Rockwool A/S Class A · OMXCOP:ROCK_A
Rockwool A/S Class A — HSBC European MidCaps Conference - Zurich 2011
55 slides from Rockwool A/S Class A's conference presentation, Nov 30, 2011
Slide 1: HSBC European MidCaps Zurich 30 November 2011
HSBC European MidCaps Conference - Zurich 30 November 2011 HSBC European MidCaps Zurich 30 November 2011 CFO Gilles Maria VP Thorkild Diness Jensen
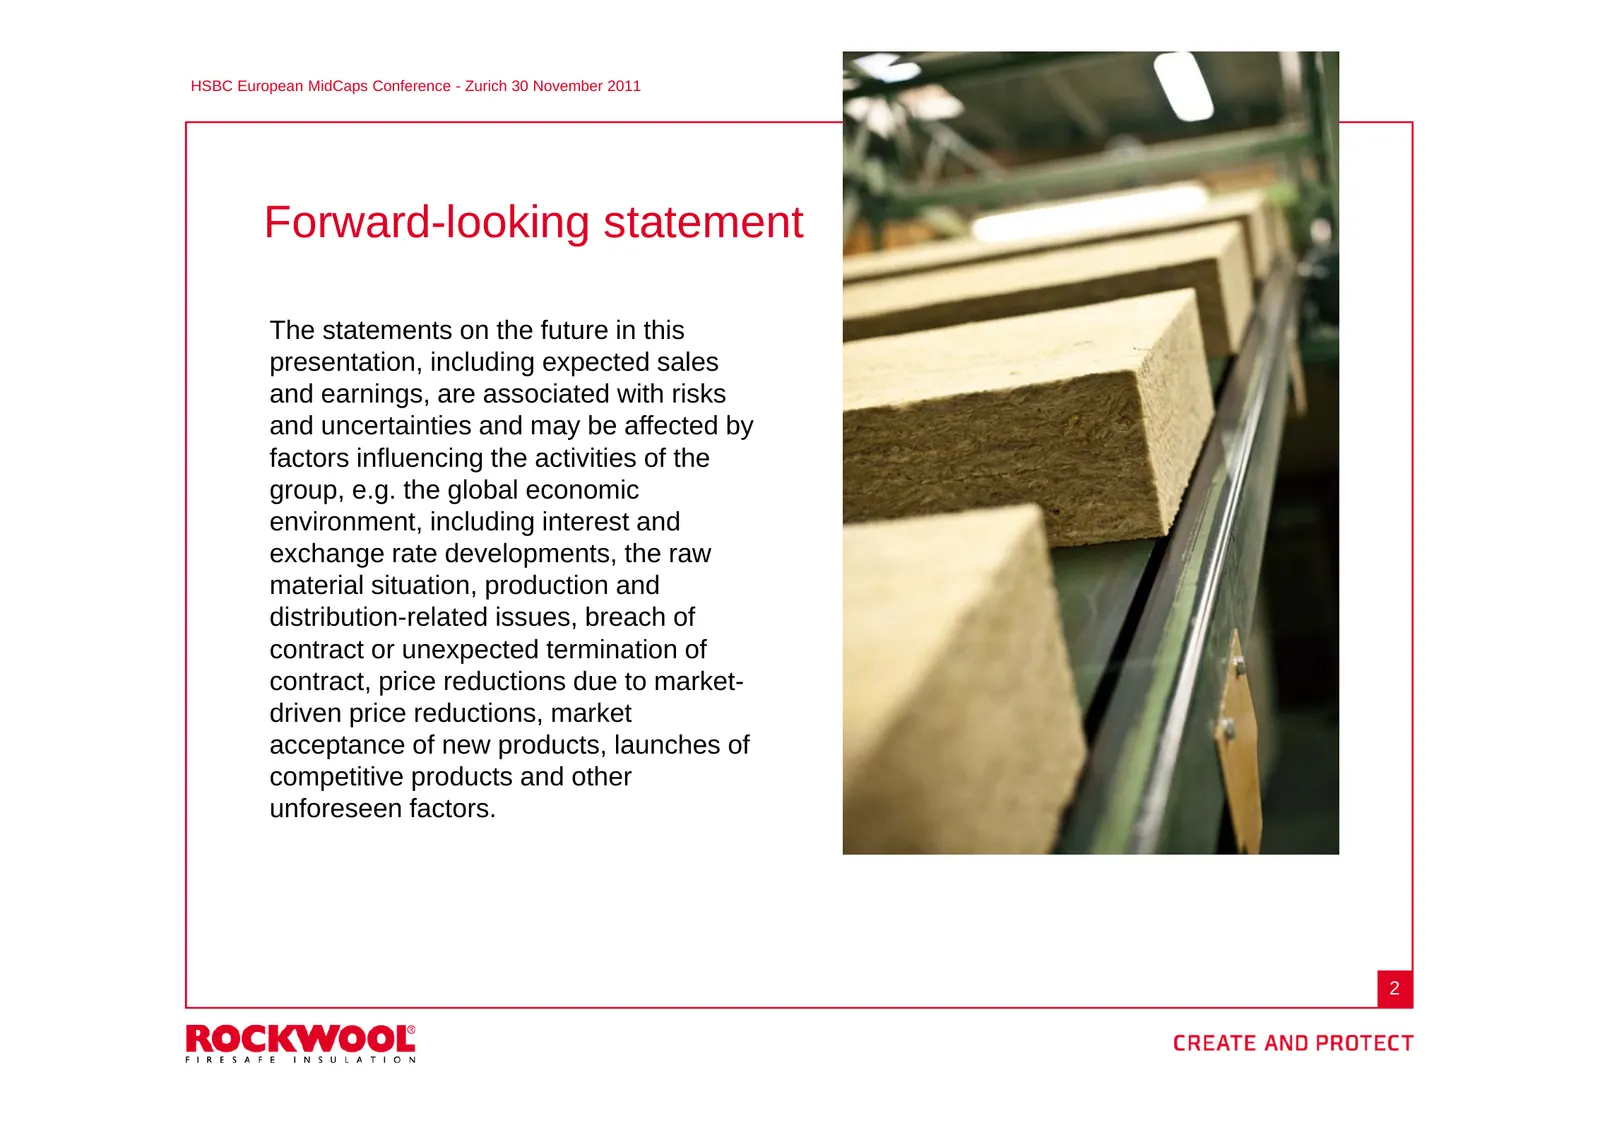
Slide 2: Forward-looking statement
HSBC European MidCaps Conference - Zurich 30 November 2011 Forward-looking statement The statements on the future in this presentation, including expected sales and earnings, are associated with risks and uncertainties and may be affected by factors influencing the activities of the group, e.g. the
Slide 3: The Rockwool Group
HSBC European MidCaps Conference - Zurich 30 November 2011 The Rockwool Group 3
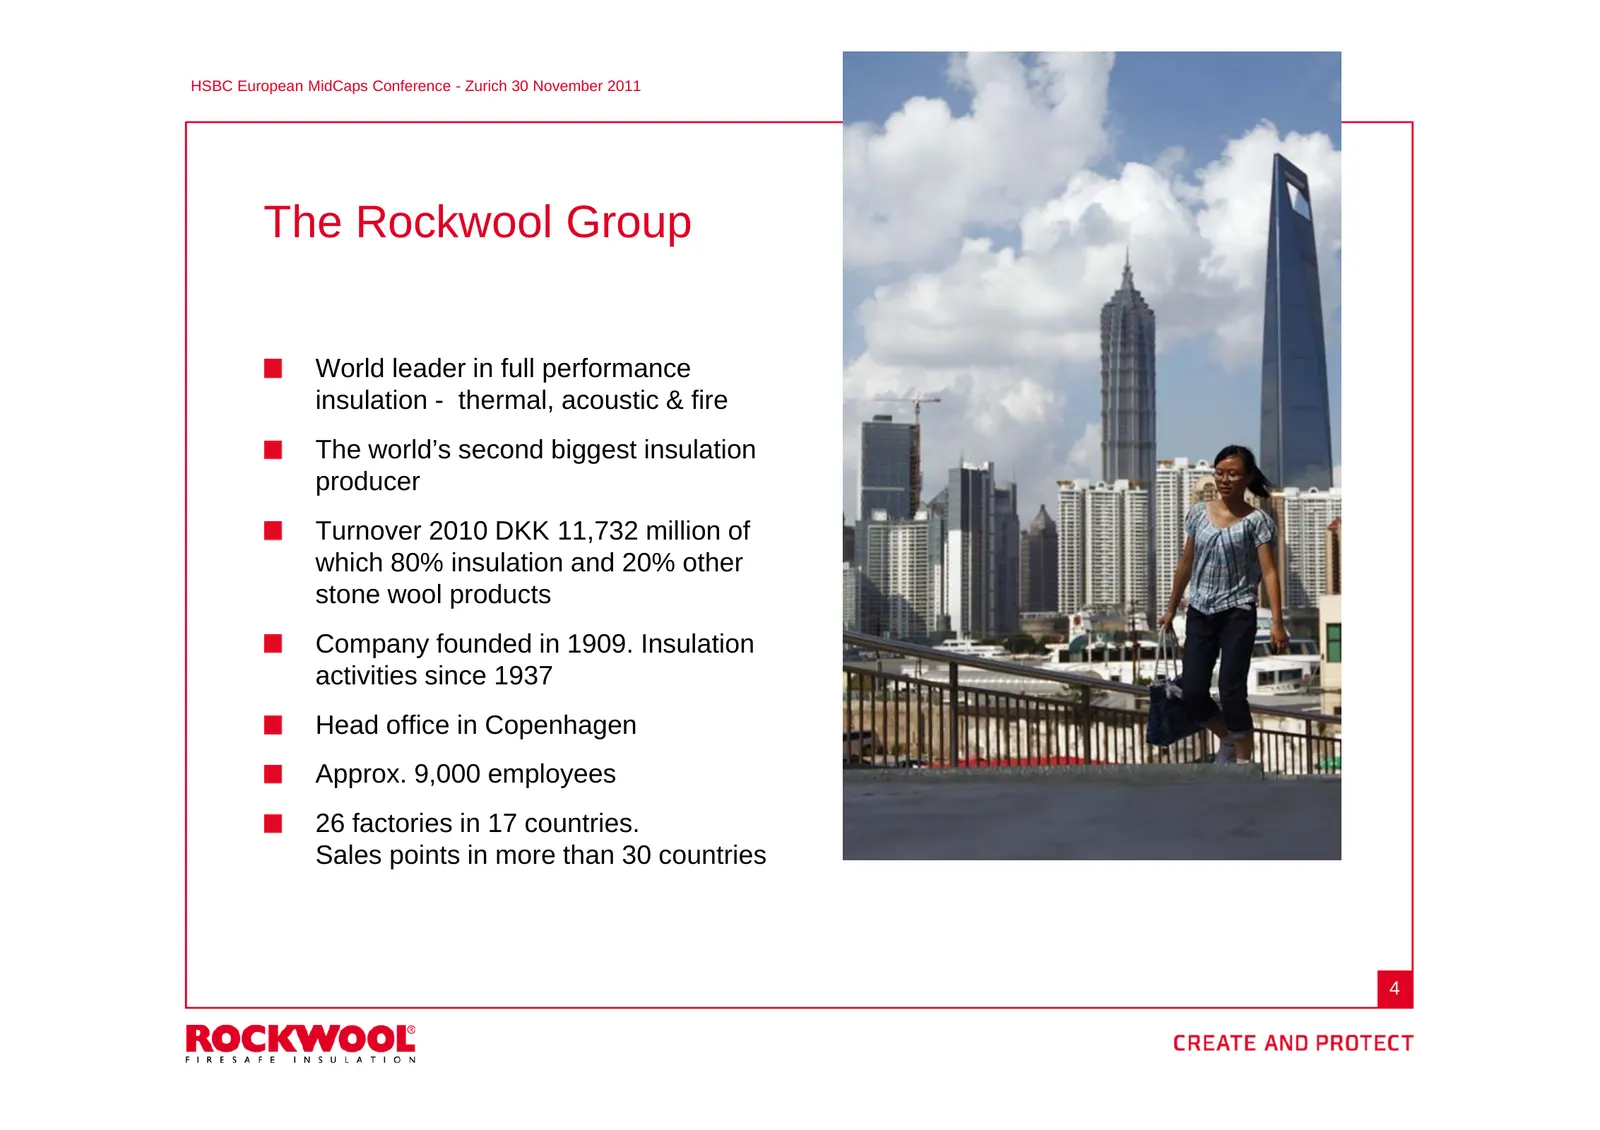
Slide 4: The Rockwool Group
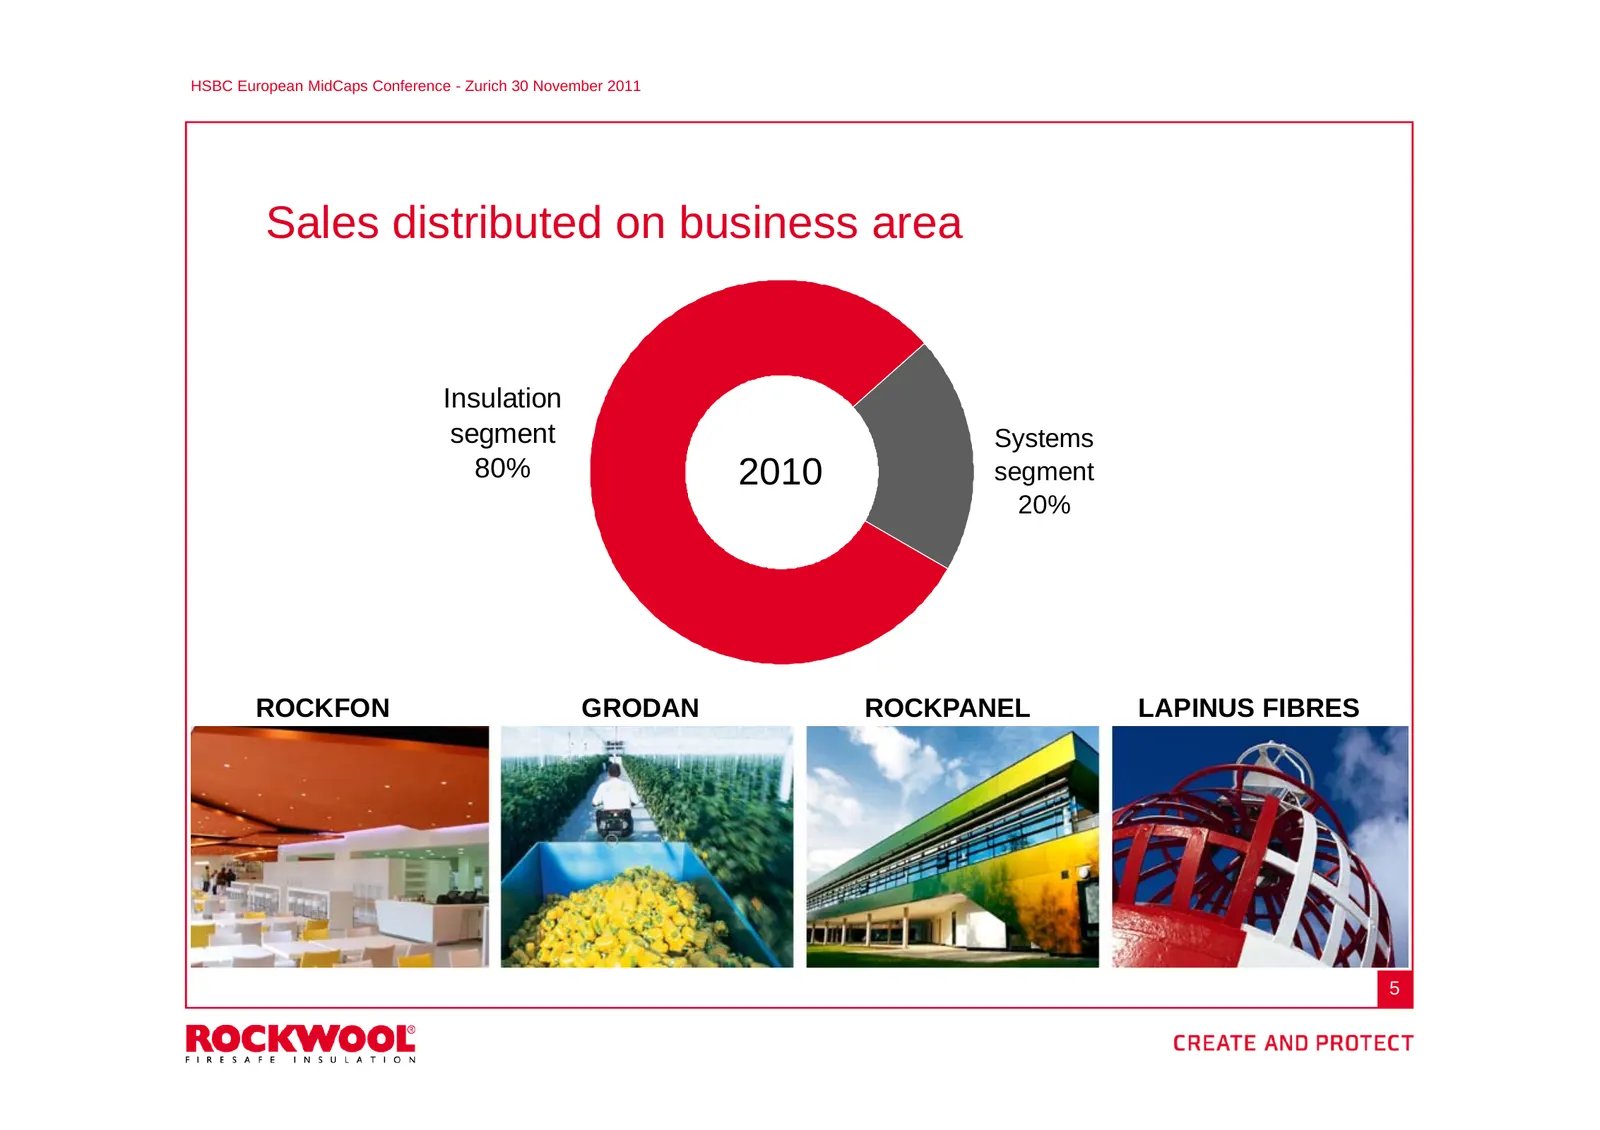
HSBC European MidCaps Conference - Zurich 30 November 2011 The Rockwool Group World leader in full performance insulation - thermal, acoustic & fire The world’s second biggest insulation producer Turnover 2010 DKK 11,732 million of which 80% insulation and 20% other stone wool products Company found
Slide 5: Sales distributed on business area
HSBC European MidCaps Conference - Zurich 30 November 2011 Sales distributed on business area Insulation segment Systems 80% 2010 segment 20% ROCKFON GRODAN ROCKPANEL LAPINUS FIBRES 5
Slide 6: Sales distributed on countries
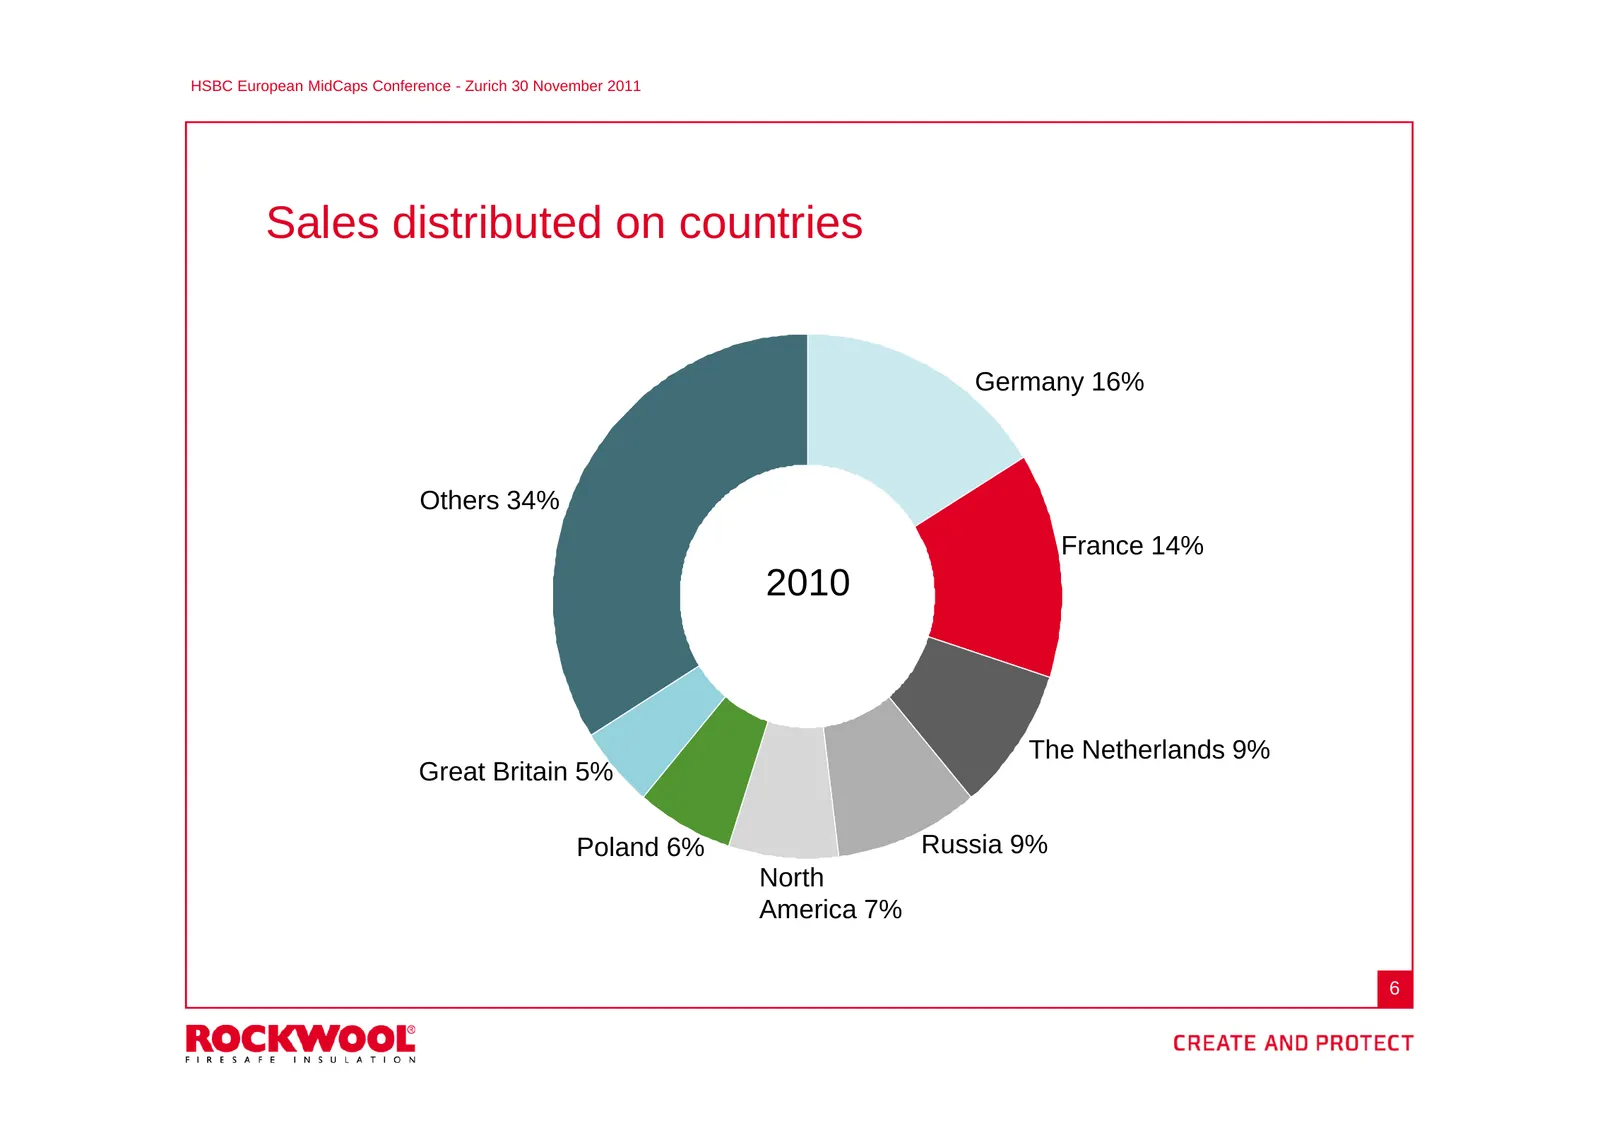
HSBC European MidCaps Conference - Zurich 30 November 2011 Sales distributed on countries Germany 16% Others 34% France 14% 2010 The Netherlands 9% Great Britain 5% Poland 6% Russia 9% North America 7% 6
Slide 7: Rockwool locations
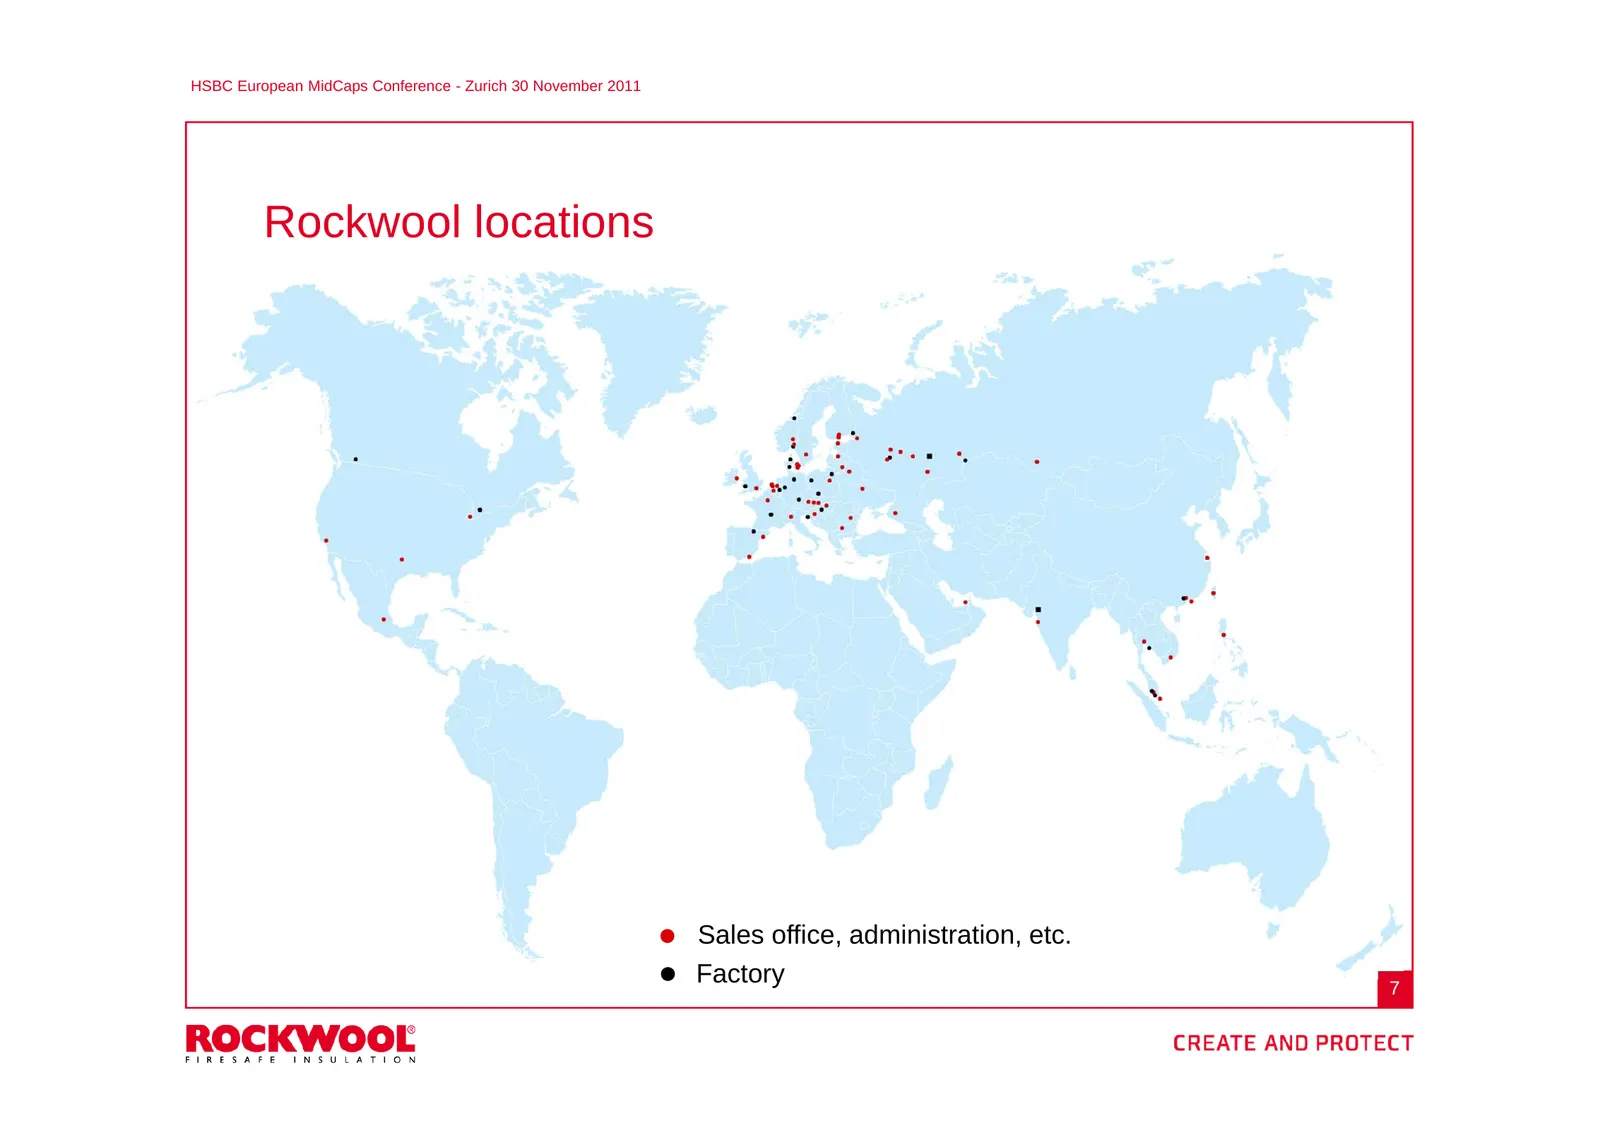
HSBC European MidCaps Conference - Zurich 30 November 2011 Rockwool locations Sales office, administration, etc. Factory 7
Slide 8: Energy and climate as growth drivers
HSBC European Roadshow Paris –MidCaps 5 October Conference 2011 - Zurich 30 November 2011 Energy and climate as growth drivers 8
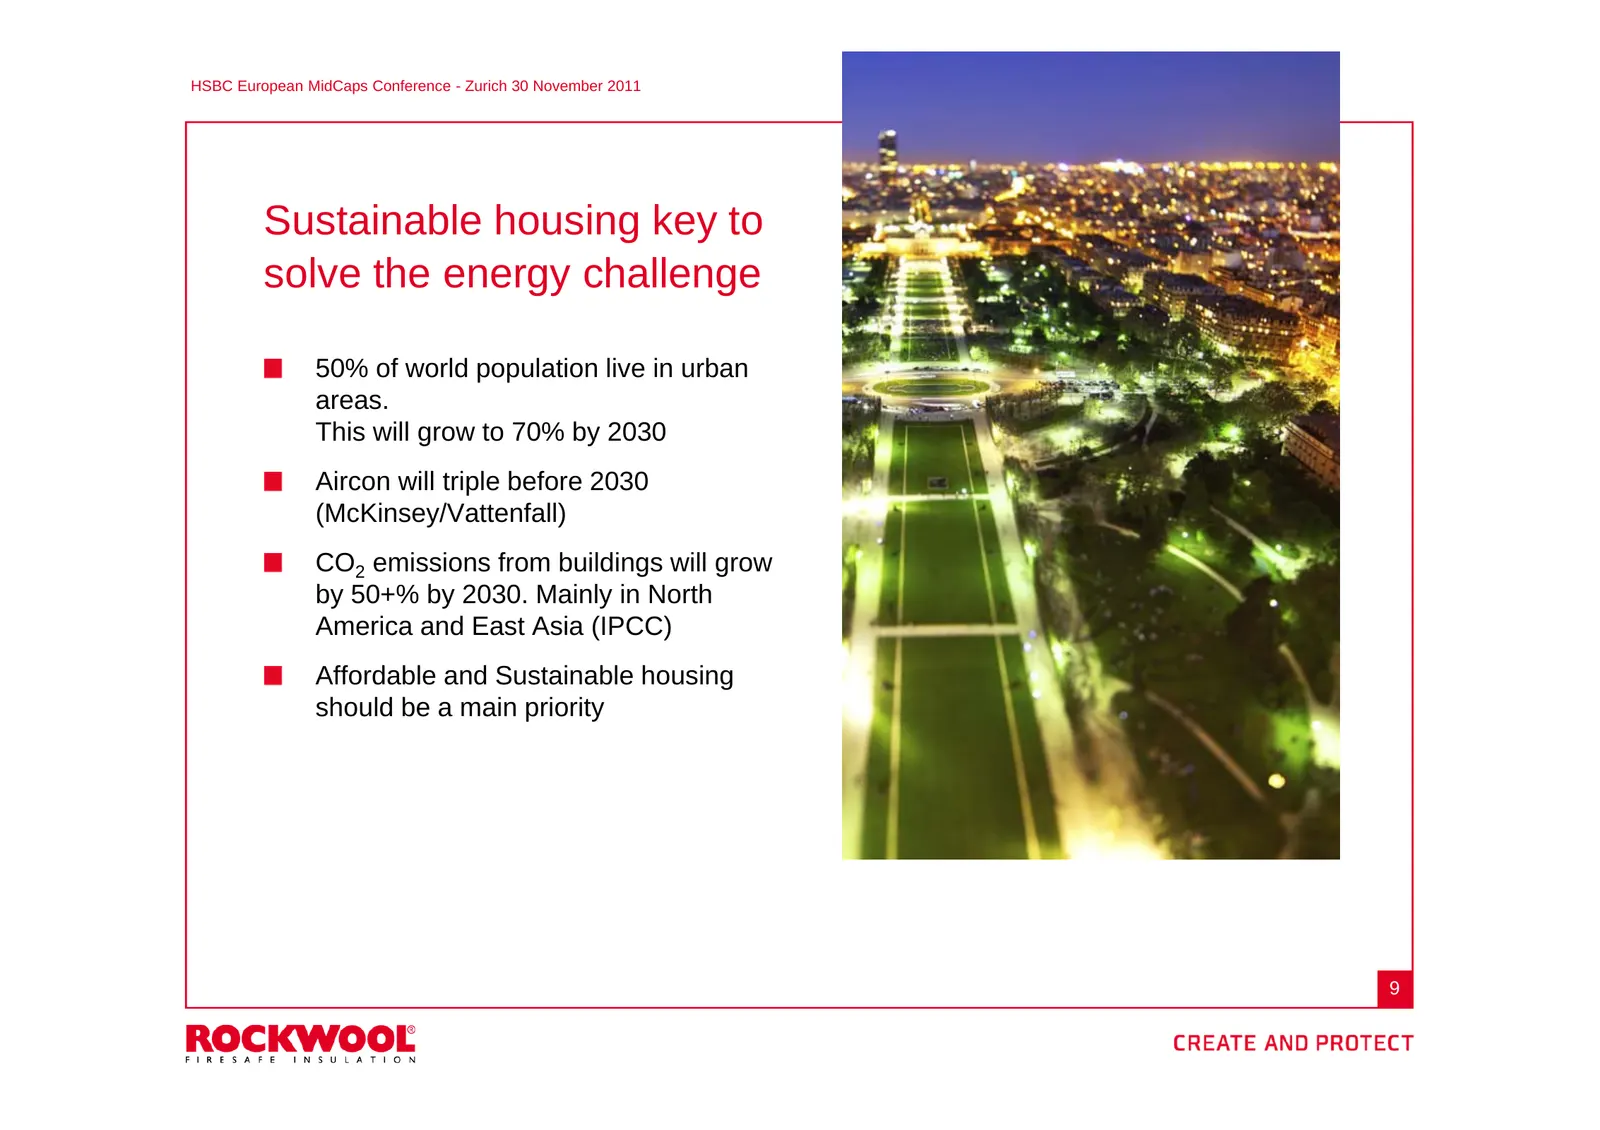
Slide 9: Sustainable housing key to solve the energy challenge
HSBC European MidCaps Conference - Zurich 30 November 2011 Sustainable housing key to solve the energy challenge 50% of world population live in urban areas. This will grow to 70% by 2030 Aircon will triple before 2030 (McKinsey/Vattenfall) CO2 emissions from buildings will grow by 50+% by 2030. Mai
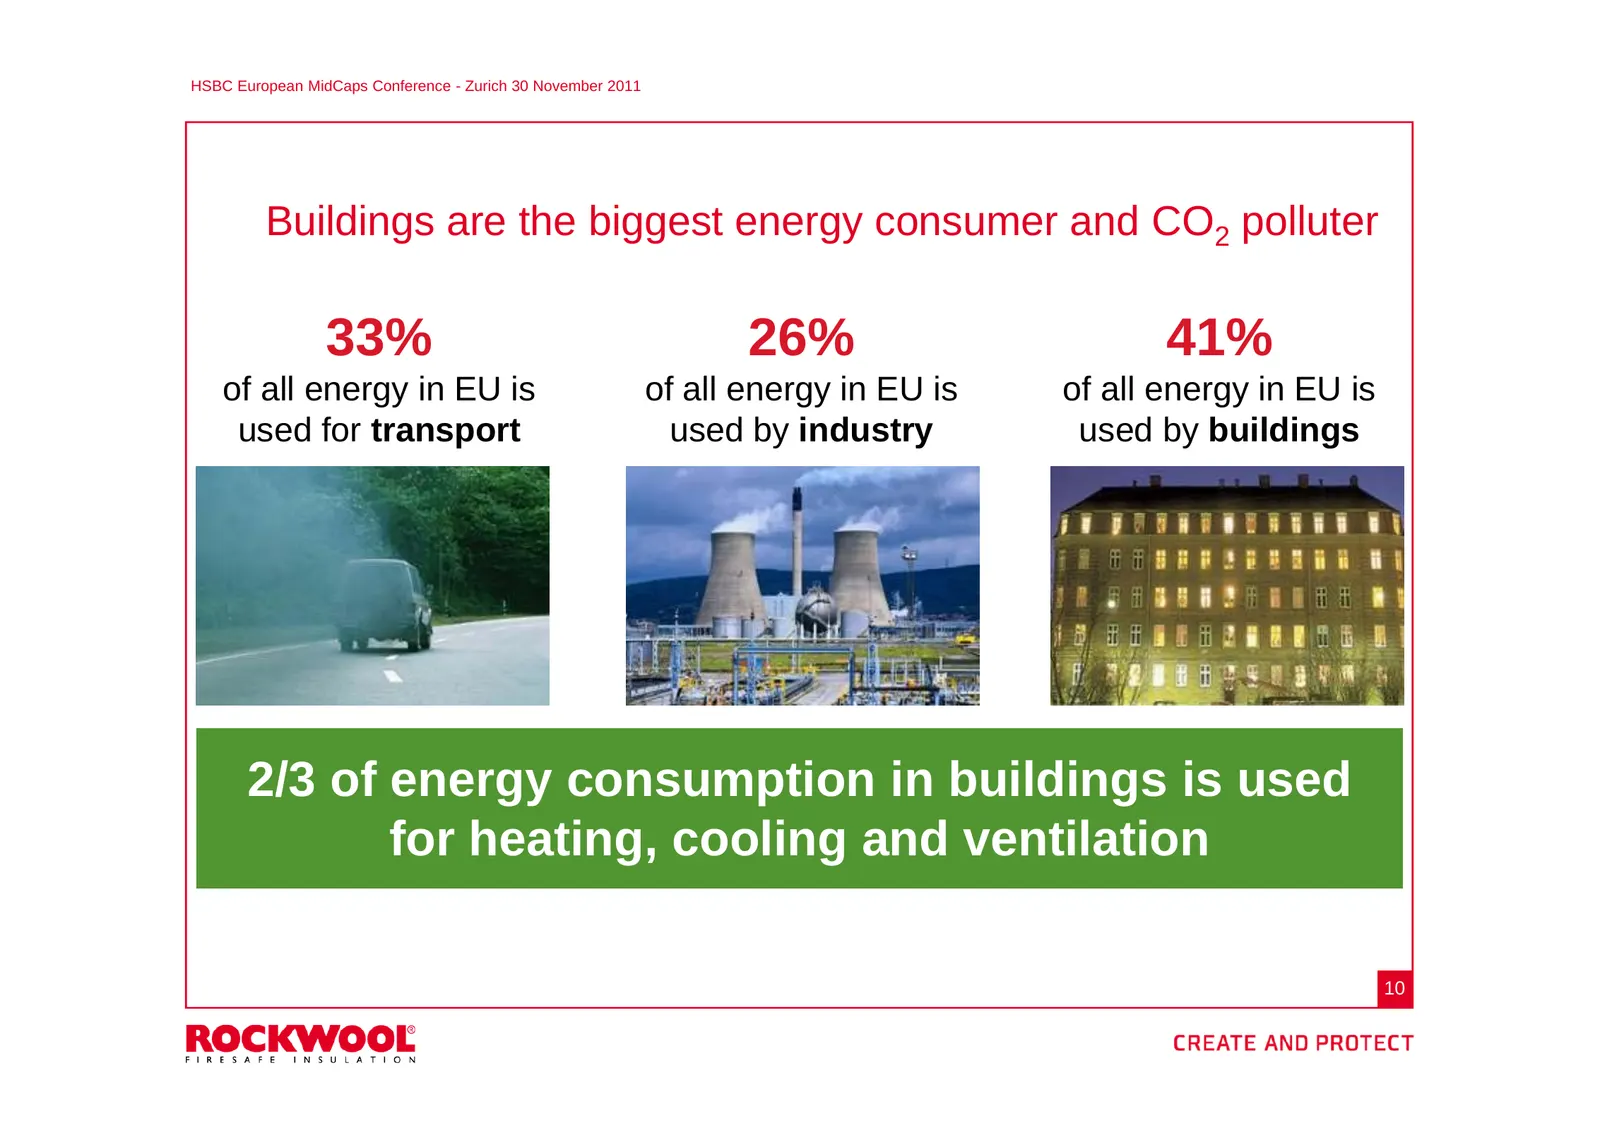
Slide 10: Buildings are the biggest energy consumer and CO2 polluter
HSBC European MidCaps Conference - Zurich 30 November 2011 Buildings are the biggest energy consumer and CO2 polluter 33% 26% 41% of all energy in EU is of all energy in EU is of all energy in EU is used for transport used by industry used by buildings 2/3 of energy consumption in buildings is used
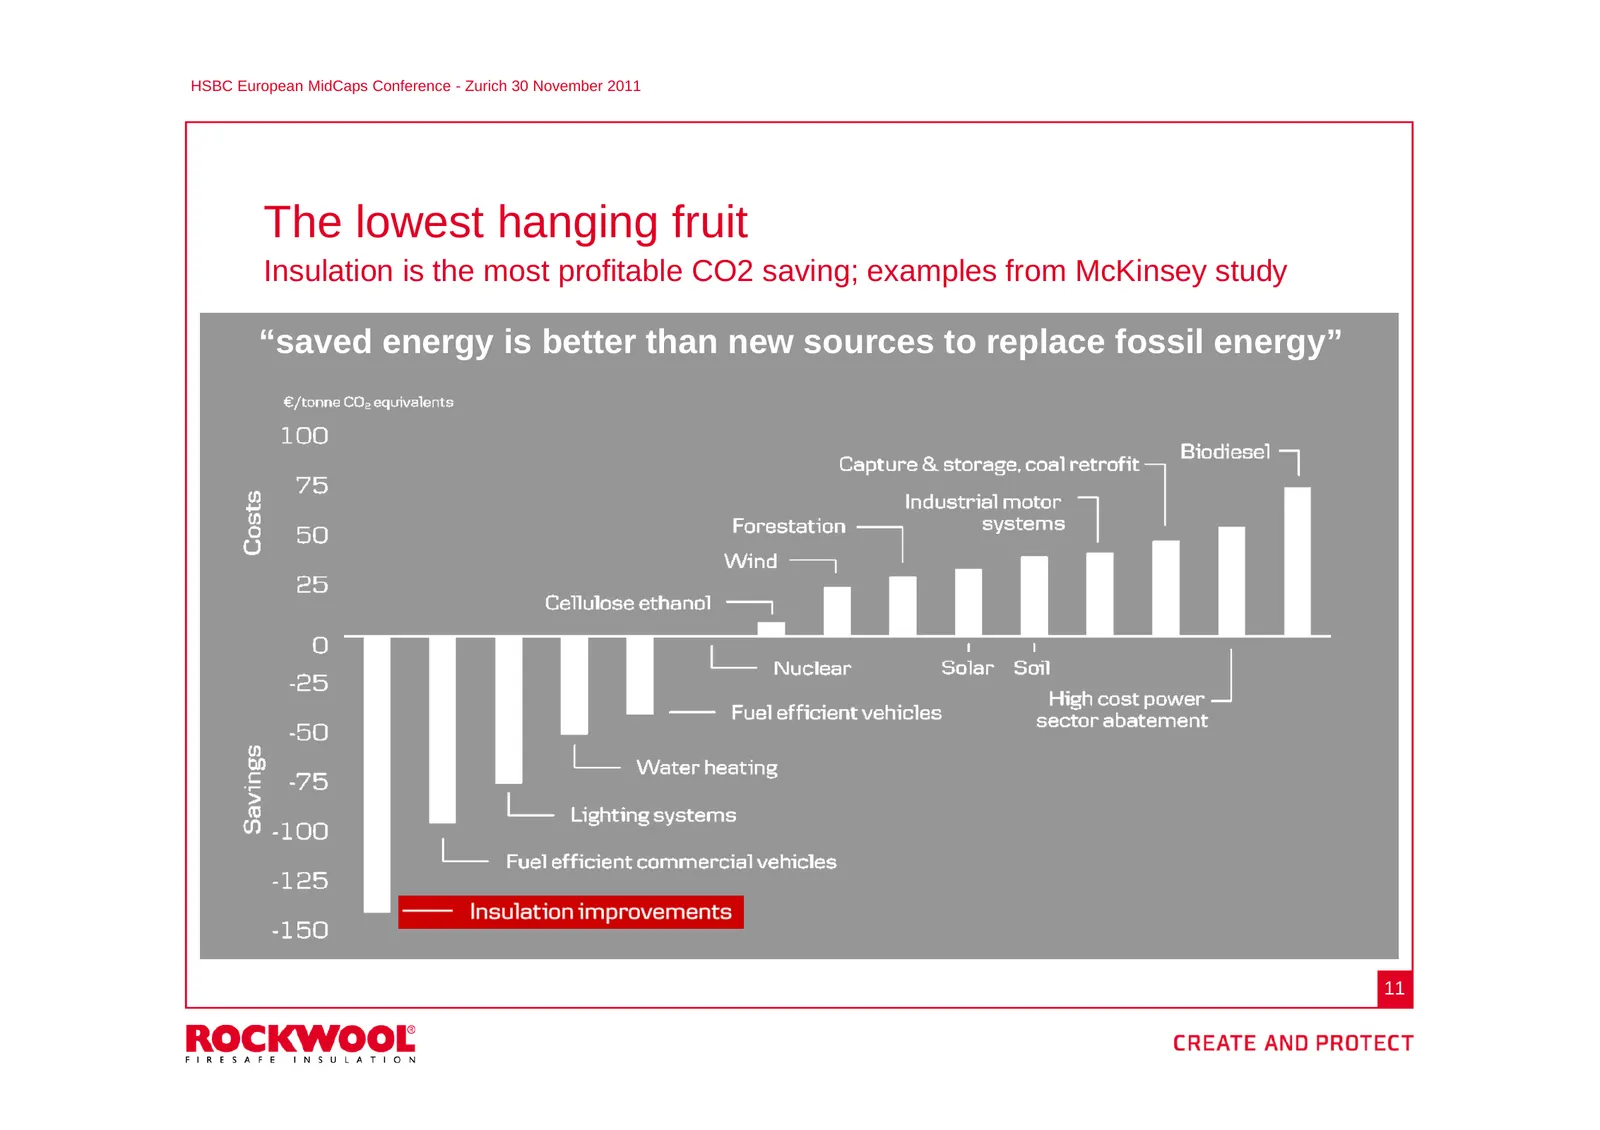
Slide 11: The lowest hanging fruit
HSBC European MidCaps Conference - Zurich 30 November 2011 The lowest hanging fruit Insulation is the most profitable CO2 saving; examples from McKinsey study “saved energy is better than new sources to replace fossil energy” 11
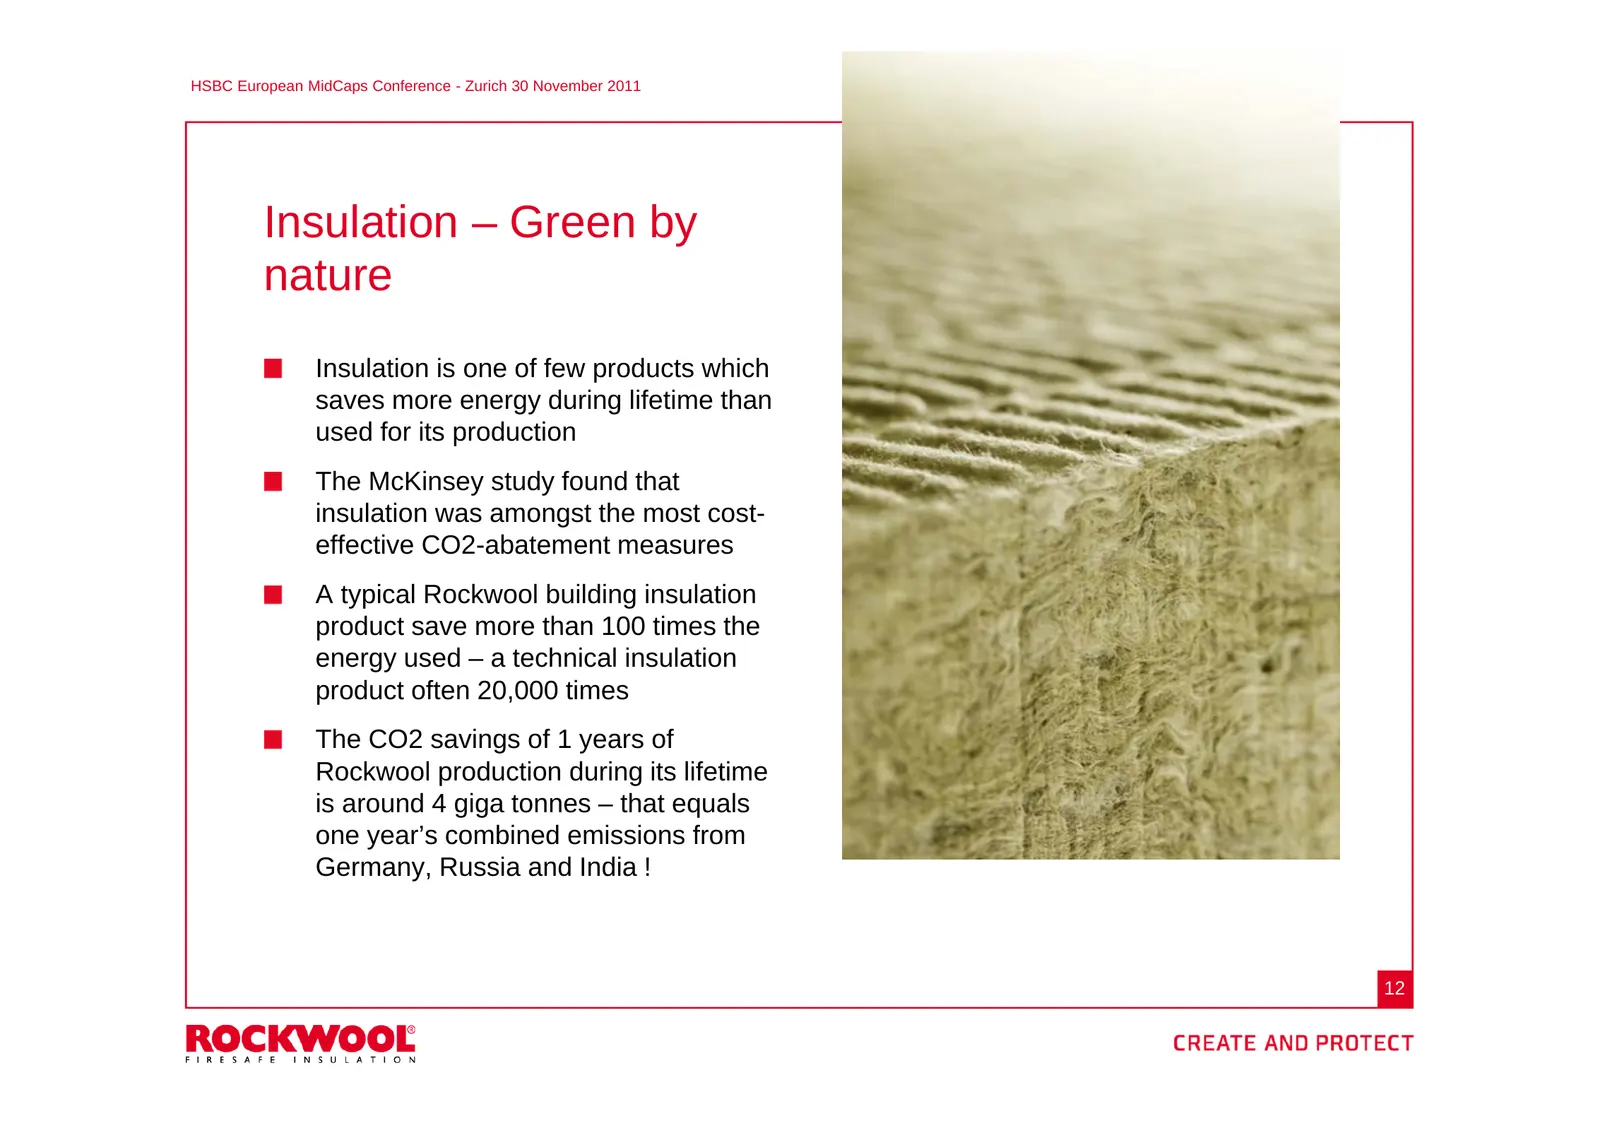
Slide 12: Insulation – Green by nature
HSBC European MidCaps Conference - Zurich 30 November 2011 Insulation – Green by nature Insulation is one of few products which saves more energy during lifetime than used for its production The McKinsey study found that insulation was amongst the most cost- effective CO2-abatement measures A typica
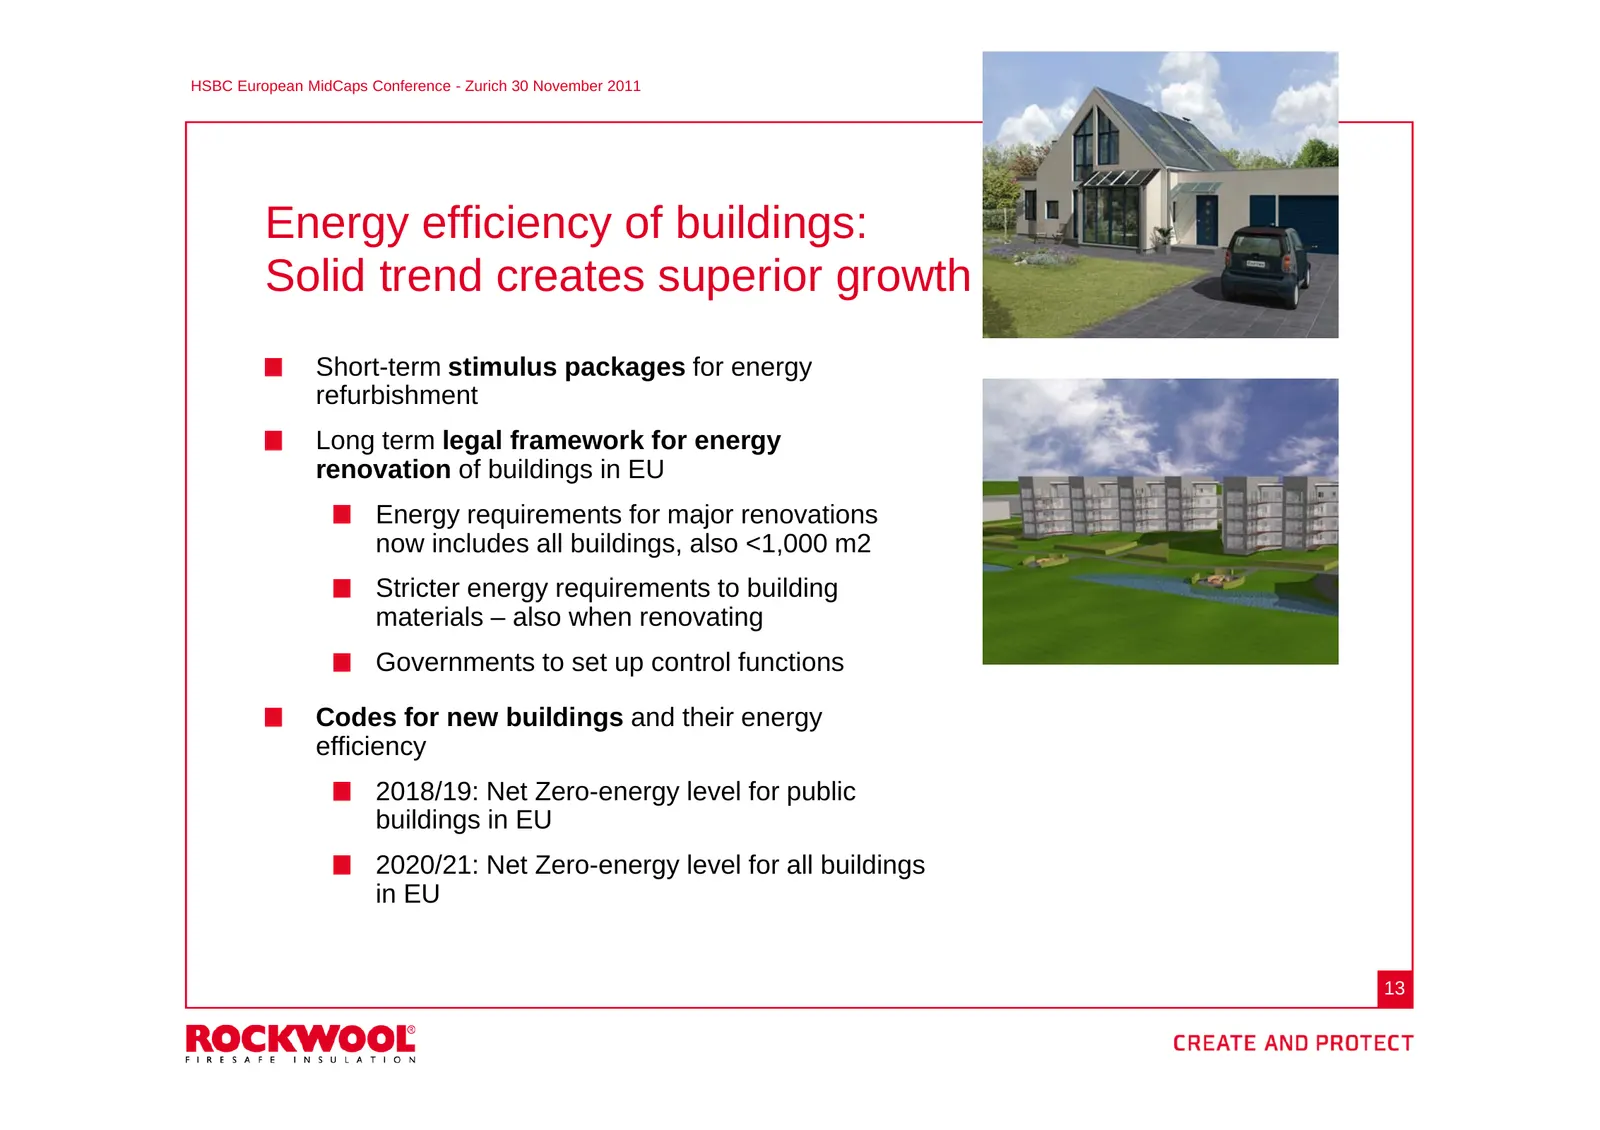
Slide 13: Energy efficiency of buildings: Solid trend creates superior growth
HSBC European MidCaps Conference - Zurich 30 November 2011 Energy efficiency of buildings: Solid trend creates superior growth Short-term stimulus packages for energy refurbishment Long term legal framework for energy renovation of buildings in EU Energy requirements for major renovations now includ
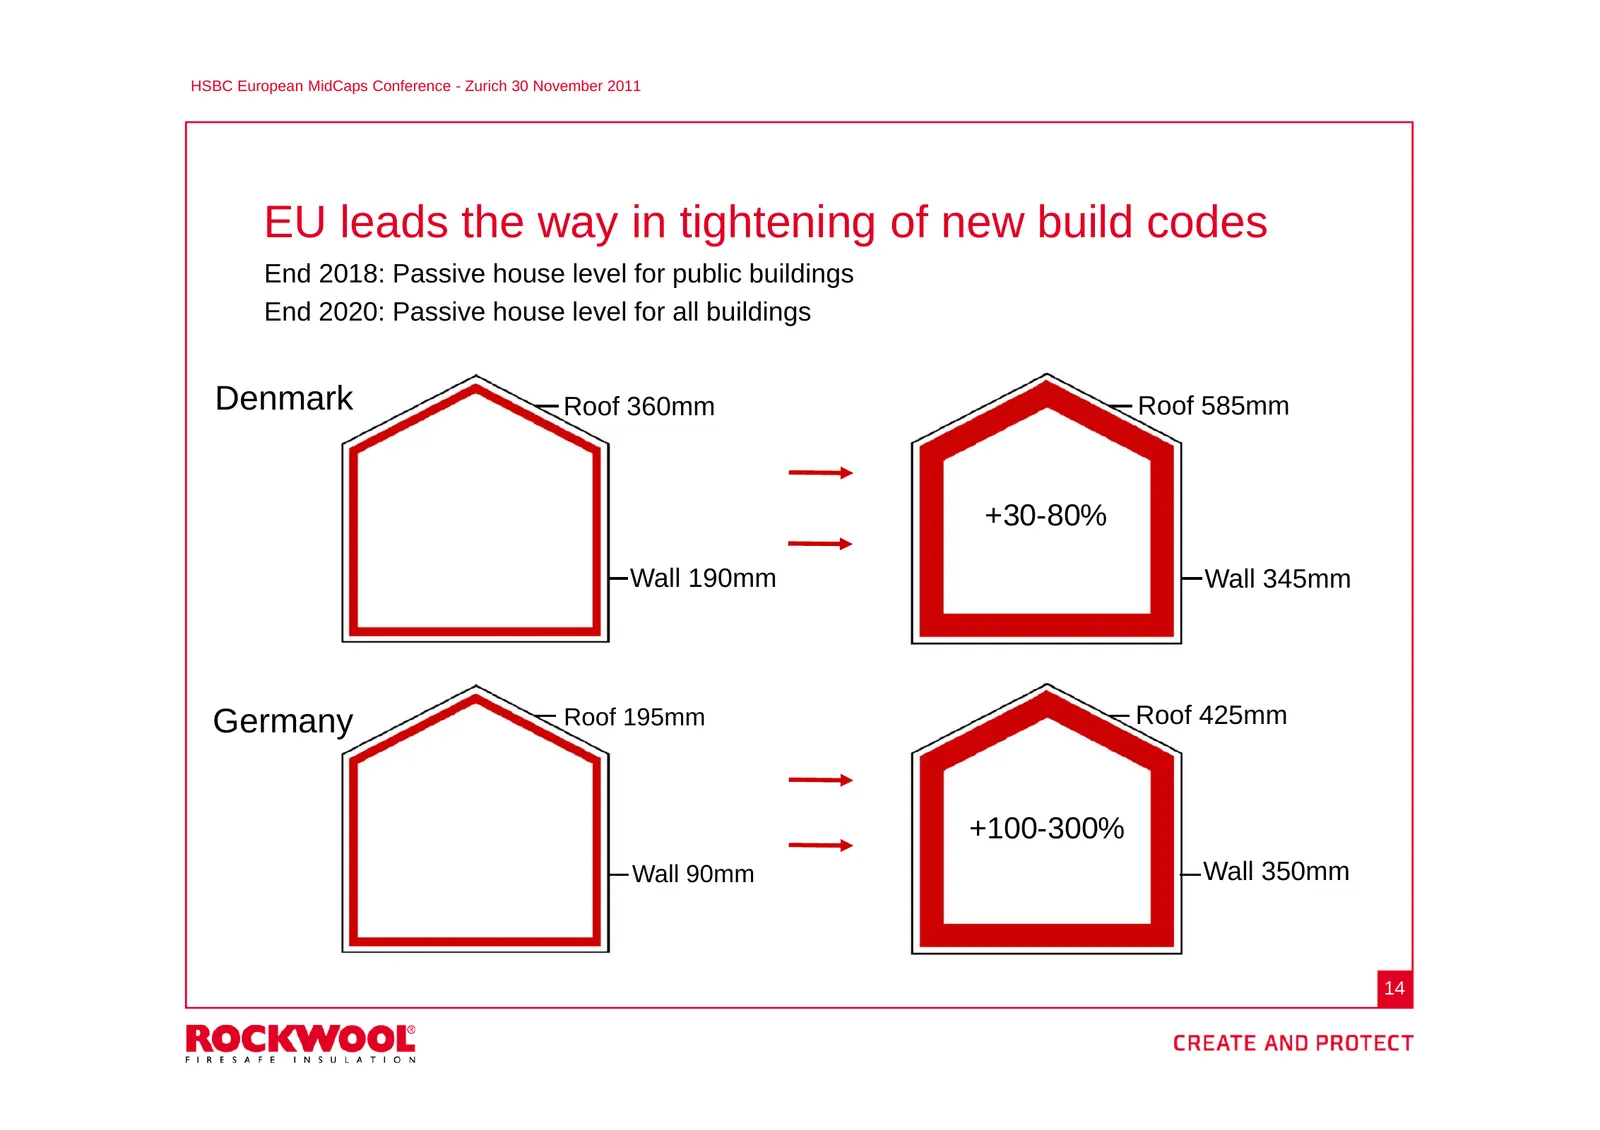
Slide 14: EU leads the way in tightening of new build codes
HSBC European MidCaps Conference - Zurich 30 November 2011 EU leads the way in tightening of new build codes End 2018: Passive house level for public buildings End 2020: Passive house level for all buildings Denmark Roof 360mm Roof 585mm +30-80% Wall 190mm Wall 345mm Germany Roof 195mm Roof 425mm +1
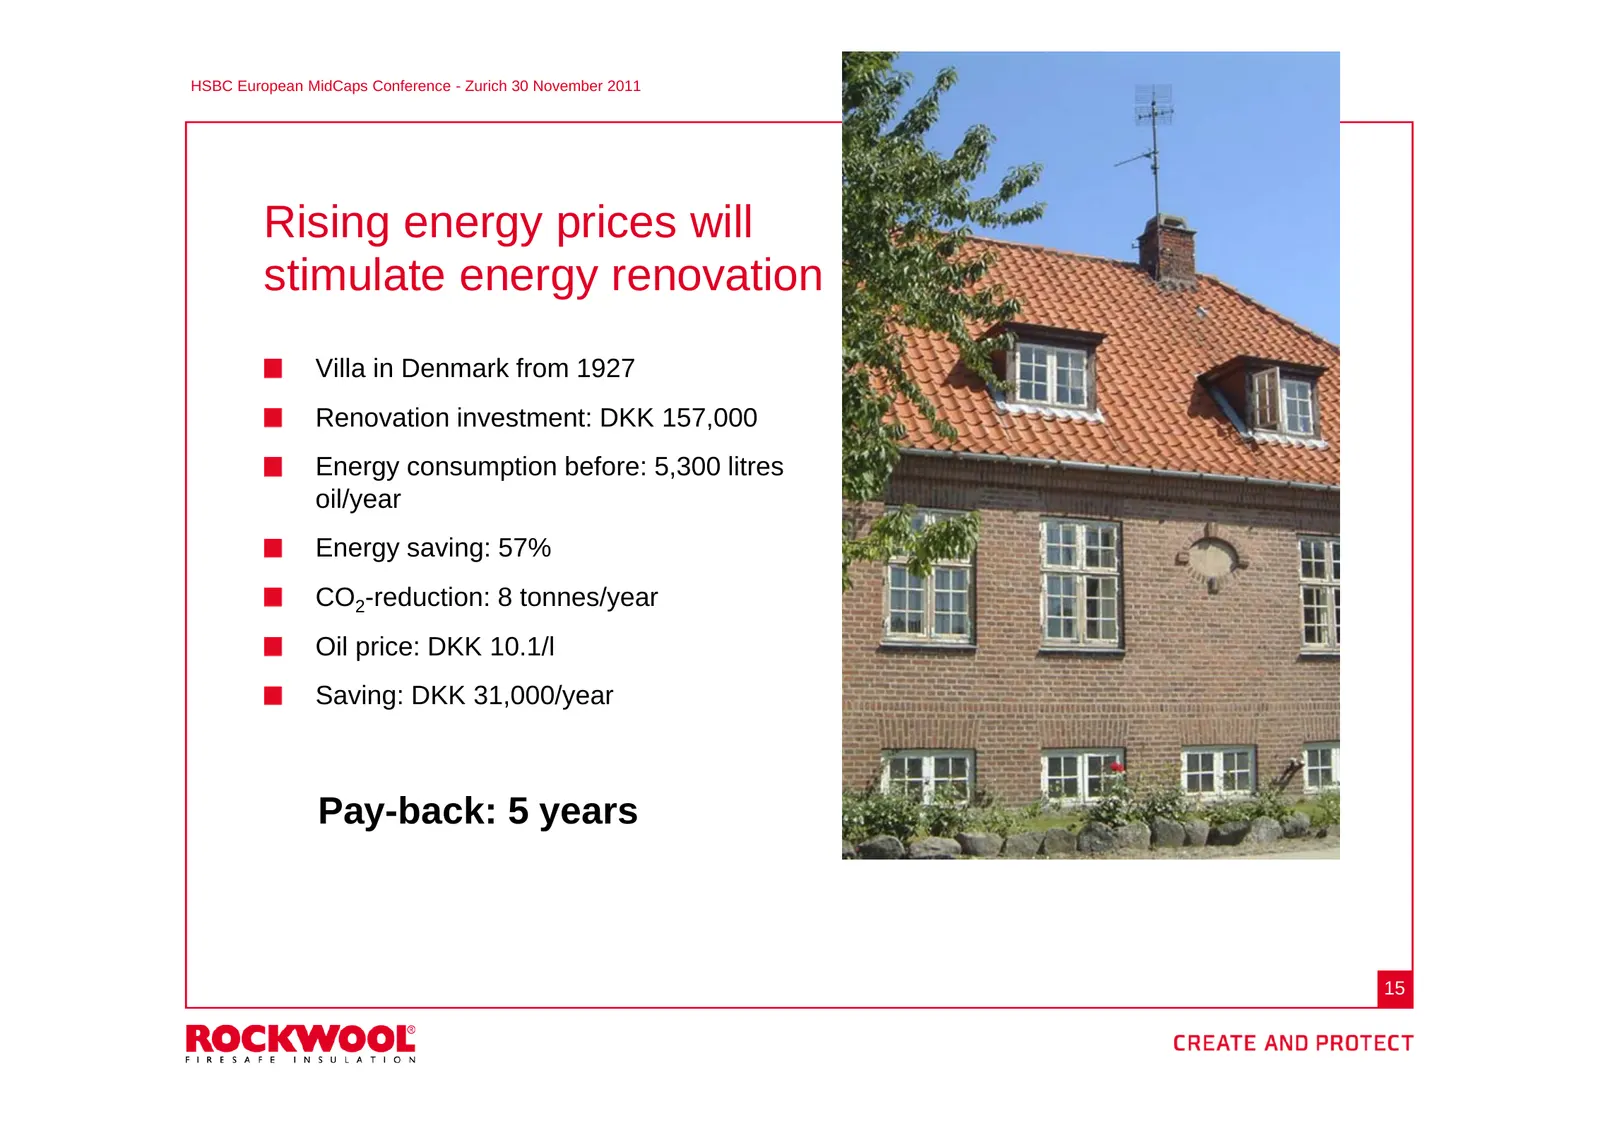
Slide 15: Rising energy prices will stimulate energy renovation
HSBC European MidCaps Conference - Zurich 30 November 2011 Rising energy prices will stimulate energy renovation Villa in Denmark from 1927 Renovation investment: DKK 157,000 Energy consumption before: 5,300 litres oil/year Energy saving: 57% CO2-reduction: 8 tonnes/year Oil price: DKK 10.1/l Saving
Slide 16: Segments, product properties and production
HSBC European MidCaps Conference - Zurich 30 November 2011 Segments, product properties and production 16
Slide 17: Main insulation areas
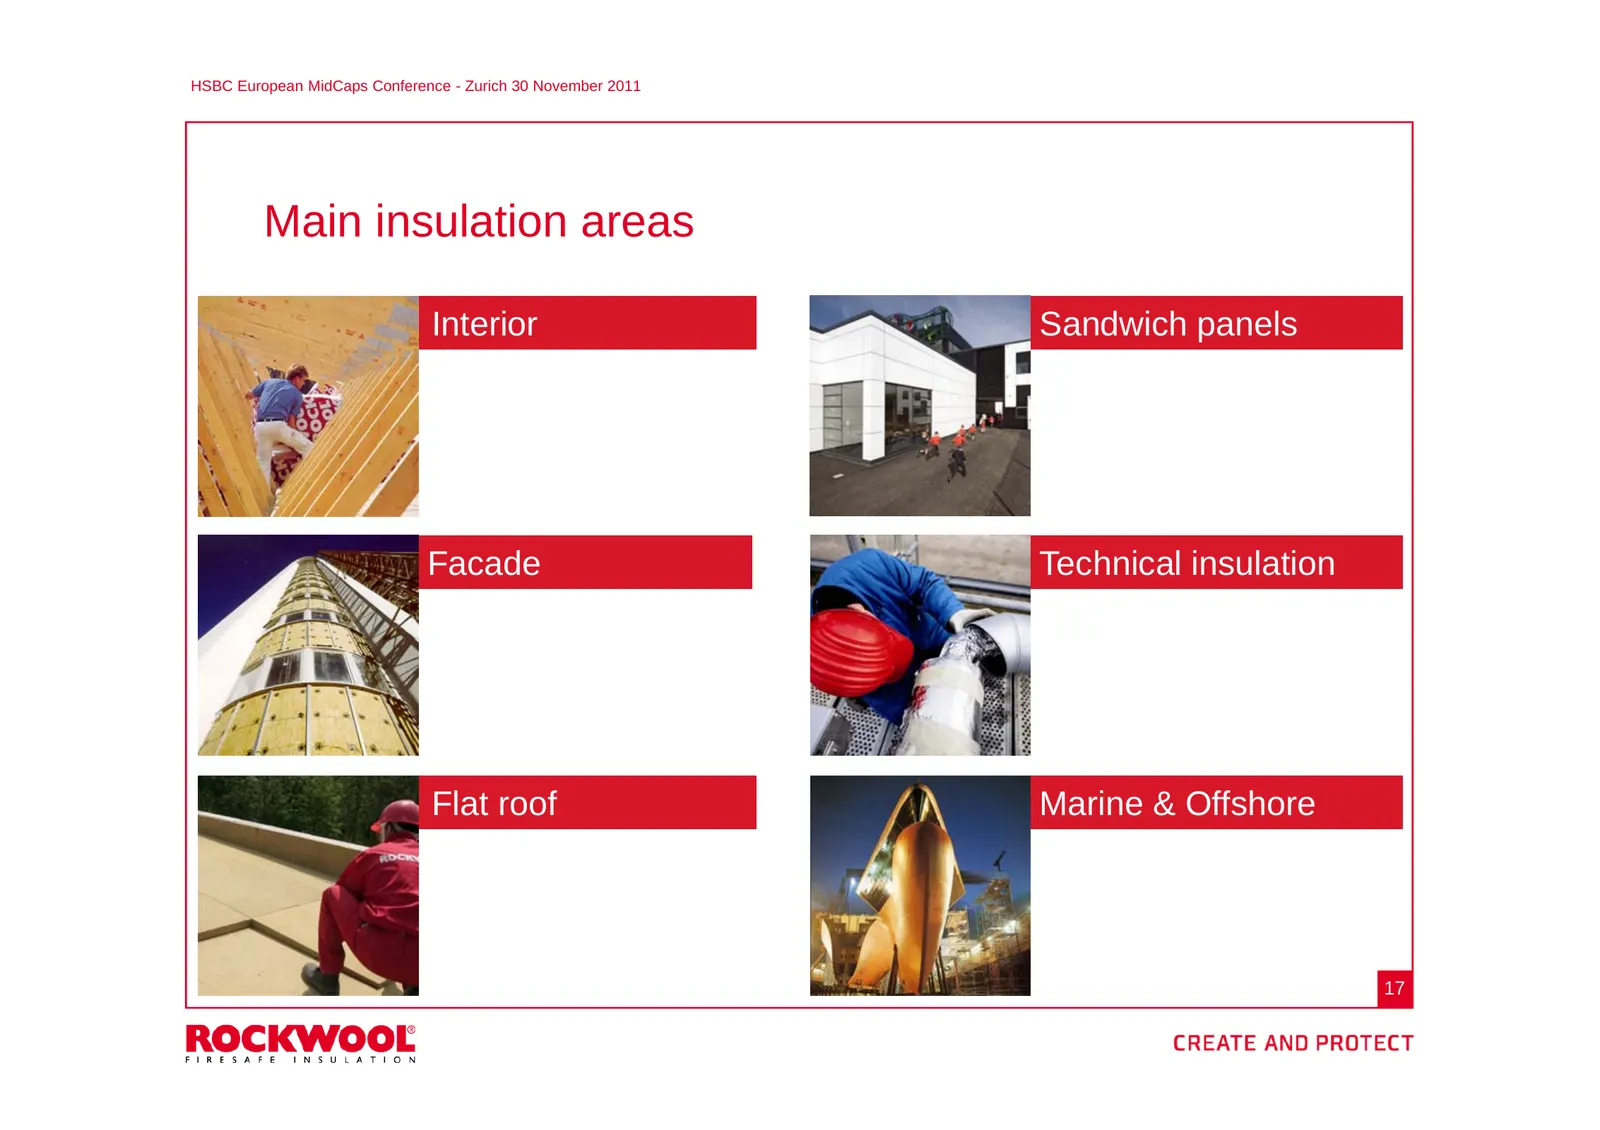
HSBC European MidCaps Conference - Zurich 30 November 2011 Main insulation areas Interior Sandwich panels Facade Technical insulation Flat roof Marine & Offshore 17
Slide 18: Thermal: Insulation comparatives
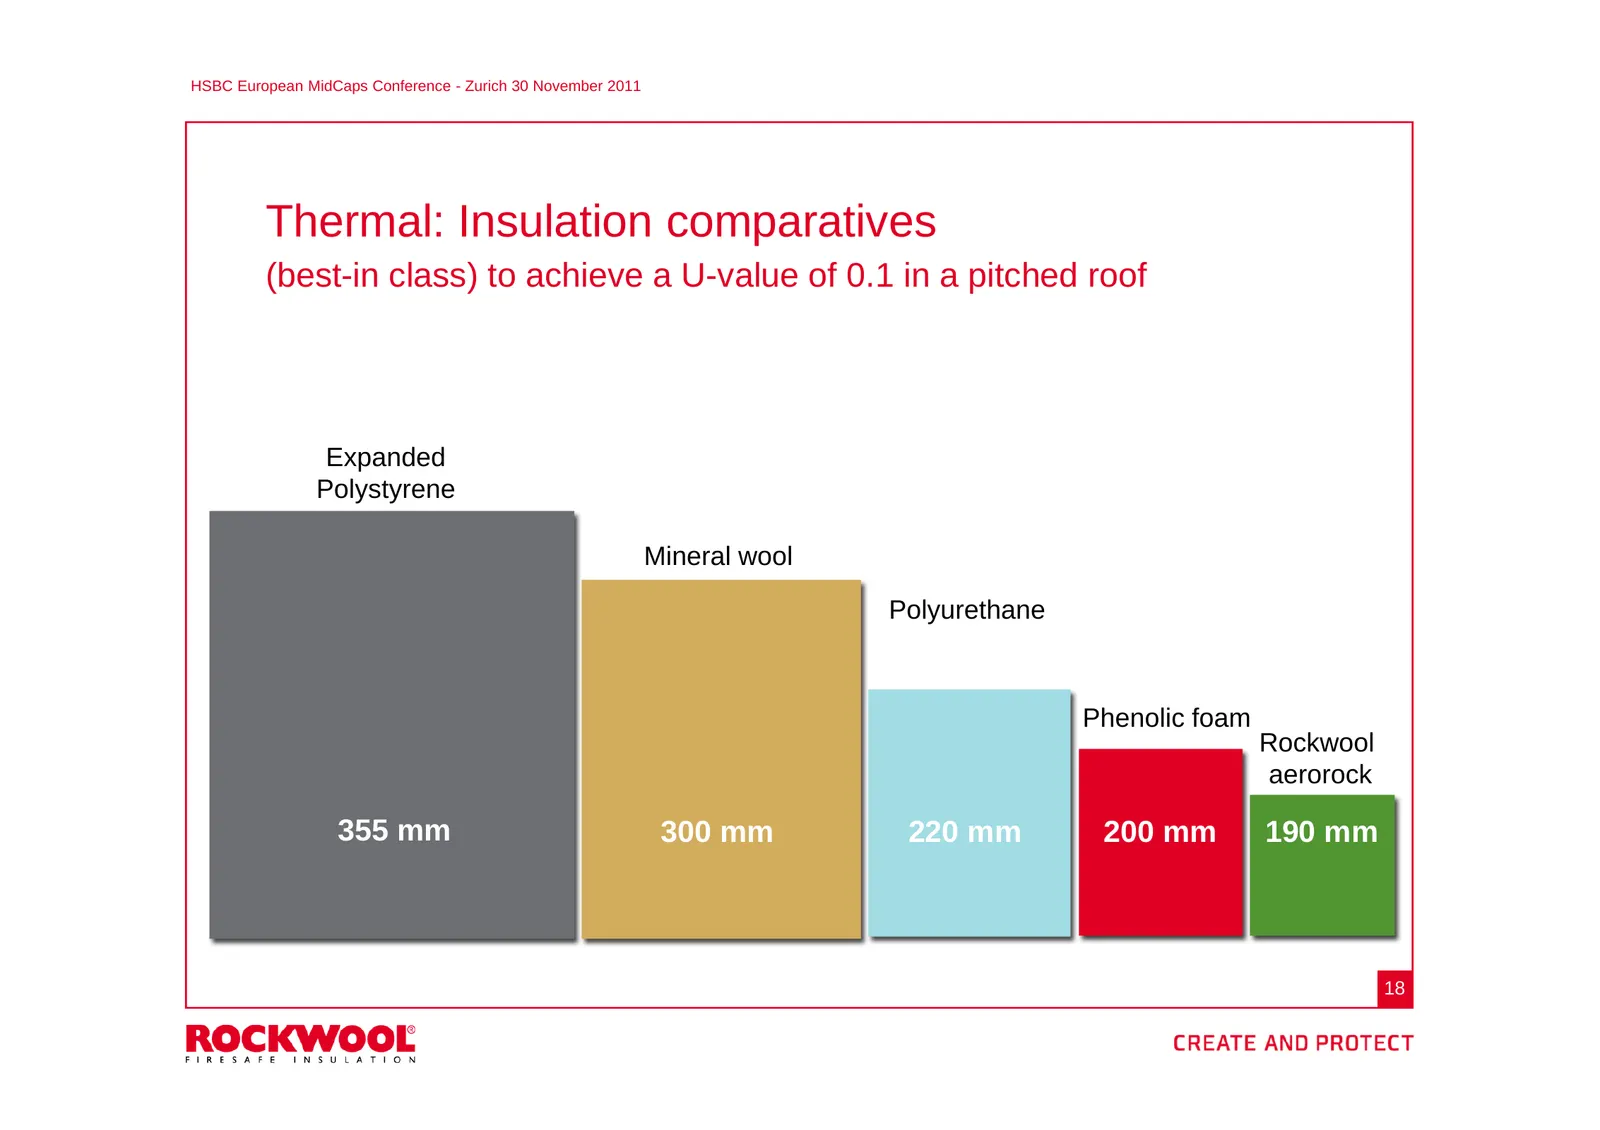
HSBC European MidCaps Conference - Zurich 30 November 2011 Thermal: Insulation comparatives (best-in class) to achieve a U-value of 0.1 in a pitched roof Expanded Polystyrene Mineral wool Polyurethane Phenolic foam Rockwool aerorock 355 mm 300 mm 220 mm 200 mm 190 mm 18
Slide 19: Product properties - Insulation
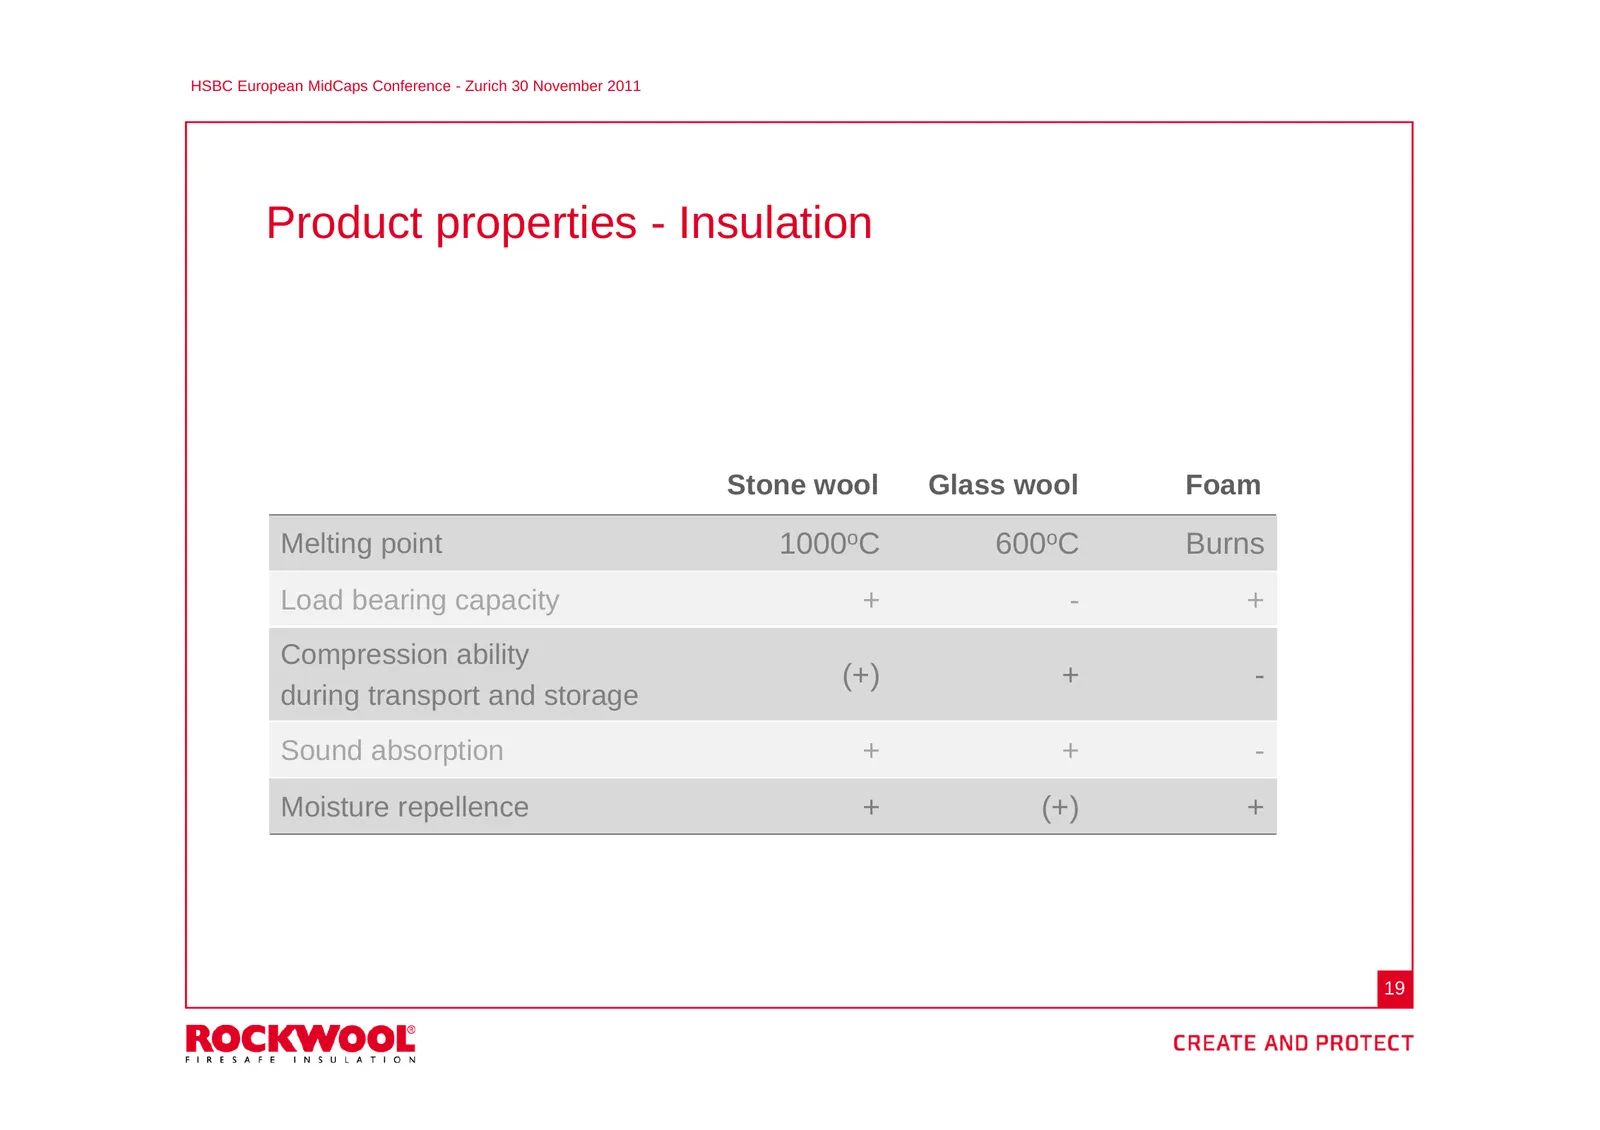
HSBC European MidCaps Conference - Zurich 30 November 2011 Product properties - Insulation Stone wool Glass wool Foam Melting point 1000oC 600oC Burns Load bearing capacity + - + Compression ability (+) + - during transport and storage Sound absorption + + - Moisture repellence + (+) + 19
Slide 20: Product properties and market segments
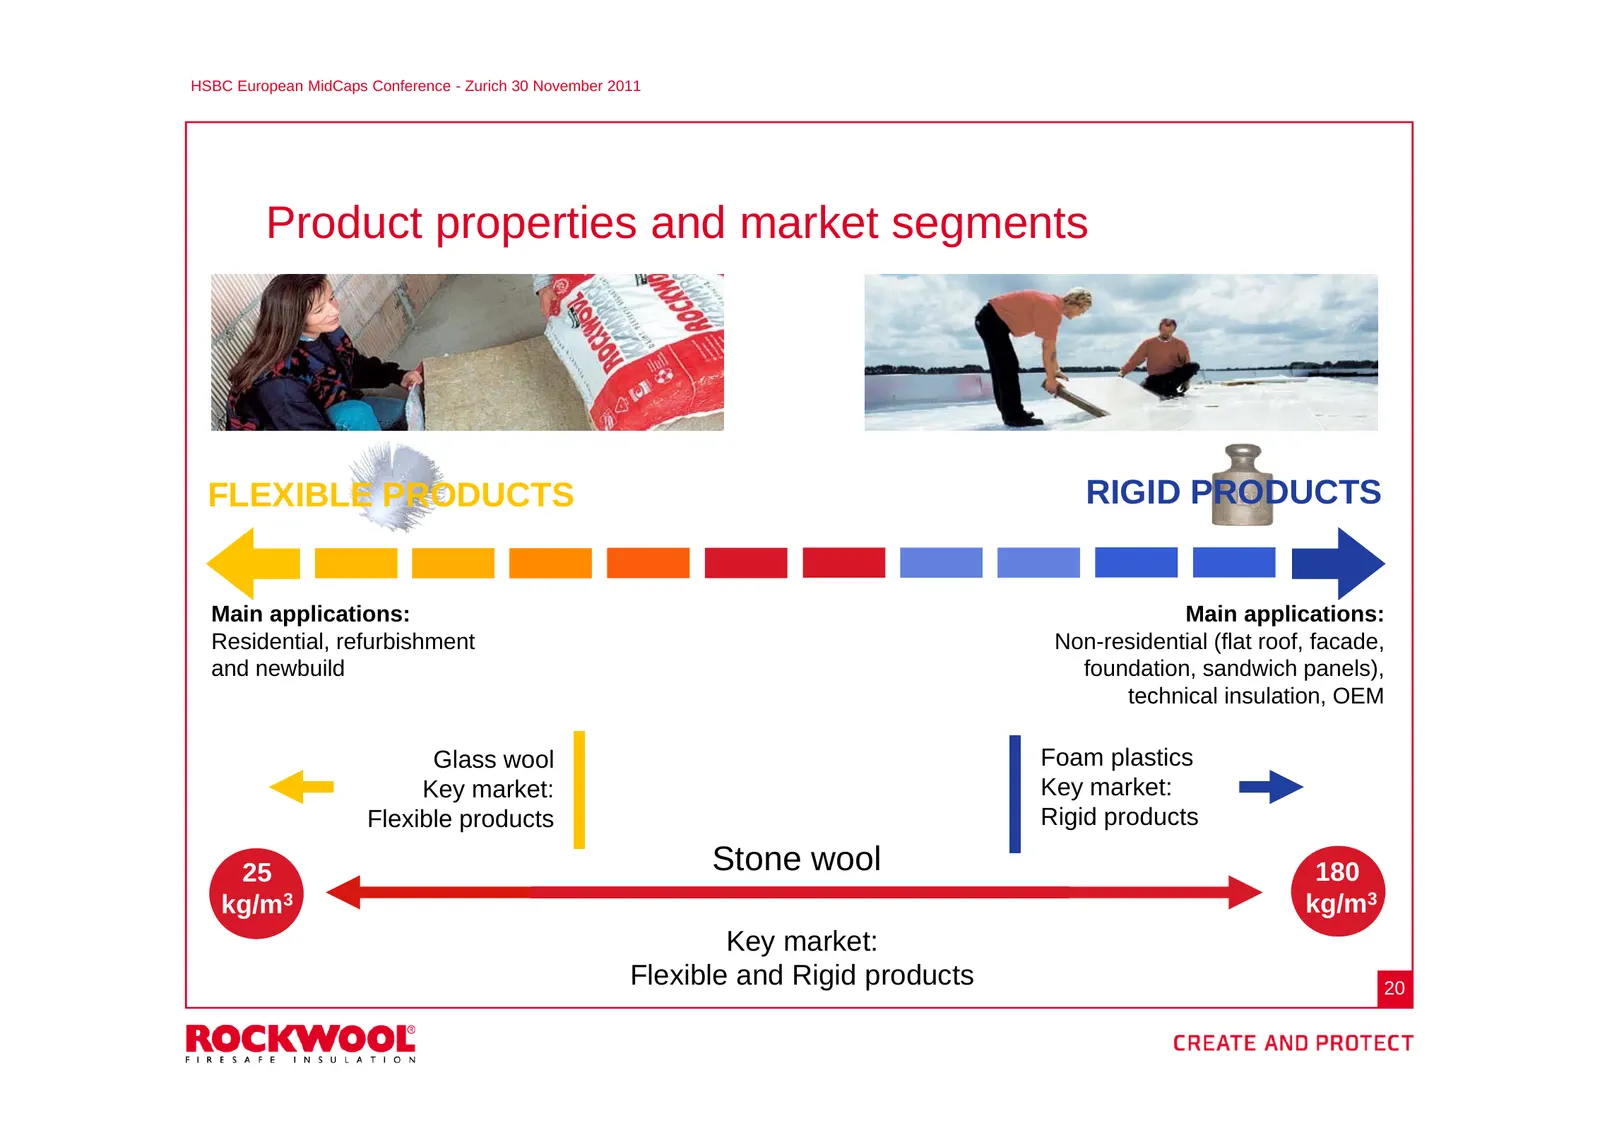
HSBC European MidCaps Conference - Zurich 30 November 2011 Product properties and market segments FLEXIBLE PRODUCTS RIGID PRODUCTS Main applications: Main applications: Residential, refurbishment Non-residential (flat roof, facade, and newbuild foundation, sandwich panels), technical insulation, OEM
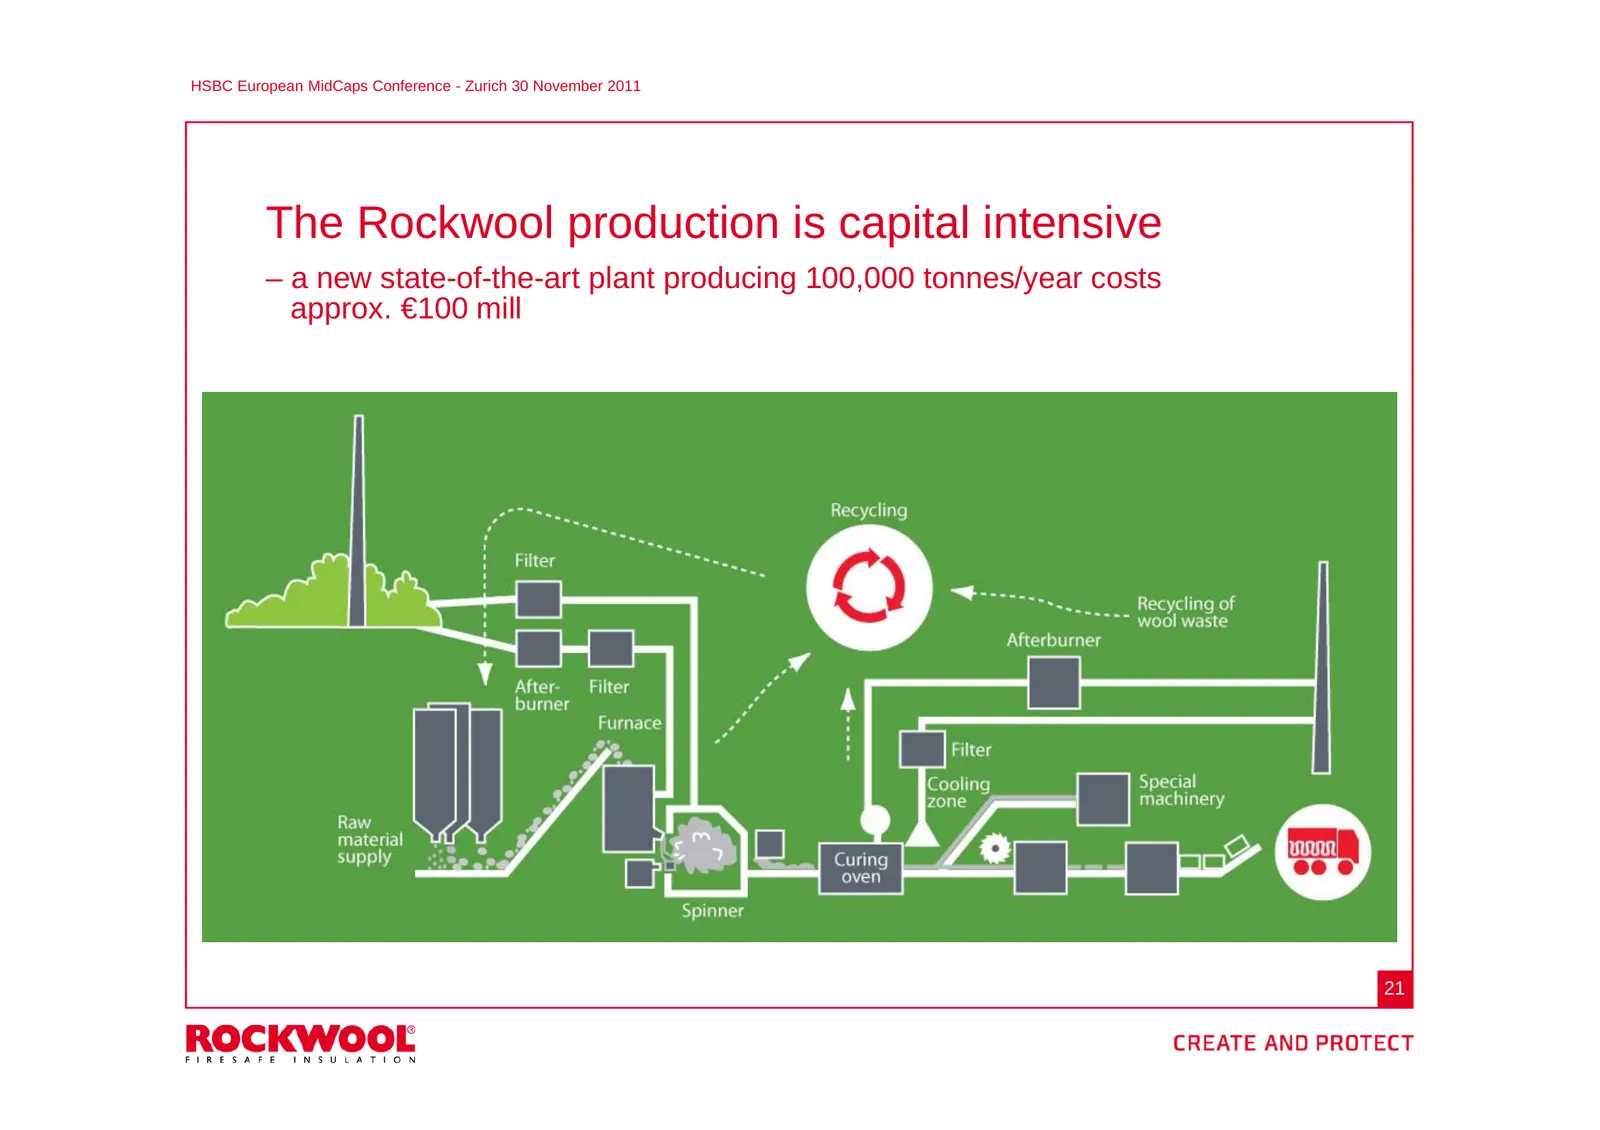
Slide 21: The Rockwool production is capital intensive
HSBC European MidCaps Conference - Zurich 30 November 2011 The Rockwool production is capital intensive – a new state-of-the-art plant producing 100,000 tonnes/year costs approx. €100 mill 21
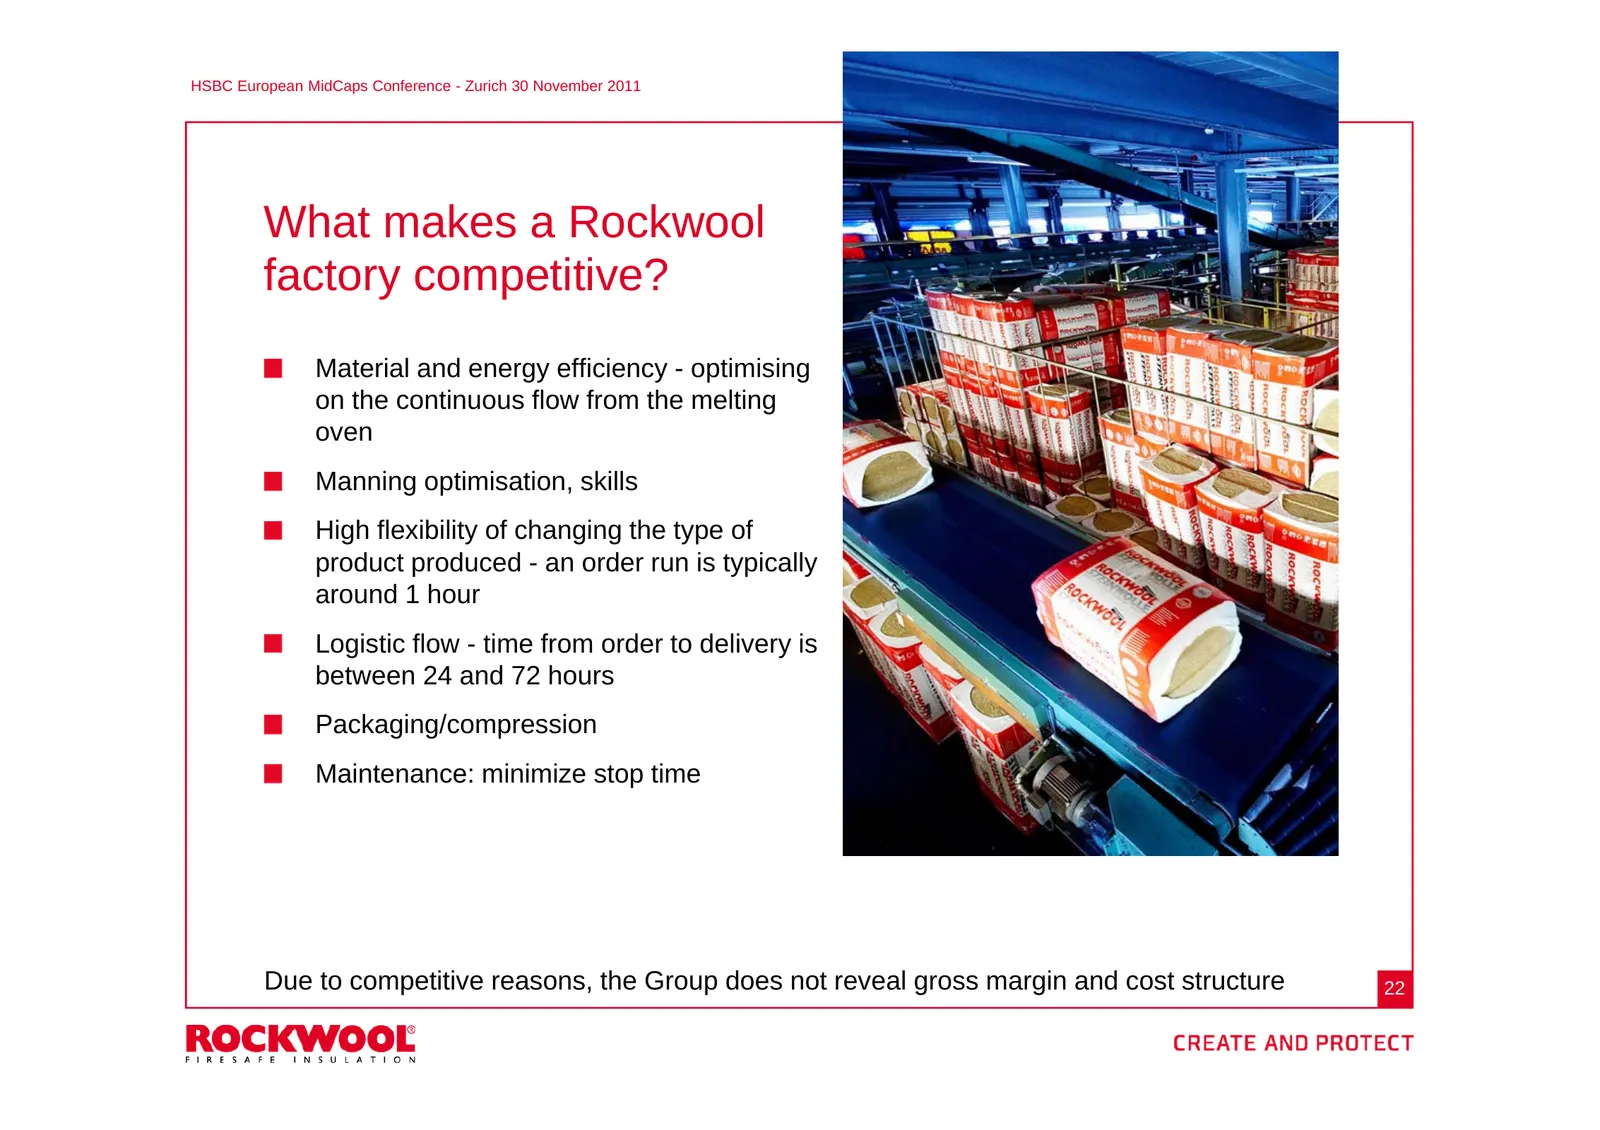
Slide 22: What makes a Rockwool factory competitive?
HSBC European MidCaps Conference - Zurich 30 November 2011 What makes a Rockwool factory competitive? Material and energy efficiency - optimising on the continuous flow from the melting oven Manning optimisation, skills High flexibility of changing the type of product produced - an order run is typi
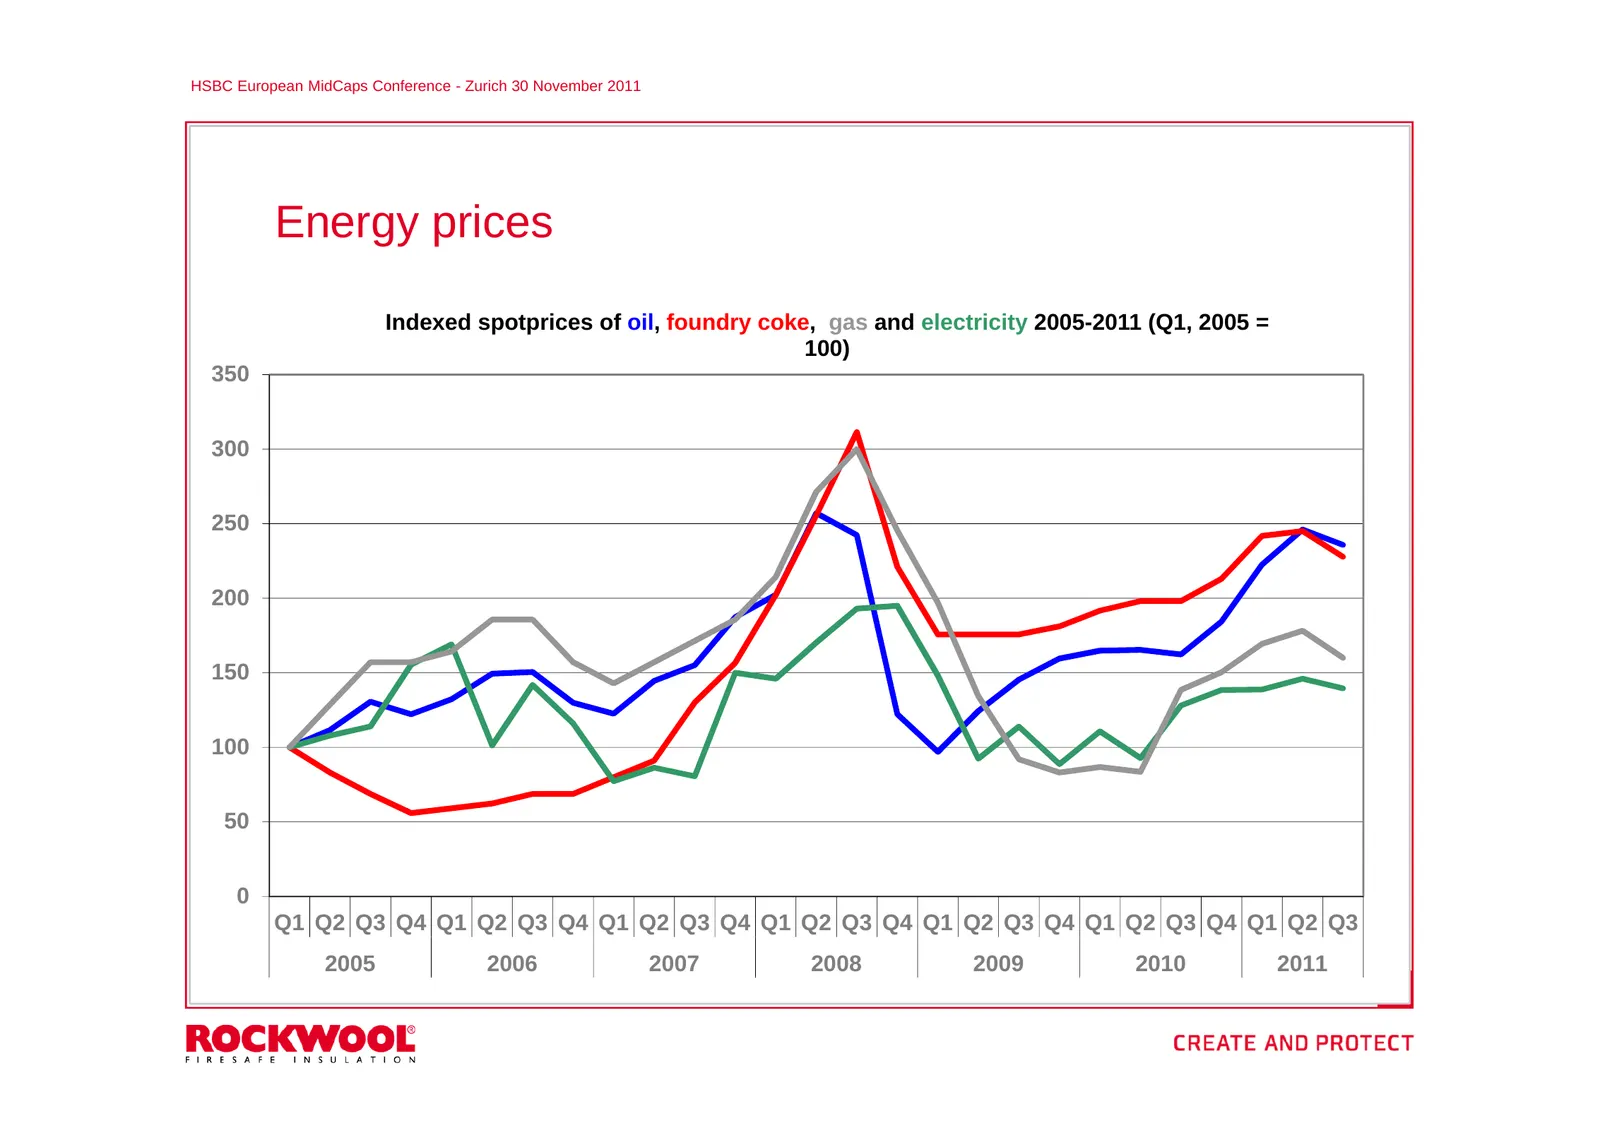
Slide 23: Energy prices
HSBC European MidCaps Conference - Zurich 30 November 2011 Energy prices Indexed spotprices of oil, foundry coke, gas and electricity 2005-2011 (Q1, 2005 = 100) 350 300 250 200 150 100 50 0 Q1 Q2 Q3 Q4 Q1 Q2 Q3 Q4 Q1 Q2 Q3 Q4 Q1 Q2 Q3 Q4 Q1 Q2 Q3 Q4 Q1 Q2 Q3 Q4 Q1 Q2 Q3 2005 2006 2007 2008 2009 2010
Slide 24: Markets and sales
HSBC European MidCaps Conference - Zurich 30 November 2011 Markets and sales 24
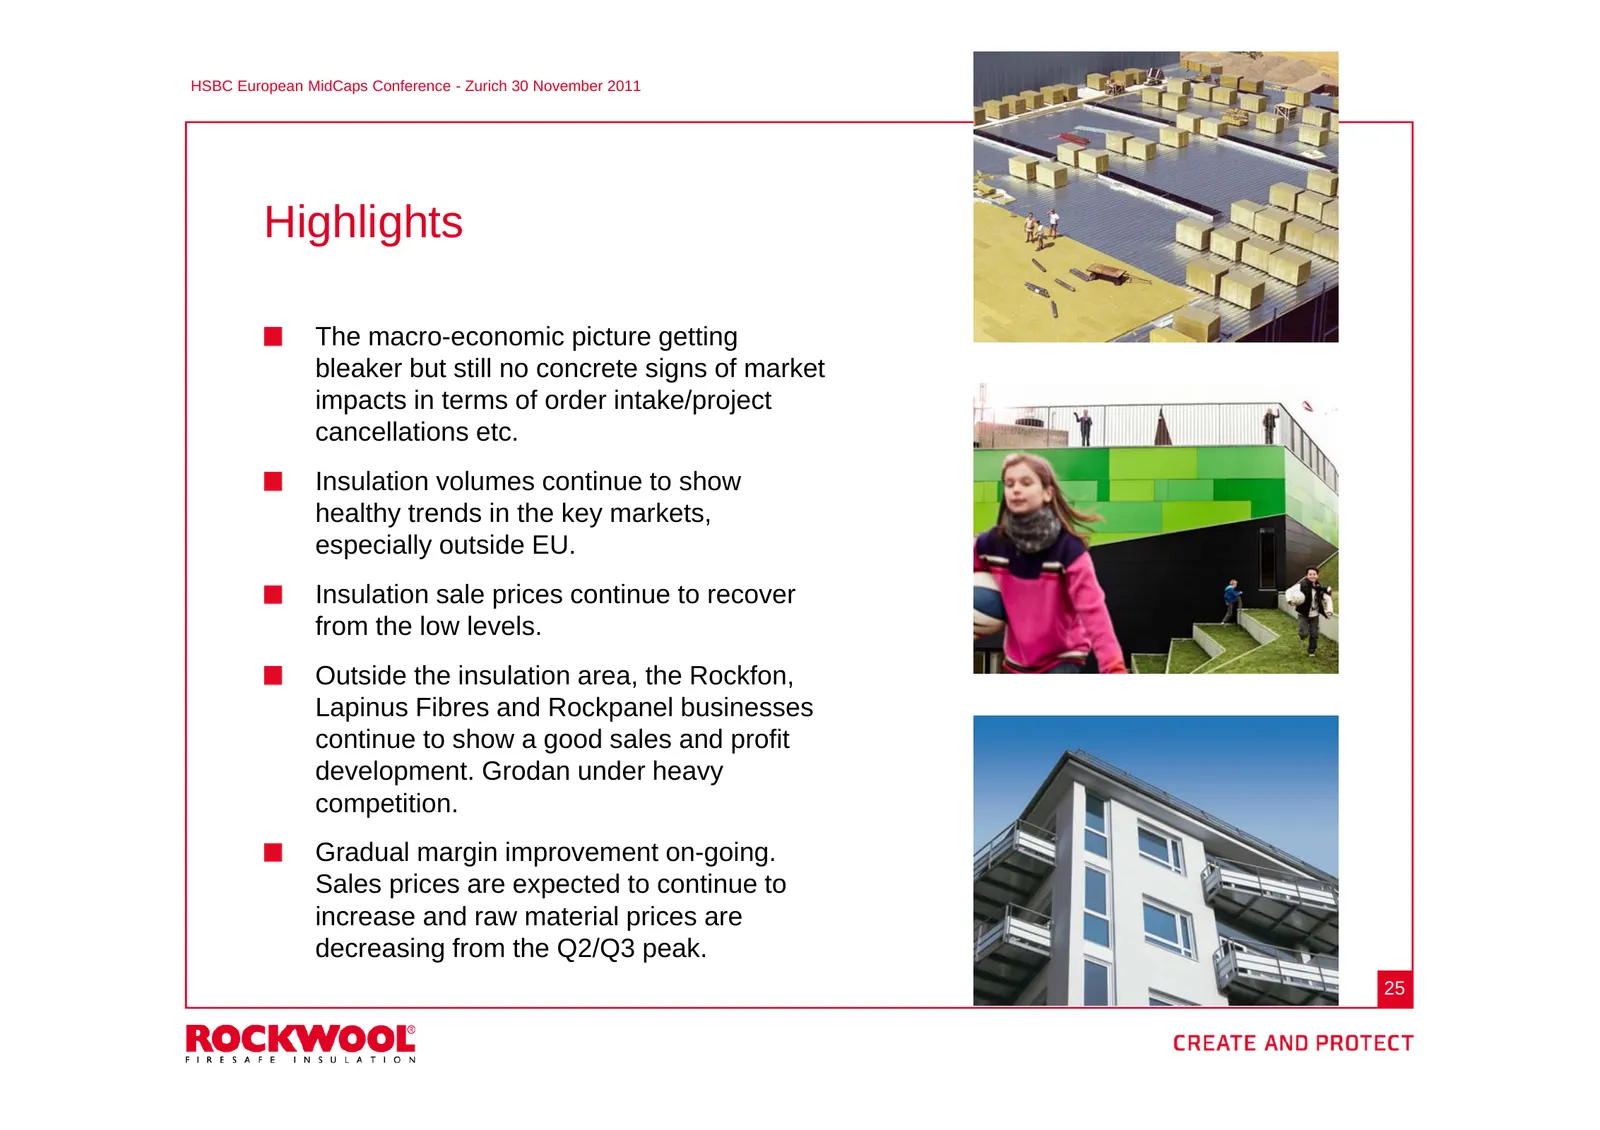
Slide 25: Highlights
HSBC European MidCaps Conference - Zurich 30 November 2011 Highlights The macro-economic picture getting bleaker but still no concrete signs of market impacts in terms of order intake/project cancellations etc. Insulation volumes continue to show healthy trends in the key markets, especially outside
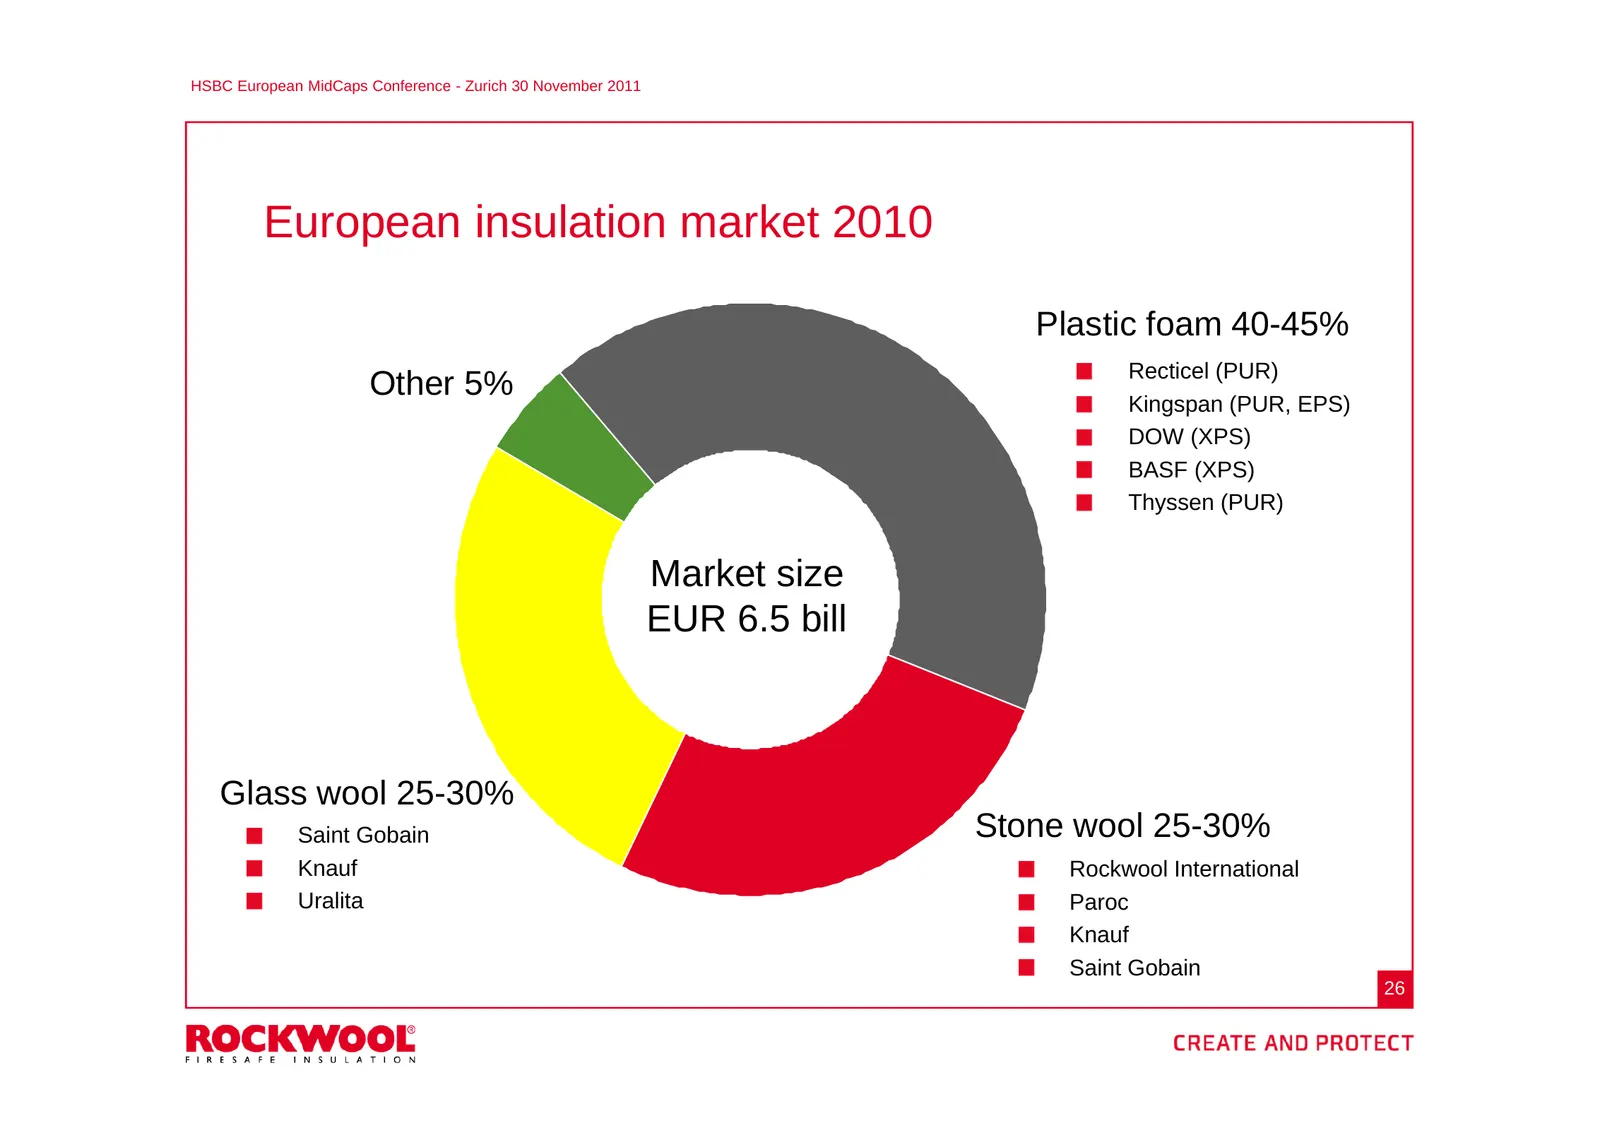
Slide 26: European insulation market 2010
HSBC European MidCaps Conference - Zurich 30 November 2011 European insulation market 2010 Plastic foam 40-45% Recticel (PUR) Other 5% Kingspan (PUR, EPS) DOW (XPS) BASF (XPS) Thyssen (PUR) Market size EUR 6.5 bill Glass wool 25-30% Saint Gobain Stone wool 25-30% Knauf Rockwool International Uralita
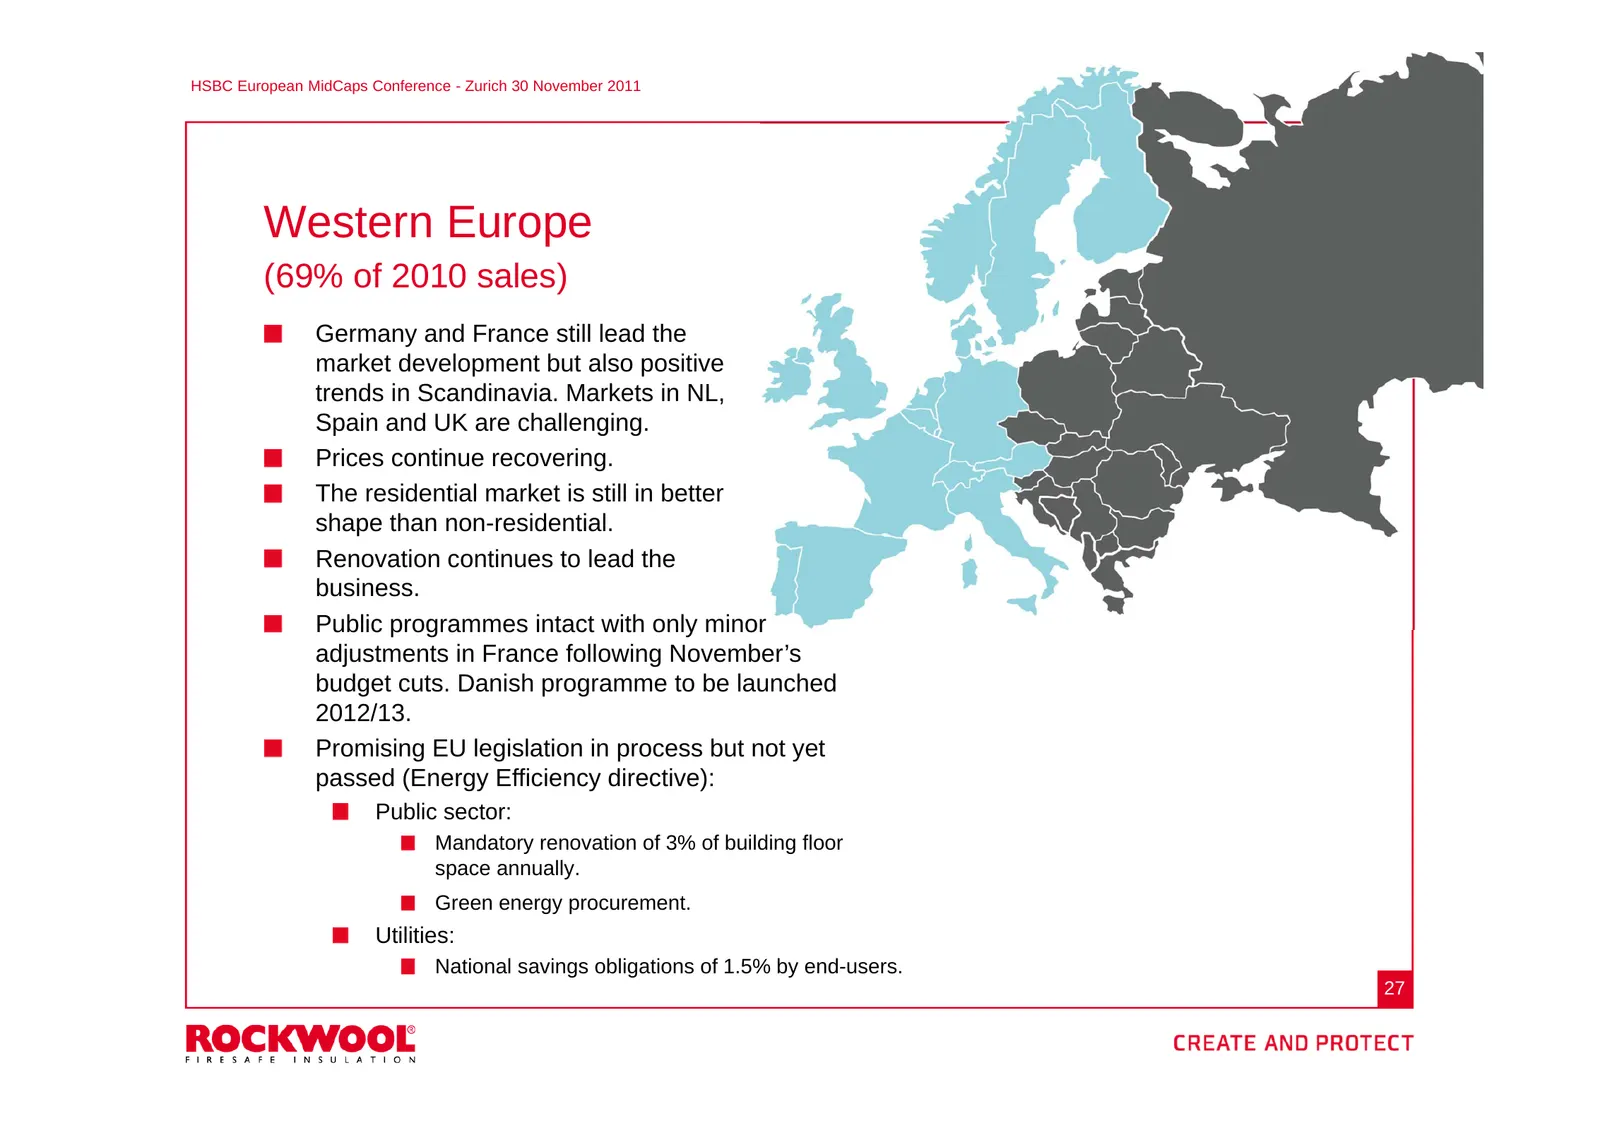
Slide 27: Western Europe
HSBC European MidCaps Conference - Zurich 30 November 2011 Western Europe (69% of 2010 sales) Germany and France still lead the market development but also positive trends in Scandinavia. Markets in NL, Spain and UK are challenging. Prices continue recovering. The residential market is still in bett
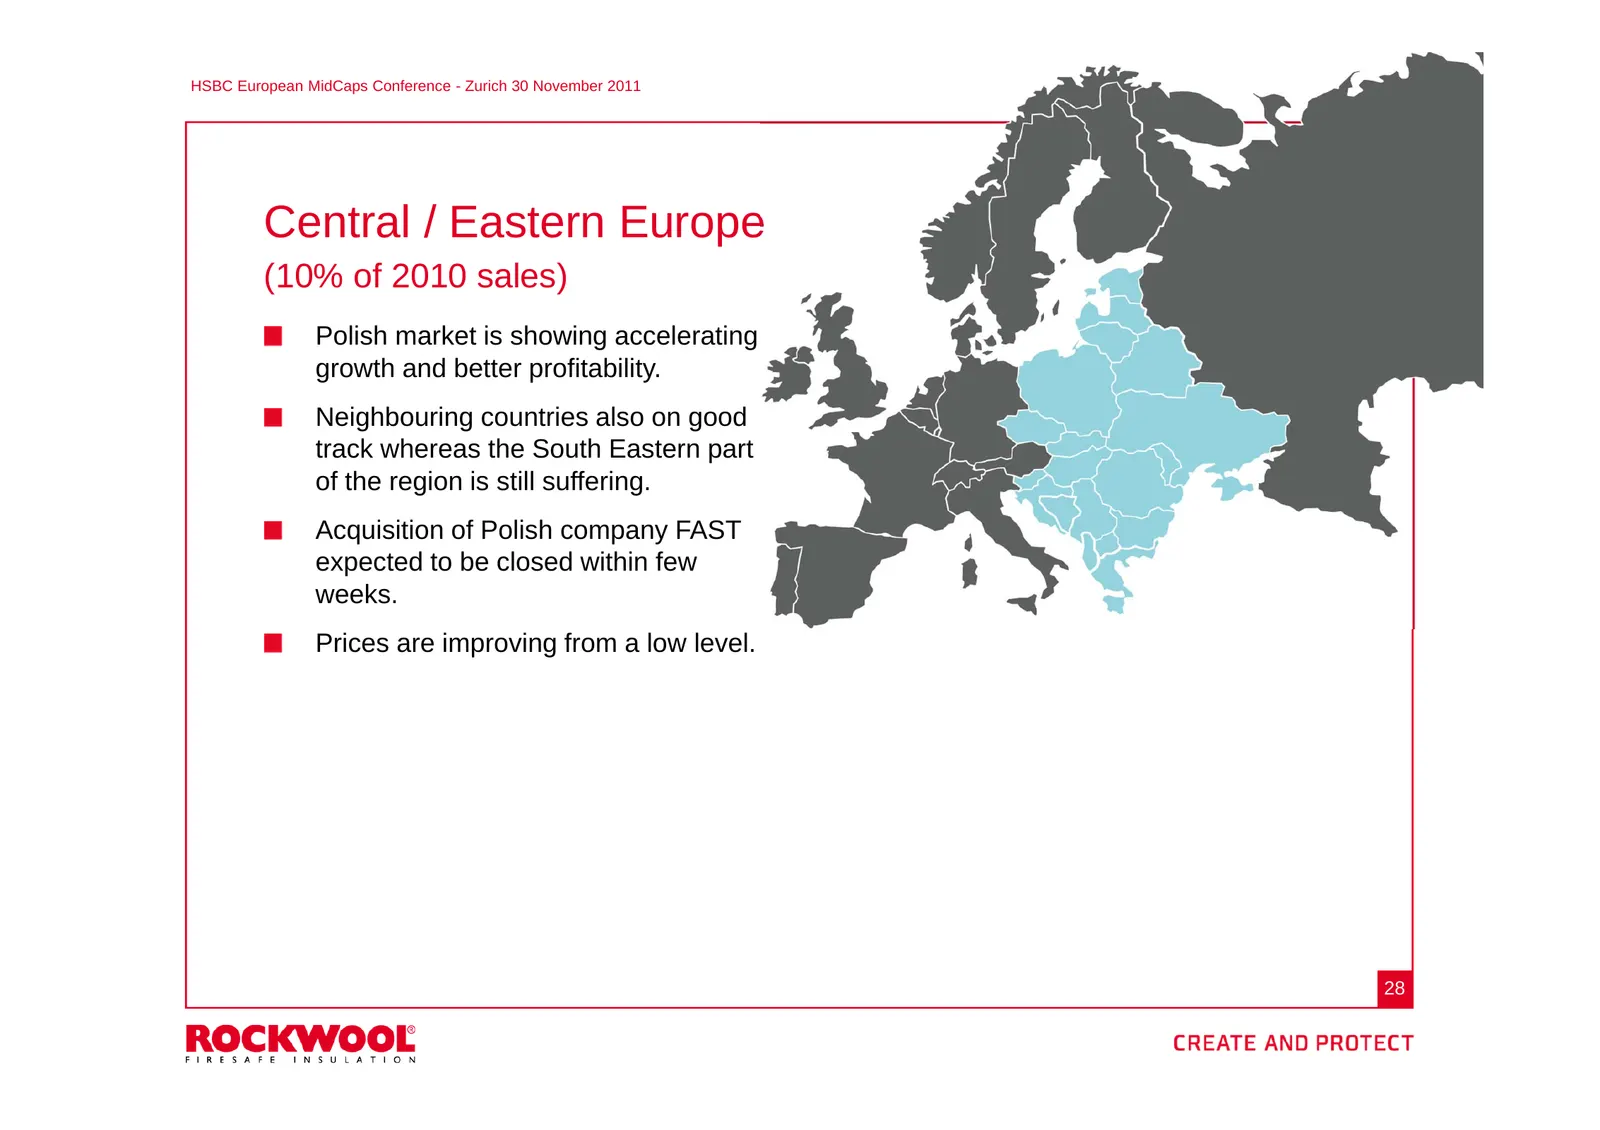
Slide 28: Central / Eastern Europe
HSBC European MidCaps Conference - Zurich 30 November 2011 Central / Eastern Europe (10% of 2010 sales) Polish market is showing accelerating growth and better profitability. Neighbouring countries also on good track whereas the South Eastern part of the region is still suffering. Acquisition of Pol
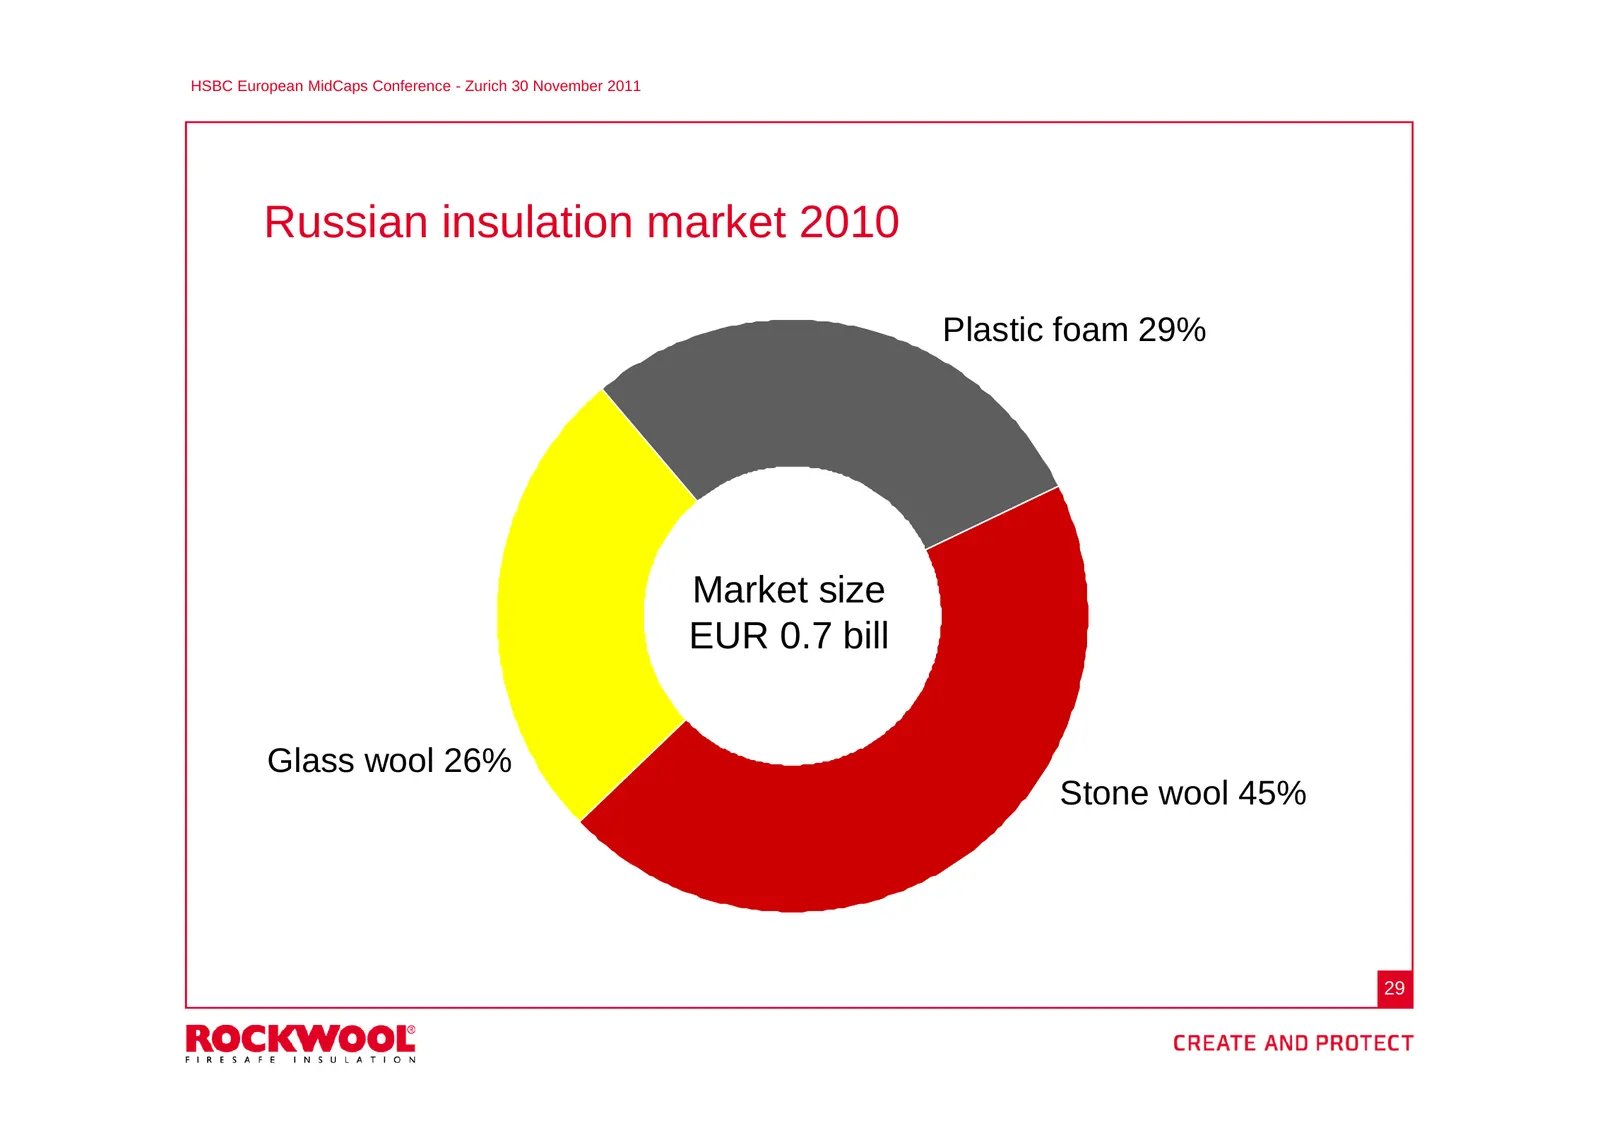
Slide 29: Russian insulation market 2010
HSBC European MidCaps Conference - Zurich 30 November 2011 Russian insulation market 2010 Plastic foam 29% Market size EUR 0.7 bill Glass wool 26% Stone wool 45% 29
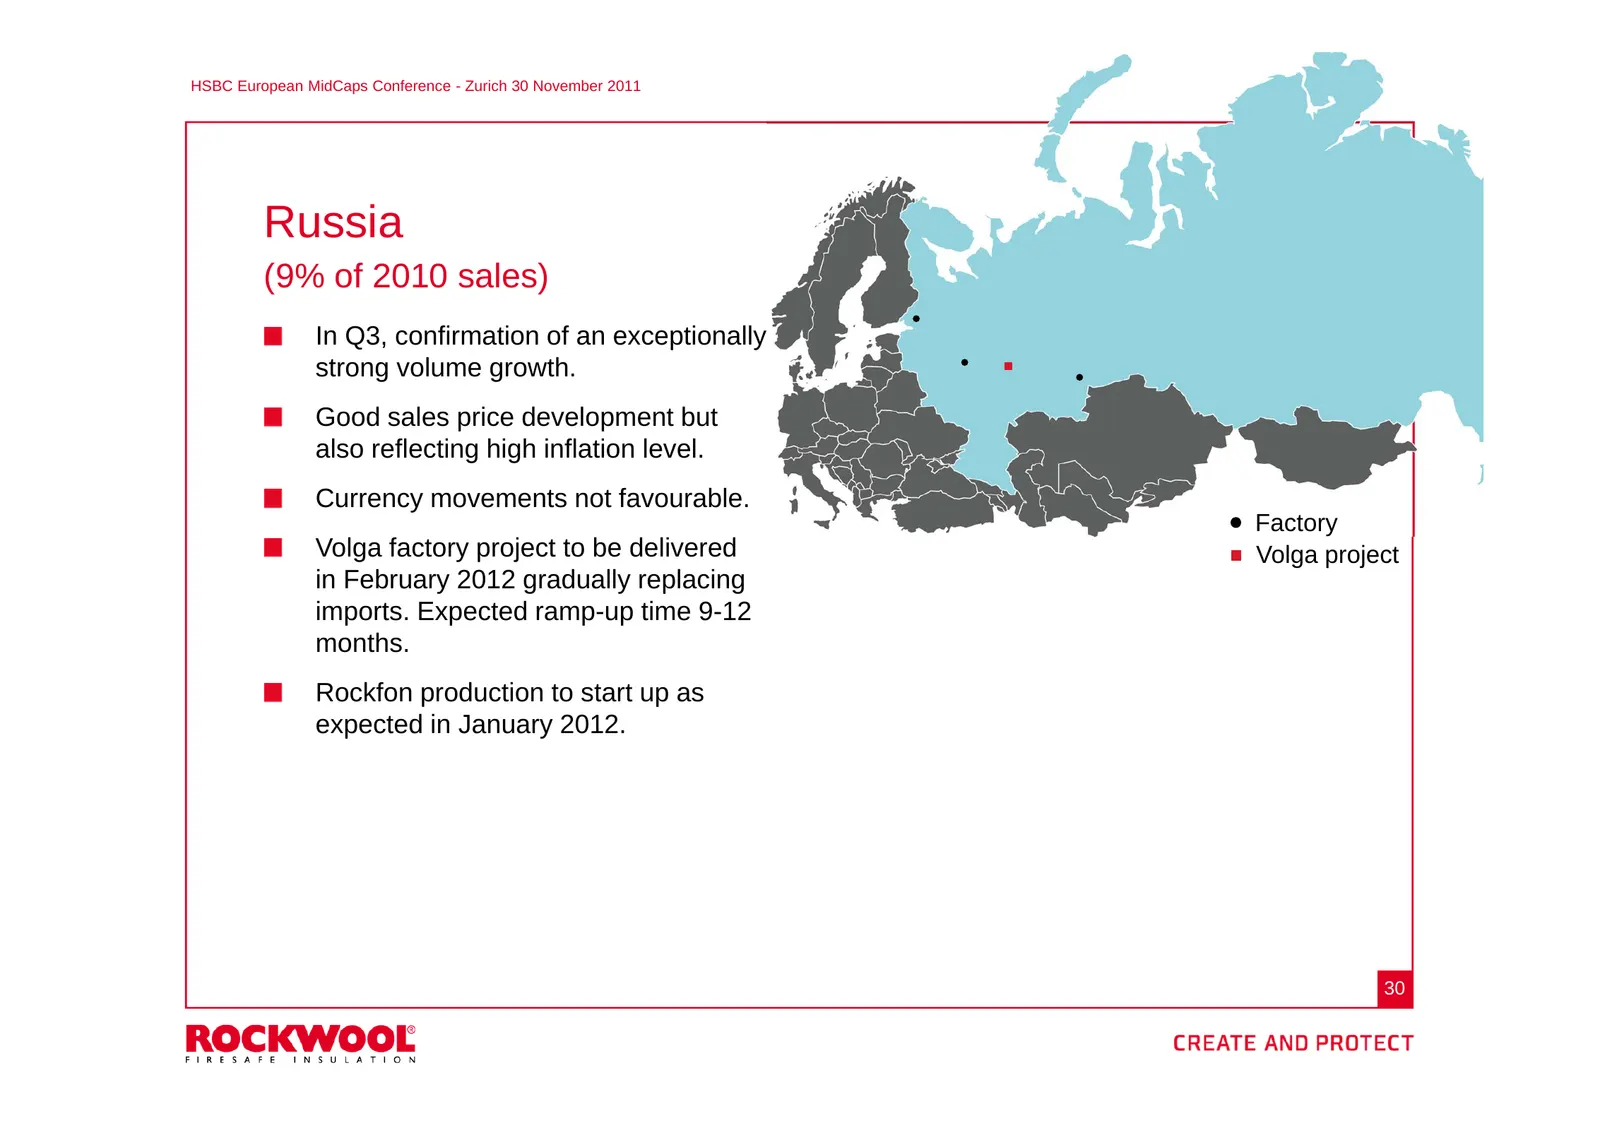
Slide 30: Russia
HSBC European MidCaps Conference - Zurich 30 November 2011 Russia (9% of 2010 sales) In Q3, confirmation of an exceptionally strong volume growth. Good sales price development but also reflecting high inflation level. Currency movements not favourable. Factory Volga factory project to be delivered V
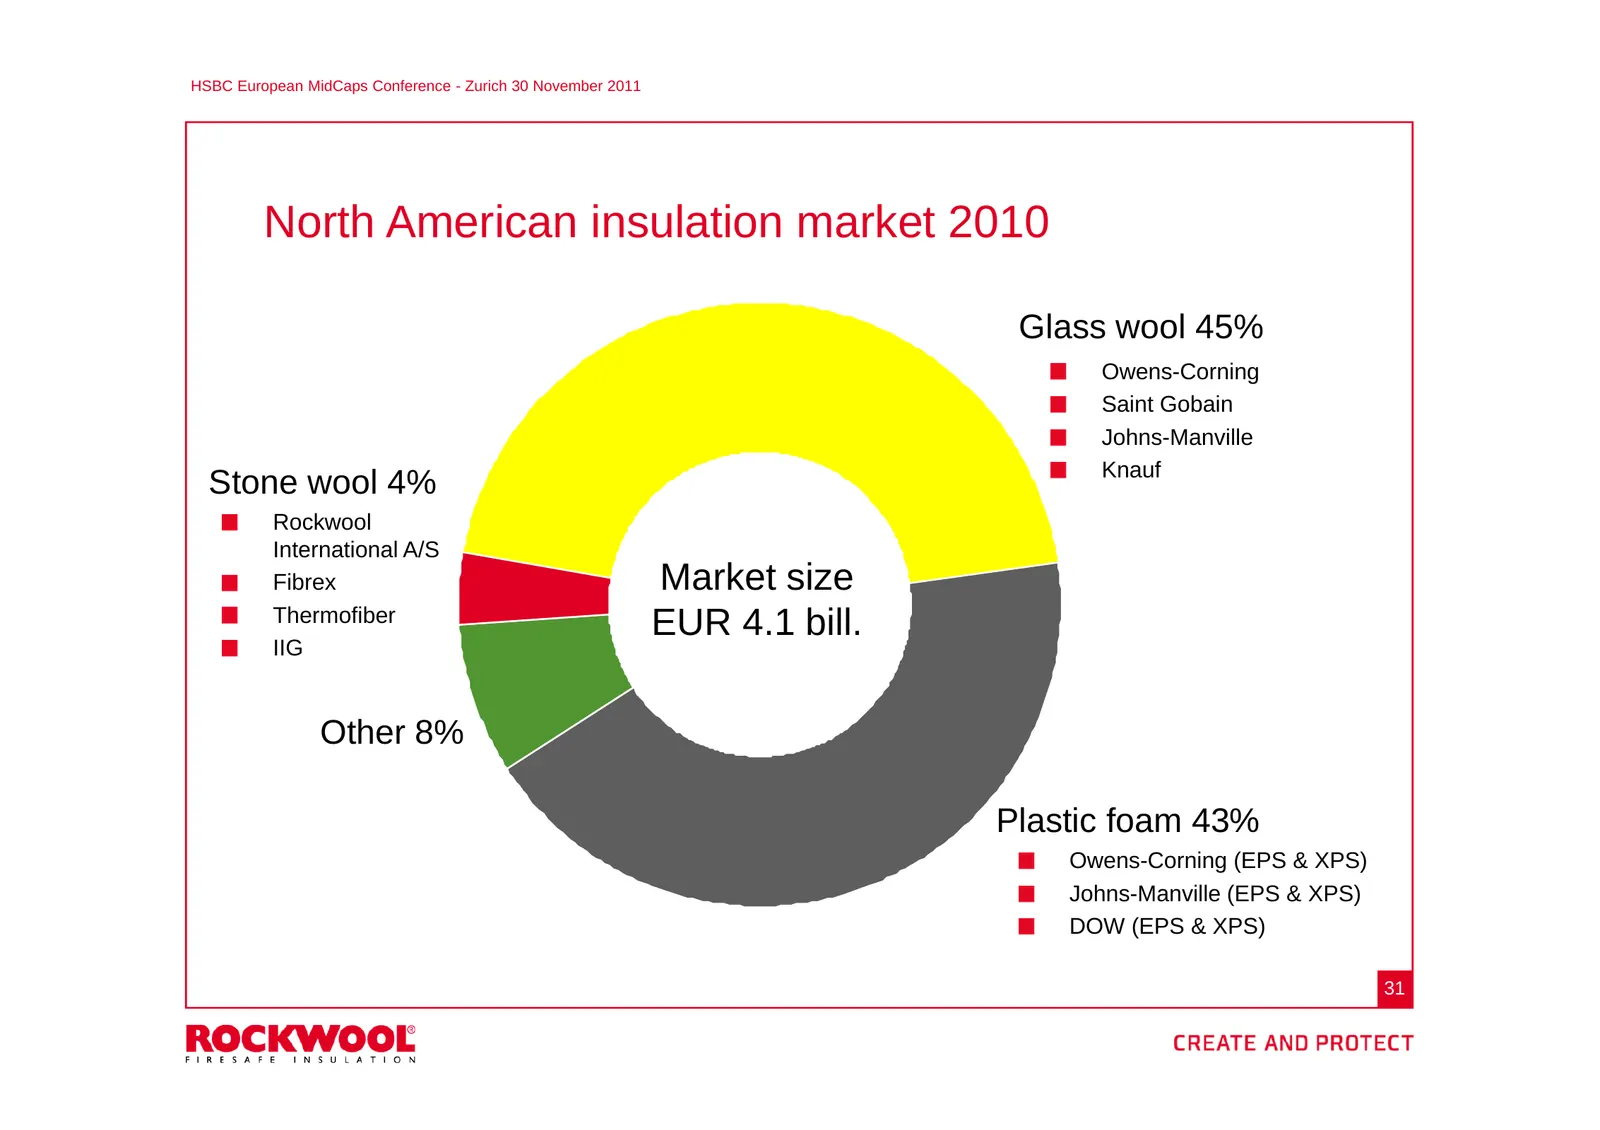
Slide 31: North American insulation market 2010
HSBC European MidCaps Conference - Zurich 30 November 2011 North American insulation market 2010 Glass wool 45% Owens-Corning Saint Gobain Johns-Manville Knauf Stone wool 4% Rockwool International A/S Fibrex Market size Thermofiber EUR 4.1 bill. IIG Other 8% Plastic foam 43% Owens-Corning (EPS & XPS
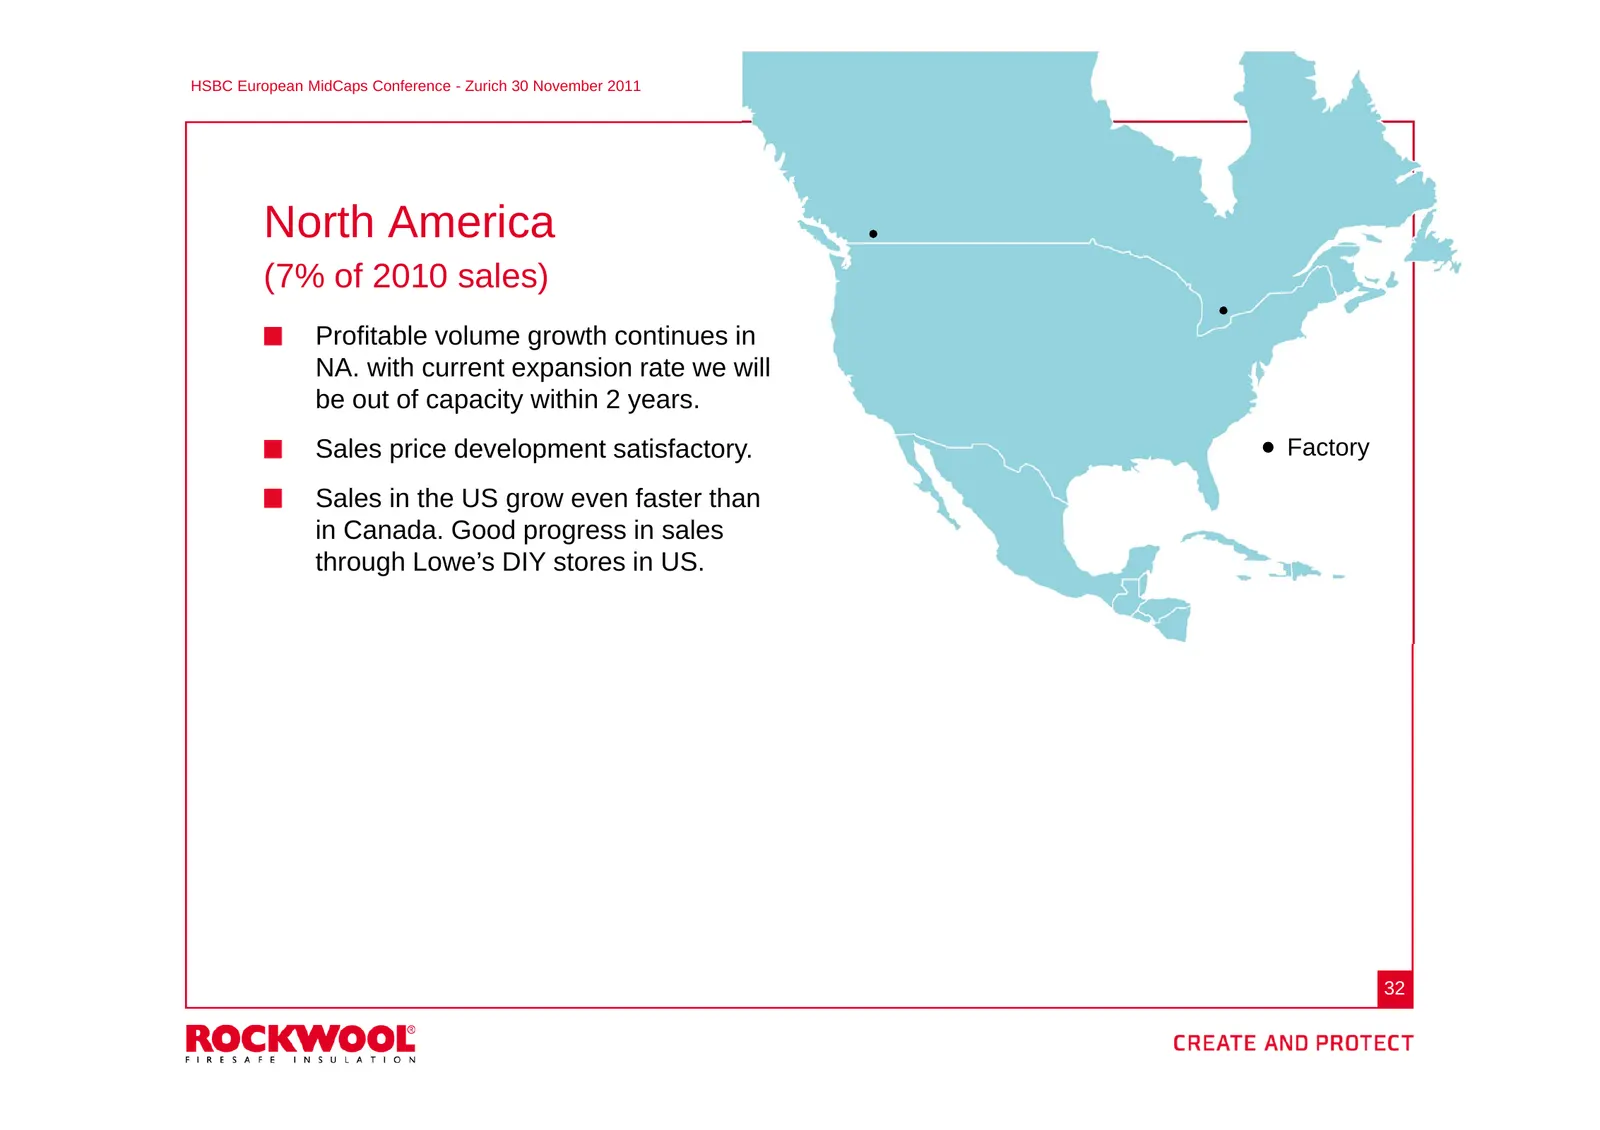
Slide 32: North America
HSBC European MidCaps Conference - Zurich 30 November 2011 North America (7% of 2010 sales) Profitable volume growth continues in NA. with current expansion rate we will be out of capacity within 2 years. Sales price development satisfactory. Factory Sales in the US grow even faster than in Canada.
Slide 33: China and Southeast Asia
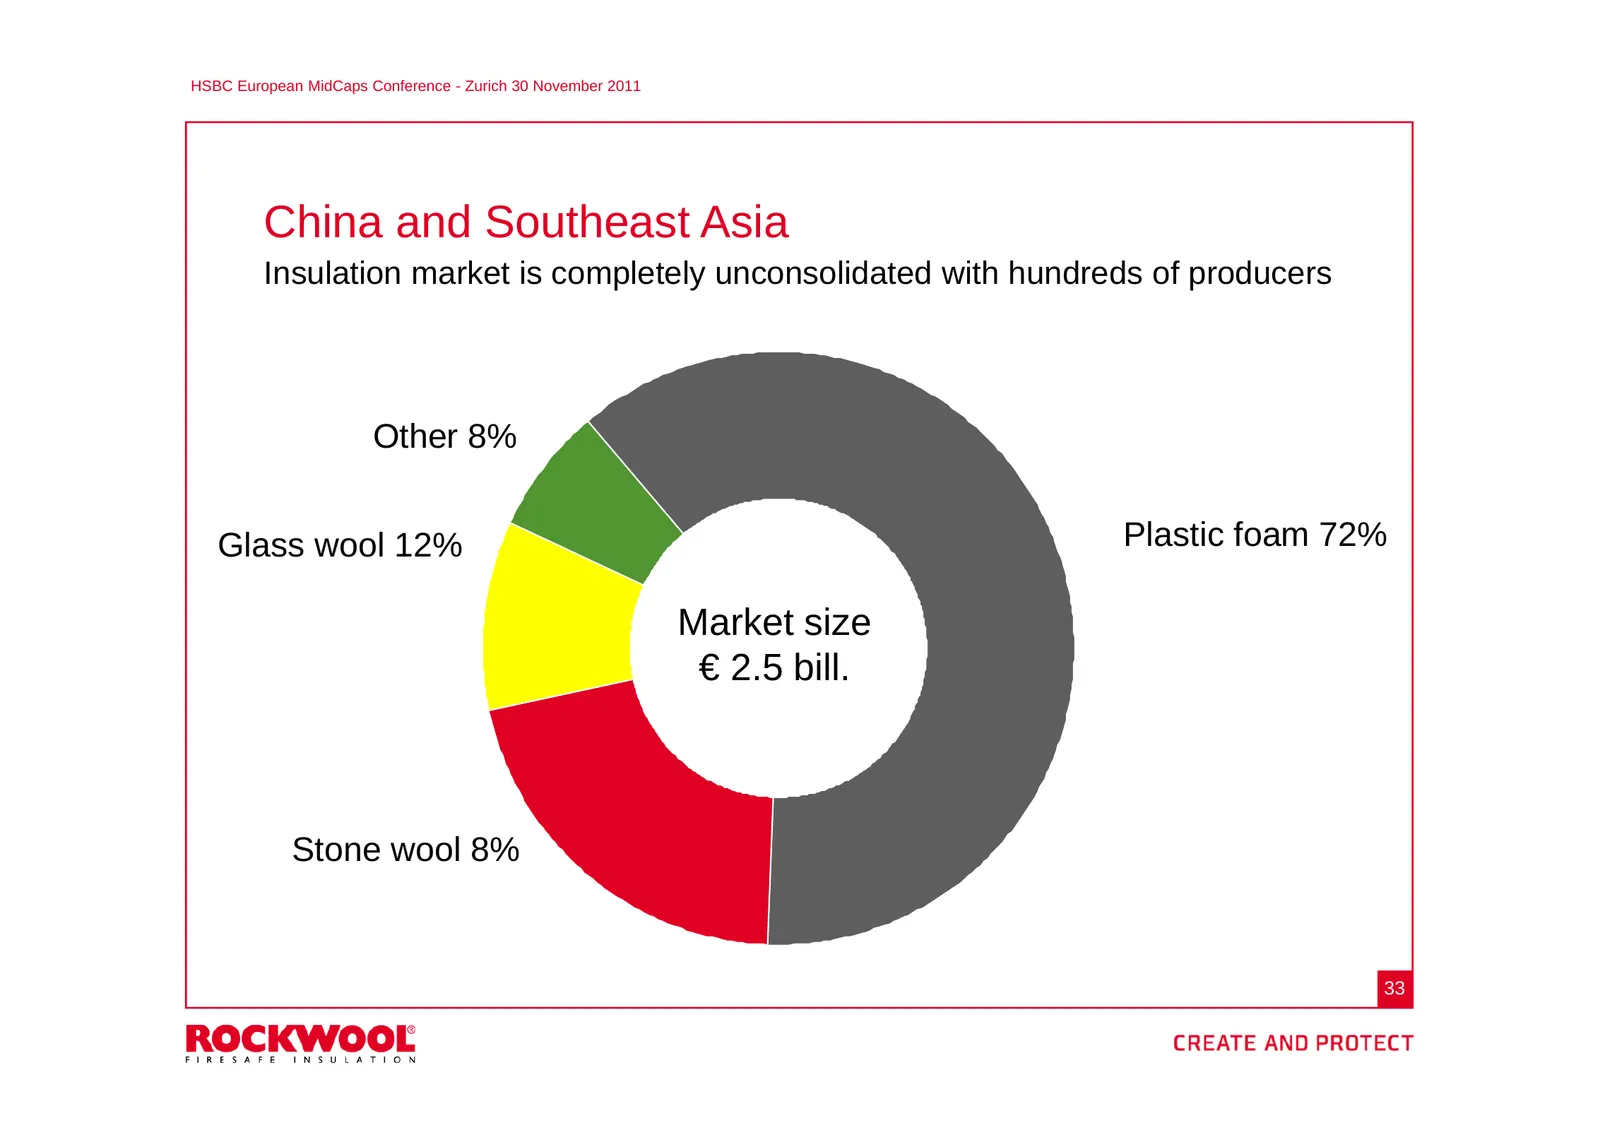
HSBC European MidCaps Conference - Zurich 30 November 2011 China and Southeast Asia Insulation market is completely unconsolidated with hundreds of producers Other 8% Glass wool 12% Plastic foam 72% Market size € 2.5 bill. Stone wool 8% 33
Slide 34: Asia
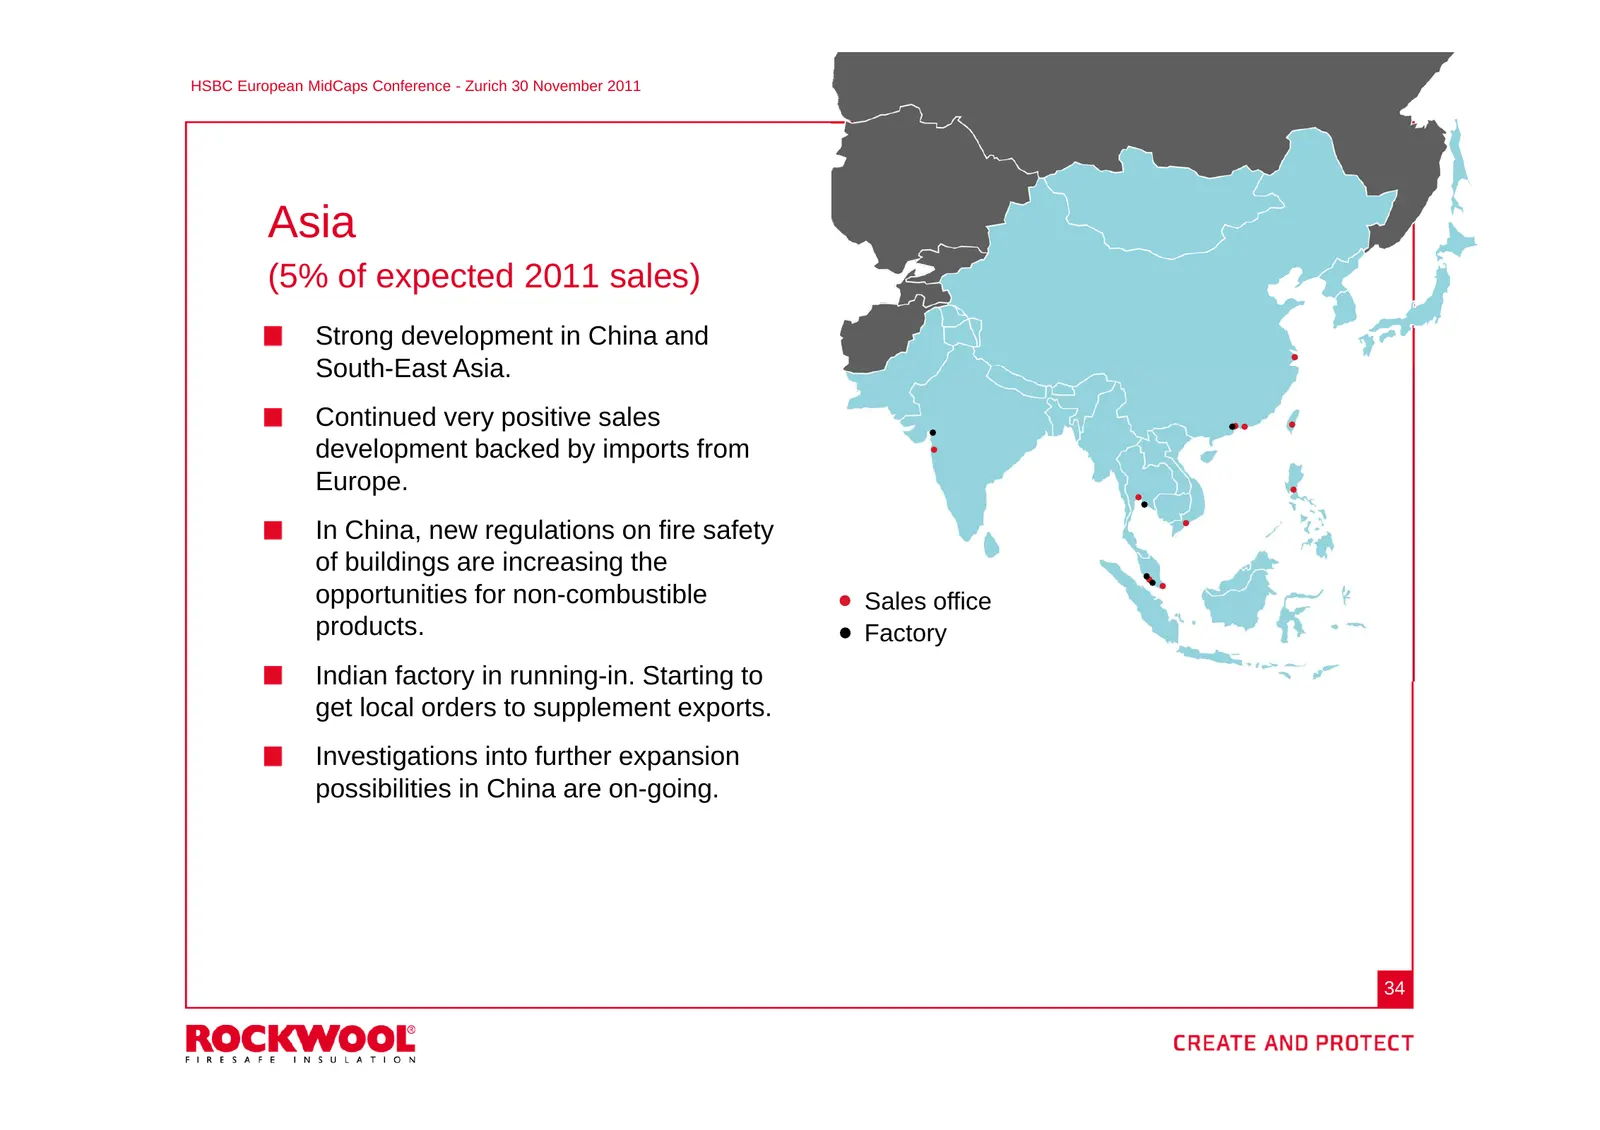
HSBC European MidCaps Conference - Zurich 30 November 2011 Asia (5% of expected 2011 sales) Strong development in China and South-East Asia. Continued very positive sales development backed by imports from Europe. In China, new regulations on fire safety of buildings are increasing the opportunities
Slide 35: Rock the globe
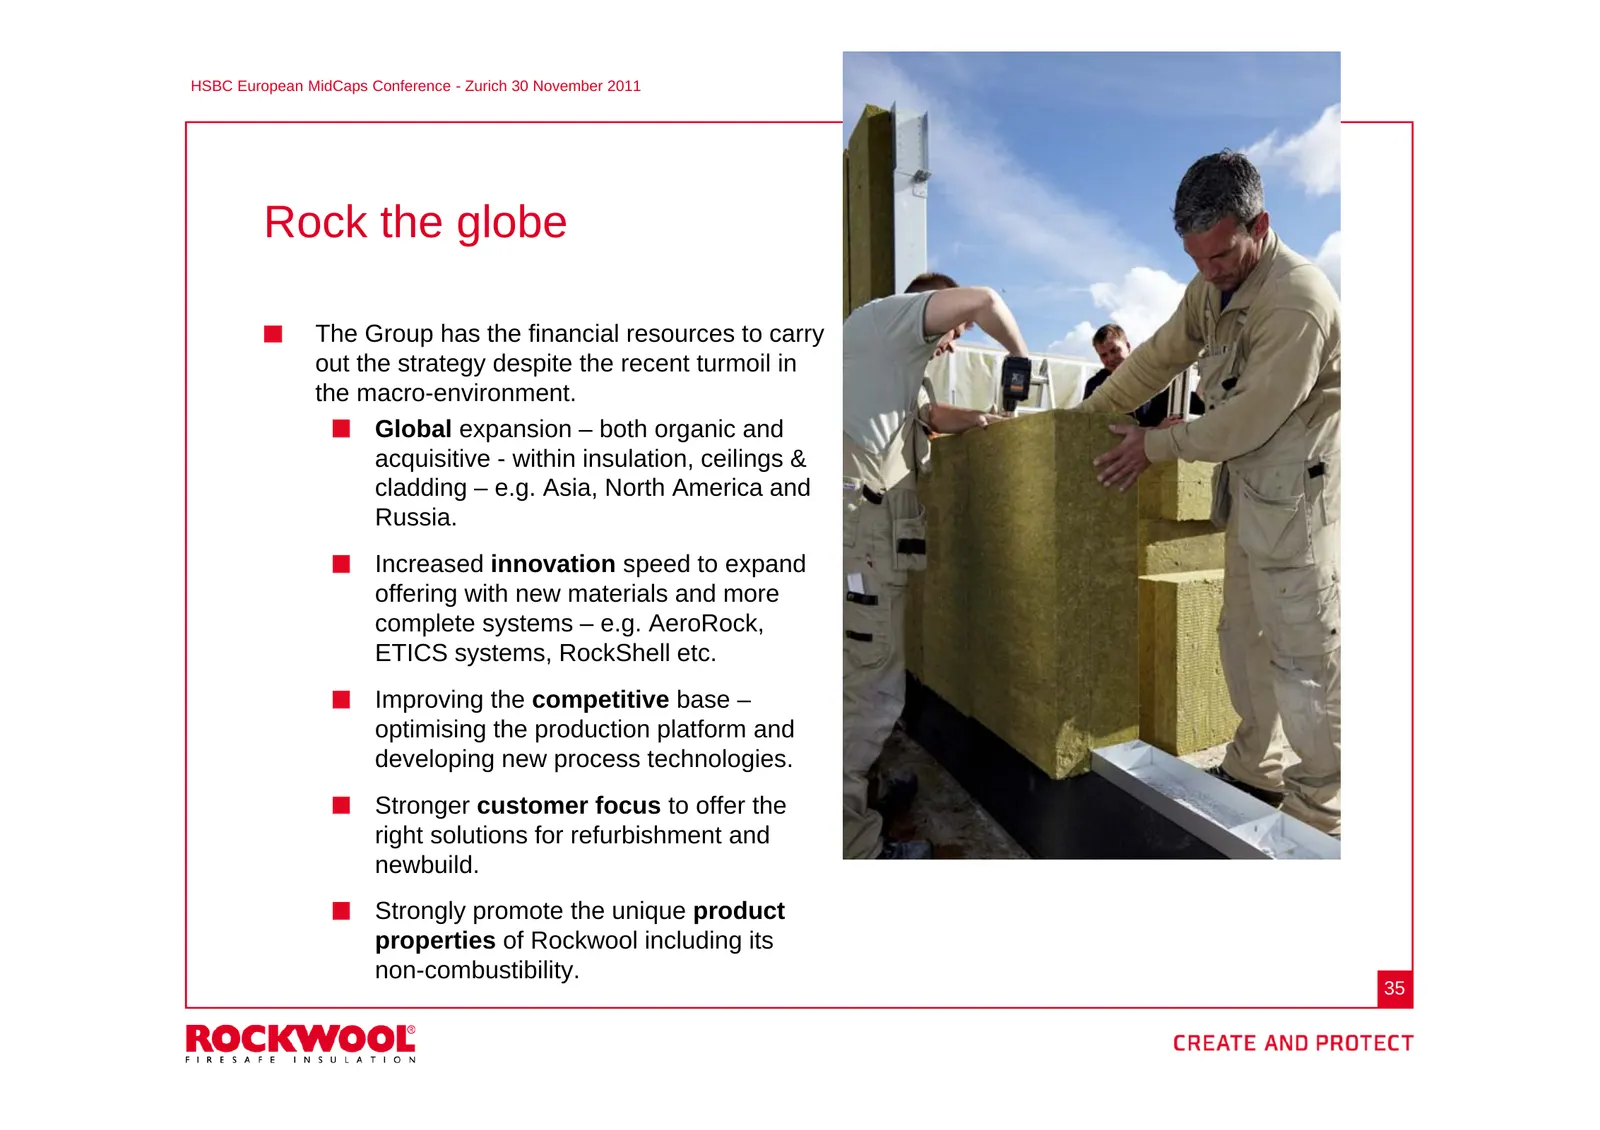
HSBC European MidCaps Conference - Zurich 30 November 2011 Rock the globe The Group has the financial resources to carry out the strategy despite the recent turmoil in the macro-environment. Global expansion – both organic and acquisitive - within insulation, ceilings & cladding – e.g. Asia, North A
Slide 36: Fire safety
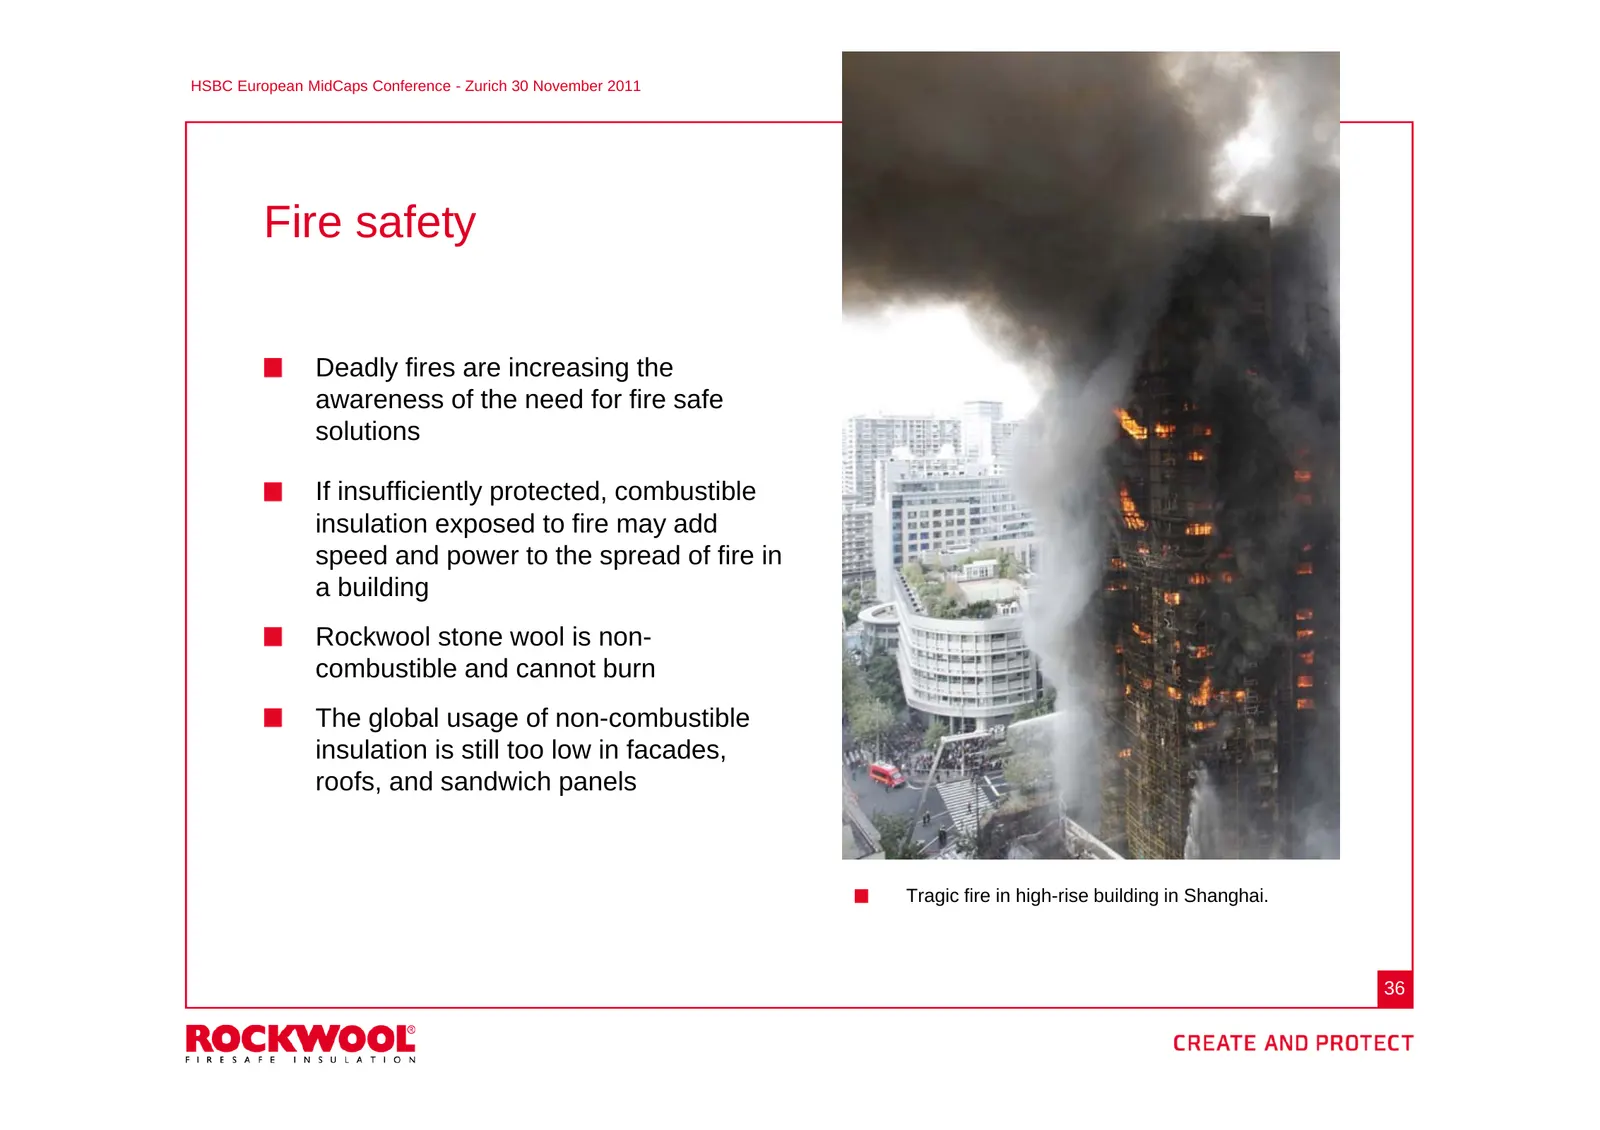
HSBC European MidCaps Conference - Zurich 30 November 2011 Fire safety Deadly fires are increasing the awareness of the need for fire safe solutions If insufficiently protected, combustible insulation exposed to fire may add speed and power to the spread of fire in a building Rockwool stone wool is
Slide 37: Financials
HSBC European MidCaps Conference - Zurich 30 November 2011 Financials 37
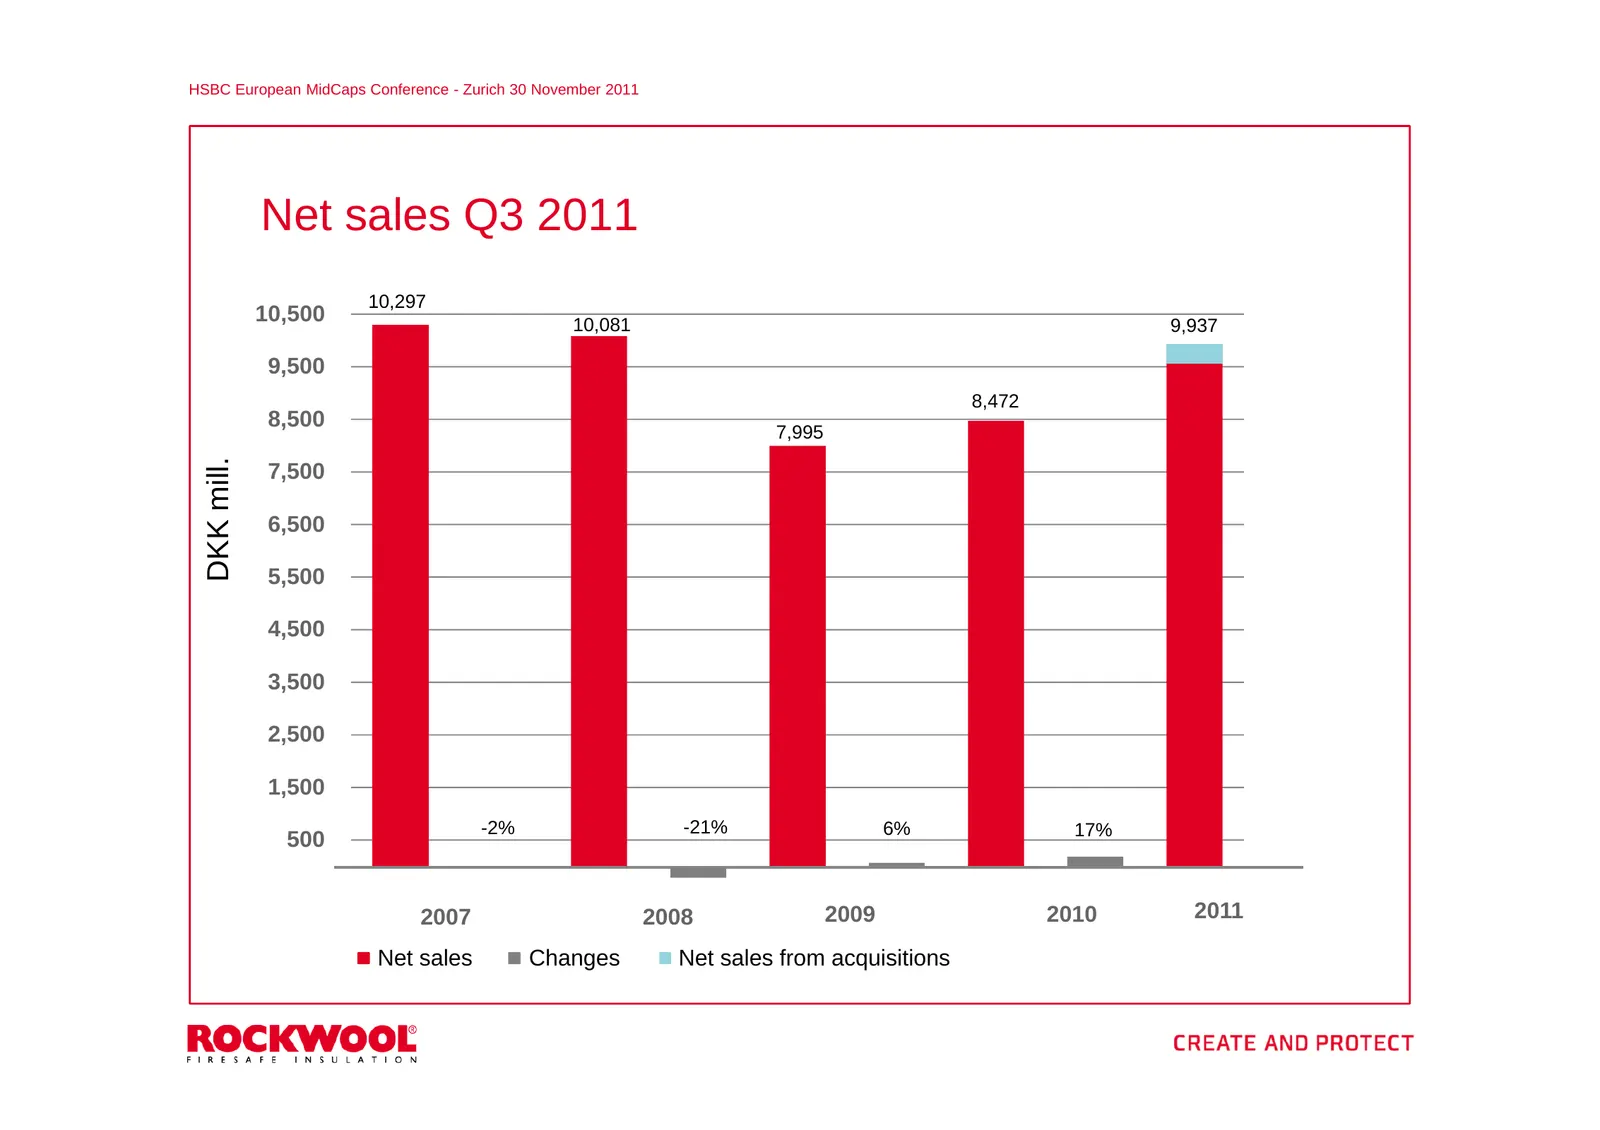
Slide 38: Net sales Q3 2011
HSBC European MidCaps Conference - Zurich 30 November 2011 Net sales Q3 2011 10,297 10,500 10,081 9,937 952.0% 9,500 8,472 8,500 7,995 752.0% DKK mill. 7,500 6,500 552.0% 5,500 4,500 352.0% 3,500 2,500 1,500 152.0% -2% -21% 6% 17% 500 -500 -48.0% 2007 2008 2009 2010 2011 Net sales Changes Net sales
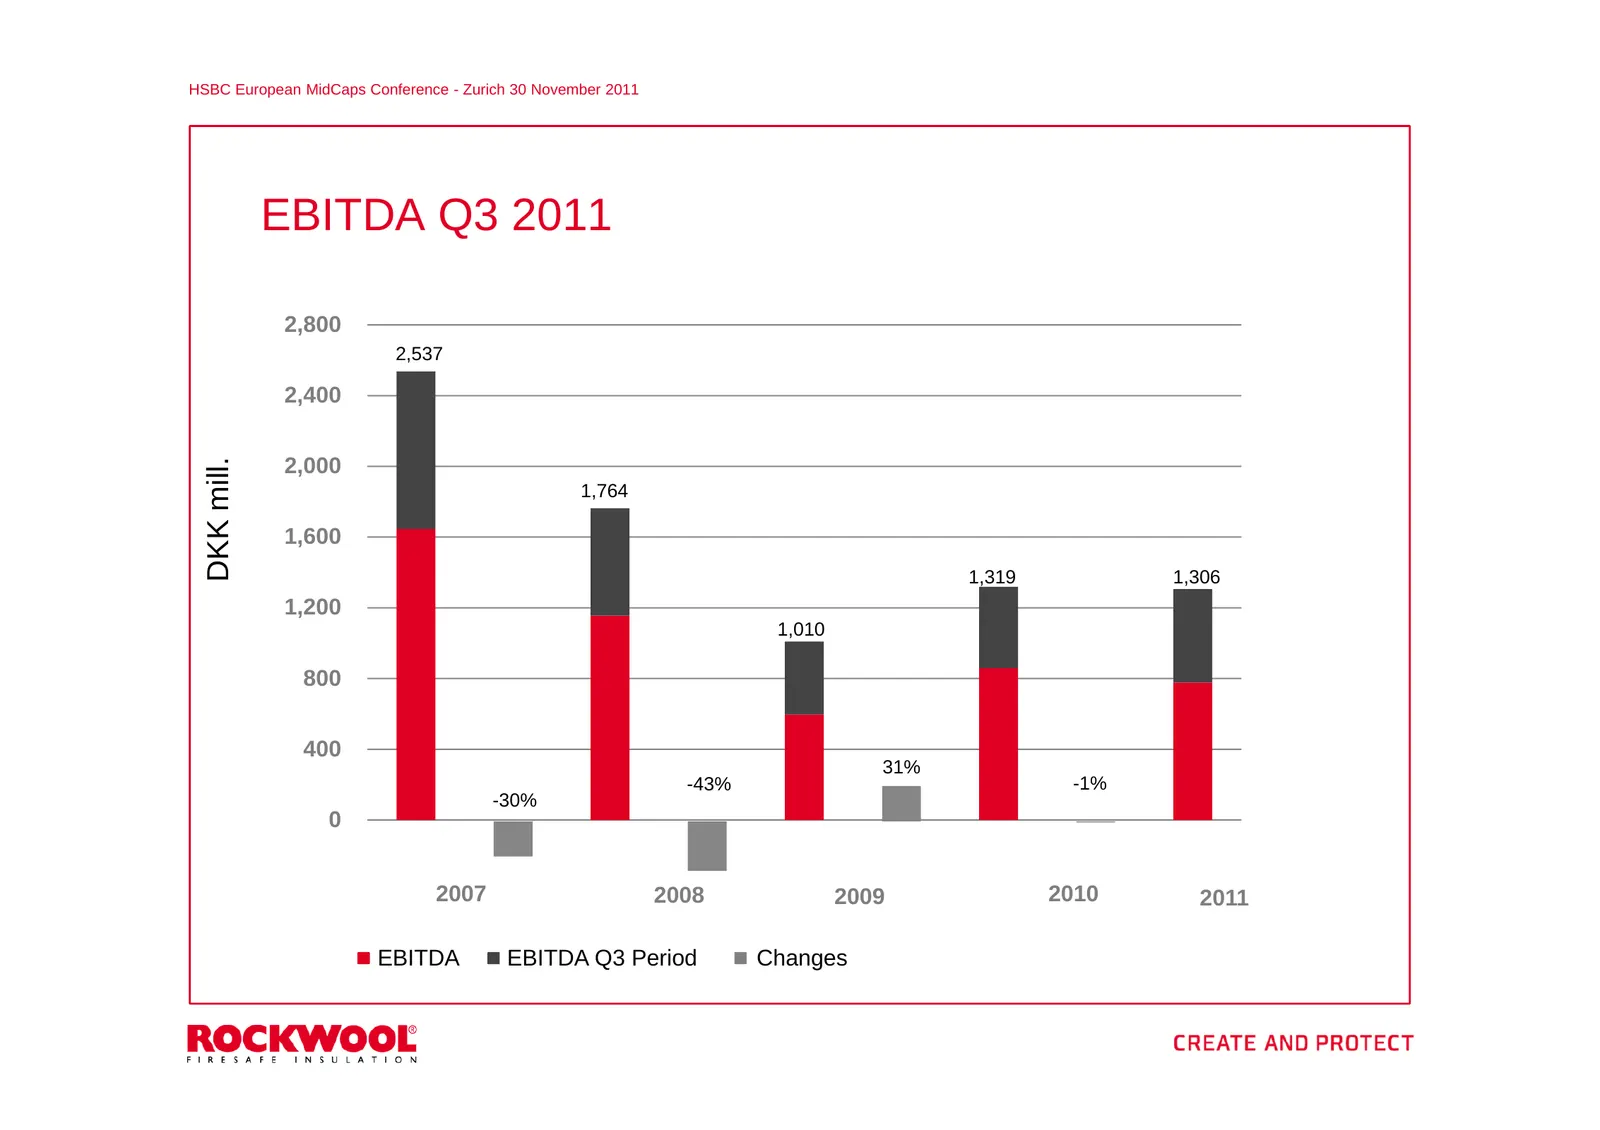
Slide 39: EBITDA Q3 2011
HSBC European MidCaps Conference - Zurich 30 November 2011 EBITDA Q3 2011 2,800 440% 2,537 2,400 340% 2,000 DKK mill. 1,764 1,600 240% 1,319 1,306 1,200 1,010 800 140% 400 31% -43% -1% 40% -30% 0 -400 2007 2008 2009 2010 2011 -60% EBITDA EBITDA Q3 Period Changes
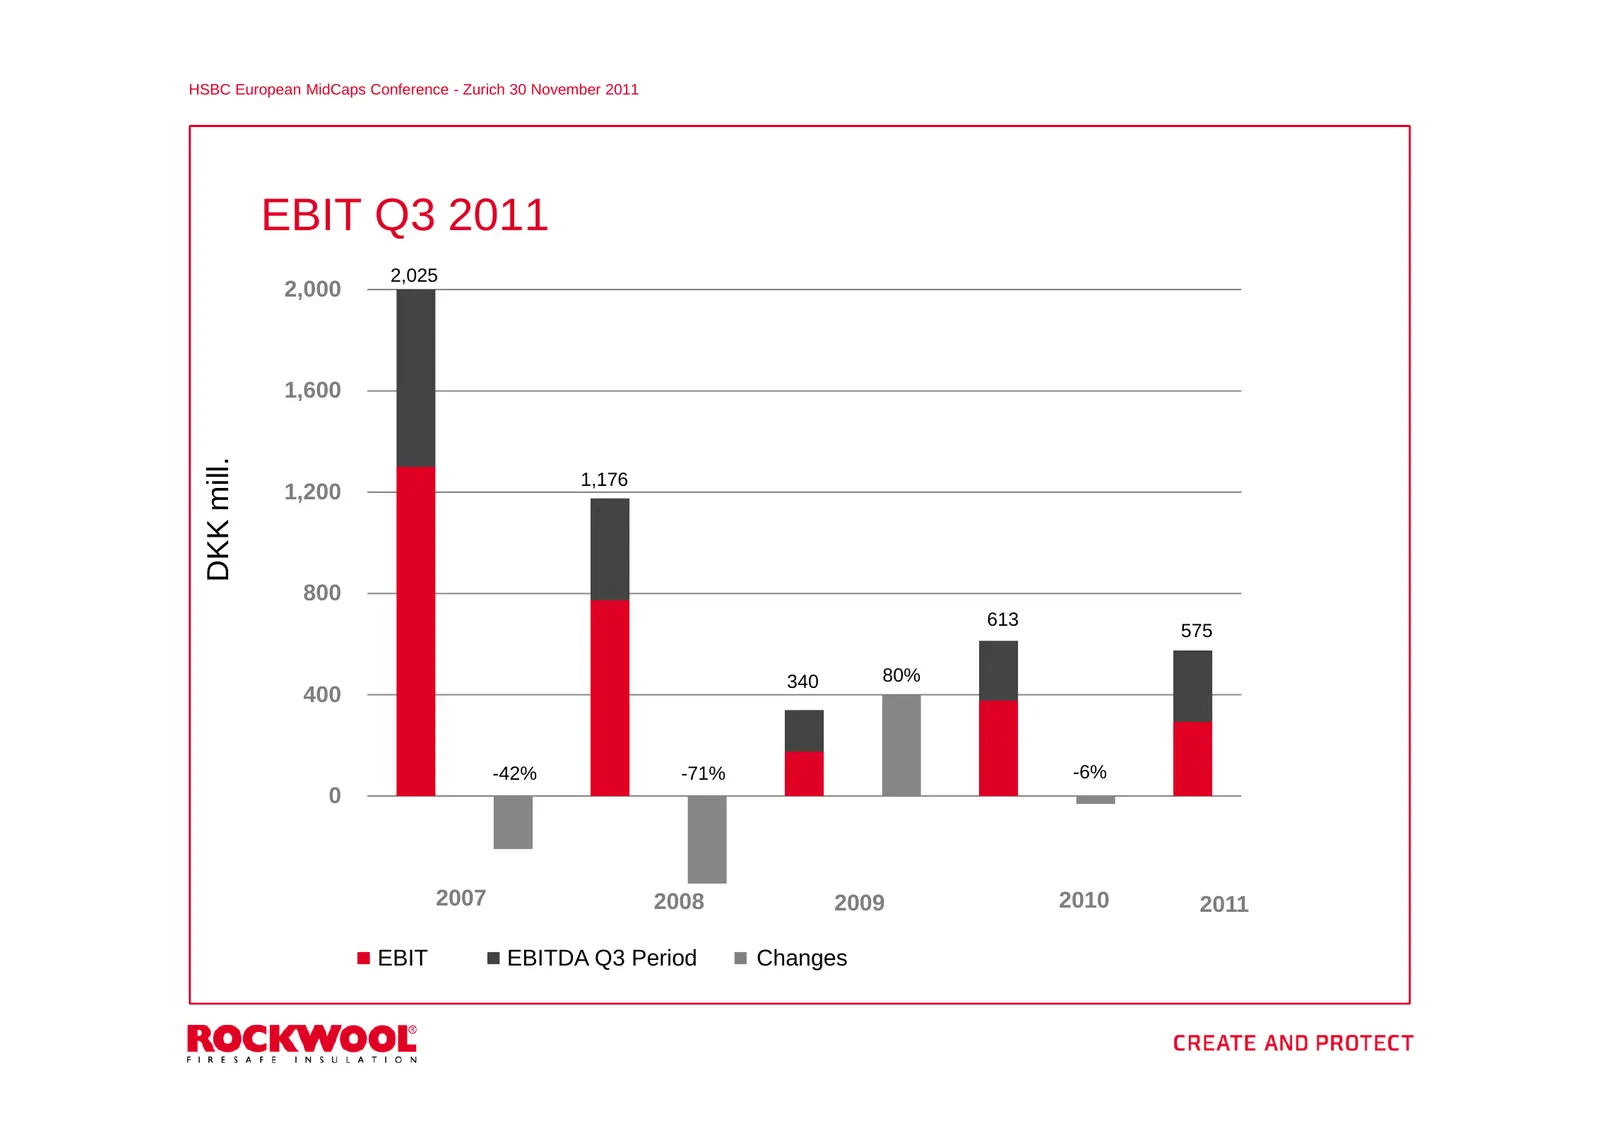
Slide 40: EBIT Q3 2011
HSBC European MidCaps Conference - Zurich 30 November 2011 EBIT Q3 2011 2,025 2,000 1,600 320% DKK mill. 1,176 1,200 220% 800 613 575 120% 340 80% 400 -42% -71% -6% 20% 0 -400 2007 2008 2009 2010 2011 -80% EBIT EBITDA Q3 Period Changes
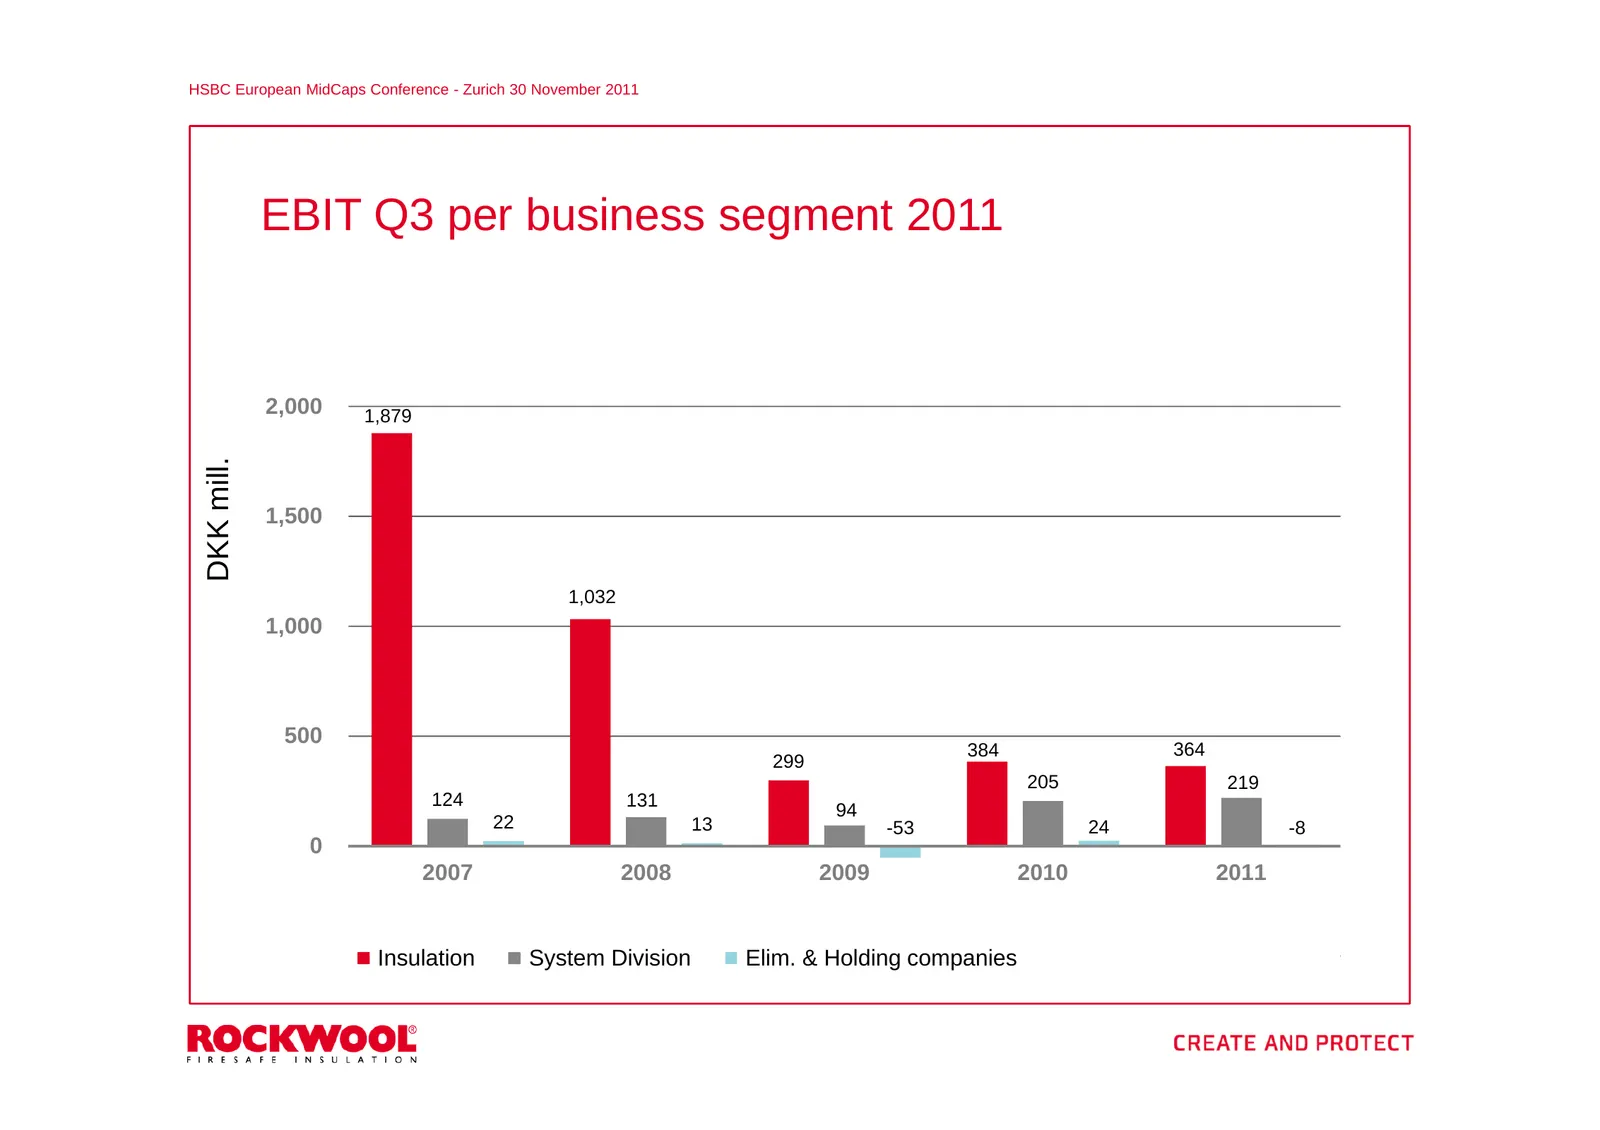
Slide 41: EBIT Q3 per business segment 2011
HSBC European MidCaps Conference - Zurich 30 November 2011 EBIT Q3 per business segment 2011 2,000 1,879 DKK mill. 1,500 1,032 1,000 500 384 364 299 205 219 124 131 94 22 13 -53 24 -8 0 2007 2008 2009 2010 2011 -500 Insulation System Division Elim. & Holding companies
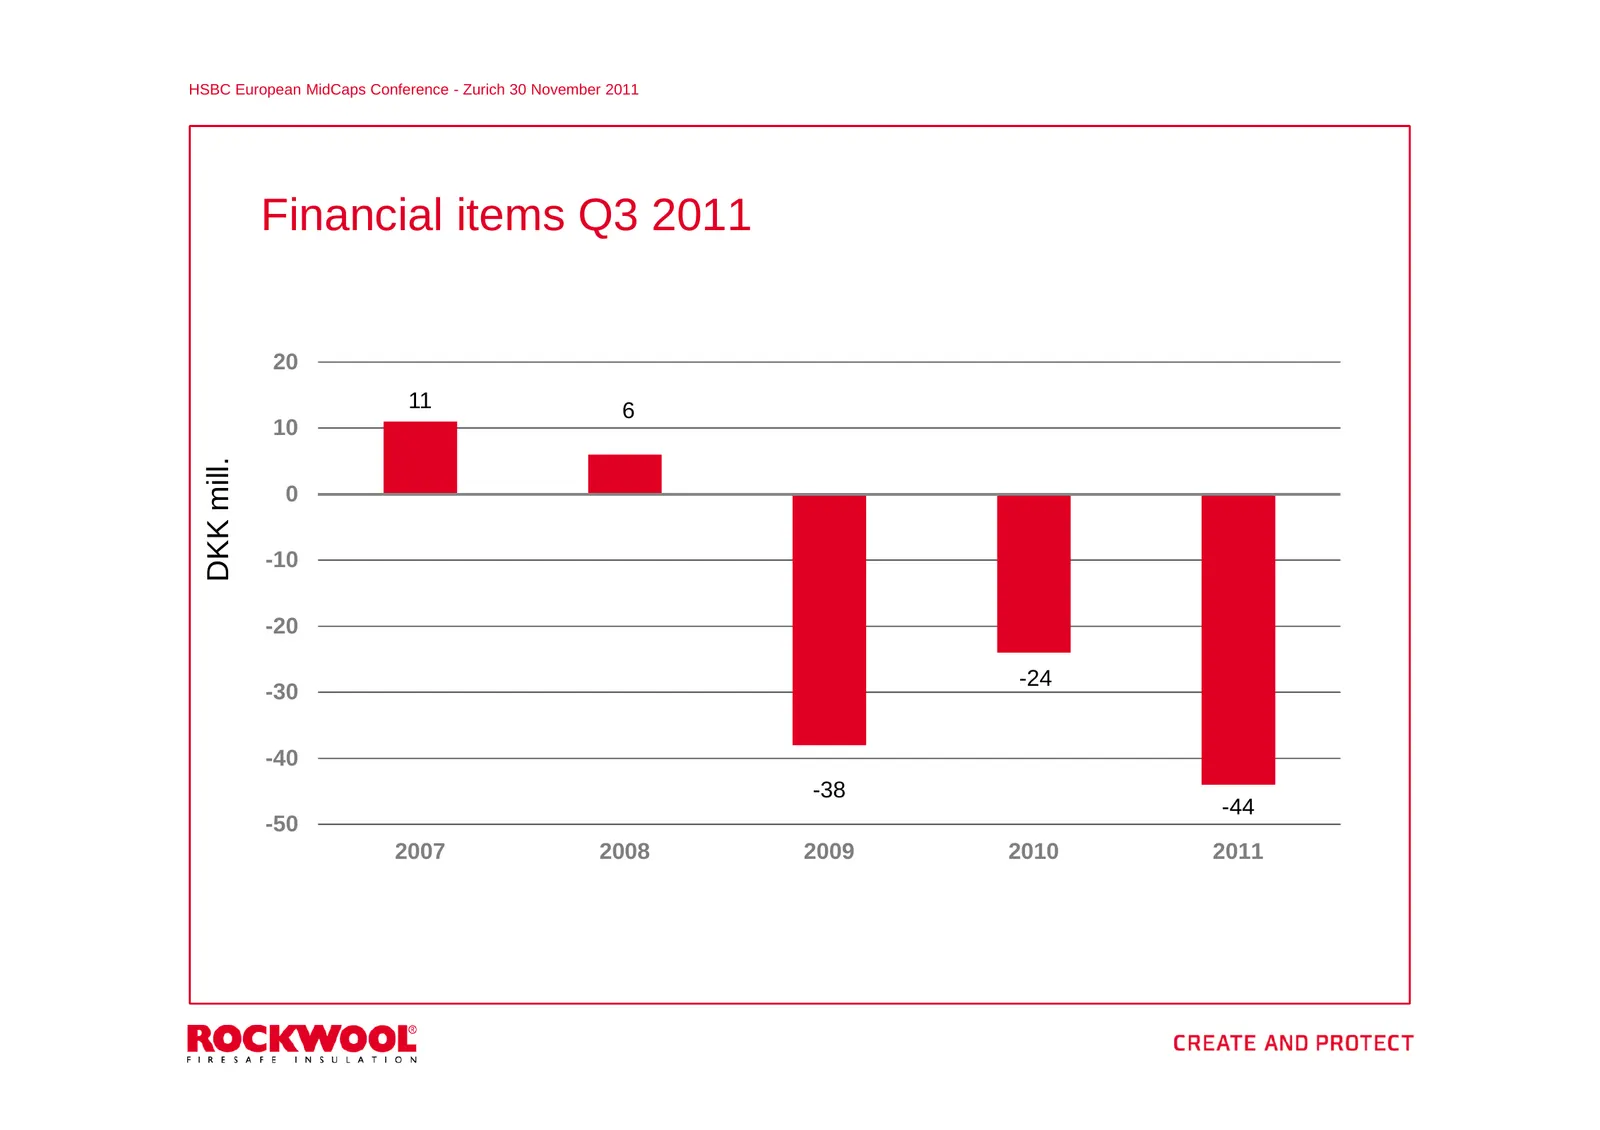
Slide 42: Financial items Q3 2011
HSBC European MidCaps Conference - Zurich 30 November 2011 Financial items Q3 2011 20 11 6 10 DKK mill. 0 -10 -20 -24 -30 -40 -38 -44 -50 2007 2008 2009 2010 2011
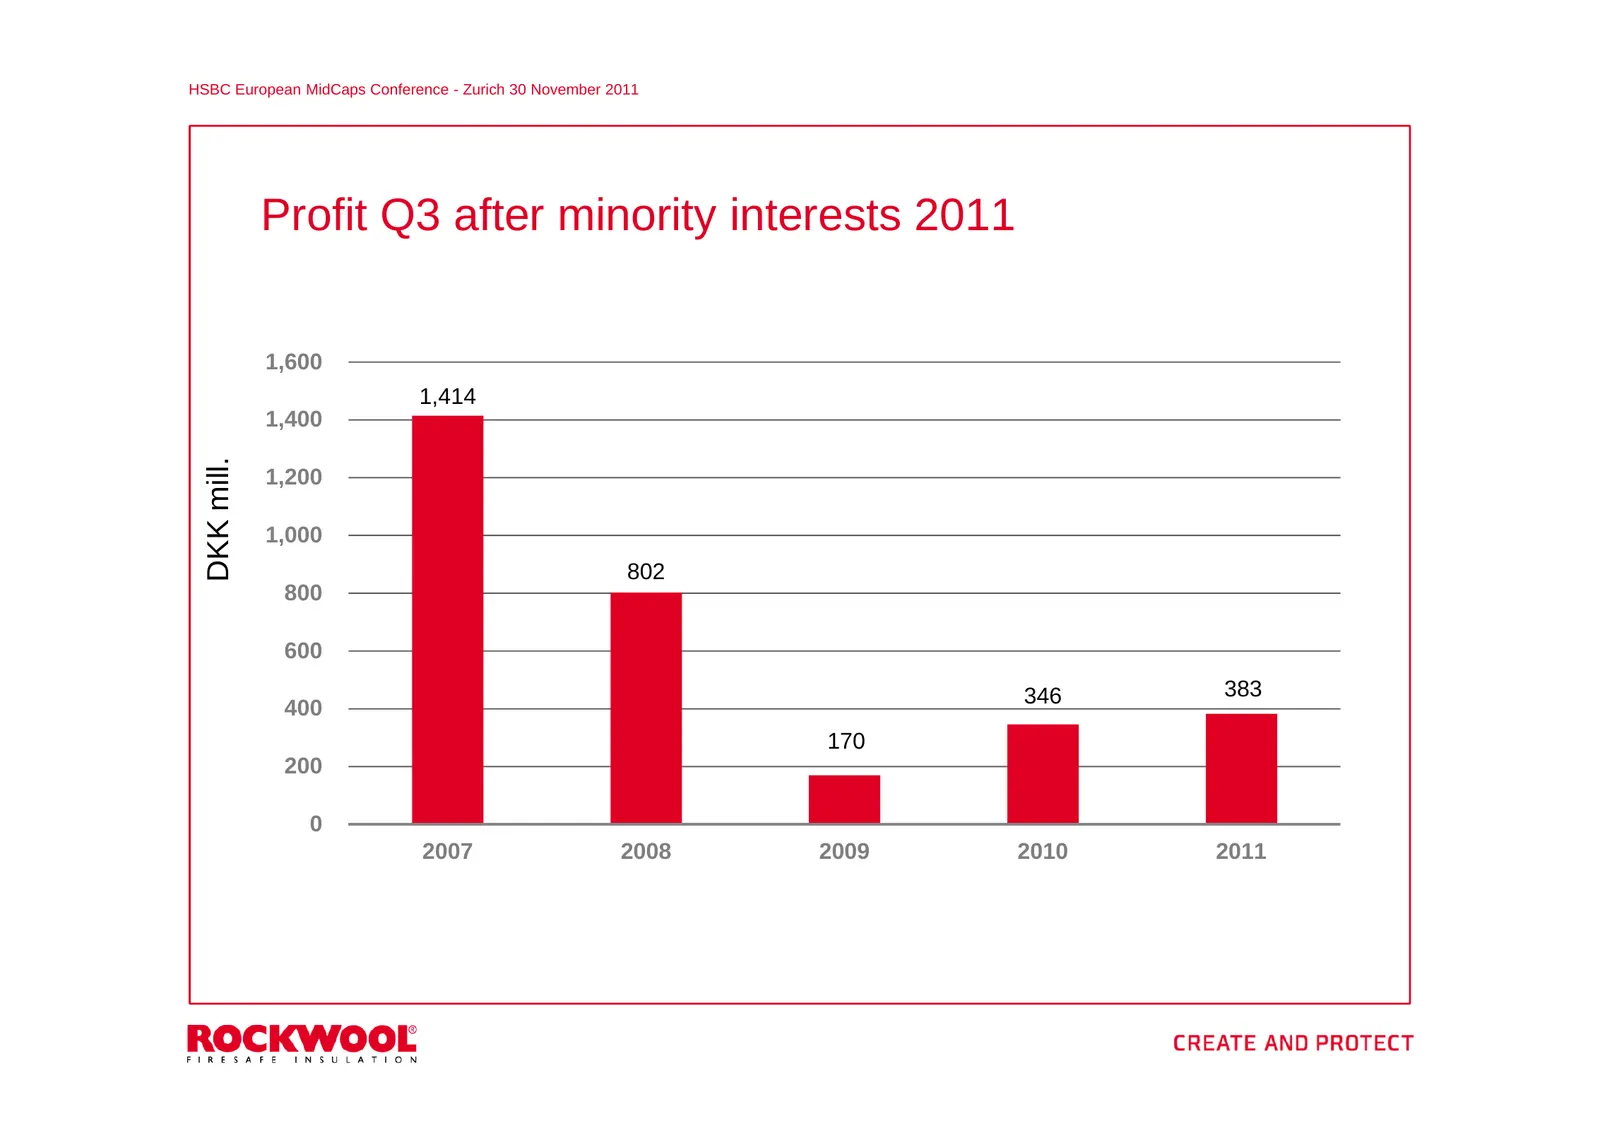
Slide 43: Profit Q3 after minority interests 2011
HSBC European MidCaps Conference - Zurich 30 November 2011 Profit Q3 after minority interests 2011 1,600 1,414 1,400 DKK mill. 1,200 1,000 802 800 600 346 383 400 170 200 0 2007 2008 2009 2010 2011
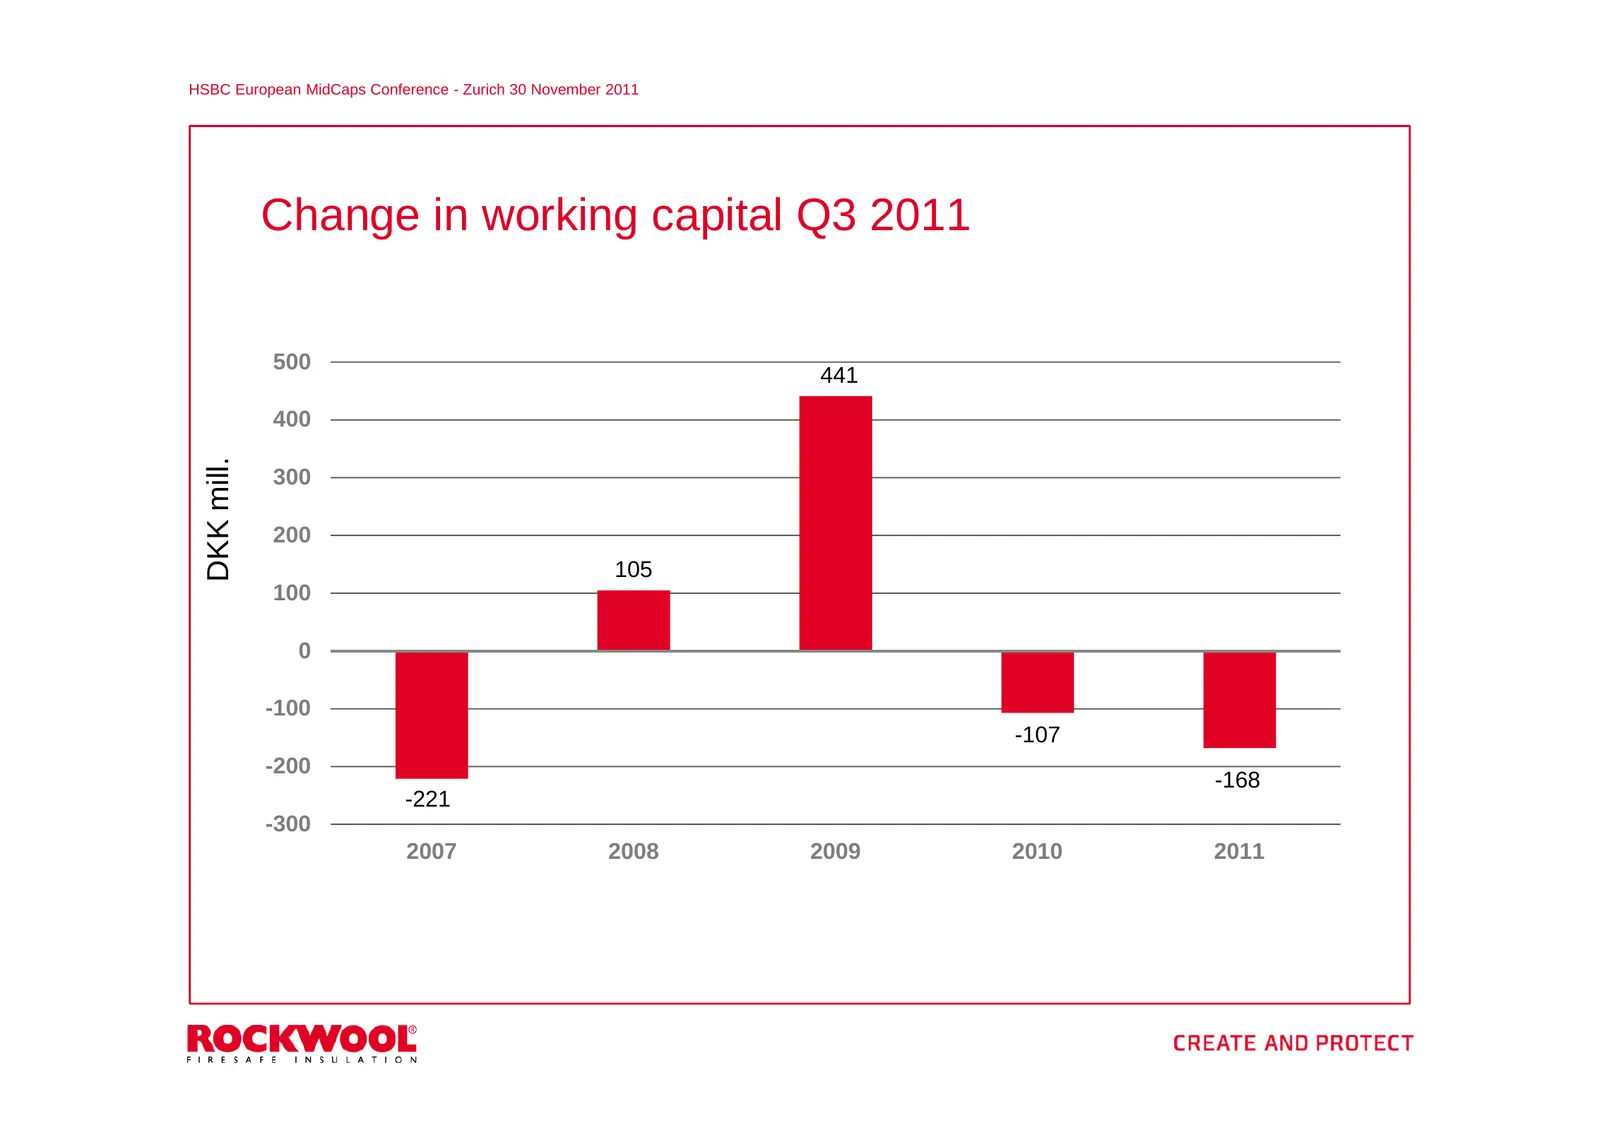
Slide 44: Change in working capital Q3 2011
HSBC European MidCaps Conference - Zurich 30 November 2011 Change in working capital Q3 2011 500 441 400 DKK mill. 300 200 105 100 0 -100 -107 -200 -168 -221 -300 2007 2008 2009 2010 2011
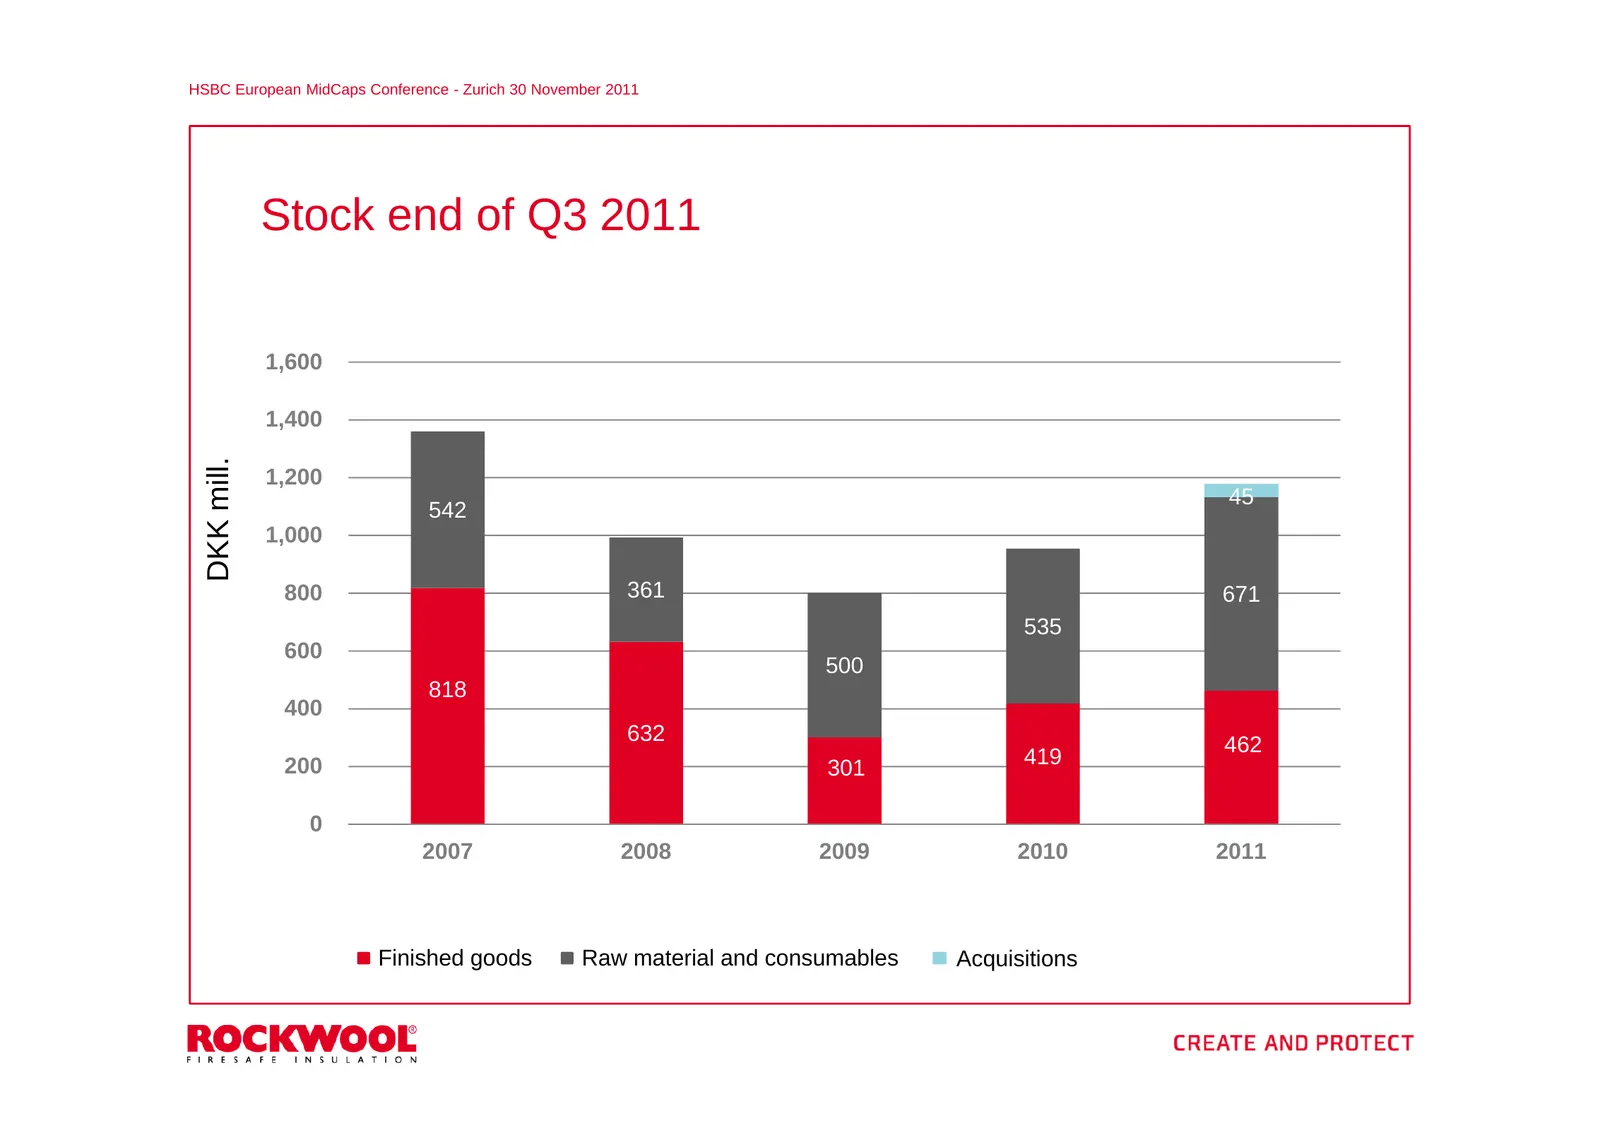
Slide 45: Stock end of Q3 2011
HSBC European MidCaps Conference - Zurich 30 November 2011 Stock end of Q3 2011 1,600 1,400 DKK mill. 1,200 45 542 1,000 800 361 671 535 600 500 818 400 632 462 200 419 301 0 2007 2008 2009 2010 2011 Finished goods Raw material and consumables Acquisitions
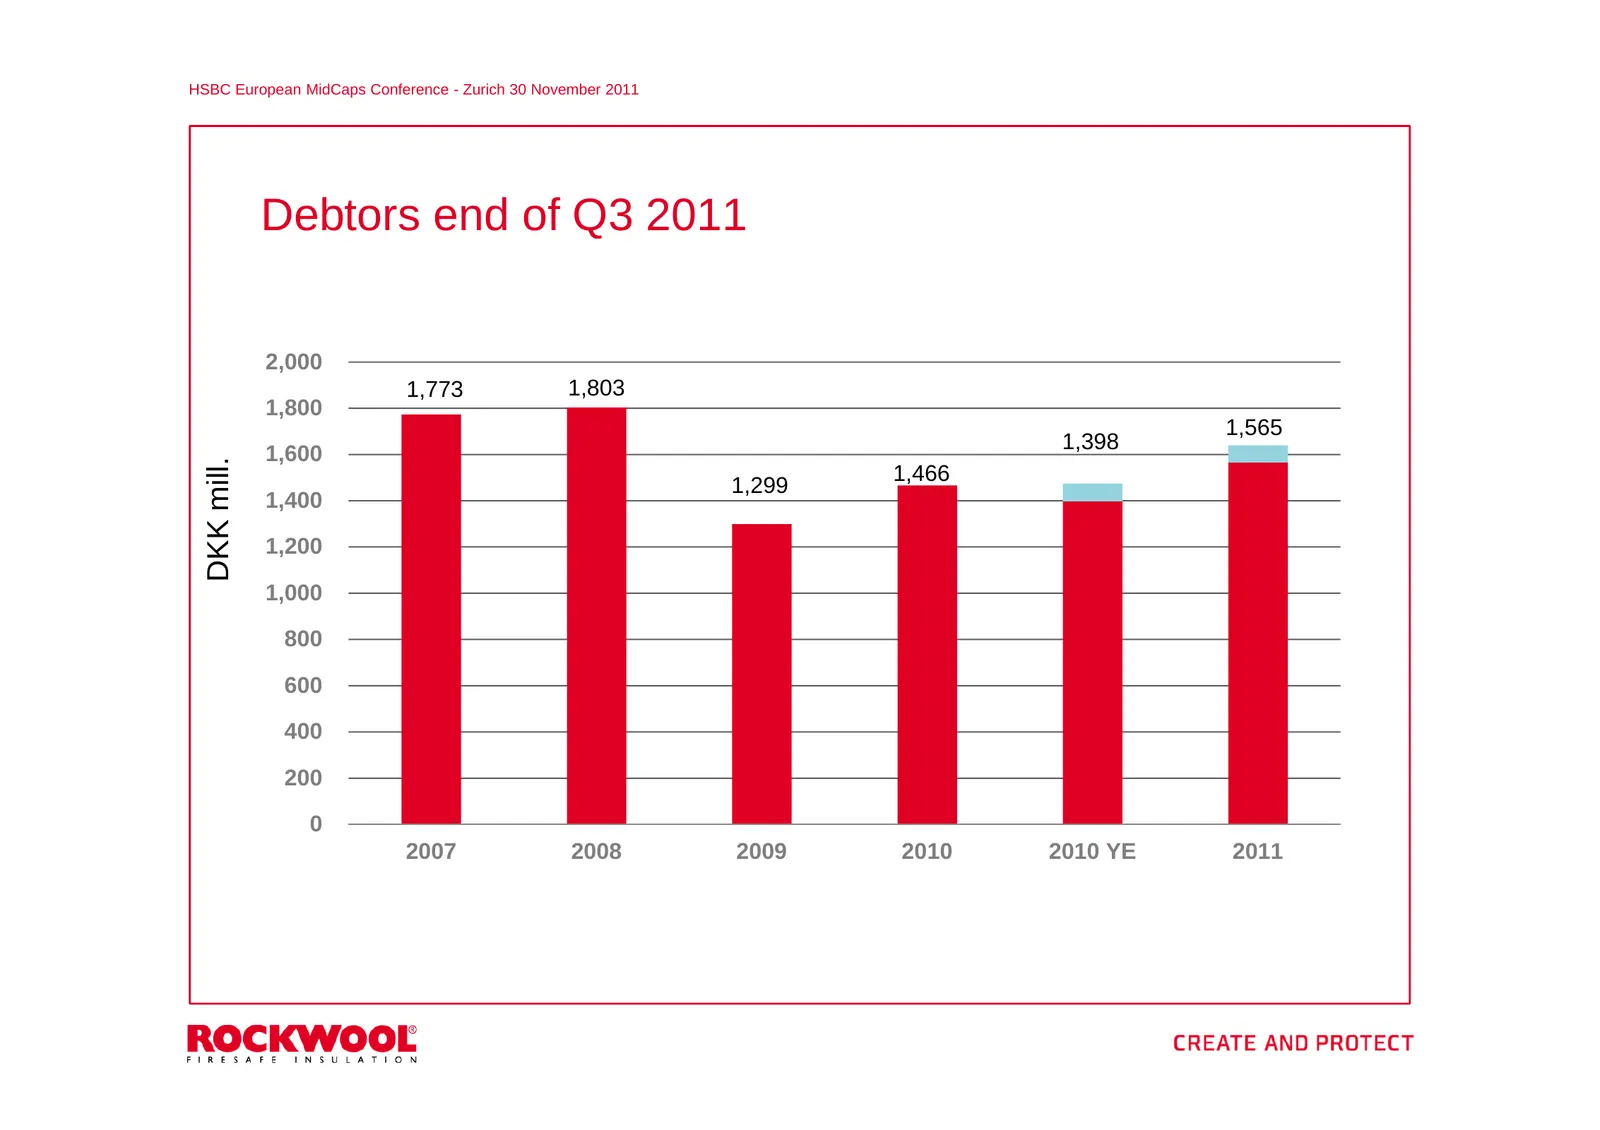
Slide 46: Debtors end of Q3 2011
HSBC European MidCaps Conference - Zurich 30 November 2011 Debtors end of Q3 2011 2,000 1,773 1,803 1,800 1,565 1,398 1,600 DKK mill. 1,466 1,299 1,400 1,200 1,000 800 600 400 200 0 2007 2008 2009 2010 2010 YE 2011
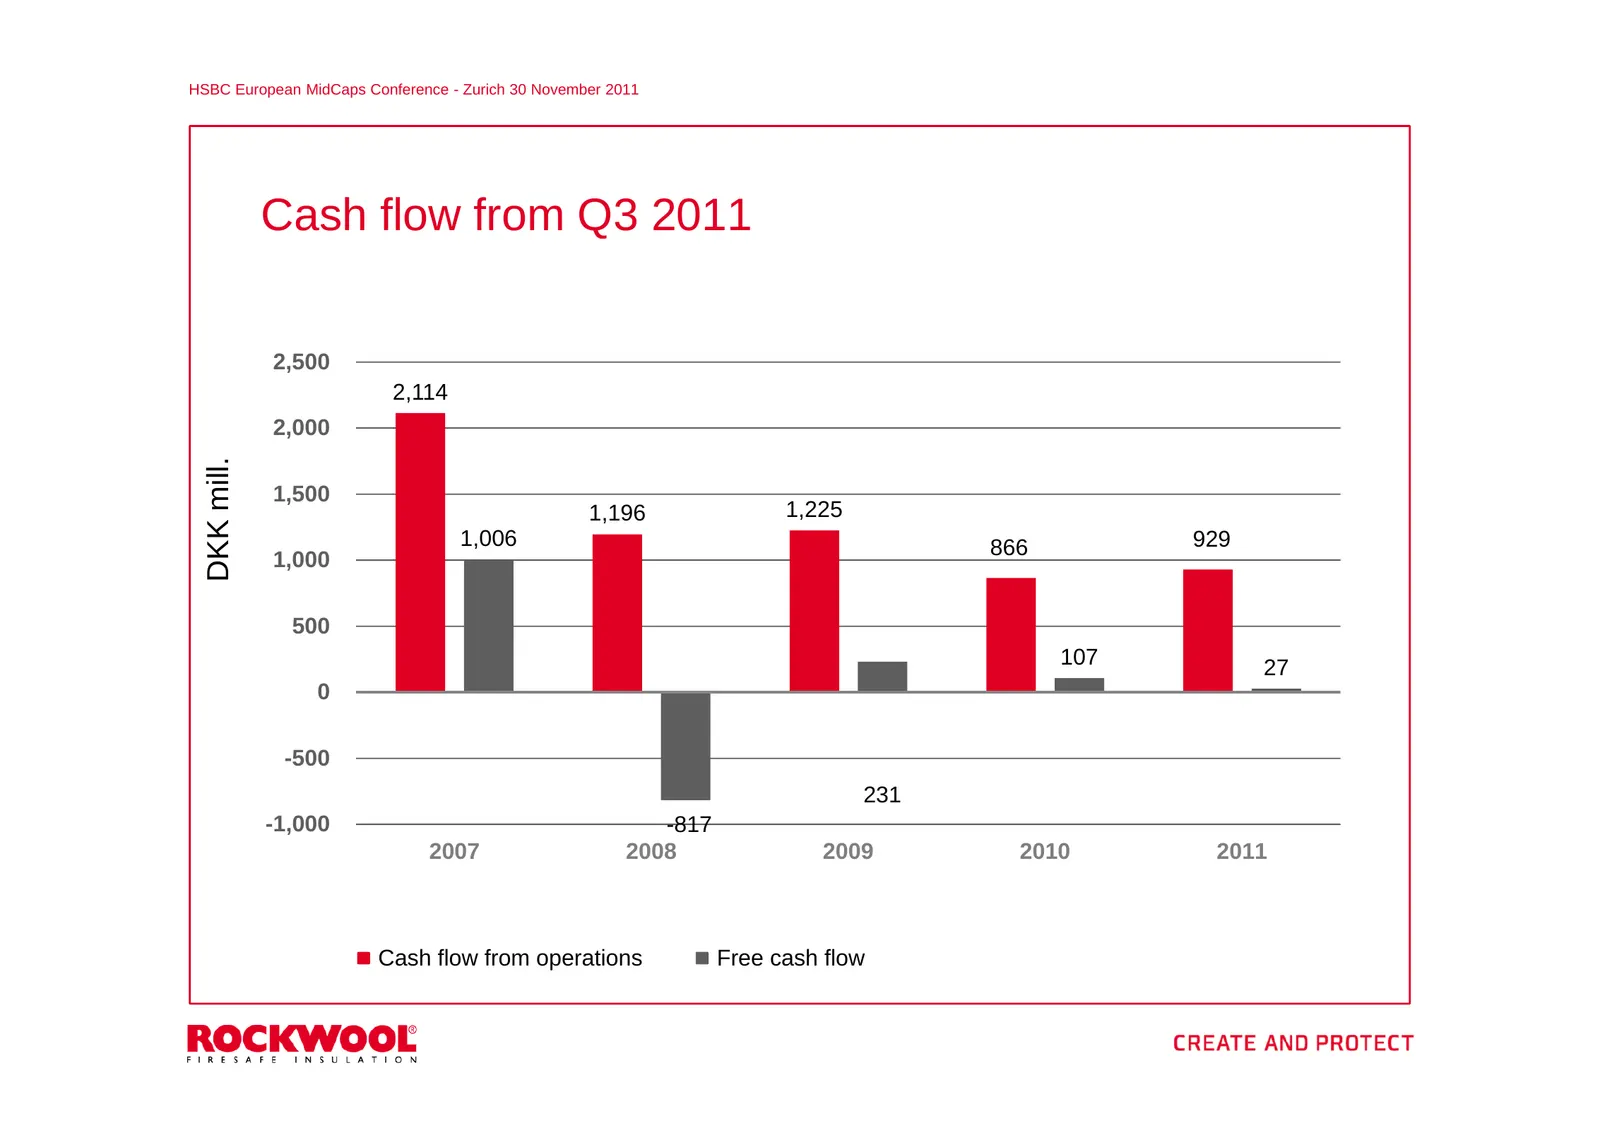
Slide 47: Cash flow from Q3 2011
HSBC European MidCaps Conference - Zurich 30 November 2011 Cash flow from Q3 2011 2,500 2,114 2,000 DKK mill. 1,500 1,196 1,225 1,006 866 929 1,000 500 107 27 0 -500 231 -1,000 -817 2007 2008 2009 2010 2011 Cash flow from operations Free cash flow
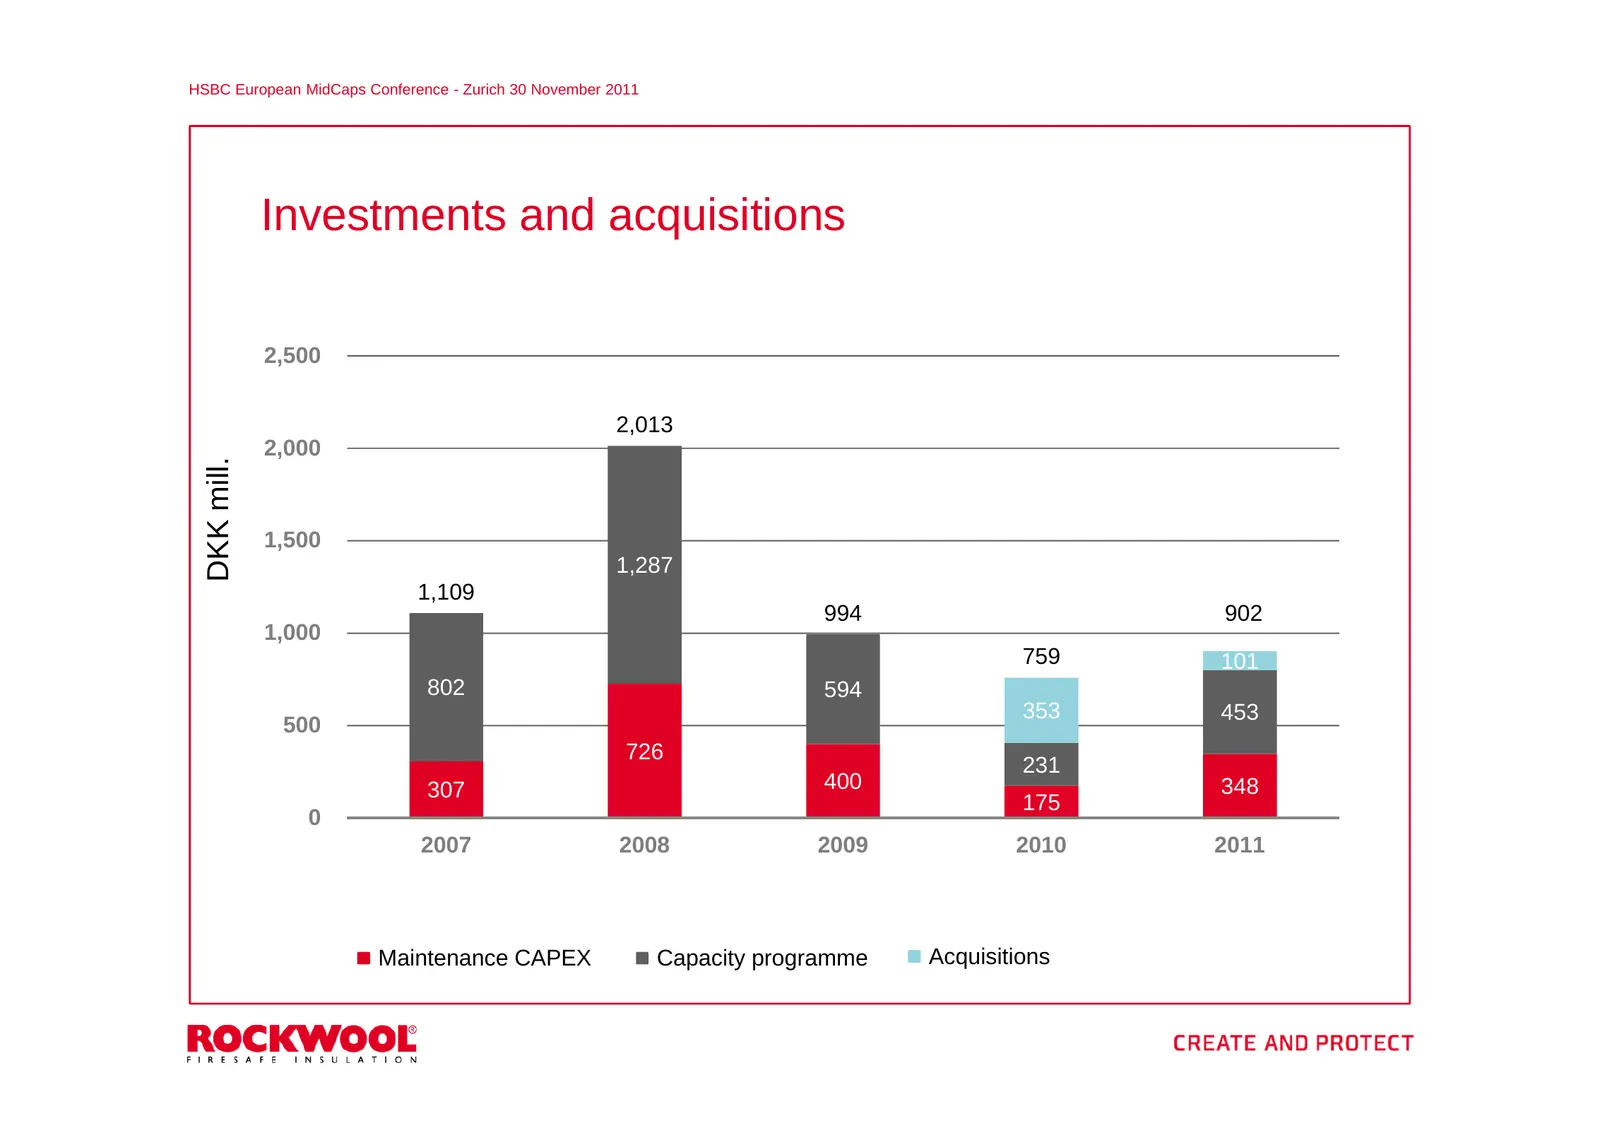
Slide 48: Investments and acquisitions
HSBC European MidCaps Conference - Zurich 30 November 2011 Investments and acquisitions 2,500 2,013 2,000 DKK mill. 1,500 1,287 1,109 994 902 1,000 759 101 802 594 353 453 500 726 231 307 400 348 175 0 2007 2008 2009 2010 2011 Maintenance CAPEX Capacity programme Acquisitions
Slide 49: Expectations
Q3 result HSBC European – Copenhagen MidCaps2011 Conference - Zurich 30 November 2011 Expectations 49
Slide 50: Expectations for 2011
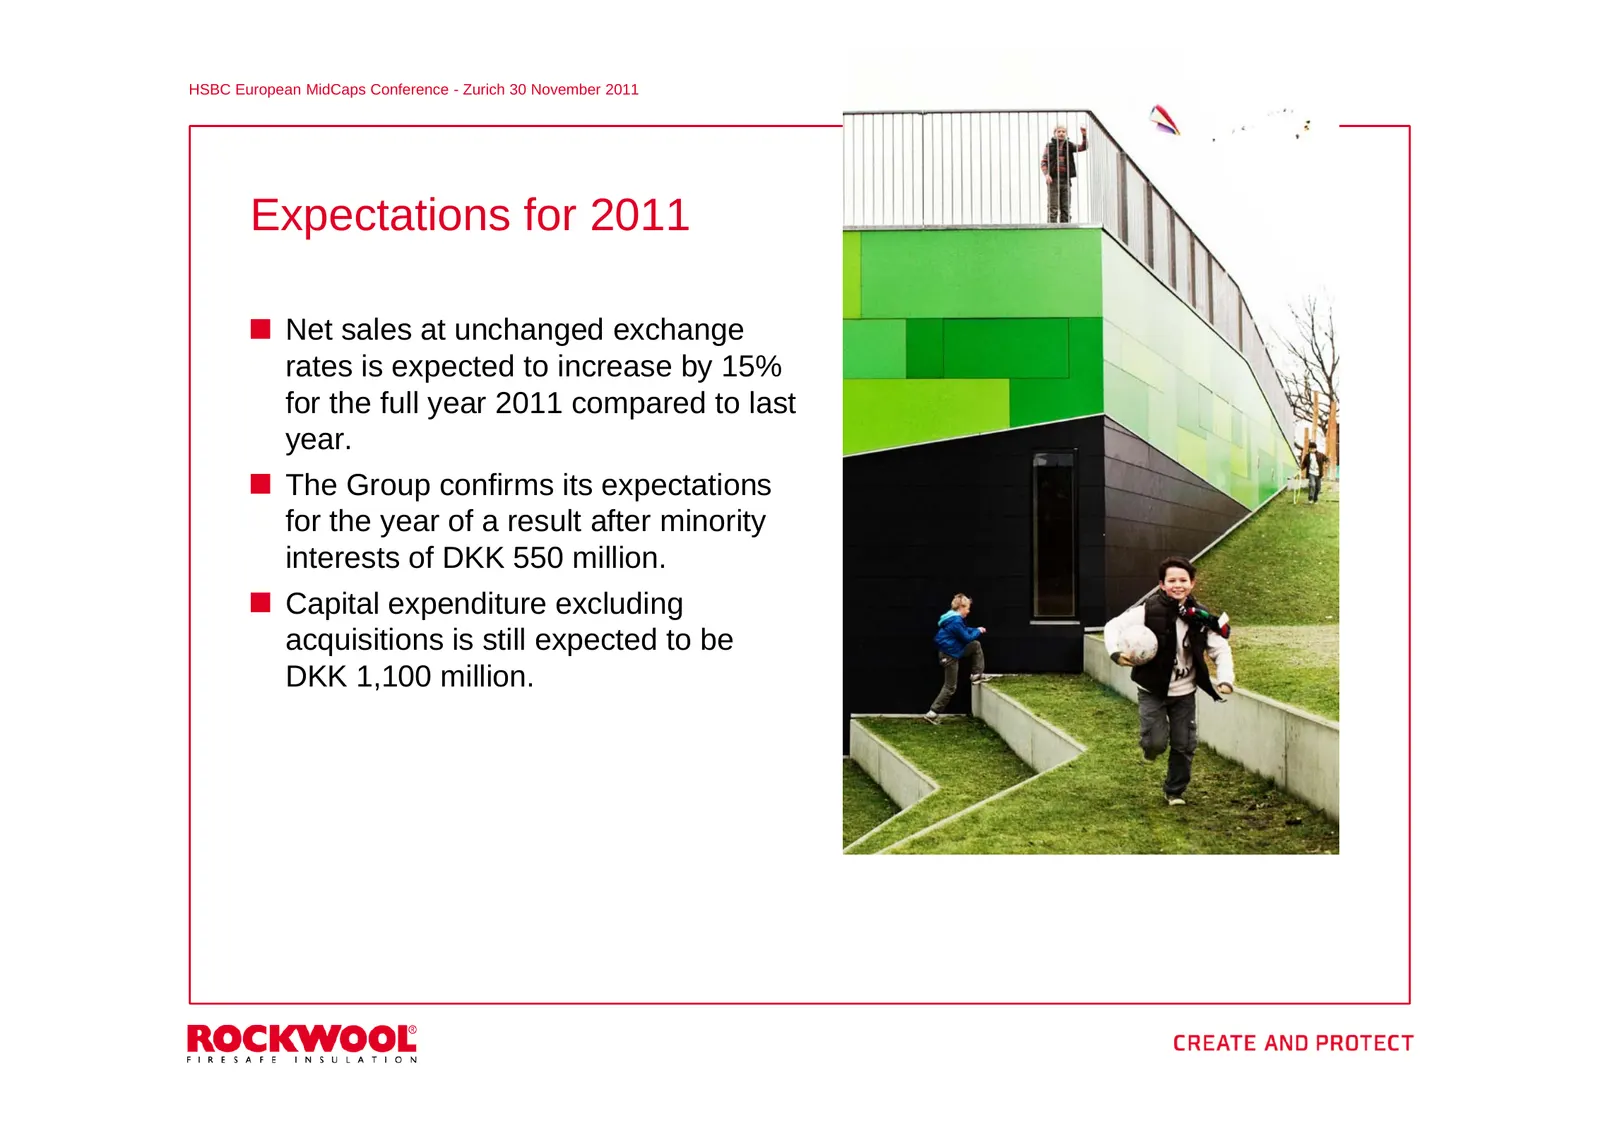
HSBC European MidCaps Conference - Zurich 30 November 2011 Expectations for 2011 Net sales at unchanged exchange rates is expected to increase by 15% for the full year 2011 compared to last year. The Group confirms its expectations for the year of a result after minority interests of DKK 550 million
Slide 51: Investments and acquisitions full year UPDATE
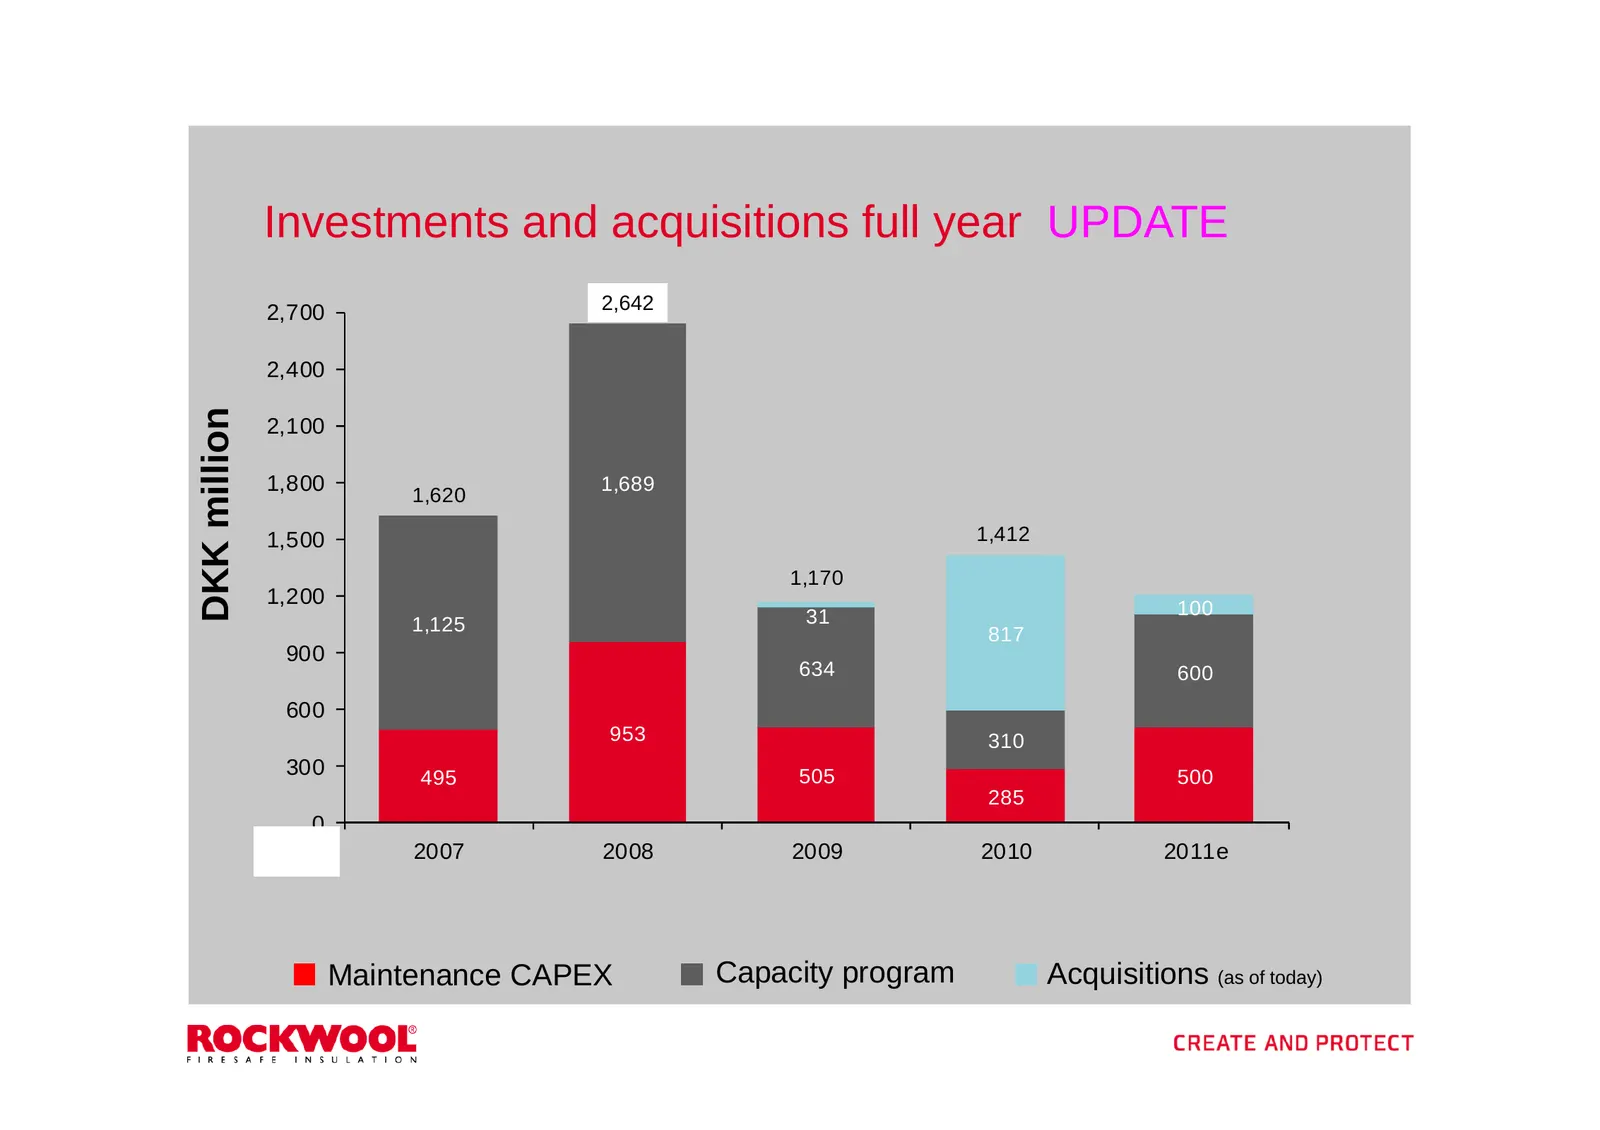
Investments and acquisitions full year UPDATE 2,700 2,642 2,642 2,400 DKK million 2,100 1,800 1,689 1,620 1,500 1,412 1,170 1,200 100 1,125 31 817 900 634 600 600 953 310 300 495 505 500 285 0 2007 2008 2009 2010 2011e Maintenance CAPEX Capacity program Acquisitions (as of today)
Slide 52: Long term sales development 1984-2011e
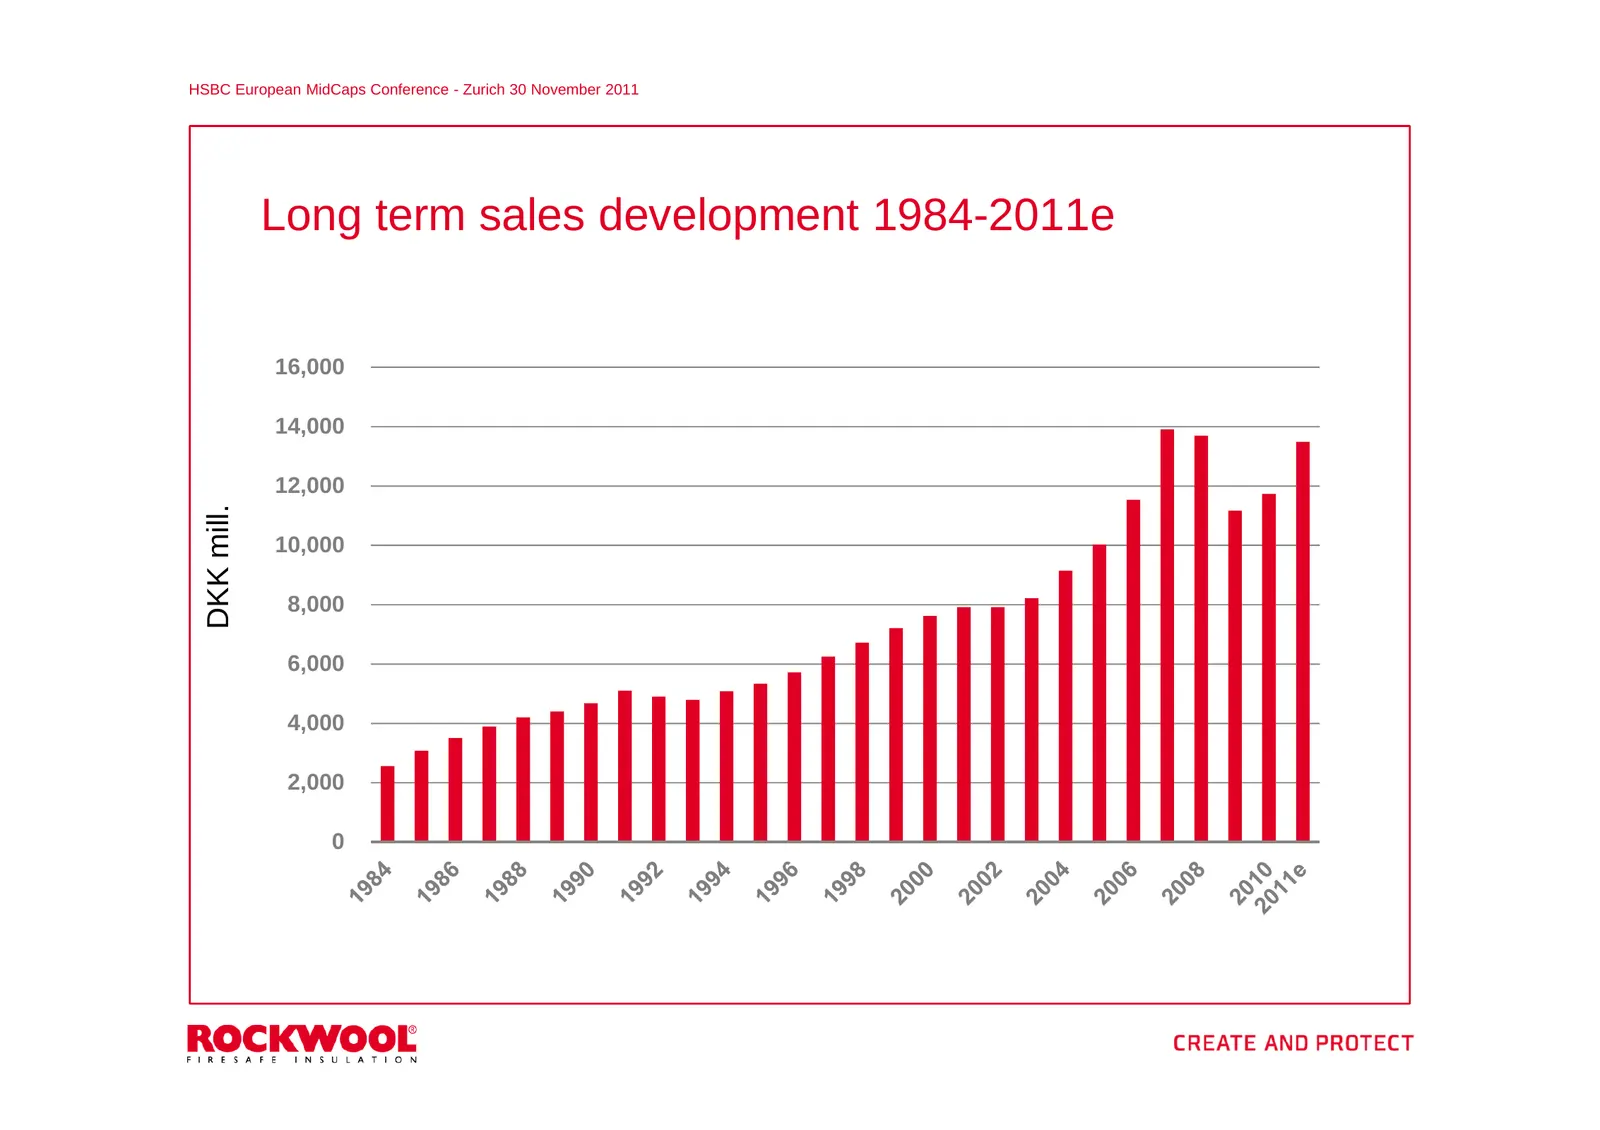
HSBC European MidCaps Conference - Zurich 30 November 2011 Long term sales development 1984-2011e 16,000 14,000 12,000 DKK mill. 10,000 8,000 6,000 4,000 2,000 0
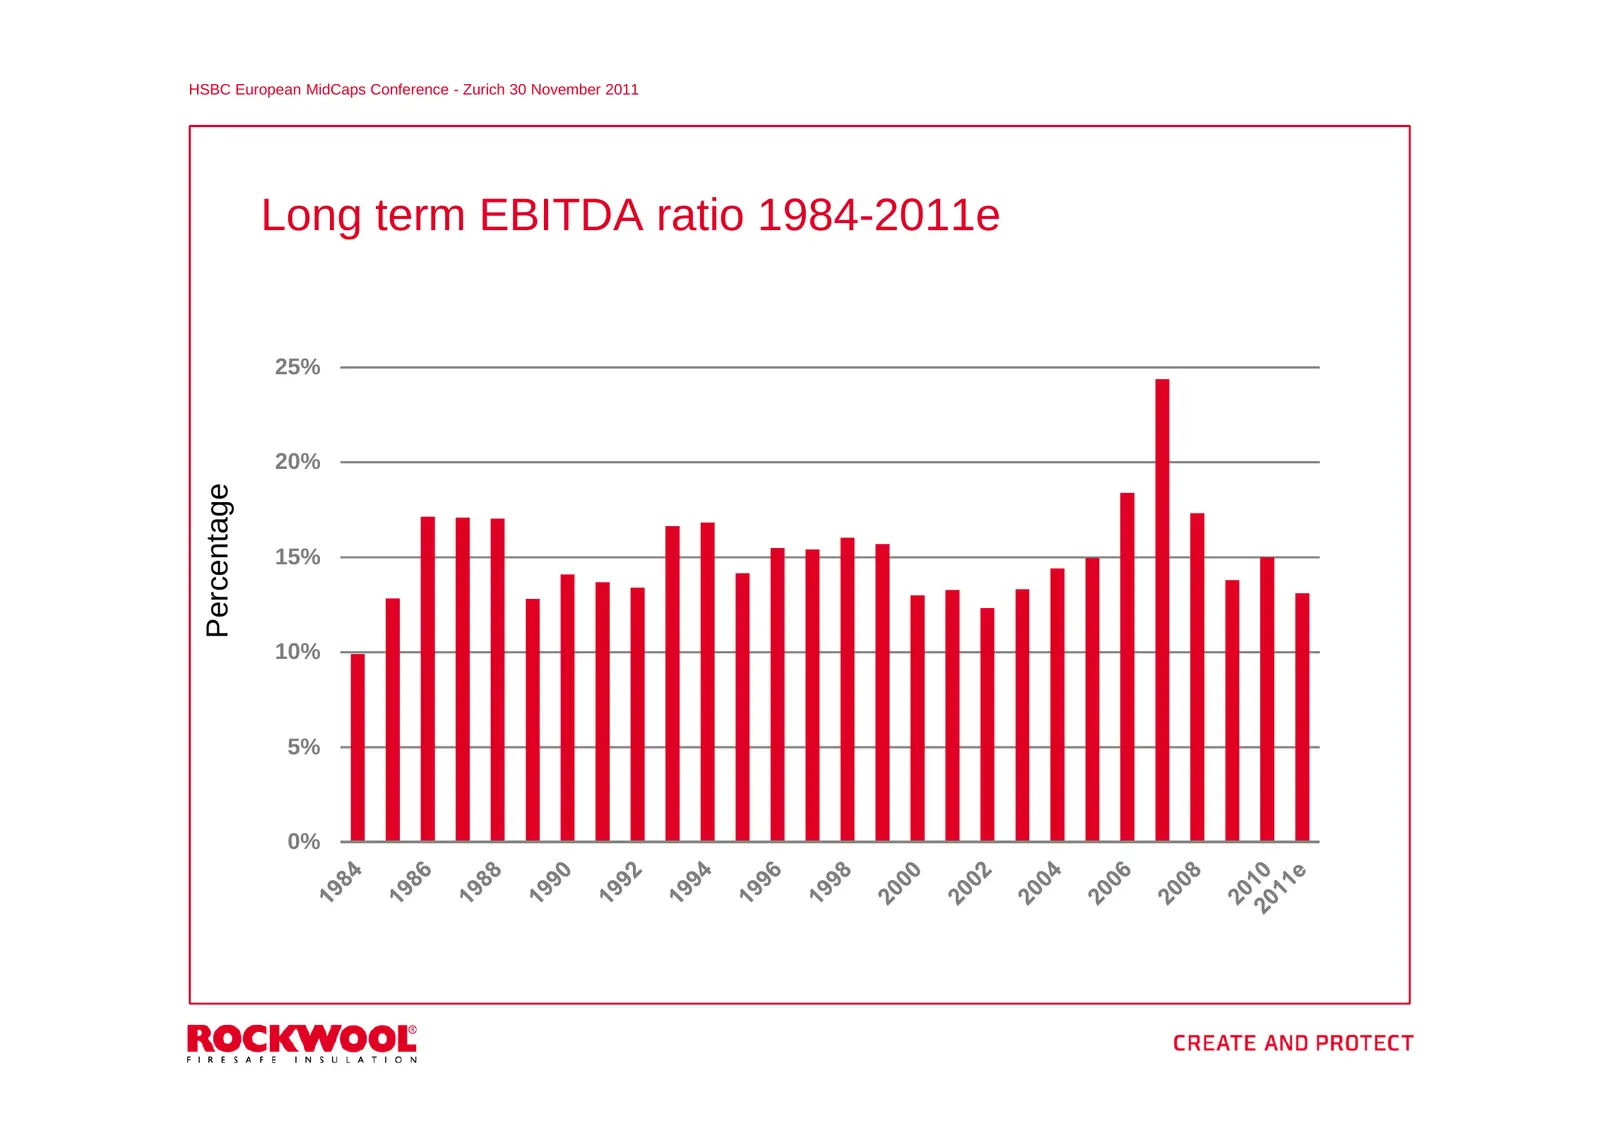
Slide 53: Long term EBITDA ratio 1984-2011e
HSBC European MidCaps Conference - Zurich 30 November 2011 Long term EBITDA ratio 1984-2011e 25% 20% Percentage 15% 10% 5% 0%
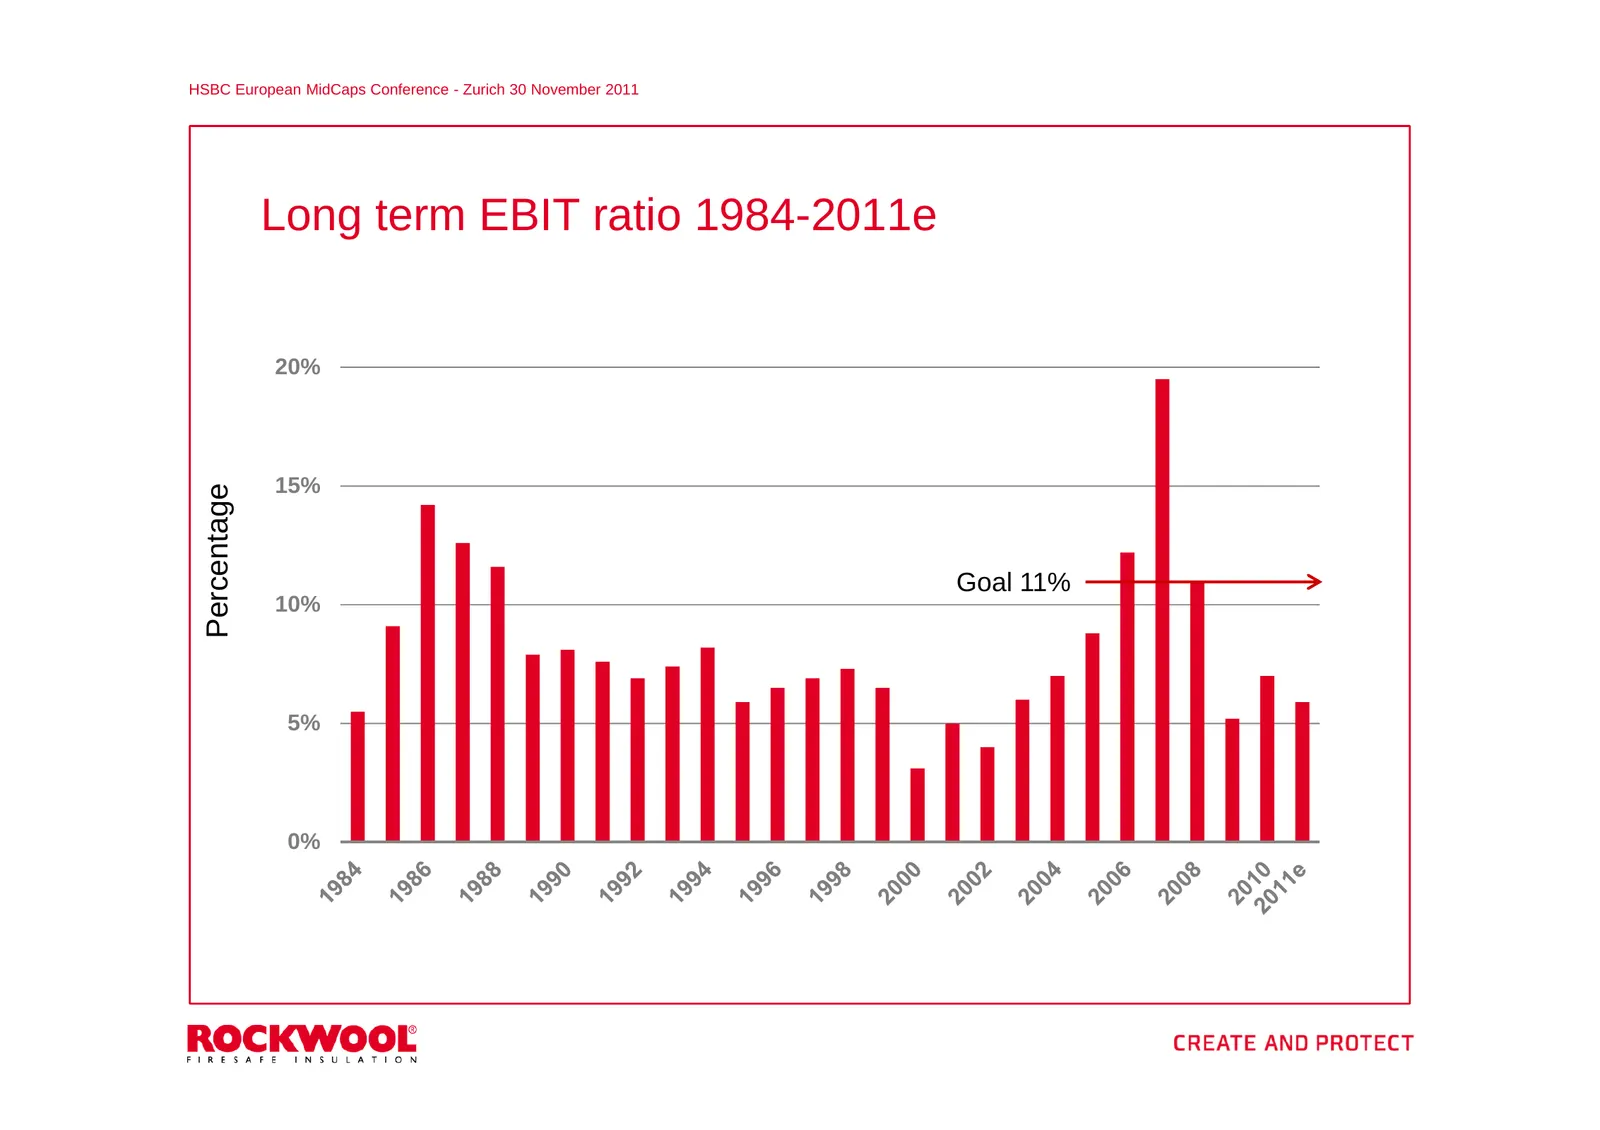
Slide 54: Long term EBIT ratio 1984-2011e
HSBC European MidCaps Conference - Zurich 30 November 2011 Long term EBIT ratio 1984-2011e 20% 15% Percentage Goal 11% 10% 5% 0%
Slide 55: Questions
Q3 result HSBC European – Copenhagen MidCaps2011 Conference - Zurich 30 November 2011 Questions 55
Source: Internet Archive copy of rockwool.com
More decks from Rockwool A/S Class A
 Q2 2026 Earnings Presentation19 slides · Aug 20, 2026
 Q1 2026 Earnings Presentation15 slides · May 20, 2026
 Shareholder Meeting (2026)10 slides · Apr 15, 2026
 Shareholder Meeting (April 2026)46 slides · Apr 15, 2026
 Q4 2025 Earnings Presentation19 slides · Feb 5, 2026
 Q2 2025 Earnings Presentation17 slides · Aug 21, 2025