comScore, Inc. · NASDAQ:SCOR
comScore — ad:tech Singapore 2012
57 slides from comScore's conference presentation, June 2012
Slide 1: State of the Global and Local Internet
State of the Global and Local Internet Lessons Learned from the Digital Measurement Trenches Of Online Advertising ad:tech Singapore, June 2012 Greg Dale, comScore, Inc. Twitter: @comScoreAPAC EVP, International @comScore
Slide 2: Discussion Topics
Discussion Topics A Brief Introduction to comScore Key Trends Shaping the Digital Landscape Lessons Learned About Online Advertising and the Future of the Digital Economy © comScore, Inc. Proprietary. 2
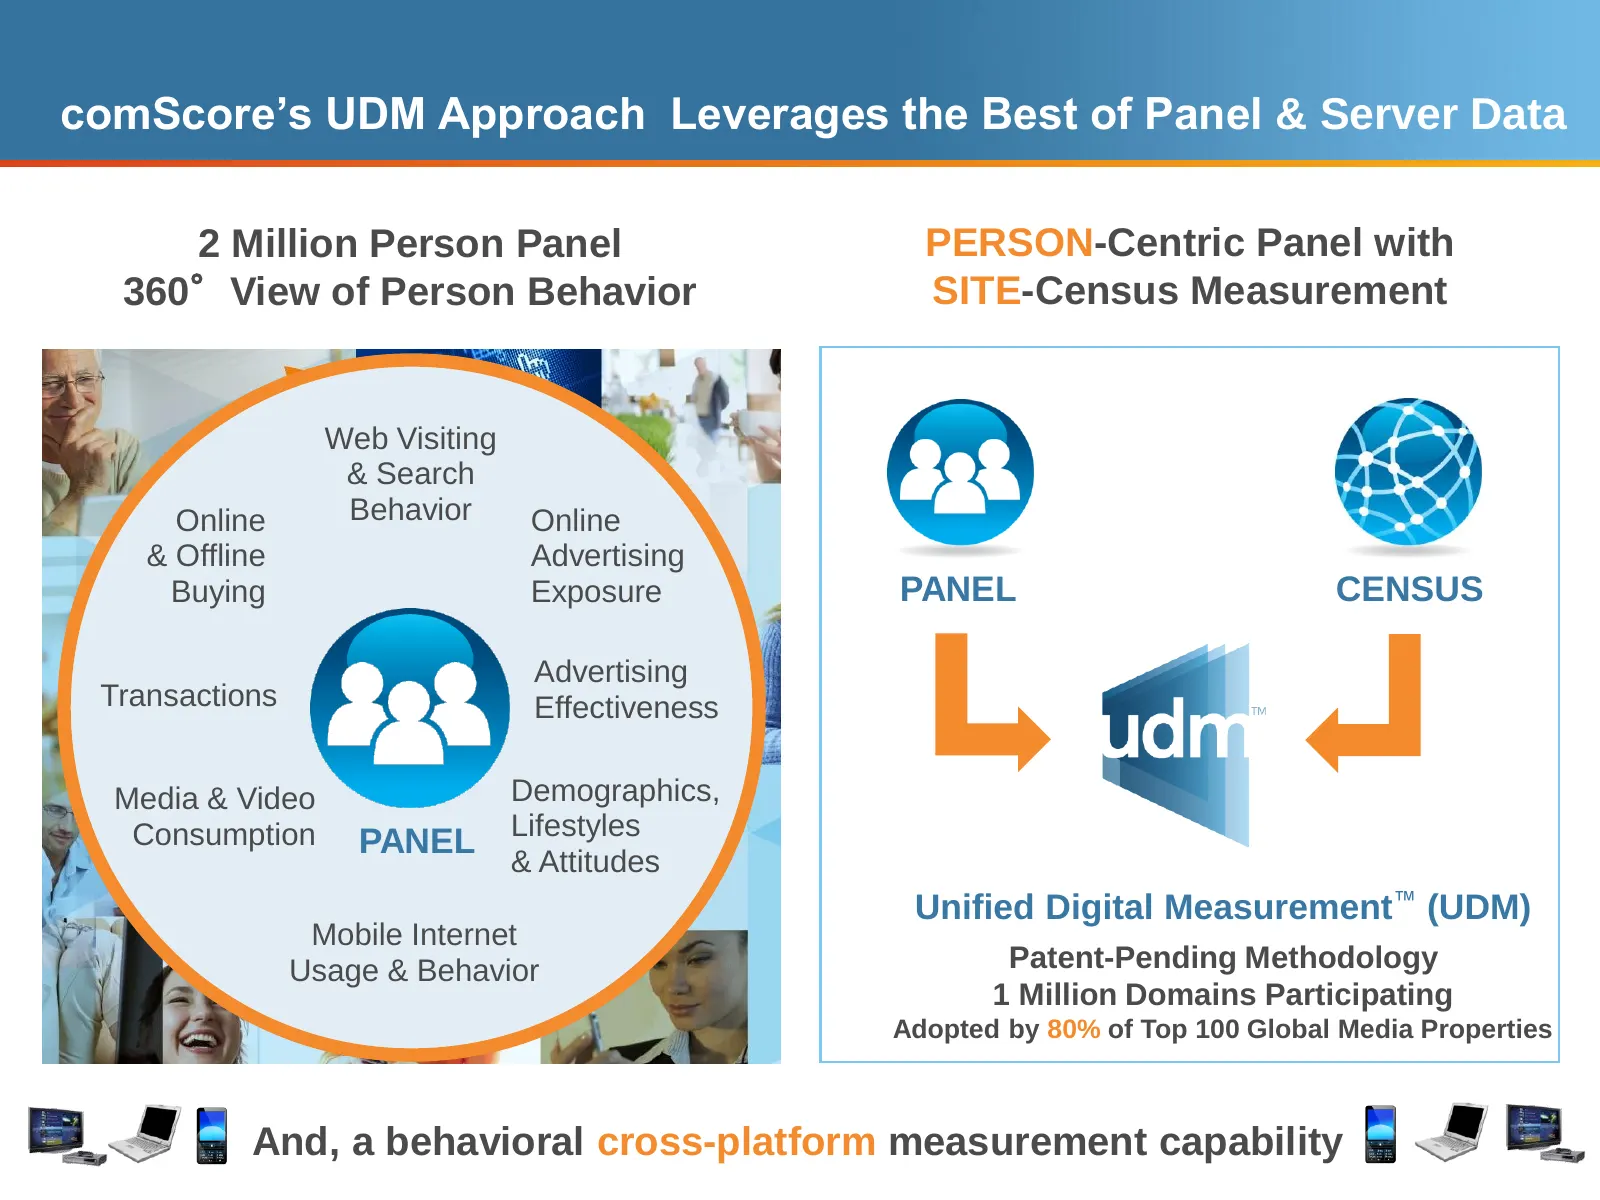
Slide 3: comScore's UDM Approach Leverages the Best of Panel & Server Data
comScore’s UDM Approach Leverages the Best of Panel & Server Data 2 Million Person Panel PERSON-Centric Panel with 360°View of Person Behavior SITE-Census Measurement Web Visiting & Search Online Behavior Online & Offline Advertising Buying Exposure PANEL CENSUS Advertising Transactions Effectivenes
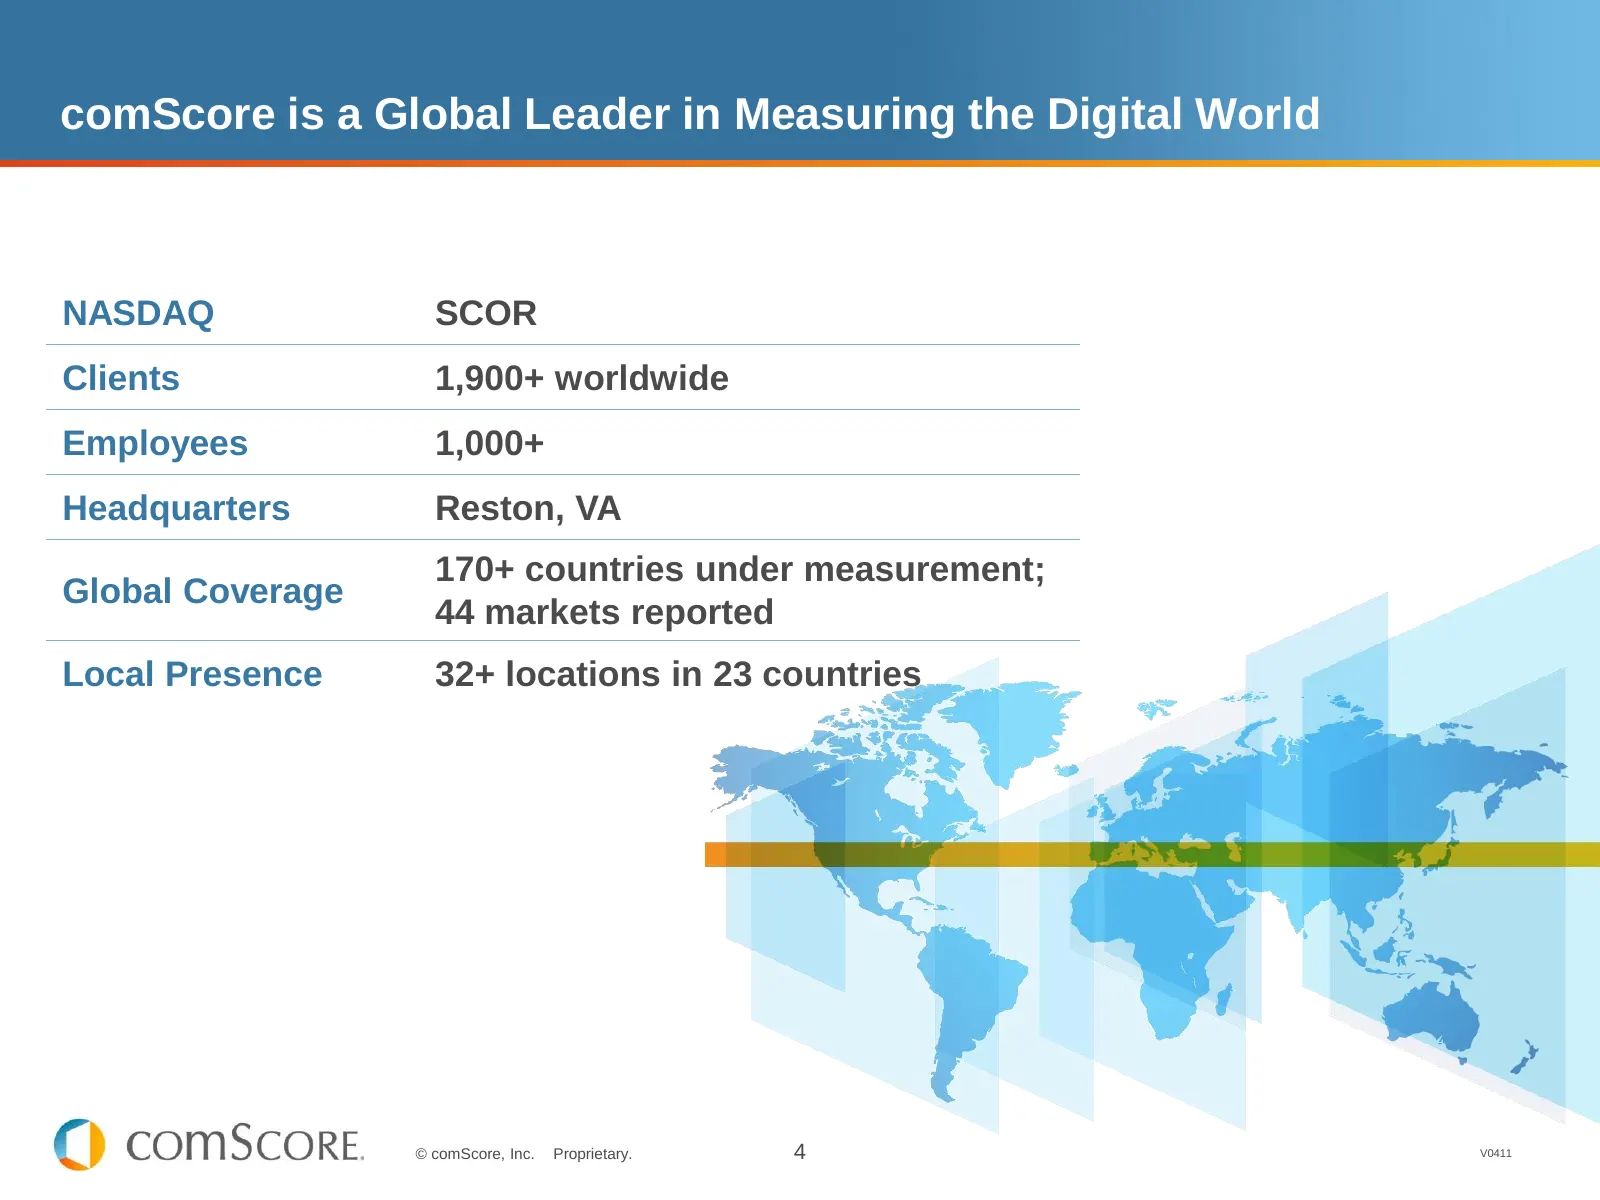
Slide 4: comScore is a Global Leader in Measuring the Digital World
comScore is a Global Leader in Measuring the Digital World NASDAQ SCOR Clients 1,900+ worldwide Employees 1,000+ Headquarters Reston, VA 170+ countries under measurement; Global Coverage 44 markets reported Local Presence 32+ locations in 23 countries © comScore, Inc. Proprietary. 4 V0411
Slide 5: A Global and Local Look at Today's Digital Landscape
A GLOBAL AND LOCAL LOOK AT TODAY’S DIGITAL LANDSCAPE © comScore, Inc. Proprietary. 5
Slide 6: Today's Global Internet User
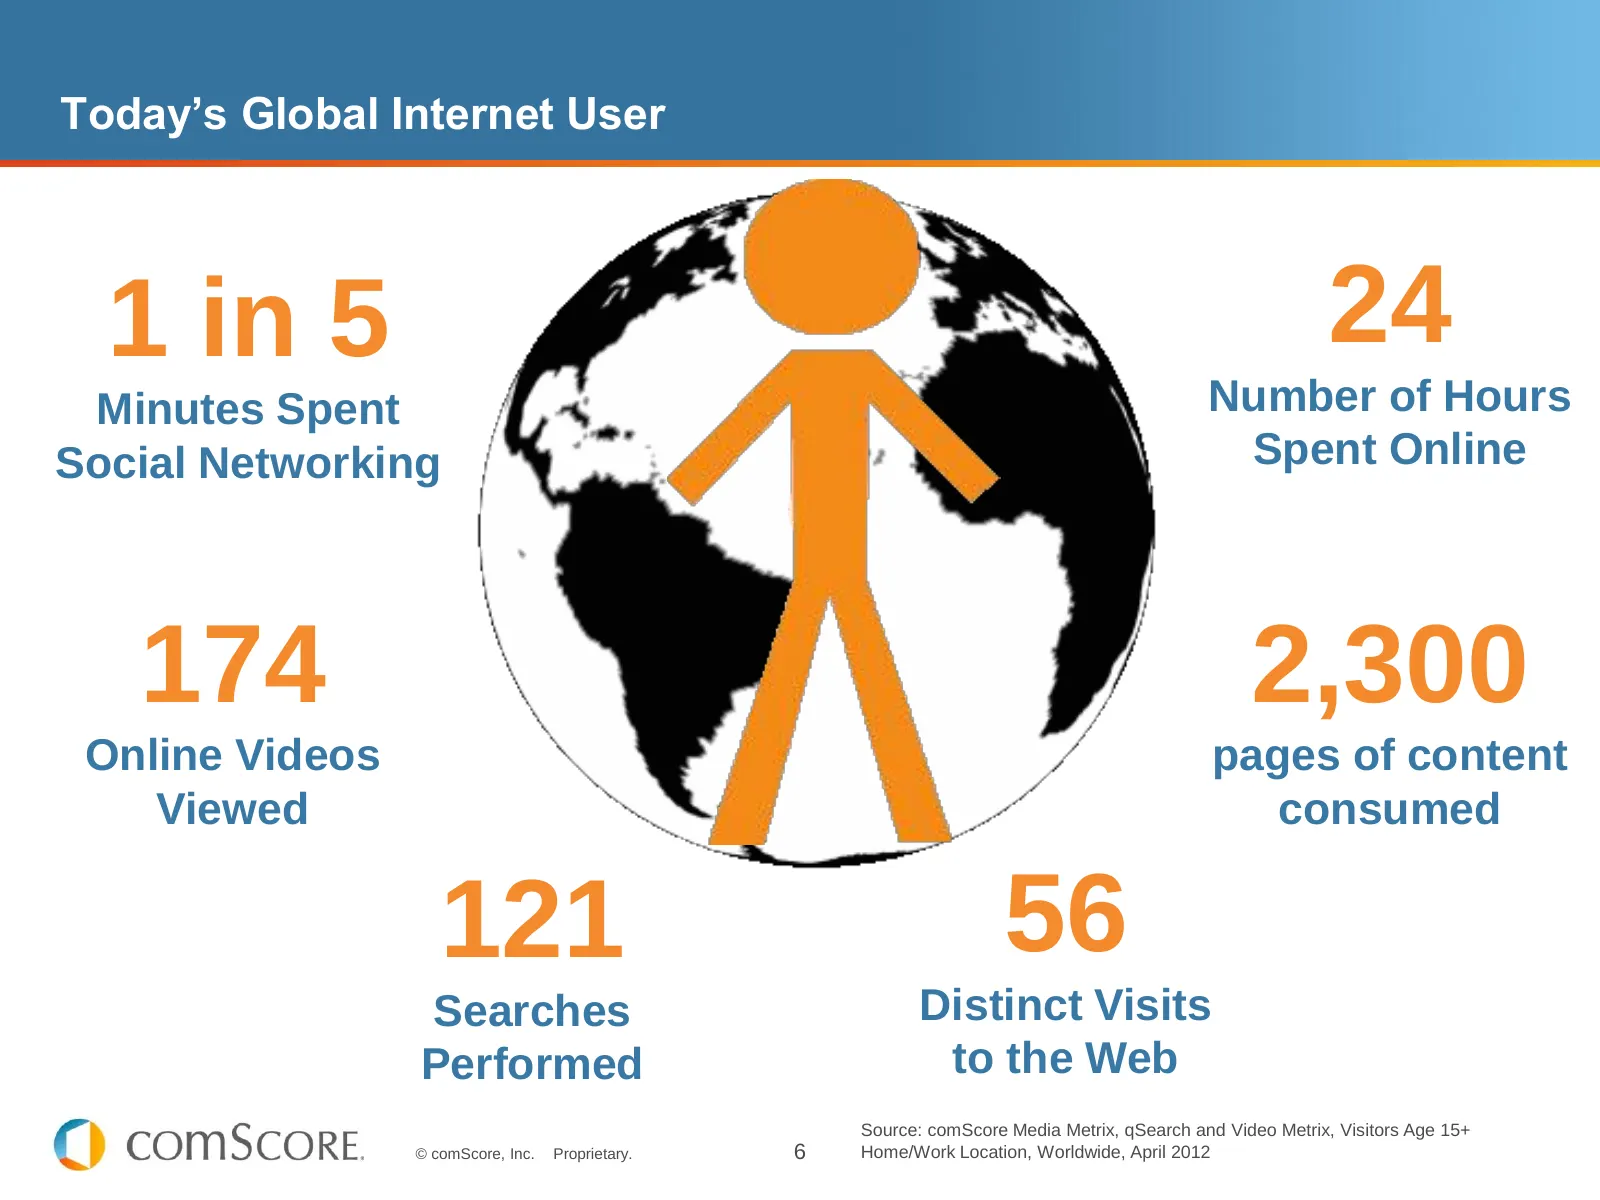
Today’s Global Internet User 1 in 5 24 Minutes Spent Number of Hours Social Networking Spent Online 174 2,300 Online Videos pages of content Viewed consumed 121 56 Searches Distinct Visits Performed to the Web Source: comScore Media Metrix, qSearch and Video Metrix, Visitors Age 15+ © comScore, Inc.
Slide 7: The U.S. Is No Longer the Center of the Online Universe
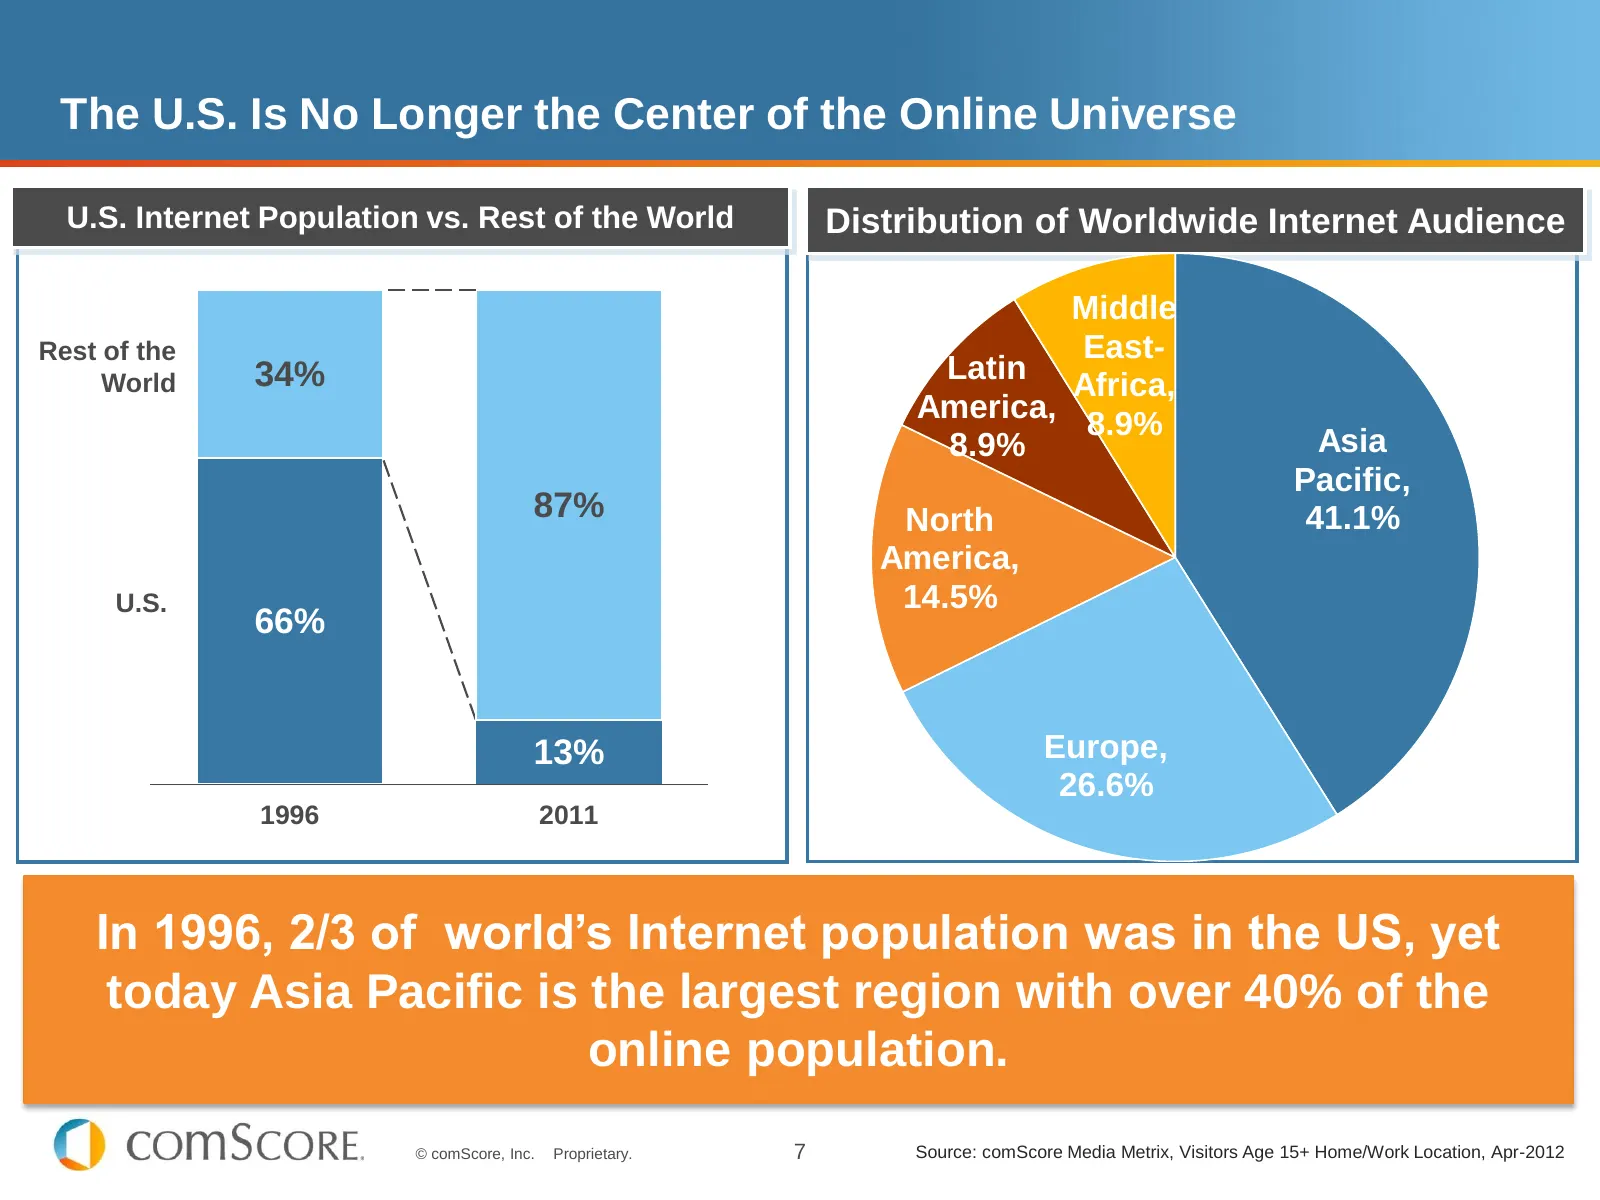
The U.S. Is No Longer the Center of the Online Universe U.S. Internet Population vs. Rest of the World Distribution of Worldwide Internet Audience Middle Rest of the East- 34% Latin World Africa, America, 8.9% 8.9% Asia Pacific, 87% North 41.1% America, U.S. 14.5% 66% Asia Pacific 13% Europe, 26.6%
Slide 8: Latin America, Middle East-Africa and Asia Pacific Driving Growth of Global Internet
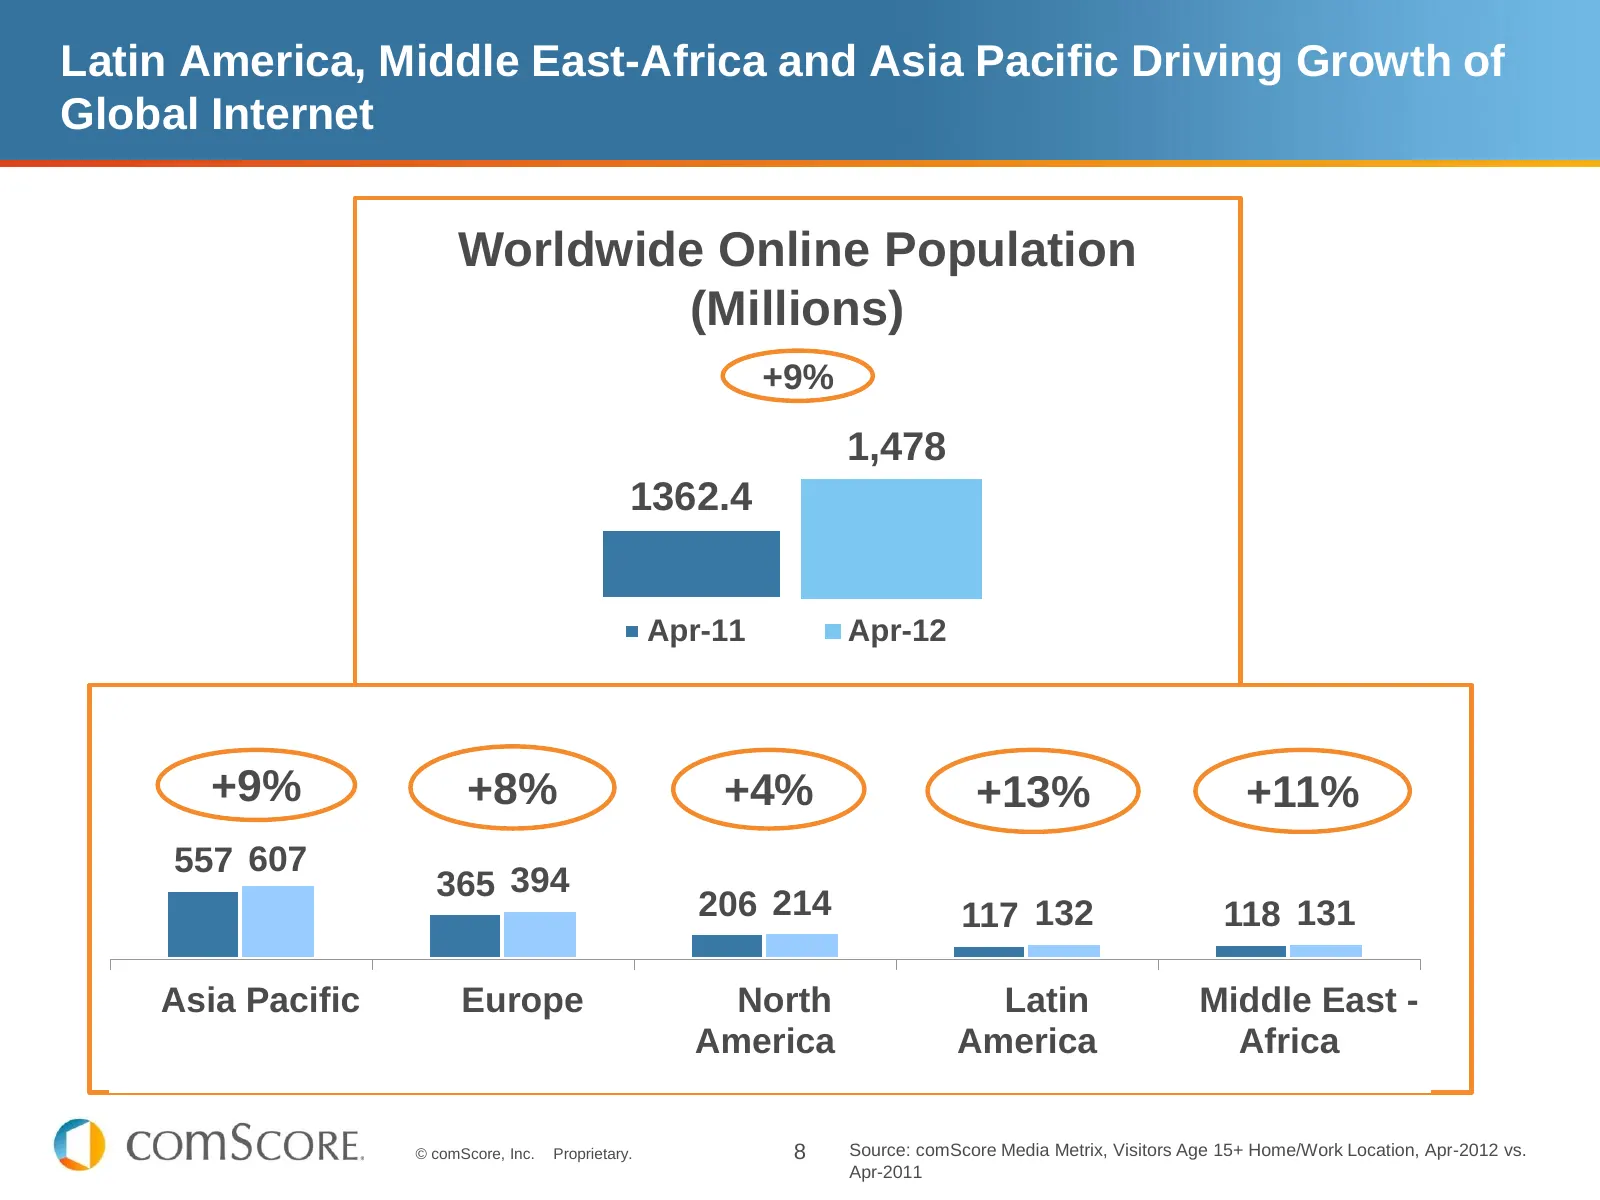
Latin America, Middle East-Africa and Asia Pacific Driving Growth of Global Internet Worldwide Online Population (Millions) +9% 1,478 1362.4 Apr-11 Apr-12 +9% +8% +4% +13% +11% 557 607 365 394 206 214 117 132 118 131 Asia Pacific Europe North Latin Middle East - America America Africa © comScore, In
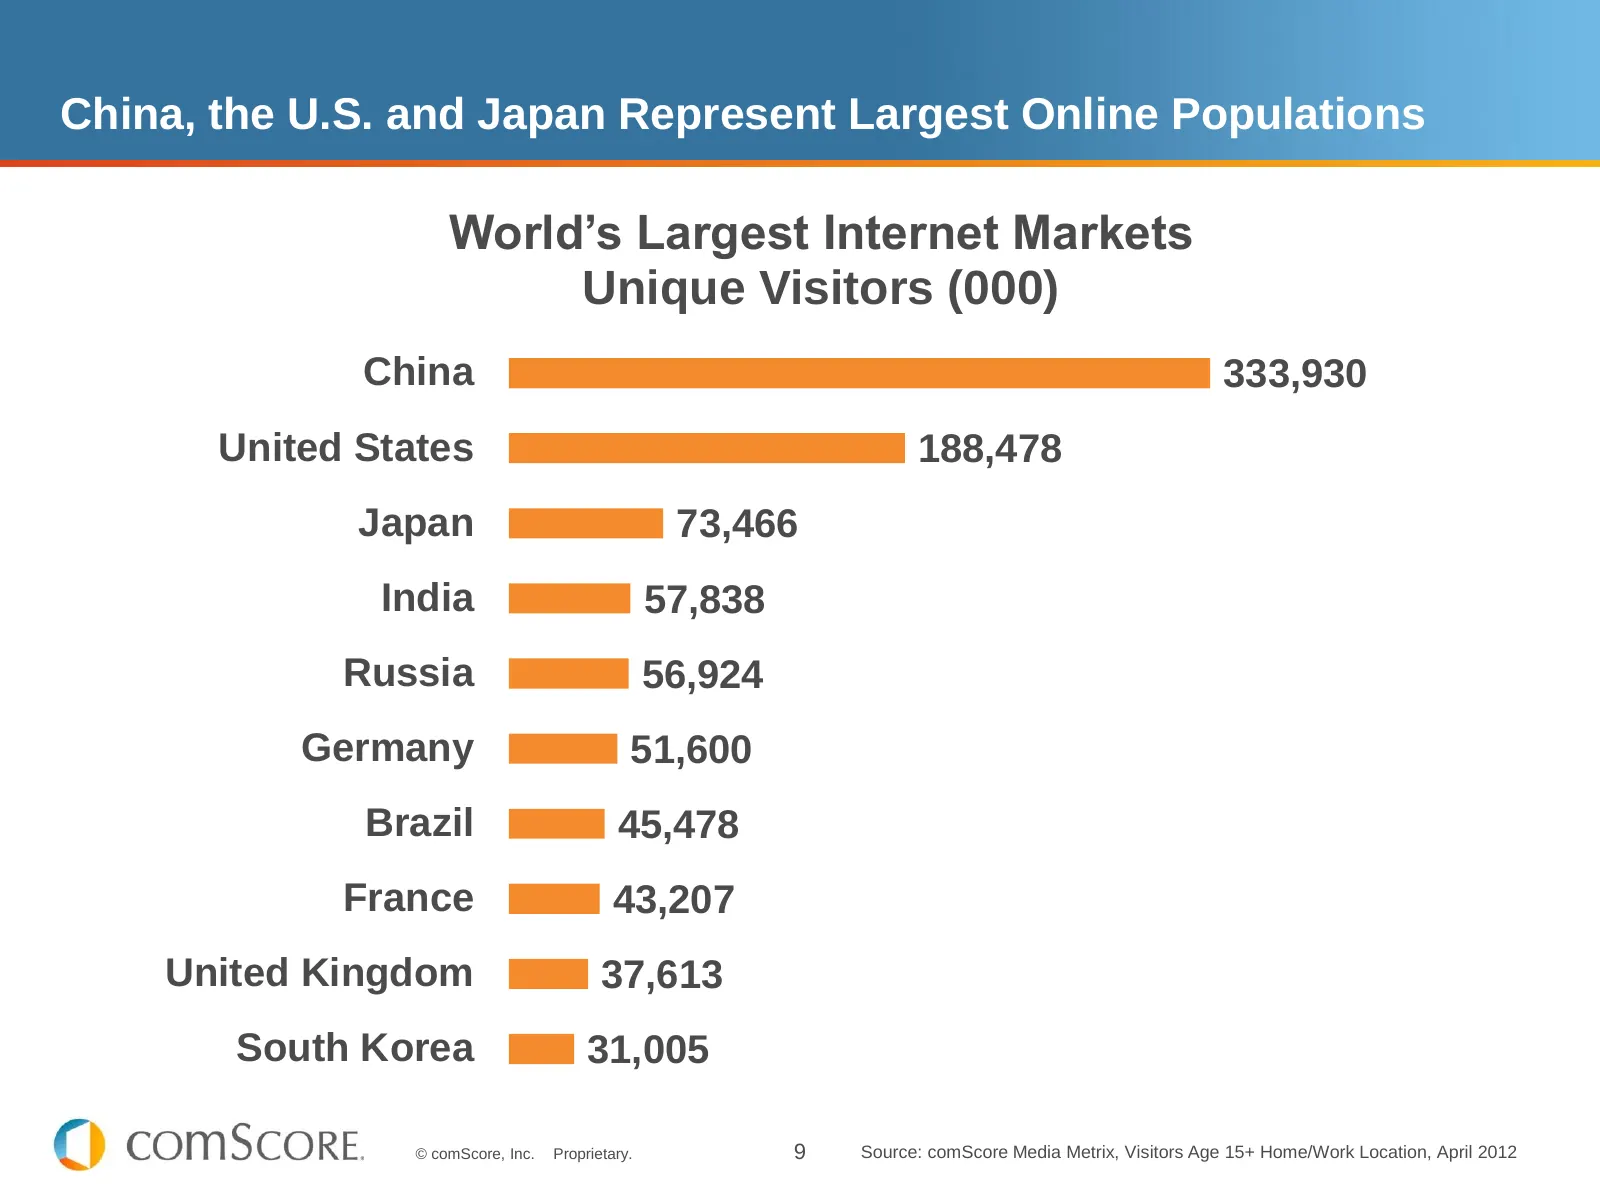
Slide 9: World's Largest Internet Markets
China, the U.S. and Japan Represent Largest Online Populations World’s Largest Internet Markets Unique Visitors (000) China 333,930 United States 188,478 Japan 73,466 India 57,838 Russia 56,924 Germany 51,600 Brazil 45,478 France 43,207 United Kingdom 37,613 South Korea 31,005 © comScore, Inc. Propr
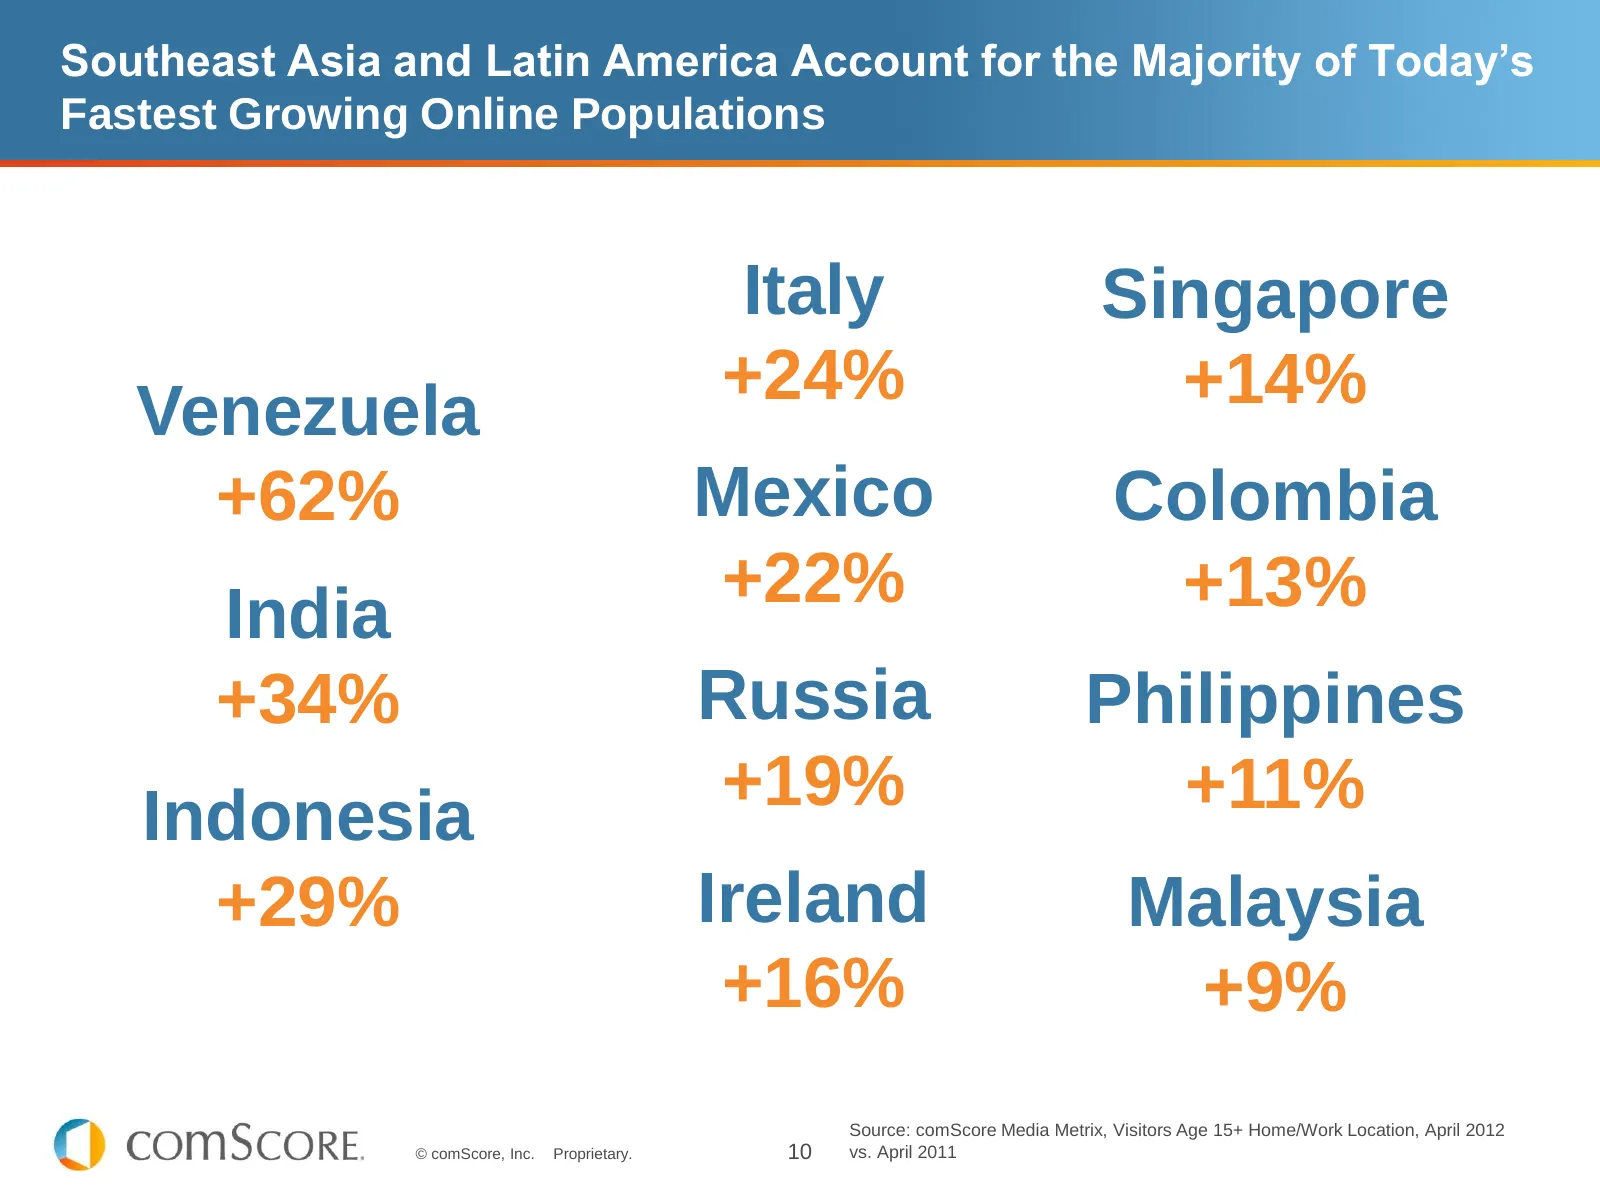
Slide 10: Southeast Asia and Latin America Account for Fastest Growing Online Populations
Southeast Asia and Latin America Account for the Majority of Today’s Fastest Growing Online Populations Italy Singapore +24% +14% Venezuela +62% Mexico Colombia +22% +13% India +34% Russia Philippines +19% +11% Indonesia +29% Ireland Malaysia +16% +9% Source: comScore Media Metrix, Visitors Age 15+
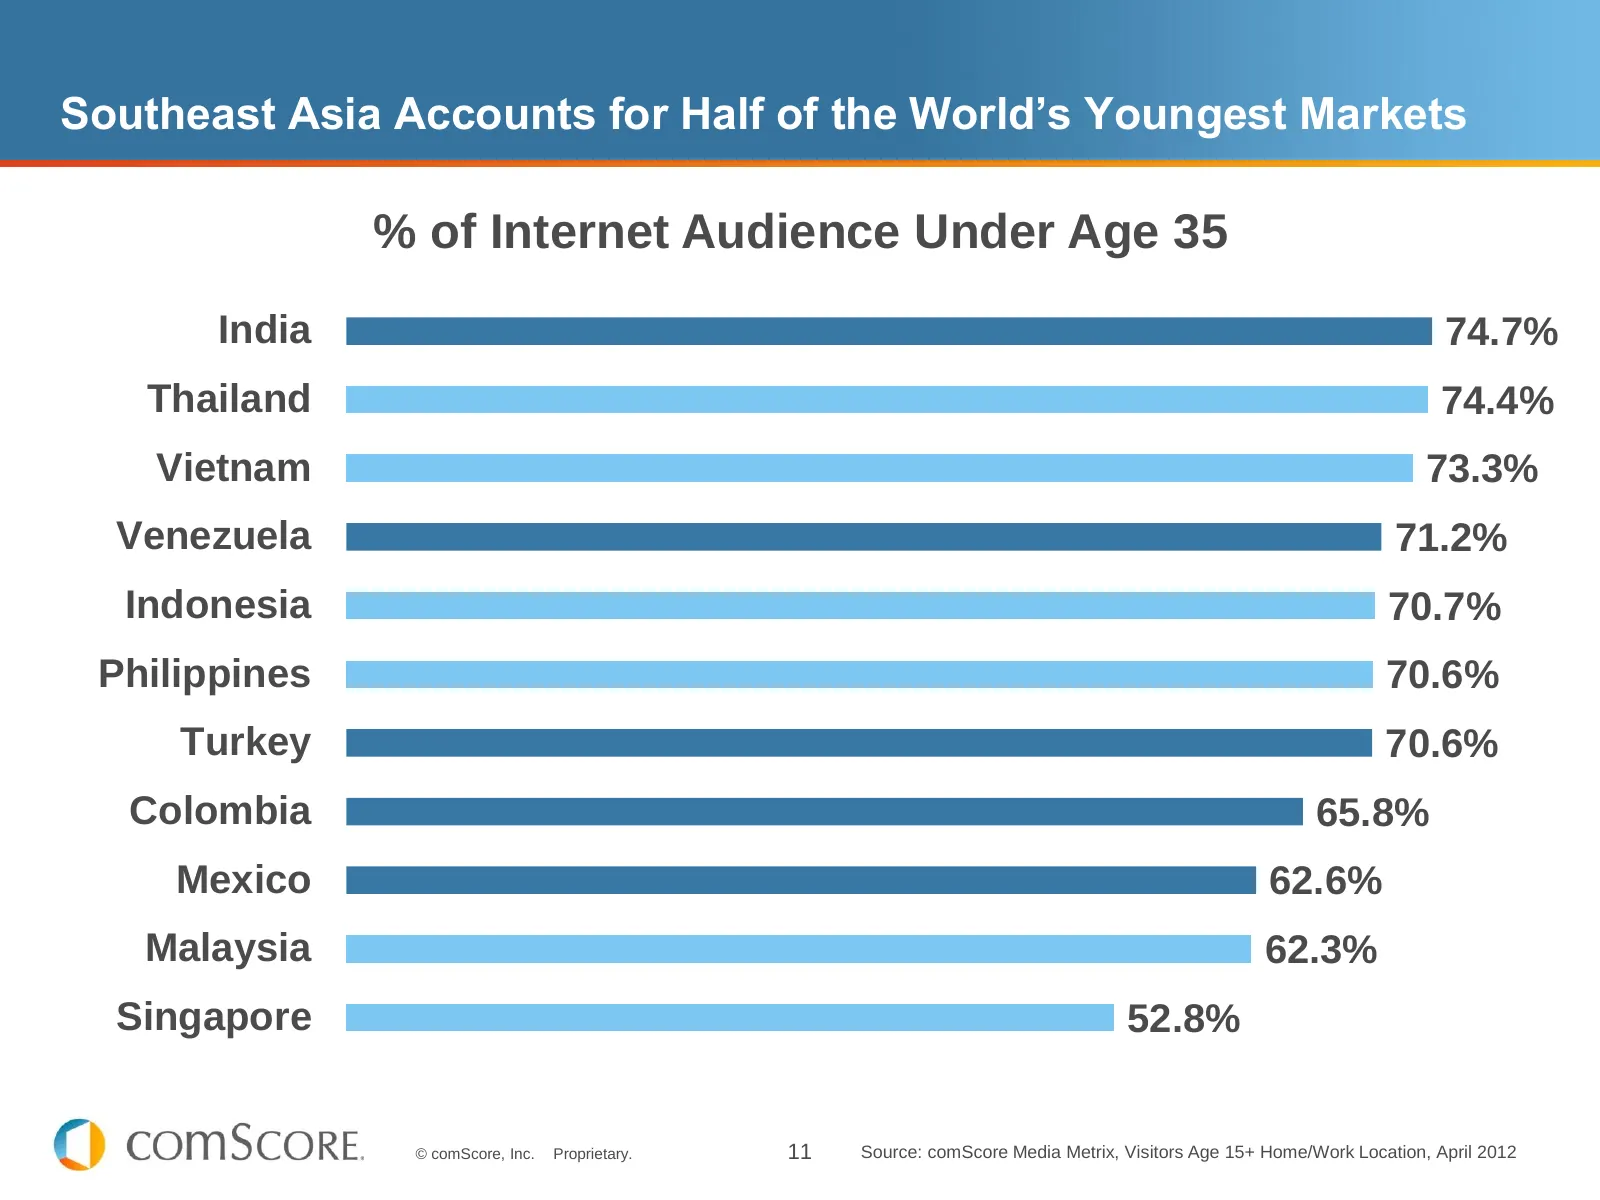
Slide 11: Southeast Asia Accounts for Half of the World's Youngest Markets
Southeast Asia Accounts for Half of the World’s Youngest Markets % of Internet Audience Under Age 35 India 74.7% Thailand 74.4% Vietnam 73.3% Venezuela 71.2% Indonesia 70.7% Philippines 70.6% Turkey 70.6% Colombia 65.8% Mexico 62.6% Malaysia 62.3% Singapore 52.8% © comScore, Inc. Proprietary. 11 Sou
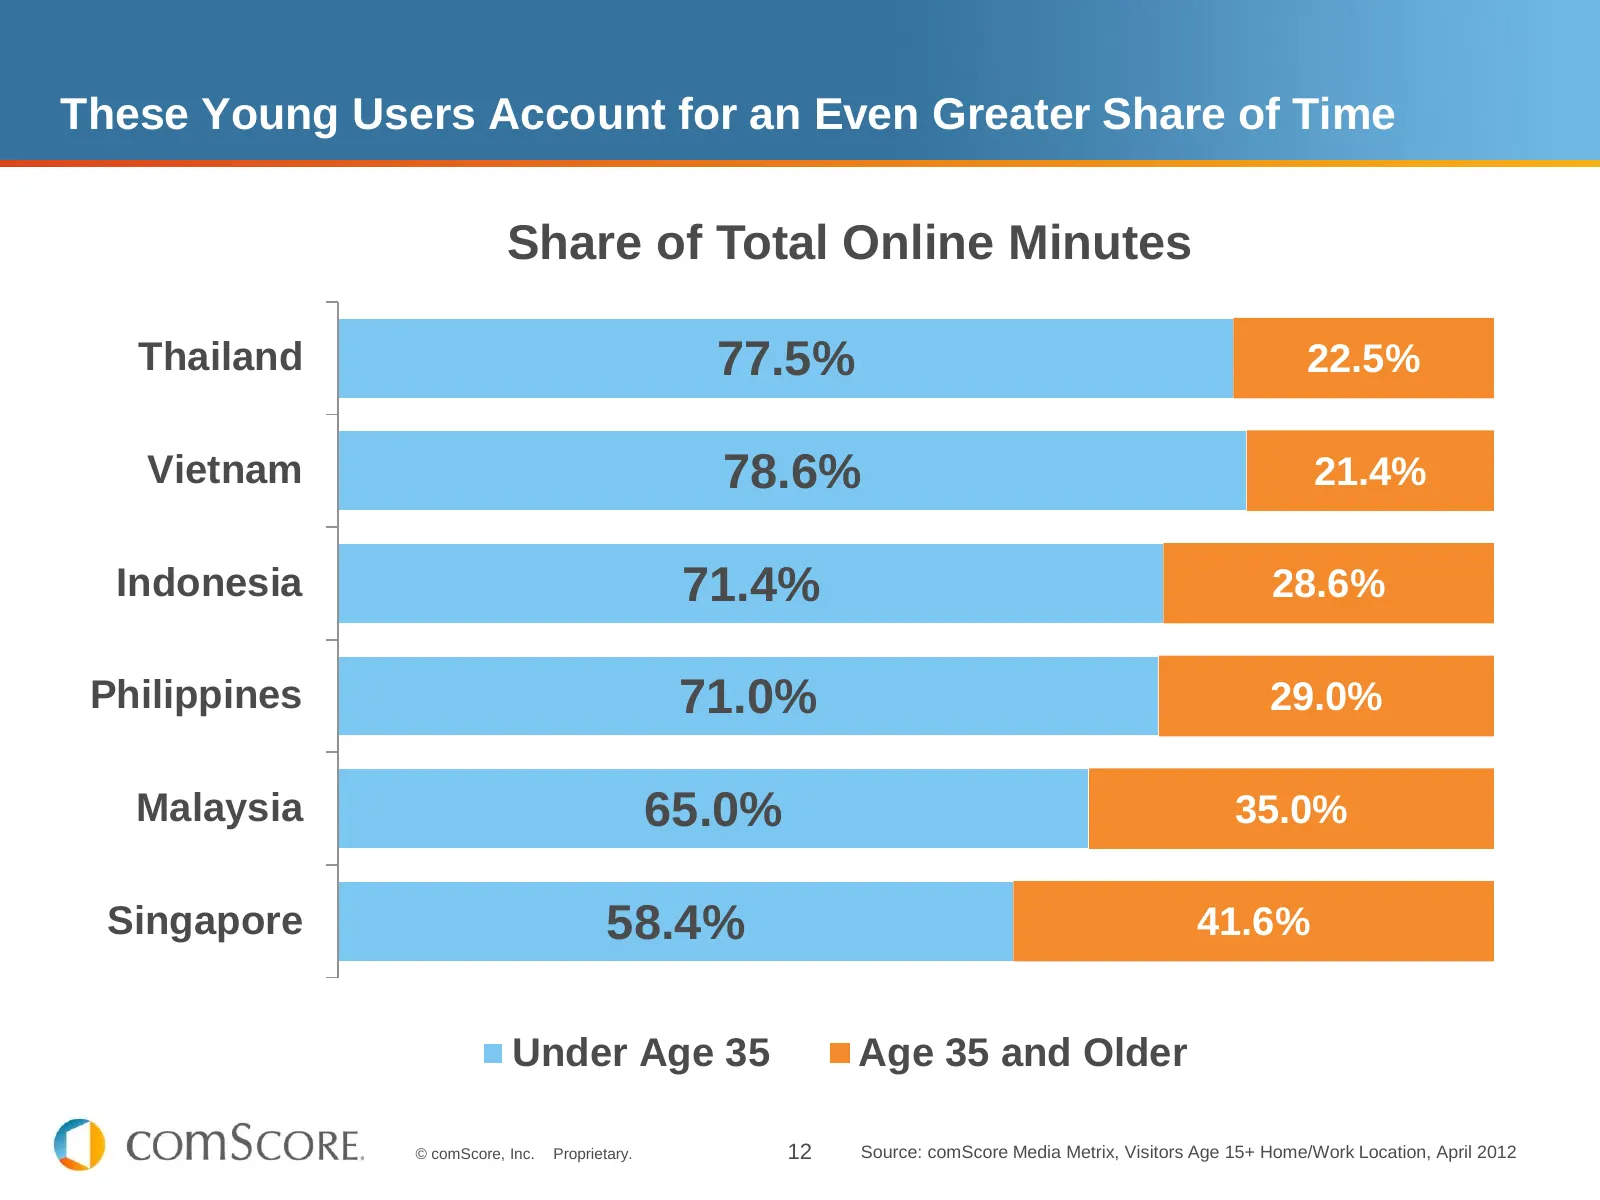
Slide 12: These Young Users Account for an Even Greater Share of Time
These Young Users Account for an Even Greater Share of Time Share of Total Online Minutes Thailand 77.5% 22.5% Vietnam 78.6% 21.4% Indonesia 71.4% 28.6% Philippines 71.0% 29.0% Malaysia 65.0% 35.0% Singapore 58.4% 41.6% Under Age 35 Age 35 and Older © comScore, Inc. Proprietary. 12 Source: comScore
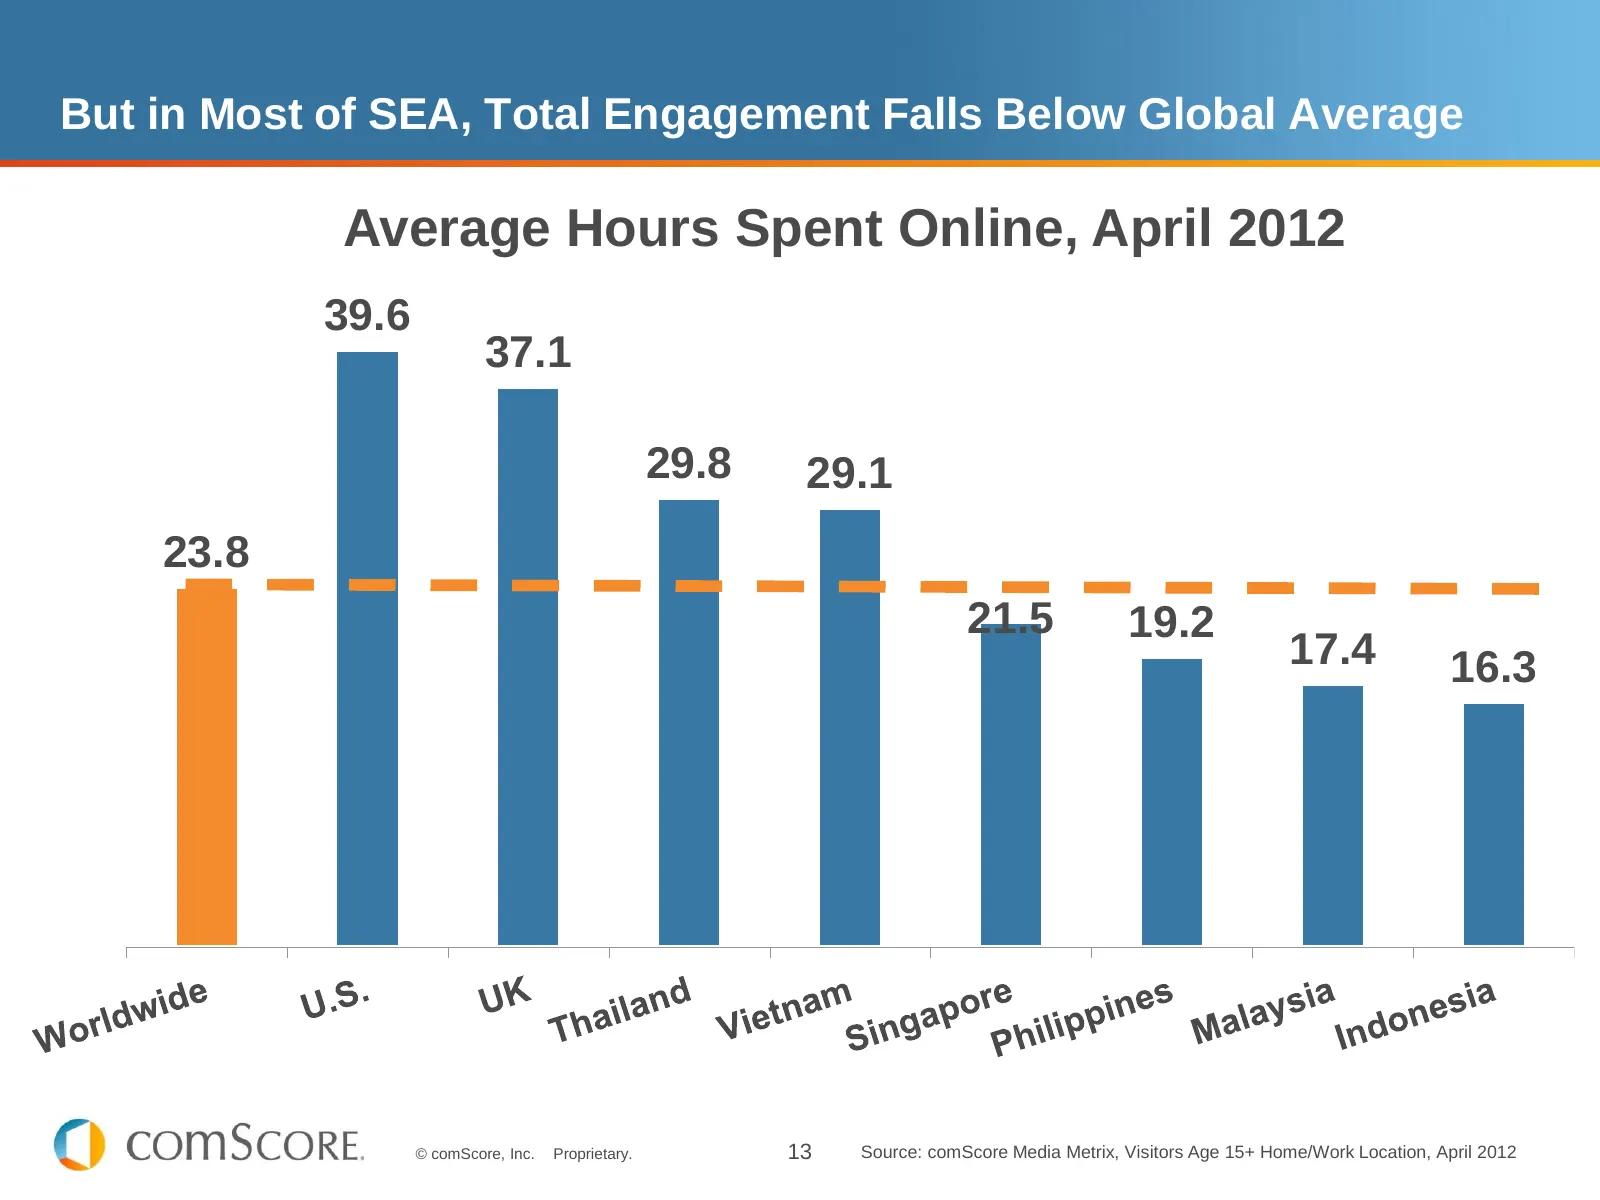
Slide 13: In Most of SEA, Total Engagement Falls Below Global Average
But in Most of SEA, Total Engagement Falls Below Global Average Average Hours Spent Online, April 2012 39.6 37.1 29.8 29.1 23.8 21.5 19.2 17.4 16.3 © comScore, Inc. Proprietary. 13 Source: comScore Media Metrix, Visitors Age 15+ Home/Work Location, April 2012

Slide 14: Key Trends Shaping the Digital Landscape
5 KEY TRENDS SHAPING THE DIGITAL LANDSCAPE SOCIAL NETWORKING E-COMMERCE ONLINE VIDEO MOBILE DIGITAL ADVERTISING © comScore, Inc. Proprietary. 14

Slide 15: Social Networking
SOCIAL NETWORKING © comScore, Inc. Proprietary. 15
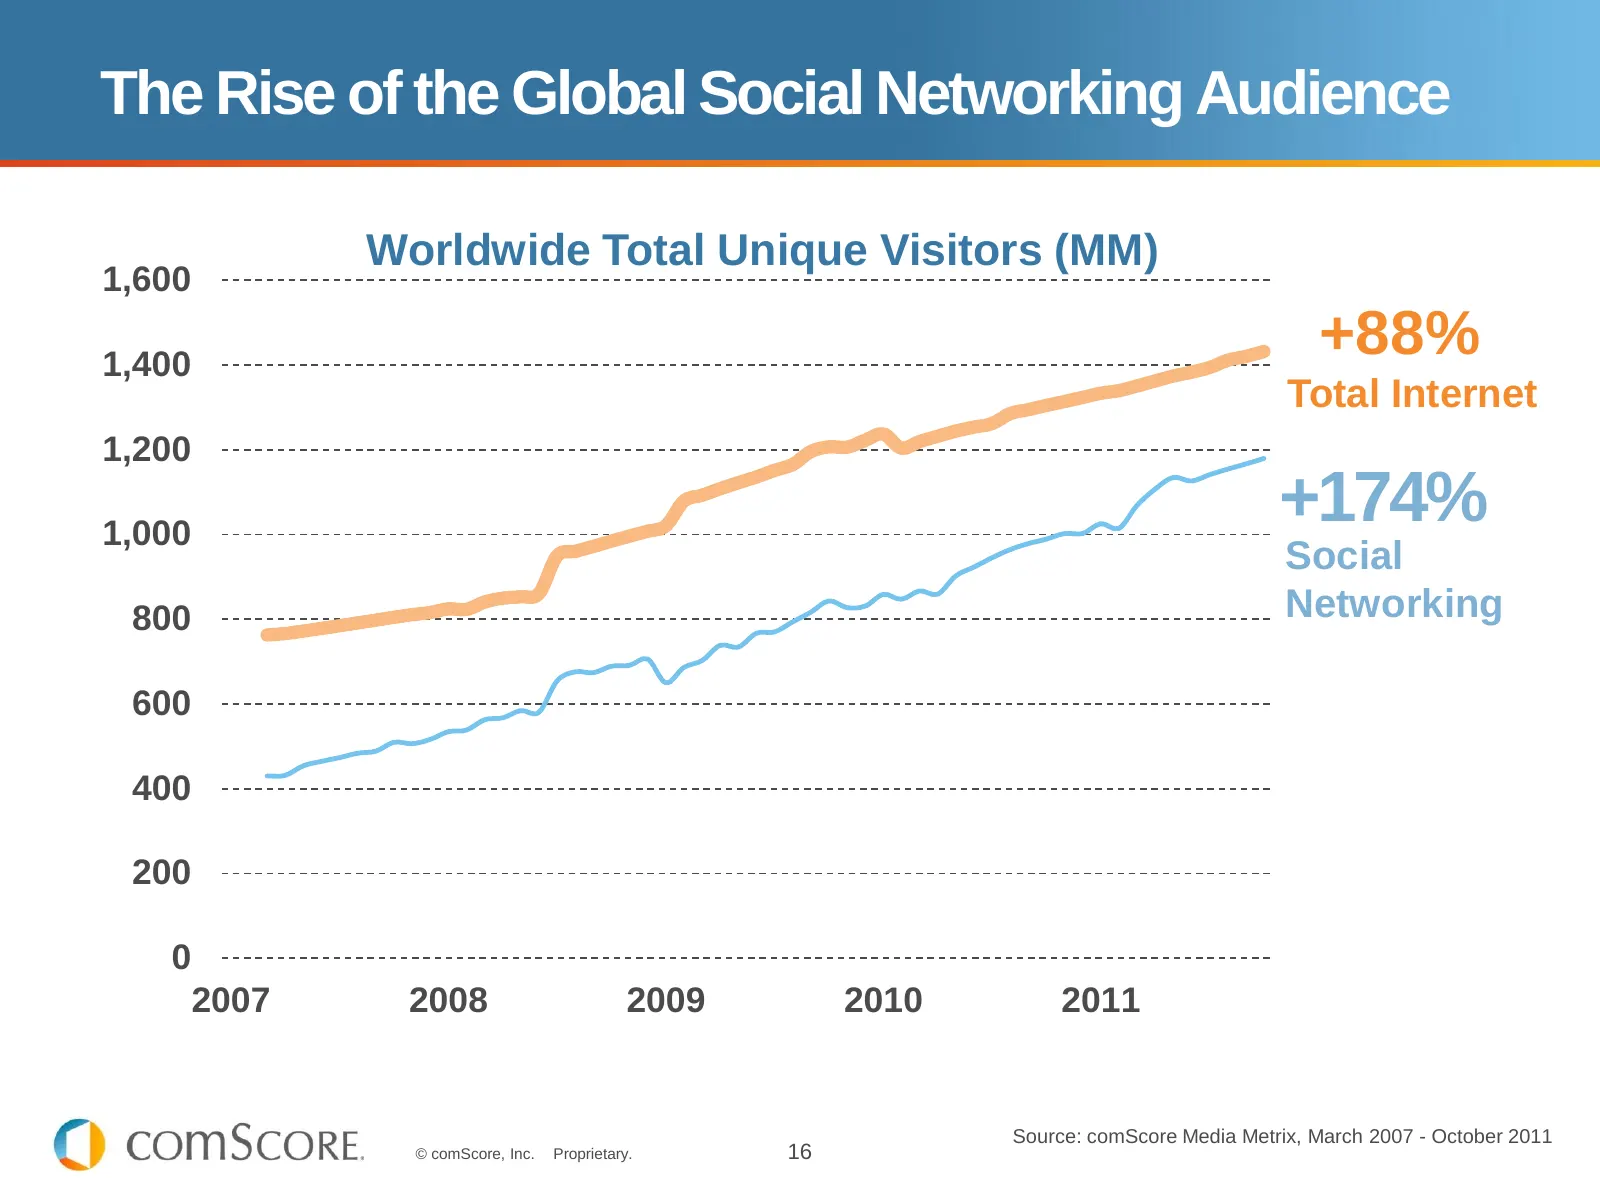
Slide 16: The Rise of the Global Social Networking Audience
The Rise of the Global Social Networking Audience Worldwide Total Unique Visitors (MM) 1,600 1,400 +88% Total Internet 1,200 1,000 +174% Social 800 Networking 600 400 200 0 2007 2008 2009 2010 2011 Source: comScore Media Metrix, March 2007 - October 2011 © comScore, Inc. Proprietary. 16
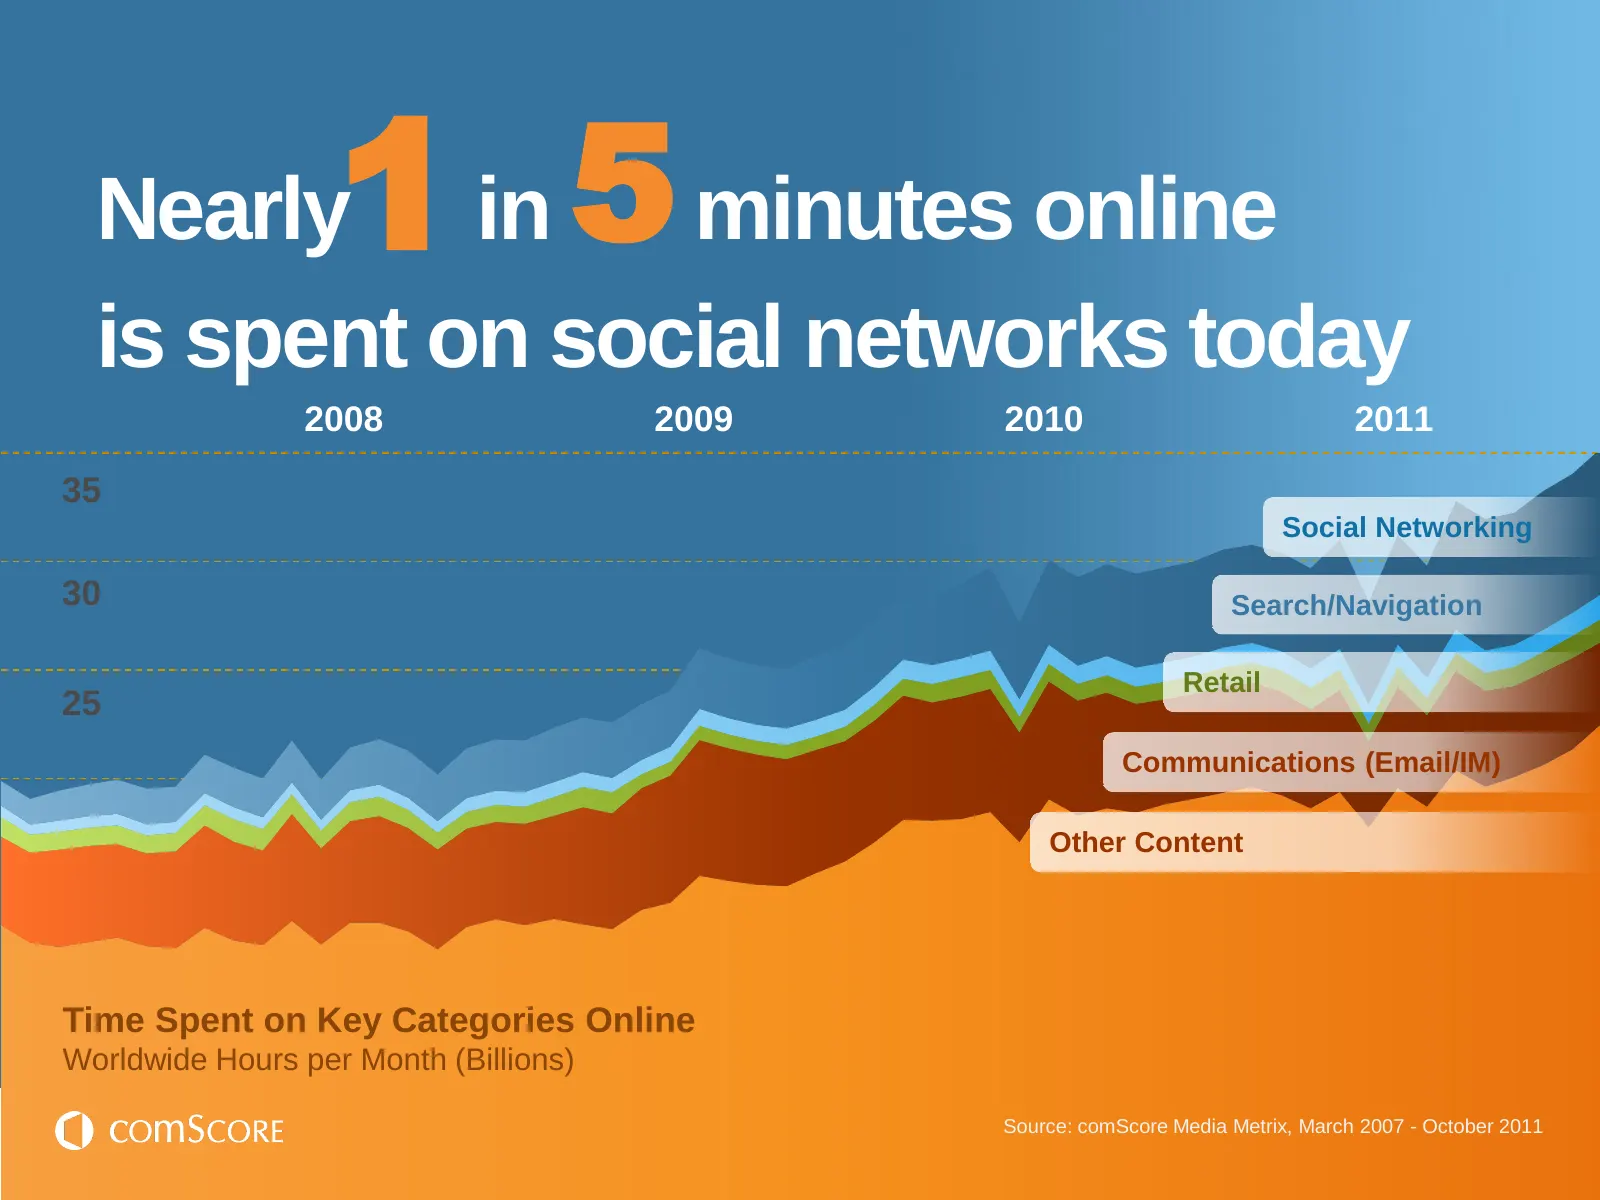
Slide 17: Share of Minutes Online Spent on Social Networks
Nearly in 1 5 minutes online is spent on social networks today 2008 2009 2010 2011 35 Social Networking 30 Search/Navigation Retail 25 Communications (Email/IM) Other Content Time Spent on Key Categories Online Worldwide Hours per Month (Billions) Source: comScore Media Metrix, March 2007 - October
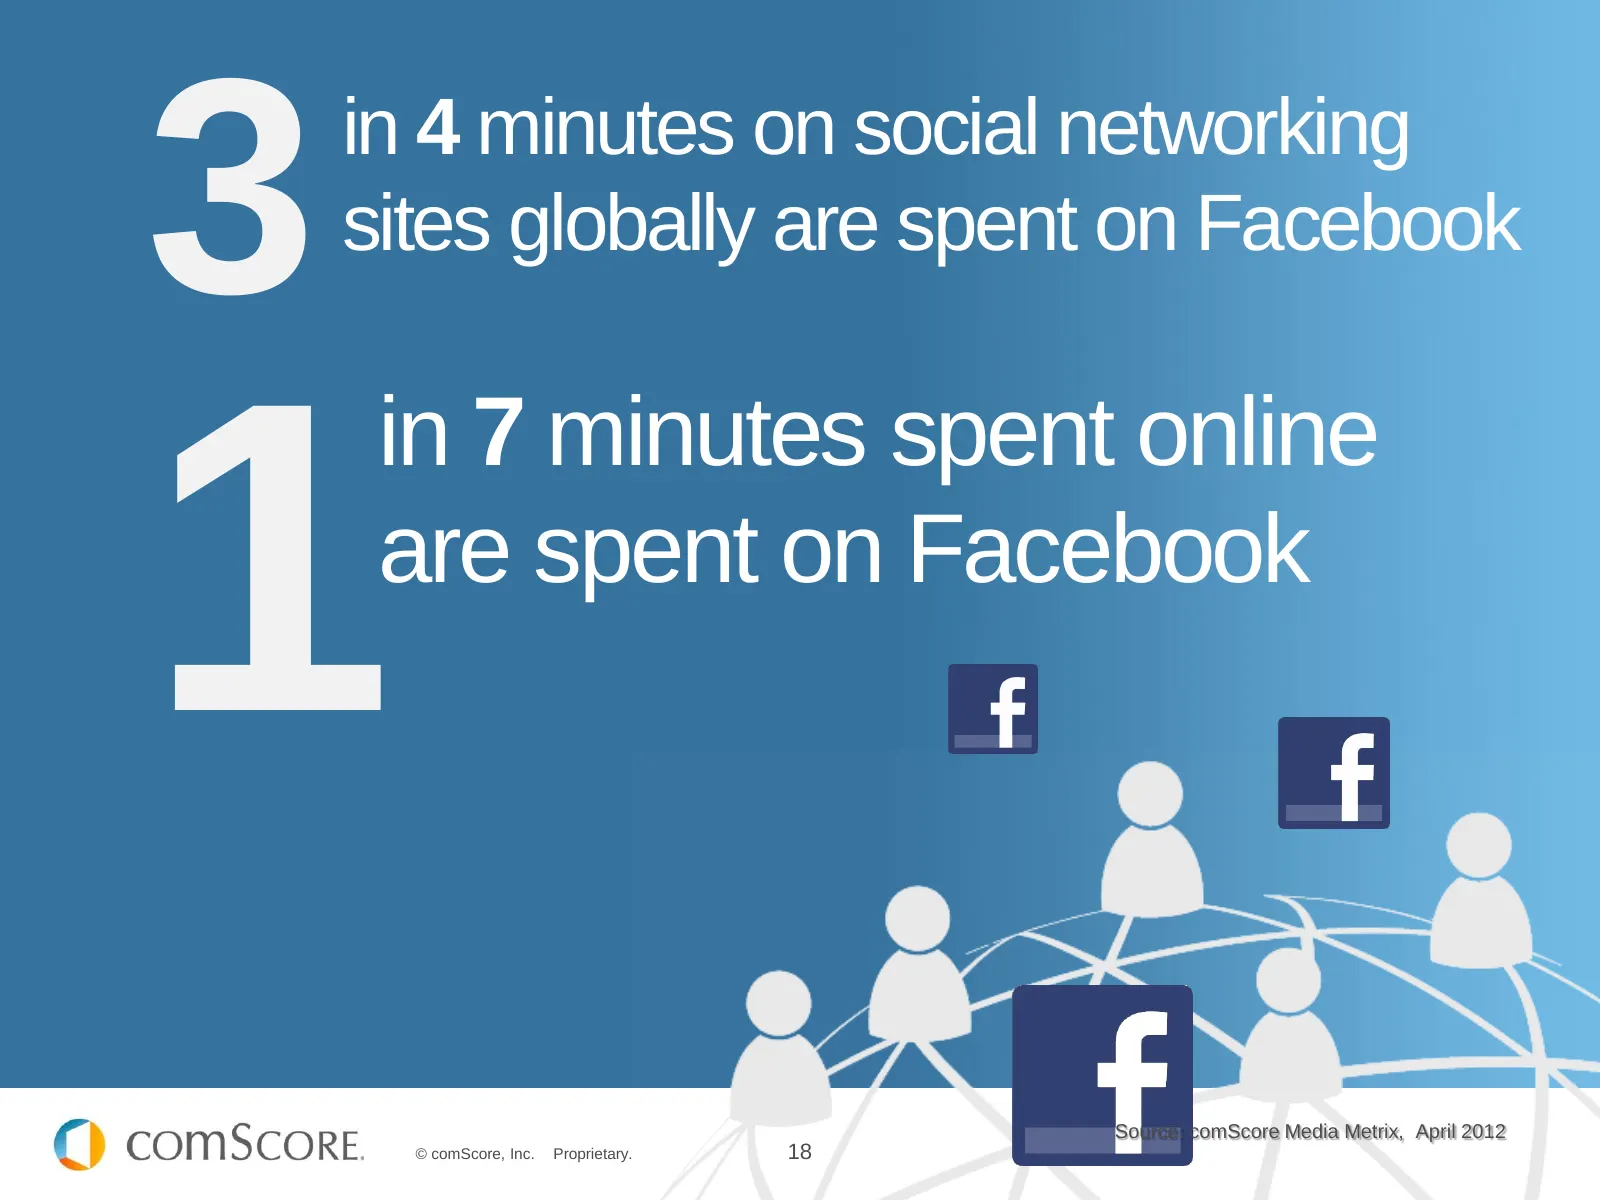
Slide 18: 1 in 7 Minutes Spent Online Are Spent on Facebook
3 in 4 minutes on social networking sites globally are spent on Facebook 1 in 7 minutes spent online are spent on Facebook Source: comScore Media Metrix, April 2012 © comScore, Inc. Proprietary. 18
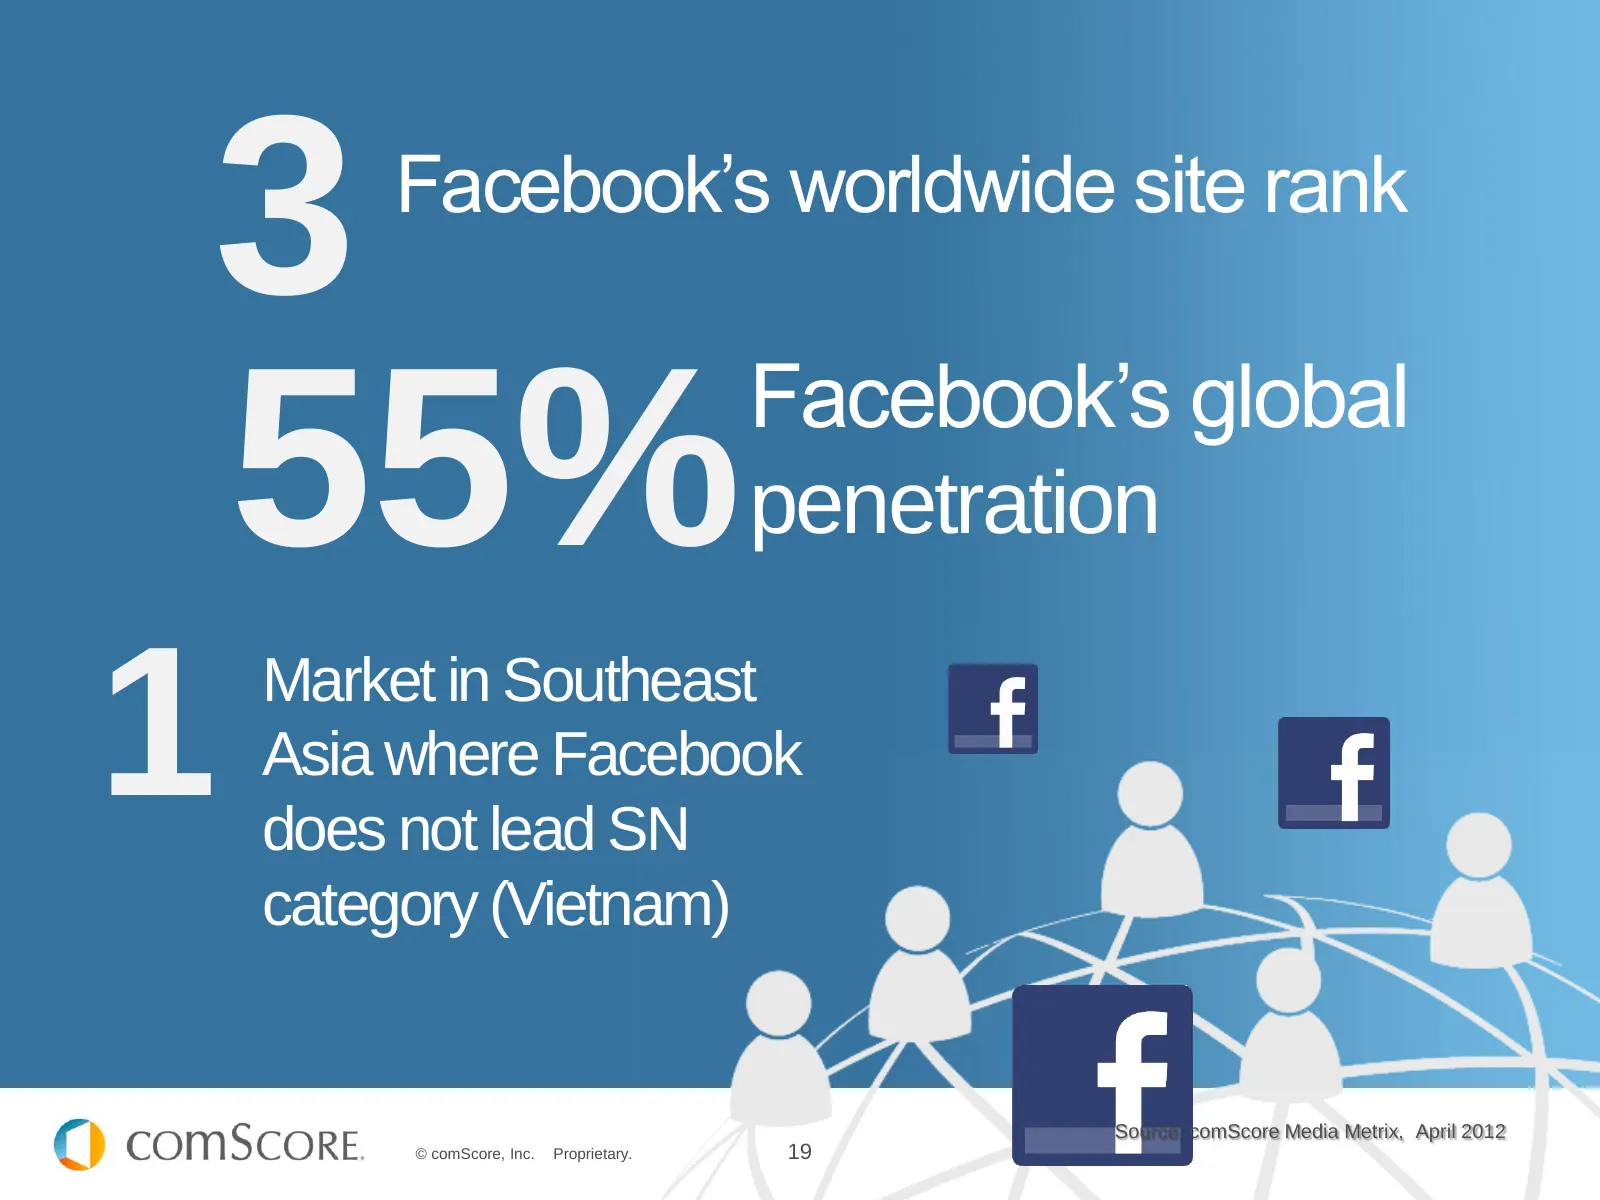
Slide 19: Facebook's Worldwide Site Rank and Penetration
3 Facebook’s worldwide site rank Facebook’s global 55% penetration 1 Market in Southeast Asia where Facebook does not lead SN category (Vietnam) Source: comScore Media Metrix, April 2012 © comScore, Inc. Proprietary. 19
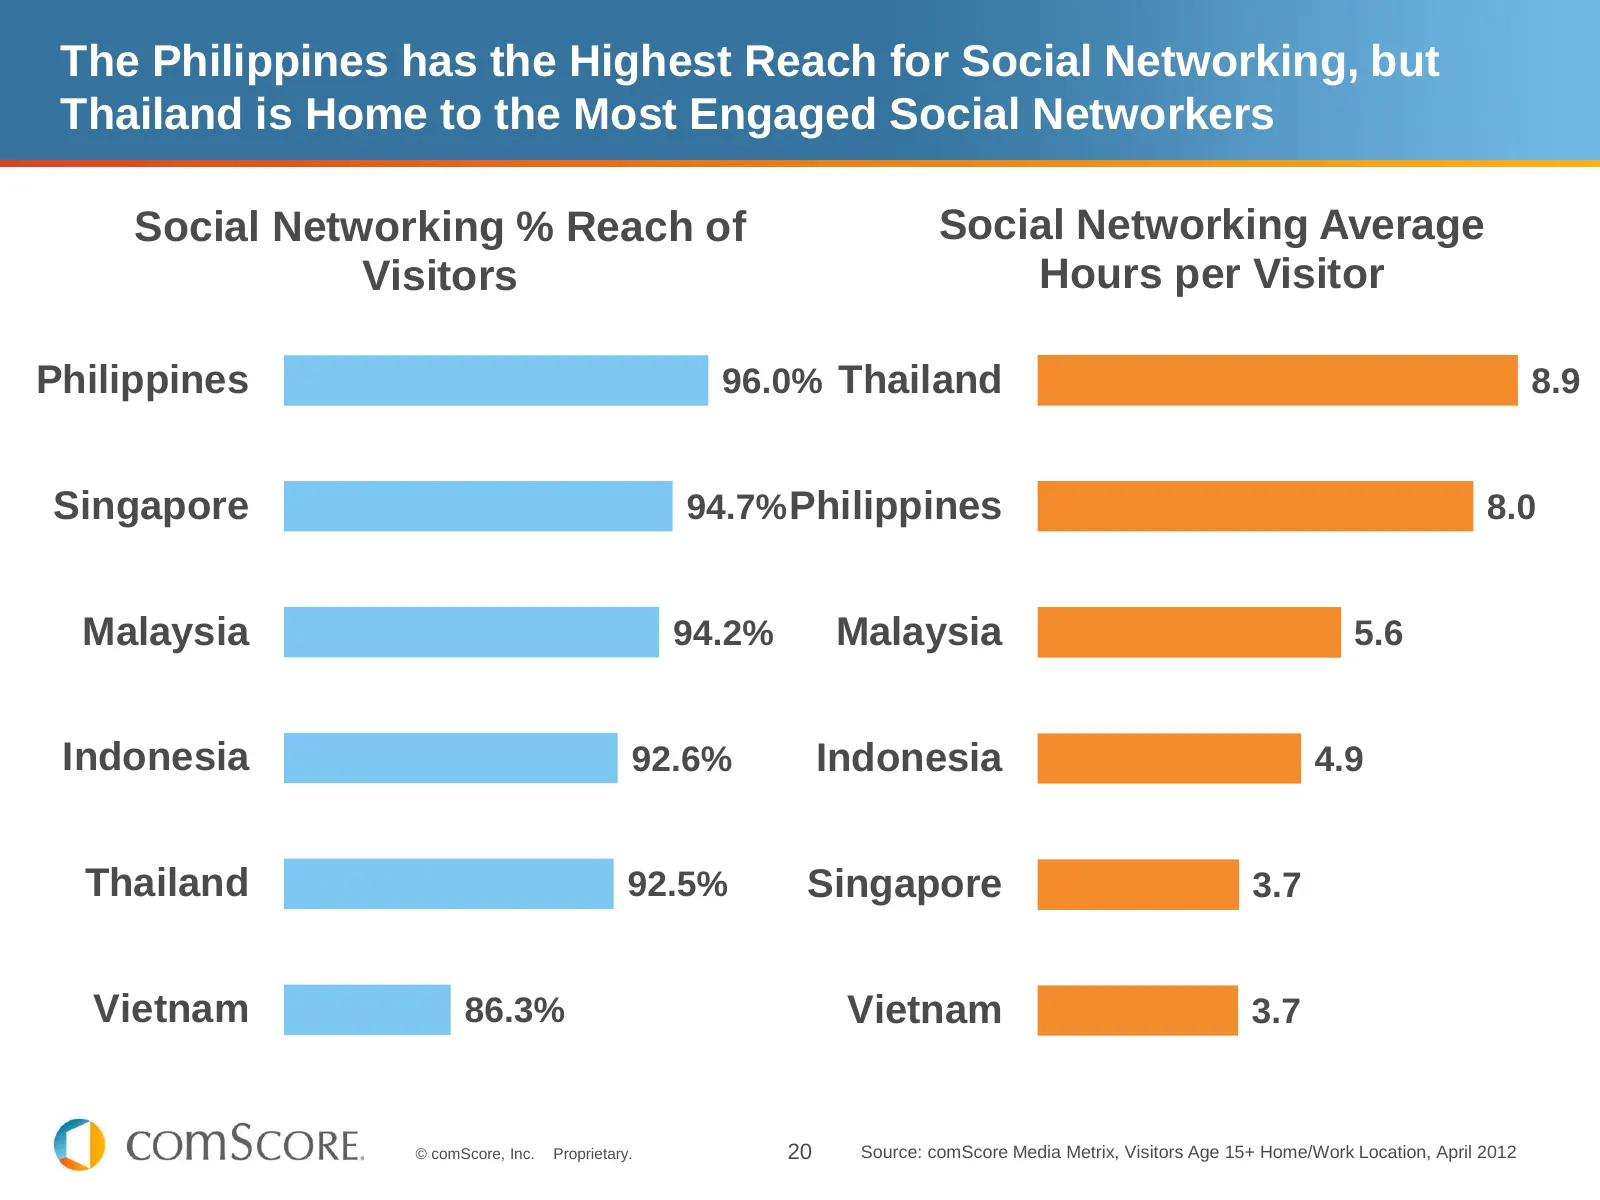
Slide 20: Philippines Has Highest Social Networking Reach; Thailand Most Engaged
The Philippines has the Highest Reach for Social Networking, but Thailand is Home to the Most Engaged Social Networkers Social Networking % Reach of Social Networking Average Visitors Hours per Visitor Philippines 96.0% Thailand 8.9 Singapore 94.7% Philippines 8.0 Malaysia 94.2% Malaysia 5.6 Indones
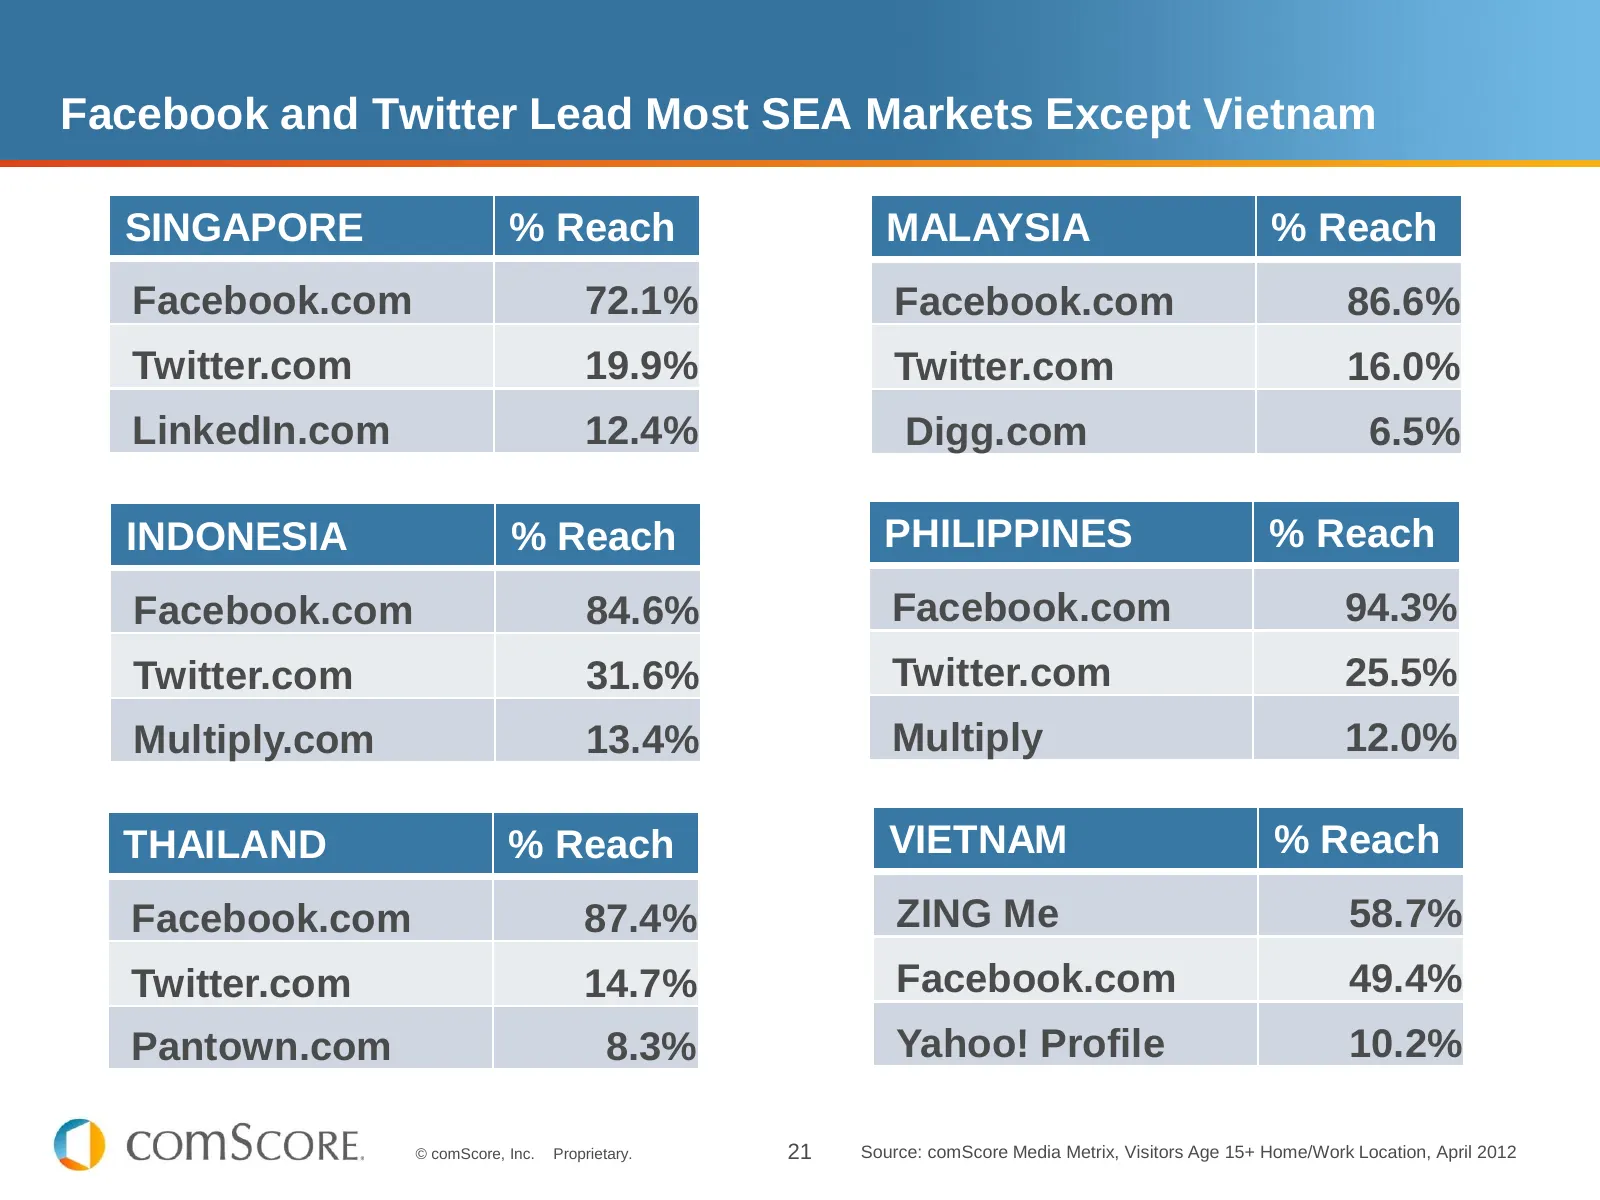
Slide 21: Facebook and Twitter Lead Most SEA Markets Except Vietnam
Facebook and Twitter Lead Most SEA Markets Except Vietnam SINGAPORE % Reach MALAYSIA % Reach Facebook.com 72.1% Facebook.com 86.6% Twitter.com 19.9% Twitter.com 16.0% LinkedIn.com 12.4% Digg.com 6.5% INDONESIA % Reach PHILIPPINES % Reach Facebook.com 84.6% Facebook.com 94.3% Twitter.com 31.6% Twitte
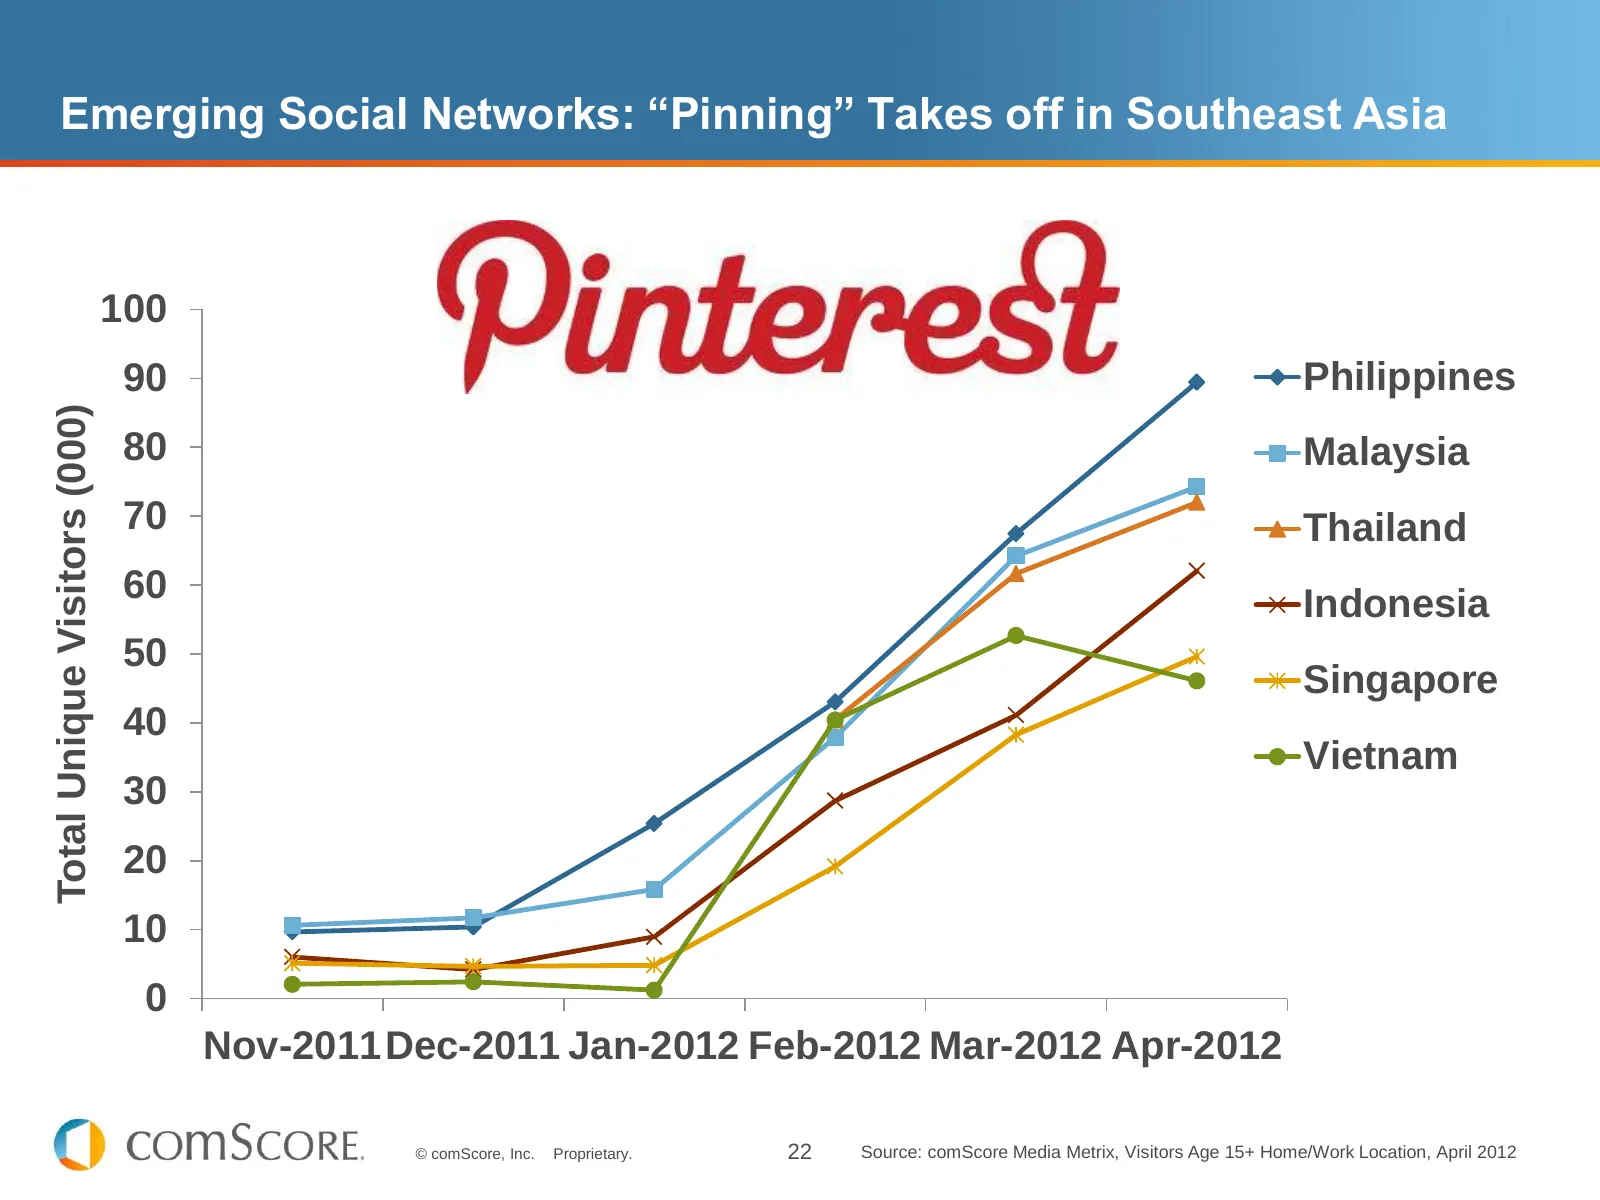
Slide 22: Emerging Social Networks: Pinning Takes off in Southeast Asia
Emerging Social Networks: “Pinning” Takes off in Southeast Asia 100 90 Philippines Total Unique Visitors (000) 80 Malaysia 70 Thailand 60 Indonesia 50 Singapore 40 Vietnam 30 20 10 0 Nov-2011Dec-2011 Jan-2012 Feb-2012 Mar-2012 Apr-2012 © comScore, Inc. Proprietary. 22 Source: comScore Media Metrix,
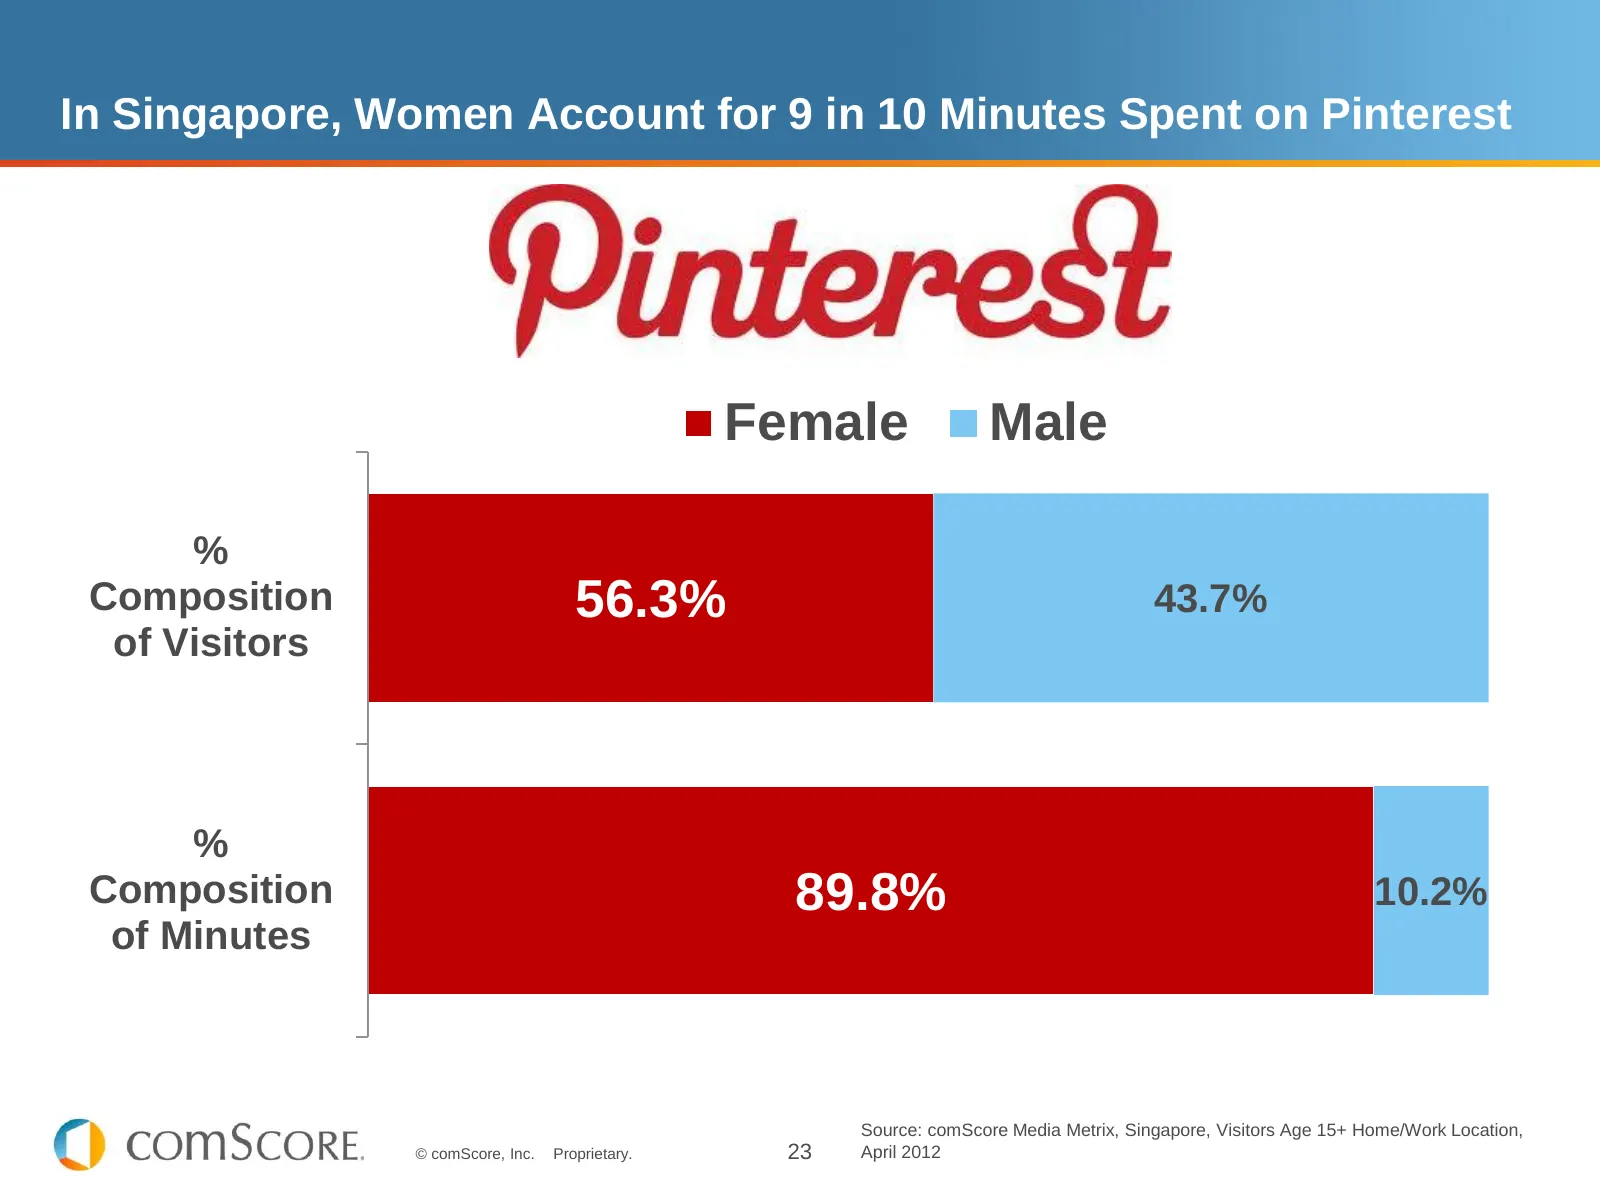
Slide 23: In Singapore, Women Account for Most Minutes on Pinterest
In Singapore, Women Account for 9 in 10 Minutes Spent on Pinterest Female Male % Composition 56.3% 43.7% of Visitors % Composition 89.8% 10.2% of Minutes Source: comScore Media Metrix, Singapore, Visitors Age 15+ Home/Work Location, © comScore, Inc. Proprietary. 23 April 2012

Slide 24: e-Commerce
e-Commerce © comScore, Inc. Proprietary. 24
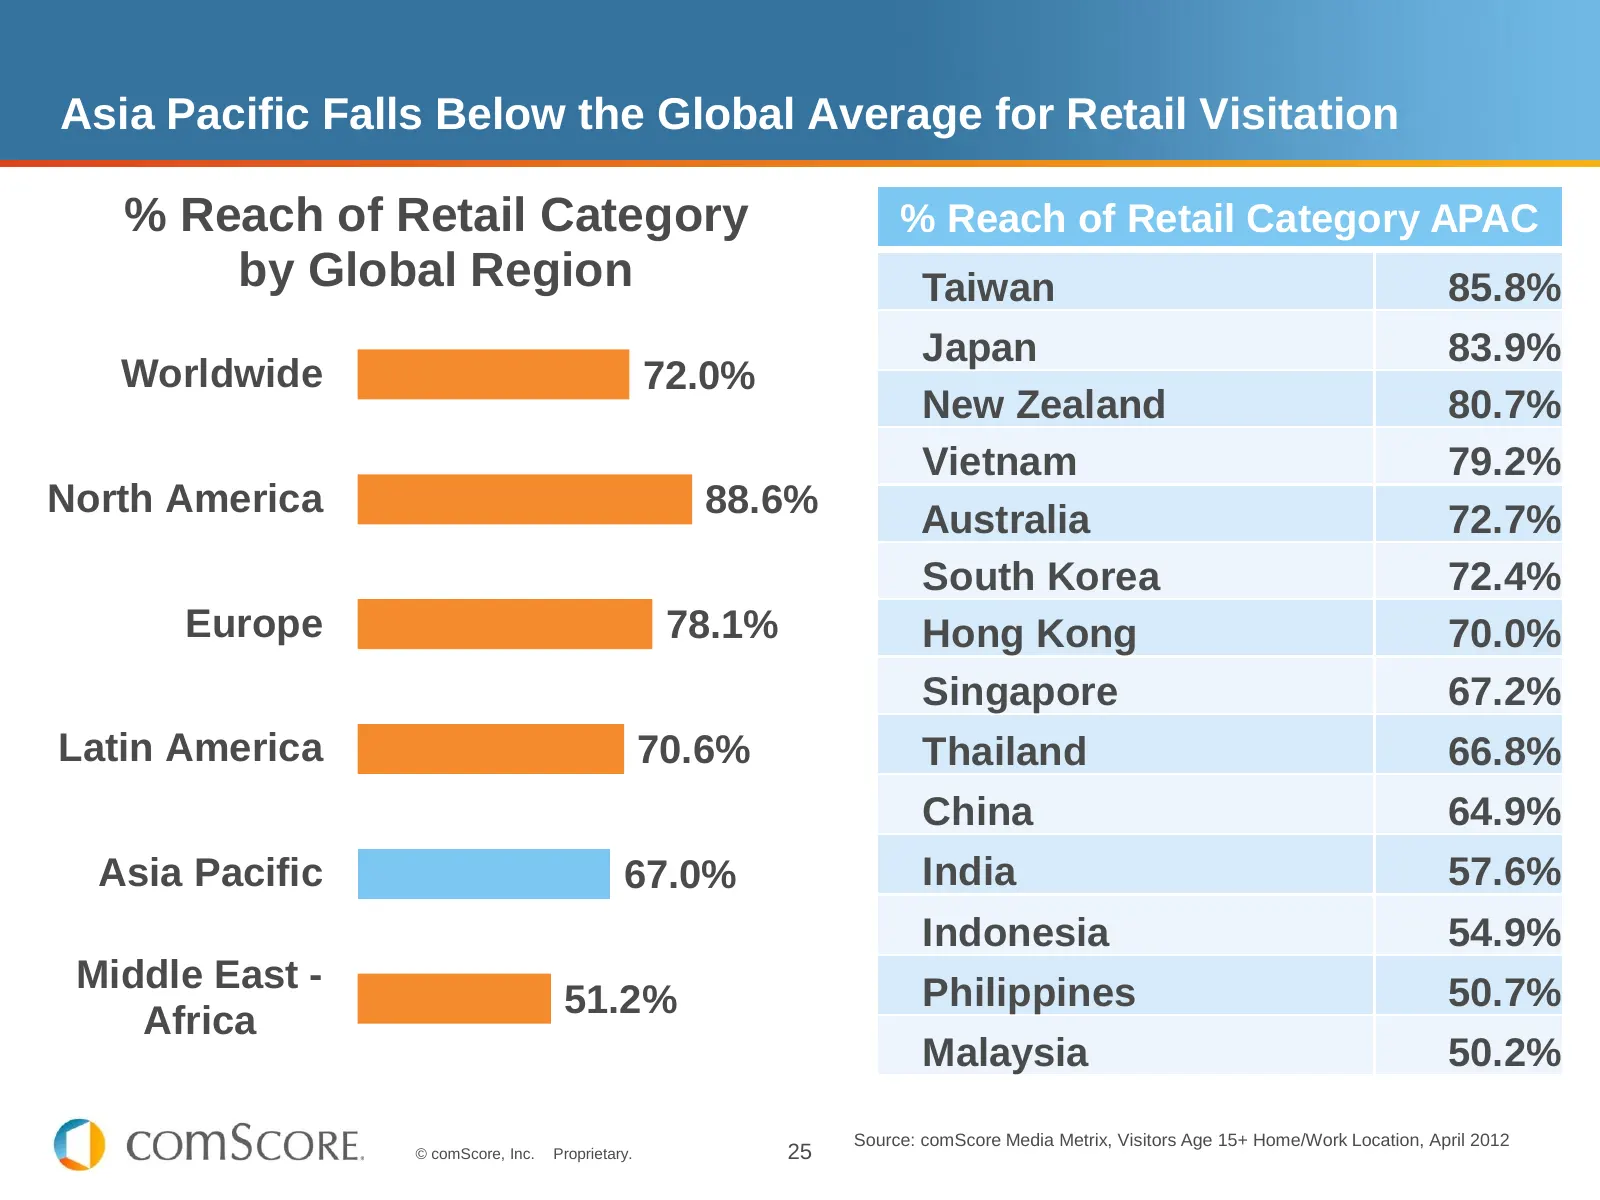
Slide 25: Asia Pacific Falls Below the Global Average for Retail Visitation
Asia Pacific Falls Below the Global Average for Retail Visitation % Reach of Retail Category % Reach of Retail Category APAC by Global Region Taiwan 85.8% Japan 83.9% Worldwide 72.0% New Zealand 80.7% Vietnam 79.2% North America 88.6% Australia 72.7% South Korea 72.4% Europe 78.1% Hong Kong 70.0% Si
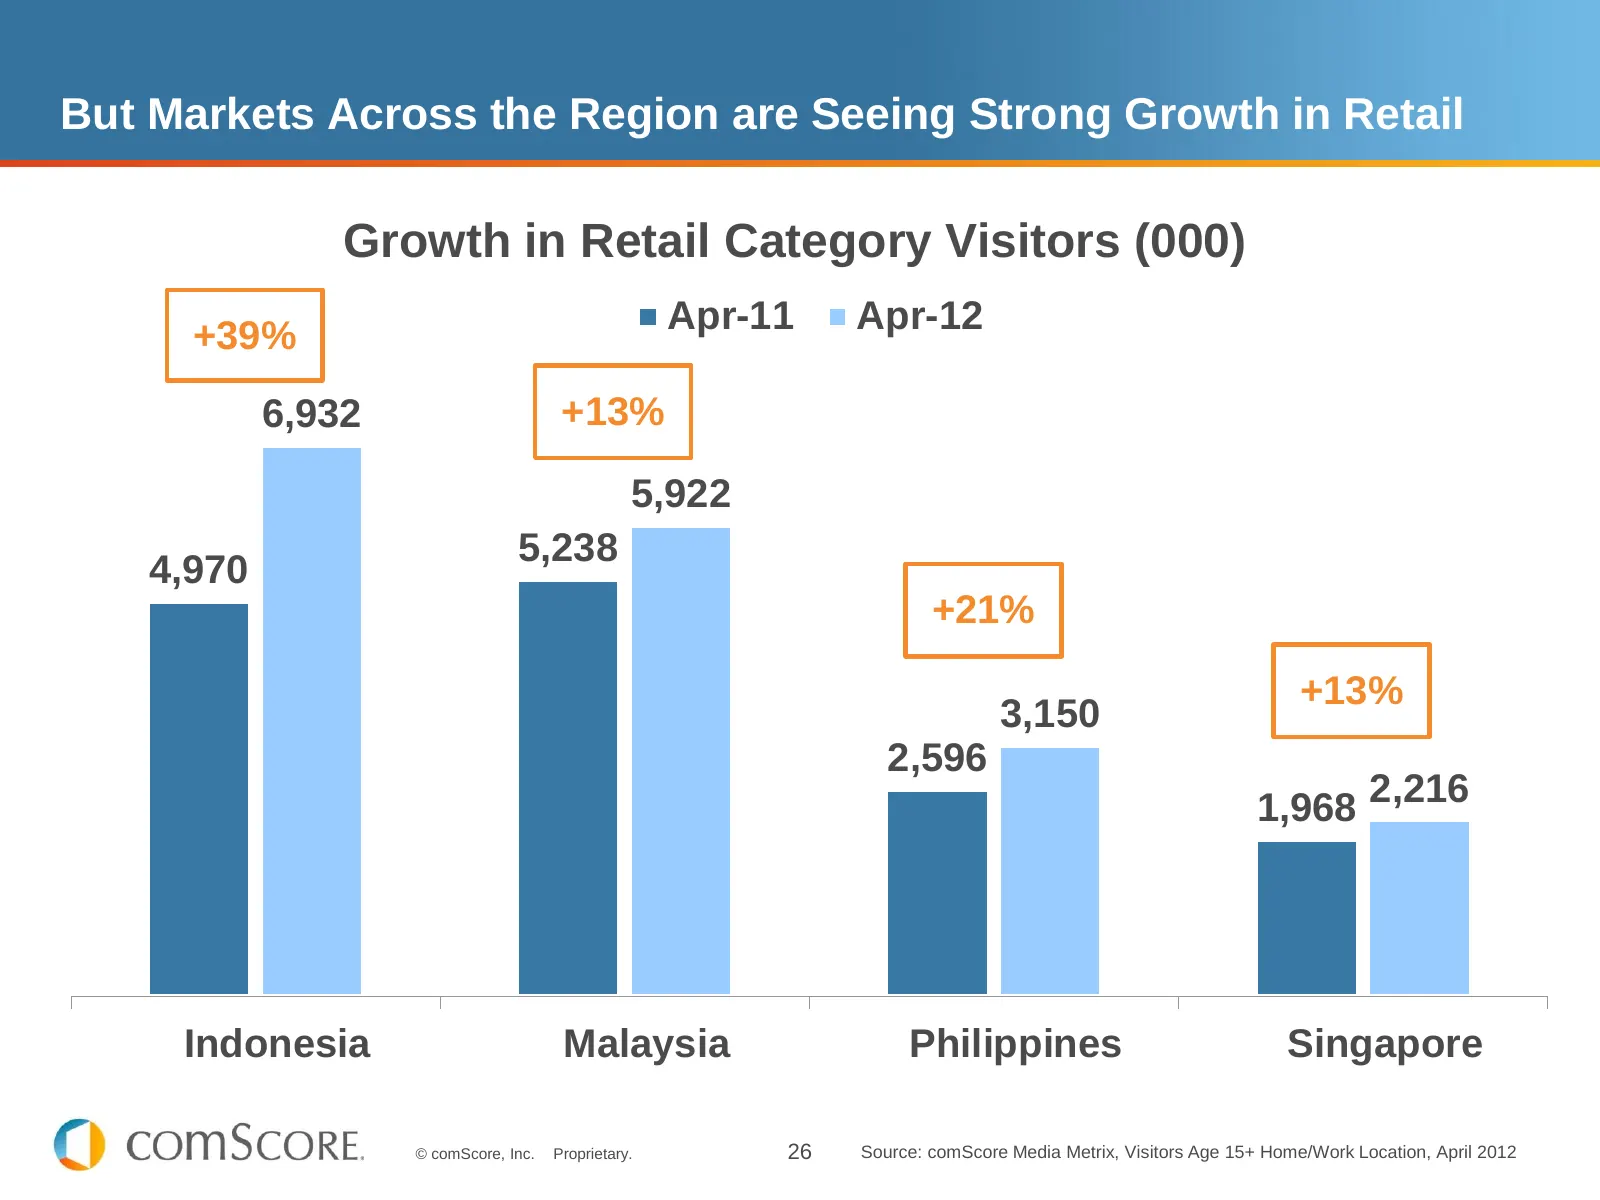
Slide 26: Markets Across the Region are Seeing Strong Growth in Retail
But Markets Across the Region are Seeing Strong Growth in Retail Growth in Retail Category Visitors (000) Apr-11 Apr-12 +39% 6,932 +13% 5,922 5,238 4,970 +21% +13% 3,150 2,596 1,968 2,216 Indonesia Malaysia Philippines Singapore © comScore, Inc. Proprietary. 26 Source: comScore Media Metrix, Visitor
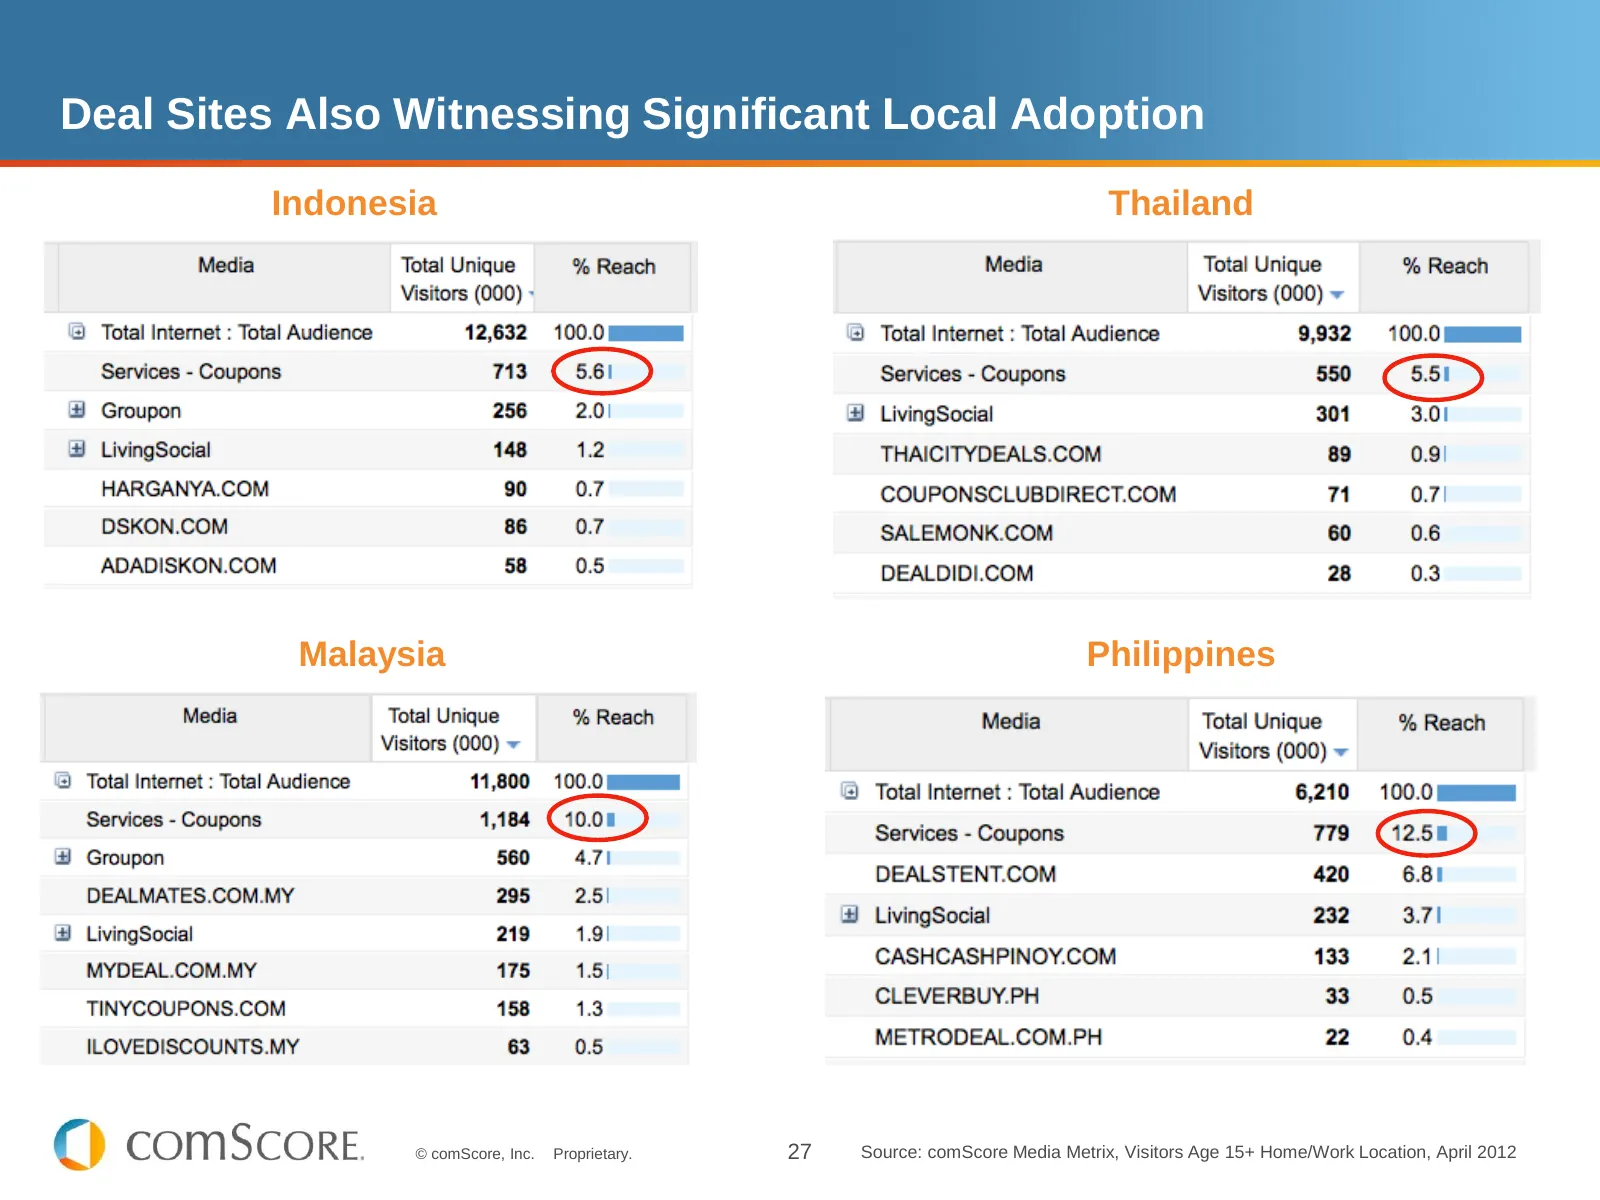
Slide 27: Deal Sites Also Witnessing Significant Local Adoption
Deal Sites Also Witnessing Significant Local Adoption Indonesia Thailand Malaysia Philippines © comScore, Inc. Proprietary. 27 Source: comScore Media Metrix, Visitors Age 15+ Home/Work Location, April 2012
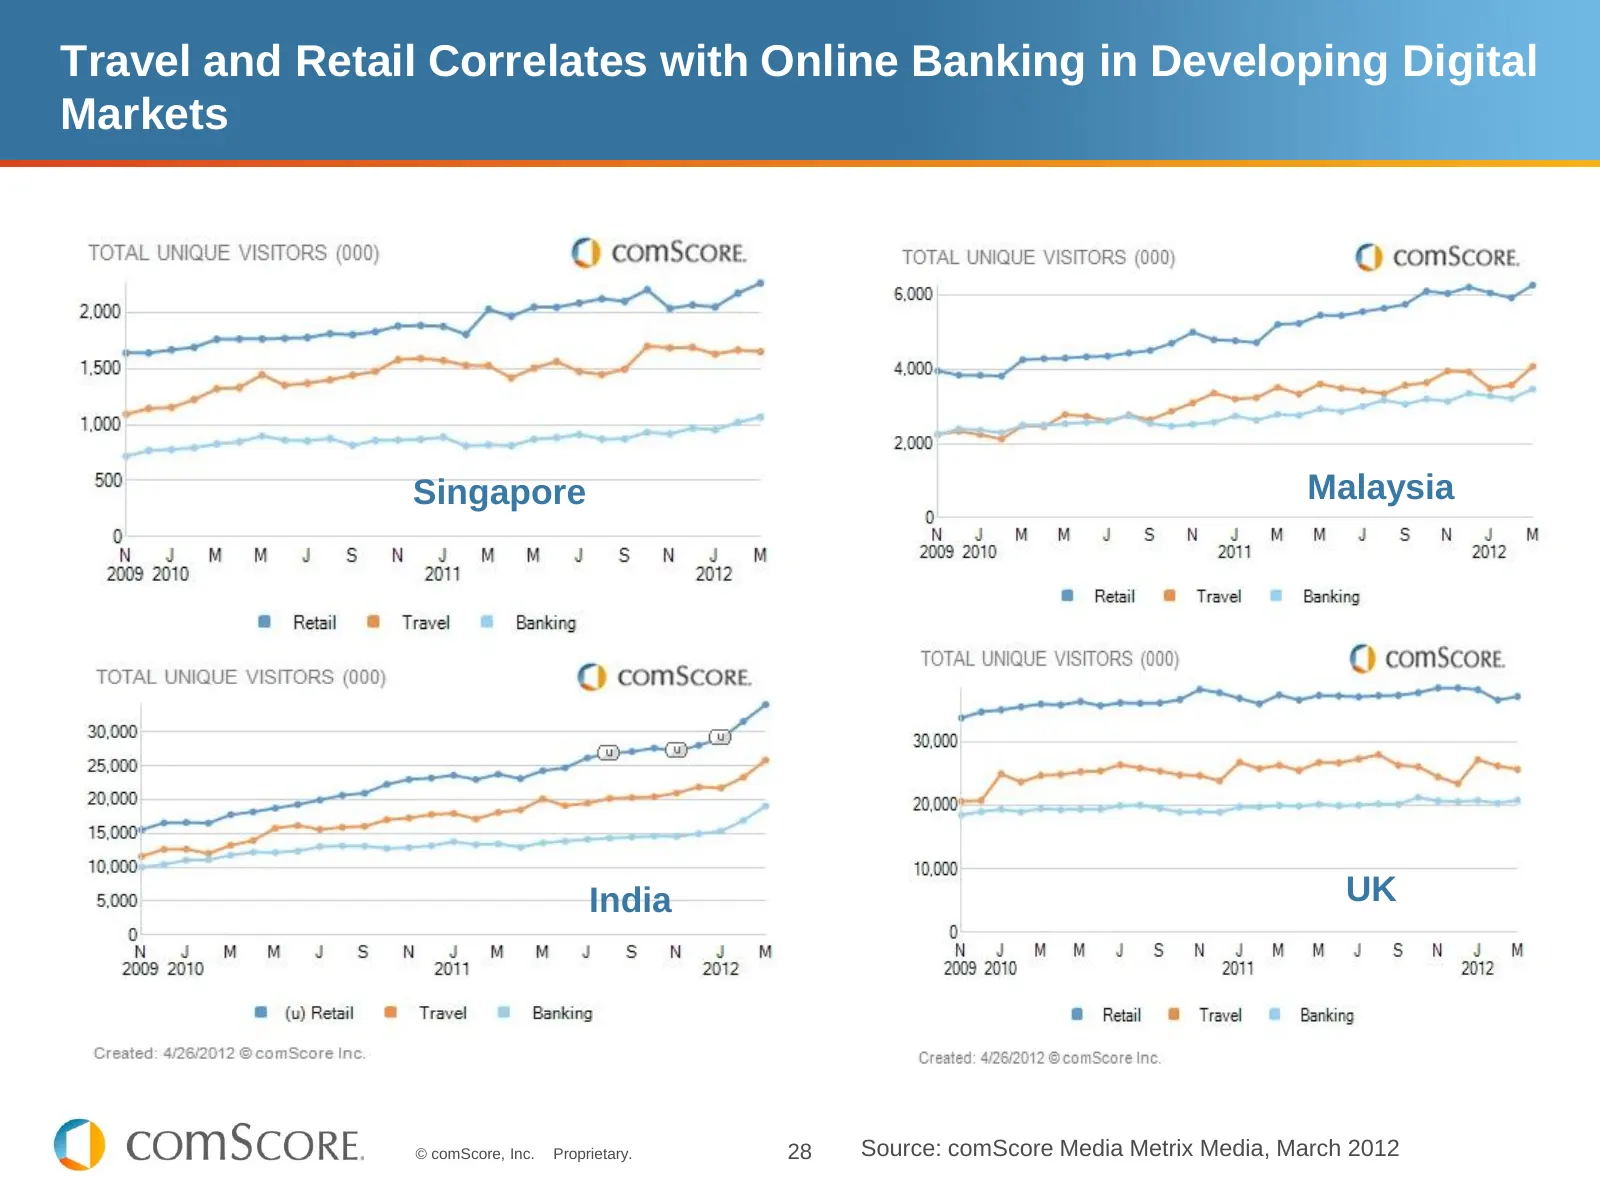
Slide 28: Travel and Retail Correlates with Online Banking in Developing Digital Markets
Travel and Retail Correlates with Online Banking in Developing Digital Markets Singapore Malaysia India UK © comScore, Inc. Proprietary. 28 Source: comScore Media Metrix Media, March 2012

Slide 29: Online Video
ONLINE VIDEO © comScore, Inc. Proprietary. 29
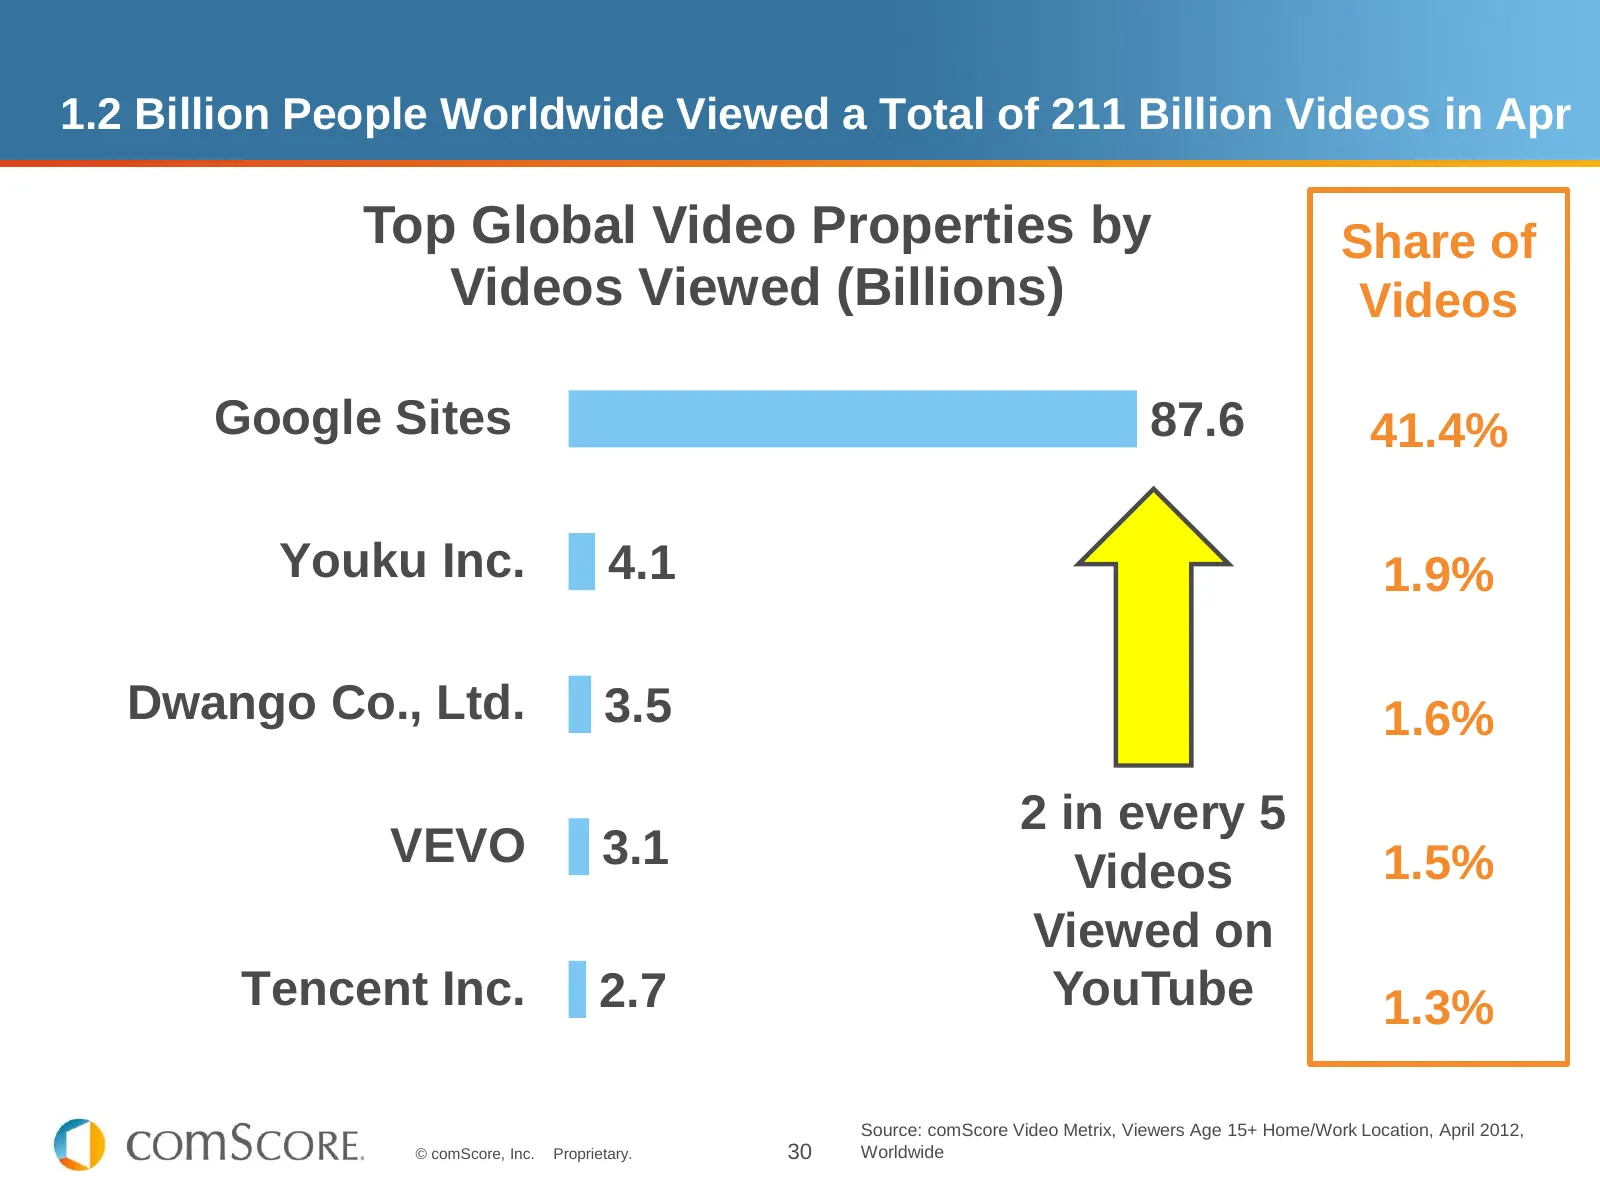
Slide 30: 1.2 Billion People Worldwide Viewed Online Videos in April
1.2 Billion People Worldwide Viewed a Total of 211 Billion Videos in Apr Top Global Video Properties by Share of Videos Viewed (Billions) Videos Google Sites 87.6 41.4% Youku Inc. 4.1 1.9% Dwango Co., Ltd. 3.5 1.6% 2 in every 5 VEVO 3.1 1.5% Videos Viewed on Tencent Inc. 2.7 YouTube 1.3% Source: com
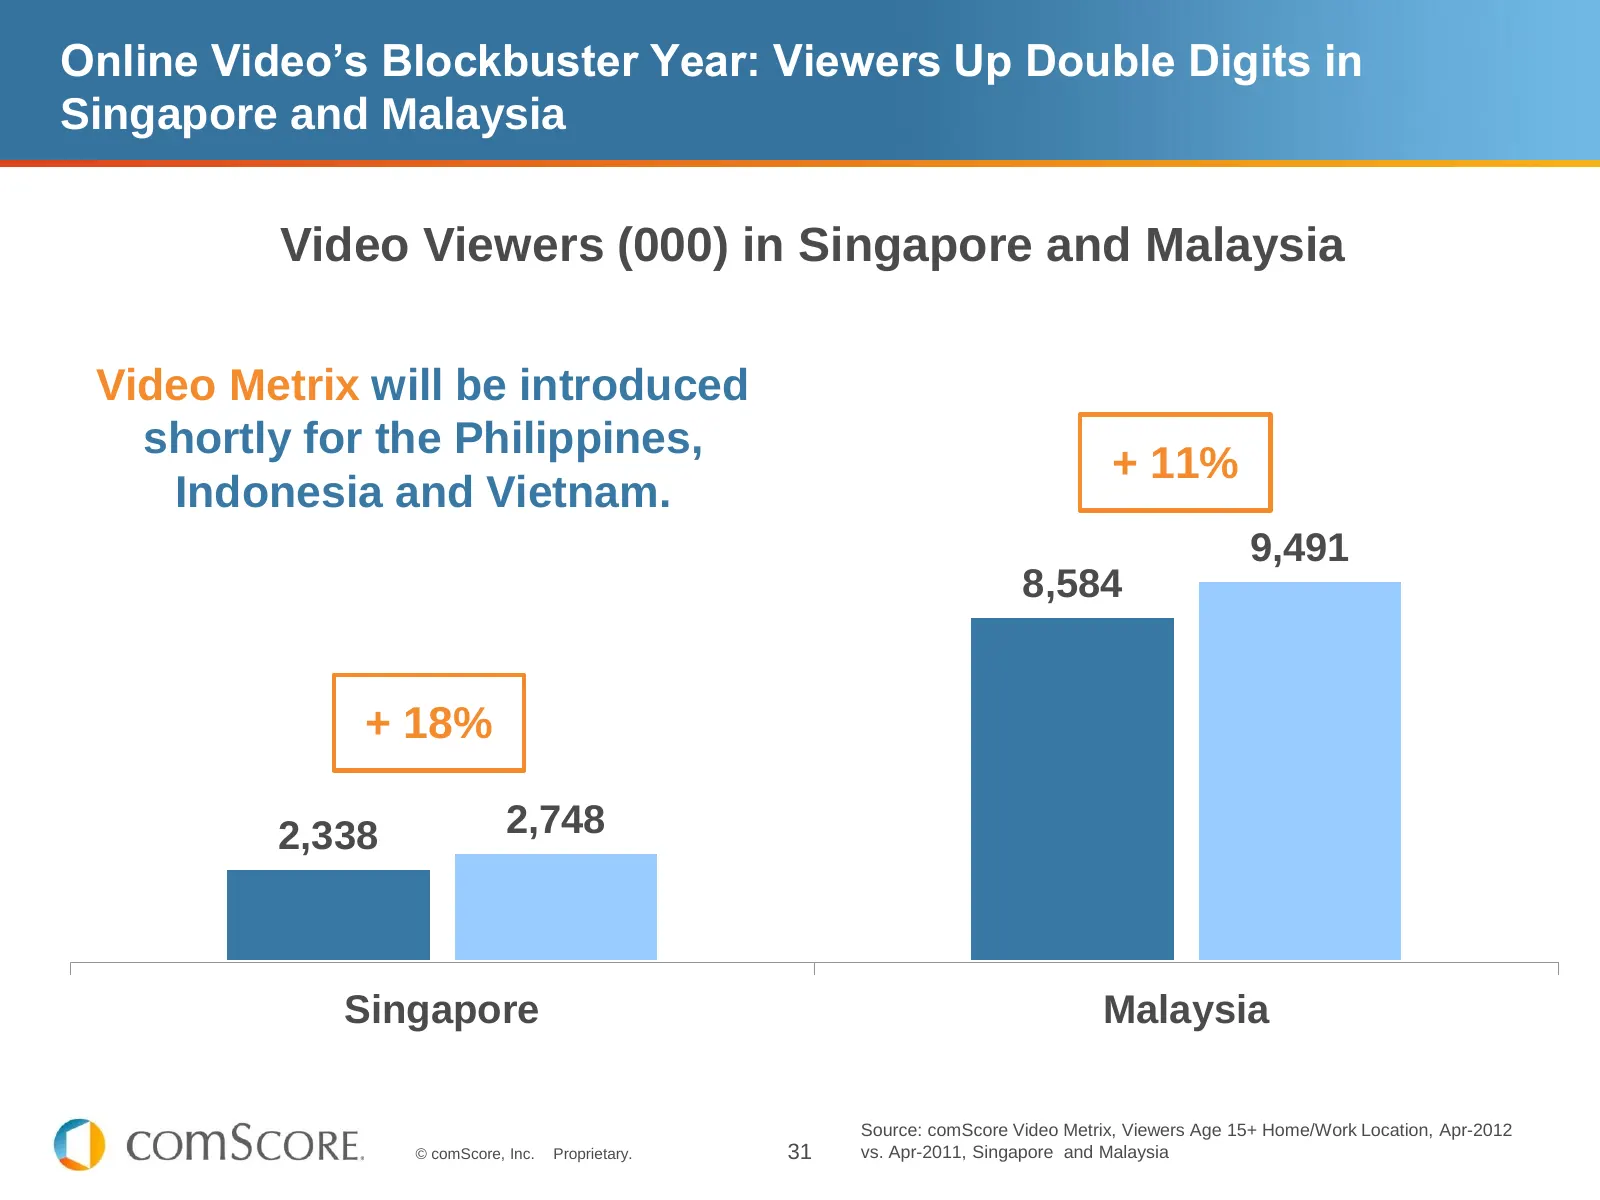
Slide 31: Online Video's Blockbuster Year: Viewers Up in Singapore and Malaysia
Online Video’s Blockbuster Year: Viewers Up Double Digits in Singapore and Malaysia Video Viewers (000) in Singapore and Malaysia Video Metrix will be introduced shortly for the Philippines, + 11% Indonesia and Vietnam. 9,491 8,584 + 18% 2,338 2,748 Singapore Malaysia Source: comScore Video Metrix,
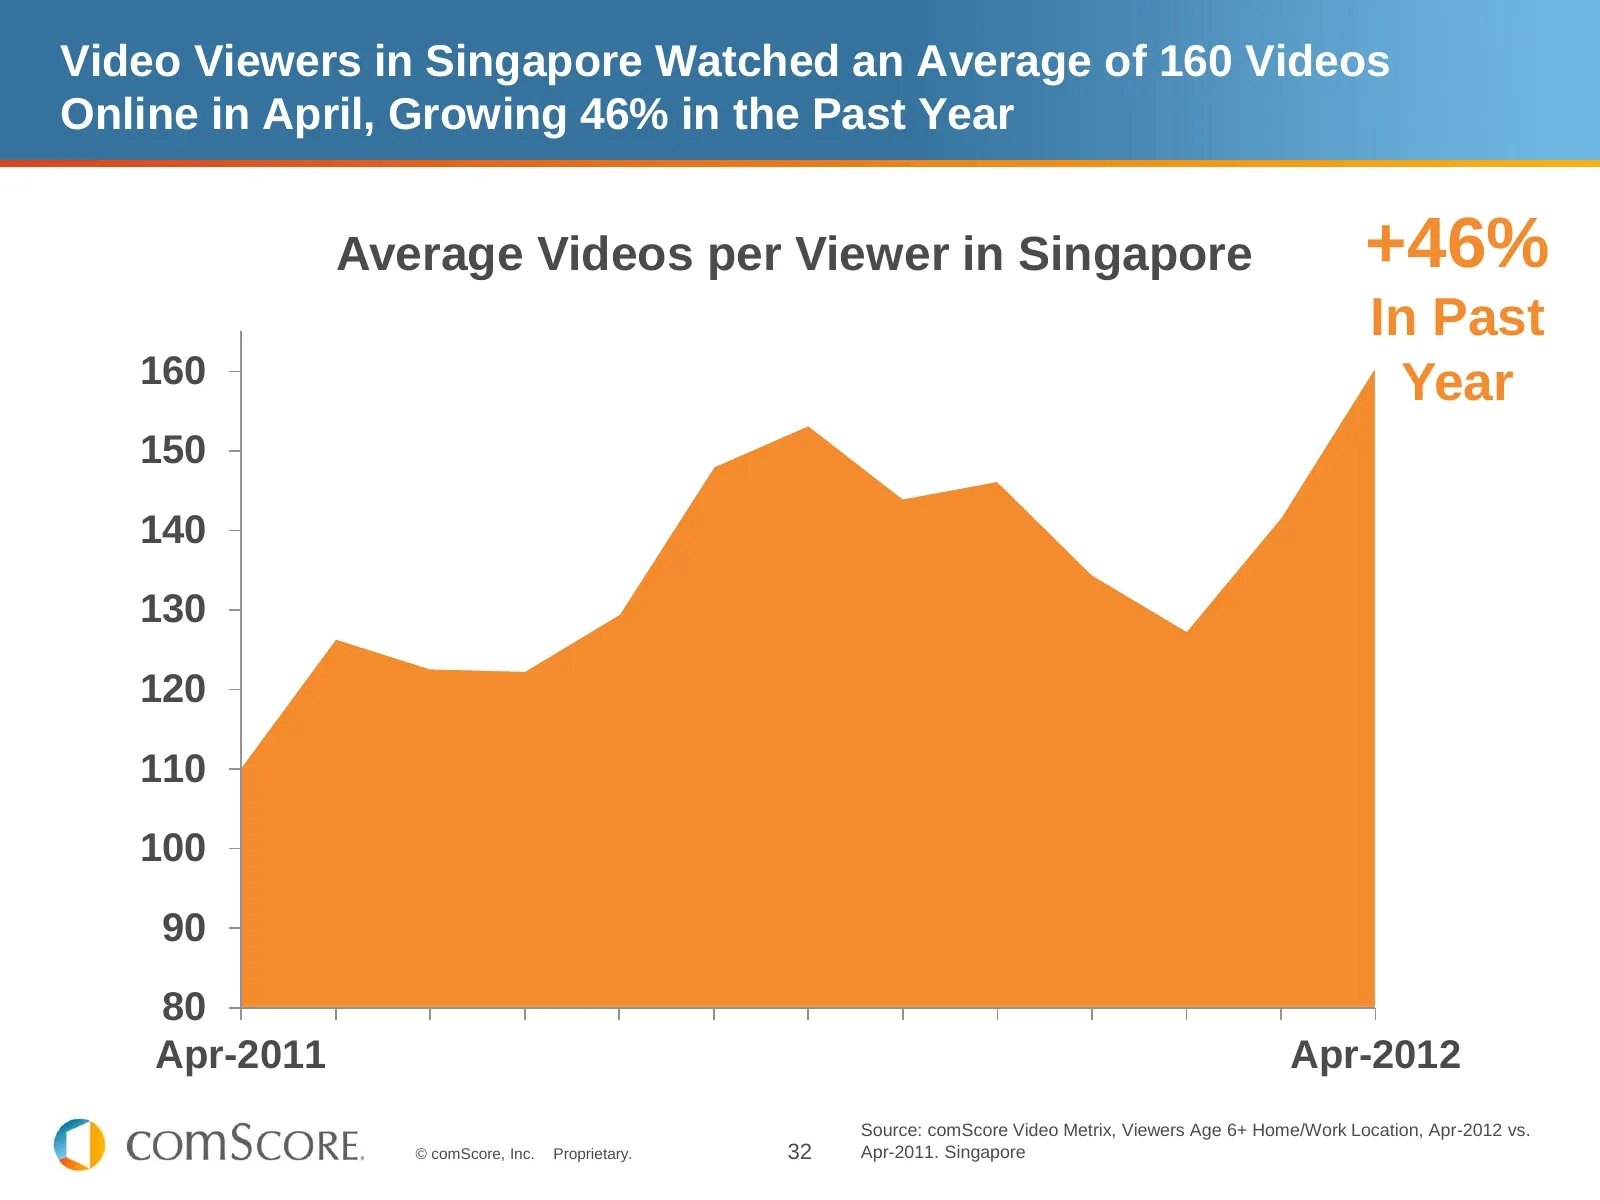
Slide 32: Video Viewers in Singapore Watched More Videos, Growing 46%
Video Viewers in Singapore Watched an Average of 160 Videos Online in April, Growing 46% in the Past Year Average Videos per Viewer in Singapore +46% In Past 160 Year 150 140 130 120 110 100 90 80 Apr-2011 Apr-2012 Source: comScore Video Metrix, Viewers Age 6+ Home/Work Location, Apr-2012 vs. © comS
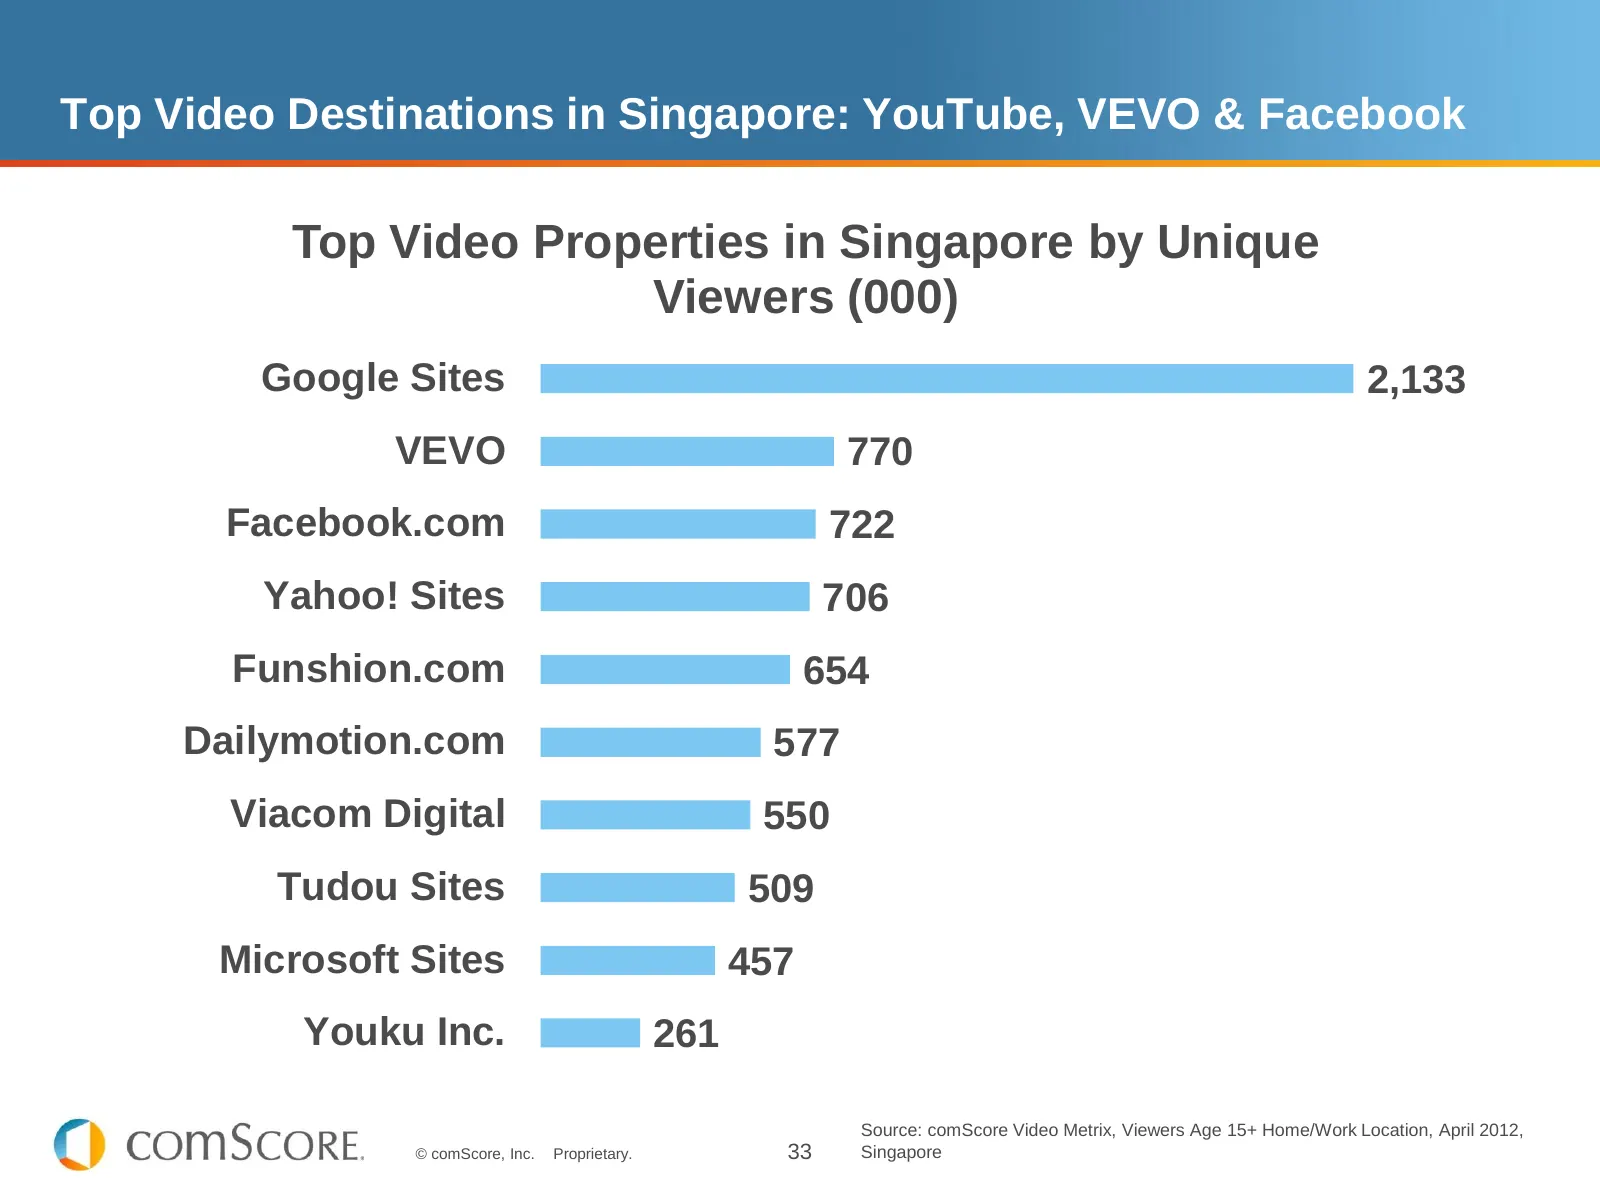
Slide 33: Top Video Destinations in Singapore: YouTube, VEVO & Facebook
Top Video Destinations in Singapore: YouTube, VEVO & Facebook Top Video Properties in Singapore by Unique Viewers (000) Google Sites 2,133 VEVO 770 Facebook.com 722 Yahoo! Sites 706 Funshion.com 654 Dailymotion.com 577 Viacom Digital 550 Tudou Sites 509 Microsoft Sites 457 Youku Inc. 261 Source: com
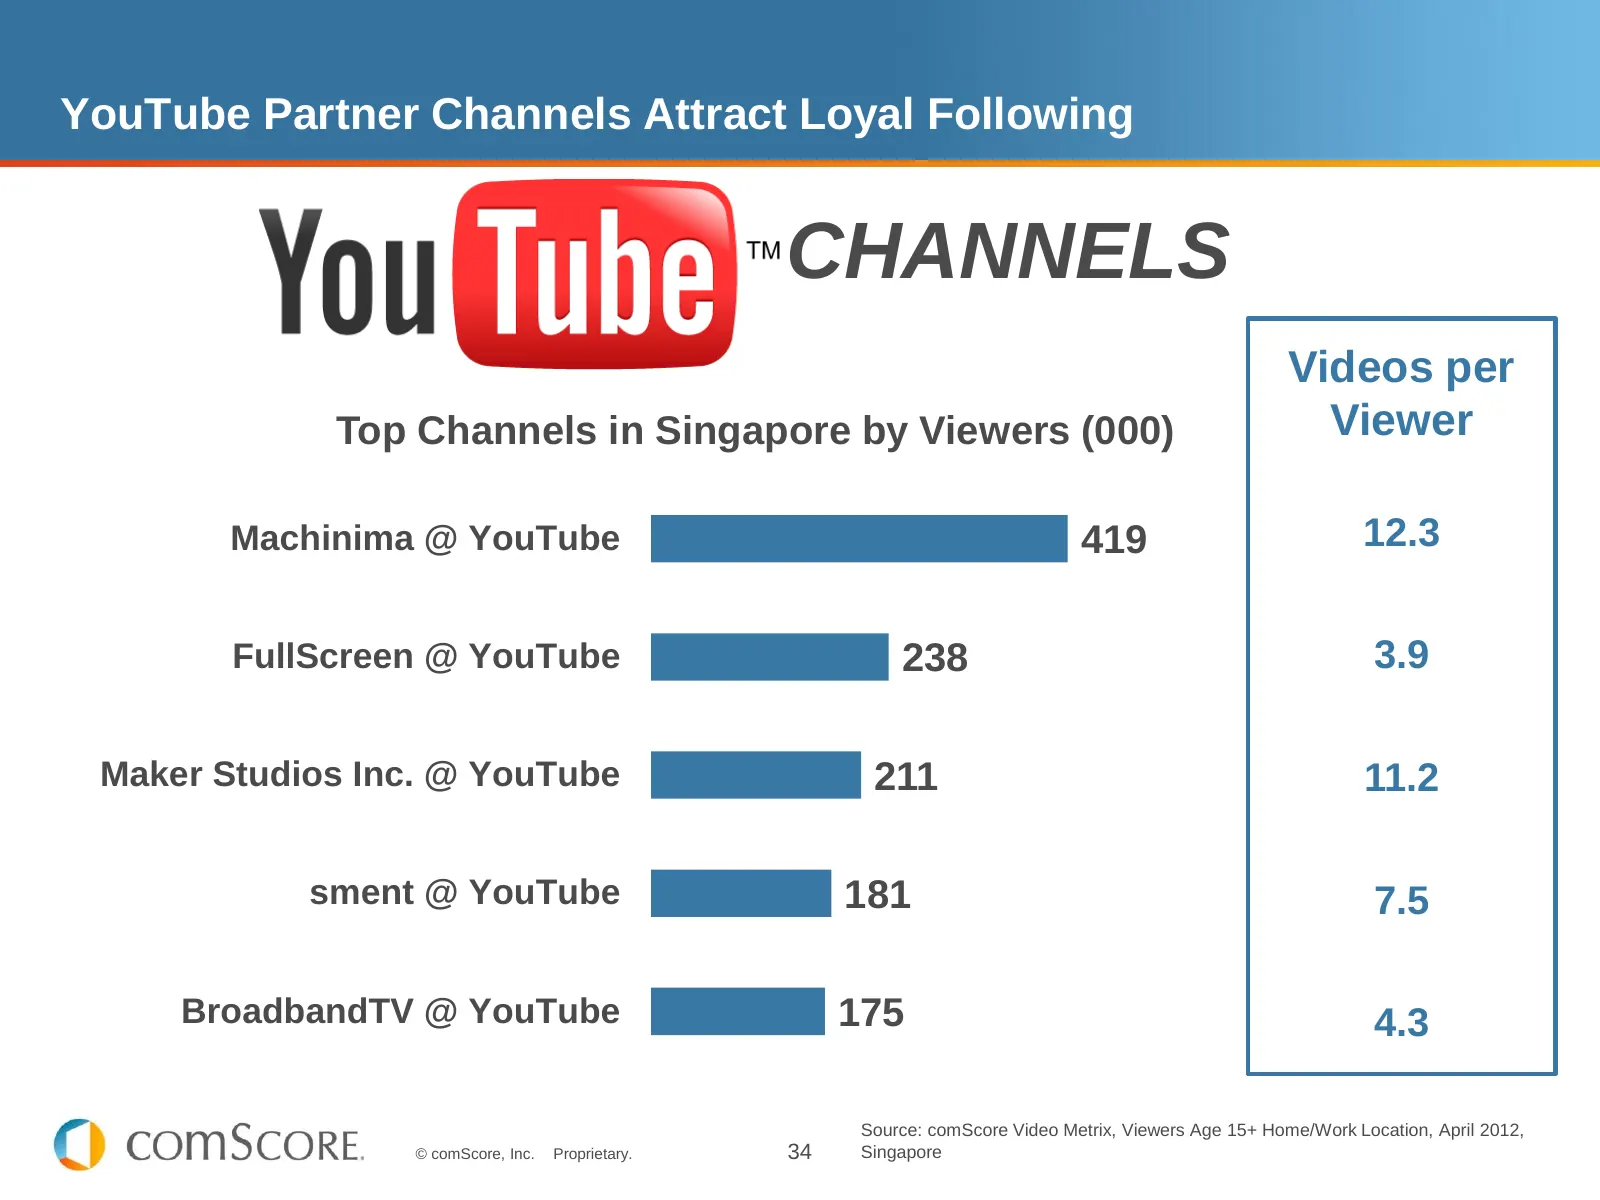
Slide 34: YouTube Partner Channels Attract Loyal Following
YouTube Partner Channels Attract Loyal Following CHANNELS Videos per Top Channels in Singapore by Viewers (000) Viewer Machinima @ YouTube 419 12.3 FullScreen @ YouTube 238 3.9 Maker Studios Inc. @ YouTube 211 11.2 sment @ YouTube 181 7.5 BroadbandTV @ YouTube 175 4.3 Source: comScore Video Metrix,

Slide 35: Mobile
MOBILE © comScore, Inc. Proprietary. 35
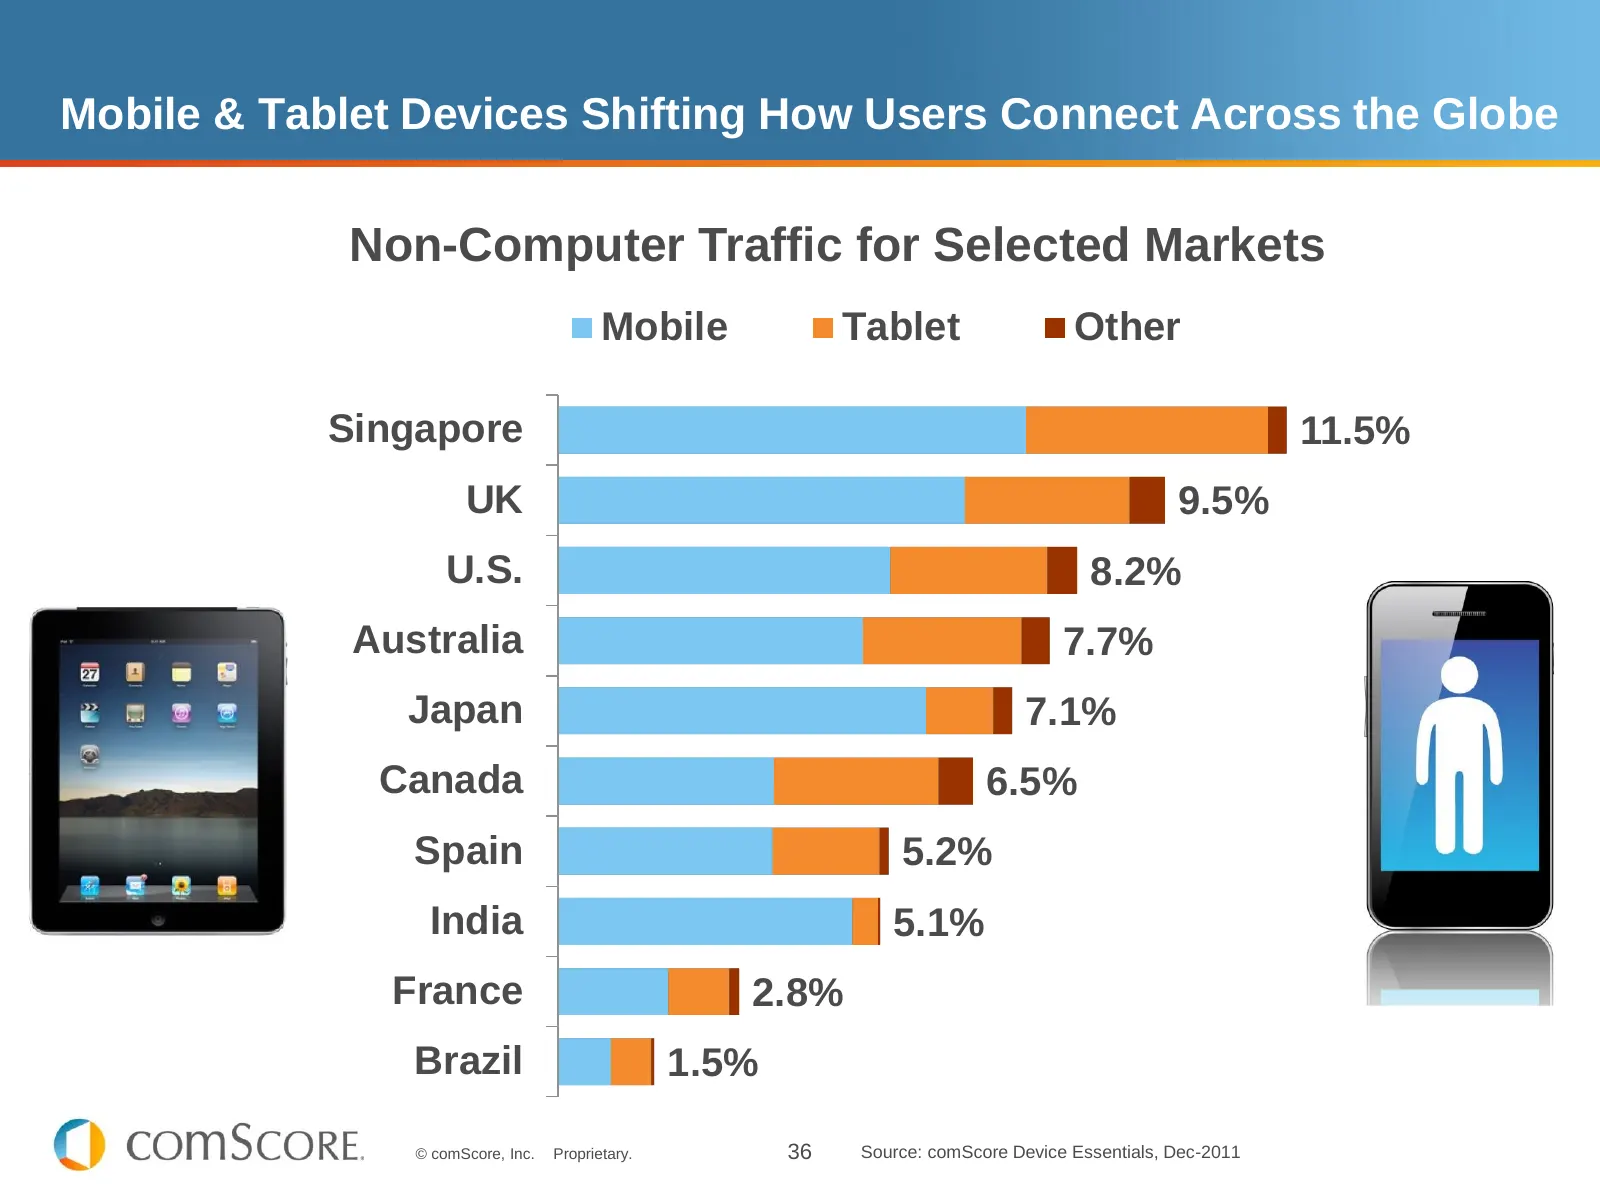
Slide 36: Mobile & Tablet Devices Shifting How Users Connect
Mobile & Tablet Devices Shifting How Users Connect Across the Globe Non-Computer Traffic for Selected Markets Mobile Tablet Other Singapore 11.5% UK 9.5% U.S. 8.2% Australia 7.7% Japan 7.1% Canada 6.5% Spain 5.2% India 5.1% France 2.8% Brazil 1.5% © comScore, Inc. Proprietary. 36 Source: comScore De
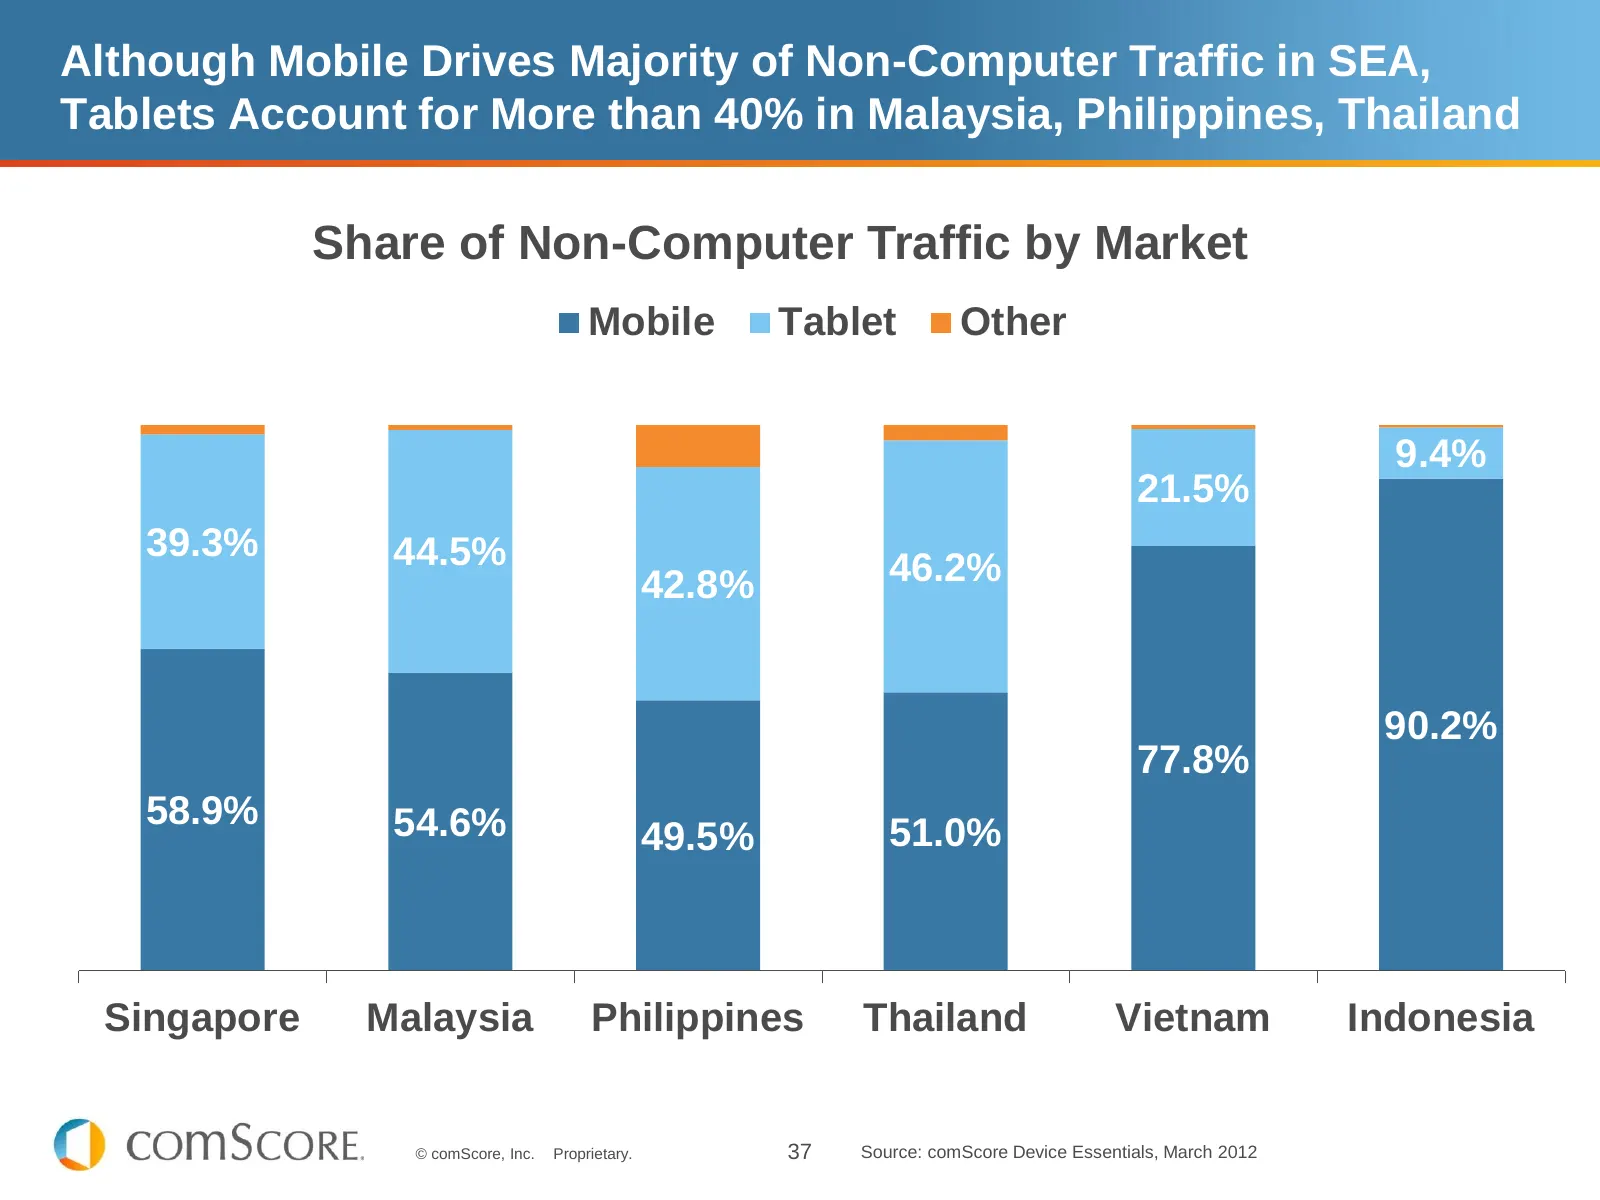
Slide 37: Mobile Drives Majority of Non-Computer Traffic in SEA
Although Mobile Drives Majority of Non-Computer Traffic in SEA, Tablets Account for More than 40% in Malaysia, Philippines, Thailand Share of Non-Computer Traffic by Market Mobile Tablet Other 9.4% 21.5% 39.3% 44.5% 42.8% 46.2% 90.2% 77.8% 58.9% 54.6% 49.5% 51.0% Singapore Malaysia Philippines Thail
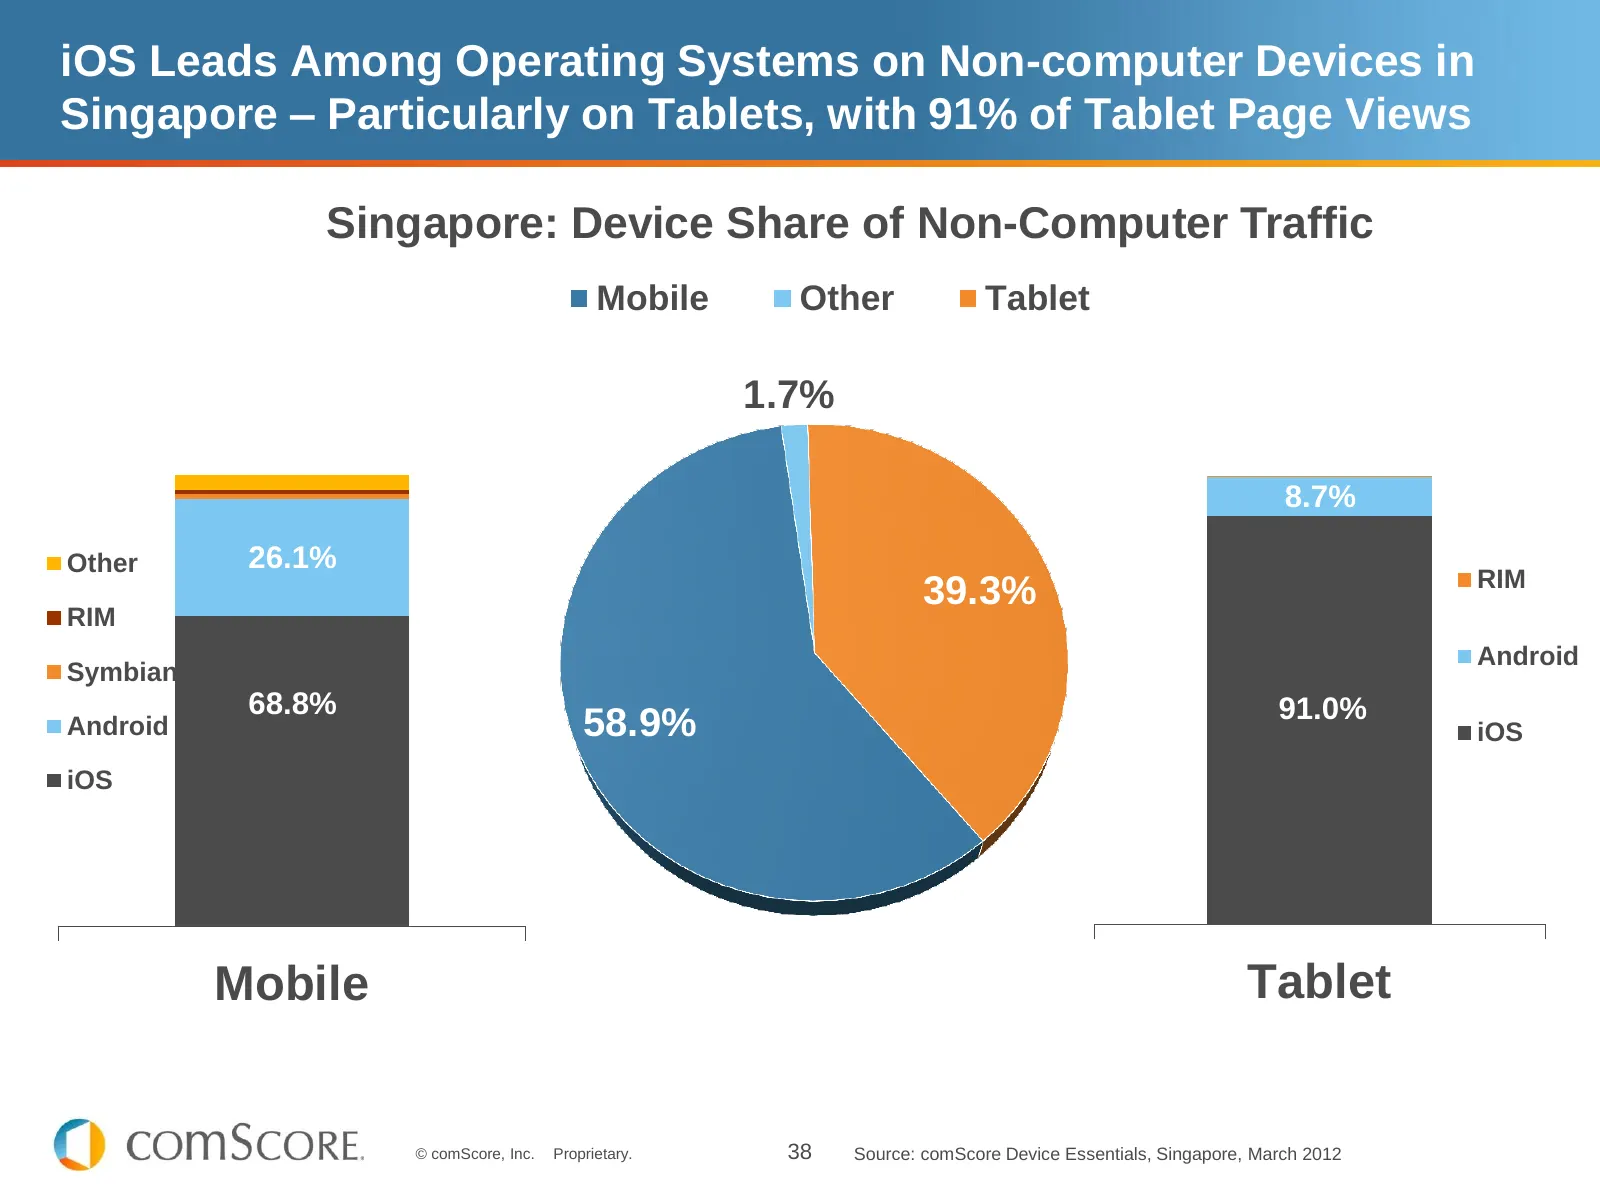
Slide 38: iOS Leads Among Operating Systems on Non-computer Devices in Singapore
iOS Leads Among Operating Systems on Non-computer Devices in Singapore – Particularly on Tablets, with 91% of Tablet Page Views Singapore: Device Share of Non-Computer Traffic Mobile Other Tablet 1.7% 8.7% Other 26.1% RIM 39.3% RIM Android Symbian 68.8% 91.0% Android 58.9% iOS iOS Mobile Tablet © co
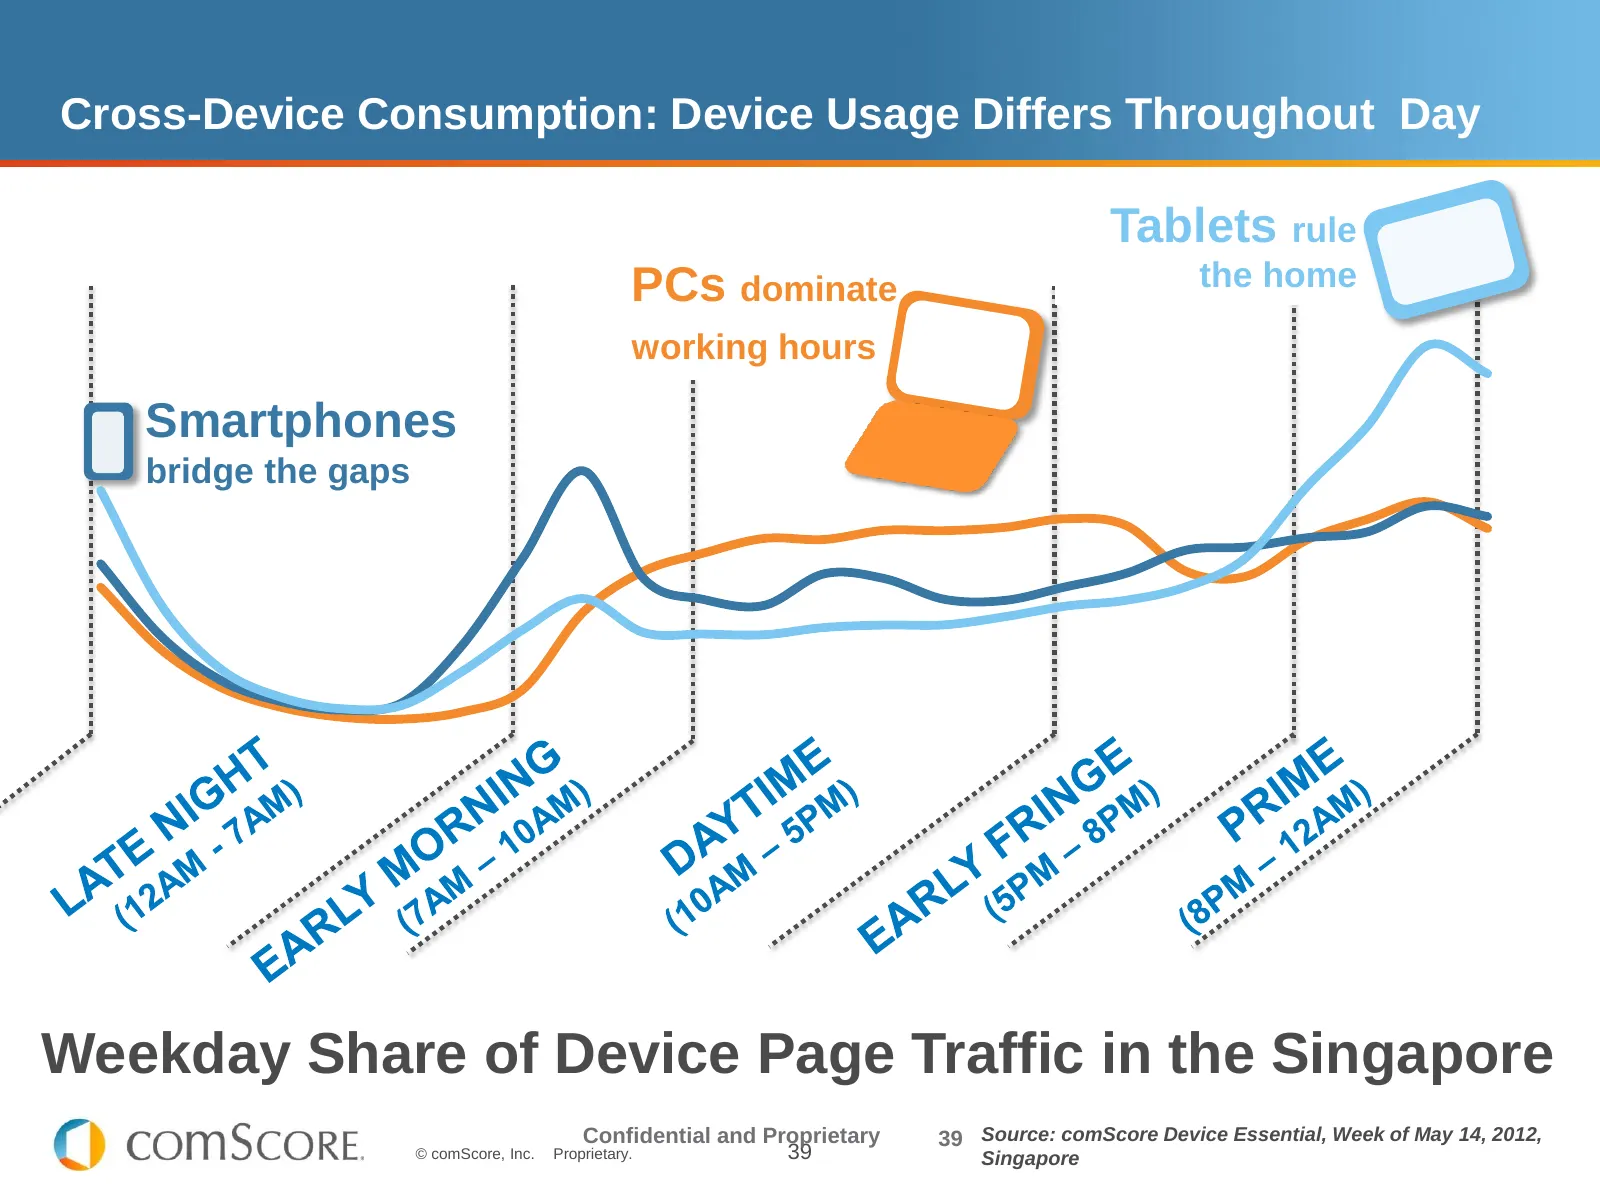
Slide 39: Cross-Device Consumption: Device Usage Differs Throughout Day
Cross-Device Consumption: Device Usage Differs Throughout Day Tablets rule PCs dominate the home working hours Smartphones bridge the gaps Weekday Share of Device Page Traffic in the Singapore Confidential and Proprietary 39 Source: comScore Device Essential, Week of May 14, 2012, © comScore, Inc. P
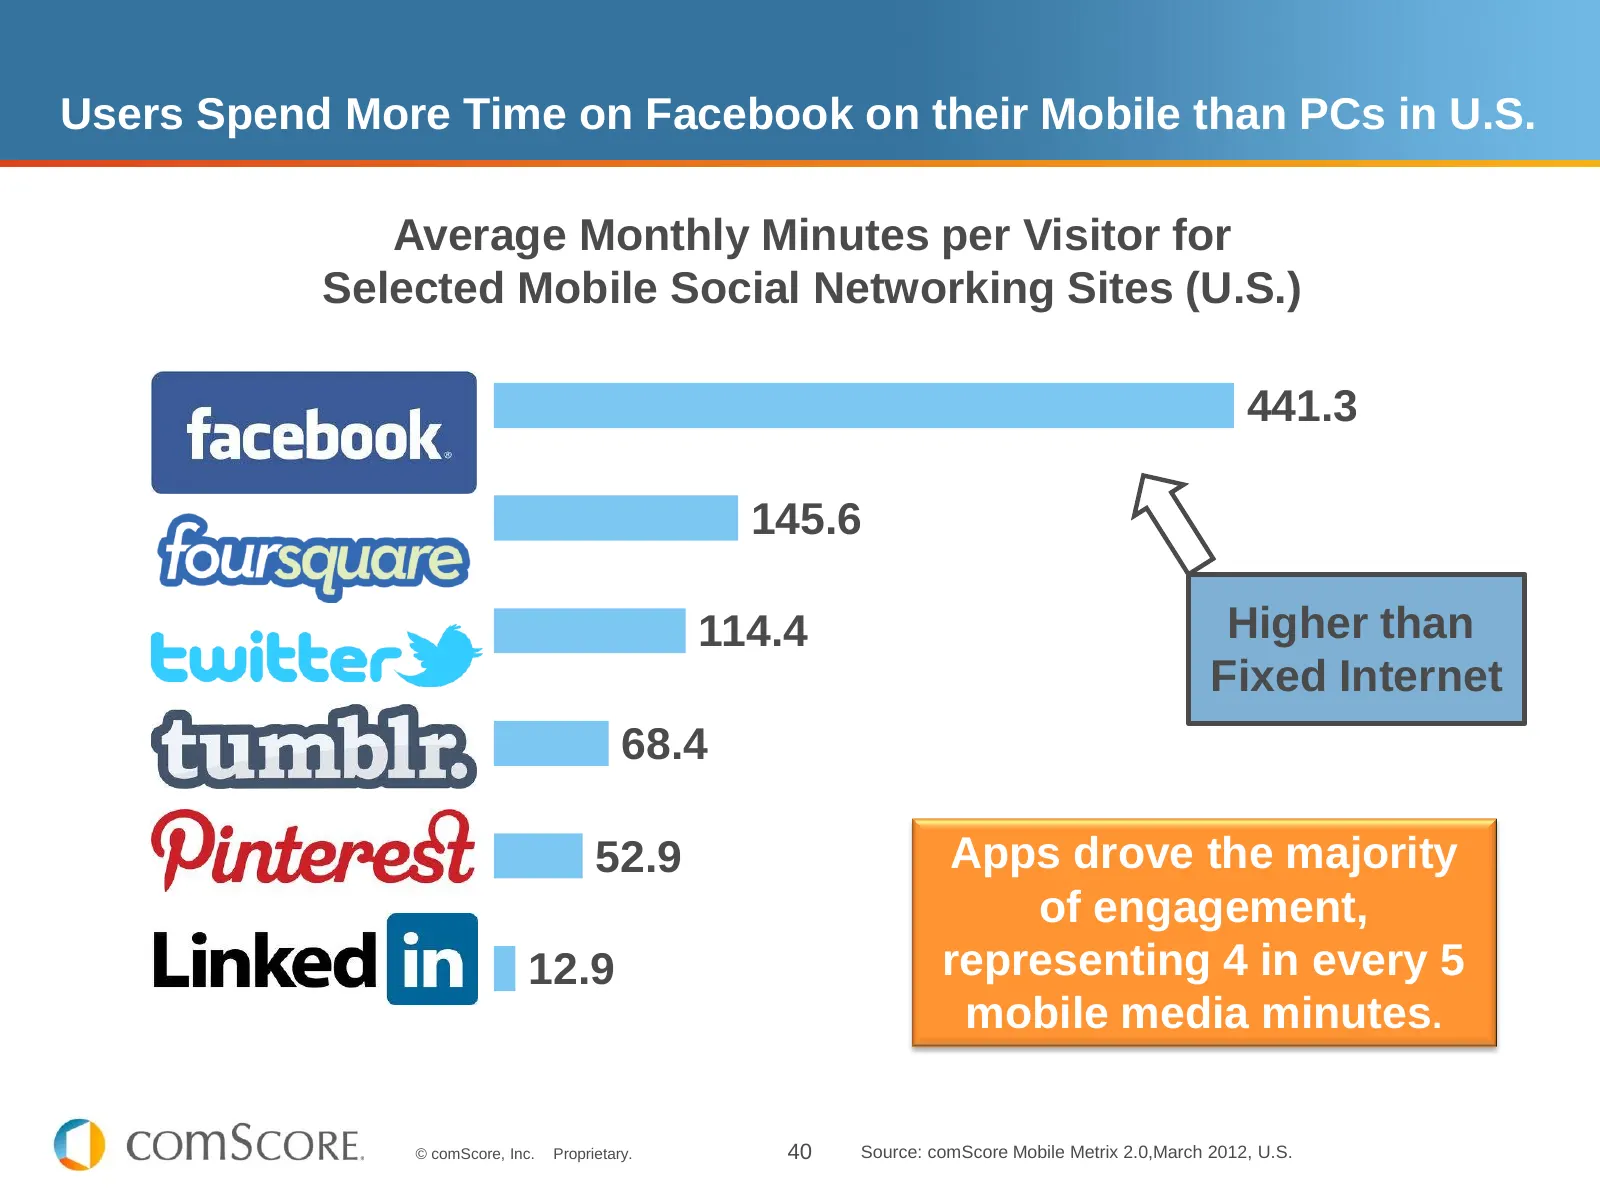
Slide 40: Users Spend More Time on Facebook on Mobile than PCs in U.S.
Users Spend More Time on Facebook on their Mobile than PCs in U.S. Average Monthly Minutes per Visitor for Selected Mobile Social Networking Sites (U.S.) 441.3 145.6 114.4 Higher than Fixed Internet 68.4 52.9 Apps drove the majority of engagement, 12.9 representing 4 in every 5 mobile media minutes.

Slide 41: Digital Advertising
DIGITAL ADVERTISING © comScore, Inc. Proprietary. 41
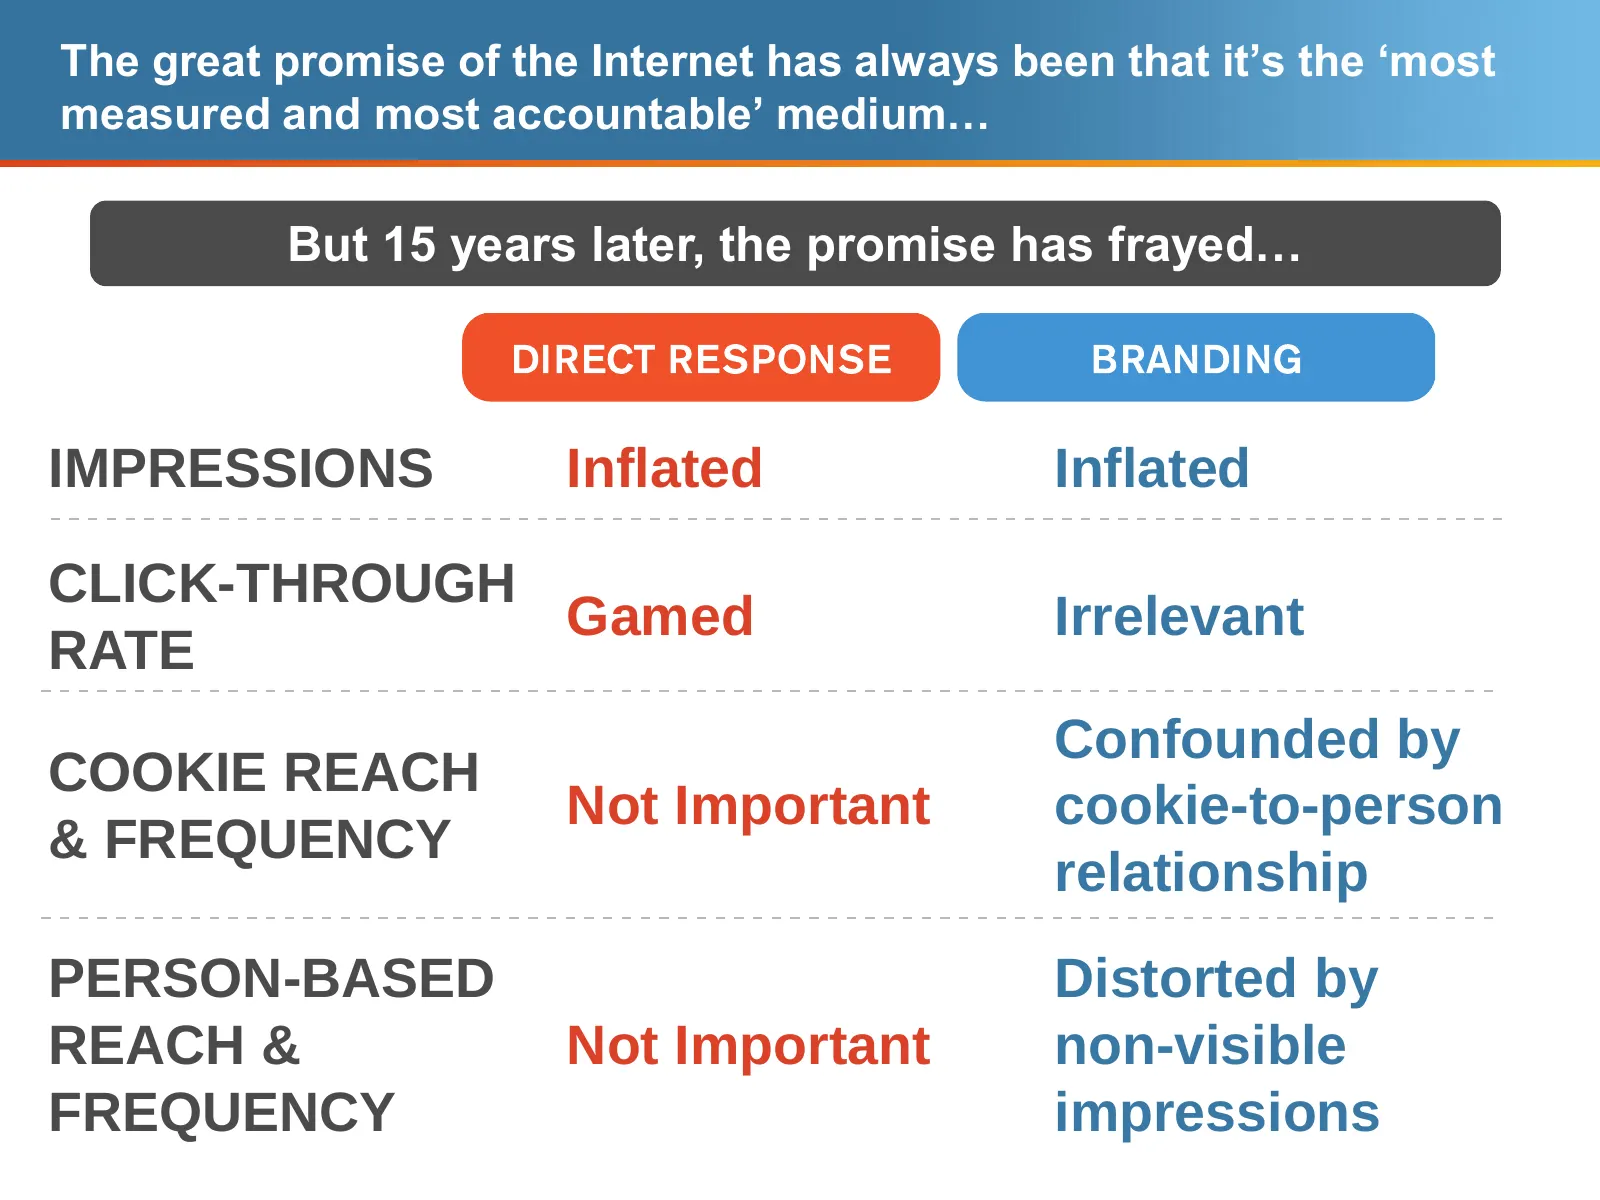
Slide 42: The Promise of the Internet as Most Measured Medium Has Frayed
The great promise of the Internet has always been that it’s the ‘most measured and most accountable’ medium… But 15 years later, the promise has frayed… IMPRESSIONS Inflated Inflated CLICK-THROUGH Gamed Irrelevant RATE Confounded by COOKIE REACH Not Important cookie-to-person & FREQUENCY relationshi
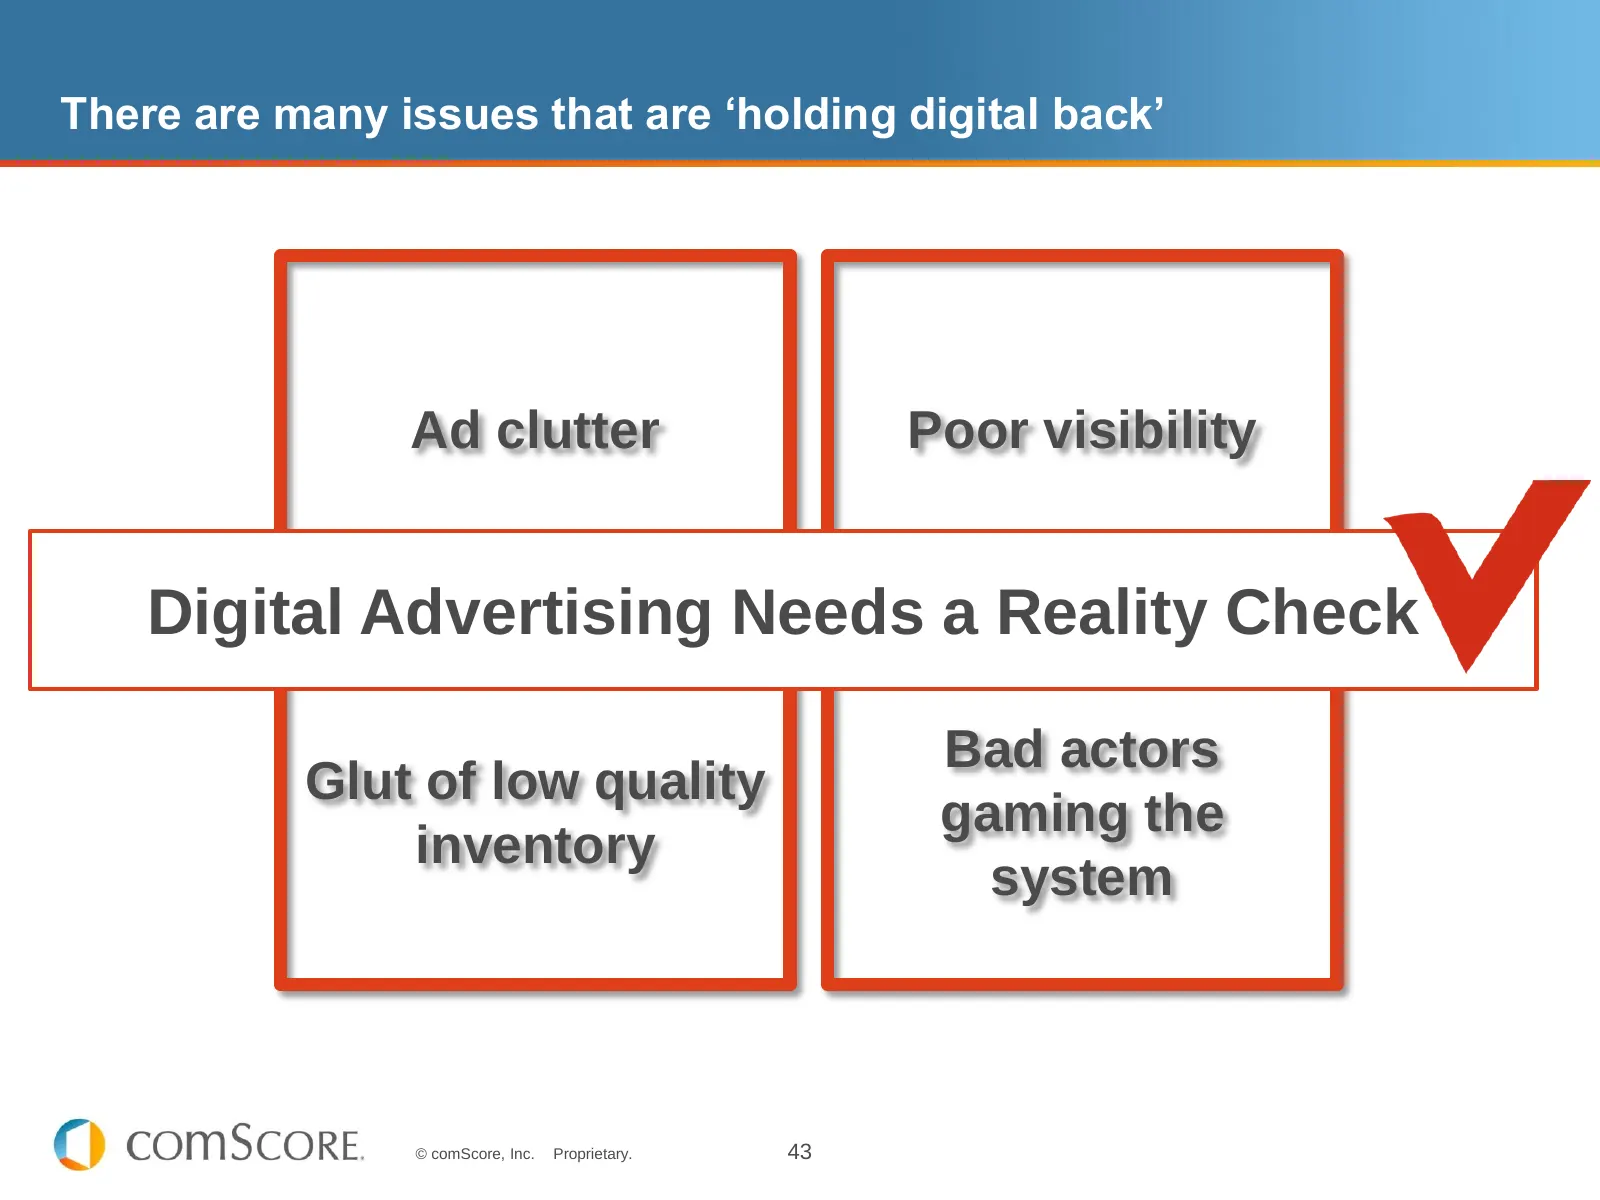
Slide 43: Digital Advertising Needs a Reality Check
There are many issues that are ‘holding digital back’ Ad clutter Poor visibility Digital Advertising Needs a Reality Check Bad actors Glut of low quality gaming the inventory system © comScore, Inc. Proprietary. 43
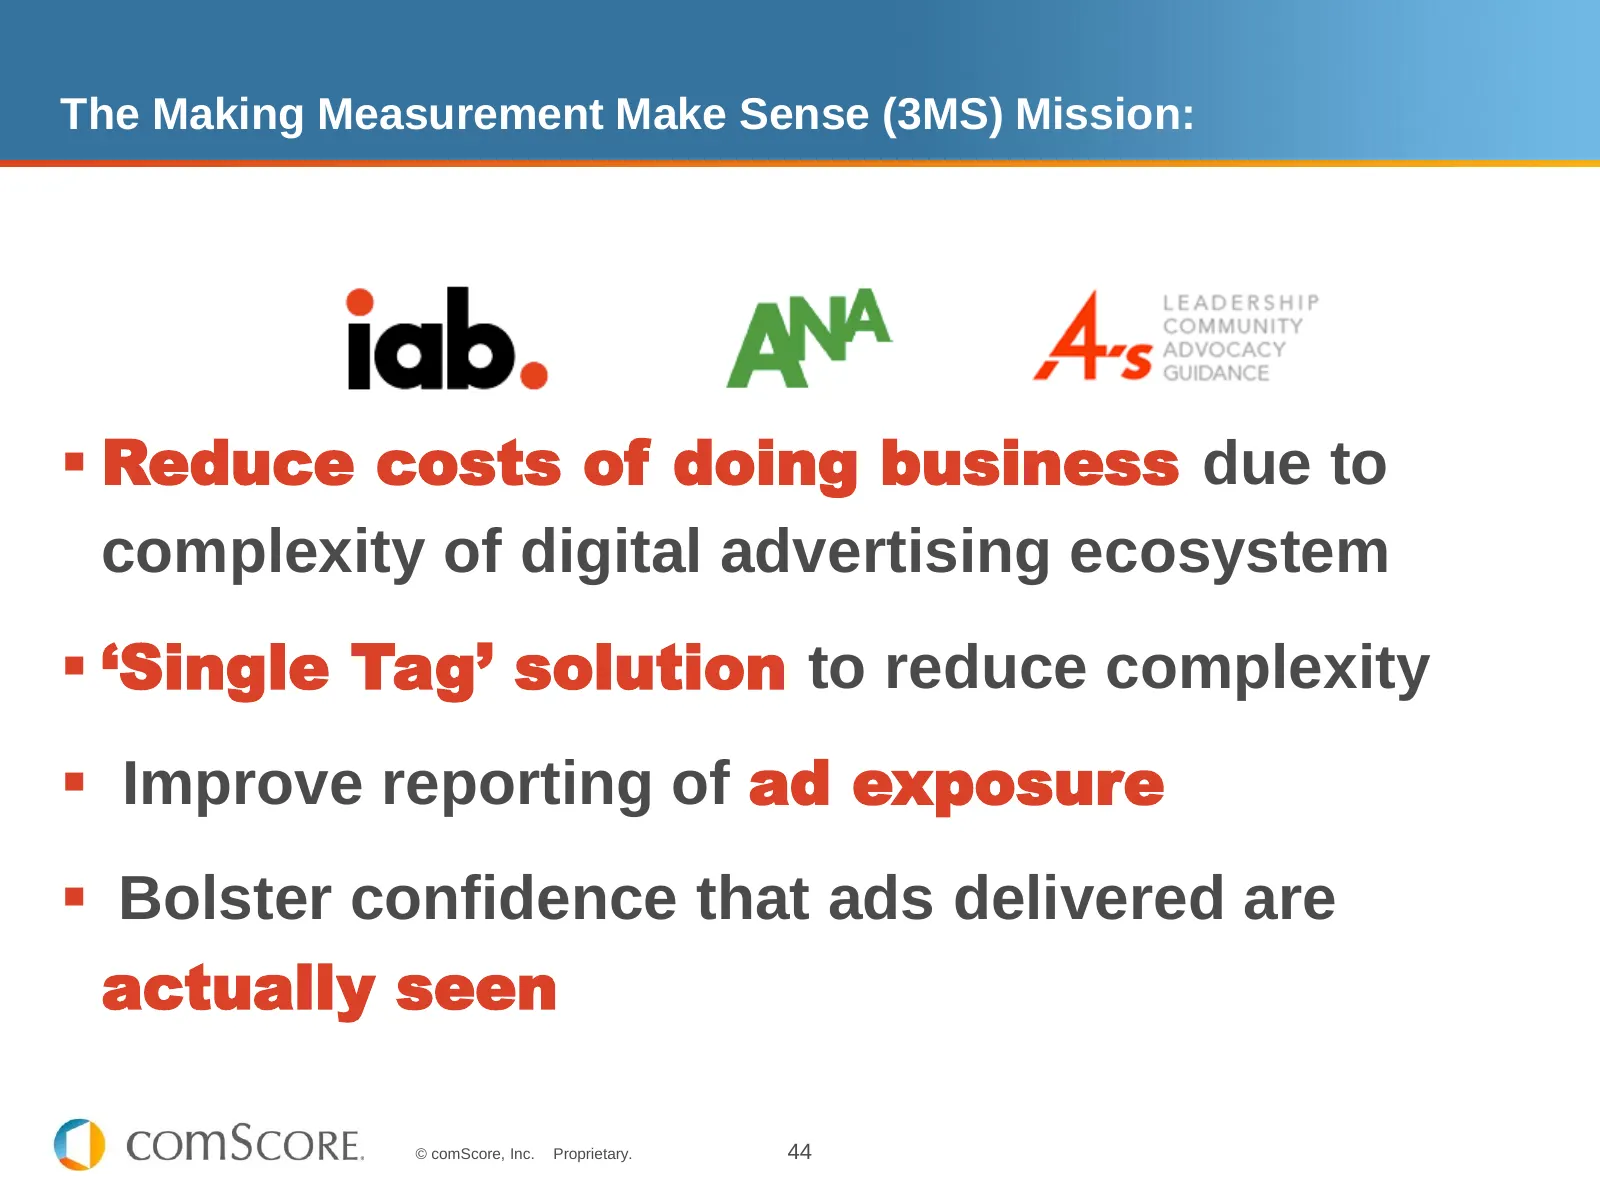
Slide 44: The Making Measurement Make Sense (3MS) Mission
The Making Measurement Make Sense (3MS) Mission: Reduce costs of doing business due to complexity of digital advertising ecosystem ‘Single Tag’ solution to reduce complexity Improve reporting of ad exposure Bolster confidence that ads delivered are actually seen © comScore, Inc. Proprietary.
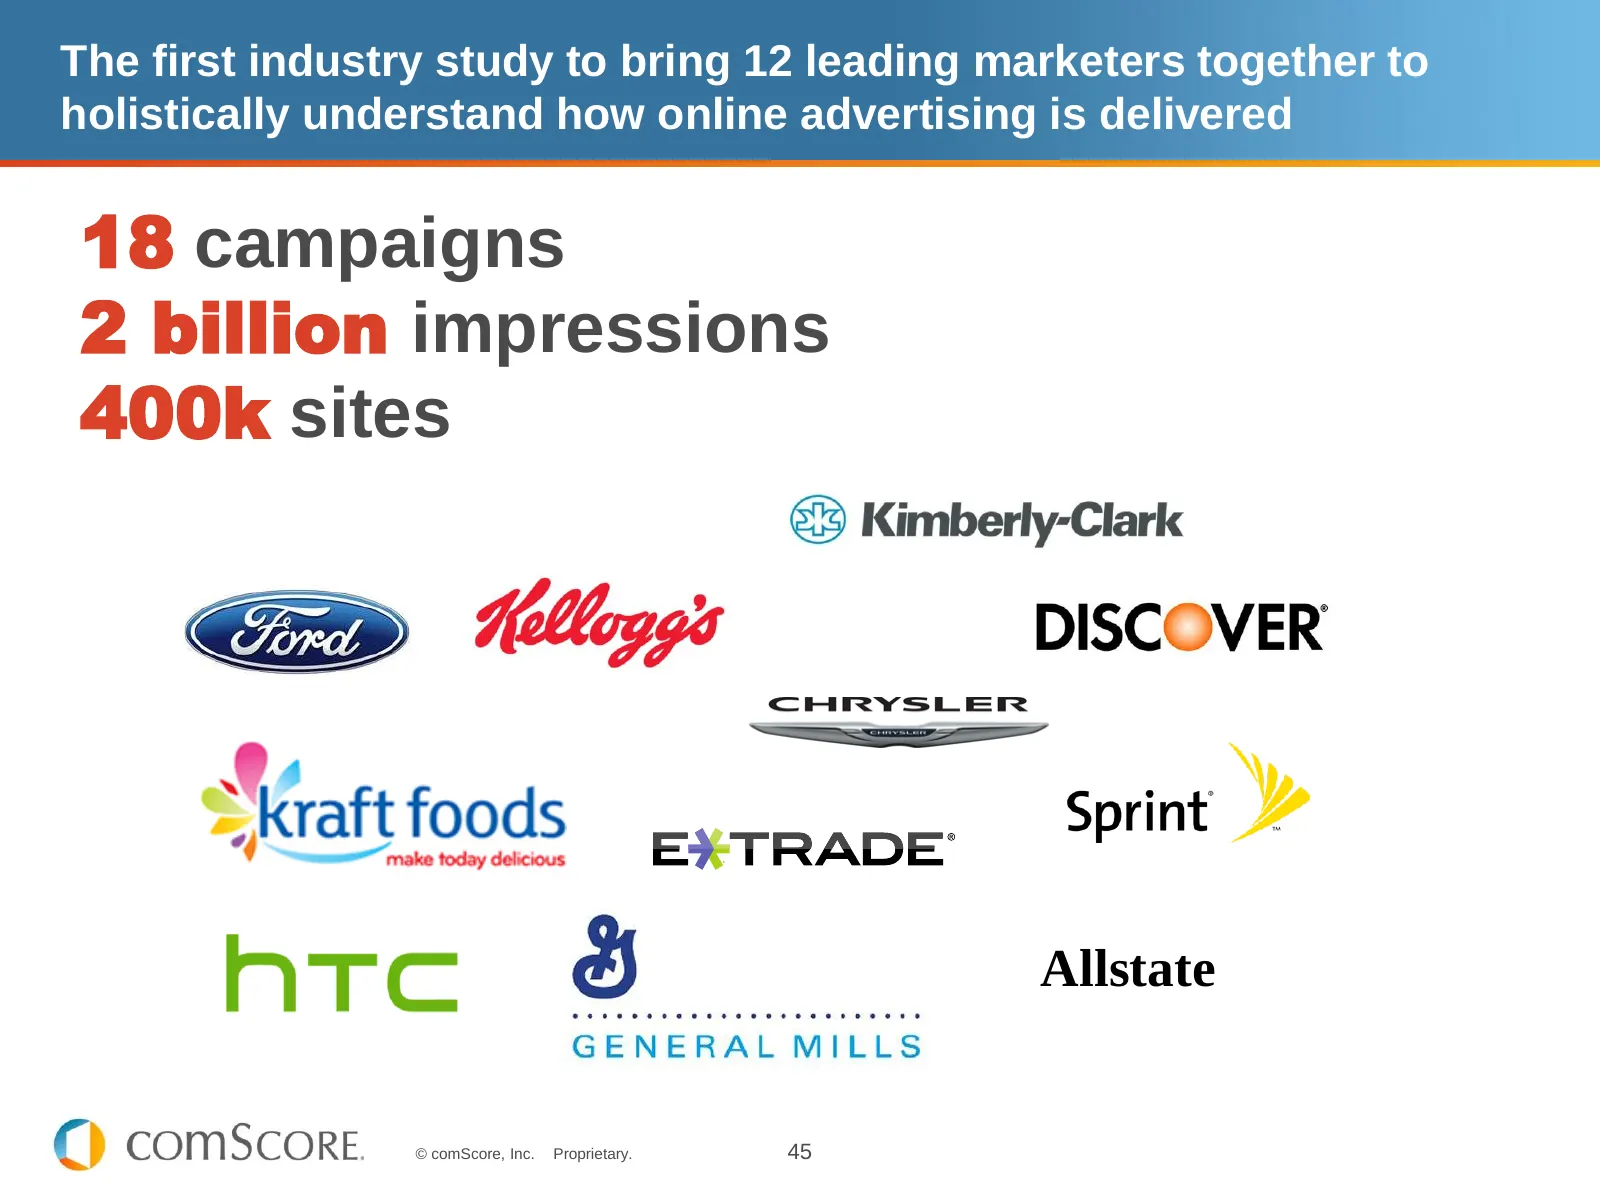
Slide 45: First Industry Study Bringing Leading Marketers Together on Ad Delivery
The first industry study to bring 12 leading marketers together to holistically understand how online advertising is delivered 18 campaigns 2 billion impressions 400k sites Allstate © comScore, Inc. Proprietary. 45
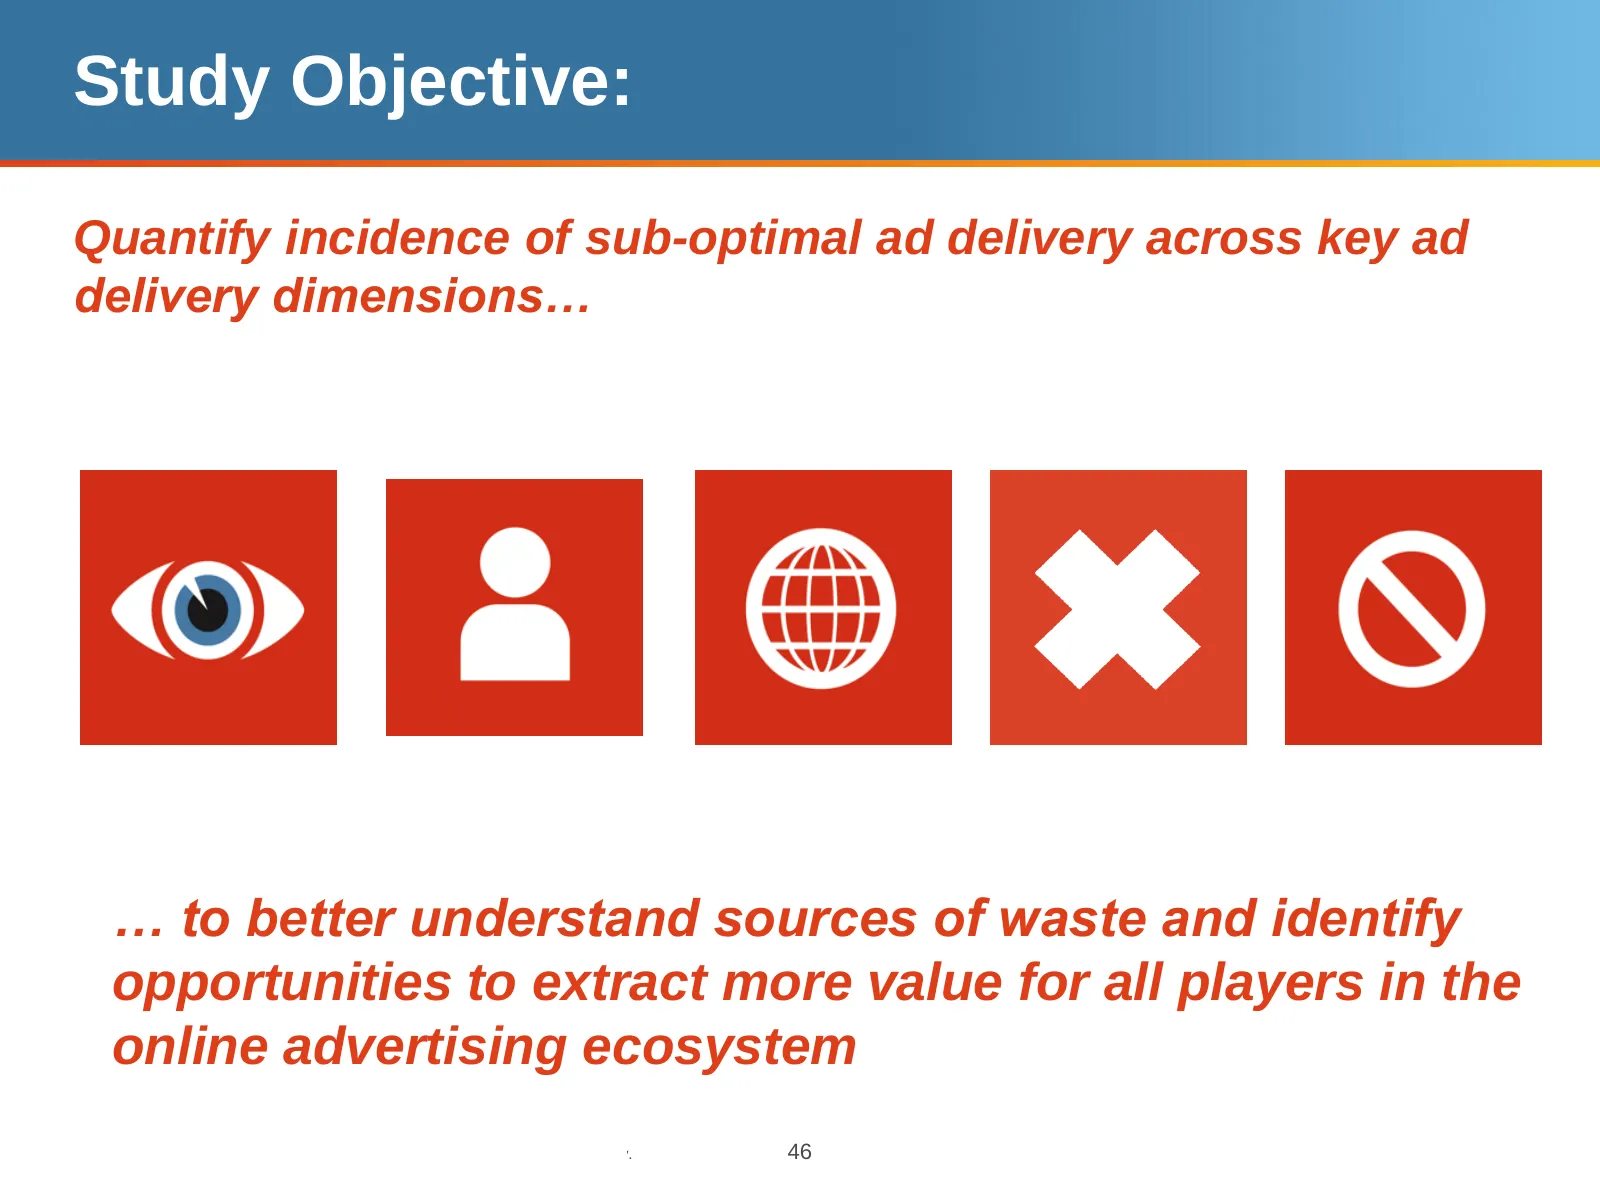
Slide 46: Study Objective
Study Objective: Quantify incidence of sub-optimal ad delivery across key ad delivery dimensions… … to better understand sources of waste and identify opportunities to extract more value for all players in the online advertising ecosystem © comScore, Inc. Proprietary. 46

Slide 47: vCE Charter Study Findings
vCE Charter Study Findings © comScore, Inc. Proprietary. 47
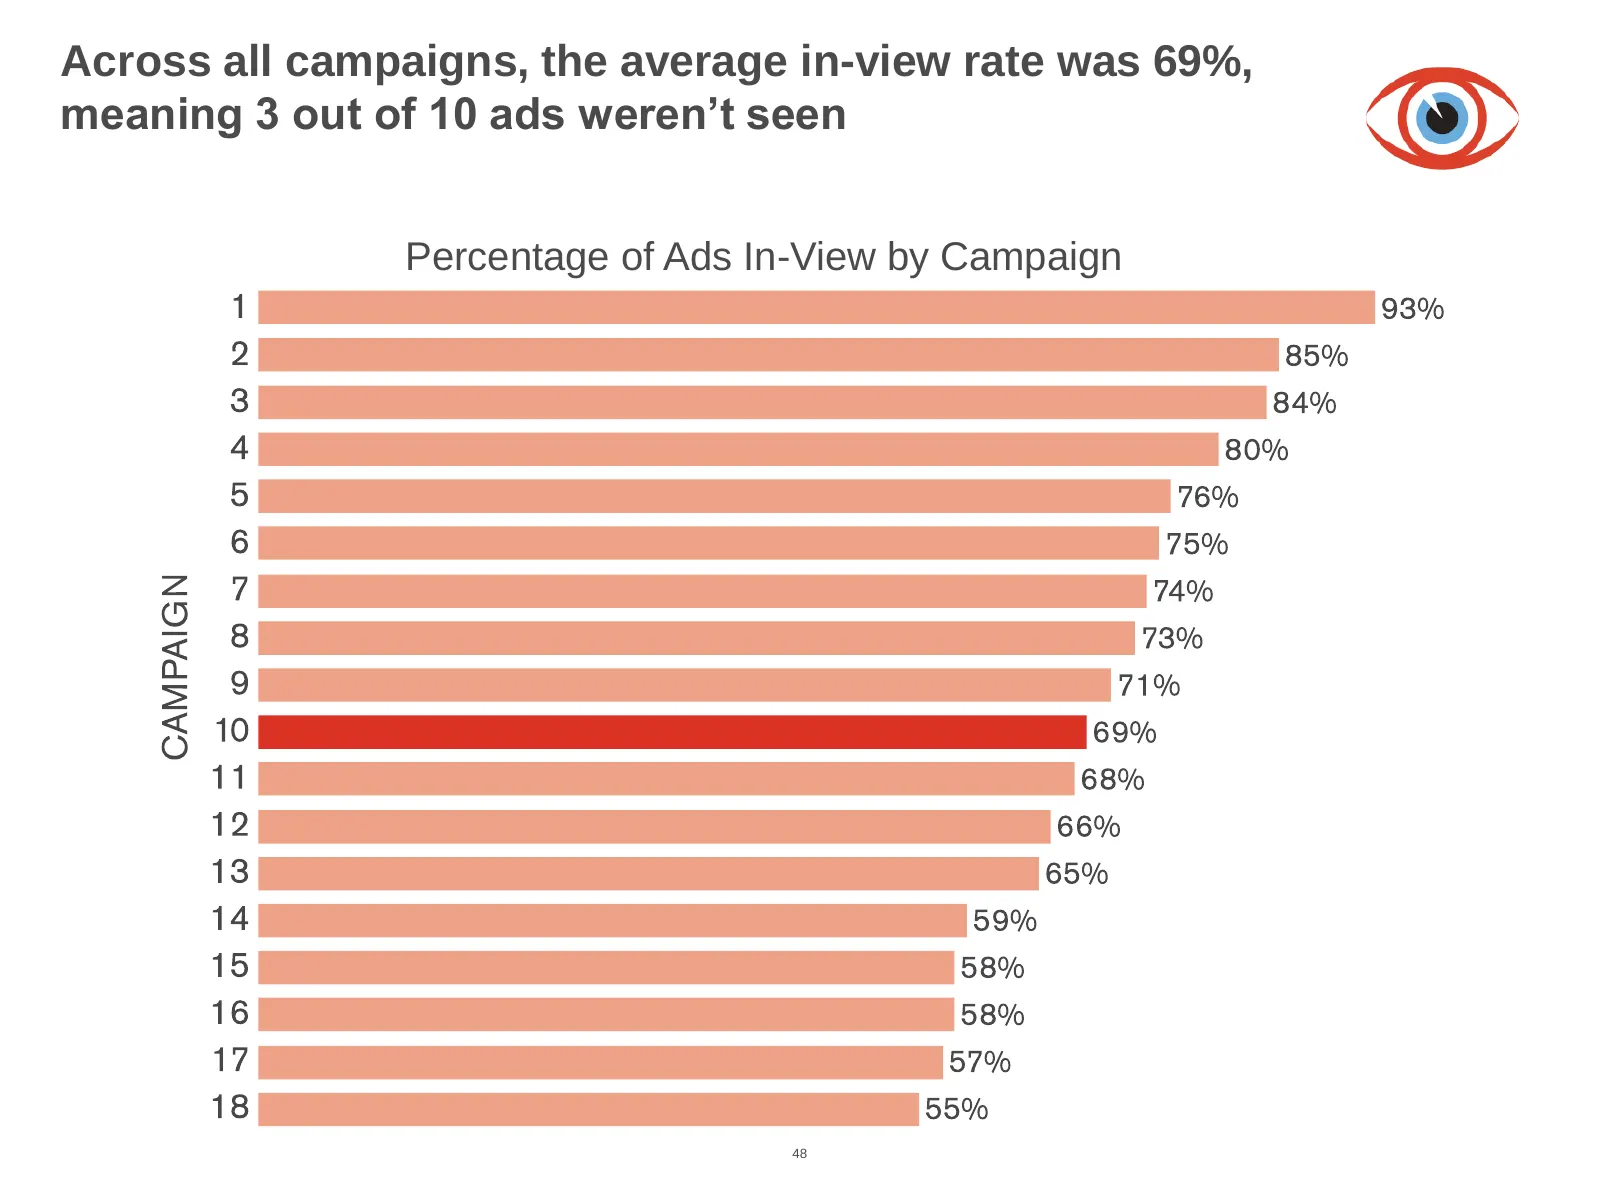
Slide 48: Average In-View Rate Was 69%, 3 out of 10 Ads Weren't Seen
Across all campaigns, the average in-view rate was 69%, meaning 3 out of 10 ads weren’t seen Percentage of Ads In-View by Campaign 48
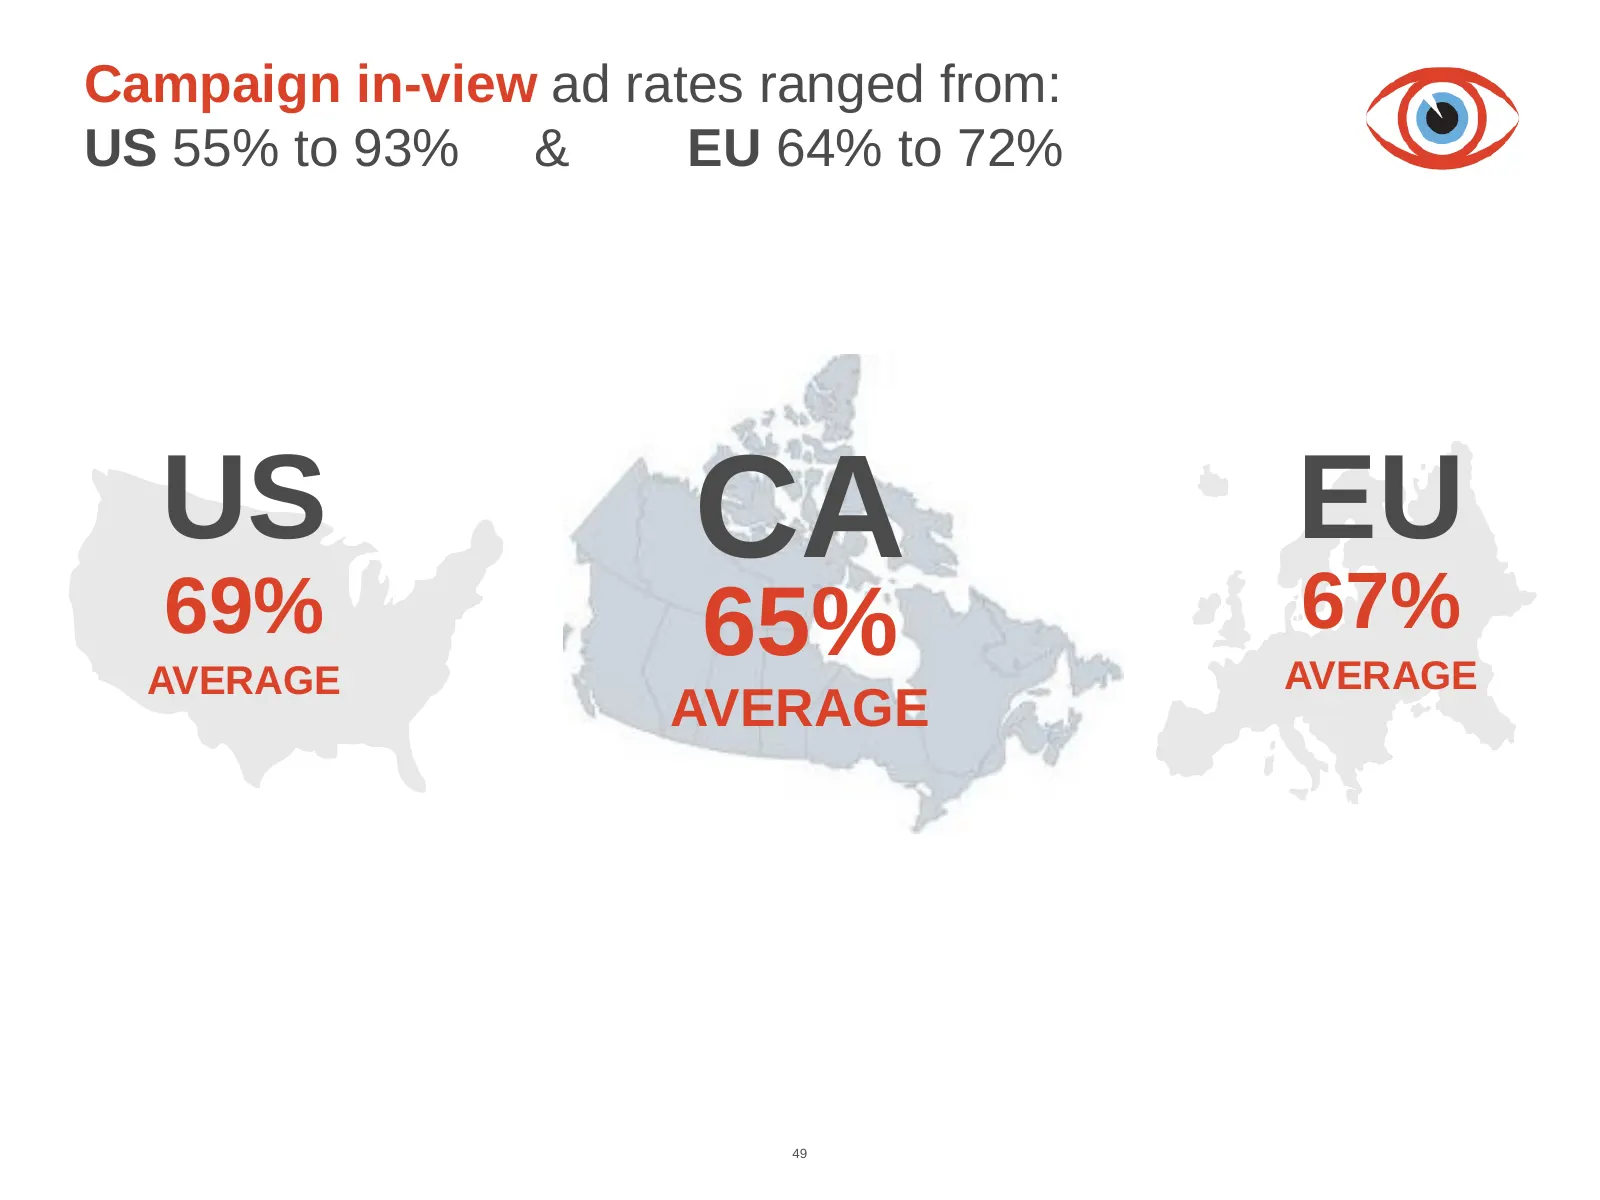
Slide 49: Campaign In-View Ad Rates Ranged from 55% to 93%
Campaign in-view ad rates ranged from: In-view US Rates& fromEUCharter 55% to 93% Studies 64% to 72% US CA EU 67% 69% 65% AVERAGE AVERAGE AVERAGE 49
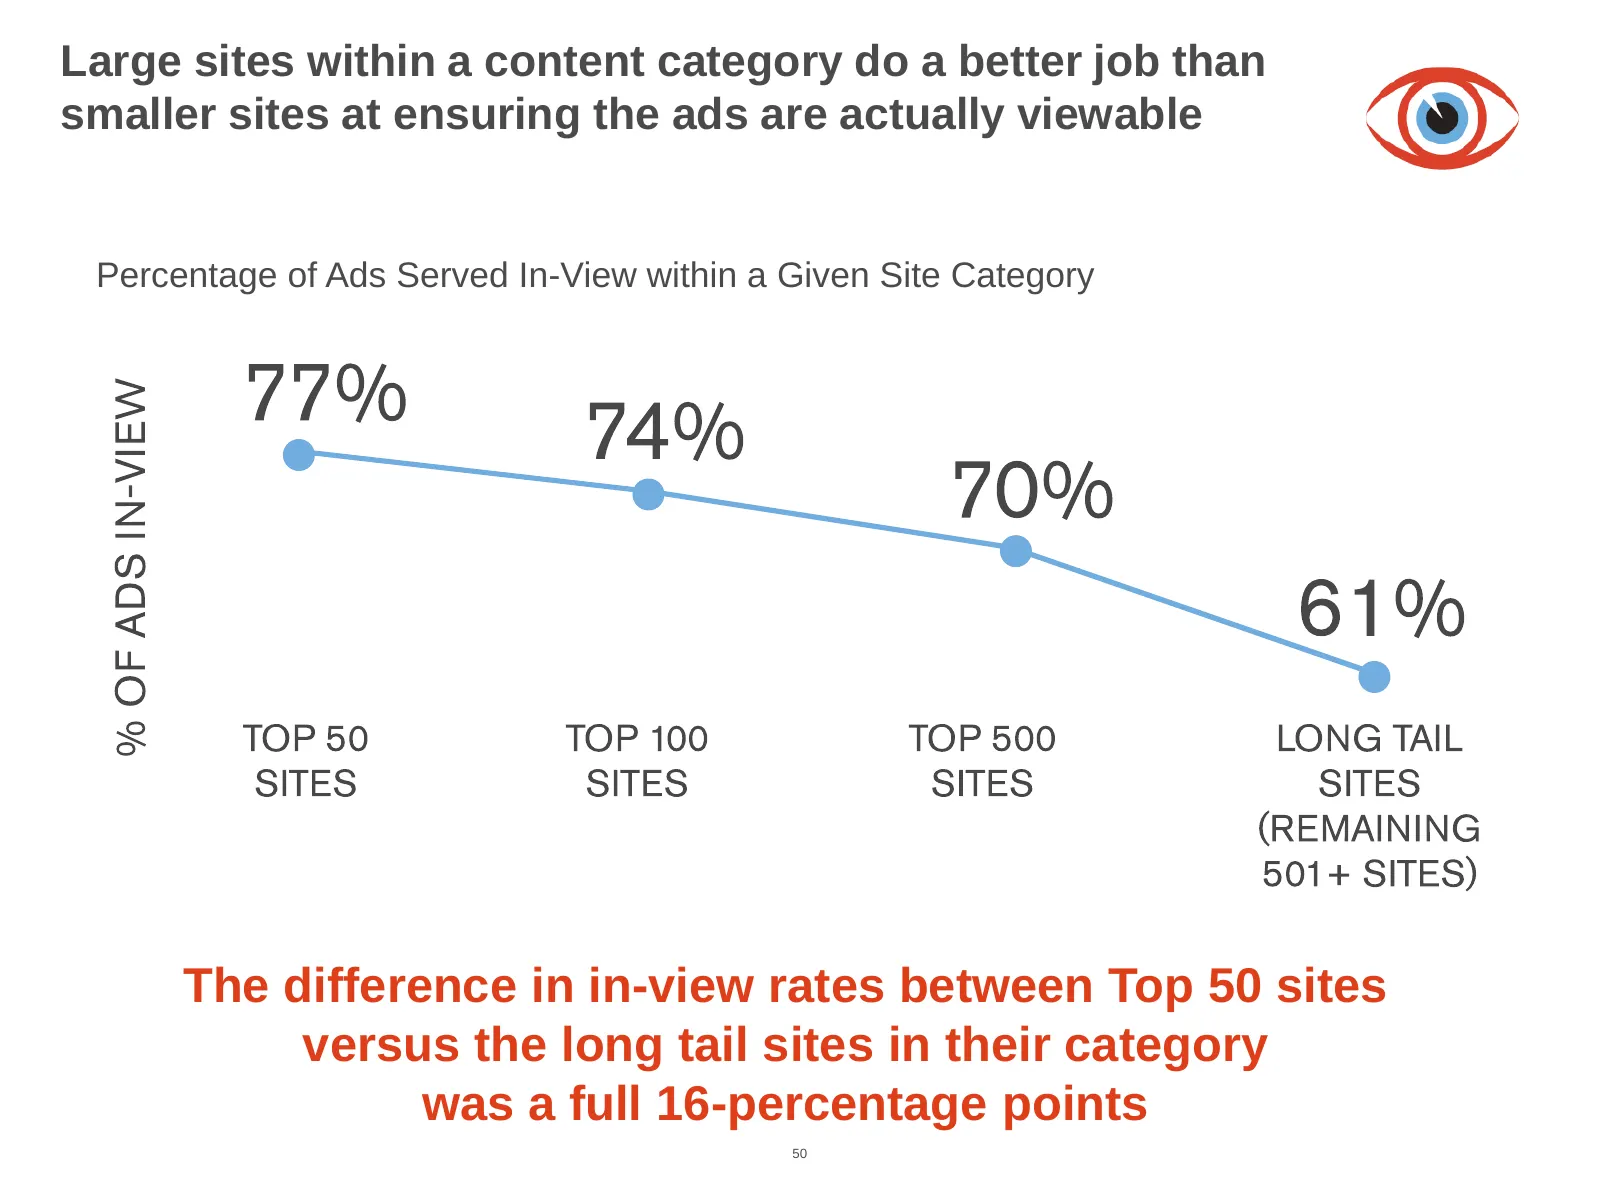
Slide 50: Large Sites Do a Better Job Ensuring Ads Are Viewable
Large sites within a content category do a better job than smaller sites at ensuring the ads are actually viewable Percentage of Ads Served In-View within a Given Site Category The difference in in-view rates between Top 50 sites versus the long tail sites in their category was a full 16-percentage
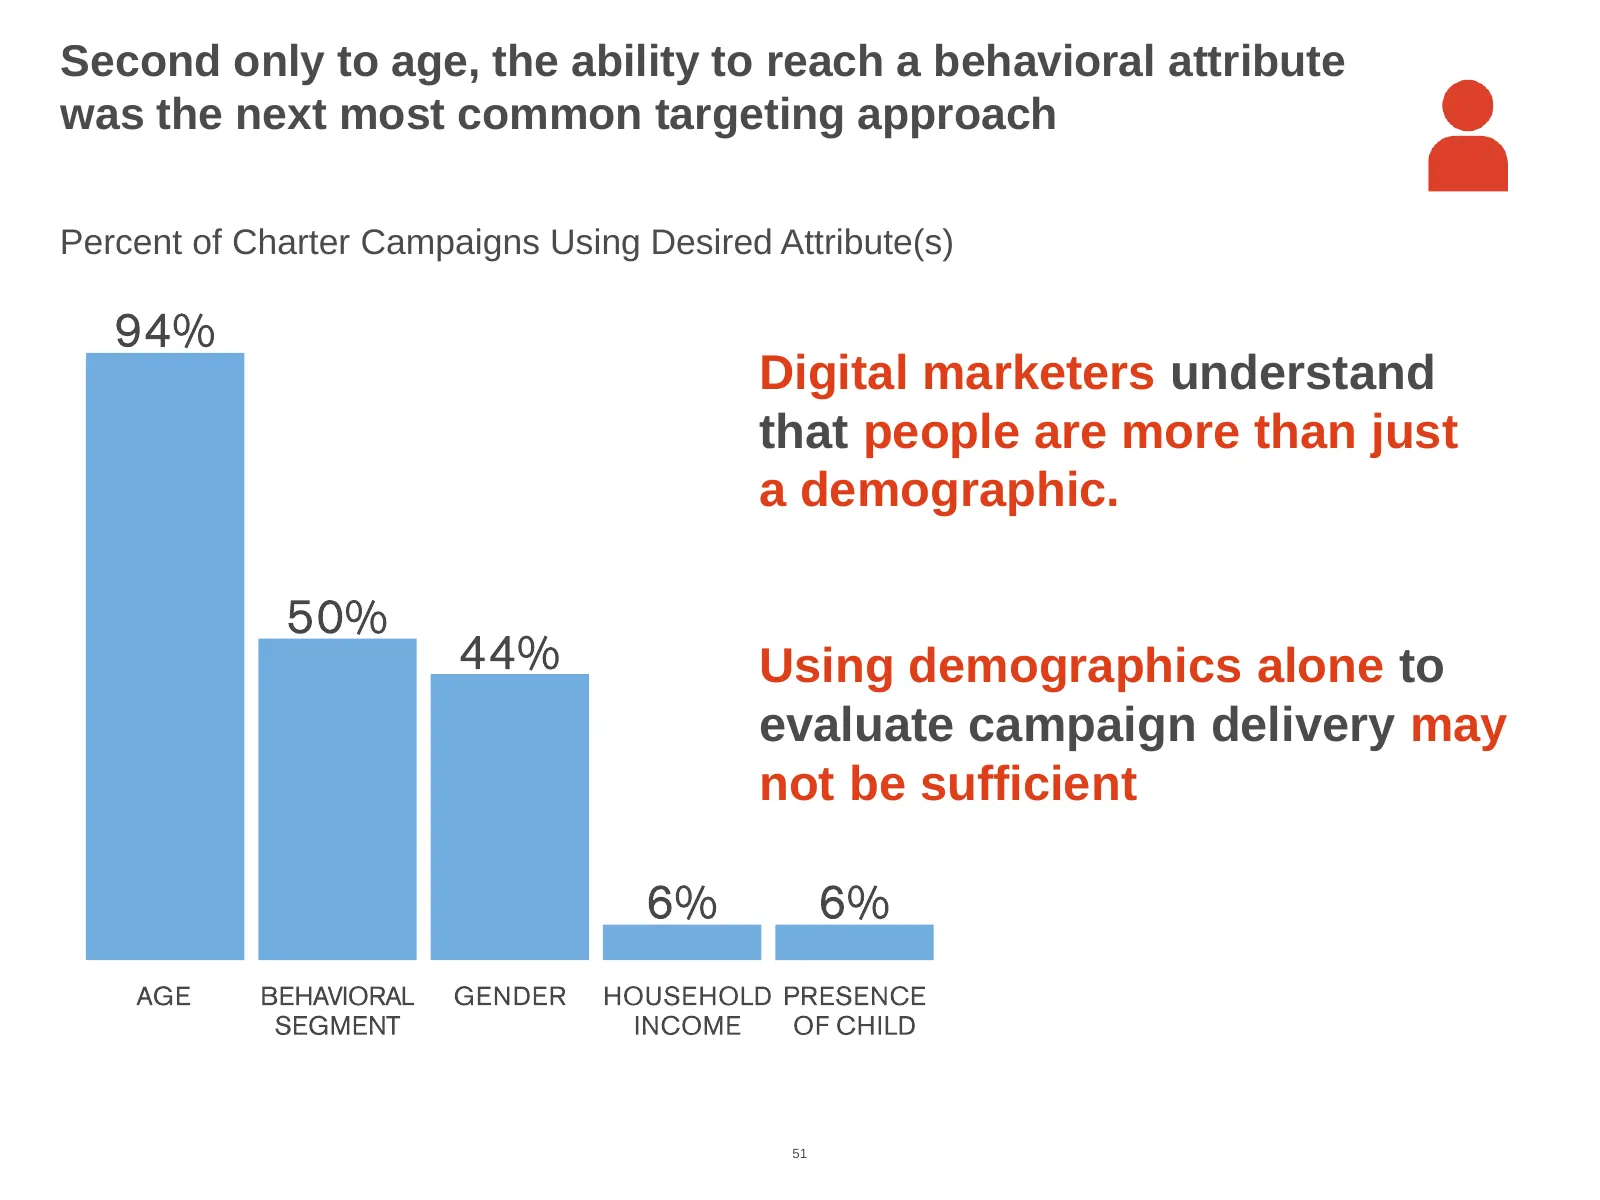
Slide 51: Behavioral Attribute Was Next Most Common Targeting Approach
Second only to age, the ability to reach a behavioral attribute was the next most common targeting approach Percent of Charter Campaigns Using Desired Attribute(s) Digital marketers understand that people are more than just a demographic. Using demographics alone to evaluate campaign delivery may no
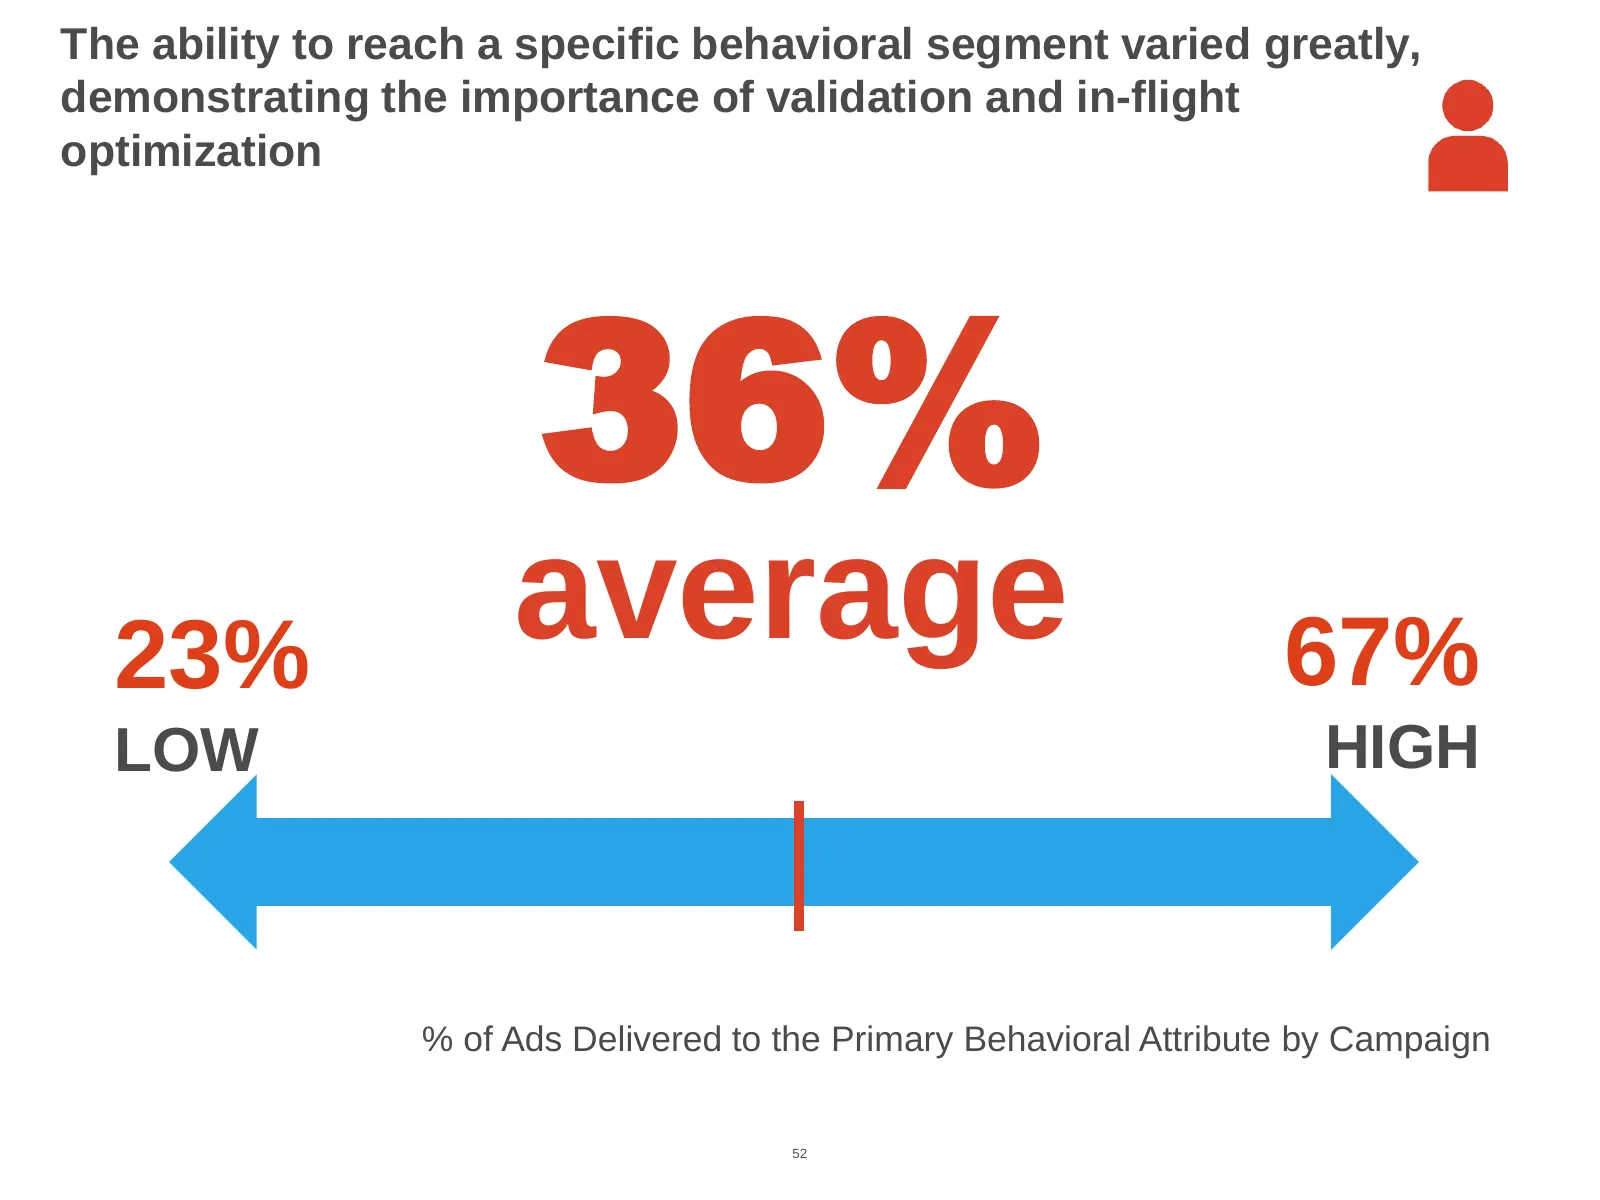
Slide 52: Ability to Reach a Behavioral Segment Varied Greatly
The ability to reach a specific behavioral segment varied greatly, demonstrating the importance of validation and in-flight optimization 36% 23% average 67% LOW HIGH % of Ads Delivered to the Primary Behavioral Attribute by Campaign 52
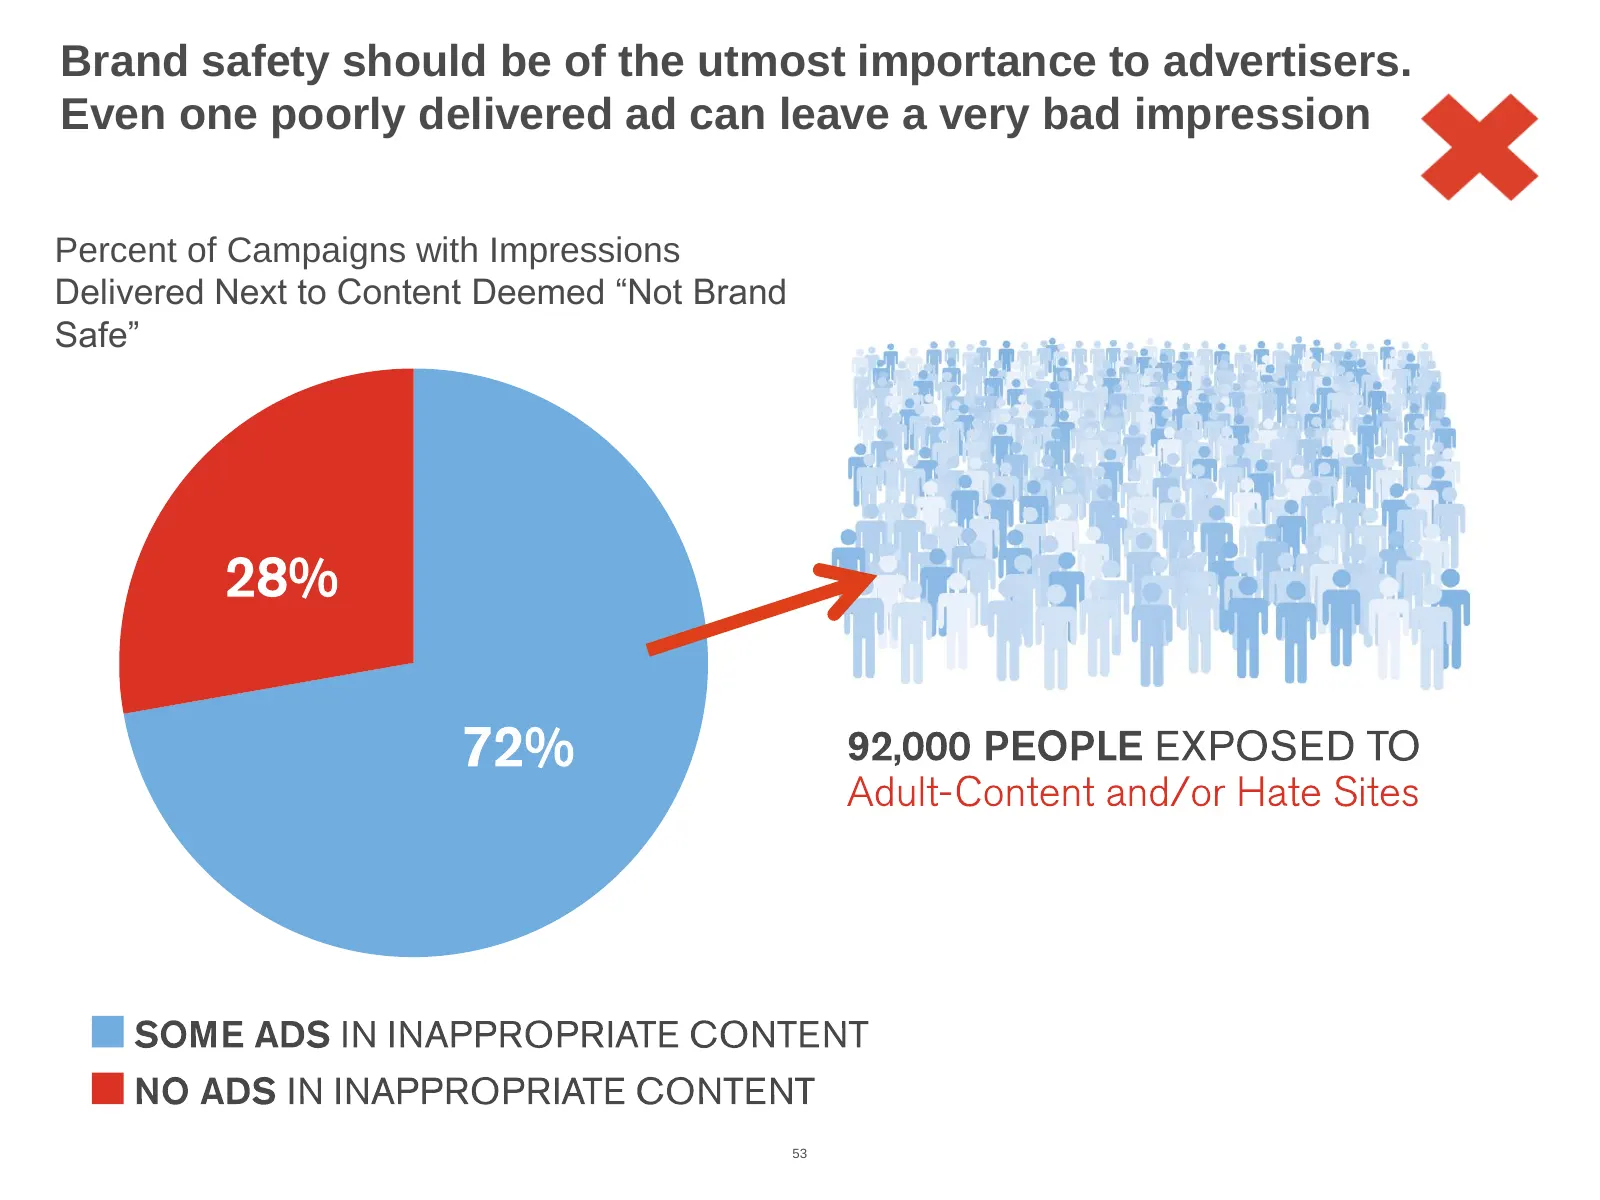
Slide 53: Brand Safety Should Be of Utmost Importance to Advertisers
Brand safety should be of the utmost importance to advertisers. Even one poorly delivered ad can leave a very bad impression Percent of Campaigns with Impressions Delivered Next to Content Deemed “Not Brand Safe” 53

Slide 54: CE/vCE: Massive Global Market Adoption
CE™/vCE™: Massive Global Market Adoption 2,600+ Studies for 120 advertisers / agencies in 28 countries North America Europe SEA Charter Brands Allstate Not an exhaustive list. Includes advertisers currently working with comScore vCE 54 who have agreed to be named publicly.
Slide 55: Key Takeaways
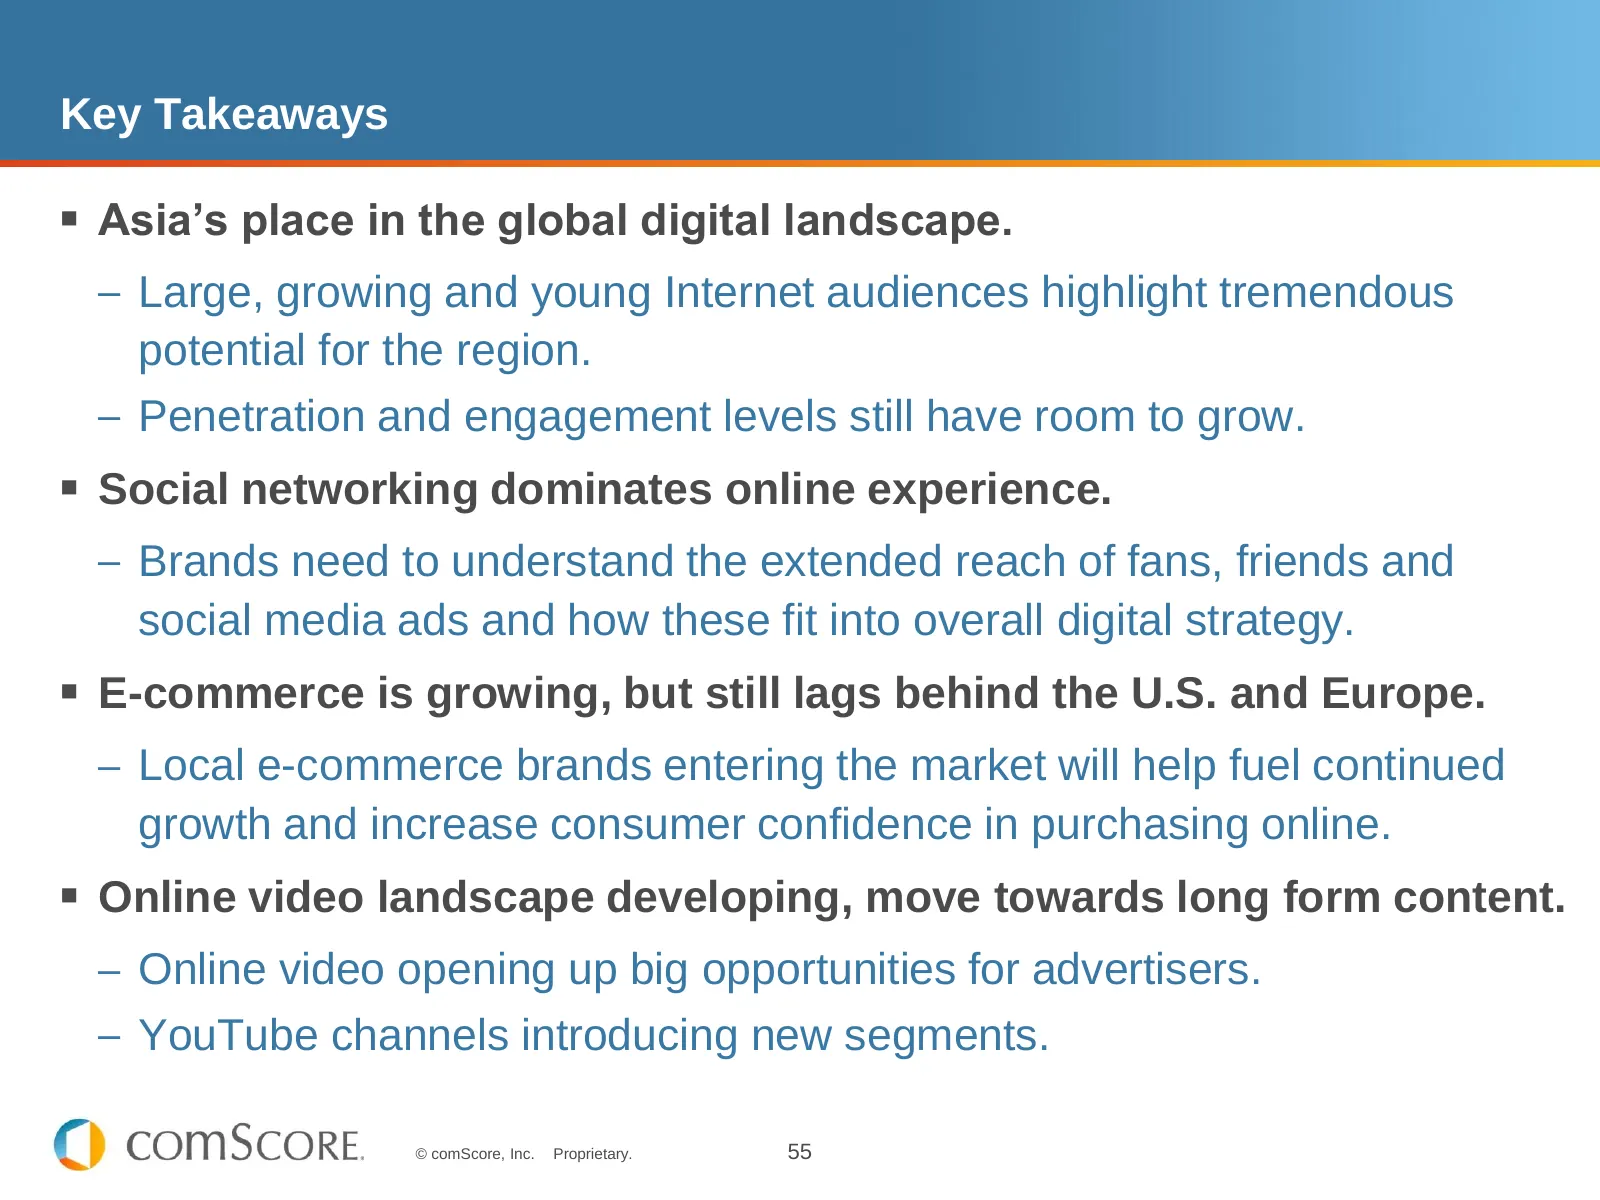
Key Takeaways Asia’s place in the global digital landscape. – Large, growing and young Internet audiences highlight tremendous potential for the region. – Penetration and engagement levels still have room to grow. Social networking dominates online experience. – Brands need to understand the ext
Slide 56: Key Takeaways Continued
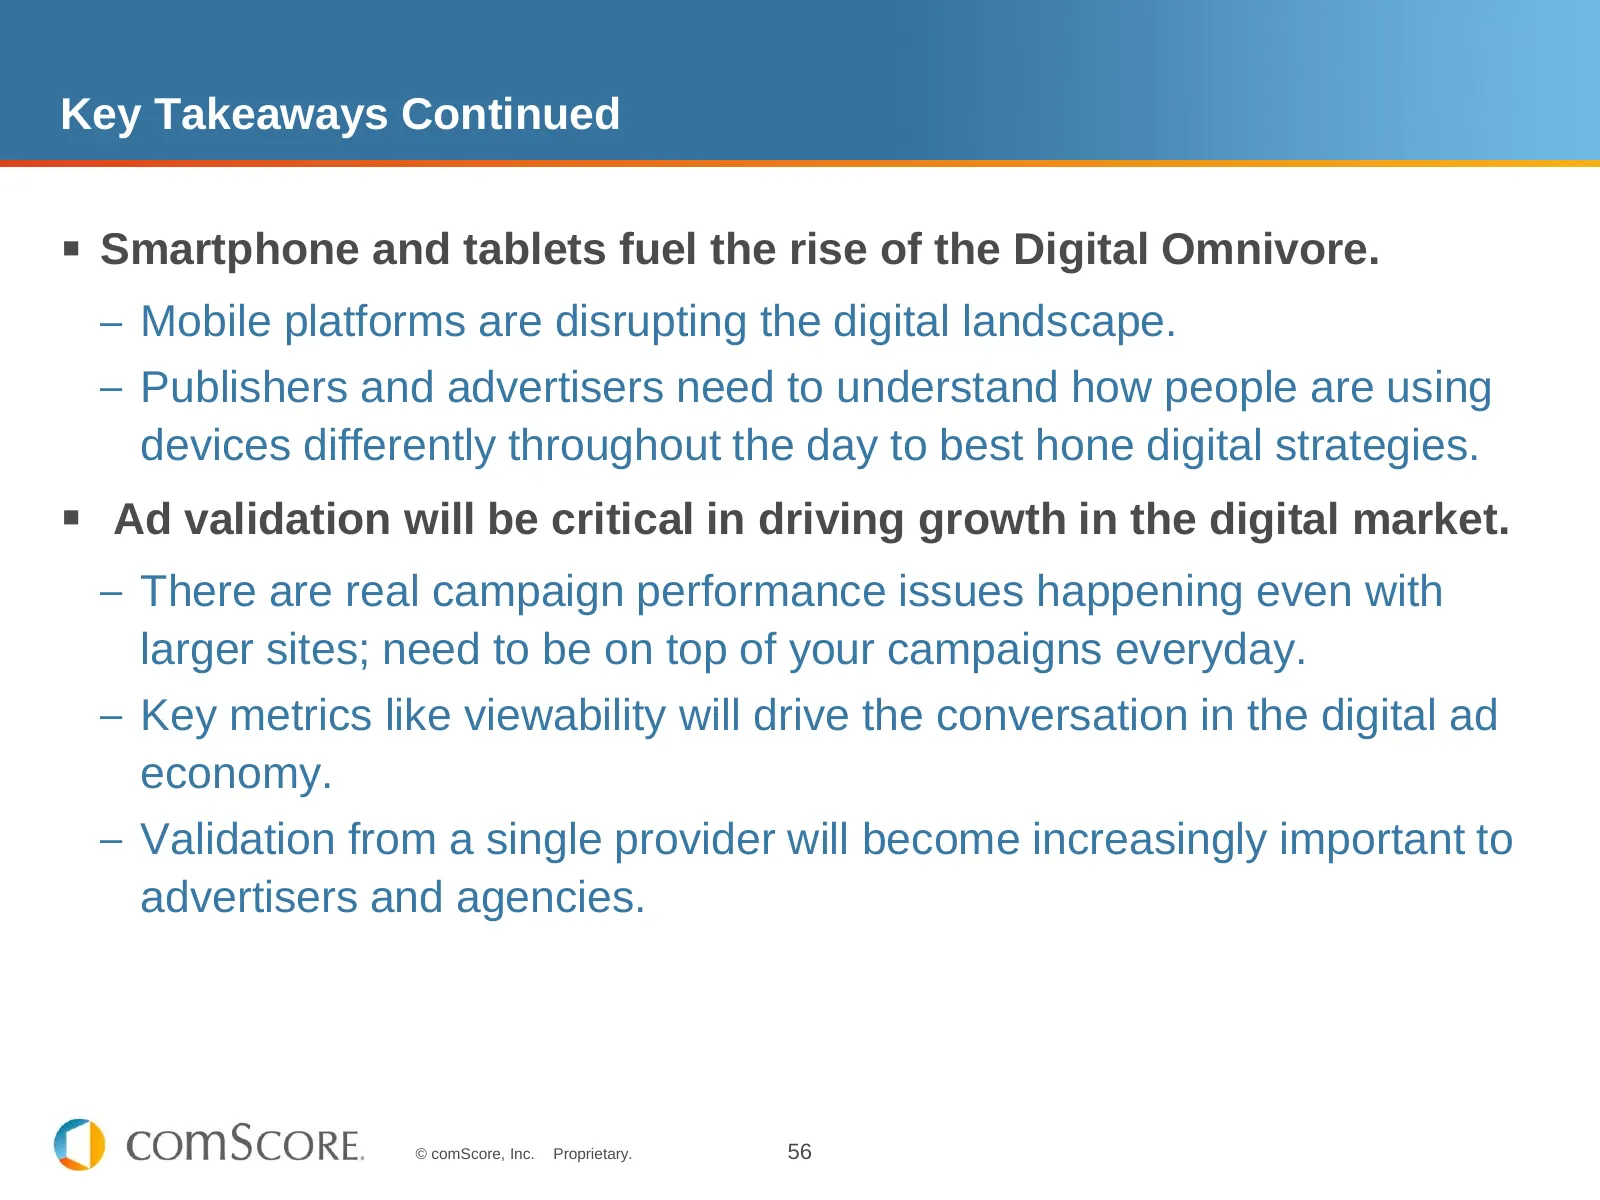
Key Takeaways Continued Smartphone and tablets fuel the rise of the Digital Omnivore. – Mobile platforms are disrupting the digital landscape. – Publishers and advertisers need to understand how people are using devices differently throughout the day to best hone digital strategies. Ad validatio

Slide 57: Thank you!
Thank you! For a copy of today’s presentation, please email press@comscore.com Greg Dale, comScore, Inc. Twitter: @comScoreAPAC EVP, International @comScore
Source: Internet Archive copy of comscore.com
More decks from comScore, Inc.
 Q3 2026 Earnings Presentation17 slides · Nov 3, 2026
 Q2 2026 Earnings Presentation20 slides · Aug 12, 2026
 Investor Presentation (June 2026)27 slides · Jun 10, 2026
 Q4 2025 Earnings Presentation13 slides · Mar 17, 2026
 Q3 2025 Earnings Presentation15 slides · Nov 4, 2025
 Q2 2025 Earnings Presentation11 slides · Aug 5, 2025