Aryzta AG · SIX:ARYN
Aryzta — Shareholder Meeting (December 2010)
54 slides from Aryzta's shareholder meeting presentation, Dec 2, 2010
Slide 1: 2010 AGM
ARYZTA AG 2010 AGM 02 December 2010
Slide 2: Forward Looking Statement
Forward Looking Statement This document contains forward looking statements which reflect management’s current views and estimates. The forward looking statements involve certain risks and uncertainties that could cause actual results to differ materially from those contained in the forward looking
Slide 3: A Milestone Year
ARYZTA AG A Milestone Year 3 © ARYZTA, December 2010
Slide 4: FY 2010 Principle Events
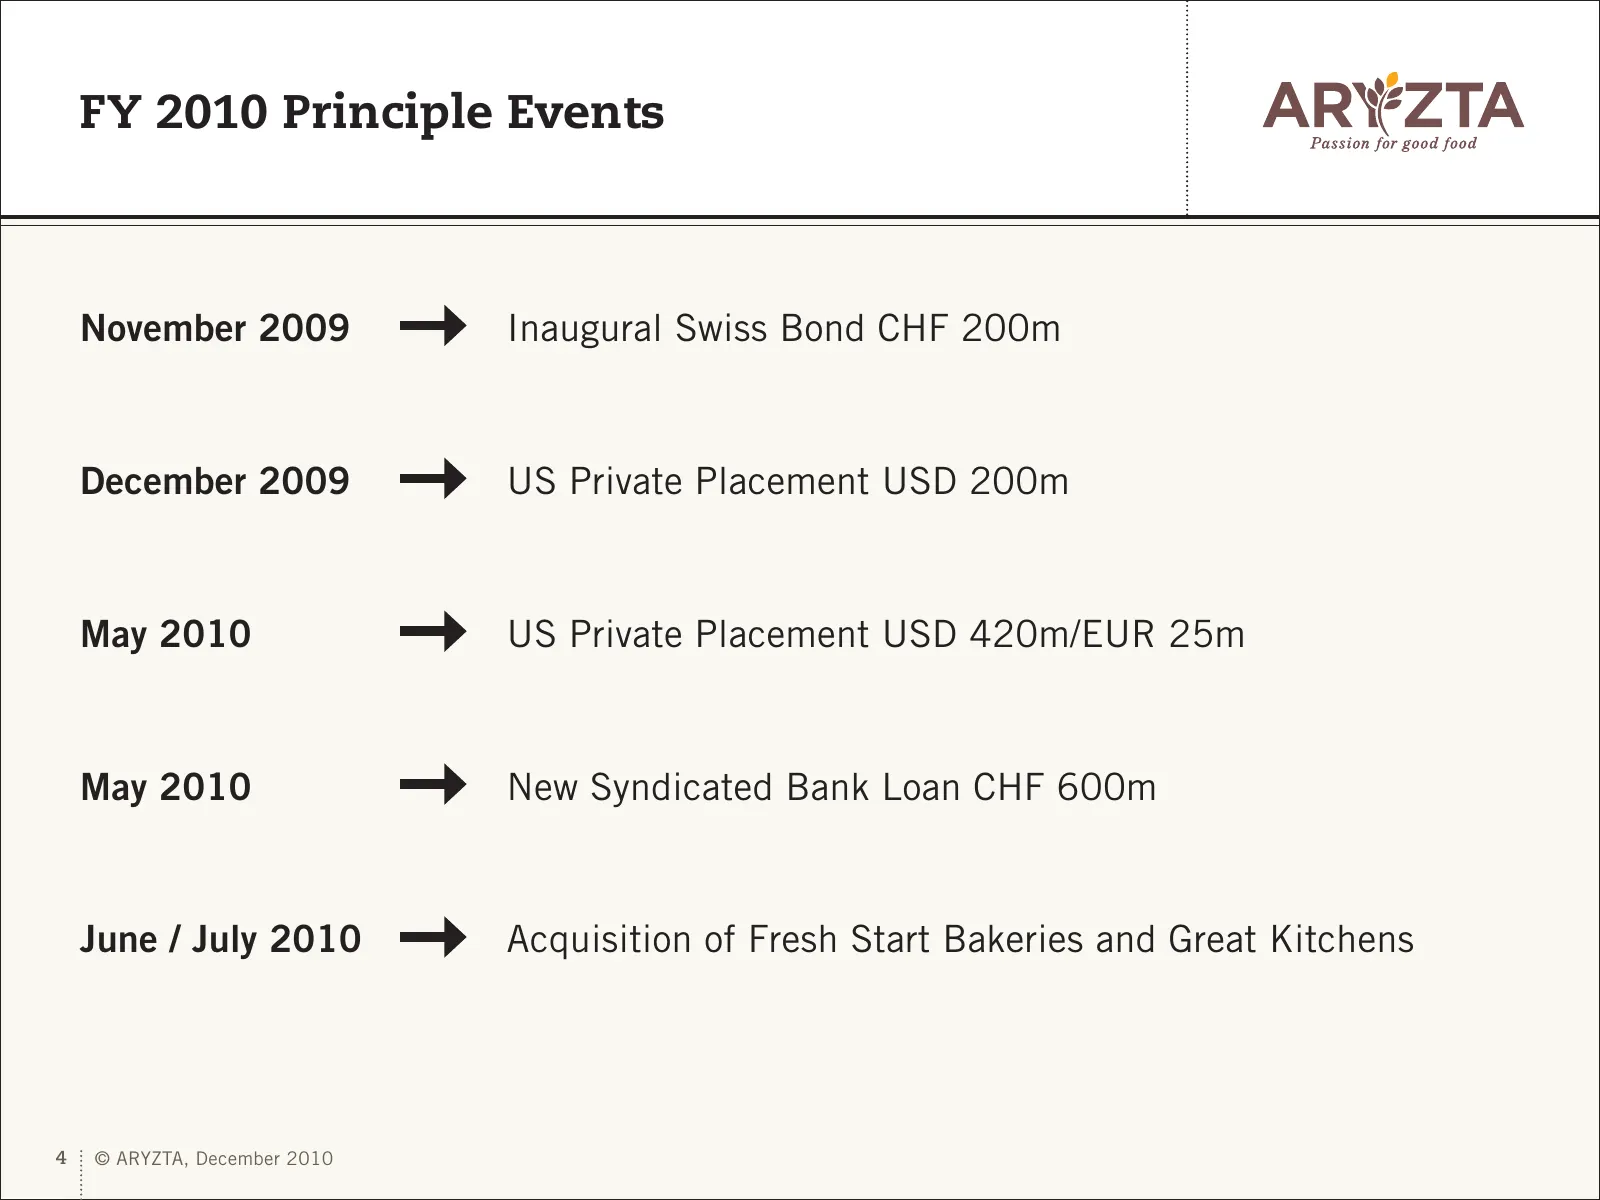
FY 2010 Principle Events November 2009 Inaugural Swiss Bond CHF 200m December 2009 US Private Placement USD 200m May 2010 US Private Placement USD 420m/EUR 25m May 2010 New Syndicated Bank Loan CHF 600m June / July 2010 Acquisition of Fresh Start Bakeries and Great Kitchens 4 © ARYZTA, December 2010
Slide 5: Corporate Governance
ARYZTA AG Corporate Governance 5 © ARYZTA, December 2010
Slide 6: Corporate Governance
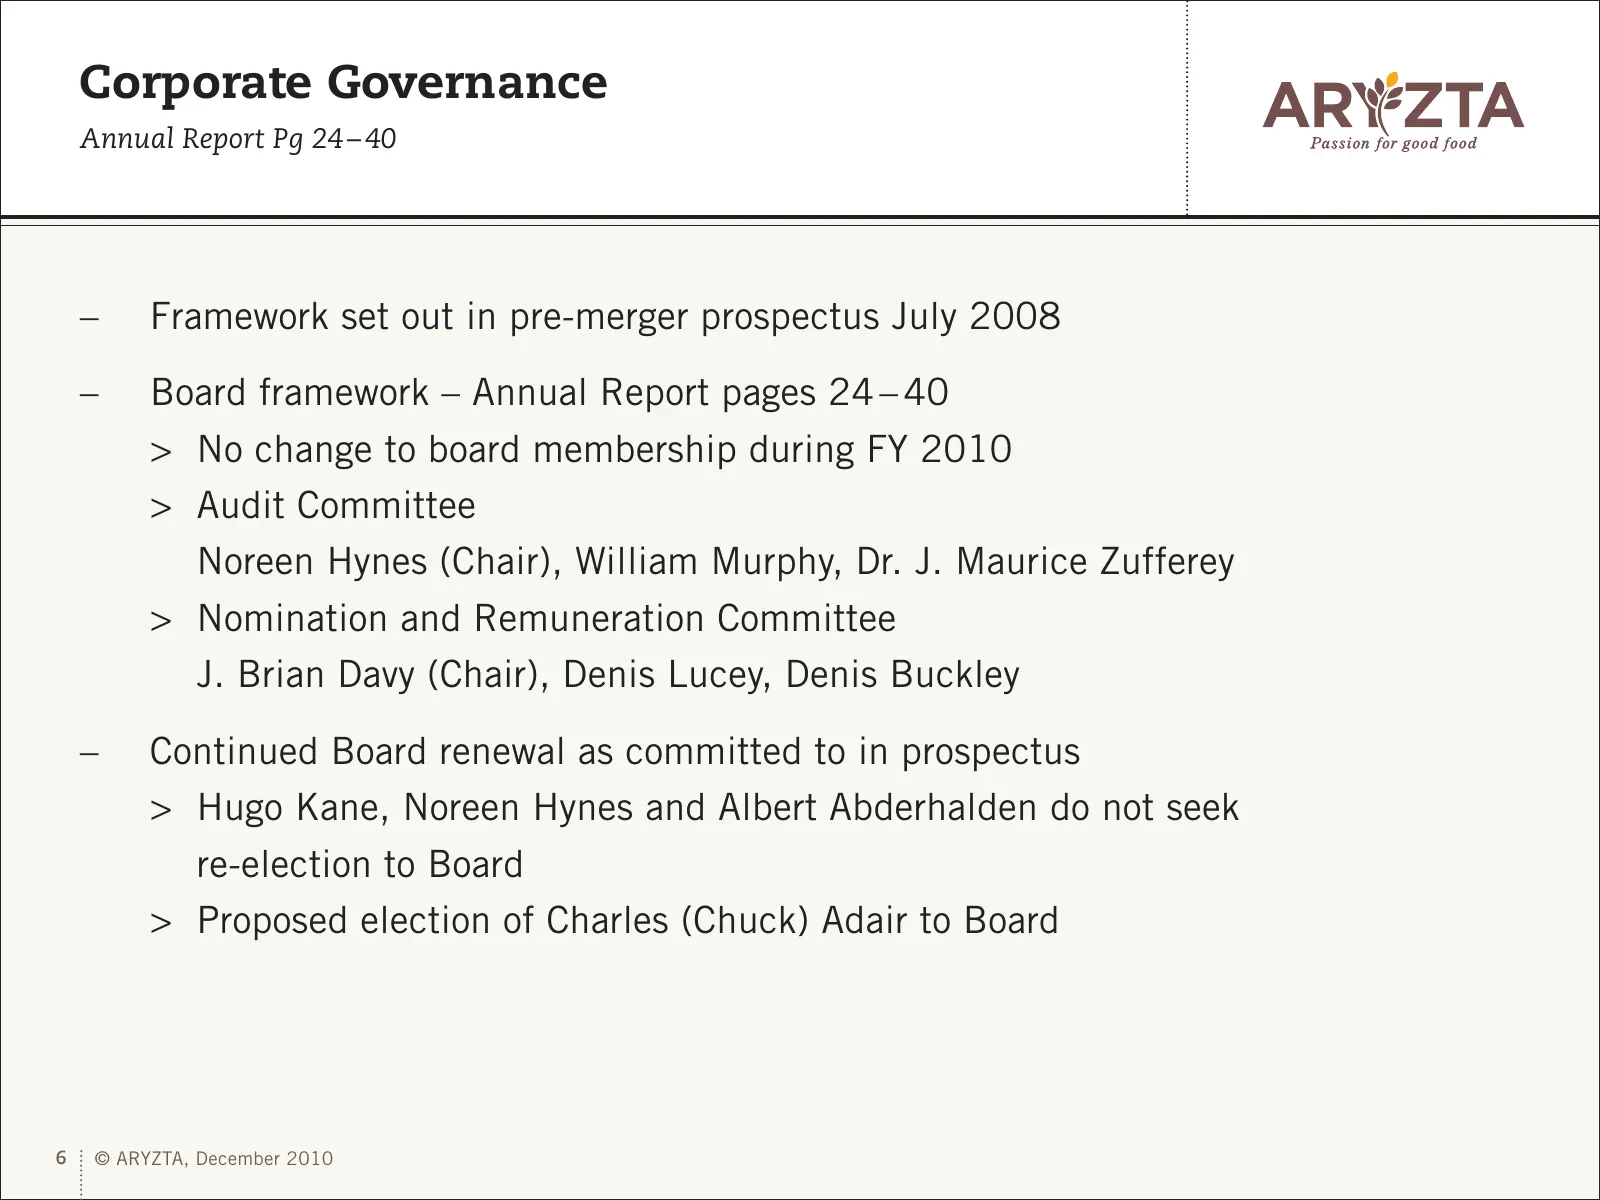
Corporate Governance Annual Report Pg 24 – 40 – Framework set out in pre-merger prospectus July 2008 – Board framework – Annual Report pages 24 – 40 > No change to board membership during FY 2010 > Audit Committee Noreen Hynes (Chair), William Murphy, Dr. J. Maurice Zufferey > Nomination and Remuner
Slide 7: Risk Statement
Risk Statement Annual Report Pg 42 – Group Risk Statement – page 42 Annual Report – Risk map developed by business – Risk map used by Internal Audit – Risk map informs Swiss Internal Control Systems (ICS) 7 © ARYZTA, December 2010
Slide 8: Responsibility
Responsibility Annual Report Pg 44 – 45 – Responsibility Statement – Pages 44 – 45 Annual Report – Decentralised business model – Path towards sustainable development through marrying of economic, environmental and social factors – Promoting: > Culture of Responsibility > Culture of Integrity > Cult
Slide 9: Remuneration
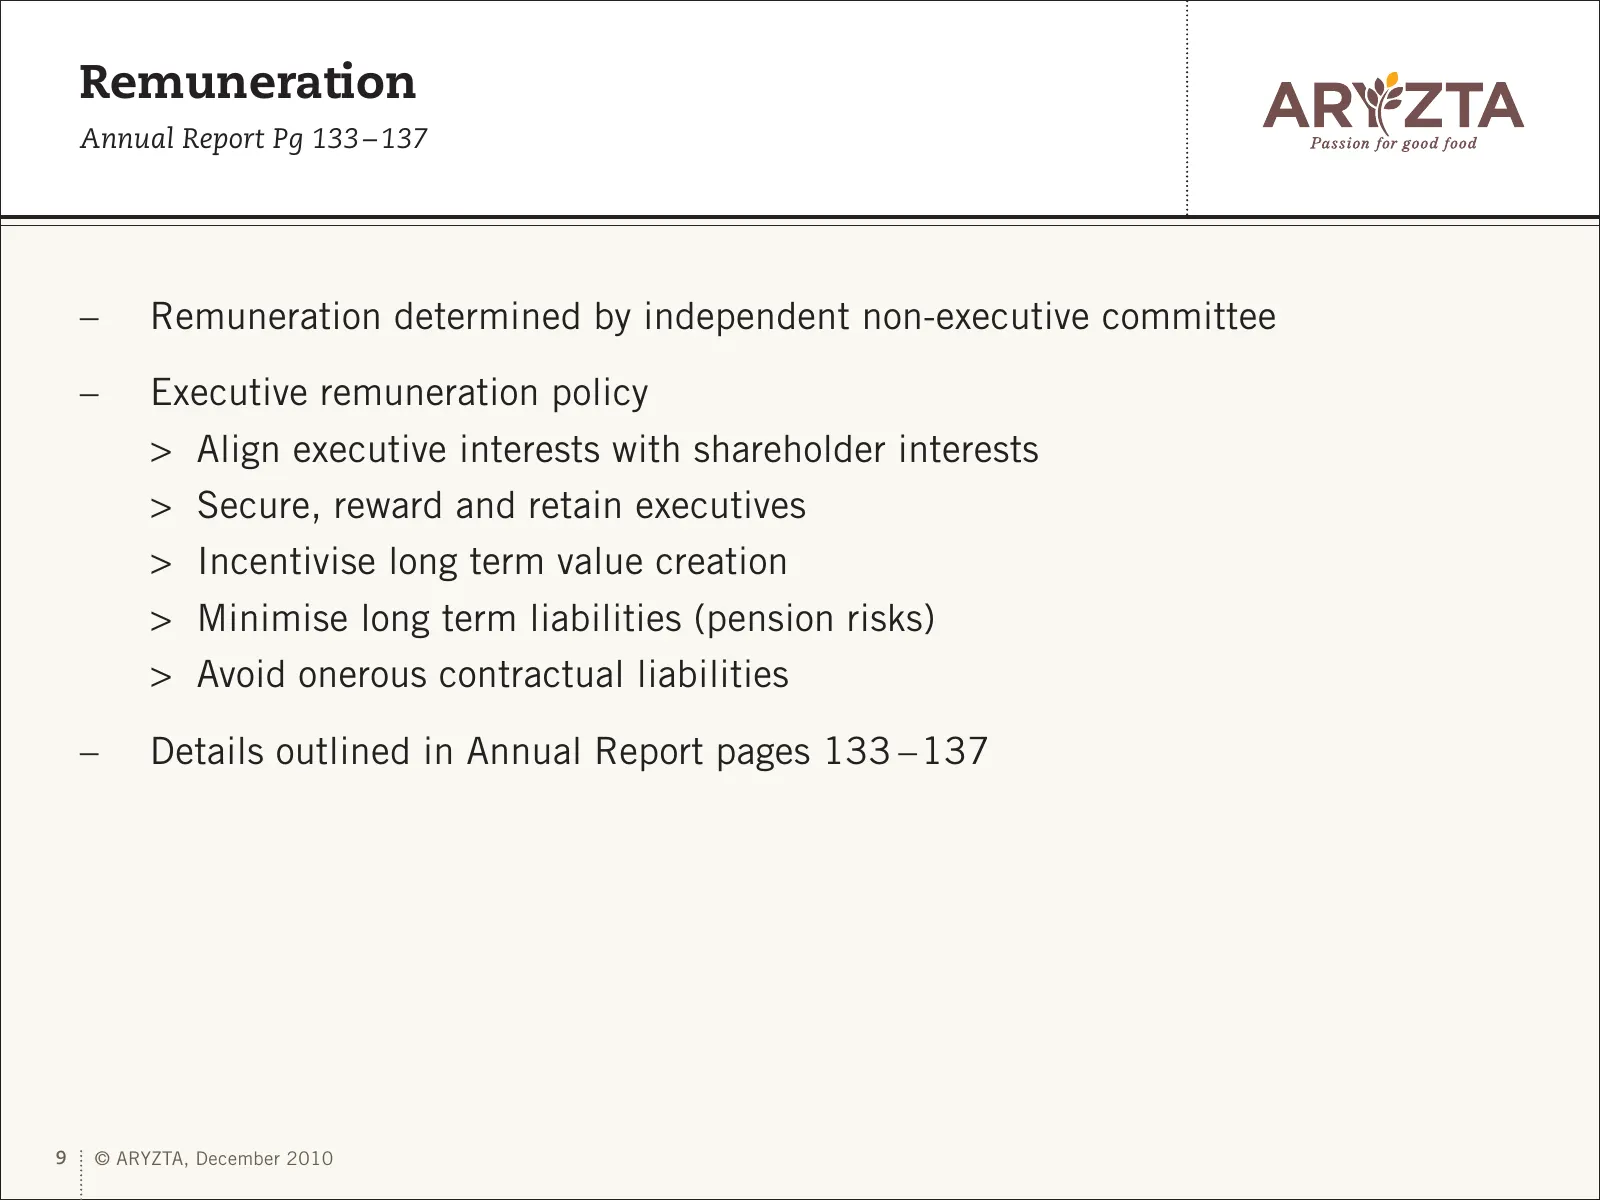
Remuneration Annual Report Pg 133 – 137 – Remuneration determined by independent non-executive committee – Executive remuneration policy > Align executive interests with shareholder interests > Secure, reward and retain executives > Incentivise long term value creation > Minimise long term liabiliti
Slide 10: Remuneration
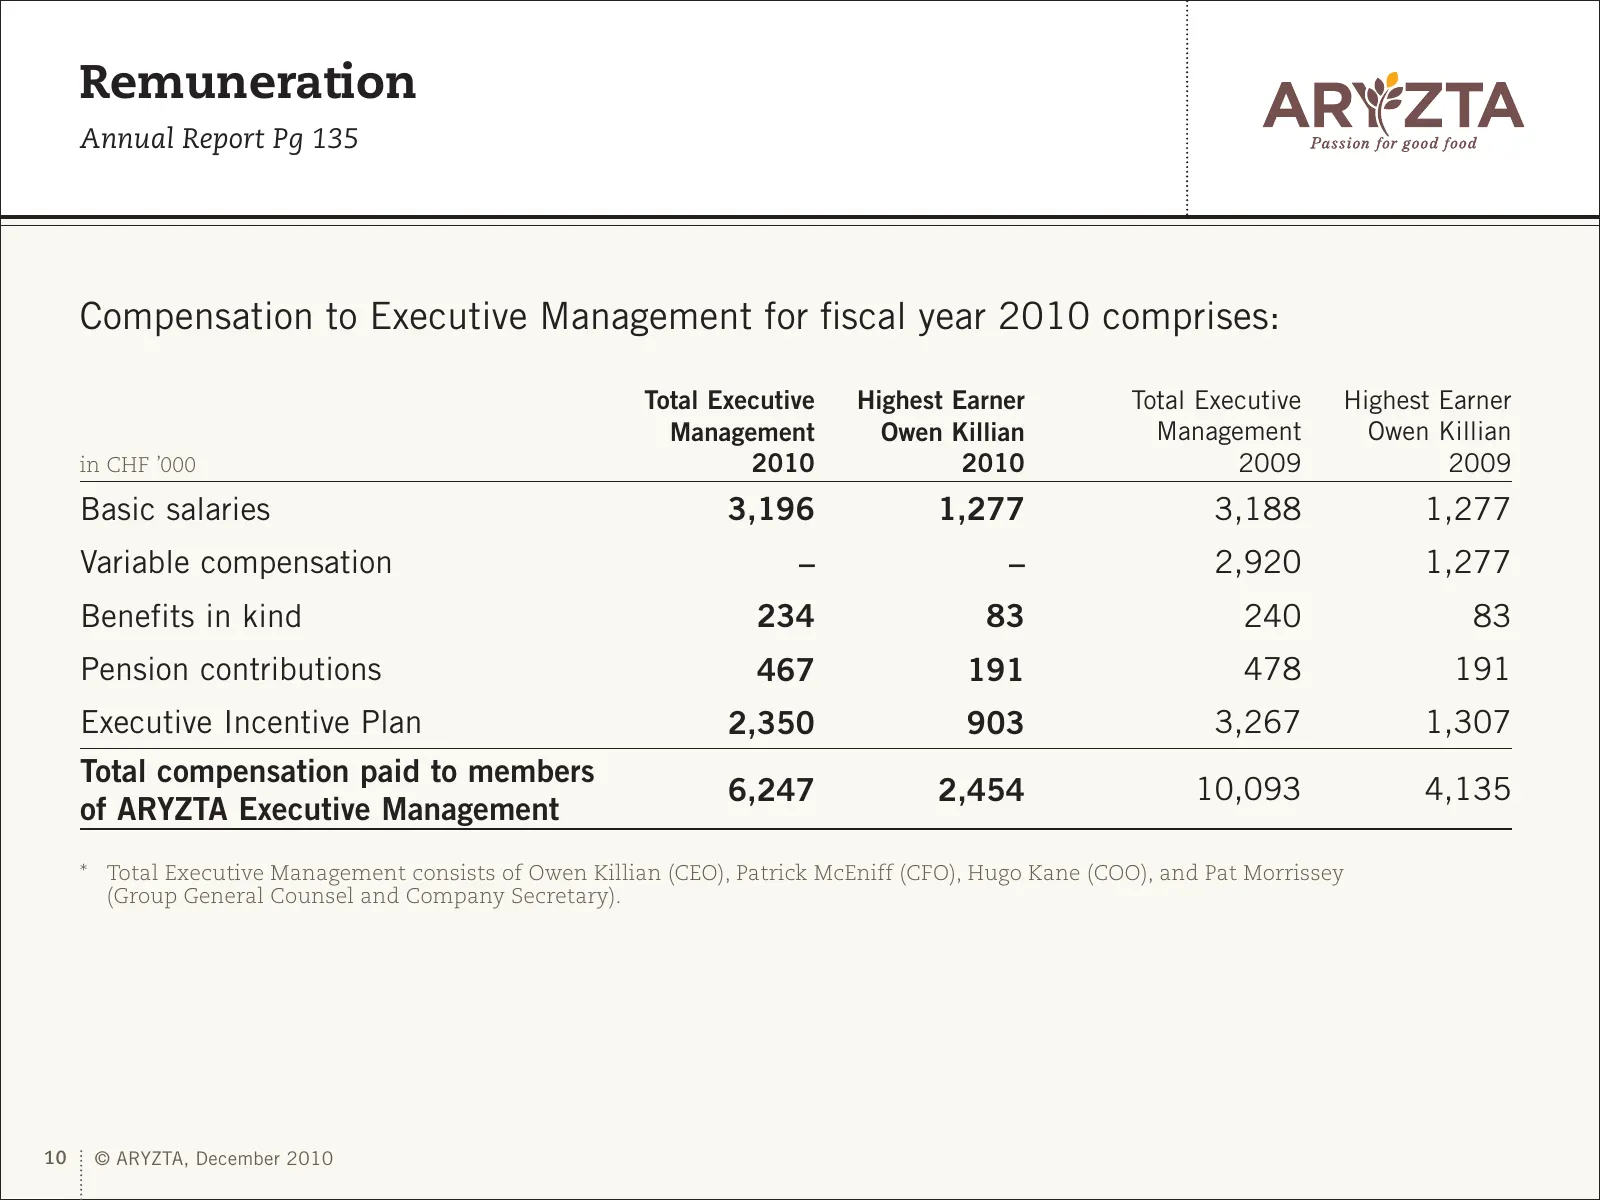
Remuneration Annual Report Pg 135 Compensation to Executive Management for fiscal year 2010 comprises: Total Executive Highest Earner Total Executive Highest Earner Management Owen Killian Management Owen Killian in CHF ’000 2010 2010 2009 2009 Basic salaries 3,196 1,277 3,188 1,277 Variable compens
Slide 11: Remuneration
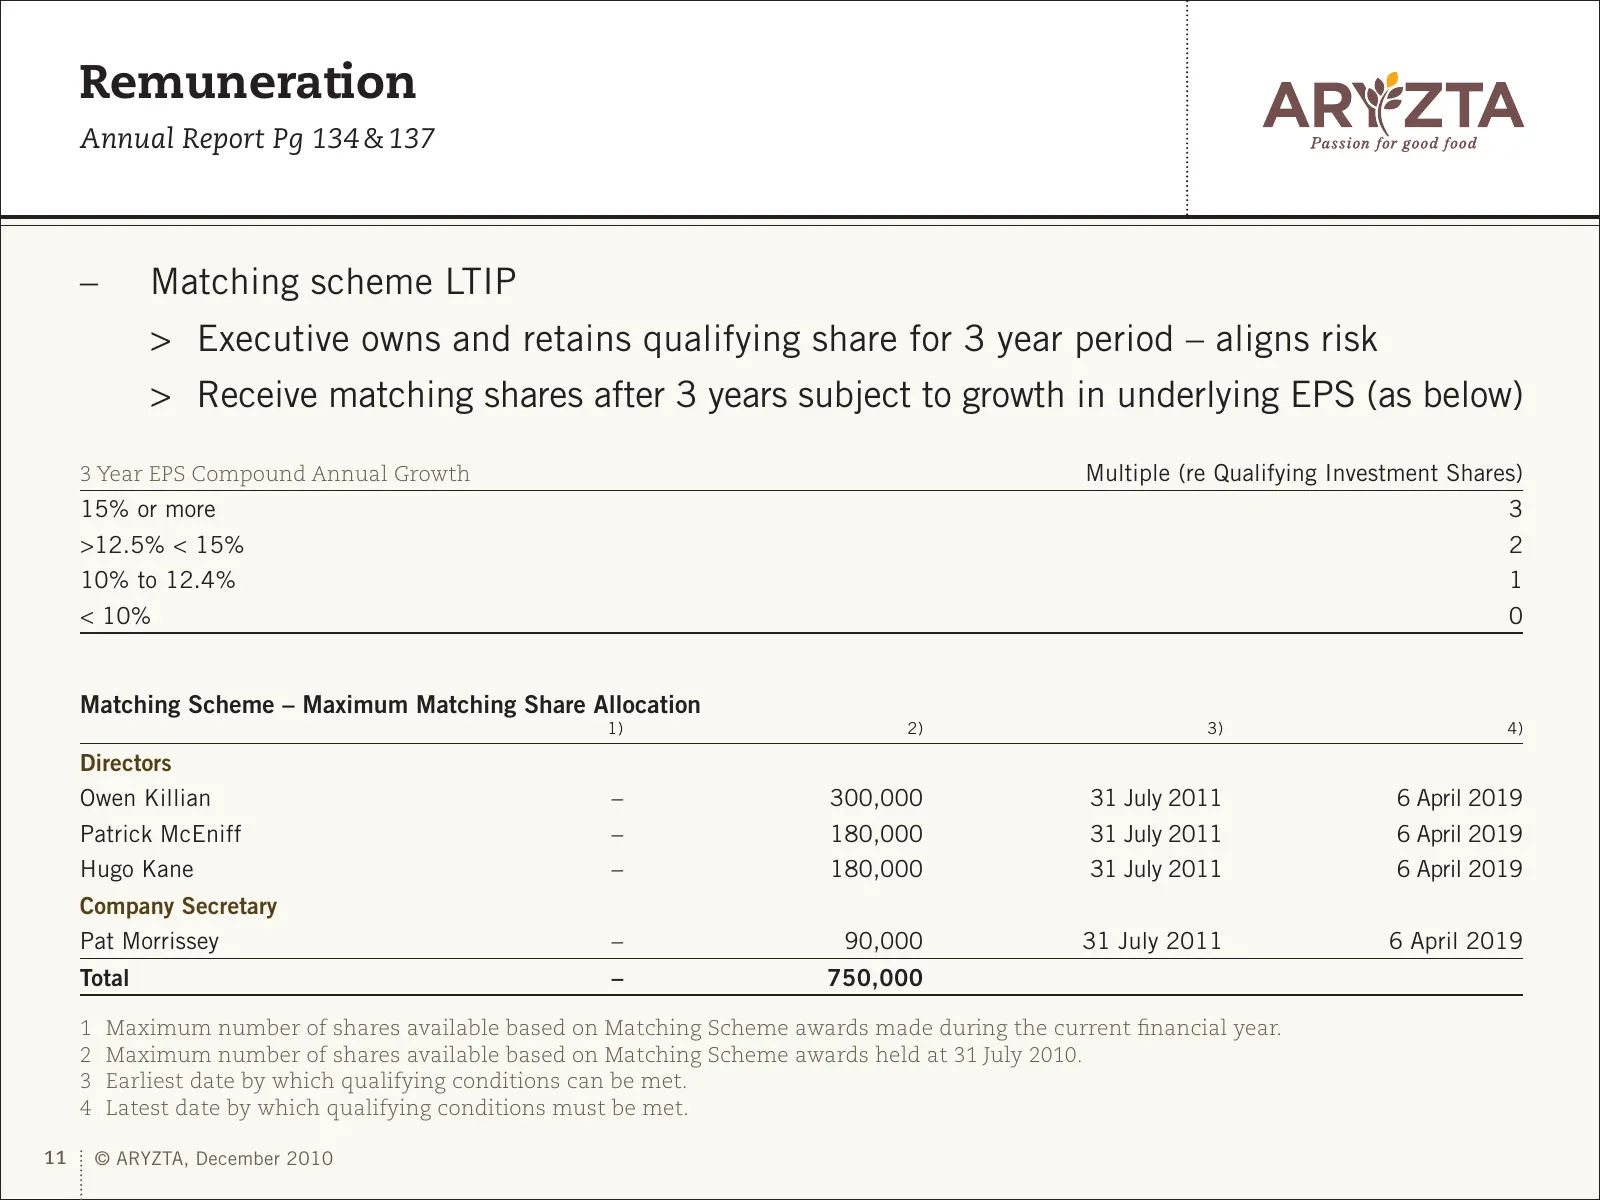
Remuneration Annual Report Pg 134 & 137 – Matching scheme LTIP > Executive owns and retains qualifying share for 3 year period – aligns risk > Receive matching shares after 3 years subject to growth in underlying EPS (as below) 3 Year EPS Compound Annual Growth Multiple (re Qualifying Investment Sha
Slide 12: Remuneration
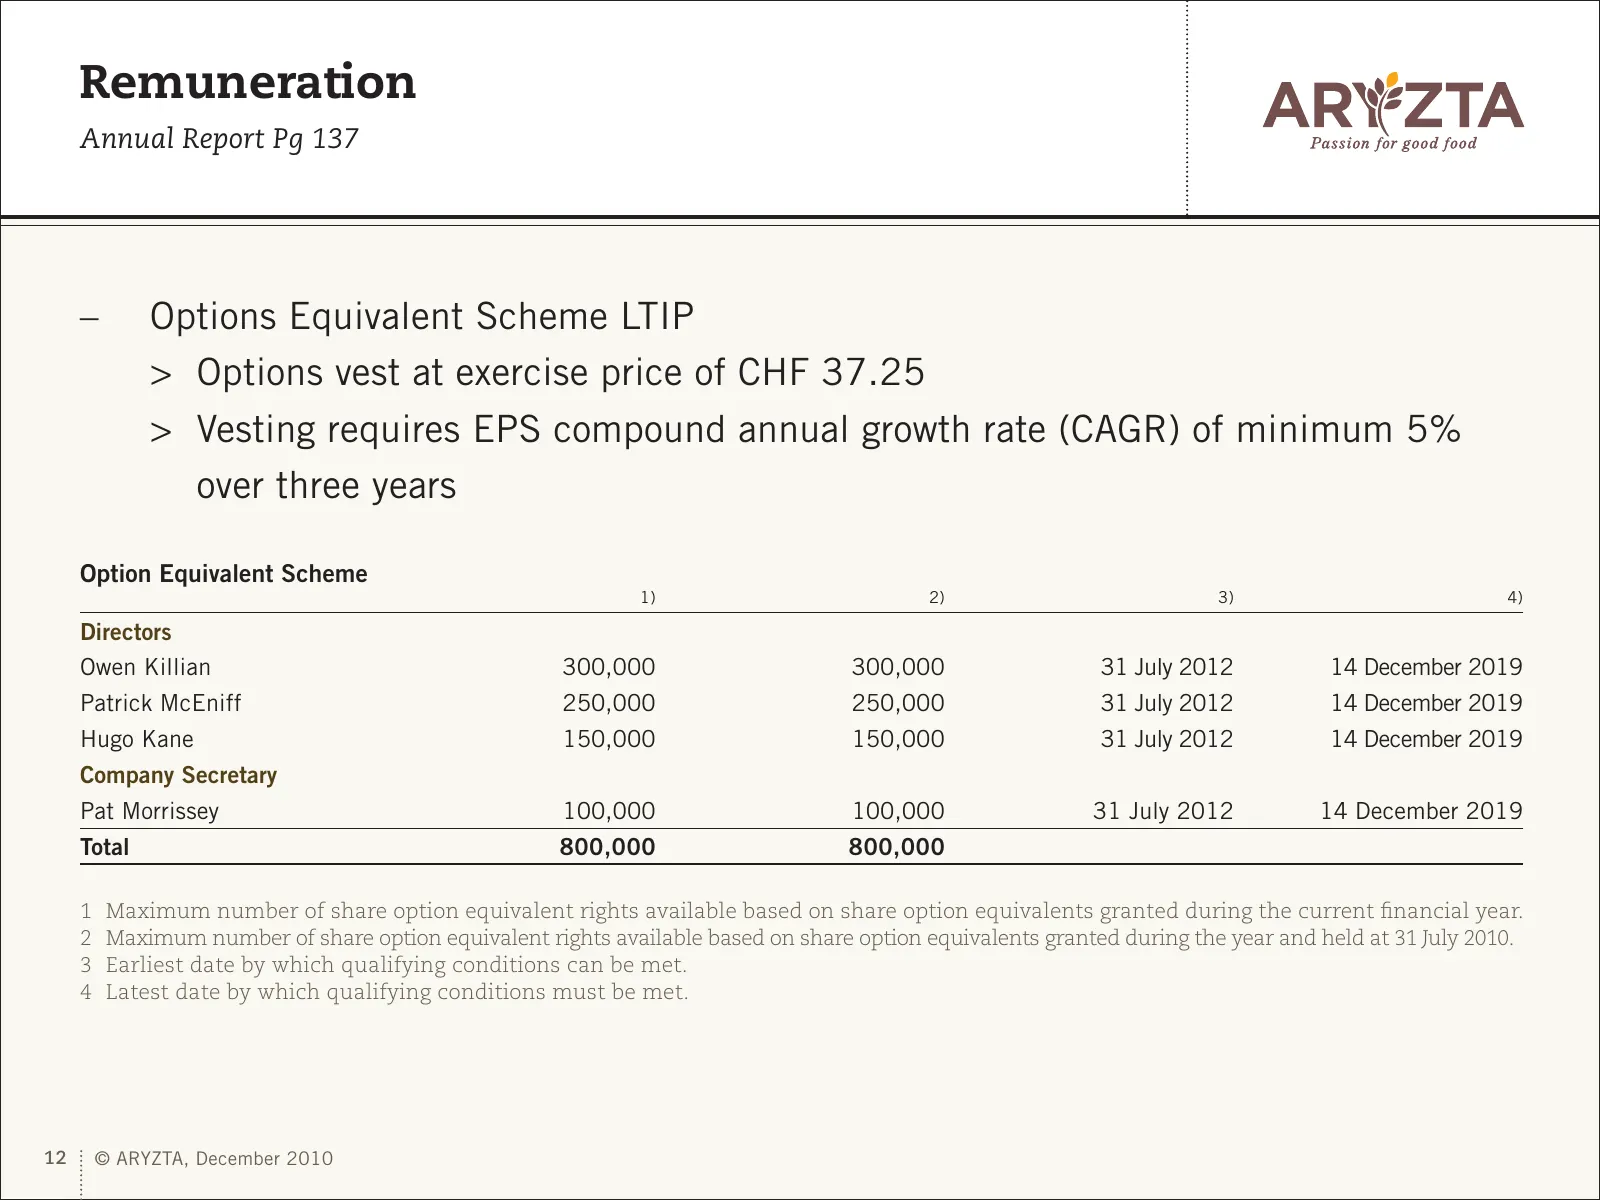
Remuneration Annual Report Pg 137 – Options Equivalent Scheme LTIP > Options vest at exercise price of CHF 37.25 > Vesting requires EPS compound annual growth rate (CAGR) of minimum 5% over three years Option Equivalent Scheme 1) 2) 3) 4) Directors Owen Killian 300,000 300,000 31 July 2012 14 Decemb
Slide 13: Business Review (to 31 July 2010)
ARYZTA AG Business Review (to 31 July 2010) 13 © ARYZTA, December 2010
Slide 14: Our Business
Our Business – Zurich based Swiss AG > Operations in Europe, North and South America, South East Asia, Australia and New Zealand – Created in 2008 – merger of Hiestand and IAWS August 2008 – Primary listing in Zurich (SIX; ARYN), and secondary listing in Dublin (ISE; YZA) – Holds 71.4 % of Origin En
Slide 15: Corporate Structure ARYZTA AG
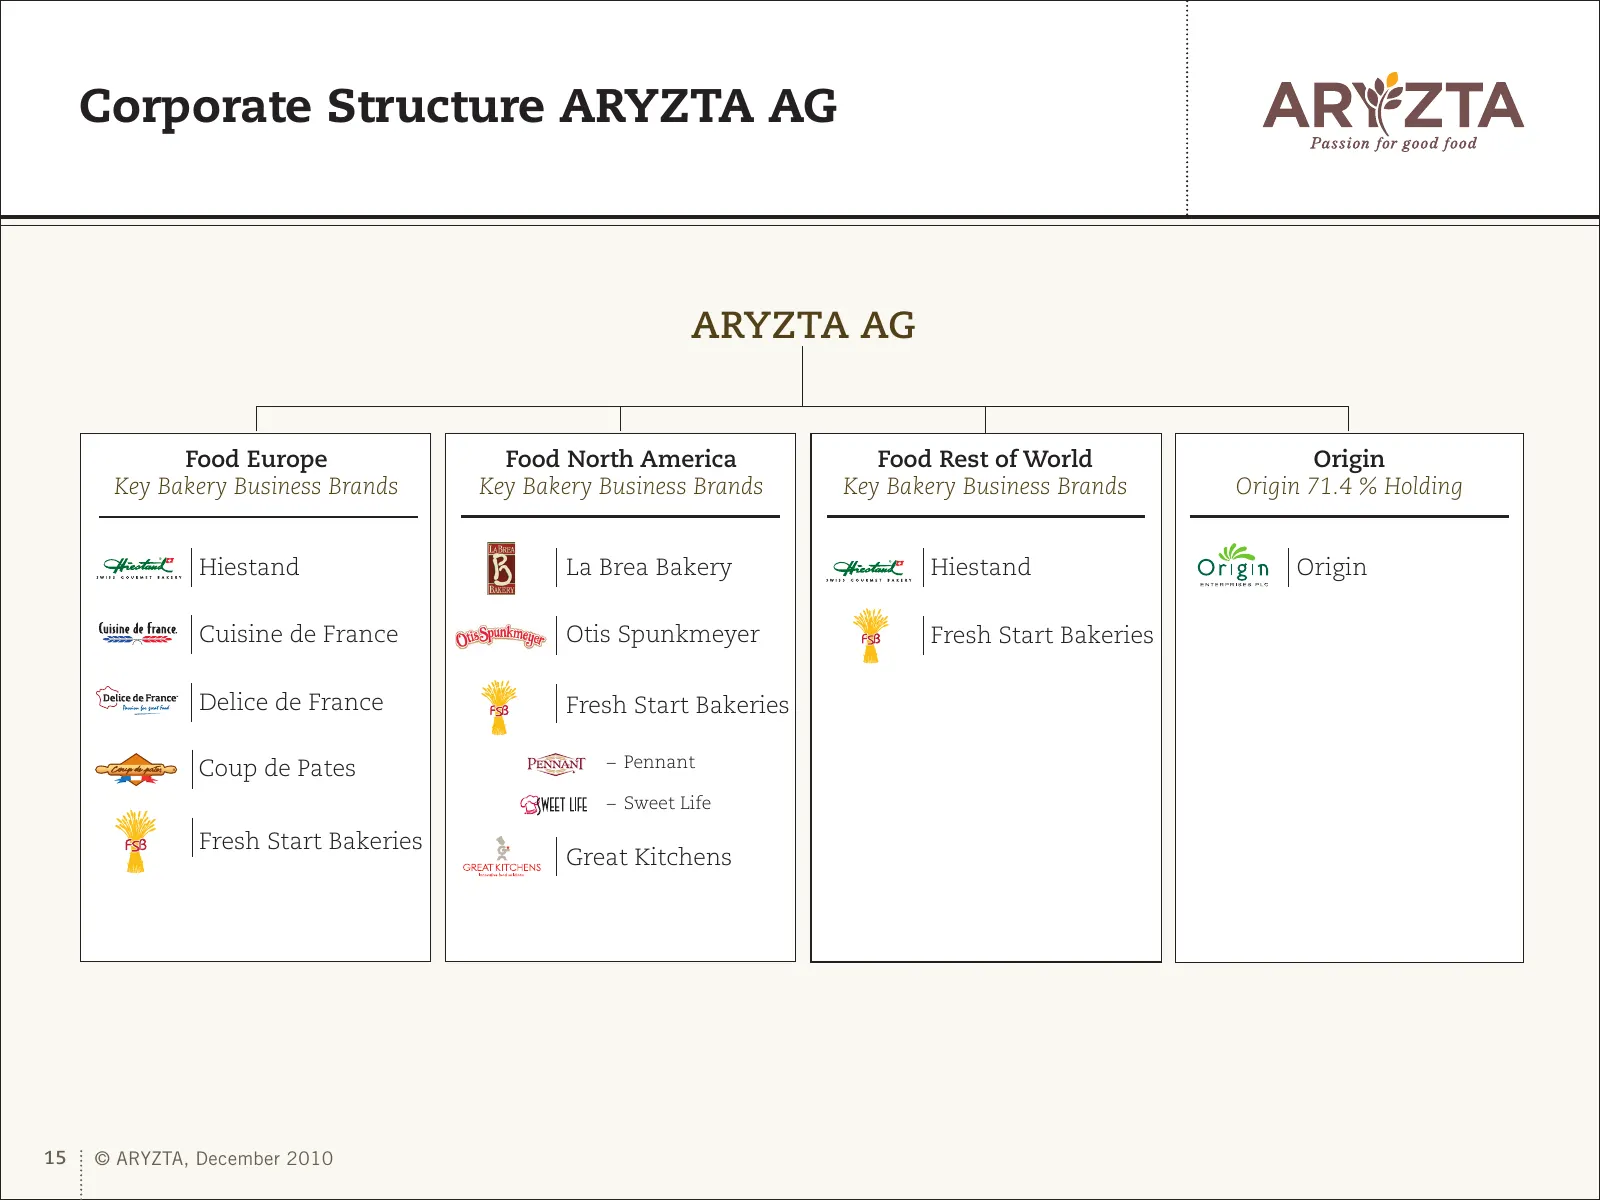
Corporate Structure ARYZTA AG ARYZTA AG Food Europe Food North America Food Rest of World Origin Key Bakery Business Brands Key Bakery Business Brands Key Bakery Business Brands Origin 71.4 % Holding Hiestand La Brea Bakery Hiestand Origin Cuisine de France Otis Spunkmeyer Fresh Start Bakeries Delic
Slide 16: Origin 71.4% Holding
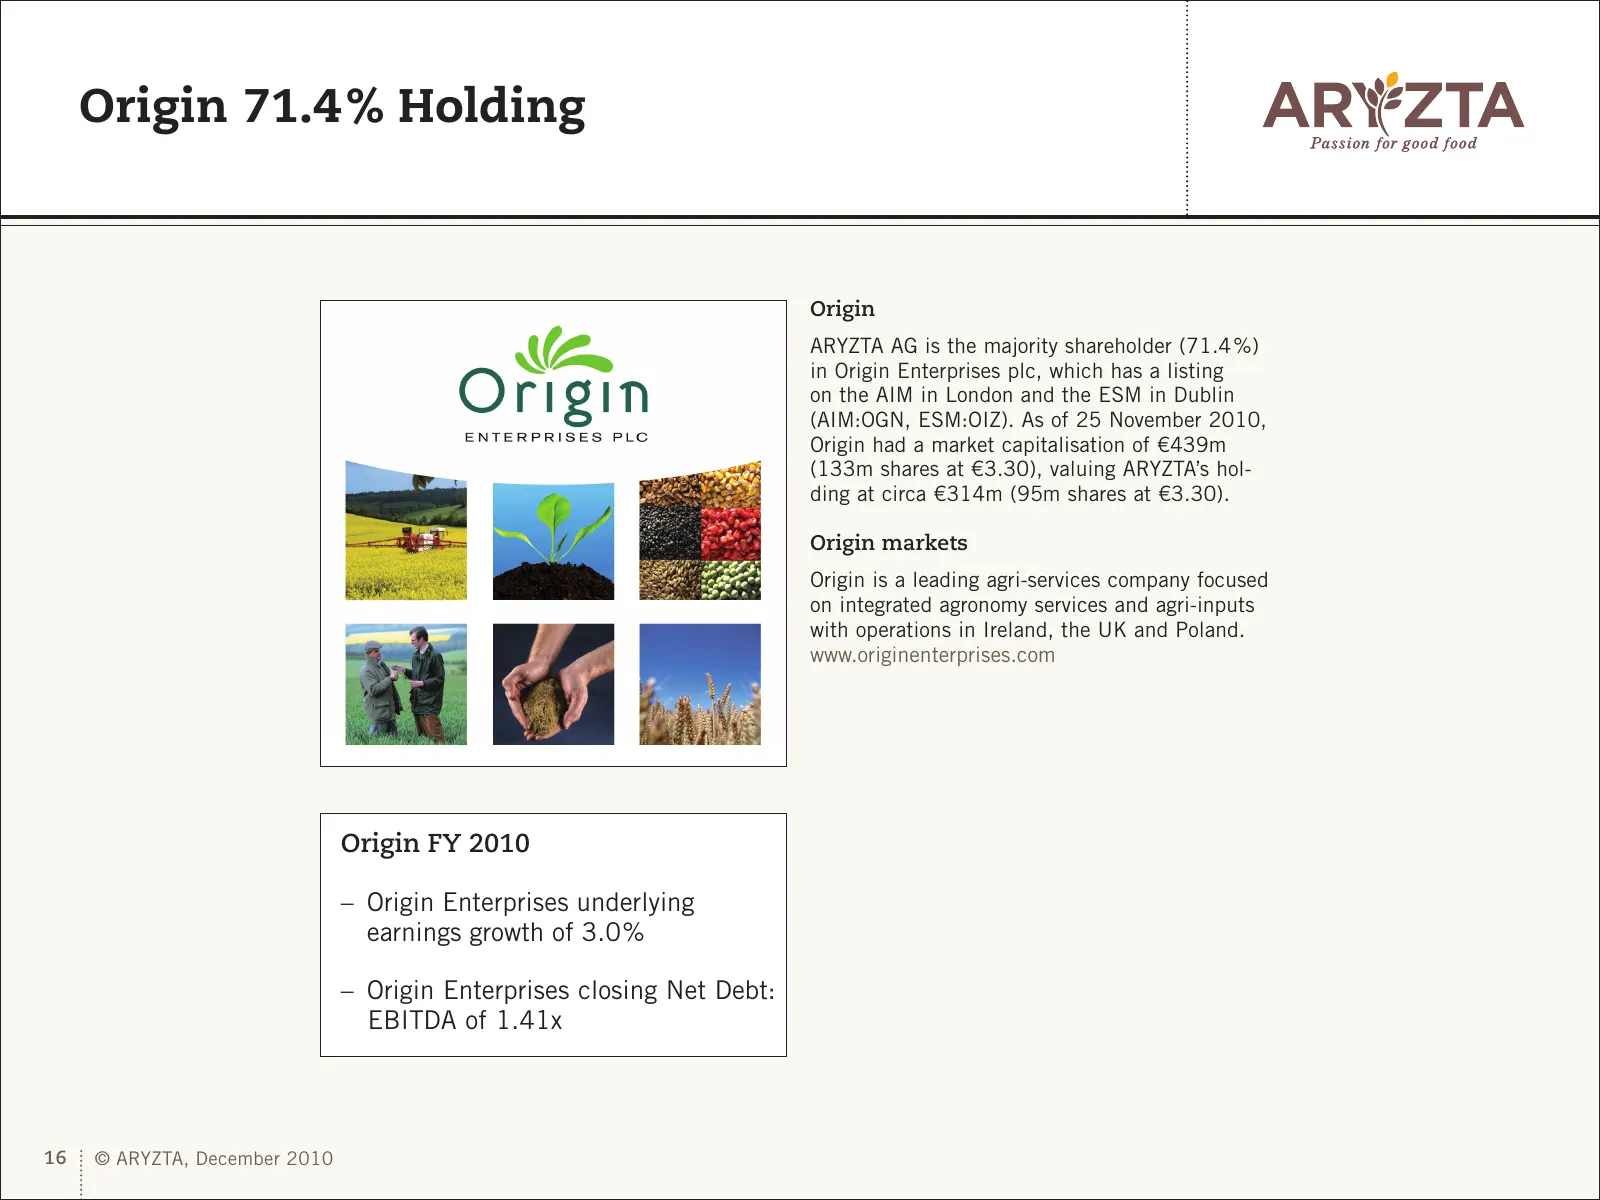
Origin 71.4 % Holding Origin ARYZTA AG is the majority shareholder (71.4 %) in Origin Enterprises plc, which has a listing on the AIM in London and the ESM in Dublin (AIM:OGN, ESM:OIZ). As of 25 November 2010, Origin had a market capitalisation of €439m (133m shares at €3.30), valuing ARYZTA’s hol-
Slide 17: Geographic Reach – Food Group
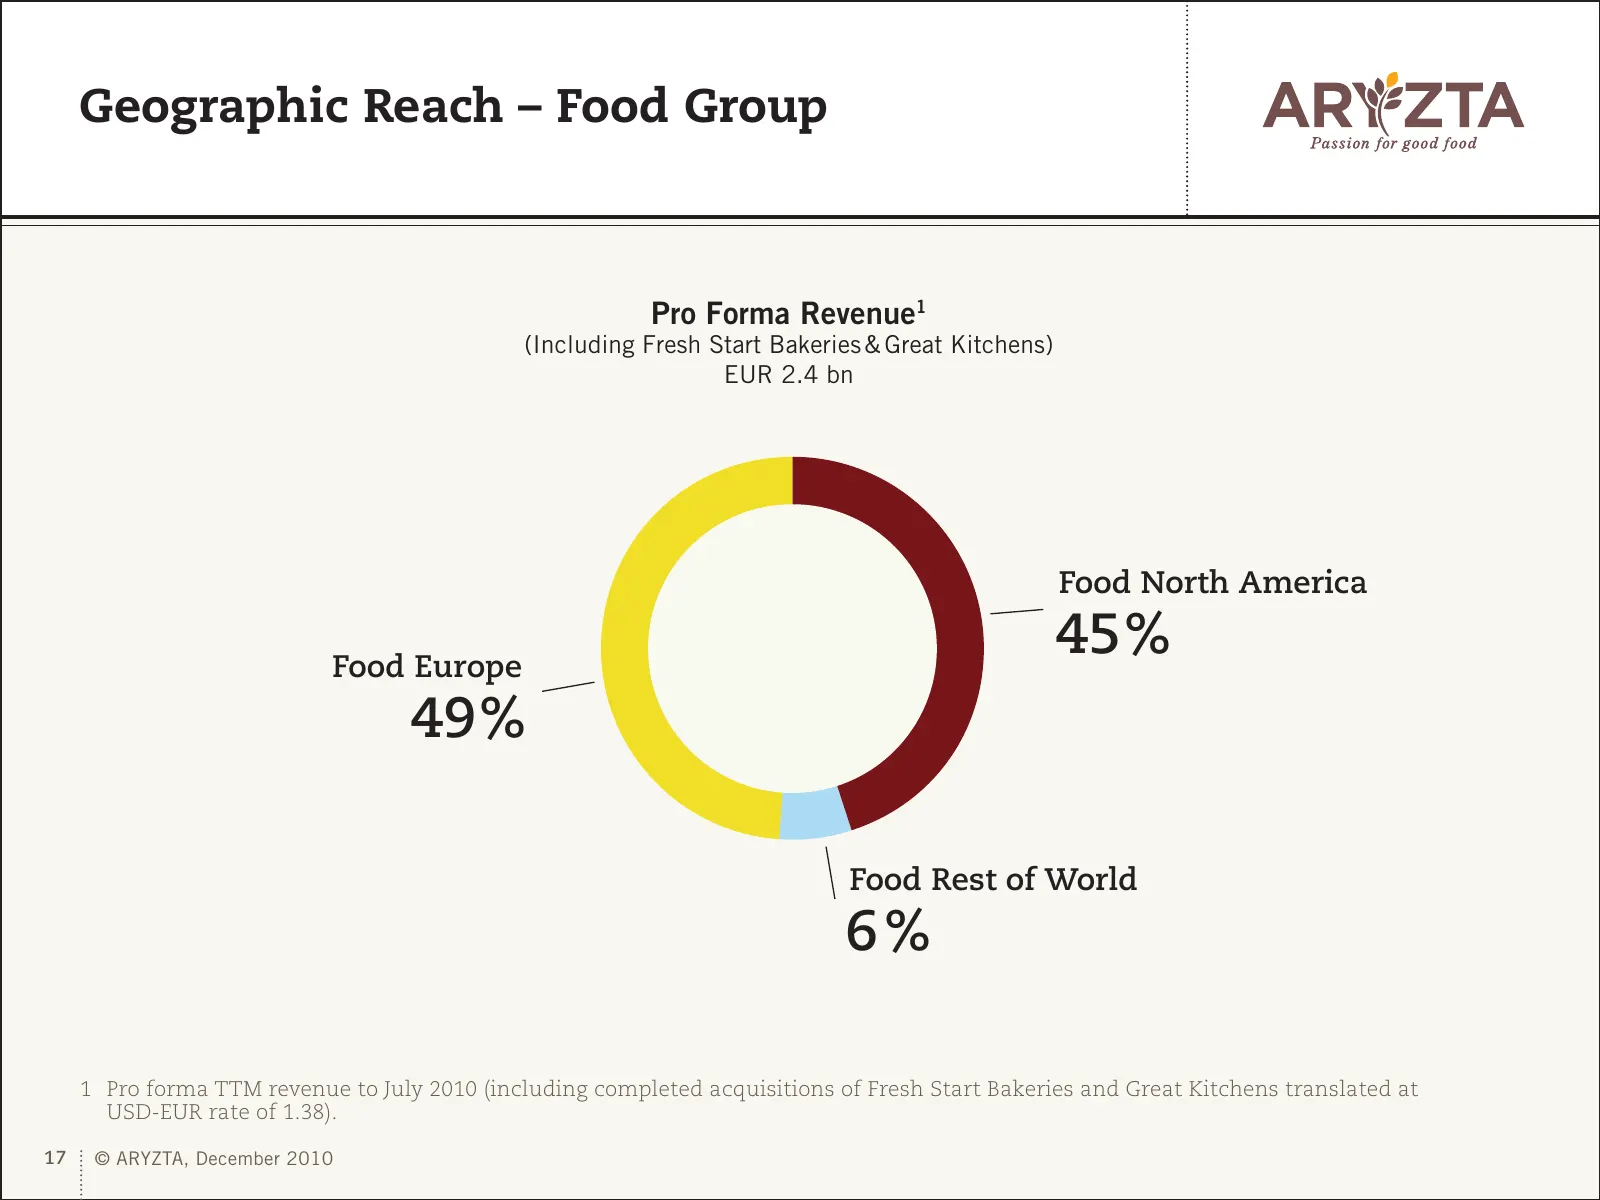
Geographic Reach – Food Group Pro Forma Revenue1 (Including Fresh Start Bakeries & Great Kitchens) EUR 2.4 bn Food North America Food Europe 45% 49% Food Rest of World 6% Pro Forma Revenue1 (Including Fresh Start Bakeries & Great Kitchens) EUR 2.4 bn 1 Pro forma TTM revenue to July 2010 (including c
Slide 18: Our Markets – Food Europe
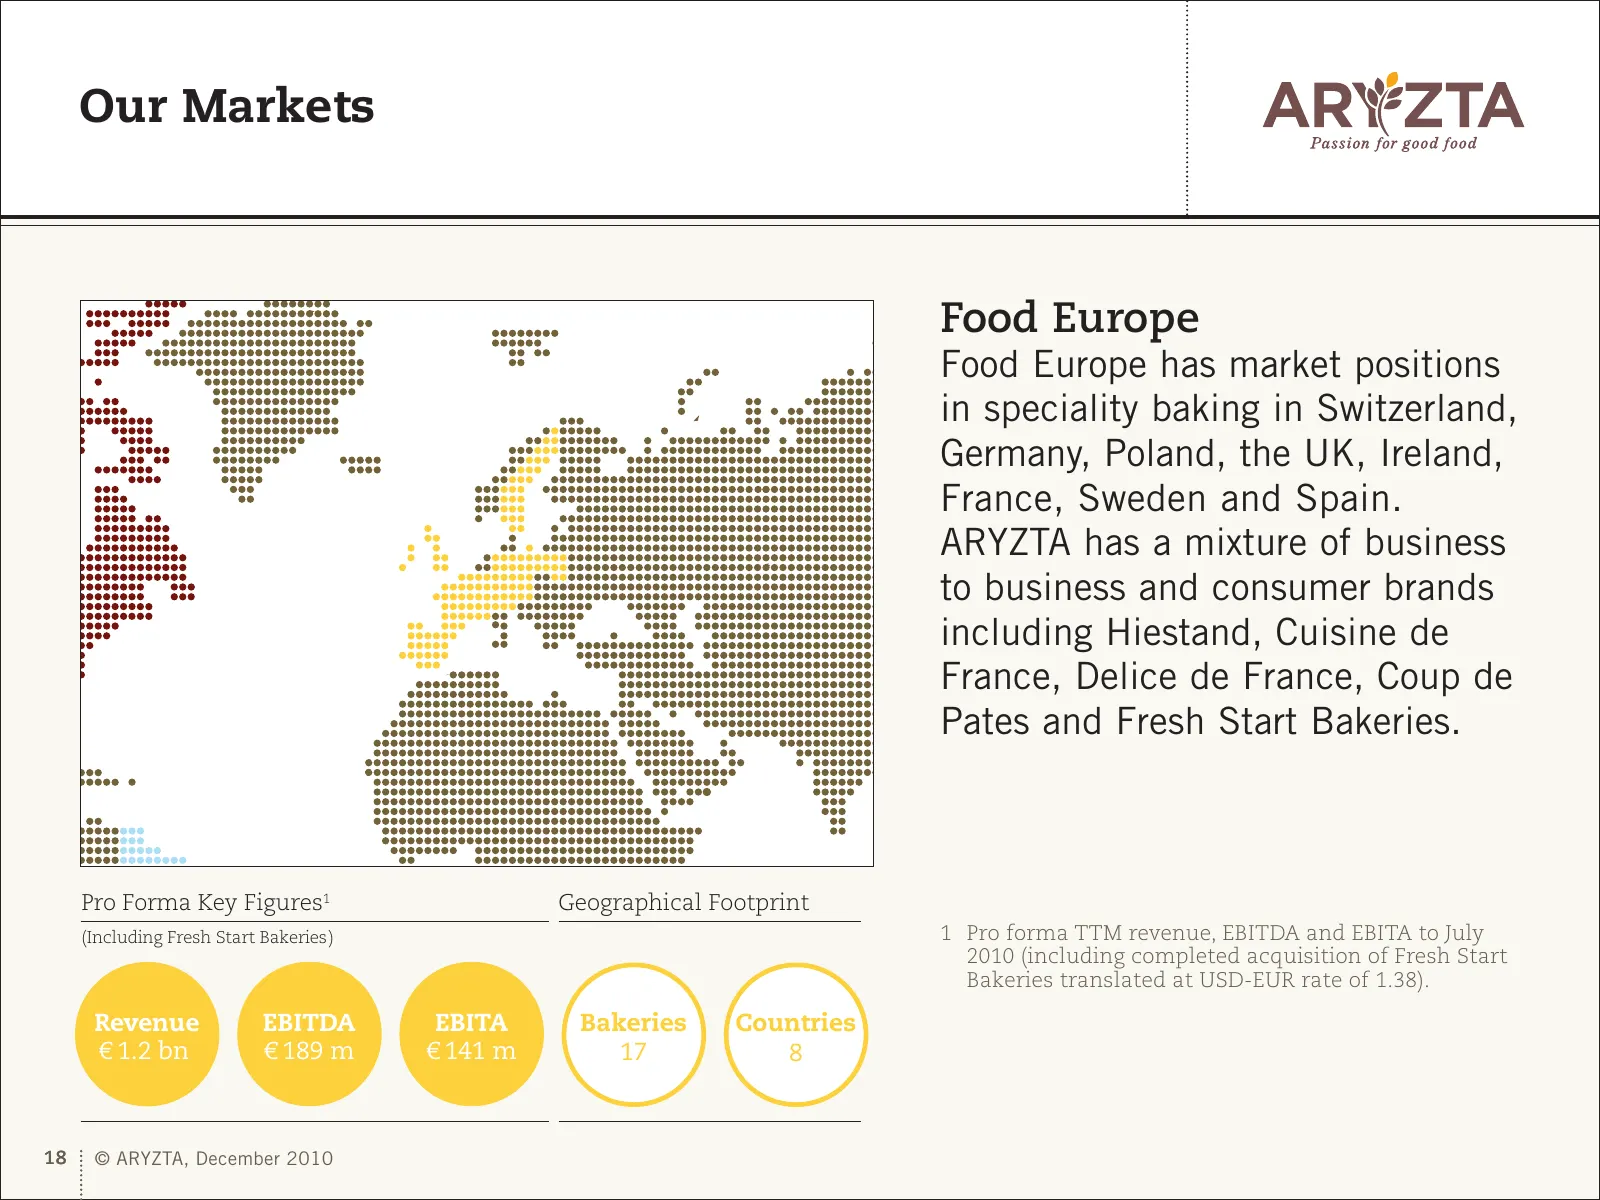
Our Markets Food Europe Food Europe has market positions in speciality baking in Switzerland, Germany, Poland, the UK, Ireland, France, Sweden and Spain. ARYZTA has a mixture of business to business and consumer brands including Hiestand, Cuisine de Pro Forma Key Figures1 Geographical Footprint (I
Slide 19: Food Europe
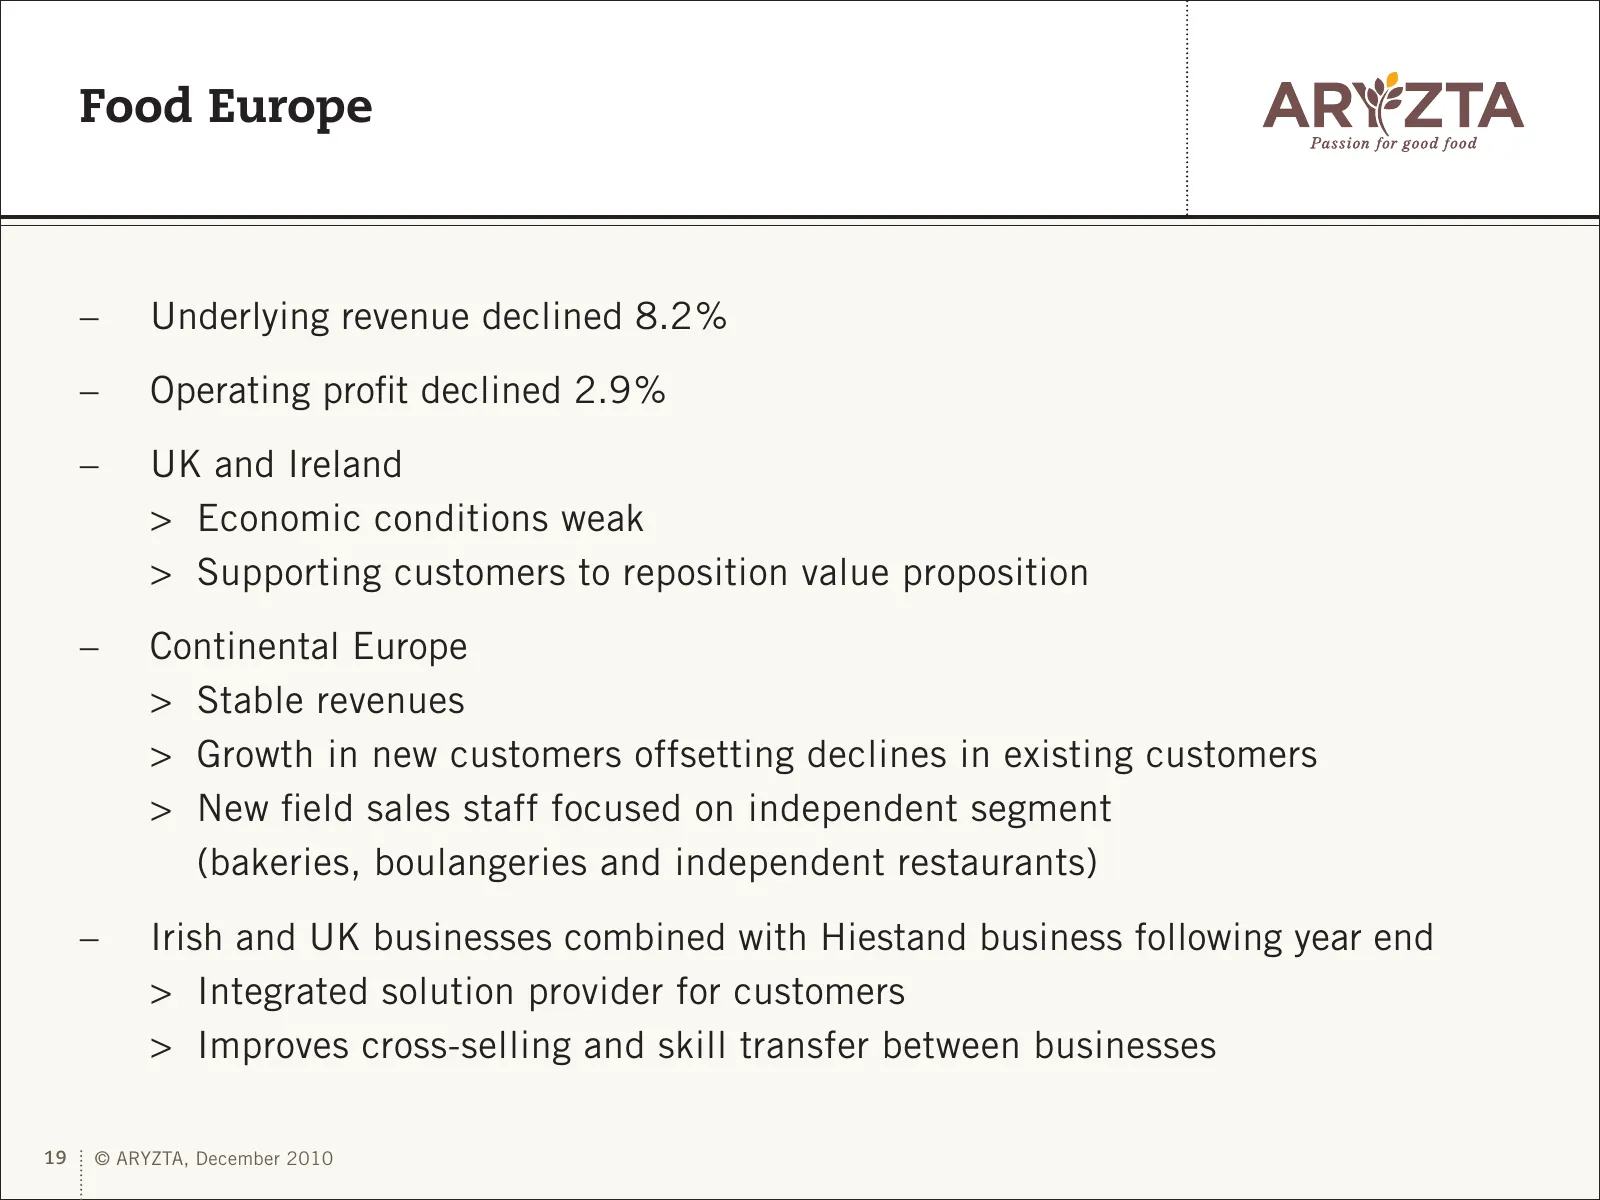
Food Europe – Underlying revenue declined 8.2 % – Operating profit declined 2.9 % – UK and Ireland > Economic conditions weak > Supporting customers to reposition value proposition – Continental Europe > Stable revenues > Growth in new customers offsetting declines in existing customers > New field
Slide 20: Our Markets – Food North America
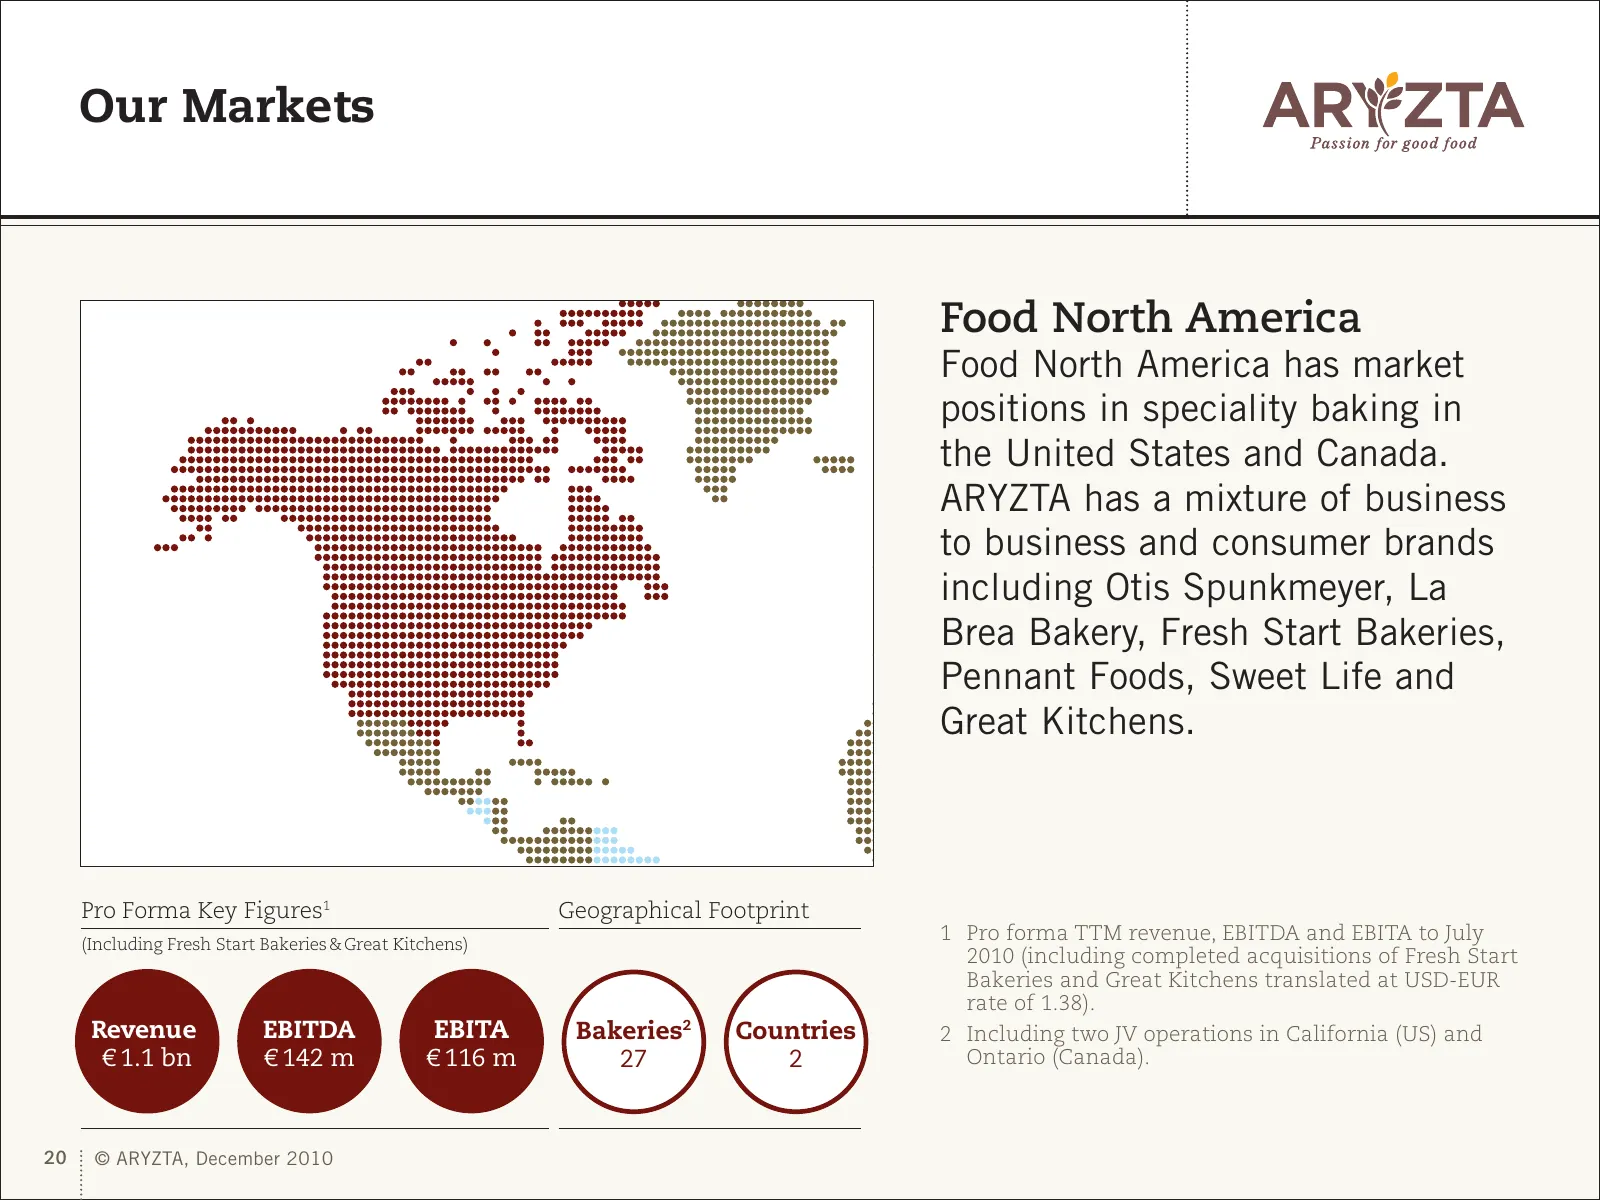
Our Markets Food North America Food North America has market positions in speciality baking in the United States and Canada. ARYZTA has a mixture of business to business and consumer brands including Otis Spunkmeyer, La Brea Bakery, Fresh Start Bakeries, Pennant Foods, Sweet Life and Great Kitchens
Slide 21: Food North America
Food North America – Underlying revenue declined 4.3 % – Revenue declined from high 2009 comparator – Operating profit increased 3.6 % – Cost curtailment and operating efficiencies drive profit growth – Product innovation remains critical to consumer experience – Economic conditions weak > Value pro
Slide 22: Our Markets – Food Rest of World
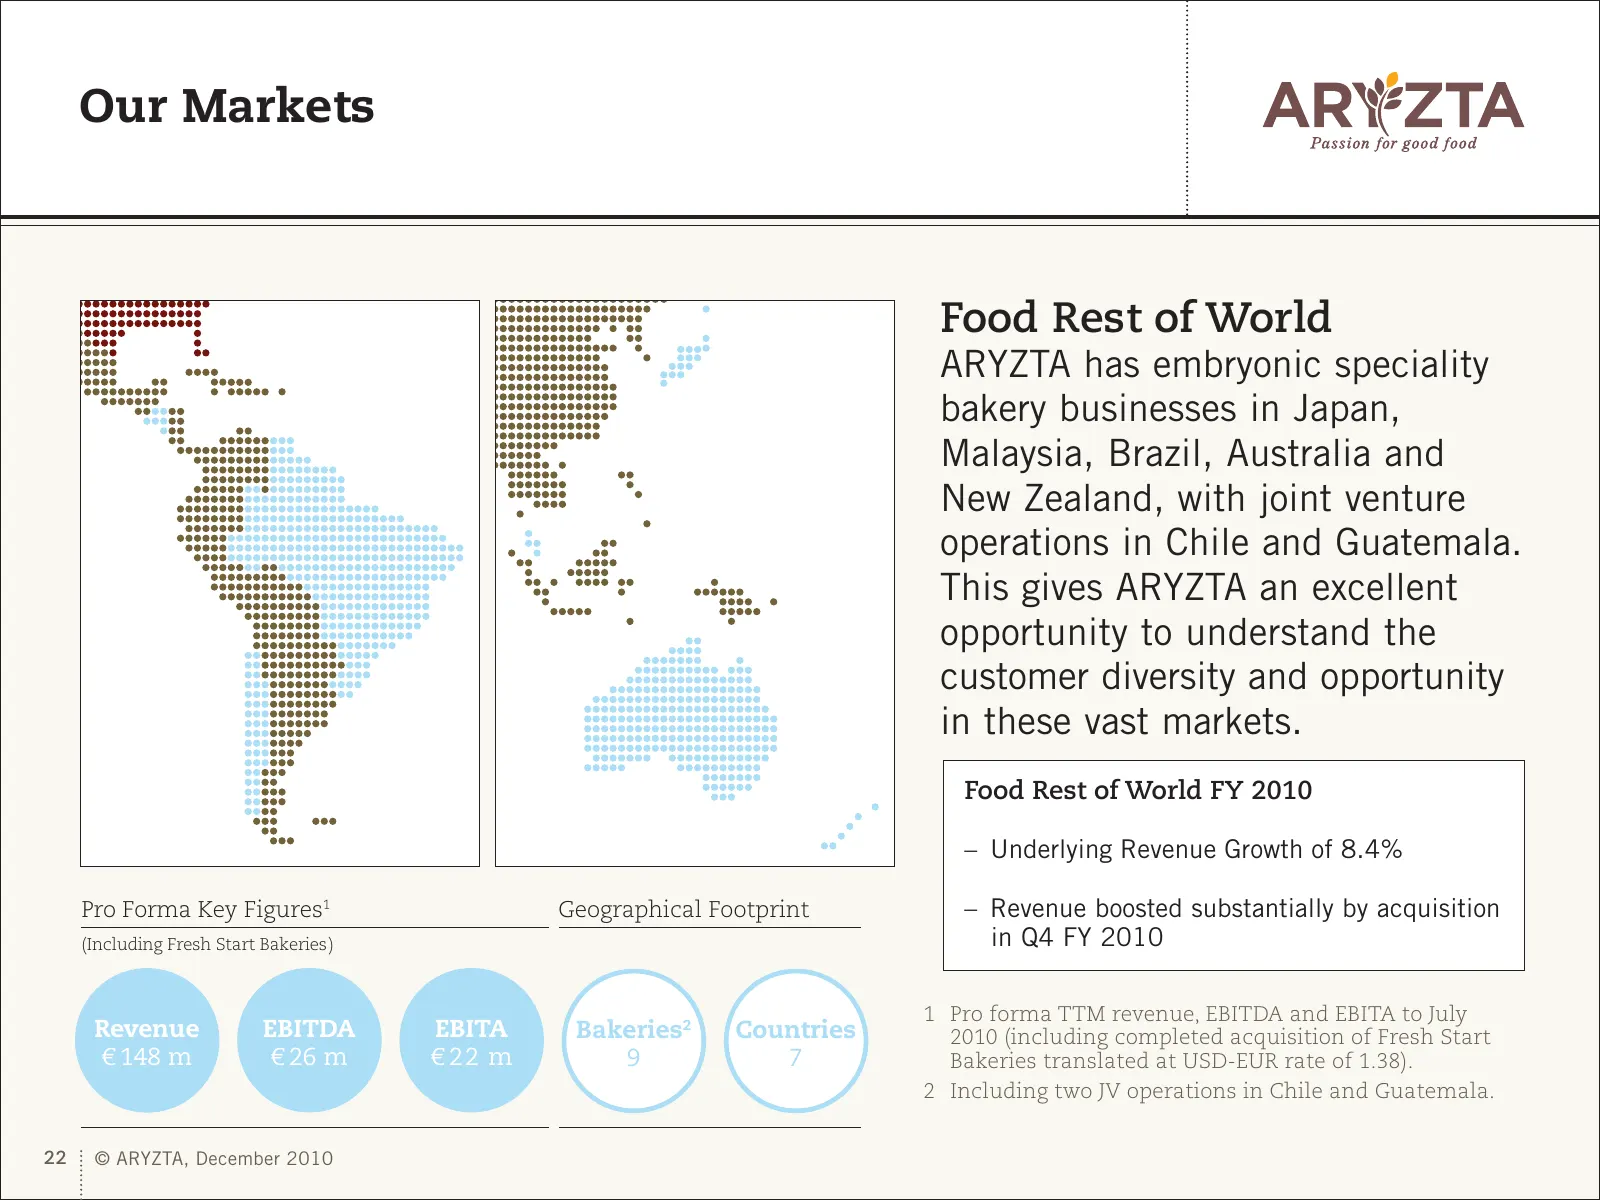
Our Markets Food Rest of World ARYZTA has embryonic speciality Pro Forma Key Figures1 Geographical Footprint bakery businesses in Japan, (Including Fresh Start Bakeries&Great Kitchens) Malaysia, Brazil, Australia and New Zealand, with joint venture Revenue EBITDA EBITA Bakeries2 Countries operations
Slide 23: Total Baked Goods Market
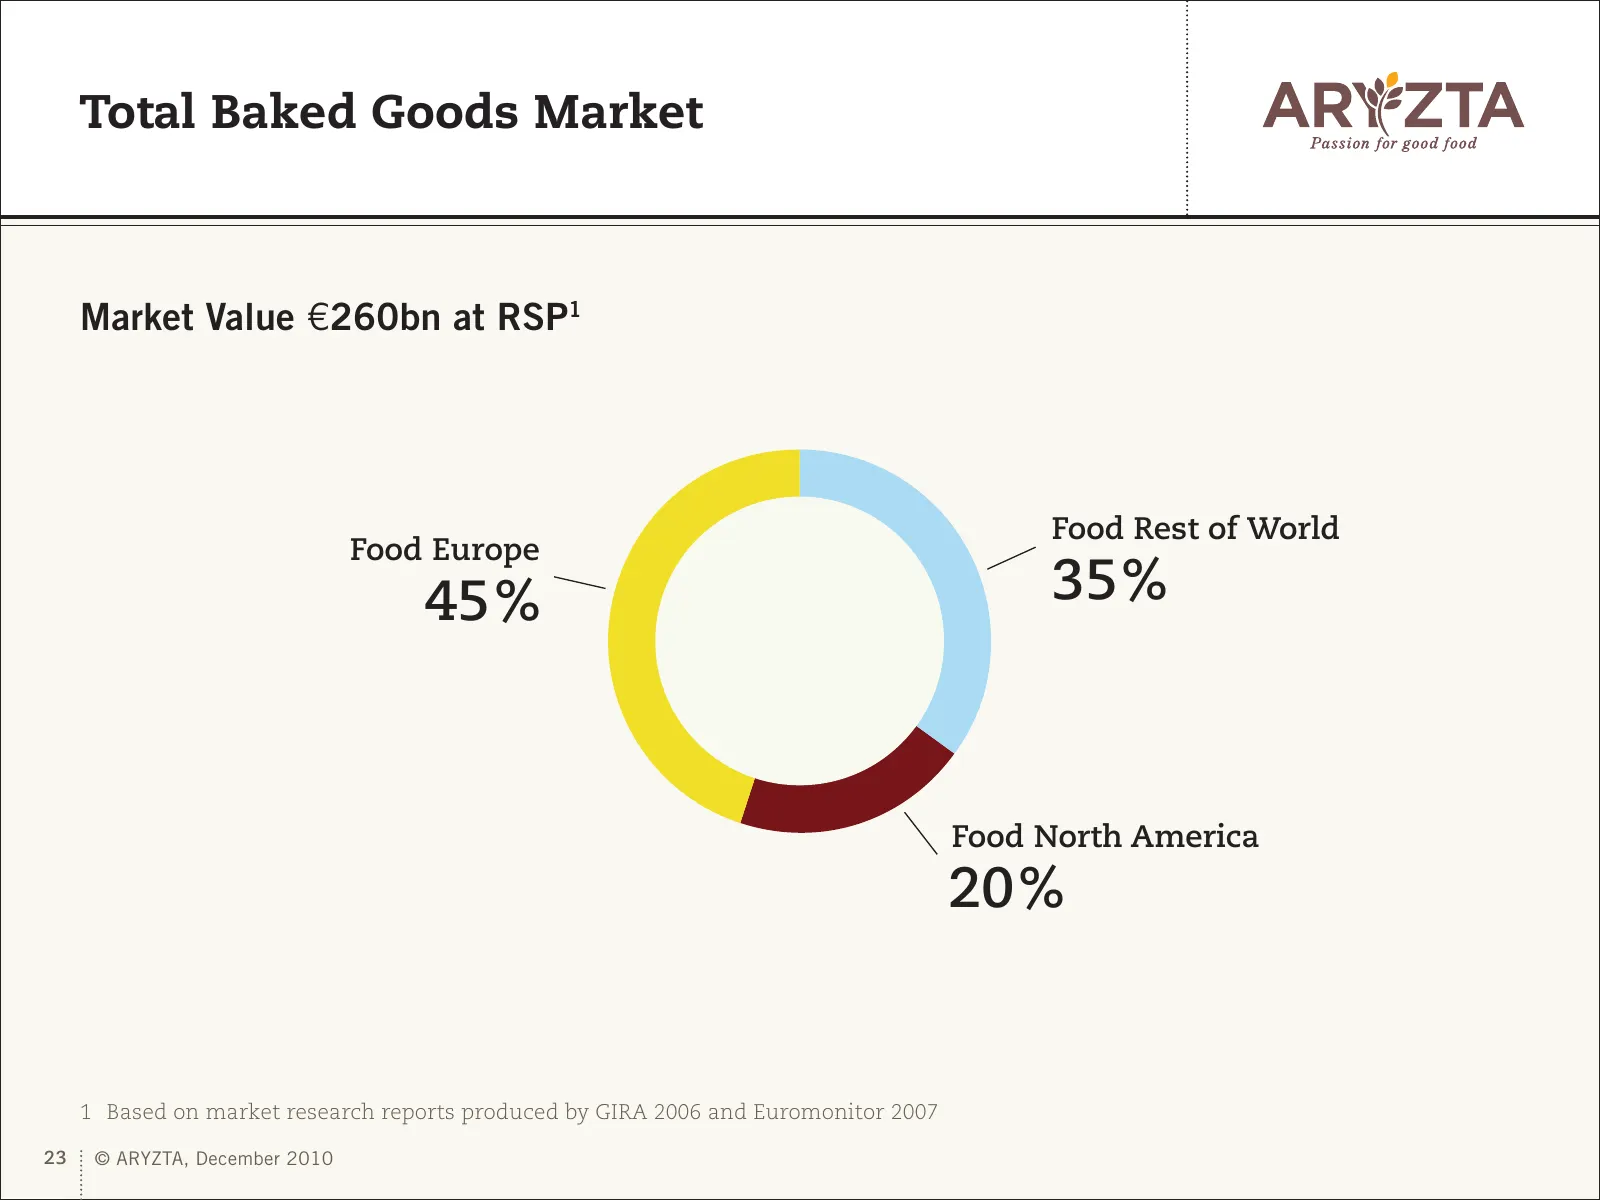
Total Baked Goods Market Market Value €260bn at RSP1 Food Rest of World Food Europe 45% 35% Food North America 20% 1 Based on market research reports produced by GIRA 2006 and Euromonitor 2007 23 © ARYZTA, December 2010
Slide 24: Speciality Bakery Market
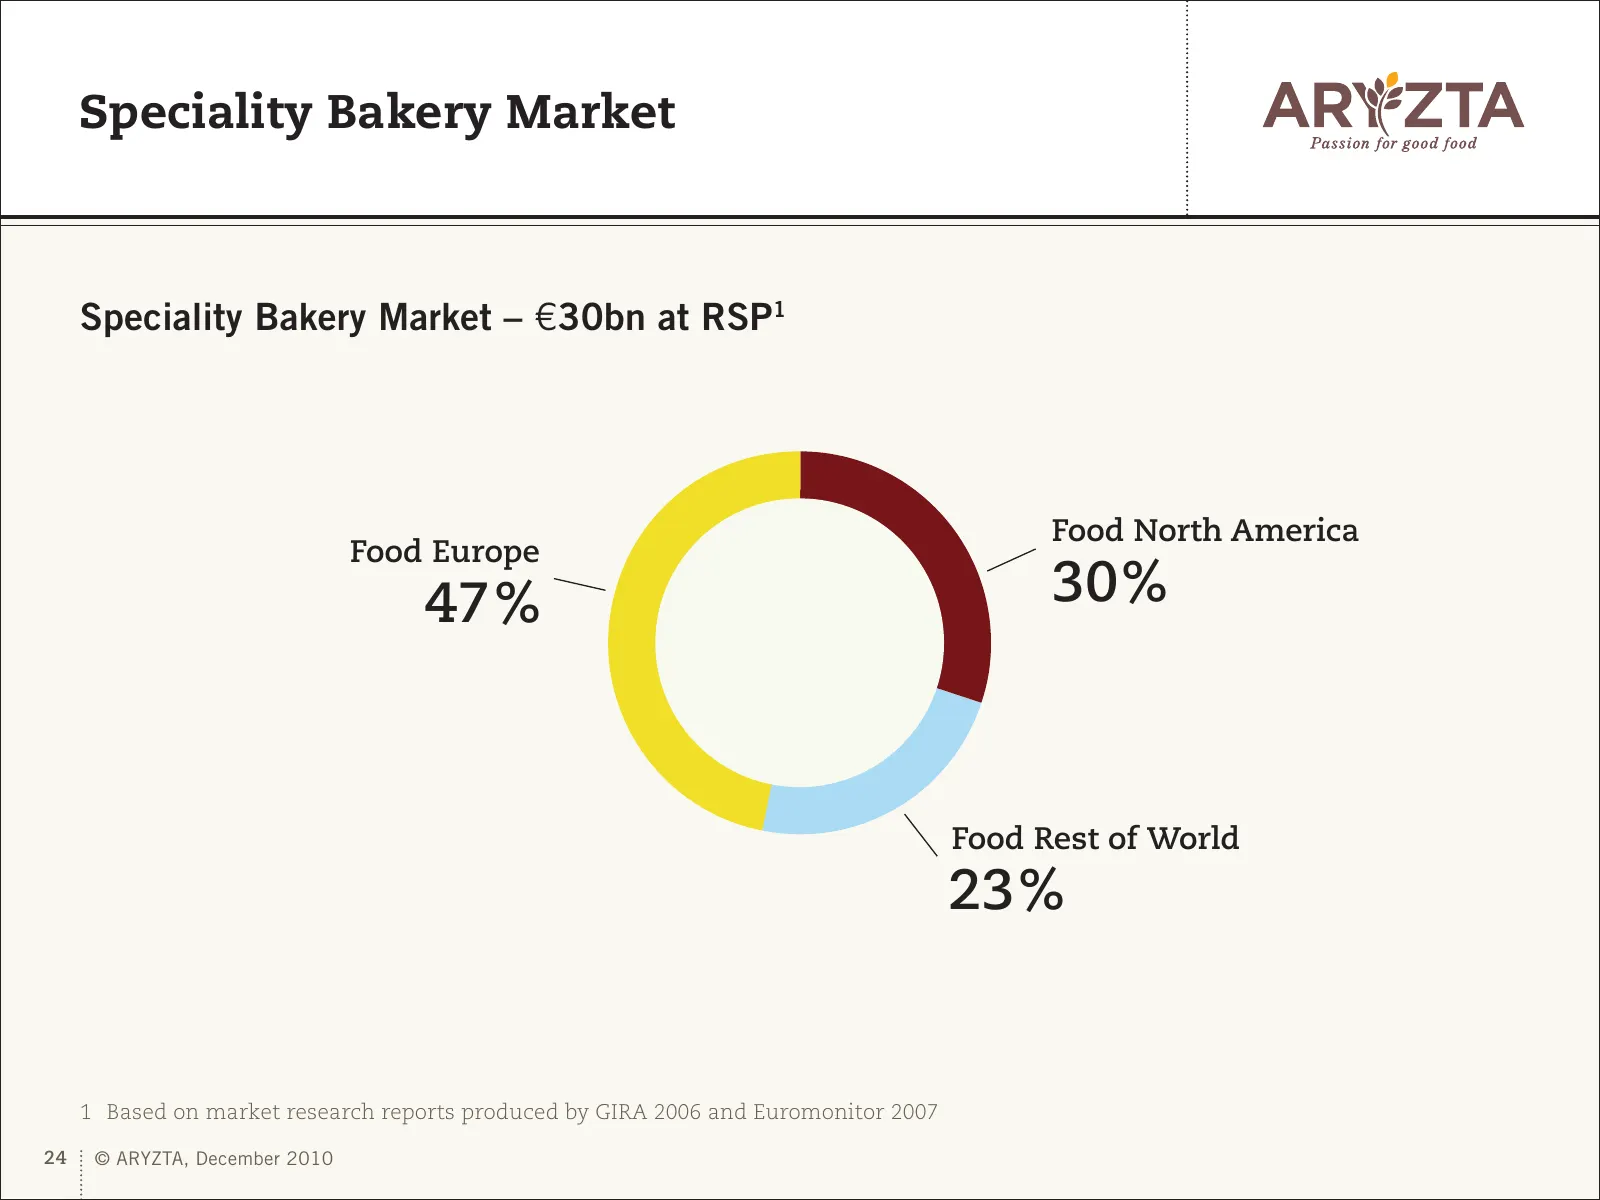
Speciality Bakery Market Speciality Bakery Market – €30bn at RSP1 Food North America Food Europe 47% 30% Food Rest of World 23% 1 Based on market research reports produced by GIRA 2006 and Euromonitor 2007 24 © ARYZTA, December 2010
Slide 25: ARYZTA Positioning
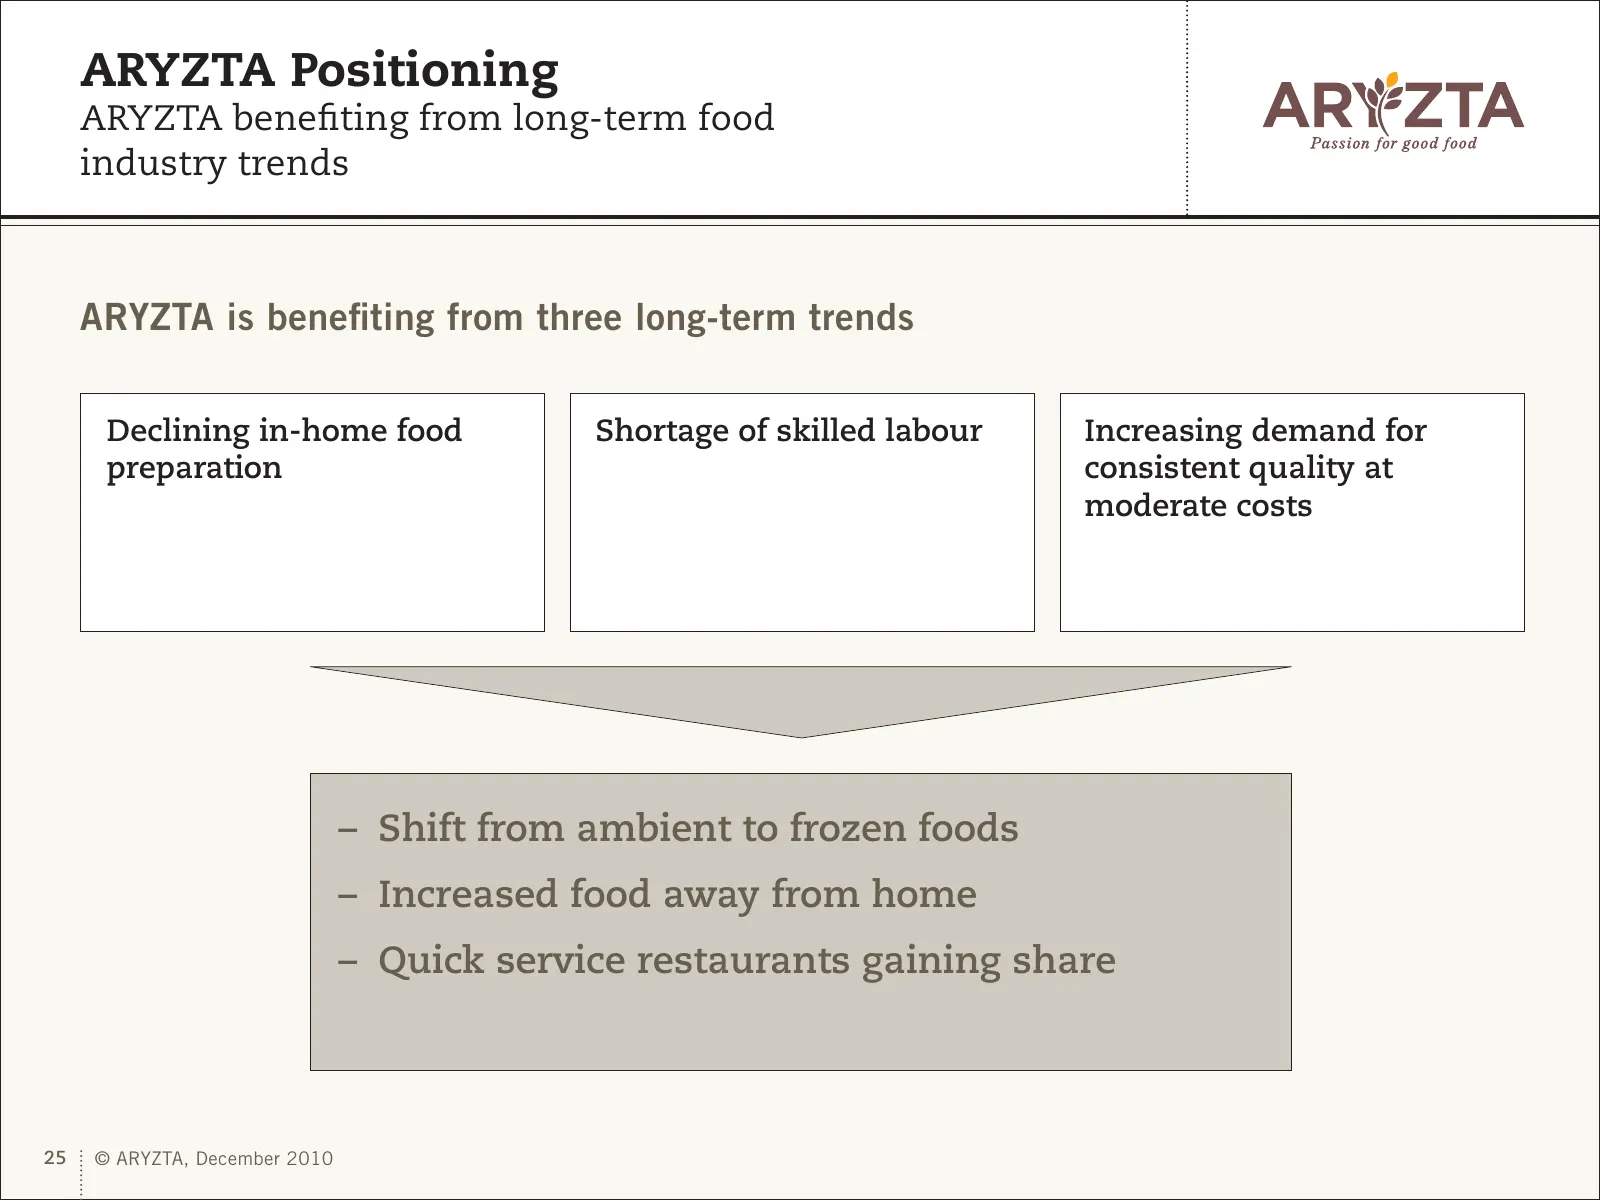
ARYZTA Positioning ARYZTA benefiting from long-term food industry trends ARYZTA is benefiting from three long-term trends Declining in-home food Shortage of skilled labour Increasing demand for preparation consistent quality at moderate costs – Shift from ambient to frozen foods – Increased food awa
Slide 26: ARYZTA Positioning
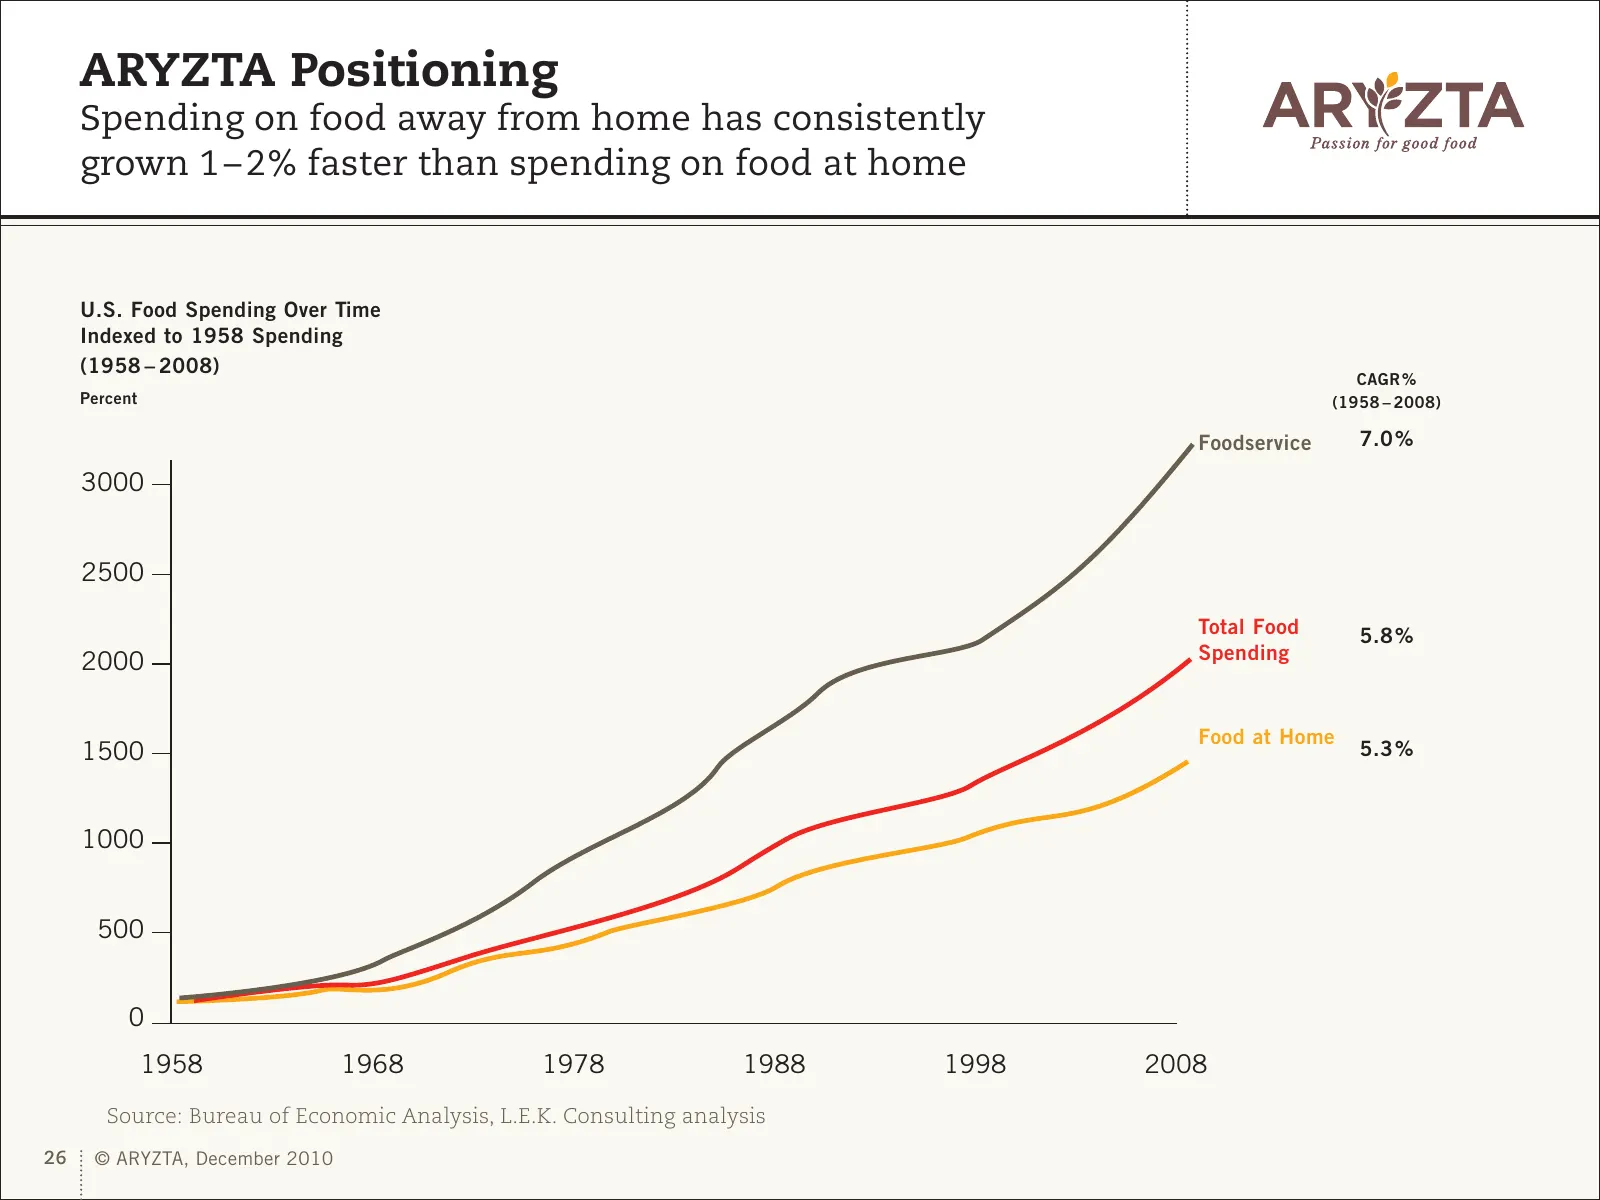
ARYZTA Positioning Spending on food away from home has consistently grown 1 – 2 % faster than spending on food at home U.S. Food Spending Over Time Indexed to 1958 Spending (1958 – 2008) CAGR % Percent (1958 – 2008) Foodservice 7.0 % 3000 2500 Total Food 5.8 % 2000 Spending Food at Home 1500 5.3 % 1
Slide 27: ARYZTA Positioning
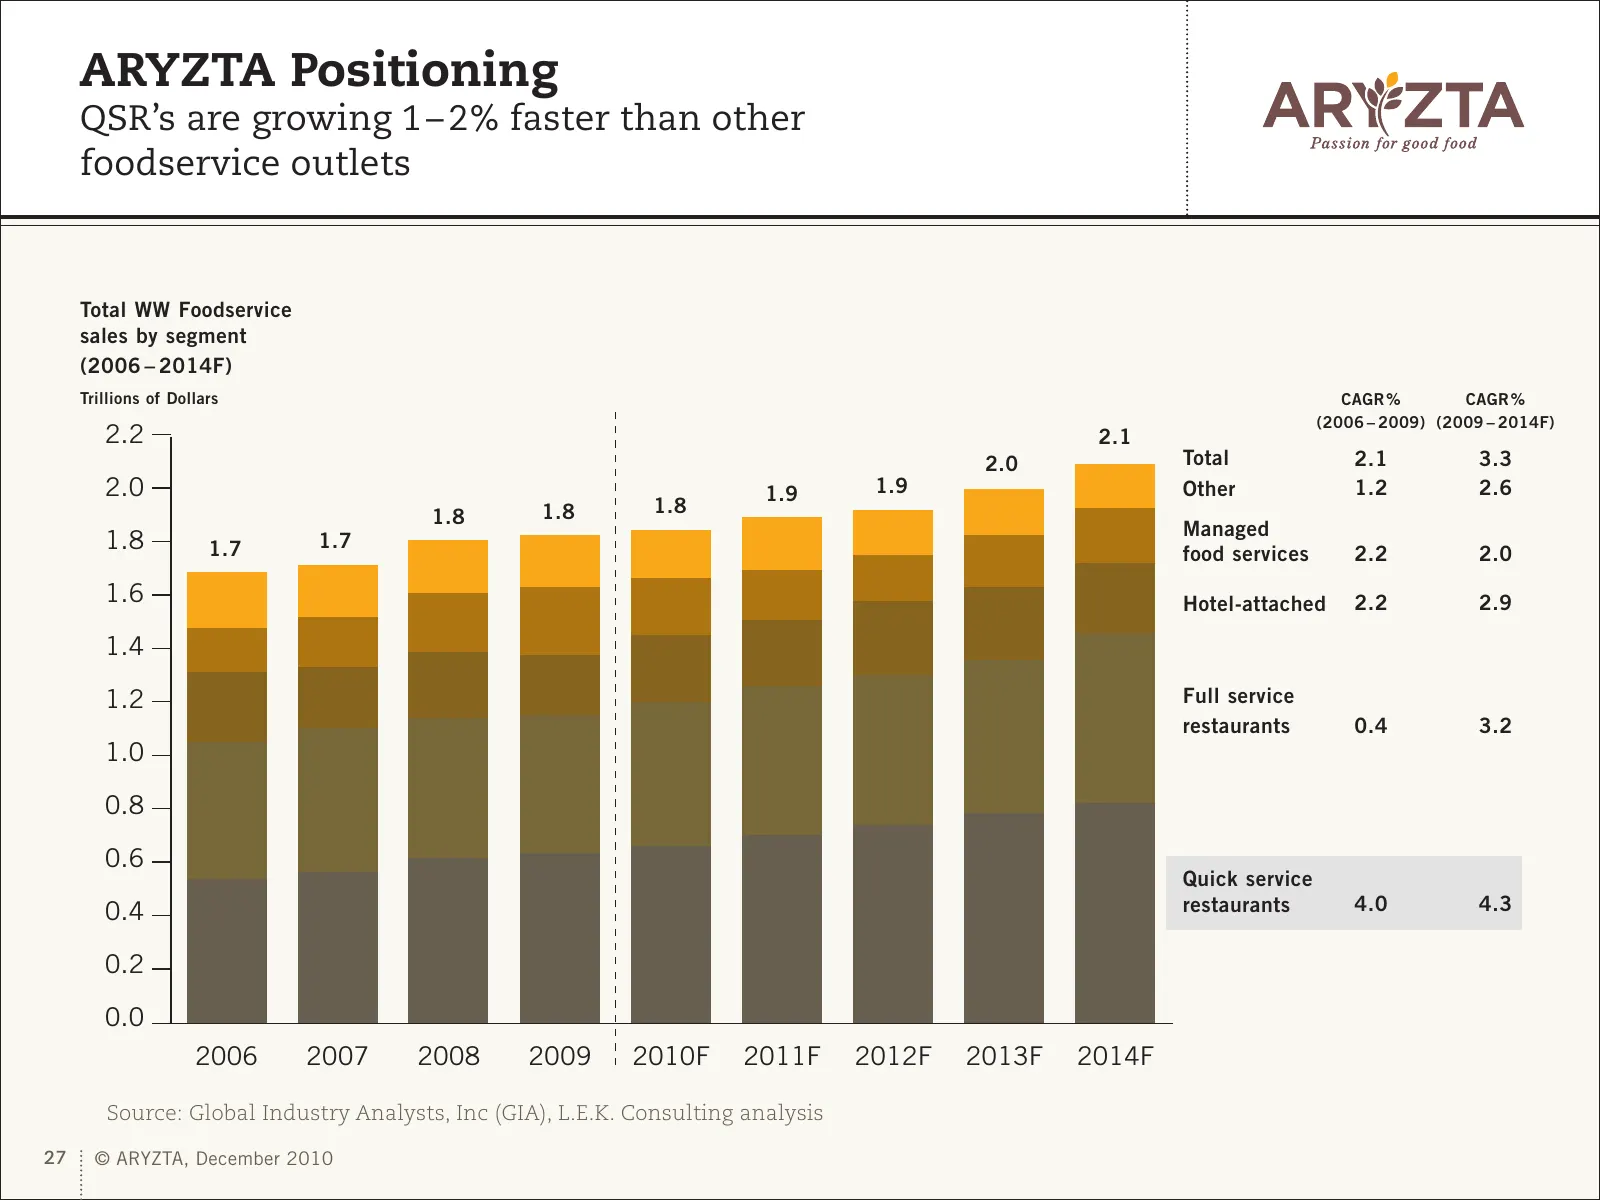
ARYZTA Positioning QSR’s are growing 1 – 2 % faster than other foodservice outlets Total WW Foodservice sales by segment (2006 – 2014F) Trillions of Dollars CAGR % CAGR % (2006 – 2009) (2009 – 2014F) 2.2 2.1 2.0 Total 2.1 3.3 2.0 1.9 1.9 Other 1.2 2.6 1.8 1.8 1.8 Managed 1.8 1.7 1.7 food services 2.
Slide 28: ARYZTA Positioning
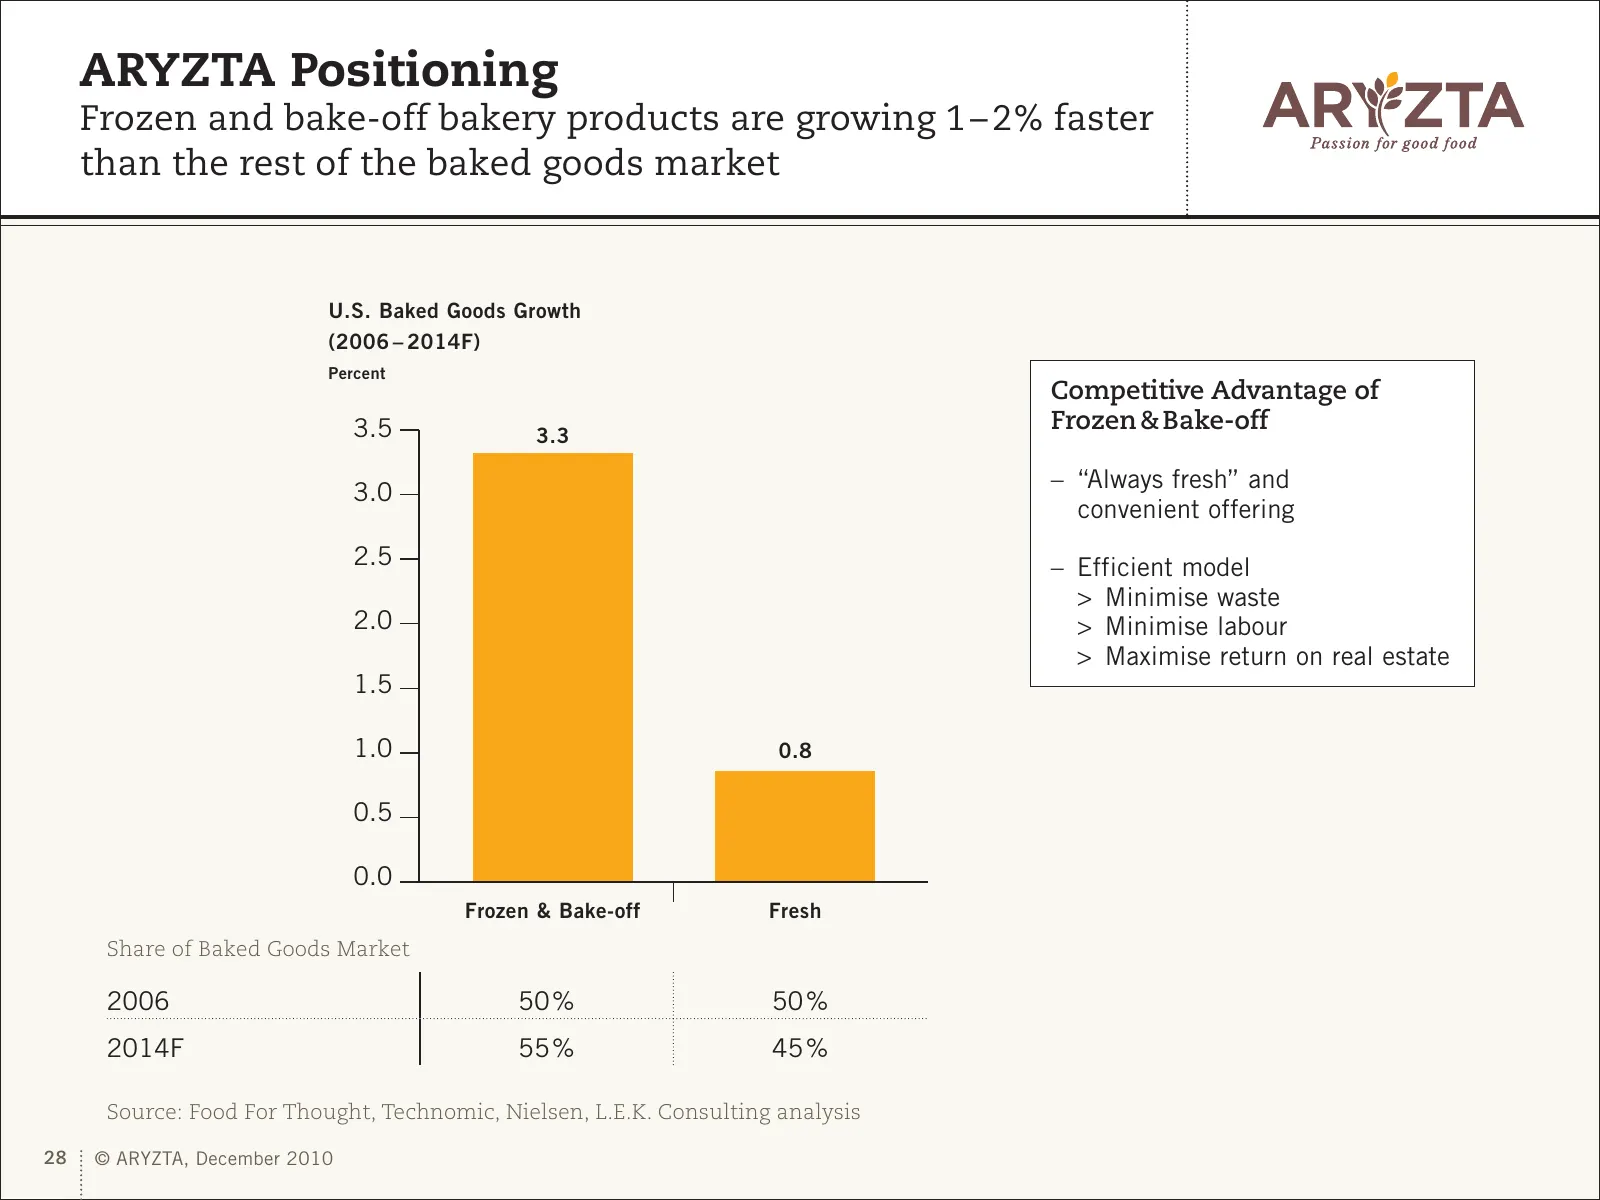
ARYZTA Positioning Frozen and bake-off bakery products are growing 1 – 2 % faster than the rest of the baked goods market U.S. Baked Goods Growth (2006 – 2014F) Percent Competitive Advantage of 3.5 Frozen & Bake-off 3.3 3.0 – “Always fresh” and convenient offering 2.5 – Efficient model > Minimise wa
Slide 29: ARYZTA Strategic Evolution
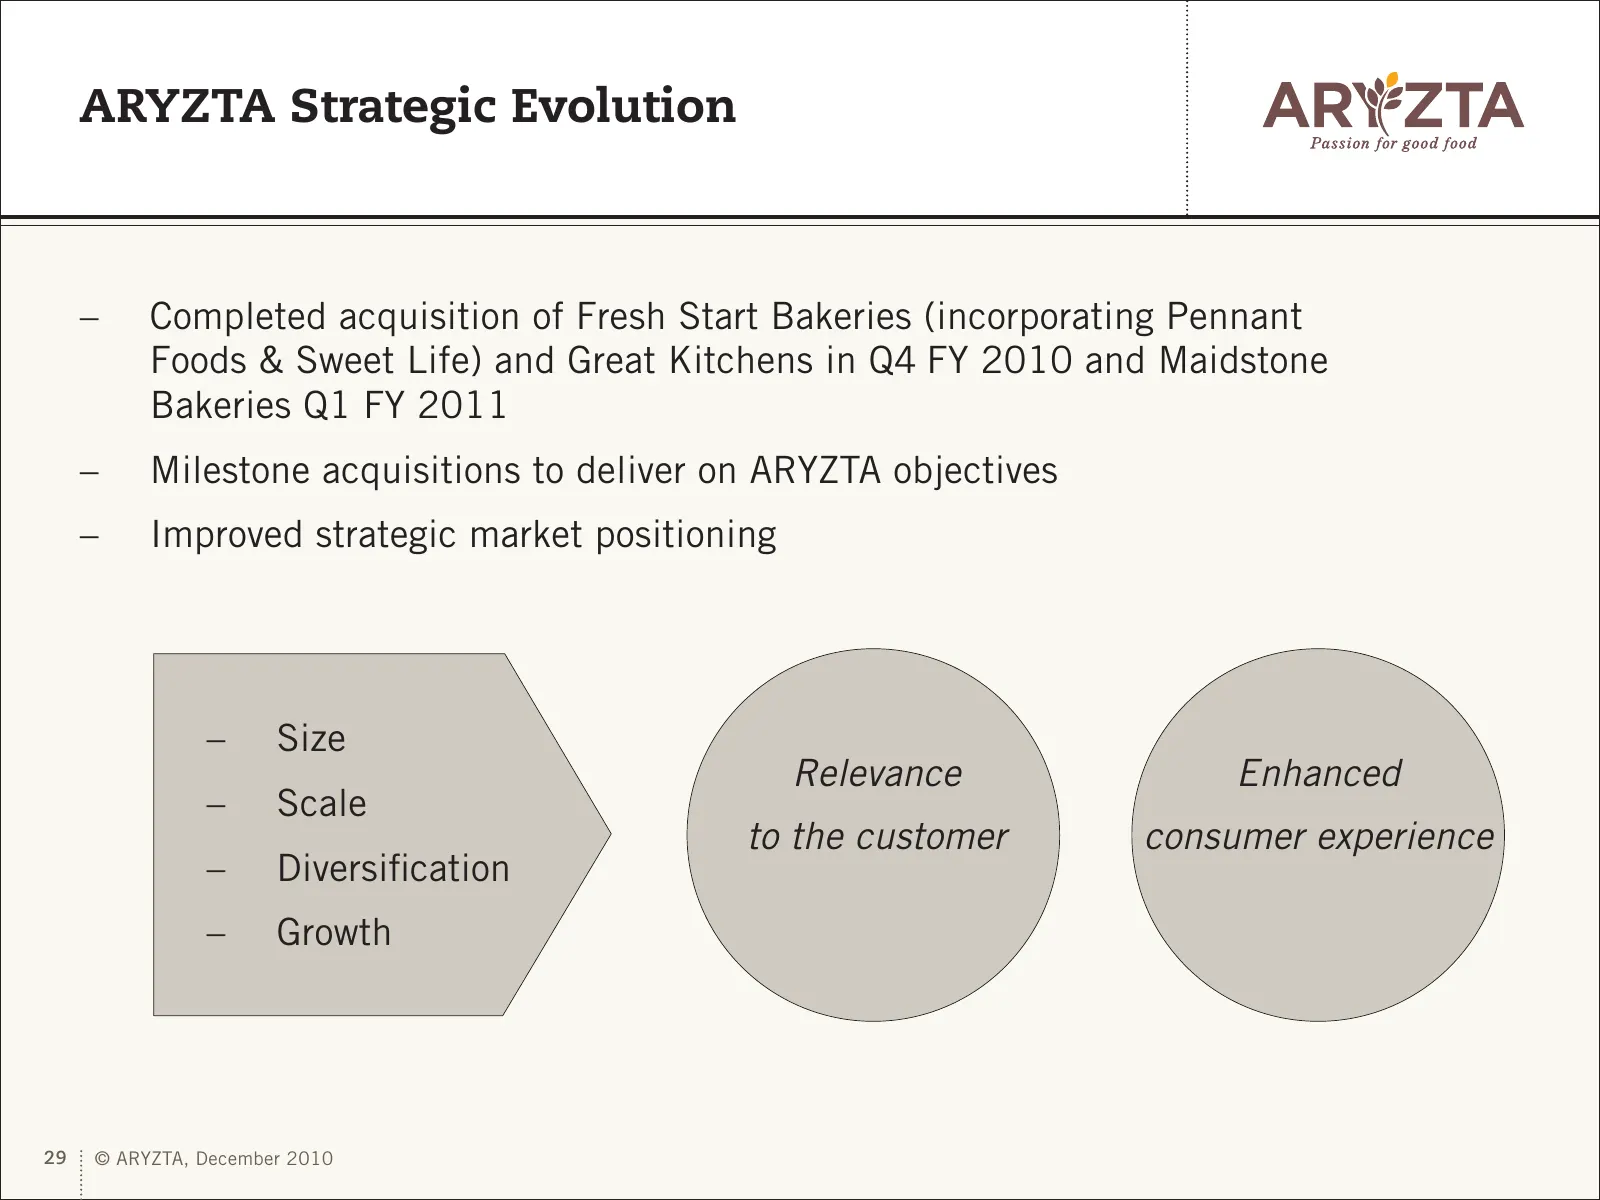
ARYZTA Strategic Evolution – Completed acquisition of Fresh Start Bakeries (incorporating Pennant Foods & Sweet Life) and Great Kitchens in Q4 FY 2010 and Maidstone Bakeries Q1 FY 2011 – Milestone acquisitions to deliver on ARYZTA objectives – Improved strategic market positioning – Size Relevance E
Slide 30: Acquisitions: Great strategic fit
Acquisitions Great strategic fit Rationale – Geographic expansion in Europe – Product expansion in North America – Increase channel access into retail and QSR – Build capabilities in Food Rest of World segment – Substantially increased bakery capability and capacity What did we find? > Tremendous de
Slide 31: Customer Channel Mix – Food Group
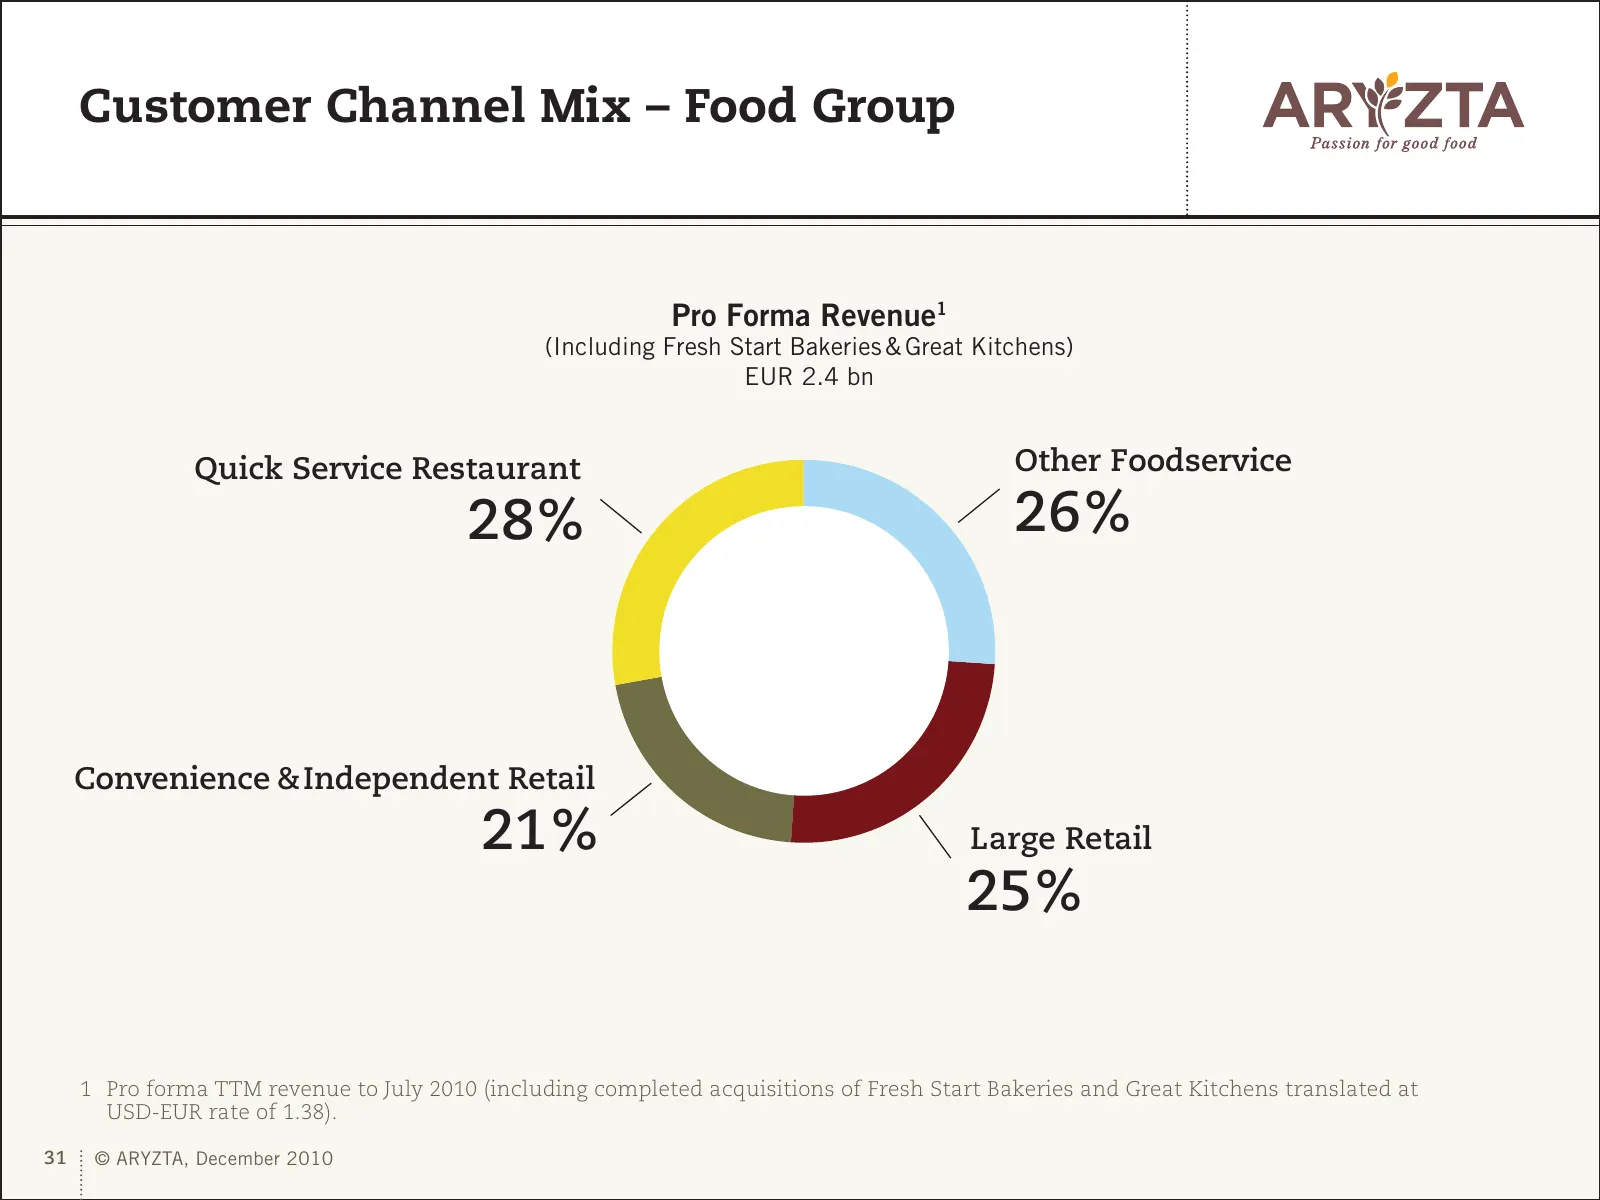
49% Customer Channel Mix – Food Group Food Rest of World 6% Pro Forma Revenue1 (Including Fresh Start Bakeries & Great Kitchens) EUR 2.4 bn Quick Service Restaurant Other Foodservice 28% 26% Convenience & Independent Retail 21% Large Retail 25% Pro Forma Revenue1 (Including Fresh Start Bakeries & Gr
Slide 32: Product & Mix – Food Group
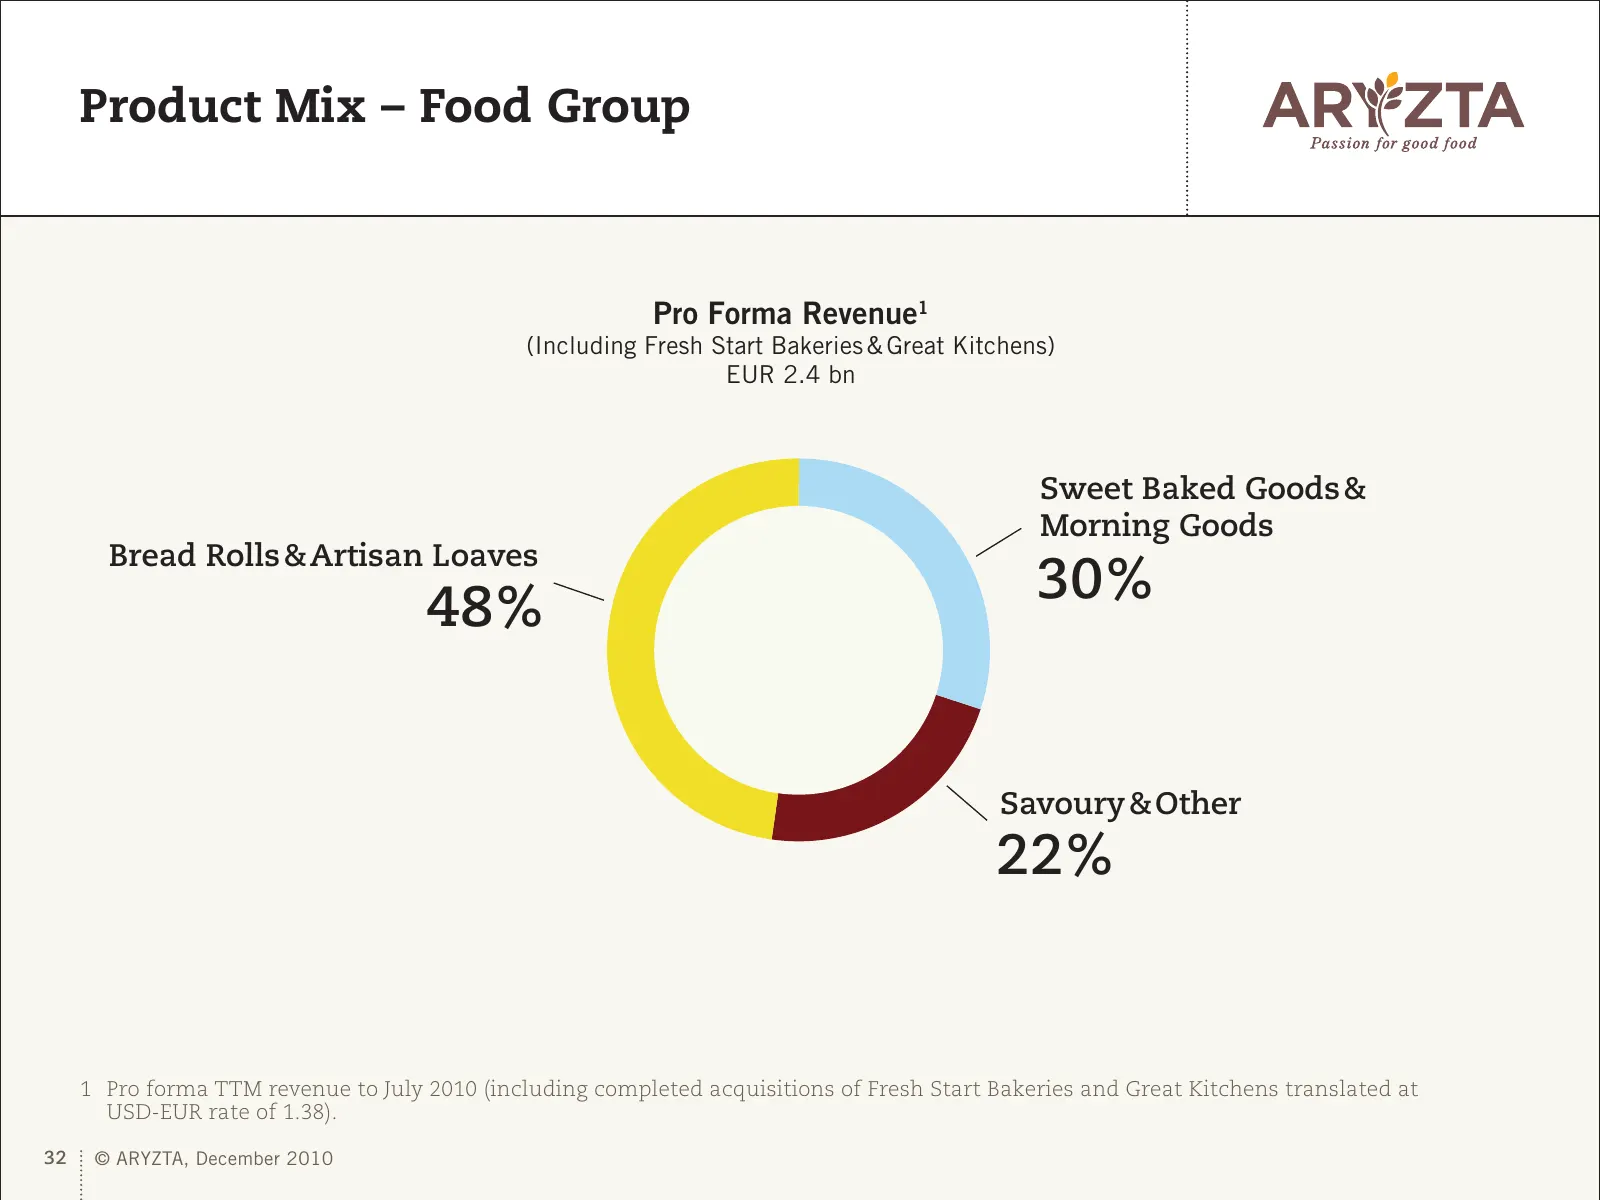
Product &Mix Convenience – Food Independent Group Retail 21% Large Retail 25% Pro Forma Revenue1 (Including Fresh Start Bakeries & Great Kitchens) EUR 2.4 bn Sweet Baked Goods & Morning Goods Bread Rolls&Artisan Loaves 30% 48% Savoury& Other 22% 1 Pro forma TTM revenue to July 2010 (including comple
Slide 33: Strategic Market Positioning
Strategic Market Positioning “Developing customer partnership model with leading operators in every channel to consumers” 33 © ARYZTA, December 2010
Slide 34: Summary and Outlook
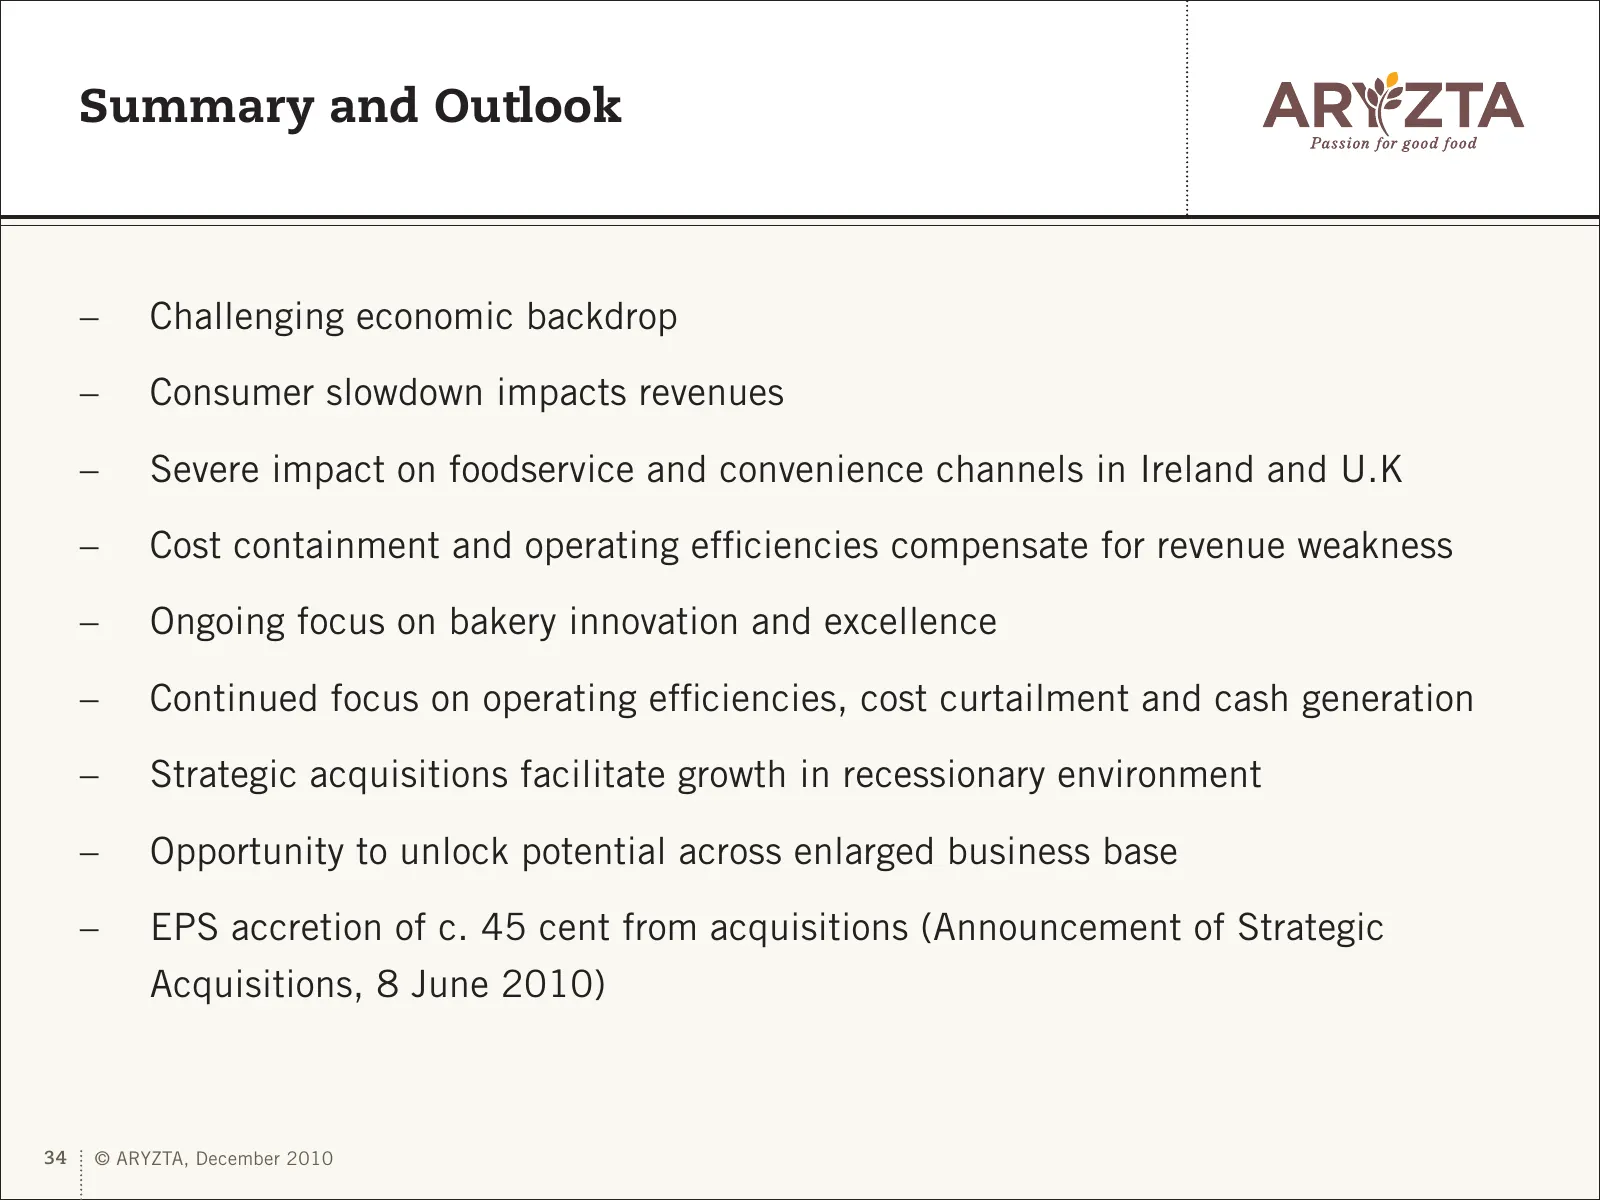
Summary and Outlook – Challenging economic backdrop – Consumer slowdown impacts revenues – Severe impact on foodservice and convenience channels in Ireland and U.K – Cost containment and operating efficiencies compensate for revenue weakness – Ongoing focus on bakery innovation and excellence – Cont
Slide 35: Finance Review July 2010
ARYZTA AG Finance Review 31 July 2010 35 © ARYZTA, December 2010
Slide 36: ARYZTA AG Income Statement
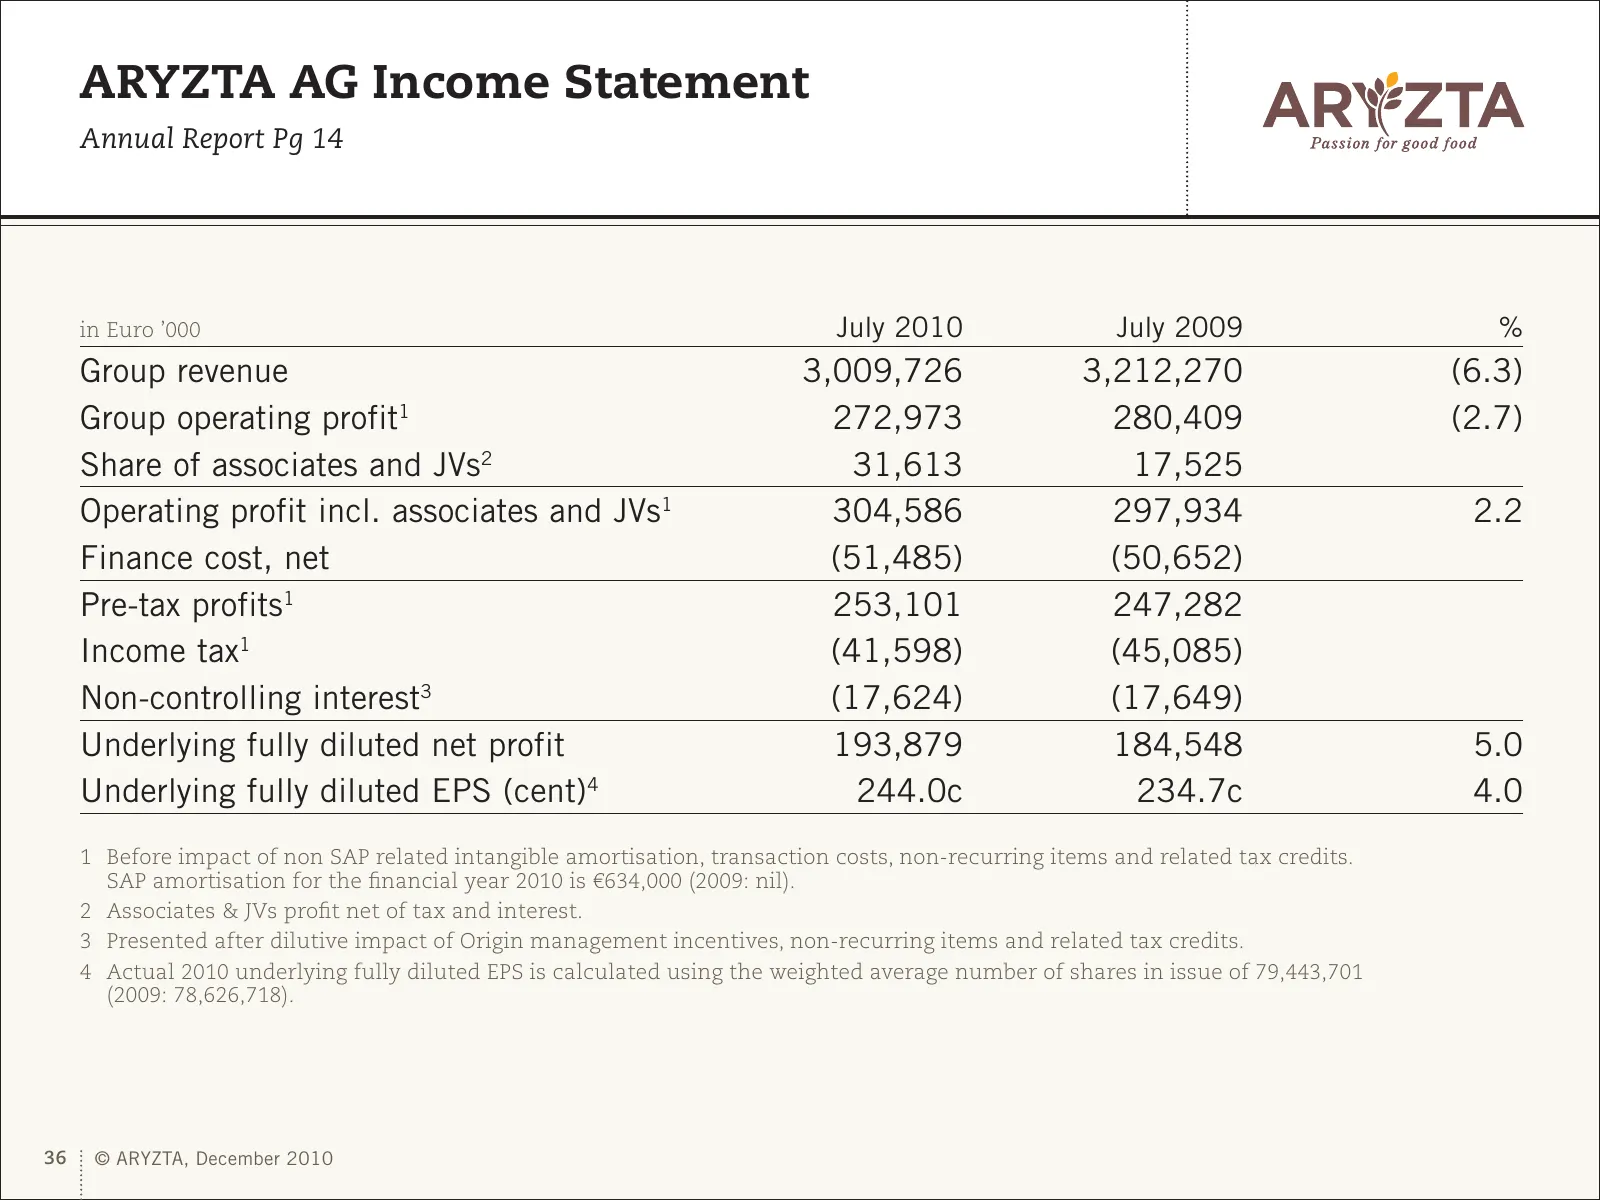
ARYZTA AG Income Statement Annual Report Pg 14 in Euro ’000 July 2010 July 2009 % Group revenue 3,009,726 3,212,270 (6.3) Group operating profit1 272,973 280,409 (2.7) Share of associates and JVs2 31,613 17,525 Operating profit incl. associates and JVs1 304,586 297,934 2.2 Finance cost, net (51,485)
Slide 37: ARYZTA AG Underlying Revenue Growth 2010
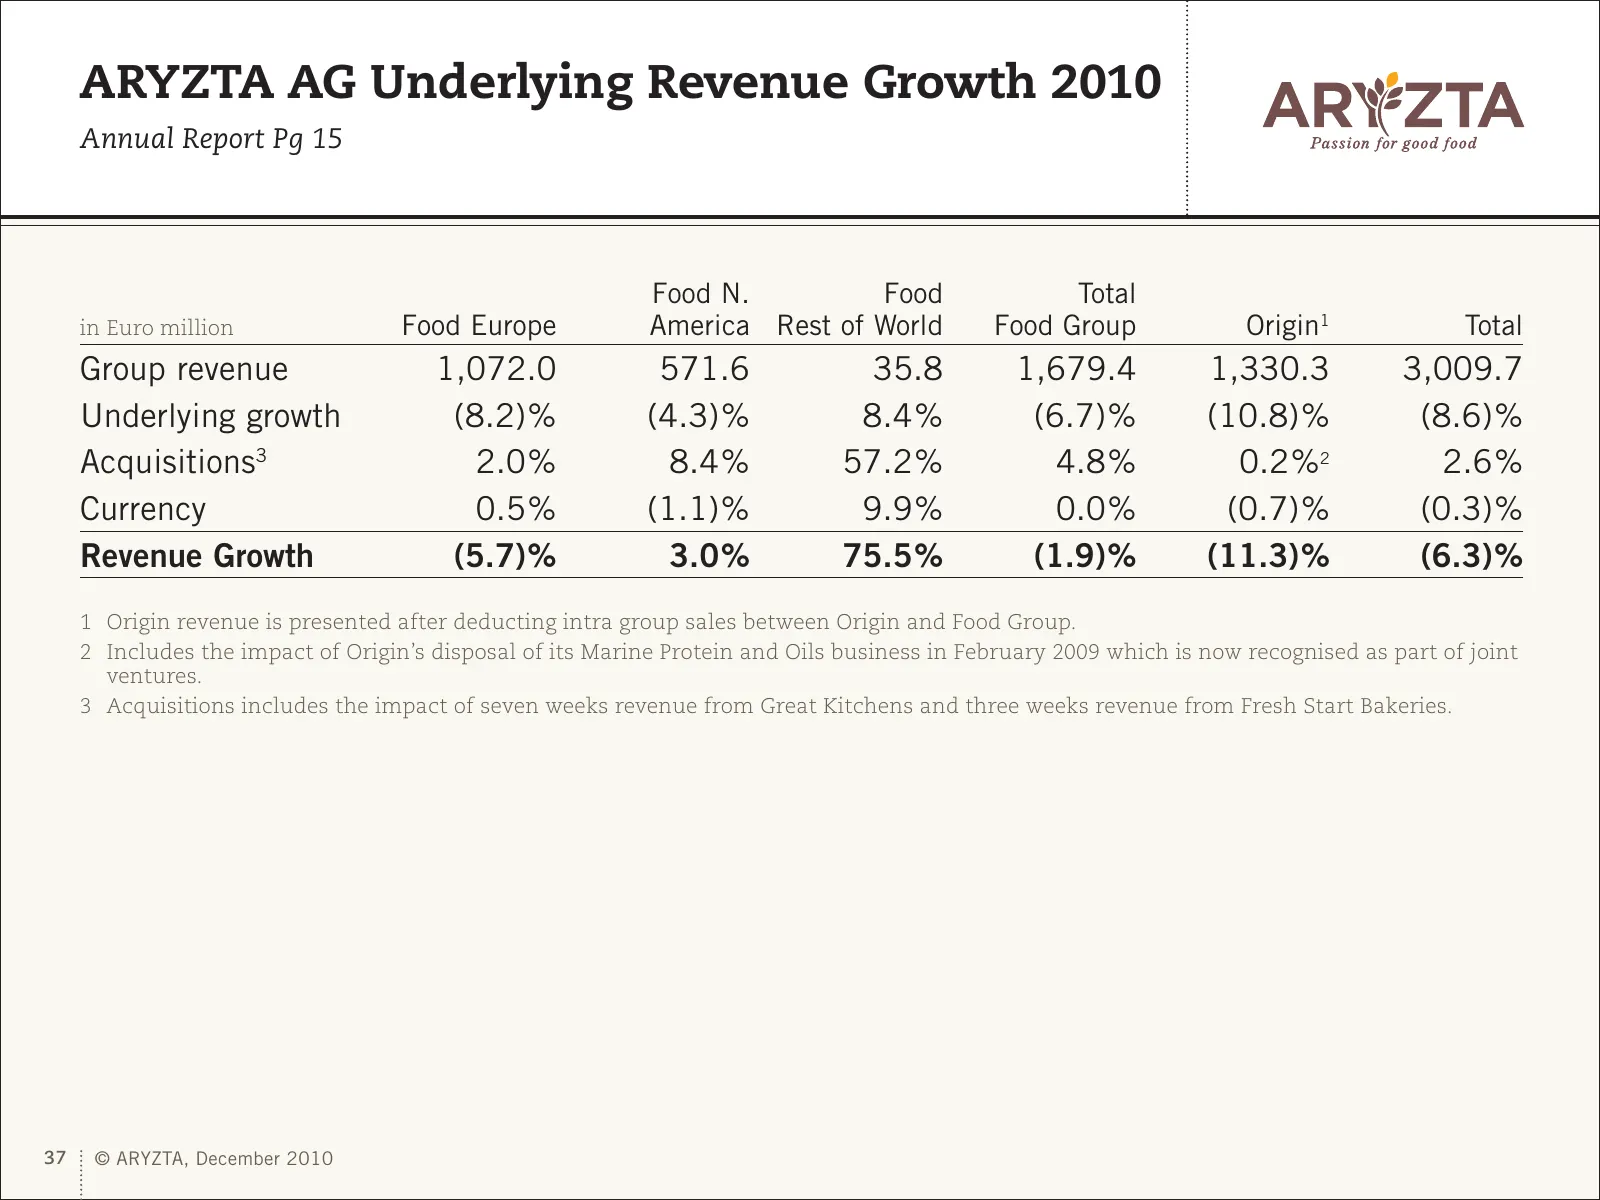
ARYZTA AG Underlying Revenue Growth 2010 Annual Report Pg 15 Food N. Food Total in Euro million Food Europe America Rest of World Food Group Origin1 Total Group revenue 1,072.0 571.6 35.8 1,679.4 1,330.3 3,009.7 Underlying growth (8.2) % (4.3) % 8.4 % (6.7) % (10.8) % (8.6) % Acquisitions3 2.0 % 8.4
Slide 38: ARYZTA AG Segmental Profit
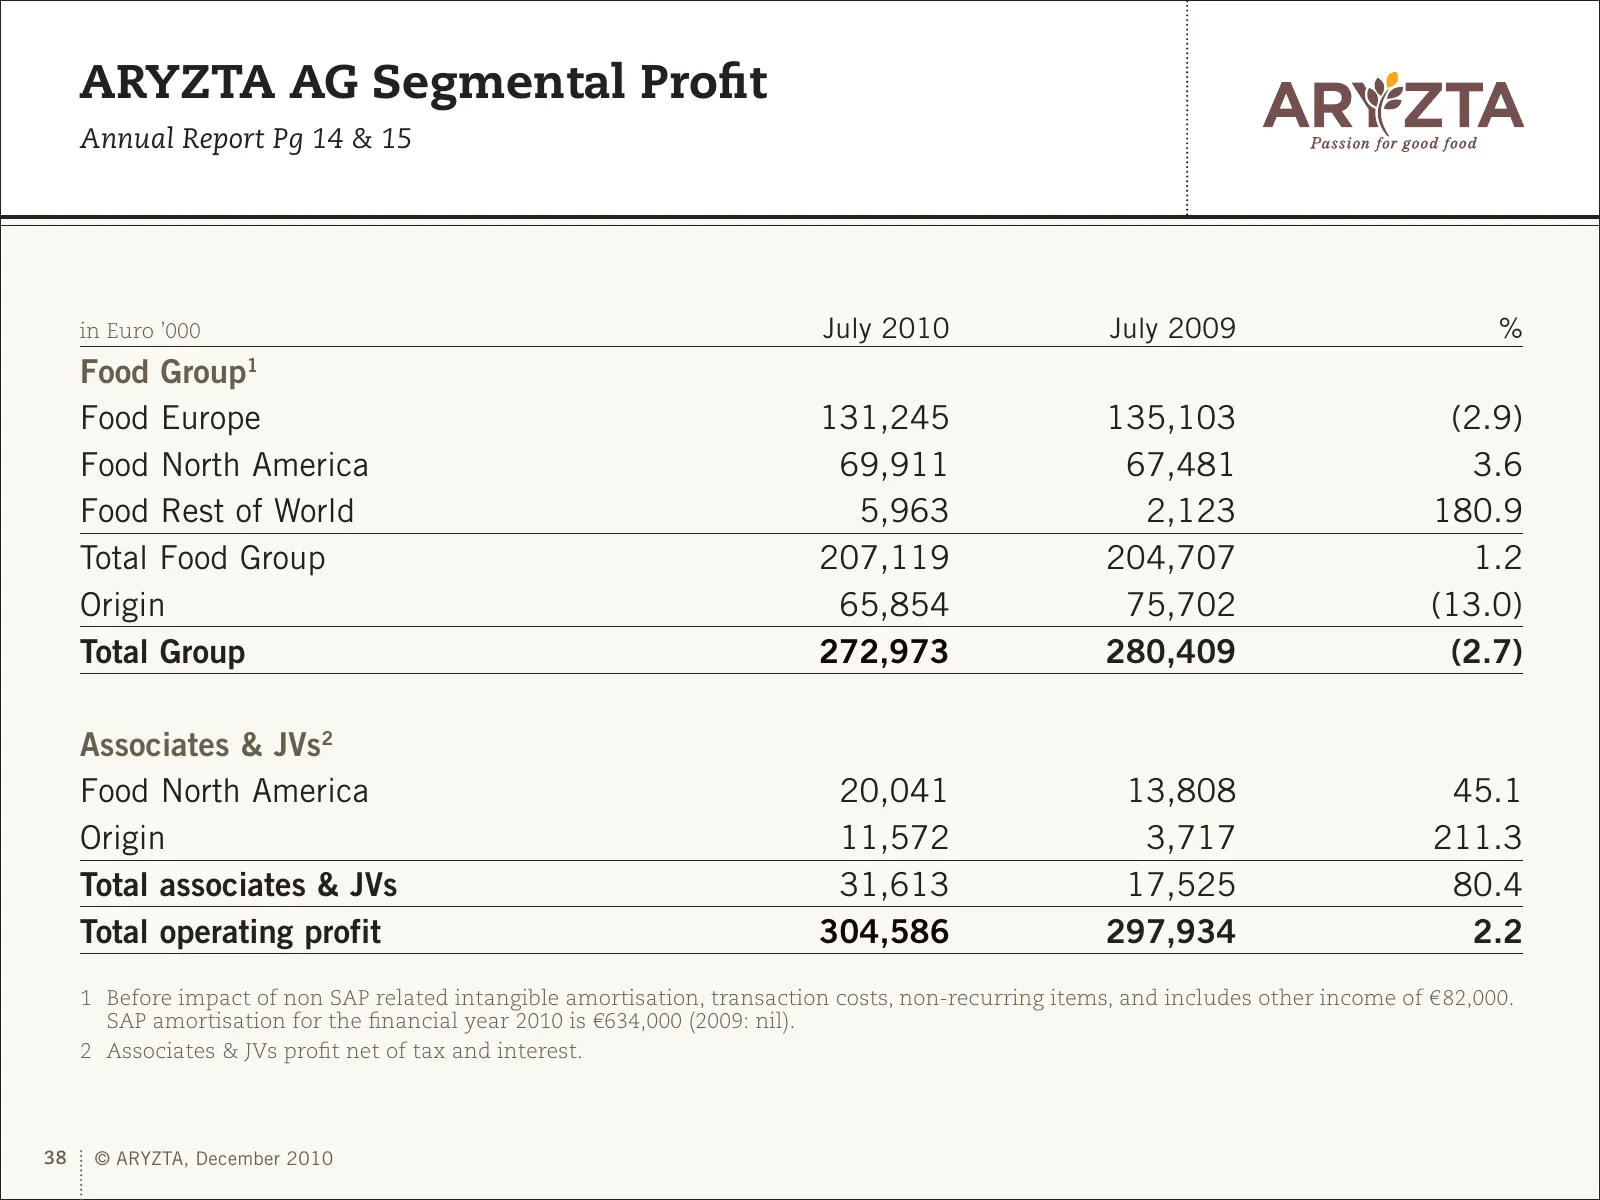
ARYZTA AG Segmental Profit Annual Report Pg 14 & 15 in Euro ’000 July 2010 July 2009 % Food Group1 Food Europe 131,245 135,103 (2.9) Food North America 69,911 67,481 3.6 Food Rest of World 5,963 2,123 180.9 Total Food Group 207,119 204,707 1.2 Origin 65,854 75,702 (13.0) Total Group 272,973 280,409
Slide 39: ARYZTA AG Underlying Net Profit Reconciliation
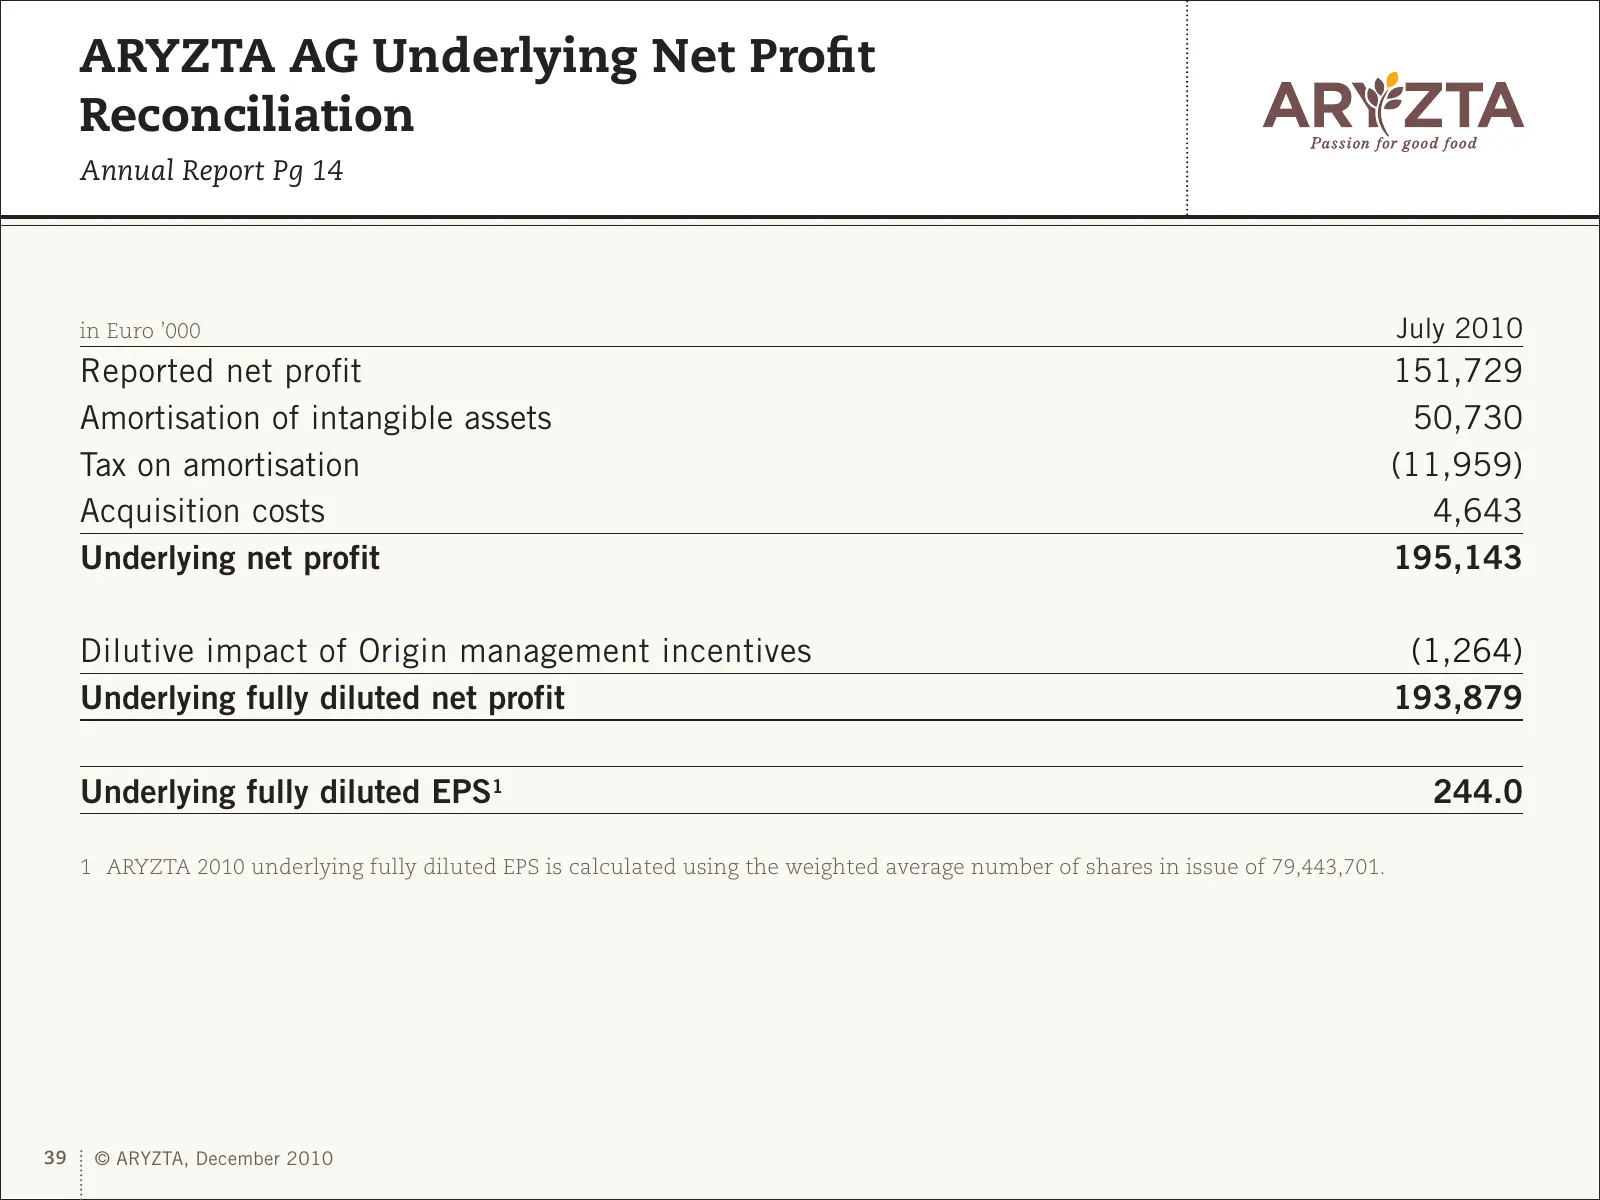
ARYZTA AG Underlying Net Profit Reconciliation Annual Report Pg 14 in Euro ’000 July 2010 Reported net profit 151,729 Amortisation of intangible assets 50,730 Tax on amortisation (11,959) Acquisition costs 4,643 Underlying net profit 195,143 Dilutive impact of Origin management incentives (1,264) U
Slide 40: Food Group Income Statement
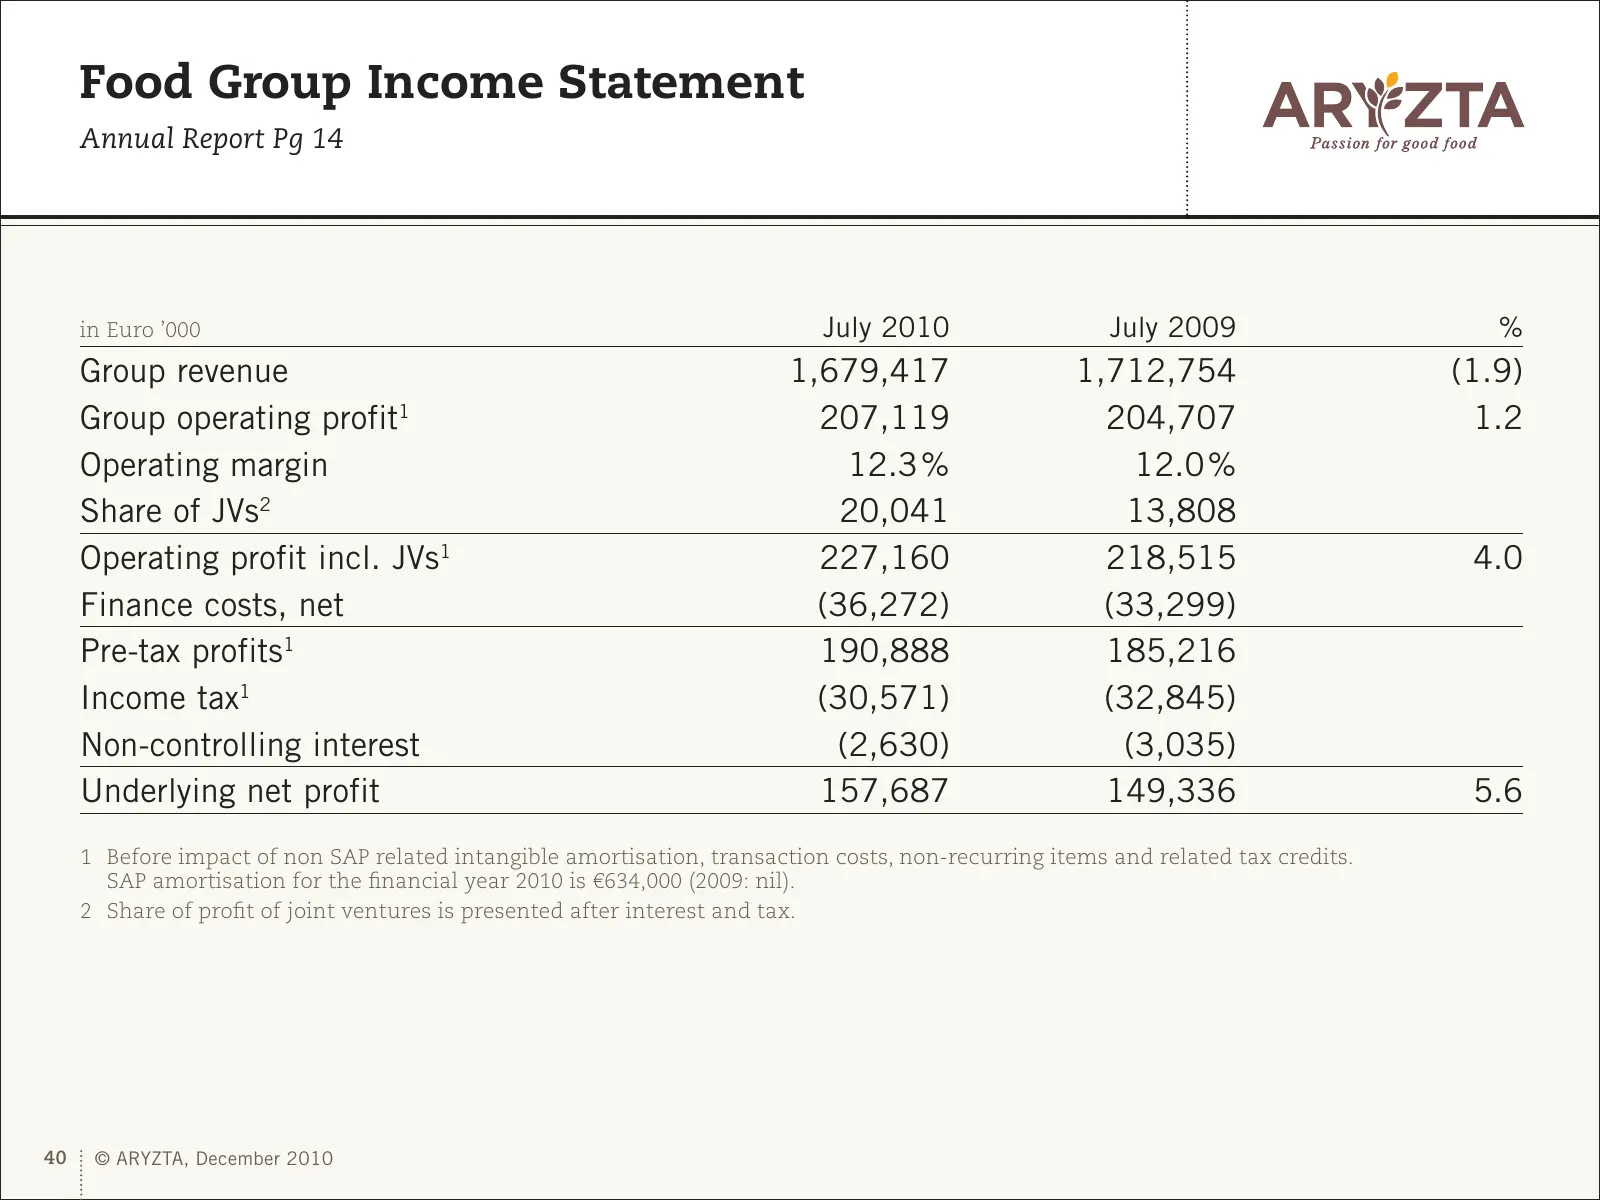
Food Group Income Statement Annual Report Pg 14 in Euro ’000 July 2010 July 2009 % Group revenue 1,679,417 1,712,754 (1.9) Group operating profit1 207,119 204,707 1.2 Operating margin 12.3 % 12.0 % Share of JVs2 20,041 13,808 Operating profit incl. JVs1 227,160 218,515 4.0 Finance costs, net (36,272
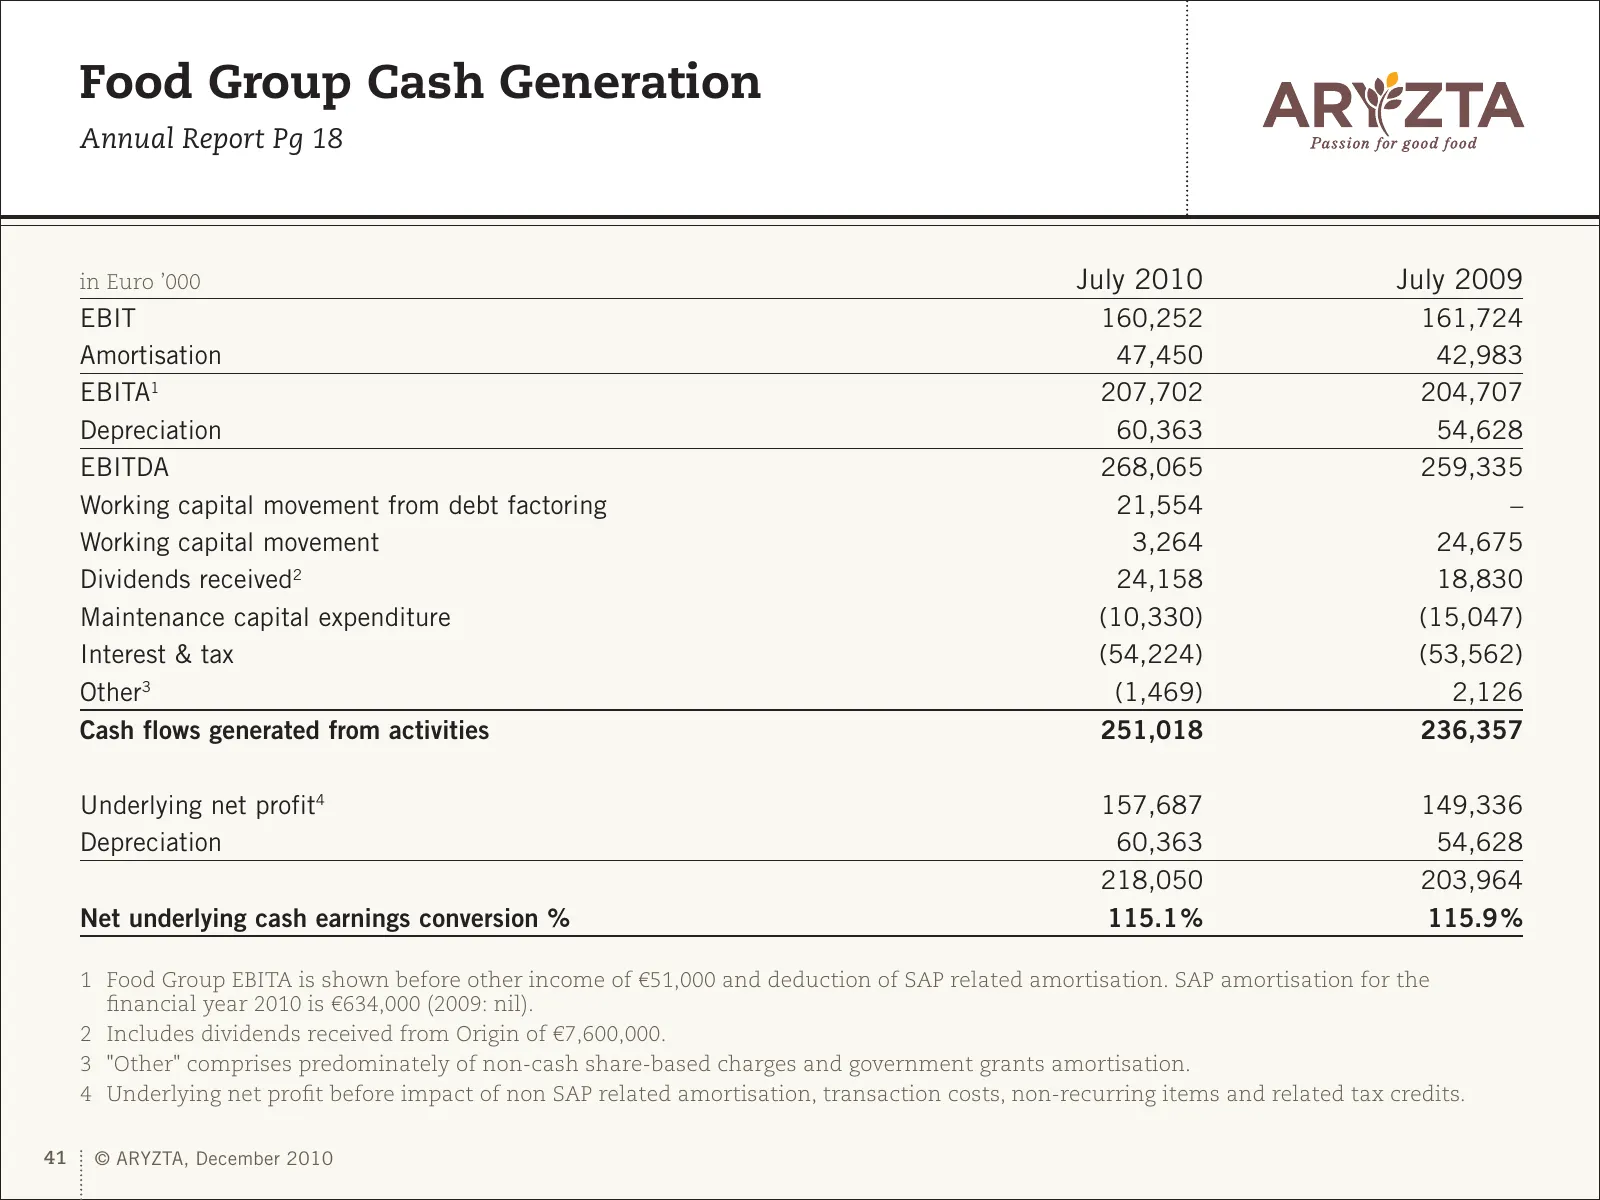
Slide 41: Food Group Cash Generation
Food Group Cash Generation Annual Report Pg 18 in Euro ’000 July 2010 July 2009 EBIT 160,252 161,724 Amortisation 47,450 42,983 EBITA1 207,702 204,707 Depreciation 60,363 54,628 EBITDA 268,065 259,335 Working capital movement from debt factoring 21,554 – Working capital movement 3,264 24,675 Dividen
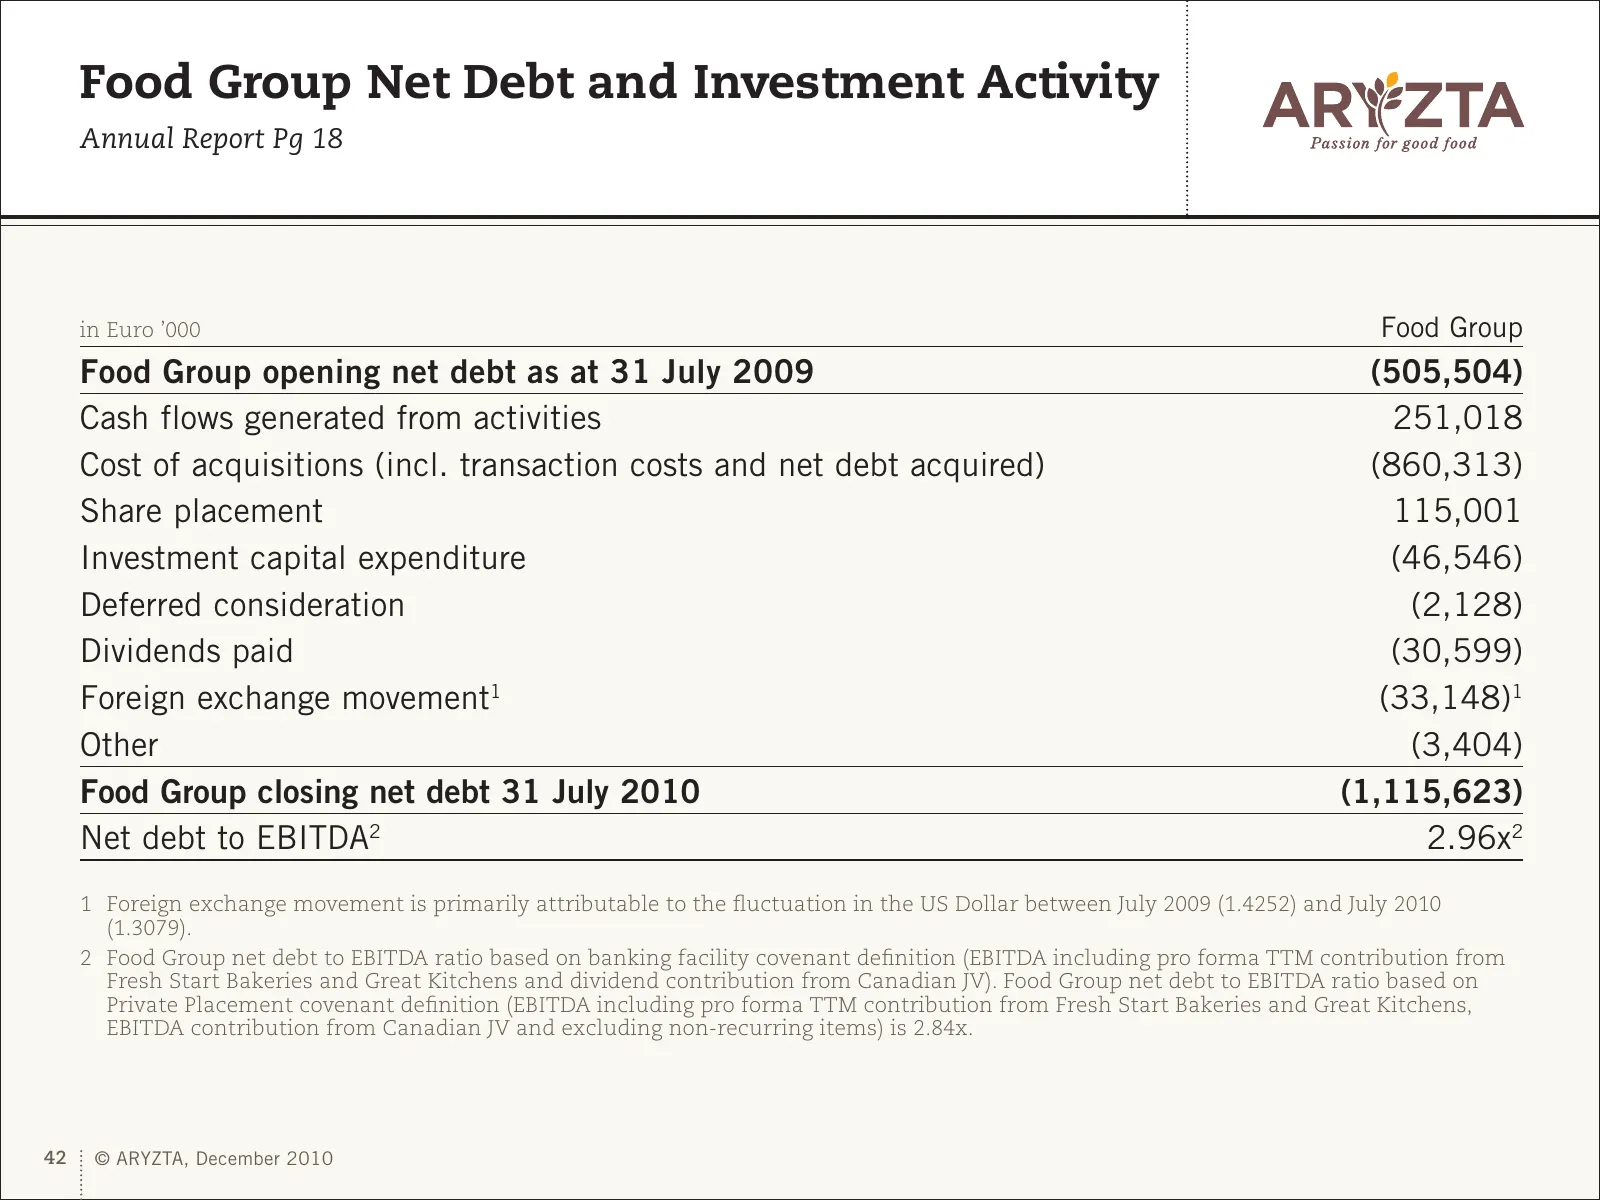
Slide 42: Food Group Net Debt and Investment Activity
Food Group Net Debt and Investment Activity Annual Report Pg 18 in Euro ’000 Food Group Food Group opening net debt as at 31 July 2009 (505,504) Cash flows generated from activities 251,018 Cost of acquisitions (incl. transaction costs and net debt acquired) (860,313) Share placement 115,001 Investm
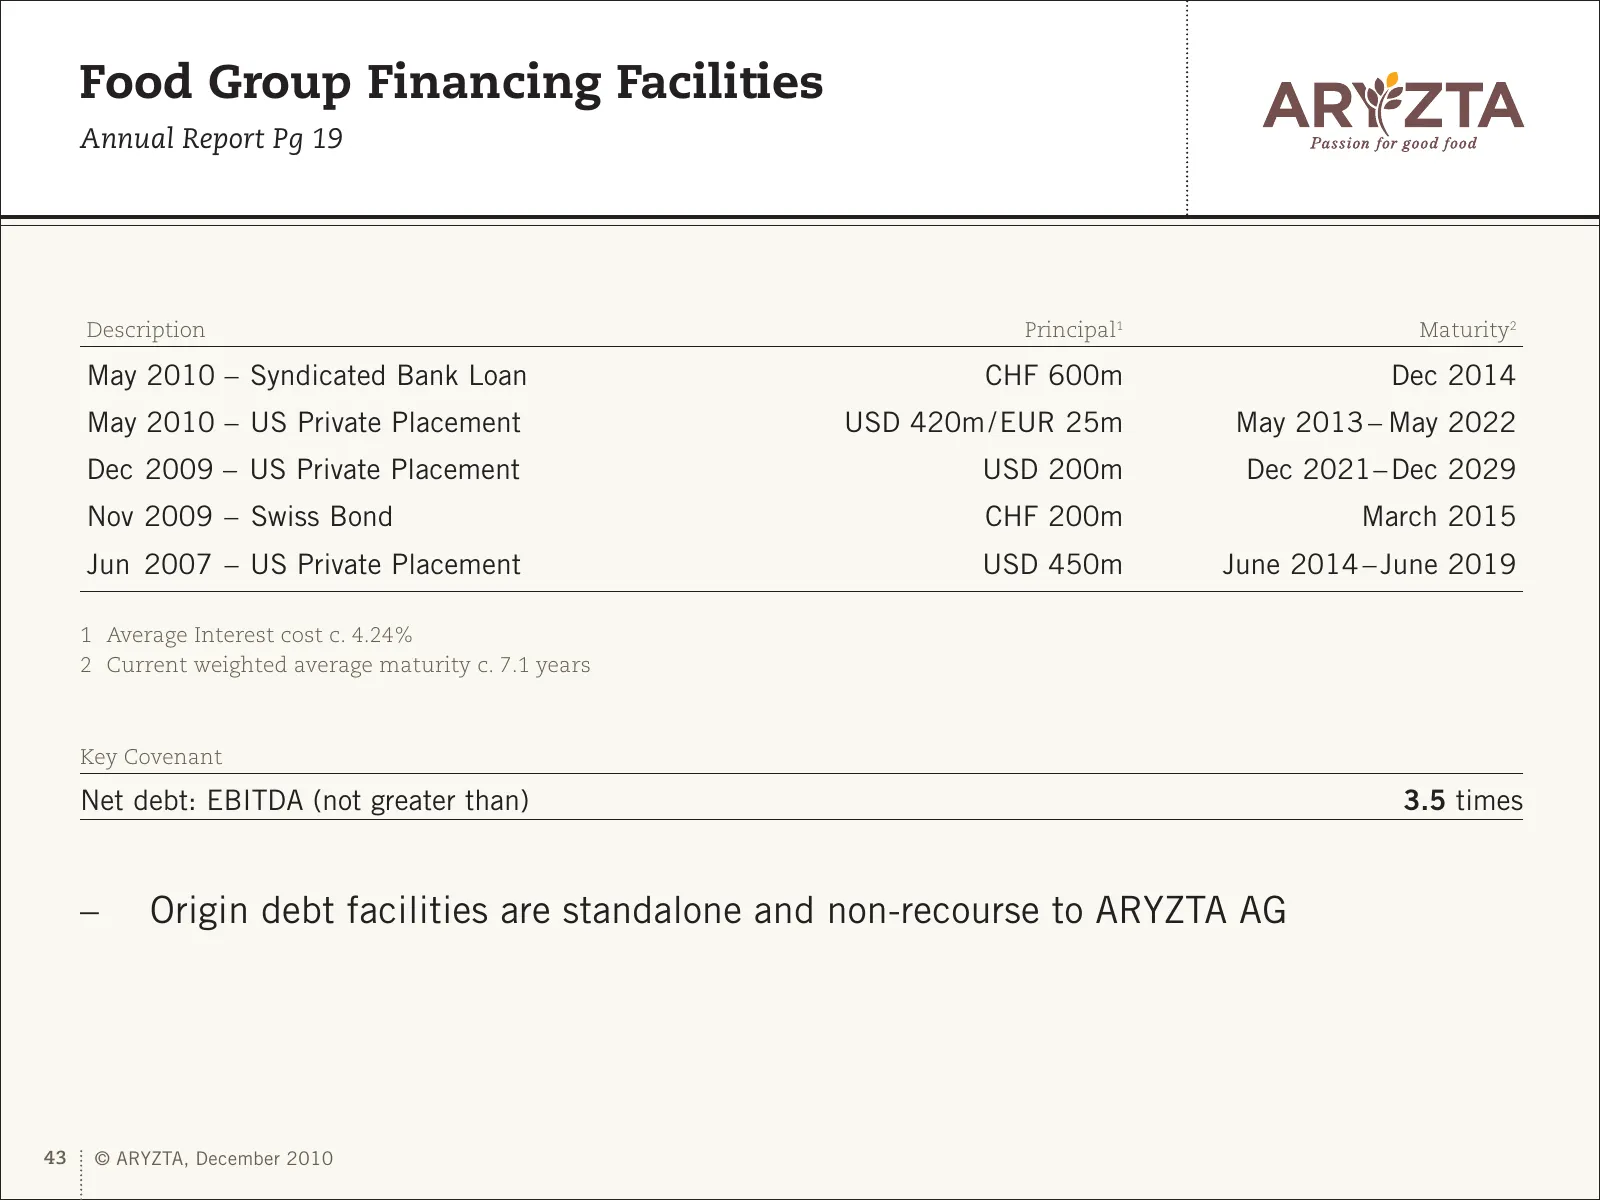
Slide 43: Food Group Financing Facilities
Food Group Financing Facilities Annual Report Pg 19 Description Principal1 Maturity2 May 2010 – Syndicated Bank Loan CHF 600m Dec 2014 May 2010 – US Private Placement USD 420m / EUR 25m May 2013 – May 2022 Dec 2009 – US Private Placement USD 200m Dec 2021 – Dec 2029 Nov 2009 – Swiss Bond CHF 200m Ma
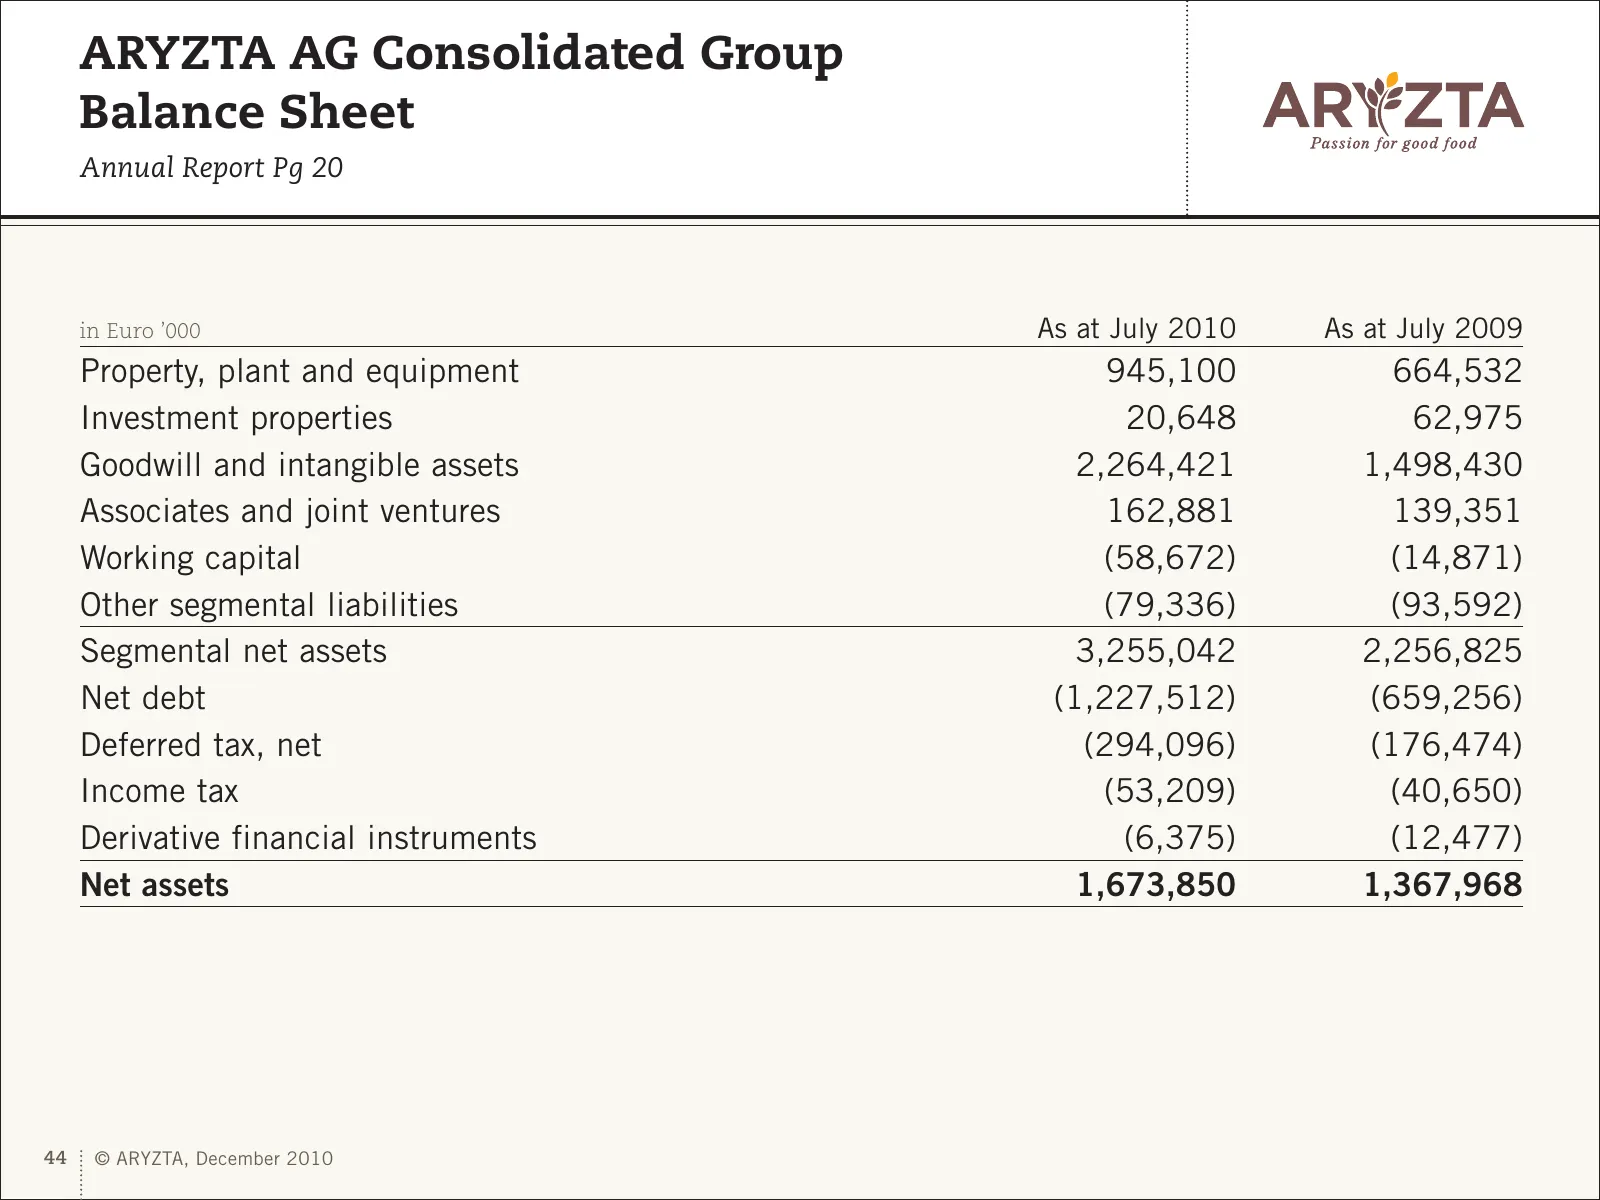
Slide 44: ARYZTA AG Consolidated Group Balance Sheet
ARYZTA AG Consolidated Group Balance Sheet Annual Report Pg 20 in Euro ’000 As at July 2010 As at July 2009 Property, plant and equipment 945,100 664,532 Investment properties 20,648 62,975 Goodwill and intangible assets 2,264,421 1,498,430 Associates and joint ventures 162,881 139,351 Working capit
Slide 45: Dividend
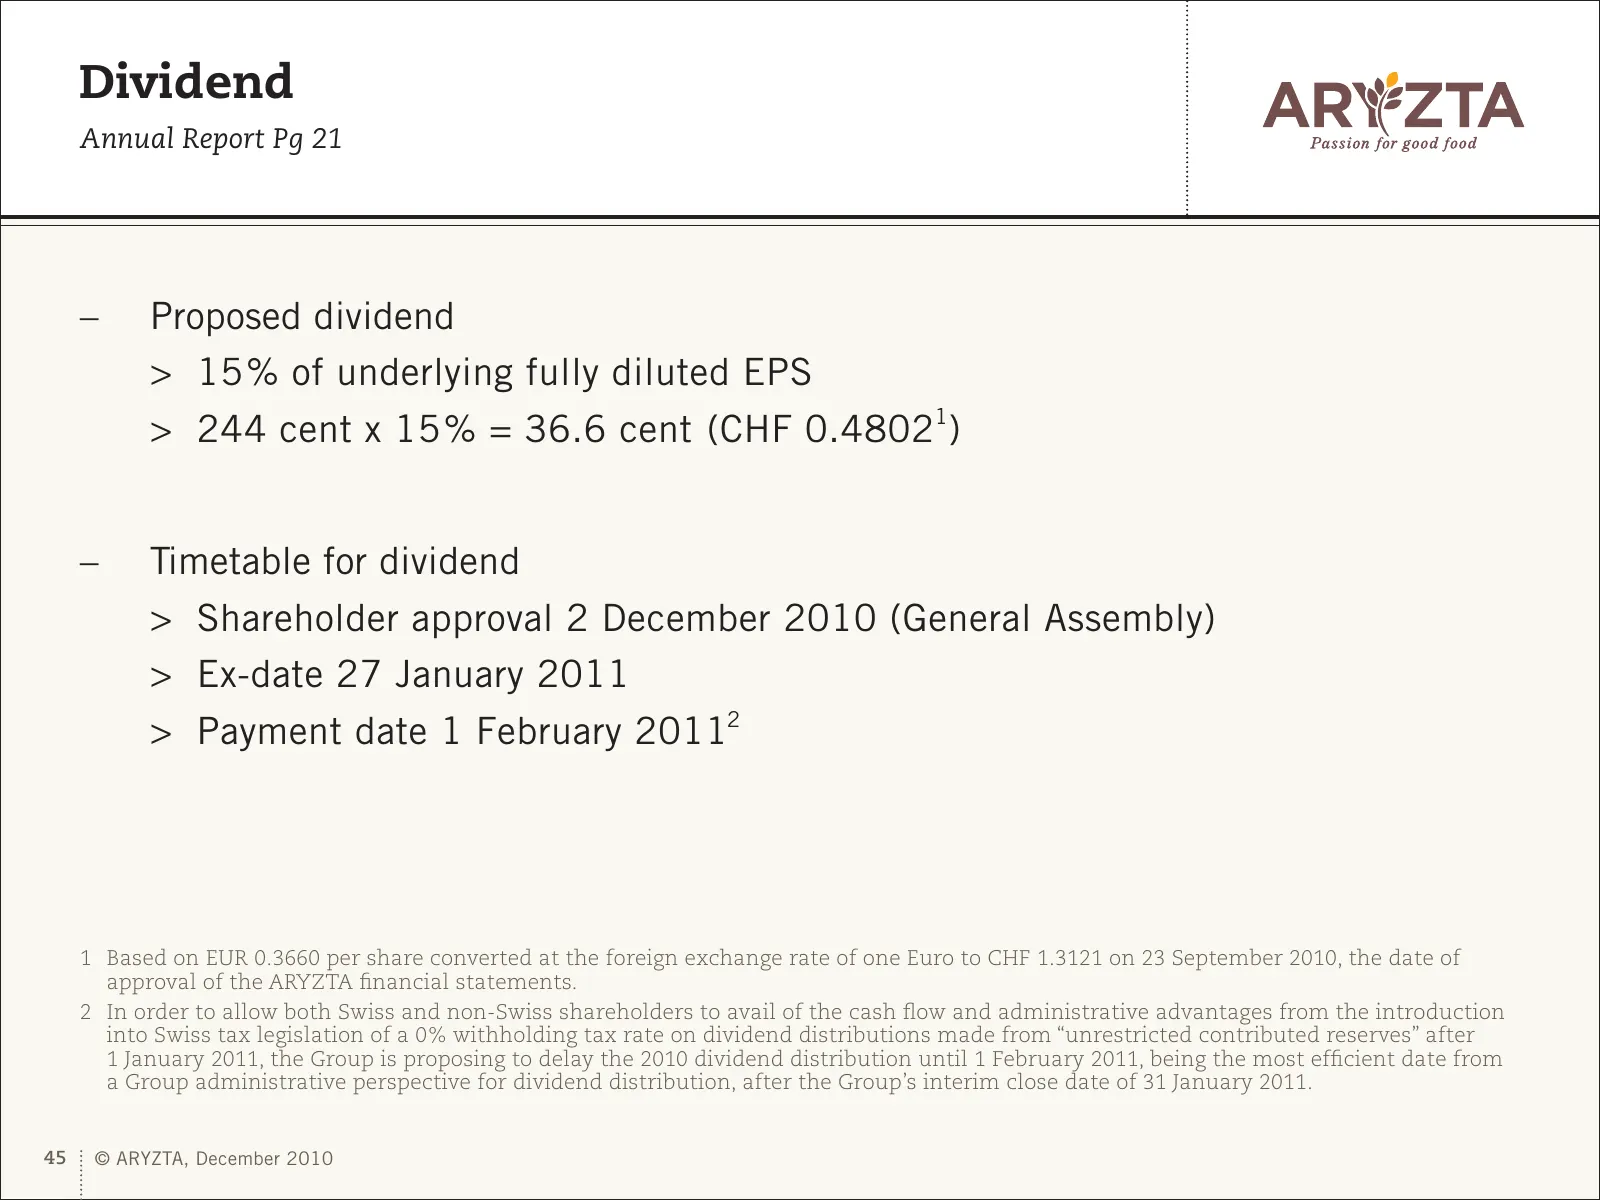
Dividend Annual Report Pg 21 – Proposed dividend > 15 % of underlying fully diluted EPS > 244 cent x 15 % = 36.6 cent (CHF 0.48021) – Timetable for dividend > Shareholder approval 2 December 2010 (General Assembly) > Ex-date 27 January 2011 > Payment date 1 February 20112 1 Based on EUR 0.3660 per s

Slide 46: Thank you!
ARYZTA AG Thank you! 46 © ARYZTA, December 2010

Slide 47: 2010 General Assembly Agenda
ARYZTA AG 2010 General Assembly Agenda 2010 Generalversammlung Traktanden 02 December 2010
Slide 48: 1. Approval of the annual report
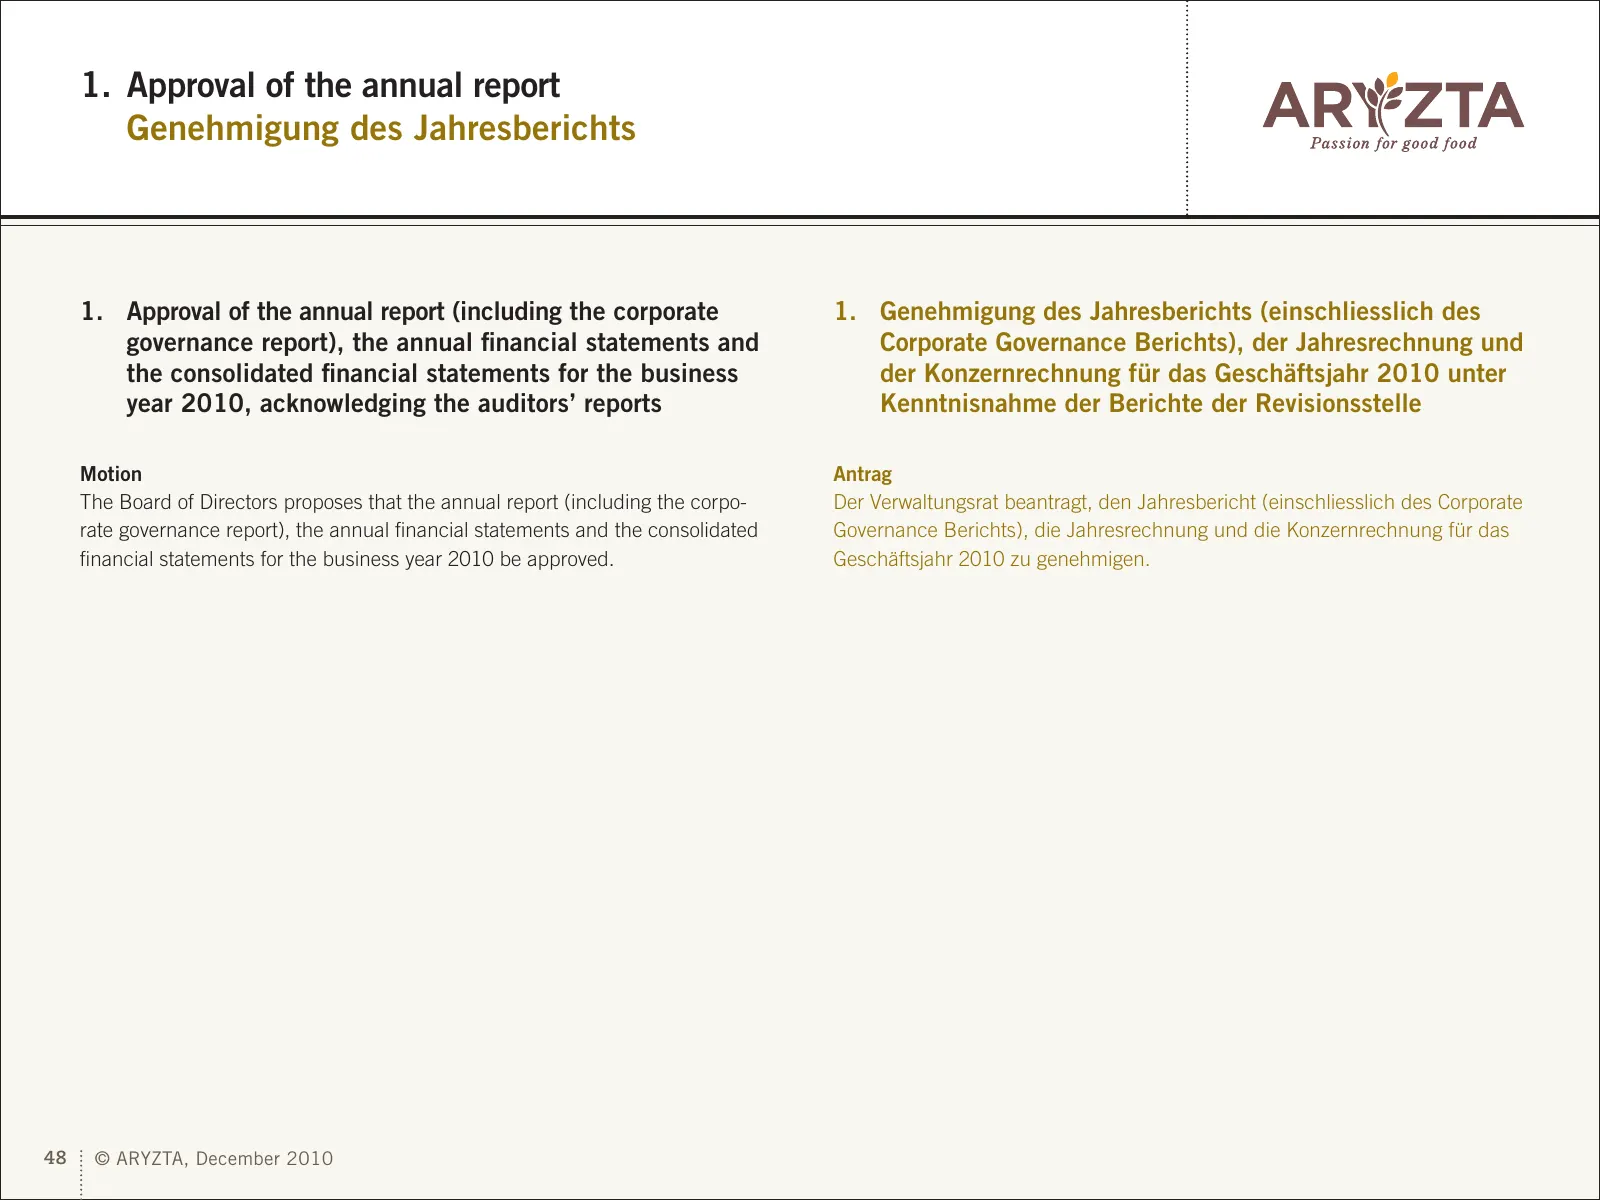
1. Approval of the annual report Genehmigung des Jahresberichts 1. Approval of the annual report (including the corporate 1. Genehmigung des Jahresberichts (einschliesslich des governance report), the annual financial statements and Corporate Governance Berichts), der Jahresrechnung und the con
Slide 49: 2. Appropriation of available earnings
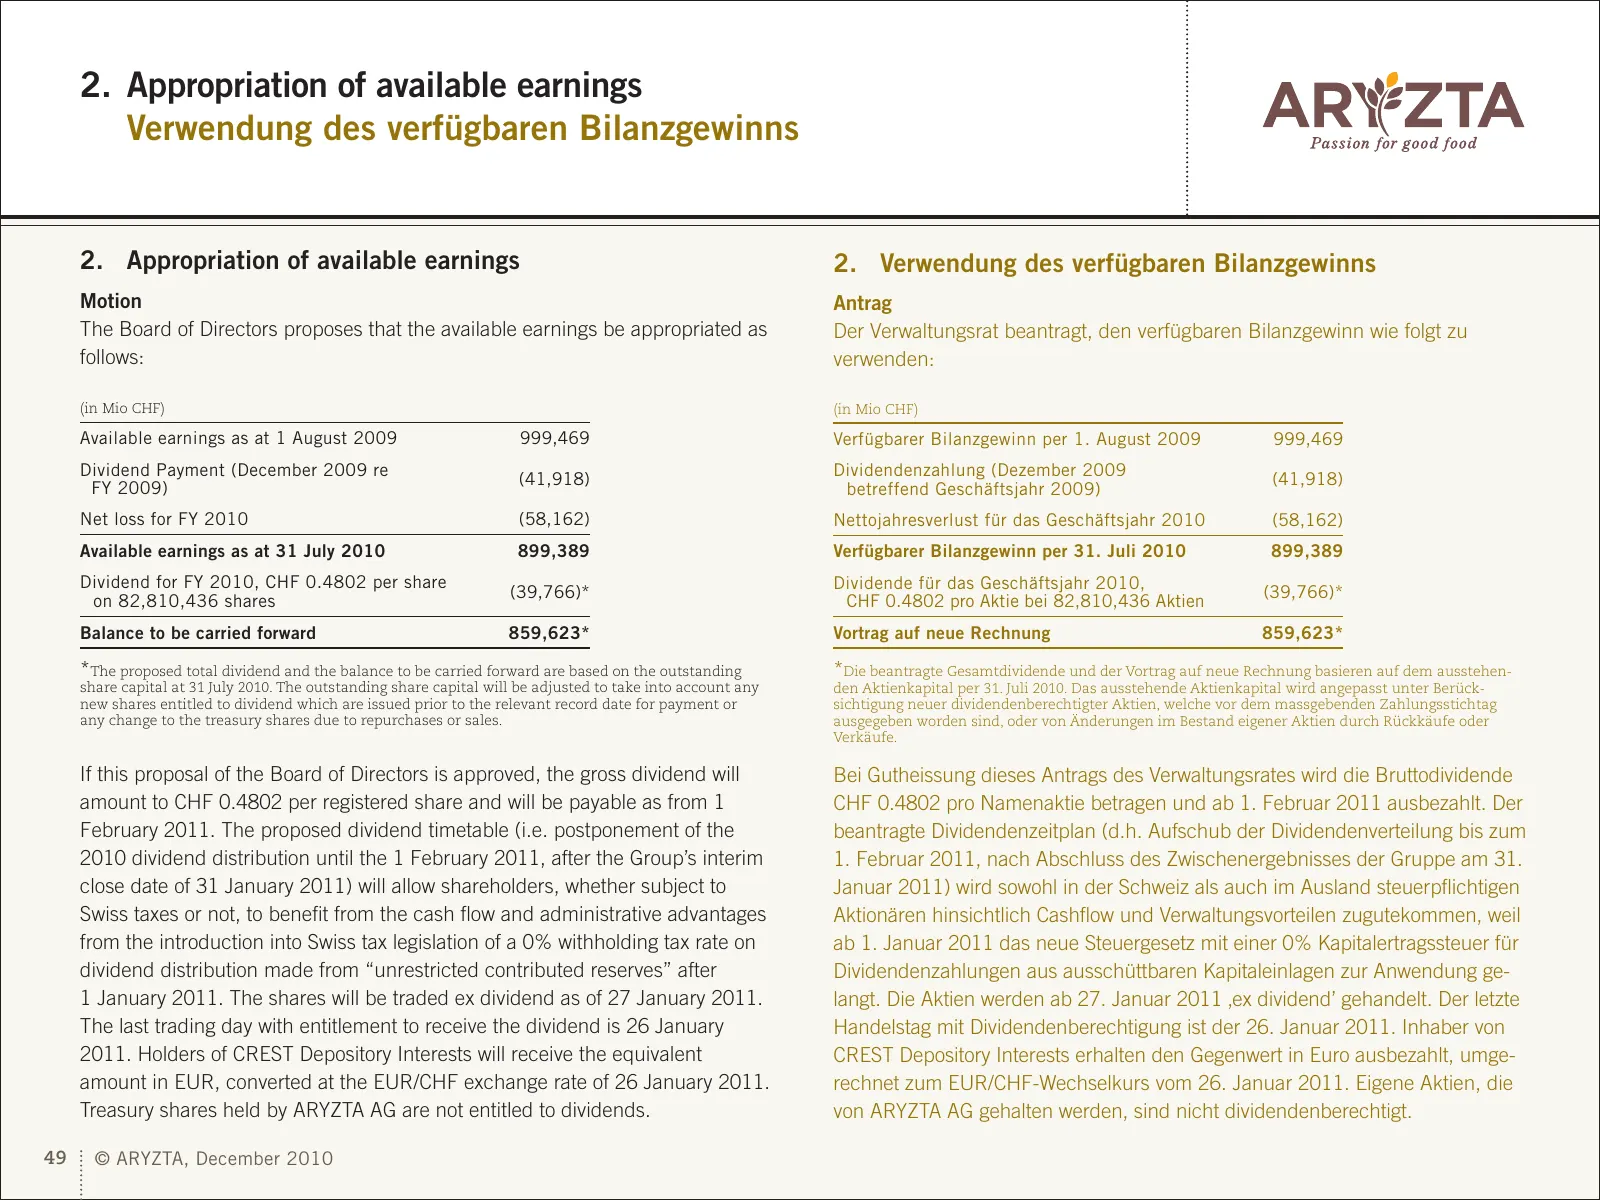
2. Appropriation of available earnings Verwendung des verfügbaren Bilanzgewinns 2. Appropriation of available earnings 2. Verwendung des verfügbaren Bilanzgewinns Motion Antrag The Board of Directors proposes that the available earnings be appropriated as Der Verwaltungsrat beantragt, den verfügbare
Slide 50: 3. Discharge of the members of the Board of Directors
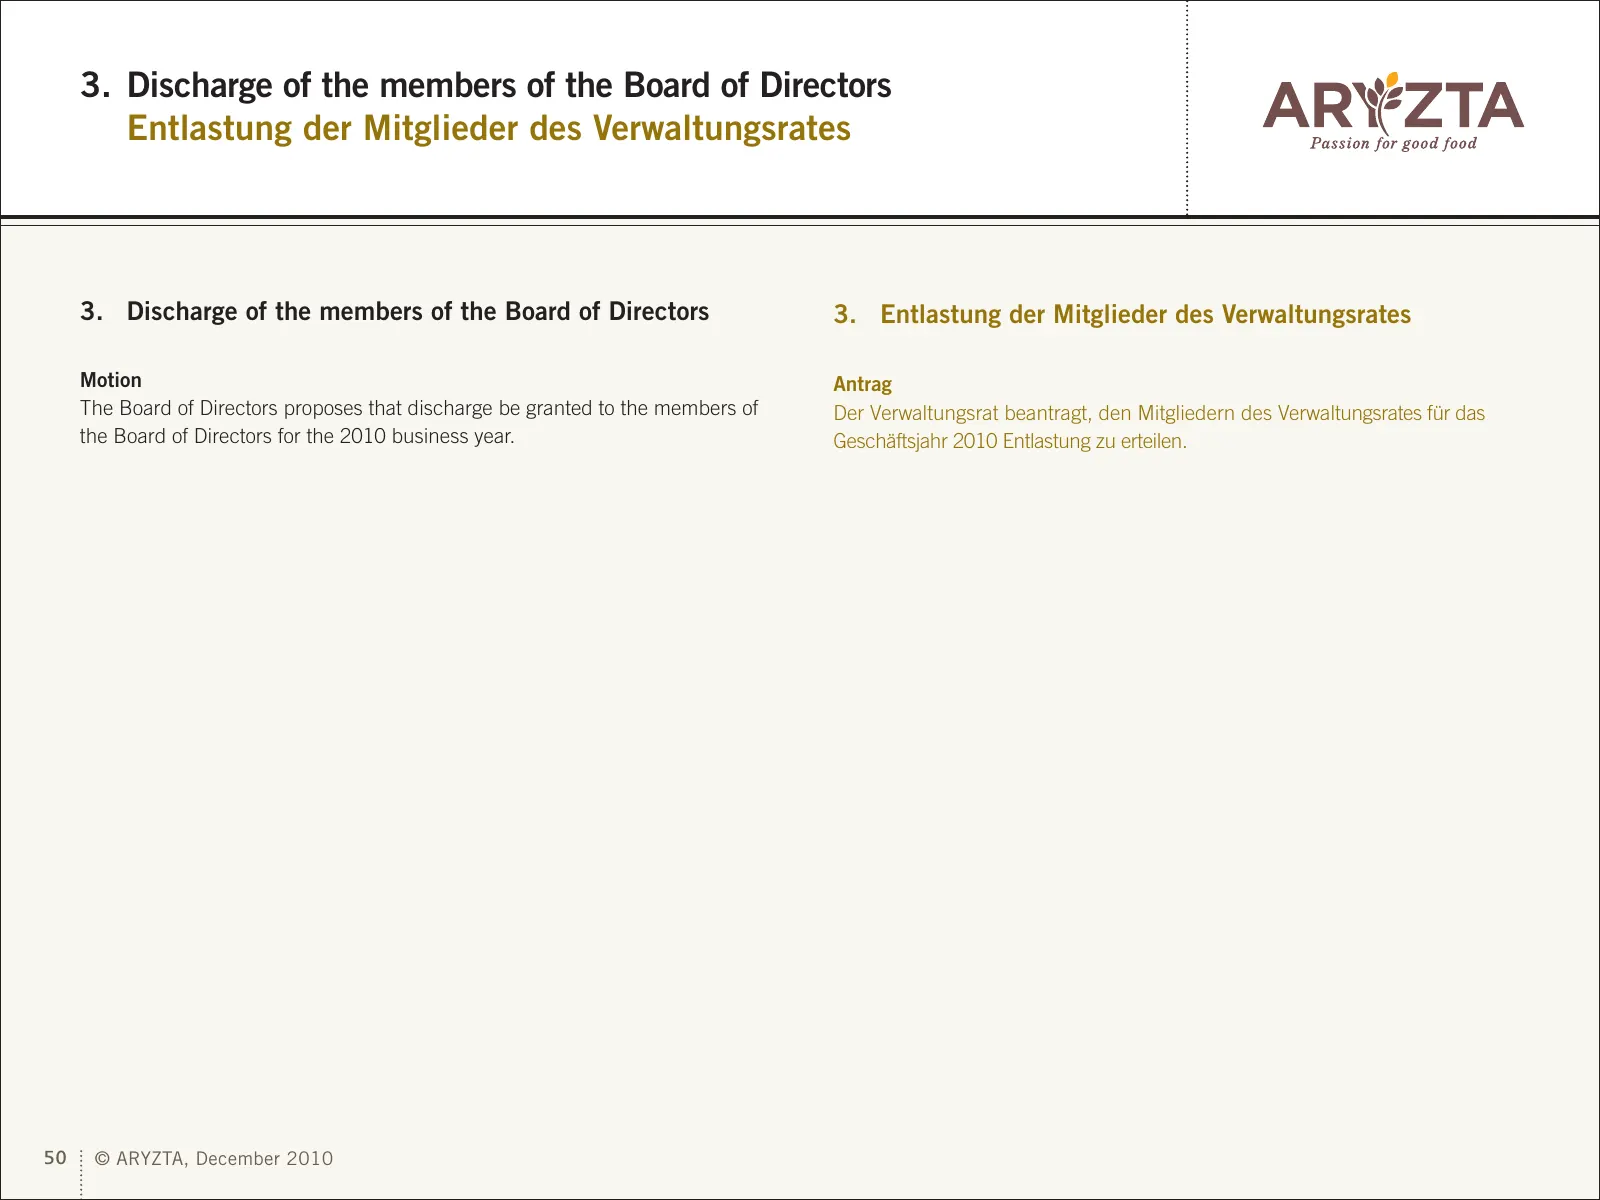
3. Discharge of the members of the Board of Directors Entlastung der Mitglieder des Verwaltungsrates 3. Discharge of the members of the Board of Directors 3. Entlastung der Mitglieder des Verwaltungsrates Motion Antrag The Board of Directors proposes that discharge be granted to the members of Der V
Slide 51: 4. Re-election of one member of the Board of Directors
4. Re-election of one member of the Board of Directors Wiederwahl eines Mitglieds des Verwaltungsrates 4. Re-election of one member of the Board of Directors 4. Wiederwahl eines Mitglieds des Verwaltungsrates Motion Antrag The Board of Directors proposes the re-election of Der Verwaltungsrat beantra
Slide 52: 5. Election of one new member of the Board of Directors
5. Election of one new member of the Board of Directors Wahl eines neuen Mitglieds des Verwaltungsrates 5. Election of one new member of the Board of Directors 5. Wahl eines neuen Mitglieds des Verwaltungsrates Motion Antrag The Board of Directors proposes the election of Mr. Charles (Chuck) Adair a
Slide 53: 6. Re-election of the auditors
6. Re-election of the auditors Wiederwahl der Revisionsstelle 6. Re-election of the auditors 6. Wiederwahl der Revisionsstelle Motion Antrag The Board of Directors proposes that PricewaterhouseCoopers AG, Zurich, be Der Verwaltungsrat beantragt, die PricewaterhouseCoopers AG, Zürich, als re-elected

Slide 54: Thank you!
ARYZTA AG Thank you! 54 © ARYZTA, December 2010
Source: Internet Archive copy of aryzta.com
More decks from Aryzta AG
 H1 2026 Earnings Presentation32 slides · Aug 10, 2026
 FY2025 Earnings Presentation7 slides · Jan 22, 2026
 Q3 2025 Earnings Presentation15 slides · Oct 20, 2025
 H1 2025 Earnings Presentation34 slides · Aug 11, 2025
 Investor Day (May 2025)48 slides · May 7, 2025
 Q1 2025 Earnings Presentation35 slides · Mar 2, 2025