FGC Rosseti · RUS:FEES
FGC Rosseti — FGC UES — FY2018 Earnings Presentation
11 slides from FGC Rosseti's earnings presentation, March 2019
Slide 1: 2018 IFRS Operational and Financial Results
2018 IFRS OPERATIONAL AND FINANCIAL RESULTS March 2019
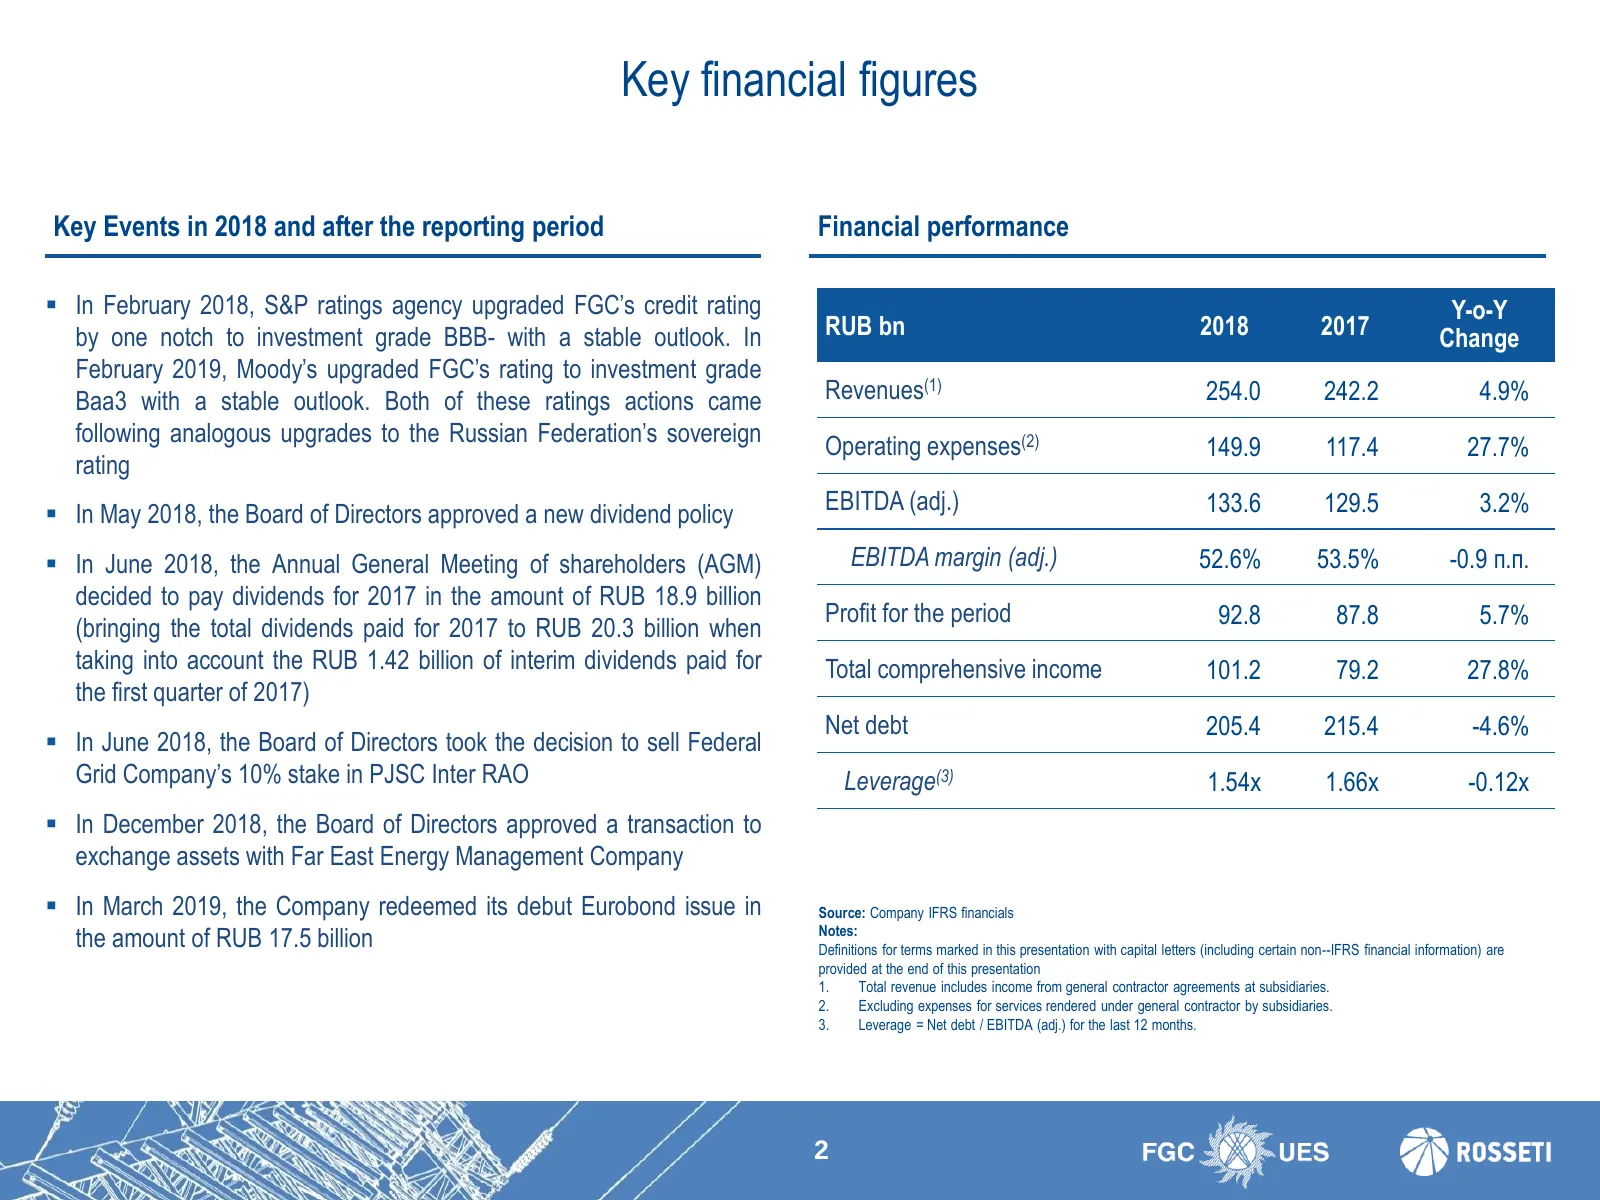
Slide 2: Key financial figures
Key financial figures Key Events in 2018 and after the reporting period Financial performance In February 2018, S&P ratings agency upgraded FGC’s credit rating Y-o-Y by one notch to investment grade BBB- with a stable outlook. In RUB bn 2018 2017 Change February 2019, Moody’s upgraded FGC’s rating
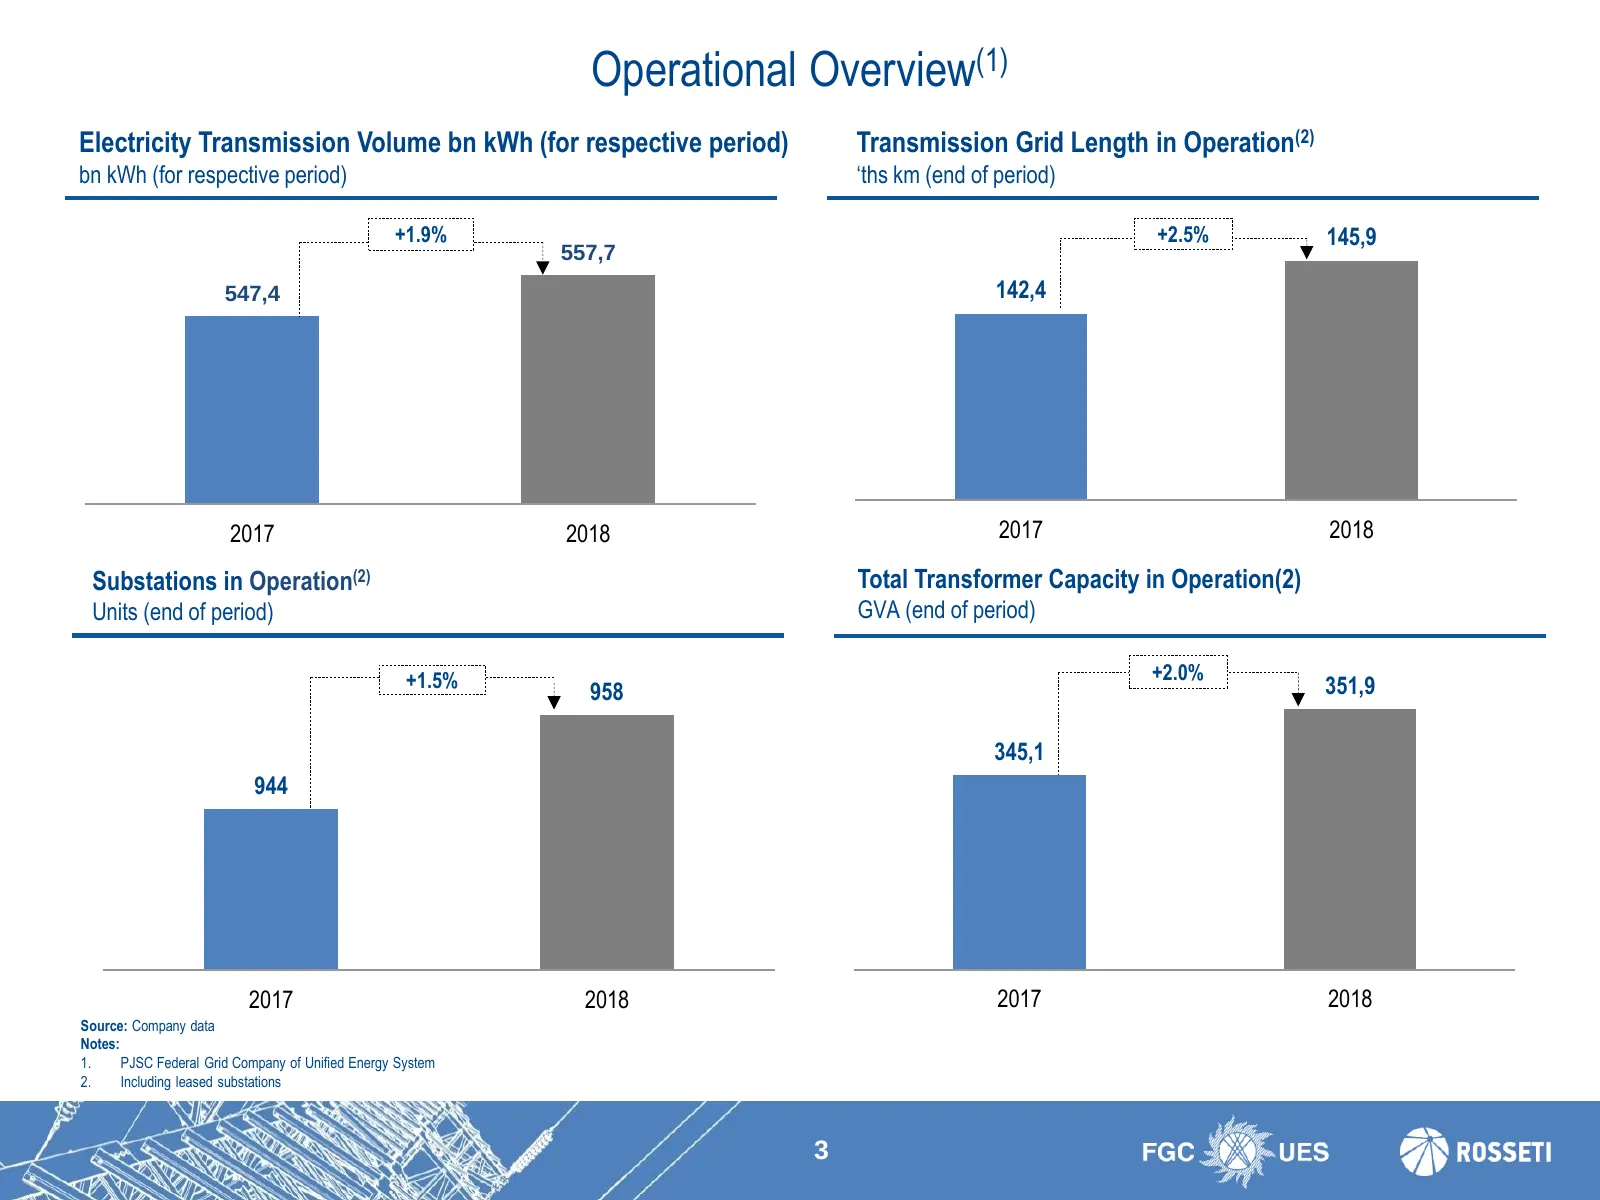
Slide 3: Operational Overview
Operational Overview(1) Electricity Transmission Volume bn kWh (for respective period) Transmission Grid Length in Operation(2) bn kWh (for respective period) ‘ths km (end of period) +1.9% +2.5% 145,9 557,7 547,4 142,4 2017 2018 2017 2018 Substations in Operation(2) Total Transformer Capacity in Ope
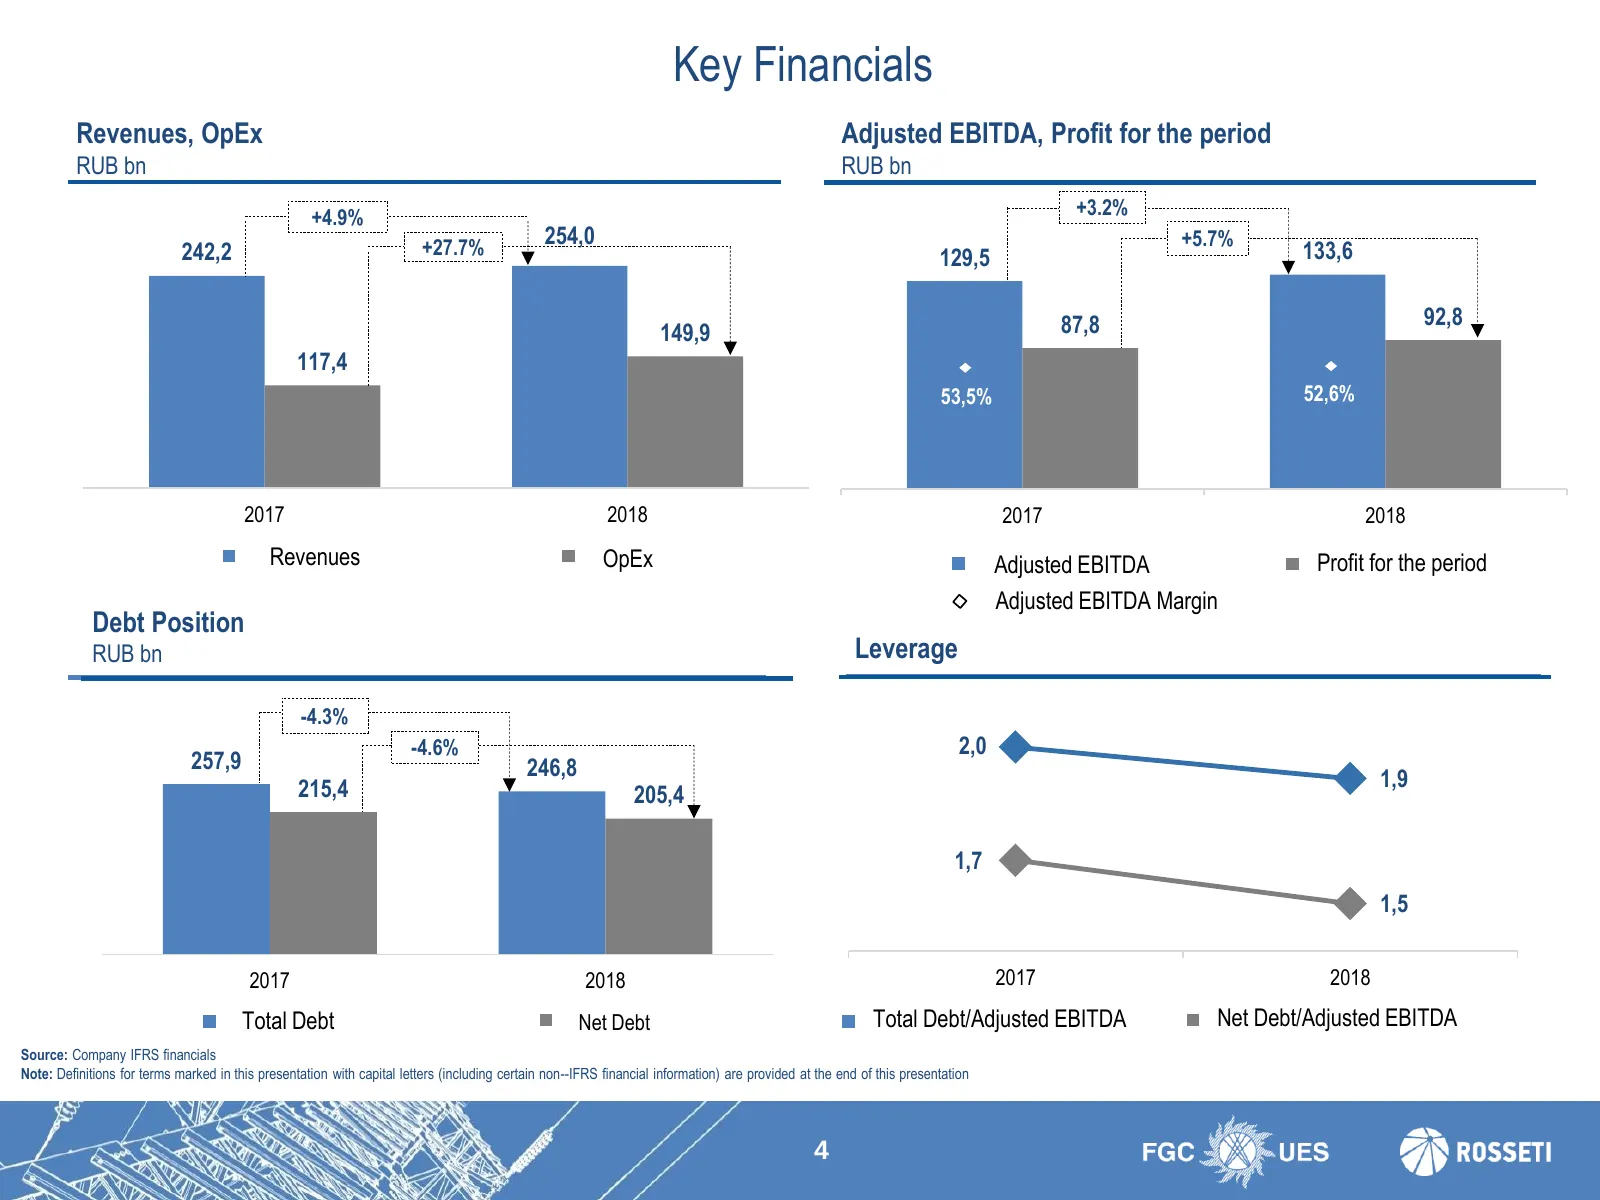
Slide 4: Key Financials
Key Financials Revenues, OpEx Adjusted EBITDA, Profit for the period RUB bn RUB bn +4.9% +3.2% +27.7% 254,0 +5.7% 242,2 129,5 133,6 87,8 92,8 149,9 117,4 53,5% 52,6% 2017 2018 2017 2018 Revenues OpEx Adjusted EBITDA Profit for the period Adjusted EBITDA Margin Debt Position RUB bn Leverage -4.3% -4.
Slide 5: Revenue Structure
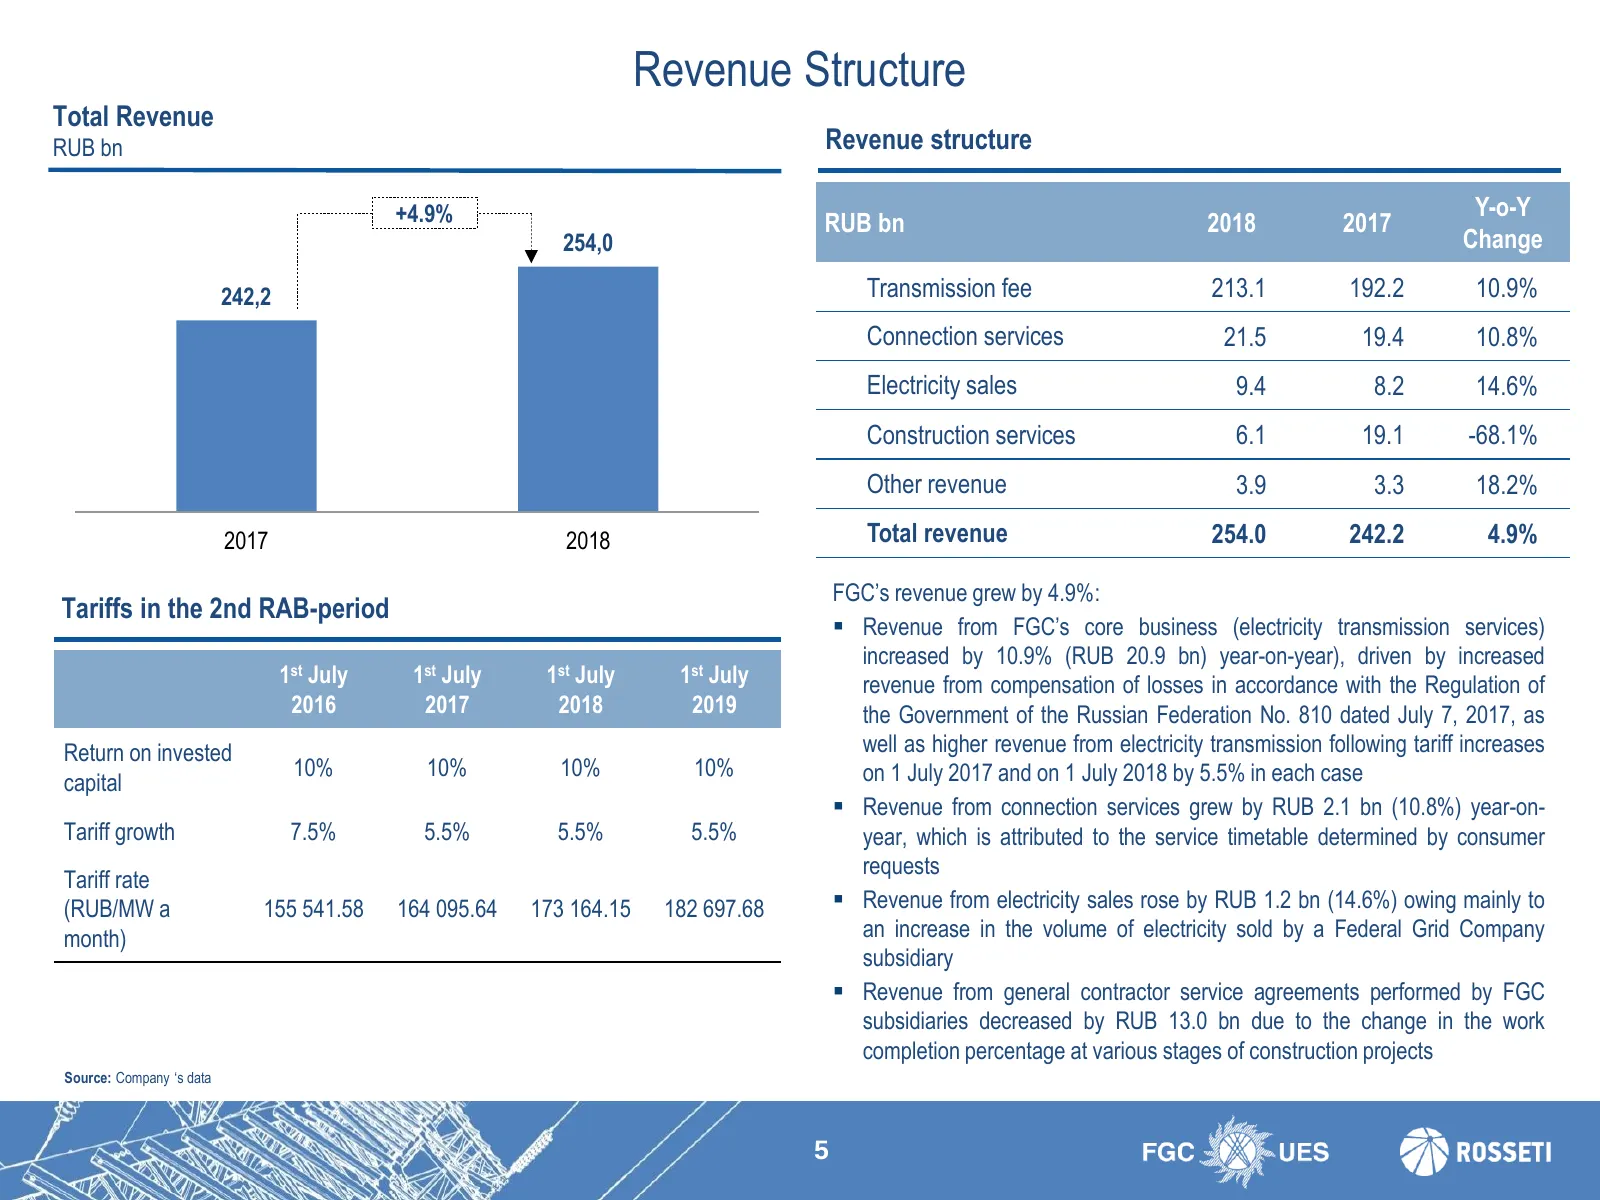
Revenue Structure Total Revenue RUB bn Revenue structure +4.9% Y-o-Y RUB bn 2018 2017 254,0 Change 242,2 Transmission fee 213.1 192.2 10.9% Connection services 21.5 19.4 10.8% Electricity sales 9.4 8.2 14.6% Construction services 6.1 19.1 -68.1% Other revenue 3.9 3.3 18.2% 2017 2018 Total revenue 25
Slide 6: Operating Cost Structure
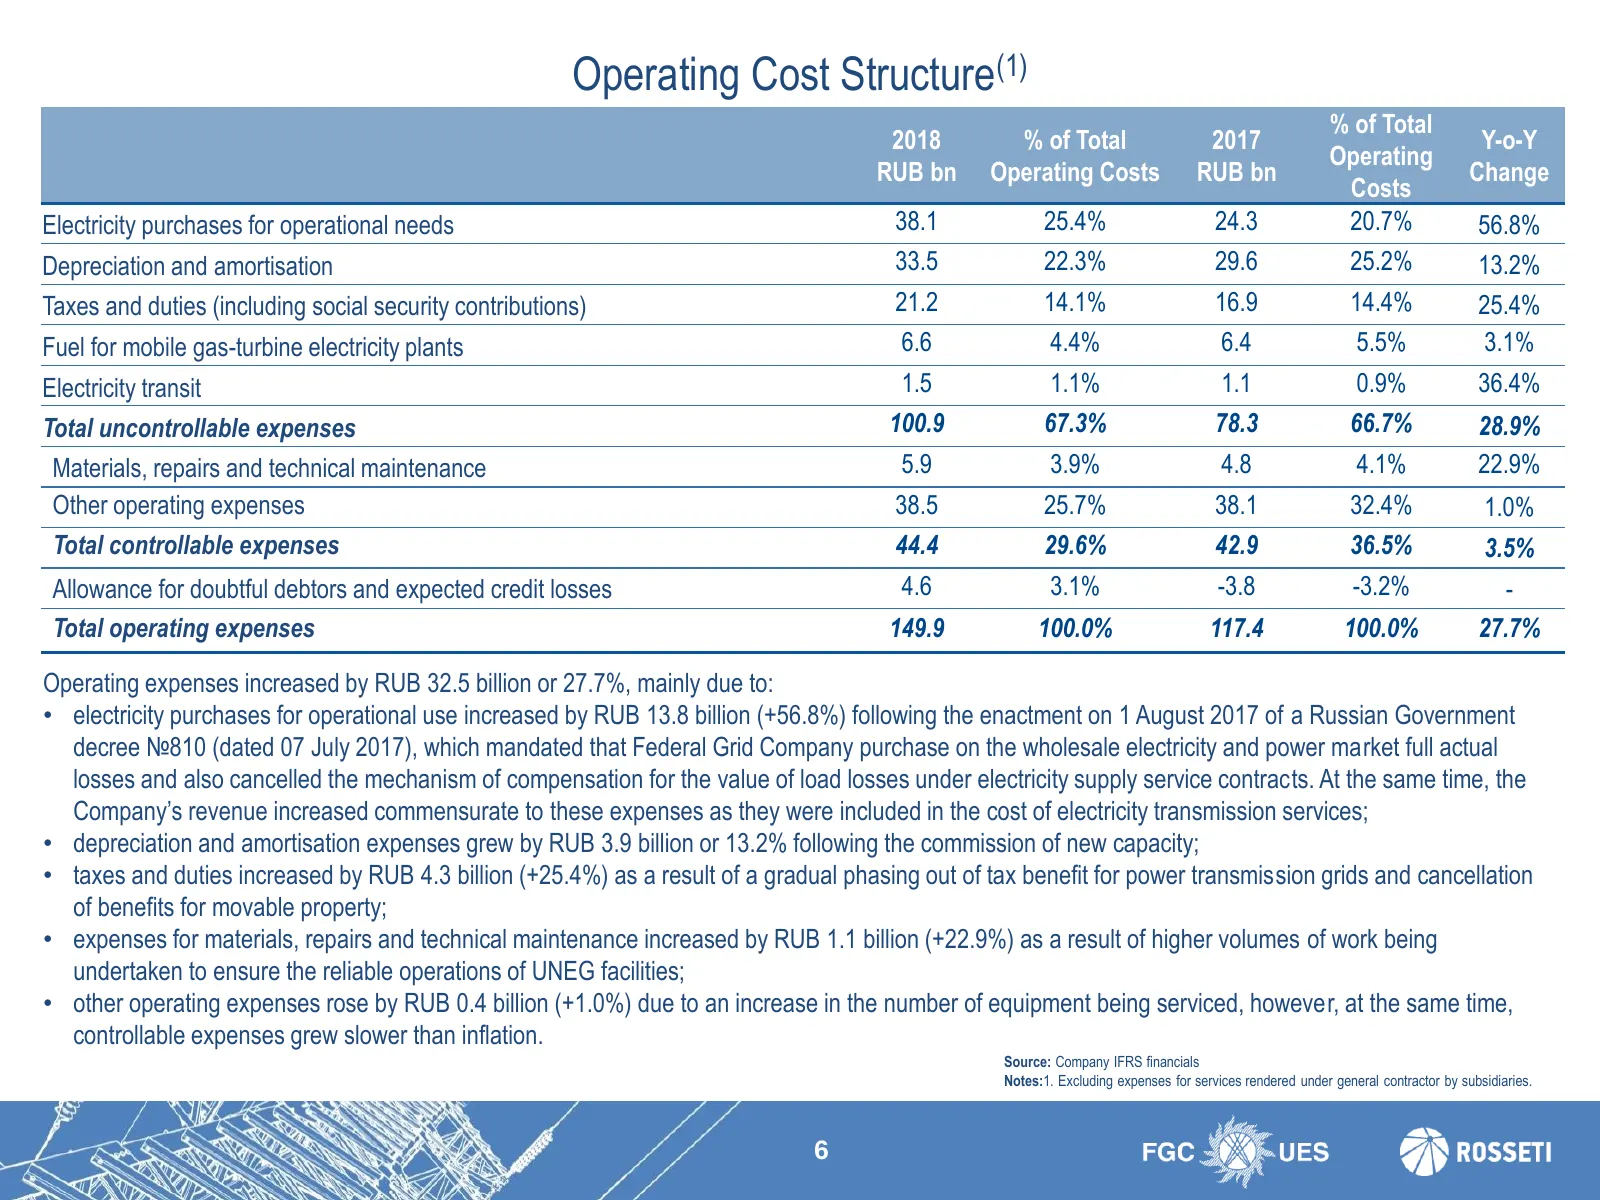
Operating Cost Structure(1) % of Total 2018 % of Total 2017 Y-o-Y Operating RUB bn Operating Costs RUB bn Change Costs Electricity purchases for operational needs 38.1 25.4% 24.3 20.7% 56.8% Depreciation and amortisation 33.5 22.3% 29.6 25.2% 13.2% Taxes and duties (including social security contrib
Slide 7: EBITDA Analysis
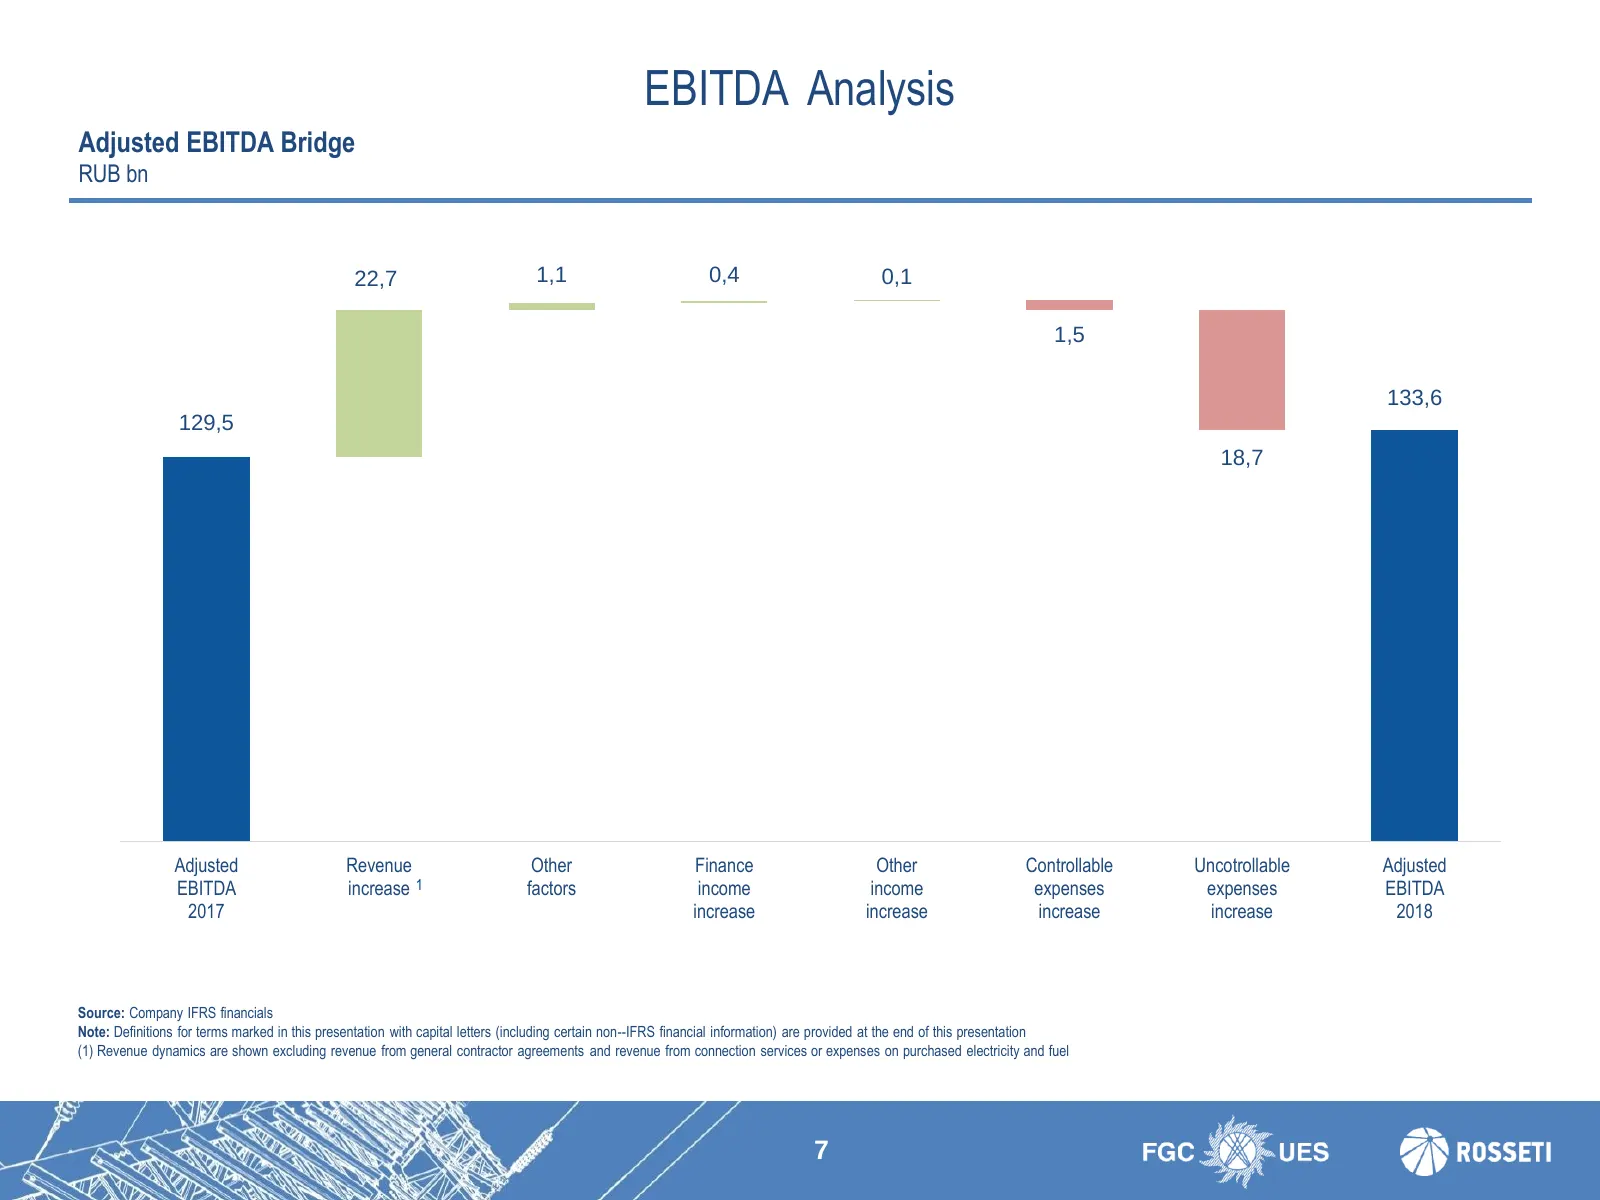
EBITDA Analysis Adjusted EBITDA Bridge RUB bn 22,7 1,1 0,4 0,1 1,5 133,6 129,5 18,7 Adjusted Revenue Other Finance Other Controllable Uncotrollable Adjusted EBITDA increase 1 factors income income expenses expenses EBITDA 2017 increase increase increase increase 2018 Source: Company IFRS financials
Slide 8: Free Cash Flow
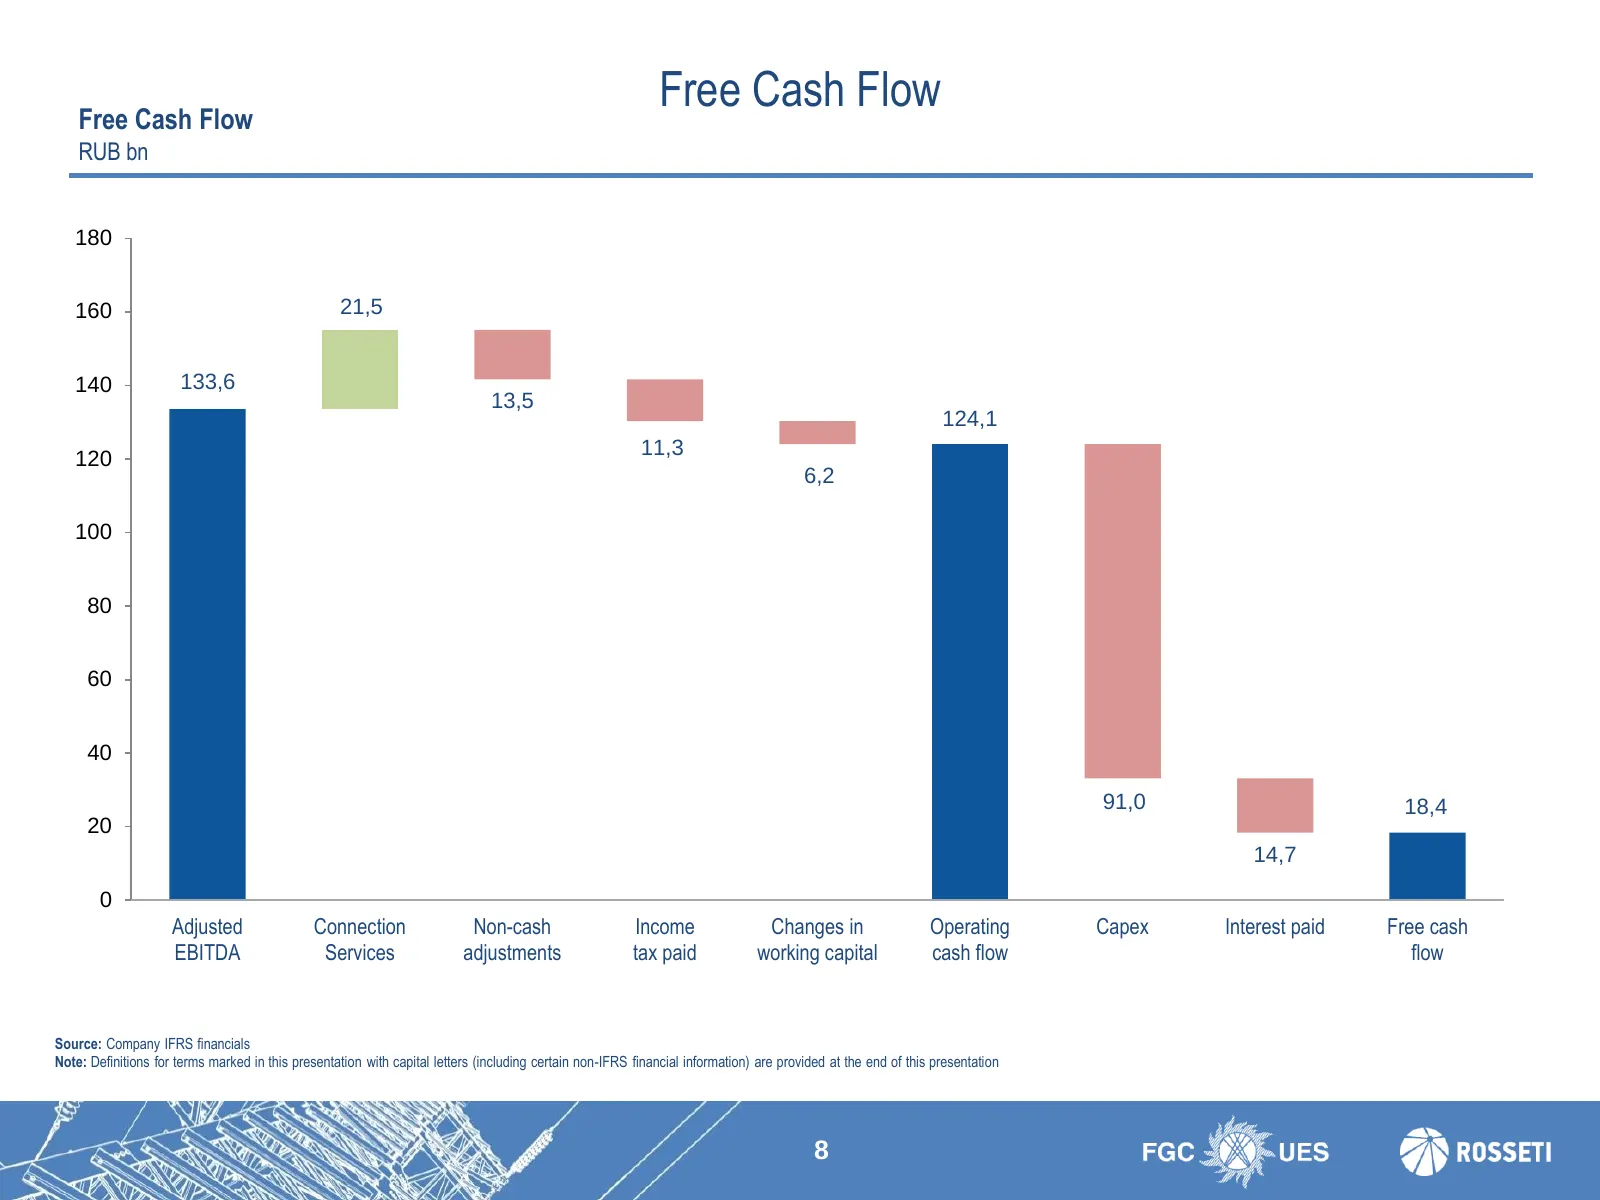
Free Cash Flow Free Cash Flow RUB bn 180 160 21,5 140 133,6 13,5 124,1 120 11,3 6,2 100 80 60 40 91,0 18,4 20 14,7 0 Adjusted Connection Non-cash Income Changes in Operating Capex Interest paid Free cash EBITDA Services adjustments tax paid working capital cash flow flow Source: Company IFRS financi
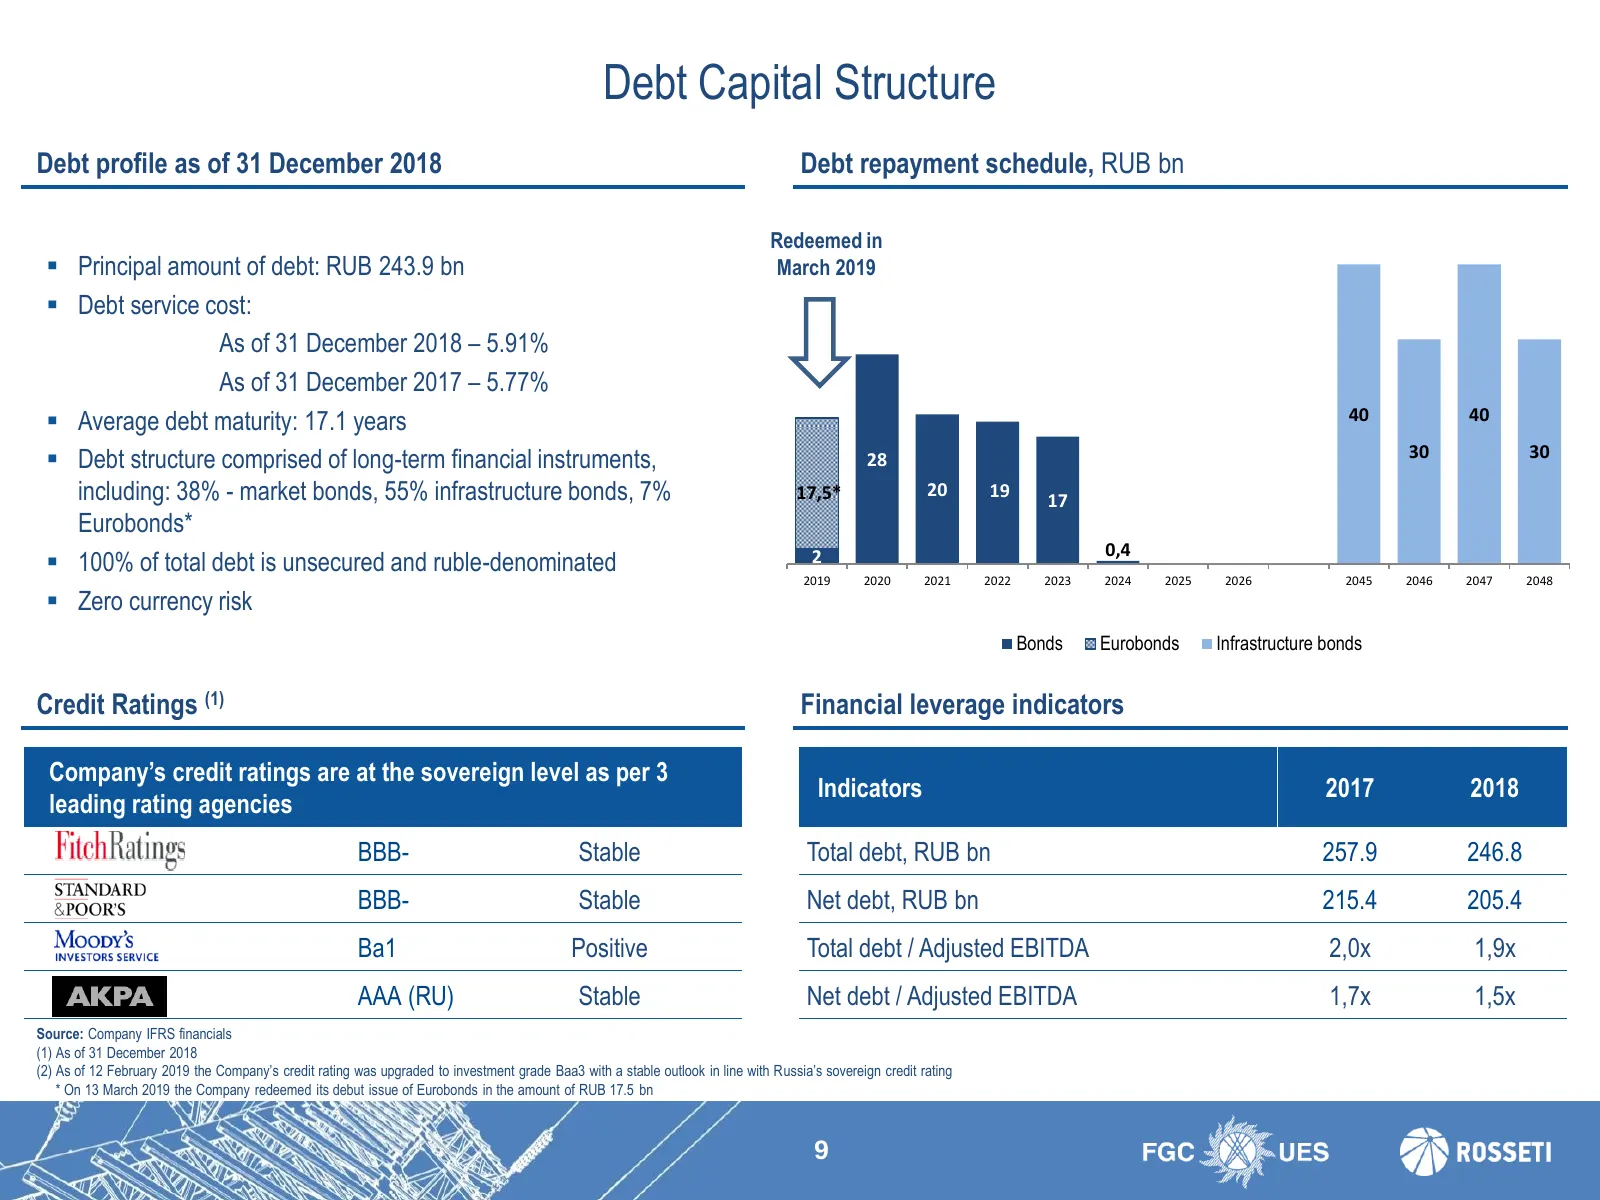
Slide 9: Debt Capital Structure
Debt Capital Structure Debt profile as of 31 December 2018 Debt repayment schedule, RUB bn Redeemed in Principal amount of debt: RUB 243.9 bn March 2019 Debt service cost: As of 31 December 2018 – 5.91% As of 31 December 2017 – 5.77% Average debt maturity: 17.1 years 40 40 30 30 Debt structu
Slide 10: Glossary
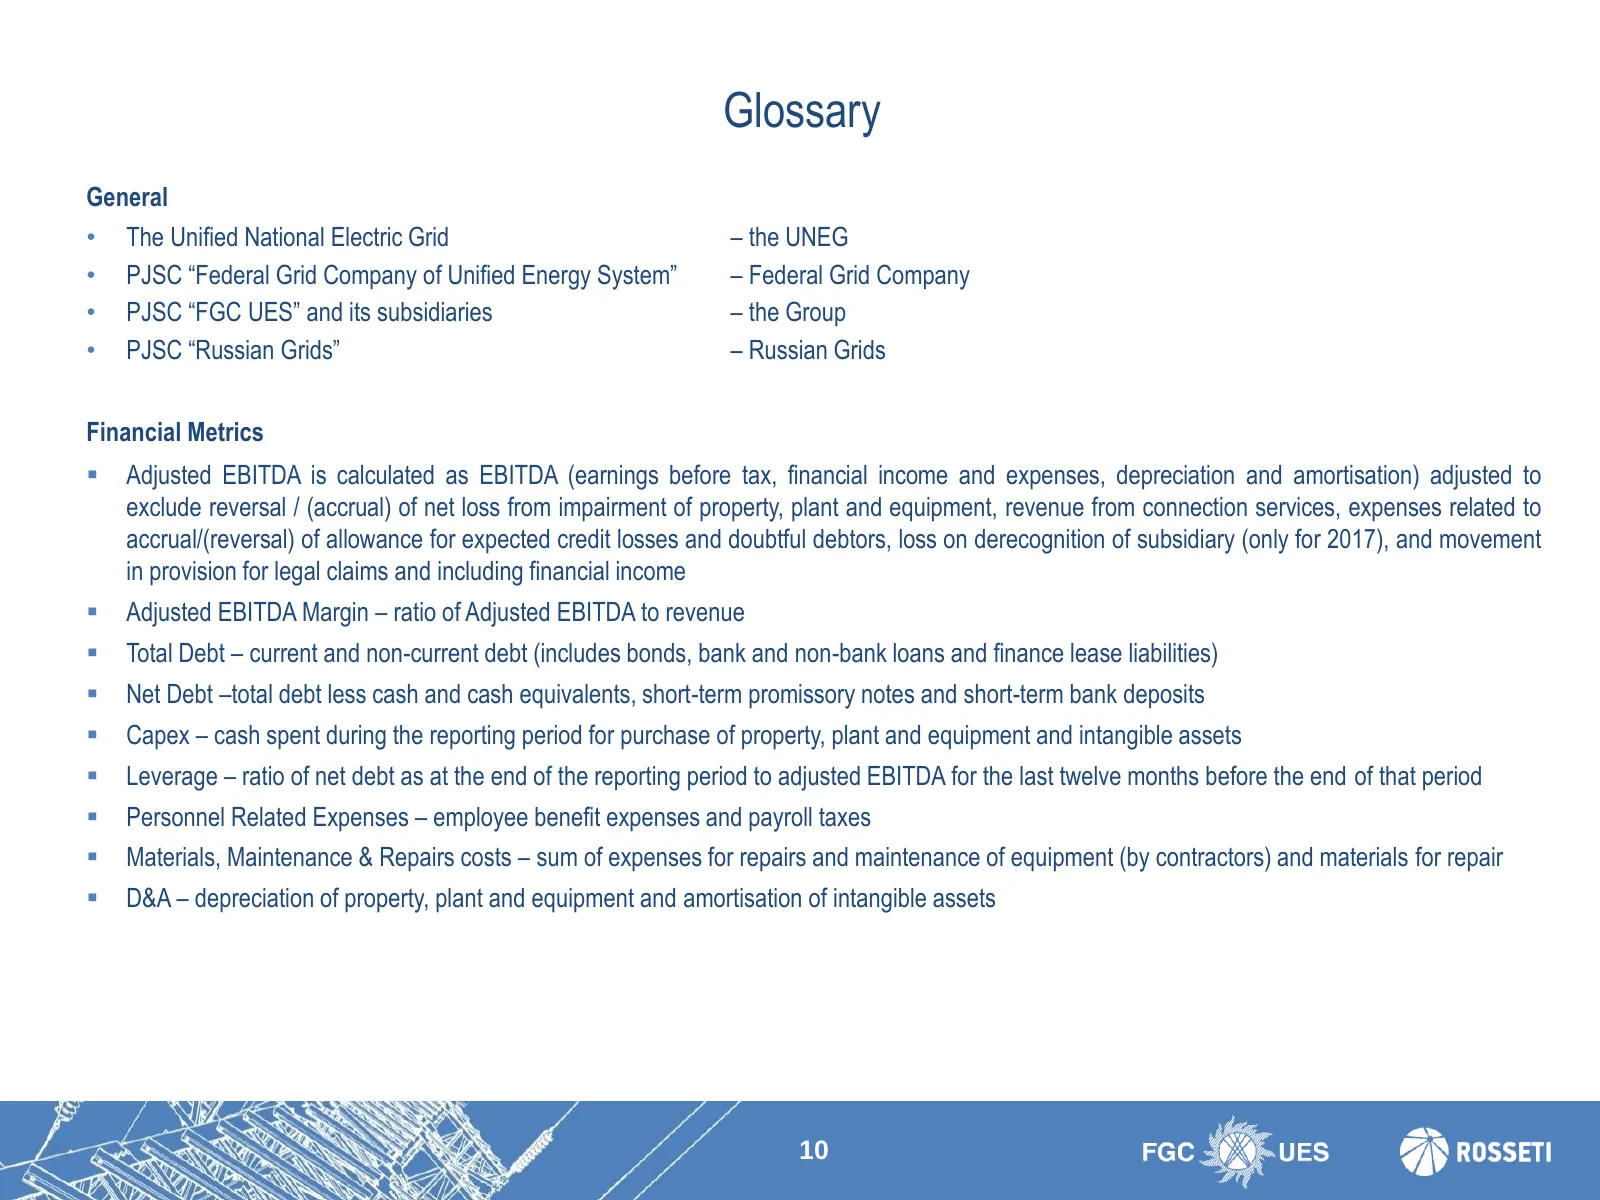
Glossary General • The Unified National Electric Grid – the UNEG • PJSC “Federal Grid Company of Unified Energy System” – Federal Grid Company • PJSC “FGC UES” and its subsidiaries – the Group • PJSC “Russian Grids” – Russian Grids Financial Metrics Adjusted EBITDA is calculated as EBITDA (earning
Slide 11: Investor Relations Contacts
Investor Relations Contacts Egor Toropov Tel.: +7 495 710 9333 ext. 2275 E-mail: toropov-ev@fsk-ees.ru Alexey Novikov Tel.: +7 495 710 9333 ext. 2143 E-mail: novikov-as@fsk-ees.ru
Source: Internet Archive copy of fsk-ees.ru
More decks from FGC Rosseti
 пао «фск еэс» — 9M 2021 Earnings Presentation9 slides · November 2021
 Rosseti FGC UES — 9M 2021 Earnings Presentation9 slides · November 2021
 PJSC FGC UES (Rosseti FGC UES) — FY2020 Earnings Presentation9 slides · Jun 1, 2021
 пао «фск еэс» — FY2020 Earnings Presentation10 slides · 2021
 Россети (Rosseti) / ПАО «ФСК ЕЭС» — FY2020 Earnings Presentation20 slides · 2021
 пао «фск еэс» — FY2019 Earnings Presentation11 slides · Mar 5, 2020