Earthstone Energy — Investor Presentation (November 2020)
25 slides from Earthstone Energy's investor presentation, Nov 19, 2020
Slide 1: Investor Presentation November 18, 2020
Exhibit 99.1 Investor Presentation November 18, 2020 1
Slide 2: Disclaimer: Forward-Looking Statements
Disclaimer Forward-Looking Statements This presentation contains forward-looking statements within the meaning of Section 27A of the Securities Act of 1933, as amended (the “Securities Act”), and Section 21E of the Securities Exchange Act of 1934, as amended (the “Exchange Act”). Statements that are
Slide 3: Investment Highlights: Leading Small-Cap, Permian Focused Producer
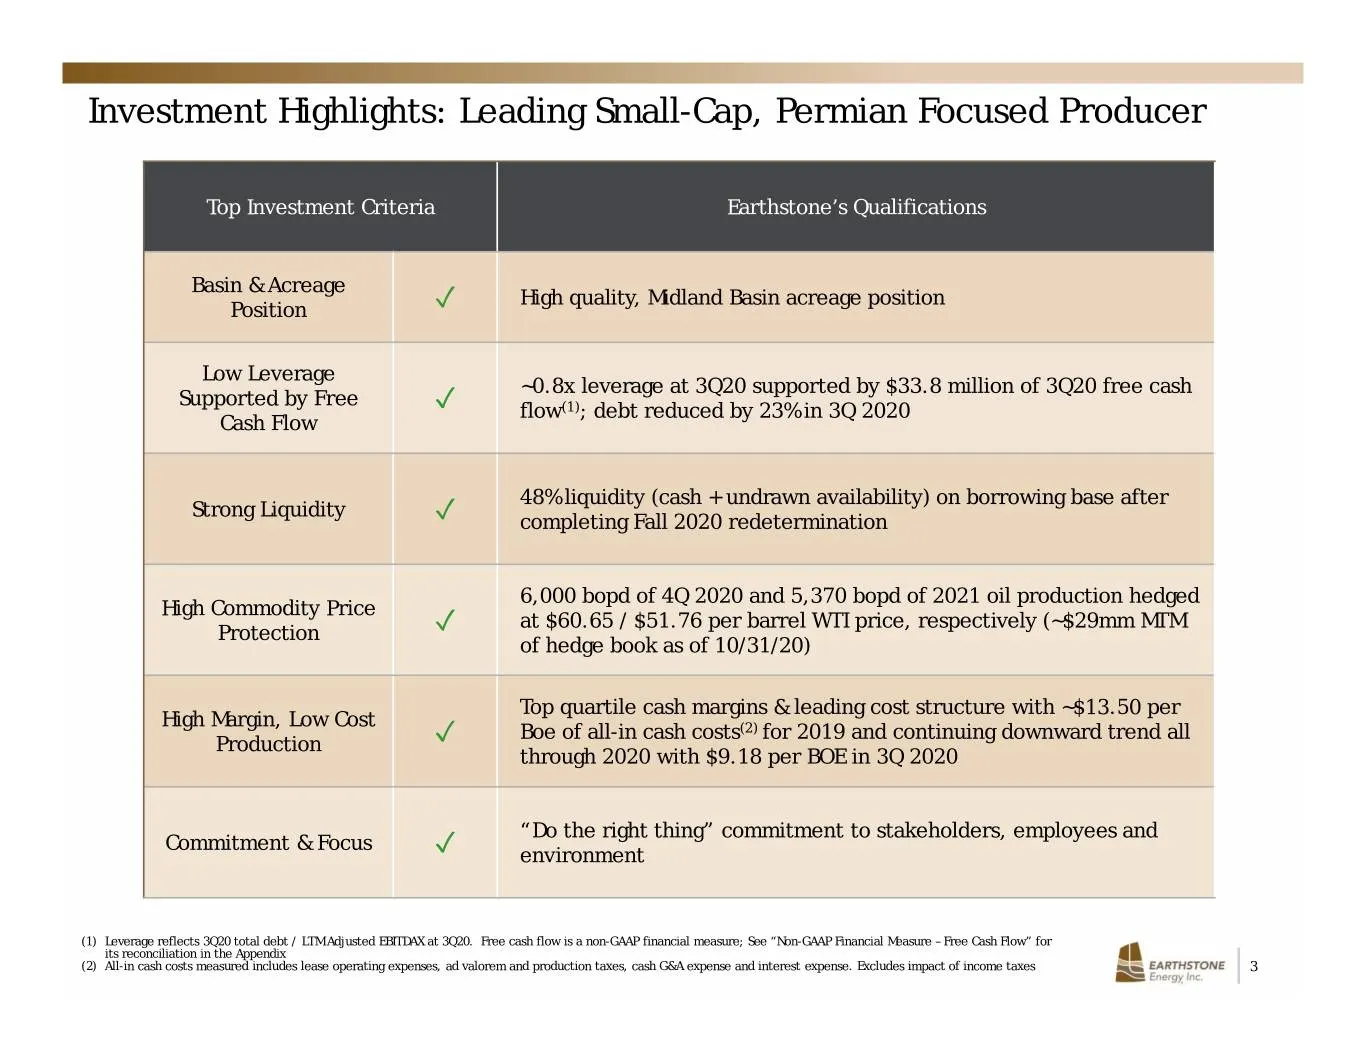
Investment Highlights: Leading Small-Cap, Permian Focused Producer Top Investment Criteria Earthstone’s Qualifications Basin & Acreage High quality, Midland Basin acreage position Position ✓ Low Leverage ~0.8x leverage at 3Q20 supported by $33.8 million of 3Q20 free cash Supported by Free ✓ flow(1);
Slide 4: Proven Leadership and Track Record of Value Creation
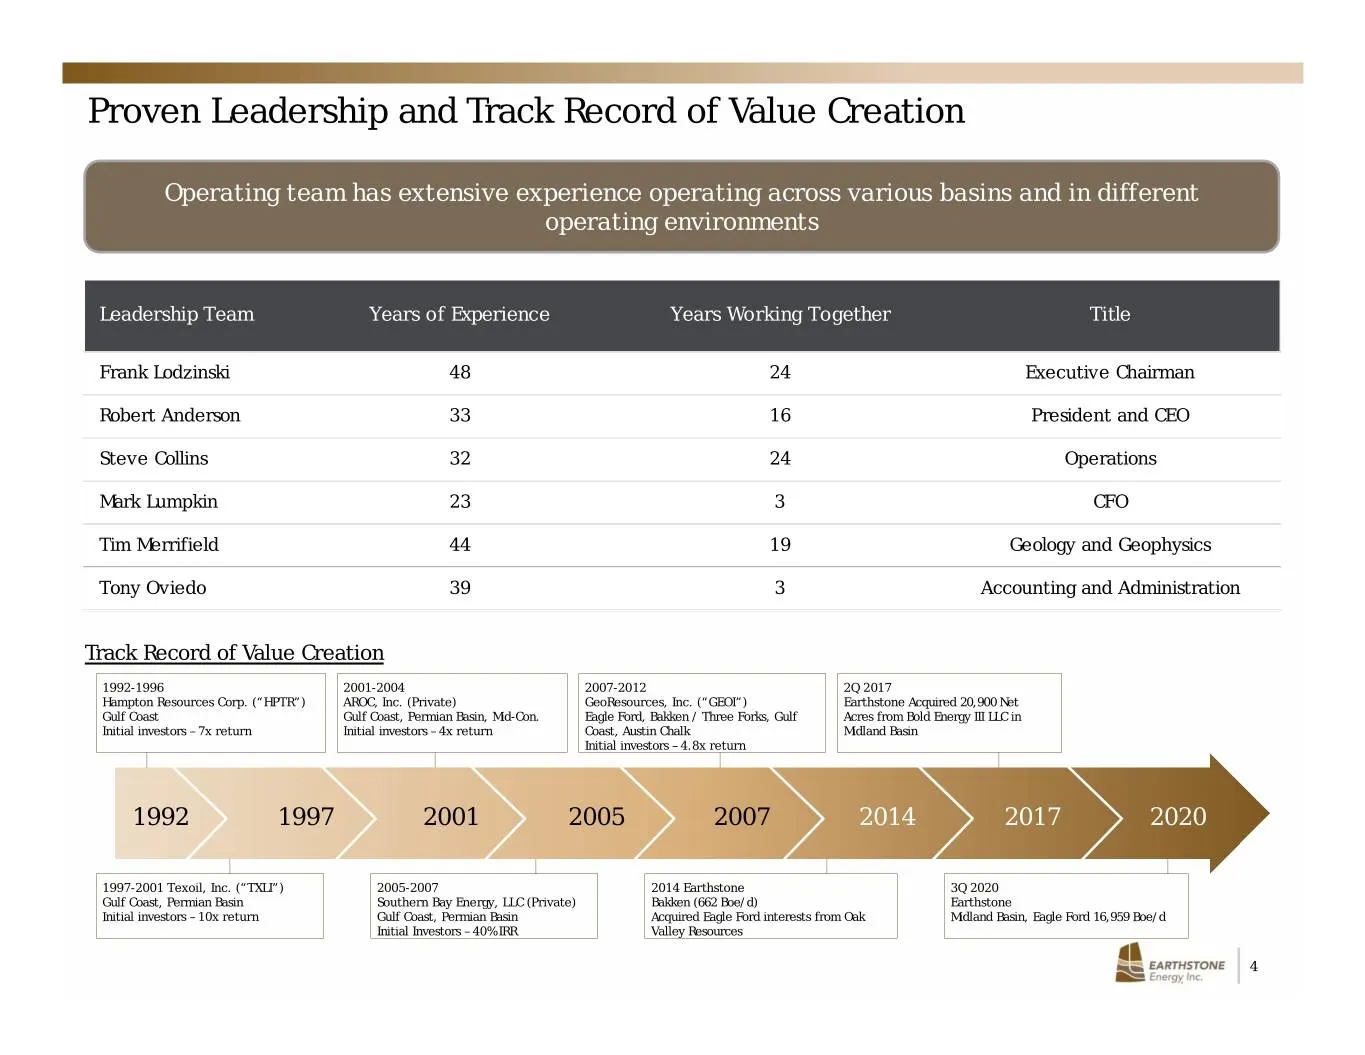
Proven Leadership and Track Record of Value Creation Operating team has extensive experience operating across various basins and in different operating environments Leadership Team Years of Experience Years Working Together Title Frank Lodzinski 48 24 Executive Chairman Robert Anderson 33 16 Preside
Slide 5: 2020: Managing Oil Price Collapse and Delivering Results
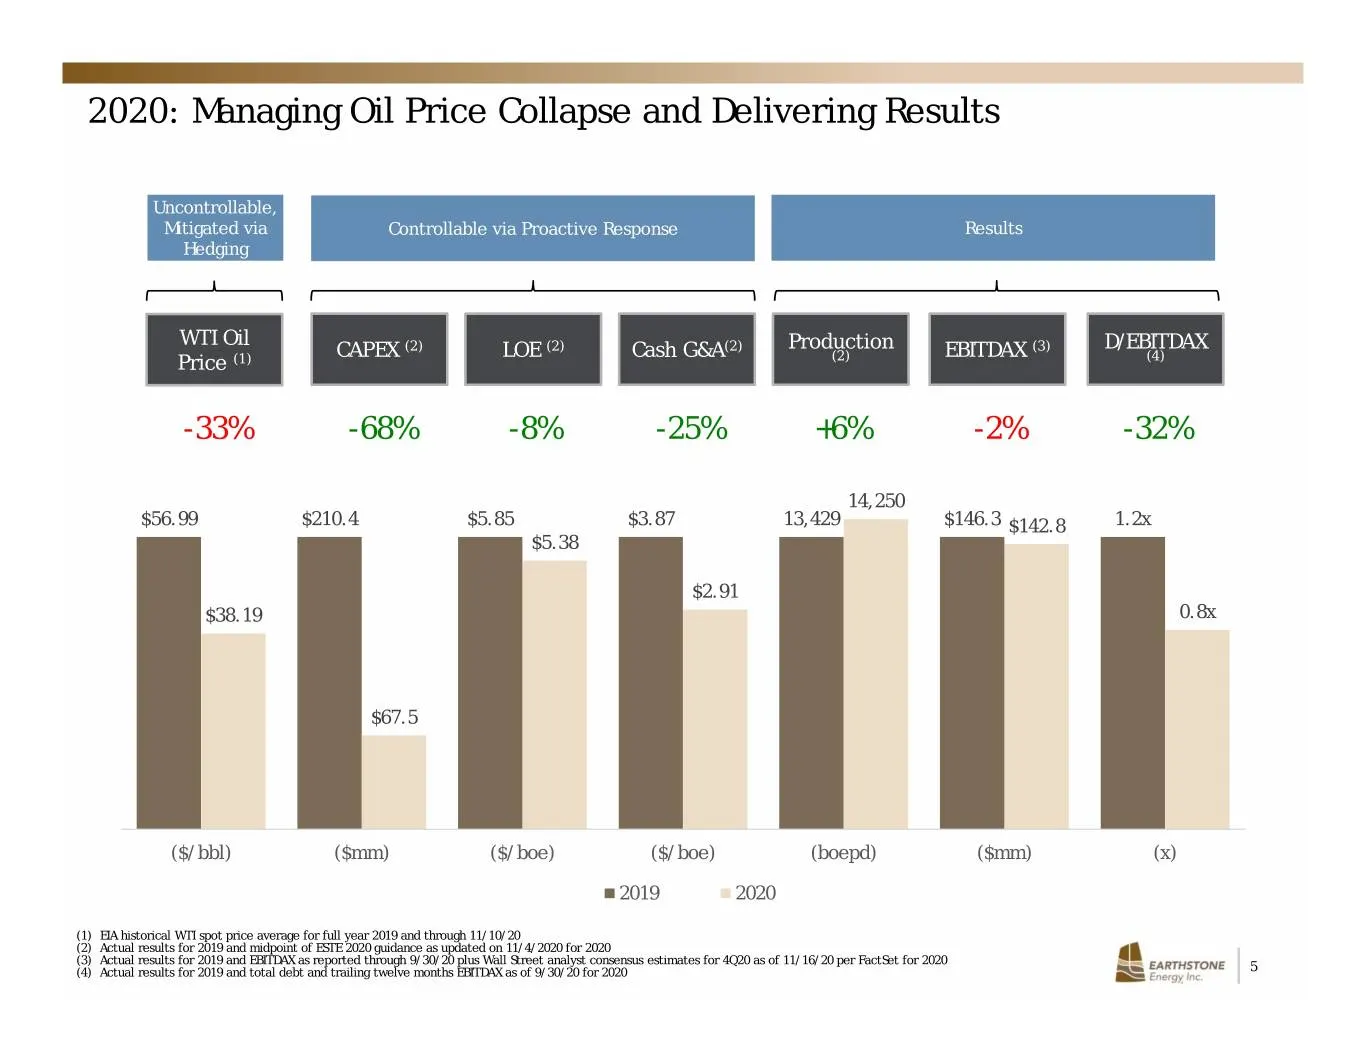
2020: Managing Oil Price Collapse and Delivering Results Uncontrollable, Mitigated via Controllable via Proactive Response Results Hedging WTI Oil CAPEX (2) LOE (2) Cash G&A(2) Production EBITDAX (3) D/EBITDAX Price (1) (2) (4) -33% -68% -8% -25% +6% -2% -32% 14,250 $56.99 $210.4 $5.85 $3.87 13,429
Slide 6: Oil Price Volatility Requires Focused Business Strategy
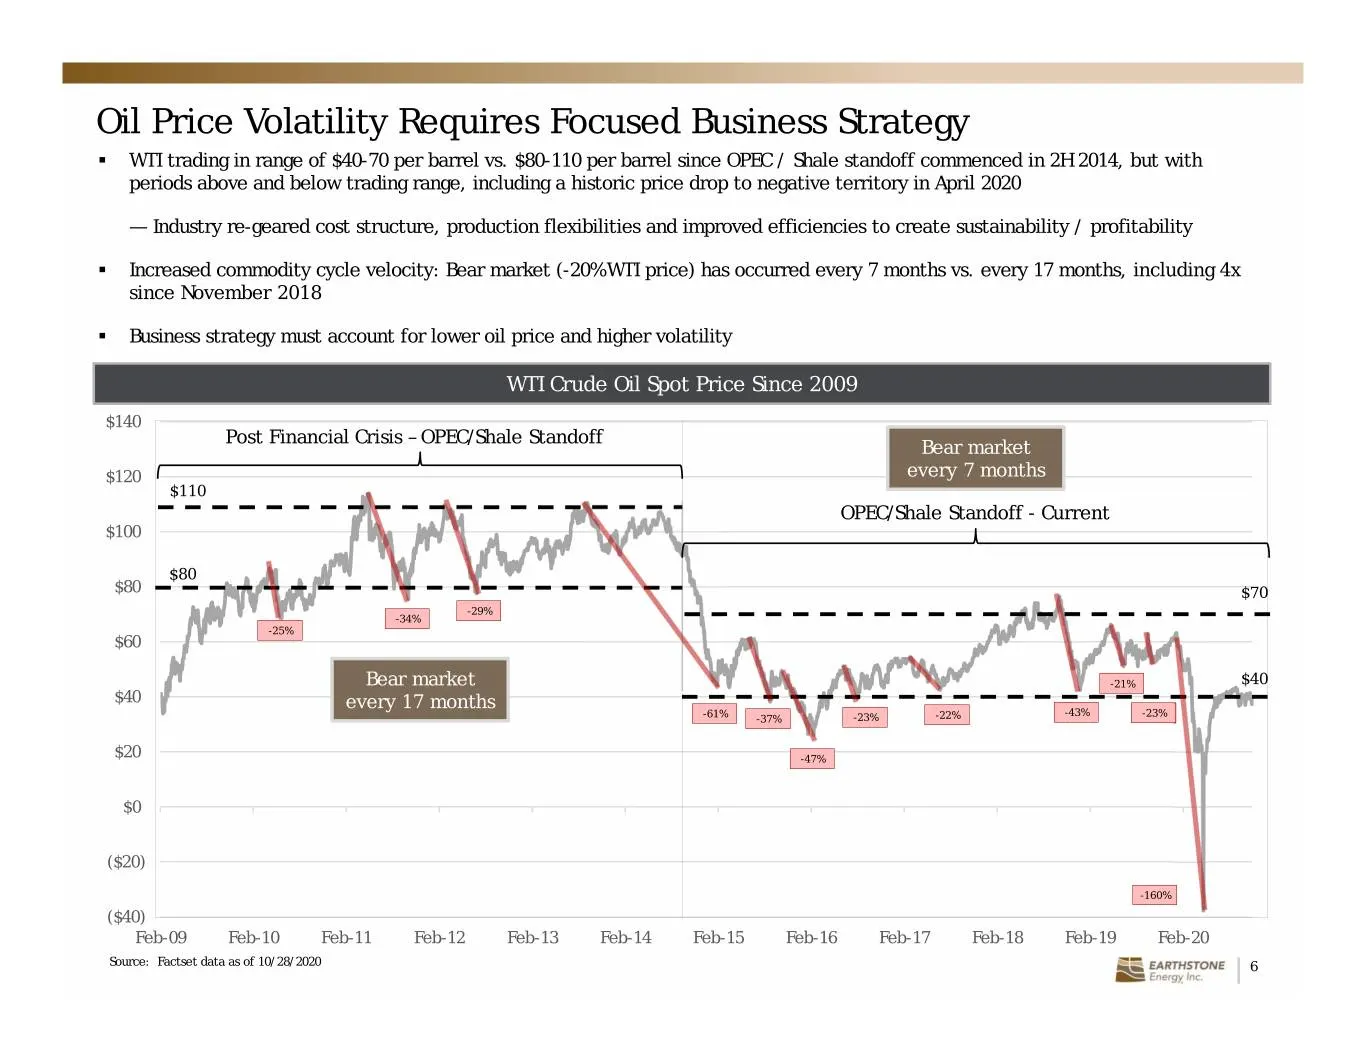
Oil Price Volatility Requires Focused Business Strategy . WTI trading in range of $40-70 per barrel vs. $80-110 per barrel since OPEC / Shale standoff commenced in 2H 2014, but with periods above and below trading range, including a historic price drop to negative territory in April 2020 — Industry
Slide 7: Managing Through Oil Price Volatility
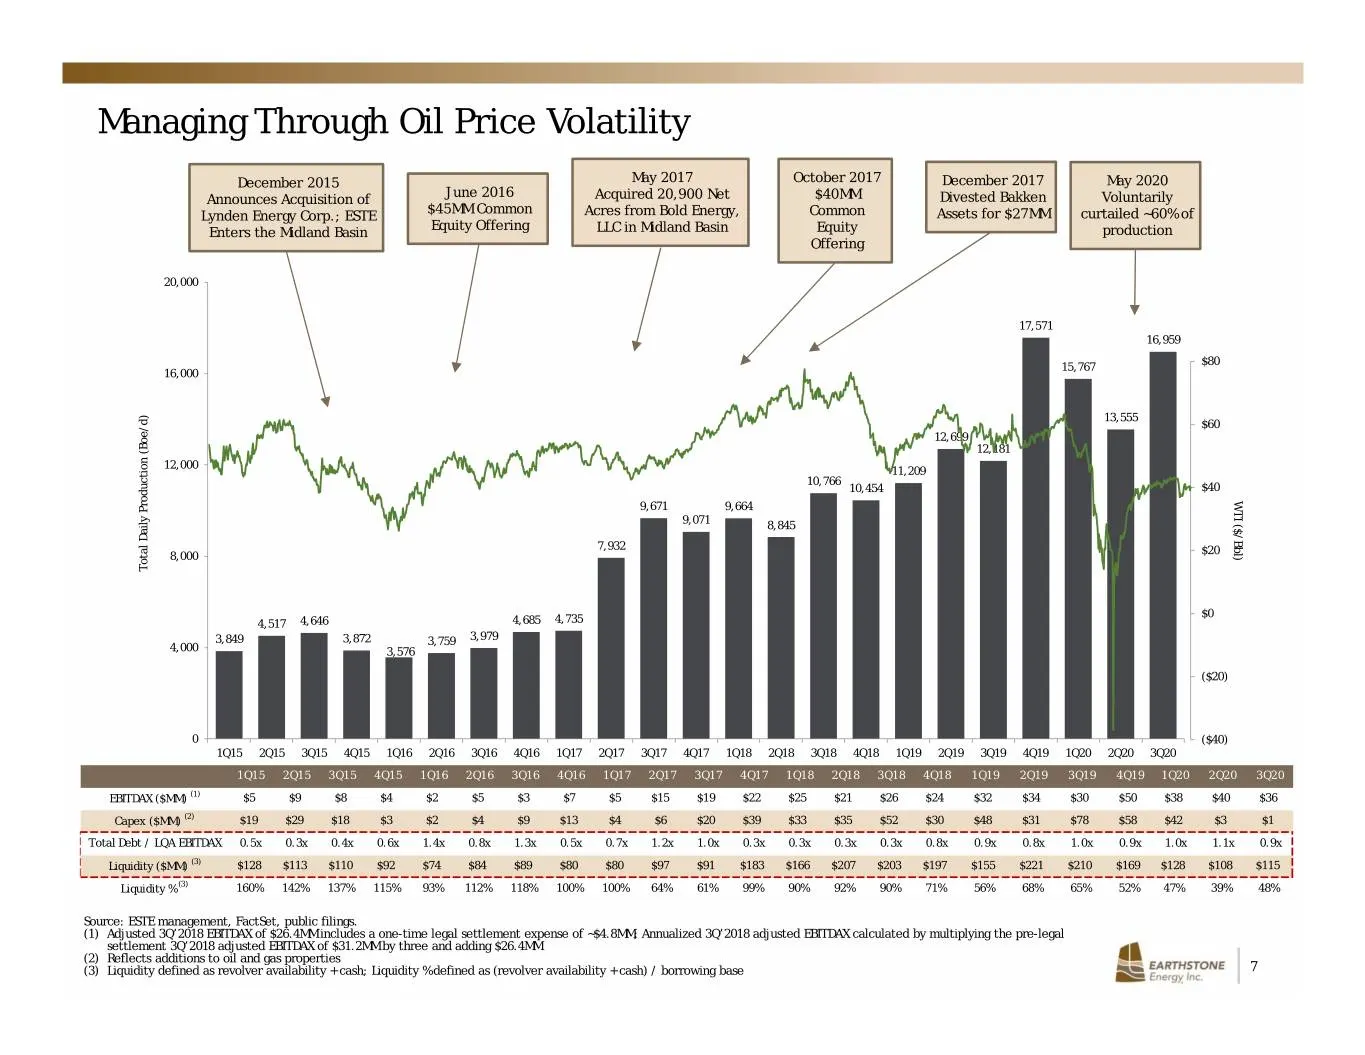
Managing Through Oil Price Volatility December 2015 May 2017 October 2017 December 2017 May 2020 June 2016 Announces Acquisition of Acquired 20,900 Net $40MM Divested Bakken Voluntarily $45MM Common Lynden Energy Corp.; ESTE Acres from Bold Energy, Common Assets for $27MM curtailed ~60% of Equity Of
Slide 8: Company Overview
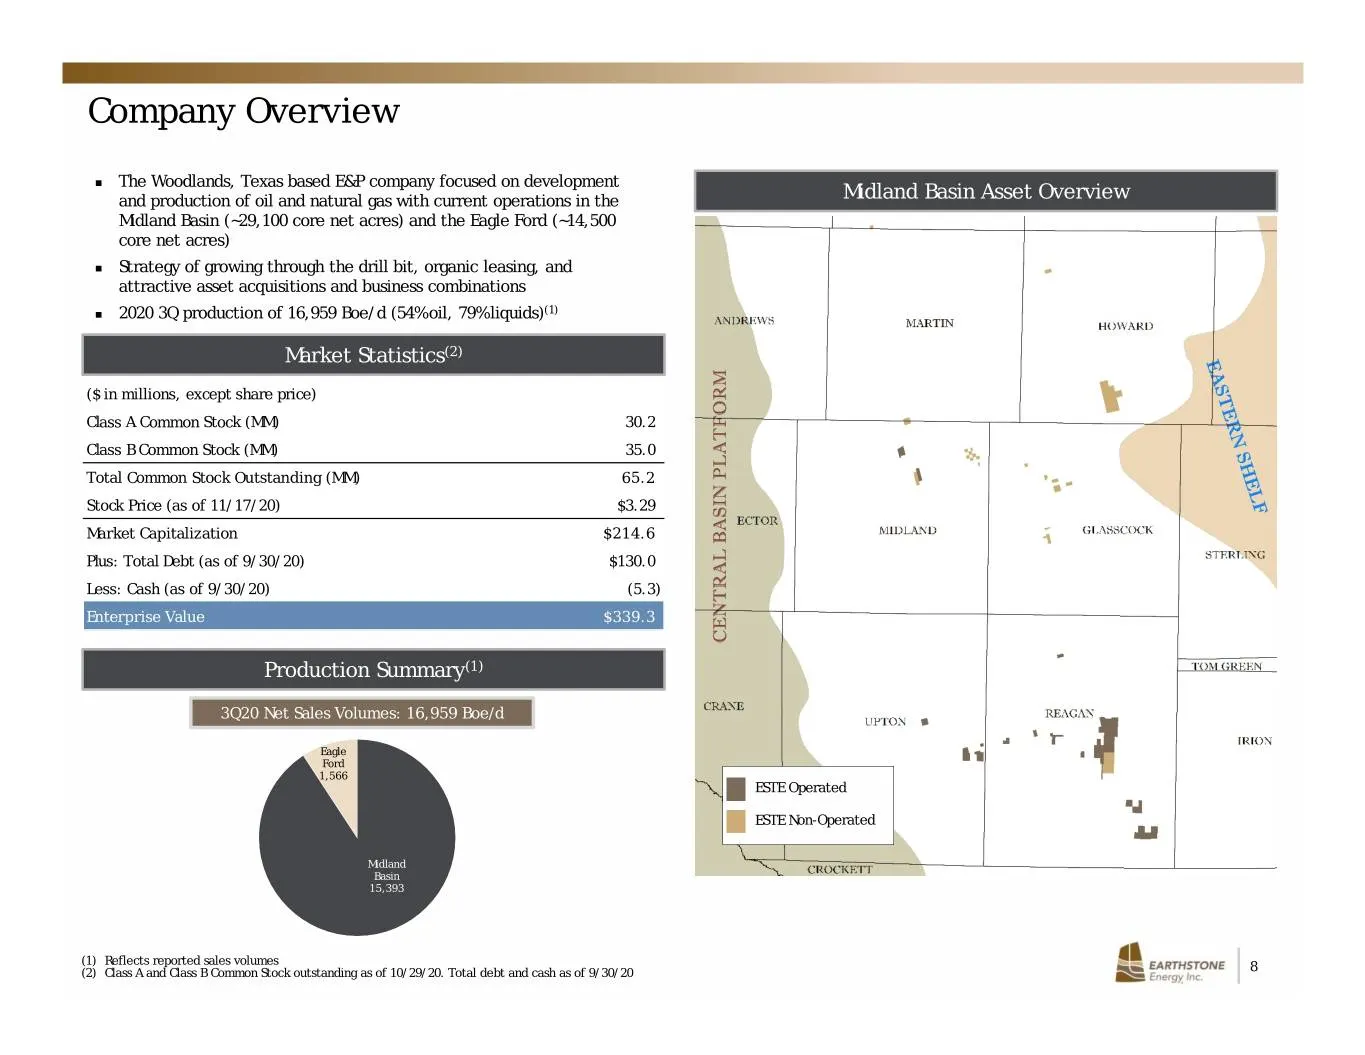
Company Overview The Woodlands, Texas based E&P company focused on development and production of oil and natural gas with current operations in the Midland Basin Asset Overview Midland Basin (~29,100 core net acres) and the Eagle Ford (~14,500 core net acres) Strategy of growing through the dril
Slide 9: Midland Basin Growth Story – But Growth on Pause
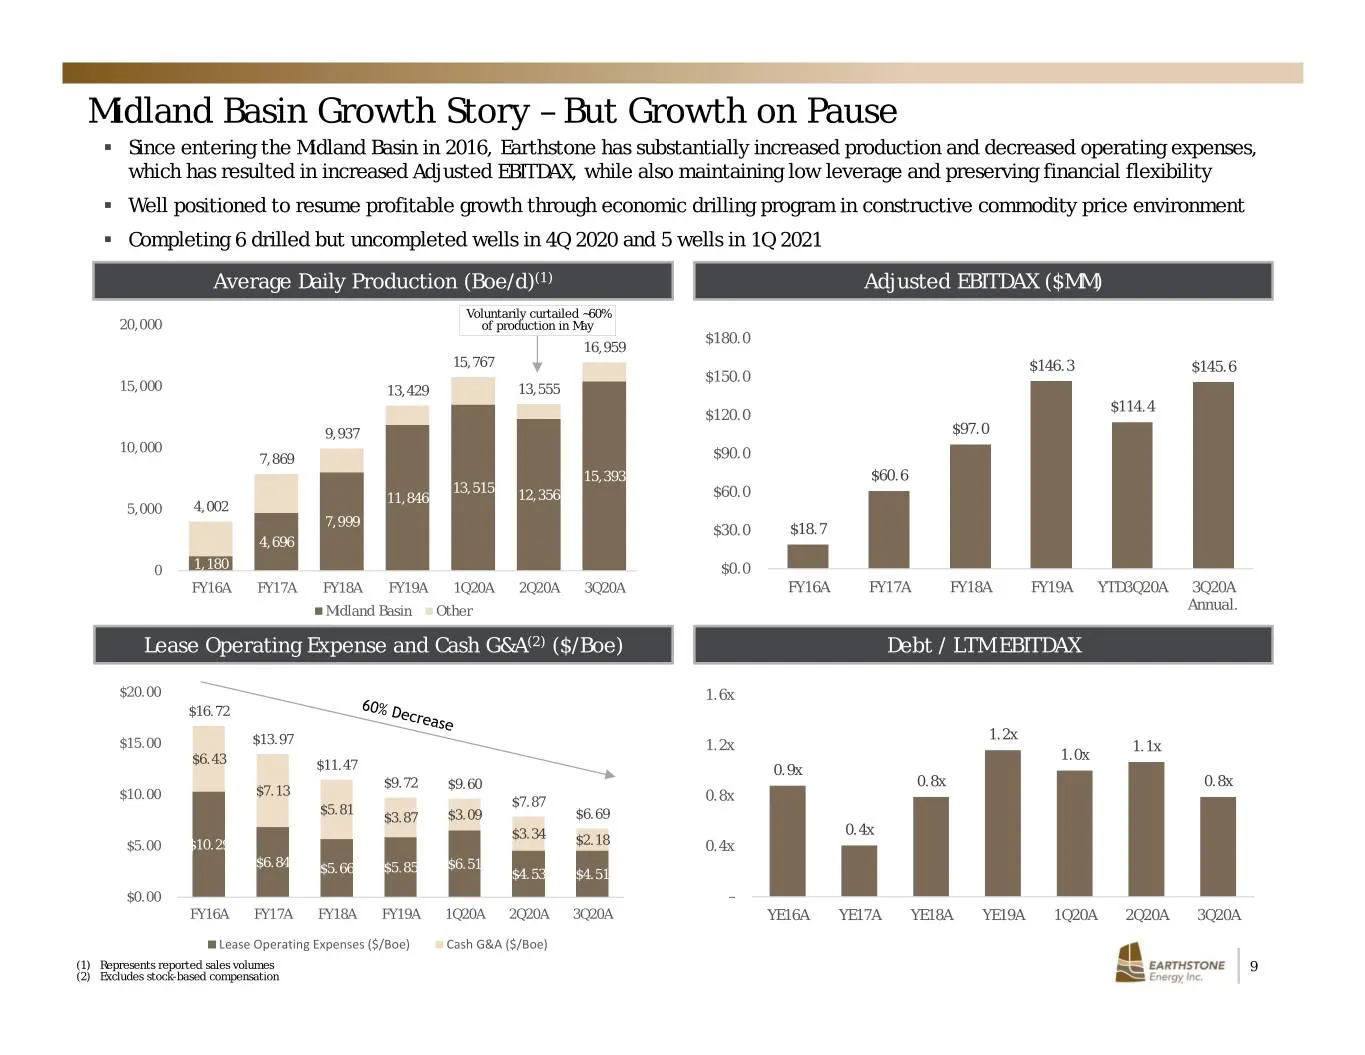
Midland Basin Growth Story – But Growth on Pause . Since entering the Midland Basin in 2016, Earthstone has substantially increased production and decreased operating expenses, which has resulted in increased Adjusted EBITDAX, while also maintaining low leverage and preserving financial flexibility
Slide 10: Low Cost Production Generates Leading Cash Margins
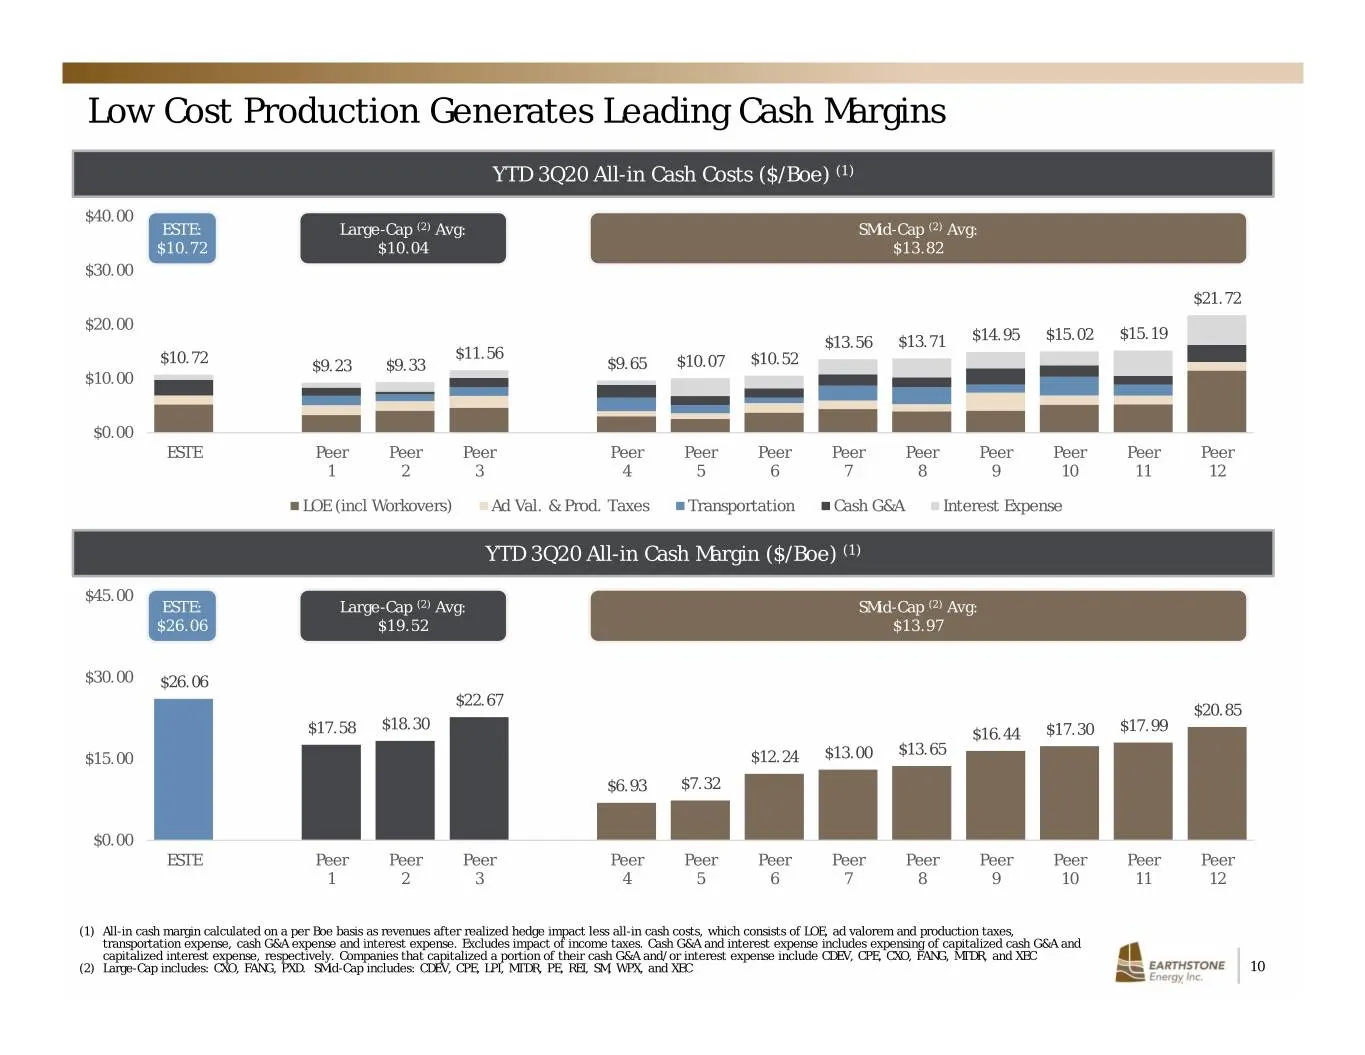
Low Cost Production Generates Leading Cash Margins YTD 3Q20 All-in Cash Costs ($/Boe) (1) $40.00 ESTE: Large-Cap (2) Avg: SMid-Cap (2) Avg: $10.72 $10.04 $13.82 $30.00 $21.72 $20.00 $15.19 $13.56 $13.71 $14.95 $15.02 $10.72 $11.56 $9.23 $9.33 $9.65 $10.07 $10.52 $10.00 $0.00 ESTE Peer Peer Peer Peer
Slide 11: Leading Leverage Metrics but Undervalued Equity Trading
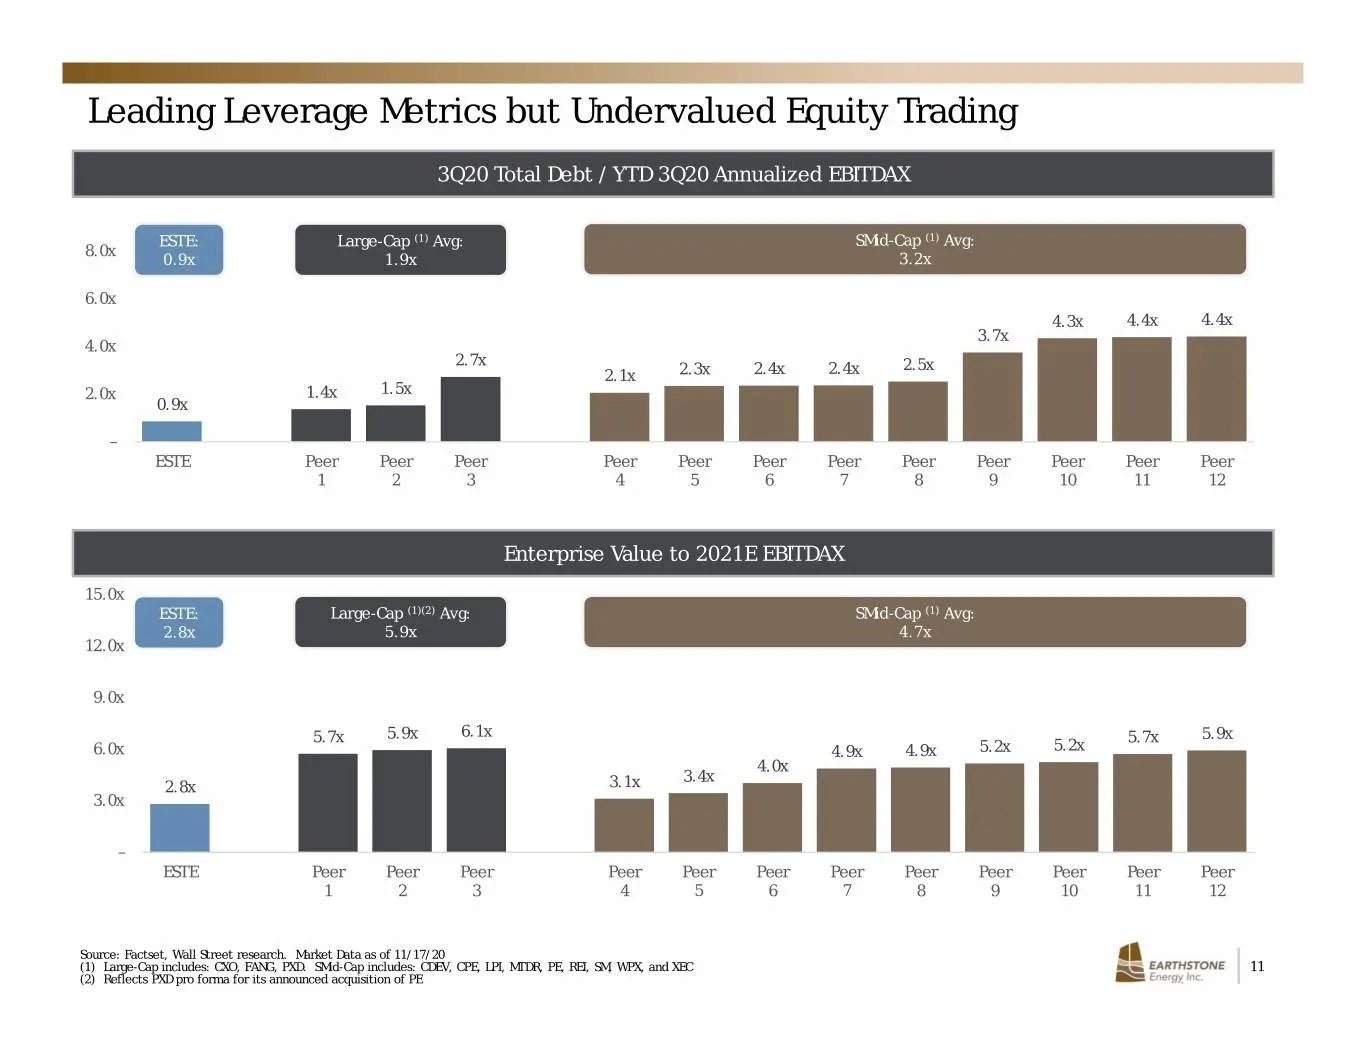
Leading Leverage Metrics but Undervalued Equity Trading 3Q20 Total Debt / YTD 3Q20 Annualized EBITDAX ESTE: Large-Cap (1) Avg: SMid-Cap (1) Avg: 8.0x 0.9x 1.9x 3.2x 6.0x 4.3x 4.4x 4.4x 3.7x 4.0x 2.7x 2.5x 2.1x 2.3x 2.4x 2.4x 2.0x 1.4x 1.5x 0.9x – ESTE Peer Peer Peer Peer Peer Peer Peer Peer Peer Pee
Slide 12: Continuous Focus on Operational Improvement
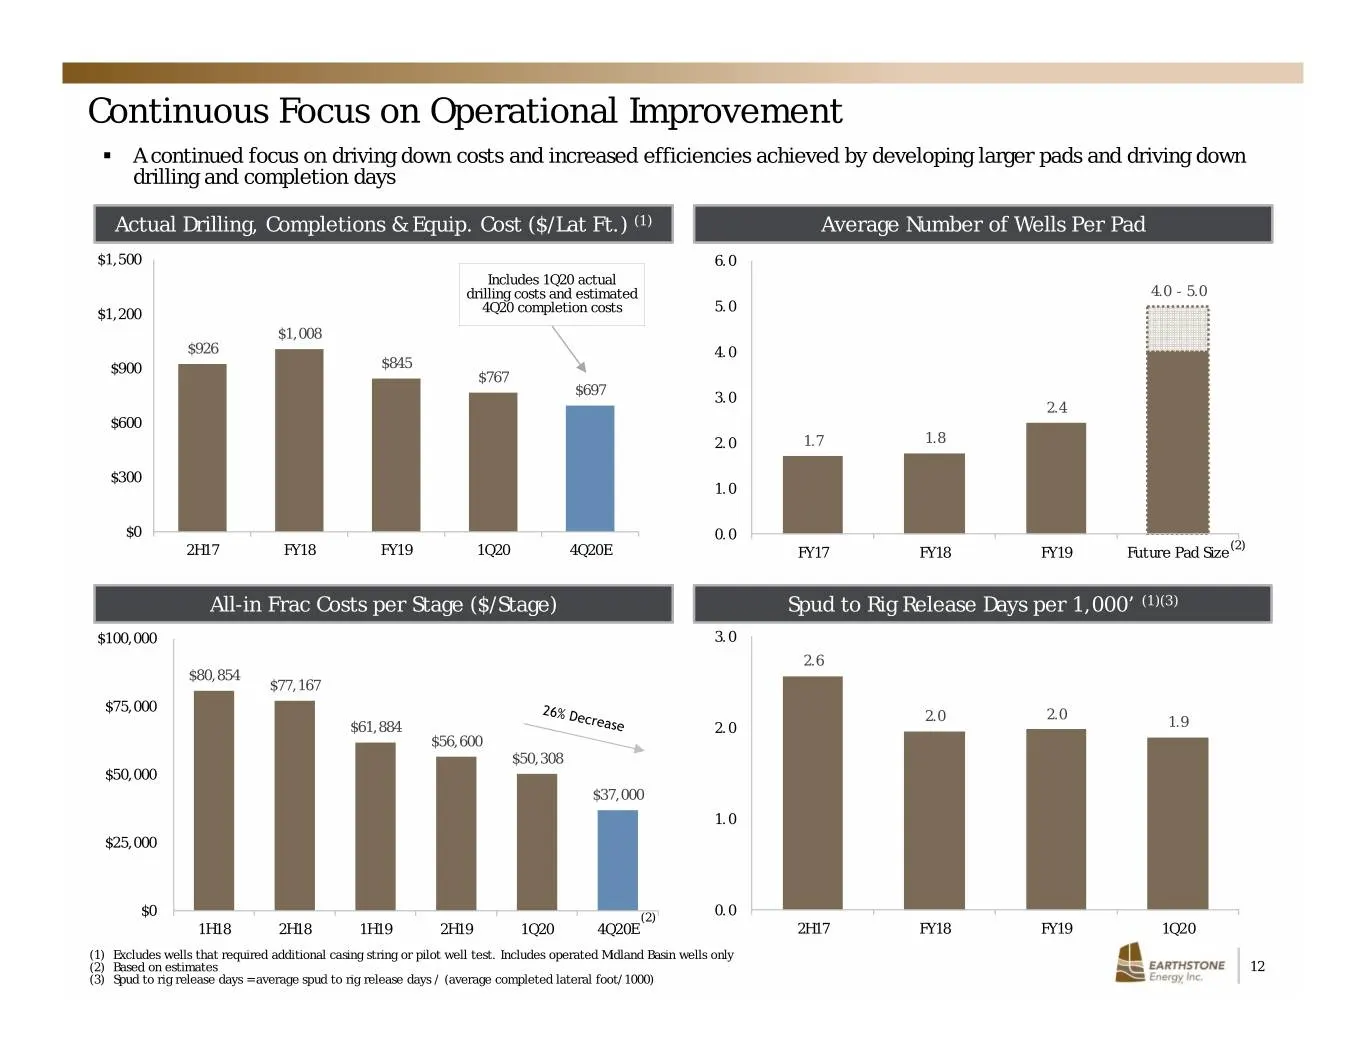
Continuous Focus on Operational Improvement . A continued focus on driving down costs and increased efficiencies achieved by developing larger pads and driving down drilling and completion days Actual Drilling, Completions & Equip. Cost ($/Lat Ft.) (1) Average Number of Wells Per Pad $1,500 6.0 Incl
Slide 13: Highly Focused Environmental Stewardship
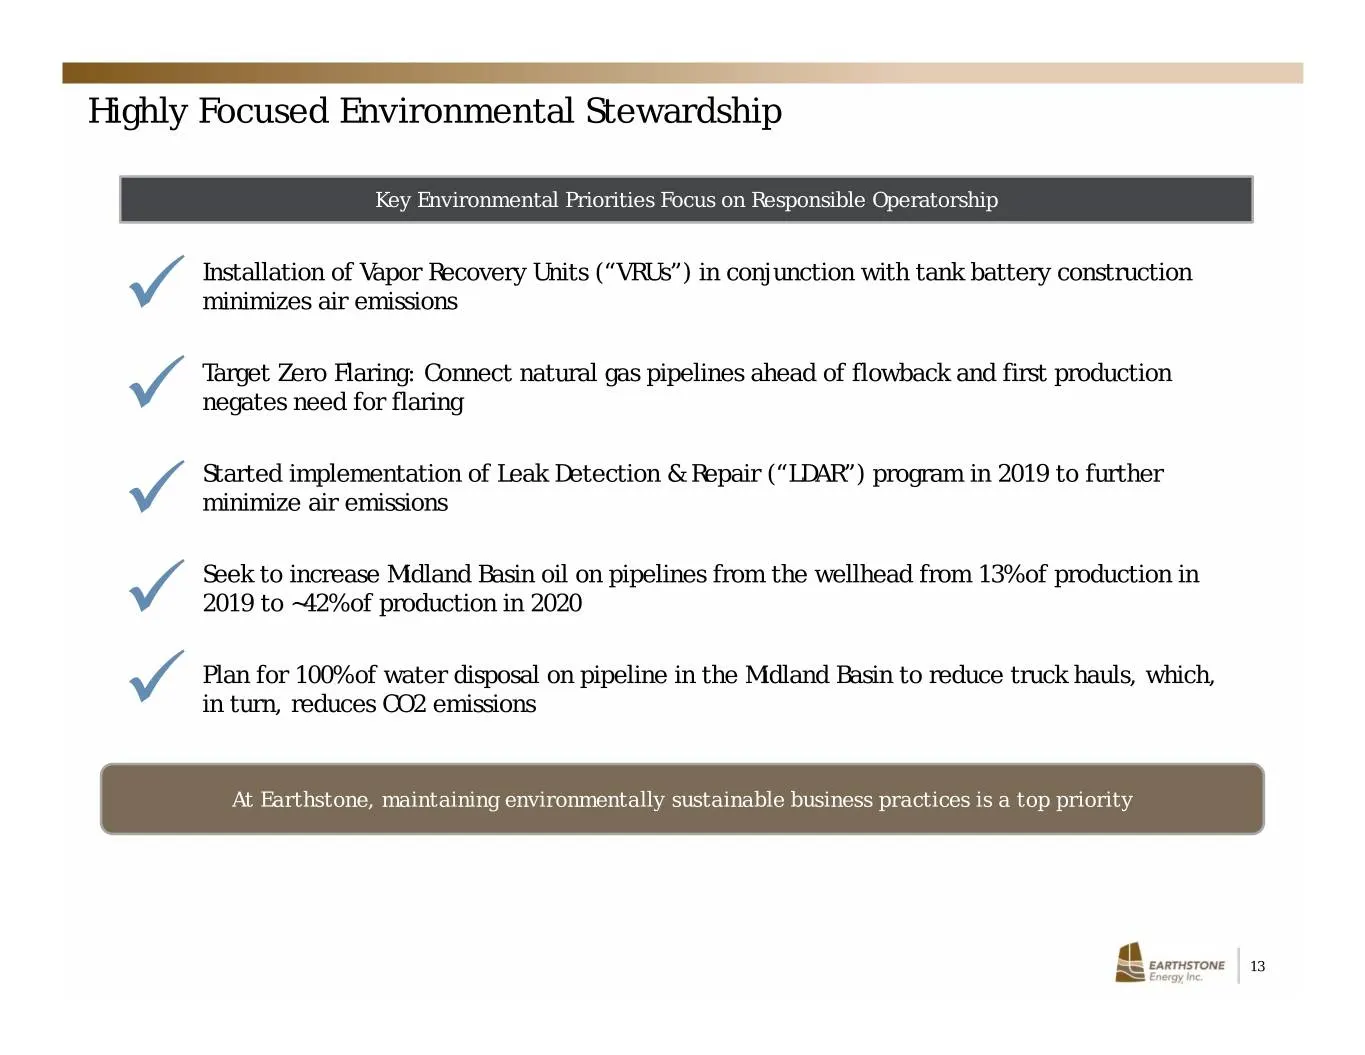
Highly Focused Environmental Stewardship Key Environmental Priorities Focus on Responsible Operatorship Installation of Vapor Recovery Units (“VRUs”) in conjunction with tank battery construction minimizes air emissions Target Zero Flaring: Connect natural gas pipelines ahead of flowback and first

Slide 14: Asset Overview
Asset Overview EARTHSTONE | 4 Energy, Inc
Slide 15: Areas of Operations
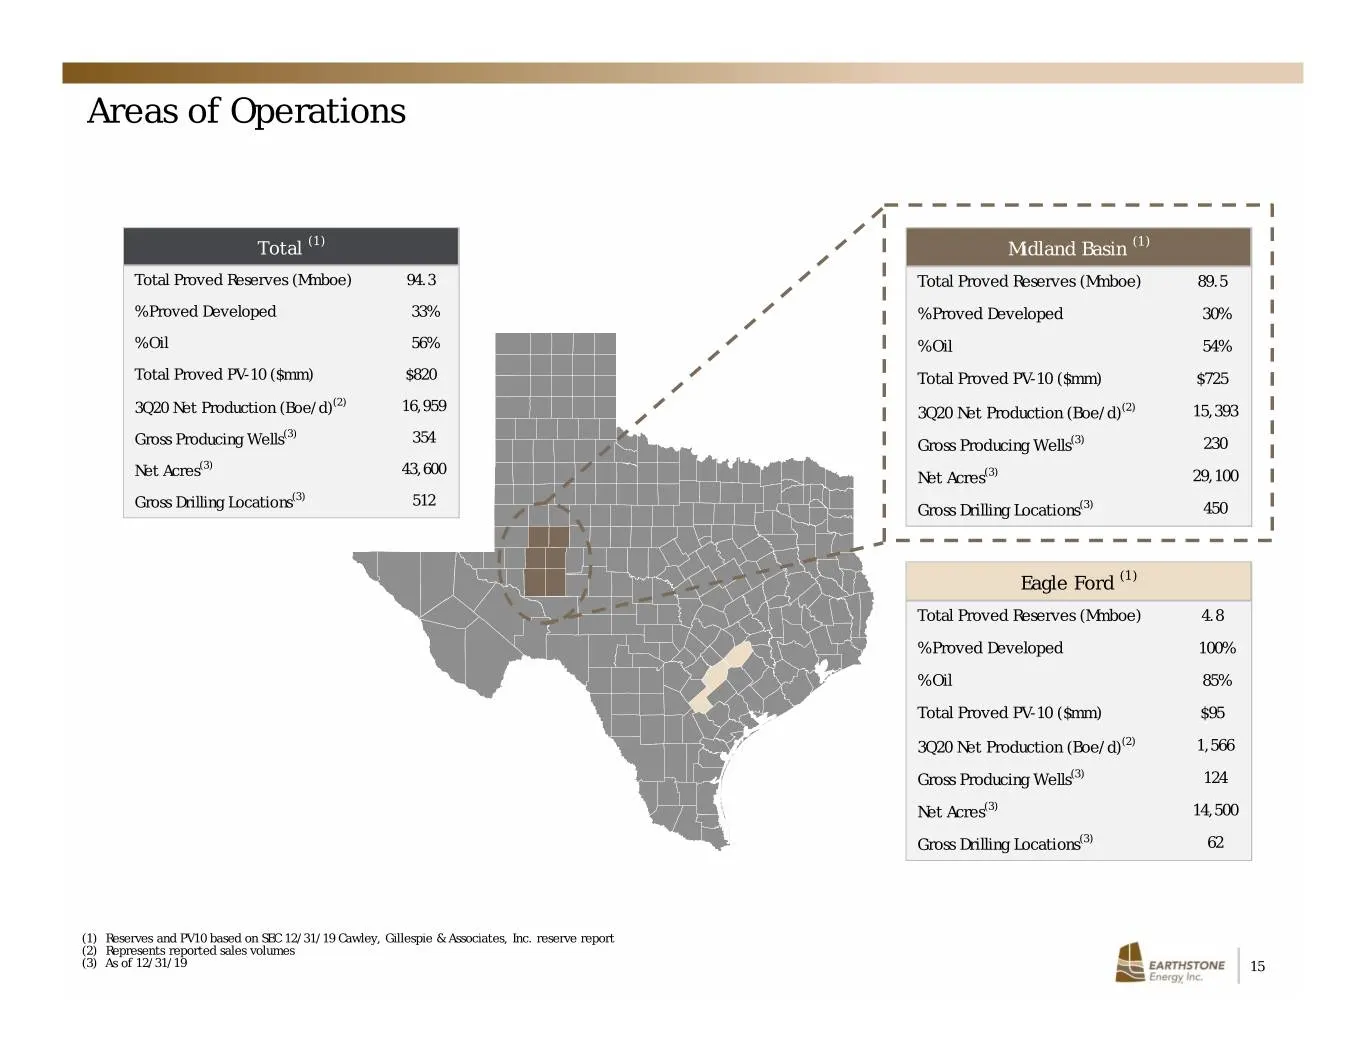
Areas of Operations Total (1) Midland Basin (1) Total Proved Reserves (Mmboe) 94.3 Total Proved Reserves (Mmboe) 89.5 % Proved Developed 33% % Proved Developed 30% % Oil 56% % Oil 54% Total Proved PV-10 ($mm) $820 Total Proved PV-10 ($mm) $725 (2) 3Q20 Net Production (Boe/d) 16,959 3Q20 Net Producti

Slide 16: Financial Overview
Financial Overview Energy, Inc
Slide 17: Capital Budget, Guidance and Liquidity
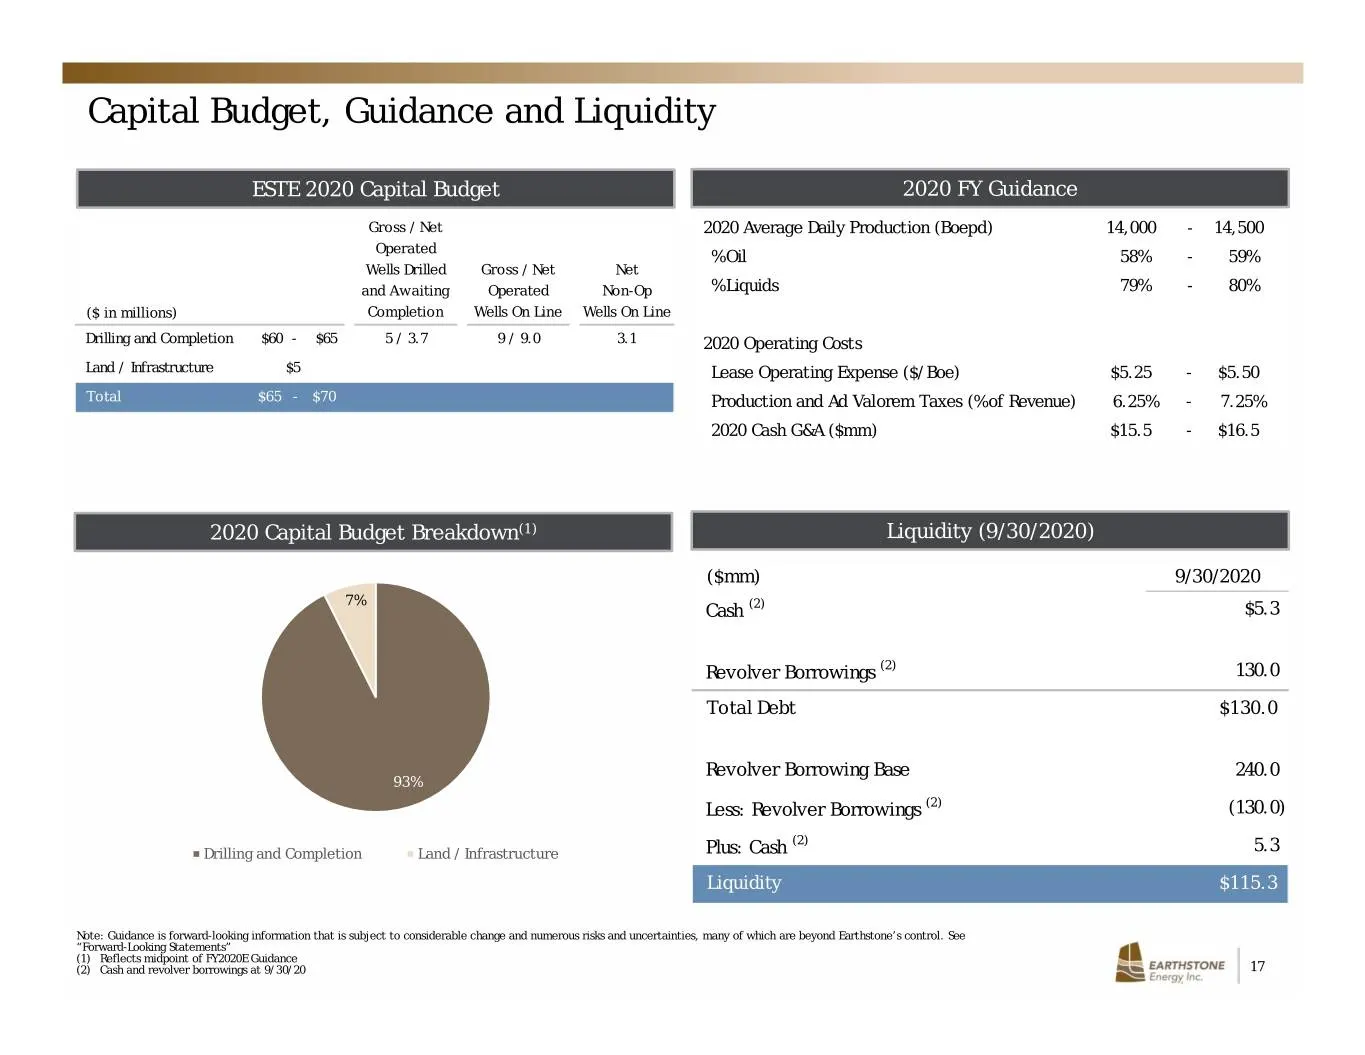
Capital Budget, Guidance and Liquidity ESTE 2020 Capital Budget 2020 FY Guidance Gross / Net 2020 Average Daily Production (Boepd) 14,000 - 14,500 Operated % Oil 58% - 59% Wells Drilled Gross / Net Net and Awaiting Operated Non-Op % Liquids 79% - 80% ($ in millions) Completion Wells On Line Wells On
Slide 18: Oil and Gas Hedges Summary – 100% Swaps
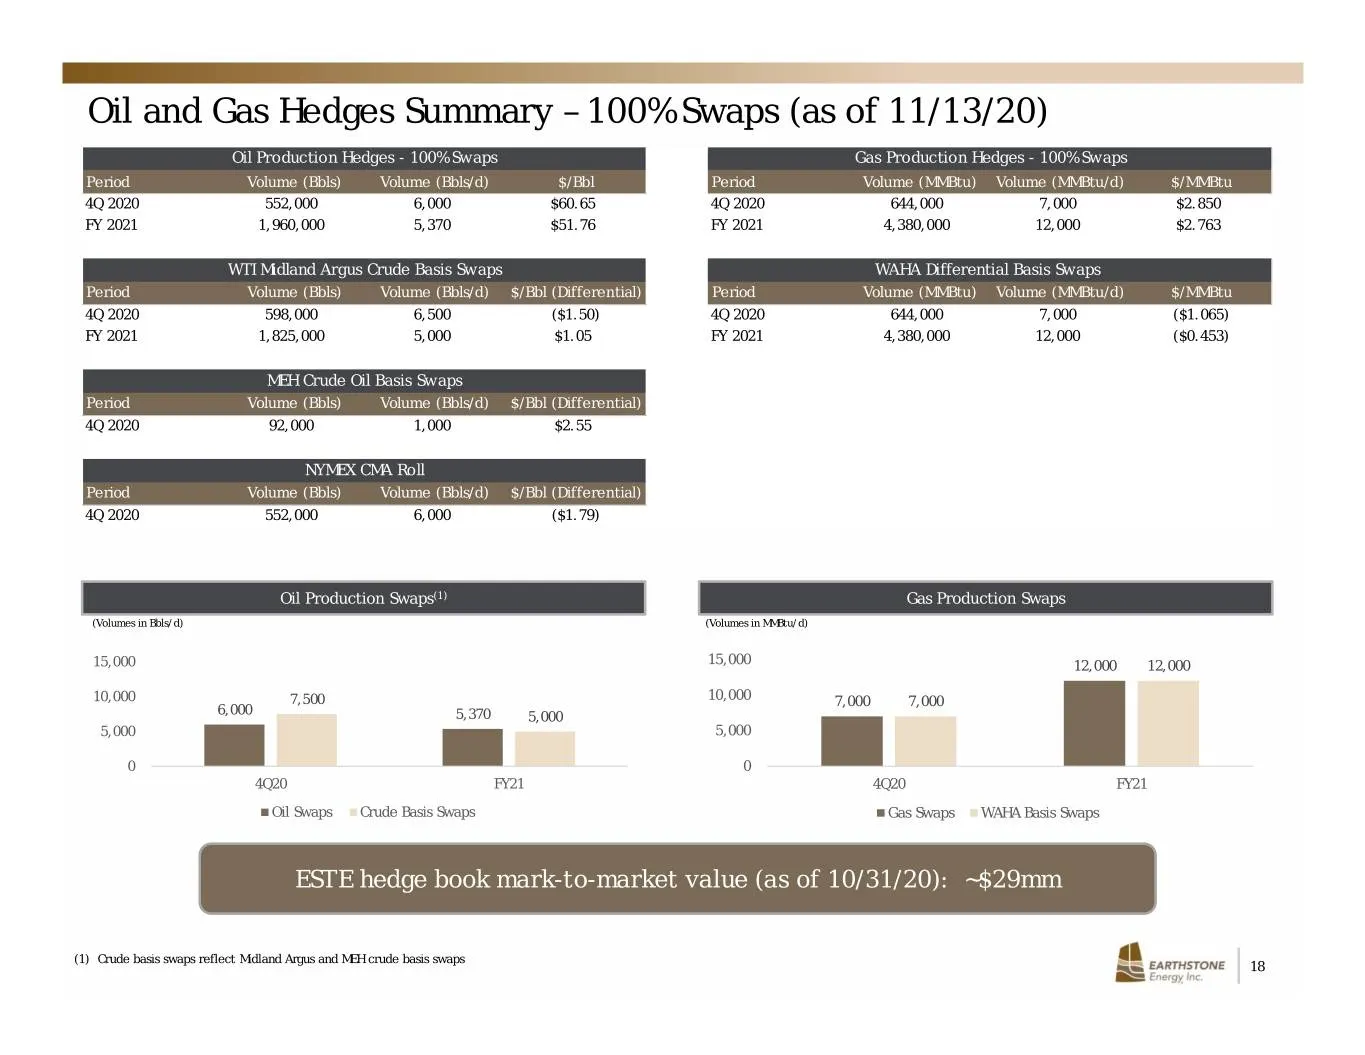
Oil and Gas Hedges Summary – 100% Swaps (as of 11/13/20) Oil Production Hedges - 100% Swaps Gas Production Hedges - 100% Swaps Period Volume (Bbls) Volume (Bbls/d) $/Bbl Period Volume (MMBtu) Volume (MMBtu/d) $/MMBtu 4Q 2020 552,000 6,000 $60.65 4Q 2020 644,000 7,000 $2.850 FY 2021 1,960,000 5,370 $
Slide 19: Analyst Coverage
Analyst Coverage Firm Analyst Contact Info Alliance Global Partners Andrew Bond / 203-577-5427 / abond@allianceg.com Coker Palmer Noel Parks / 215-913-7320 / parks@cokerpalmer.com Johnson Rice Dun McIntosh / 504-584-1217 / dun@jrco.com Northland Jeff Grampp / 949-600-4150 / jgrampp@northlandcapitalm
Slide 20: Contact Information
Contact Information Mark Lumpkin, Jr. EVP, Chief Financial Officer Scott Thelander Vice President of Finance Corporate Offices Houston 1400 Woodloch Forest Drive | Suite 300 | The Woodlands, TX 77380 | (281) 298-4246 Midland 600 N. Marienfeld | Suite 1000 | Midland, TX 79701 | (432) 686-1100 Website

Slide 21: Appendix
Appendix EARTHSTONE Energy, Inc | a
Slide 22: Differentiated, Balanced Inventory in Midland Basin
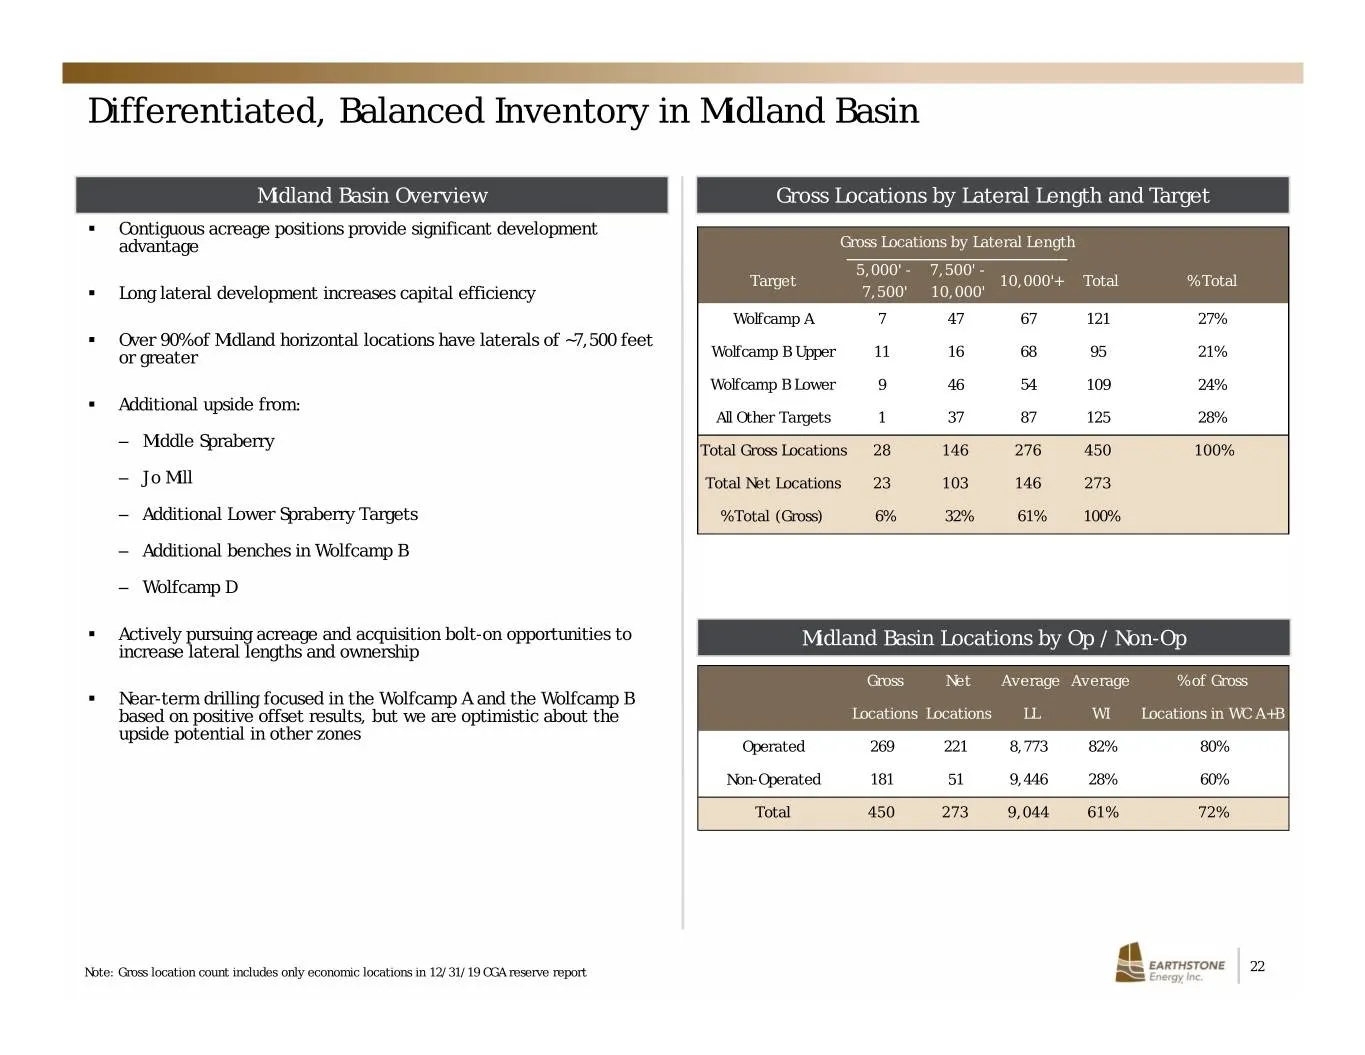
Differentiated, Balanced Inventory in Midland Basin Midland Basin Overview Gross Locations by Lateral Length and Target . Contiguous acreage positions provide significant development advantage Gross Locations by Lateral Length 5,000' - 7,500' - Target 10,000'+ Total % Total . Long lateral developmen
Slide 23: Reconciliation of Non-GAAP Financial Measure – Adjusted EBITDAX
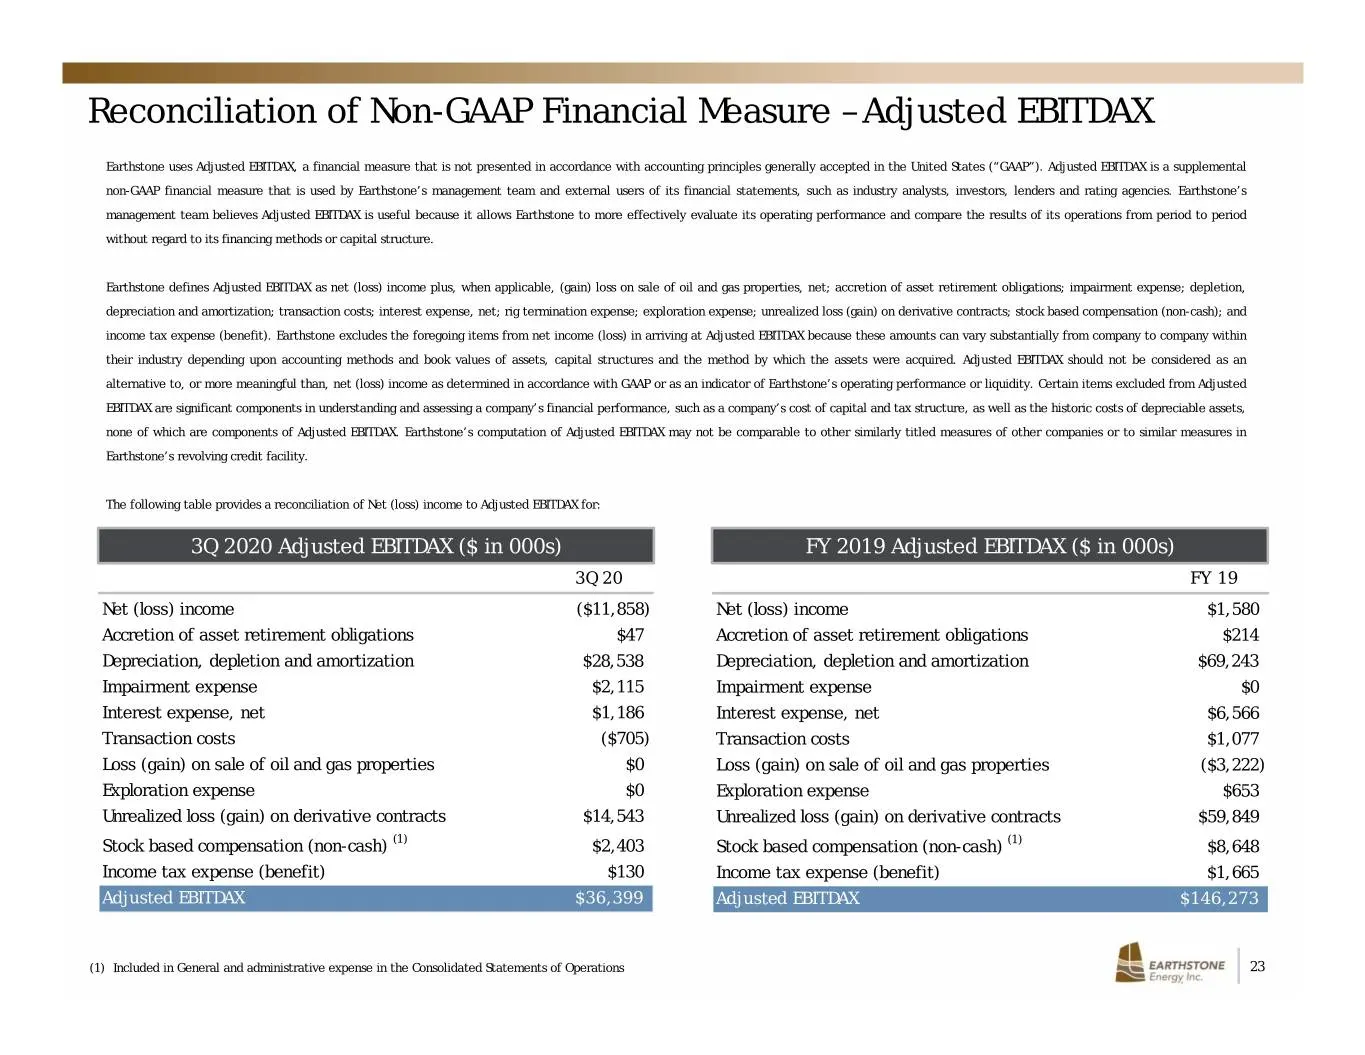
Reconciliation of Non-GAAP Financial Measure – Adjusted EBITDAX Earthstone uses Adjusted EBITDAX, a financial measure that is not presented in accordance with accounting principles generally accepted in the United States (“GAAP”). Adjusted EBITDAX is a supplemental non-GAAP financial measure that is
Slide 24: Reserves Summary and PV-10 (Non-GAAP Financial Measure)
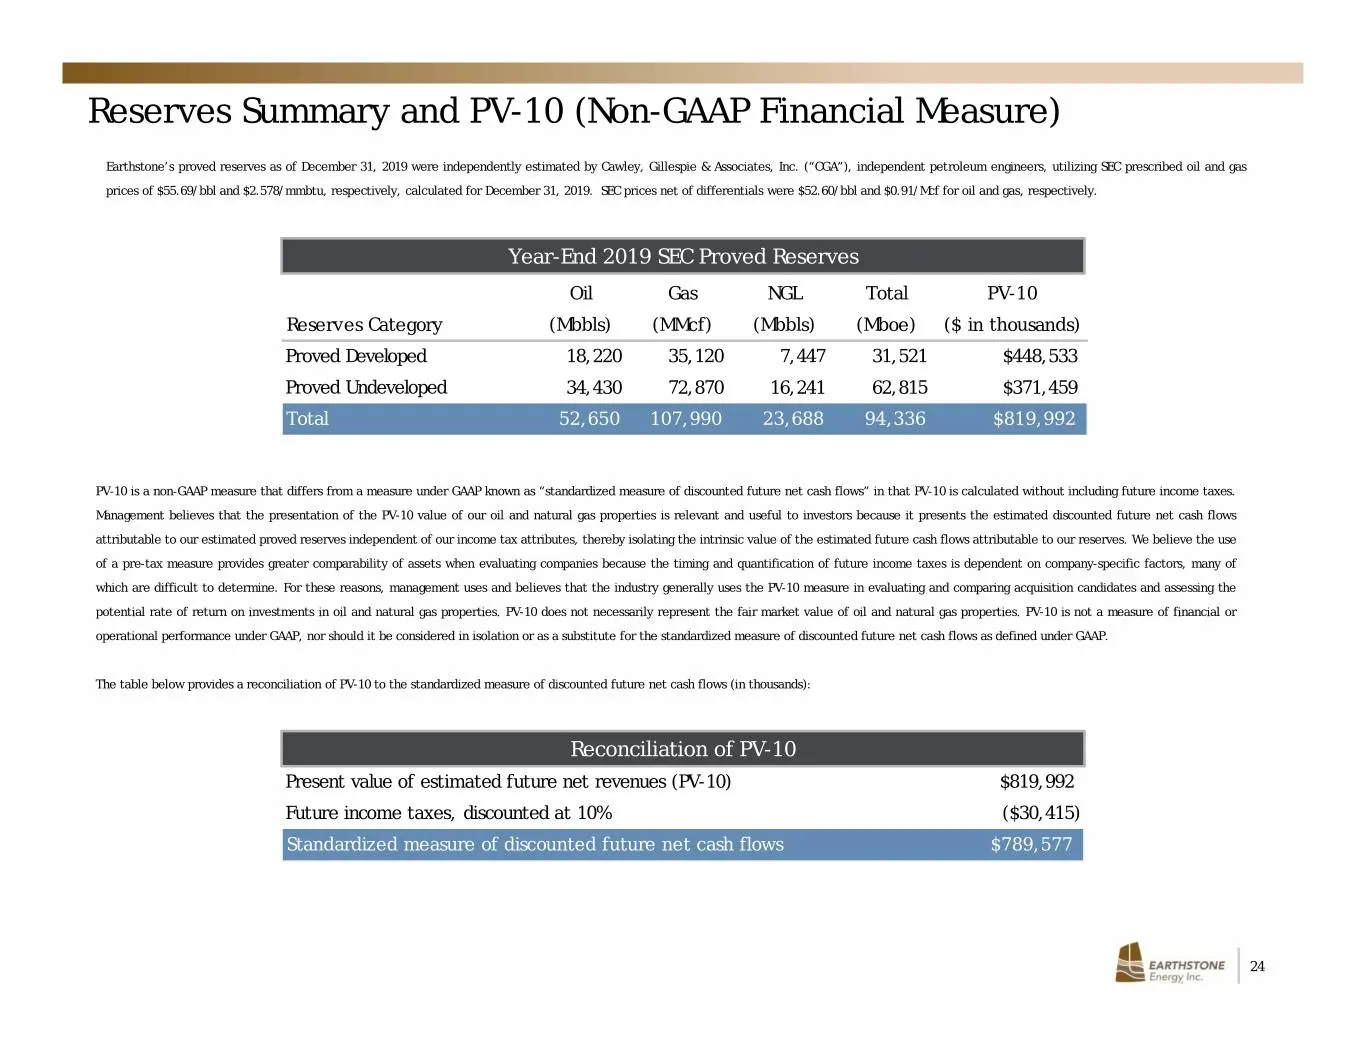
Reserves Summary and PV-10 (Non-GAAP Financial Measure) Earthstone’s proved reserves as of December 31, 2019 were independently estimated by Cawley, Gillespie & Associates, Inc. (“CGA”), independent petroleum engineers, utilizing SEC prescribed oil and gas prices of $55.69/bbl and $2.578/mmbtu, resp
Slide 25: Non-GAAP Financial Measure – Free Cash Flow
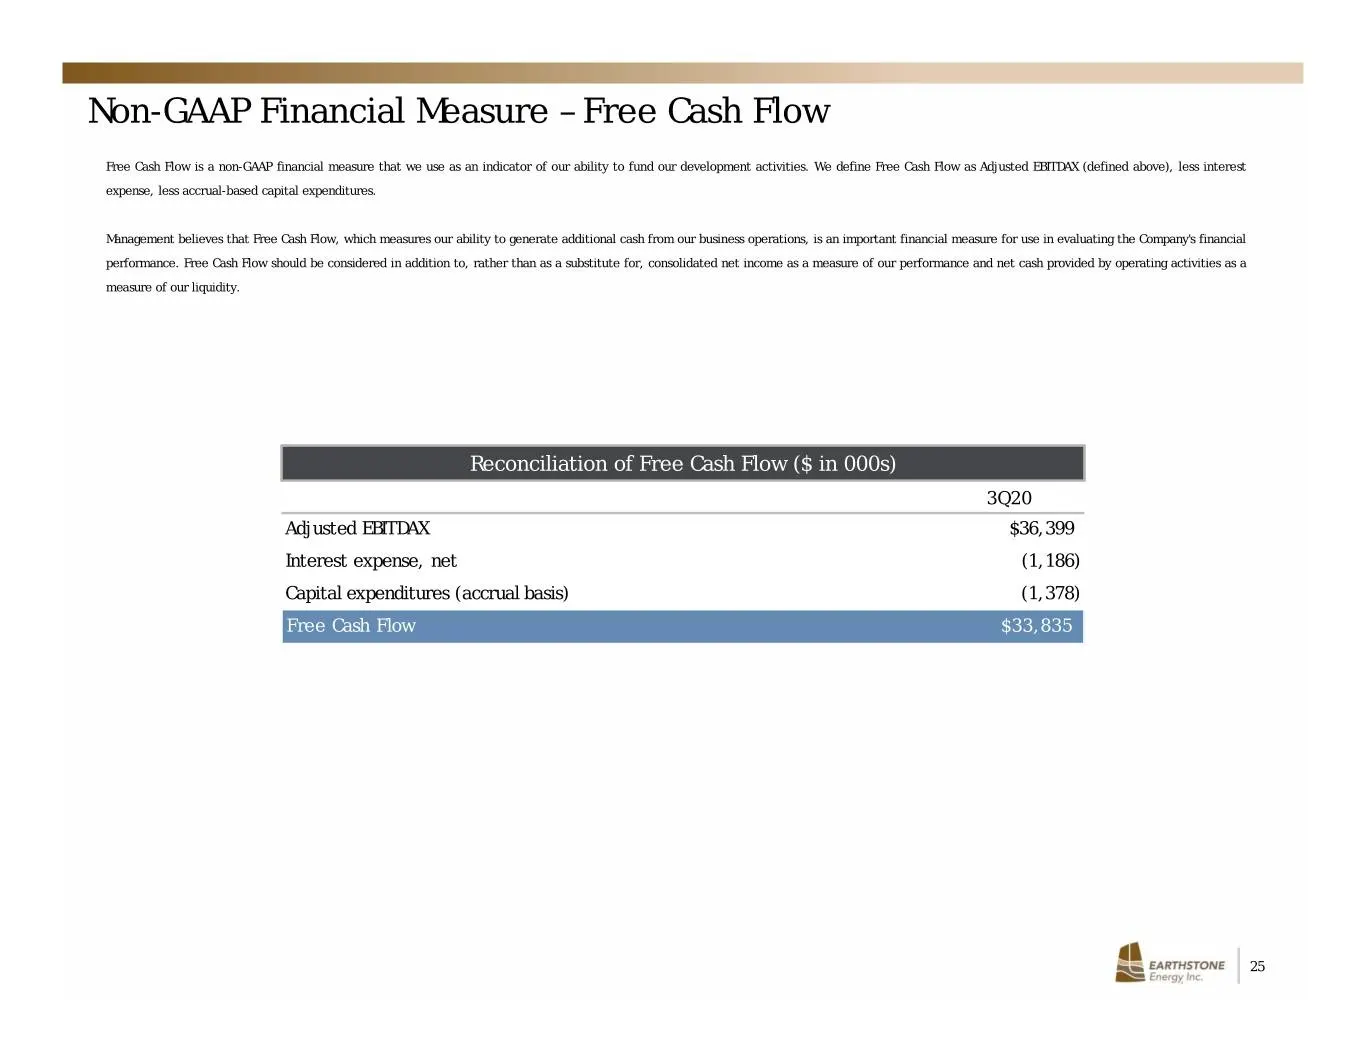
Non-GAAP Financial Measure – Free Cash Flow Free Cash Flow is a non-GAAP financial measure that we use as an indicator of our ability to fund our development activities. We define Free Cash Flow as Adjusted EBITDAX (defined above), less interest expense, less accrual-based capital expenditures. Mana
Source: SEC EDGAR · 8-K filed Nov 19, 2020
More decks from Earthstone Energy Inc
 Merger or Acquisition (August 2023)20 slides · Aug 23, 2023
 EnerCom Denver 202332 slides · Aug 14, 2023
 Q2 2023 Earnings Presentation25 slides · Aug 2, 2023
 Investor Presentation (June 2023)29 slides · Jun 20, 2023
 Merger or Acquisition (June 2023)16 slides · Jun 16, 2023
 Q1 2023 Earnings Presentation33 slides · May 3, 2023