Heartland Financial USA — Q1 2020 Earnings Presentation
10 slides from Heartland Financial USA's earnings presentation, Apr 27, 2020

Slide 1: COVID-19 Credit Overview: Commercial and Ag Portfolios, 1st Quarter 2020
Heartland Financial USA, Inc. COVID-19 Credit Overview Commercial and Ag Portfolios 1st Quarter 2020
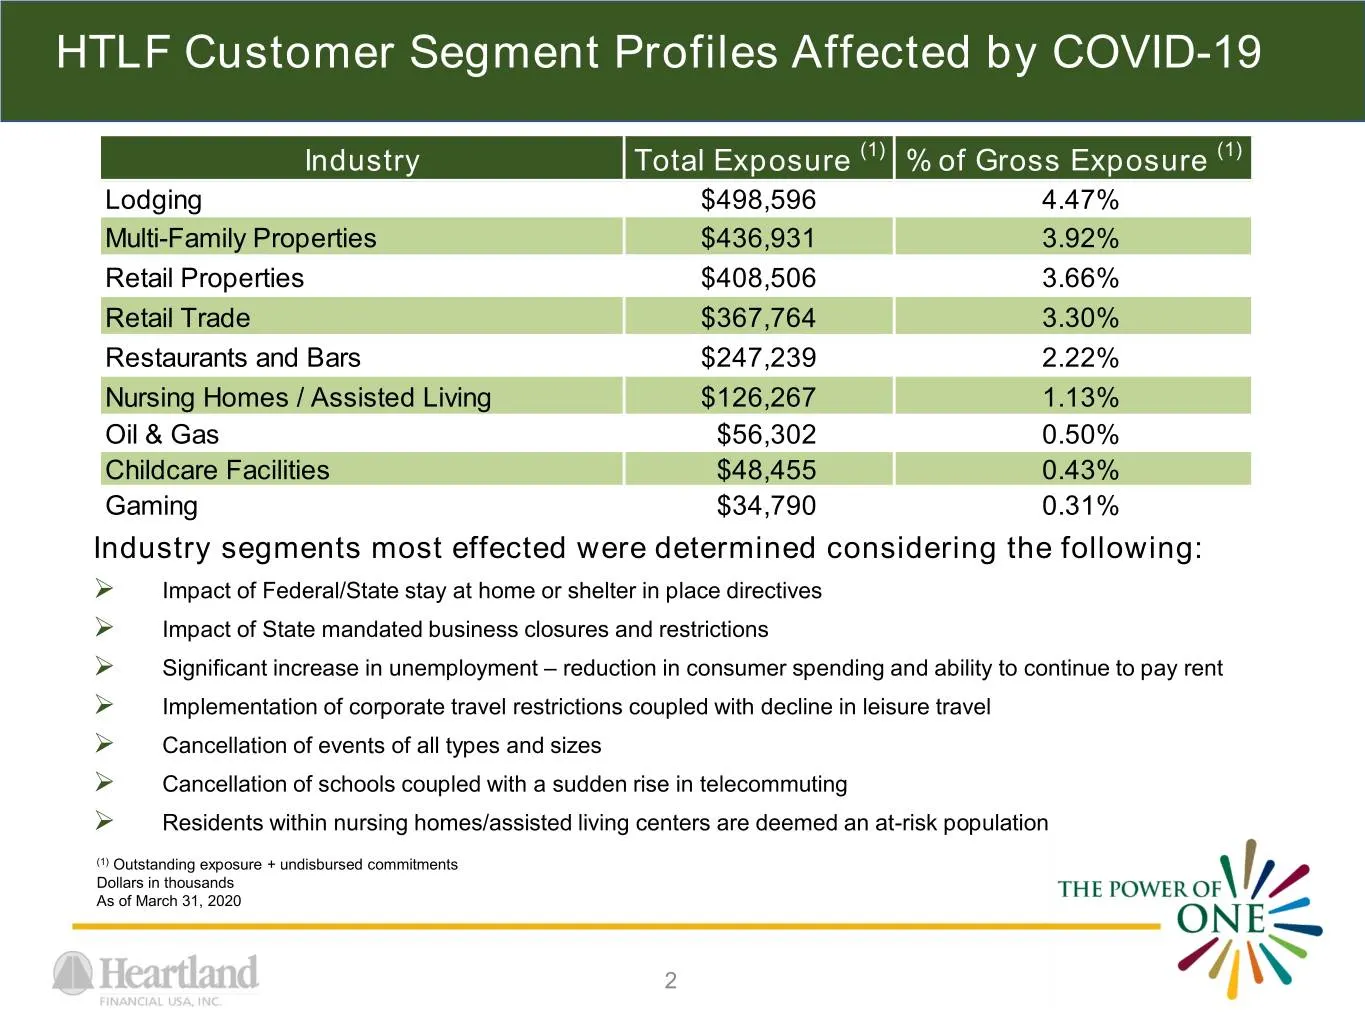
Slide 2: HTLF Customer Segment Profiles Affected by COVID-19
HTLF Customer Segment Profiles Affected by COVID-19 Industry Total Exposure (1) % of Gross Exposure (1) Lodging $498,596 4.47% Multi-Family Properties $436,931 3.92% Retail Properties $408,506 3.66% Retail Trade $367,764 3.30% Restaurants and Bars $247,239 2.22% Nursing Homes / Assisted Living $126,
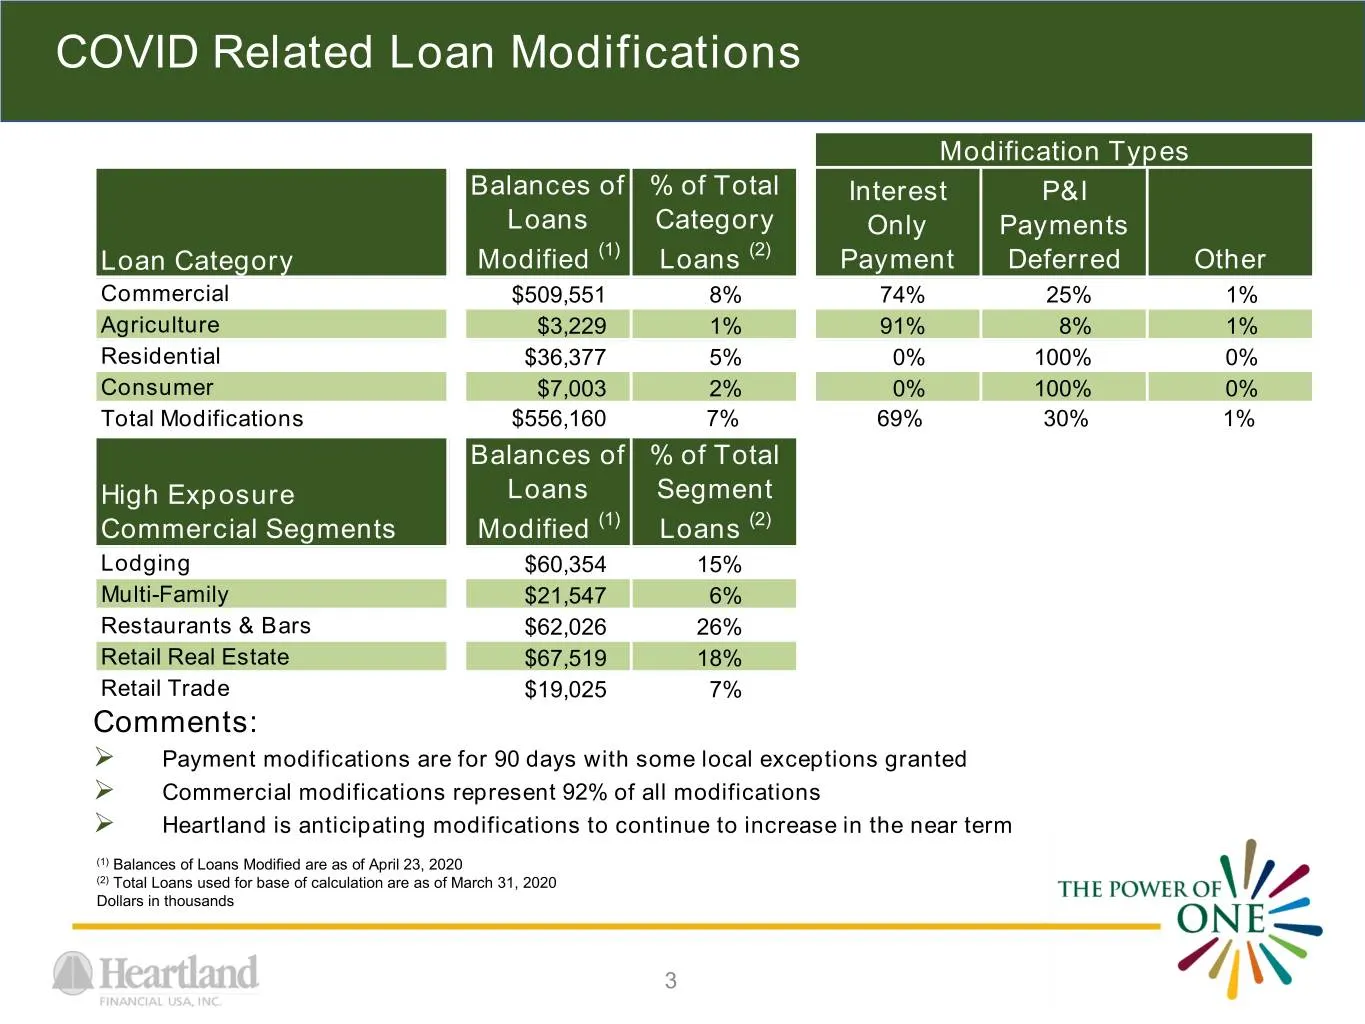
Slide 3: COVID Related Loan Modifications
COVID Related Loan Modifications Modification Types Balances of % of Total Interest P&I Loans Category Only Payments Loan Category Modified (1) Loans (2) Payment Deferred Other Commercial $509,551 8% 74% 25% 1% Agriculture $3,229 1% 91% 8% 1% Residential $36,377 5% 0% 100% 0% Consumer $7,003 2% 0% 1
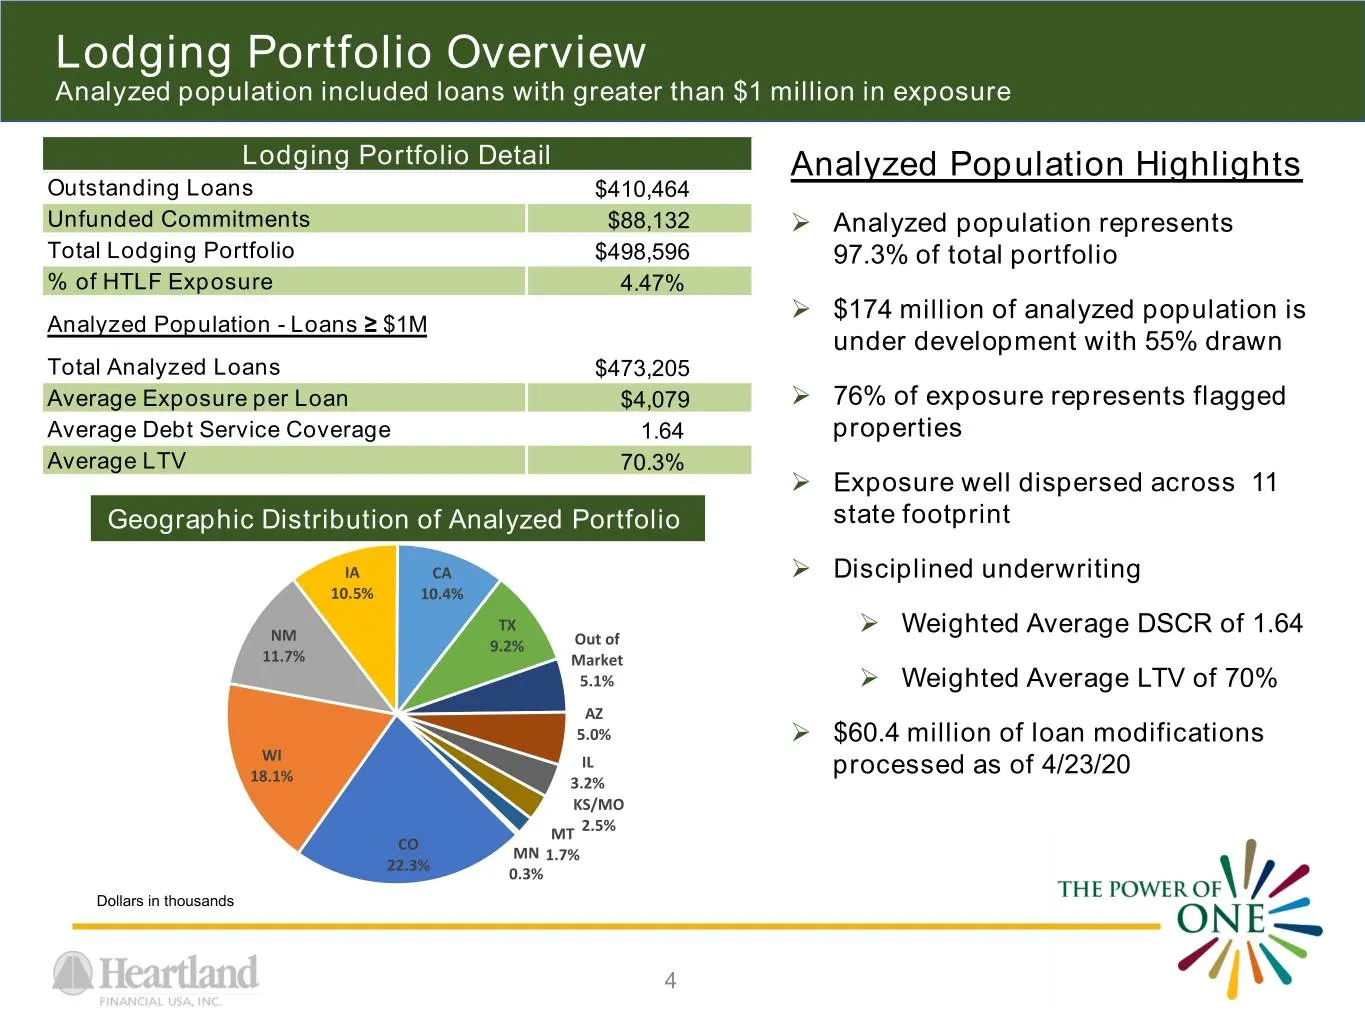
Slide 4: Lodging
Lodging Portfolio Overview Analyzed population included loans with greater than $1 million in exposure Lodging Portfolio Detail Analyzed Population Highlights Outstanding Loans $410,464 Unfunded Commitments $88,132 Analyzed population represents Total Lodging Portfolio $498,596 97.3% of total port
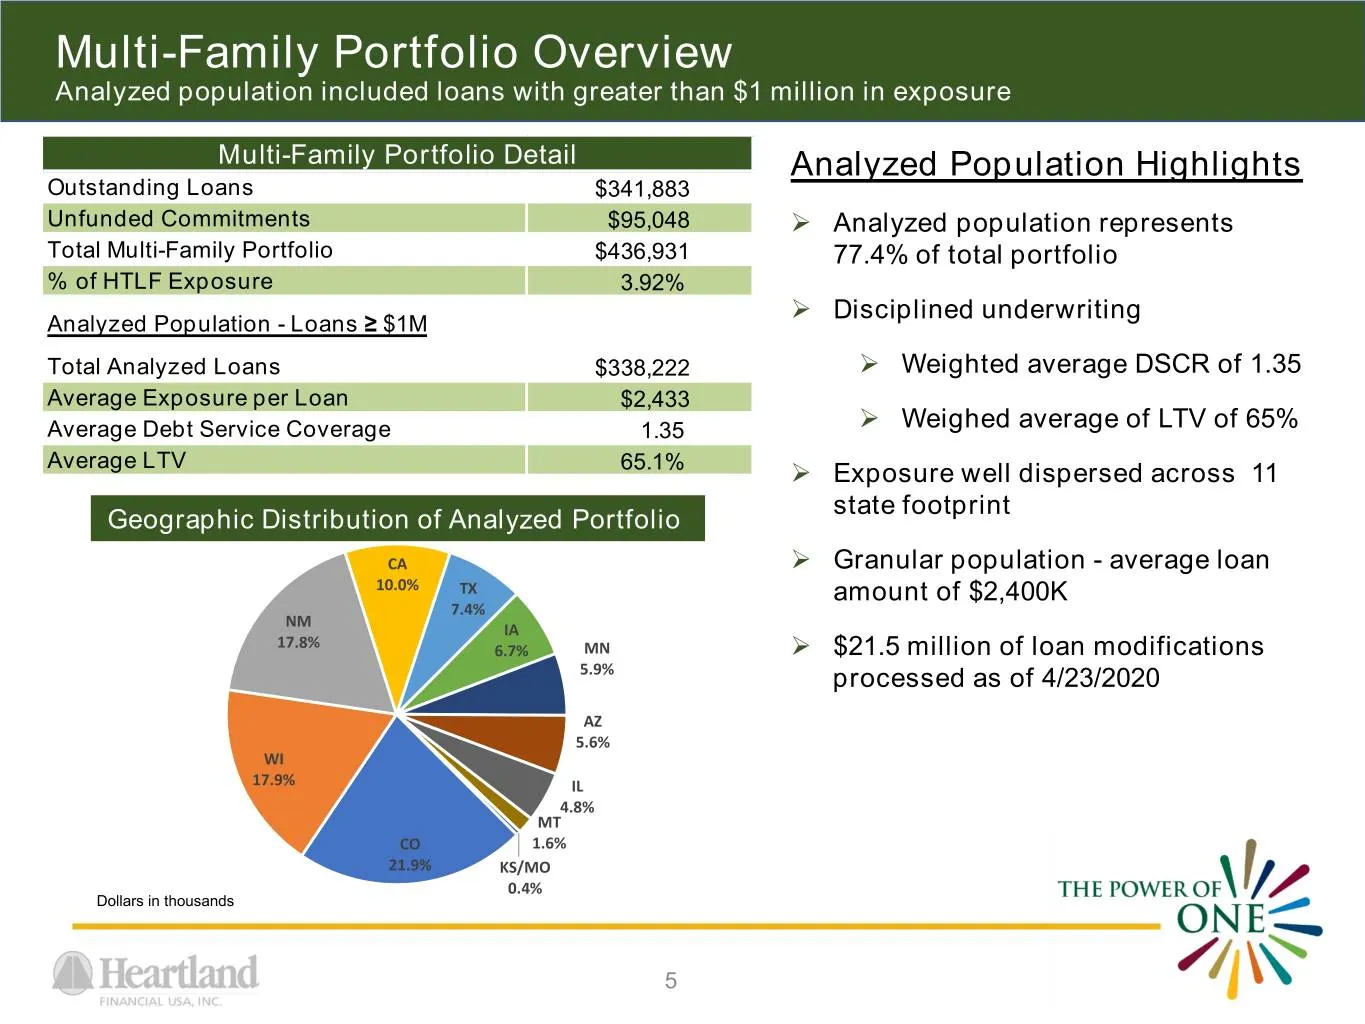
Slide 5: Multi-Family
Multi-Family Portfolio Overview Analyzed population included loans with greater than $1 million in exposure Multi-Family Portfolio Detail Analyzed Population Highlights Outstanding Loans $341,883 Unfunded Commitments $95,048 Analyzed population represents Total Multi-Family Portfolio $436,931 77.4
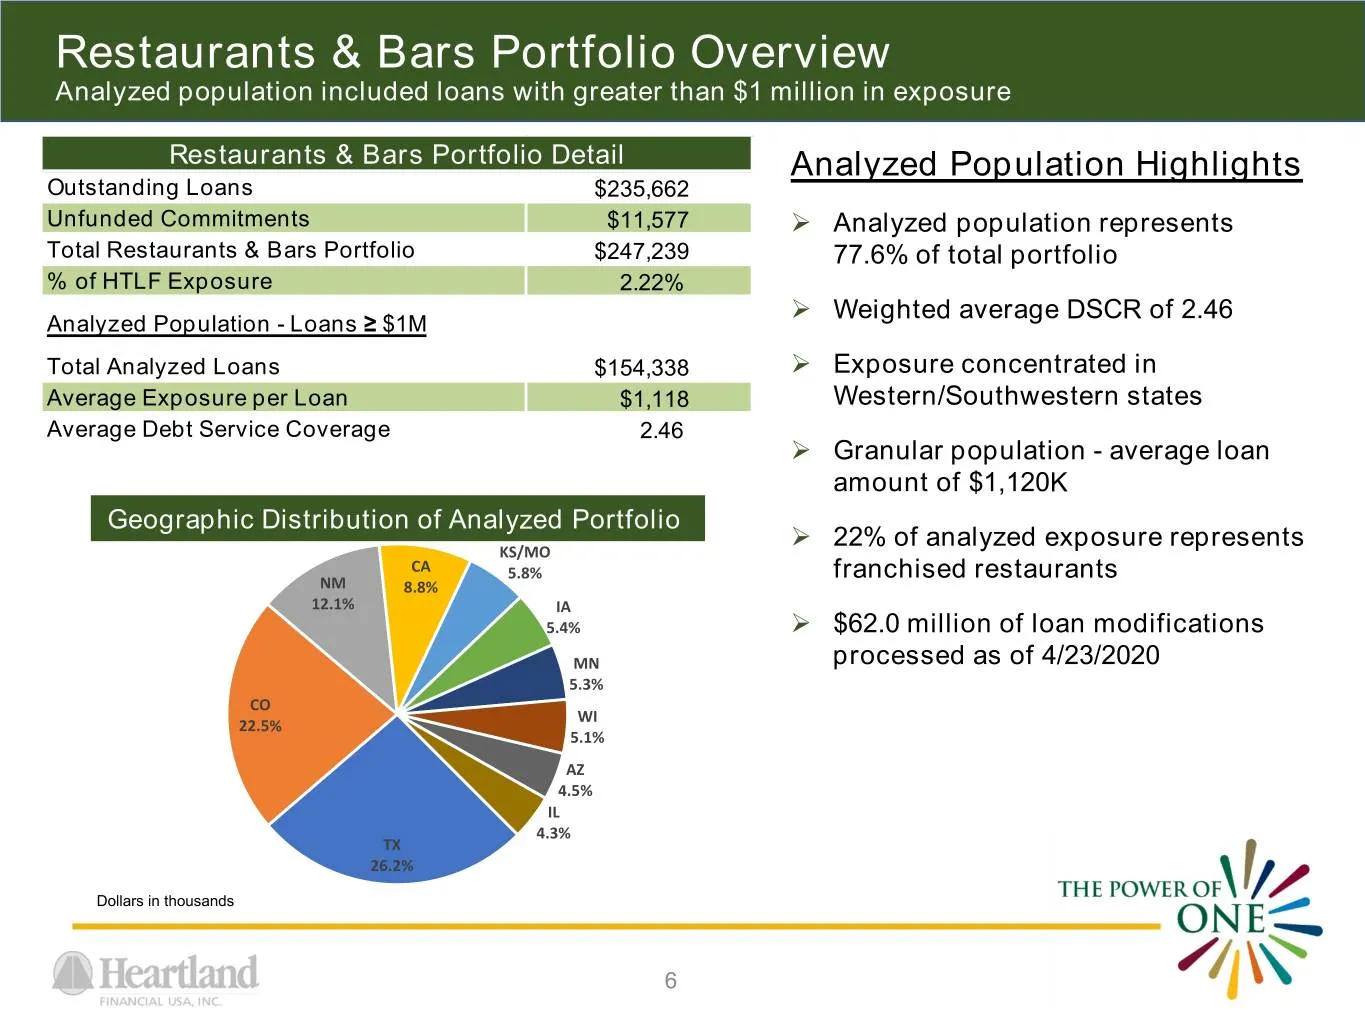
Slide 6: Restaurants & Bars
Restaurants & Bars Portfolio Overview Analyzed population included loans with greater than $1 million in exposure Restaurants & Bars Portfolio Detail Analyzed Population Highlights Outstanding Loans $235,662 Unfunded Commitments $11,577 Analyzed population represents Total Restaurants & Bars Portf
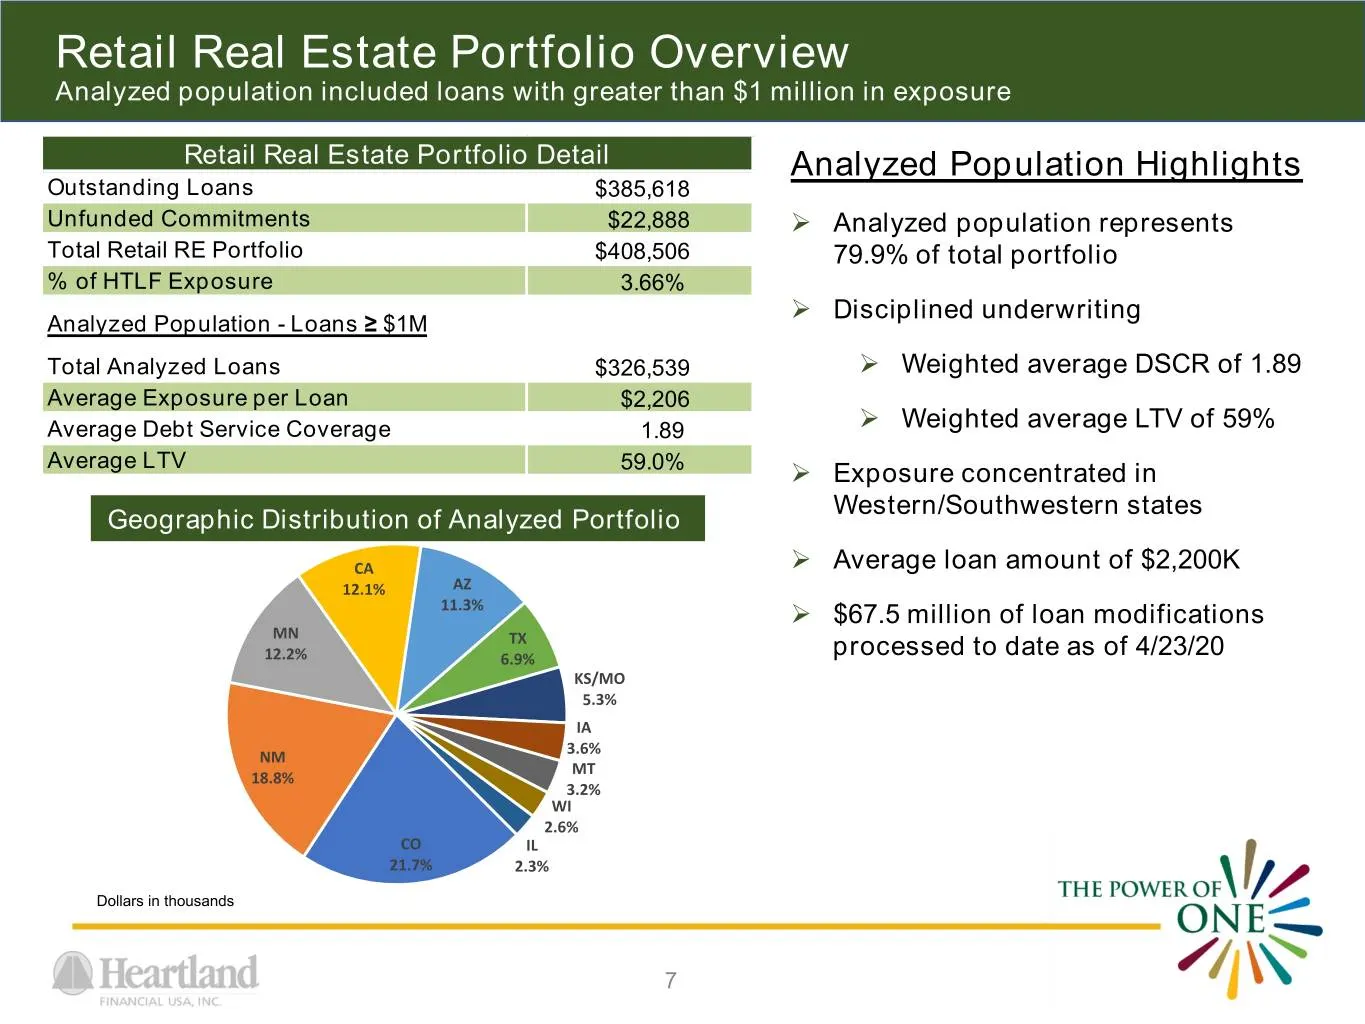
Slide 7: Retail Real Estate
Retail Real Estate Portfolio Overview Analyzed population included loans with greater than $1 million in exposure Retail Real Estate Portfolio Detail Analyzed Population Highlights Outstanding Loans $385,618 Unfunded Commitments $22,888 Analyzed population represents Total Retail RE Portfolio $408
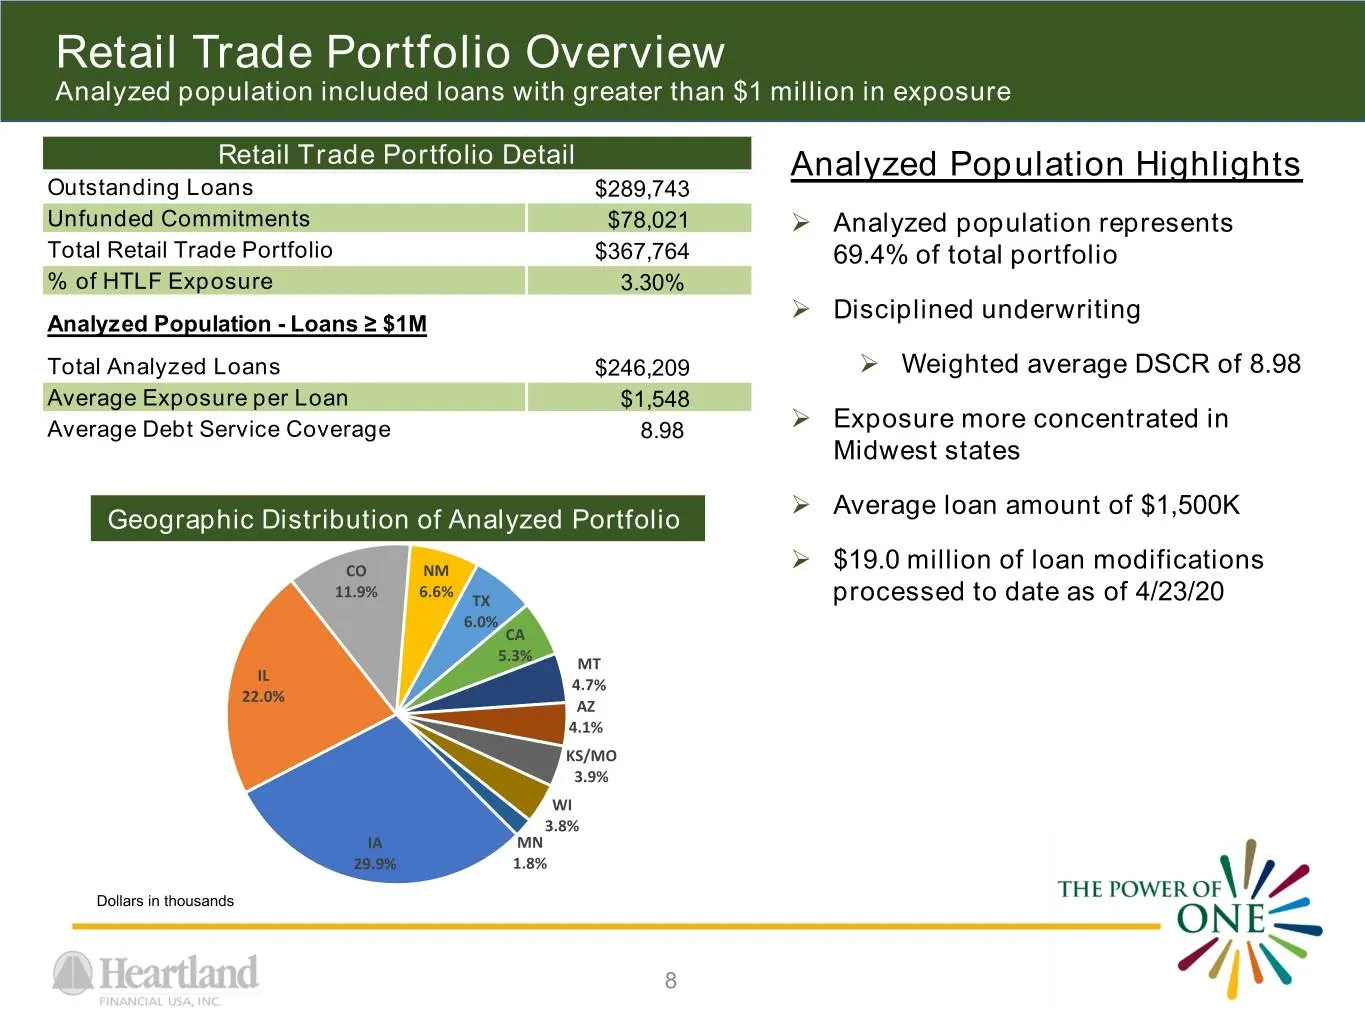
Slide 8: Retail Trade
Retail Trade Portfolio Overview Analyzed population included loans with greater than $1 million in exposure Retail Trade Portfolio Detail Analyzed Population Highlights Outstanding Loans $289,743 Unfunded Commitments $78,021 Analyzed population represents Total Retail Trade Portfolio $367,764 69.4
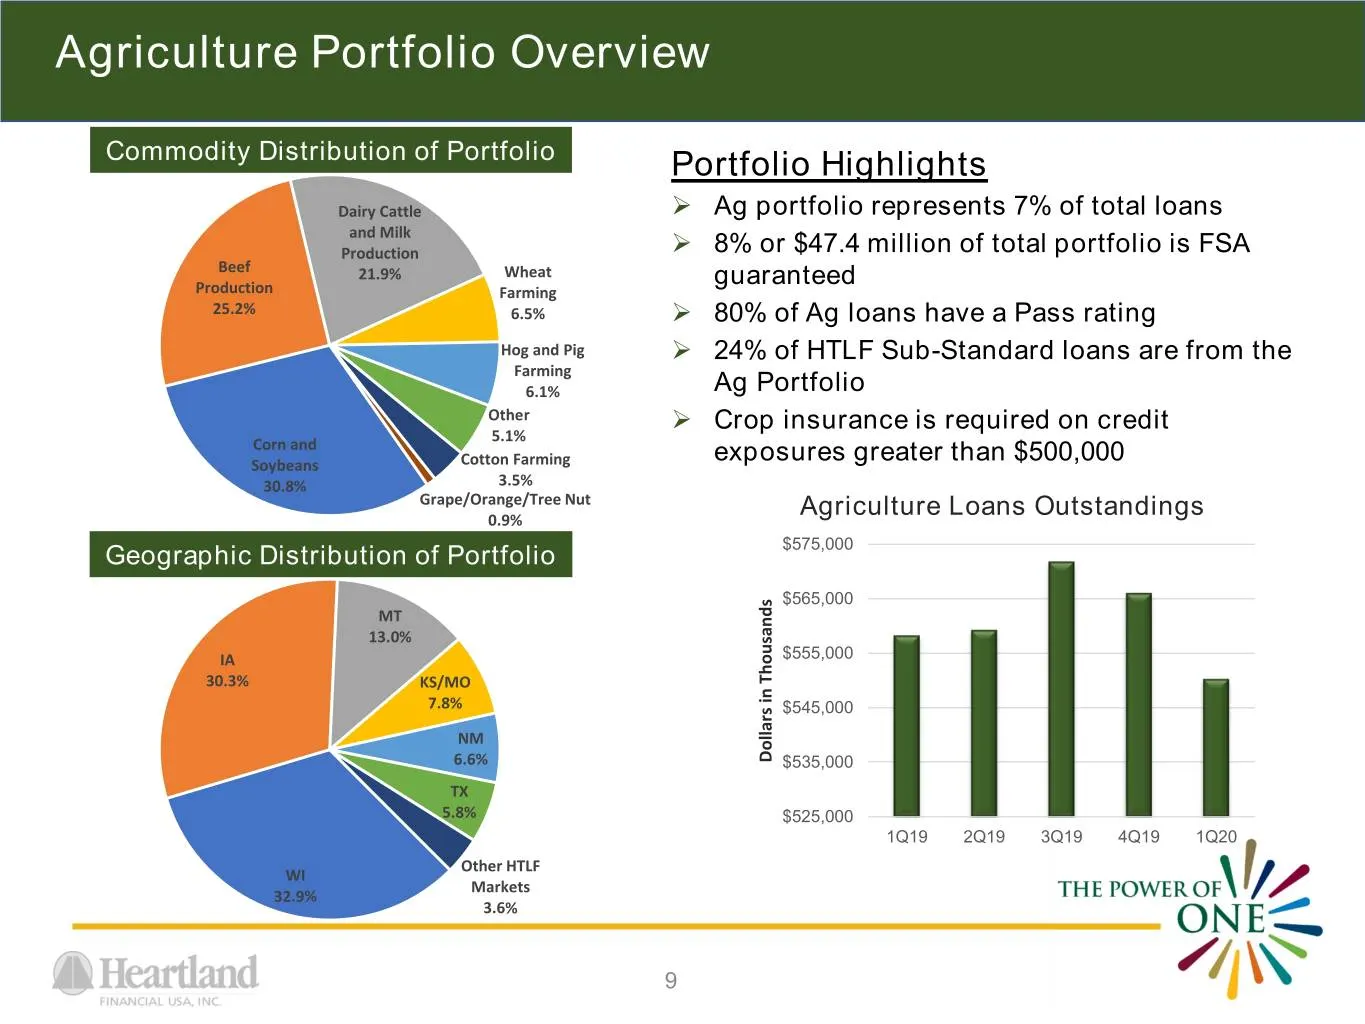
Slide 9: Agriculture Portfolio Overview
Agriculture Portfolio Overview Commodity Distribution of Portfolio Portfolio Highlights Dairy Cattle Ag portfolio represents 7% of total loans and Milk Production 8% or $47.4 million of total portfolio is FSA Beef 21.9% Wheat guaranteed Production Farming 25.2% 6.5% 80% of Ag loans have a Pass
Slide 10: Safe Harbor Statement
Safe Harbor Statement This release, and future oral and written statements of Heartland and its management, may contain forward-looking statements within the meaning of the Private Securities Litigation Reform Act of 1995 about Heartland's financial condition, results of operations, plans, objective
Source: SEC EDGAR · 8-K filed Apr 27, 2020
More decks from Heartland Financial USA Inc
 Merger or Acquisition (July 2024)6 slides · Jul 31, 2024
 Merger or Acquisition (May 2024)6 slides · May 2, 2024
 Merger or Acquisition (May 2024)27 slides · May 2, 2024
 Q4 2023 Earnings Presentation54 slides · Feb 13, 2024
 Q4 2023 Earnings Presentation35 slides · Jan 29, 2024
 Q3 2023 Earnings Presentation55 slides · Nov 15, 2023