Coventry Group Limited · ASX:CYG
Coventry — Shareholder Meeting (October 2024)
38 slides from Coventry's shareholder meeting presentation, Oct 25, 2024
Slide 1: FY24 AGM Presentation: Driving Growth
FY24 AGM Presentation DRIVING GROWTH in fragmented markets with significant organic opportunities
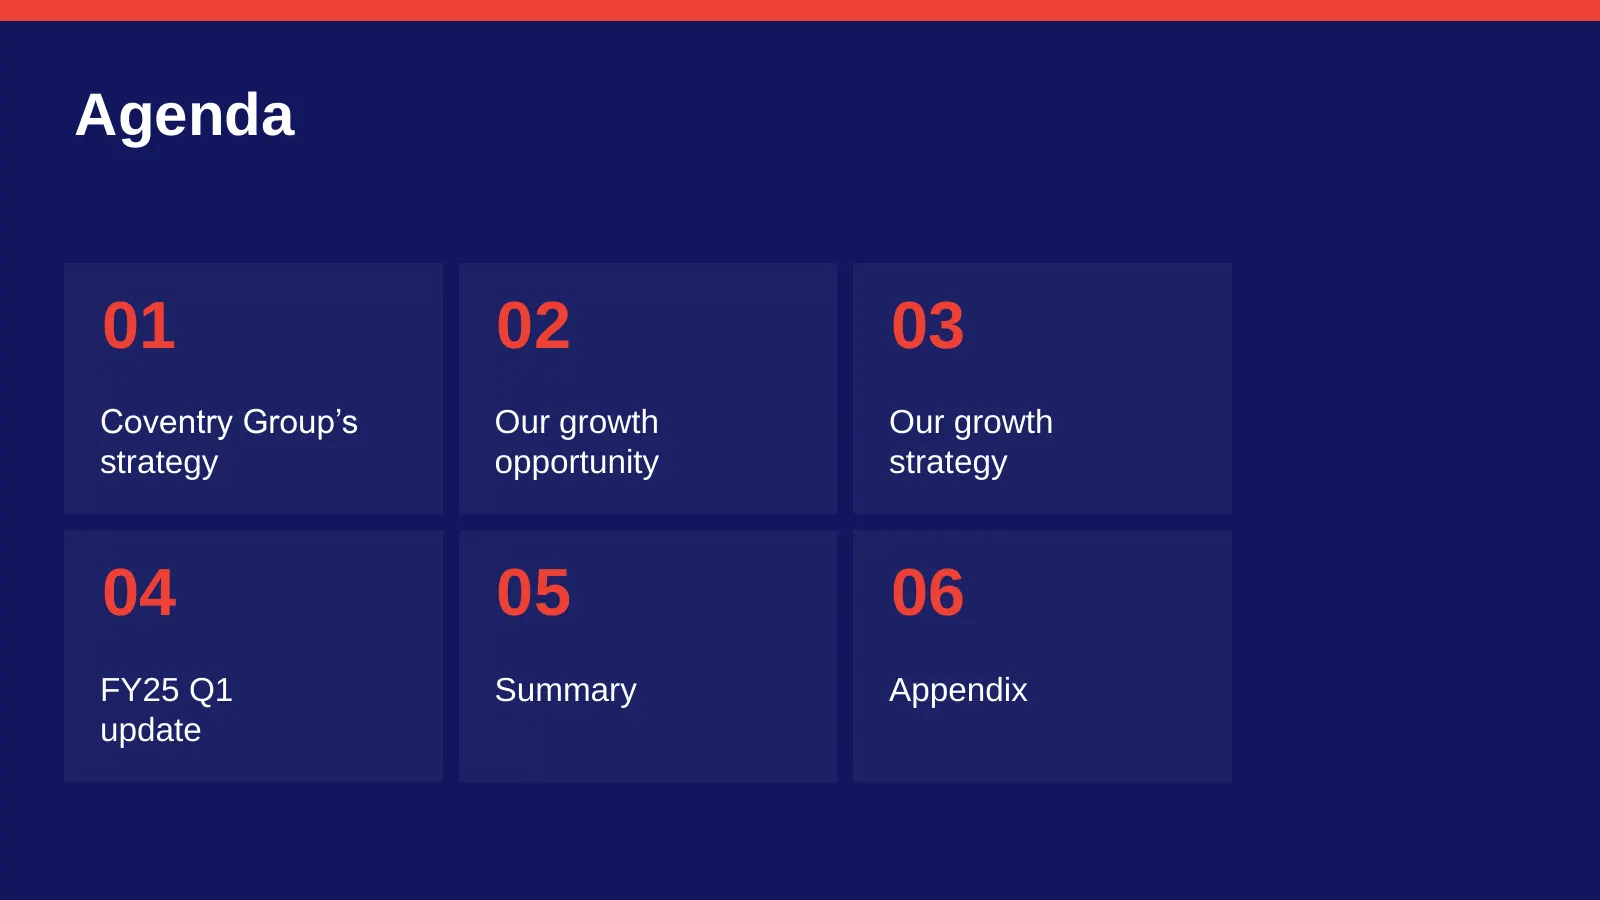
Slide 2: Agenda
Agenda 01 02 03 Coventry Group’s Our growth Our growth strategy opportunity strategy 04 05 06 FY25 Q1 Summary Appendix update
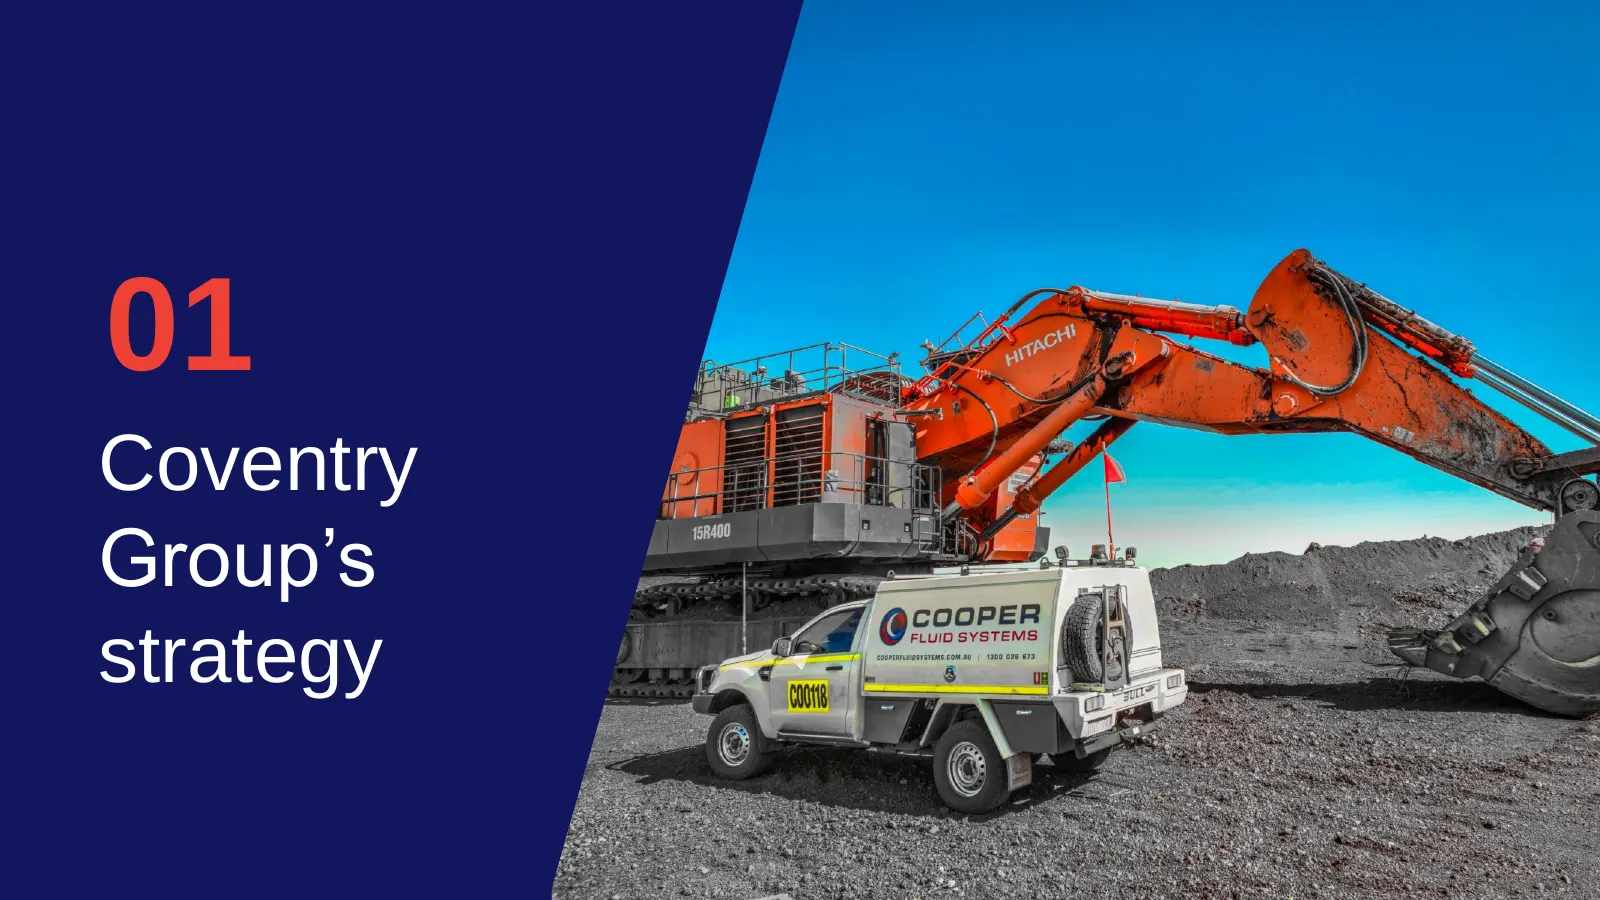
Slide 3: Coventry Group's strategy
01 Coventry Group’s strategy
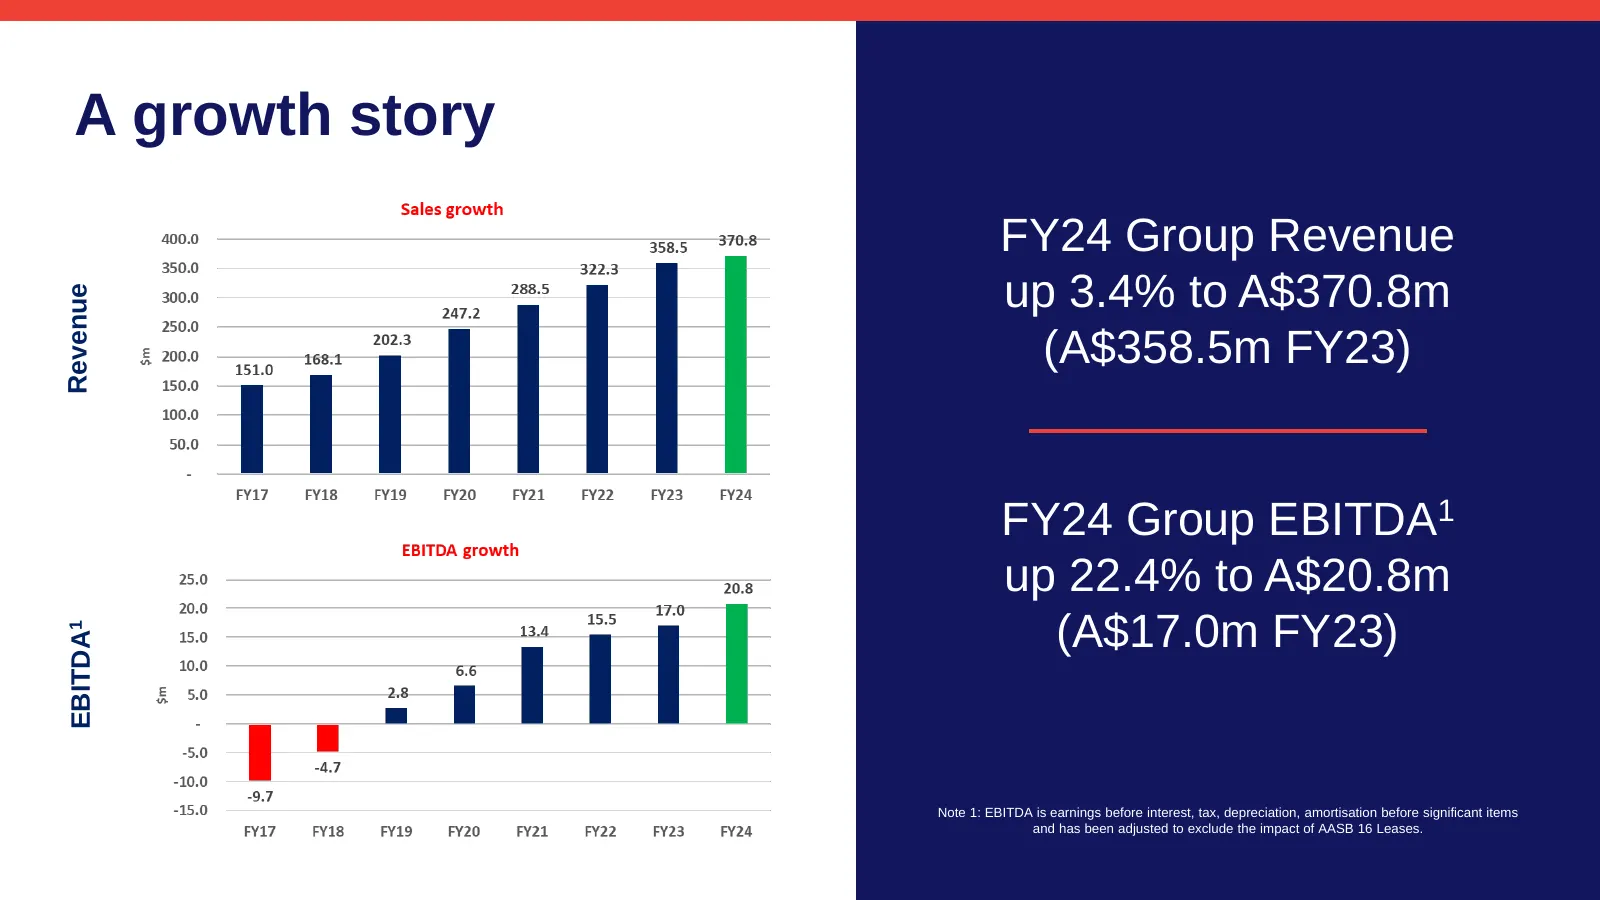
Slide 4: A growth story
A growth story FY24 Group Revenue up 3.4% to A$370.8m Revenue (A$358.5m FY23) FY24 Group EBITDA1 up 22.4% to A$20.8m (A$17.0m FY23) EBITDA1 Note 1: EBITDA is earnings before interest, tax, depreciation, amortisation before significant items and has been adjusted to exclude the impact of AASB 16 Leas
Slide 5: Our strategy
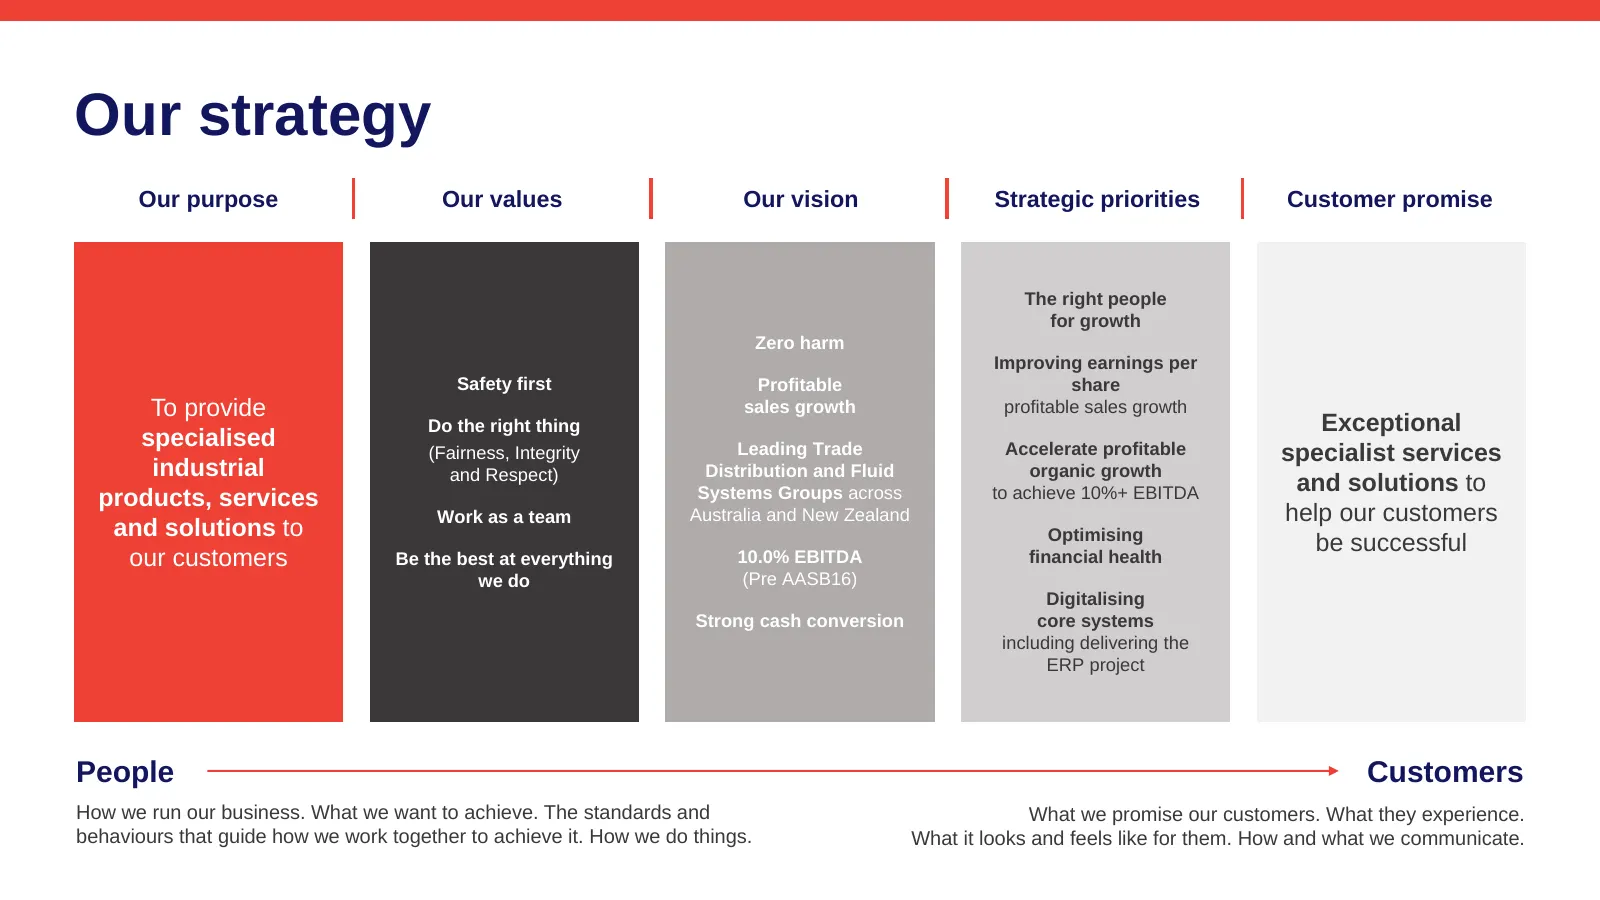
Our strategy Our purpose Our values Our vision Strategic priorities Customer promise The right people for growth Zero harm Improving earnings per Safety first Profitable share To provide sales growth profitable sales growth Do the right thing Exceptional specialised Leading Trade Accelerate profitab
Slide 6: Our strategies are delivering
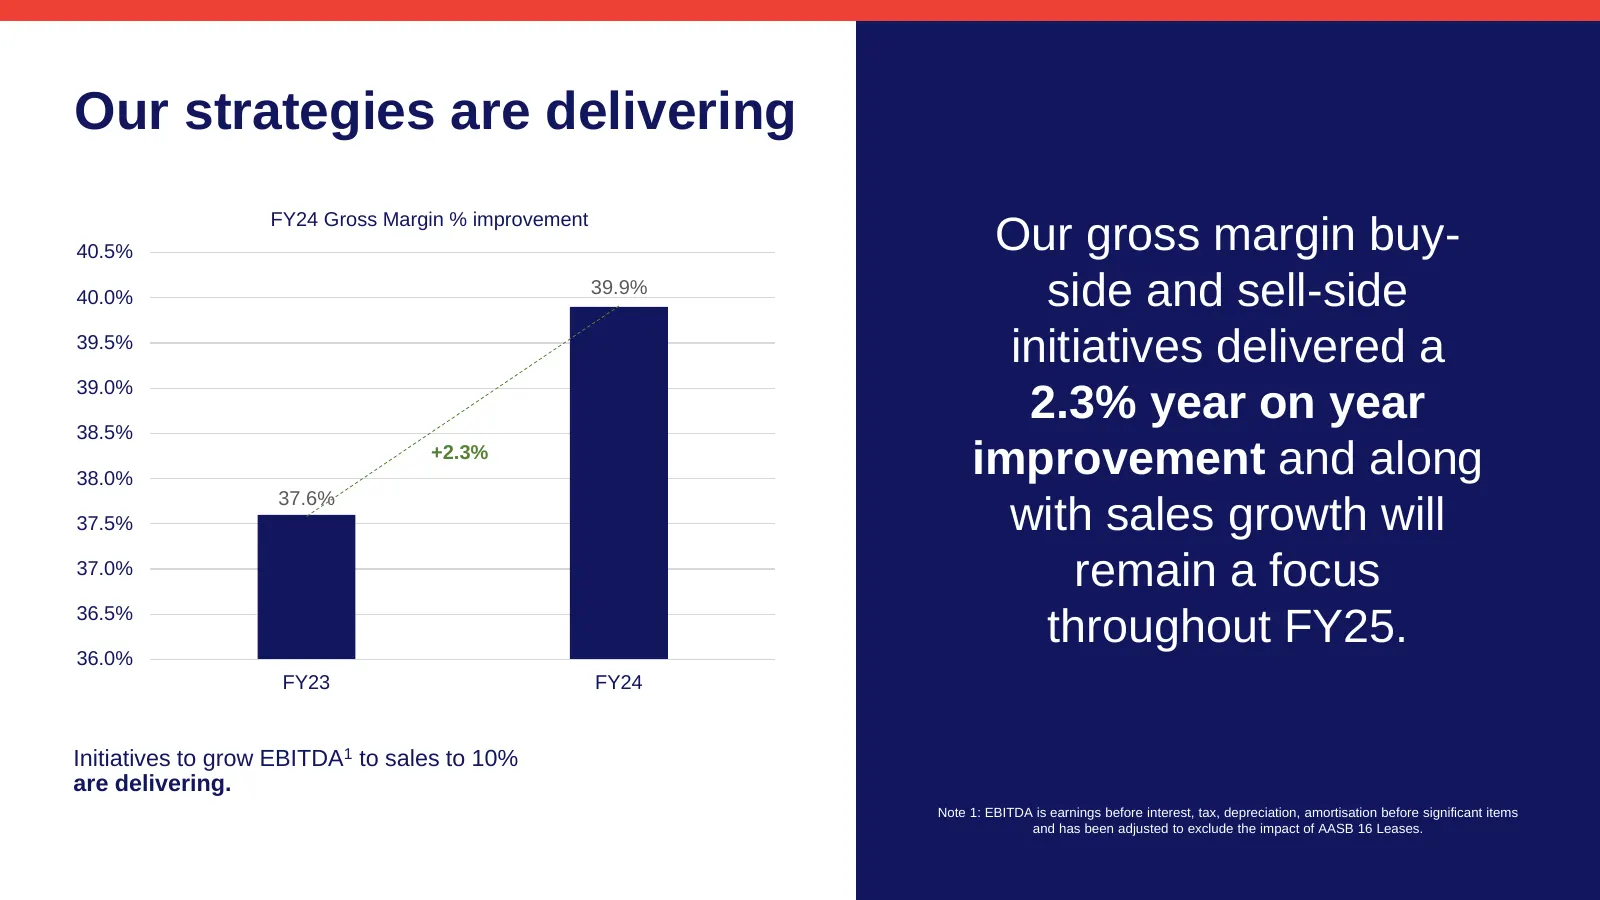
Our strategies are delivering FY24 Gross Margin % improvement 40.5% Our gross margin buy- 40.0% 39.9% side and sell-side 39.5% initiatives delivered a 39.0% 38.5% 2.3% year on year 38.0% +2.3% improvement and along 37.6% 37.5% with sales growth will 37.0% remain a focus 36.5% 36.0% throughout FY25.
Slide 7: Our growth opportunity
02 Our growth opportunity
Slide 8: We operate in large fragmented markets
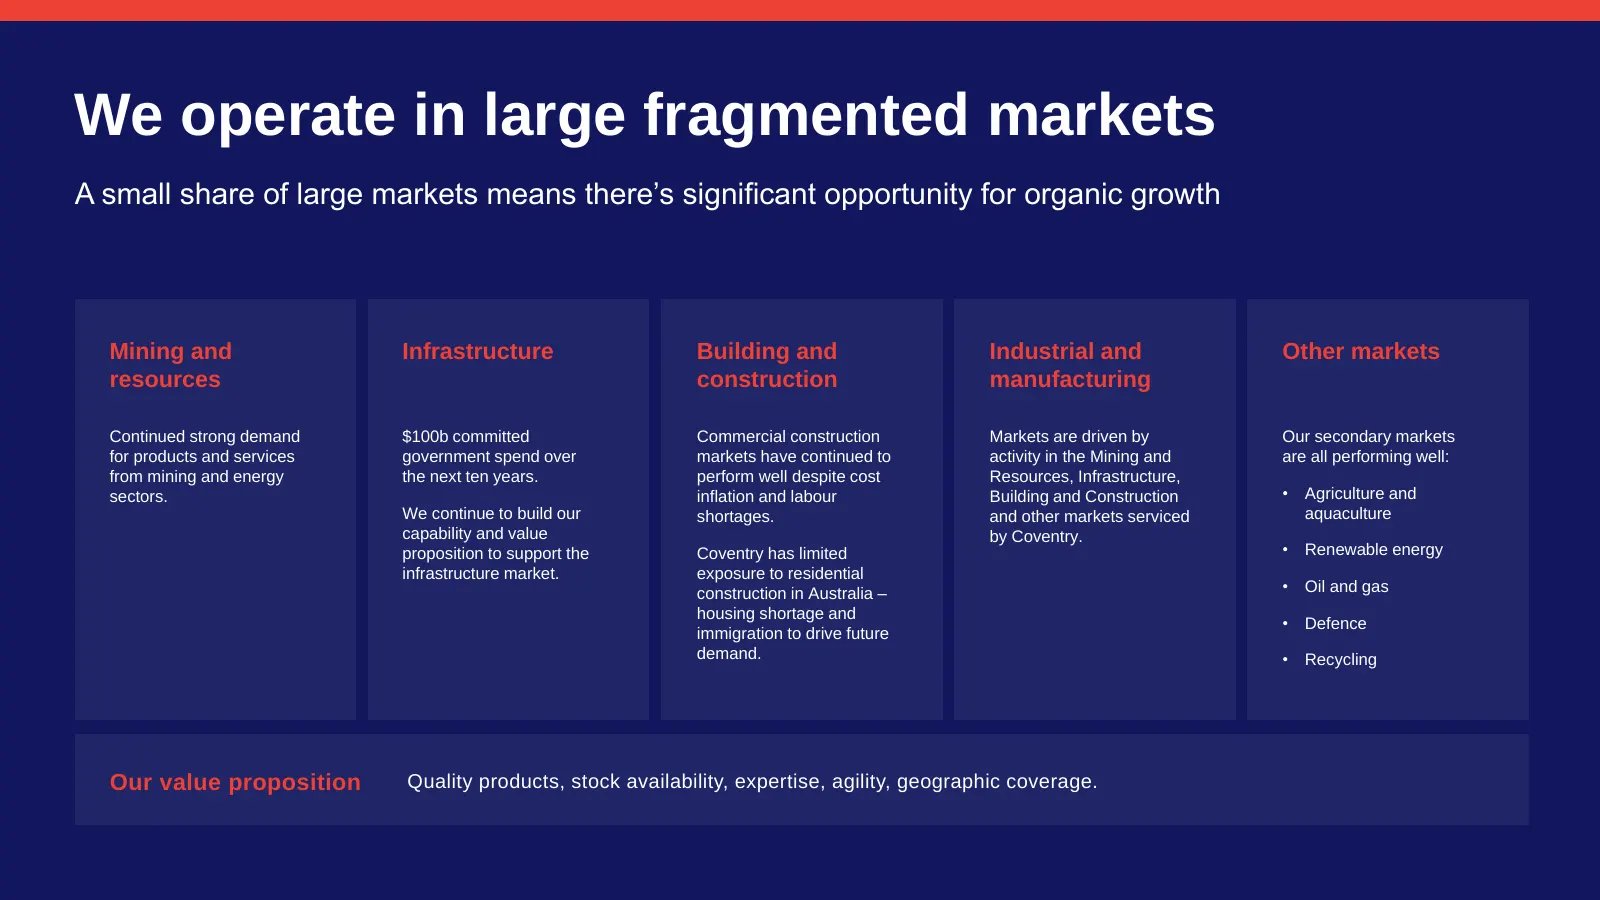
We operate in large fragmented markets A small share of large markets means there’s significant opportunity for organic growth Mining and Infrastructure Building and Industrial and Other markets resources construction manufacturing Continued strong demand $100b committed Commercial construction Mark
Slide 9: Our opportunities and threats
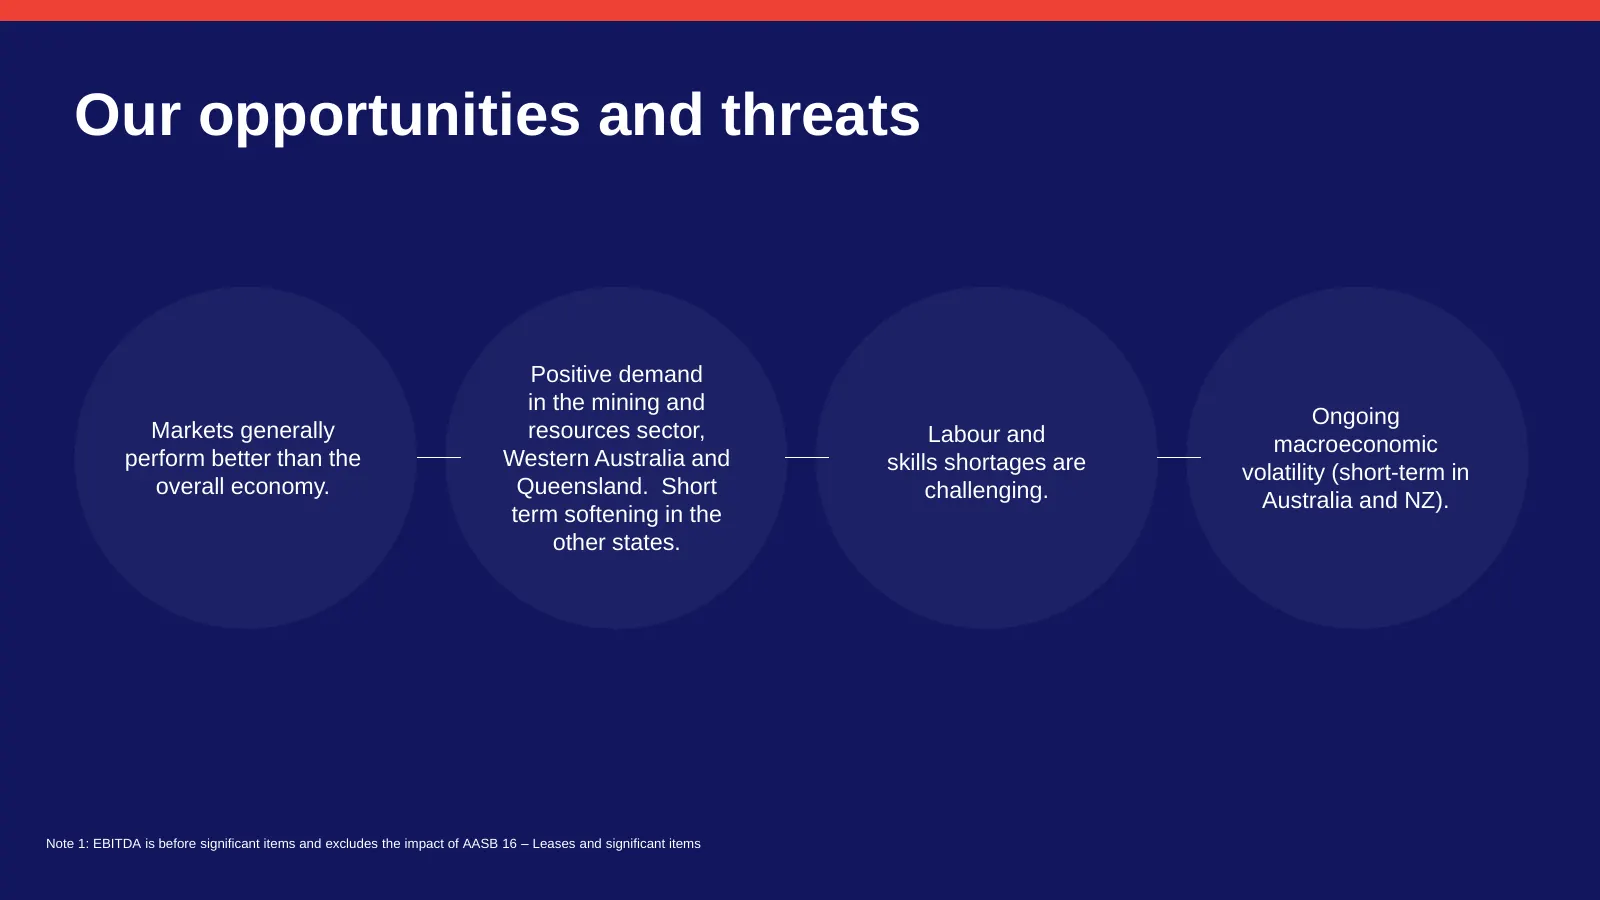
Our opportunities and threats Positive demand in the mining and Ongoing Markets generally resources sector, Labour and macroeconomic perform better than the Western Australia and skills shortages are volatility (short-term in overall economy. Queensland. Short challenging. Australia and NZ). term so
Slide 10: Significant opportunities for growth: Industrial Fasteners Market
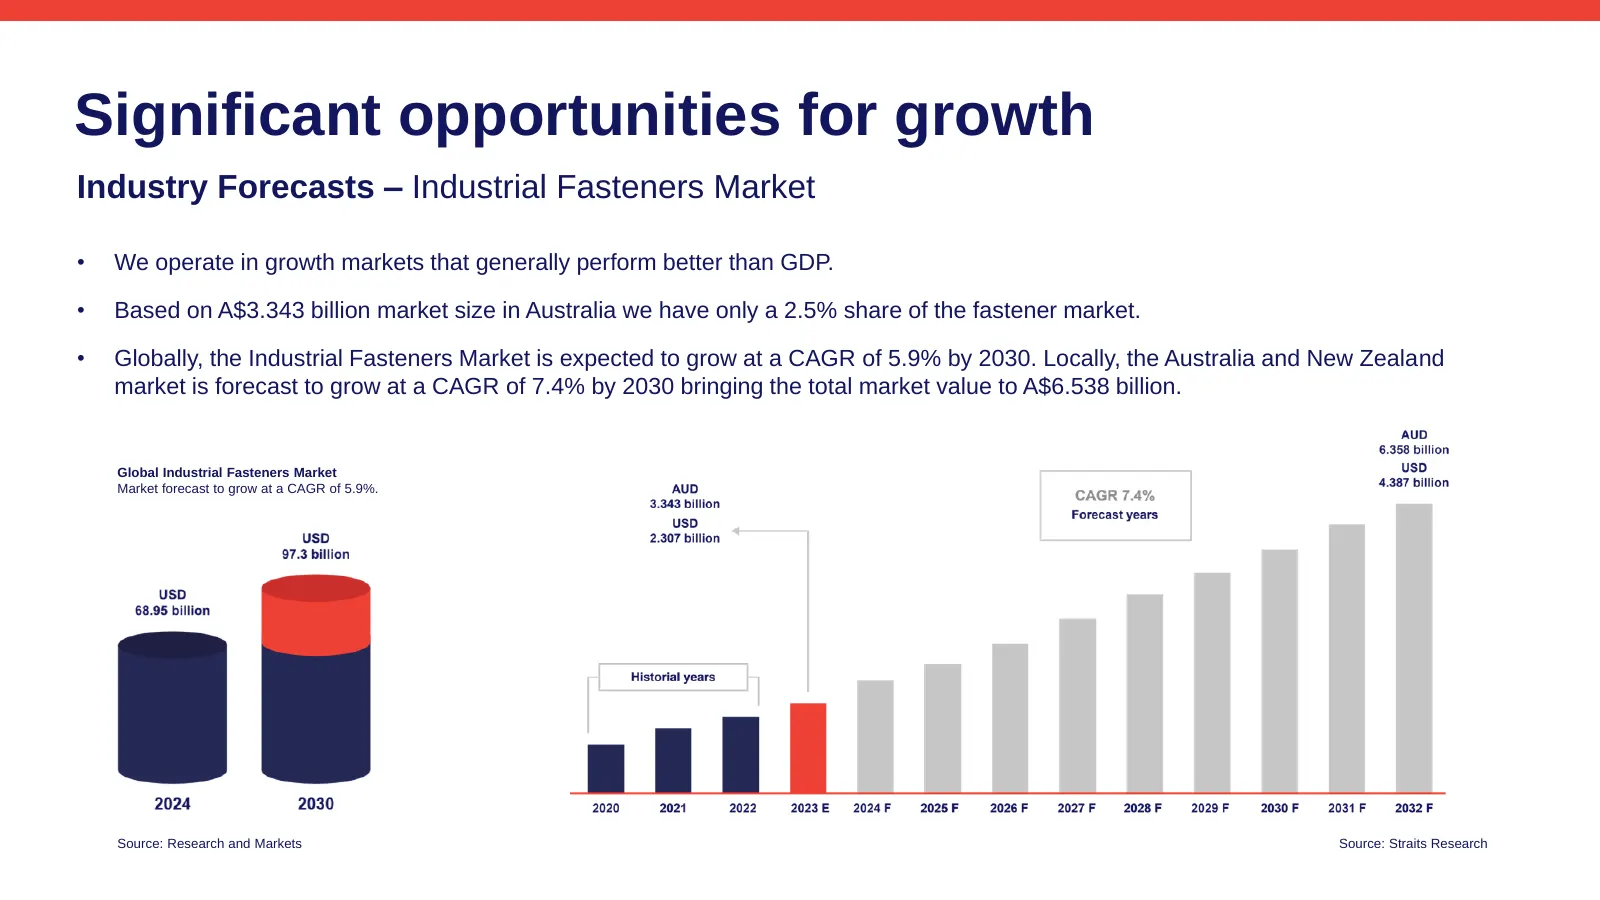
Significant opportunities for growth Industry Forecasts – Industrial Fasteners Market • We operate in growth markets that generally perform better than GDP. • Based on A$3.343 billion market size in Australia we have only a 2.5% share of the fastener market. • Globally, the Industrial Fasteners Mark
Slide 11: Significant opportunities for growth: Fluid Power Equipment Market
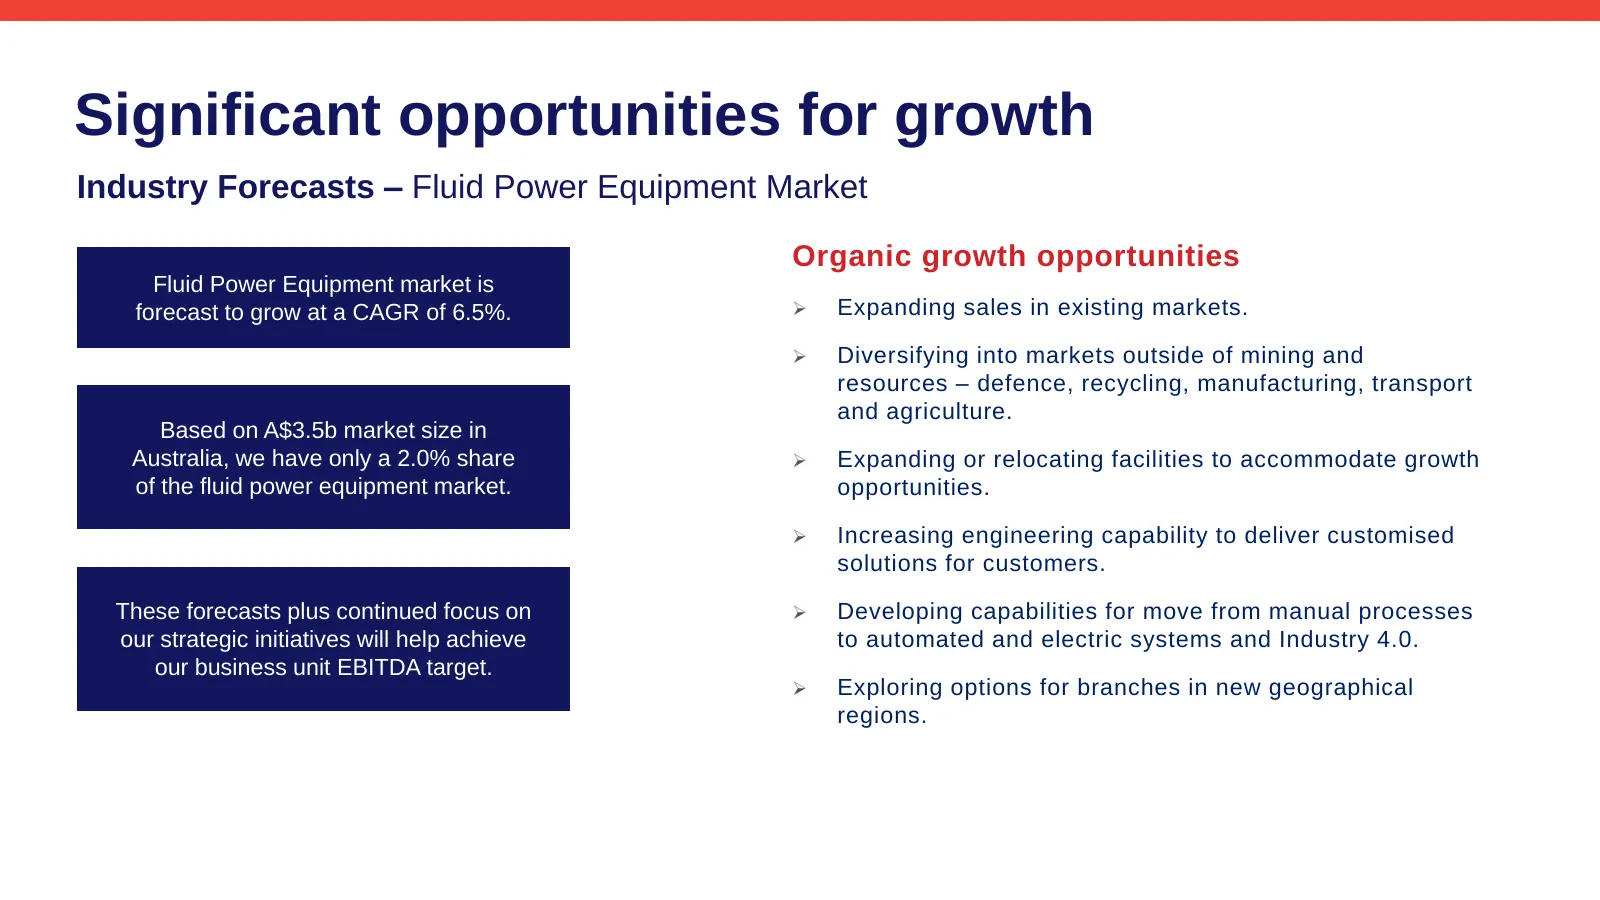
Significant opportunities for growth Industry Forecasts – Fluid Power Equipment Market Organic growth opportunities Fluid Power Equipment market is forecast to grow at a CAGR of 6.5%. ➢ Expanding sales in existing markets. ➢ Diversifying into markets outside of mining and resources – defence, recycl
Slide 12: Our growth strategy
03 Our growth strategy
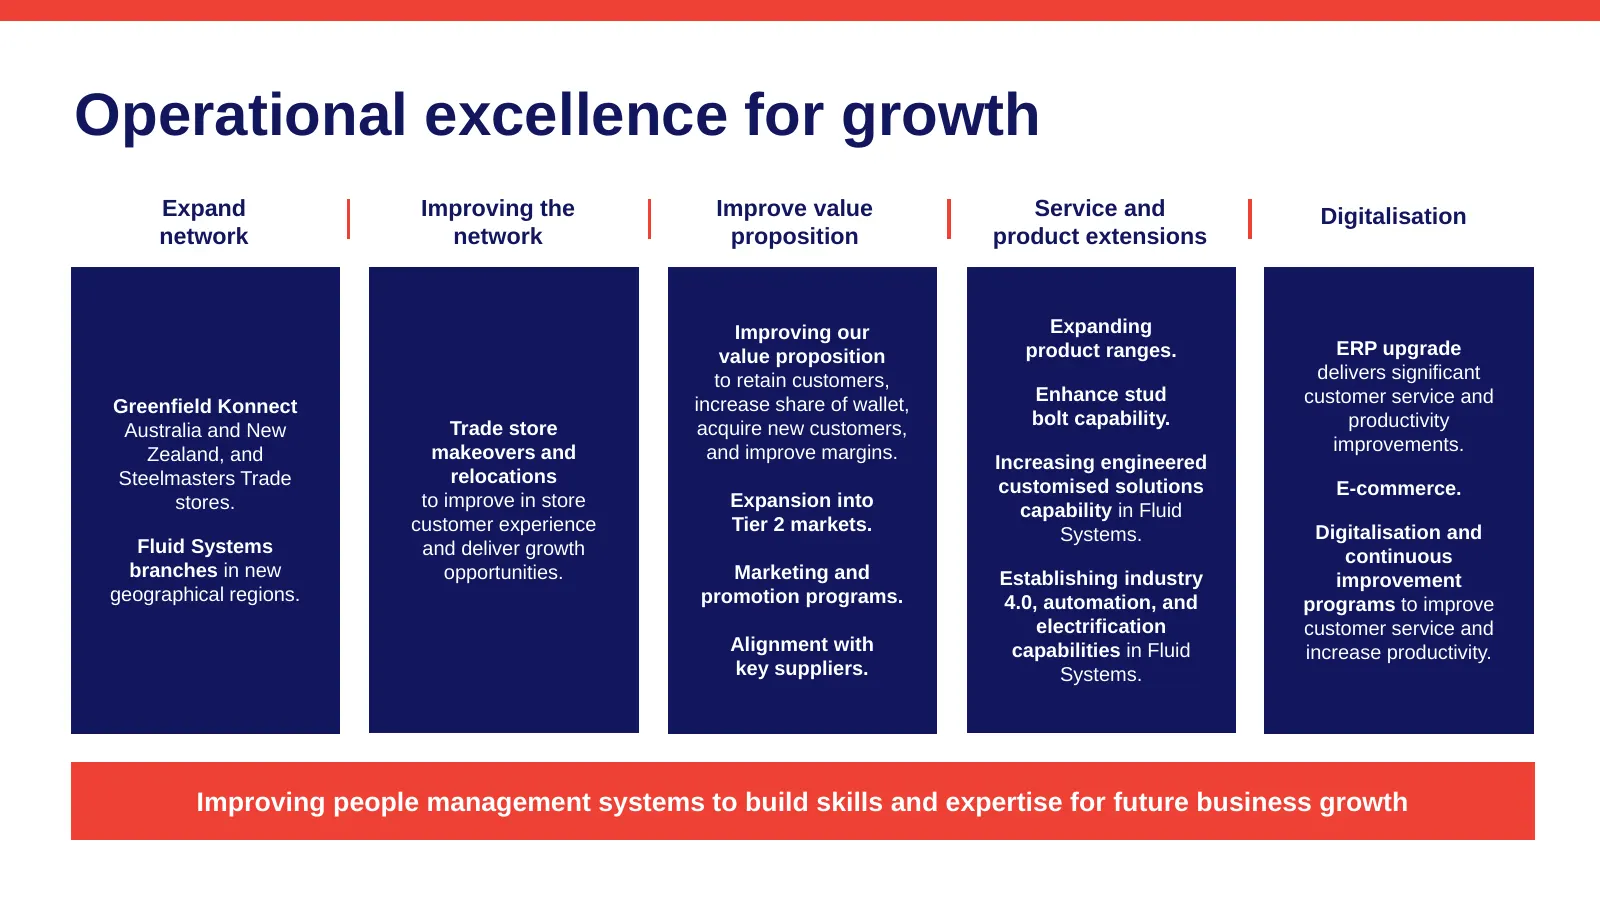
Slide 13: Operational excellence for growth
Operational excellence for growth Expand Improving the Improve value Service and Digitalisation network network proposition product extensions Improving our Expanding value proposition product ranges. ERP upgrade to retain customers, delivers significant Enhance stud customer service and Greenfield
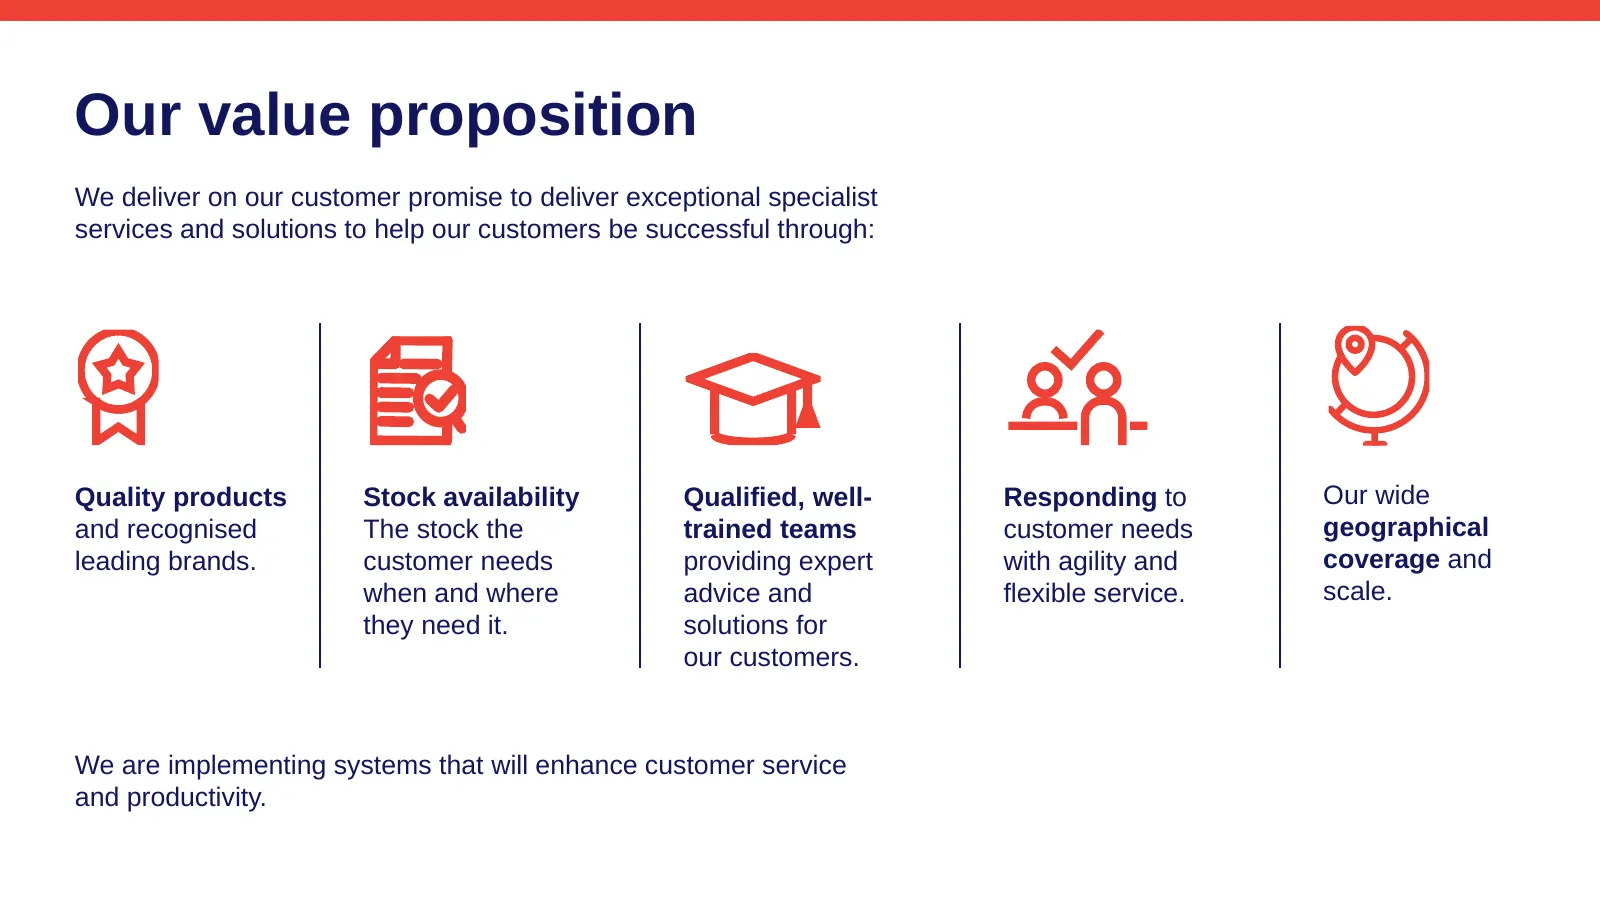
Slide 14: Our value proposition
Our value proposition We deliver on our customer promise to deliver exceptional specialist services and solutions to help our customers be successful through: Quality products Stock availability Qualified, well- Responding to Our wide and recognised The stock the trained teams customer needs geograp
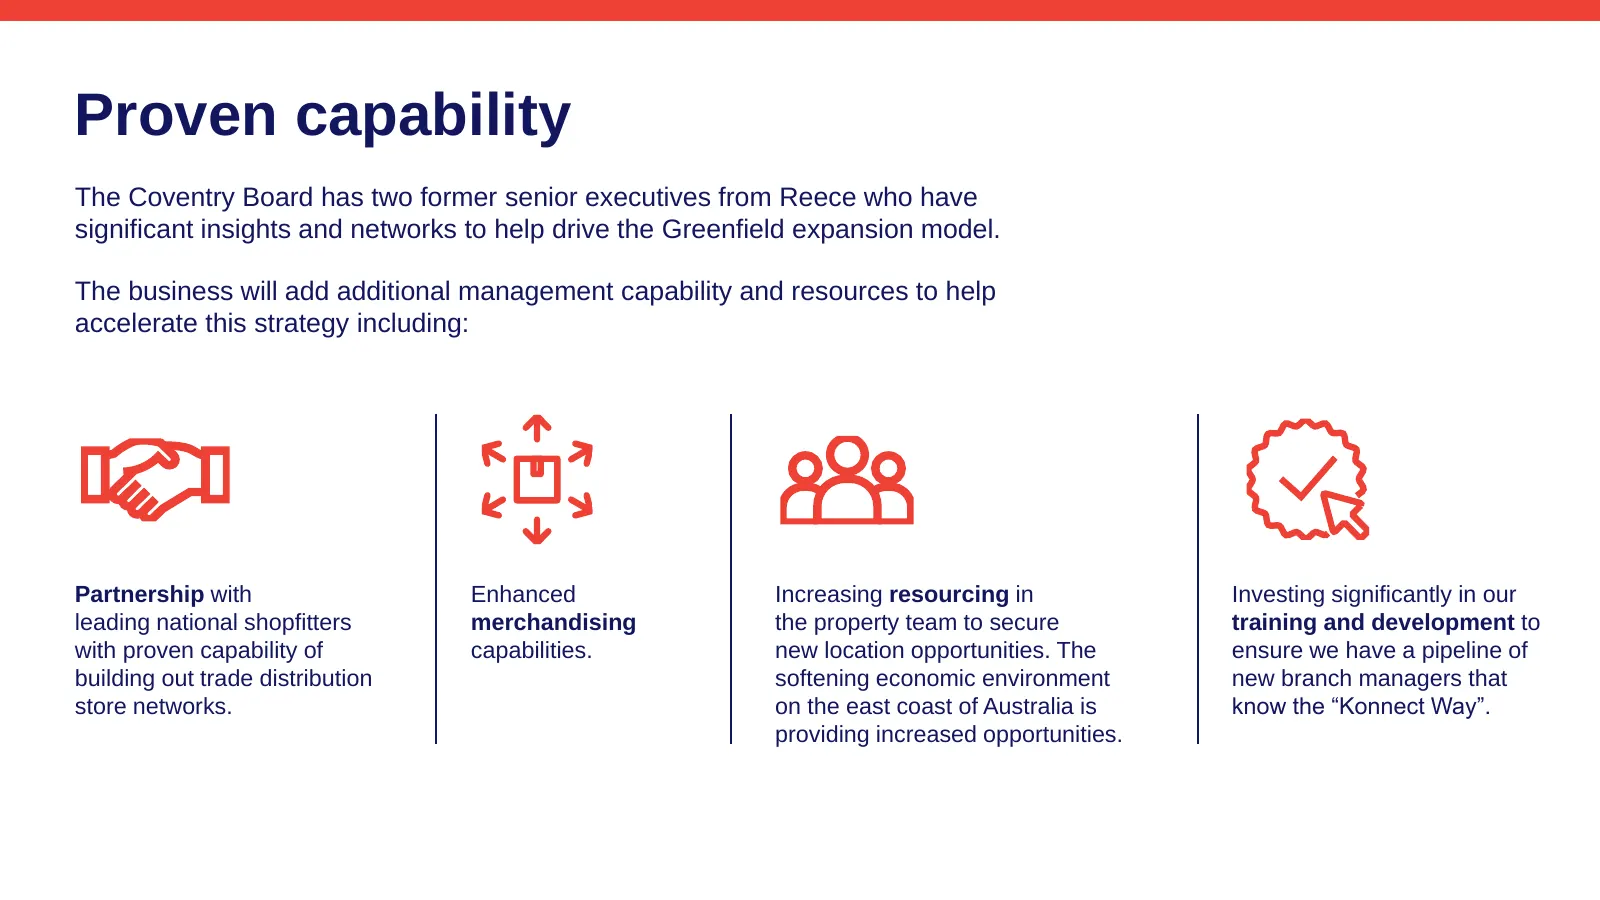
Slide 15: Proven capability
Proven capability The Coventry Board has two former senior executives from Reece who have significant insights and networks to help drive the Greenfield expansion model. The business will add additional management capability and resources to help accelerate this strategy including: Partnership with
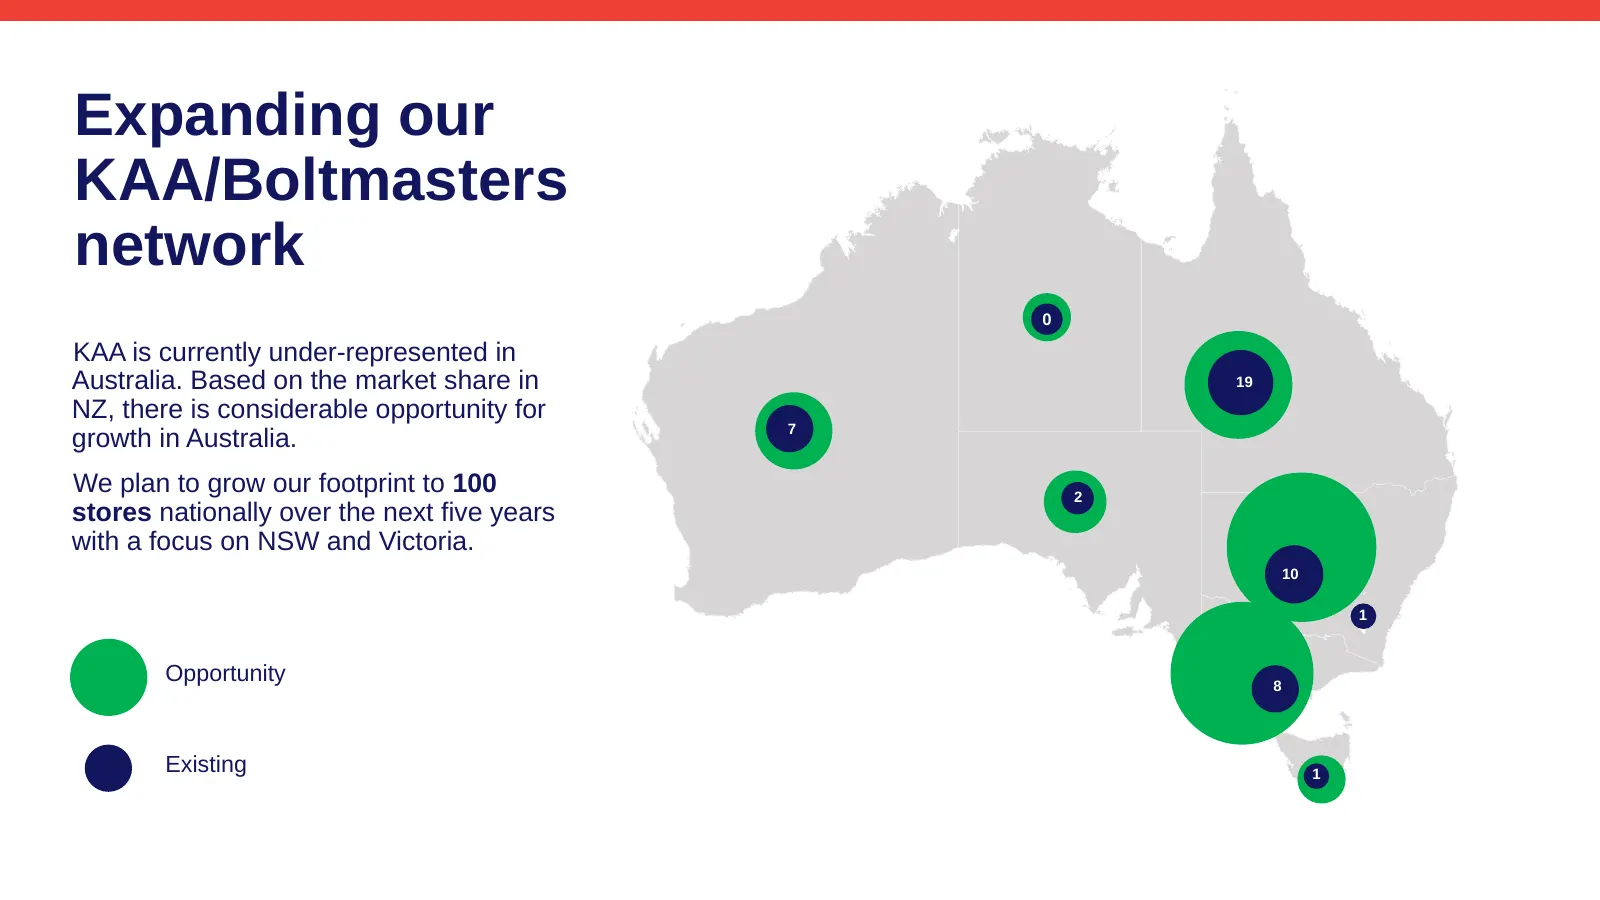
Slide 16: Expanding our KAA/Boltmasters network
Expanding our KAA/Boltmasters network 0 KAA is currently under-represented in Australia. Based on the market share in 19 NZ, there is considerable opportunity for 7 growth in Australia. We plan to grow our footprint to 100 2 stores nationally over the next five years with a focus on NSW and Victoria
Slide 17: Greenfield Model
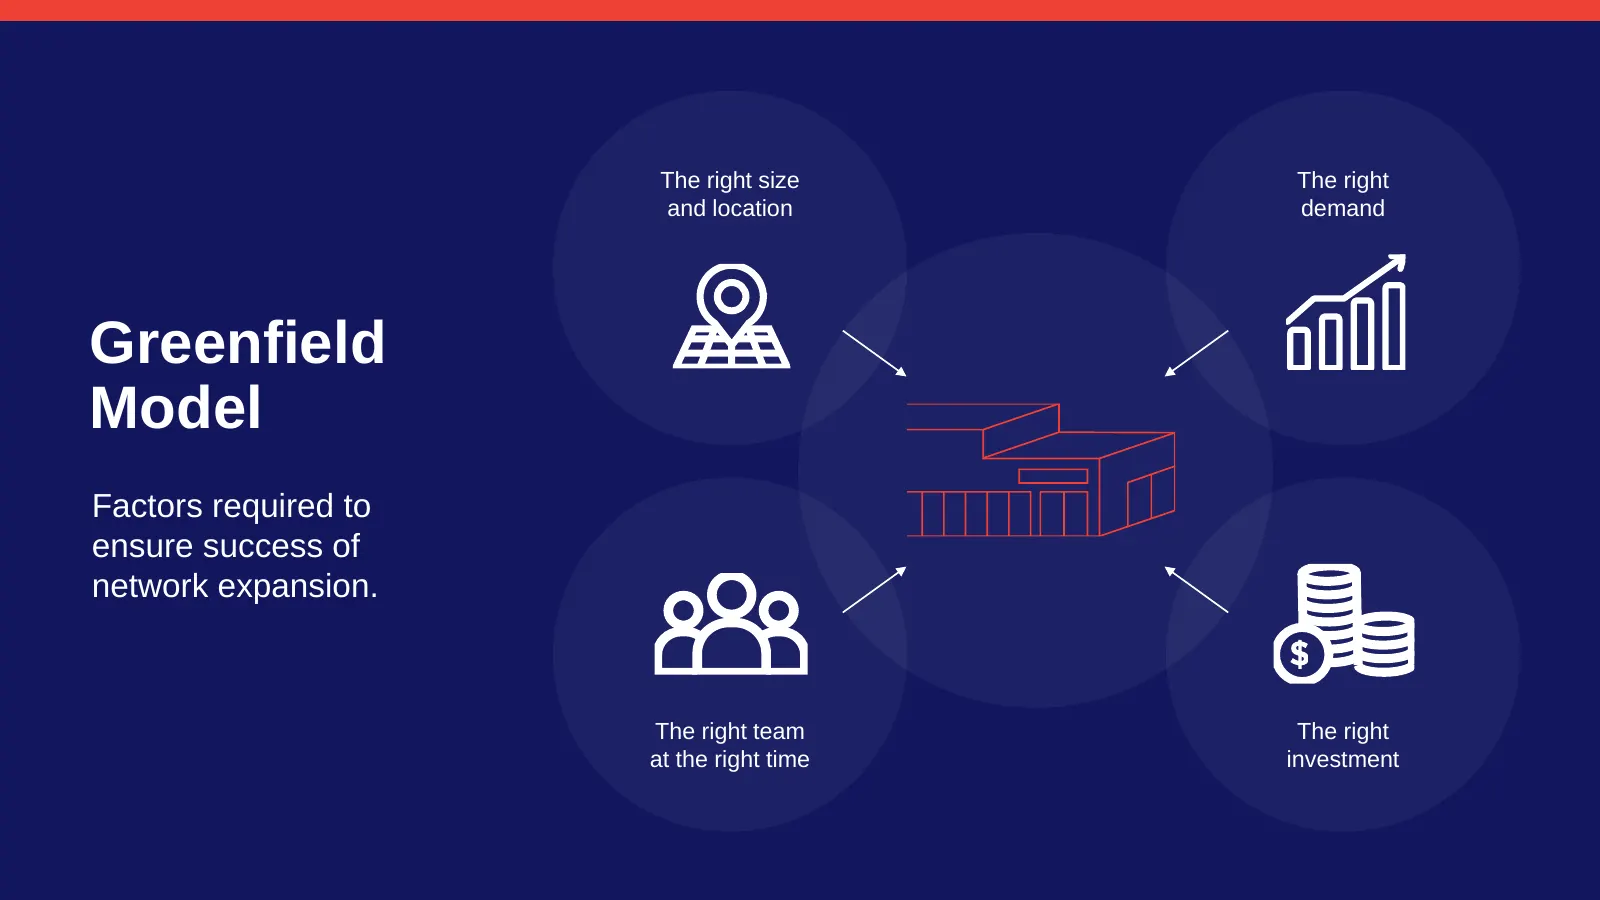
The right size The right and location demand Greenfield Model Factors required to ensure success of network expansion. The right team The right at the right time investment
Slide 18: KAA new store rollout profile
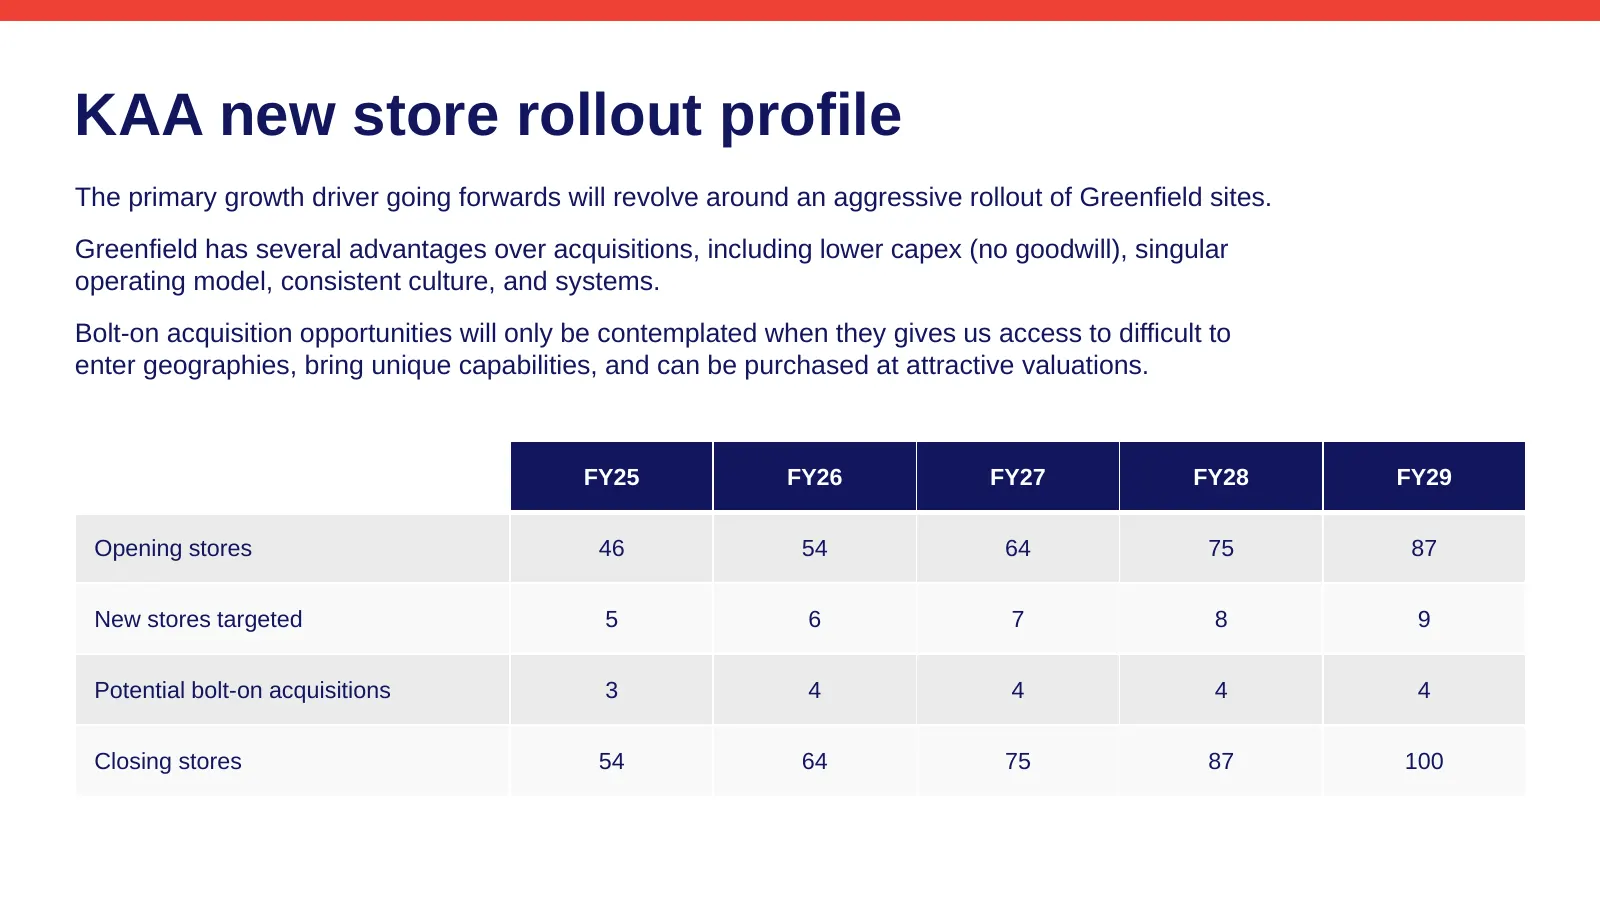
KAA new store rollout profile The primary growth driver going forwards will revolve around an aggressive rollout of Greenfield sites. Greenfield has several advantages over acquisitions, including lower capex (no goodwill), singular operating model, consistent culture, and systems. Bolt-on acquisiti
Slide 19: Targeted Greenfield economics
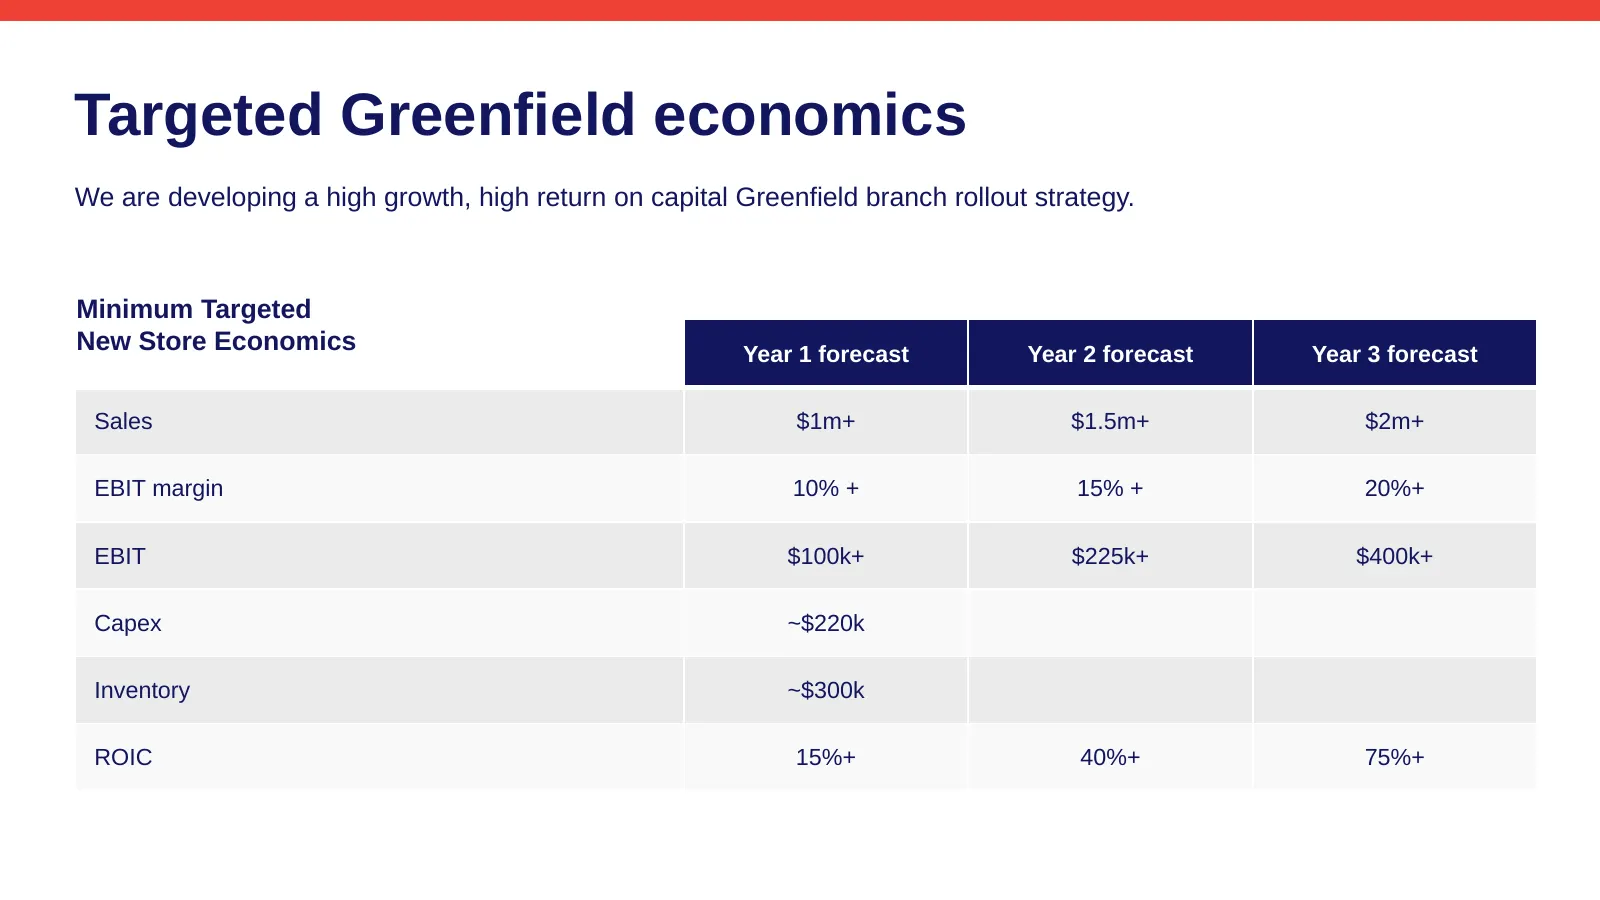
Targeted Greenfield economics We are developing a high growth, high return on capital Greenfield branch rollout strategy. Minimum Targeted New Store Economics Year 1 forecast Year 2 forecast Year 3 forecast Sales $1m+ $1.5m+ $2m+ EBIT margin 10% + 15% + 20%+ EBIT $100k+ $225k+ $400k+ Capex ~$220k In
Slide 20: A greenfield model that works
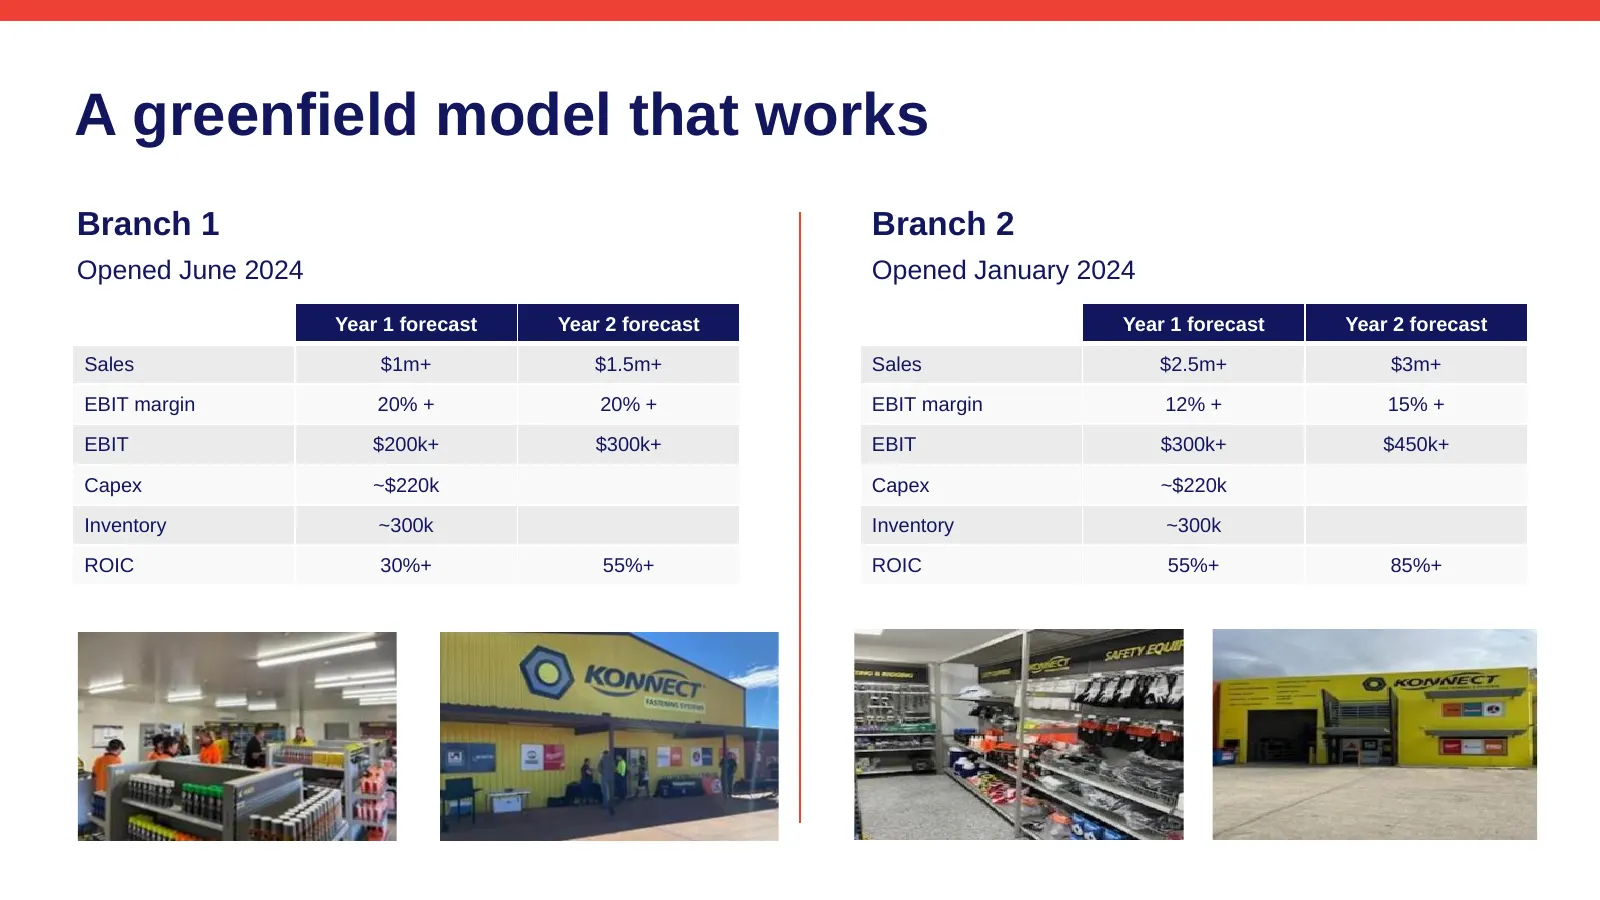
A greenfield model that works Branch 1 Branch 2 Opened June 2024 Opened January 2024 Year 1 forecast Year 2 forecast Year 1 forecast Year 2 forecast Sales $1m+ $1.5m+ Sales $2.5m+ $3m+ EBIT margin 20% + 20% + EBIT margin 12% + 15% + EBIT $200k+ $300k+ EBIT $300k+ $450k+ Capex ~$220k Capex ~$220k Inv
Slide 21: FY25 Q1 Update
04 FY25 Q1 Update
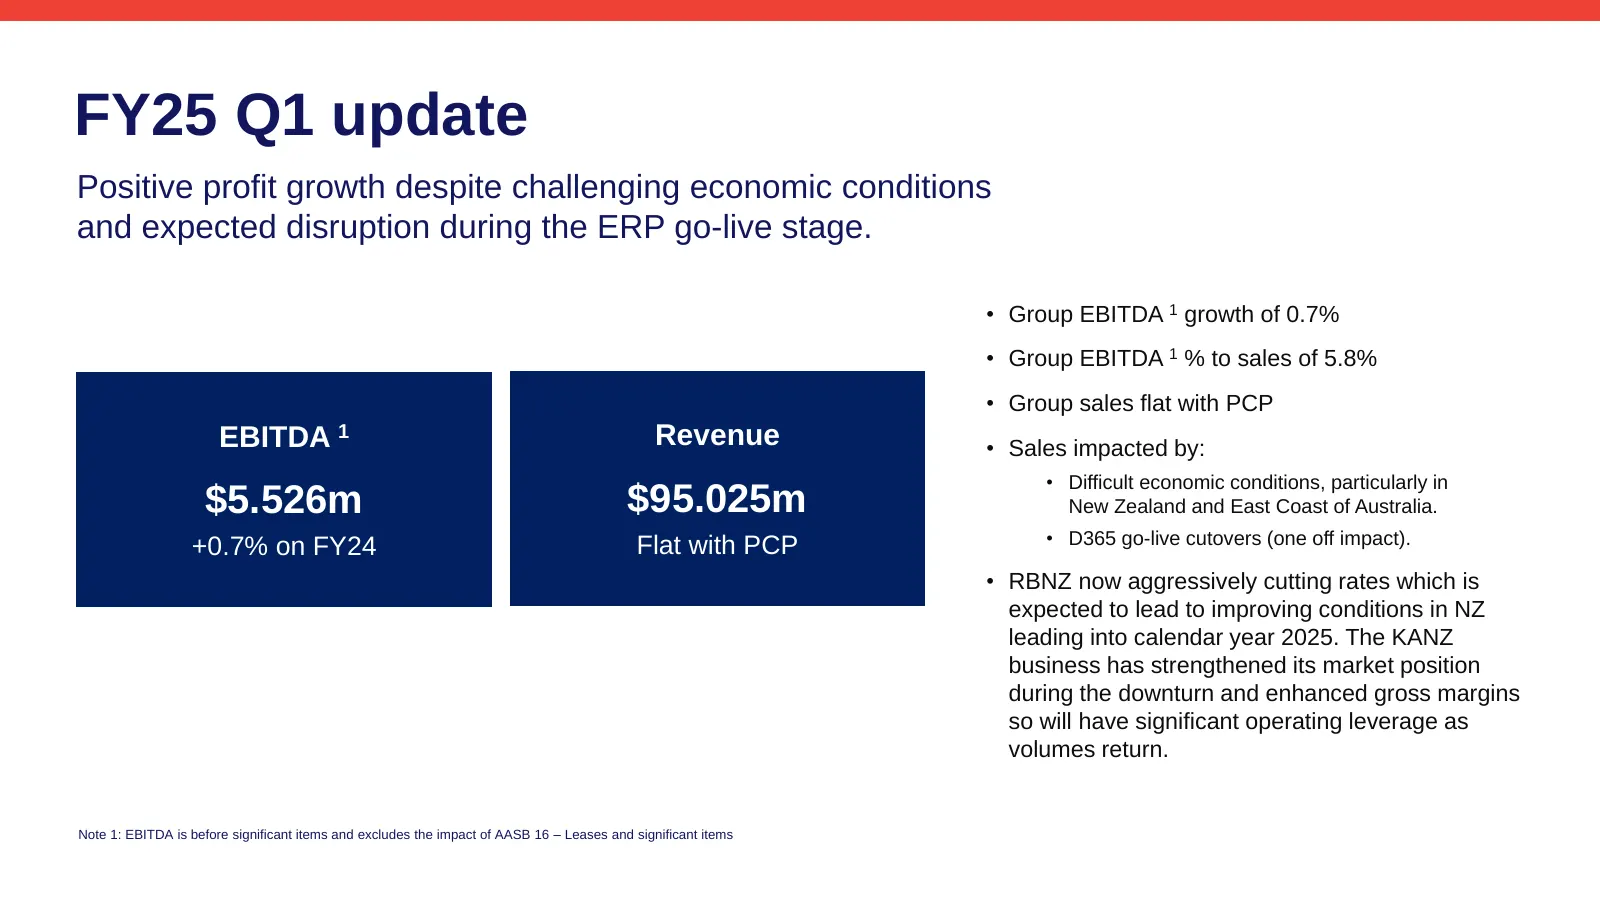
Slide 22: FY25 Q1 update
FY25 Q1 update Positive profit growth despite challenging economic conditions and expected disruption during the ERP go-live stage. • Group EBITDA 1 growth of 0.7% • Group EBITDA 1 % to sales of 5.8% • Group sales flat with PCP EBITDA 1 Revenue • Sales impacted by: • Difficult economic conditions, p
Slide 23: Summary
05 Summary
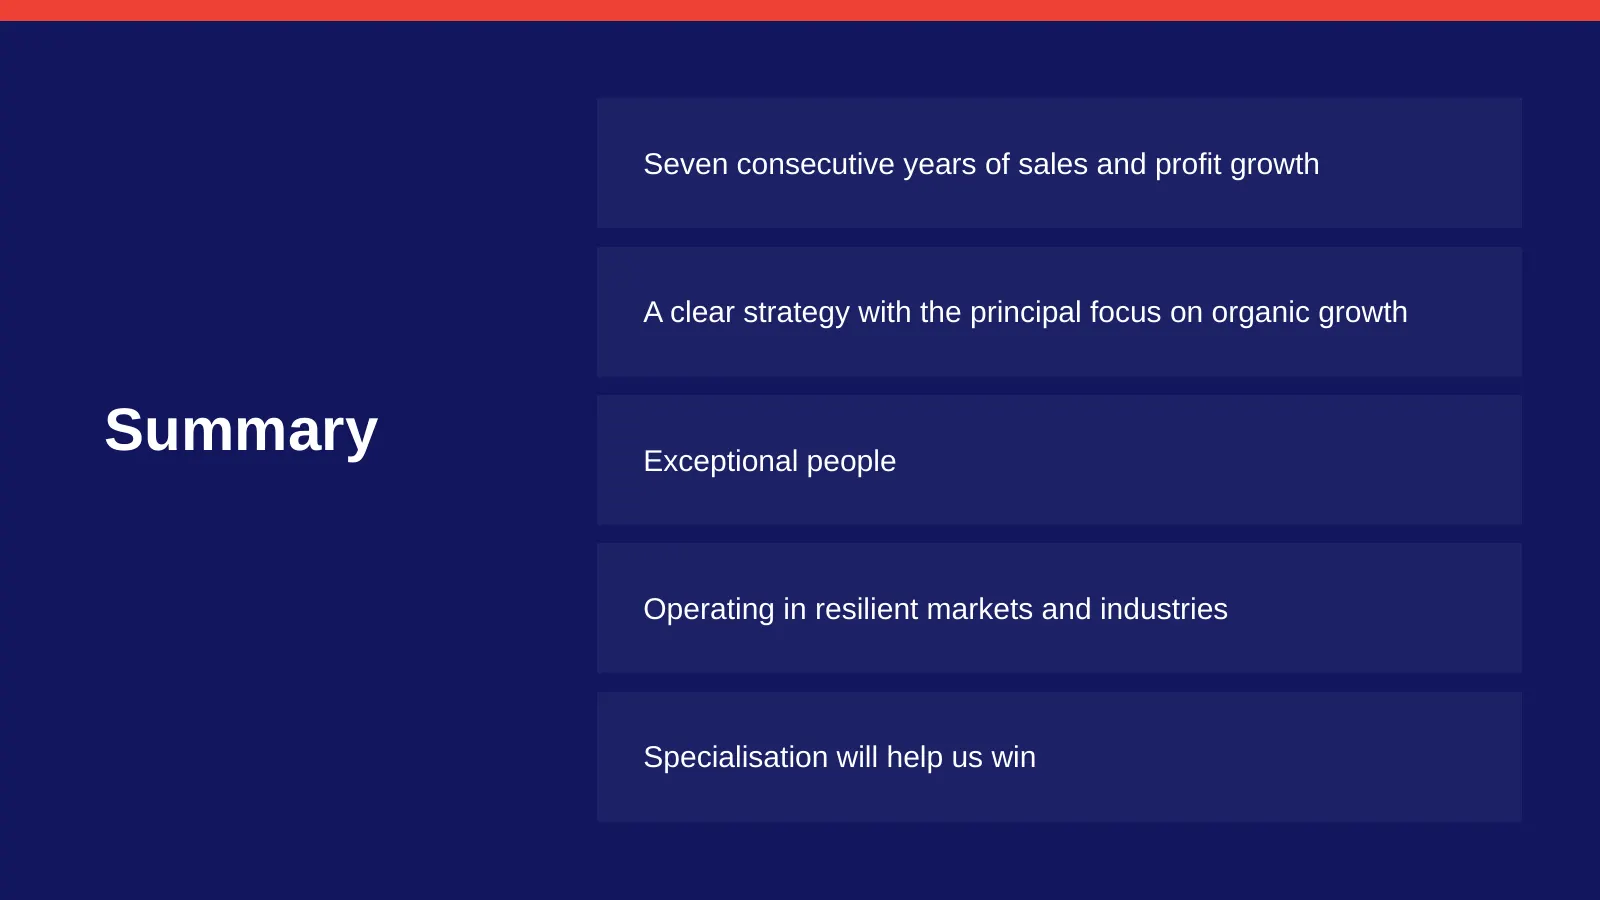
Slide 24: Summary
Seven consecutive years of sales and profit growth A clear strategy with the principal focus on organic growth Summary Exceptional people Operating in resilient markets and industries Specialisation will help us win
Slide 25: About the Coventry Group
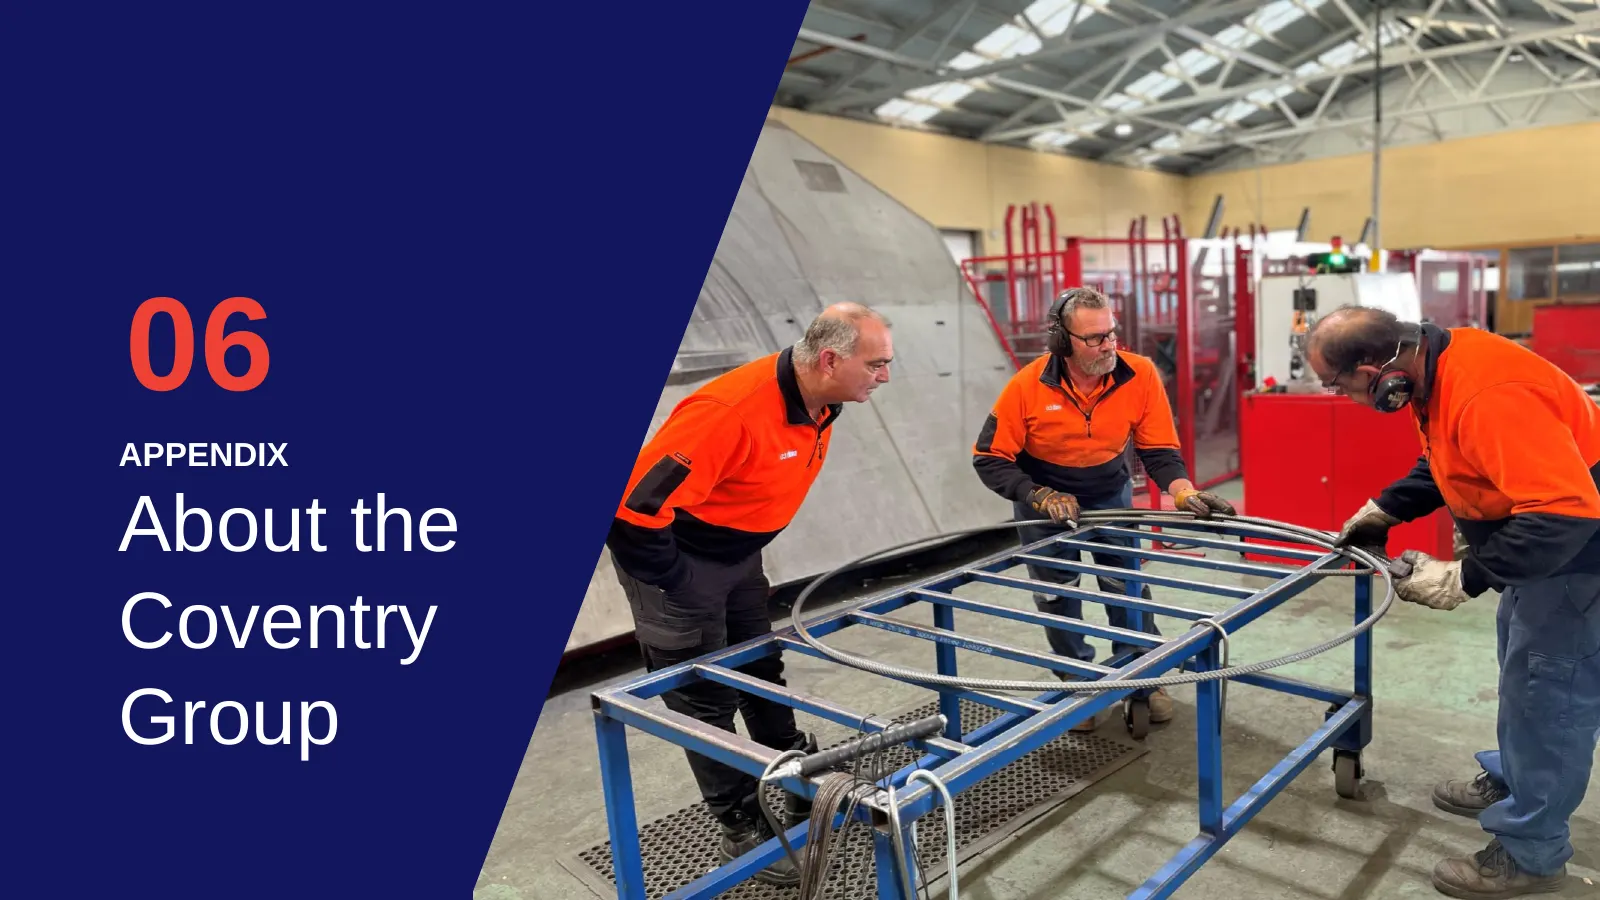
06 APPENDIX About the Coventry Group
Slide 26: About Coventry
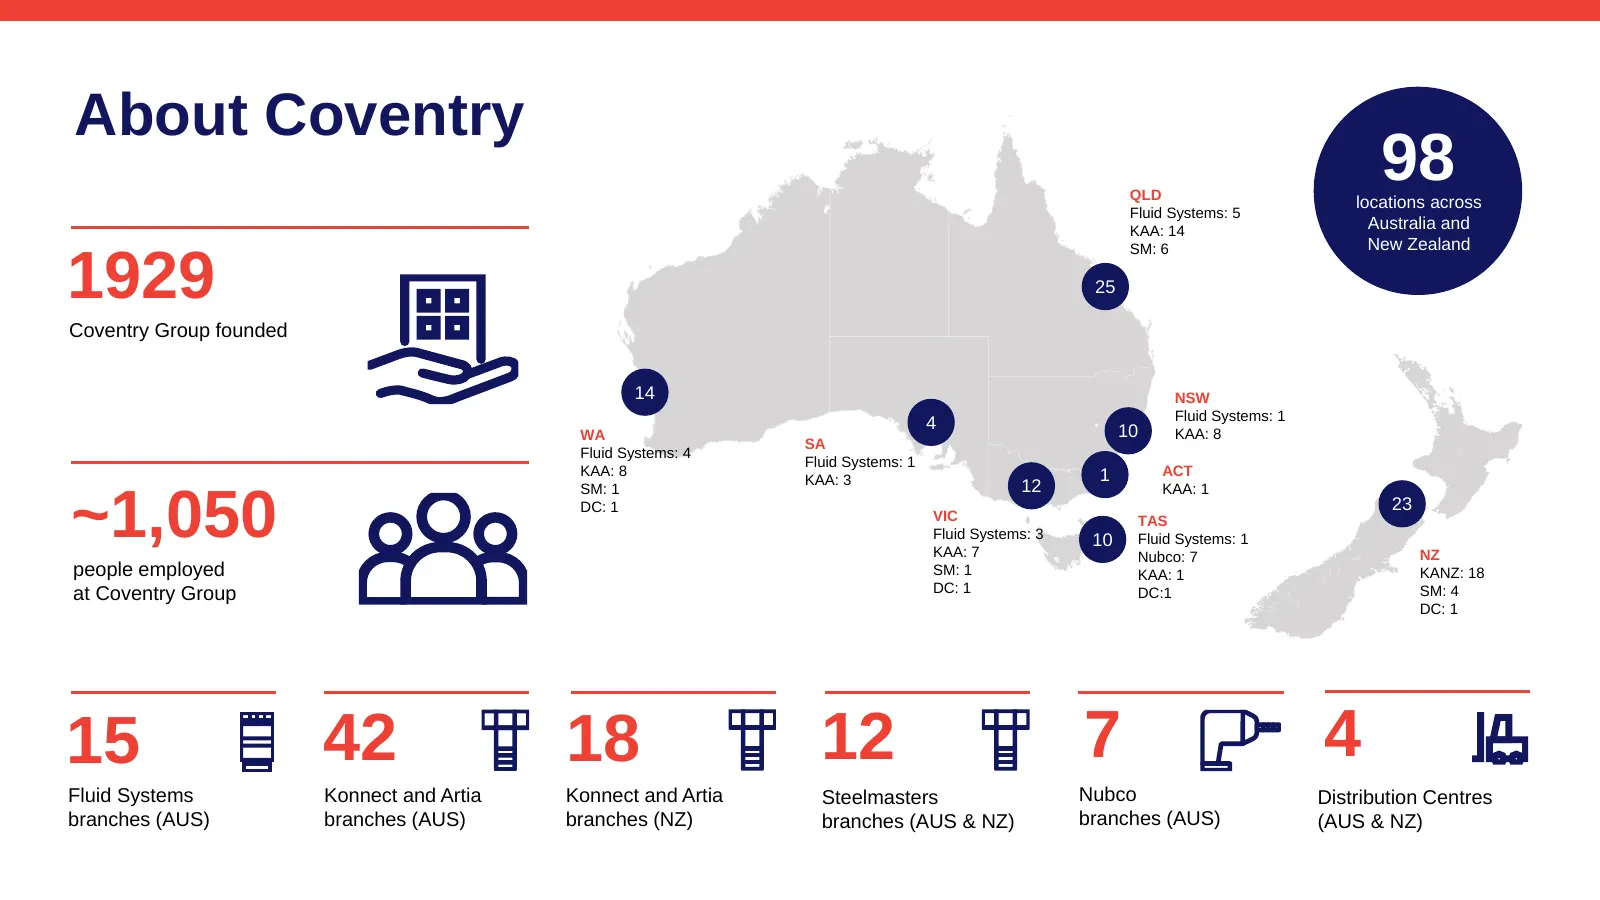
About Coventry QLD 98 locations across Fluid Systems: 5 KAA: 14 Australia and SM: 6 New Zealand 1929 25 Coventry Group founded 14 NSW Fluid Systems: 1 4 10 WA KAA: 8 SA Fluid Systems: 4 Fluid Systems: 1 KAA: 8 1 ACT KAA: 3 12 SM: 1 KAA: 1 ~1,050 DC: 1 VIC Fluid Systems: 3 KAA: 7 10 TAS Fluid Systems
Slide 27: Specialisation is how we win
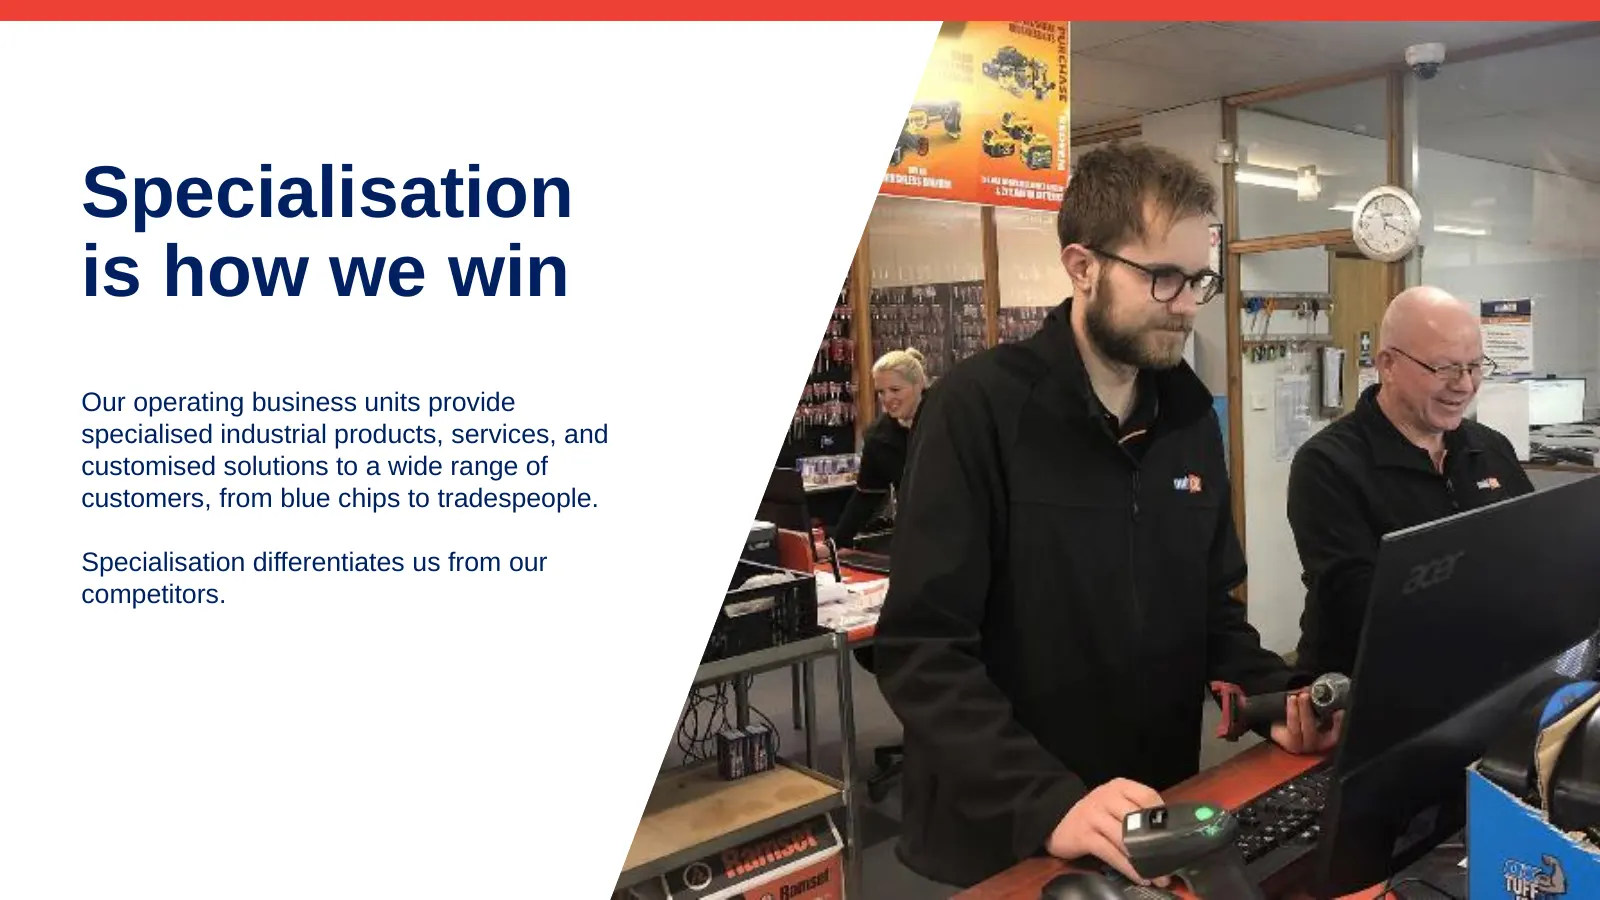
Specialisation is how we win Our operating business units provide specialised industrial products, services, and customised solutions to a wide range of customers, from blue chips to tradespeople. Specialisation differentiates us from our competitors.
Slide 28: Where we specialise
Where we specialise Trade Distribution Fluid Systems Trade Distribution comprises: Fluid Systems is an innovative service provider to the Mining and Resources, • Konnect and Artia Australia (KAA) Renewable Energy, Agriculture and Aquaculture, Defence, Food & Beverage • Konnect and Artia New Zealand
Slide 29: Target 10%+ EBITDA
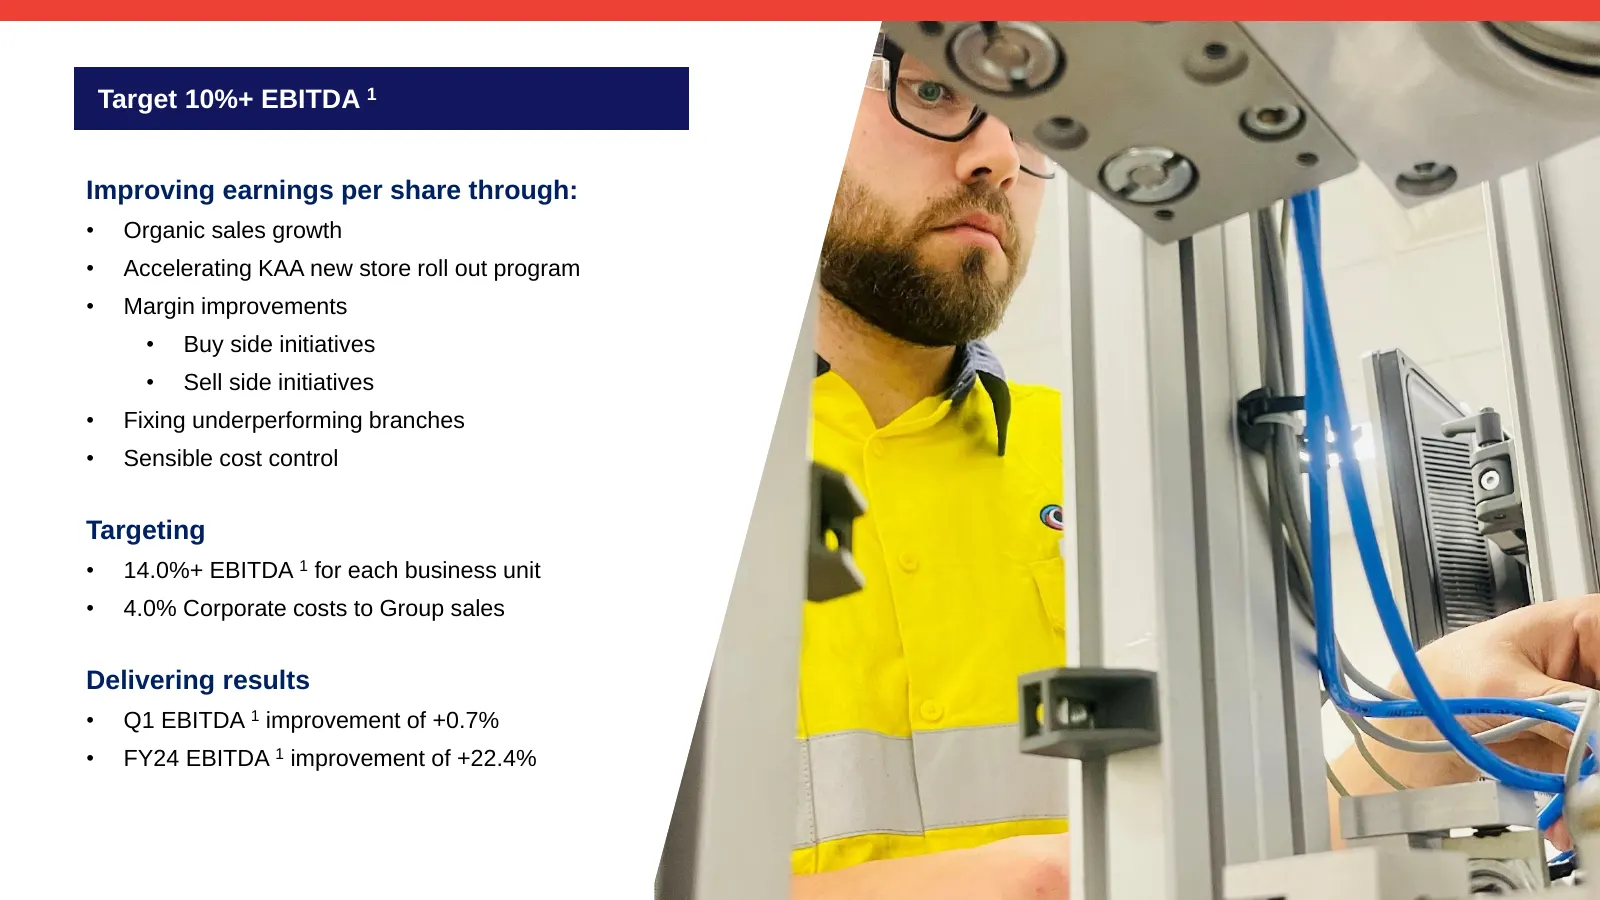
Target 10%+ EBITDA 1 Improving earnings per share through: • Organic sales growth • Accelerating KAA new store roll out program • Margin improvements • Buy side initiatives • Sell side initiatives • Fixing underperforming branches • Sensible cost control Targeting • 14.0%+ EBITDA 1 for each business
Slide 30: KAA profitability improvements
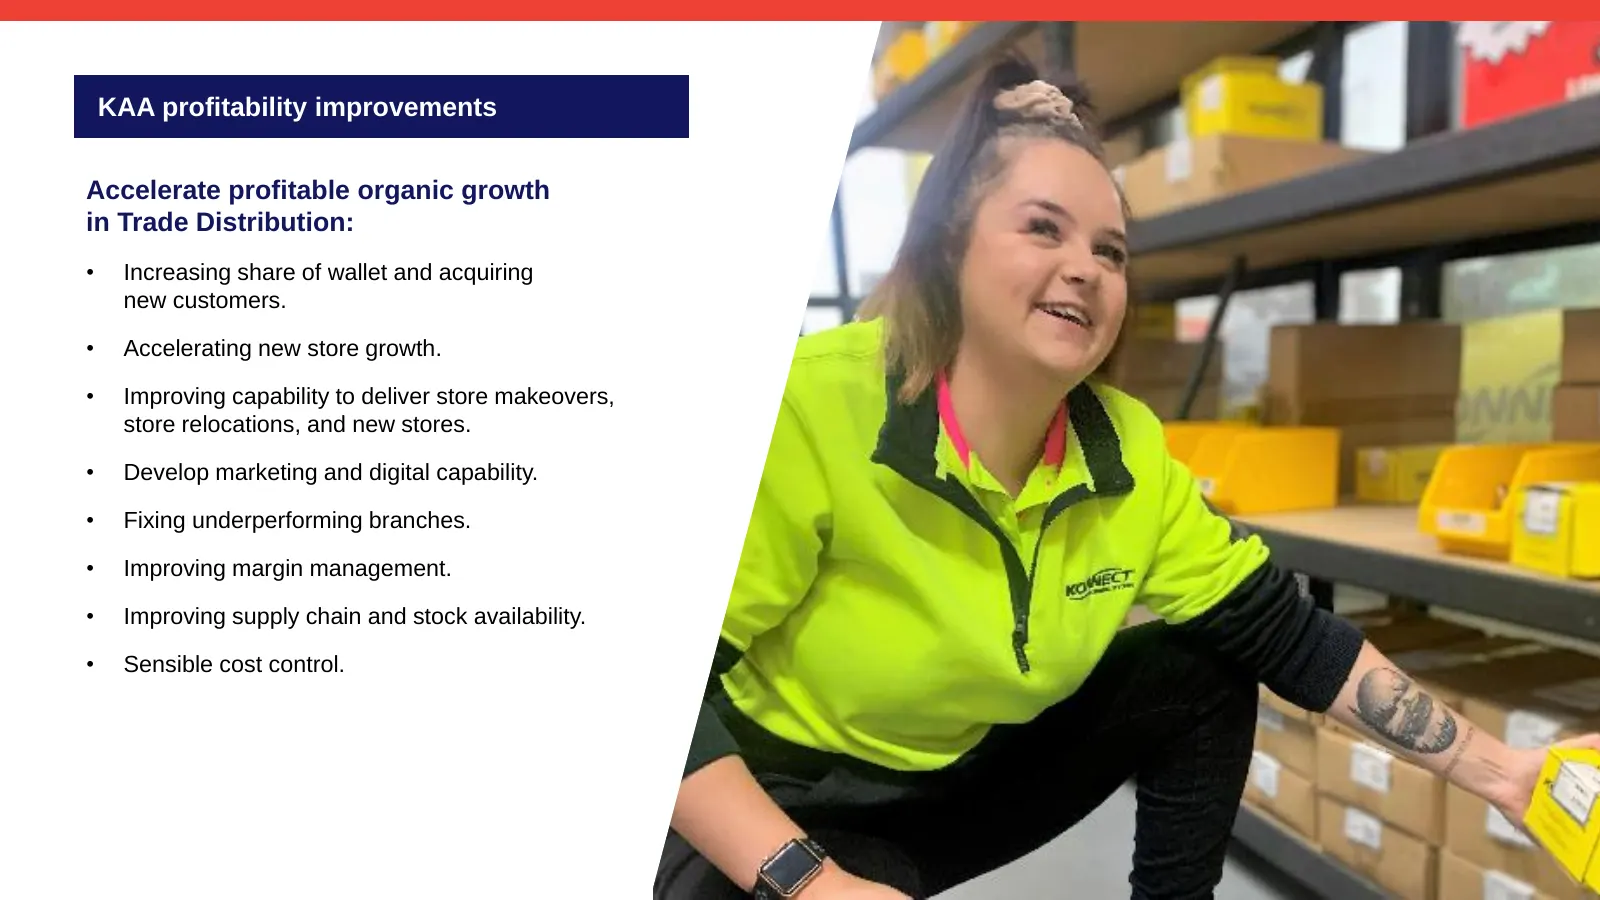
KAA profitability improvements Accelerate profitable organic growth in Trade Distribution: • Increasing share of wallet and acquiring new customers. • Accelerating new store growth. • Improving capability to deliver store makeovers, store relocations, and new stores. • Develop marketing and digital
Slide 31: ERP upgrade project
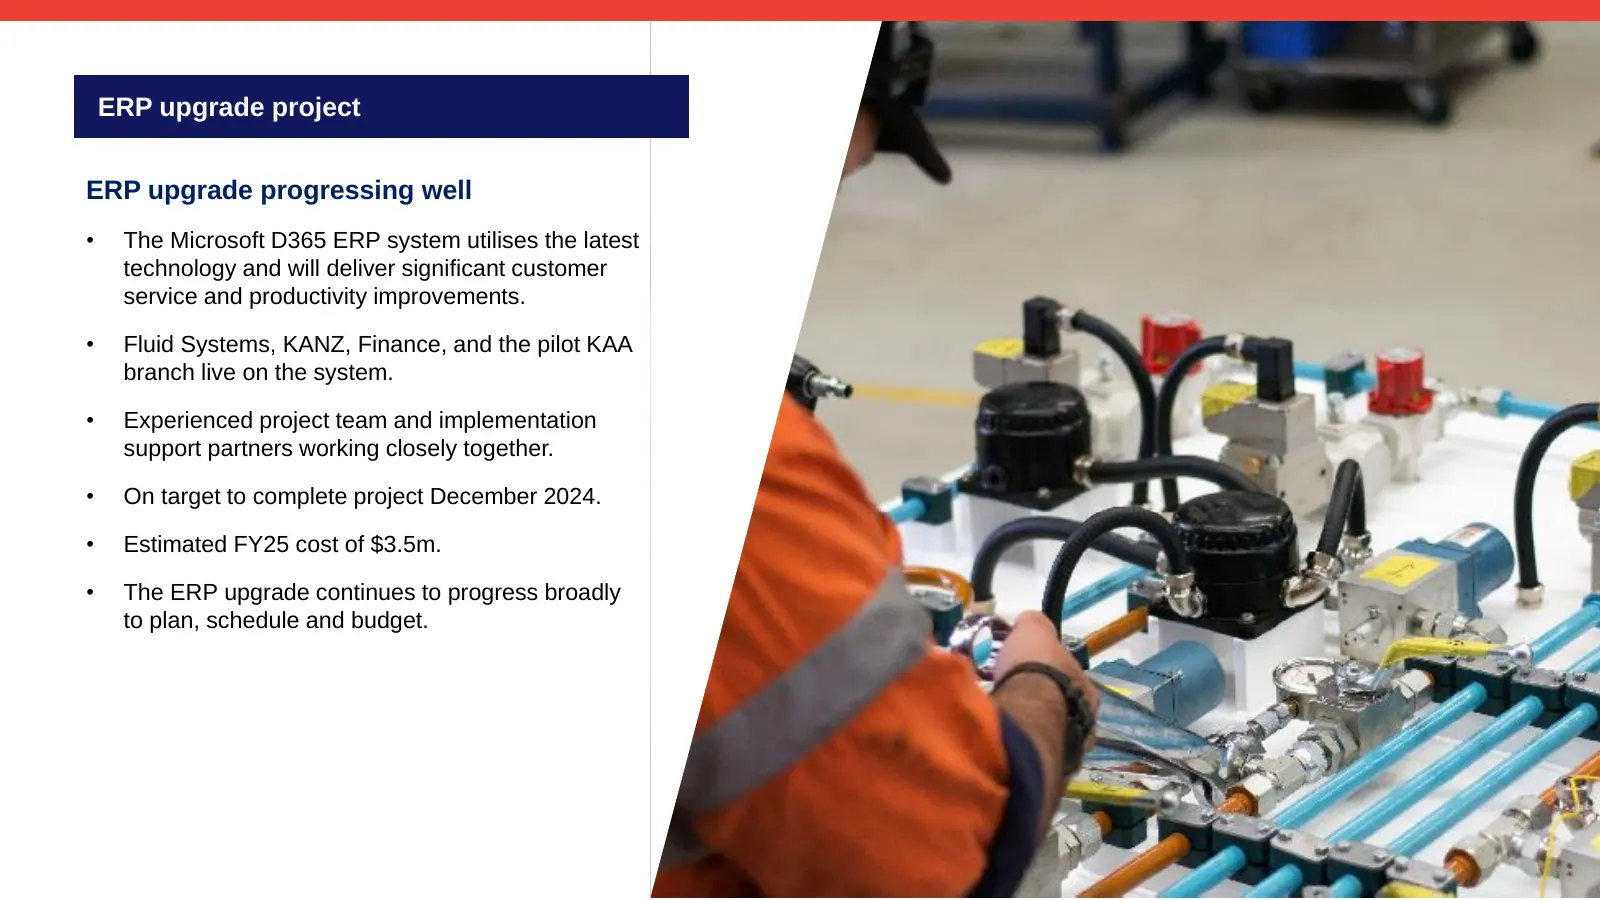
ERP upgrade project ERP upgrade progressing well • The Microsoft D365 ERP system utilises the latest technology and will deliver significant customer service and productivity improvements. • Fluid Systems, KANZ, Finance, and the pilot KAA branch live on the system. • Experienced project team and imp
Slide 32: Optimising financial health
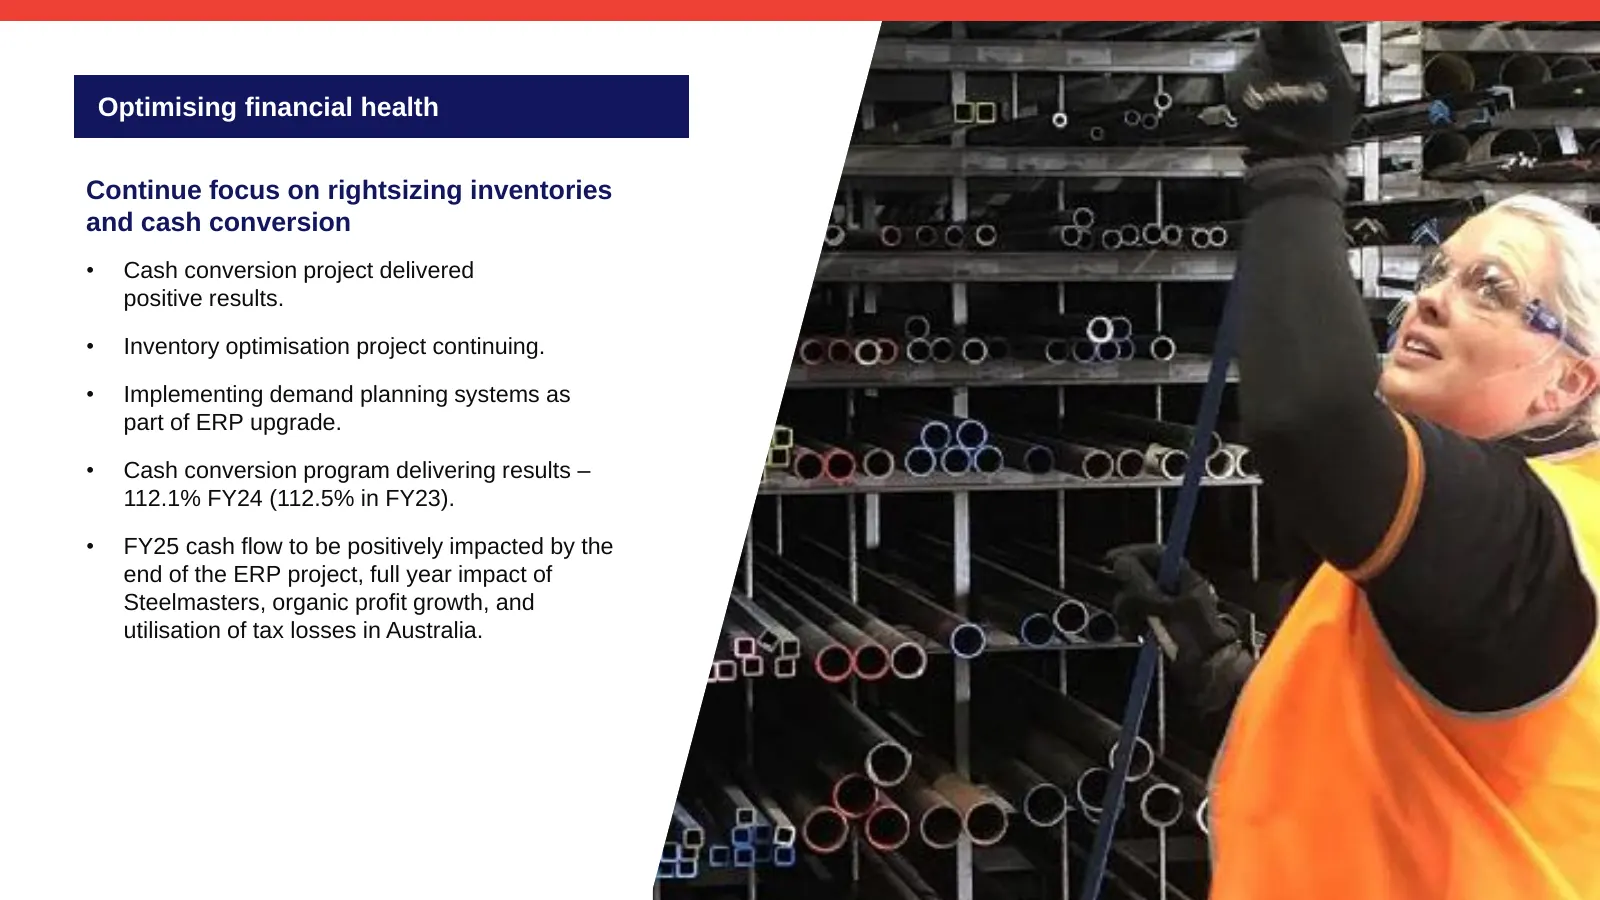
Optimising financial health Continue focus on rightsizing inventories and cash conversion • Cash conversion project delivered positive results. • Inventory optimisation project continuing. • Implementing demand planning systems as part of ERP upgrade. • Cash conversion program delivering results – 1
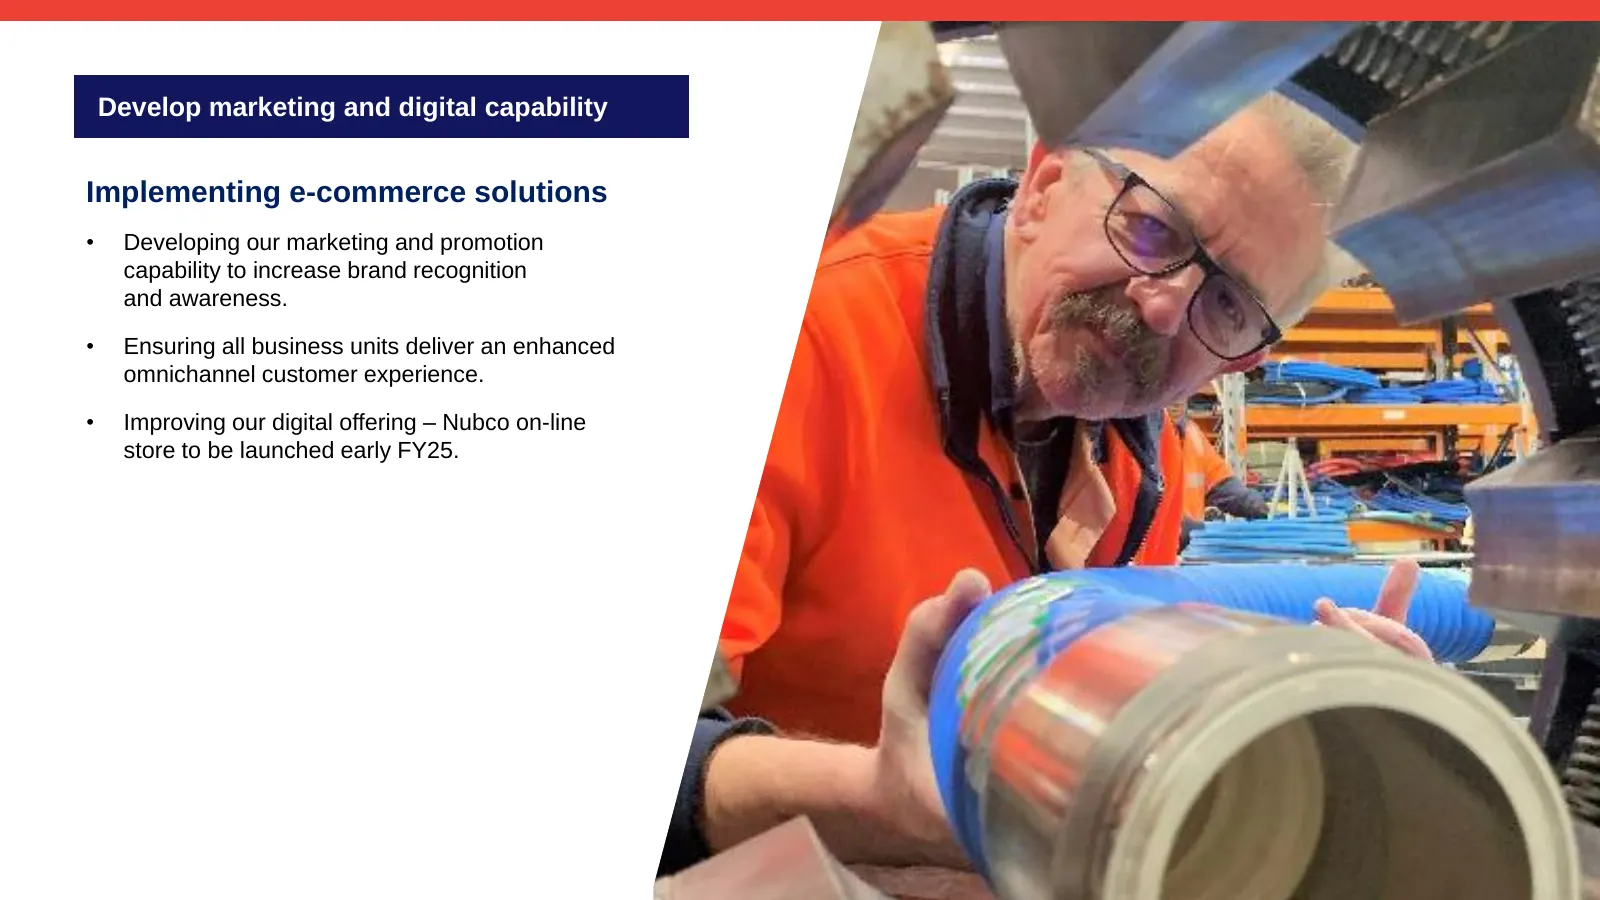
Slide 33: Implementing e-commerce solutions
Develop marketing and digital capability Implementing e-commerce solutions • Developing our marketing and promotion capability to increase brand recognition and awareness. • Ensuring all business units deliver an enhanced omnichannel customer experience. • Improving our digital offering – Nubco on-l
Slide 34: FY24 performance
FY24 performance
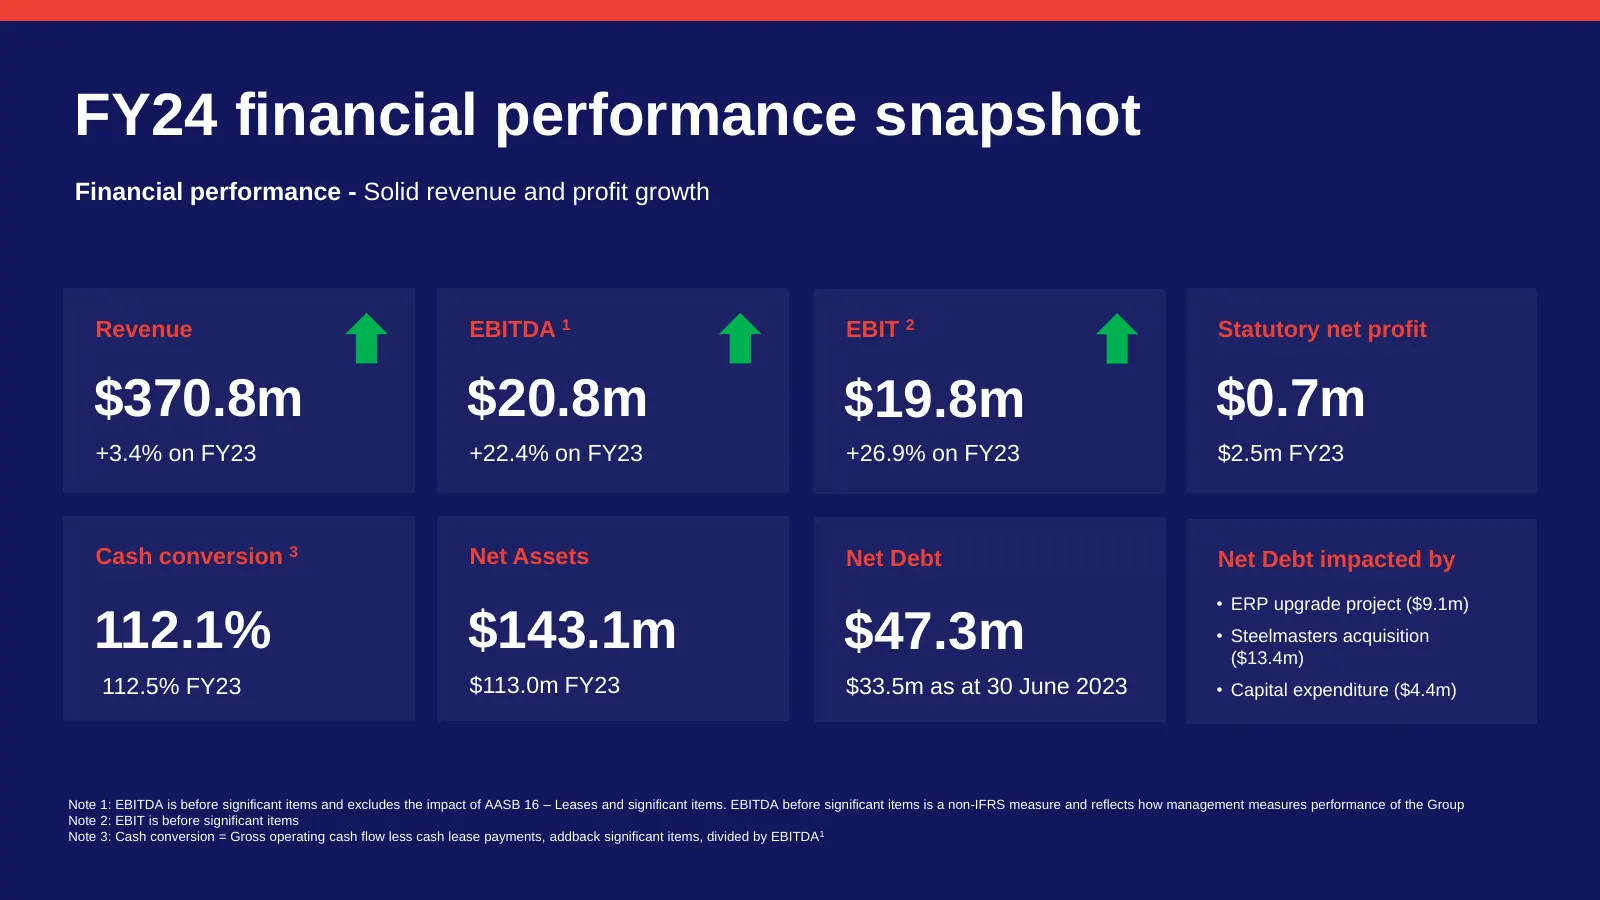
Slide 35: FY24 financial performance snapshot
FY24 financial performance snapshot Financial performance - Solid revenue and profit growth Revenue EBITDA 1 EBIT 2 Statutory net profit $370.8m $20.8m $19.8m $0.7m +3.4% on FY23 +22.4% on FY23 +26.9% on FY23 $2.5m FY23 Cash conversion 3 Net Assets Net Debt Net Debt impacted by • ERP upgrade project
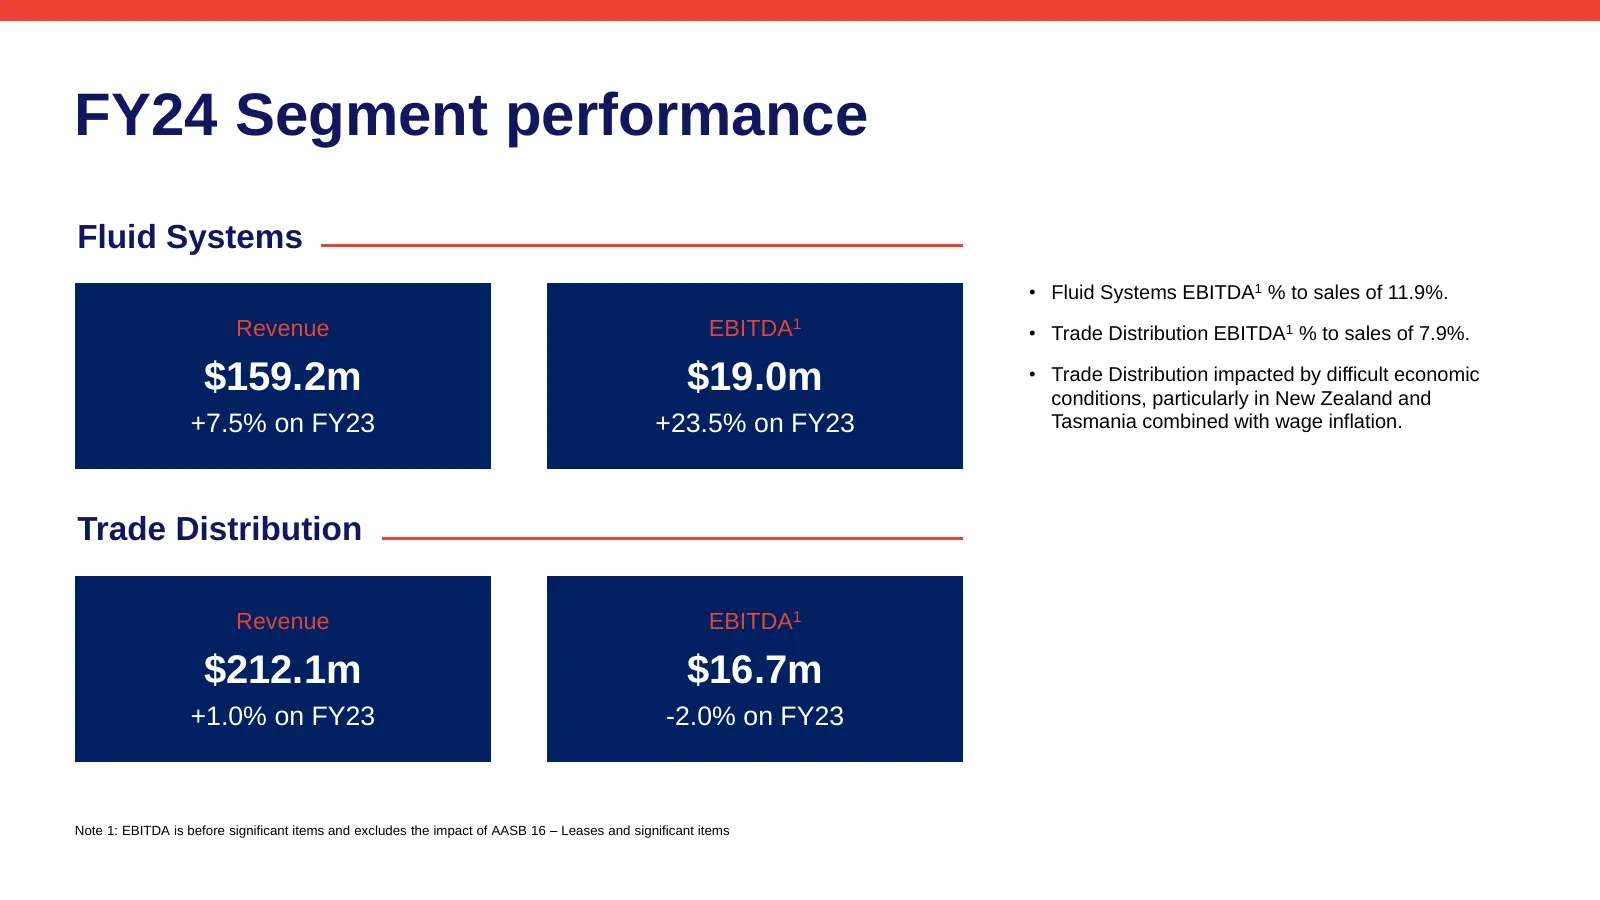
Slide 36: FY24 Segment performance
FY24 Segment performance Fluid Systems • Fluid Systems EBITDA1 % to sales of 11.9%. Revenue EBITDA1 • Trade Distribution EBITDA1 % to sales of 7.9%. $159.2m $19.0m • Trade Distribution impacted by difficult economic conditions, particularly in New Zealand and +7.5% on FY23 +23.5% on FY23 Tasmania co
Slide 37: Disclaimer
Authorised for release by the Disclaimer Board of Directors of Coventry Group Limited. Reliance on third party information Forward looking statements The information and views expressed in this presentation were prepared by Coventry Group This presentation may include forward-looking statements. Alt

Slide 38: Thank you
Thank you y a Coventry Group Ltd
Source: ASX announcement via 6ix News
More decks from Coventry Group Limited
 Shareholder Meeting (November 2026)11 slides · Nov 20, 2026
 FY2026 Earnings Presentation31 slides · Aug 31, 2026
 Investor Presentation (February 2026)14 slides · Feb 27, 2026
 Shareholder Meeting (November 2025)19 slides · Nov 21, 2025
 Investor Presentation (September 2025)16 slides · Sep 15, 2025
 FY2025 Earnings Presentation19 slides · September 2025