Chittenden — Investor Presentation (September 2002)
18 slides from Chittenden's investor presentation, Sep 19, 2002
Slide 1: Chittenden Corporation
Chiltan CORPORATION As of June 30, 2002 Chitin Sissons — EFLAGSHPBK Naw AKT
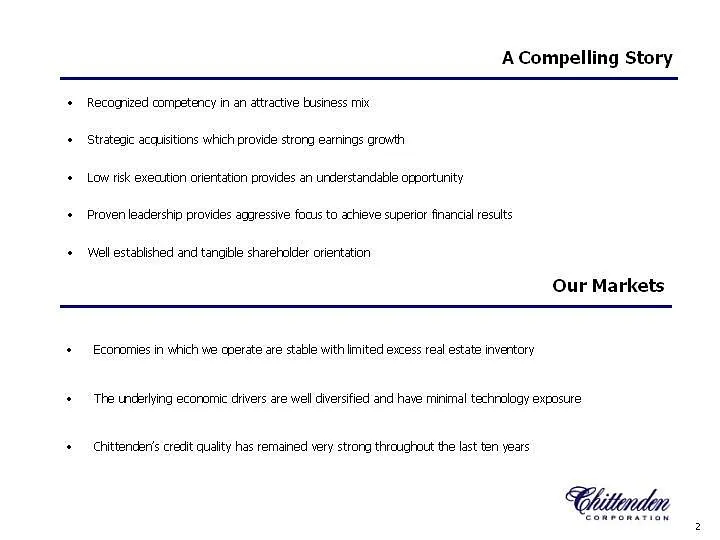
Slide 2: A Compelling Story
ACompelling Story + Recognized competency in an attractive business mi + Strategic acquisitions which provide strong earings growth + Low risk execution orientation provides an understandable opportunity + Proven leadership provides aggressive focus to achieve superior financial resuits ‘+ Well esta
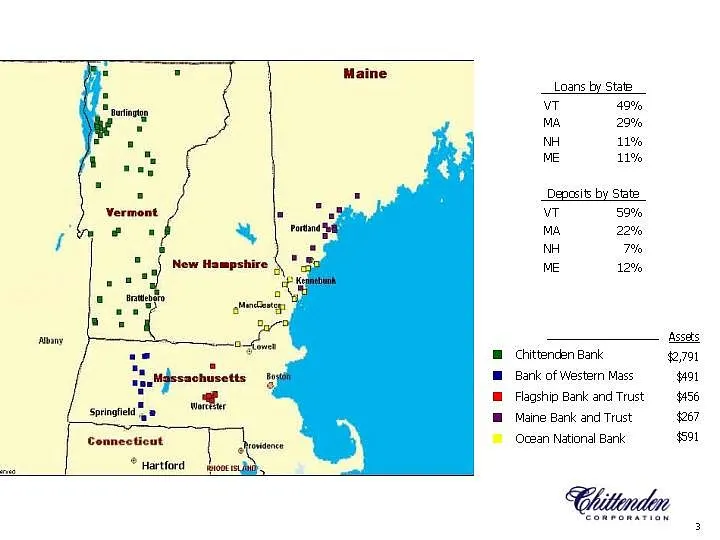
Slide 3: Loans and Deposits by State
Loans by State vr 49% MA 25% NH 11% ME 11% Deposits by State VT 59% ma, 22% NH T% ME 12% —__ Assas Chittenden Bank gr Bank of Western Mass $91 Flagship Bank and Trust 4456 Maine Bank and Trust esr (Ocean National Bank $s
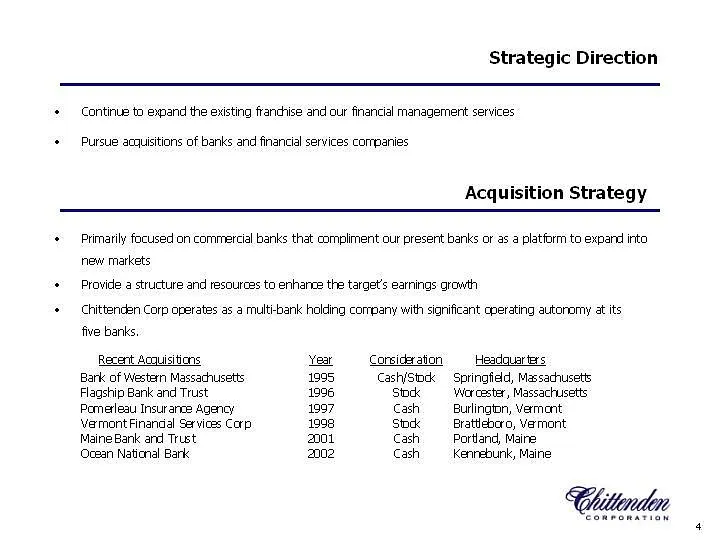
Slide 4: Strategic Direction
Strategic Direction + Continue to expand the existing franchise and our financial management services ‘+ Pursue acquisitions of banks and financial services corrpanies Acquisit ion Strategy + Primarily focused on commercial banks that compliment our present banks or as a platform to expand into new
Slide 5: Business Approach
Business Approach Deep relationships with worthwhile customers Focus on small and mid-sized businesses Maintain conservative underwriting standards and discipline Offer a complete range of banking products and services Geographically diverse branch franchise with both a consumer and stall business f
Slide 6: Cash Management and Fee Businesses
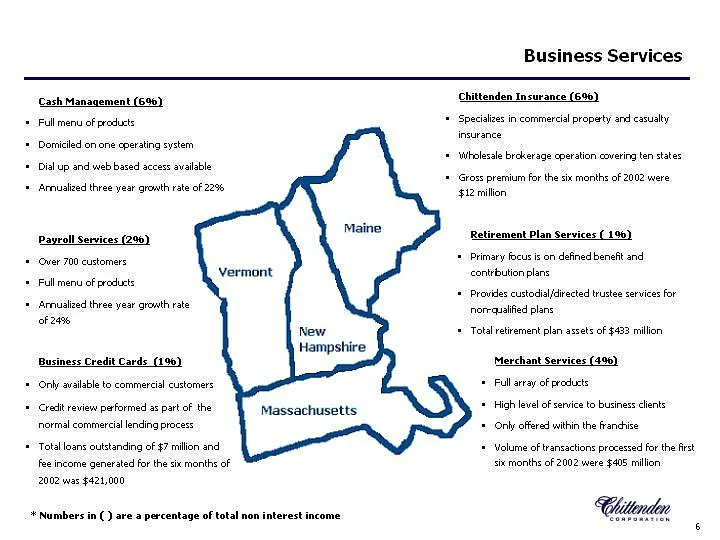
Cash Management (696) Full menu of products, Domiclled on one eperating system Dialup and web based access avaiable rousled three year growth rate of 256 Payroll Services (200) Over 700 customers Full menu of poduts Annualized three year growth rate oF 24% New Hampshire Business Credit Cards (19) ‘O
Slide 7: Asset Management Services
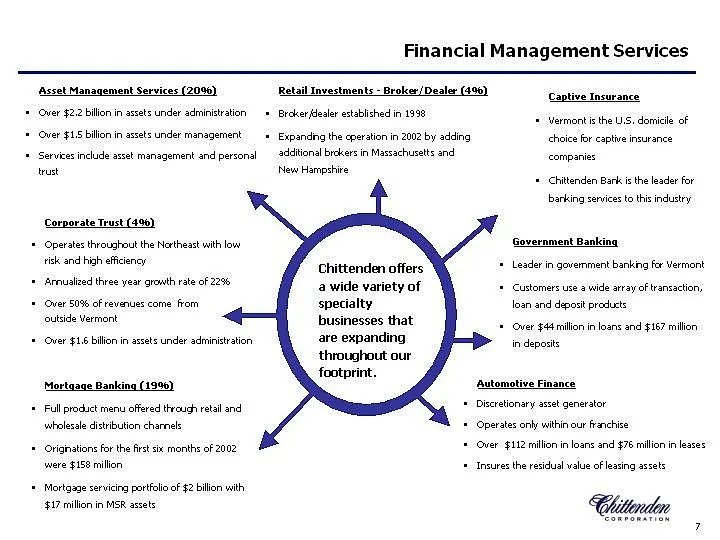
‘Asset Management Services (2096) Financial Management Services Retail Investments - Broker/Dealer (496) Over $22 billon in assts under administration + Over $15 bilion in sree under management 1 Services include asset management and personal trust Corporate Trust (496) + Operates throughout the Ner
Slide 8: Performance
| Performance Consistent Supe! Strong net interest margin Low cost stable sources of funding Strong fee based revenues in targeted businesses Efficient cost structure Strong capital Conservative reserves, and excellent credit quality
Slide 9: Strong Consistent Net Interest Margin
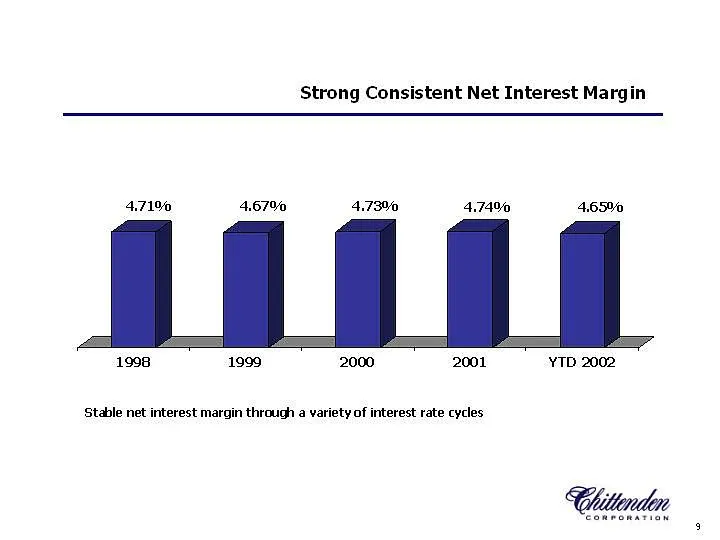
Strong Consistent Net Interest Margin 4.719% 4.67% 4.73% 4.74% 465% 1998 1999 2000 2001 YTD 2002 Stable net interest margin through a variety of interest rate cycles
Slide 10: A Diversified Loan Portfolio
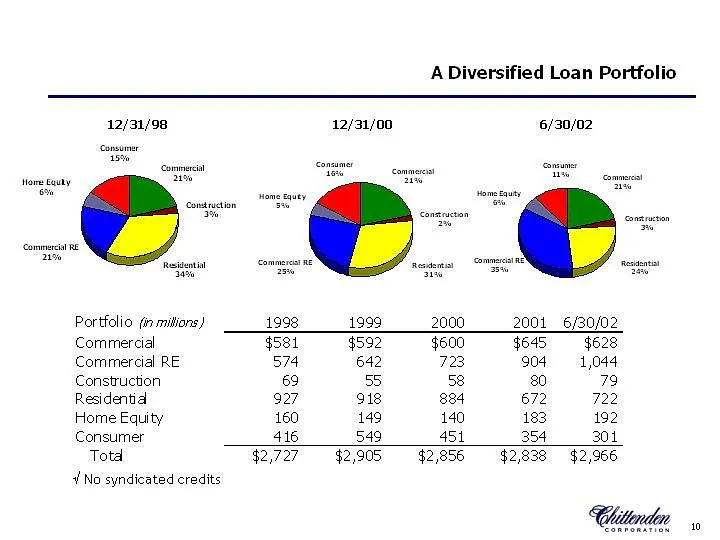
A Diversified Loan Portfolio 12/31/98 12/31/00 6/30/02 Portfolio. tin mitions) 1998 1999 2000 2001 _ 6/30/02 Commercial $581 $592 $600 $645 $628 Commercial RE 574 642 723 904 1,044 Construction 69 55 58 80 79 Residentia 927 918 884 672 722 Home Equity 160 149 140 188 192 Consumer 416 549 451 354 304
Slide 11: Strong Core Funding
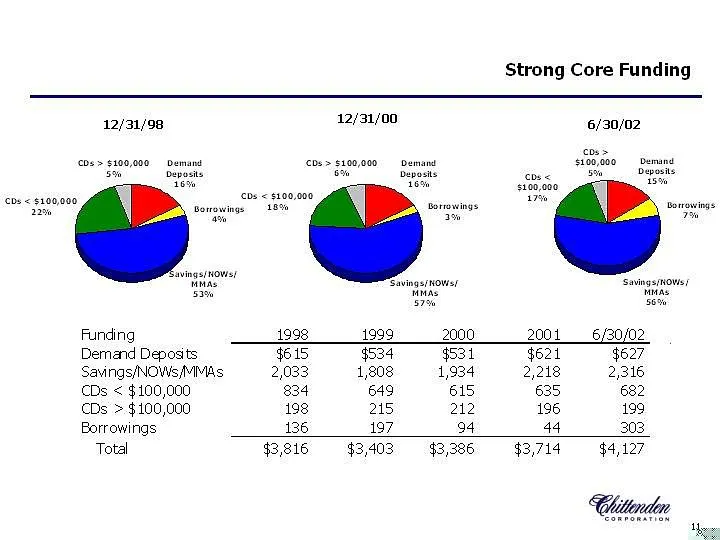
12/31/98 cs > $100,000 cbs < $100,000 Funding Demand Deposits Savings/NOWs/MMAs Ds < $100,000 CDs > $100,000 Borrowings Total Strong Core Funding 12/31/00 6/30/02 c0s> $100,000 demand 100/000 Denana rod sty roo eve « $100,000 7 Pings NOW} Savings/NOWs/ 1998 1999 2000 2001 6/30/02 $615 $534 $o3t $621
Slide 12: A Strong Diversified Stream of Noninterest Income
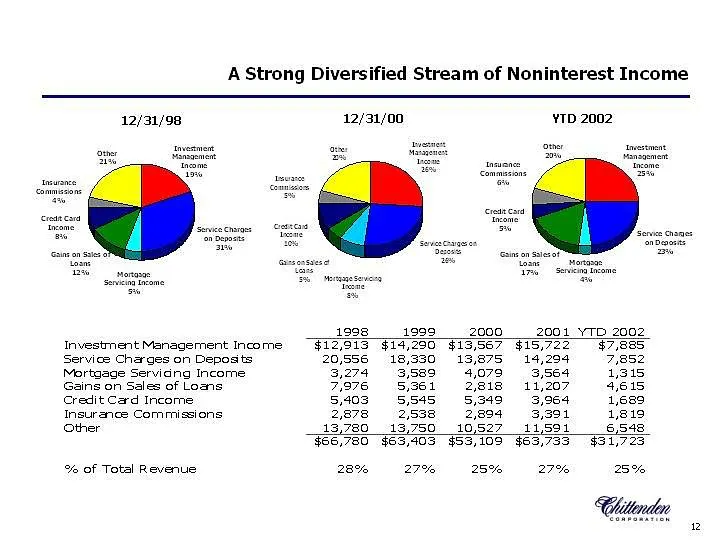
A Strong Diversified Stream of Noninterest Income 12/31/98 12/31/00 YTD 2002 1998 1999 2000-2001 YTD 2002 Investment Management Income “$12,913 $14,290 §13,567 $15,722 $7,885 Service Charges on Deposits 20,556 18,330 13,875 14,294 7,852 Mortgage Servidng Income 3,274 3,589 4,079 3,564 1,315 Gains on
Slide 13: Financial Summary
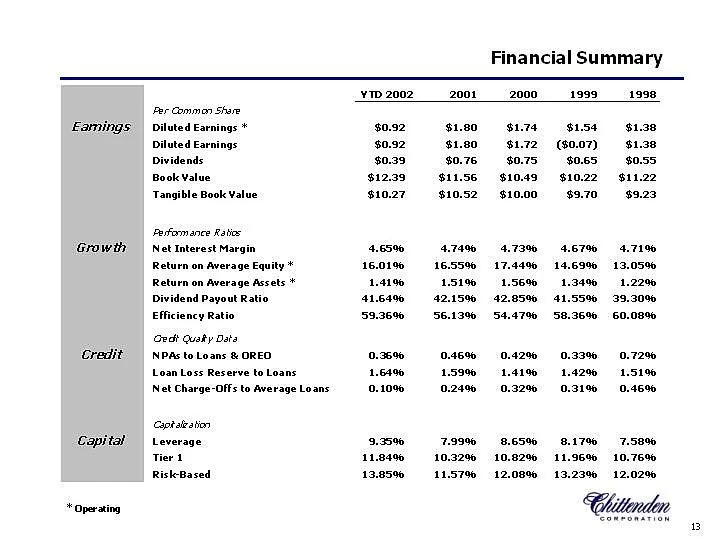
Financial Summary yi 200220012000 1999198 Ber Common Shore Eamings viluted Earnings * $092 $1.80 81.74 $154 $1.38 Diluted Earnings $0.92 $1.80 $1.72 (90.07) $1.8 Dividends $039 $0.76 «80.75 $0.65 $0.55 Book Value $1299 $11.56 $10.49 $10.22 $11.22 Tangible Book Value $1027 $10.52 $10.00 $9.70 $9.23 B
Slide 14: Return on Average Equity
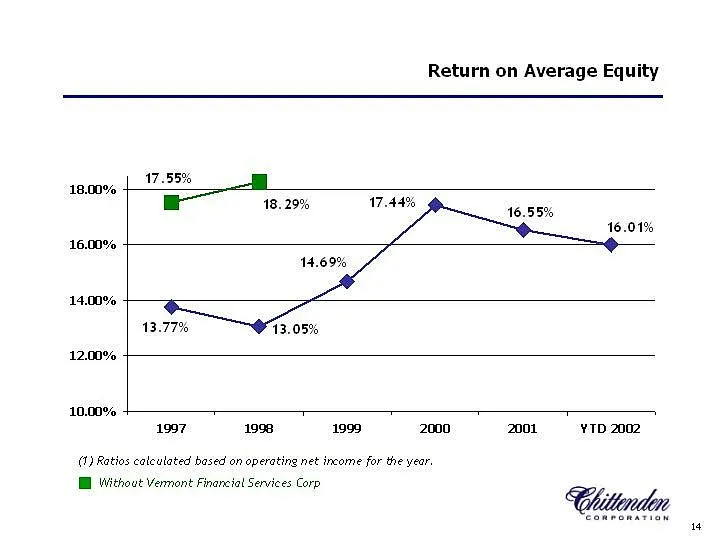
18.00% 16.00% 14.00% 12.00% 10.00% Return on Average Equity 1997 1998 1999 2000 2001 YTD 2002 (1) Ratios calculated based on operating net income for the year, I Without Vermont Financial Services Corp 1%
Slide 15: Return on Average Assets
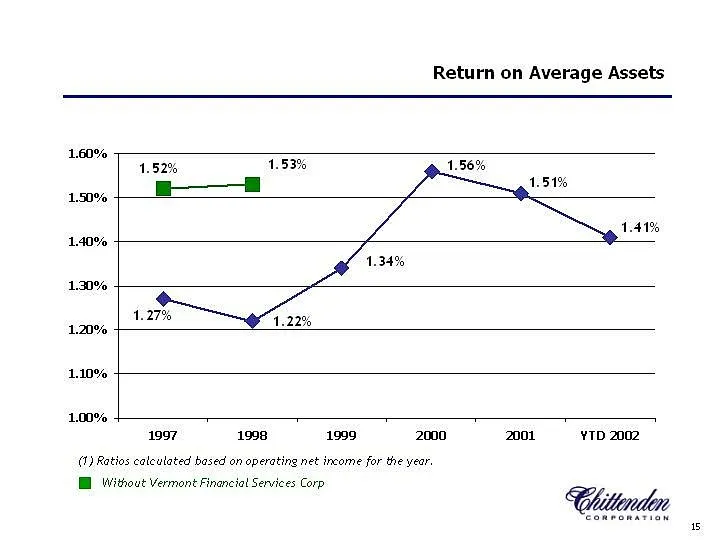
1.60% 1.50% 1.40% 1.30% 1.20% 1.10% 1.00% Return on Average Assets 1.52% 1.53% 1.41% 1.34% 1.27% 1.22% 1997 i998 1999 2000 2001 ¥TD 2002 (1) Ratios calculated based on operating net income for the year, Without Vermont Financial Services Corp 15
Slide 16: High Performance Bank Peer Group
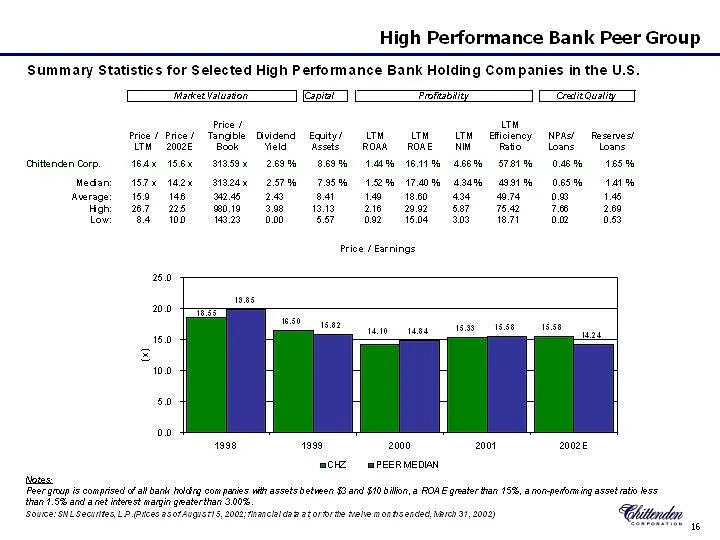
High Performance Bank Peer Group Summary Statistics for Selected High Performance Bank Holding Companies in the U.S. c Tara aor ] ee [ Foray ] erent Price / un Price / Prices Tangble Cuidend Eqity/ TM _LTM_ LTH ficiency NPAs! Reserves! Ur 2002 "Book eld. Aged ROMA RONEN Fata.” Loans Loans Chitenden
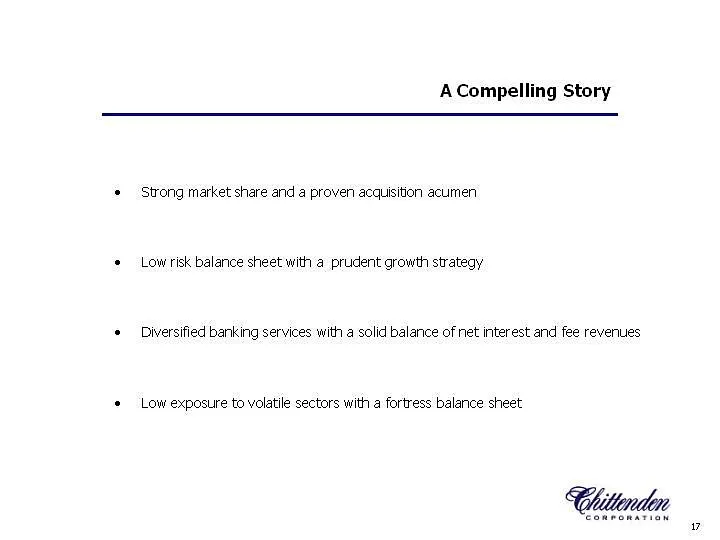
Slide 17: Strong market share and a proven acquisition acumen
Strong market share and a proven acquisition acumen Low risk balance sheet with a prudent growth strategy Diversified banking services with a solid balance of net interest and fee revenues Low exposure to volatile sectors with a fortress balance sheet v
Slide 18: Chittenden Corporation
i CORPORATION Visit our website for a wide range of products, latest financial reports and many other interactive services: www.chittendencorp.com This presentation contains “forwarclecking statements” which may describe future plans and strategic iniative, These forward locking statements are based
Source: SEC EDGAR · 8-K filed Sep 19, 2002
More decks from Chittenden Corp
 Investor Presentation (September 2007)38 slides · Sep 7, 2007
 Merger or Acquisition (June 2007)27 slides · Jun 27, 2007
 Chittenden — Merger or Acquisition (June 2007)25 slides · Jun 27, 2007
 Merger or Acquisition (June 2007)9 slides · Jun 5, 2007
 Investor Presentation (May 2007)36 slides · May 14, 2007
 Investor Presentation (February 2007)37 slides · Feb 16, 2007