Chittenden — Investor Presentation (May 2003)
17 slides from Chittenden's investor presentation, May 9, 2003
Slide 1: Our Case for Excellence Over the Long Term Is Anything But Brief
Exhibit 99.1 [PHOTO] [LOGO] Chittenden OUR CASE FOR EXCELLENCE OVER THE LONG TERM IS ANYTHING Corporation BUT BRIEF. As of March 31, 2003 [LOGO] Chittenden Corporation 2002 ANNUAL REPORT
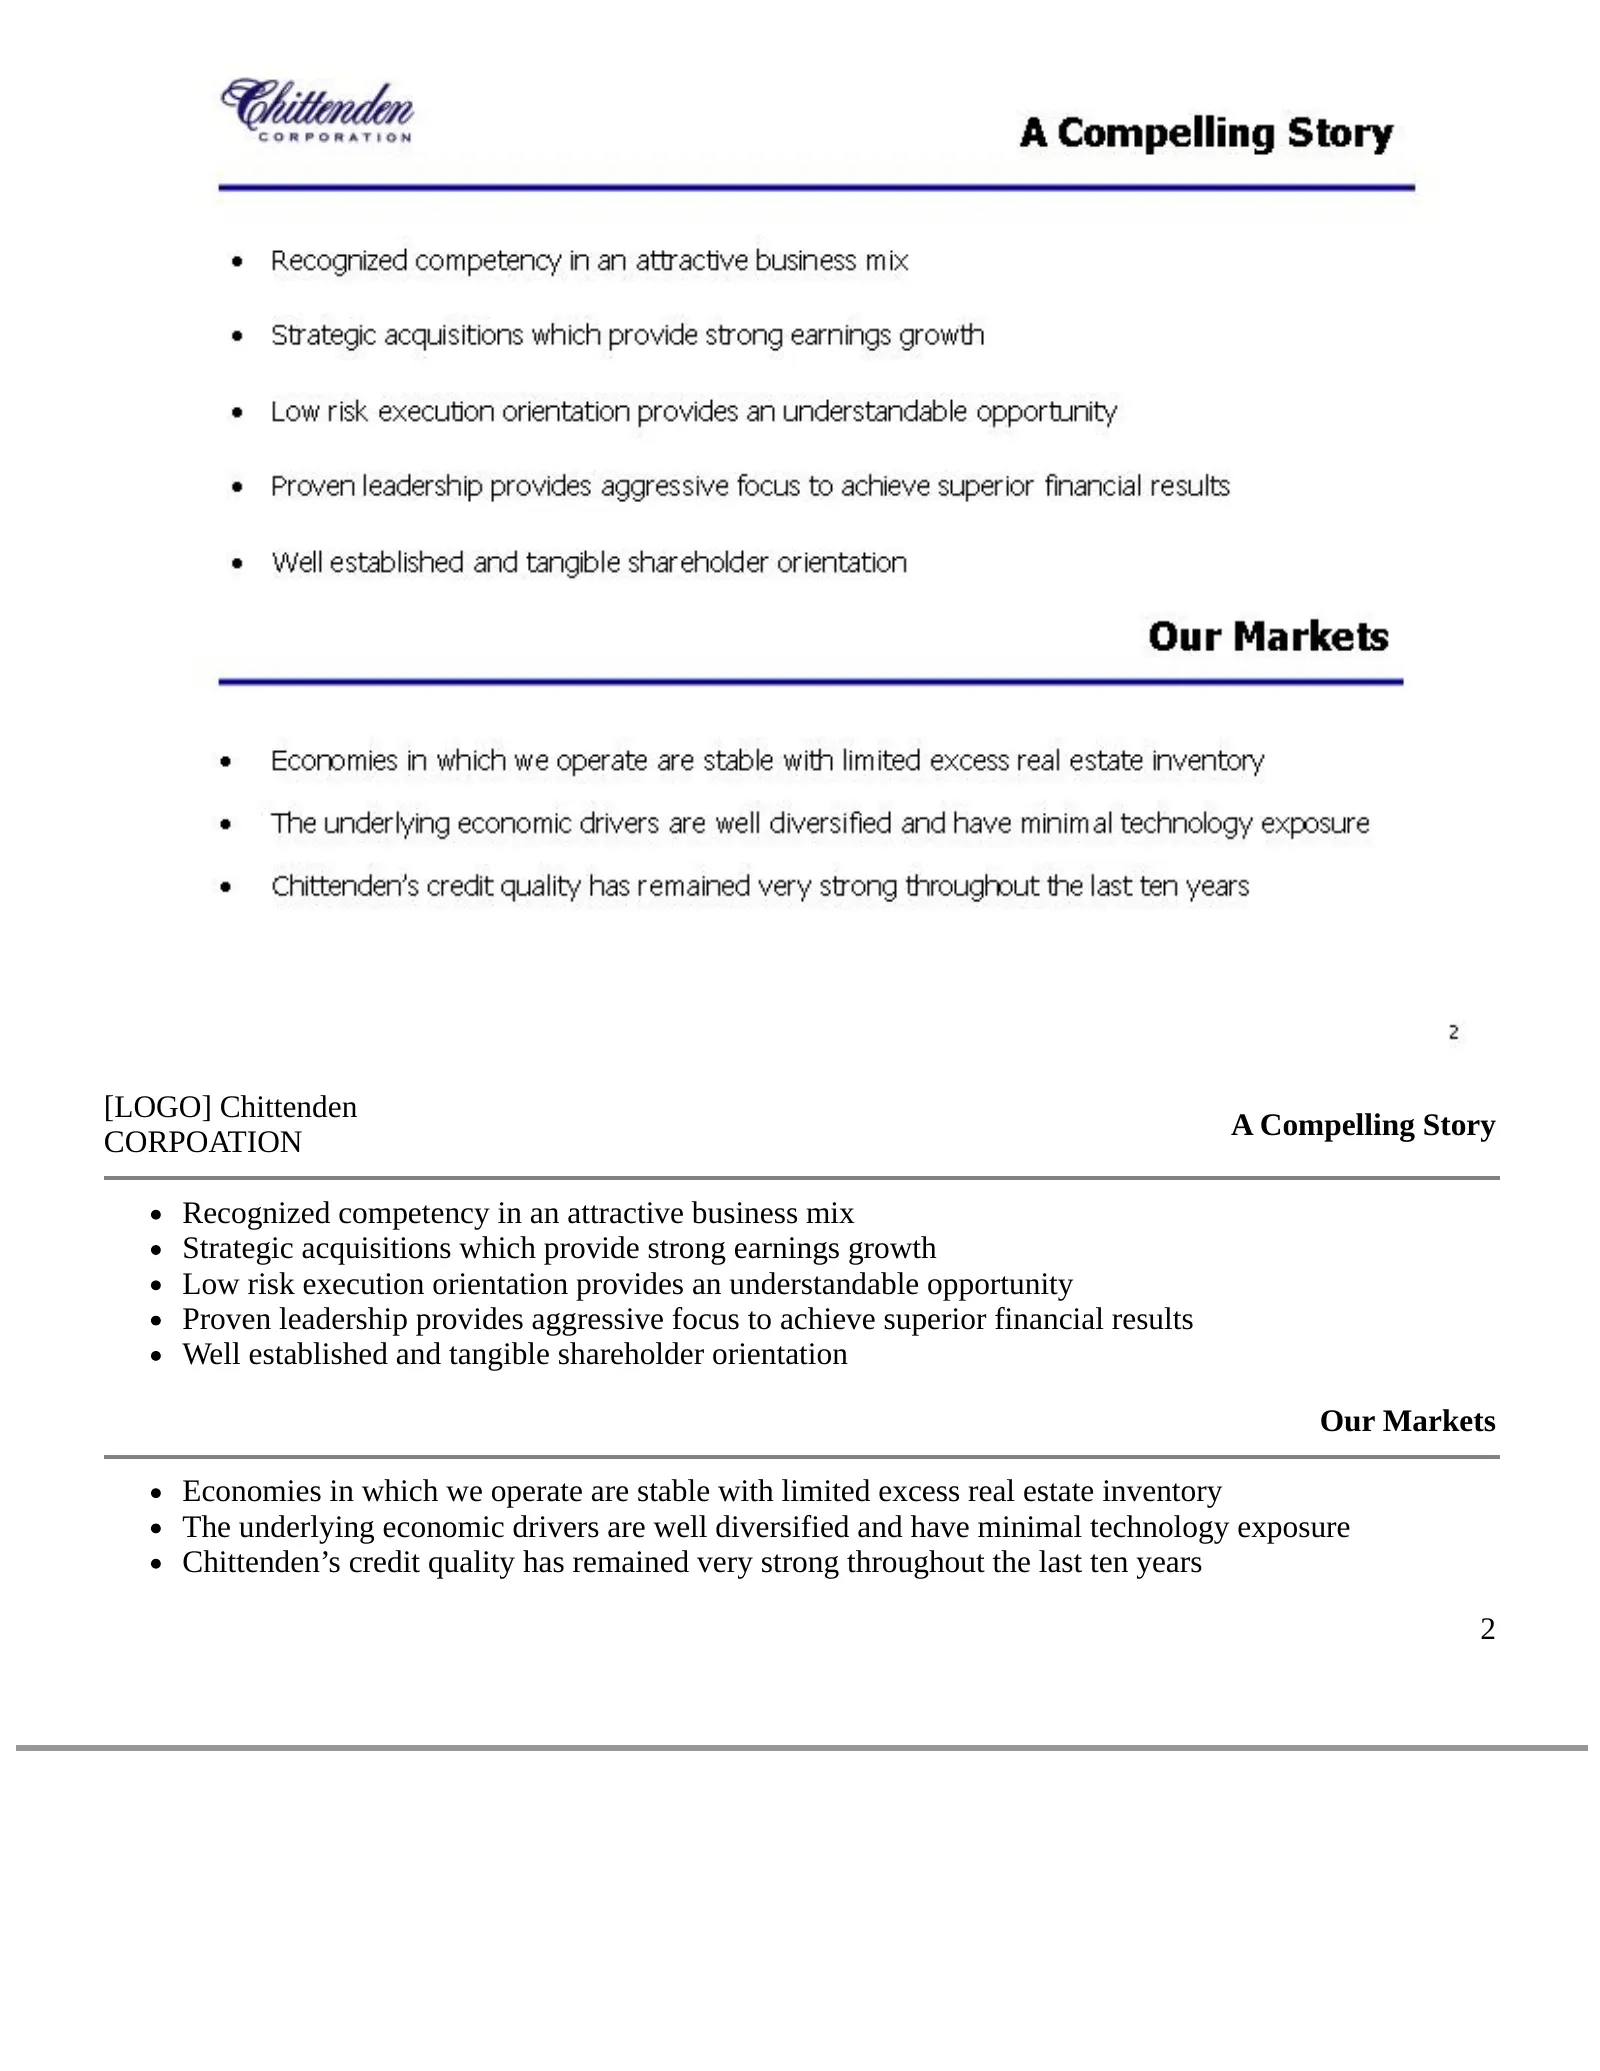
Slide 2: A Compelling Story
[LOGO] Chittenden A Compelling Story CORPOATION Recognized competency in an attractive business mix Strategic acquisitions which provide strong earnings growth Low risk execution orientation provides an understandable opportunity Proven leadership provides aggressive focus to achieve superior financ
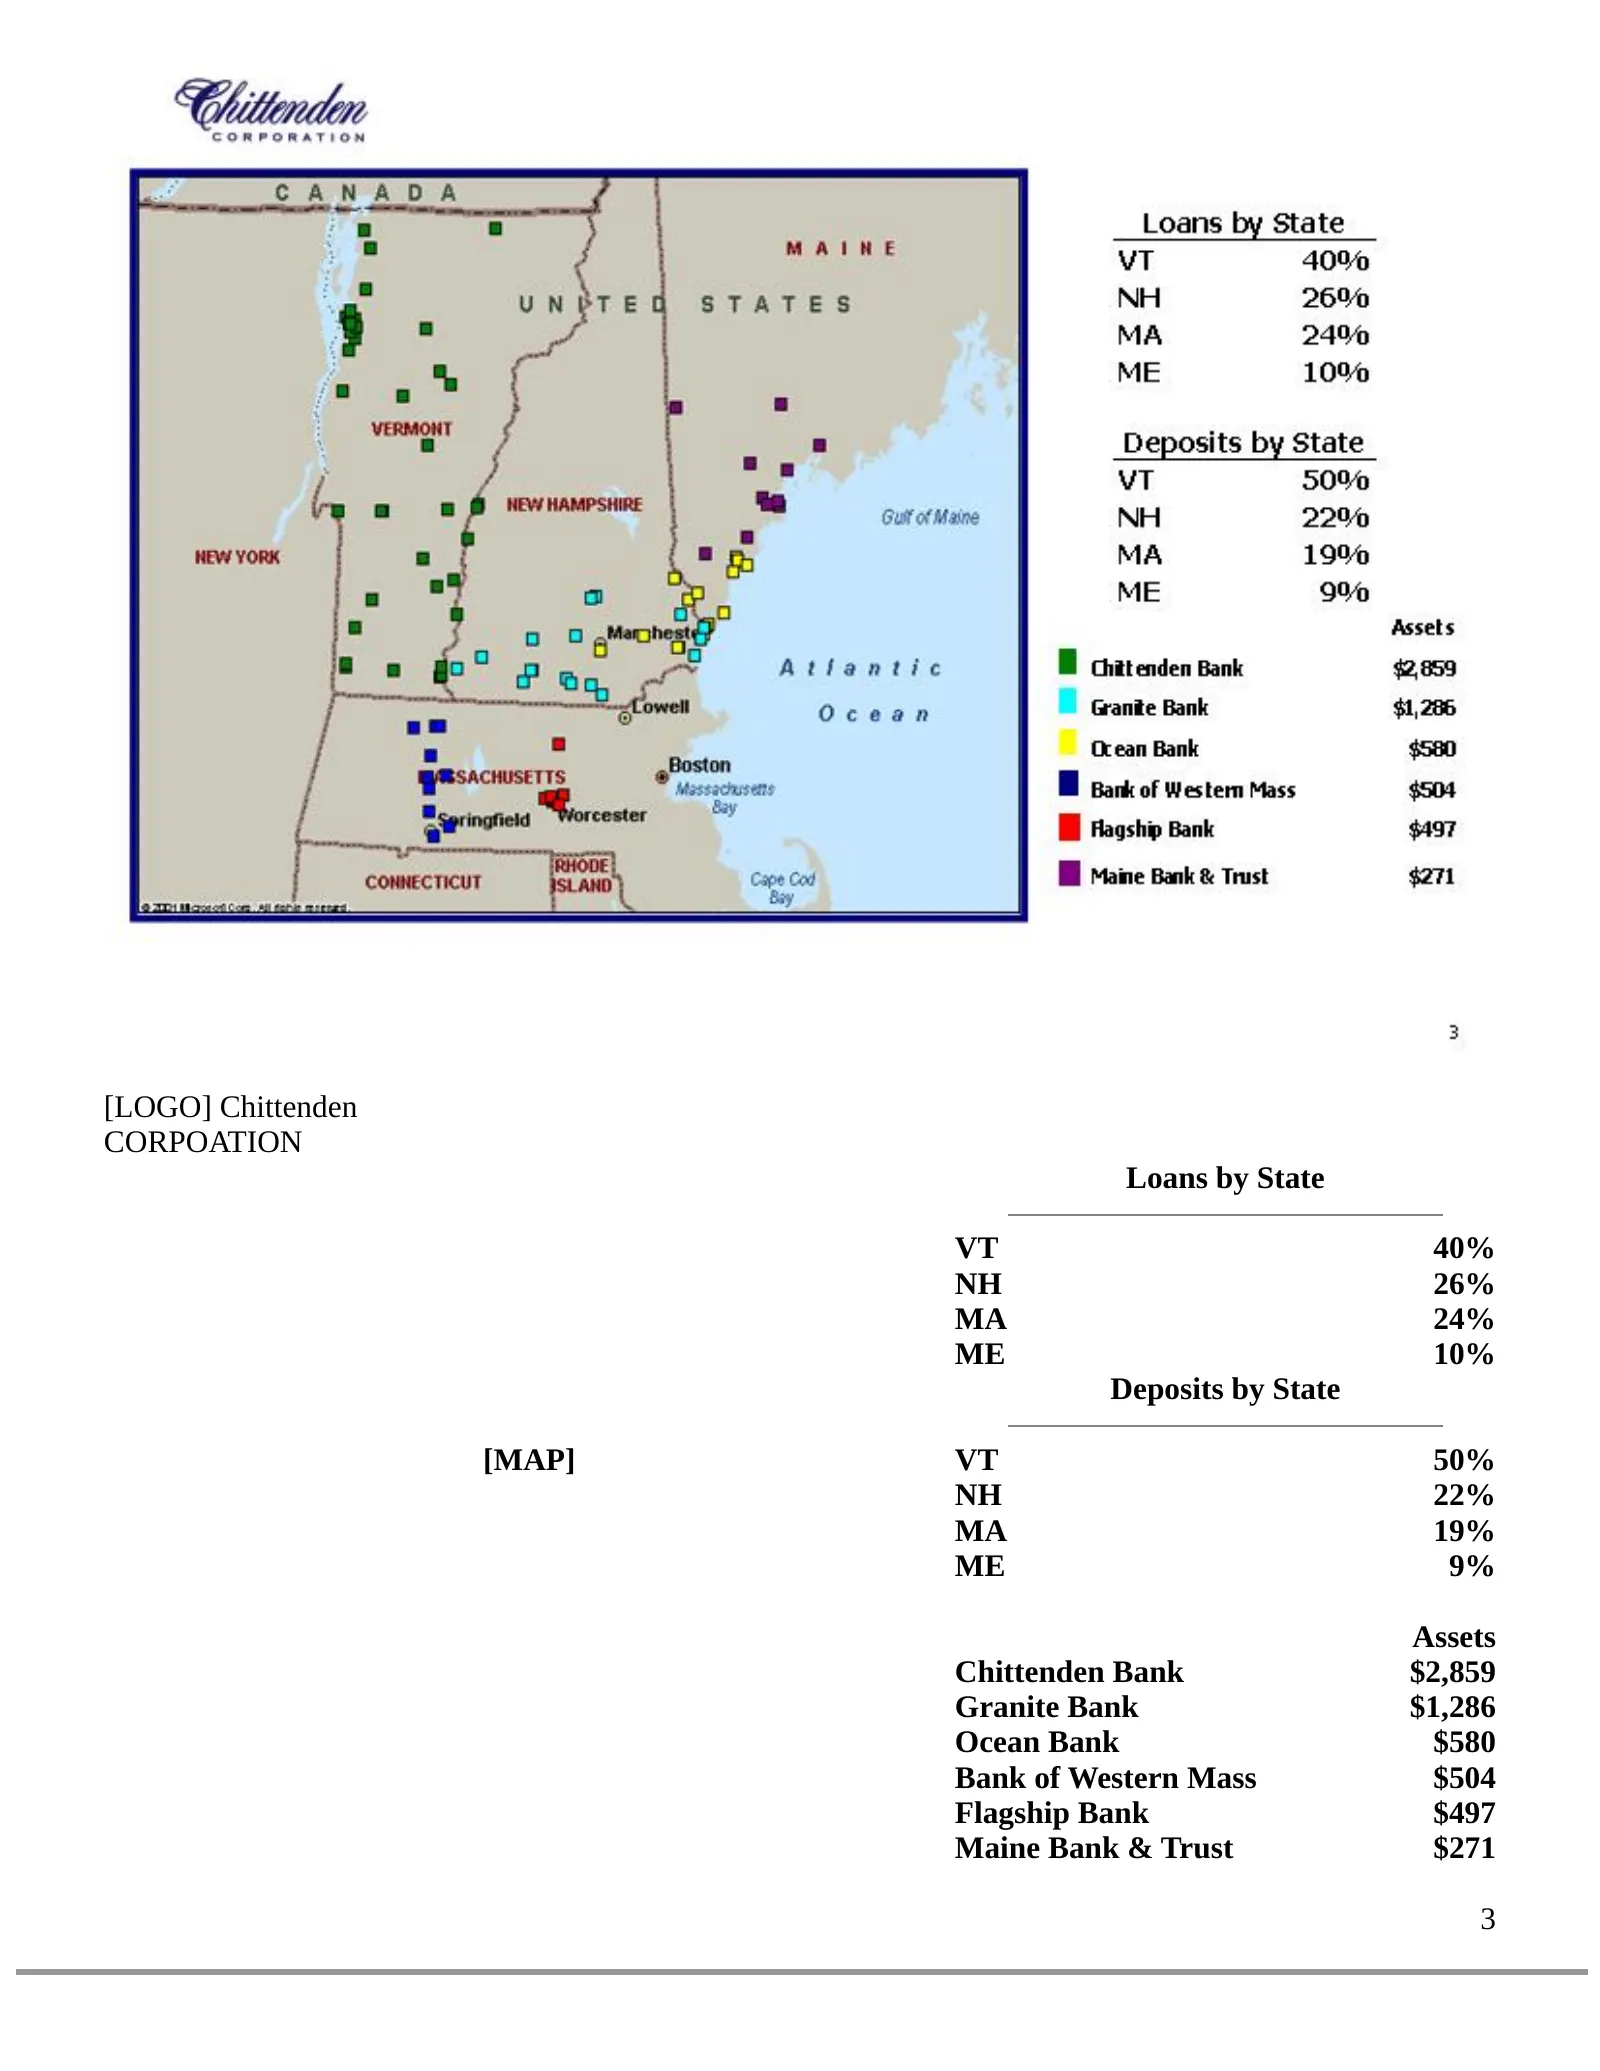
Slide 3: Loans and Deposits by State
[LOGO] Chittenden CORPOATION Loans by State VT 40% NH 26% MA 24% ME 10% Deposits by State [MAP] VT 50% NH 22% MA 19% ME 9% Assets Chittenden Bank $2,859 Granite Bank $1,286 Ocean Bank $580 Bank of Western Mass $504 Flagship Bank $497 Maine Bank & Trust $271 3
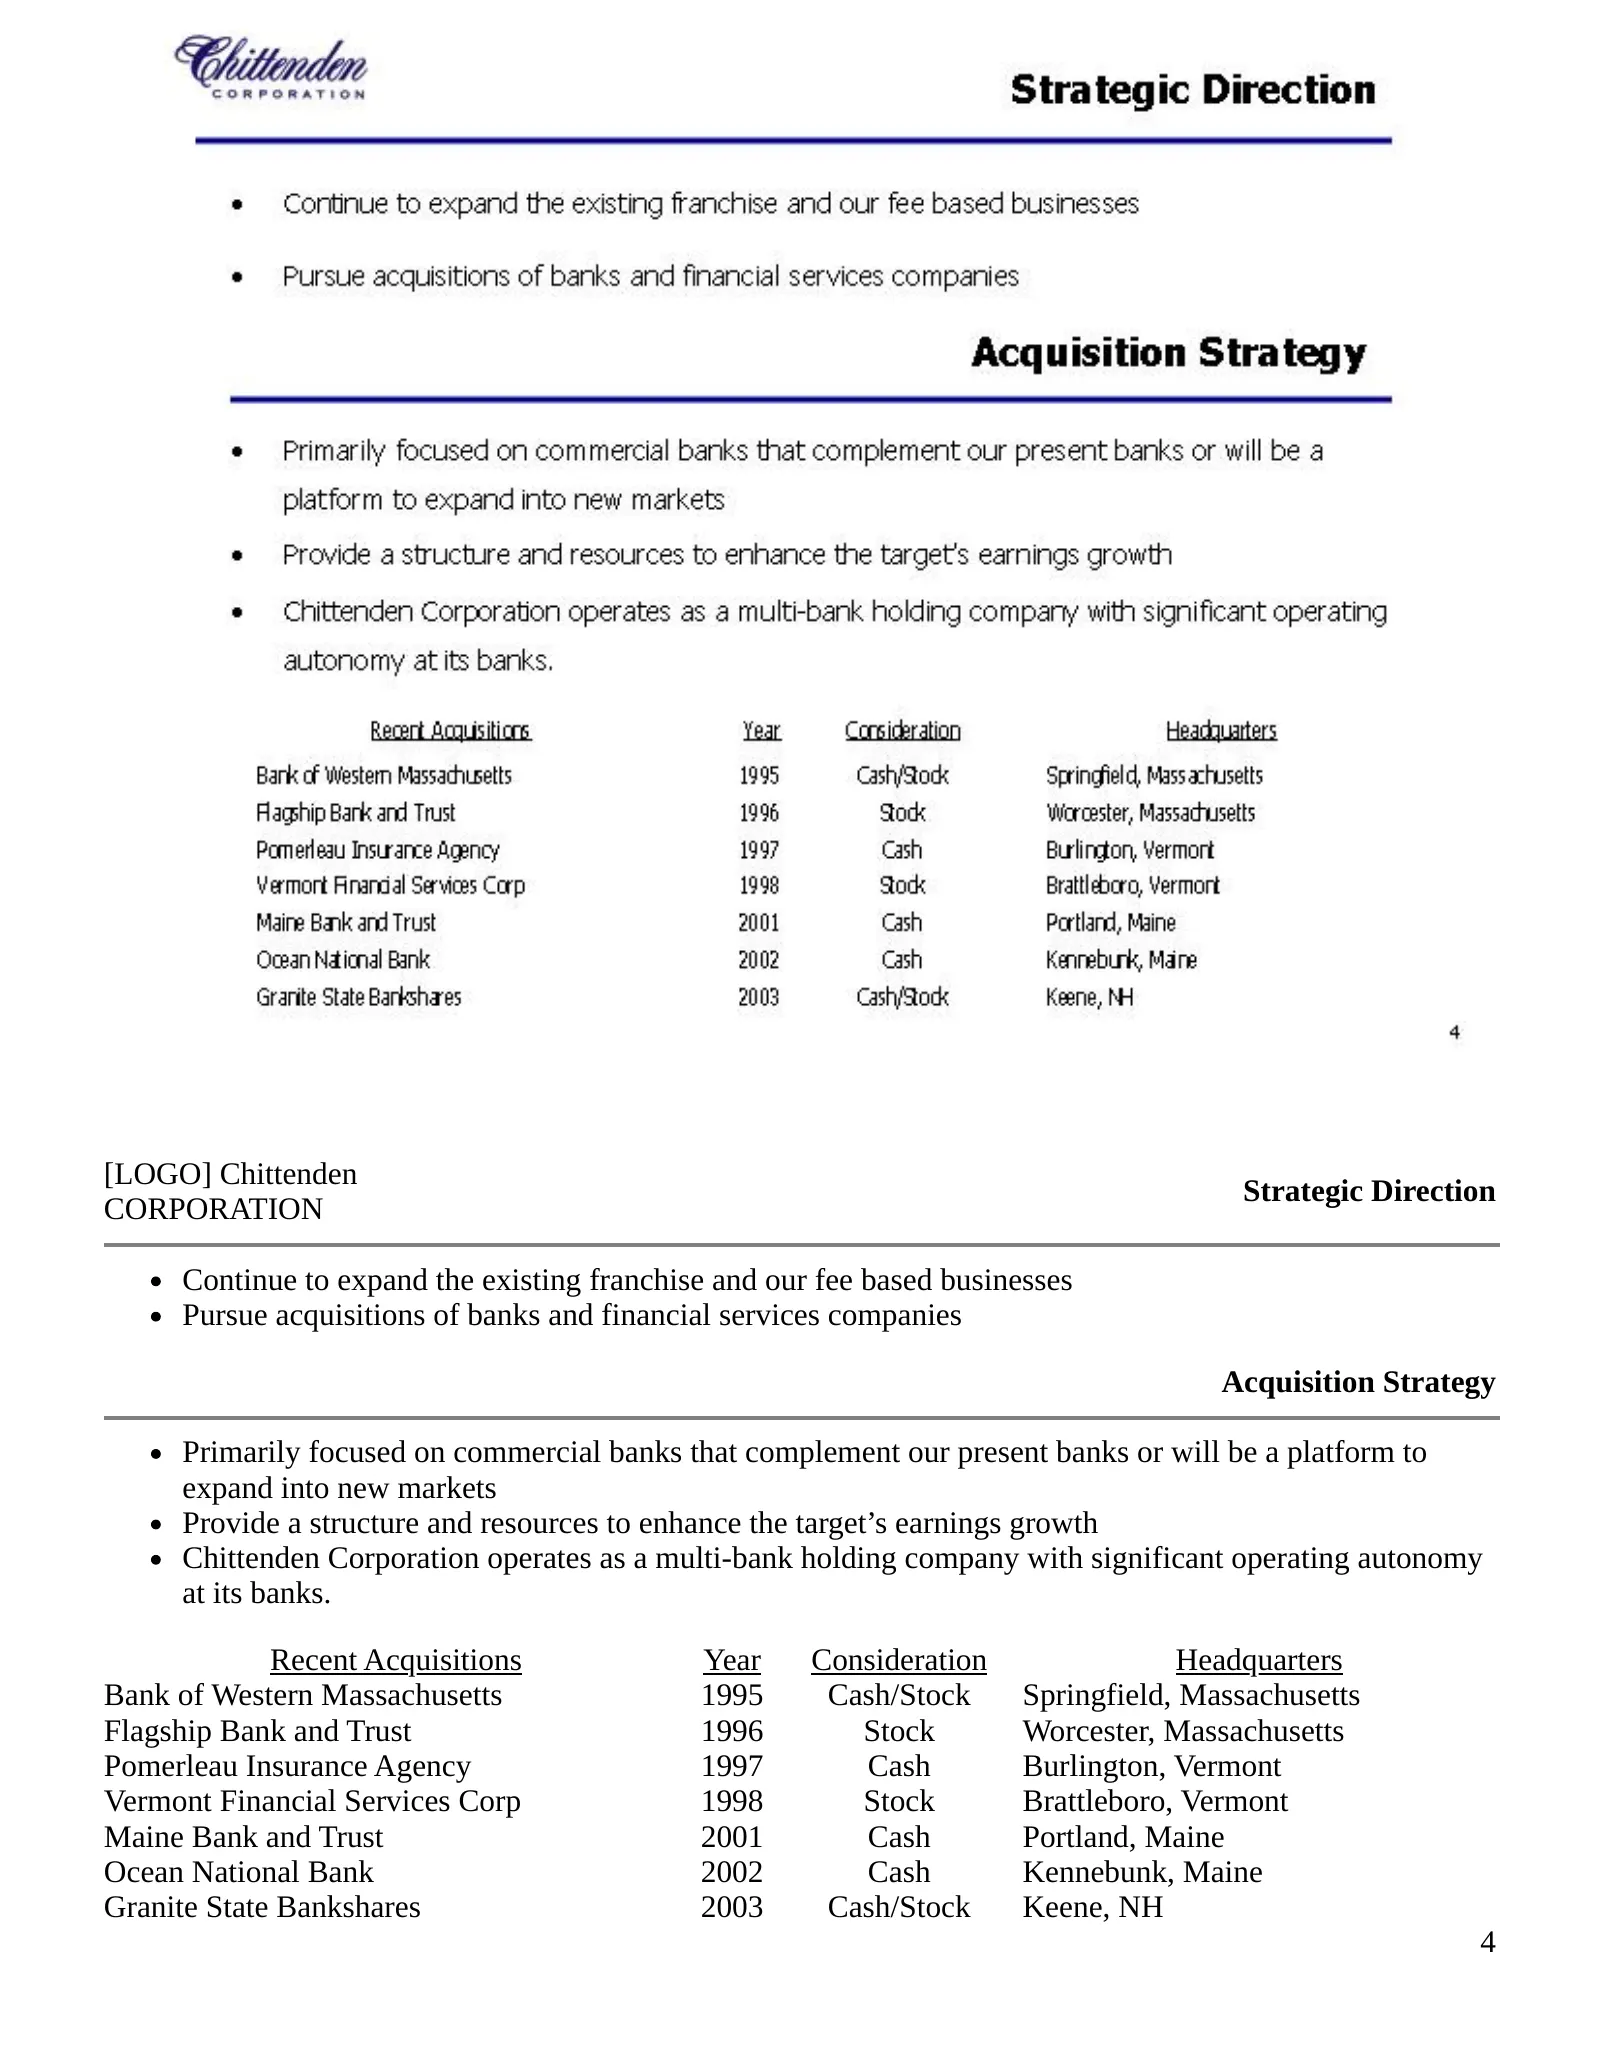
Slide 4: Strategic Direction
[LOGO] Chittenden Strategic Direction CORPORATION Continue to expand the existing franchise and our fee based businesses Pursue acquisitions of banks and financial services companies Acquisition Strategy Primarily focused on commercial banks that complement our present banks or will be a platform to
Slide 5: Business Approach
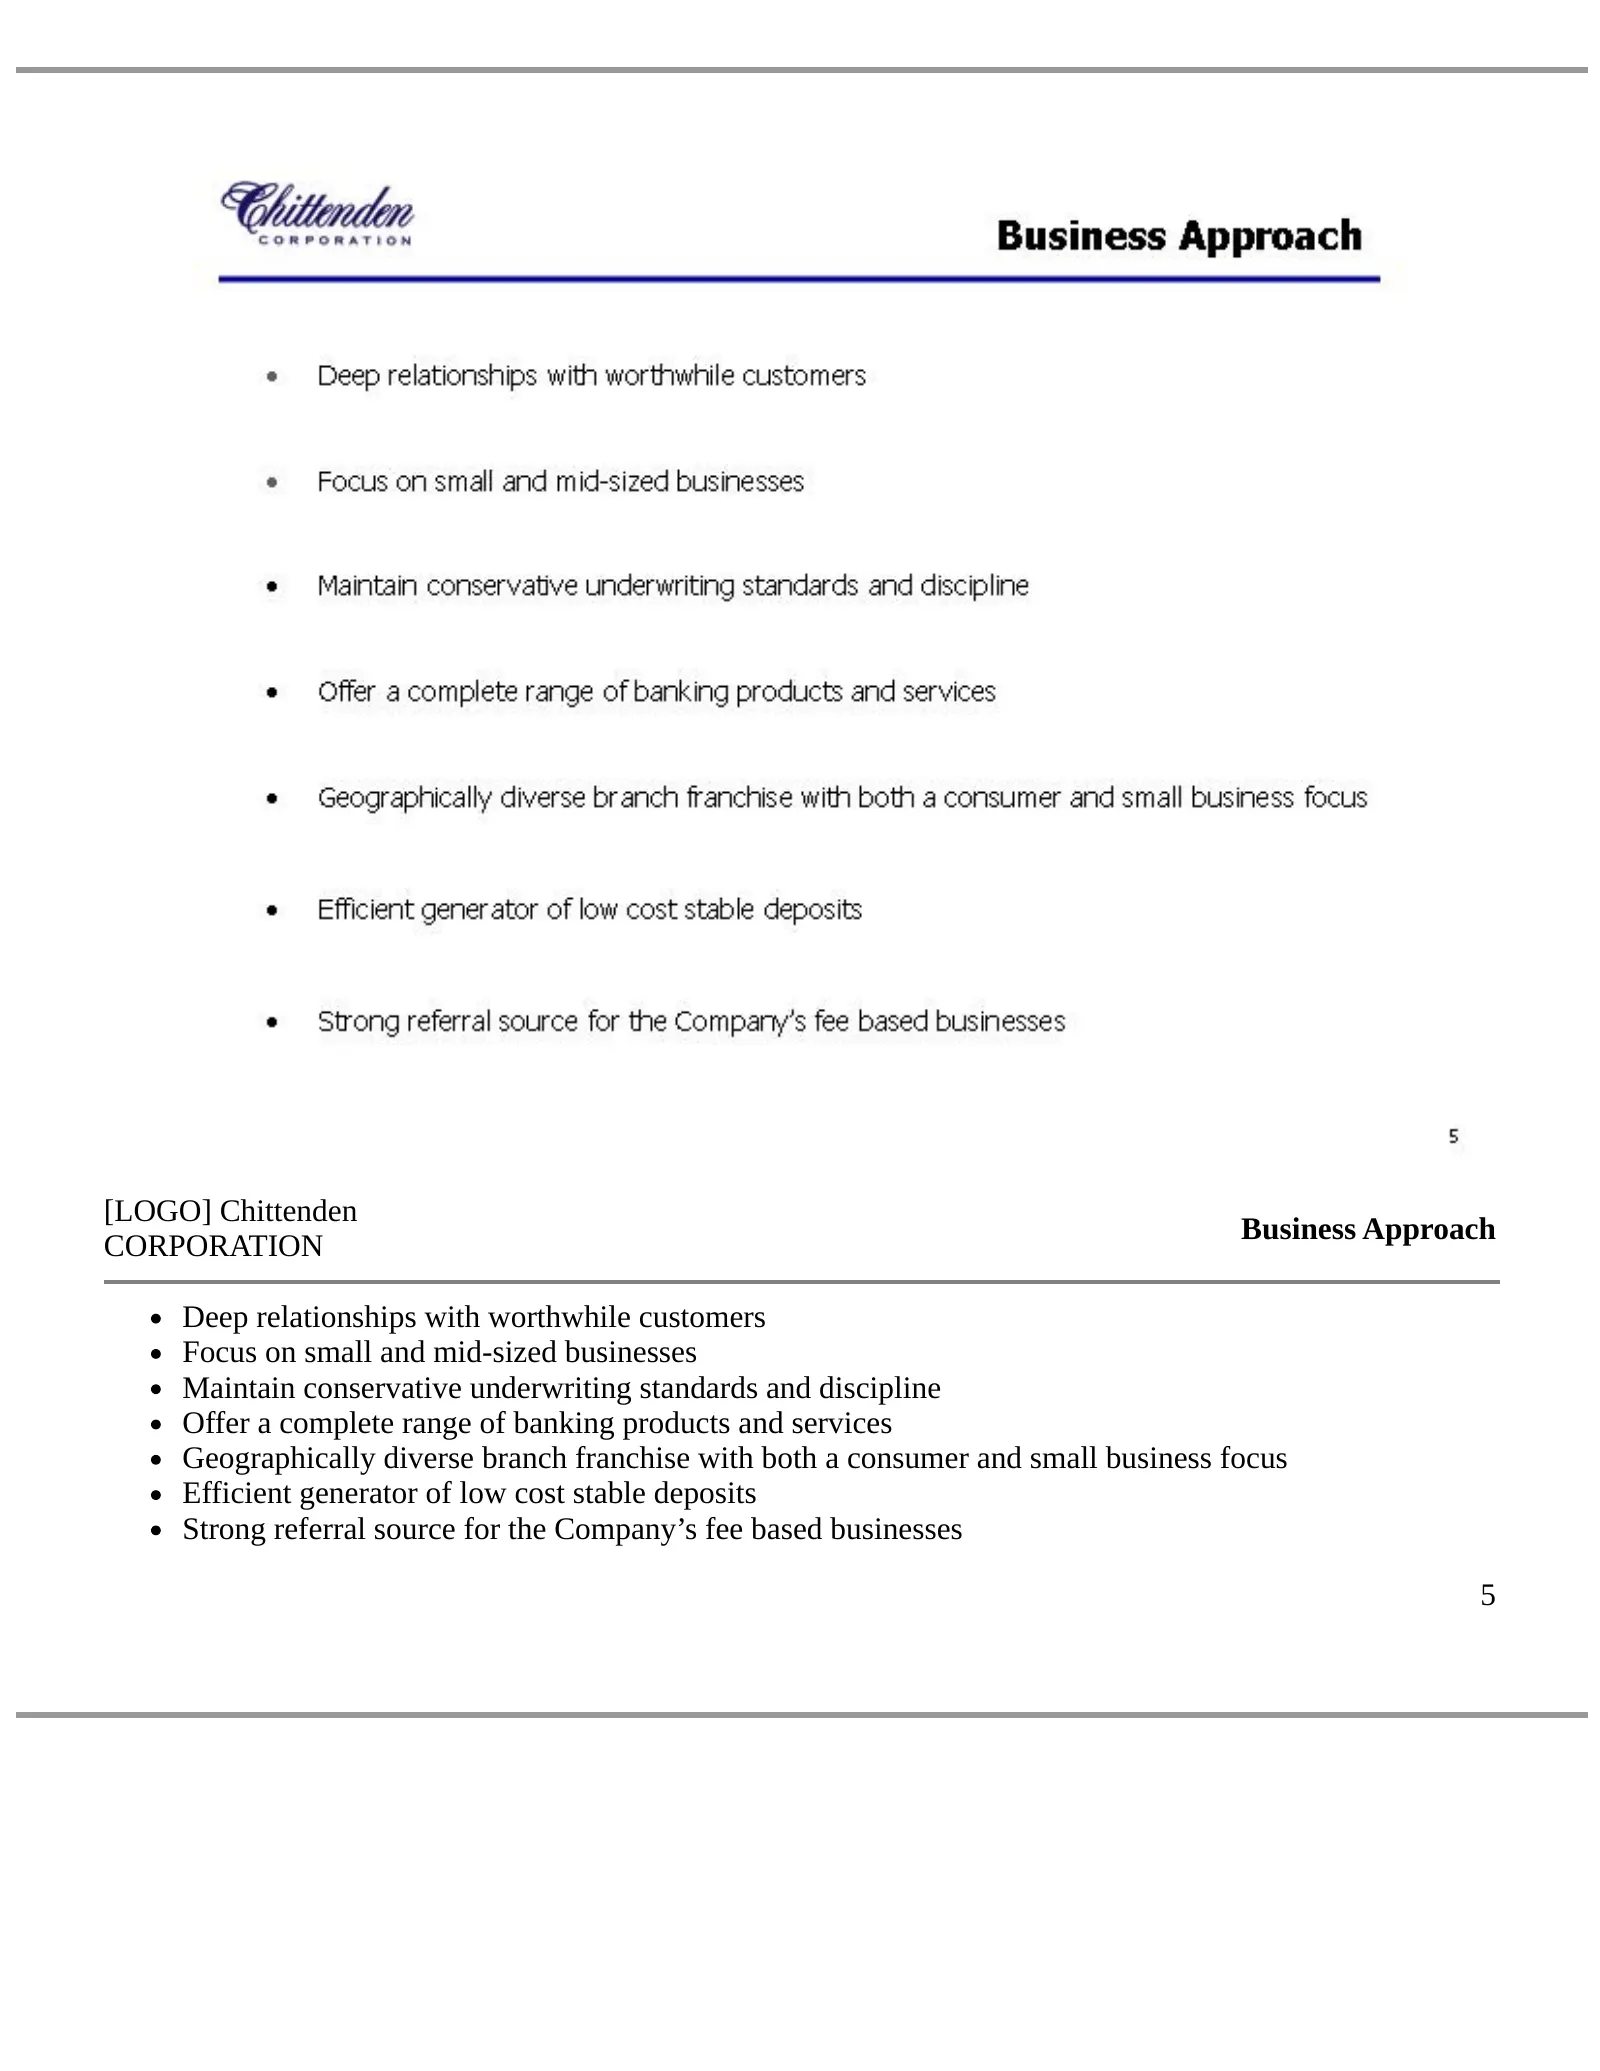
[LOGO] Chittenden Business Approach CORPORATION Deep relationships with worthwhile customers Focus on small and mid-sized businesses Maintain conservative underwriting standards and discipline Offer a complete range of banking products and services Geographically diverse branch franchise with both a
Slide 6: Business Services
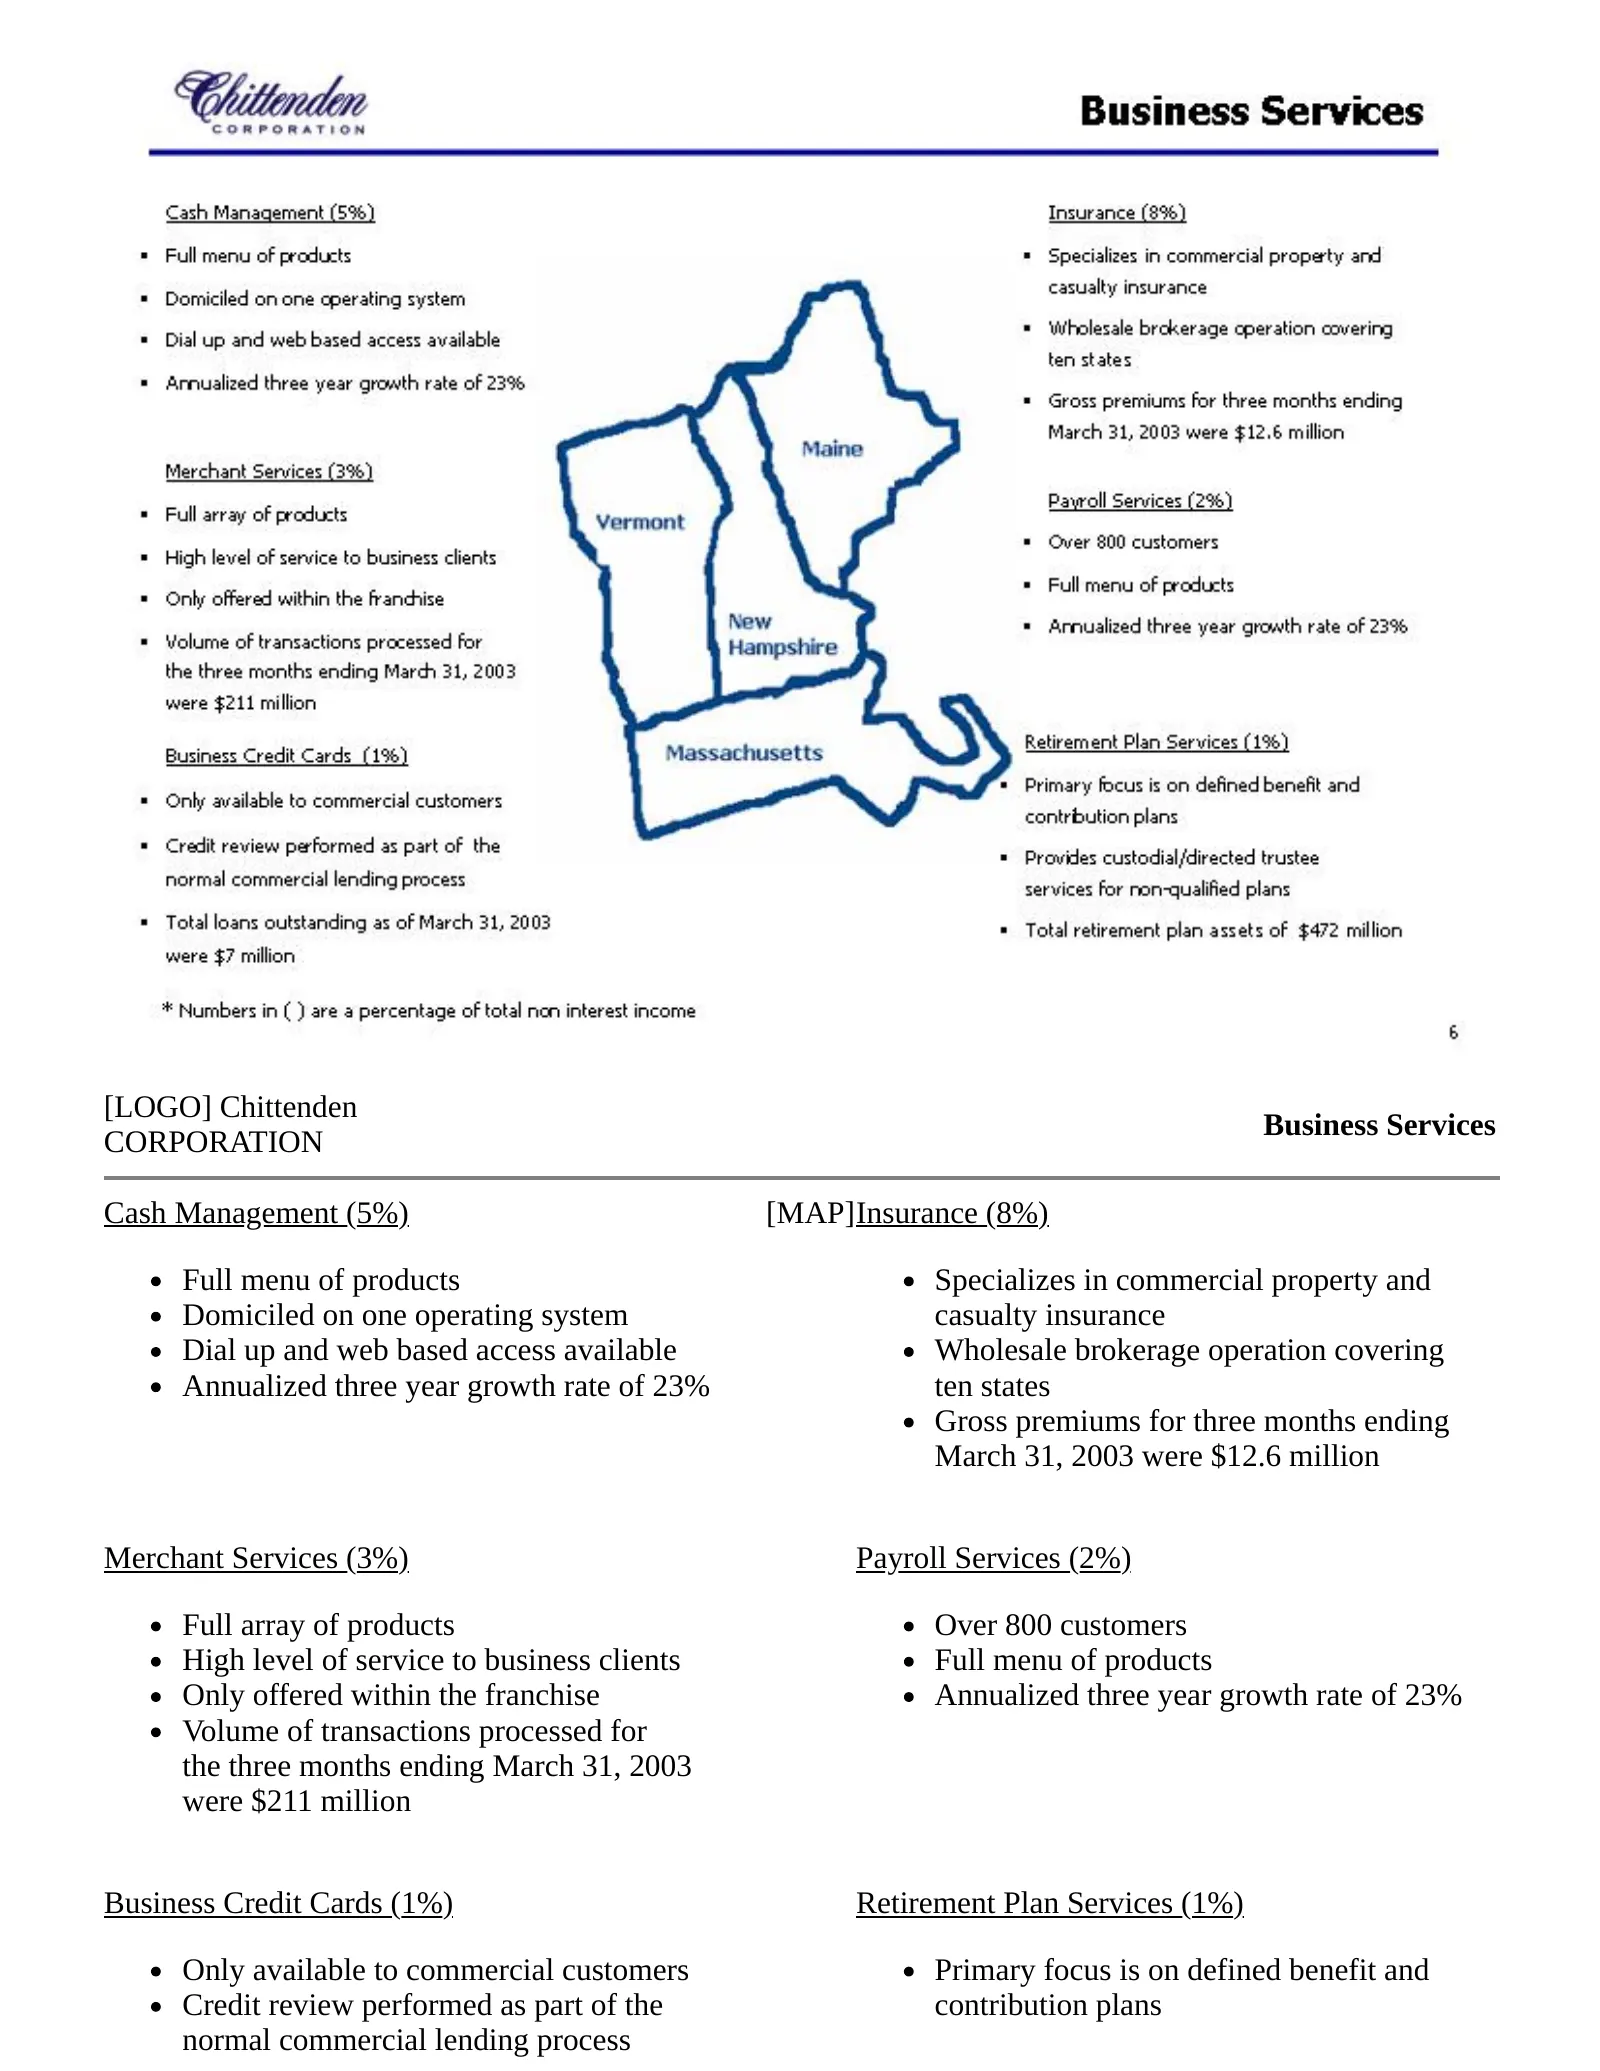
[LOGO] Chittenden Business Services CORPORATION Cash Management (5%) [MAP]Insurance (8%) Full menu of products Specializes in commercial property and Domiciled on one operating system casualty insurance Dial up and web based access available Wholesale brokerage operation covering Annualized three ye
Slide 7: Financial Management Services and Specialty Businesses
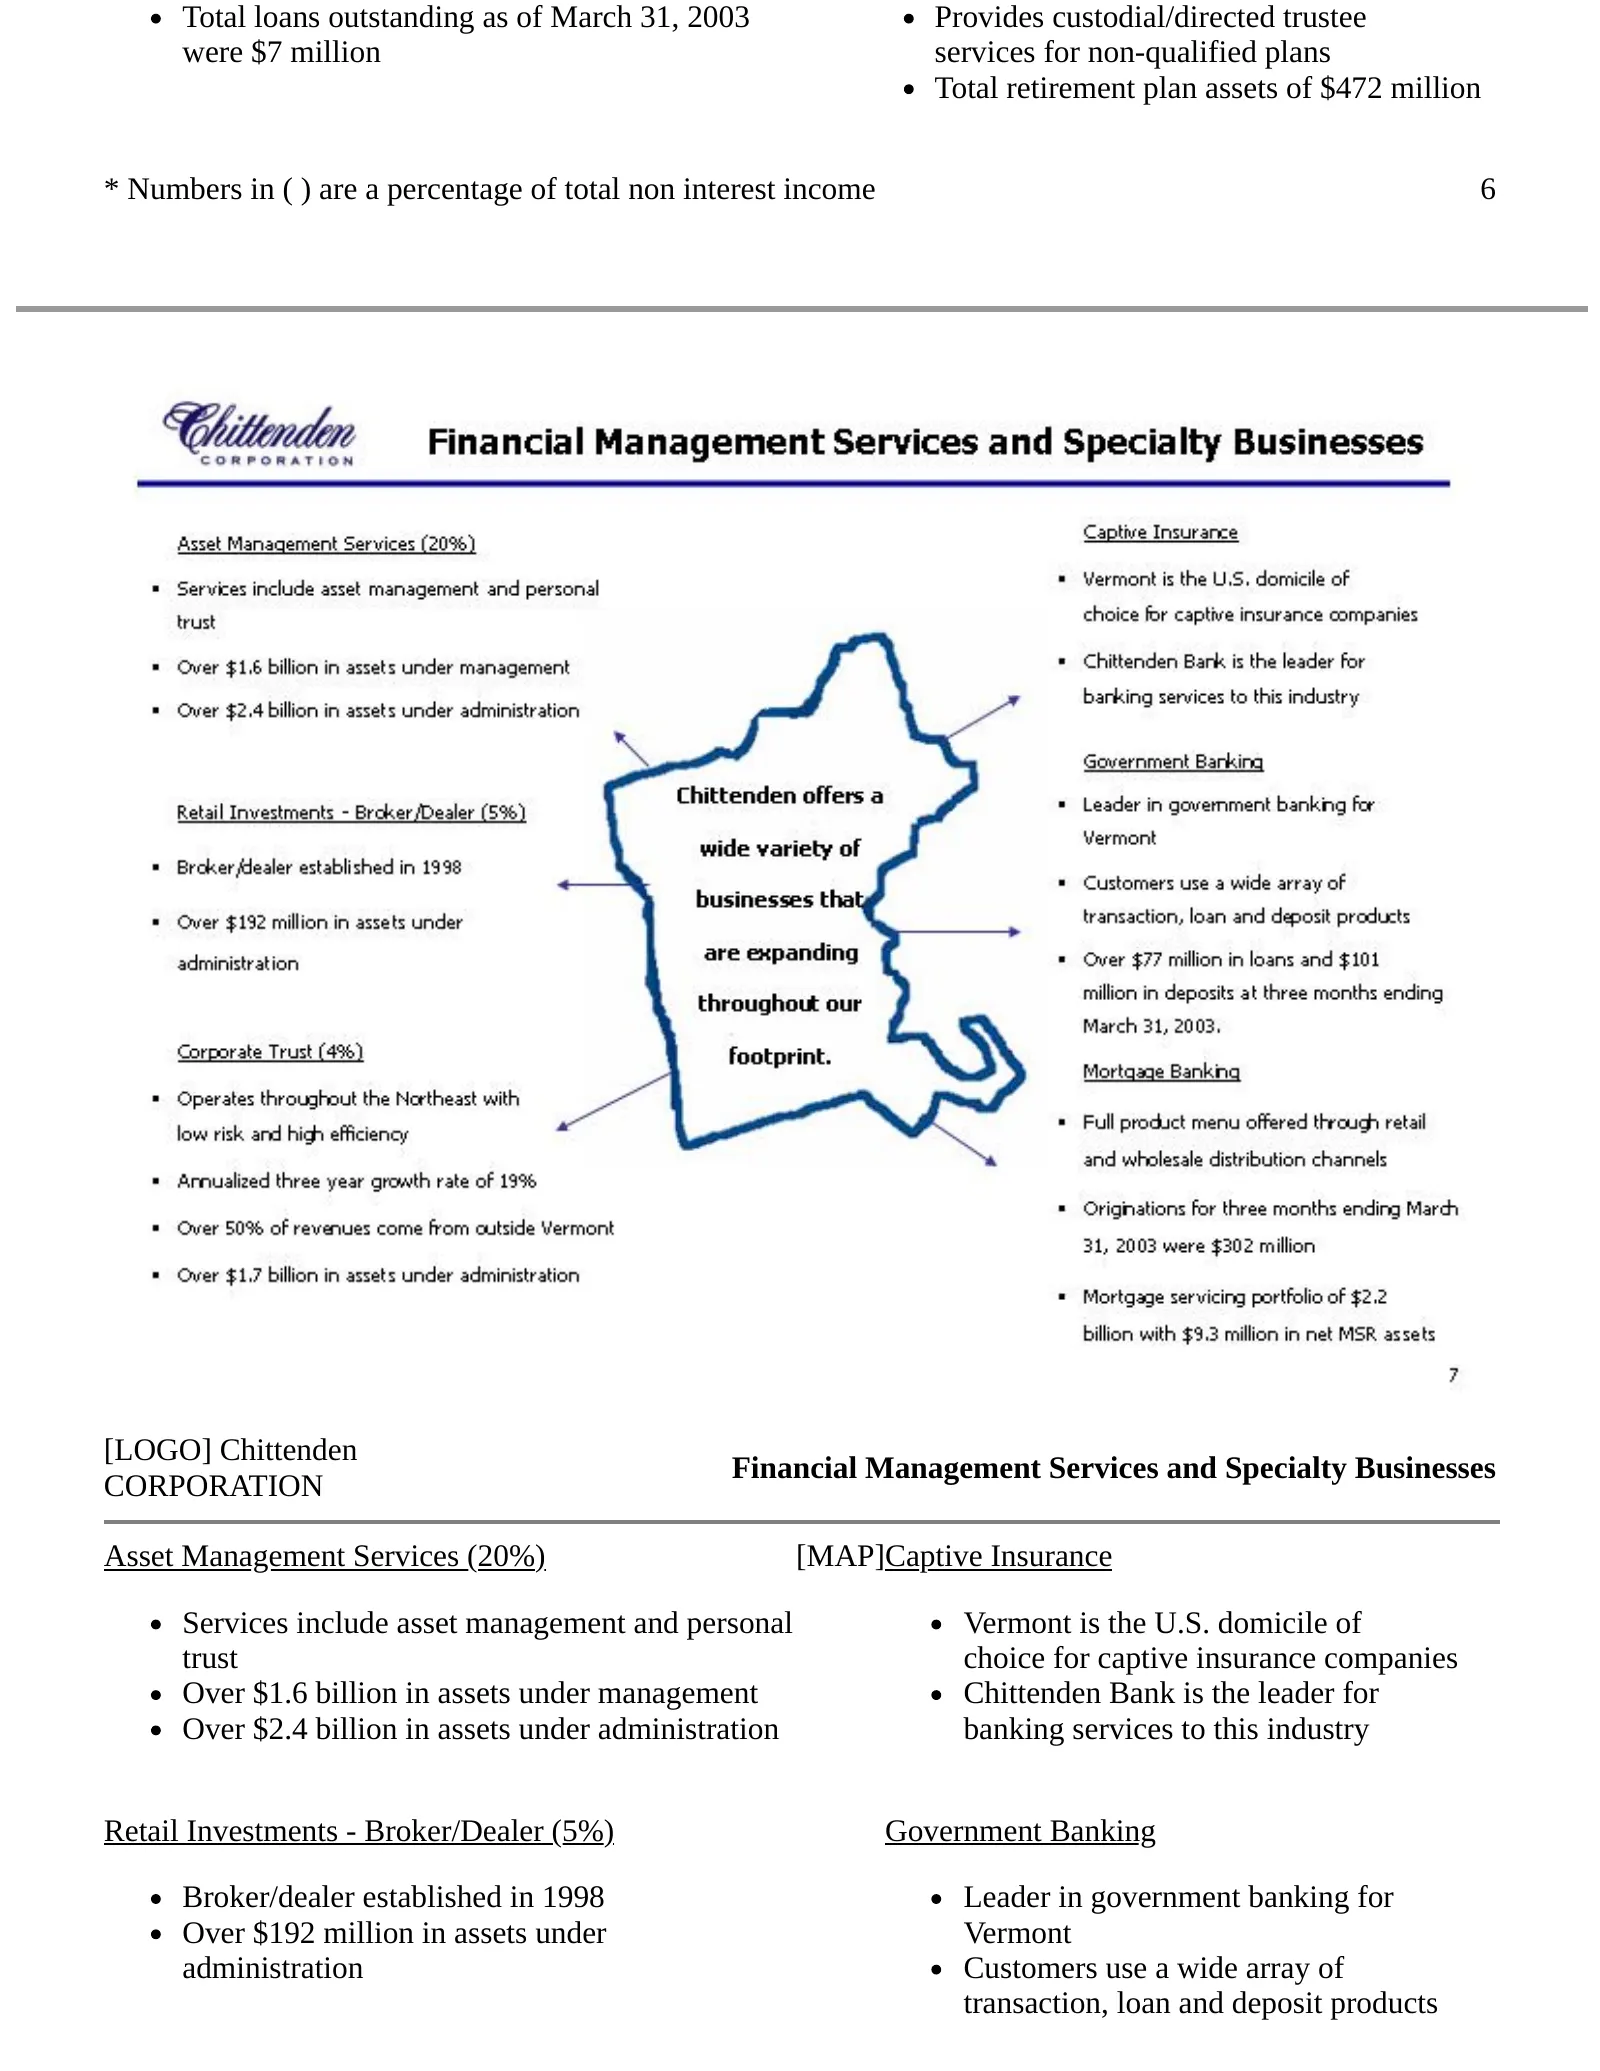
Total loans outstanding as of March 31, 2003 Provides custodial/directed trustee were $7 million services for non-qualified plans Total retirement plan assets of $472 million * Numbers in ( ) are a percentage of total non interest income 6 [LOGO] Chittenden Financial Management Services and Specialt
Slide 8: Corporate Trust and Mortgage Banking
Over $77 million in loans and $101 million in deposits at three months ending March 31, 2003. Corporate Trust (4%) Mortgage Banking Operates throughout the Northeast with Full product menu offered through low risk and high efficiency retail and wholesale distribution channels Annualized three year g
Slide 9: Financial Summary
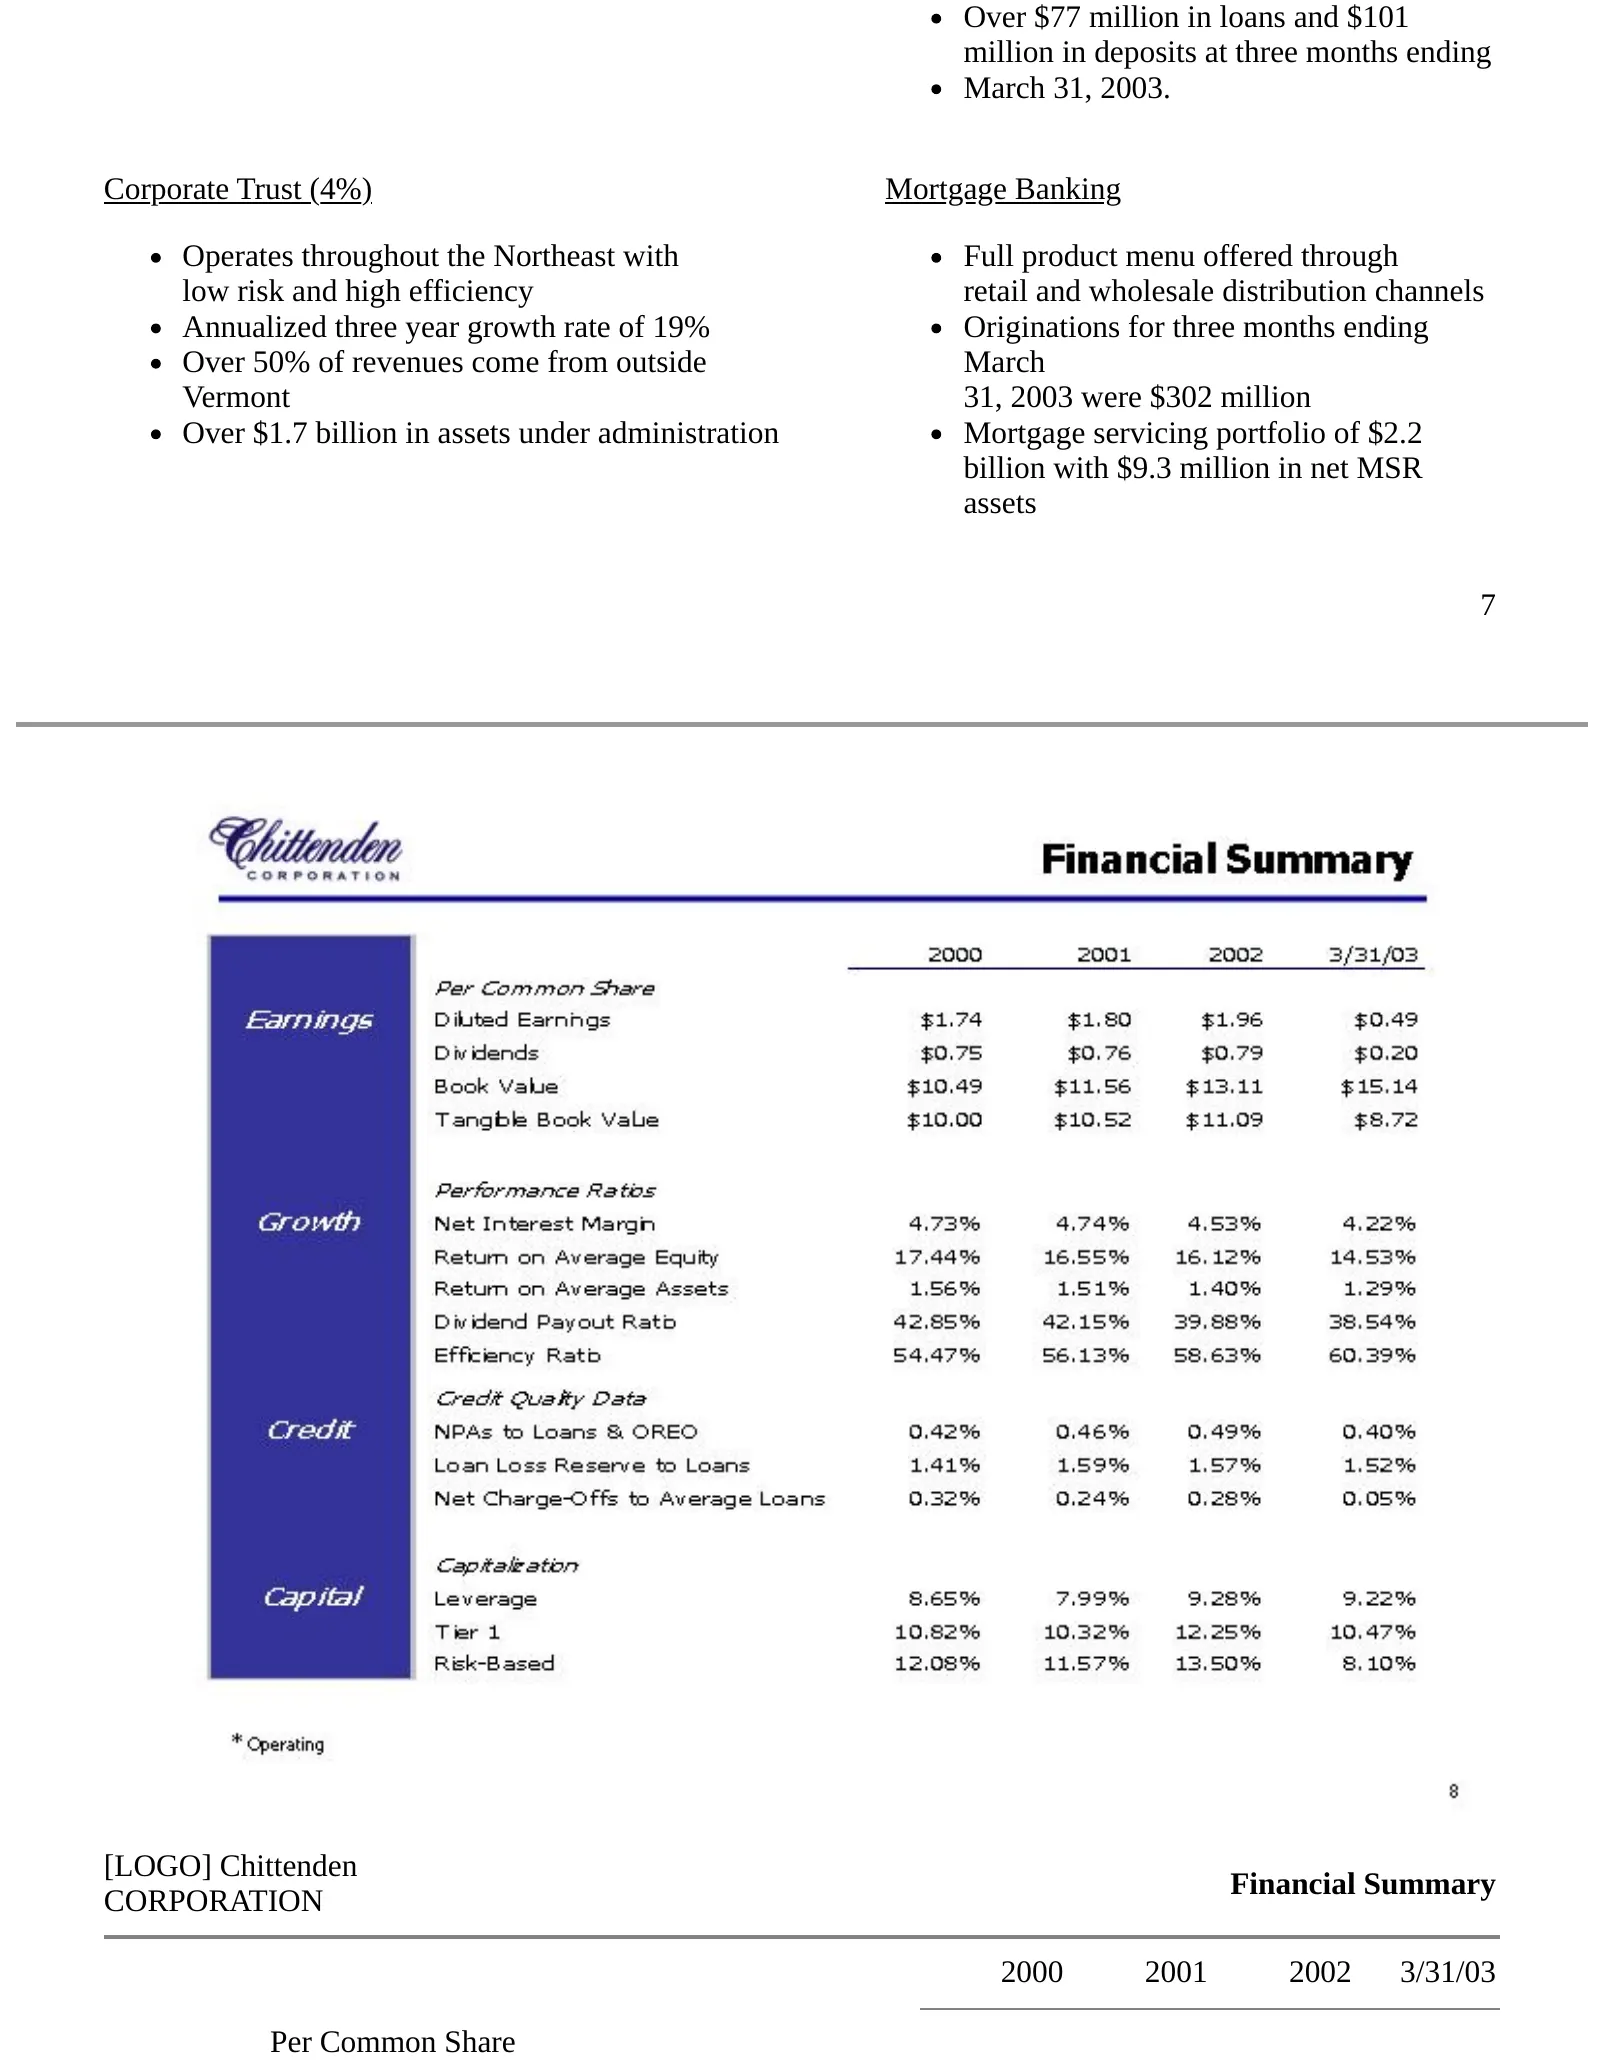
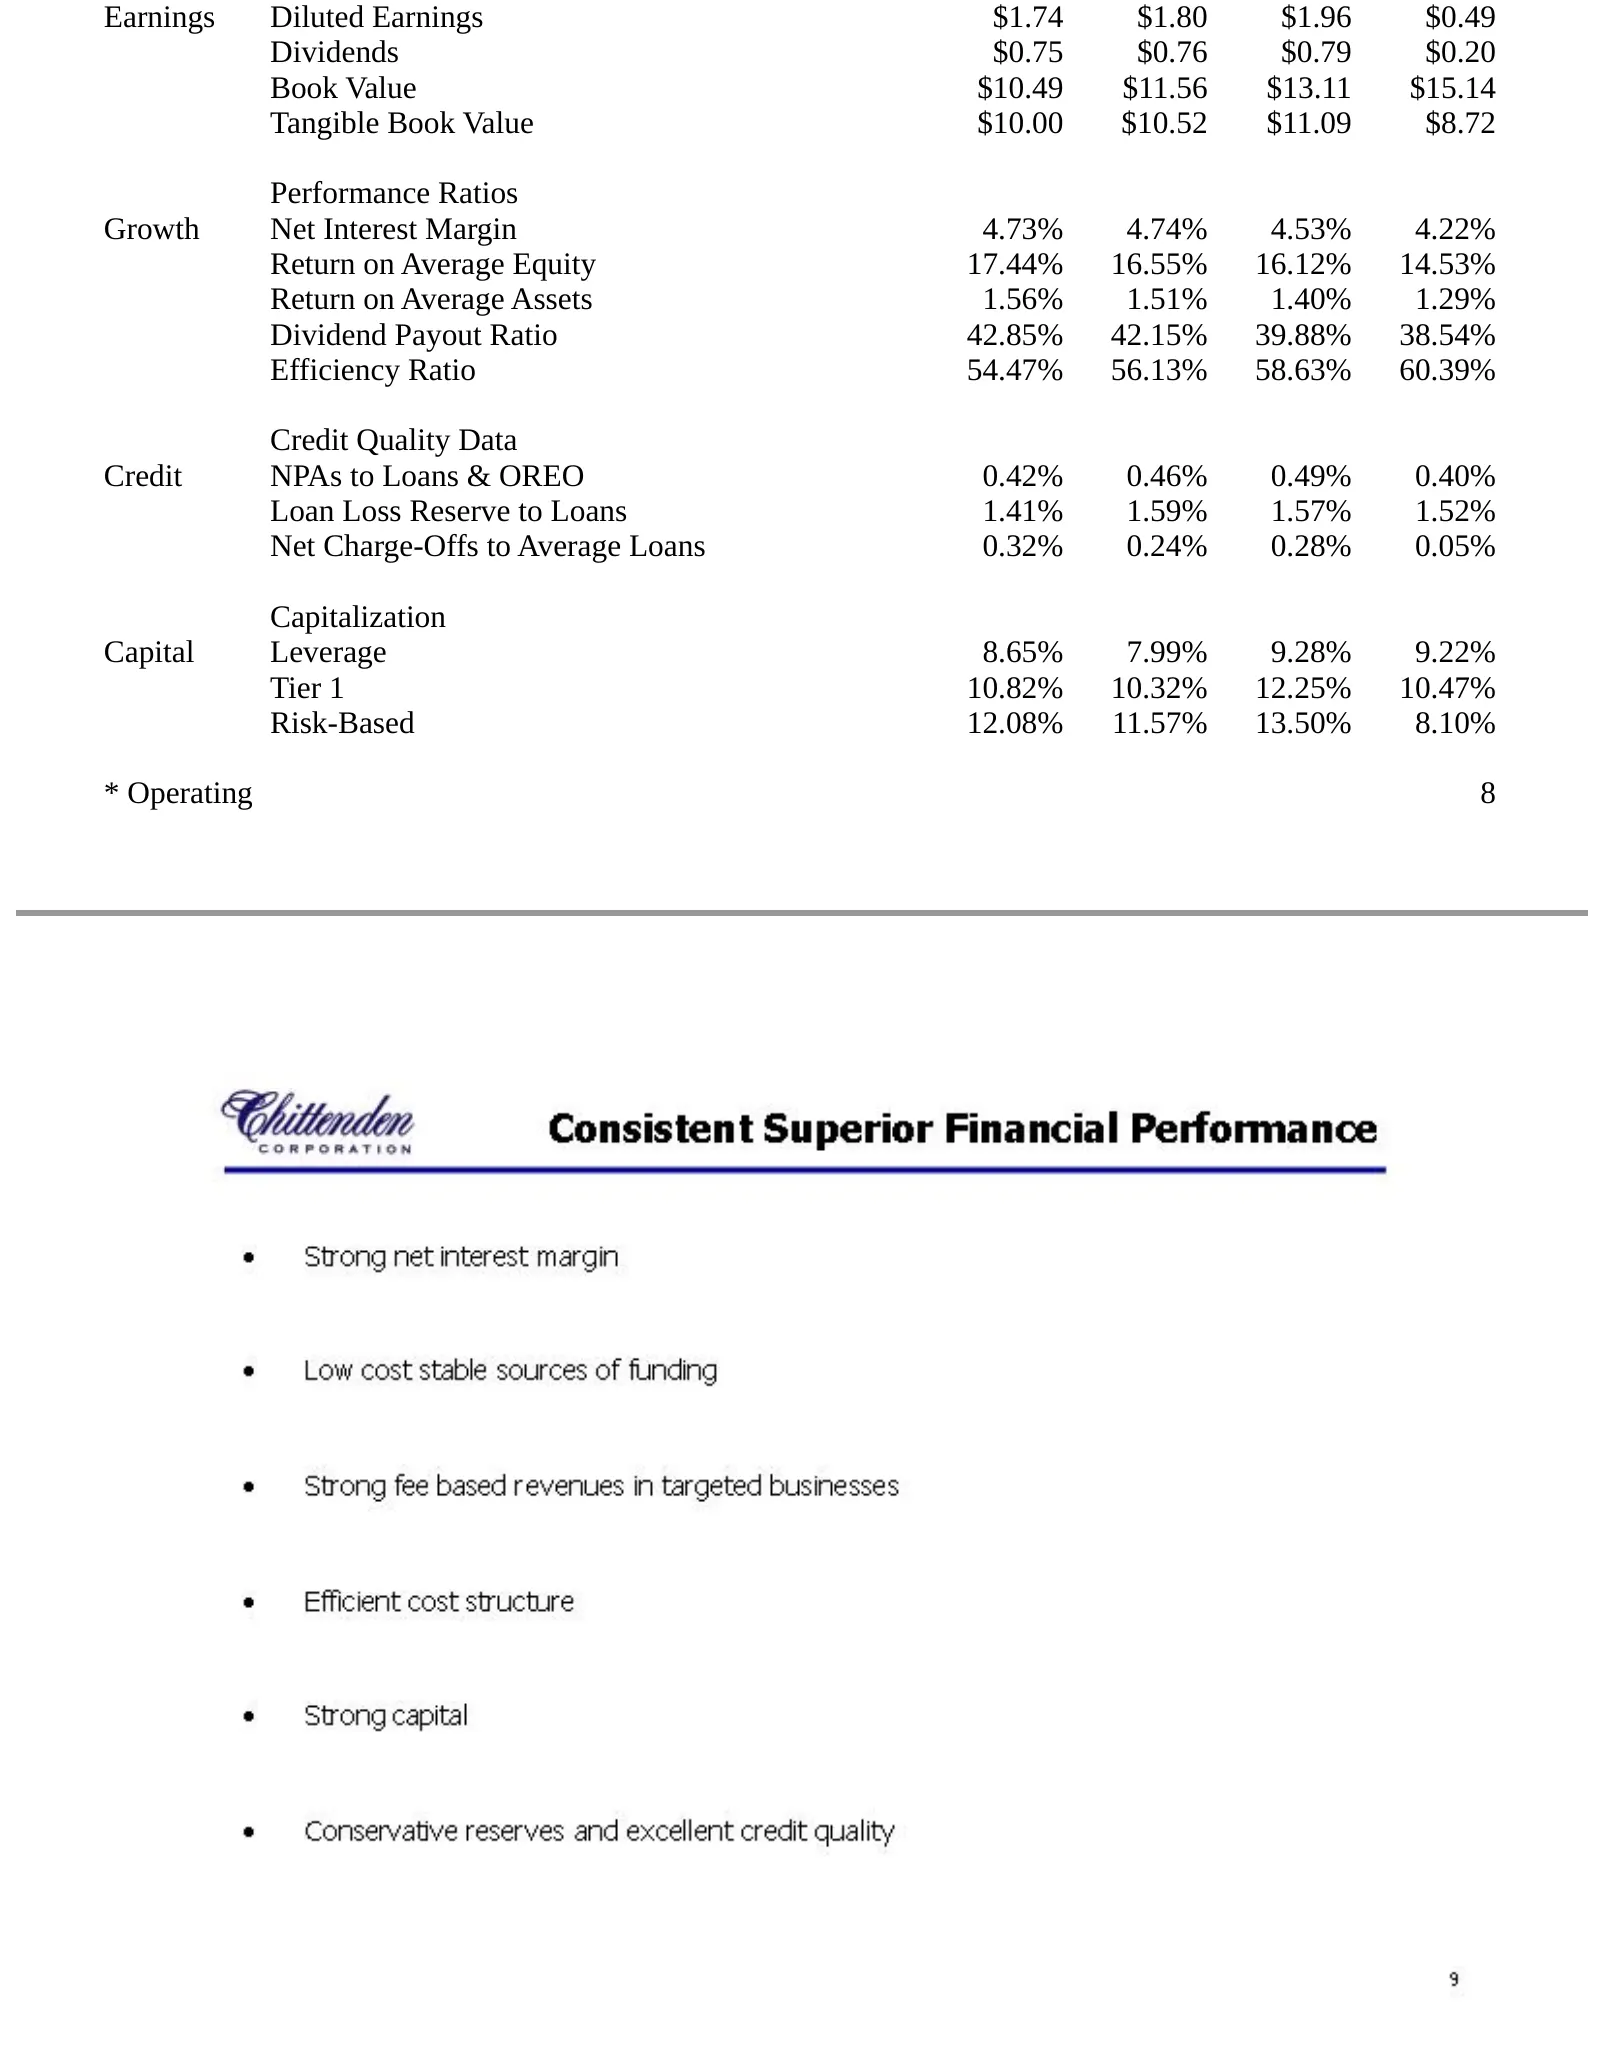
Earnings Diluted Earnings $1.74 $1.80 $1.96 $0.49 Dividends $0.75 $0.76 $0.79 $0.20 Book Value $10.49 $11.56 $13.11 $15.14 Tangible Book Value $10.00 $10.52 $11.09 $8.72 Performance Ratios Growth Net Interest Margin 4.73% 4.74% 4.53% 4.22% Return on Average Equity 17.44% 16.55% 16.12% 14.53% Return
Slide 10: A Diversified Loan Portfolio
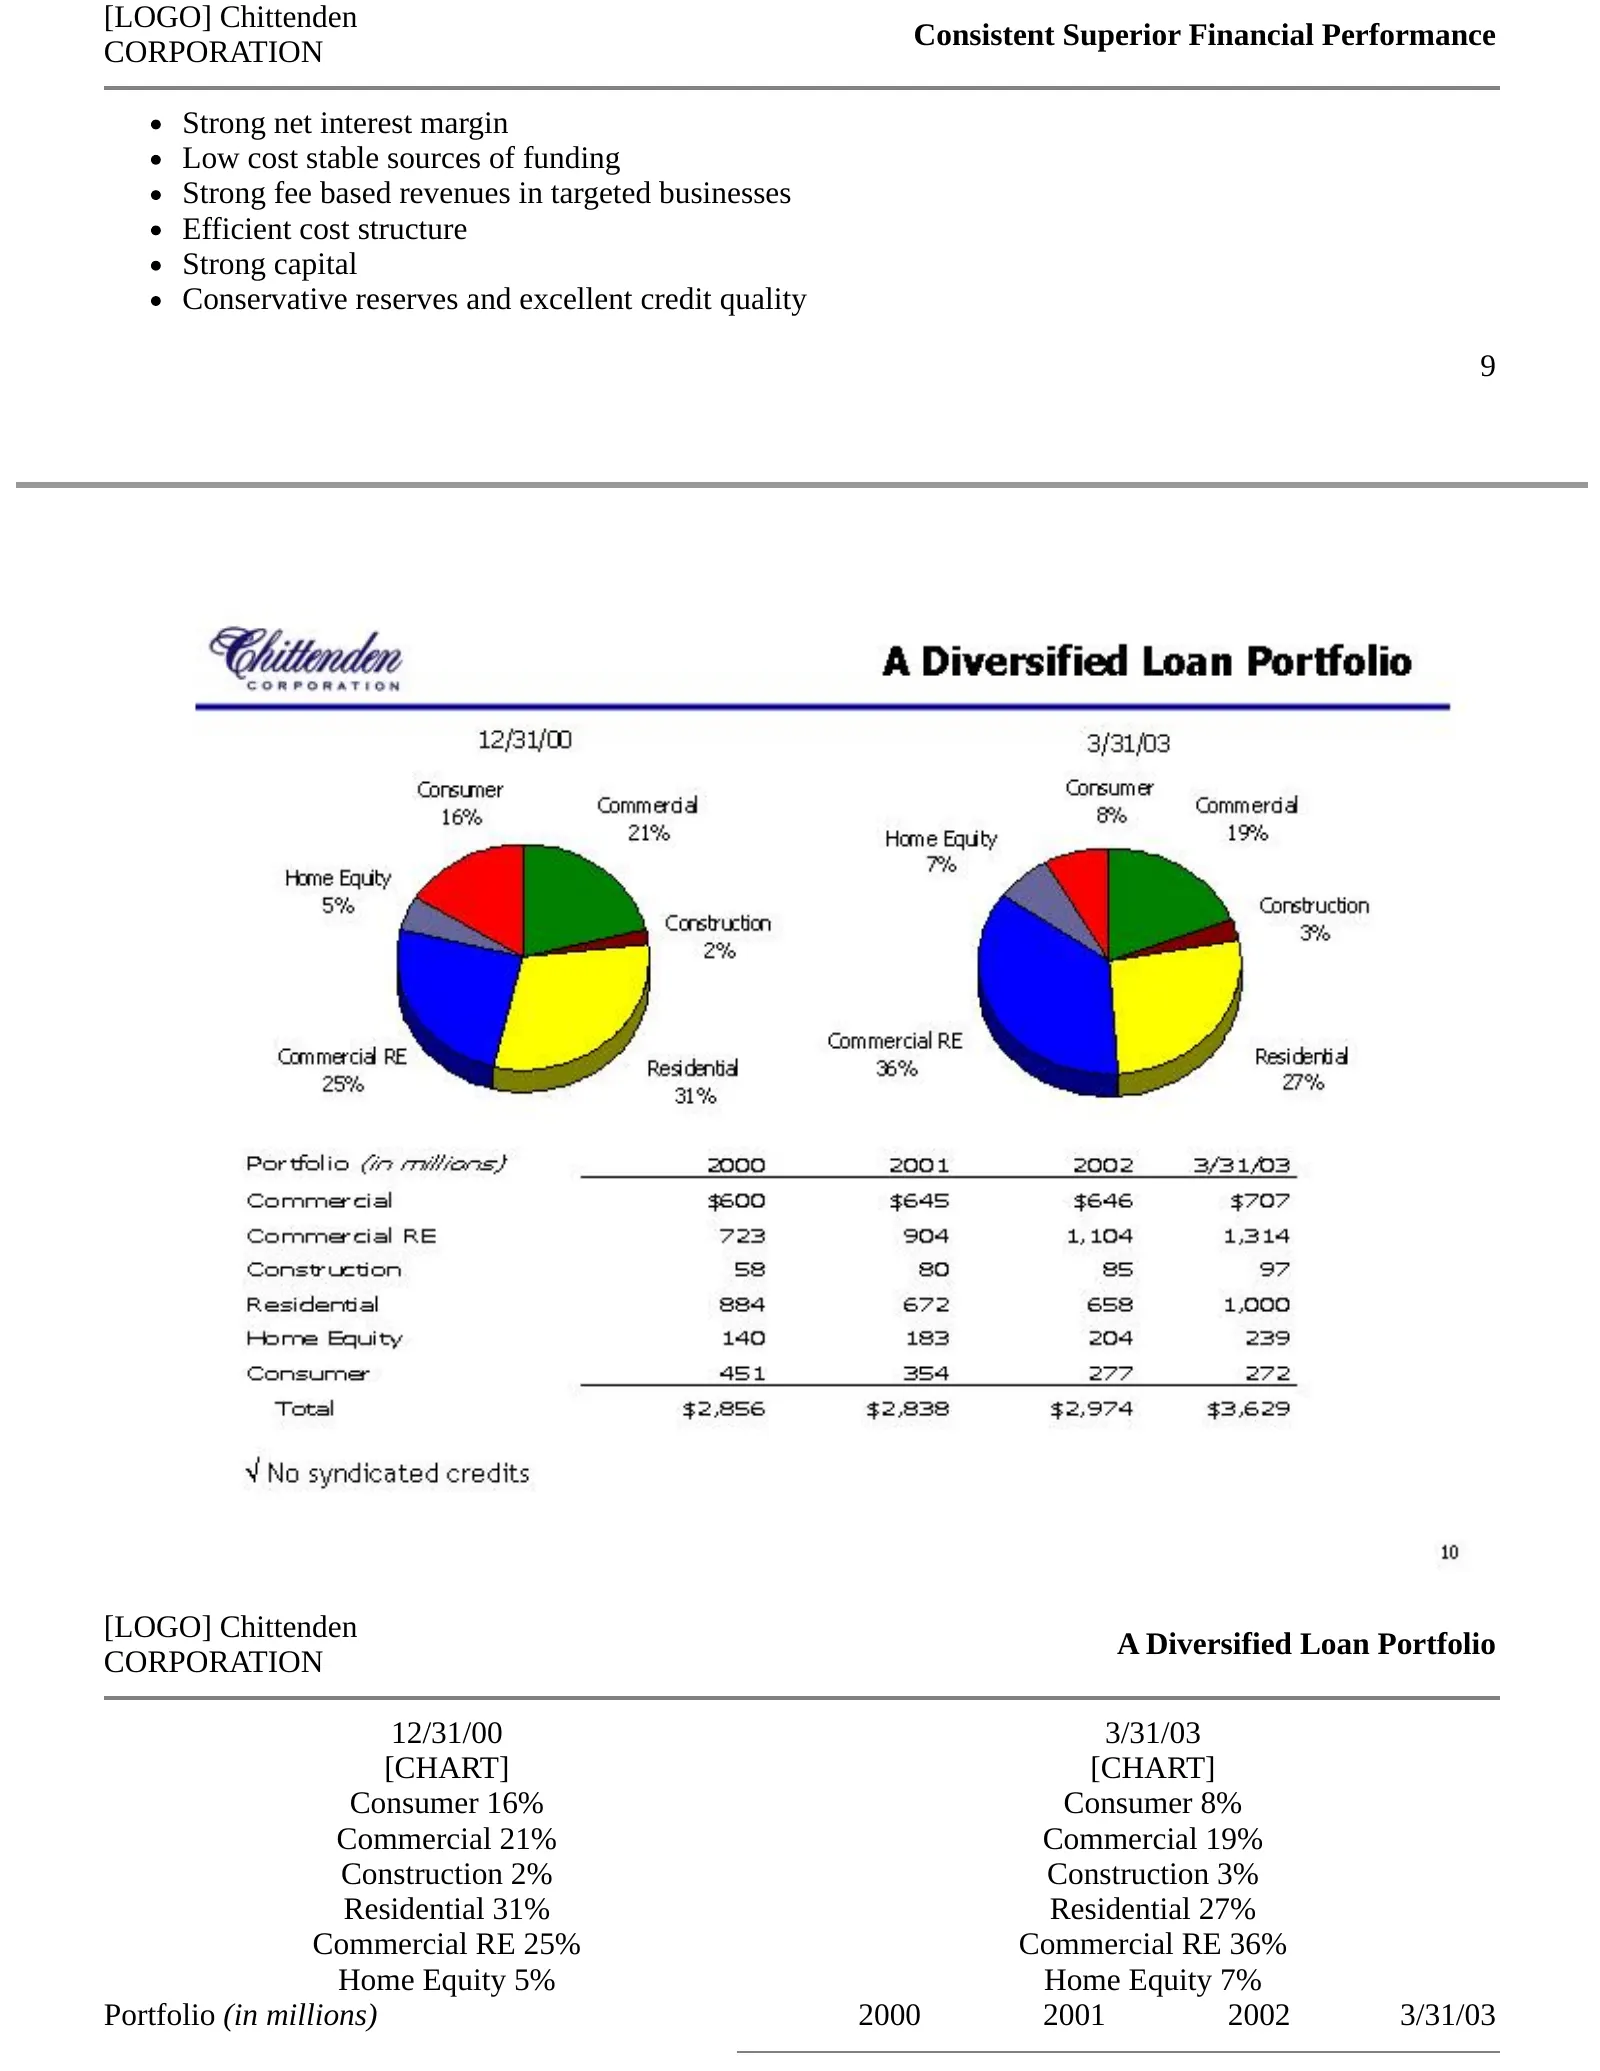
[LOGO] Chittenden Consistent Superior Financial Performance CORPORATION Strong net interest margin Low cost stable sources of funding Strong fee based revenues in targeted businesses Efficient cost structure Strong capital Conservative reserves and excellent credit quality 9 [LOGO] Chittenden A Dive
Slide 11: Loan Portfolio Table and Asset Quality
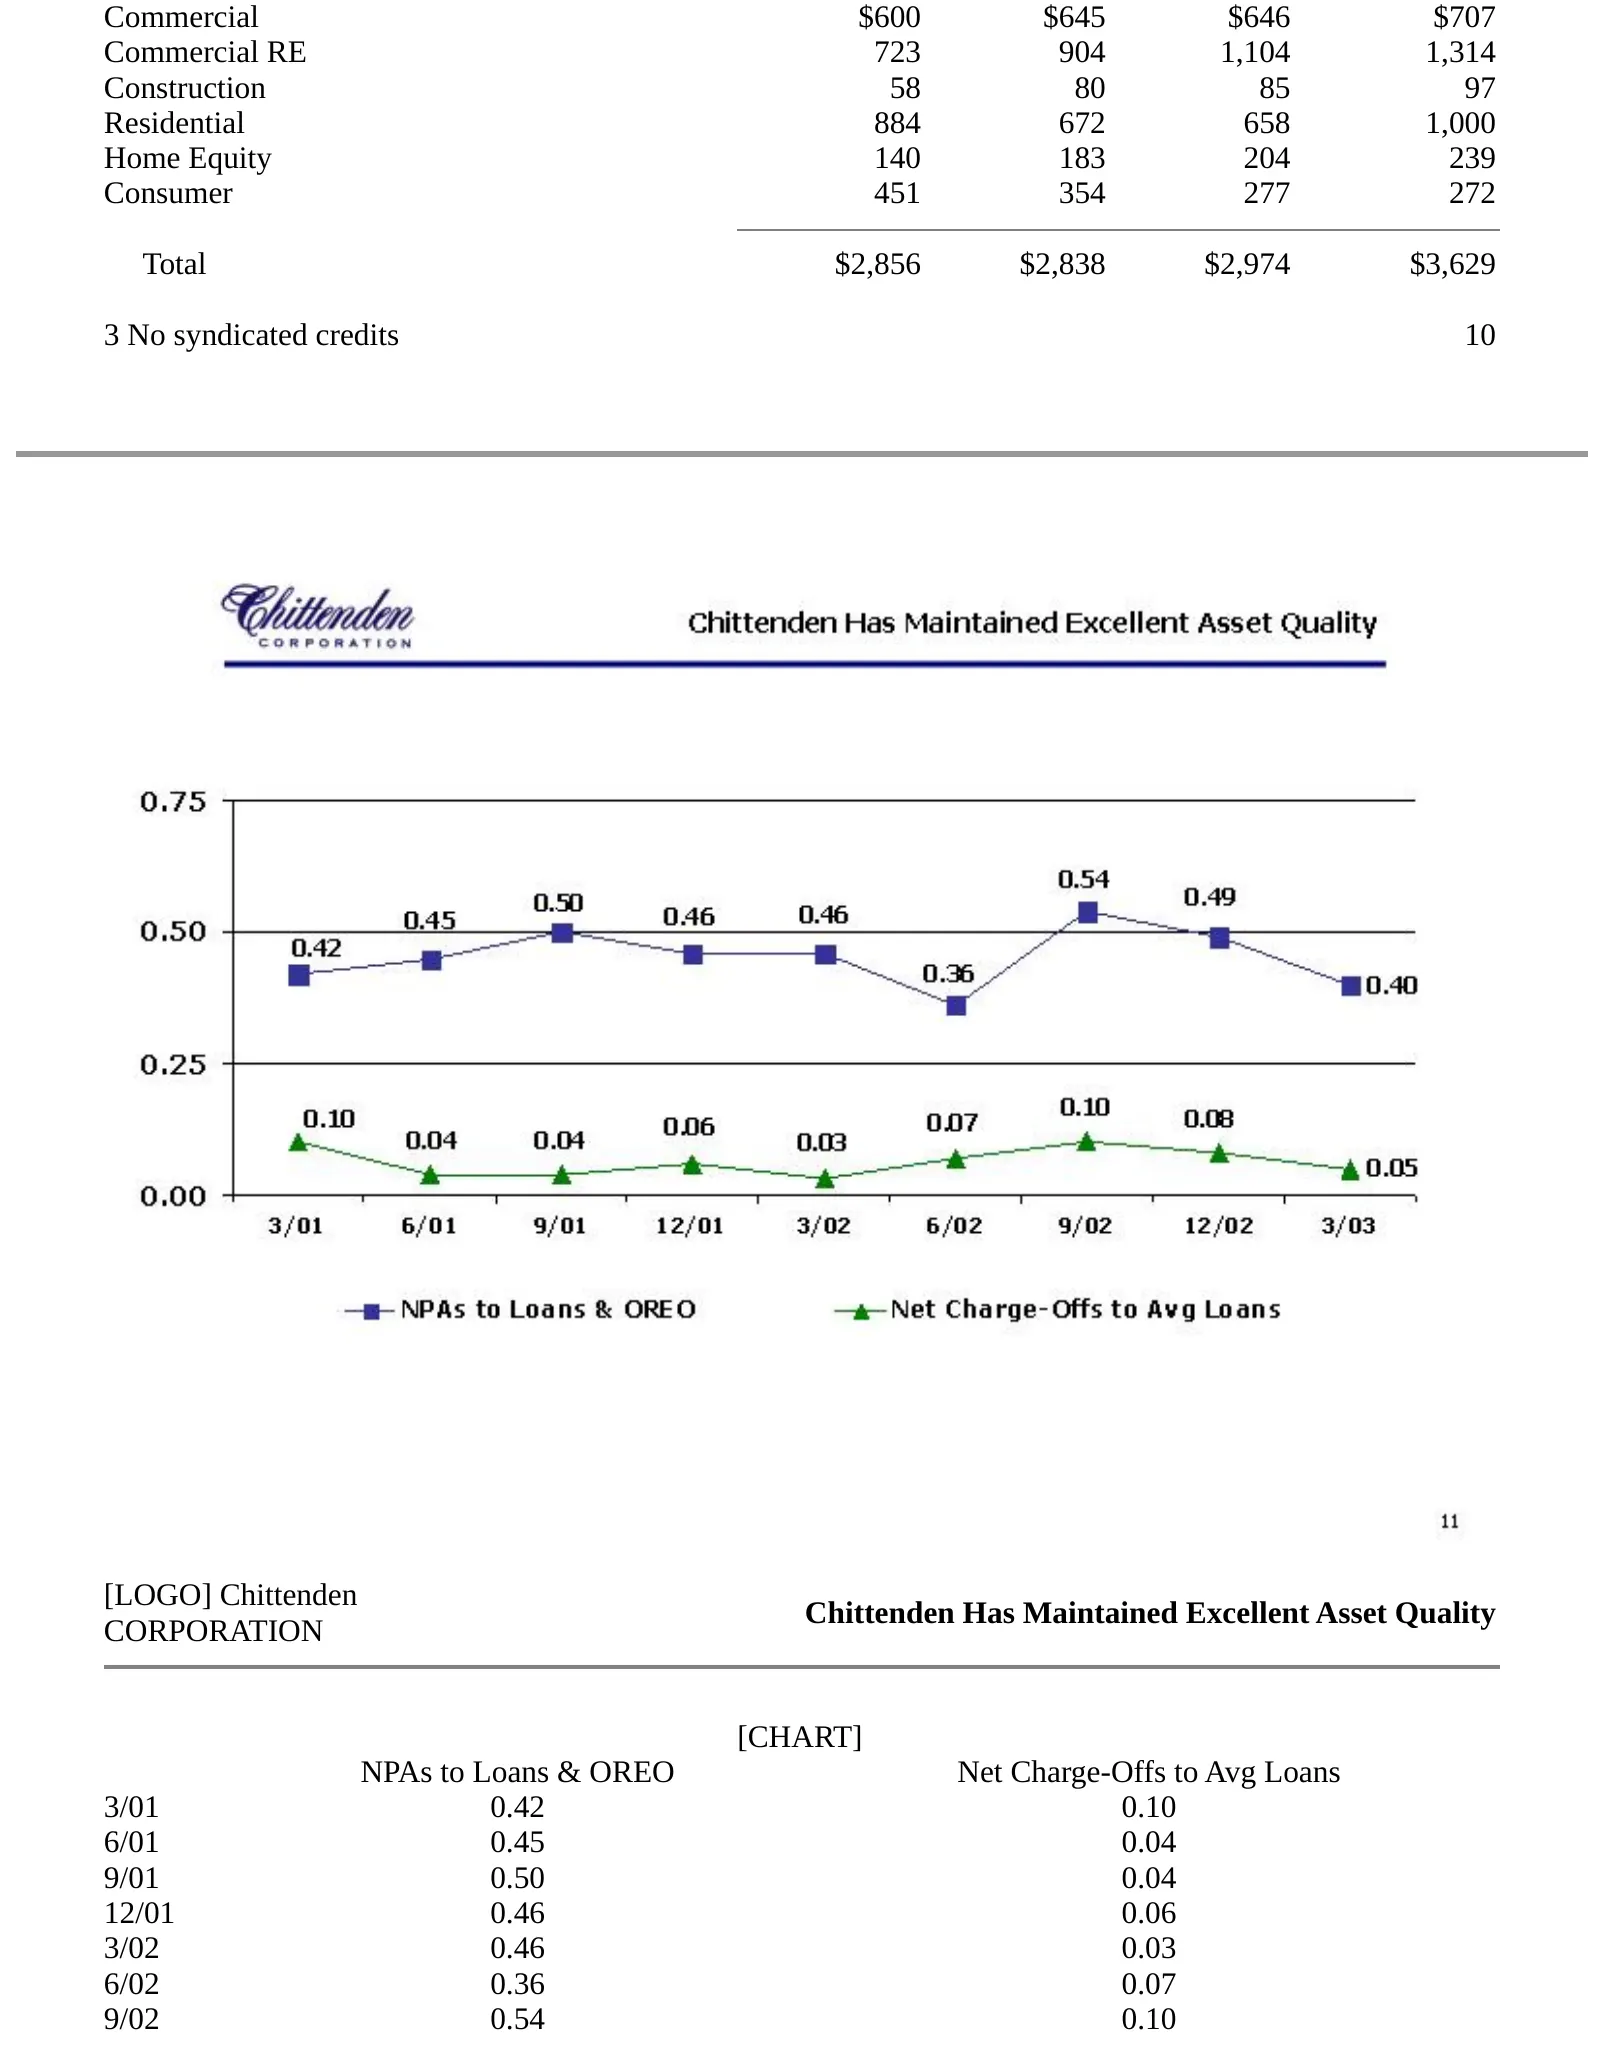
Commercial $600 $645 $646 $707 Commercial RE 723 904 1,104 1,314 Construction 58 80 85 97 Residential 884 672 658 1,000 Home Equity 140 183 204 239 Consumer 451 354 277 272 Total $2,856 $2,838 $2,974 $3,629 3 No syndicated credits 10 [LOGO] Chittenden Chittenden Has Maintained Excellent Asset Qualit
Slide 12: Strong Core Funding
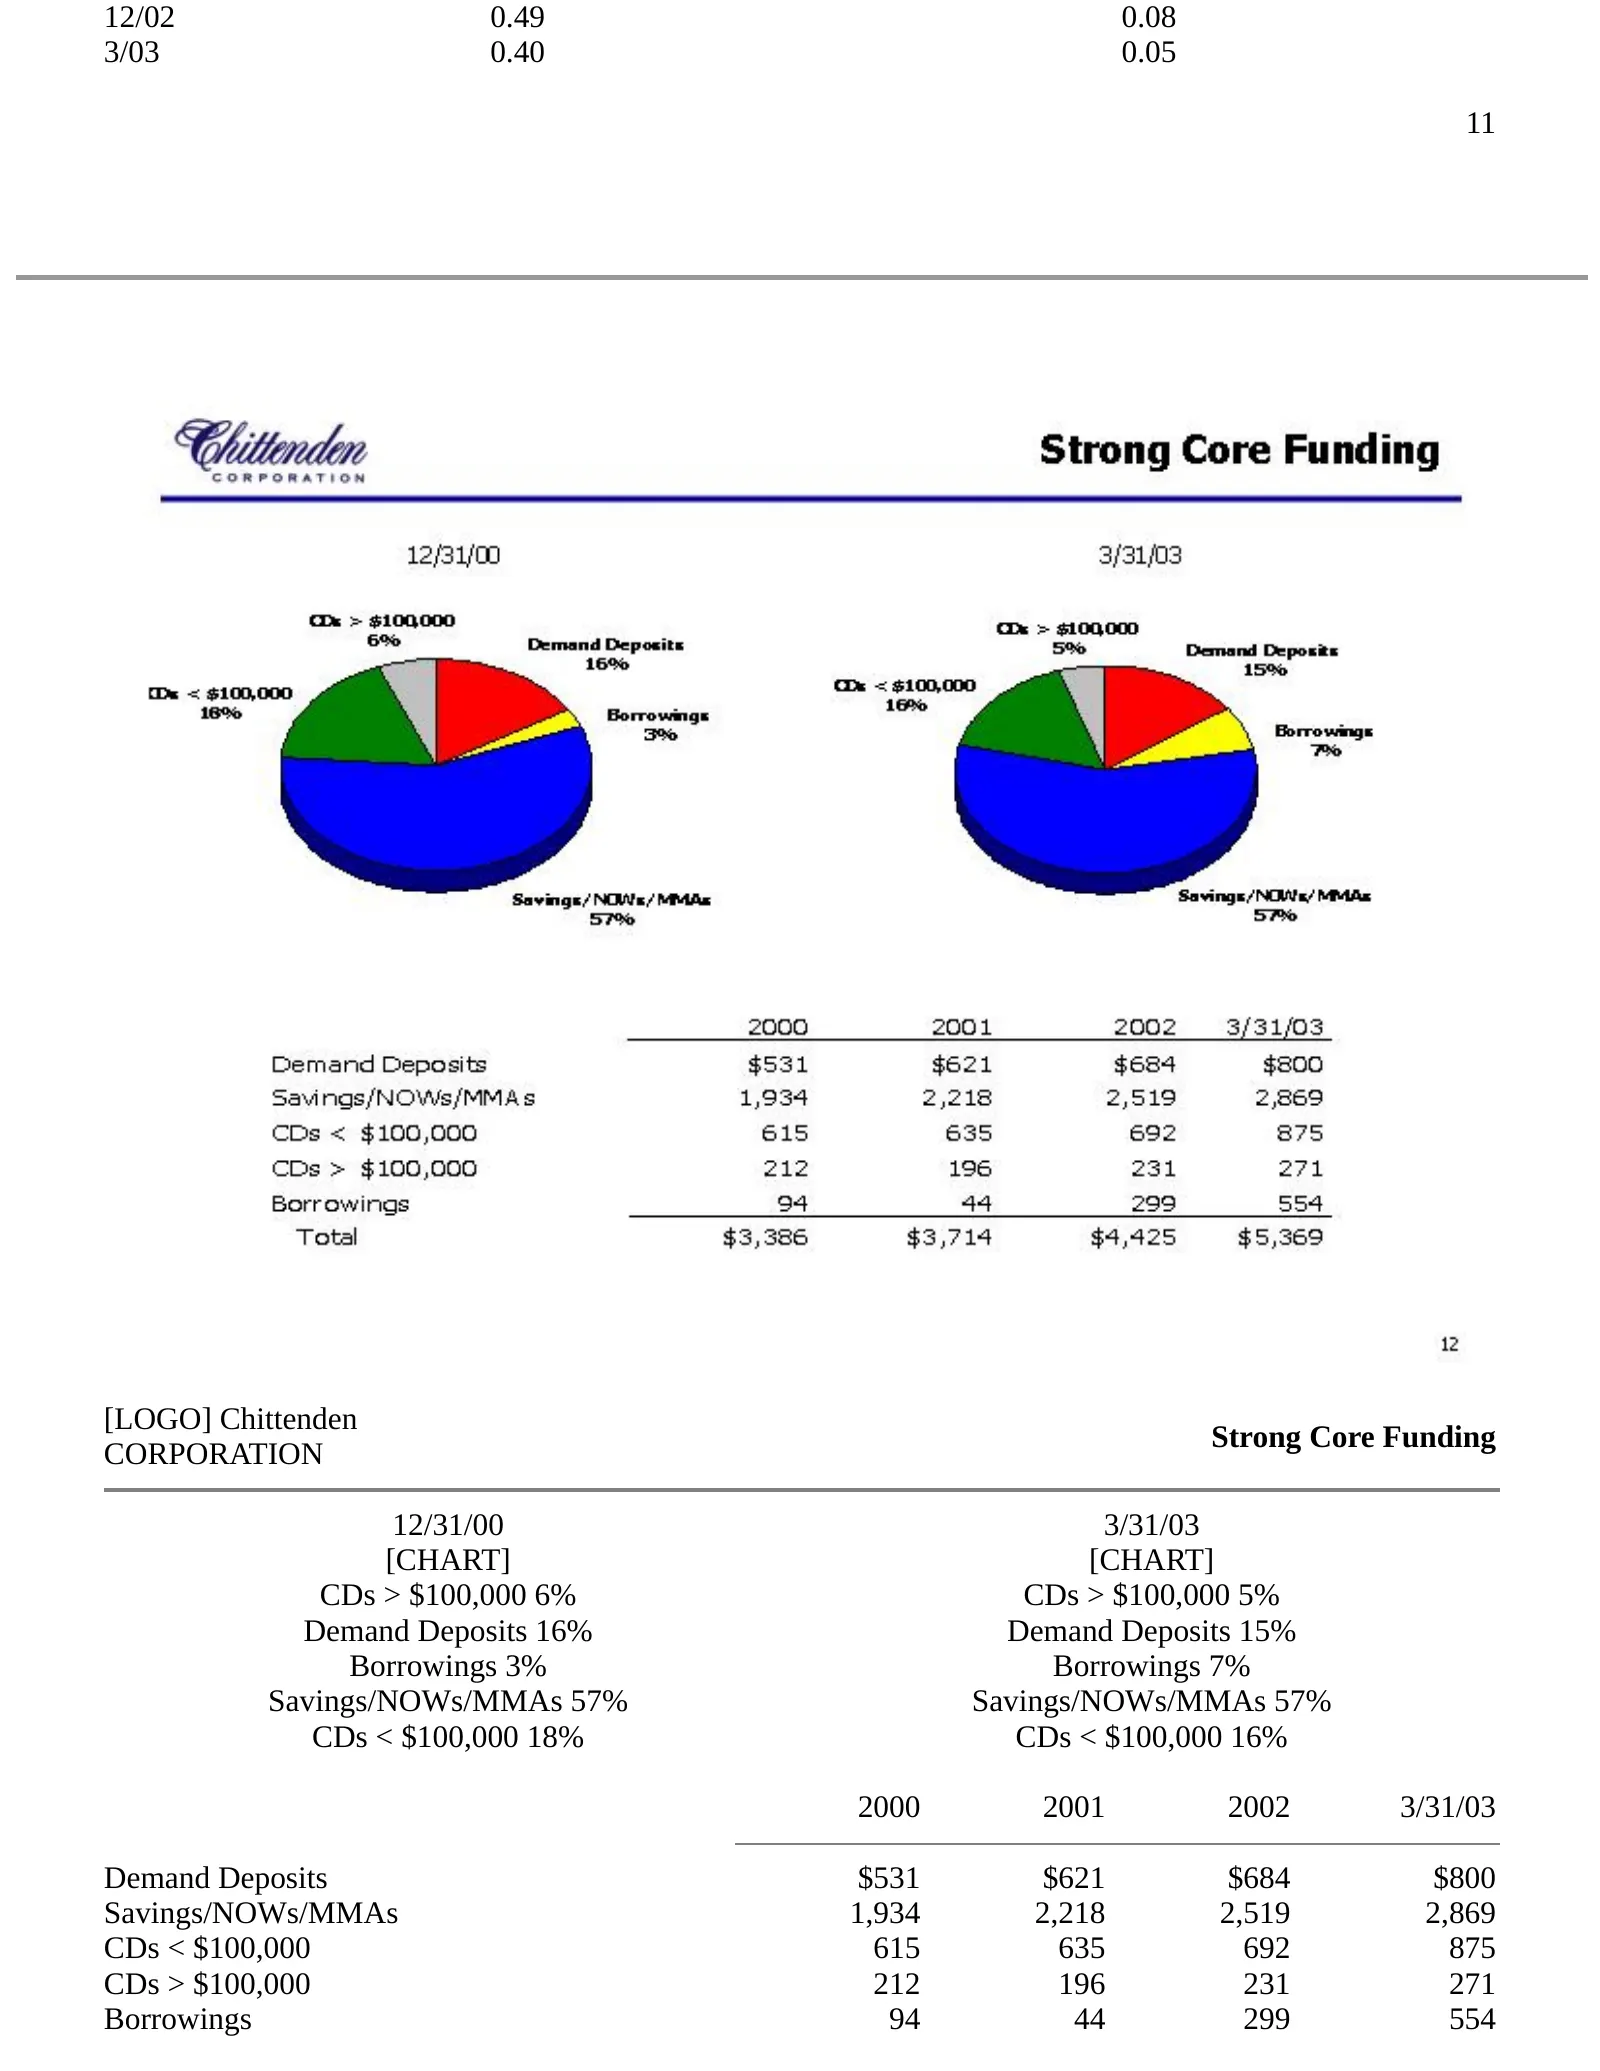
12/02 0.49 0.08 3/03 0.40 0.05 11 [LOGO] Chittenden Strong Core Funding CORPORATION 12/31/00 3/31/03 [CHART] [CHART] CDs > $100,000 6% CDs > $100,000 5% Demand Deposits 16% Demand Deposits 15% Borrowings 3% Borrowings 7% Savings/NOWs/MMAs 57% Savings/NOWs/MMAs 57% CDs < $100,000 18% CDs < $100,000 1
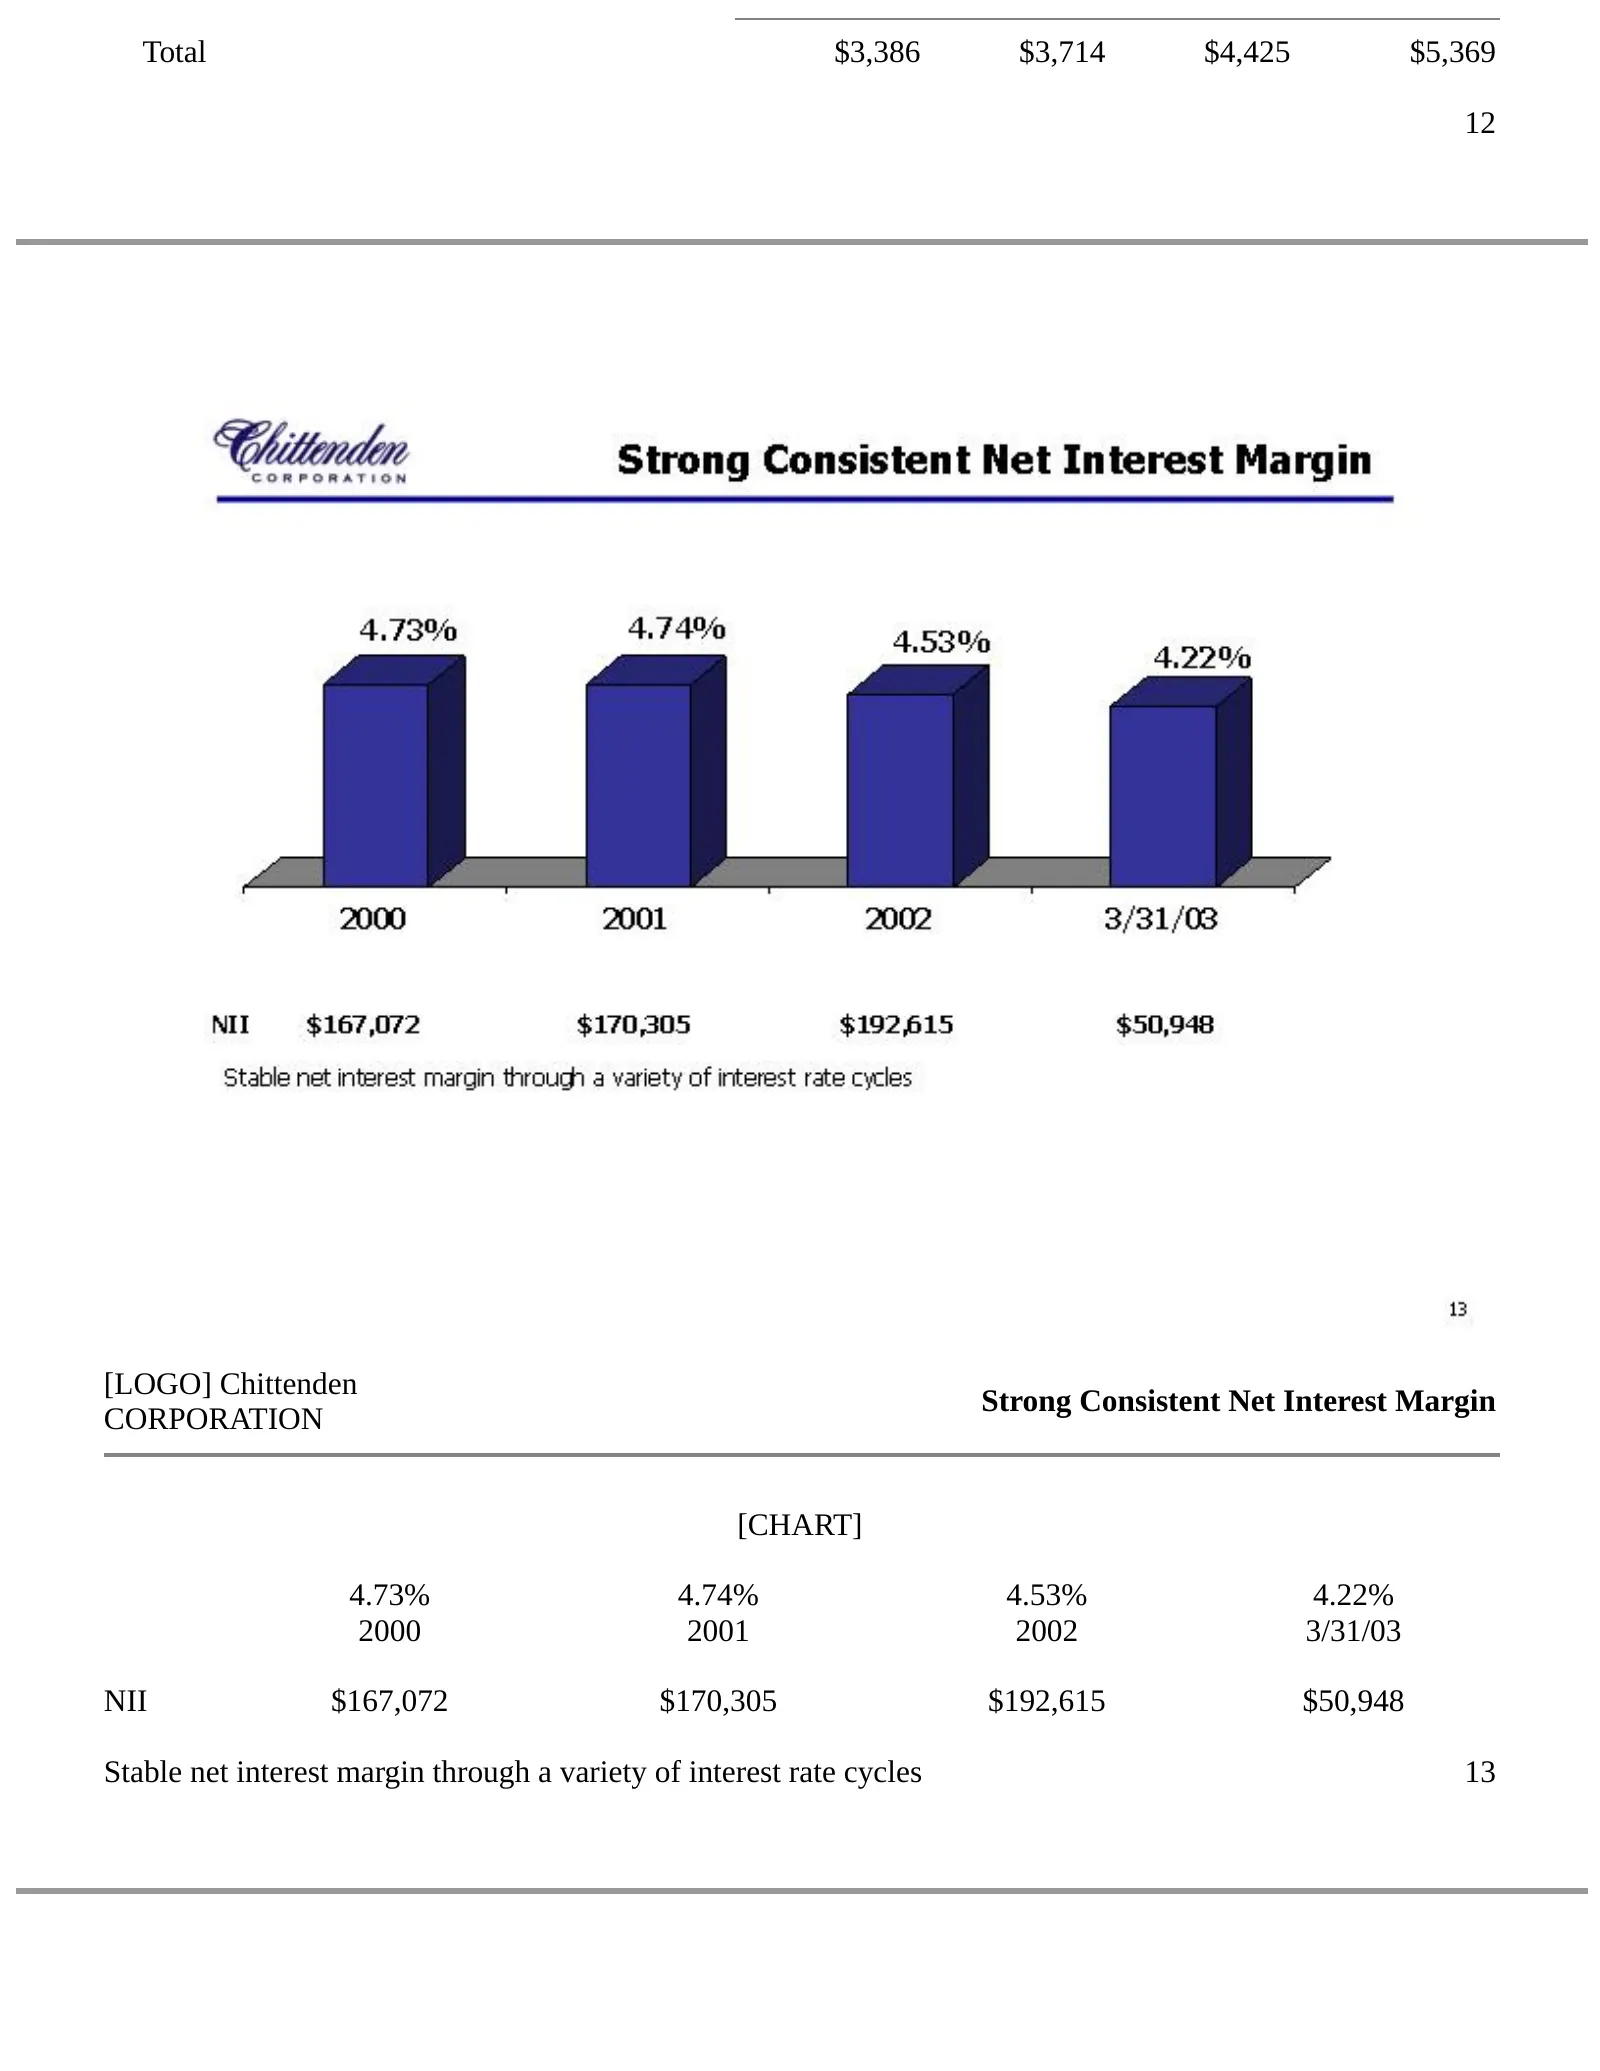
Slide 13: Strong Consistent Net Interest Margin
Total $3,386 $3,714 $4,425 $5,369 12 [LOGO] Chittenden Strong Consistent Net Interest Margin CORPORATION [CHART] 4.73% 4.74% 4.53% 4.22% 2000 2001 2002 3/31/03 NII $167,072 $170,305 $192,615 $50,948 Stable net interest margin through a variety of interest rate cycles 13
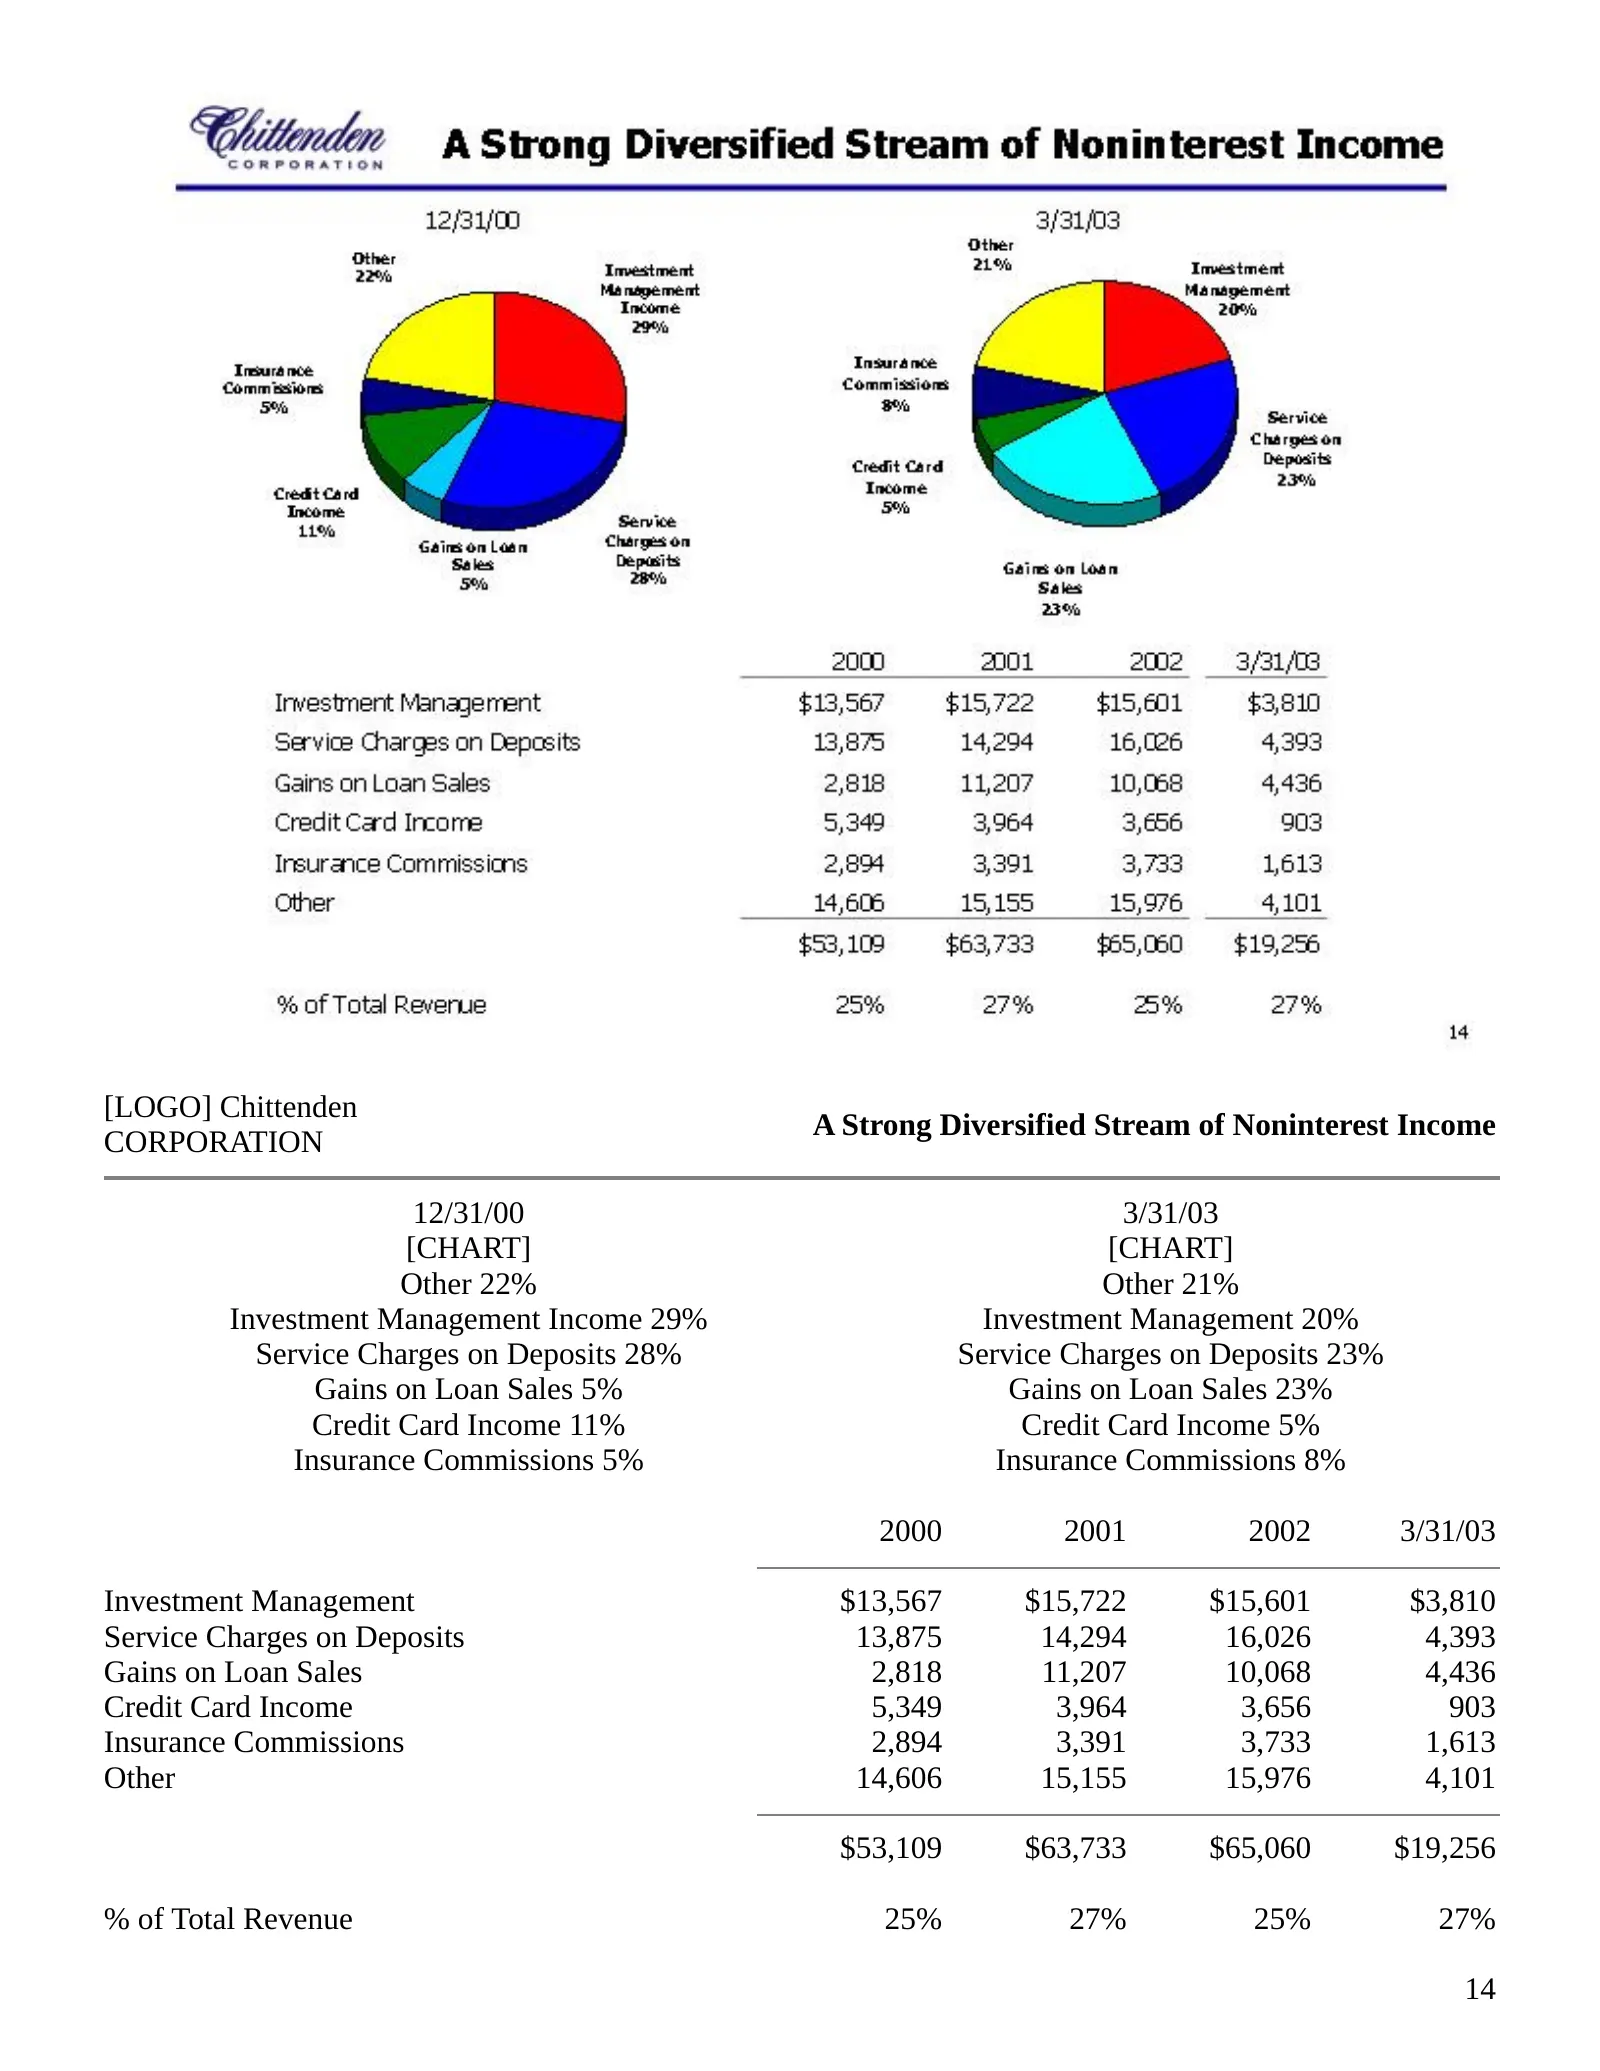
Slide 14: A Strong Diversified Stream of Noninterest Income
[LOGO] Chittenden A Strong Diversified Stream of Noninterest Income CORPORATION 12/31/00 3/31/03 [CHART] [CHART] Other 22% Other 21% Investment Management Income 29% Investment Management 20% Service Charges on Deposits 28% Service Charges on Deposits 23% Gains on Loan Sales 5% Gains on Loan Sales 2
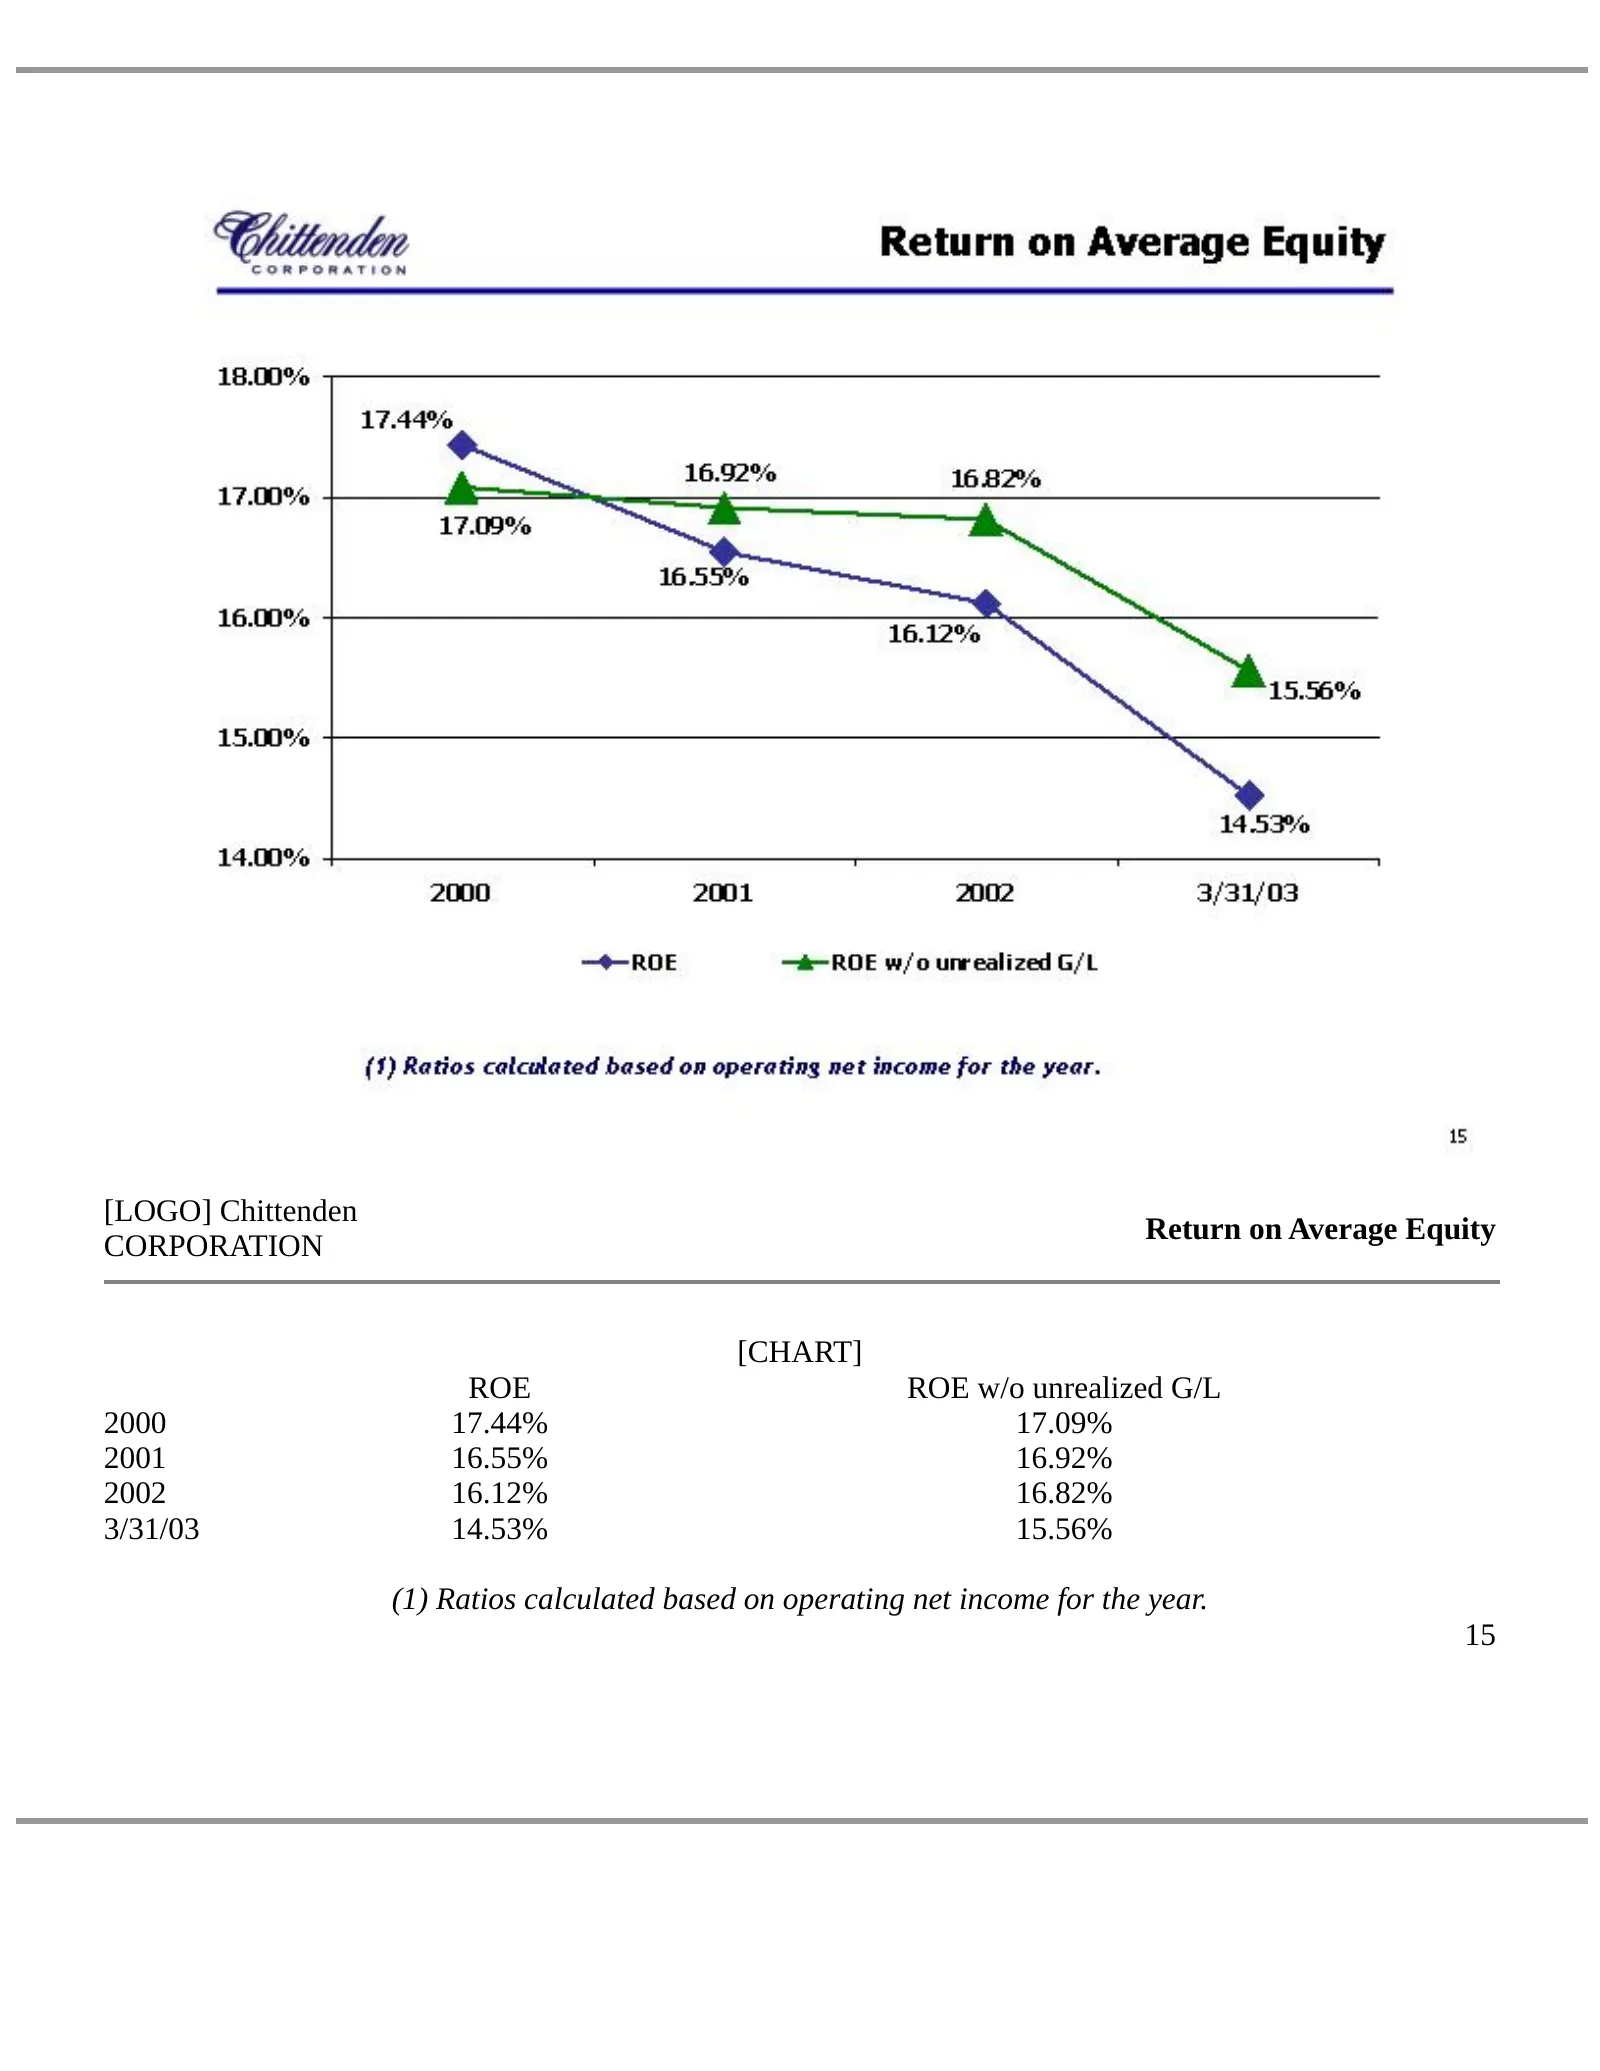
Slide 15: Return on Average Equity
[LOGO] Chittenden Return on Average Equity CORPORATION [CHART] ROE ROE w/o unrealized G/L 2000 17.44% 17.09% 2001 16.55% 16.92% 2002 16.12% 16.82% 3/31/03 14.53% 15.56% (1) Ratios calculated based on operating net income for the year. 15
Slide 16: A Compelling Story
[LOGO] Chittenden A Compelling Story CORPORATION Strong market share and a proven acquisition acumen Low risk balance sheet with a prudent growth strategy Diversified banking services with a solid balance of net interest and fee revenues Low exposure to volatile sectors with a fortress balance sheet
Slide 17: Visit our website
[LOGO]Chittenden CORPORATION Visit our website for a wide range of products, latest financial reports and many other interactive services: www.chittendencorp.com This presentation contains “forward-looking statements” which may describe future plans and strategic initiatives. These forward-looking s
Source: SEC EDGAR · 8-K filed May 9, 2003
More decks from Chittenden Corp
 Investor Presentation (September 2007)38 slides · Sep 7, 2007
 Merger or Acquisition (June 2007)27 slides · Jun 27, 2007
 Chittenden — Merger or Acquisition (June 2007)25 slides · Jun 27, 2007
 Merger or Acquisition (June 2007)9 slides · Jun 5, 2007
 Investor Presentation (May 2007)36 slides · May 14, 2007
 Investor Presentation (February 2007)37 slides · Feb 16, 2007