Consti Oyj · OMXHEX:CONSTI
Consti Oyj — Q3 2018 Earnings Presentation
24 slides from Consti Oyj's earnings presentation, Oct 26, 2018
Slide 1: Consti Group Plc Interim Report 1 January – 30 September 2018
CONSTI GROUP PLC INTERIM REPORT 1 JANUARY – 30 SEPTEMBER 2018 CEO Esa Korkeela CFO Joni Sorsanen Building renovation specialist | www.consti.fi
Slide 2: Contents
Contents Highlights and Group performance Cash flow and financial position Market outlook, guidance and summary Appendix Building renovation specialist | www.consti.fi
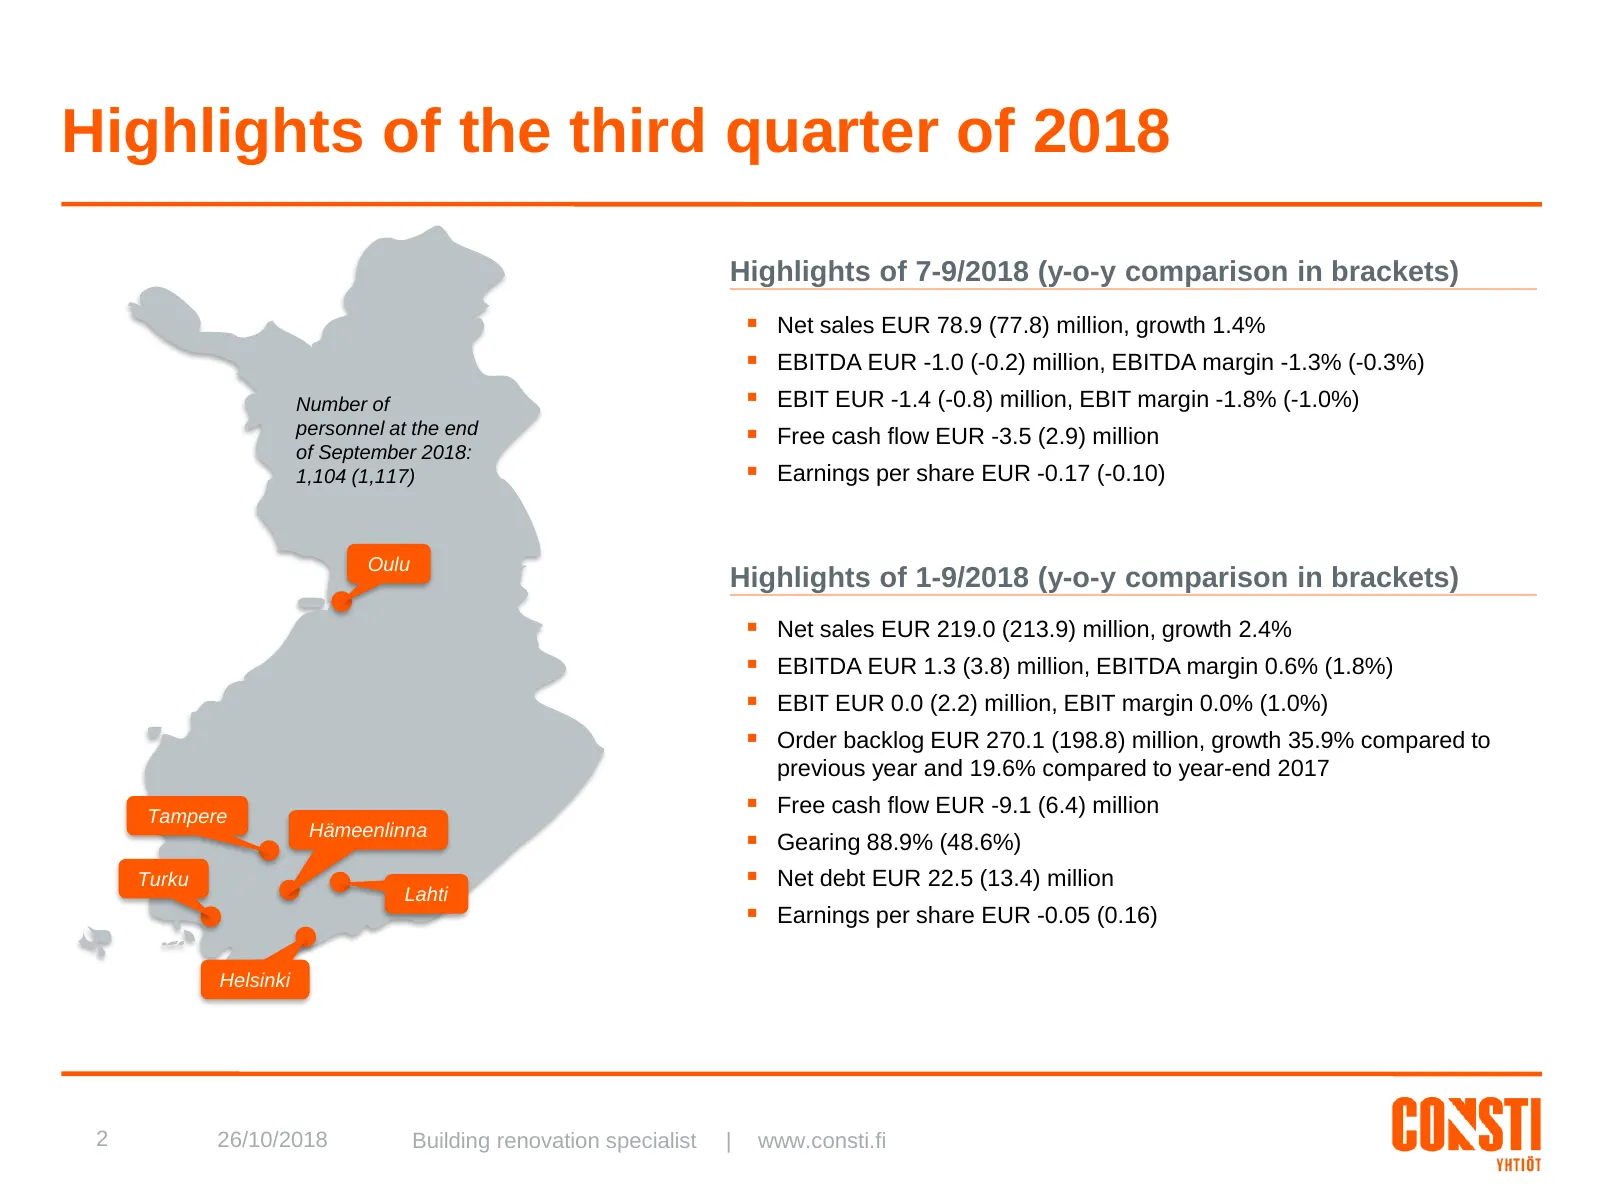
Slide 3: Highlights of the third quarter of 2018
Highlights of the third quarter of 2018 Highlights of 7-9/2018 (y-o-y comparison in brackets) Net sales EUR 78.9 (77.8) million, growth 1.4% EBITDA EUR -1.0 (-0.2) million, EBITDA margin -1.3% (-0.3%) Number of EBIT EUR -1.4 (-0.8) million, EBIT margin -1.8% (-1.0%) personnel at the end Free
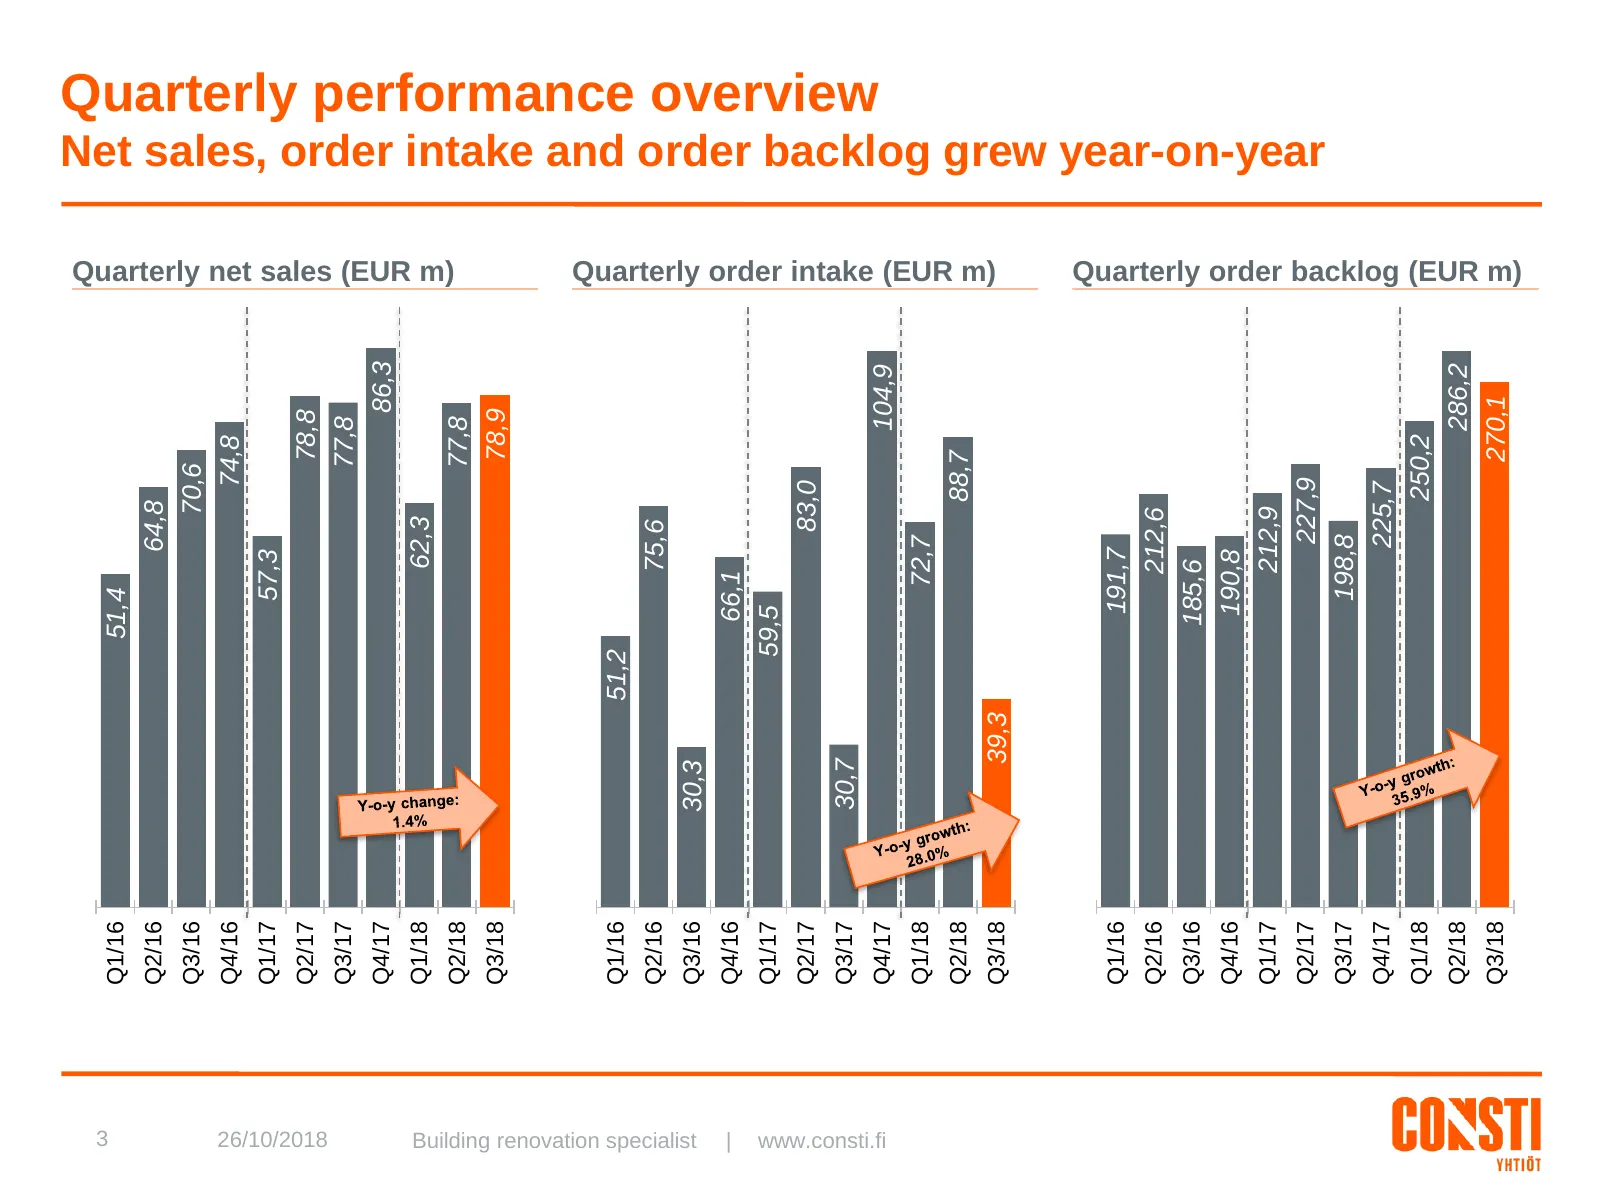
Slide 4: Quarterly performance overview
3 Q1/16 51,4 Q2/16 64,8 Q3/16 70,6 Q4/16 74,8 Q1/17 57,3 Q2/17 78,8 26/10/2018 Q3/17 77,8 Q4/17 86,3 Q1/18 62,3 Quarterly net sales (EUR m) Q2/18 77,8 Q3/18 78,9 Q1/16 51,2 Q2/16 75,6 Building renovation specialist Q3/16 30,3 | Q4/16 66,1 Q1/17 59,5 Q2/17 83,0 Q3/17 30,7 Quarterly performance overvi
Slide 5: Quarterly net sales development
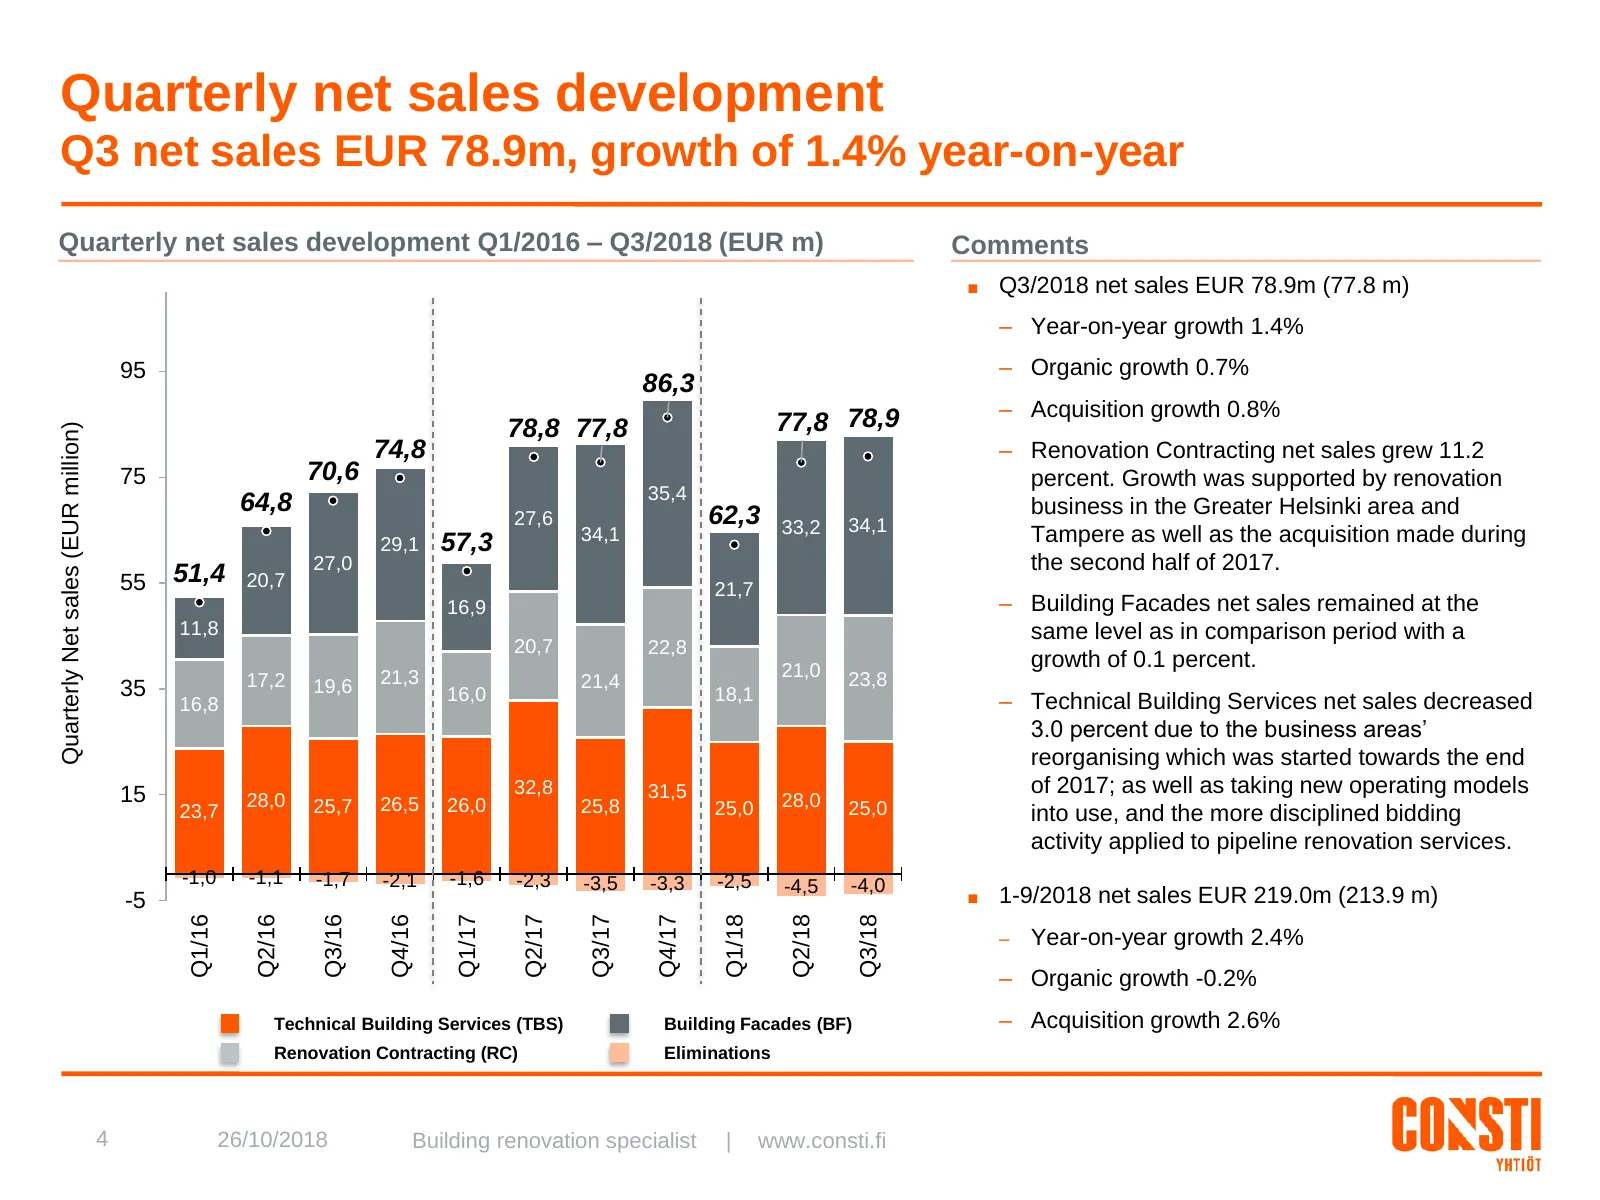
Quarterly net sales development Q3 net sales EUR 78.9m, growth of 1.4% year-on-year Quarterly net sales development Q1/2016 – Q3/2018 (EUR m) Comments ■ Q3/2018 net sales EUR 78.9m (77.8 m) – Year-on-year growth 1.4% 95 – Organic growth 0.7% 86,3 – Acquisition growth 0.8% 78,8 77,8 77,8 78,9 Quarter
Slide 6: Quarterly EBIT development
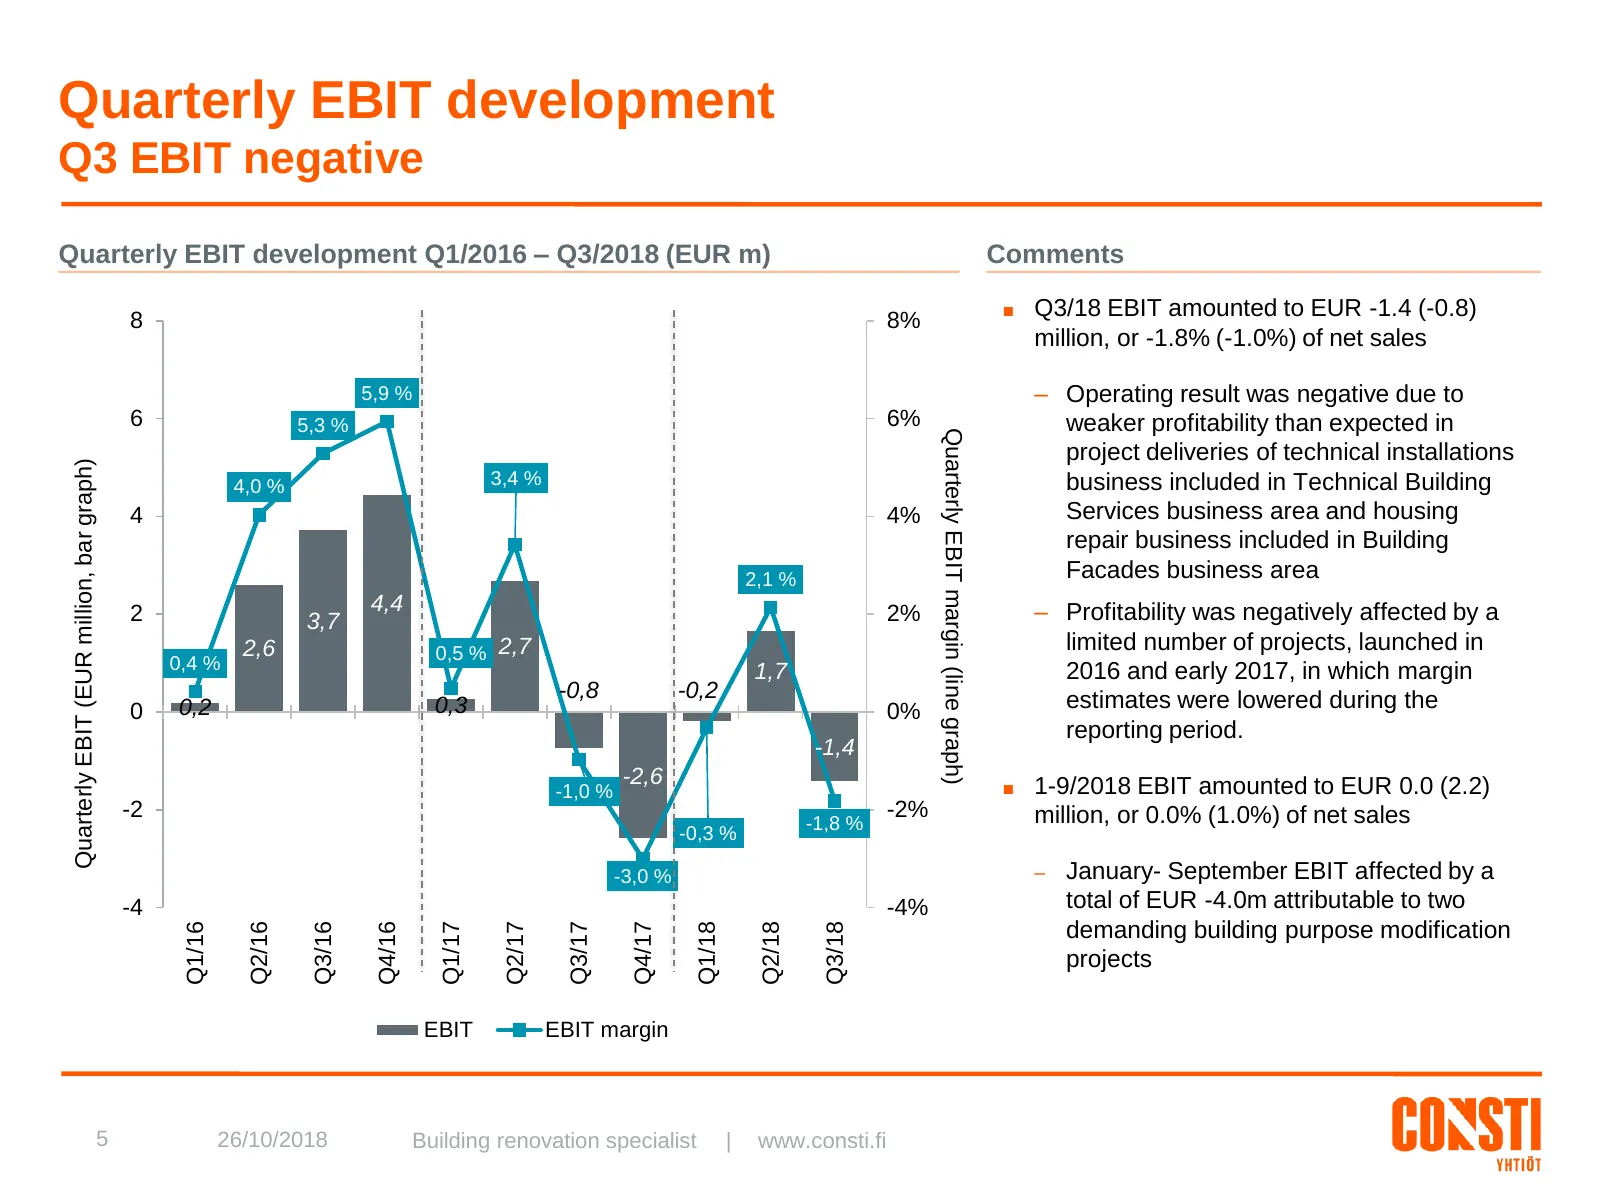
Quarterly EBIT development Q3 EBIT negative Quarterly EBIT development Q1/2016 – Q3/2018 (EUR m) Comments ■ Q3/18 EBIT amounted to EUR -1.4 (-0.8) 8 8% million, or -1.8% (-1.0%) of net sales 5,9 % – Operating result was negative due to 6 5,3 % 6% weaker profitability than expected in Quarterly EBIT
Slide 7: Consti's whale curve for January-September 2018
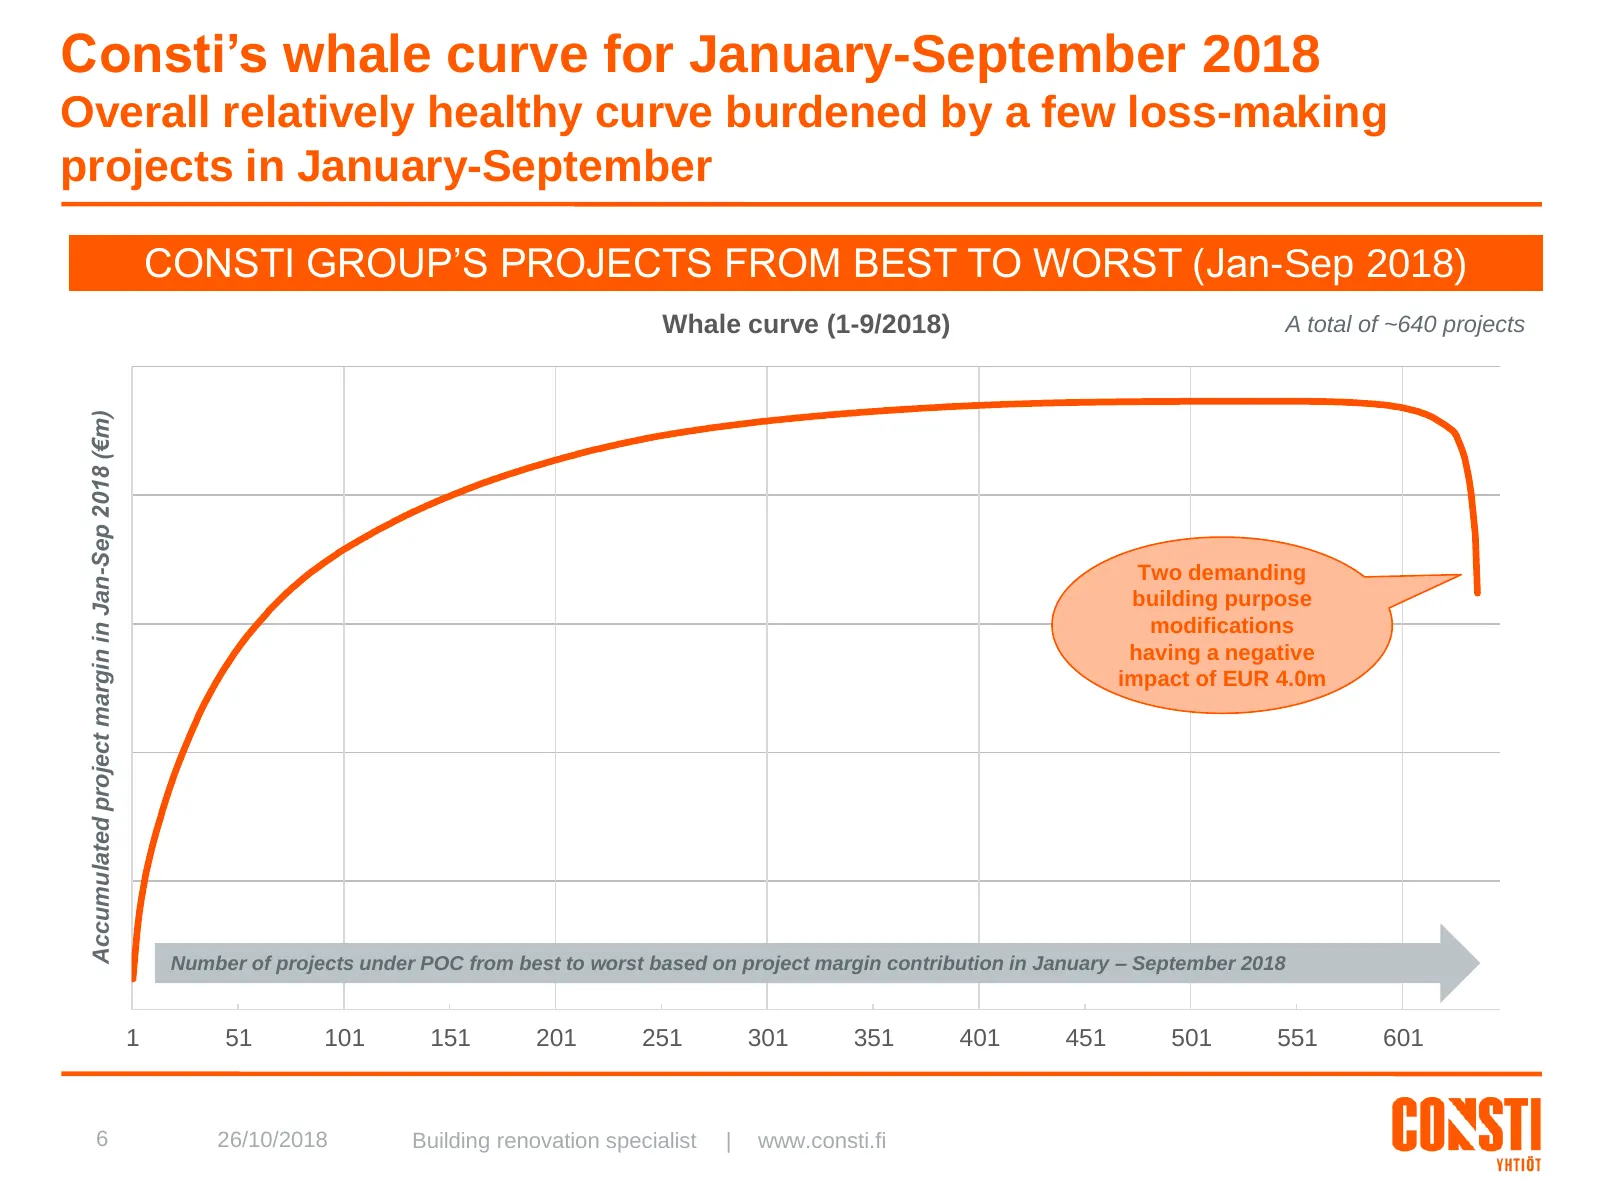
Consti’s whale curve for January-September 2018 Overall relatively healthy curve burdened by a few loss-making projects in January-September CONSTI GROUP’S PROJECTS FROM BEST TO WORST (Jan-Sep 2018) Whale curve (1-9/2018) A total of ~640 projects 25 Accumulated project margin in Jan-Sep 2018 (€m) 20
Slide 8: Actions to improve profitability to be continued
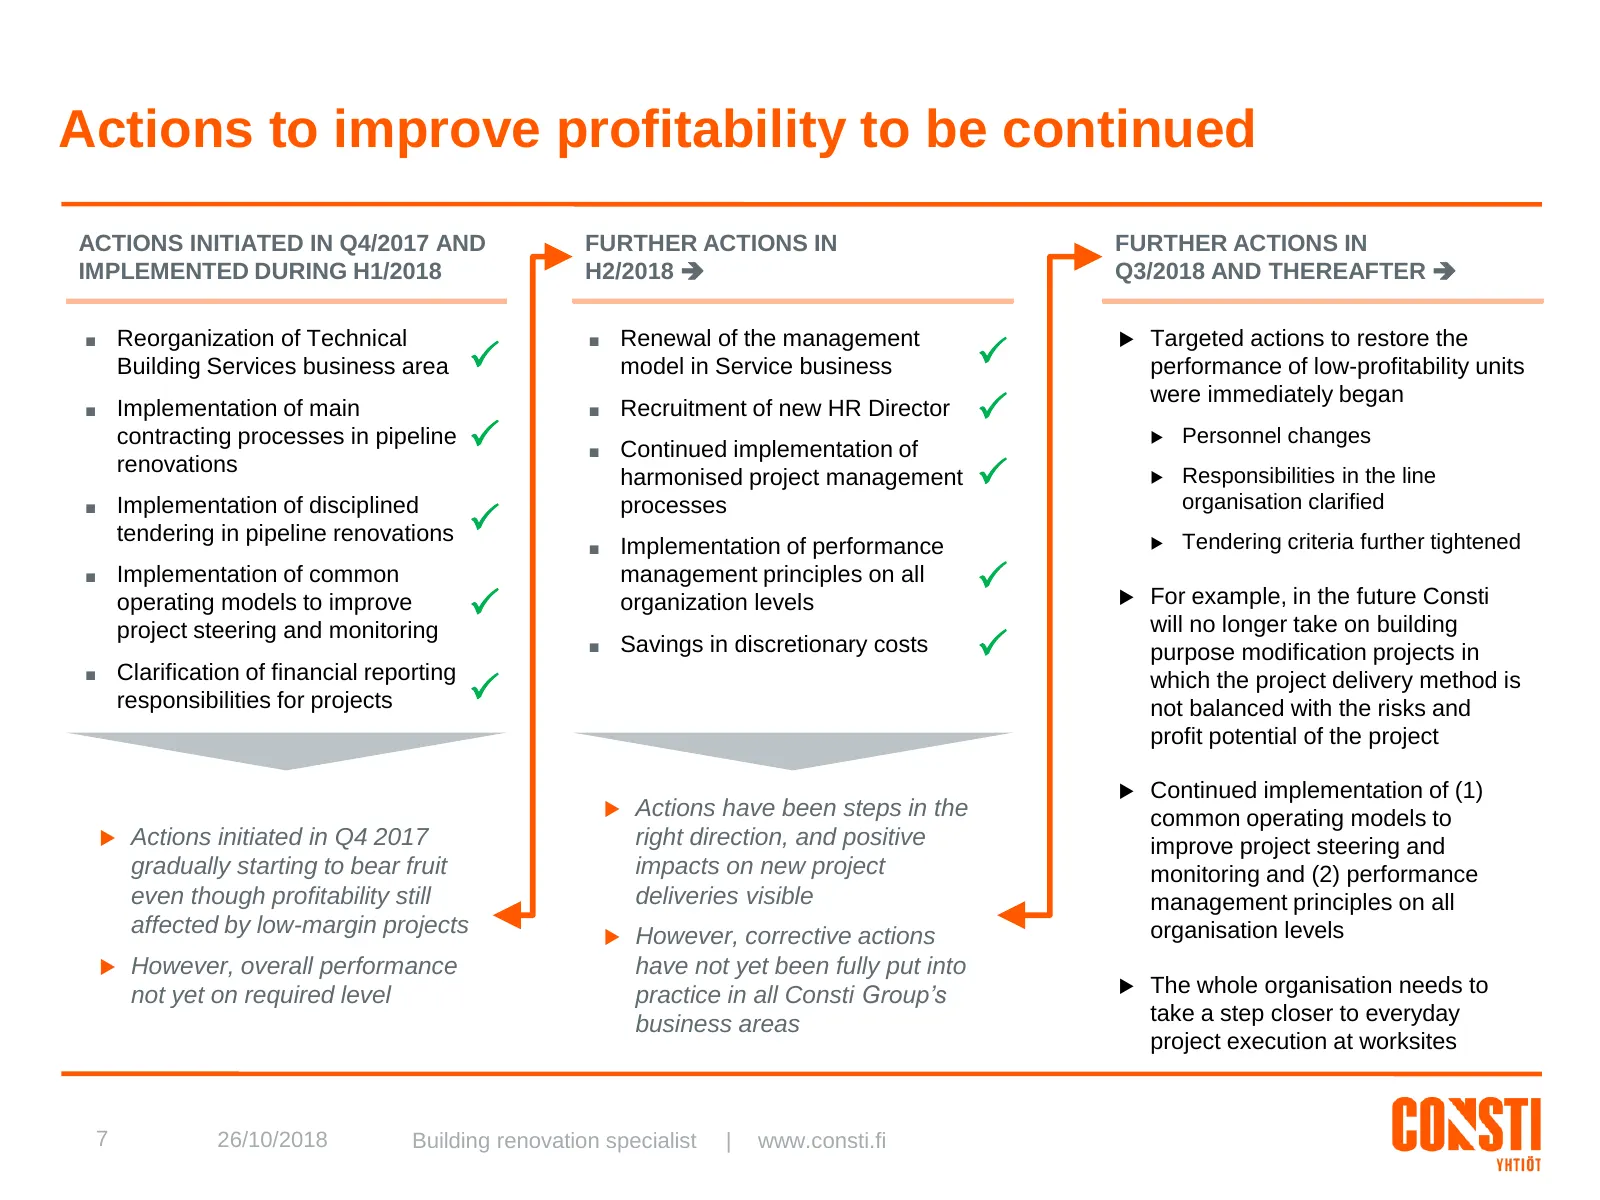
Actions to improve profitability to be continued ACTIONS INITIATED IN Q4/2017 AND FURTHER ACTIONS IN FURTHER ACTIONS IN IMPLEMENTED DURING H1/2018 H2/2018 Q3/2018 AND THEREAFTER ■ Reorganization of Technical ■ Renewal of the management Targeted actions to restore the Building Services business
Slide 9: Quarterly order intake development
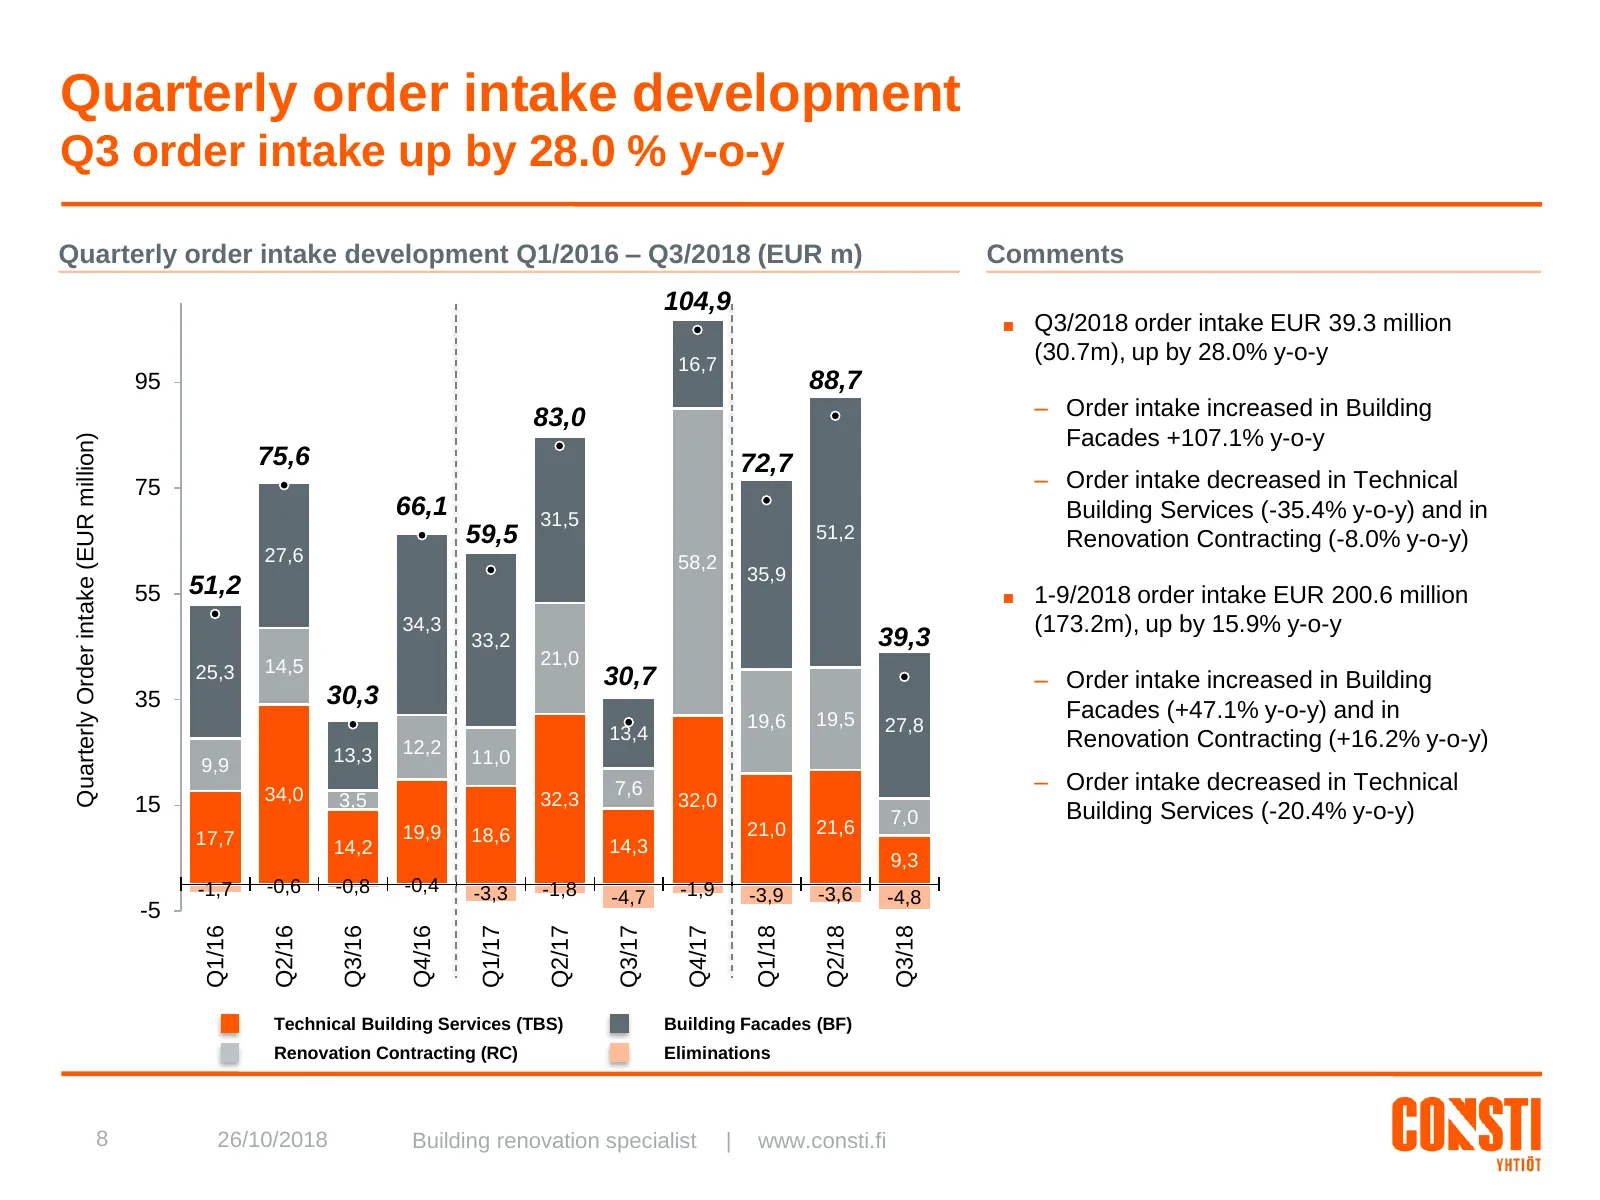
Quarterly order intake development Q3 order intake up by 28.0 % y-o-y Quarterly order intake development Q1/2016 – Q3/2018 (EUR m) Comments 104,9 ■ Q3/2018 order intake EUR 39.3 million 16,7 (30.7m), up by 28.0% y-o-y 95 88,7 83,0 – Order intake increased in Building Facades +107.1% y-o-y Quarterly
Slide 10: Examples of new orders received in Q3/2018
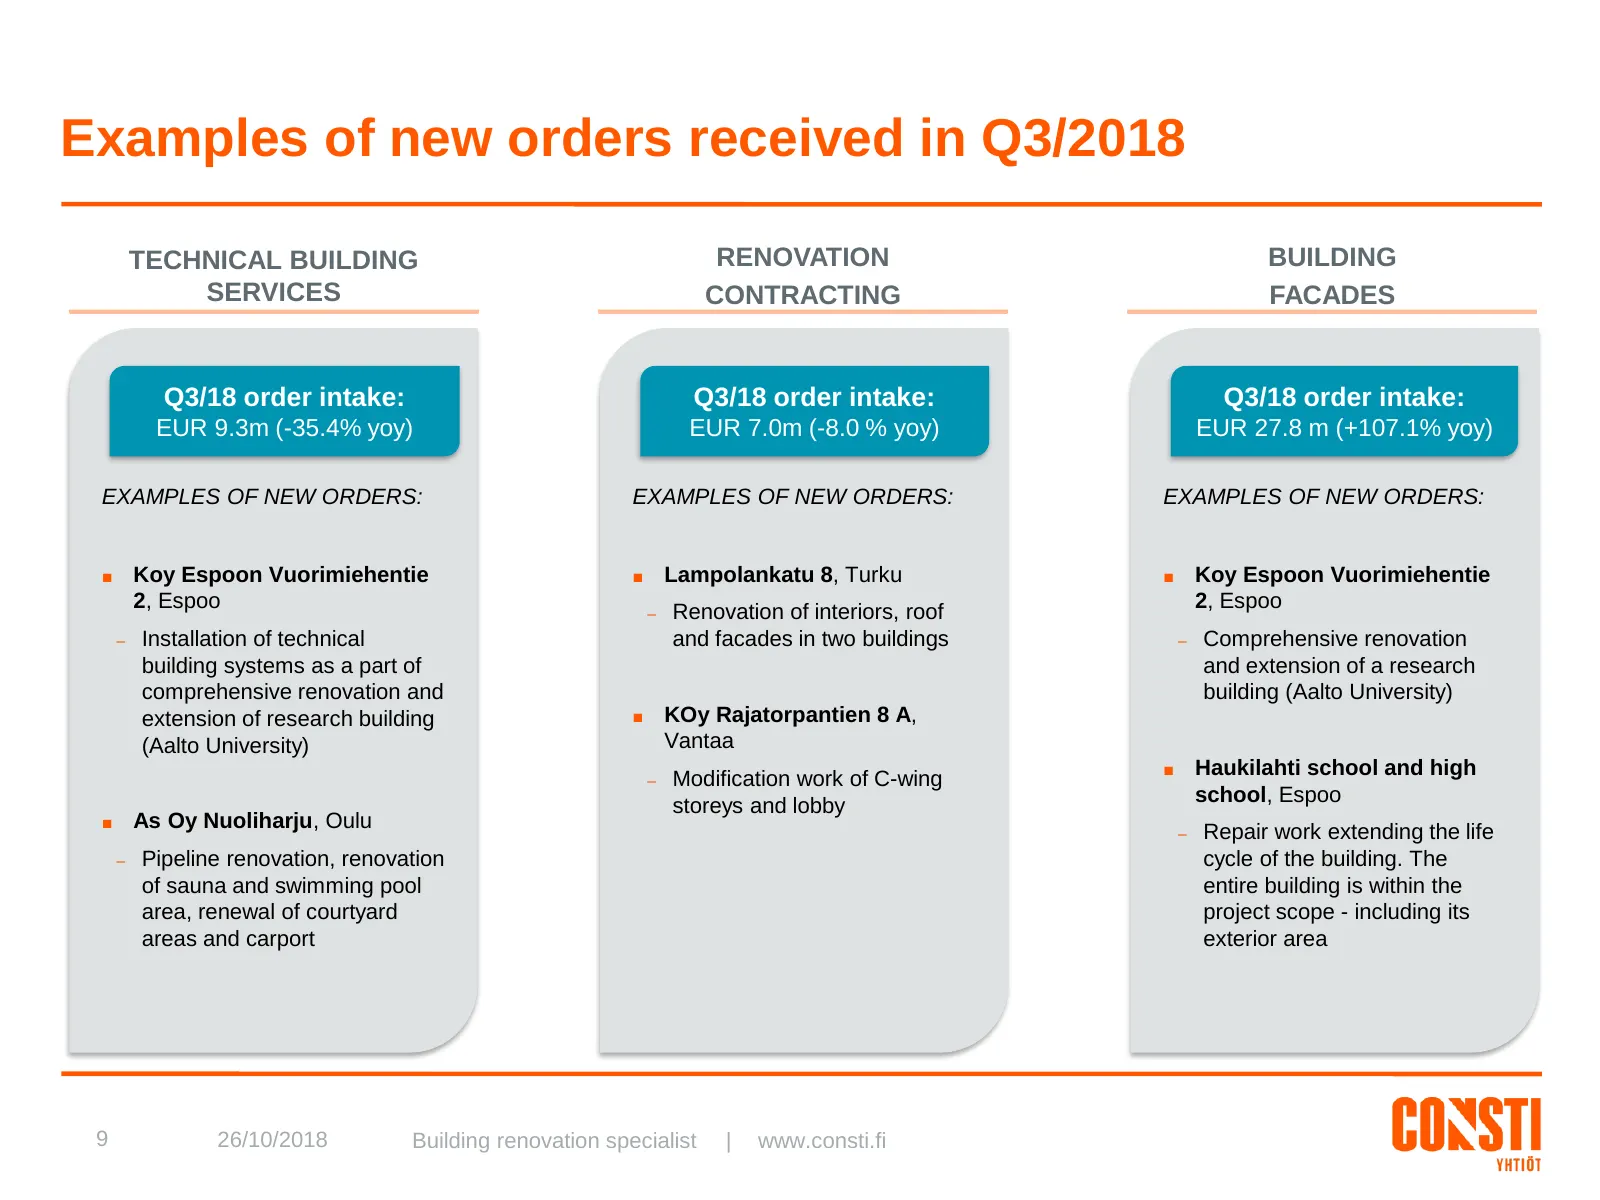
Examples of new orders received in Q3/2018 TECHNICAL BUILDING RENOVATION BUILDING SERVICES CONTRACTING FACADES Q3/18 order intake: Q3/18 order intake: Q3/18 order intake: EUR 9.3m (-35.4% yoy) EUR 7.0m (-8.0 % yoy) EUR 27.8 m (+107.1% yoy) EXAMPLES OF NEW ORDERS: EXAMPLES OF NEW ORDERS: EXAMPLES OF
Slide 11: Quarterly order backlog development
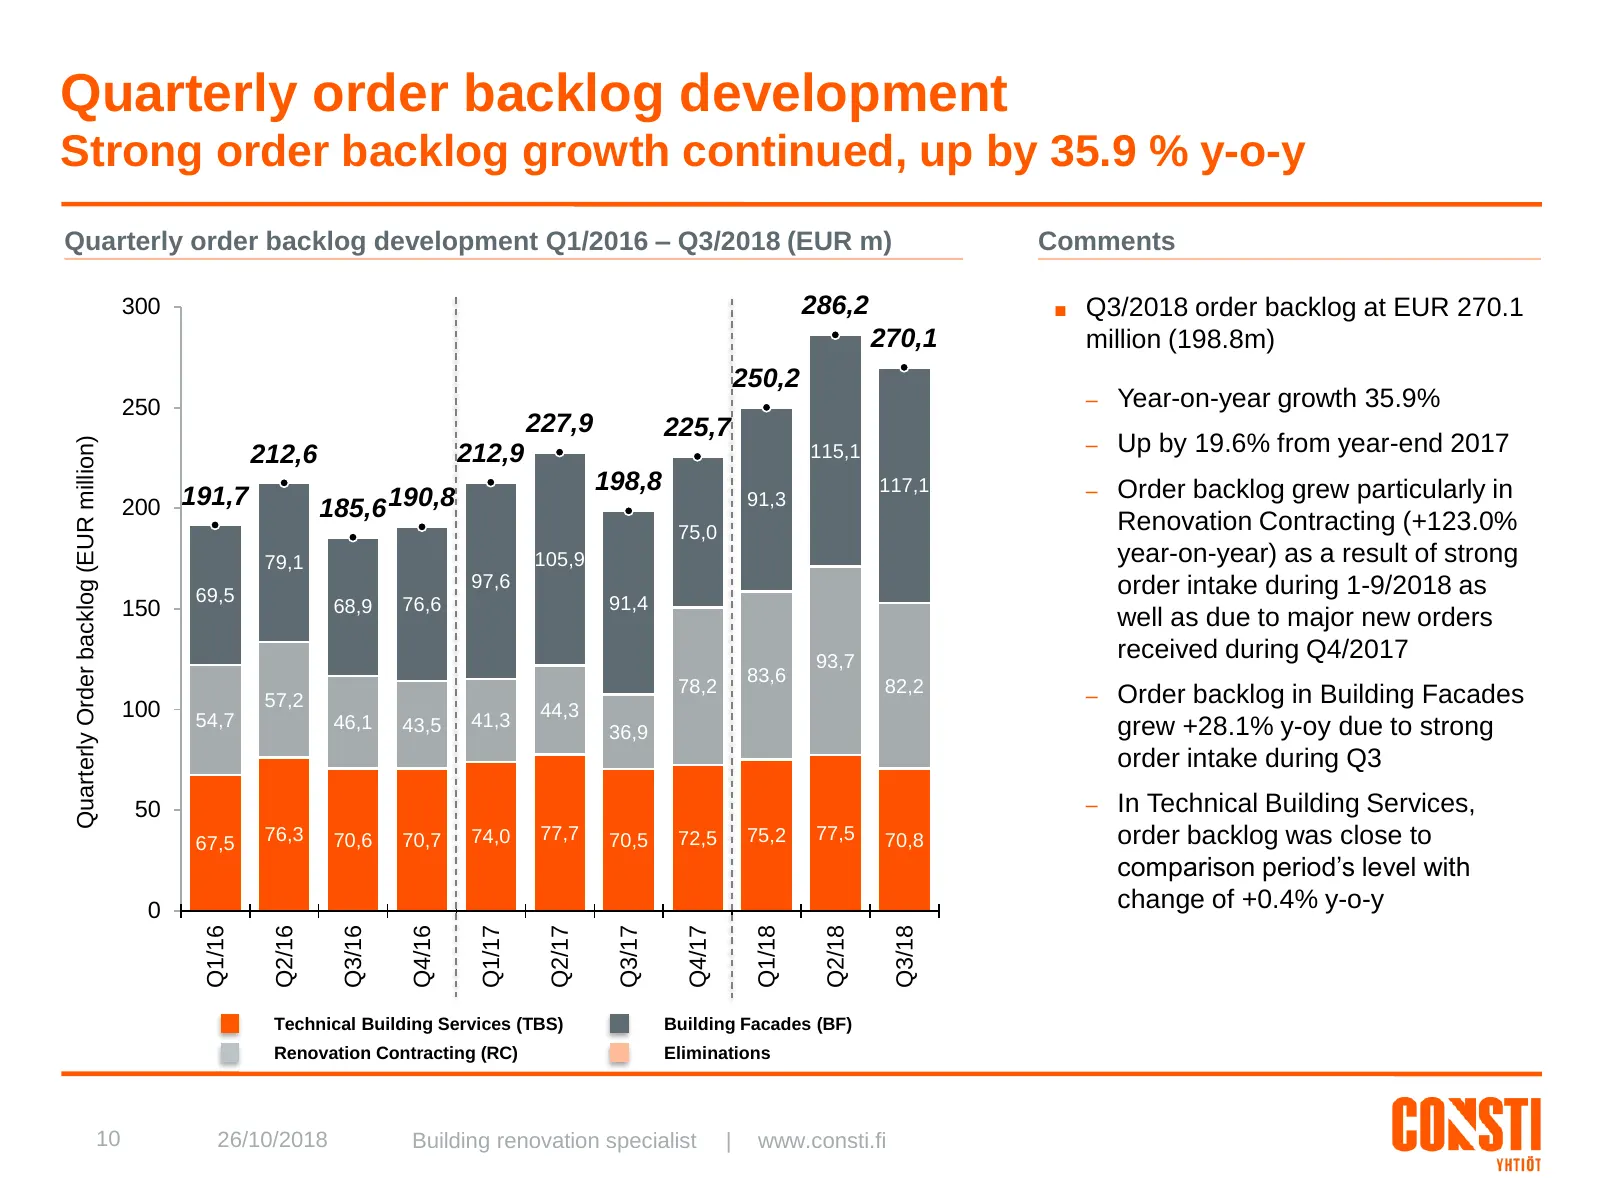
Quarterly order backlog development Strong order backlog growth continued, up by 35.9 % y-o-y Quarterly order backlog development Q1/2016 – Q3/2018 (EUR m) Comments 300 286,2 ■ Q3/2018 order backlog at EUR 270.1 270,1 million (198.8m) 250,2 250 – Year-on-year growth 35.9% 227,9 225,7 – Up by 19.6% f
Slide 12: Cash flow and financial position
Cash flow and financial position 11 26/10/2018 Building renovation specialist | www.consti.fi
Slide 13: Quarterly free cash flow development
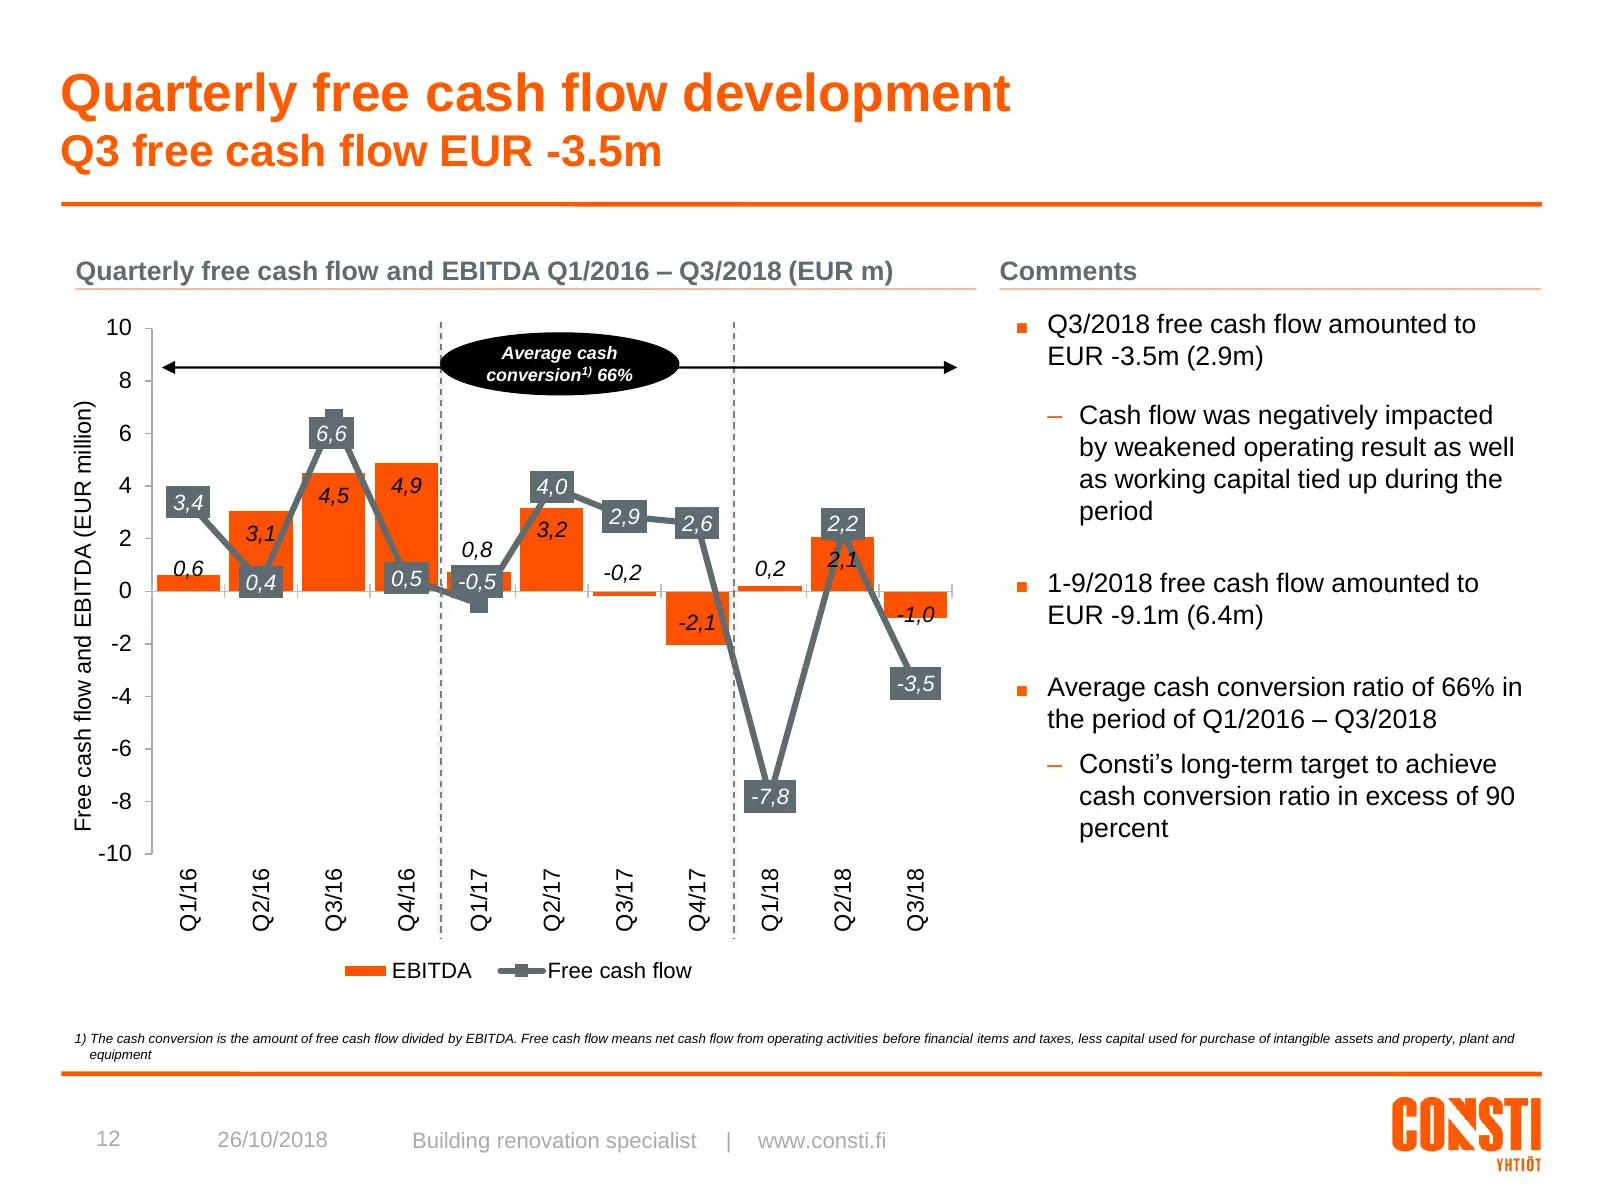
Quarterly free cash flow development Q3 free cash flow EUR -3.5m Quarterly free cash flow and EBITDA Q1/2016 – Q3/2018 (EUR m) Comments 10 ■ Q3/2018 free cash flow amounted to Average cash EUR -3.5m (2.9m) 8 conversion1) 66% – Cash flow was negatively impacted Free cash flow and EBITDA (EUR million)
Slide 14: Quarterly net working capital development
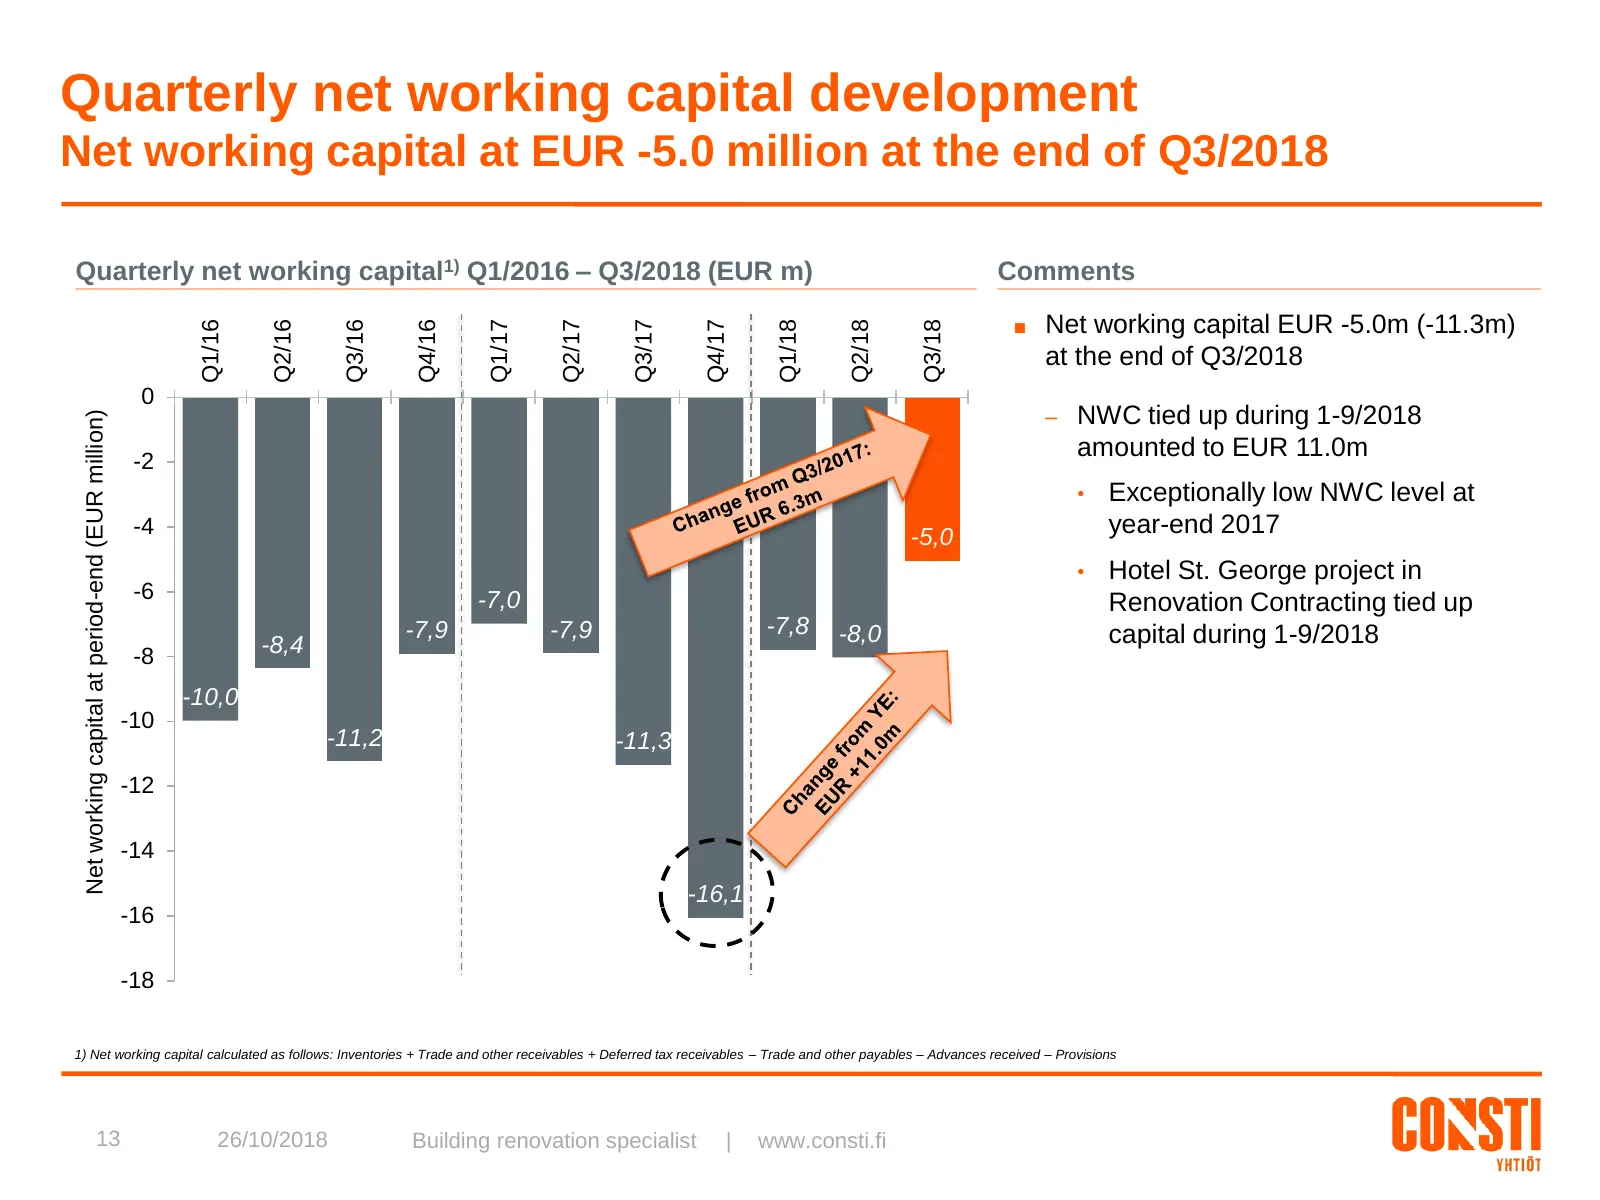
Quarterly net working capital development Net working capital at EUR -5.0 million at the end of Q3/2018 Quarterly net working capital1) Q1/2016 – Q3/2018 (EUR m) Comments ■ Net working capital EUR -5.0m (-11.3m) Q1/16 Q2/16 Q3/16 Q4/16 Q1/17 Q2/17 Q3/17 Q4/17 Q1/18 Q2/18 Q3/18 at the end of Q3/2018
Slide 15: Quarterly balance sheet structure
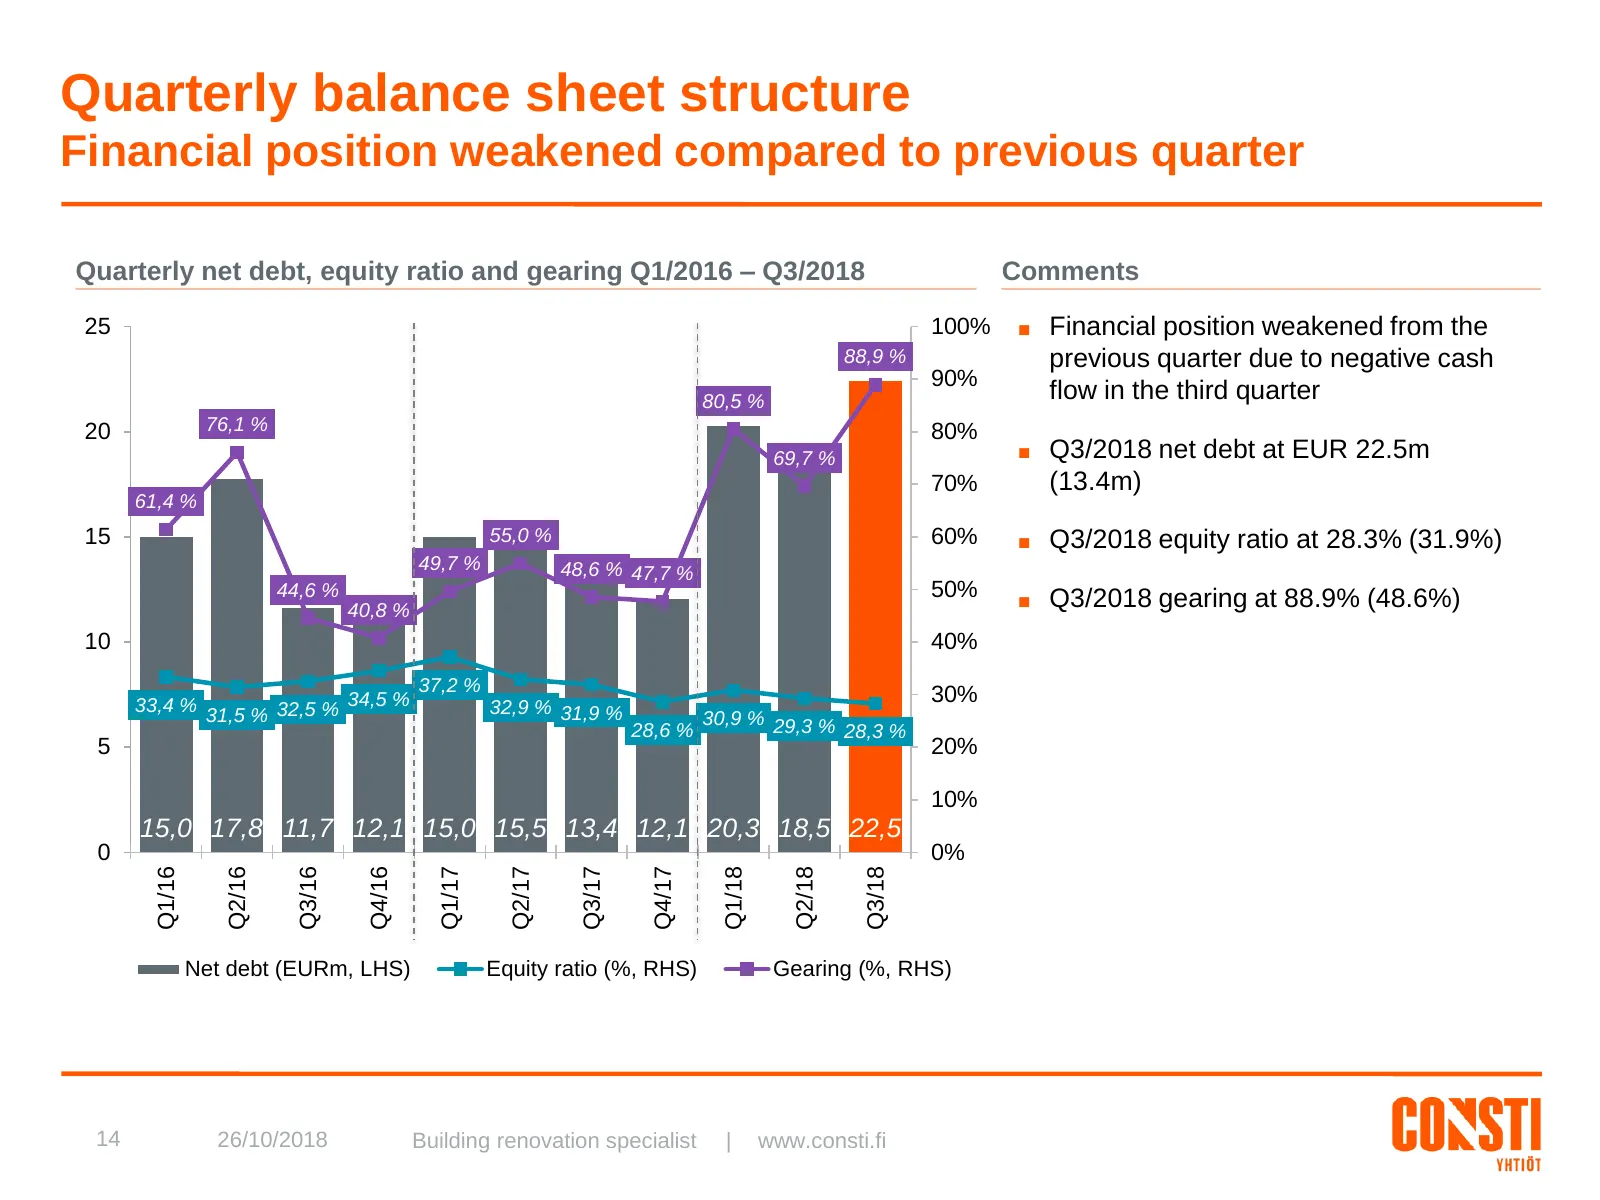
Quarterly balance sheet structure Financial position weakened compared to previous quarter Quarterly net debt, equity ratio and gearing Q1/2016 – Q3/2018 Comments 25 100% ■ Financial position weakened from the 88,9 % previous quarter due to negative cash 90% 80,5 % flow in the third quarter 20 76,1
Slide 16: Market outlook, guidance and summary
Market outlook, guidance and summary 15 26/10/2018 Building renovation specialist | www.consti.fi
Slide 17: Lead indicators for the Finnish economy and construction remain good
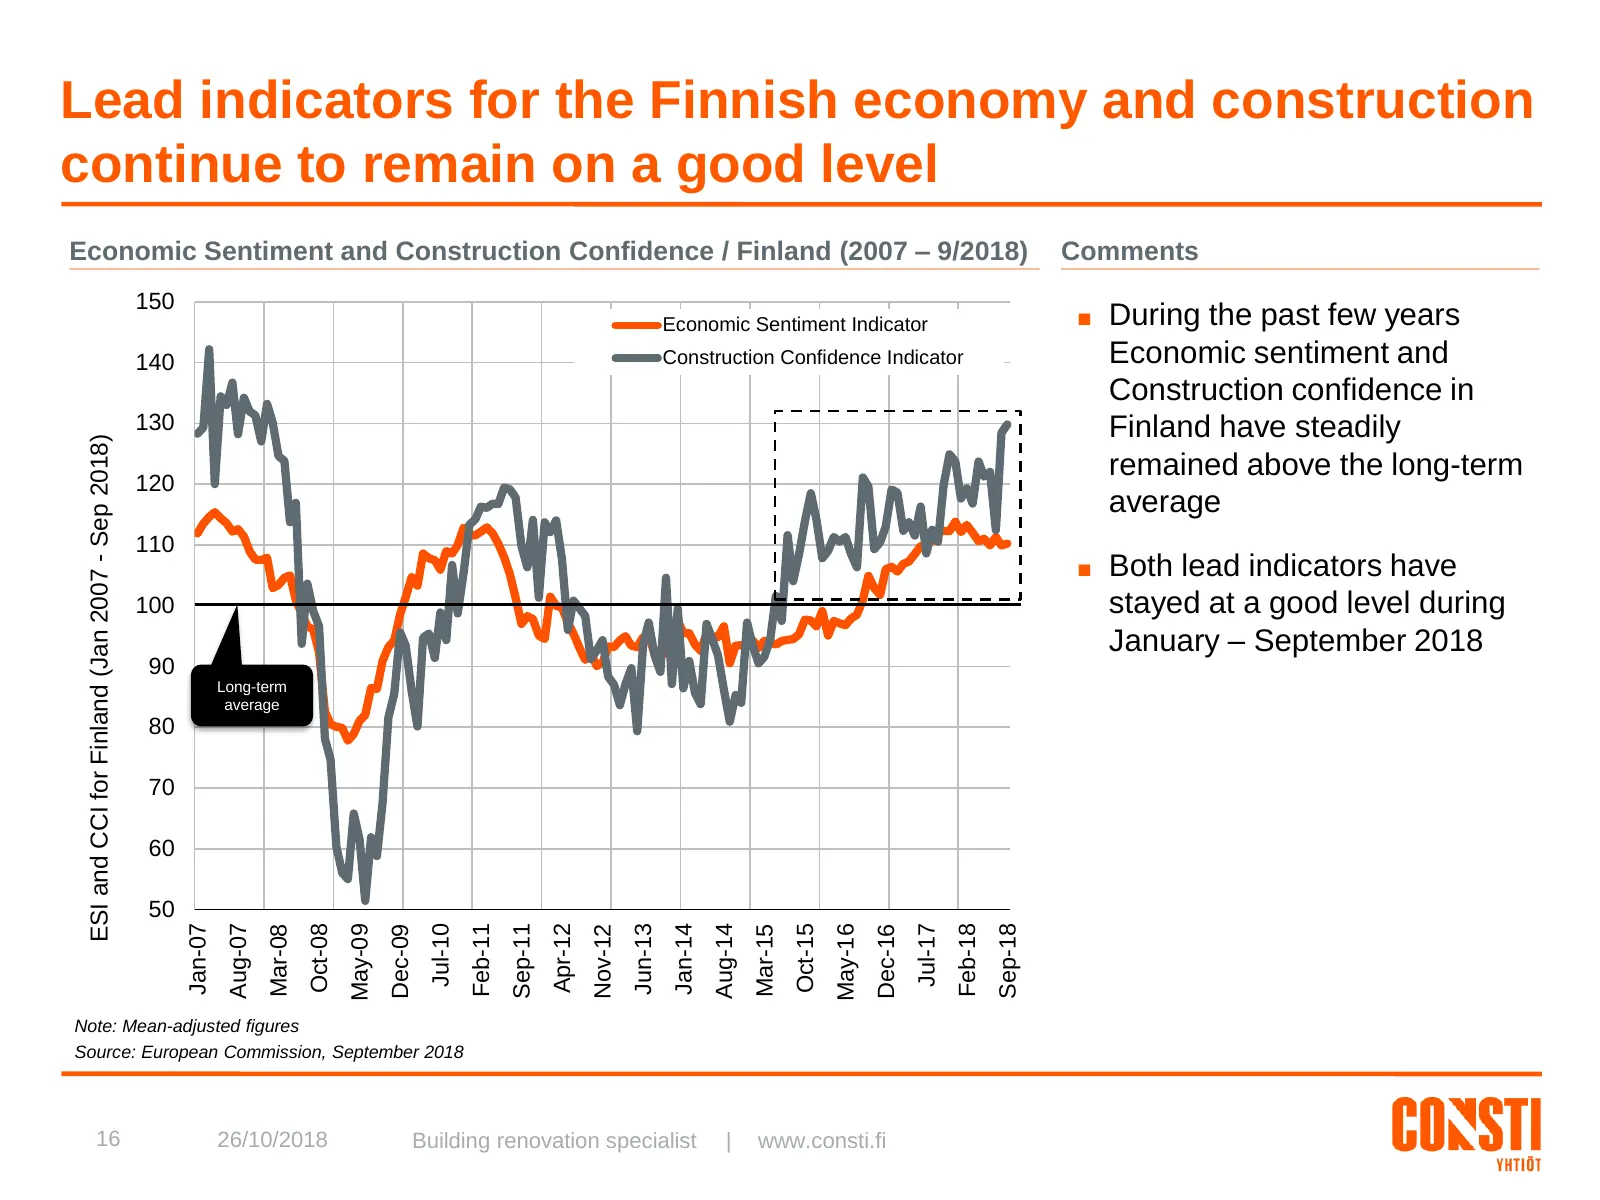
Lead indicators for the Finnish economy and construction continue to remain on a good level Economic Sentiment and Construction Confidence / Finland (2007 – 9/2018) Comments 150 Economic Sentiment Indicator ■ During the past few years 140 Construction Confidence Indicator Economic sentiment and Cons
Slide 18: Stable growth in renovation to continue
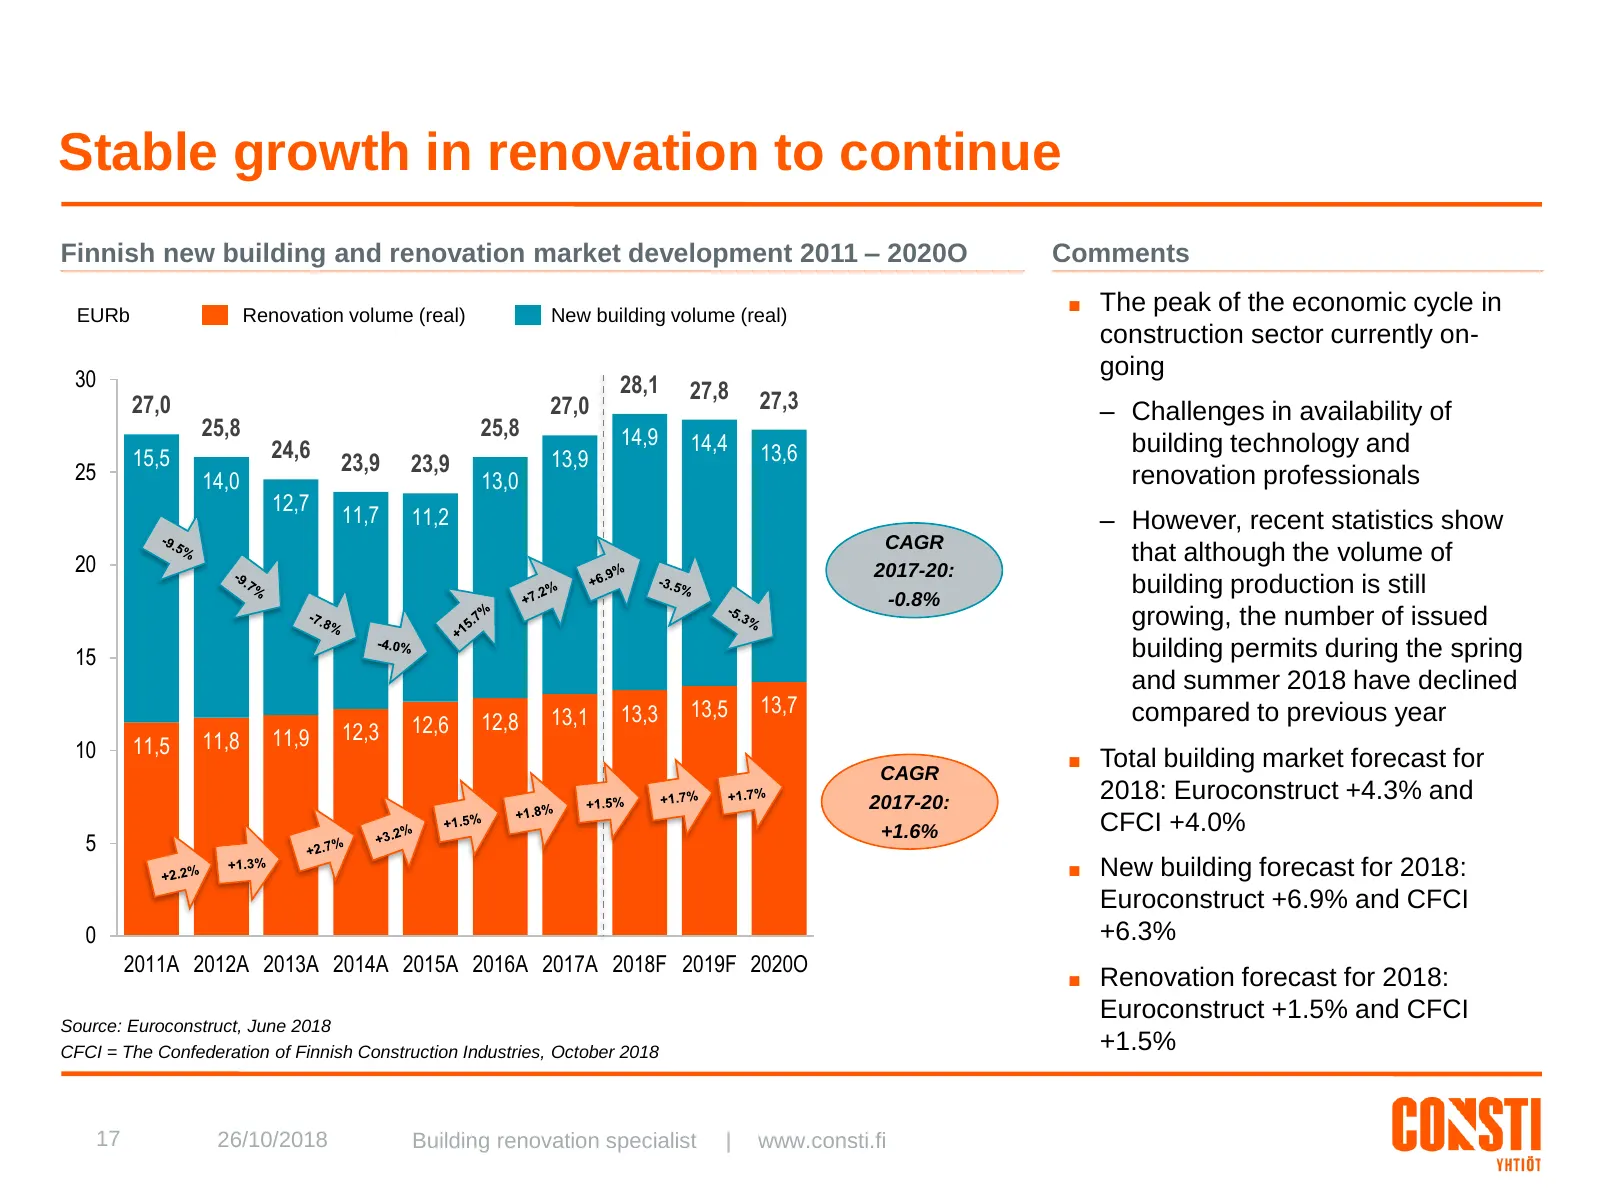
Stable growth in renovation to continue Finnish new building and renovation market development 2011 – 2020O Comments ■ The peak of the economic cycle in EURb Renovation volume (real) New building volume (real) construction sector currently on- 30 going 28,1 27,8 27,0 27,0 27,3 – Challenges in availa
Slide 19: Demand-driven renovation market growth supported by structural growth drivers
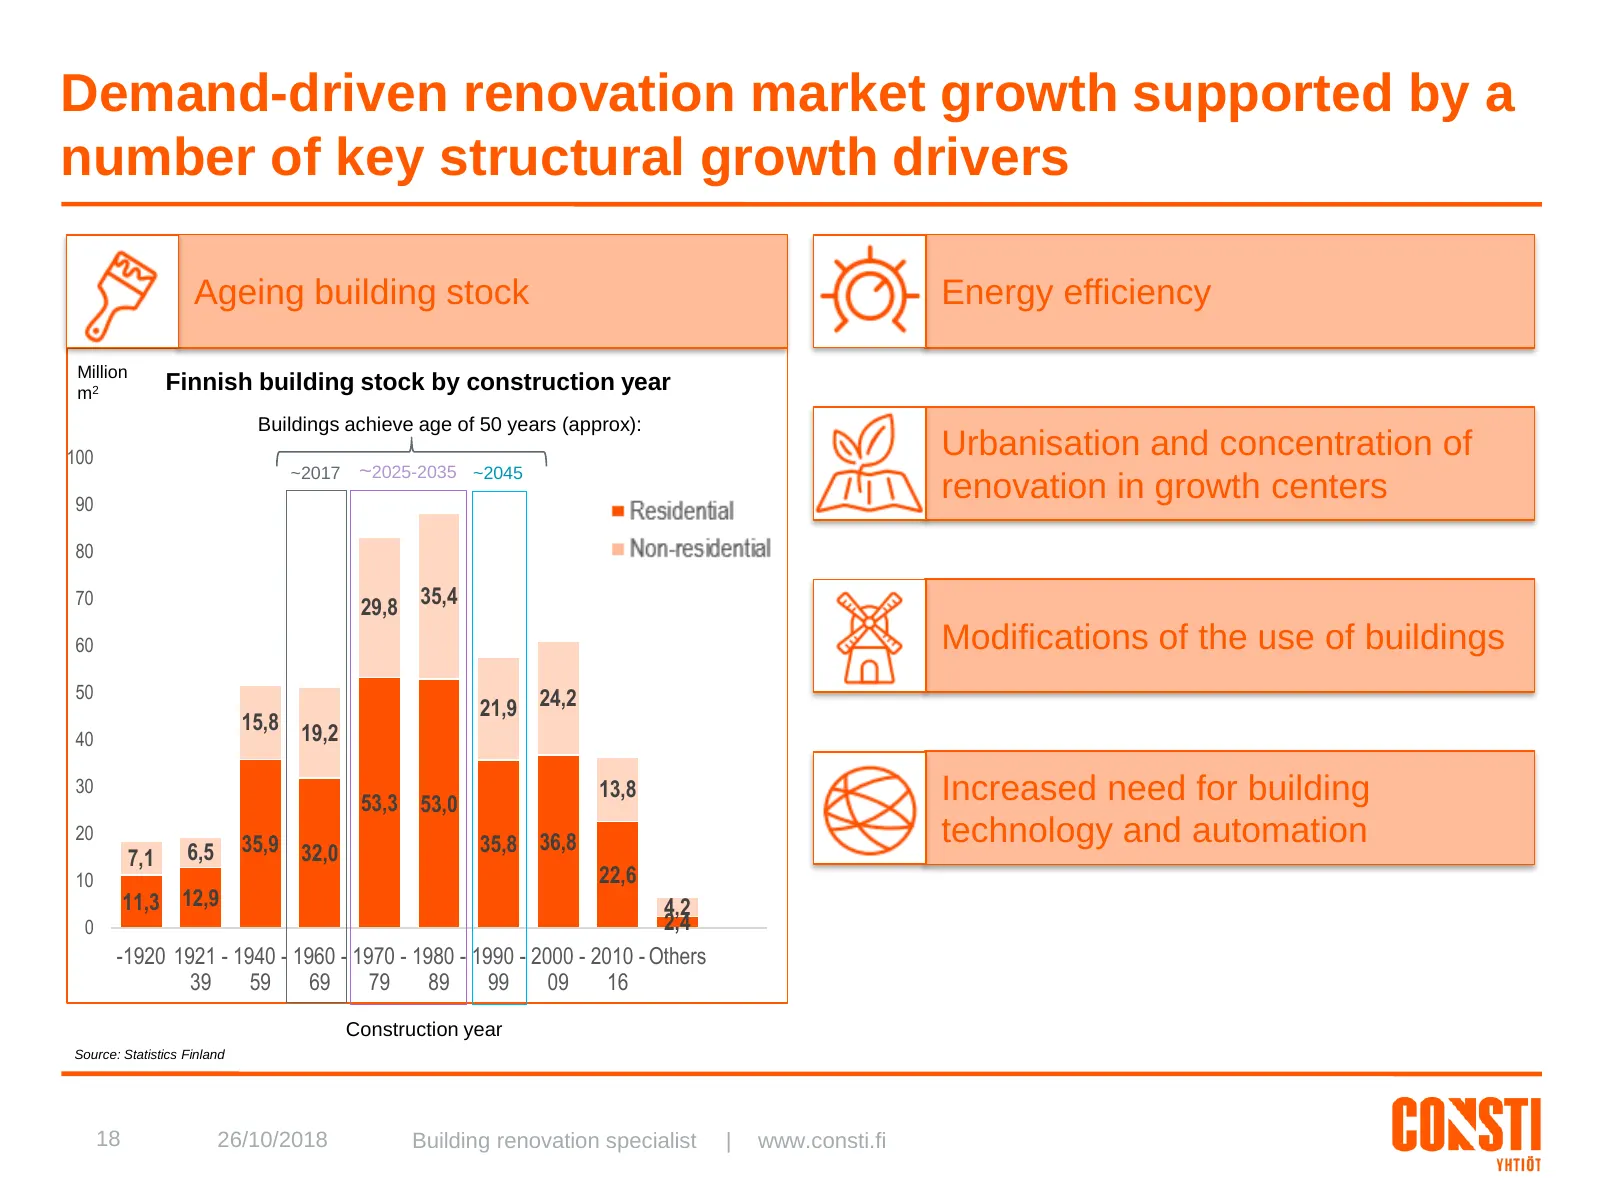
Demand-driven renovation market growth supported by a number of key structural growth drivers Ageing building stock Energy efficiency Million m2 Finnish building stock by construction year Buildings achieve age of 50 years (approx): 100 Urbanisation and concentration of ~2017 ~2025-2035 ~2045 90 88,
Slide 20: Guidance for financial year 2018
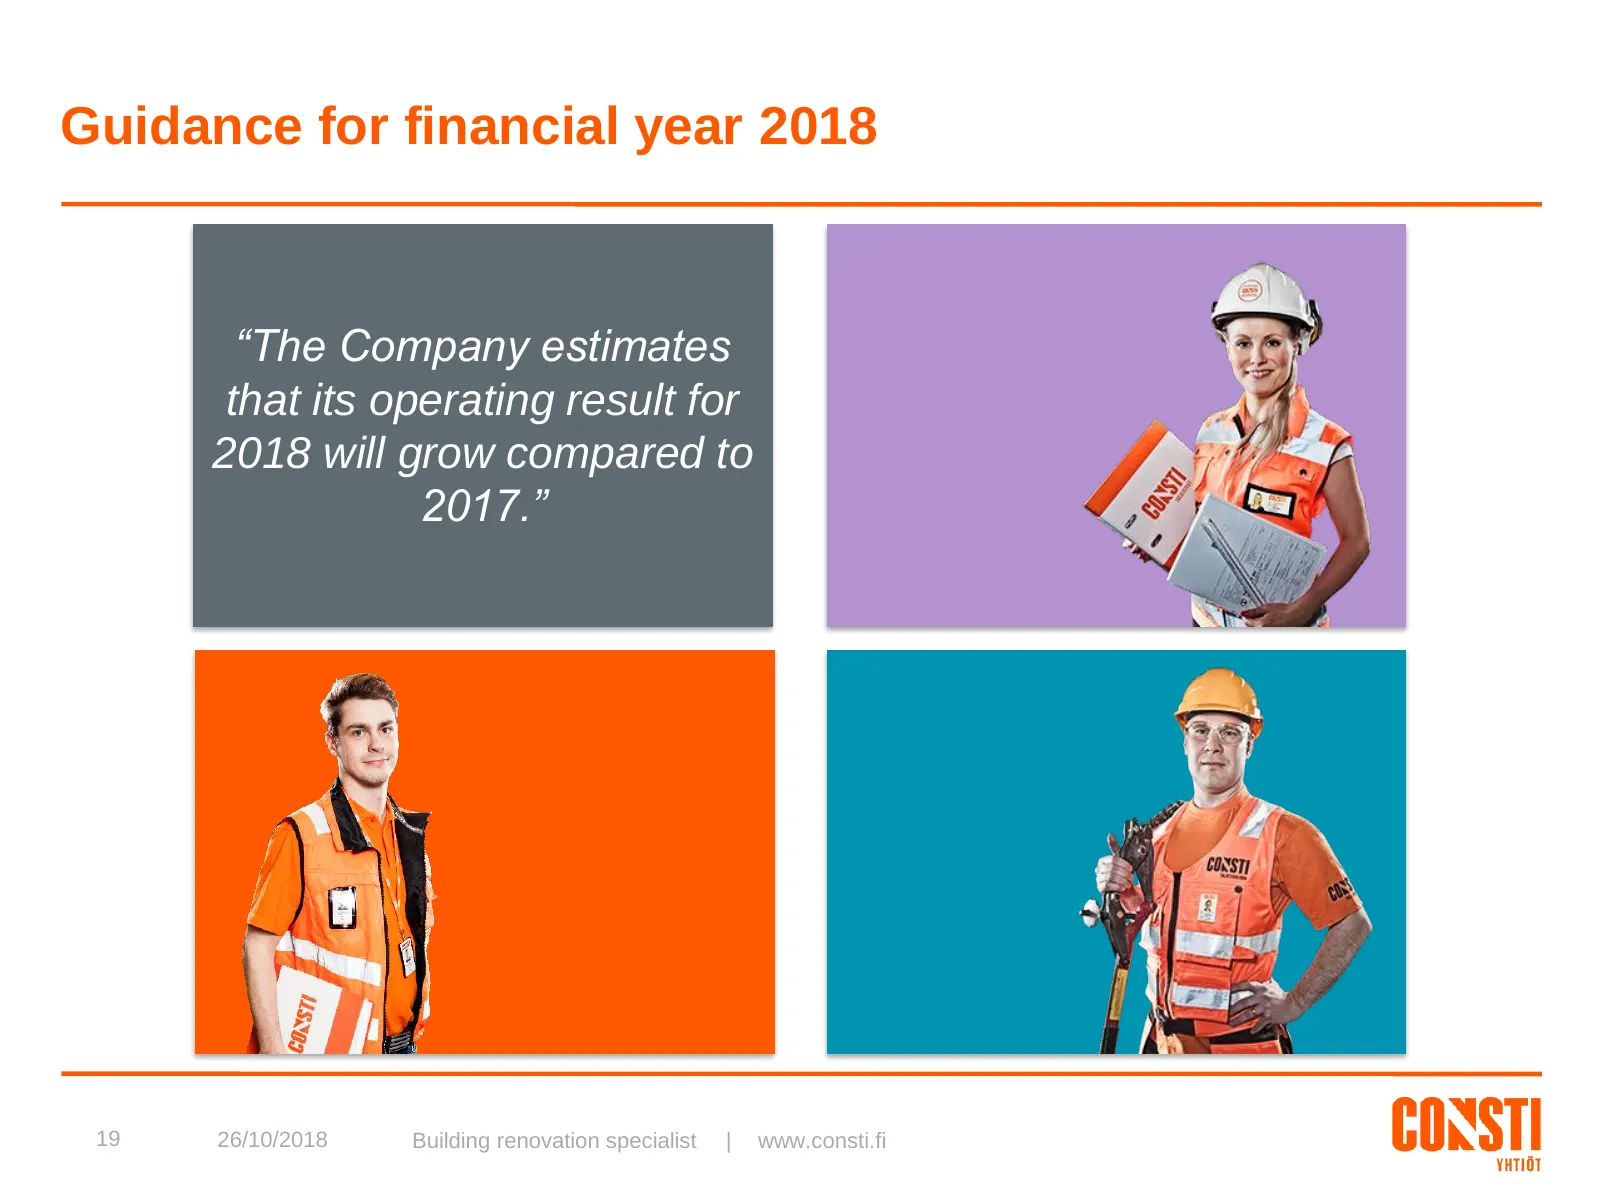
Guidance for financial year 2018 “The Company estimates that its operating result for 2018 will grow compared to 2017.” 19 26/10/2018 Building renovation specialist | www.consti.fi
Slide 21: Summary
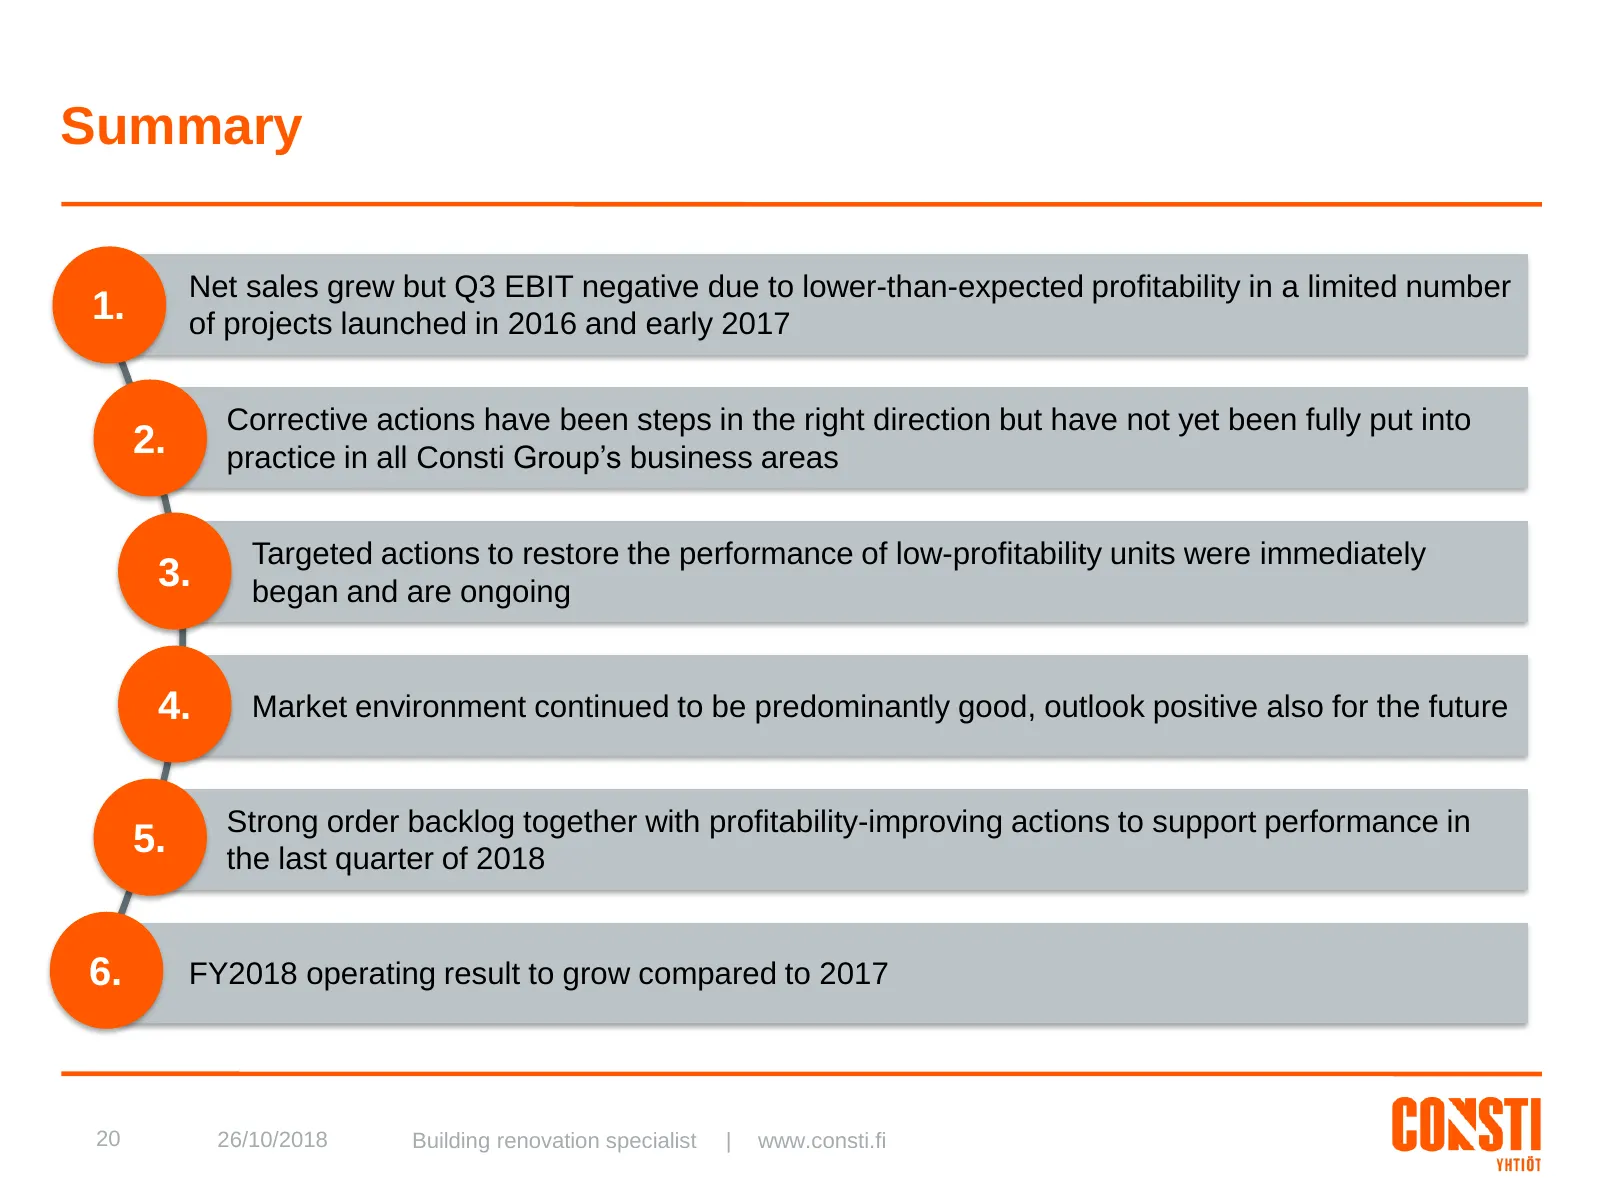
Summary Net sales grew but Q3 EBIT negative due to lower-than-expected profitability in a limited number 1. of projects launched in 2016 and early 2017 Corrective actions have been steps in the right direction but have not yet been fully put into 2. practice in all Consti Group’s business areas Targ
Slide 22: Appendix
Appendix 21 26/10/2018 Building renovation specialist | www.consti.fi
Slide 23: Building renovation specialist www.consti.fi
22 26/10/2018 Building renovation specialist | www.consti.fi
Slide 24: Interim Report Consti Group Plc Q3
INTERIM REPORT 1-9/2018 CONSTI GROUP PLC Q3 CONSTI GROUP PLC HOPEATIE 2 FI-00440, HELSINKI BUSINESS ID 2203605-05 WWW.CONSTI.FI 23 26/10/2018 Building renovation specialist | www.consti.fi
Source: Internet Archive copy of investor.consti.fi
More decks from Consti Oyj
 Q3 2026 Earnings Presentation21 slides · Oct 23, 2026
 H1 2026 Earnings Presentation21 slides · Jul 17, 2026
 Q1 2026 Earnings Presentation21 slides · Apr 29, 2026
 Shareholder Meeting (April 2026)19 slides · Apr 9, 2026
 Investor Presentation (February 2026)26 slides · Feb 25, 2026
 FY2025 Earnings Presentation23 slides · Feb 6, 2026