Rockwool A/S Class A · OMXCOP:ROCK_A
Rockwool A/S Class A — Rockwool International — Non-Deal Roadshow (May 2008)
52 slides from Rockwool A/S Class A's roadshow presentation, May 27, 2008
Slide 1: Investor roadshow London, 27 May 2008
Investor roadshow London, 27 May 2008 CFO, Gilles Maria Vice President Group Finance, Jens Krogsgaard 1
Slide 2: Forward-looking statement
Forward-looking statement The statements on the future in this presentation, including expected sales and earnings, are associated with risks and uncertainties and may be affected by factors influencing the activities of the group, e.g. the global economic environment, including interest and exchang
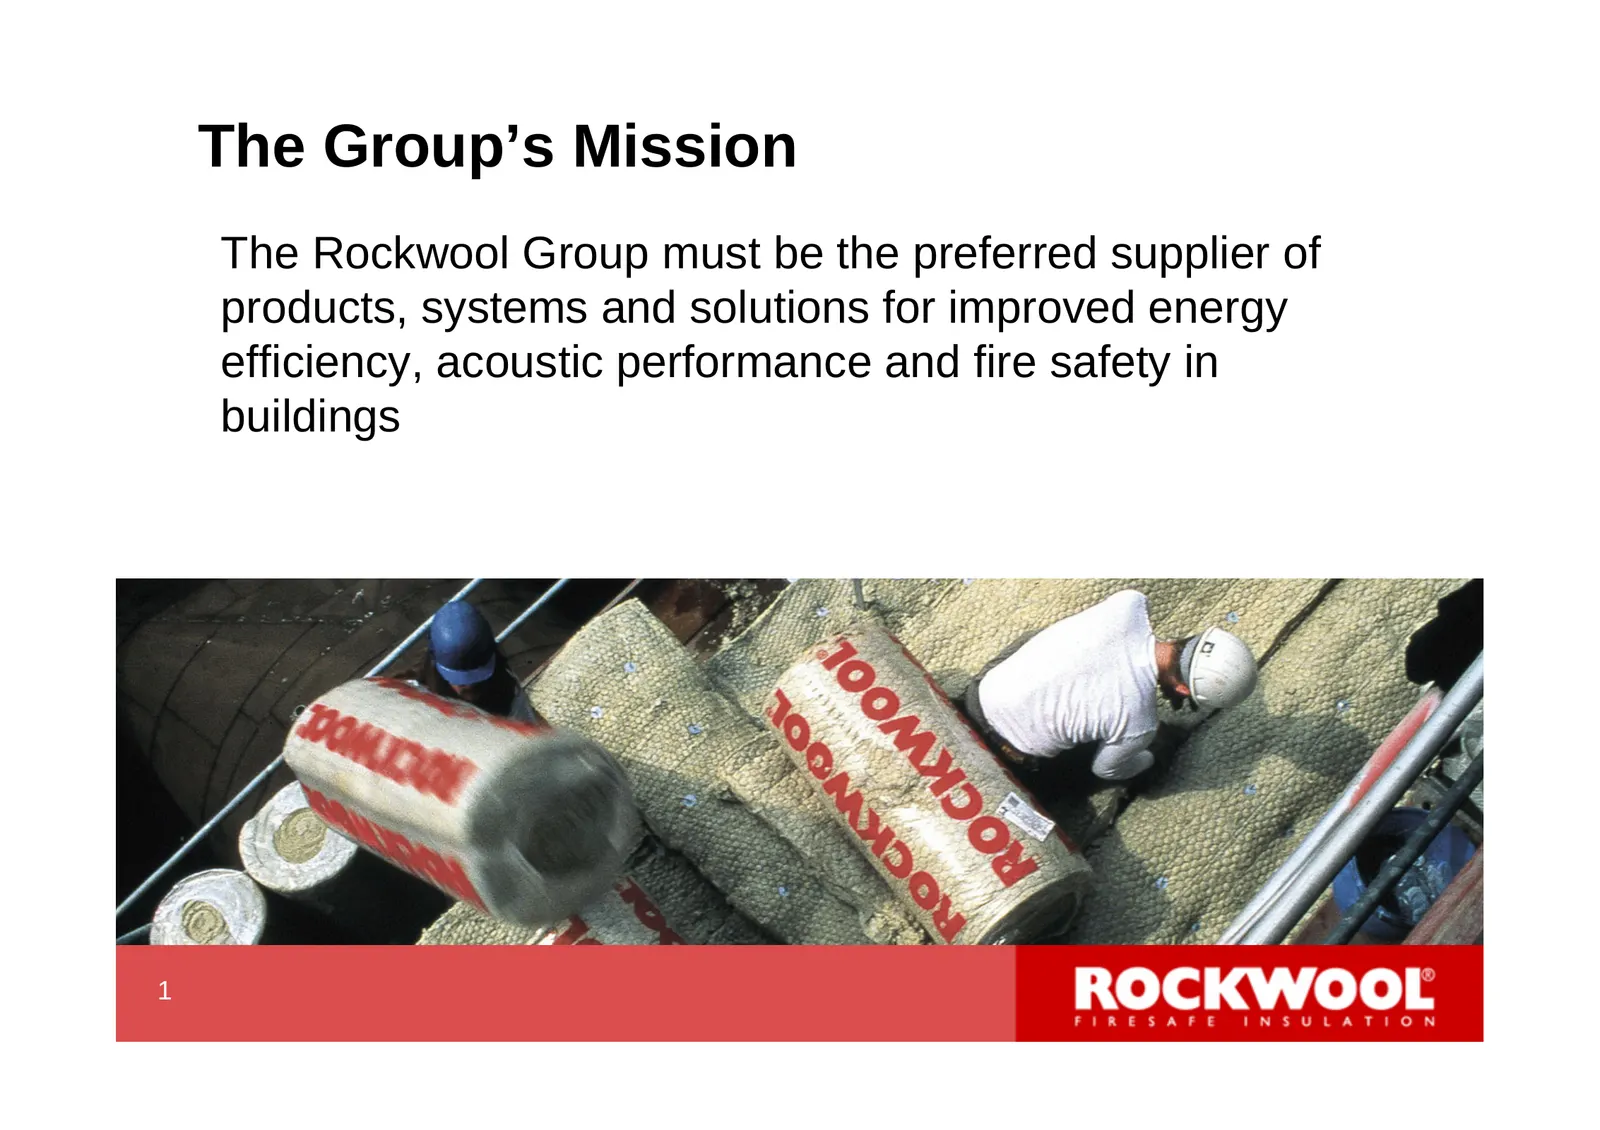
Slide 3: The Group's Mission
The Group’s Mission The Rockwool Group must be the preferred supplier of products, systems and solutions for improved energy efficiency, acoustic performance and fire safety in buildings 1 3
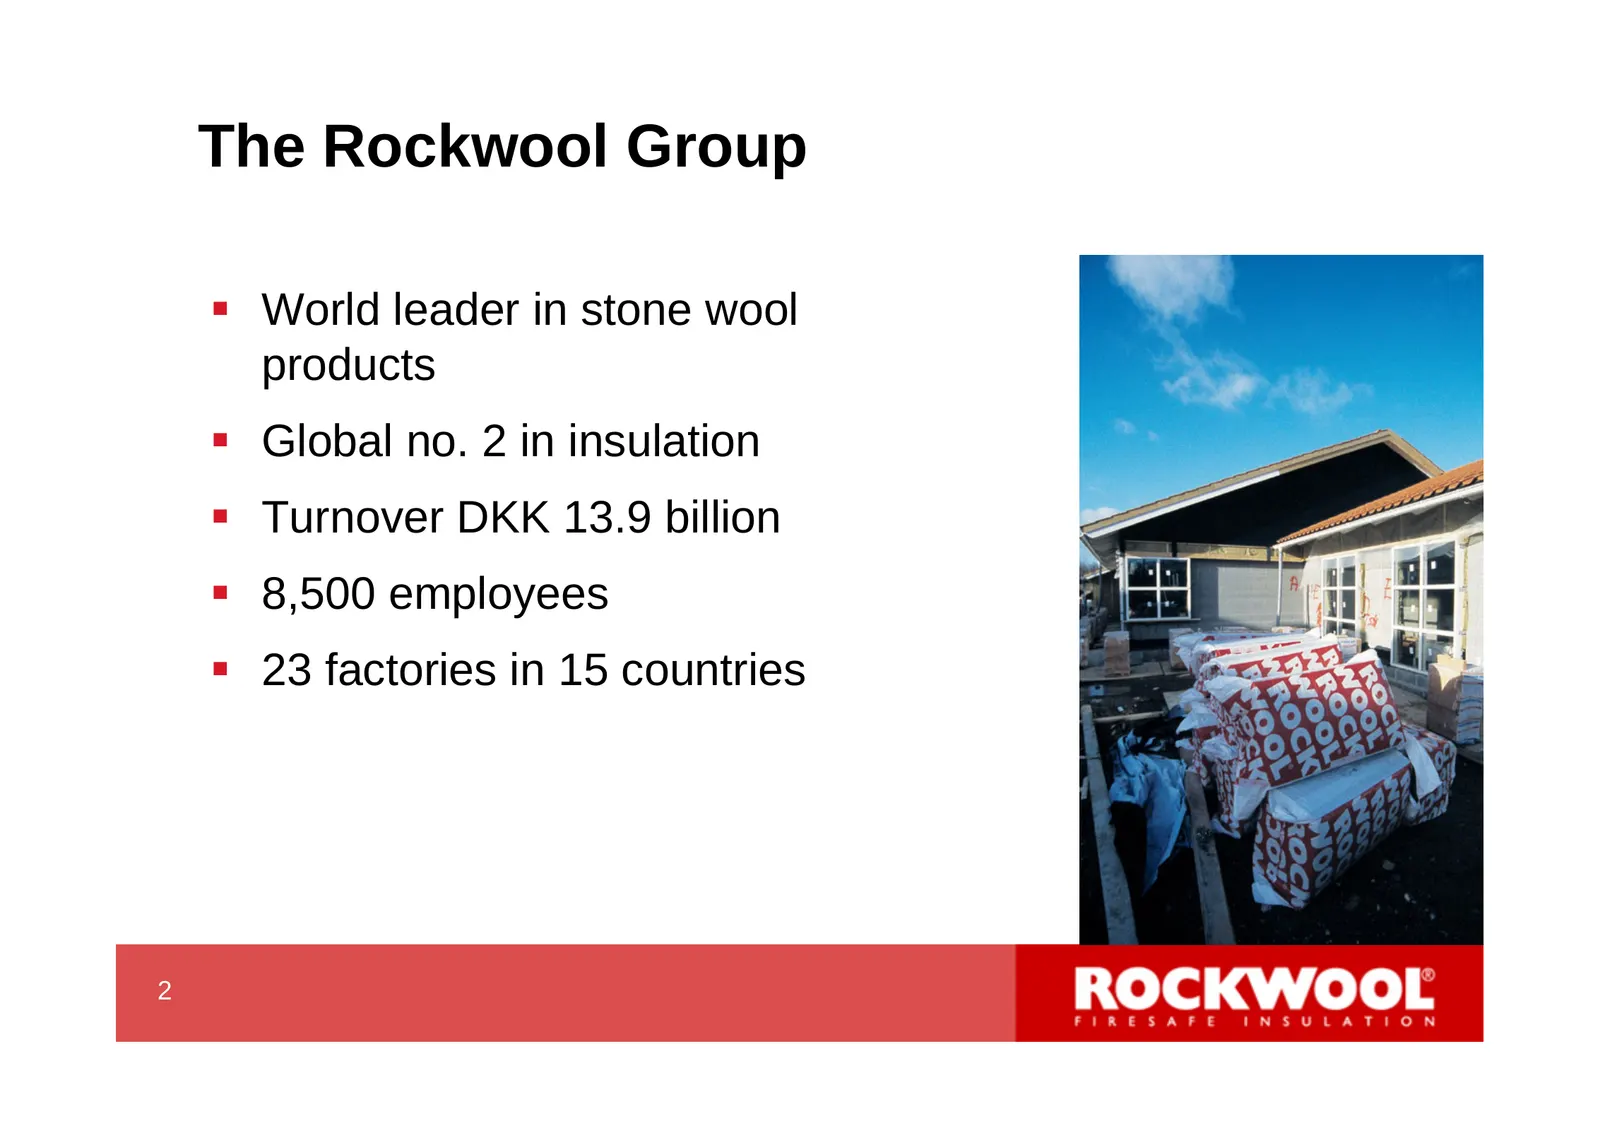
Slide 4: The Rockwool Group
The Rockwool Group World leader in stone wool products Global no. 2 in insulation Turnover DKK 13.9 billion 8,500 employees 23 factories in 15 countries 2 4
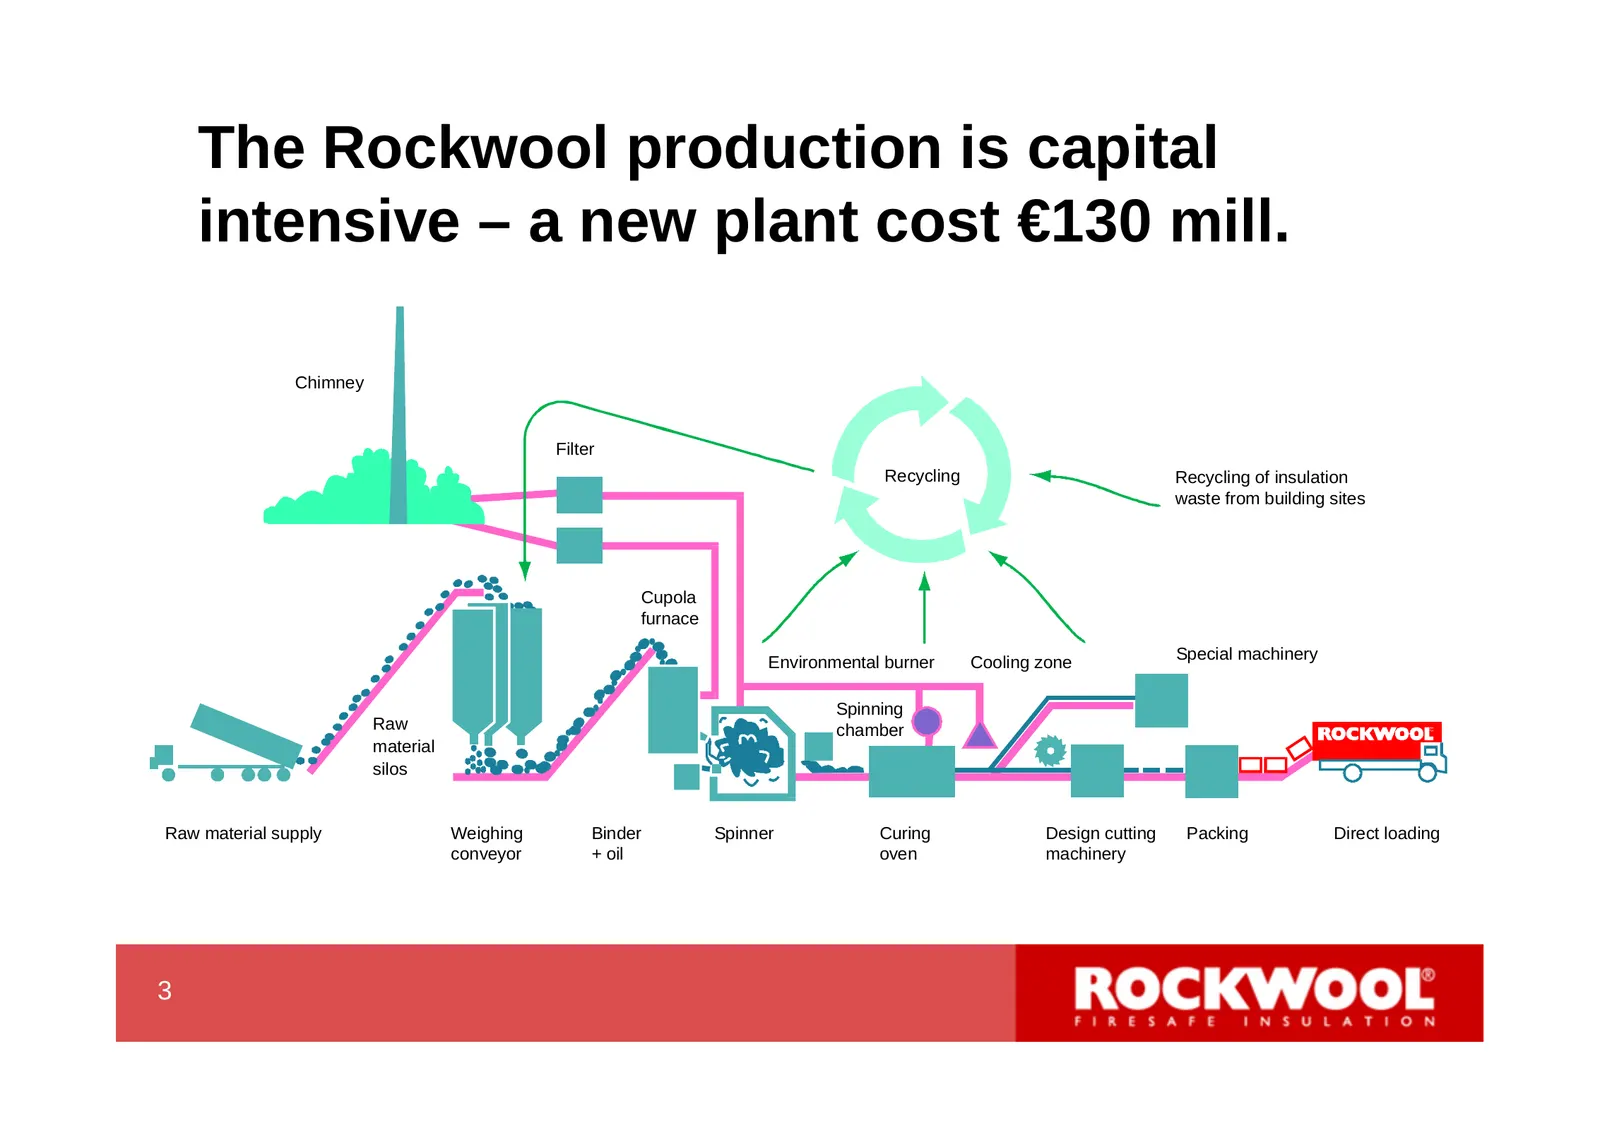
Slide 5: The Rockwool production is capital intensive – a new plant cost €130 mill.
The Rockwool production is capital intensive – a new plant cost €130 mill. Chimney Filter Recycling Recycling of insulation waste from building sites Cupola furnace Environmental burner Cooling zone Special machinery Spinning Raw chamber material silos Raw material supply Weighing Binder Spinner Cur
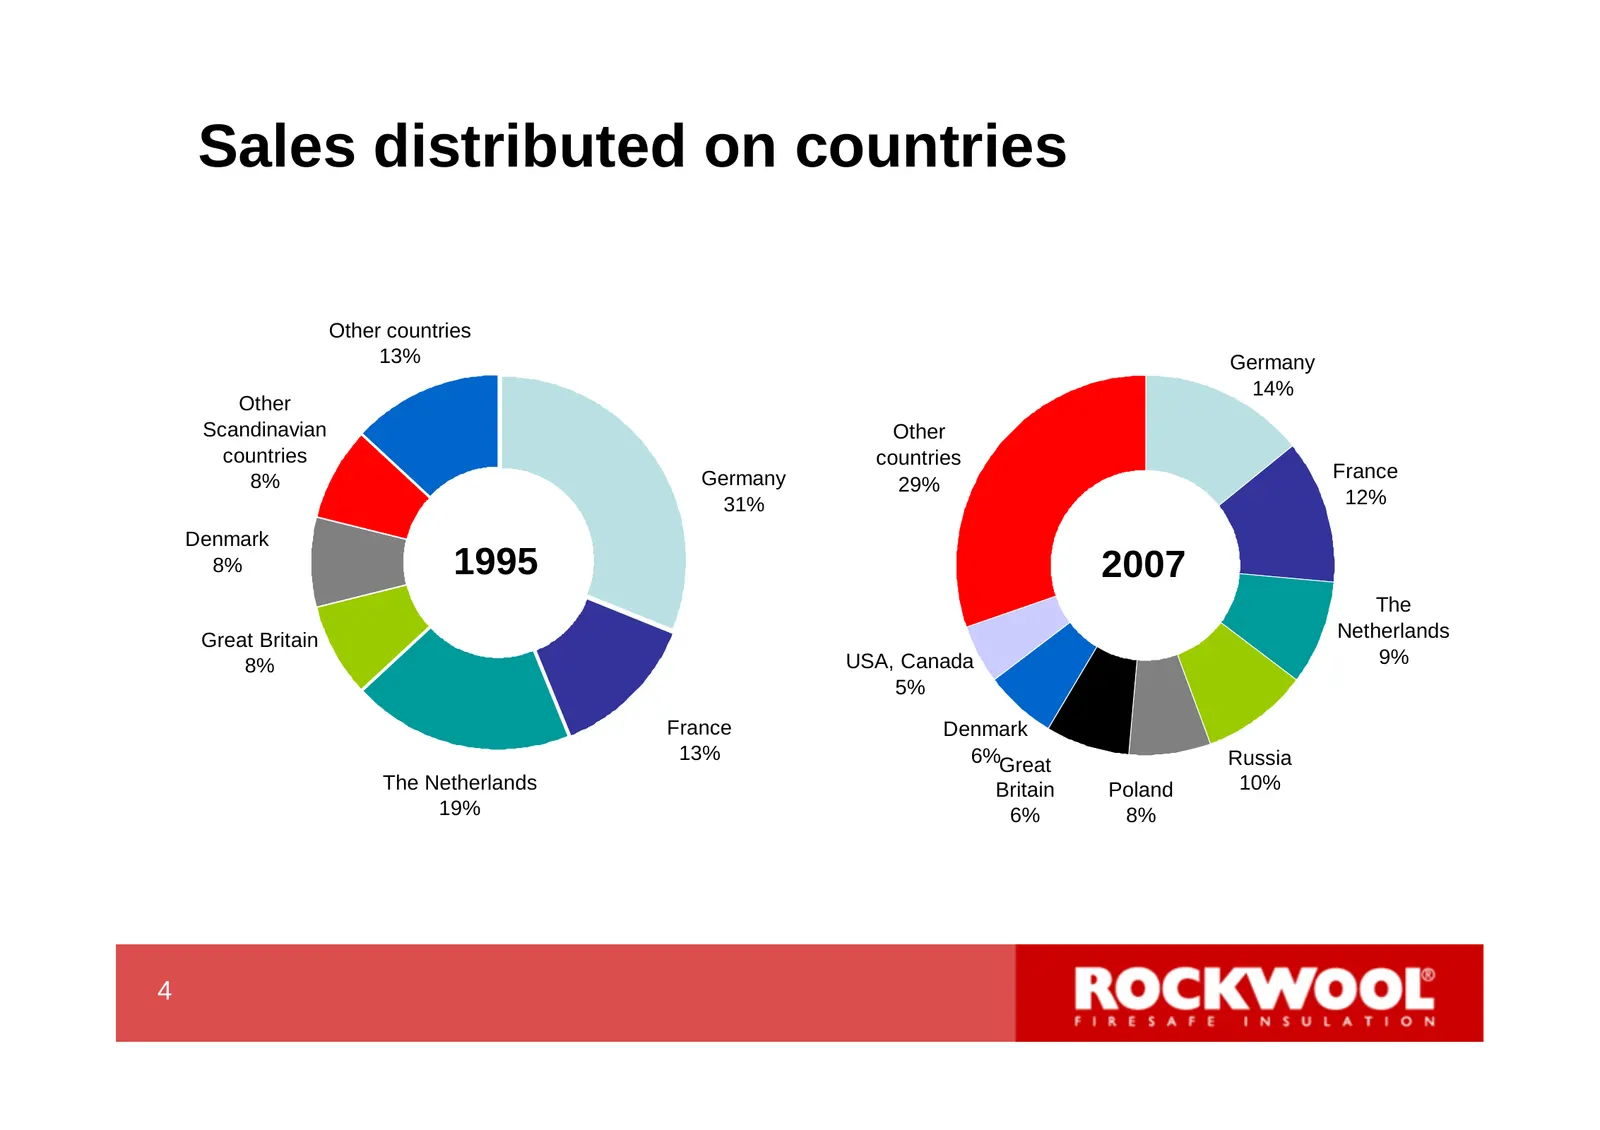
Slide 6: Sales distributed on countries
Sales distributed on countries Other countries 13% Germany 14% Other Scandinavian Other countries countries 8% Germany France 29% 31% 12% Denmark 8% 1995 2007 The Great Britain Netherlands 8% USA, Canada 9% 5% France Denmark 13% 6%Great Russia The Netherlands Britain Poland 10% 19% 6% 8% 4 6
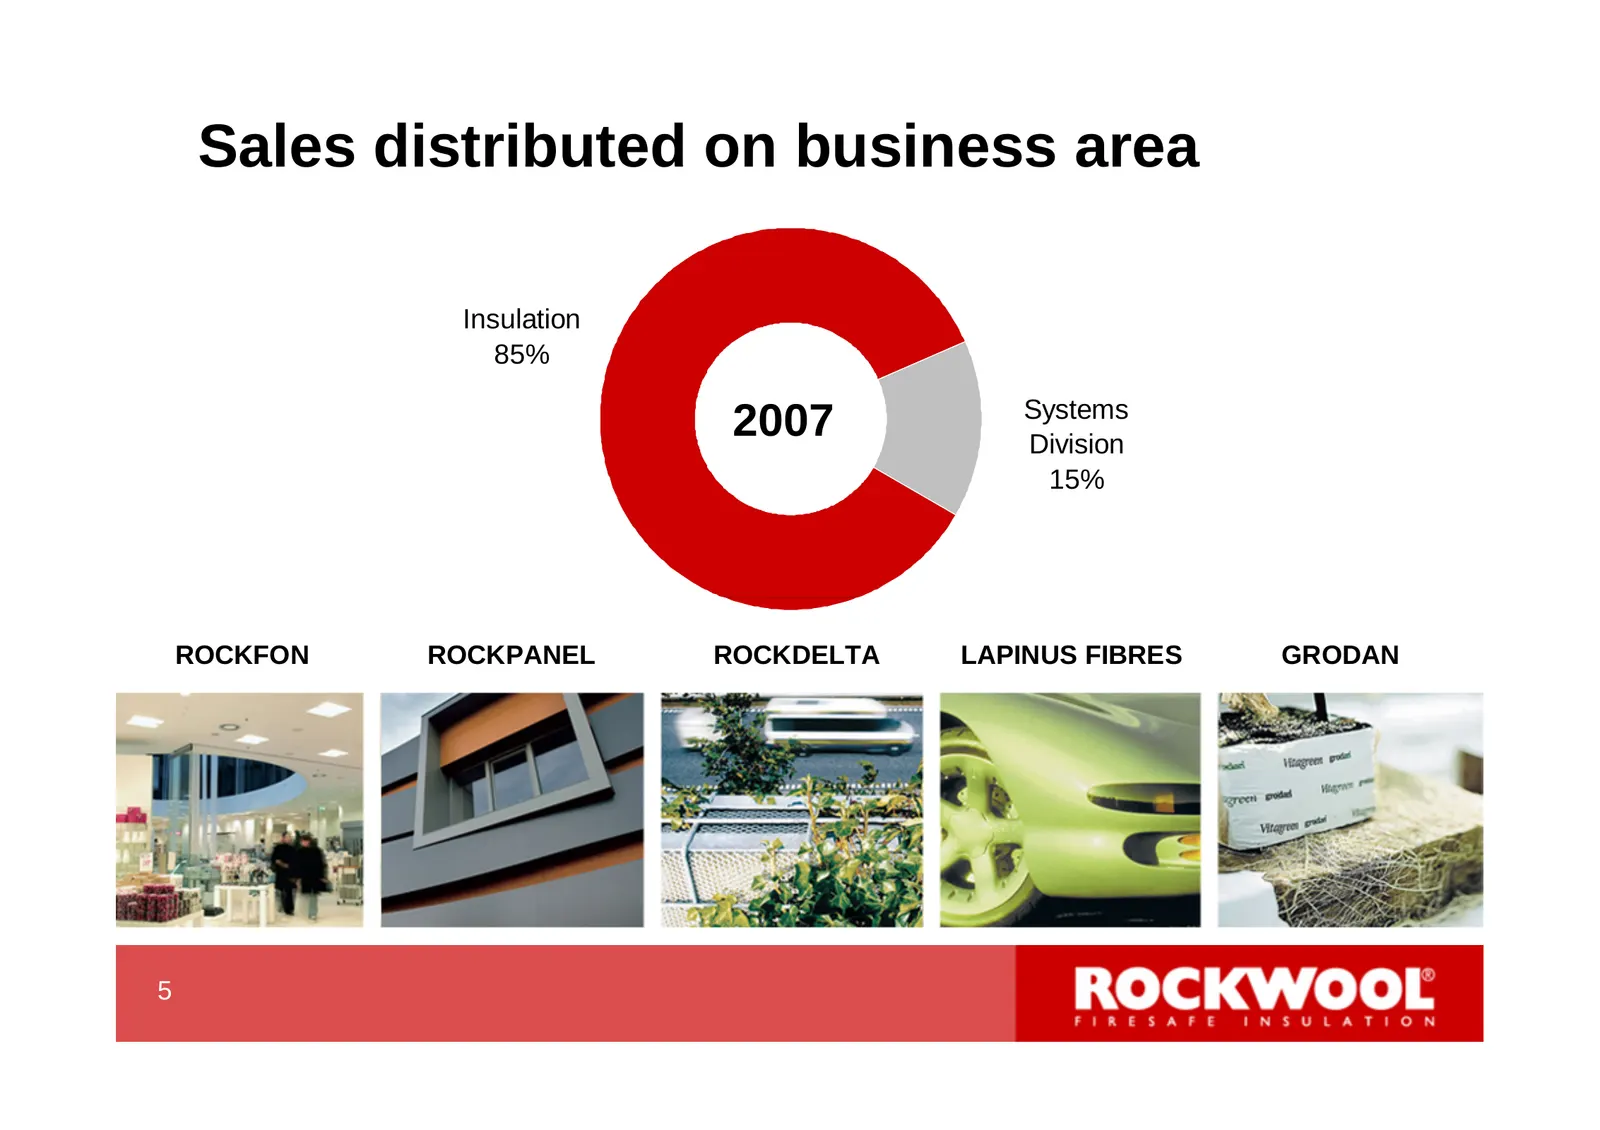
Slide 7: Sales distributed on business area
Sales distributed on business area Insulation 85% Systems 2007 Division 15% ROCKFON ROCKPANEL ROCKDELTA LAPINUS FIBRES GRODAN 5 7
Slide 8: BuildDesk
BuildDesk The Rockwool Group’s consultancy business - focusing on creating an energy efficient and sustainable building environment The BuildDesk division employs more than 100 employees and is market active in Austria, Germany, Holland, Denmark and the UK In 2007, CEA, a leading consultancy b
Slide 9: Main results from Q1 2008
Main results from Q1 2008 7 9
Slide 10: Net sales first quarter
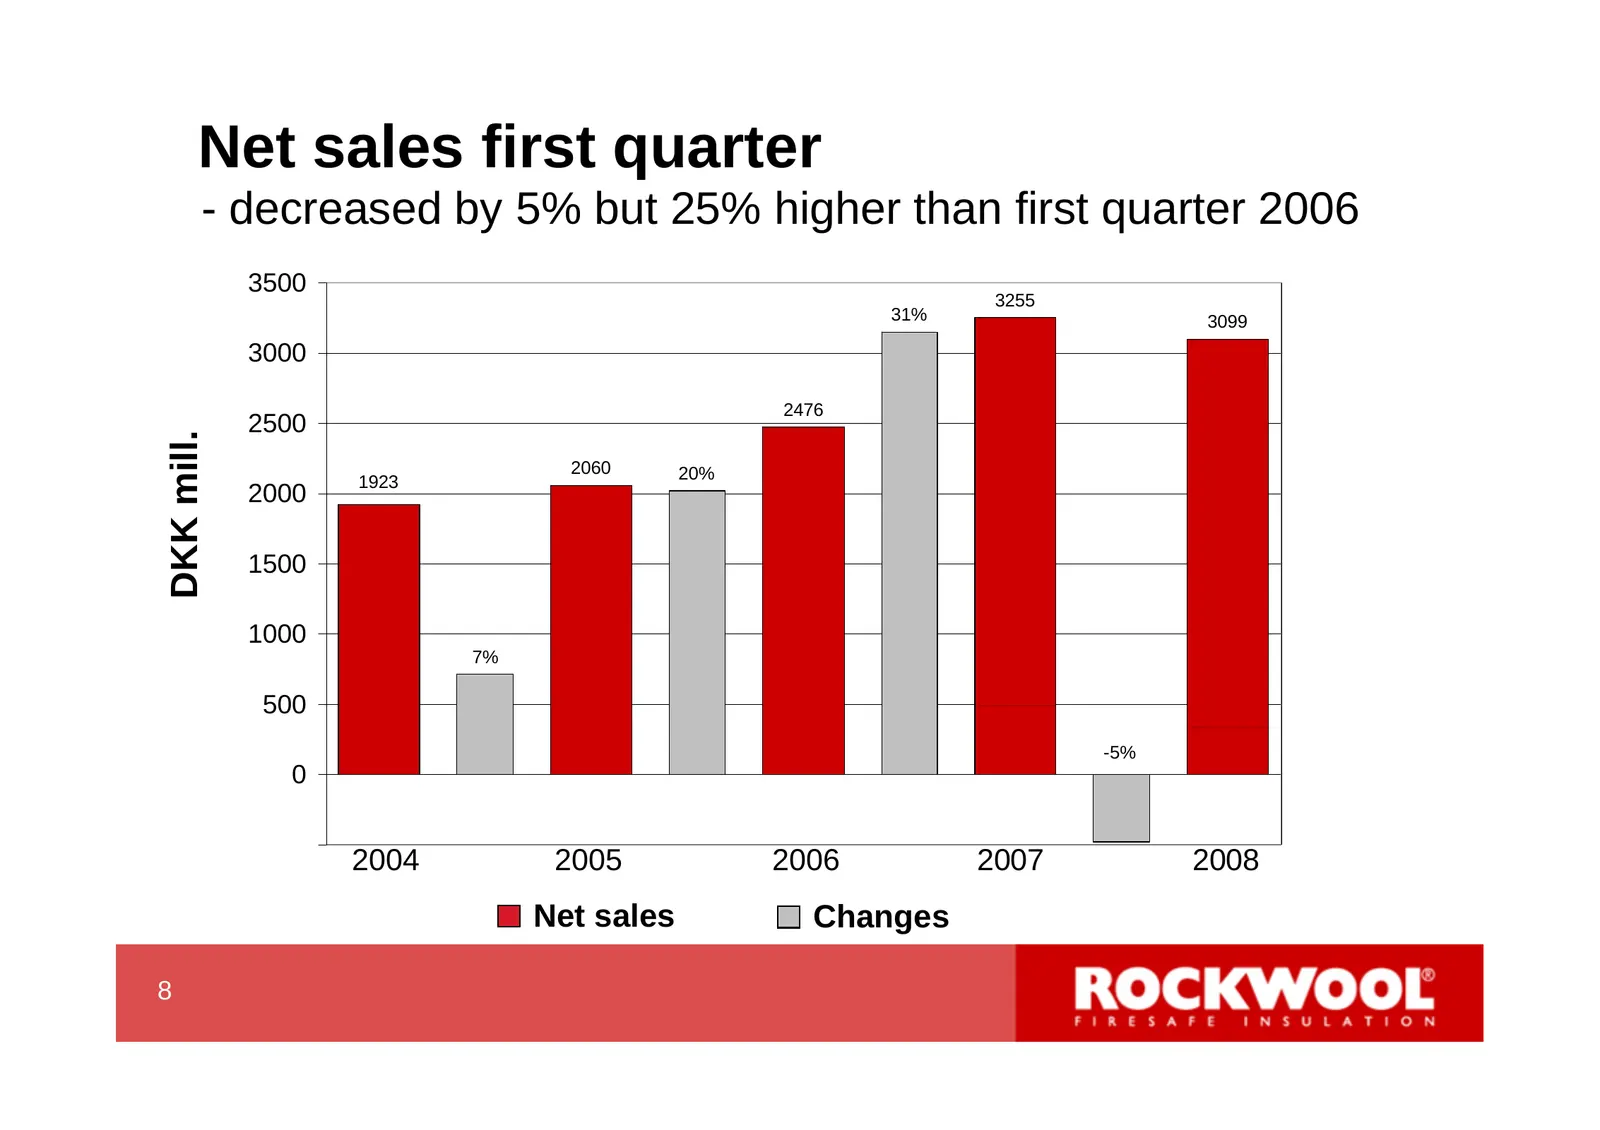
Net sales first quarter - decreased by 5% but 25% higher than first quarter 2006 3500 35% 3255 31% 3099 3000 30% 2476 2500 25% DKK mill. 2060 20% 1923 2000 20% 1500 15% 1000 10% 7% 500 5% -5% 0 0% -500 -5% 2004 2005 2006 2007 2008 Net sales Changes 8 10
Slide 11: Long term sales development
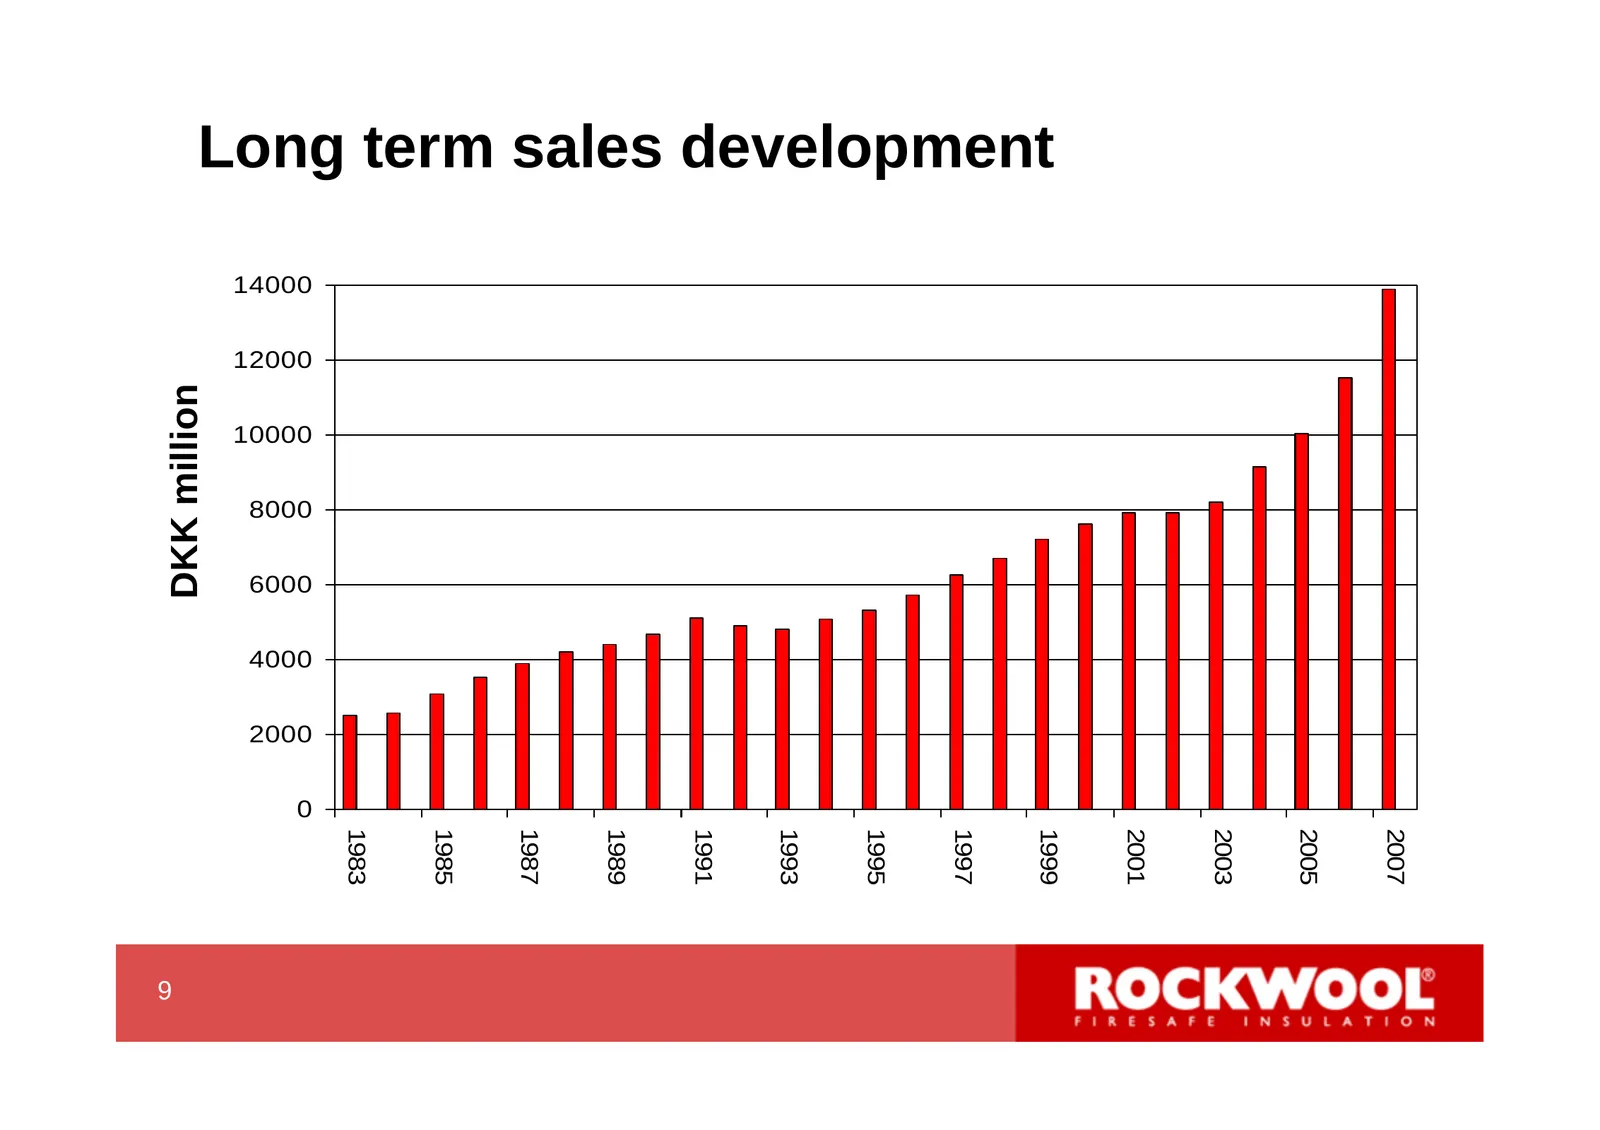
Long term sales development 14000 12000 DKK million 10000 8000 6000 4000 2000 0 1983 1985 1987 1989 1991 1993 1995 1997 1999 2001 2003 2005 2007 9 11
Slide 12: EBIT first quarter
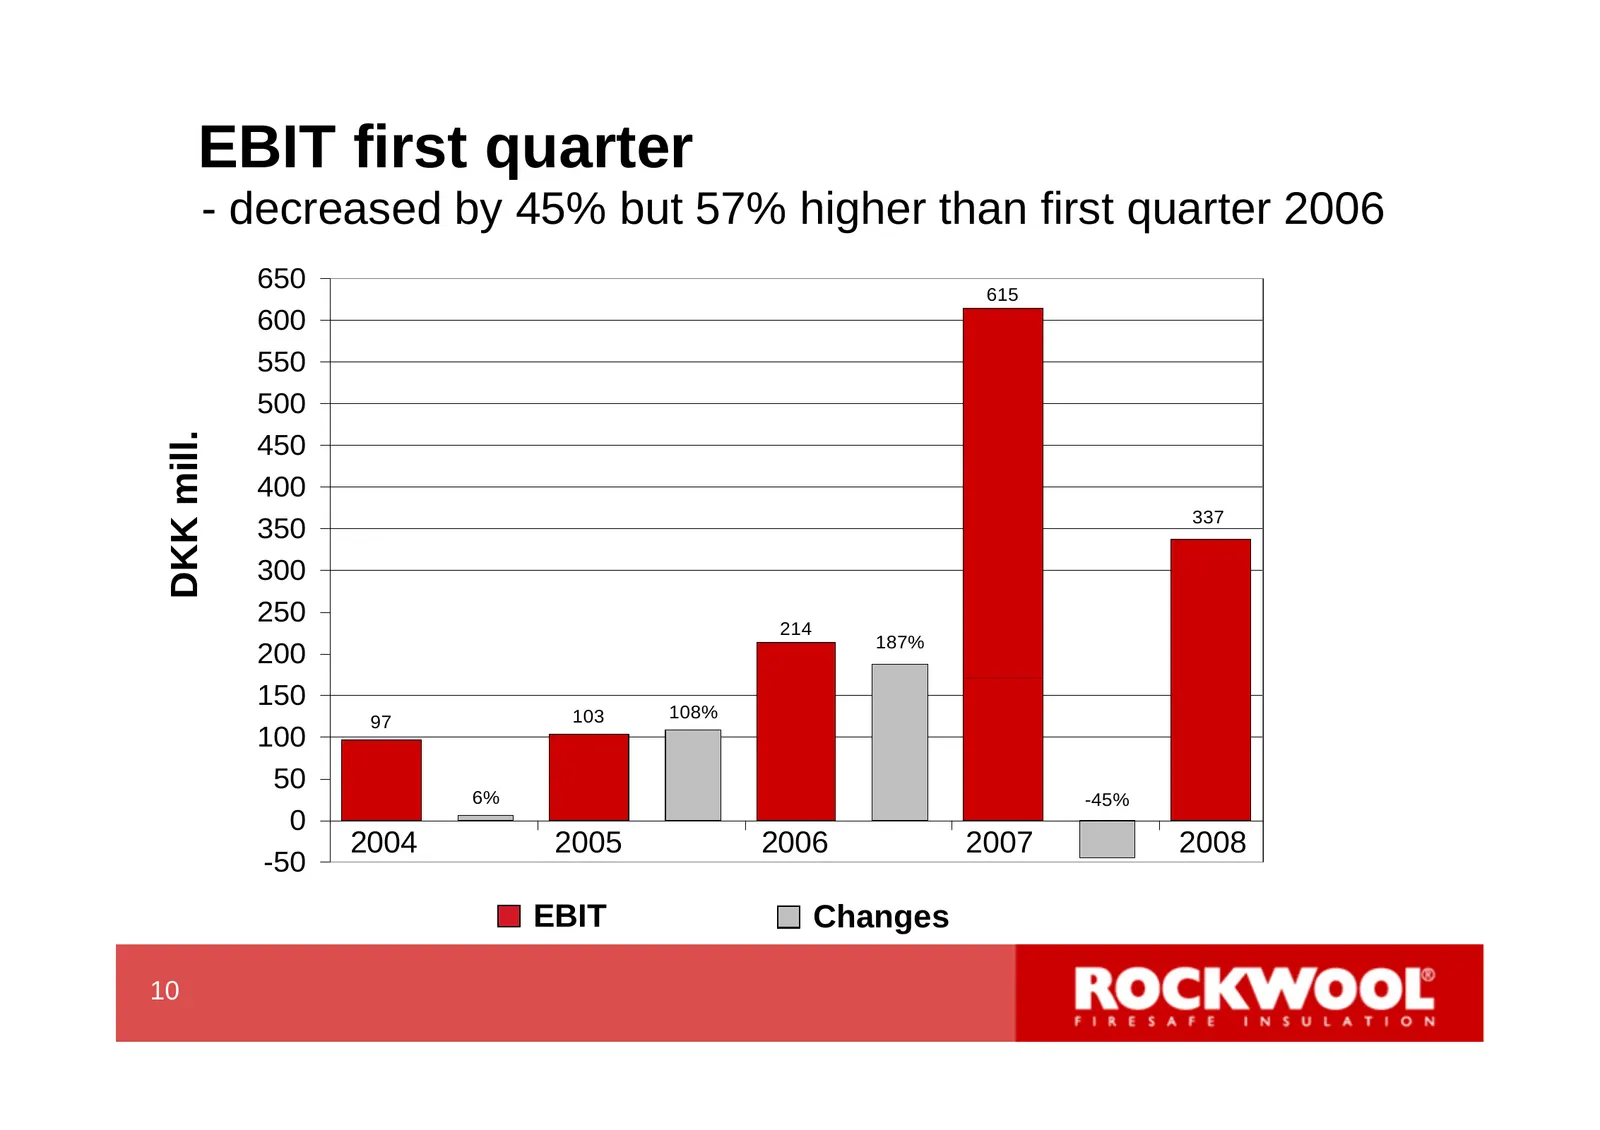
EBIT first quarter - decreased by 45% but 57% higher than first quarter 2006 650 615 650% 600 550 550% 500 DKK mill. 450 450% 400 337 350 350% 300 250 214 250% 187% 200 150 108% 150% 97 103 100 50 50% 6% -45% 0 2004 2005 2006 2007 2008 -50 -50% EBIT Changes 10 12
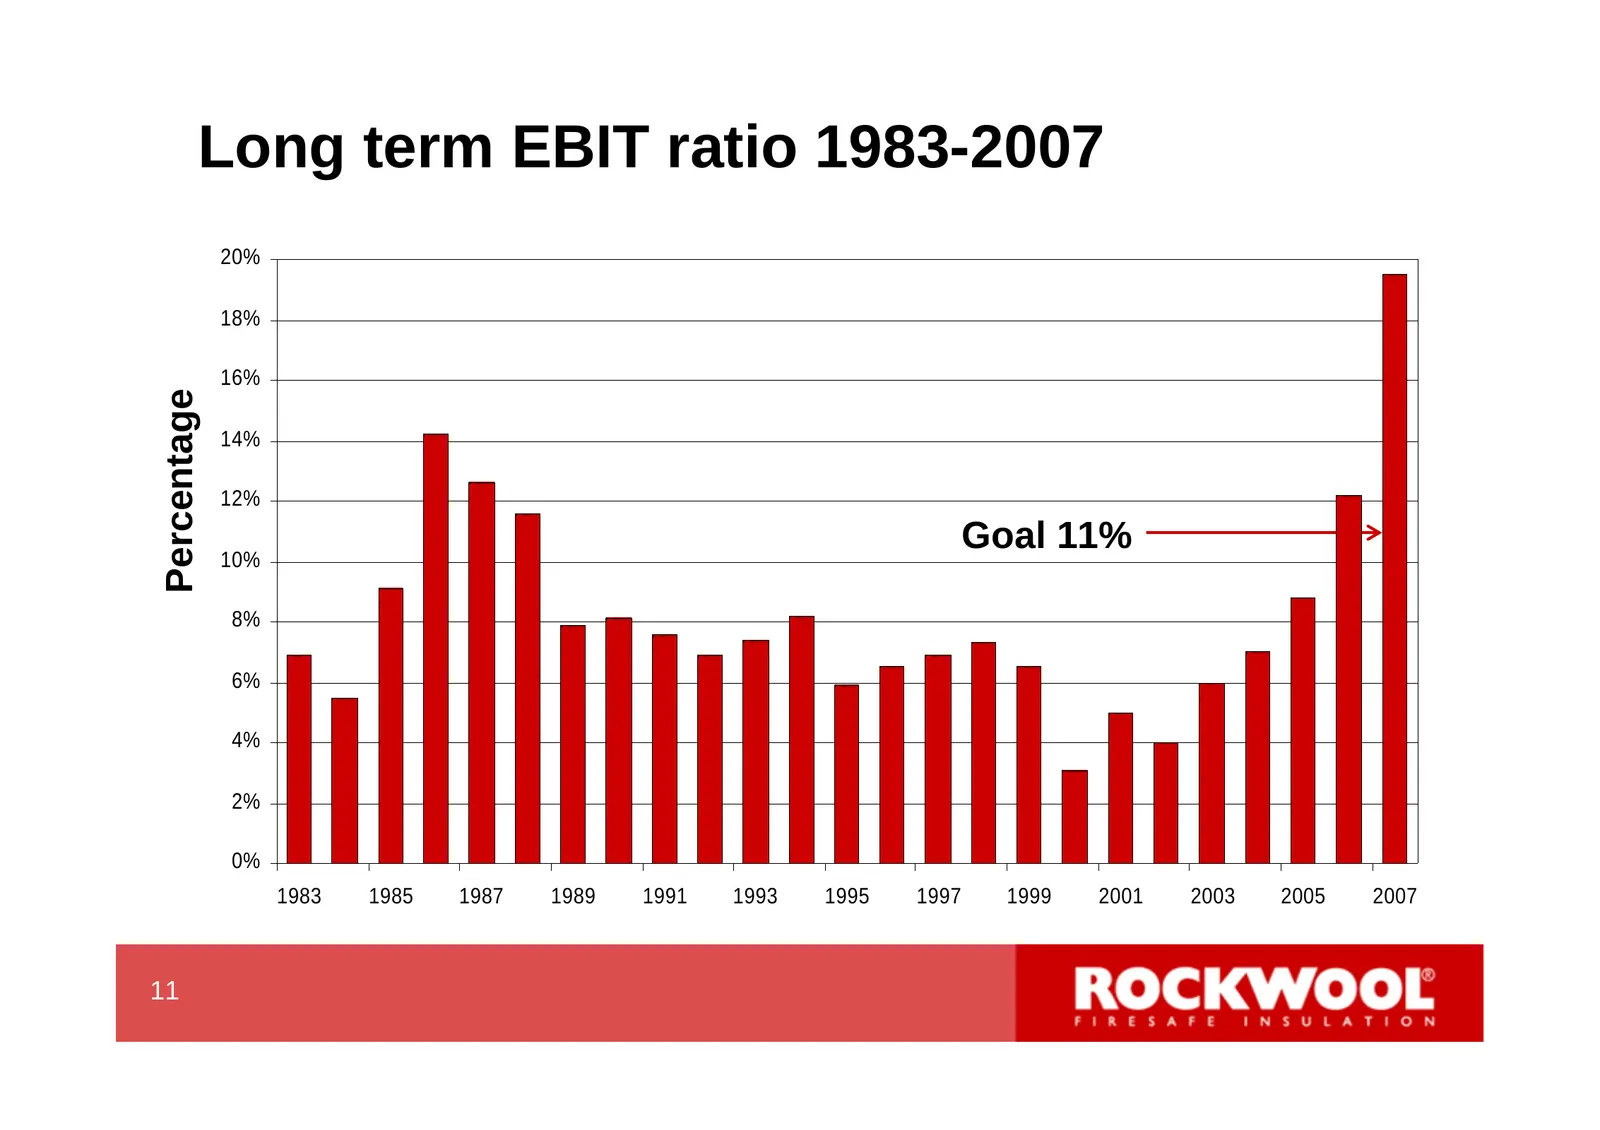
Slide 13: Long term EBIT ratio 1983-2007
Long term EBIT ratio 1983-2007 20% 18% 16% Percentage 14% 12% 10% Goal 11% 8% 6% 4% 2% 0% 1983 1985 1987 1989 1991 1993 1995 1997 1999 2001 2003 2005 2007 11 13
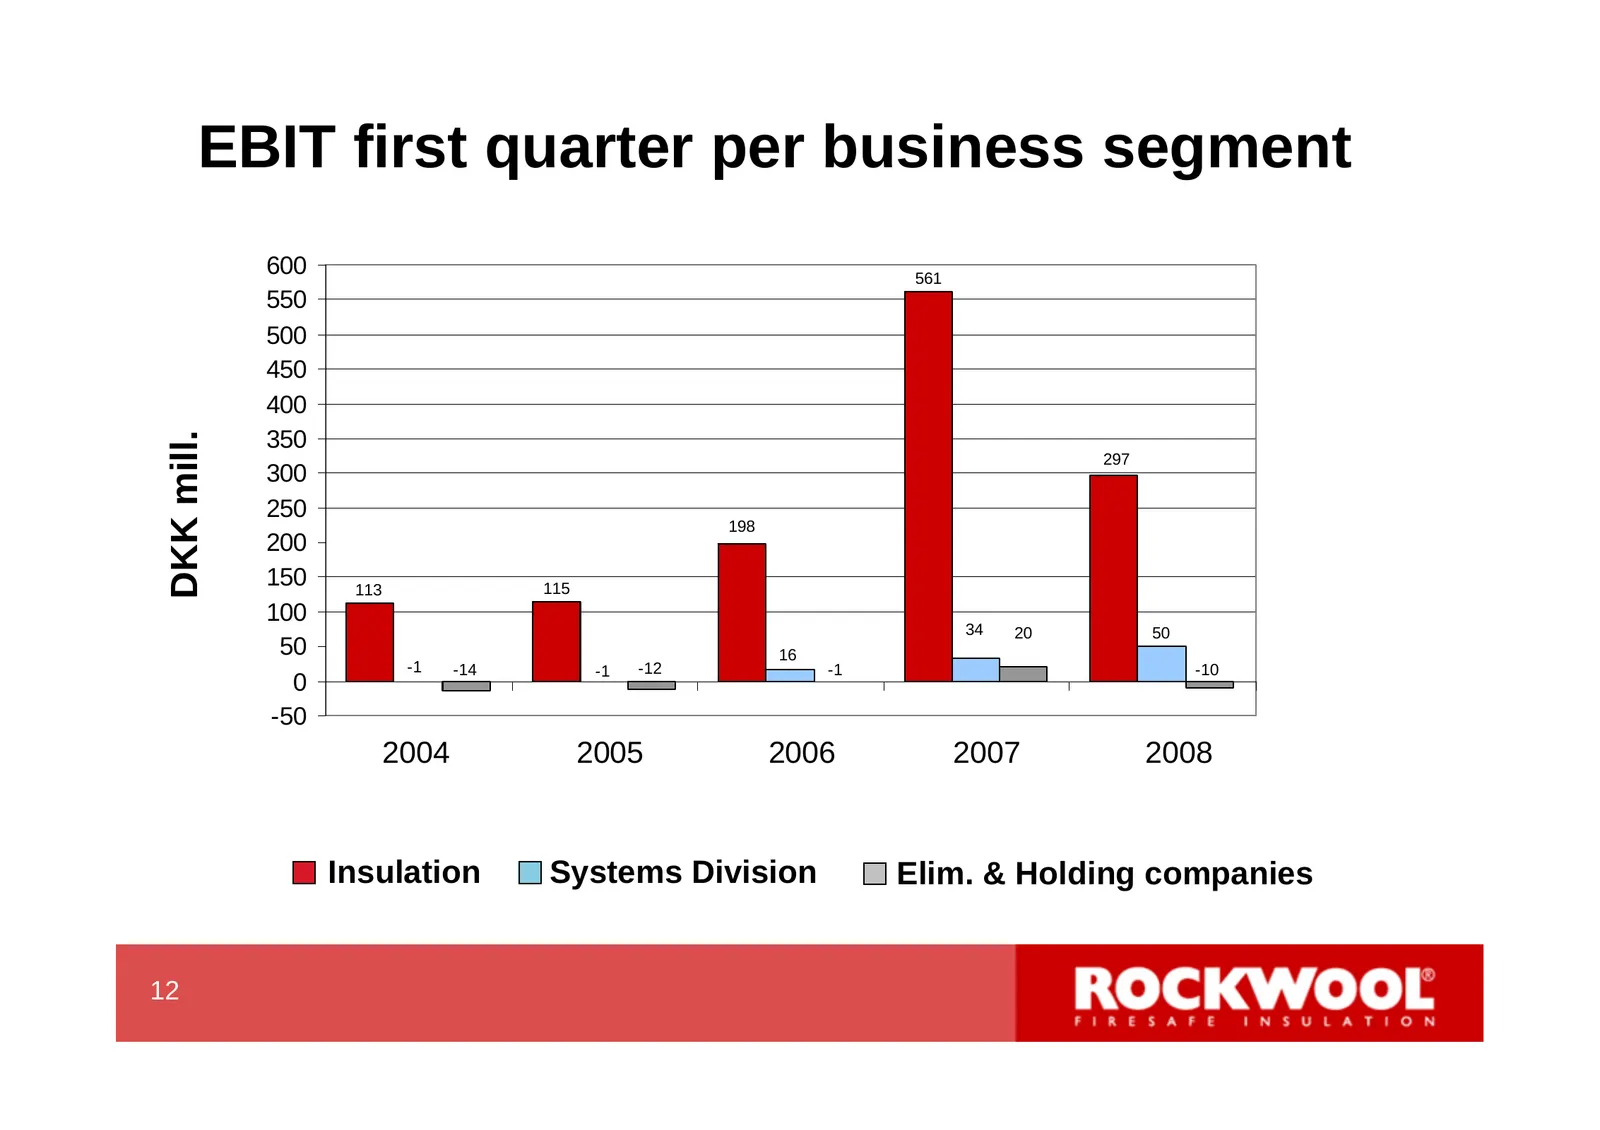
Slide 14: EBIT first quarter per business segment
EBIT first quarter per business segment 600 561 550 500 450 400 350 DKK mill. 297 300 250 198 200 150 113 115 100 34 20 50 50 16 -1 -14 -1 -12 -1 -10 0 -50 2004 2005 2006 2007 2008 Insulation Systems Division Elim. & Holding companies 12 14
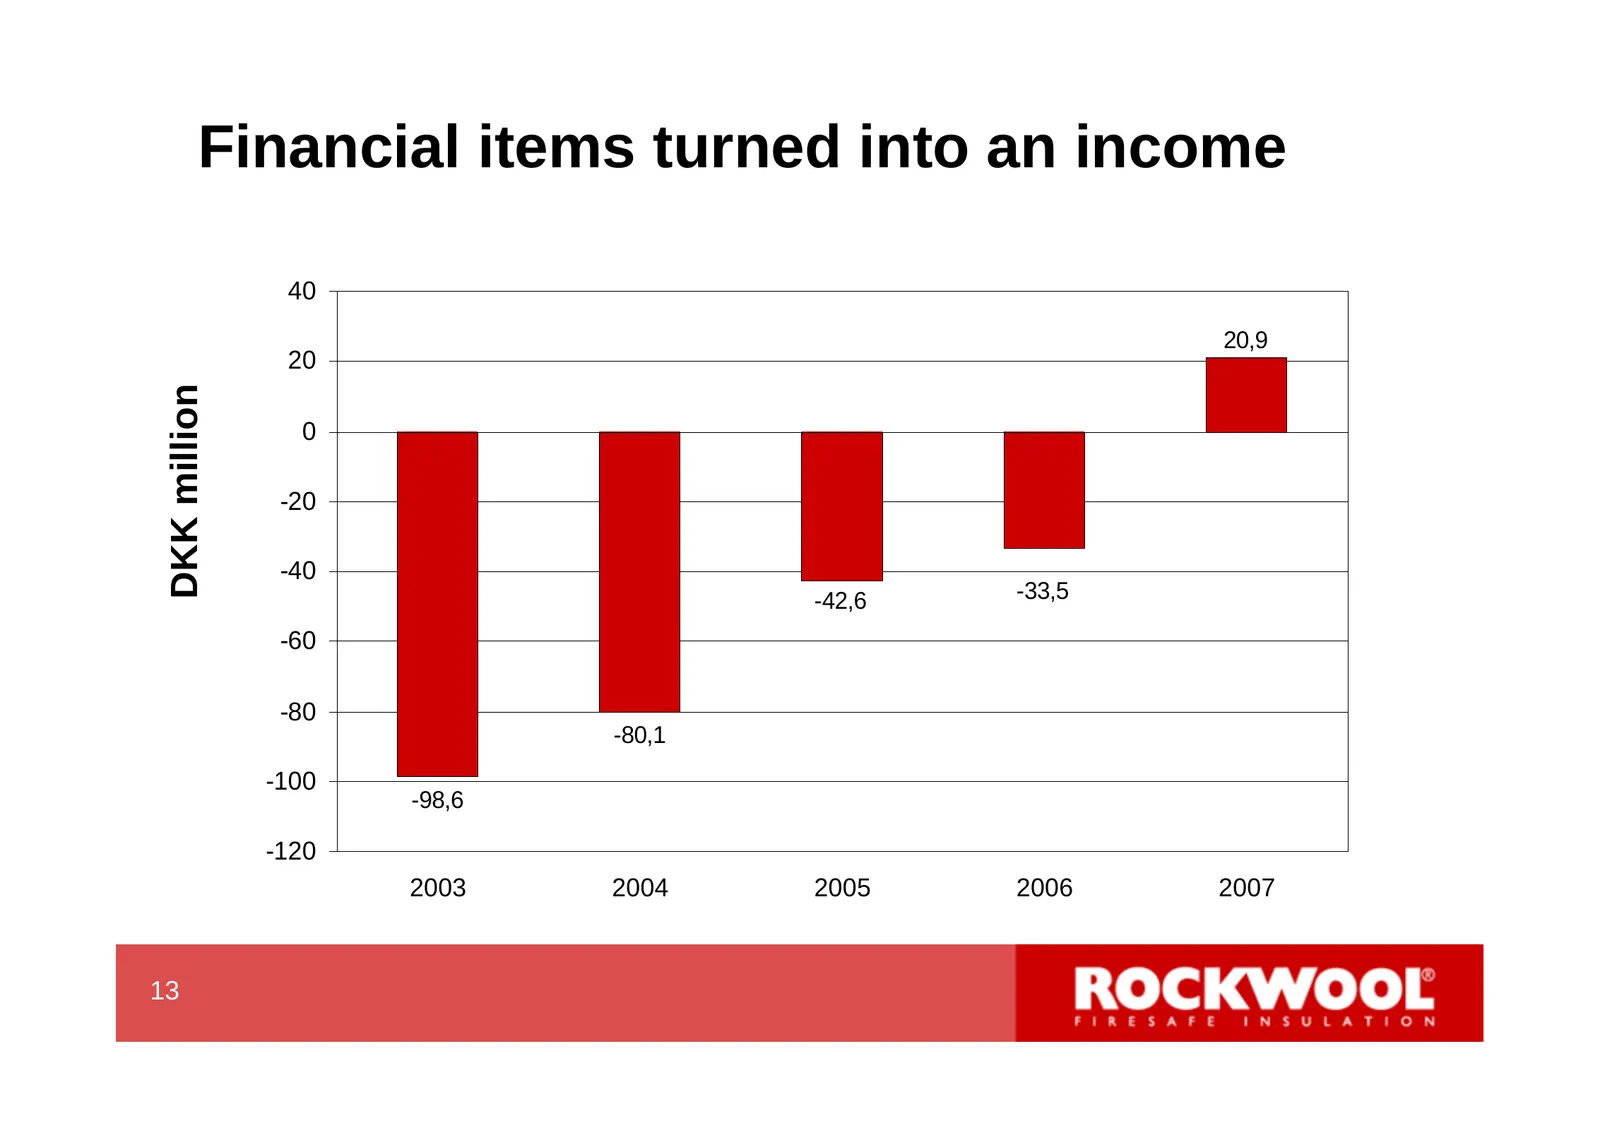
Slide 15: Financial items turned into an income
Financial items turned into an income 40 20,9 20 DKK million 0 -20 -40 -42,6 -33,5 -60 -80 -80,1 -100 -98,6 -120 2003 2004 2005 2006 2007 13 15
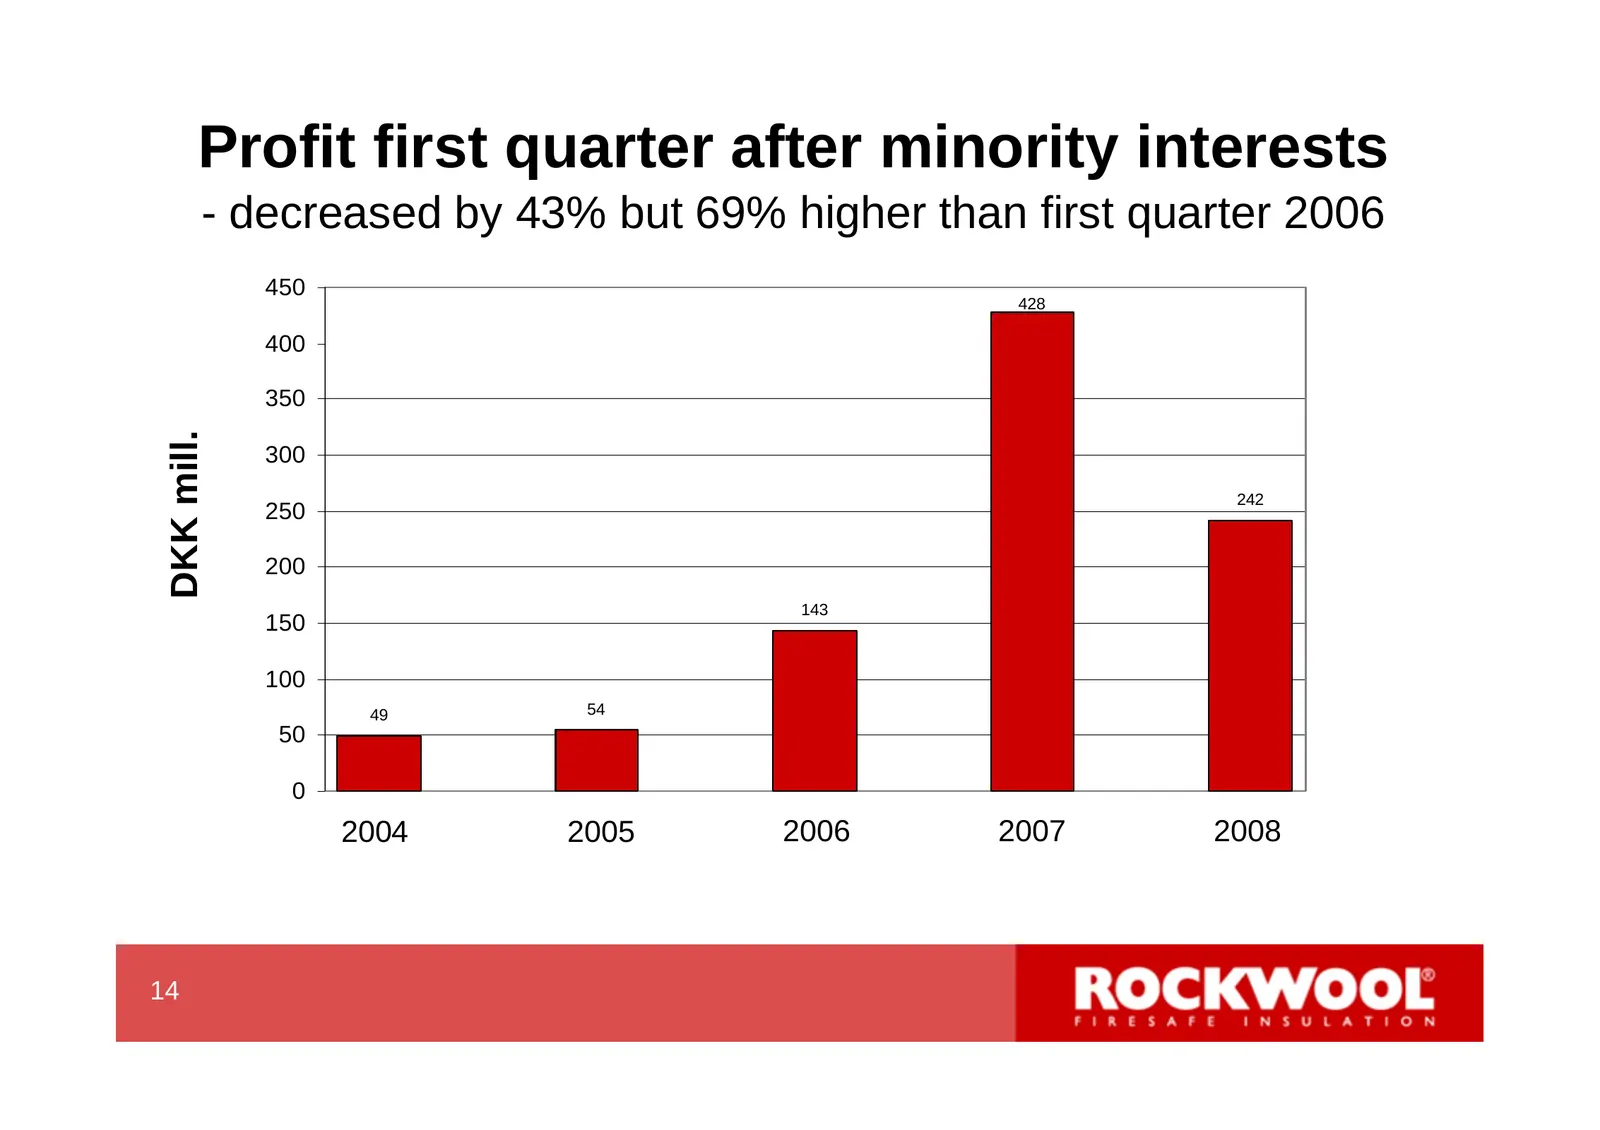
Slide 16: Profit first quarter after minority interests
Profit first quarter after minority interests - decreased by 43% but 69% higher than first quarter 2006 450 428 400 350 DKK mill. 300 242 250 200 143 150 100 49 54 50 0 2004 2005 2006 2007 2008 14 16
Slide 17: Investments and acquisitions first quarter
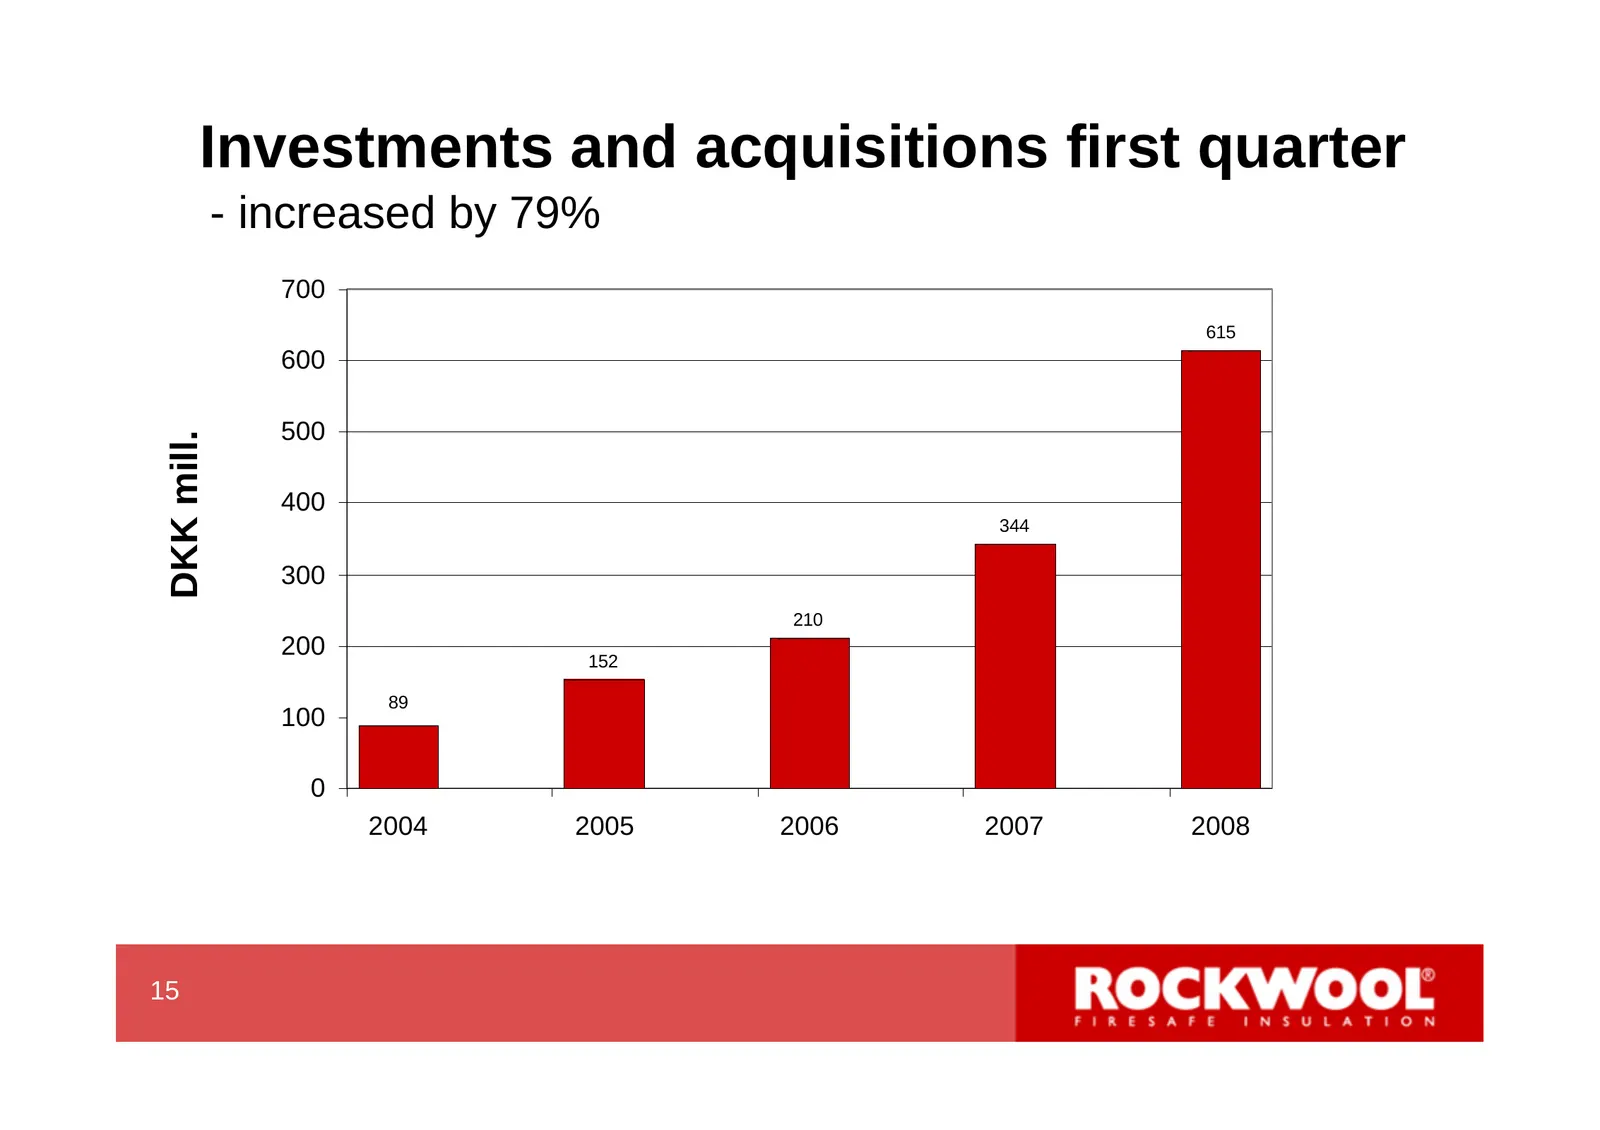
Investments and acquisitions first quarter - increased by 79% 700 615 600 500 DKK mill. 400 344 300 210 200 152 89 100 0 2004 2005 2006 2007 2008 15 17
Slide 18: Financial goals
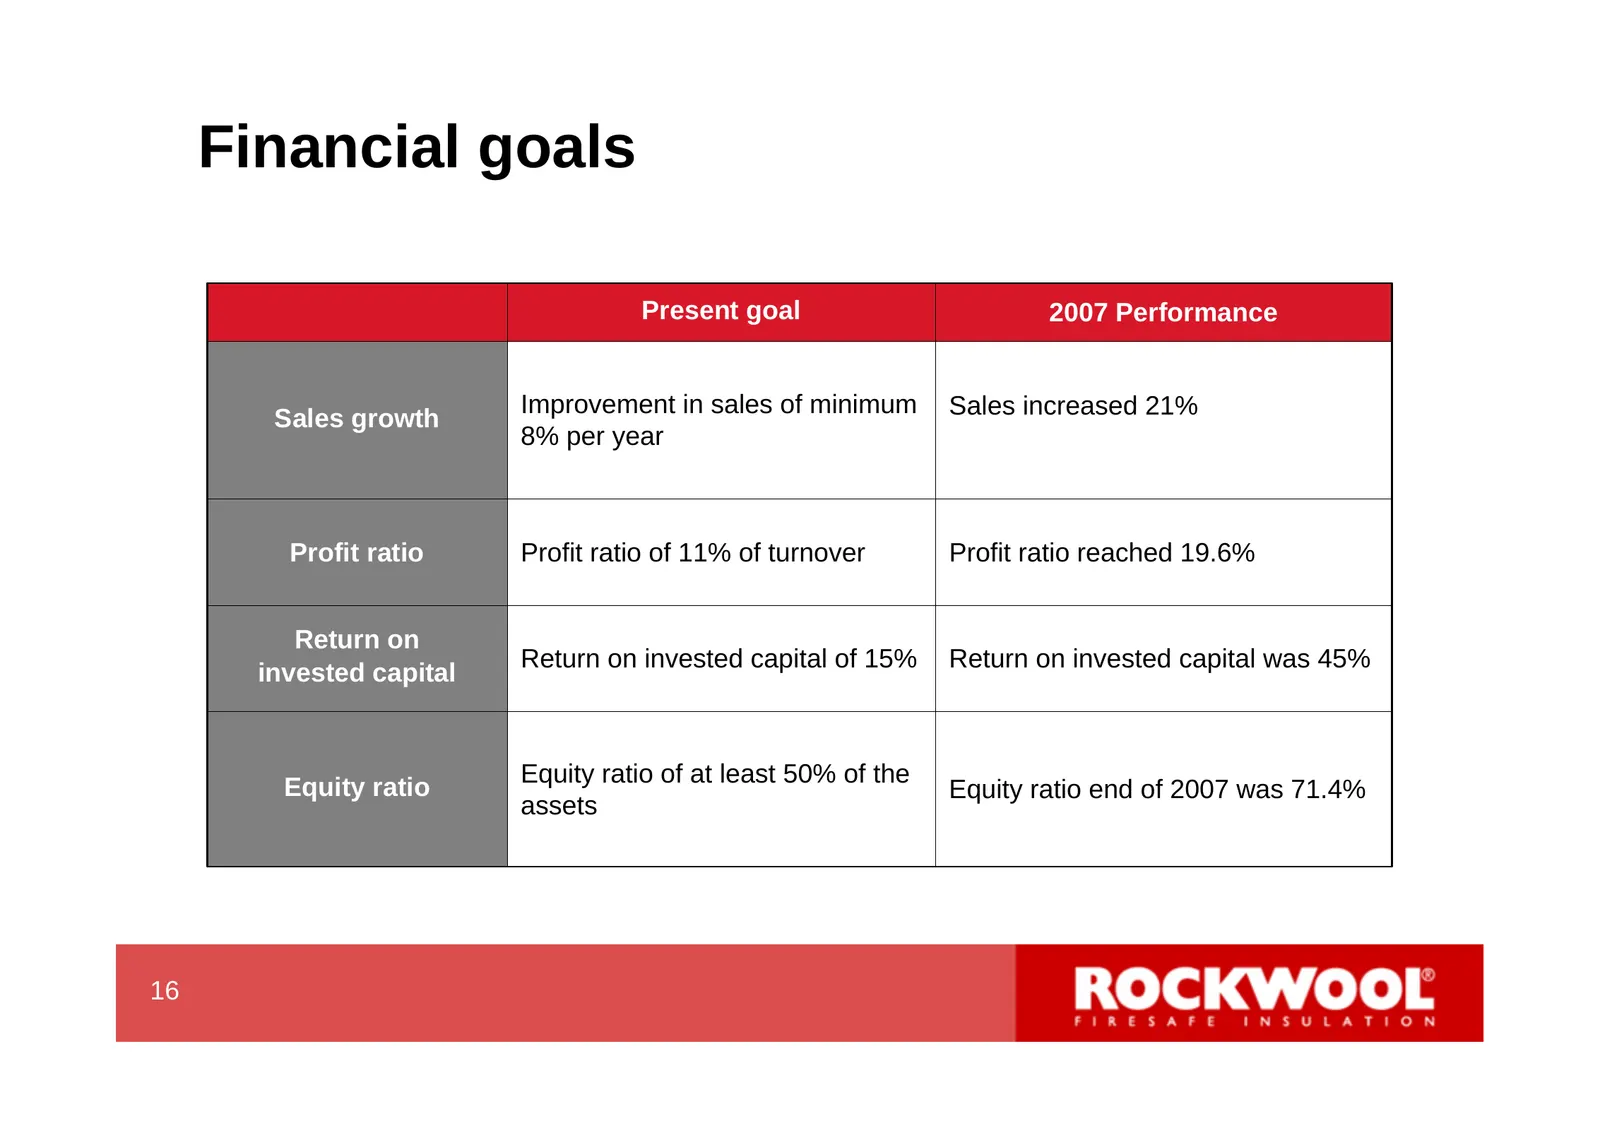
Financial goals Present goal 2007 Performance Improvement in sales of minimum Sales increased 21% Sales growth 8% per year Profit ratio Profit ratio of 11% of turnover Profit ratio reached 19.6% Return on Return on invested capital of 15% Return on invested capital was 45% invested capital Equity ra
Slide 19: Expectations for 2008 are unchanged
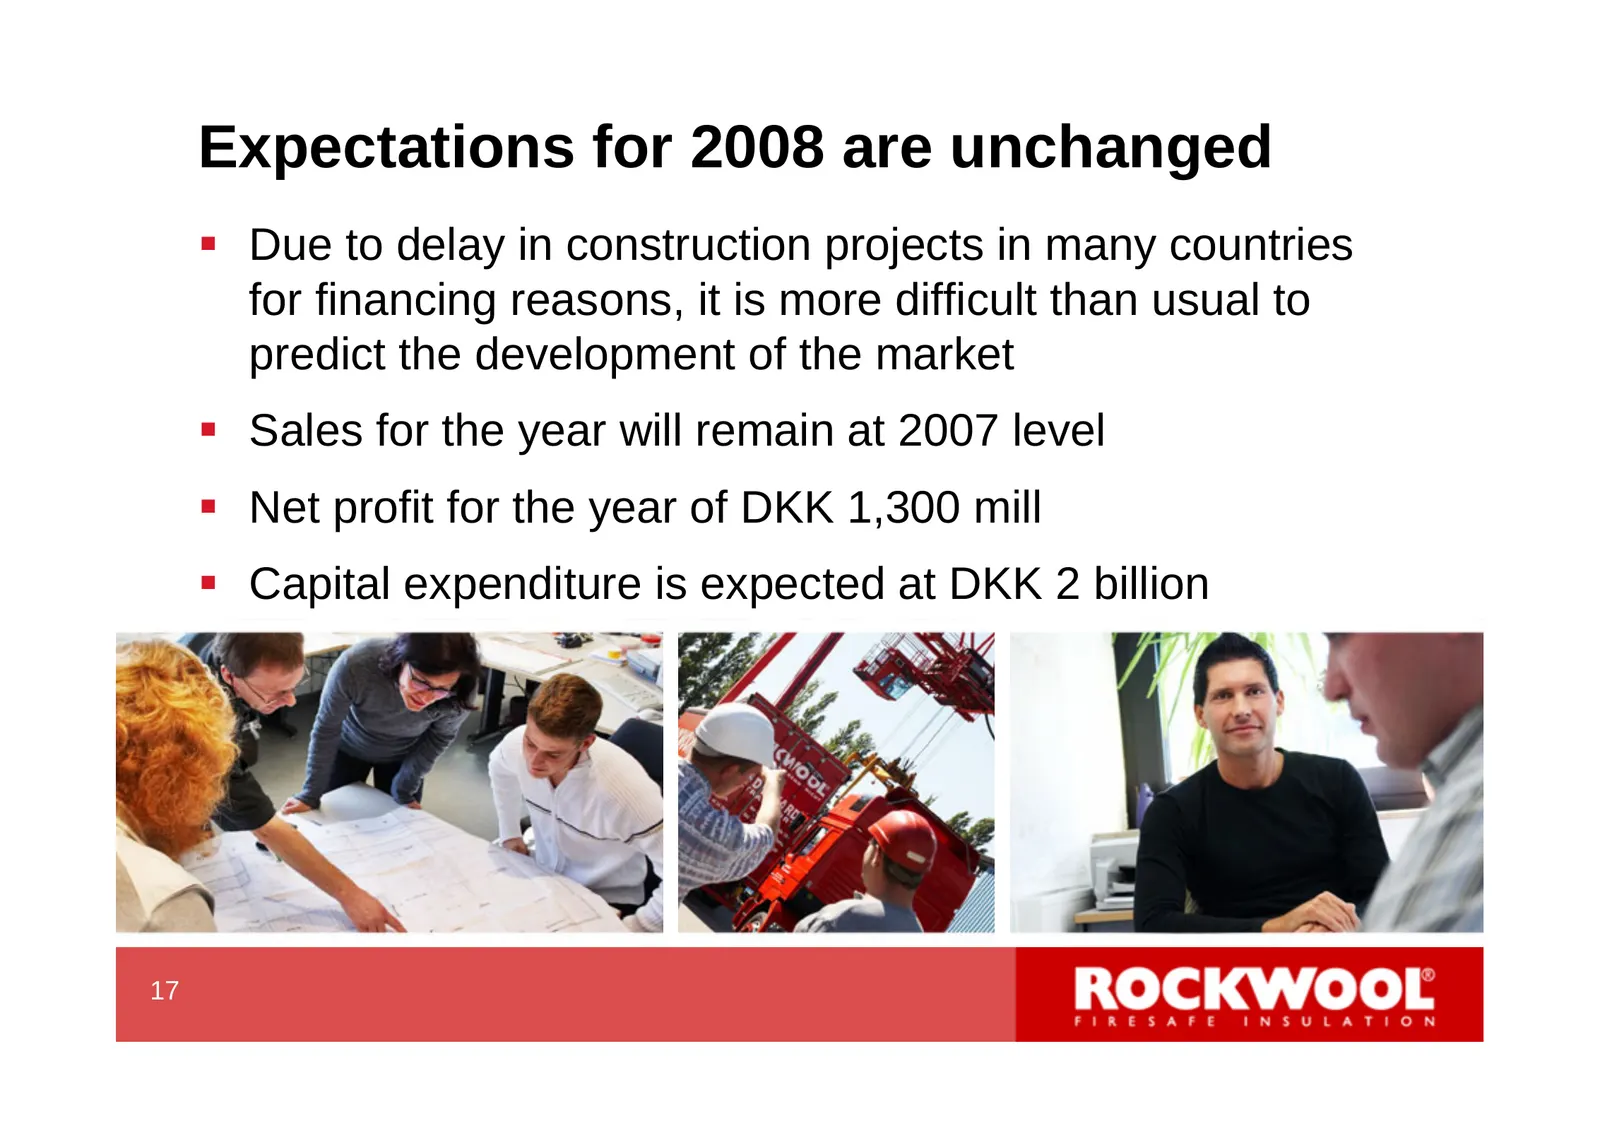
Expectations for 2008 are unchanged Due to delay in construction projects in many countries for financing reasons, it is more difficult than usual to predict the development of the market Sales for the year will remain at 2007 level Net profit for the year of DKK 1,300 mill Capital expenditu
Slide 20: Market
Market 18 20
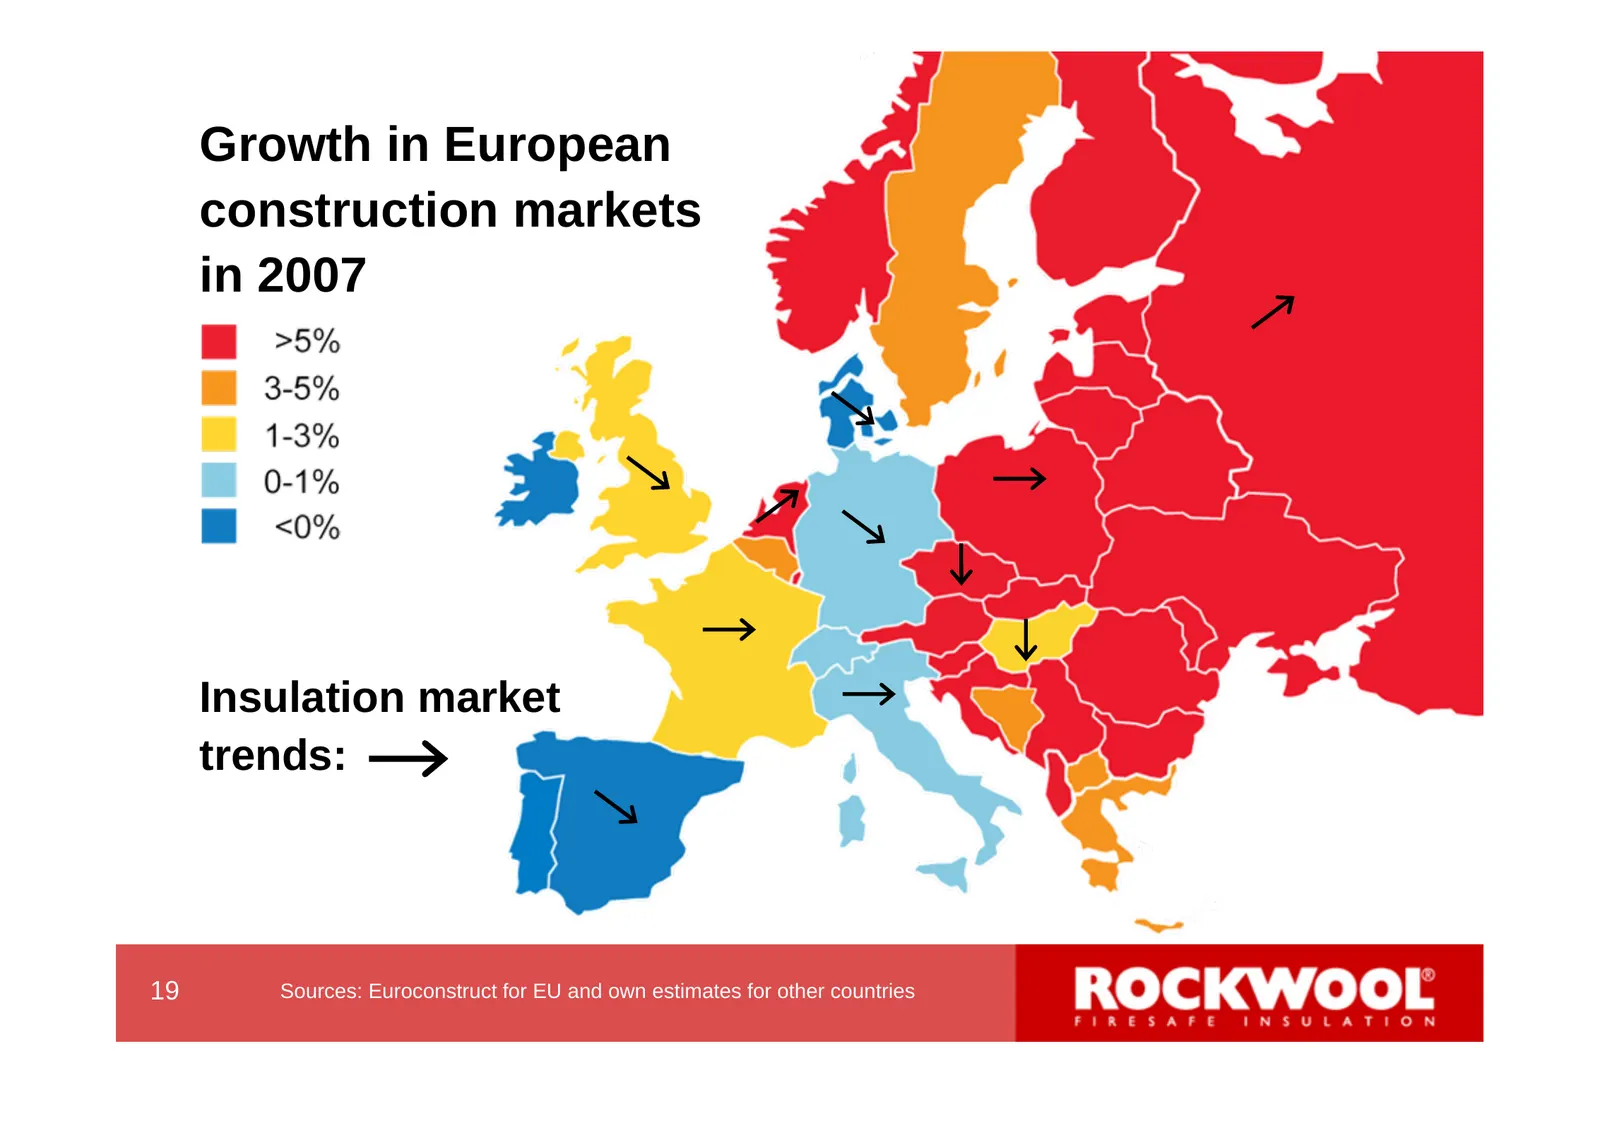
Slide 21: Growth in European construction markets in 2007
Growth in European construction markets in 2007 Insulation market trends: 19 Sources: Euroconstruct for EU and own estimates for other countries 21
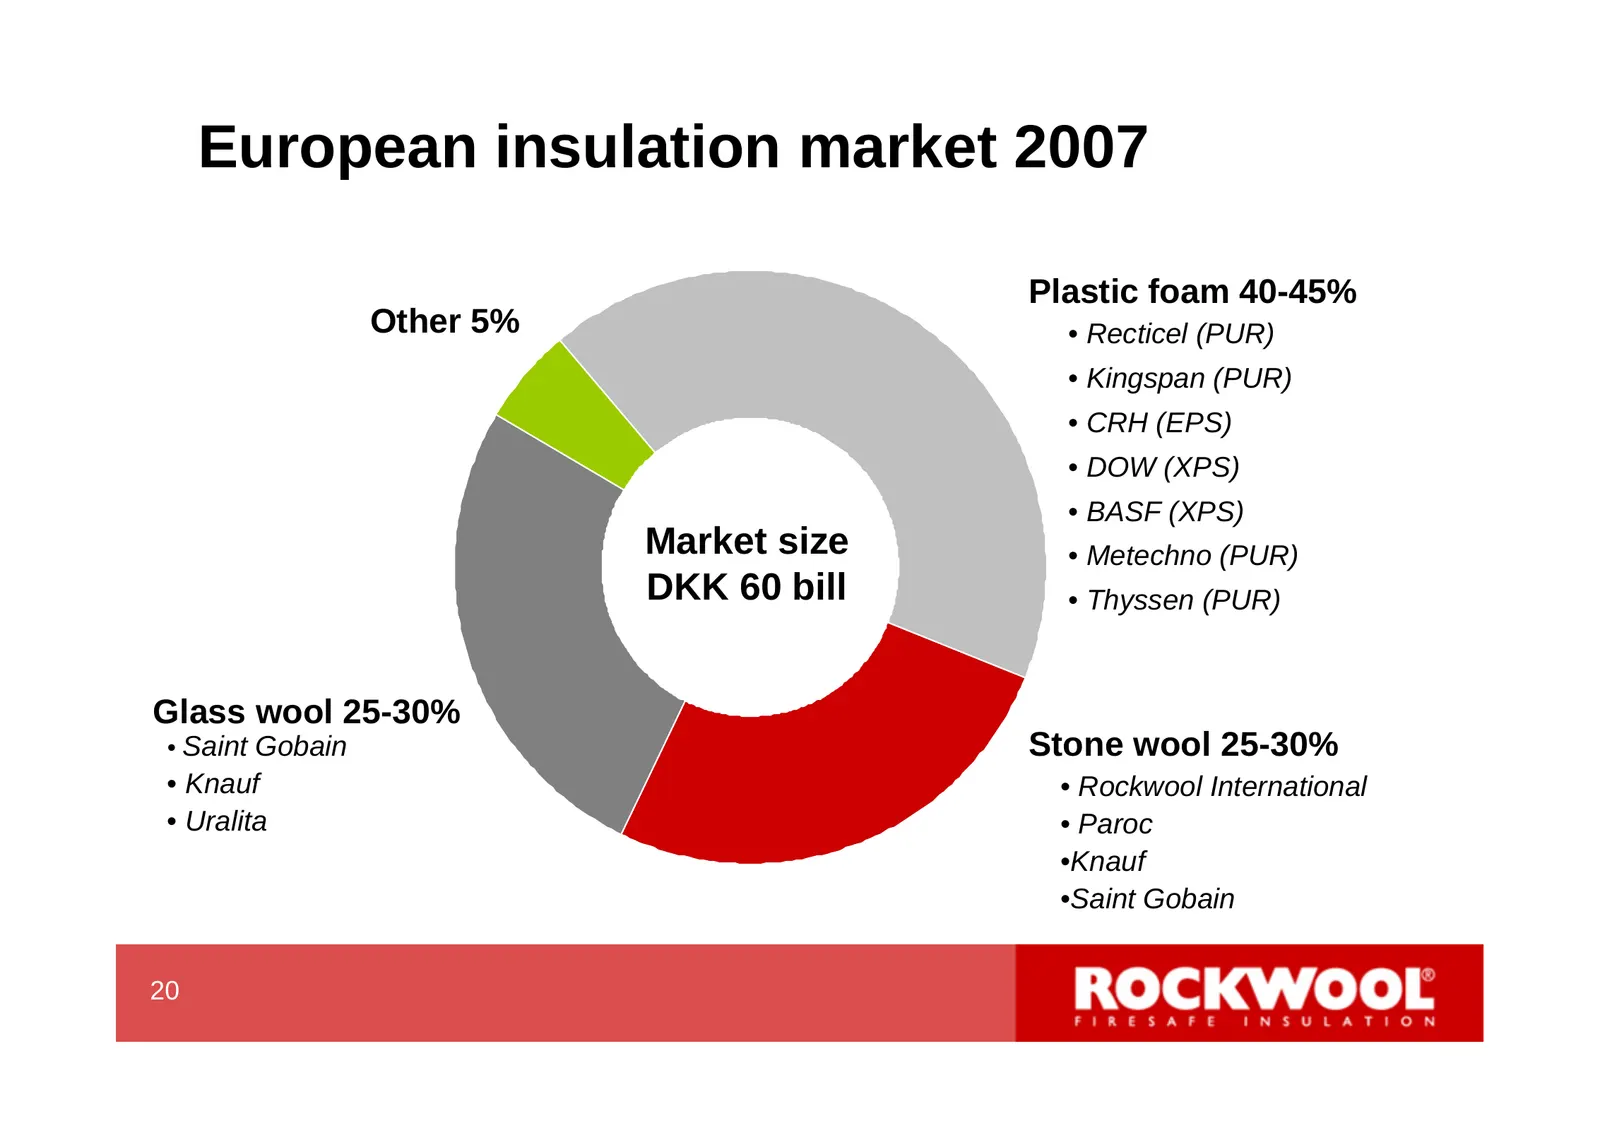
Slide 22: European insulation market 2007
European insulation market 2007 Plastic foam 40-45% Other 5% • Recticel (PUR) • Kingspan (PUR) • CRH (EPS) • DOW (XPS) • BASF (XPS) Market size • Metechno (PUR) DKK 60 bill • Thyssen (PUR) Glass wool 25-30% • Saint Gobain Stone wool 25-30% • Knauf • Rockwool International • Uralita • Paroc •Knauf •S
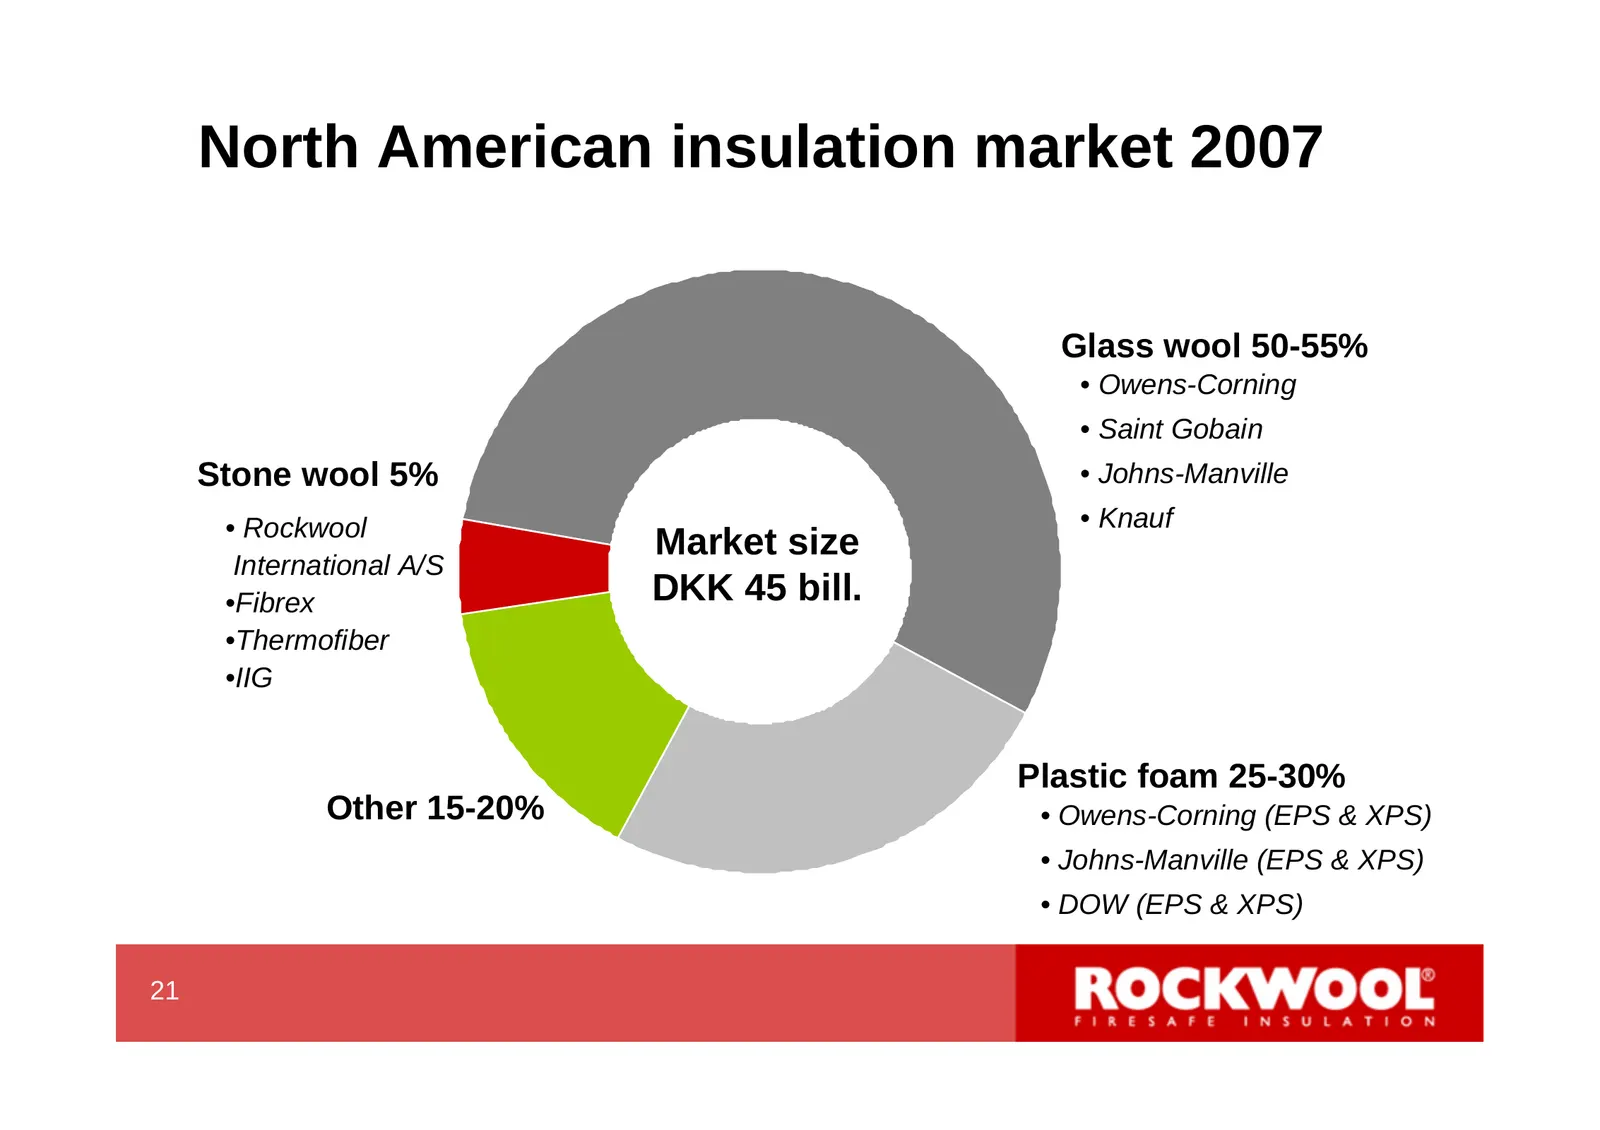
Slide 23: North American insulation market 2007
North American insulation market 2007 Glass wool 50-55% • Owens-Corning • Saint Gobain Stone wool 5% • Johns-Manville • Rockwool • Knauf Market size International A/S •Fibrex DKK 45 bill. •Thermofiber •IIG Plastic foam 25-30% Other 15-20% • Owens-Corning (EPS & XPS) • Johns-Manville (EPS & XPS) • DO
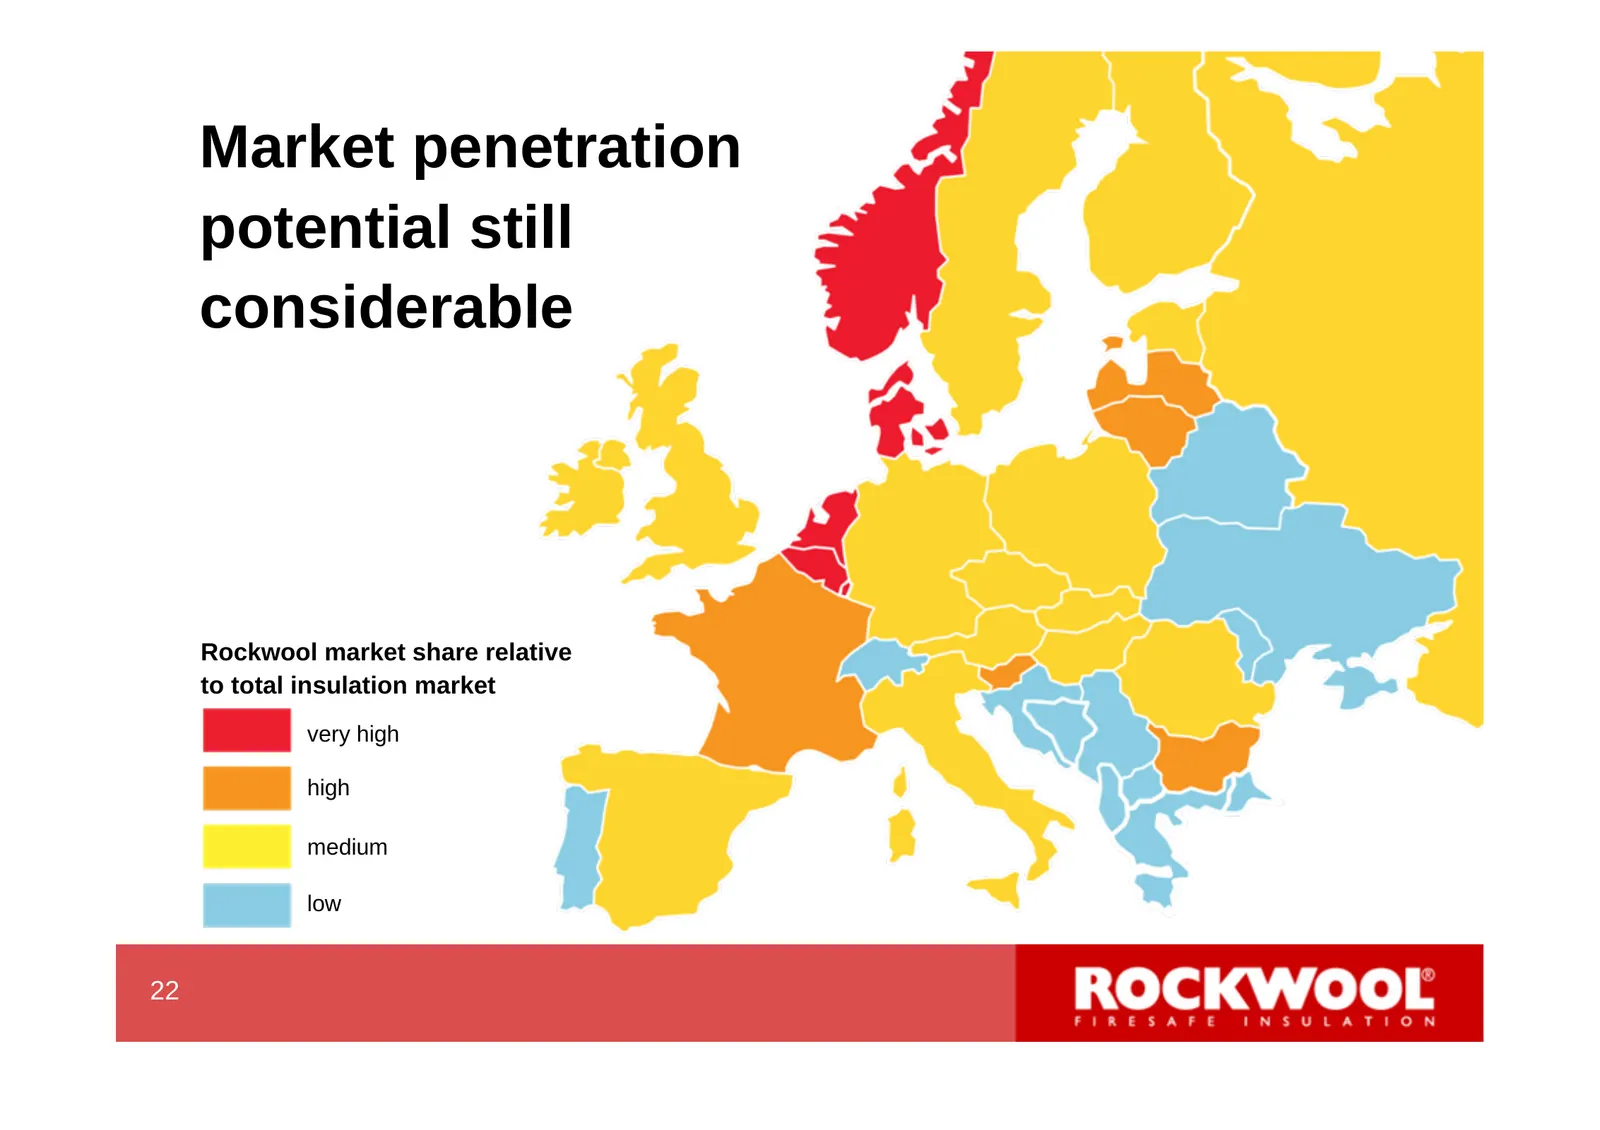
Slide 24: Market penetration potential still considerable
Market penetration potential still considerable Rockwool market share relative to total insulation market very high high medium low 22 24
Slide 25: Product properties and market segments
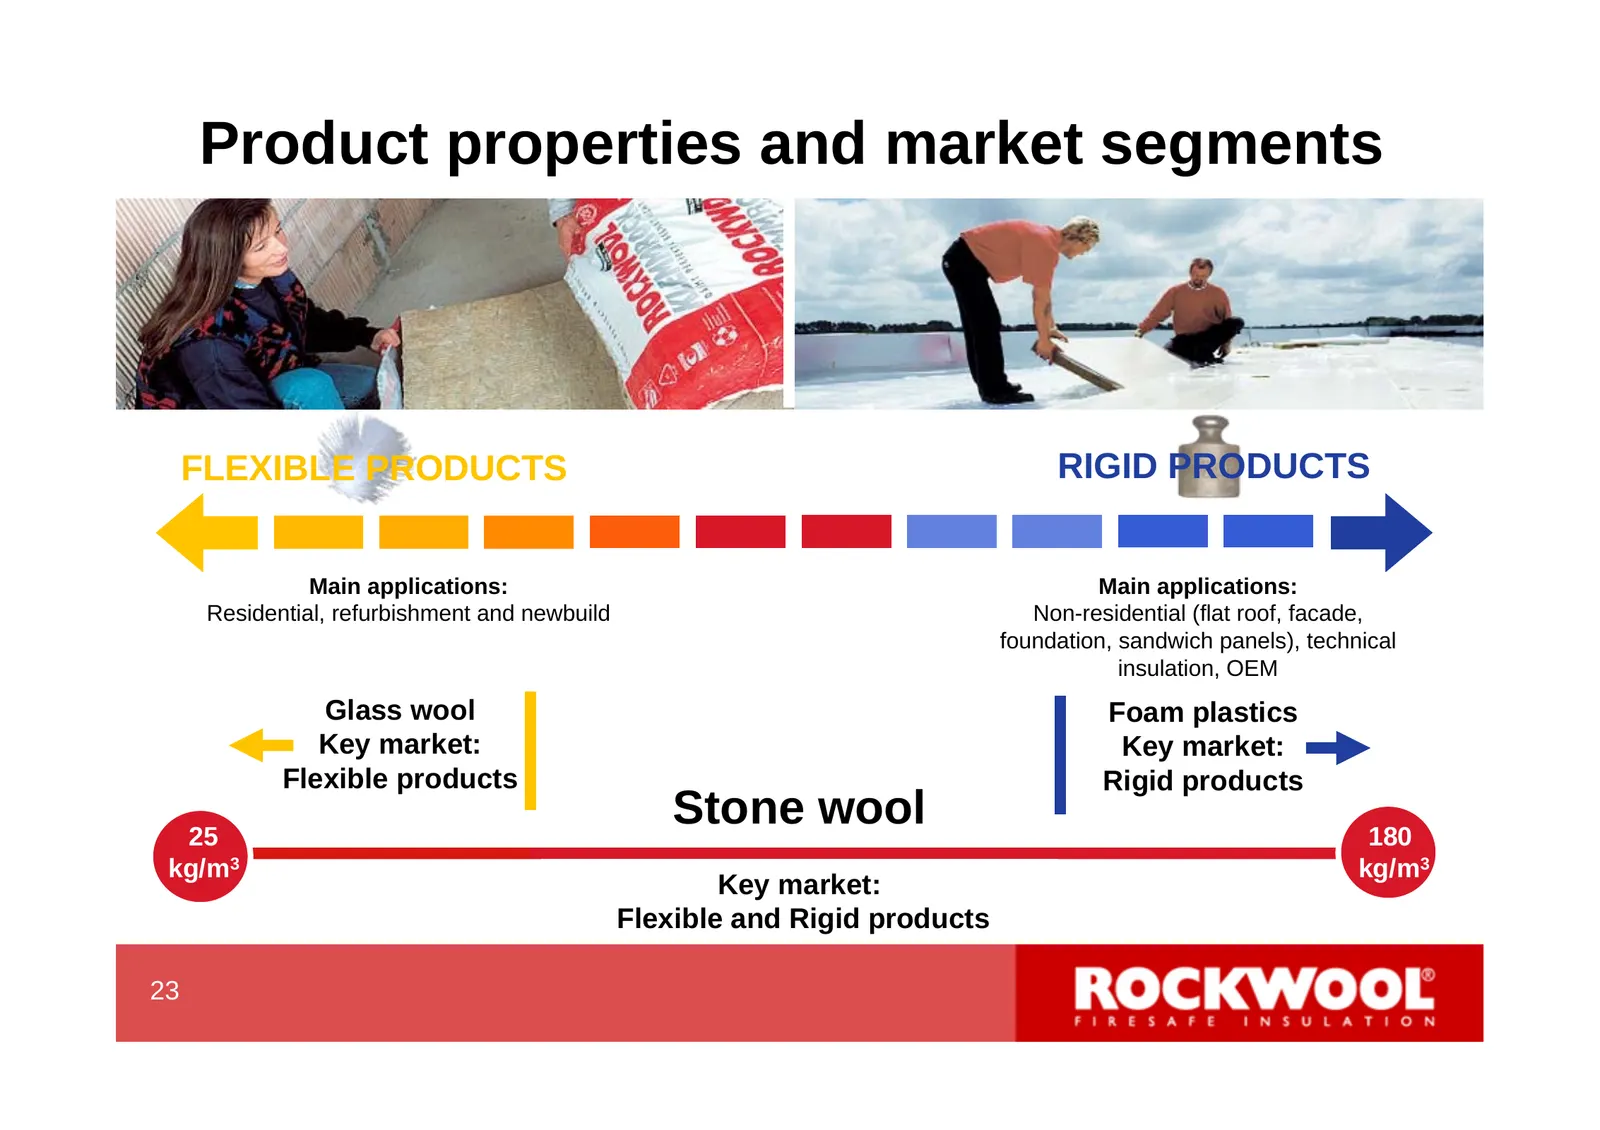
Product properties and market segments FLEXIBLE PRODUCTS RIGID PRODUCTS Main applications: Main applications: Residential, refurbishment and newbuild Non-residential (flat roof, facade, foundation, sandwich panels), technical insulation, OEM Glass wool Foam plastics Key market: Key market: Flexible
Slide 26: Product properties - Insulation
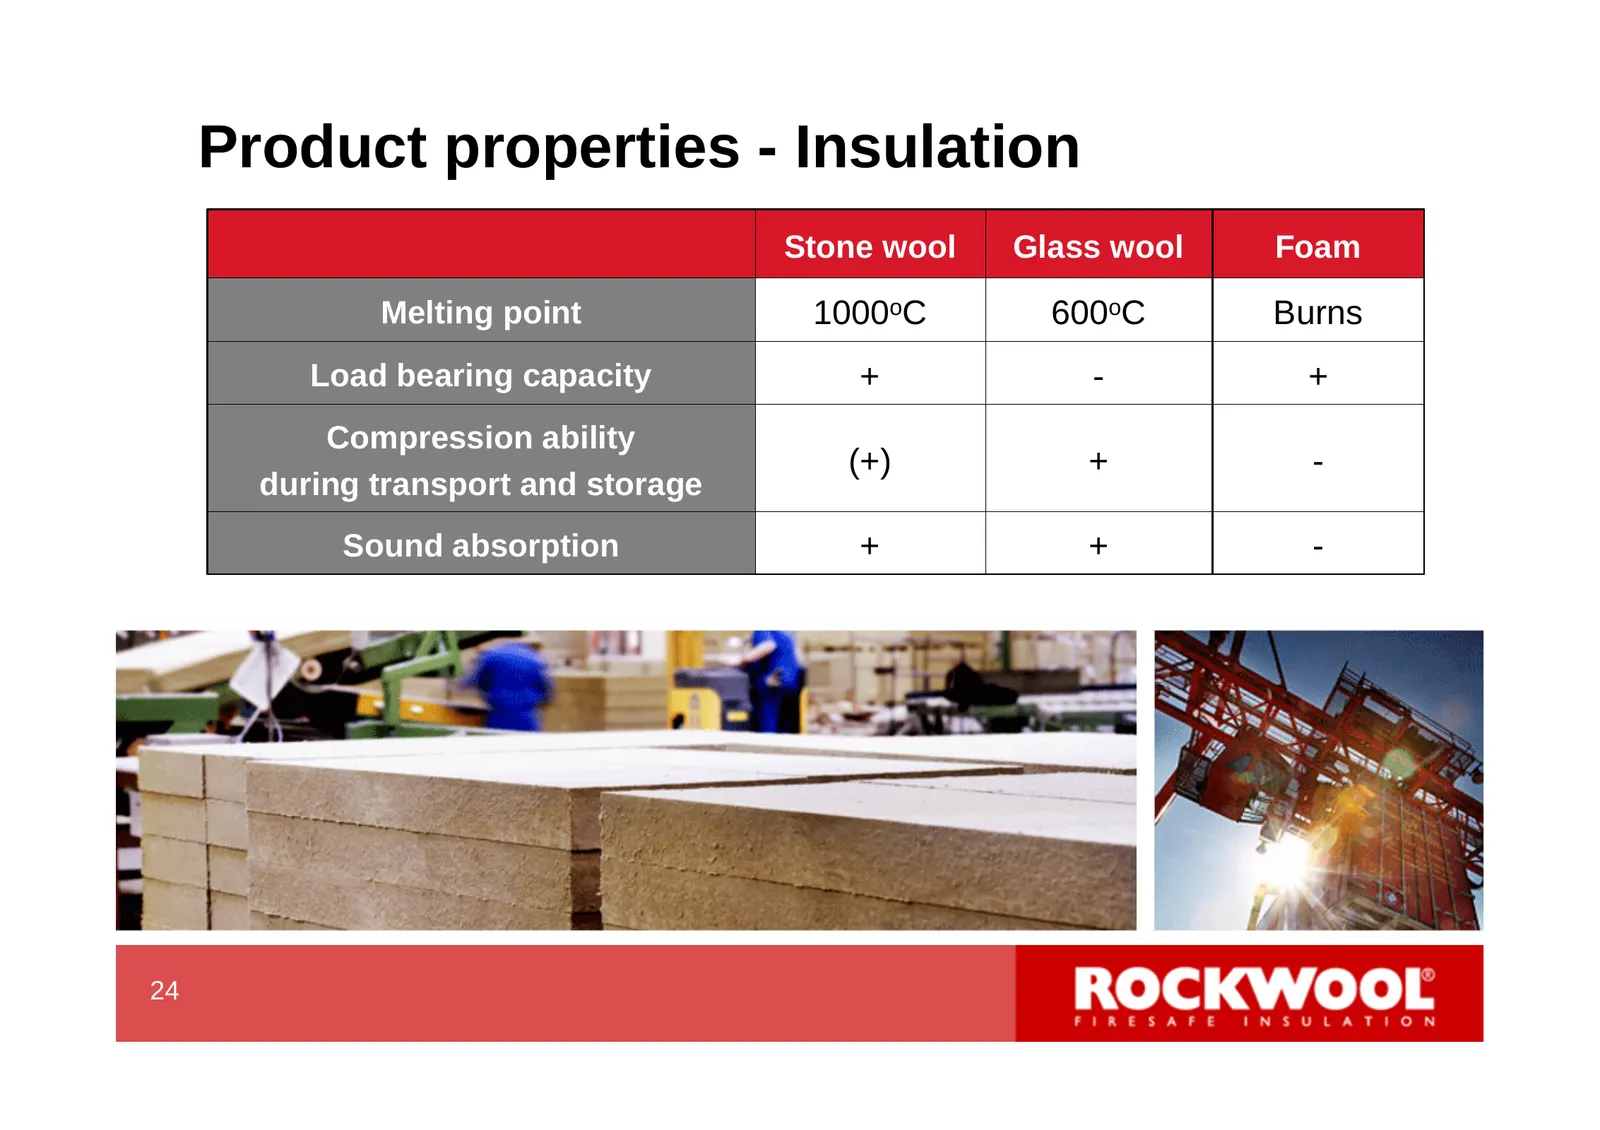
Product properties - Insulation Stone wool Glass wool Foam Melting point 1000oC 600oC Burns Load bearing capacity + - + Compression ability (+) + - during transport and storage Sound absorption + + - 24 26
Slide 27: European insulation market
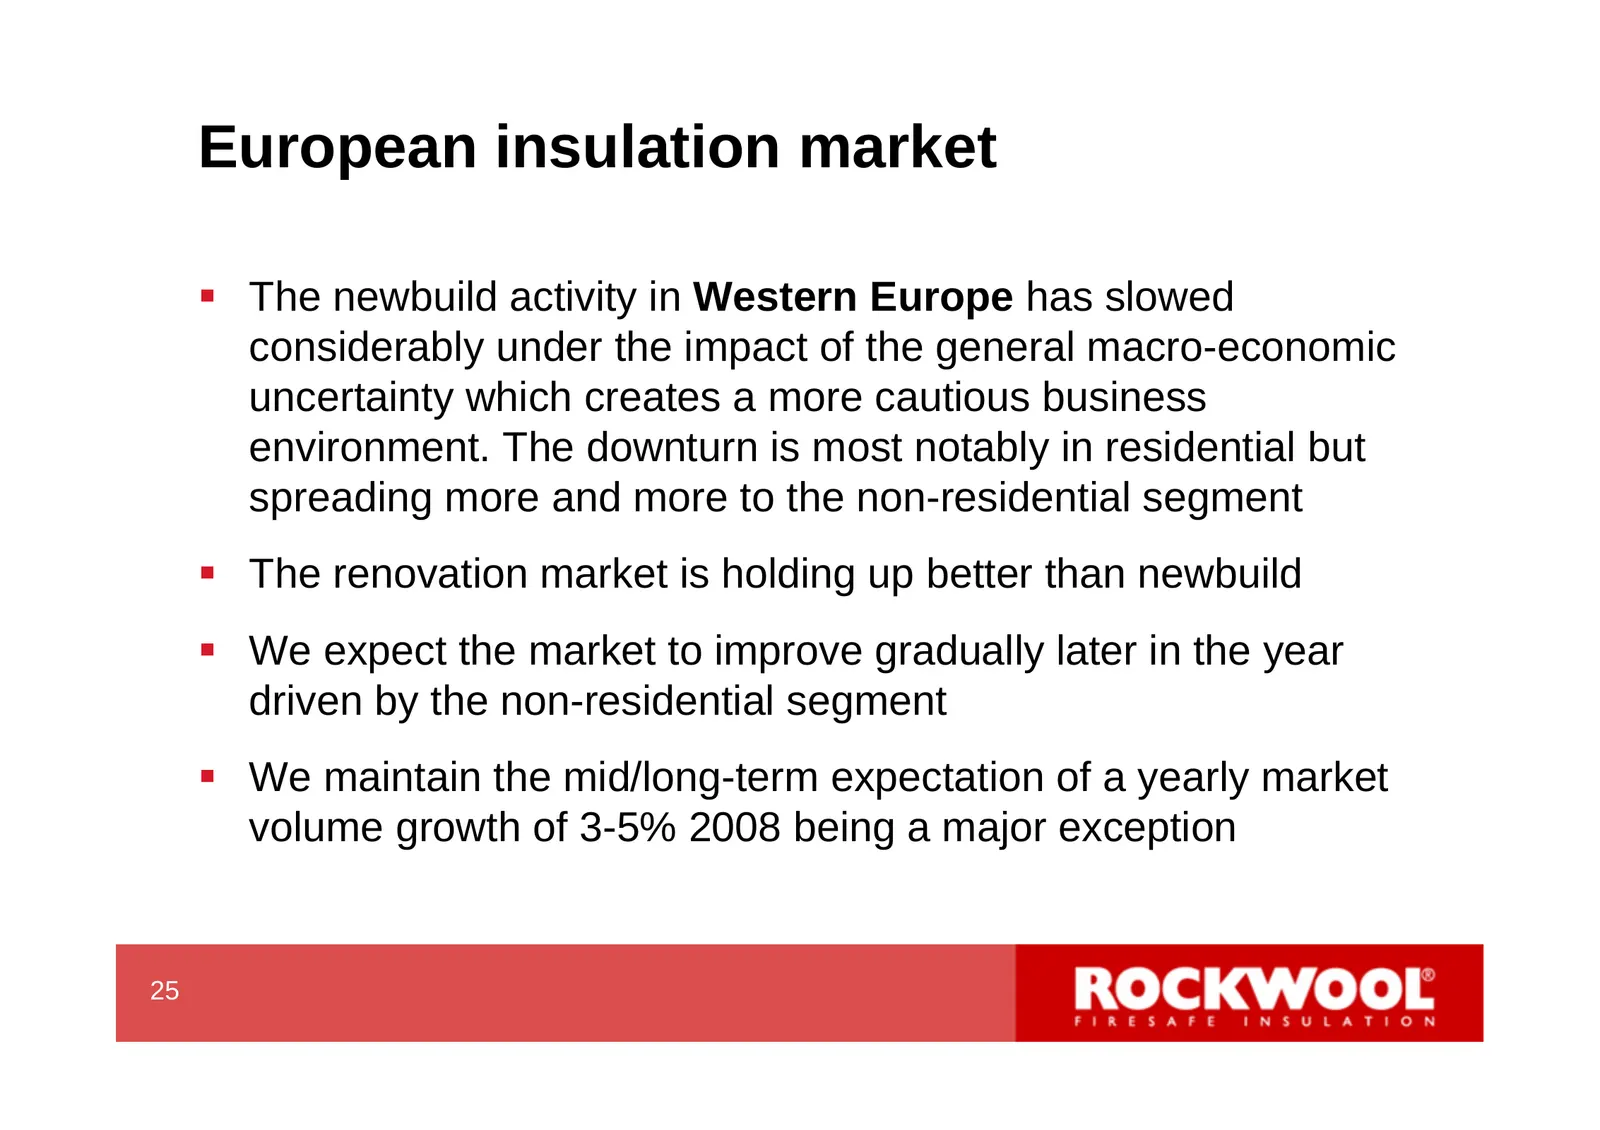
European insulation market The newbuild activity in Western Europe has slowed considerably under the impact of the general macro-economic uncertainty which creates a more cautious business environment. The downturn is most notably in residential but spreading more and more to the non-residential s
Slide 28: European insulation market
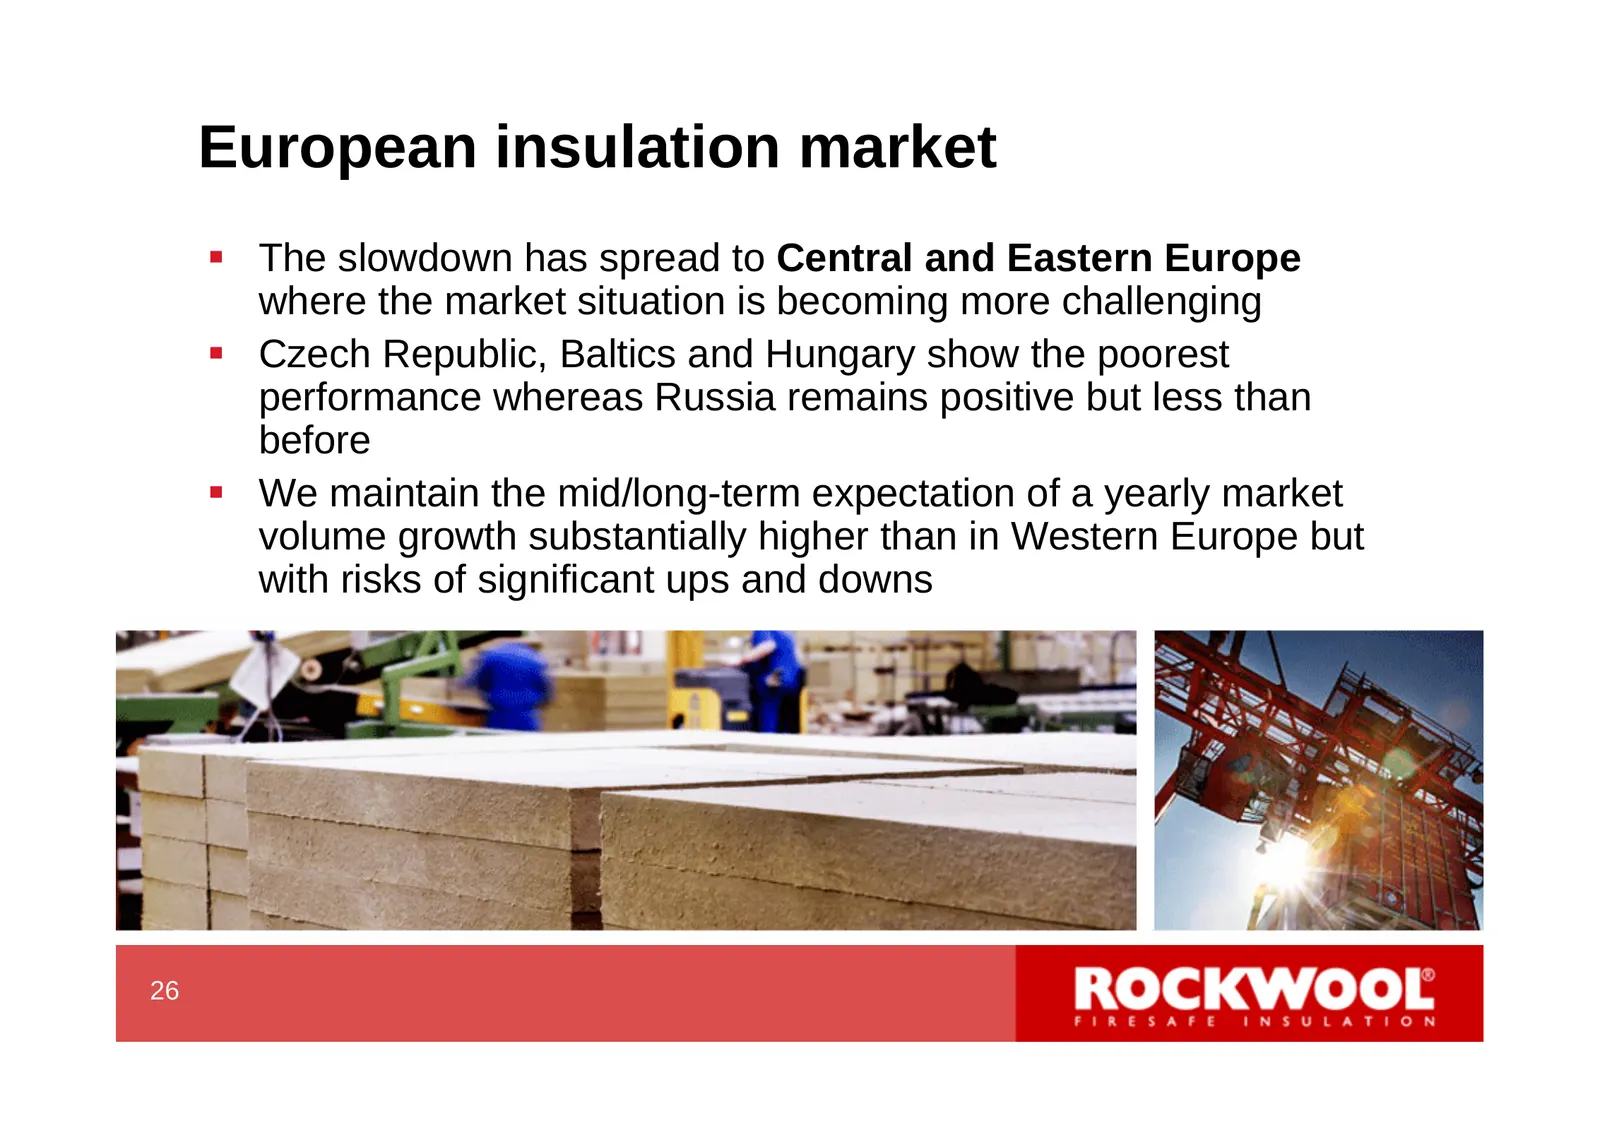
European insulation market The slowdown has spread to Central and Eastern Europe where the market situation is becoming more challenging Czech Republic, Baltics and Hungary show the poorest performance whereas Russia remains positive but less than before We maintain the mid/long-term expectati
Slide 29: Overseas insulation markets
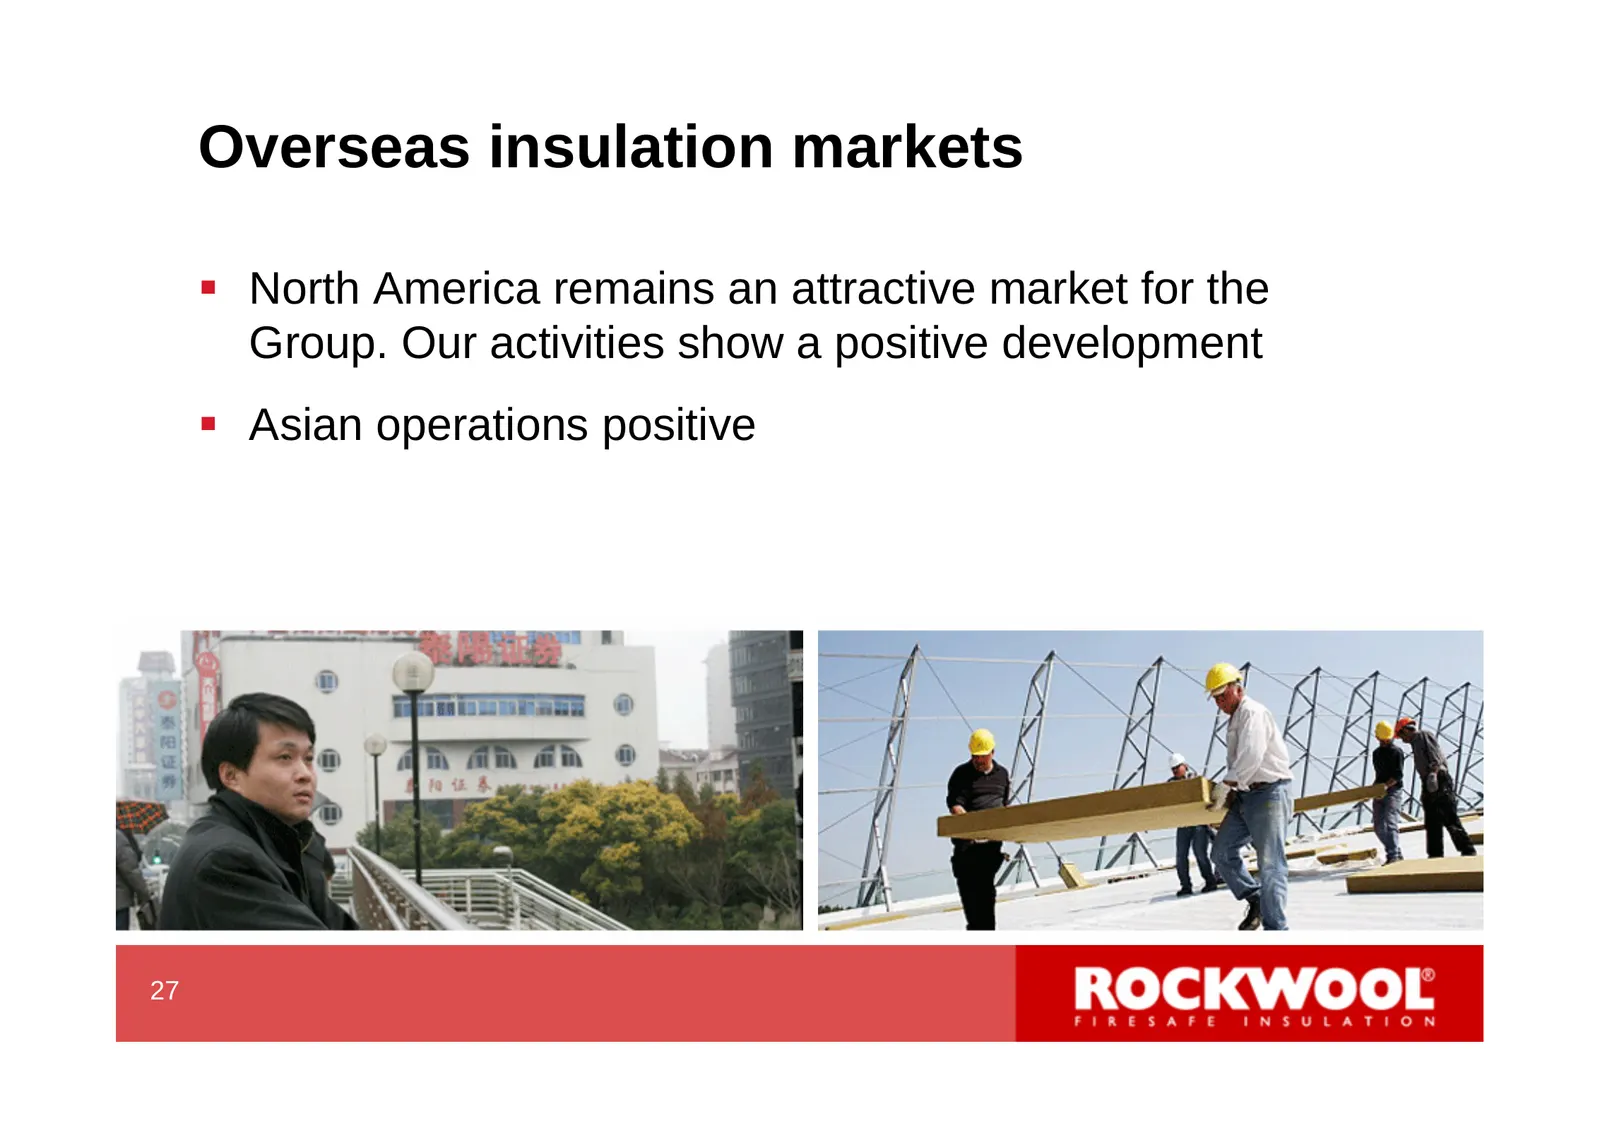
Overseas insulation markets North America remains an attractive market for the Group. Our activities show a positive development Asian operations positive 27 29
Slide 30: Systems Division markets
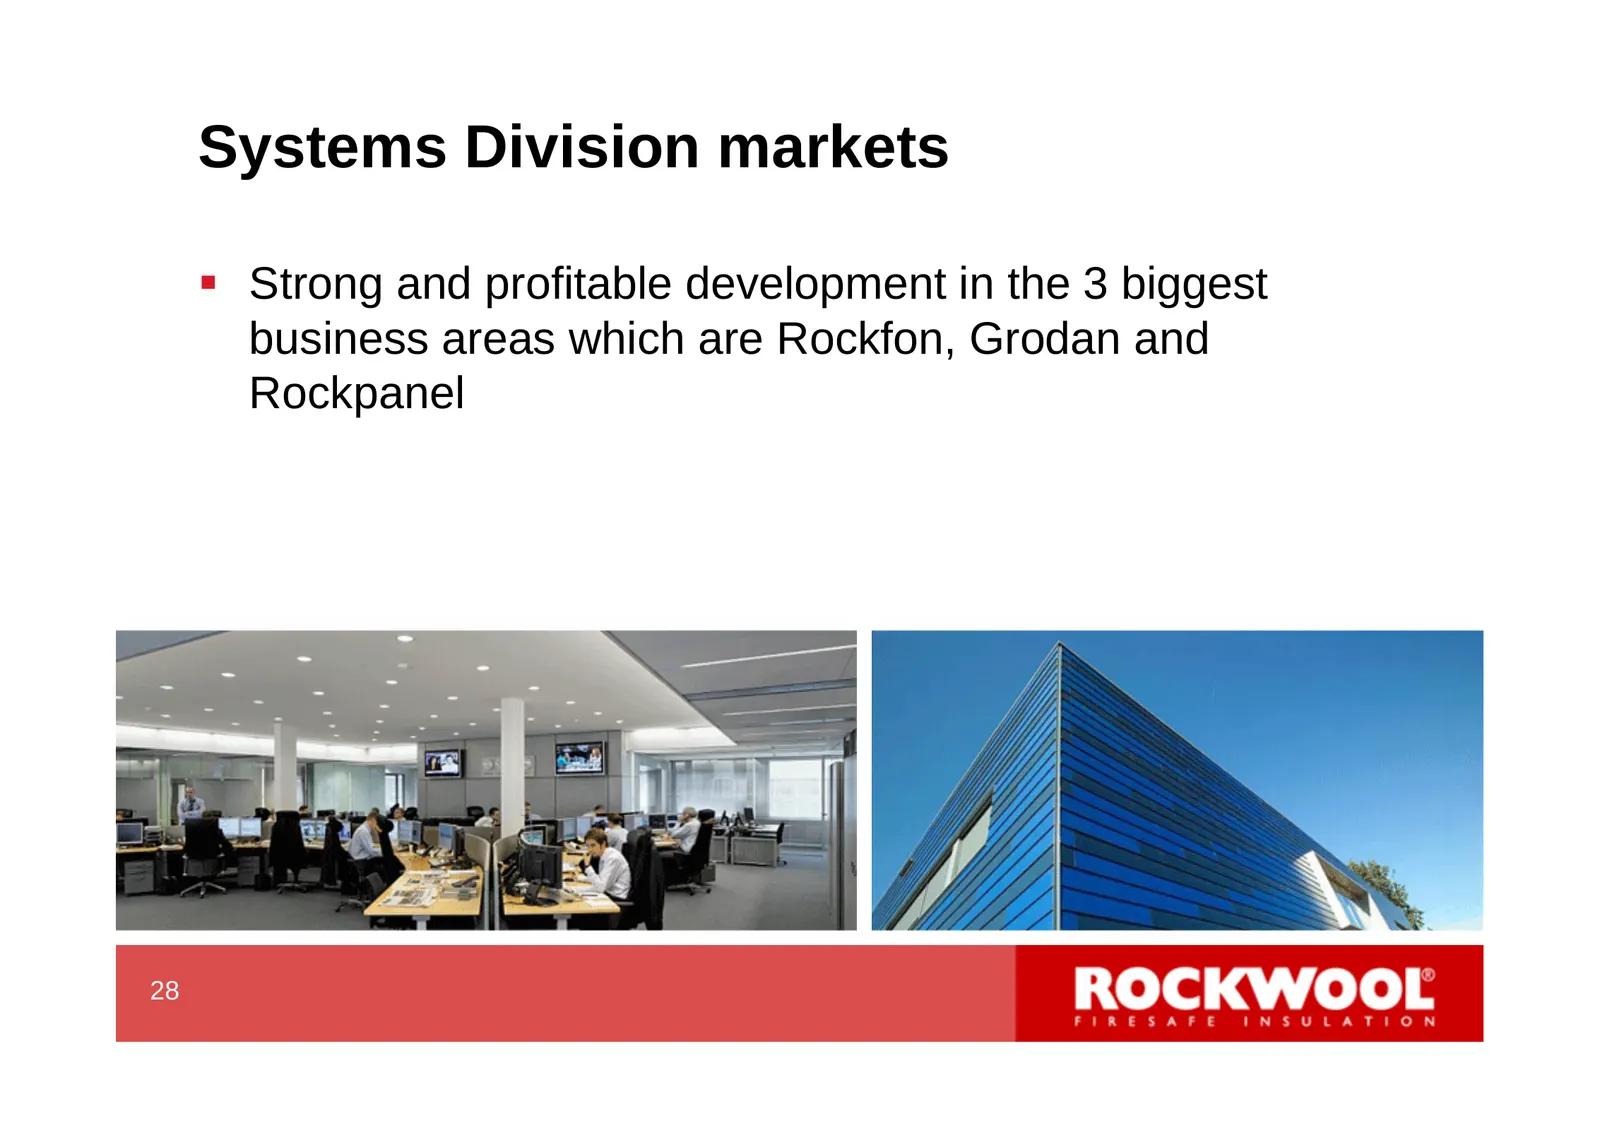
Systems Division markets Strong and profitable development in the 3 biggest business areas which are Rockfon, Grodan and Rockpanel 28 30
Slide 31: Major growth drivers - Energy efficiency in buildings
Major growth drivers - Energy efficiency in buildings 29 31
Slide 32: Energy Efficiency in Buildings - EU waves
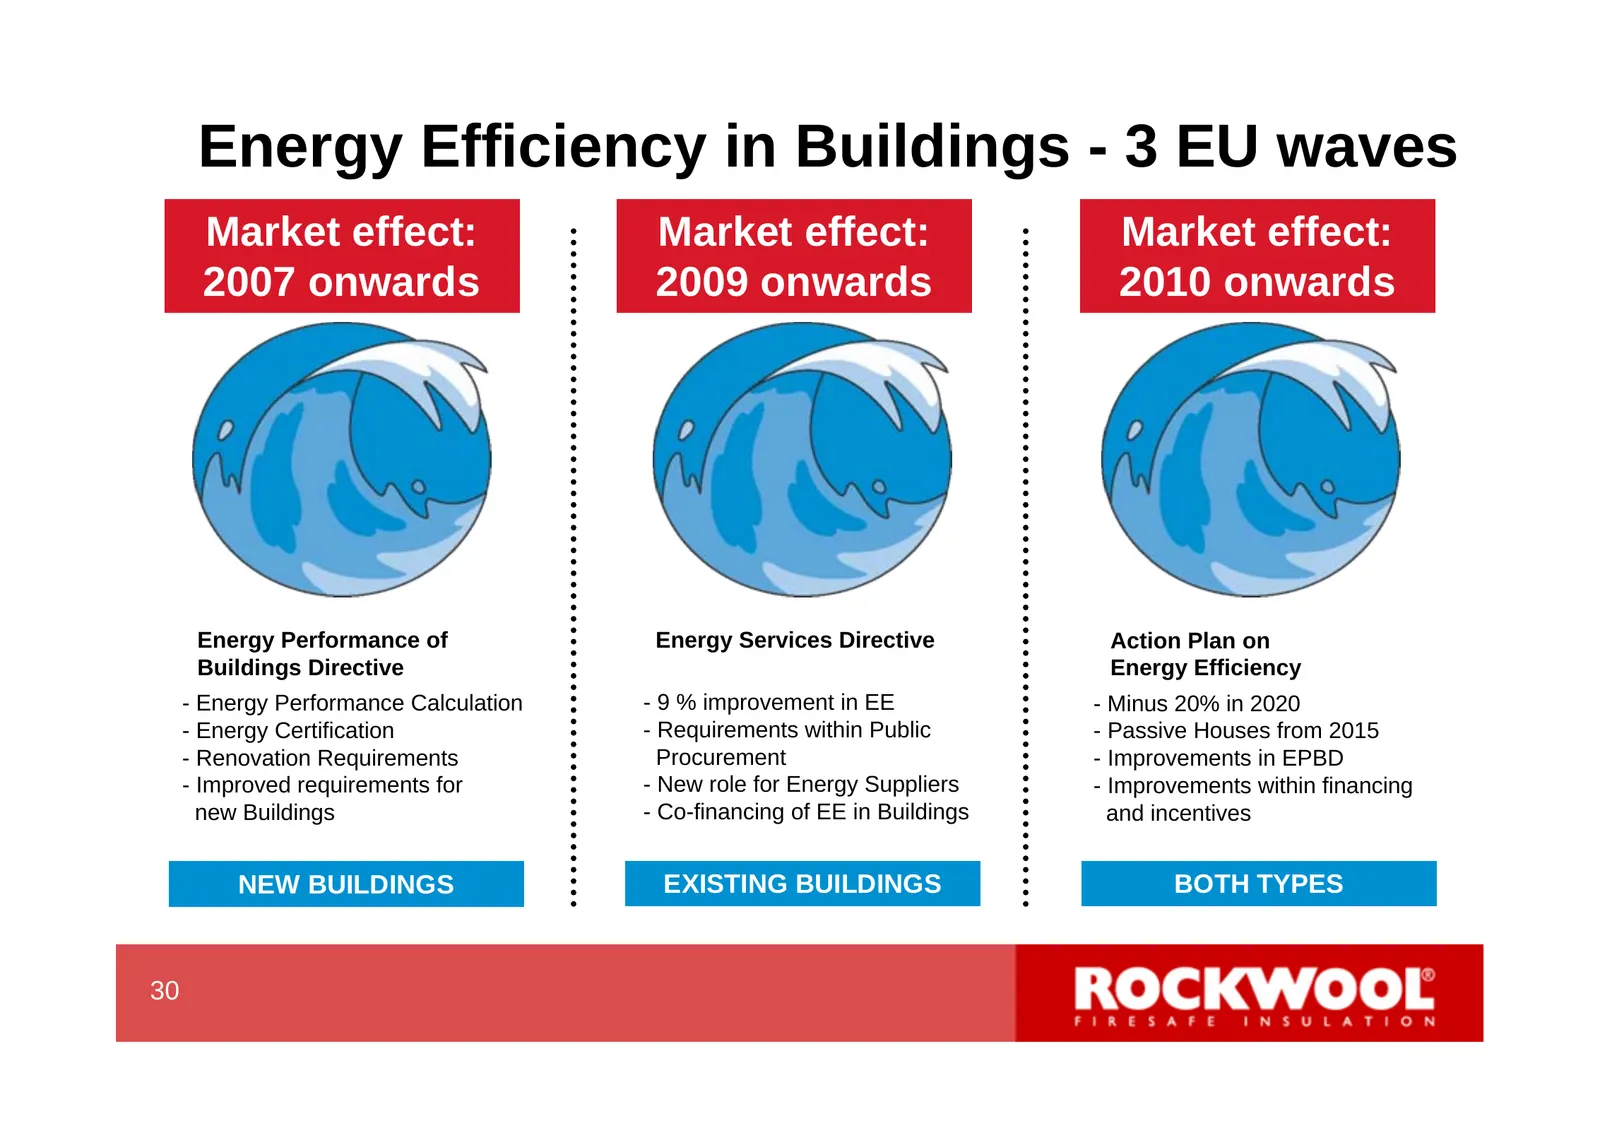
Energy Efficiency in Buildings - 3 EU waves Market effect: Market effect: Market effect: 2007 onwards 2009 onwards 2010 onwards Energy Performance of Energy Services Directive Action Plan on Buildings Directive Energy Efficiency - Energy Performance Calculation - 9 % improvement in EE - Minus 20% in
Slide 33: Energy efficiency of buildings - status
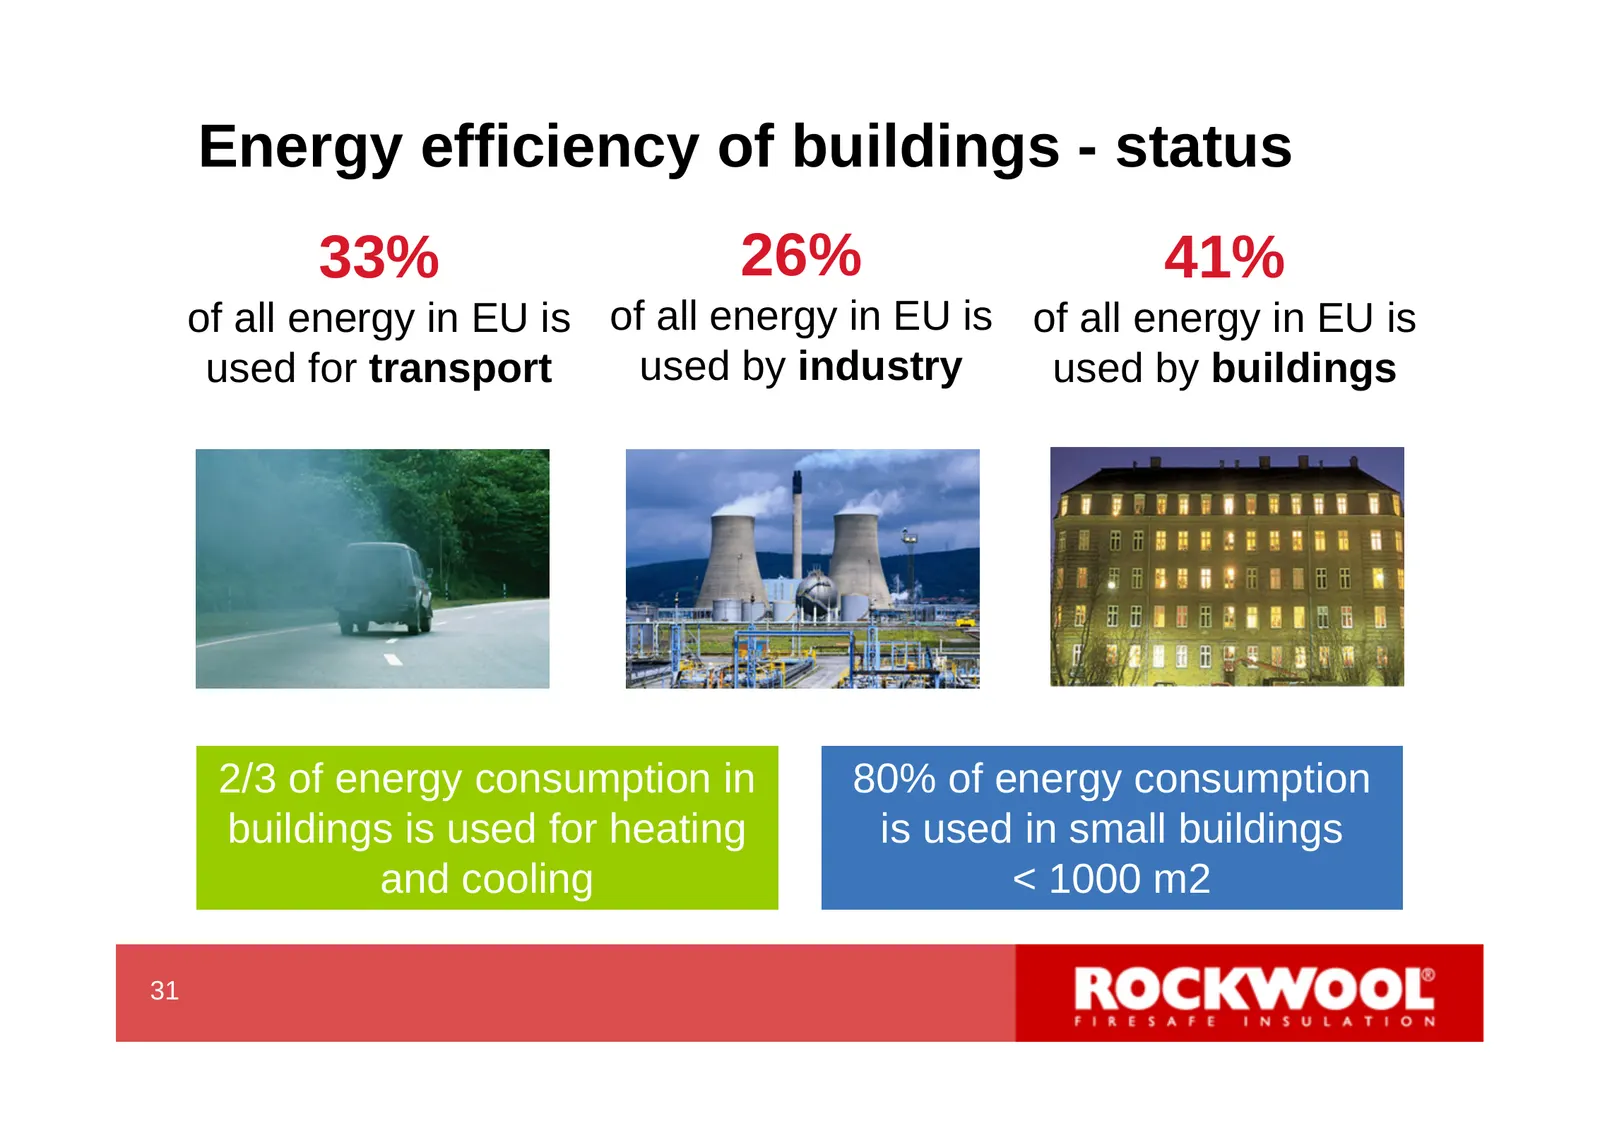
Energy efficiency of buildings - status 33% 26% 41% of all energy in EU is of all energy in EU is of all energy in EU is used for transport used by industry used by buildings 2/3 of energy consumption in 80% of energy consumption buildings is used for heating is used in small buildings and cooling <
Slide 34: The potential - energy used for heating of buildings in DK
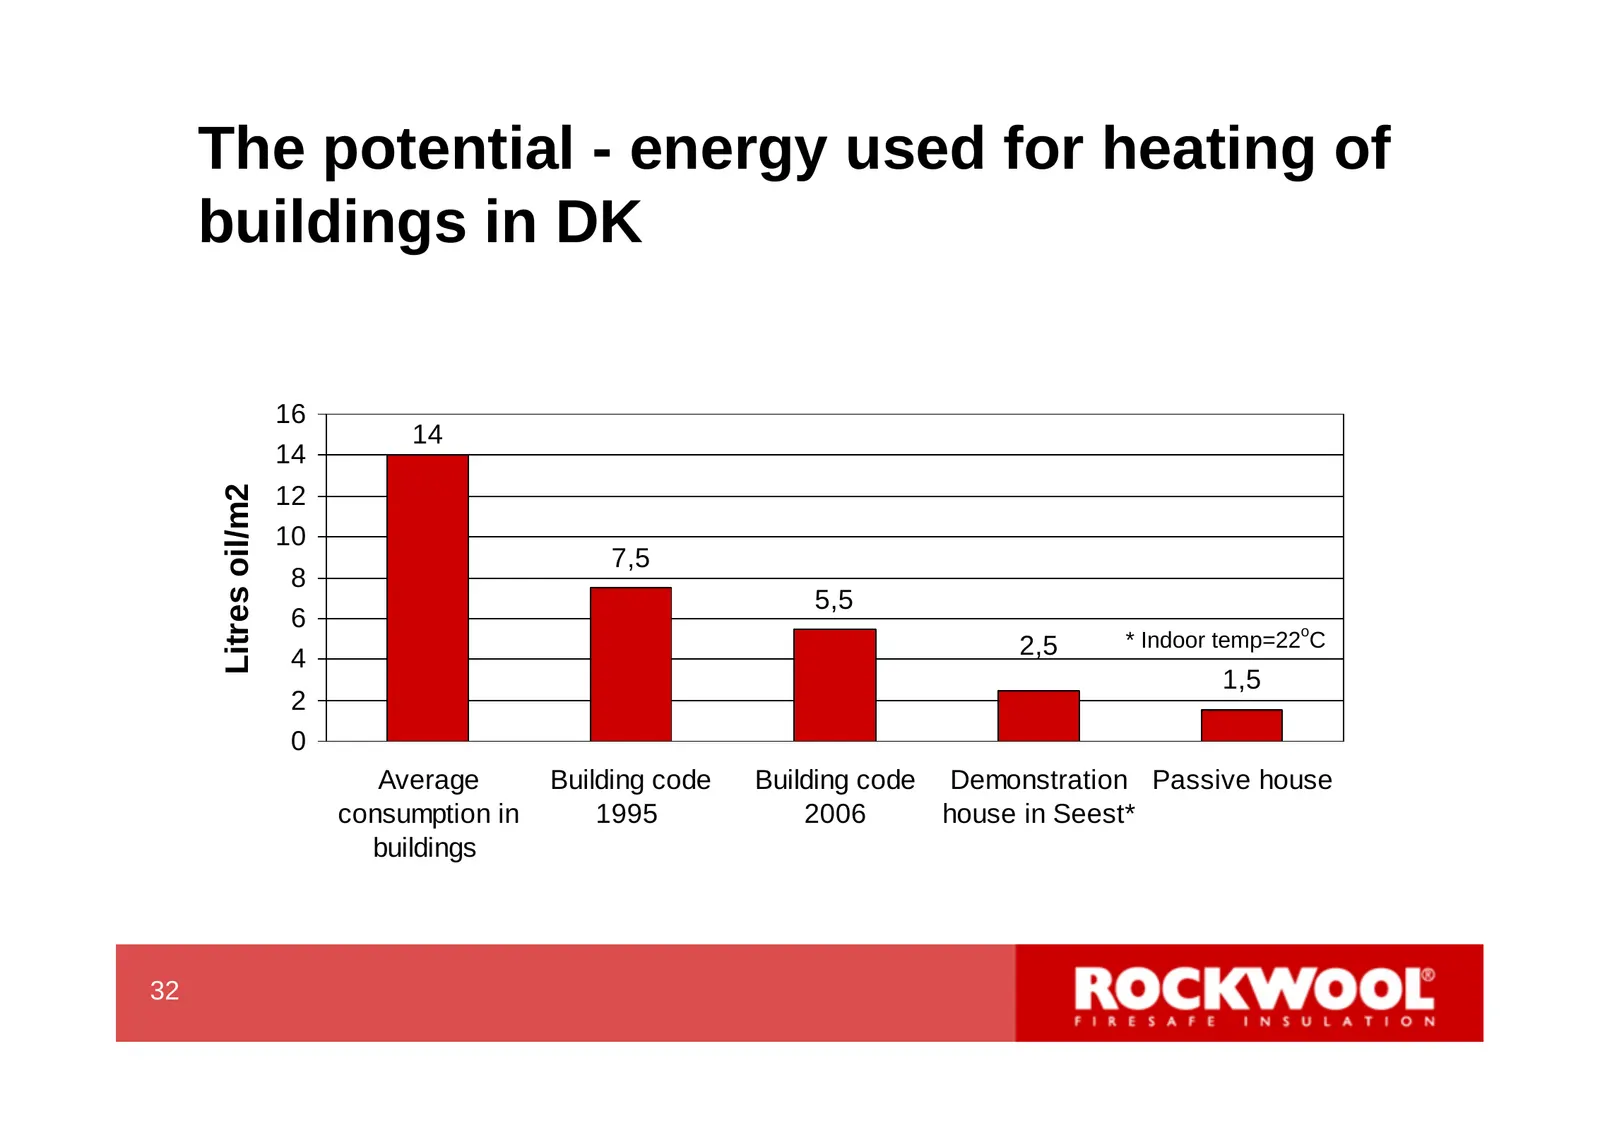
The potential - energy used for heating of buildings in DK 16 14 14 Litres oil/m2 12 10 7,5 8 5,5 6 2,5 * Indoor temp=22oC 4 1,5 2 0 Average Building code Building code Demonstration Passive house consumption in 1995 2006 house in Seest* buildings 32 34
Slide 35: Political pressure for CO2 reductions keeps increasing
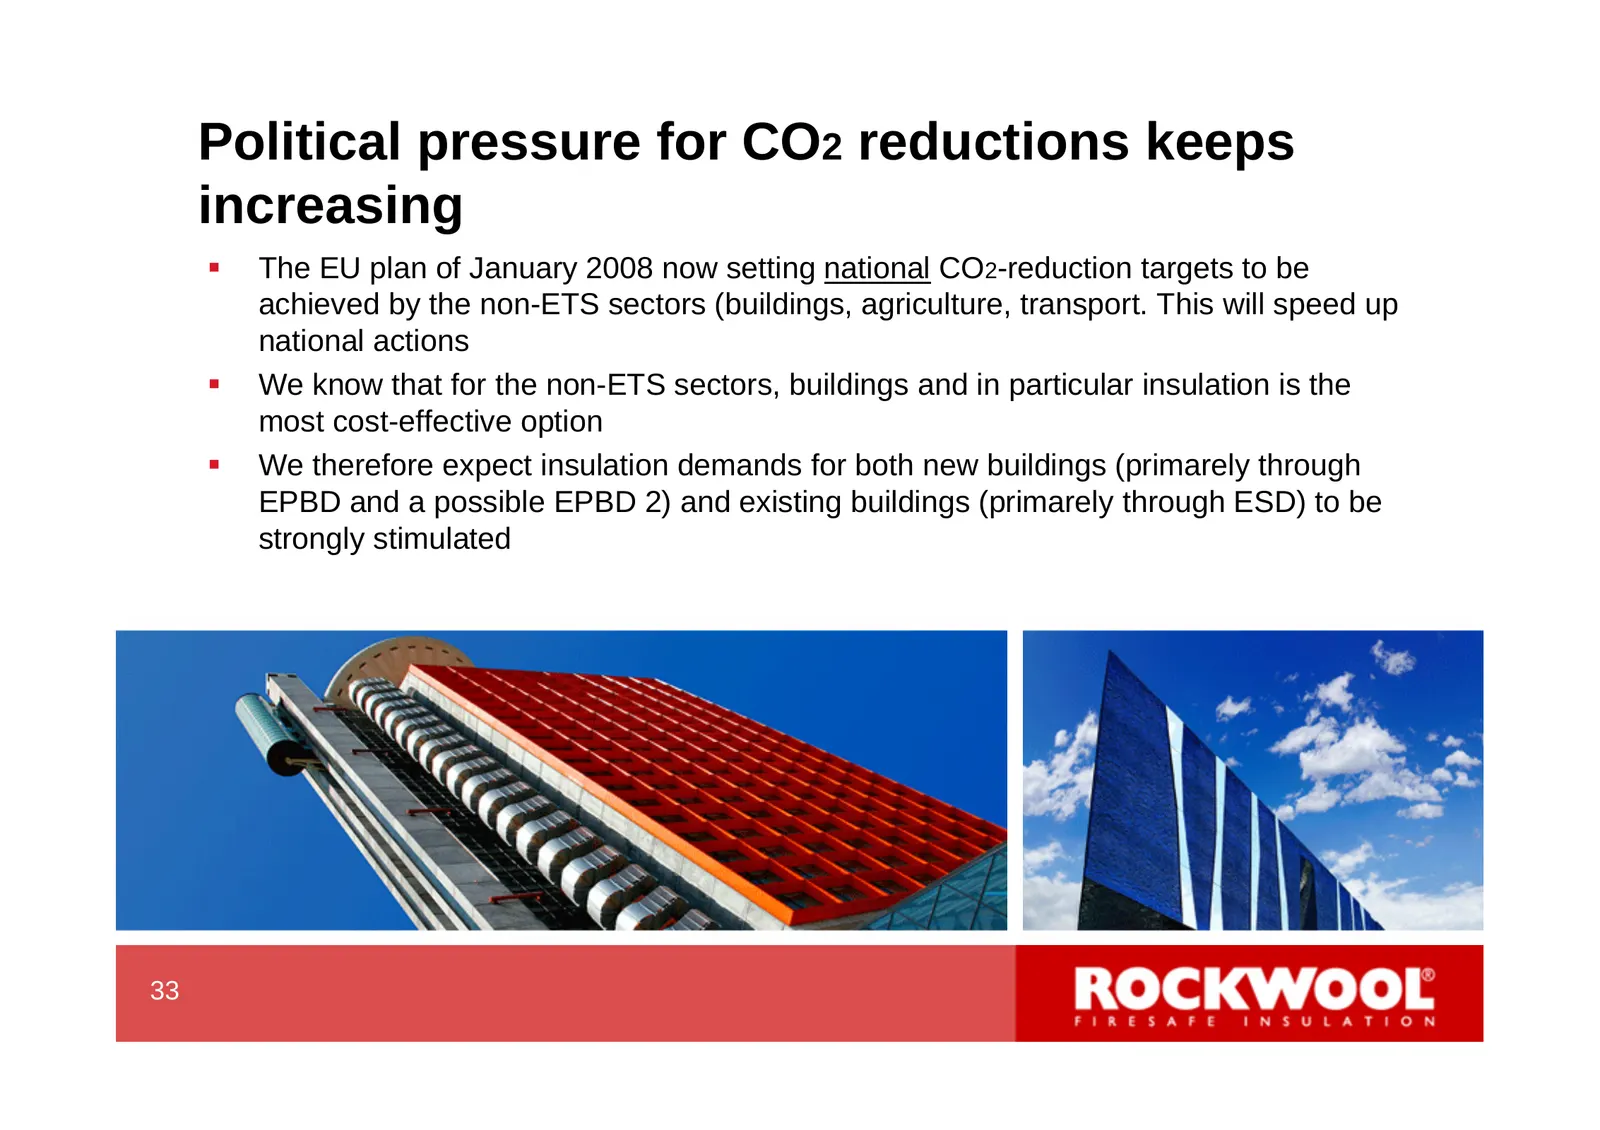
Political pressure for CO2 reductions keeps increasing The EU plan of January 2008 now setting national CO2-reduction targets to be achieved by the non-ETS sectors (buildings, agriculture, transport. This will speed up national actions We know that for the non-ETS sectors, buildings and in parti
Slide 36: National saving targets
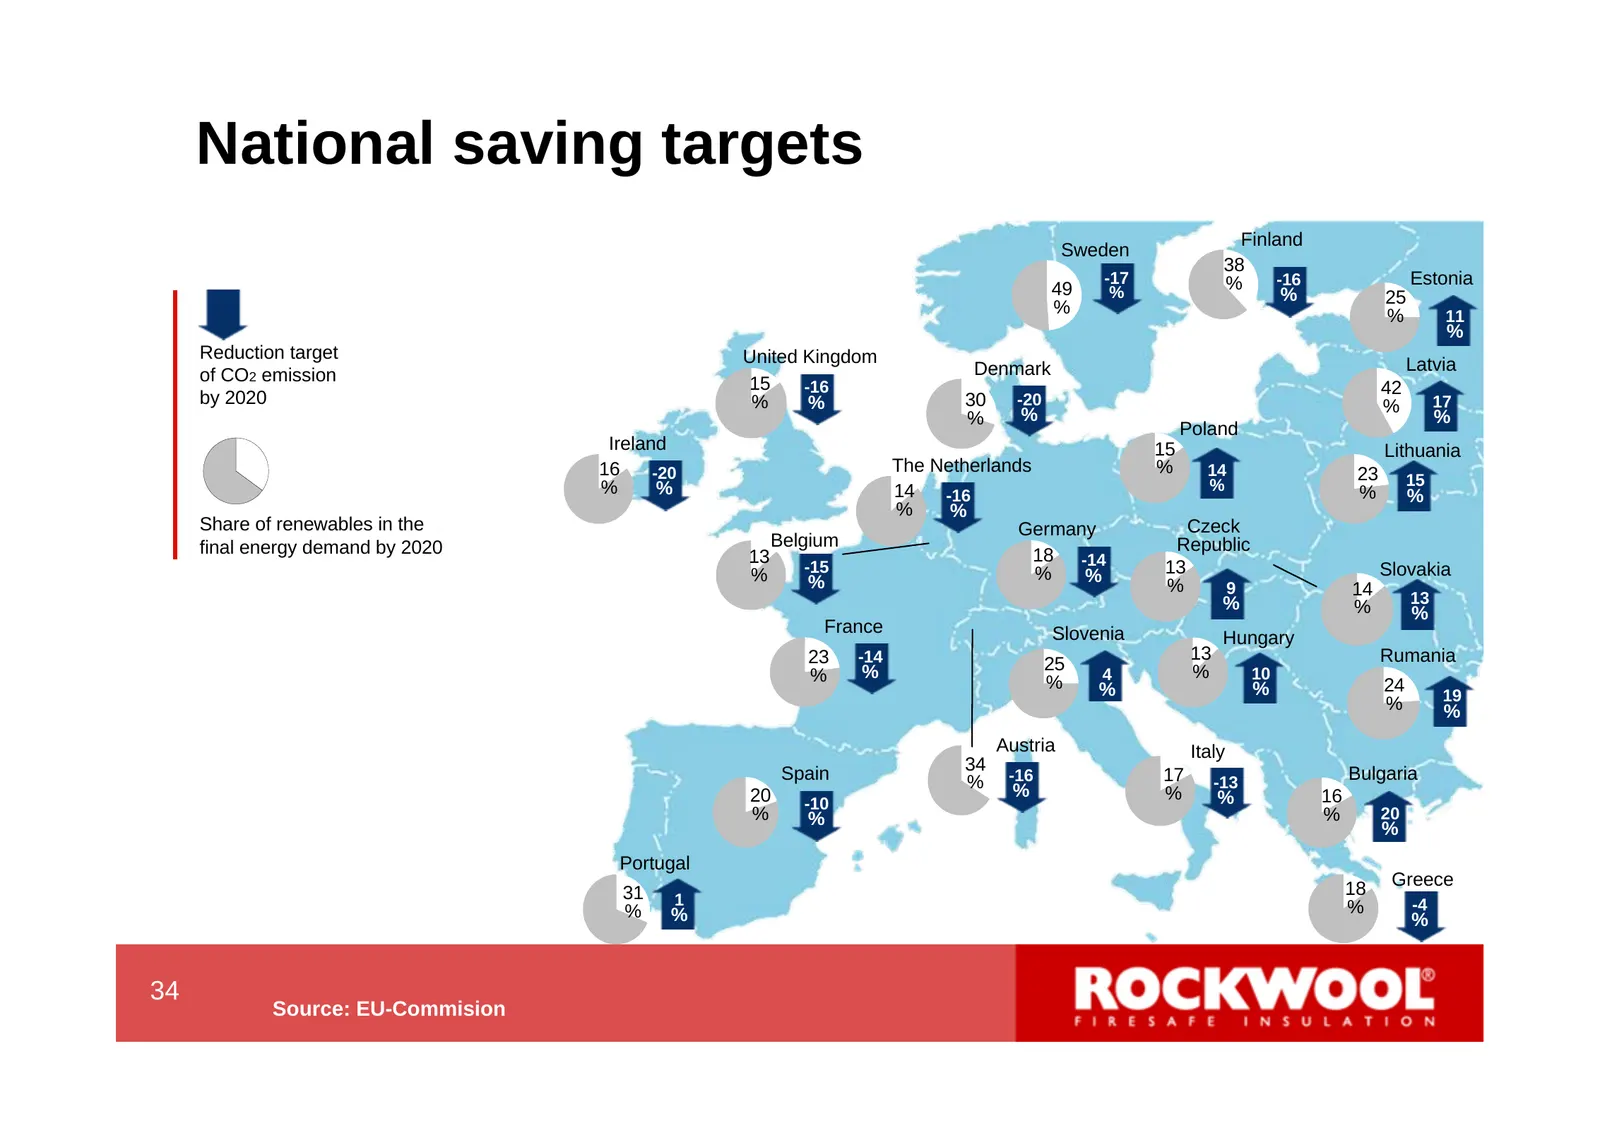
National saving targets Finland Sweden 38 -17 % -16 Estonia 49 % % 25 % % 11 % Reduction target United Kingdom Denmark Latvia of CO2 emission 15 -16 42 by 2020 % % 30 -20 % 17 % % % Poland Ireland 15 Lithuania 16 -20 The Netherlands % 14 23 % % % 15 14 -16 % % % % Share of renewables in the Germany
Slide 37: Renovation of existing buildings: plans move ahead on national level
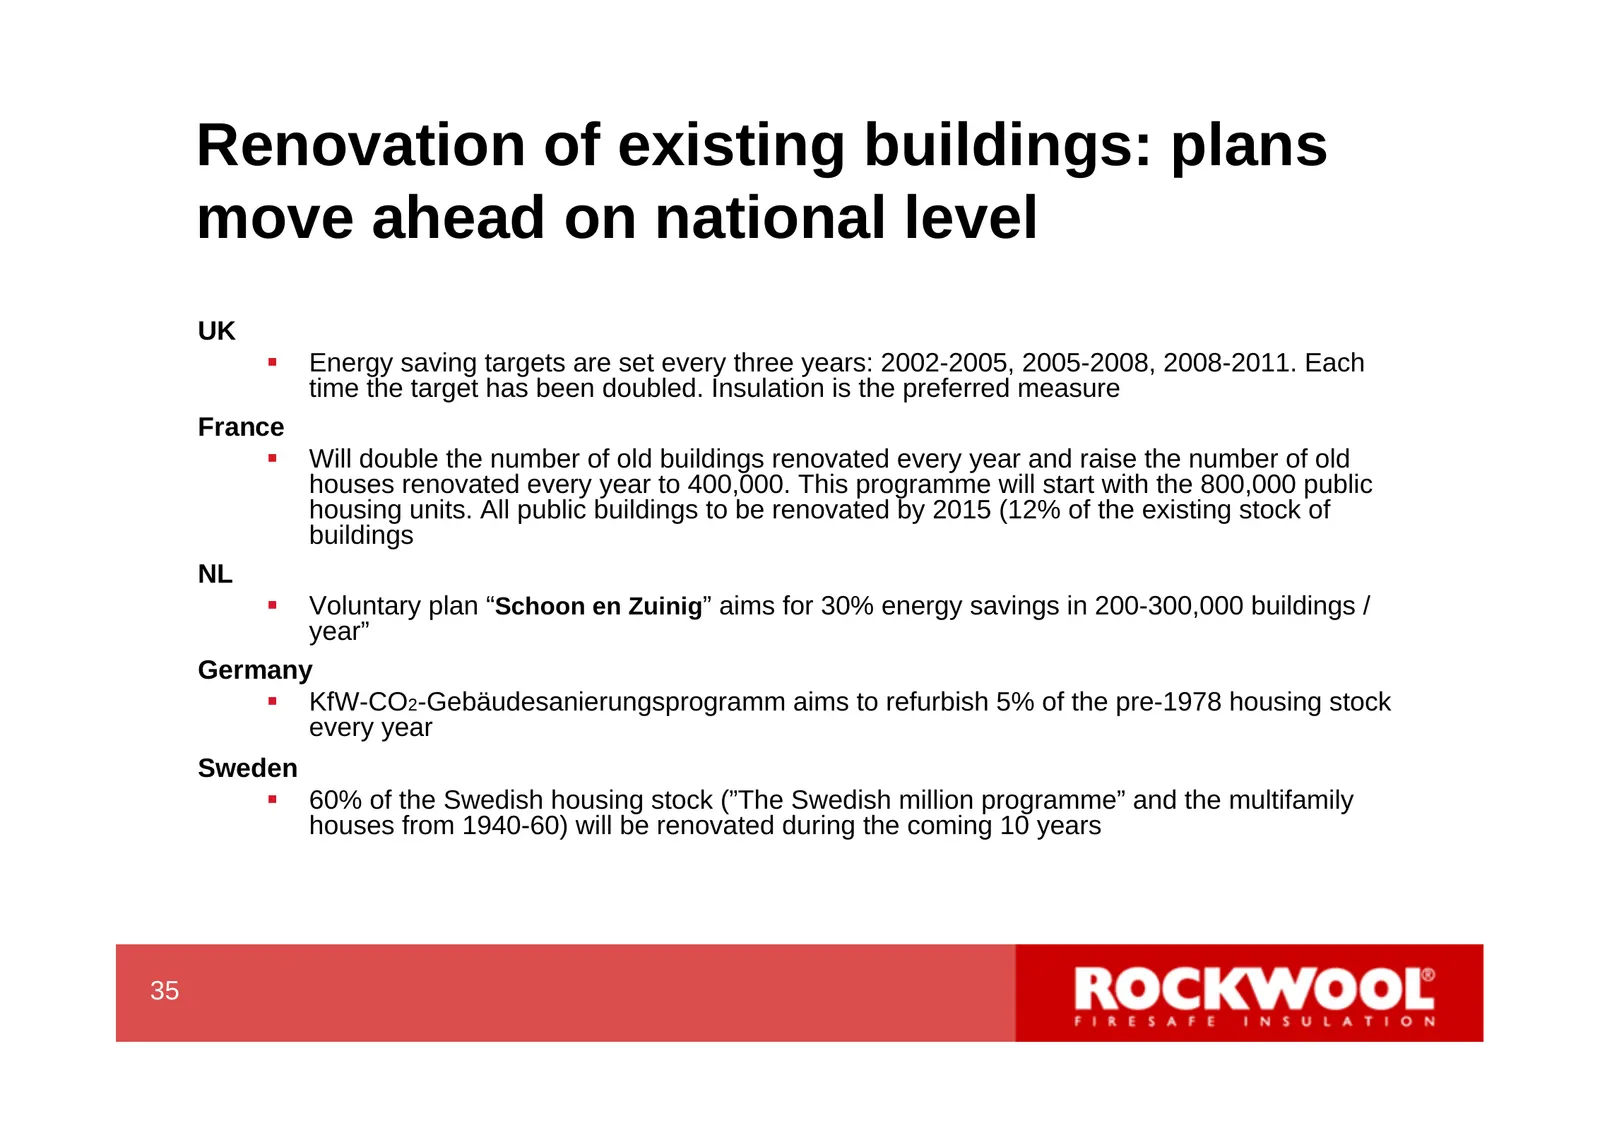
Renovation of existing buildings: plans move ahead on national level UK Energy saving targets are set every three years: 2002-2005, 2005-2008, 2008-2011. Each time the target has been doubled. Insulation is the preferred measure France Will double the number of old buildings renovated every year
Slide 38: EPBD - strengthening of building codes
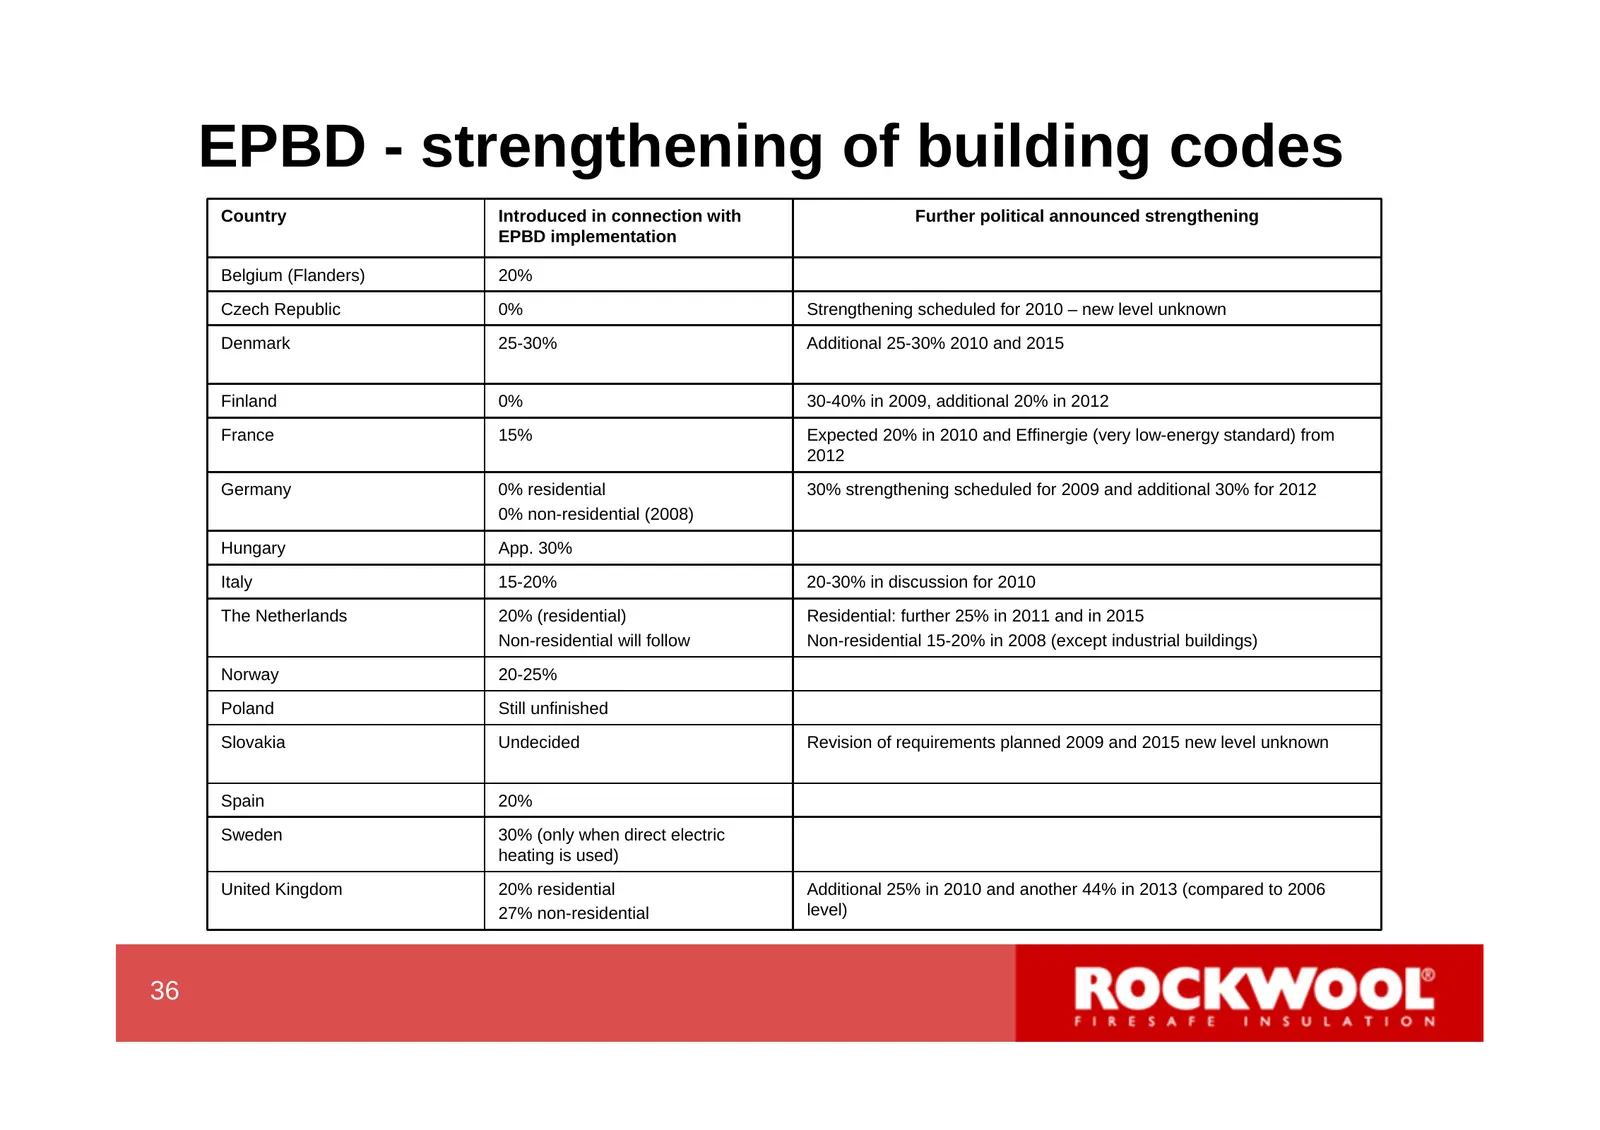
EPBD - strengthening of building codes Country Introduced in connection with Further political announced strengthening EPBD implementation Belgium (Flanders) 20% Czech Republic 0% Strengthening scheduled for 2010 – new level unknown Denmark 25-30% Additional 25-30% 2010 and 2015 Finland 0% 30-40% in
Slide 39: New buildings: Waiting for the EPBD effect in the market (sketch)
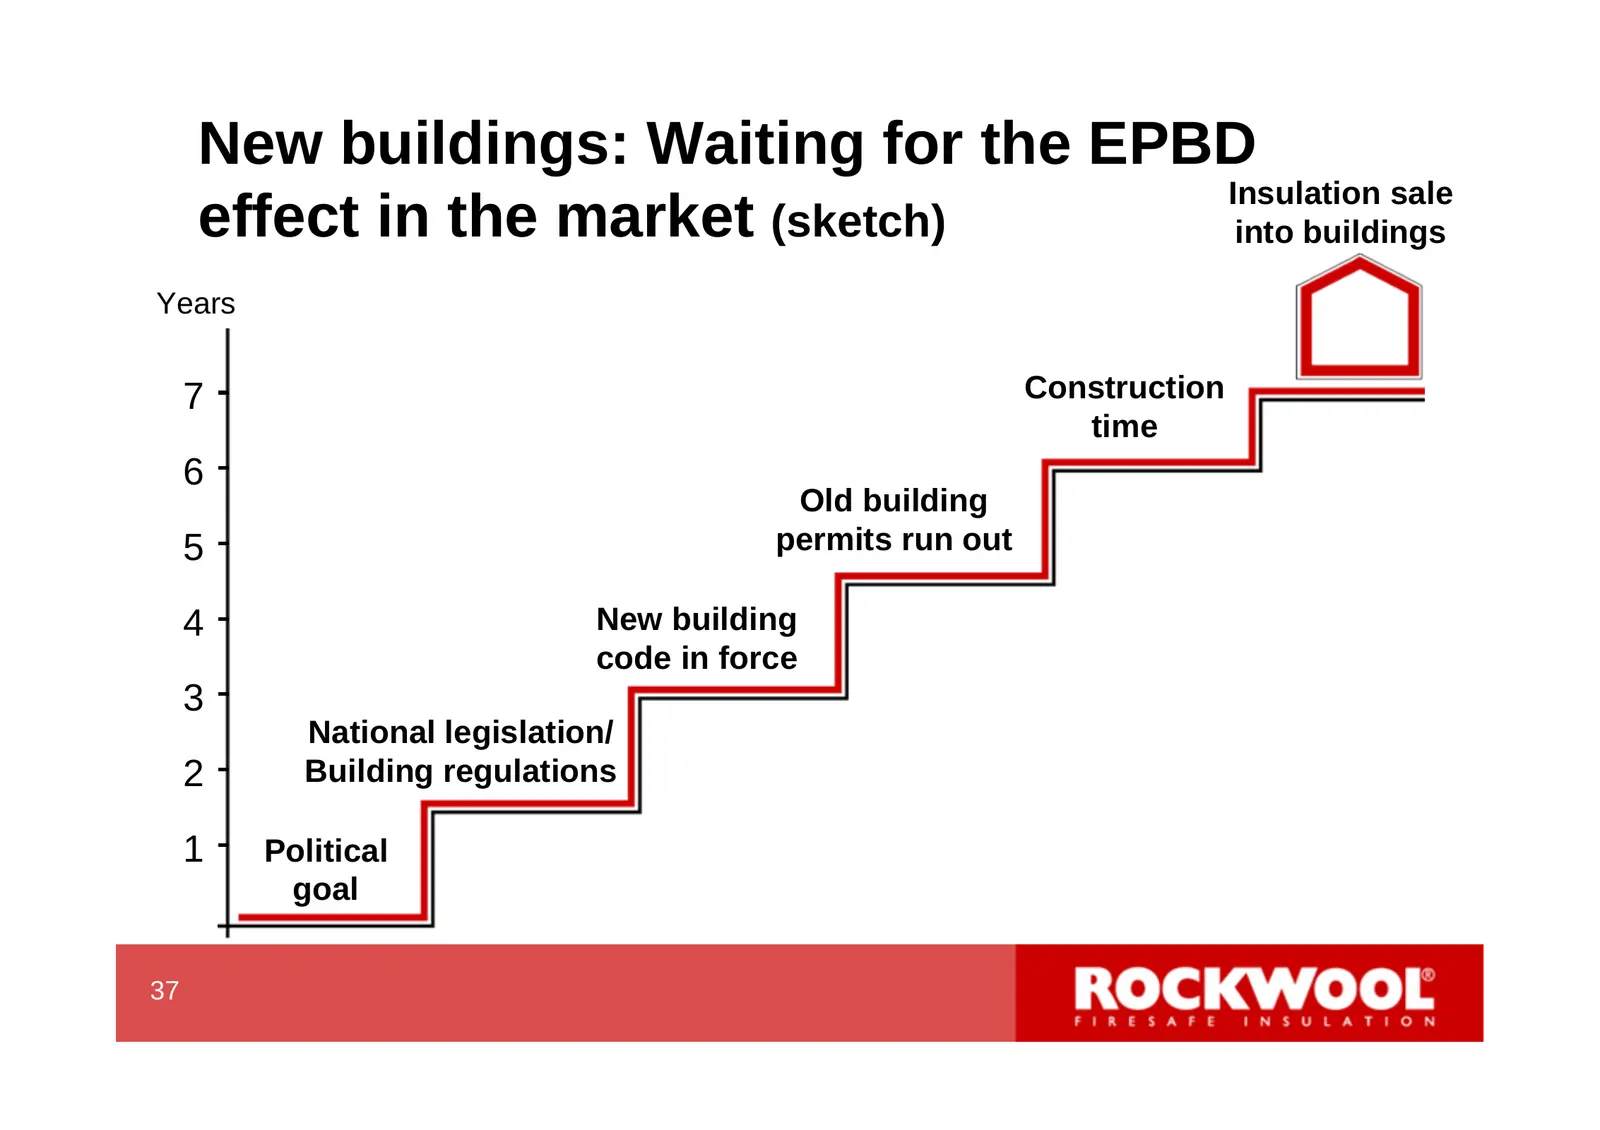
New buildings: Waiting for the EPBD Insulation sale effect in the market (sketch) into buildings Years 7 Construction time 6 Old building 5 permits run out 4 New building code in force 3 National legislation/ 2 Building regulations 1 Political goal 37 39
Slide 40: New buildings: EU Energy action plan
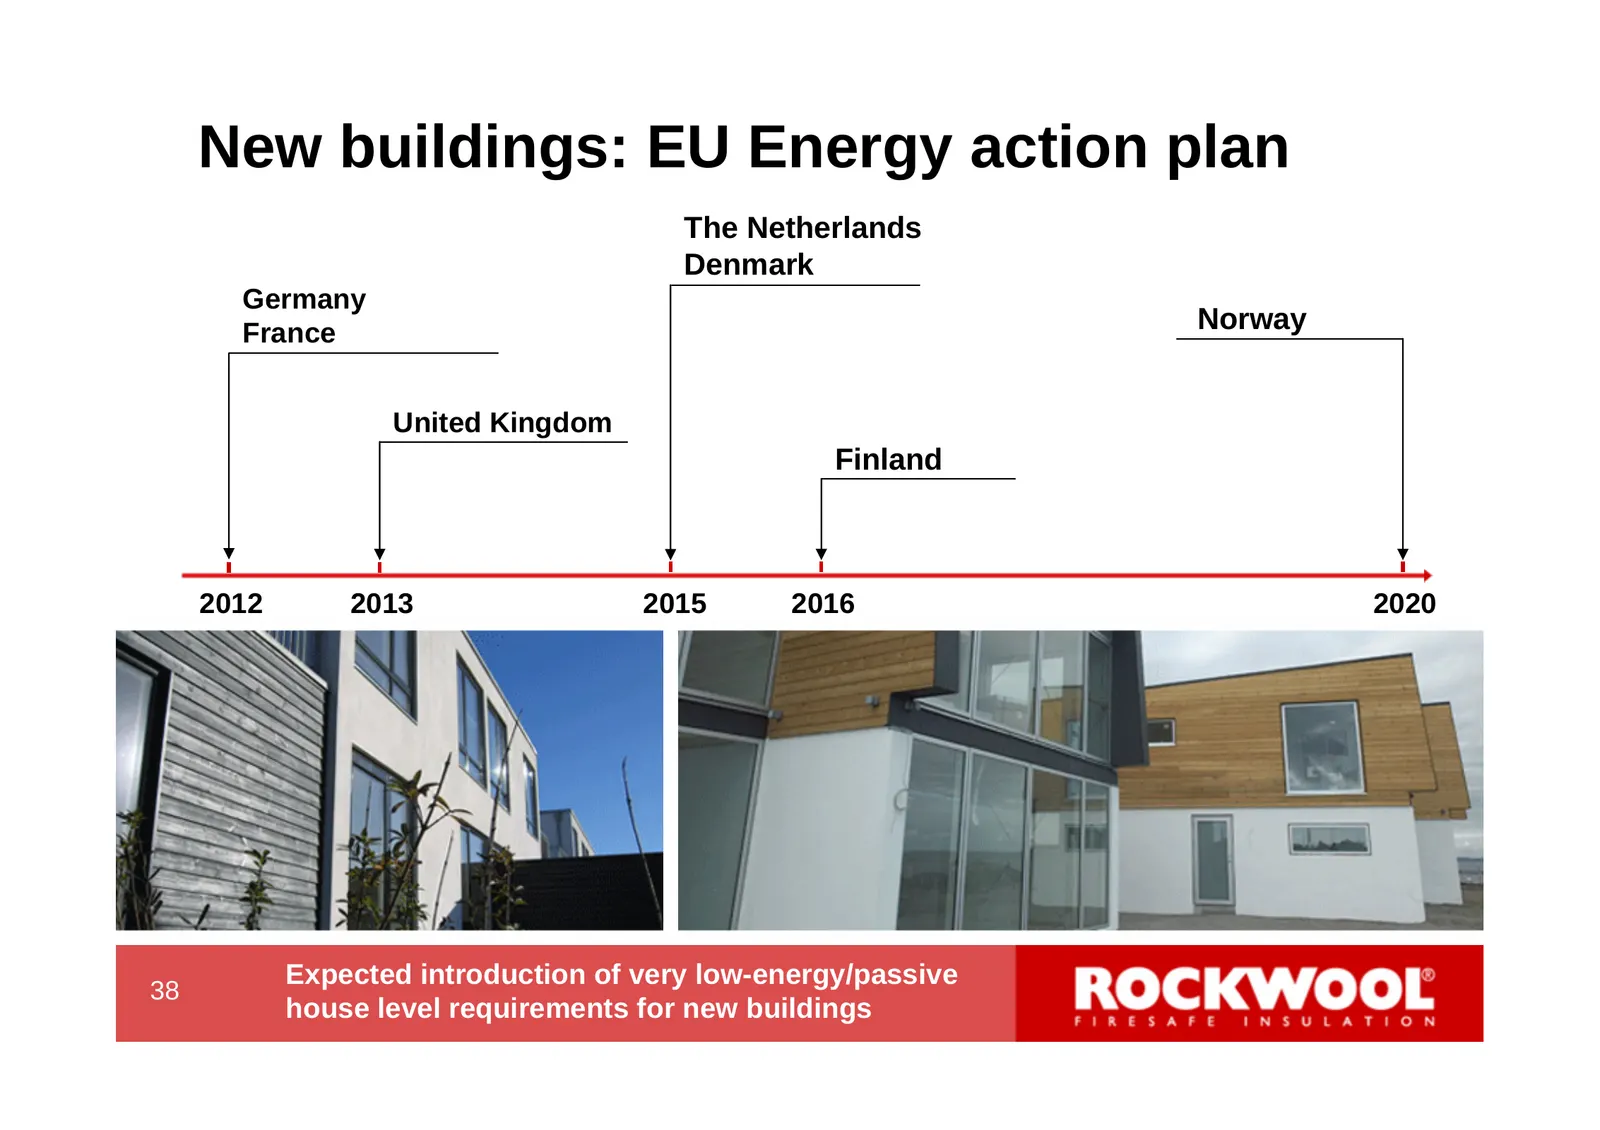
New buildings: EU Energy action plan The Netherlands Denmark Germany France Norway United Kingdom Finland 2012 2013 2015 2016 2020 Expected introduction of very low-energy/passive 38 house level requirements for new buildings 40
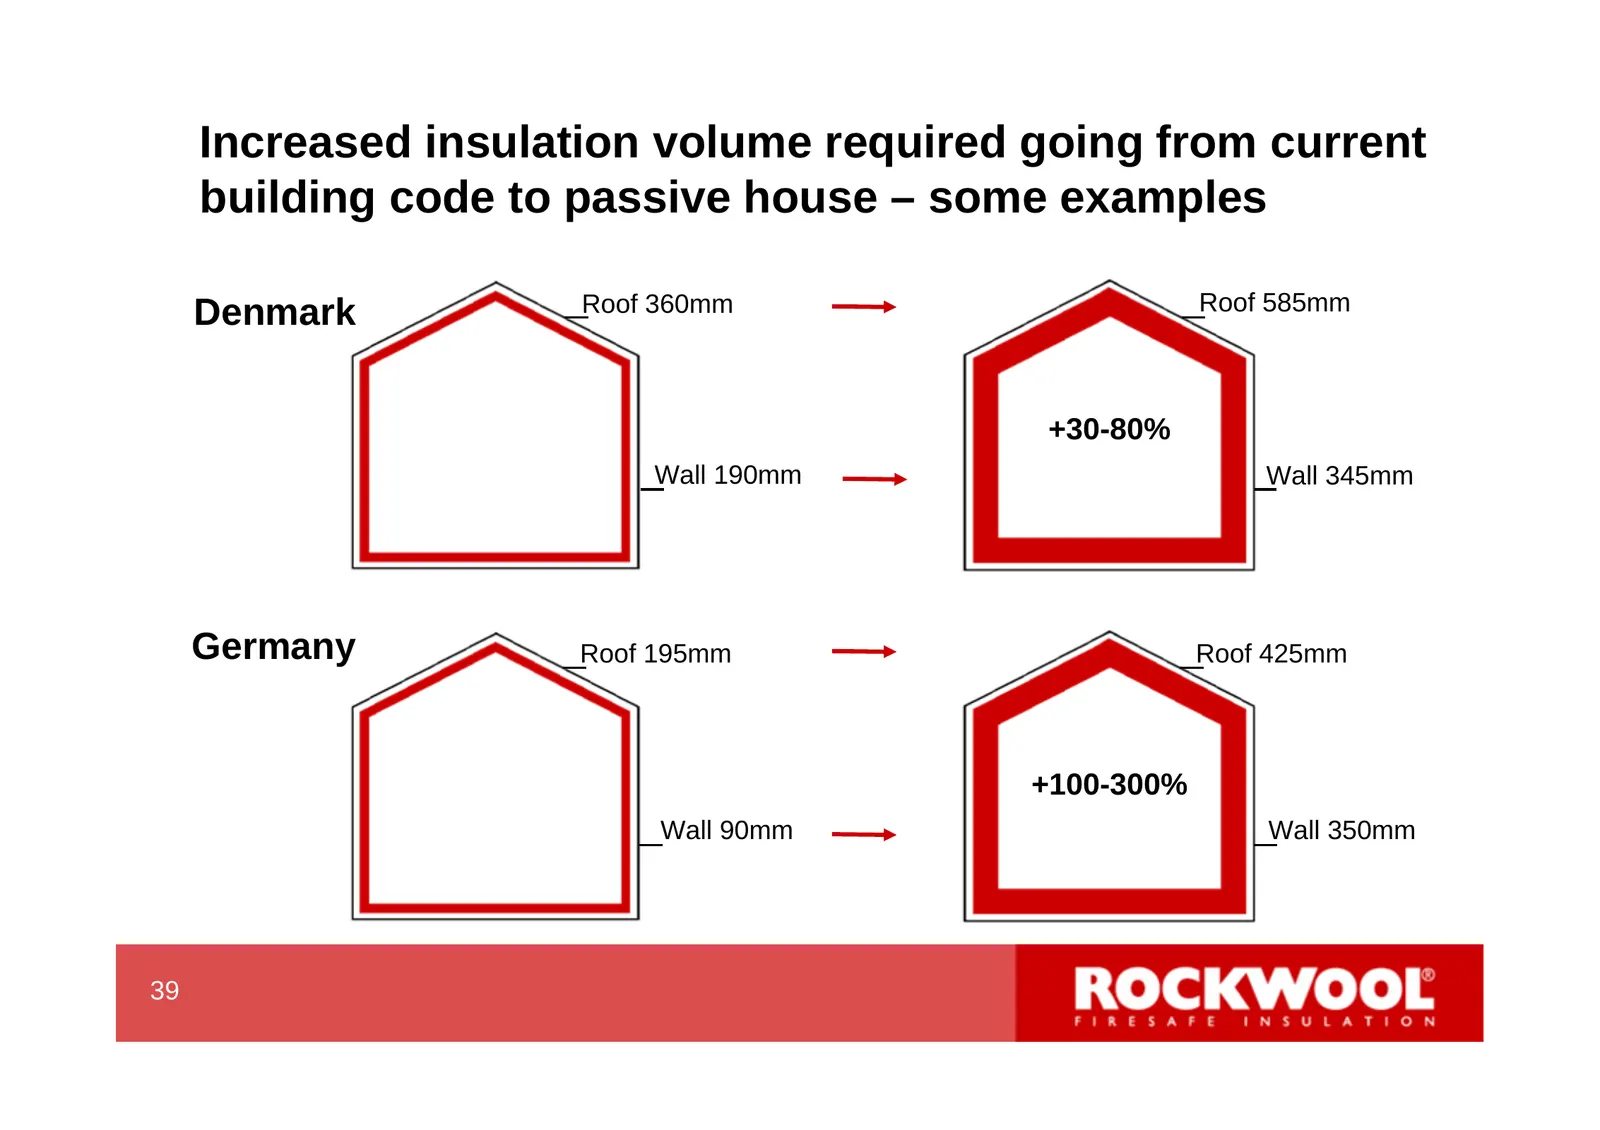
Slide 41: Increased insulation volume required going from current building code to passive house
Increased insulation volume required going from current building code to passive house – some examples Roof 360mm Roof 585mm Denmark +30-80% Wall 190mm Wall 345mm Germany Roof 195mm Roof 425mm +100-300% Wall 90mm Wall 350mm 39 41
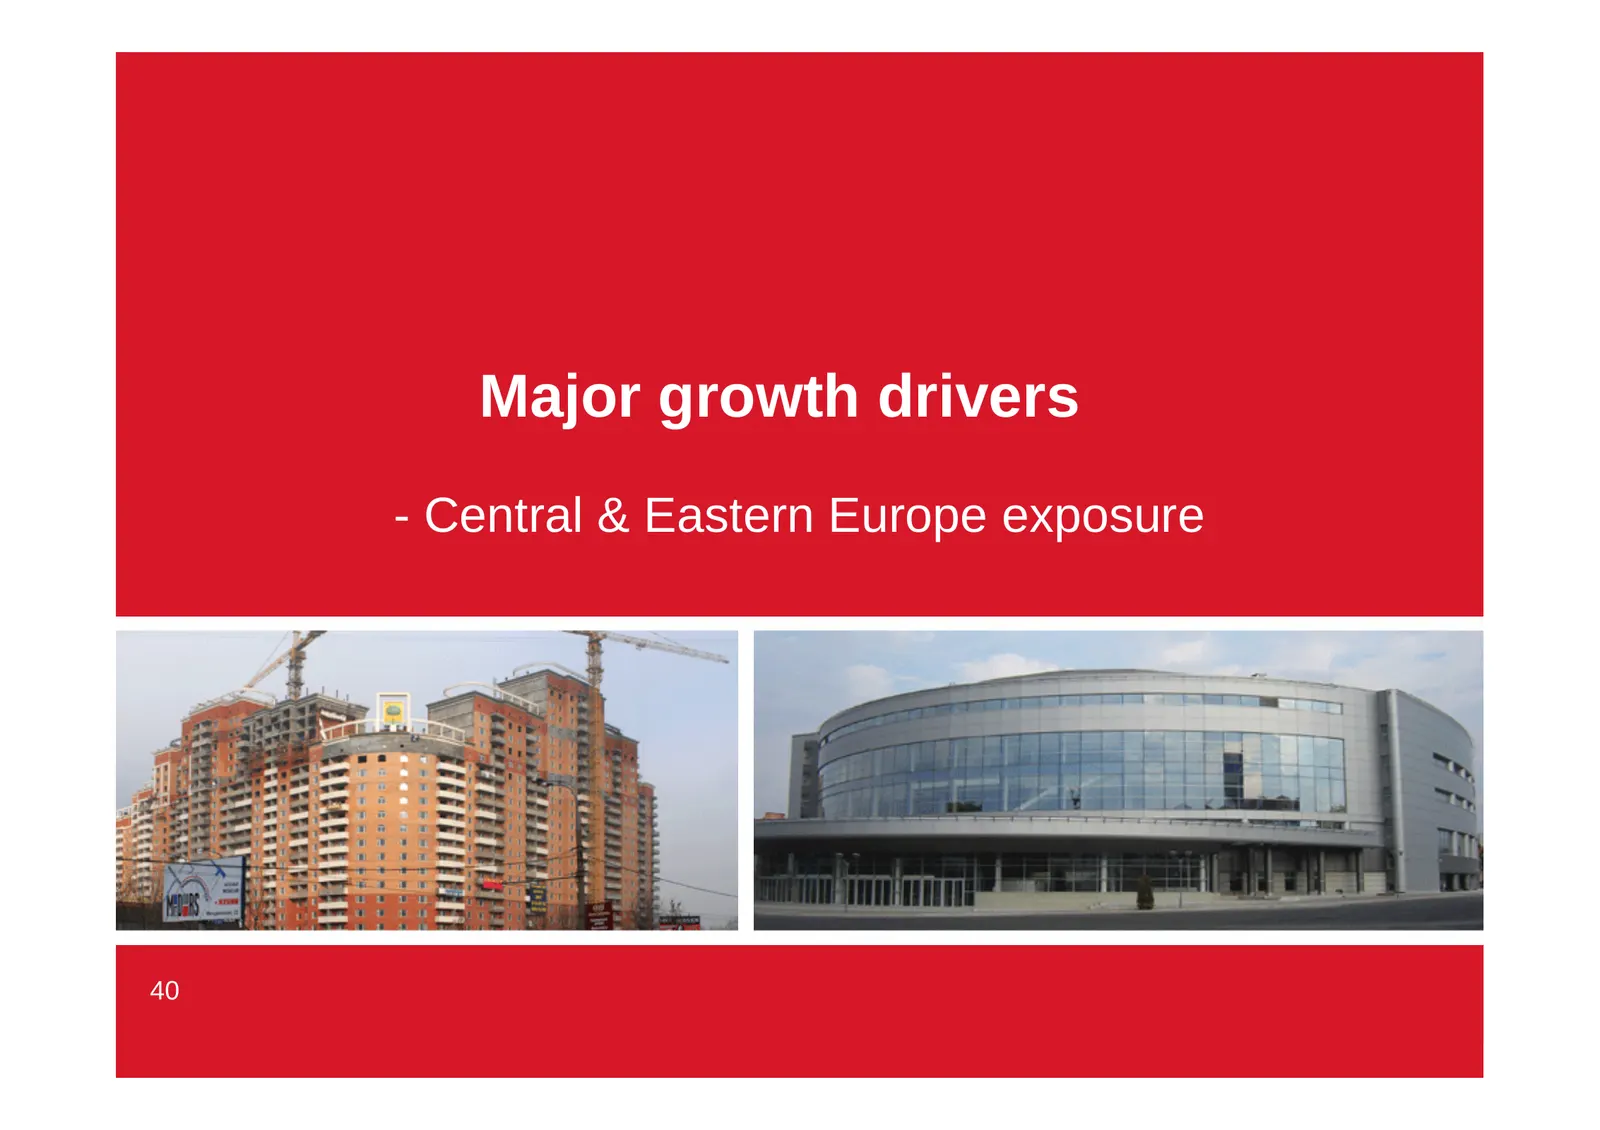
Slide 42: Major growth drivers - Central & Eastern Europe exposure
Major growth drivers - Central & Eastern Europe exposure 40 42
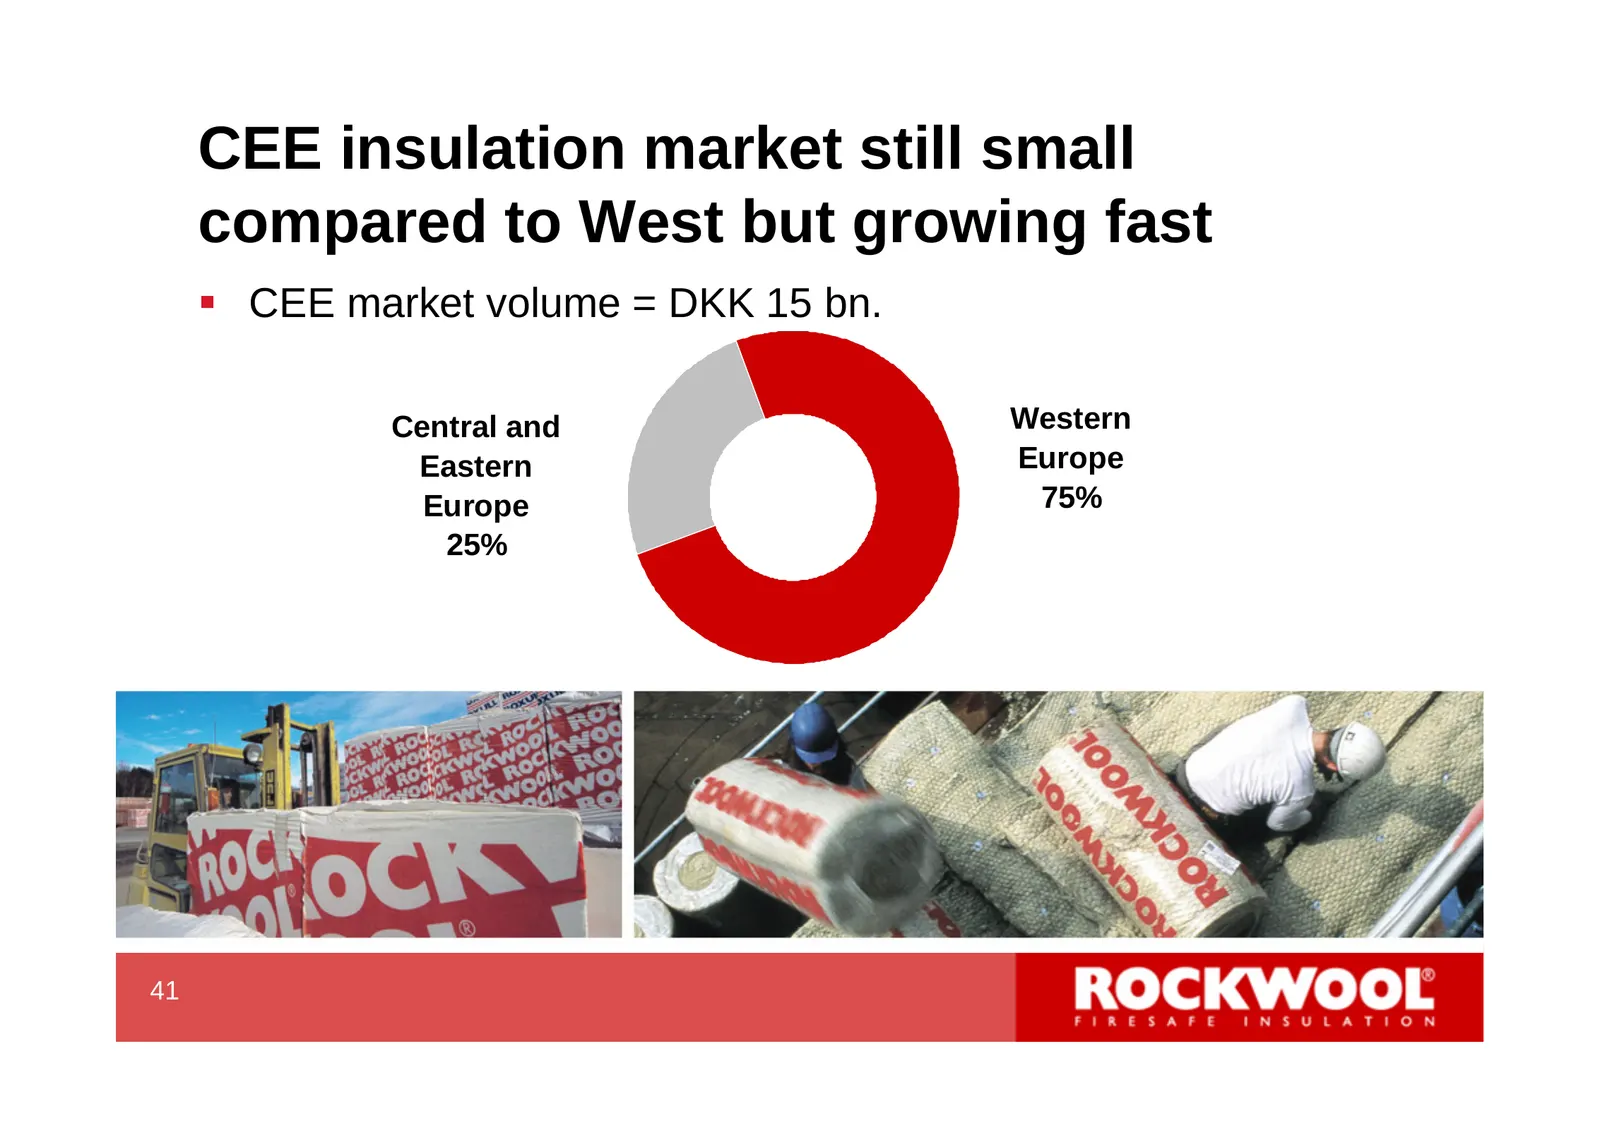
Slide 43: CEE insulation market still small compared to West but growing fast
CEE insulation market still small compared to West but growing fast CEE market volume = DKK 15 bn. Central and Western Eastern Europe Europe 75% 25% 41 43
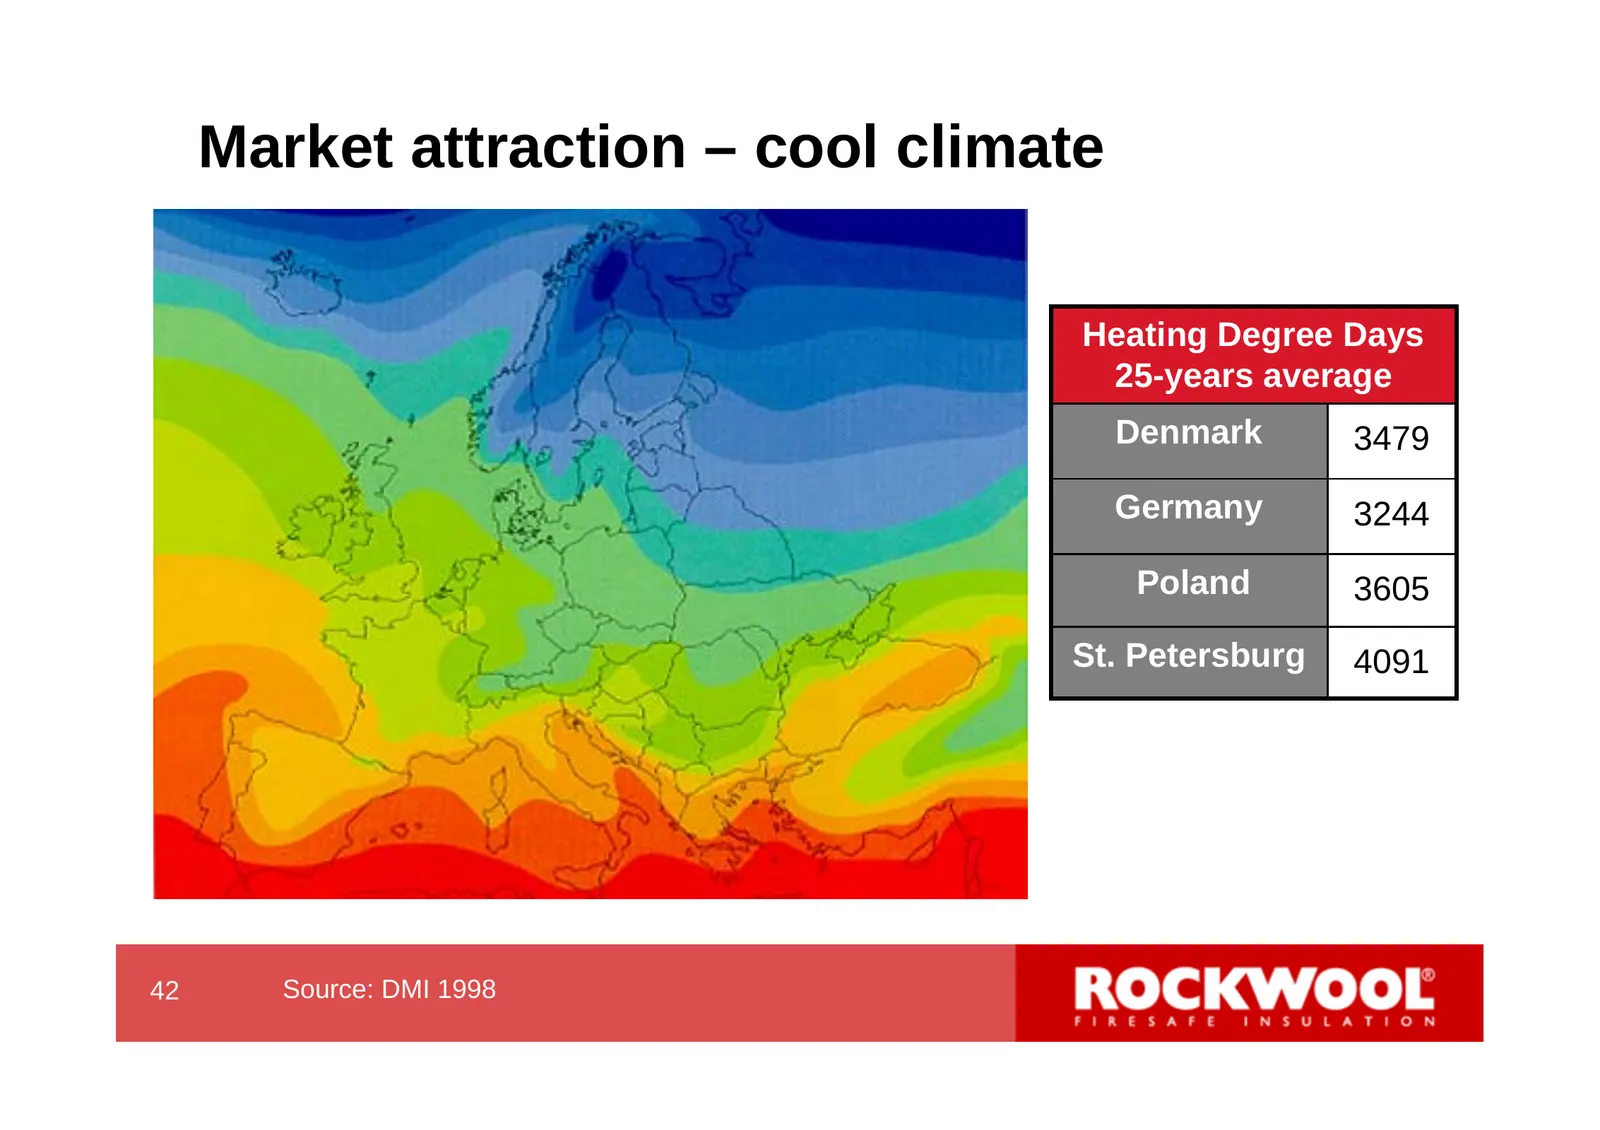
Slide 44: Market attraction – cool climate
Market attraction – cool climate Heating Degree Days 25-years average Denmark 3479 Germany 3244 Poland 3605 St. Petersburg 4091 42 Source: DMI 1998 44
Slide 45: Market attraction - regional potential
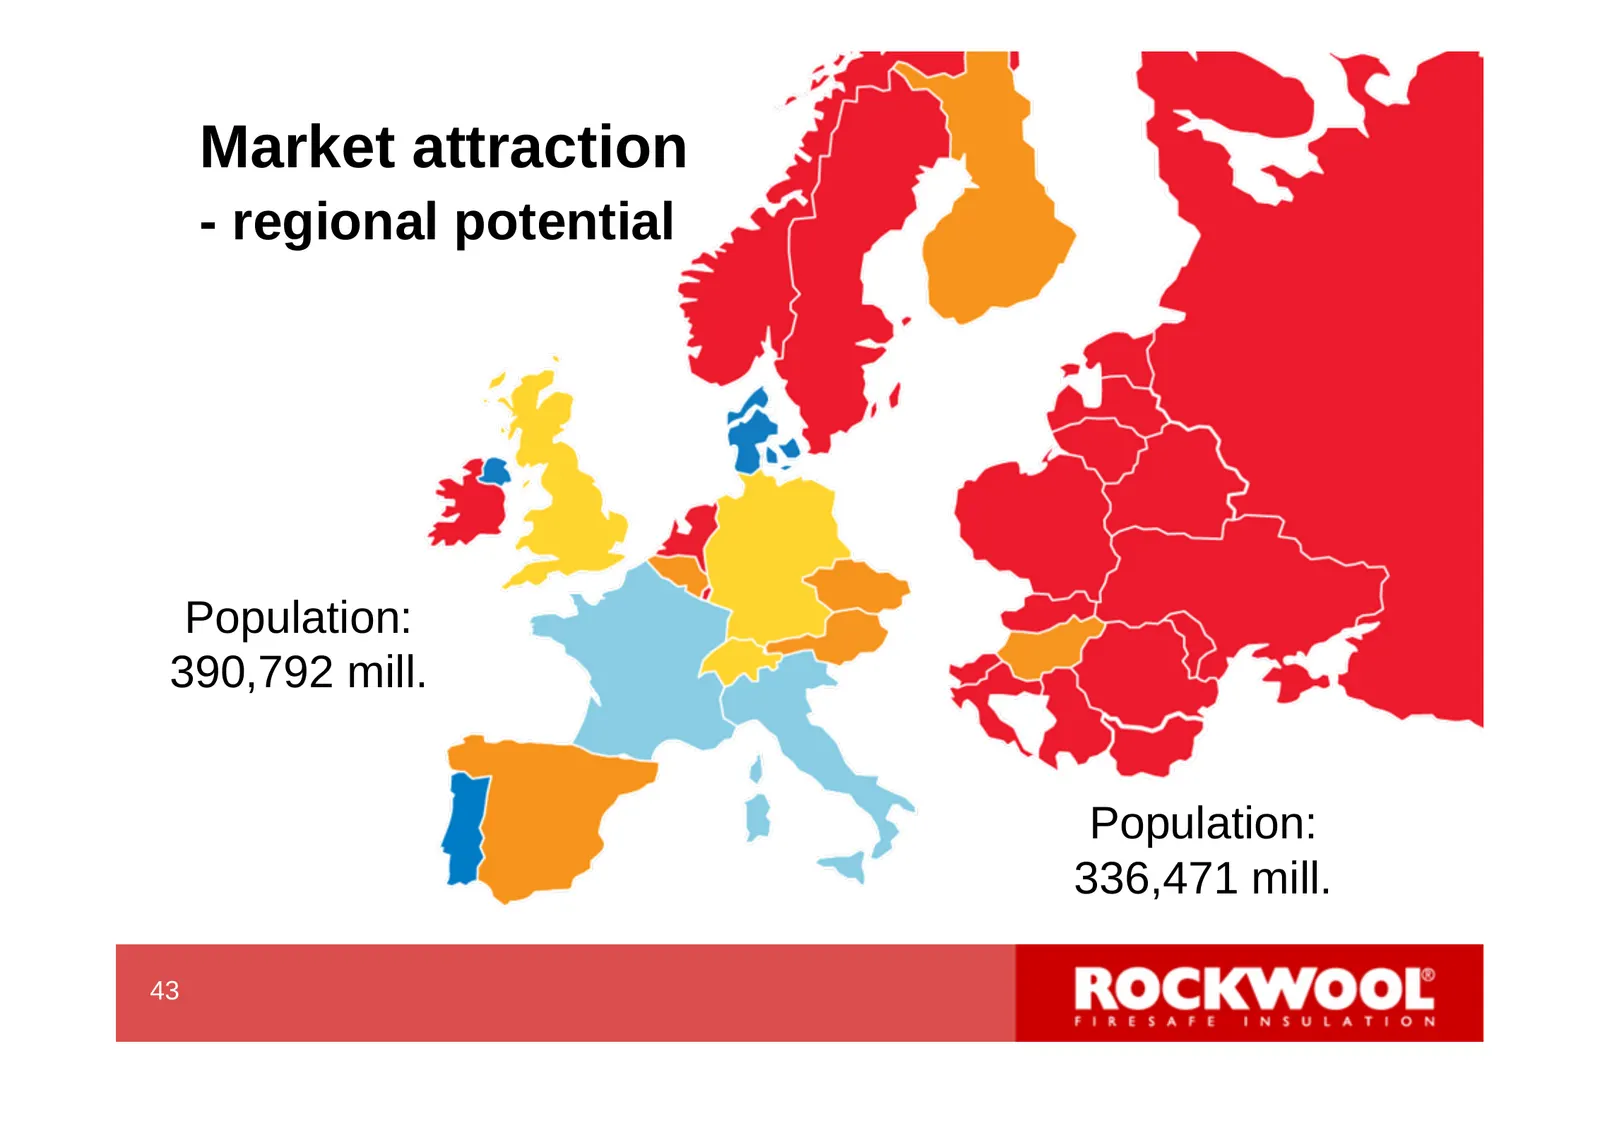
Market attraction - regional potential Population: 390,792 mill. Population: 336,471 mill. 43 45
Slide 46: CEE market development phases
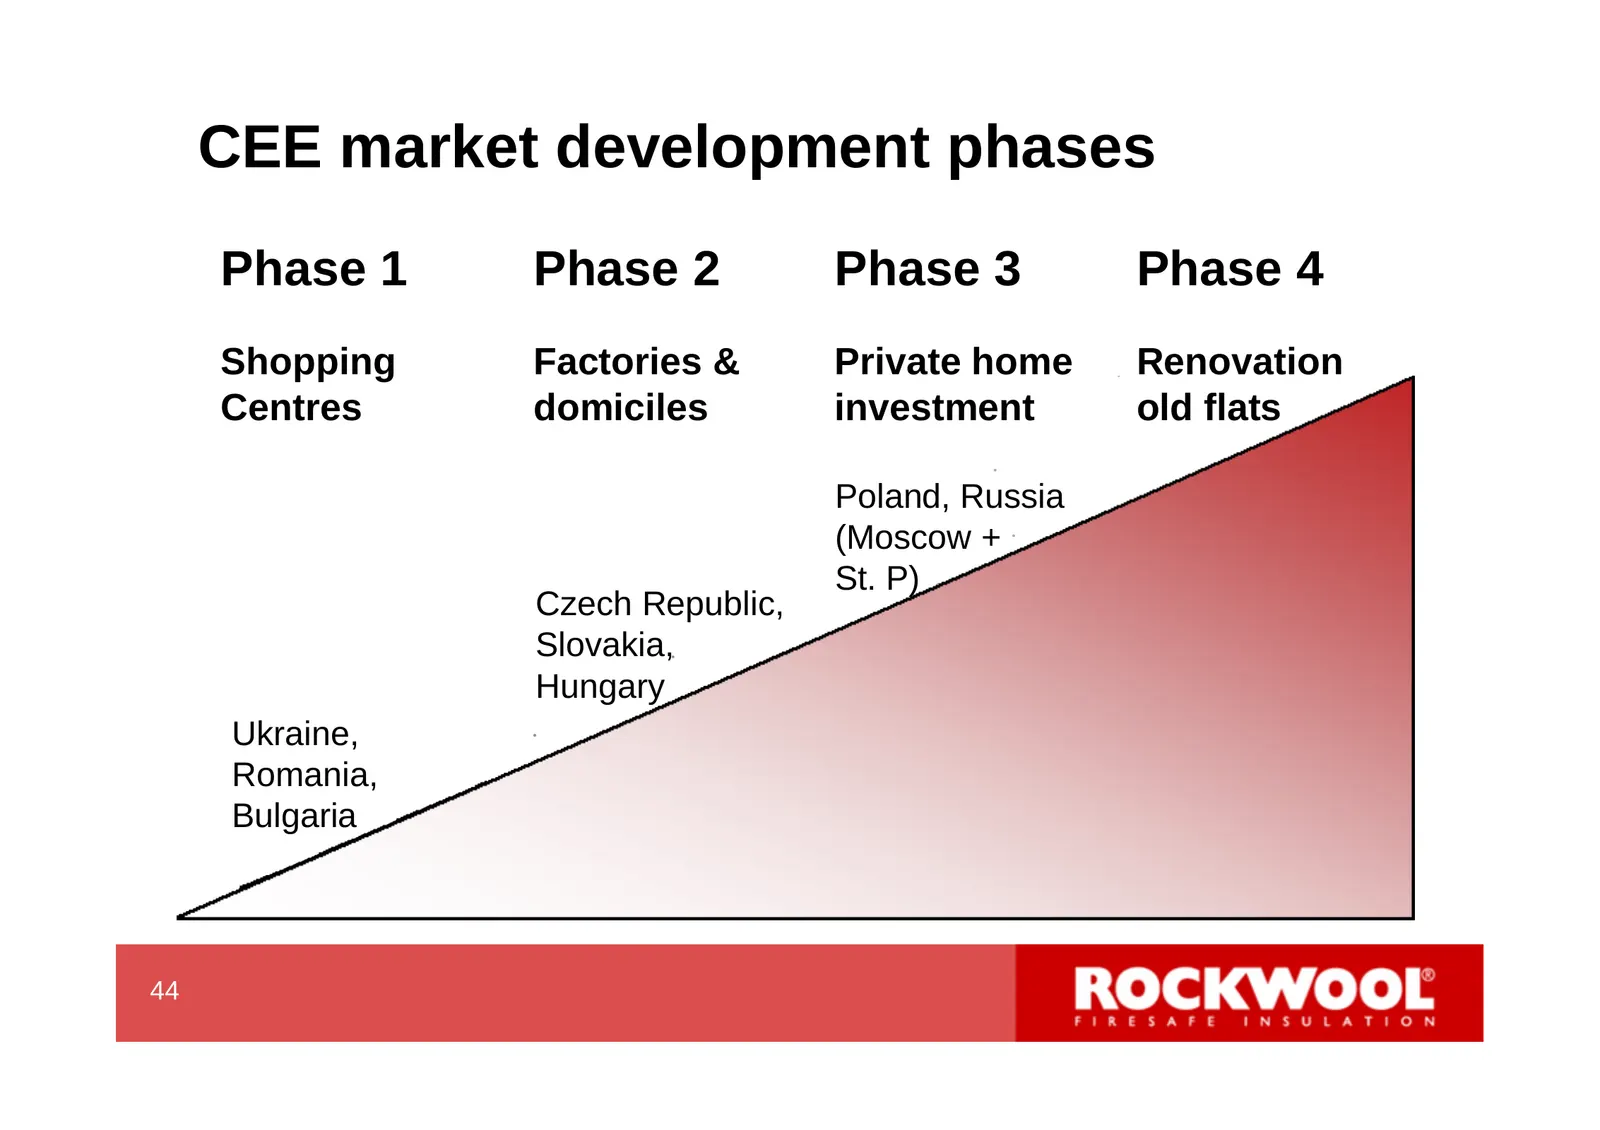
CEE market development phases Phase 1 Phase 2 Phase 3 Phase 4 Shopping Factories & Private home Renovation Centres domiciles investment old flats Poland, Russia (Moscow + St. P) Czech Republic, Slovakia, Hungary Ukraine, Romania, Bulgaria 44 46
Slide 47: How to cope with the long-term growth?
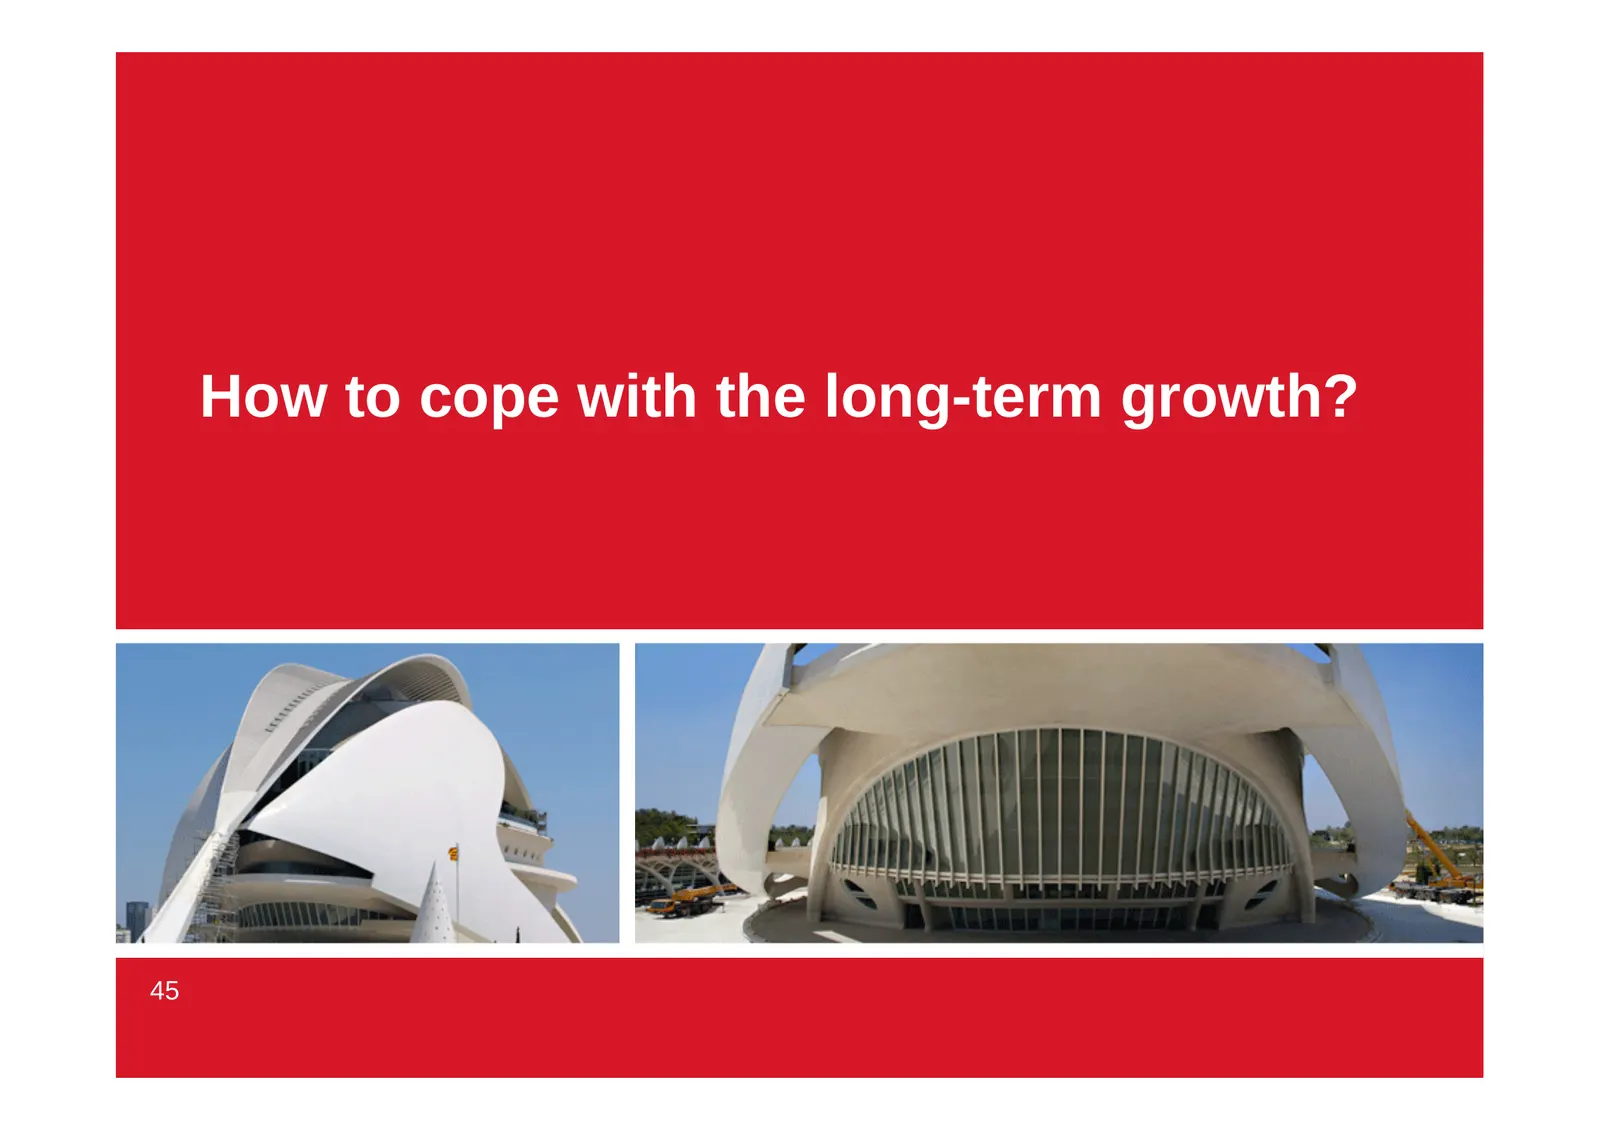
How to cope with the long-term growth? 45 47
Slide 48: Building capacity
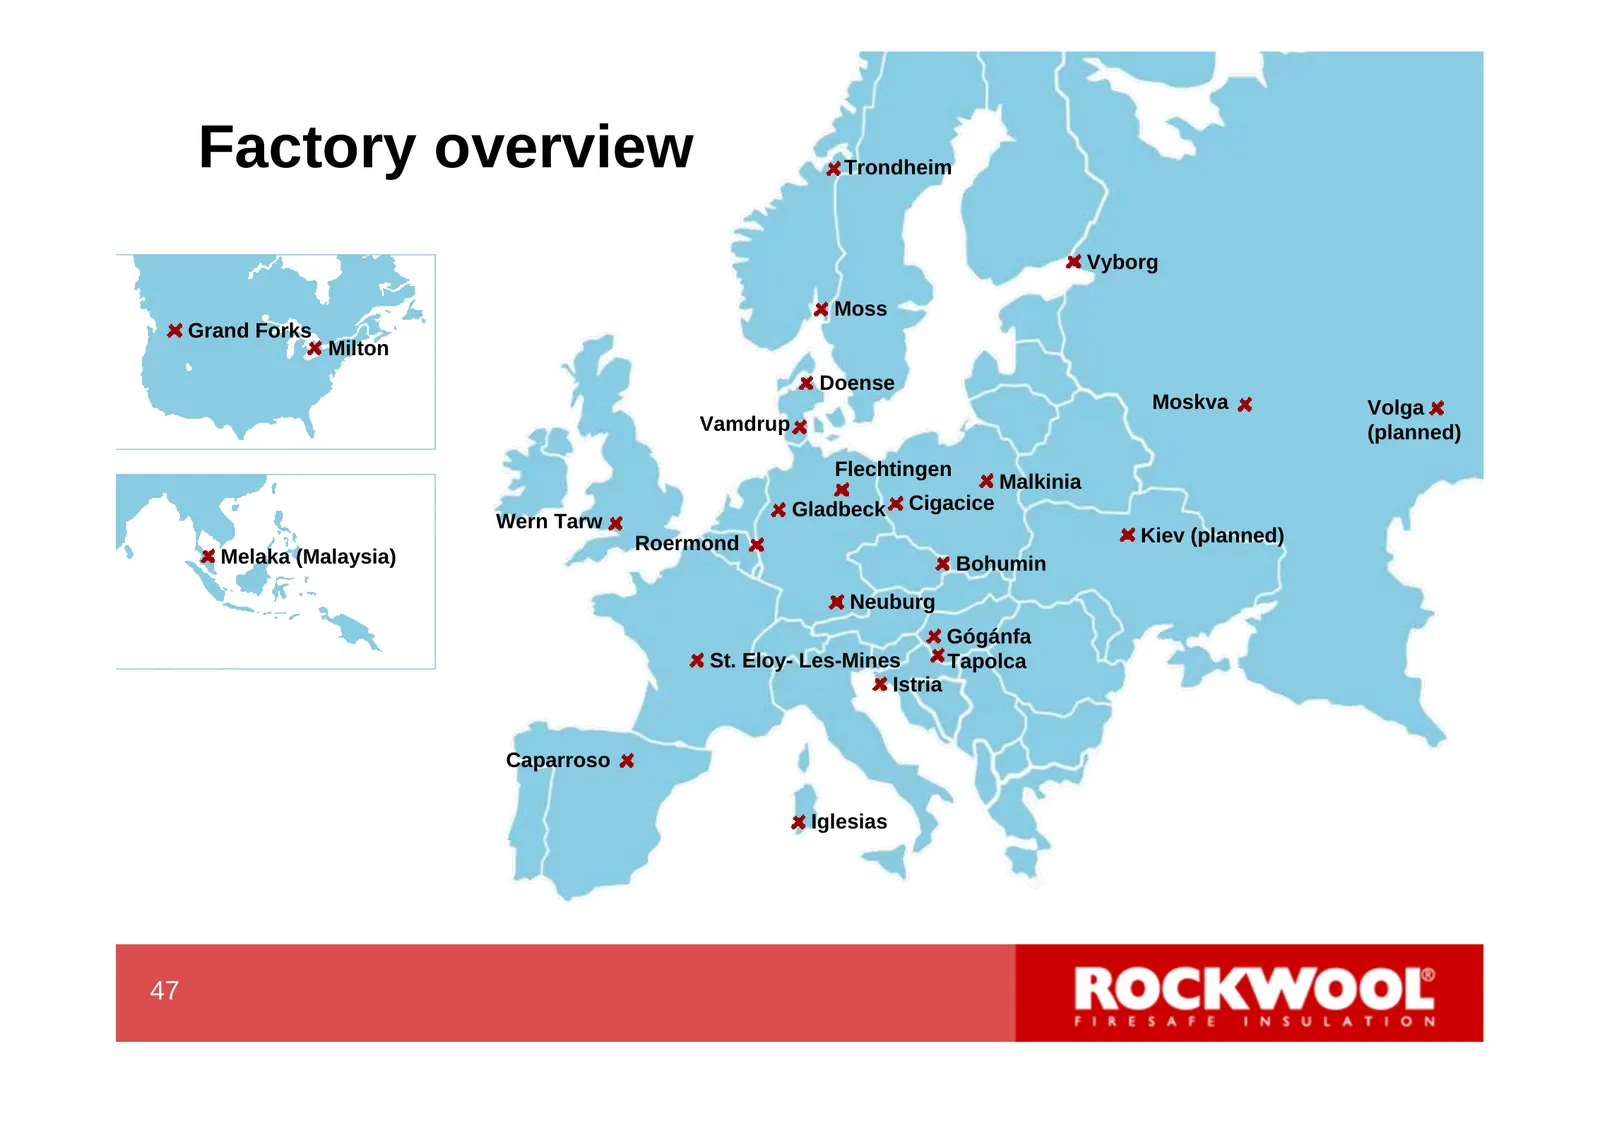
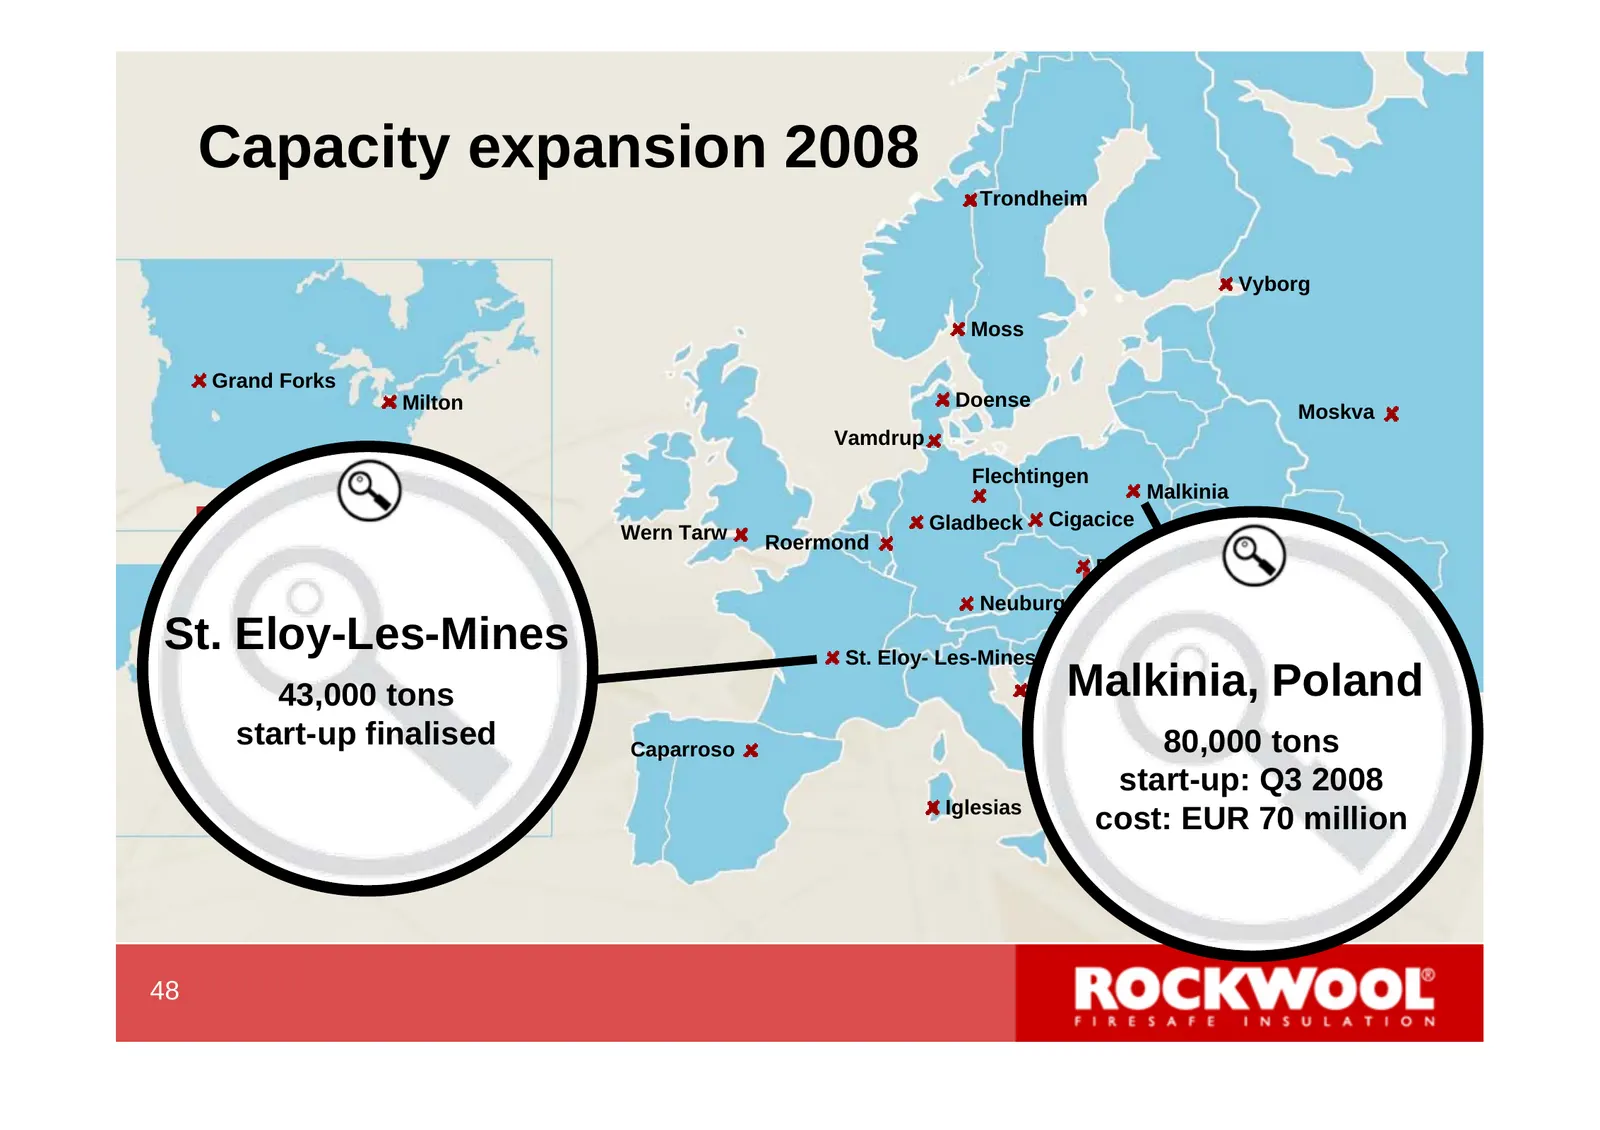
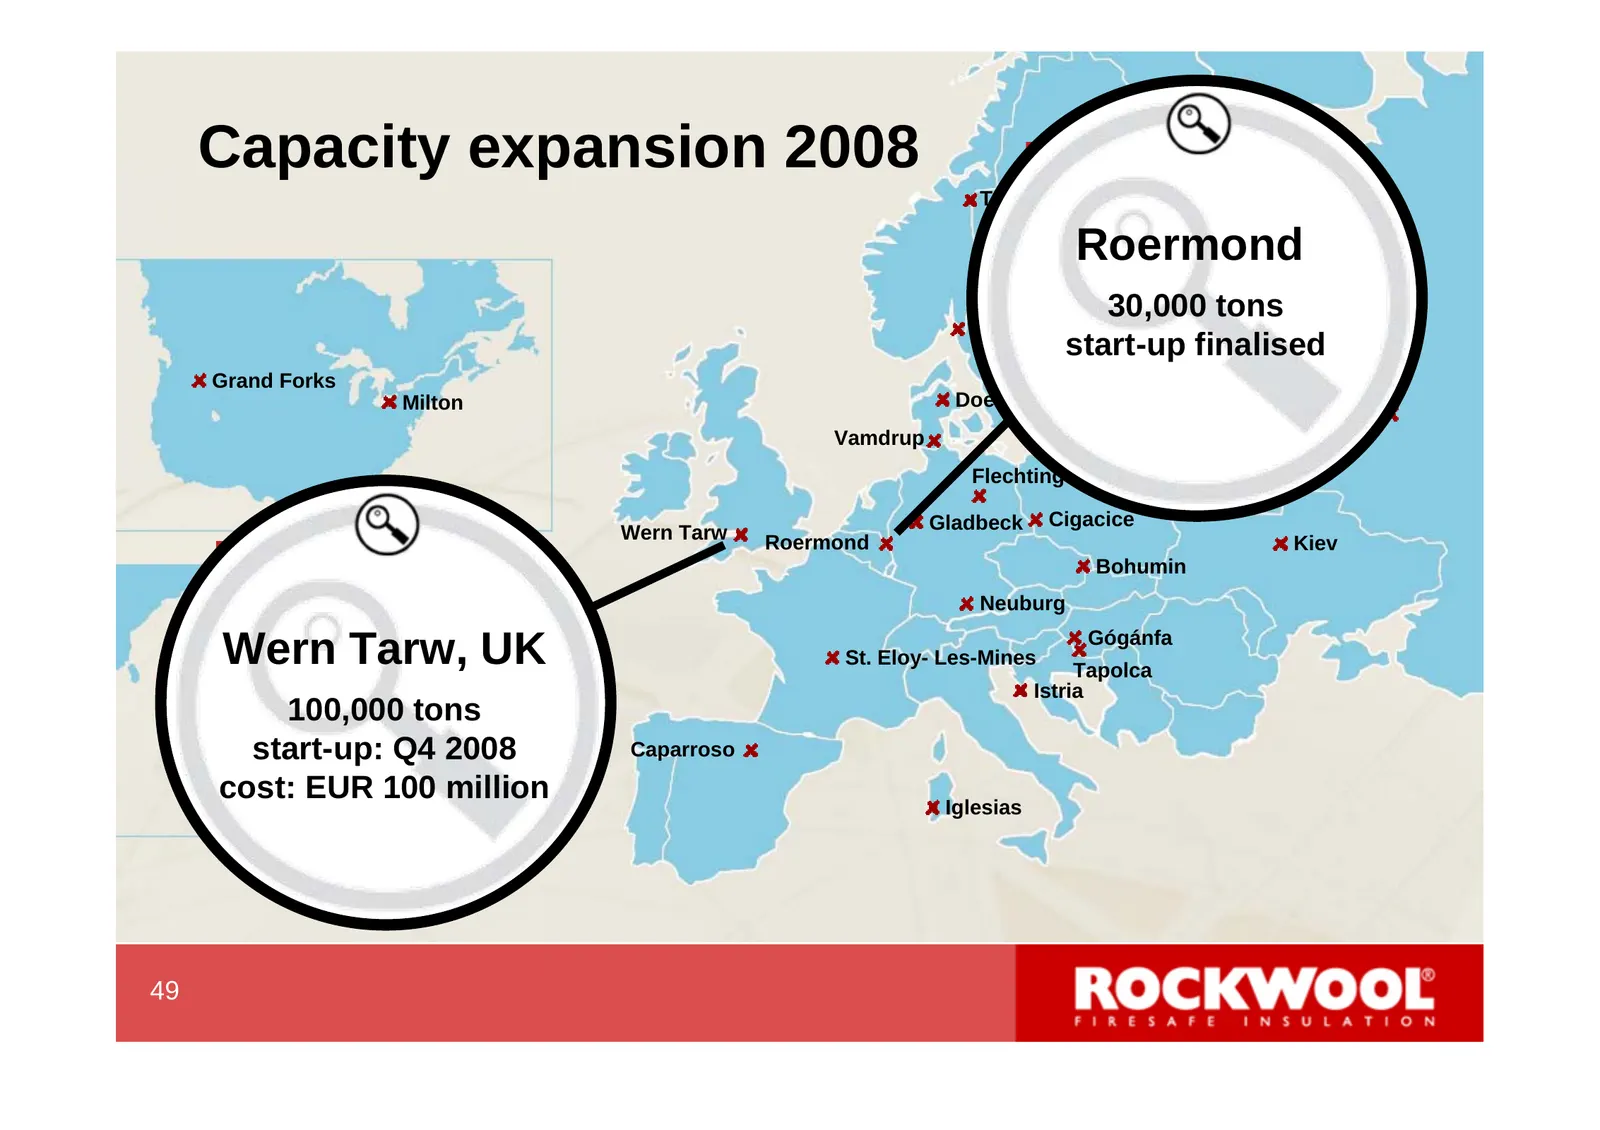
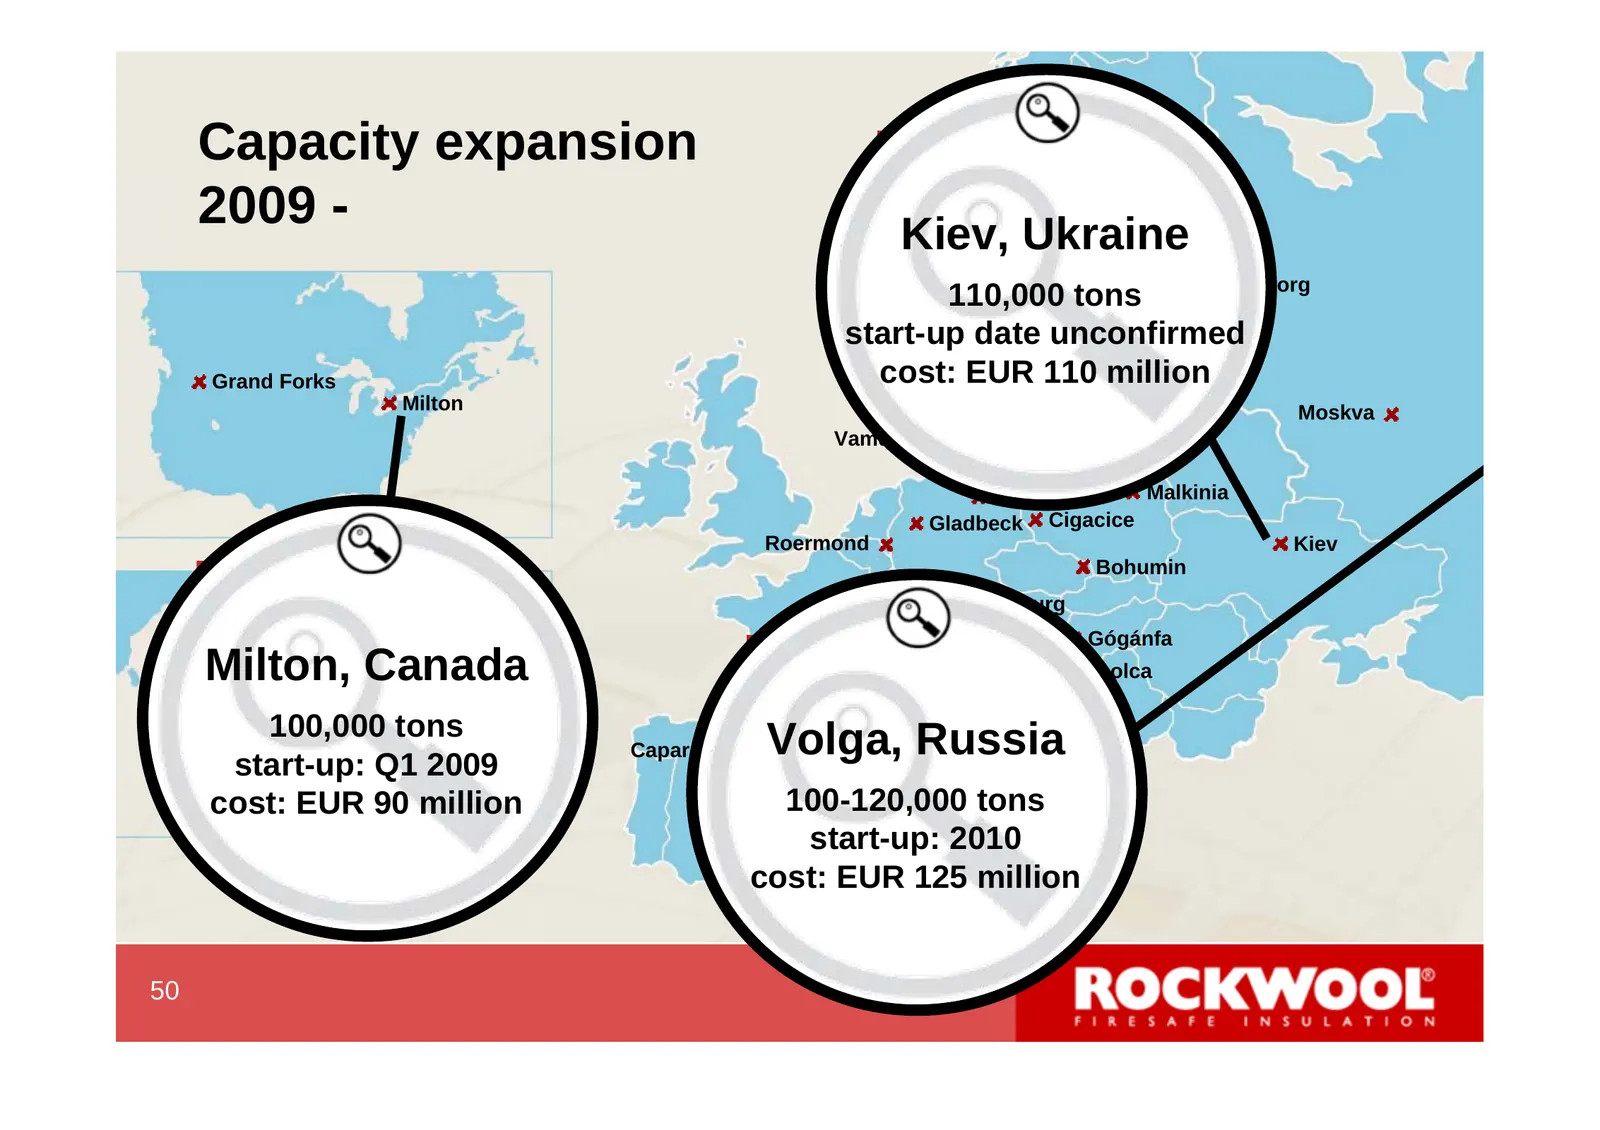
Building capacity In order to meet the expected increase in demand, the Rockwool Group is presently establishing new capacity in selected places In November 2006 a major capacity expansion plan was announced consisting of possibly 5 new factories/lines. All 5 have now been announced In additio
Slide 49: Factory overview
Factory overview Trondheim Vyborg Moss Grand Forks Milton Doense Moskva Volga Vamdrup (planned) Flechtingen Malkinia Gladbeck Cigacice Wern Tarw Roermond Kiev (planned) Melaka (Malaysia) Bohumin Neuburg Gógánfa St. Eloy- Les-Mines Tapolca Istria Caparroso Iglesias 47 49
Slide 50: Capacity expansion 2008
Capacity expansion 2008 Trondheim Vyborg Moss Grand Forks Milton Doense Moskva Vamdrup Flechtingen Malkinia >5% Wern Tarw Roermond Gladbeck Cigacice Kiev Bohumin 3-5 % >5% Neuburg 1-3 % St. Eloy-Les-Mines 3-5 % Gógánfa St. Eloy- Les-Mines 0-1 Melaka%(Malaysia) 43,000 tons Tapolca Malkinia, Istria 1-
Slide 51: Capacity expansion 2008
Capacity expansion 2008 >5% Trondheim 3-5 % Roermond 1-3 % Vyborg Moss 0-1 % 30,000 tons start-up < 0 % finalised Grand Forks Milton Doense Moskva Vamdrup Flechtingen Malkinia Gladbeck Cigacice Wern Tarw Roermond Kiev >5% Bohumin Neuburg 3-5 % Gógánfa Wern 1-3 % Tarw, UK St. Eloy- Les-Mines Tapolca
Slide 52: Capacity expansion 2009
Capacity expansion >5% 2009 - 3-5Trondheim % Kiev, 1-3 %Ukraine Vyborg 0-1 % tons 110,000 start-up date % unconfirmed < 0Moss Grand Forks cost: EUR 110 million Milton Doense Moskva Vamdrup Flechtingen Malkinia Gladbeck Cigacice Roermond Kiev Bohumin >5% Neuburg 3-5 % Gógánfa Milton, Canada > 5St.% E
Source: Internet Archive copy of rockwool.com
More decks from Rockwool A/S Class A
 Q2 2026 Earnings Presentation19 slides · Aug 20, 2026
 Q1 2026 Earnings Presentation15 slides · May 20, 2026
 Shareholder Meeting (2026)10 slides · Apr 15, 2026
 Shareholder Meeting (April 2026)46 slides · Apr 15, 2026
 Q4 2025 Earnings Presentation19 slides · Feb 5, 2026
 Q2 2025 Earnings Presentation17 slides · Aug 21, 2025