RPX Gold · TSXV:RPX
RPX Gold — Investor Presentation (November 2026)
36 slides from RPX Gold's investor presentation, November 2026
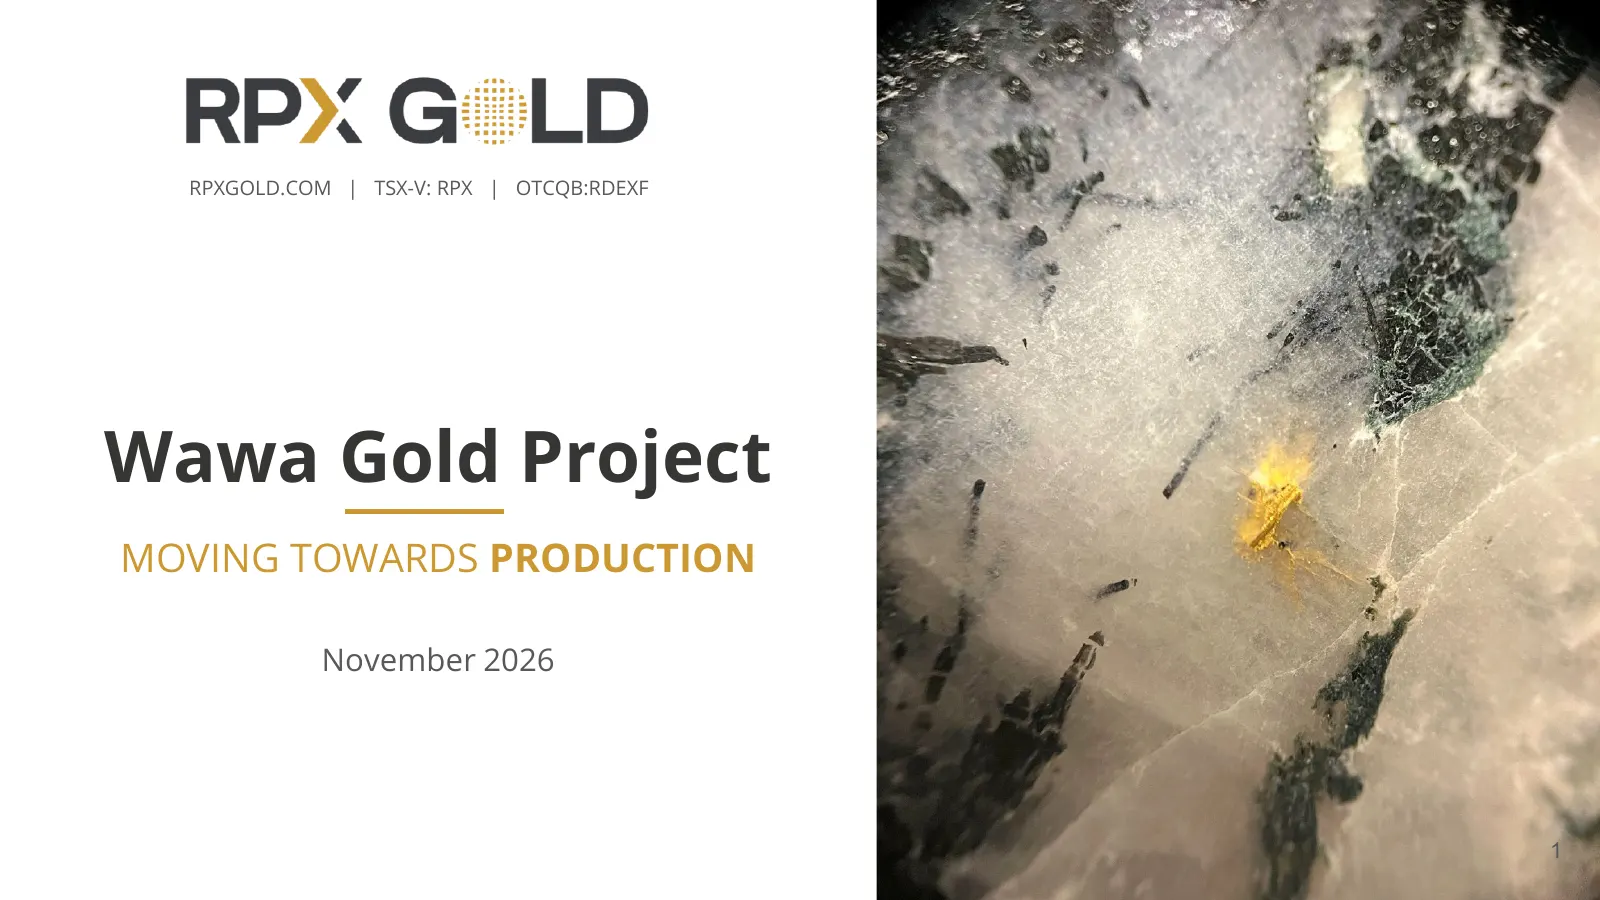
Slide 1: Wawa Gold Project: Moving Towards Production
RPXGOLD.COM | TSX-V: RPX | OTCQB:RDEXF Wawa Gold Project MOVING TOWARDS PRODUCTION November 2026 1
Slide 2: Forward-Looking Statement
Forward-Looking Statement This presentation, the information contained herein, any other materials provided in connection with this presentation and any oral remarks accompanying this presentation ( collectively, the “Presentation”) , have been prepared by RPX Gold Inc. ( “RPX” or the “Company”) sol
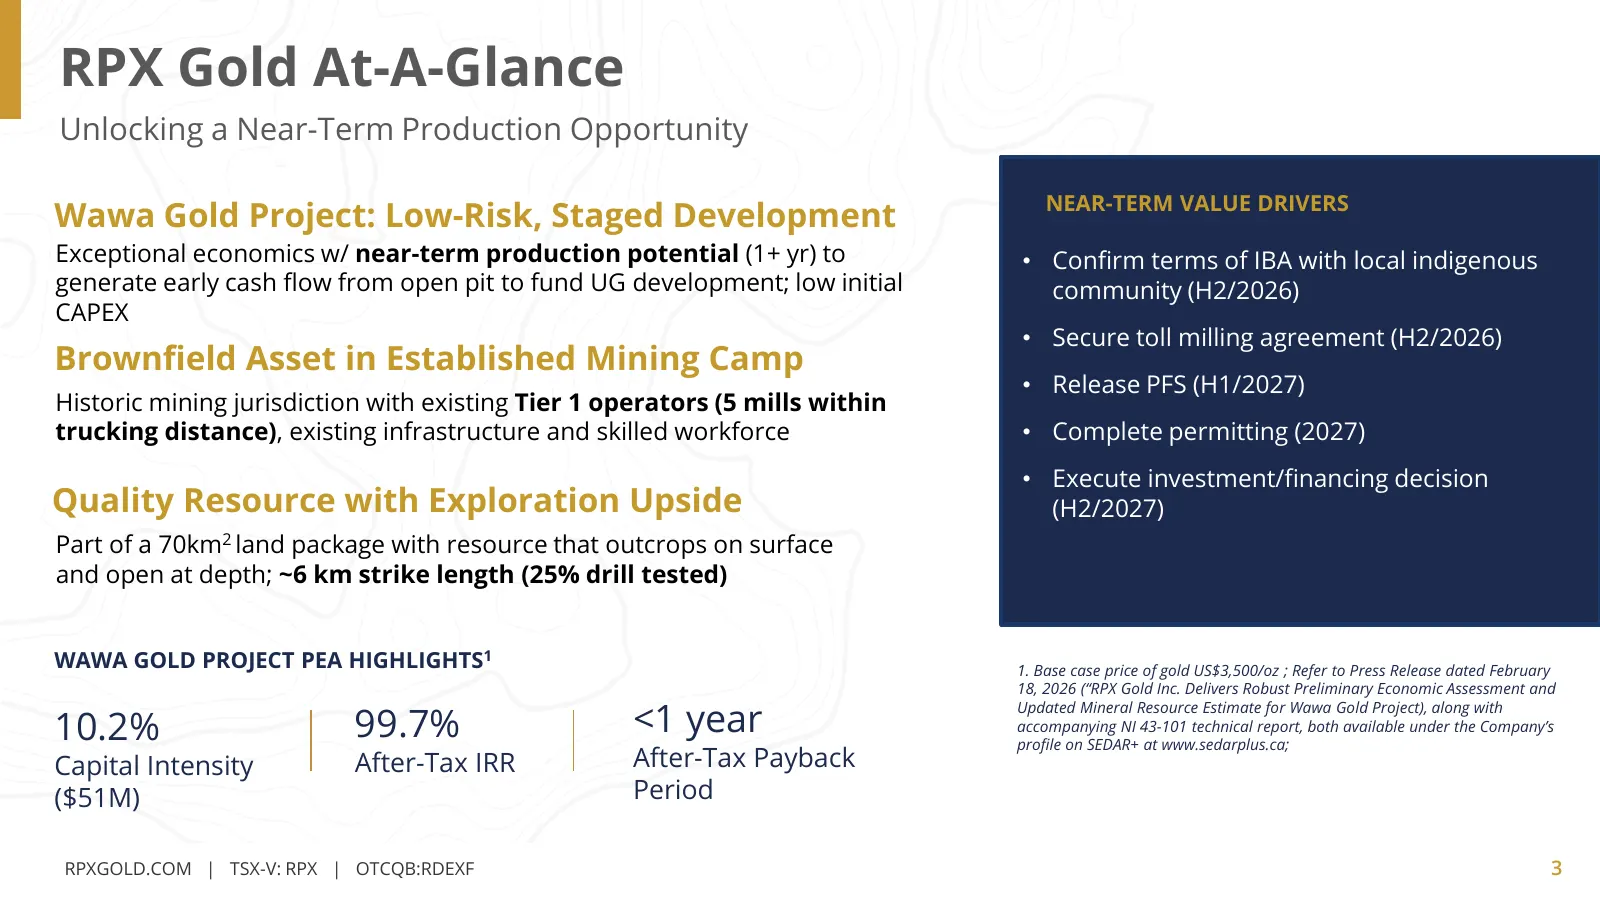
Slide 3: RPX Gold At-A-Glance
RPX Gold At-A-Glance Unlocking a Near-Term Production Opportunity NEAR-TERM VALUE DRIVERS Wawa Gold Project: Low-Risk, Staged Development ● Exceptional economics w/ near-term production potential (1+ yr) to • Confirm terms of IBA with local indigenous generate early cash flow from open pit to fund U
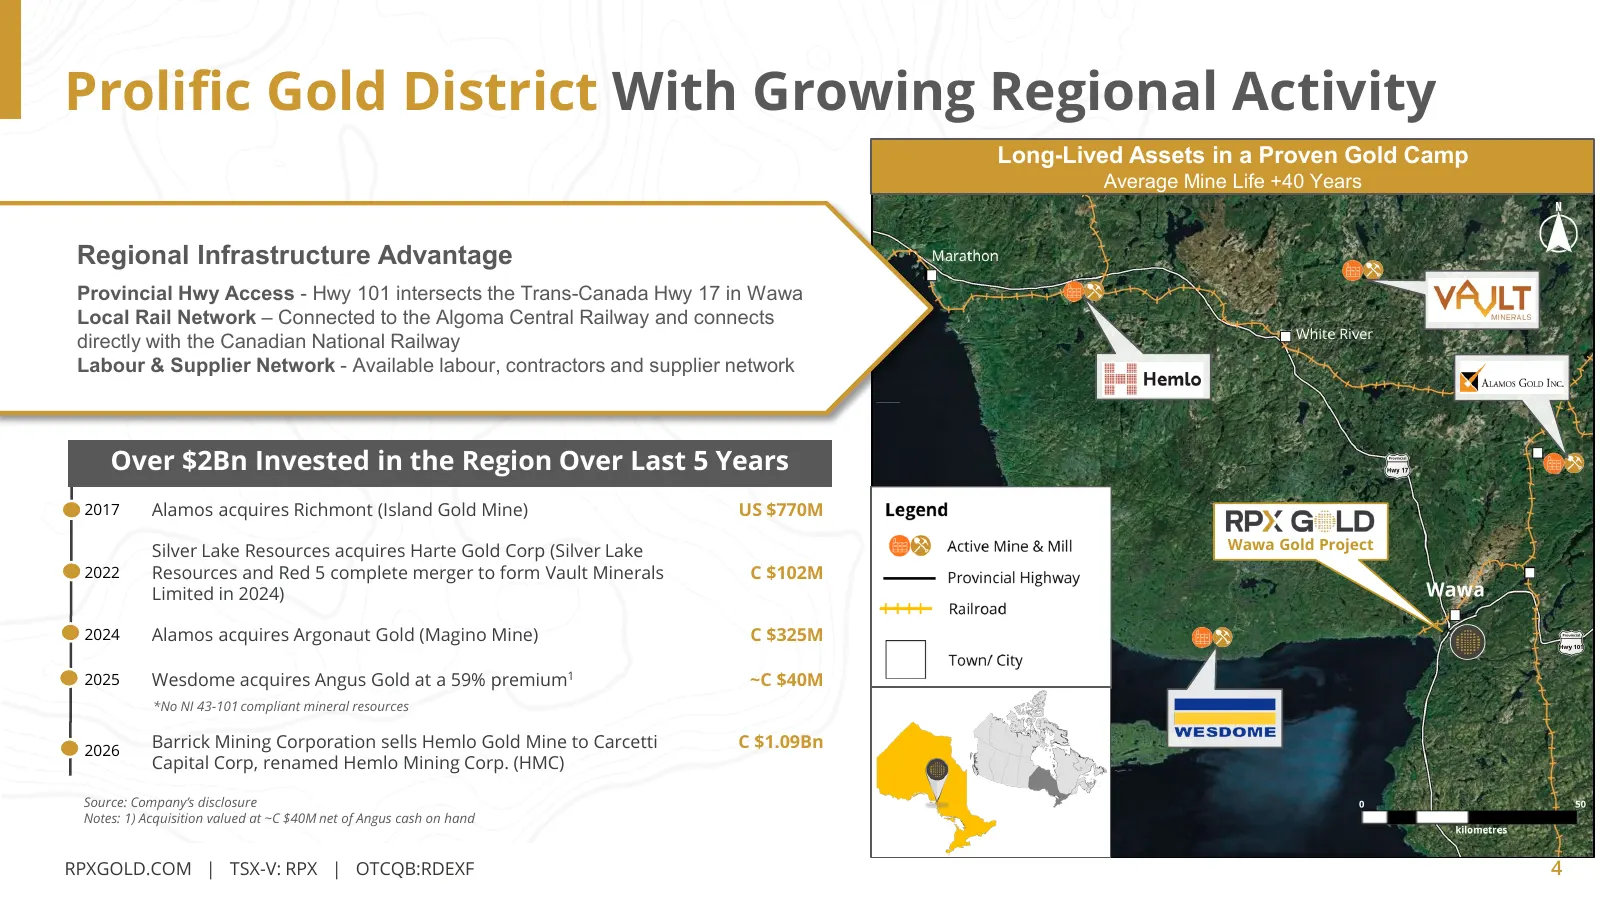
Slide 4: Prolific Gold District With Growing Regional Activity
Prolific Gold District With Growing Regional Activity Long-Lived Assets in a Proven Gold Camp Average Mine Life +40 Years Regional Infrastructure Advantage • Provincial Hwy Access - Hwy 101 intersects the Trans-Canada Hwy 17 in Wawa • Local Rail Network – Connected to the Algoma Central Railway and
Slide 5: Wawa Gold Project Overview
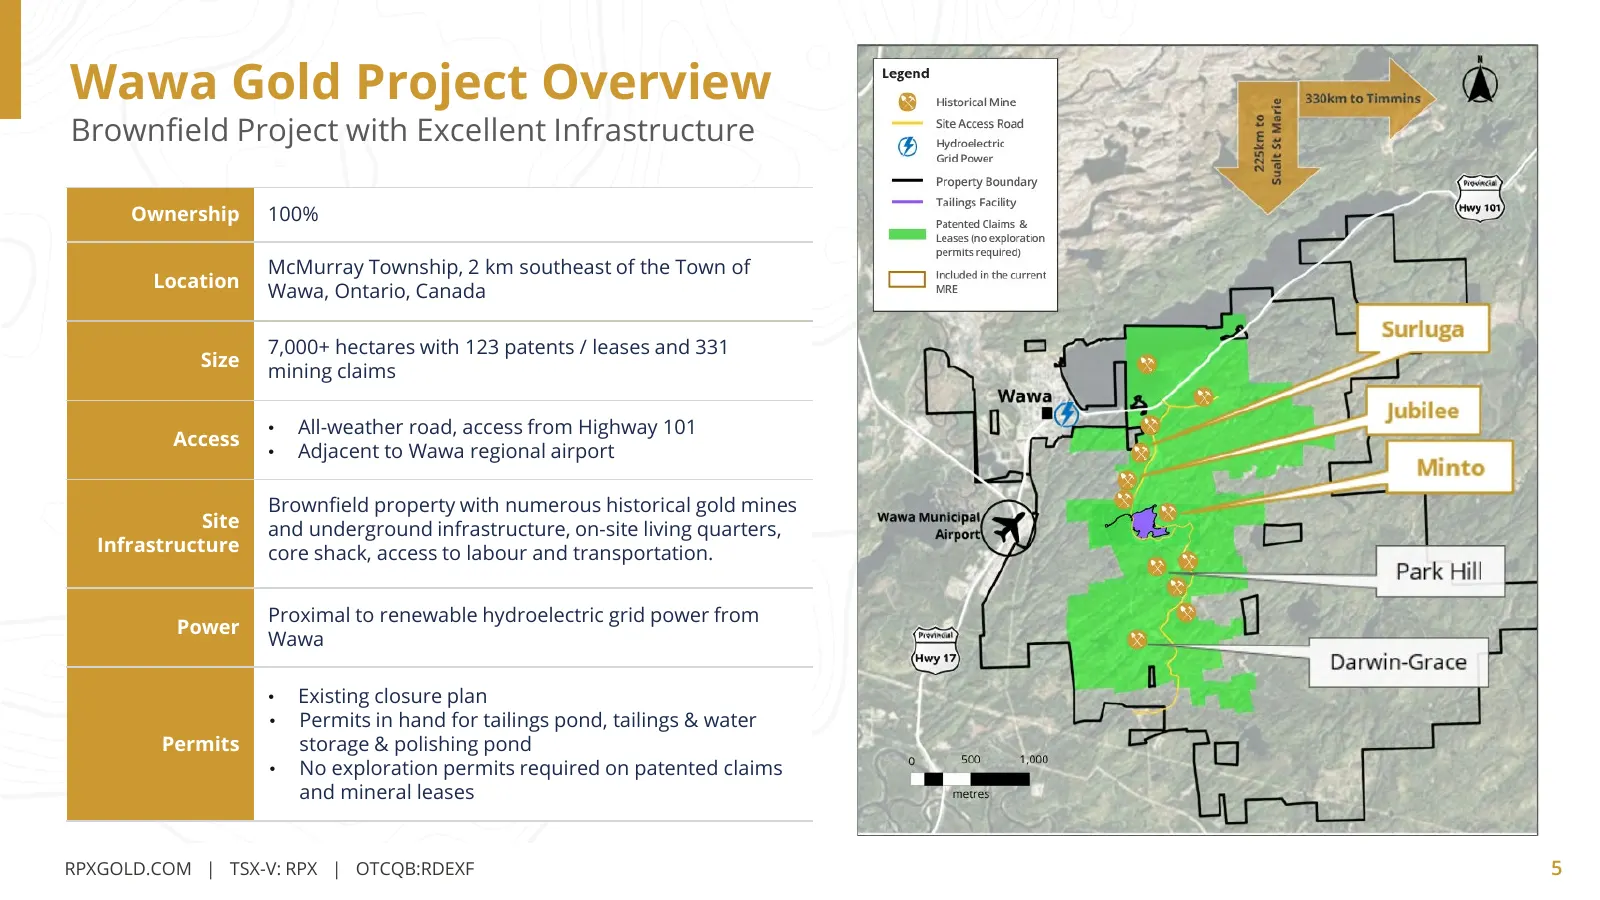
Wawa Gold Project Overview Brownfield Project with Excellent Infrastructure Ownership 100% McMurray Township, 2 km southeast of the Town of Location Wawa, Ontario, Canada 7,000+ hectares with 123 patents / leases and 331 Size mining claims • All-weather road, access from Highway 101 Access • Adjacen
Slide 6: Large Gold System (~6km-long) With Many Underexplored Areas
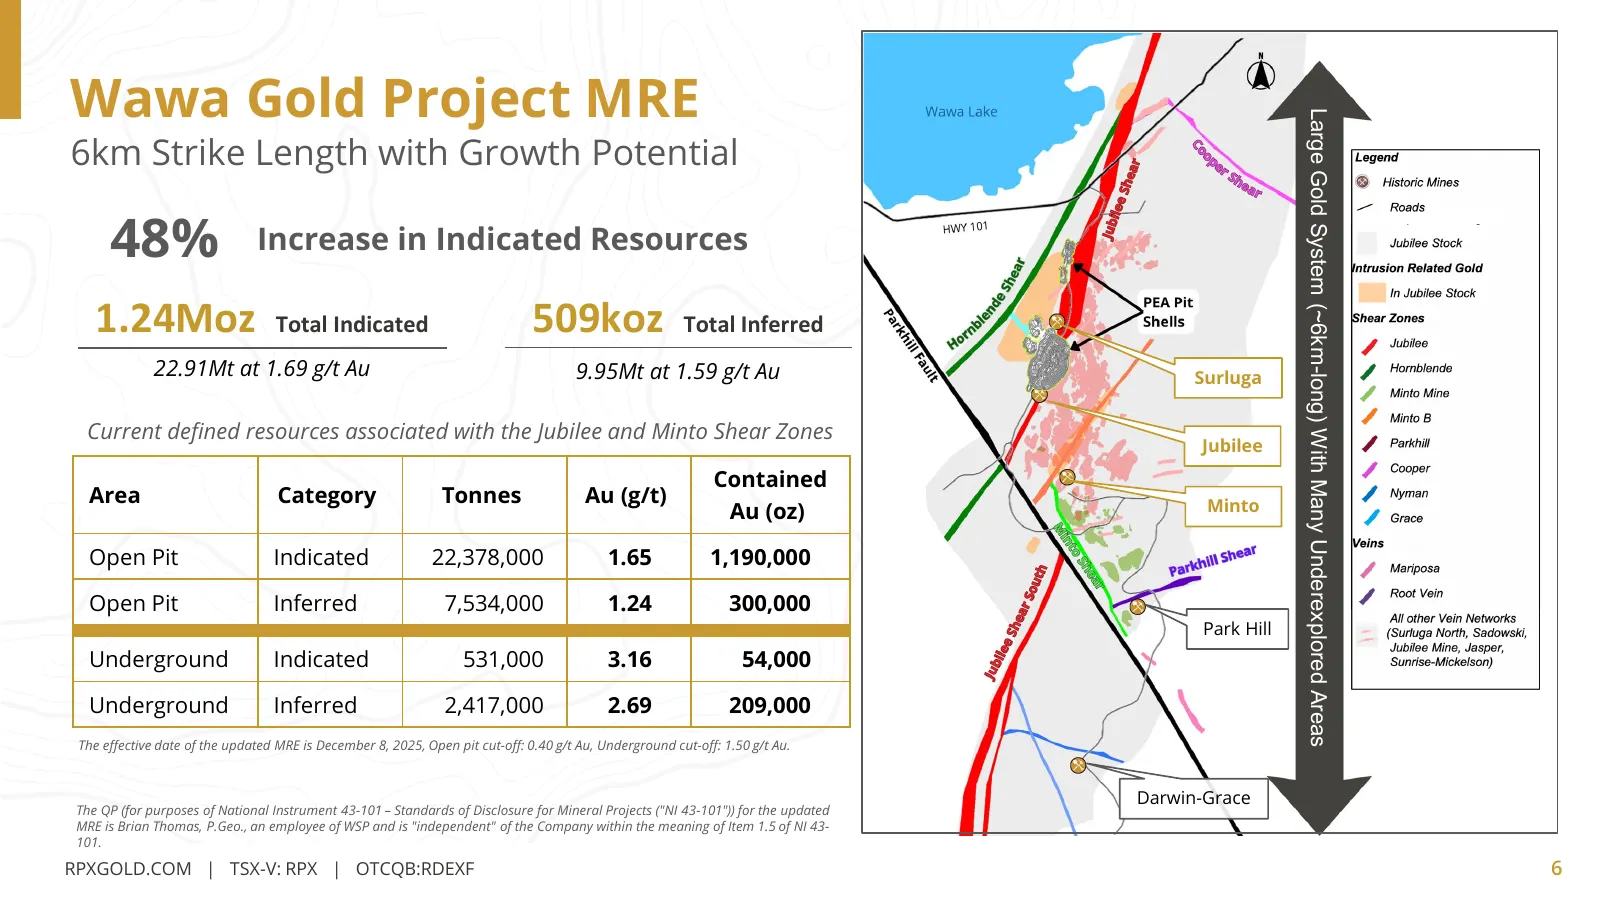
Wawa Gold Project MRE Large Gold System (~6km-long) With Many Underexplored Areas 6km Strike Length with Growth Potential 48% Increase in Indicated Resources 1.24Moz Total Indicated 509koz Total Inferred 22.91Mt at 1.69 g/t Au 9.95Mt at 1.59 g/t Au Surluga Current defined resources associated with t
Slide 7: The Wawa Gold Opportunity
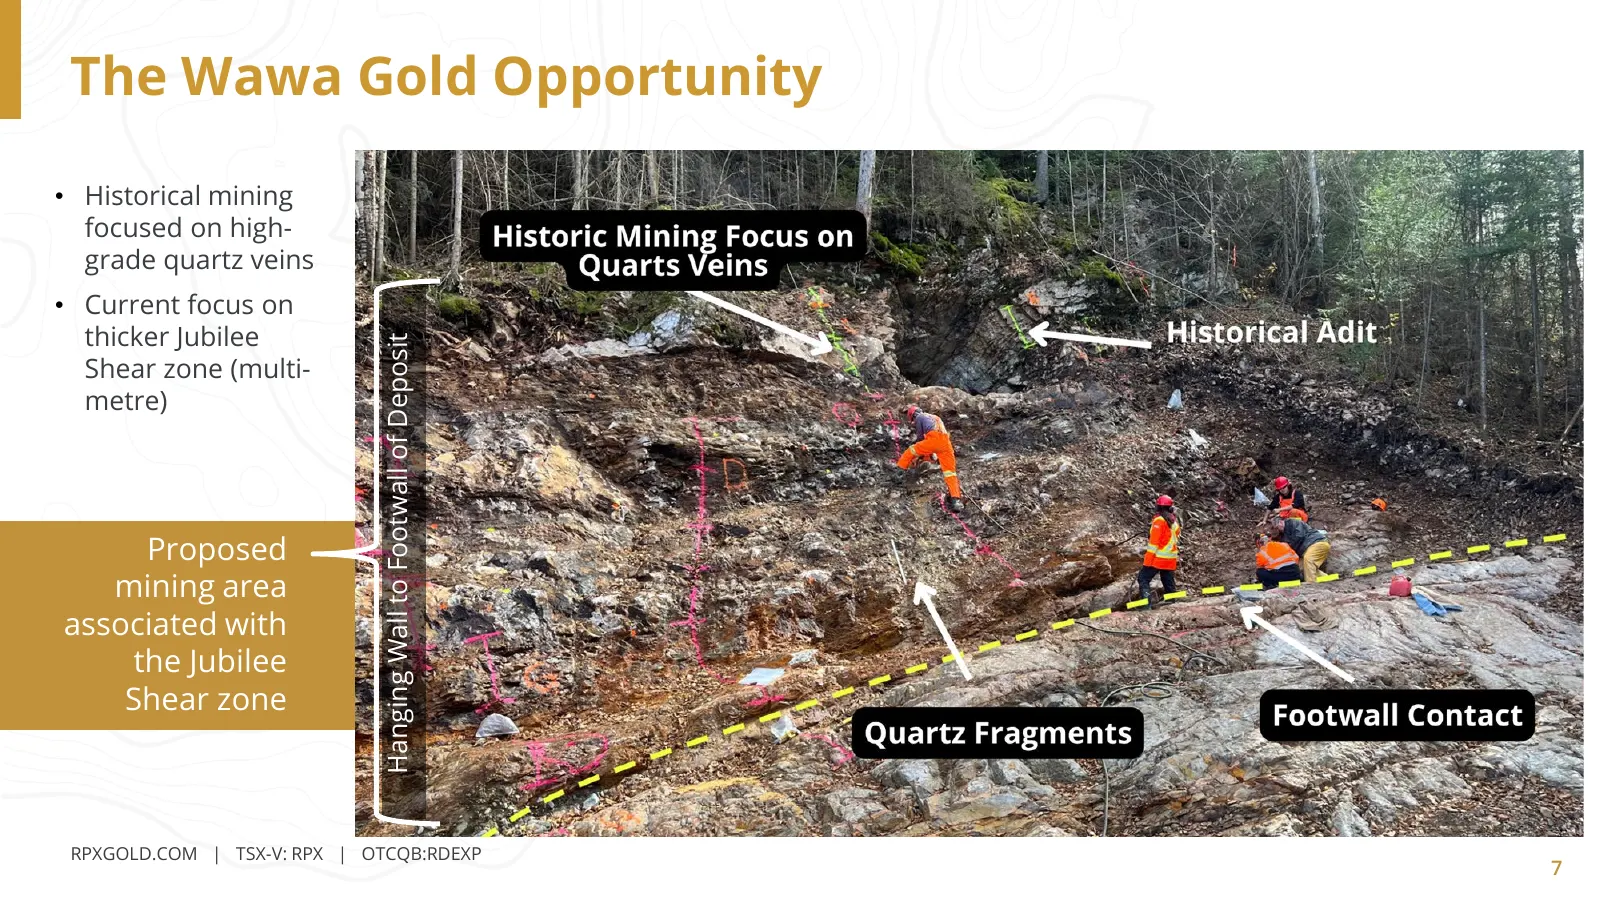
The Wawa Gold Opportunity • Historical mining focused on high- grade quartz veins • Current focus on thicker Jubilee Hanging Wall to Footwall of Deposit Shear zone (multi- metre) Proposed mining area associated with the Jubilee Shear zone RPXGOLD.COM | TSX-V: RPX | OTCQB:RDEXP 7
Slide 8: Wawa Gold Project PEA Highlights
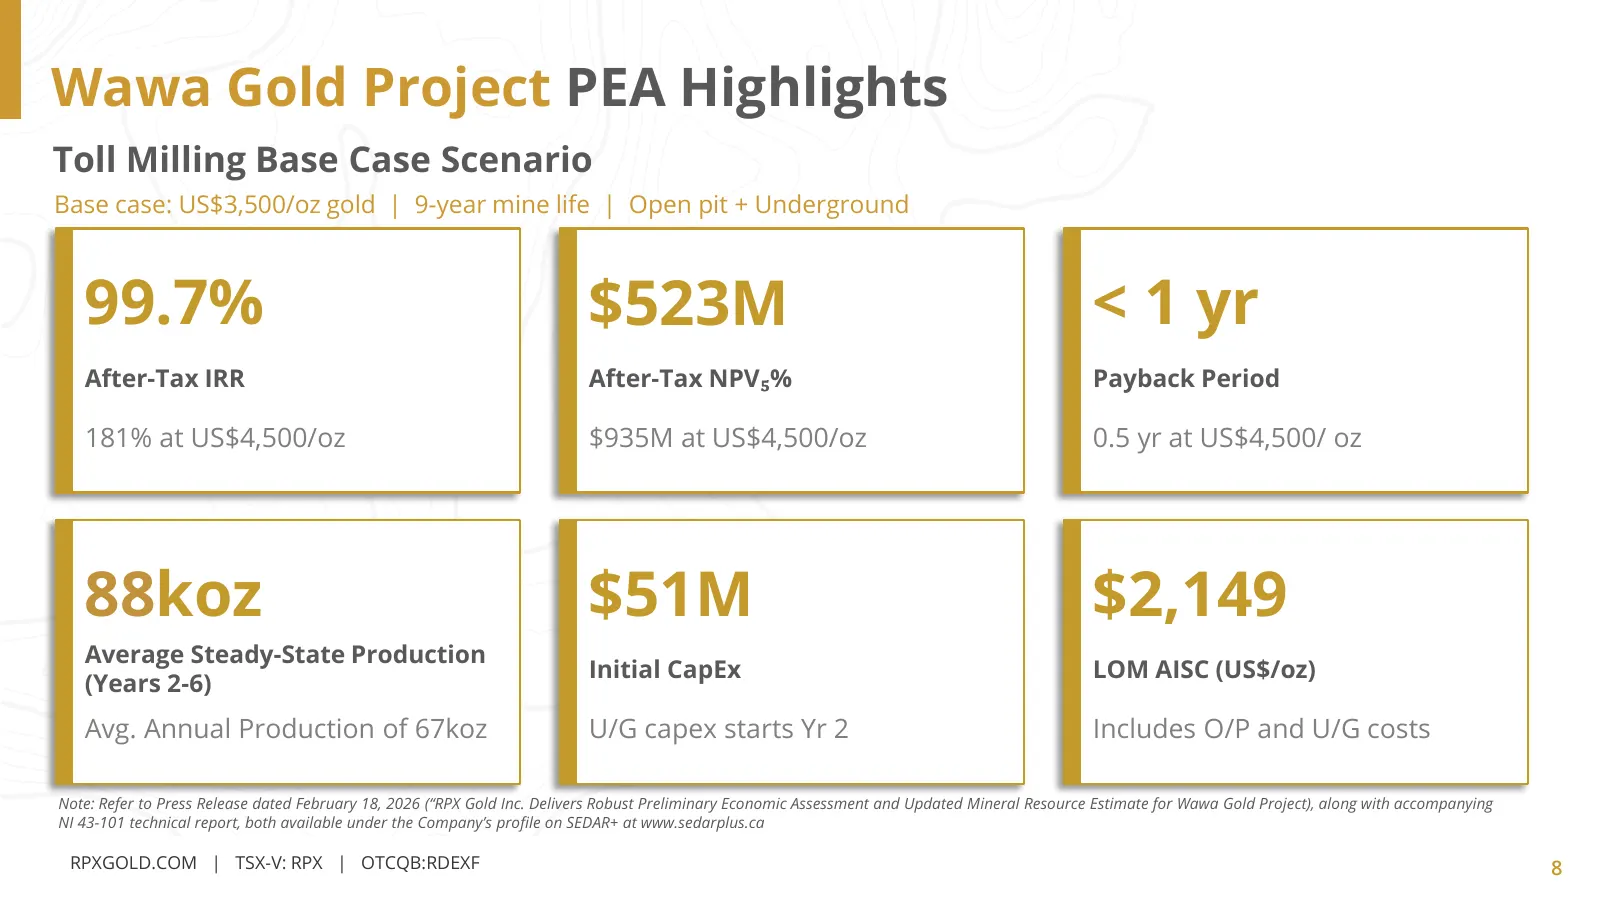
PEA HIGHLIGHTS Wawa Gold Project PEA Highlights Toll Milling Base Case Scenario Base case: US$3,500/oz gold | 9-year mine life | Open pit + Underground 99.7% $523M < 1 yr After-Tax IRR After-Tax NPV₅% Payback Period 181% at US$4,500/oz $935M at US$4,500/oz 0.5 yr at US$4,500/ oz 88koz $51M $2,149 Av
Slide 9: Open Pit and Underground PEA Mine Plan
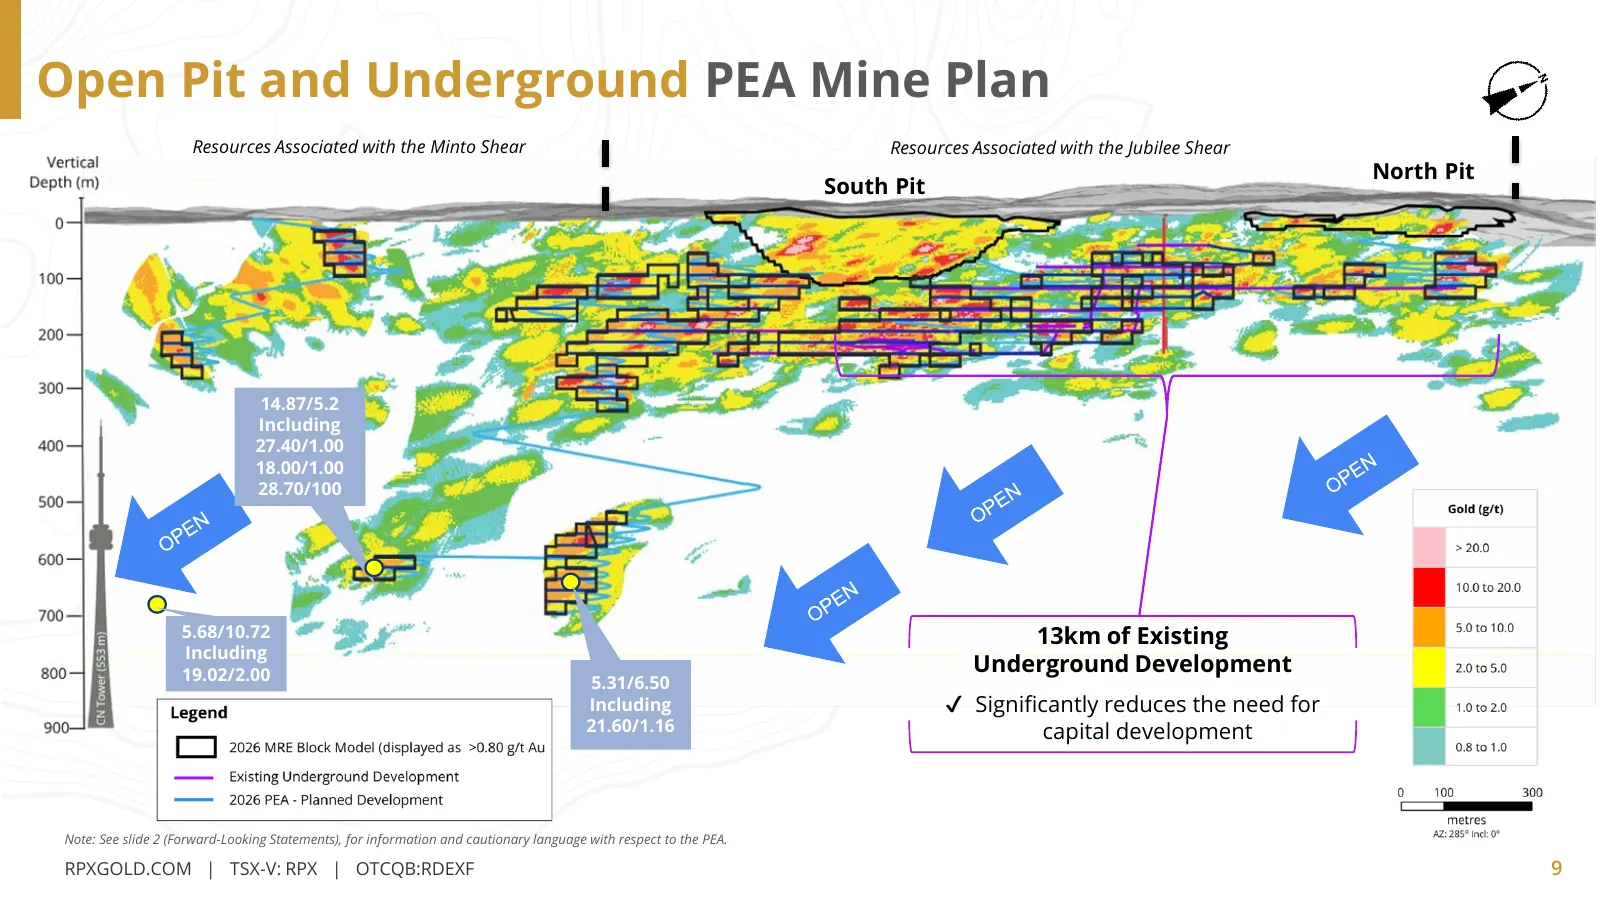
Open Pit and Underground PEA Mine Plan Resources Associated with the Minto Shear Resources Associated with the Jubilee Shear North Pit South Pit 14.87/5.2 Including 27.40/1.00 18.00/1.00 28.70/100 5.68/10.72 13km of Existing Including 19.02/2.00 Underground Development 5.31/6.50 Including ✔ Signific
Slide 10: PEA Production Profile
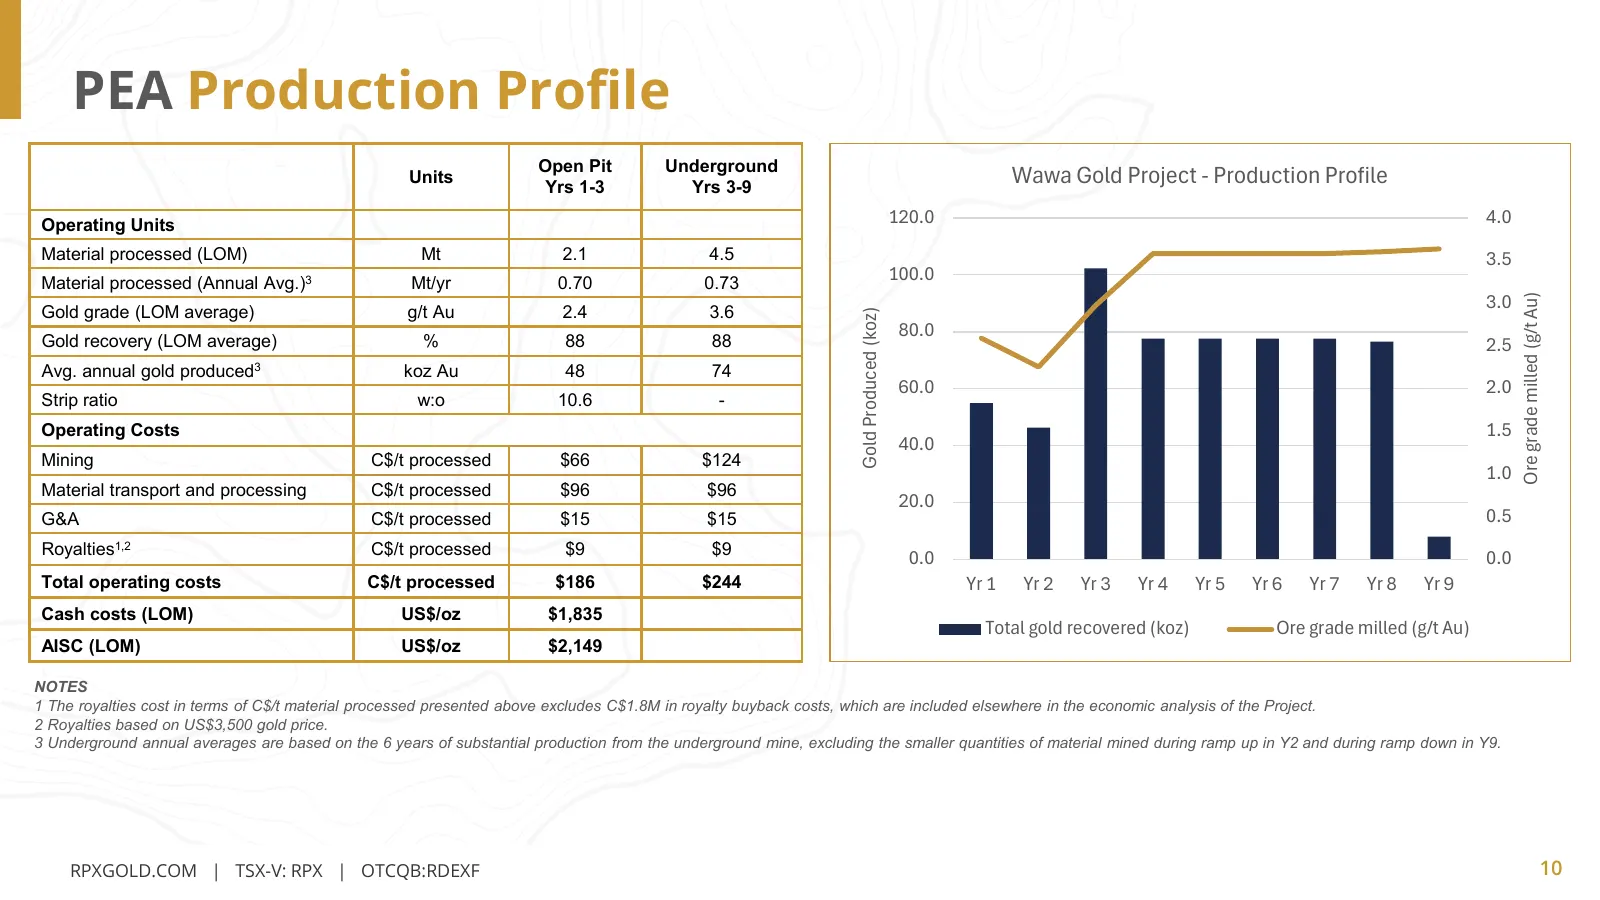
PEA Production Profile Open Pit Underground Units Yrs 1-3 Yrs 3-9 Wawa Gold Project - Production Profile Operating Units 120.0 4.0 Material processed (LOM) Mt 2.1 4.5 3.5 Material processed (Annual Avg.)3 Mt/yr 0.70 0.73 100.0 3.0 Ore grade milled (g/t Au) Gold grade (LOM average) g/t Au 2.4 3.6 Gol
Slide 11: PEA Project Economics
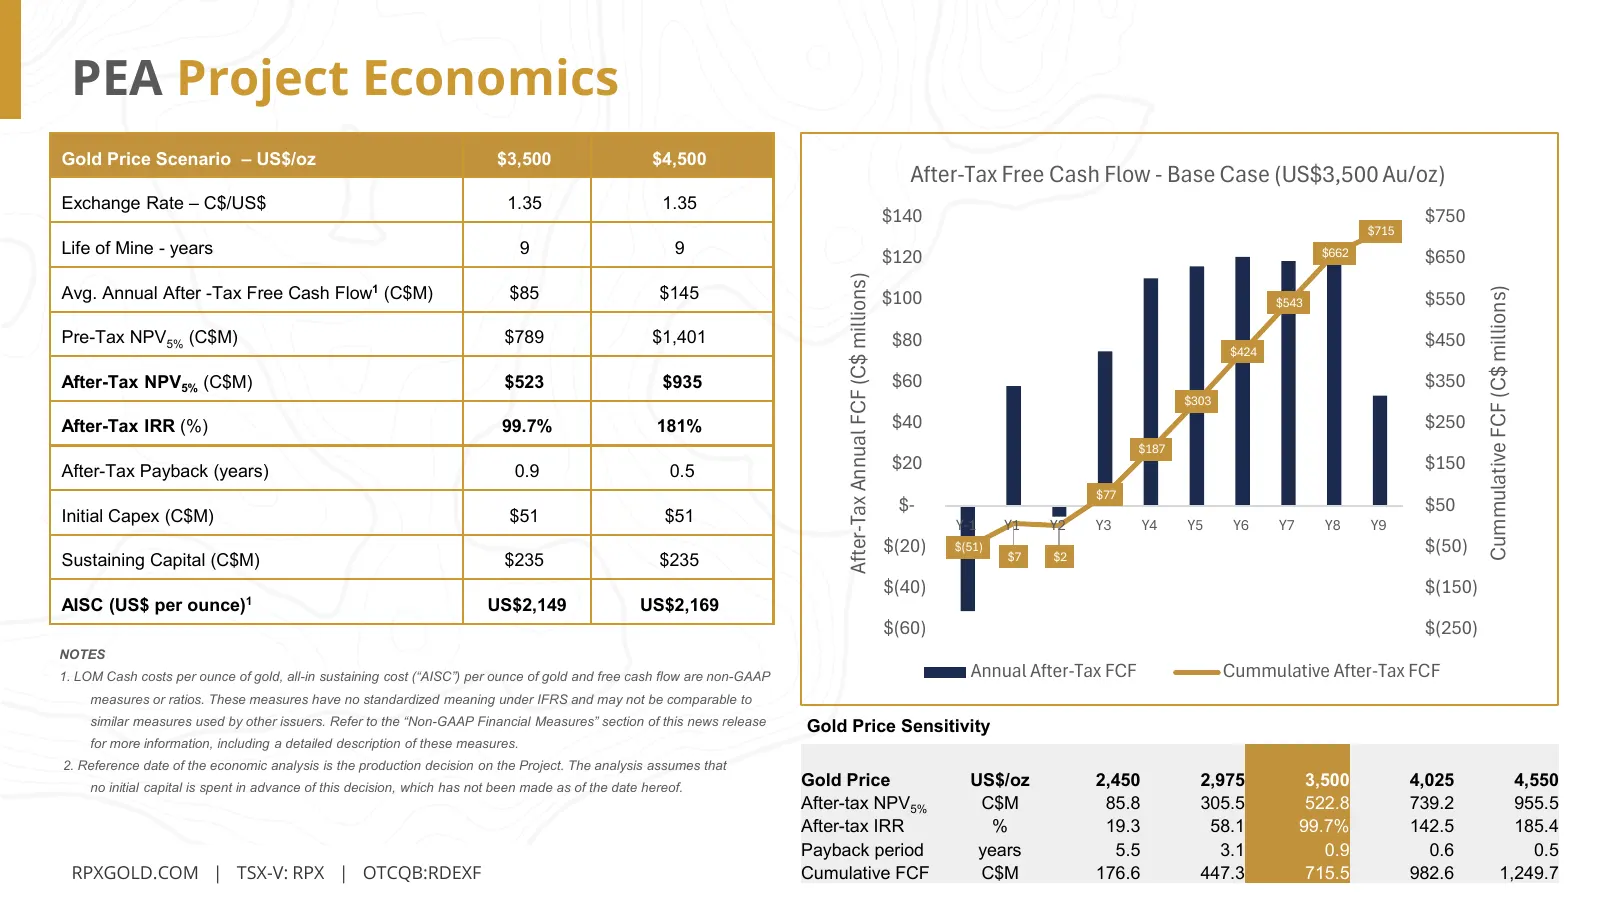
PEA Project Economics Gold Price Scenario – US$/oz $3,500 $4,500 After-Tax Free Cash Flow - Base Case (US$3,500 Au/oz) Exchange Rate – C$/US$ 1.35 1.35 $140 $750 $715 Life of Mine - years 9 9 $120 $662 $650 After-Tax Annual FCF (C$ millions) Avg. Annual After -Tax Free Cash Flow1 (C$M) $85 $145 $100
Slide 12: Recent Drilling Highlights with PFS Infill Drill Targets
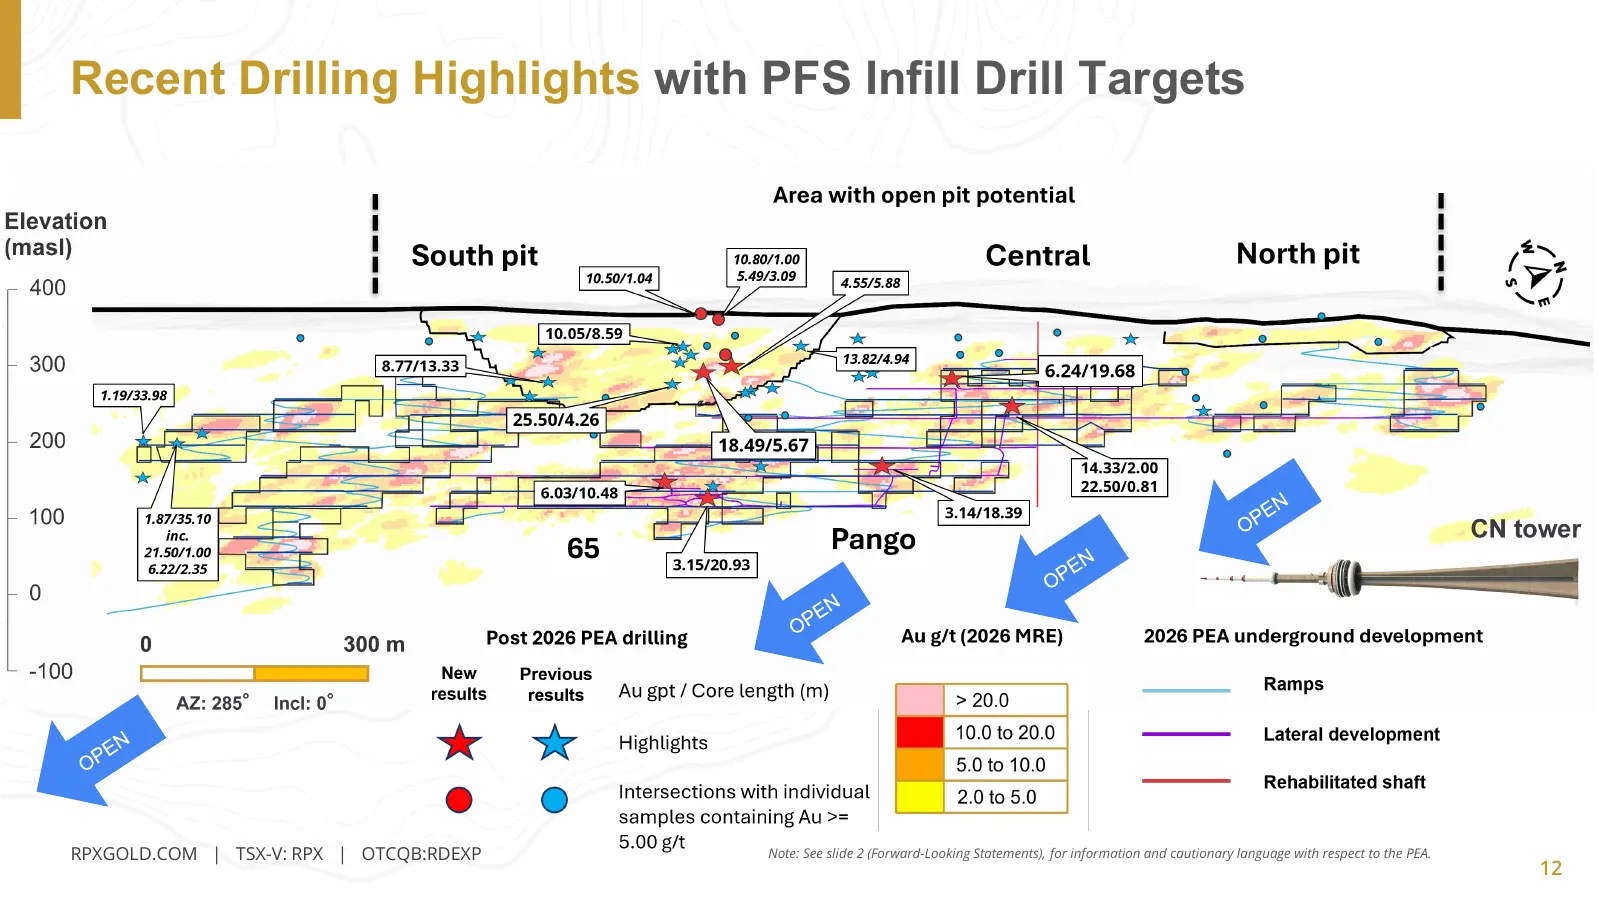
Recent Drilling Highlights with PFS Infill Drill Targets RPXGOLD.COM | TSX-V: RPX | OTCQB:RDEXP Note: See slide 2 (Forward-Looking Statements), for information and cautionary language with respect to the PEA. 12
Slide 13: Baseline Environmental Studies for Permitting & Closure Plan
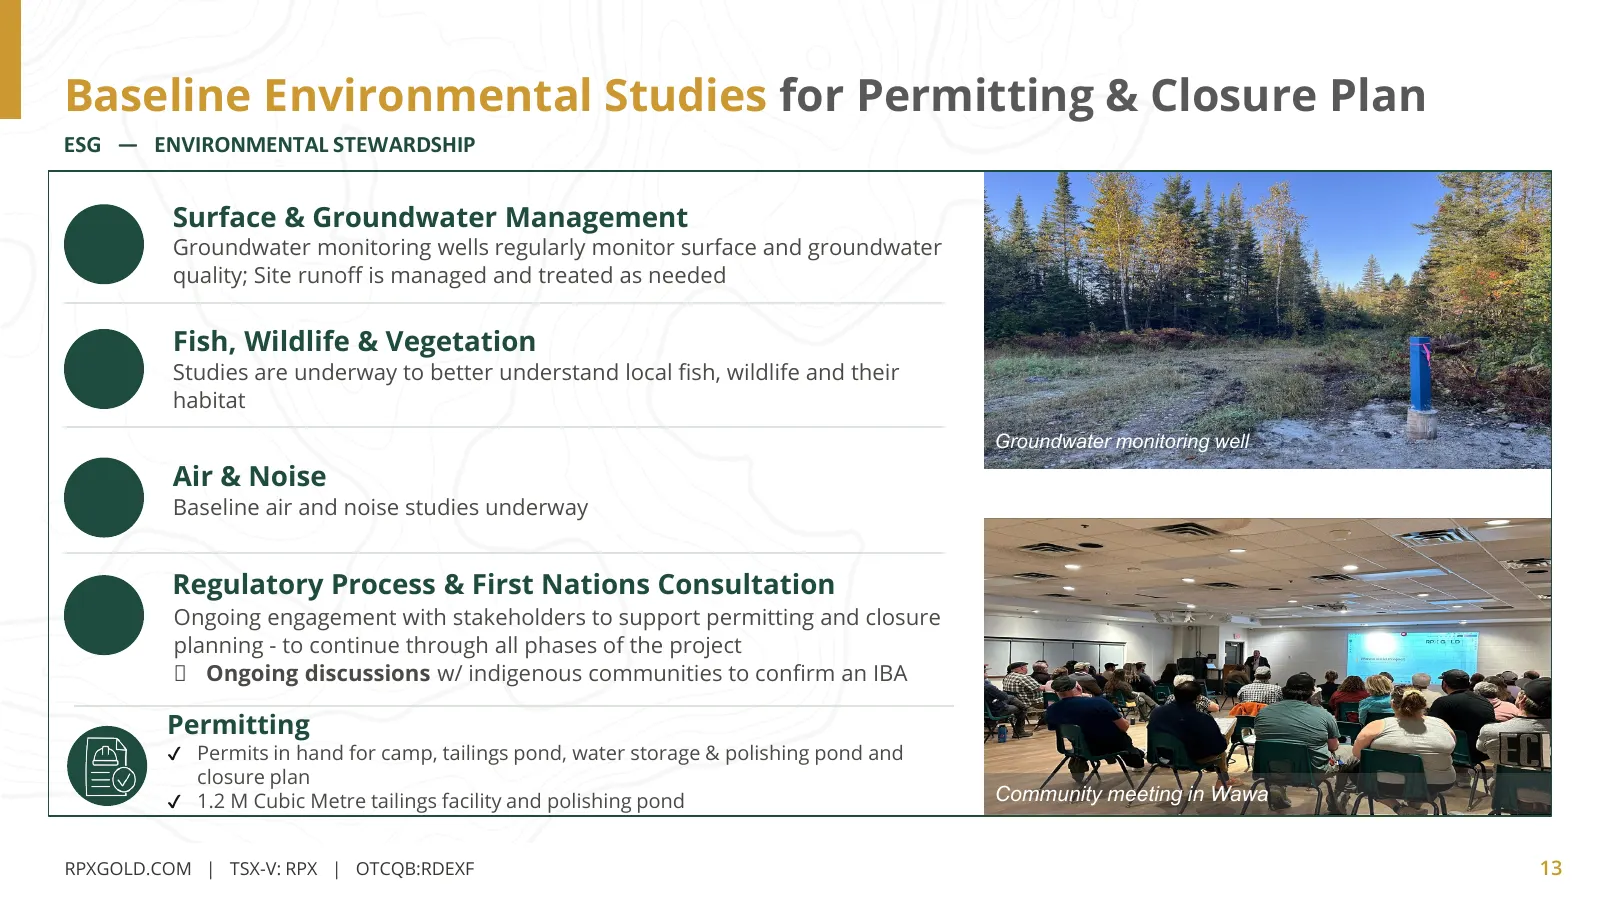
Baseline Environmental Studies for Permitting & Closure Plan ESG — ENVIRONMENTAL STEWARDSHIP Surface & Groundwater Management Groundwater monitoring wells regularly monitor surface and groundwater quality; Site runoff is managed and treated as needed Fish, Wildlife & Vegetation Studies are underway
Slide 14: Project Schedule With Expedited Path to Production
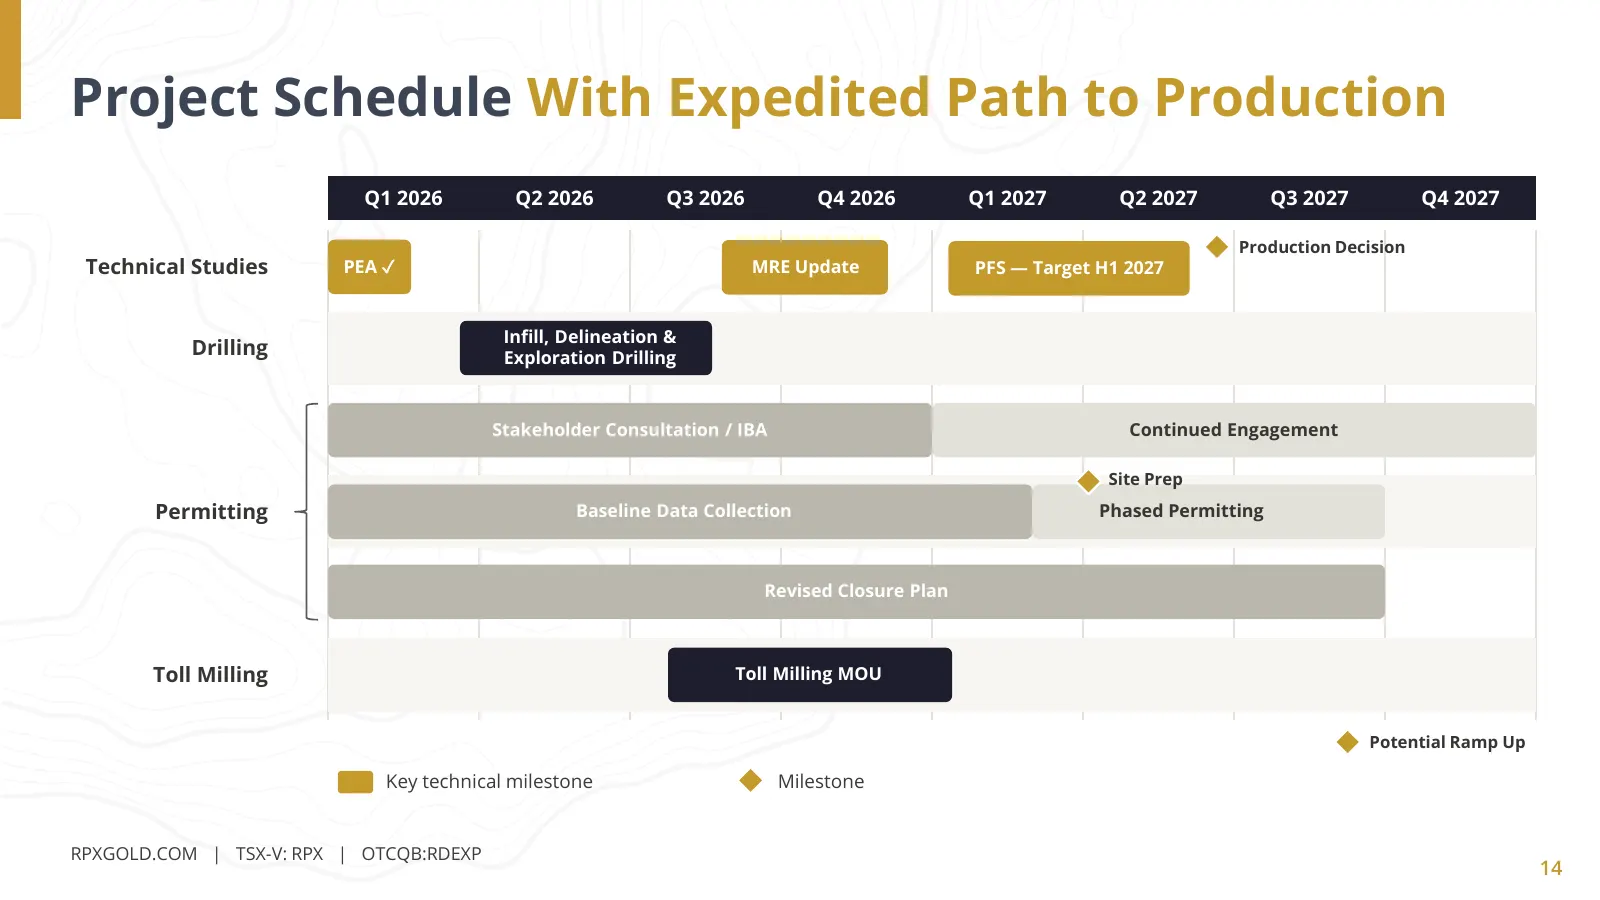
Project Schedule With Expedited Path to Production Q1 2026 Q2 2026 Q3 2026 Q4 2026 Q1 2027 Q2 2027 Q3 2027 Q4 2027 Production Decision Technical Studies PEA ✓ MRE Update PFS — Target H1 2027 Infill, Delineation & Drilling Exploration Drilling Stakeholder Consultation / IBA Continued Engagement Site
Slide 15: Leadership and Technical Expertise
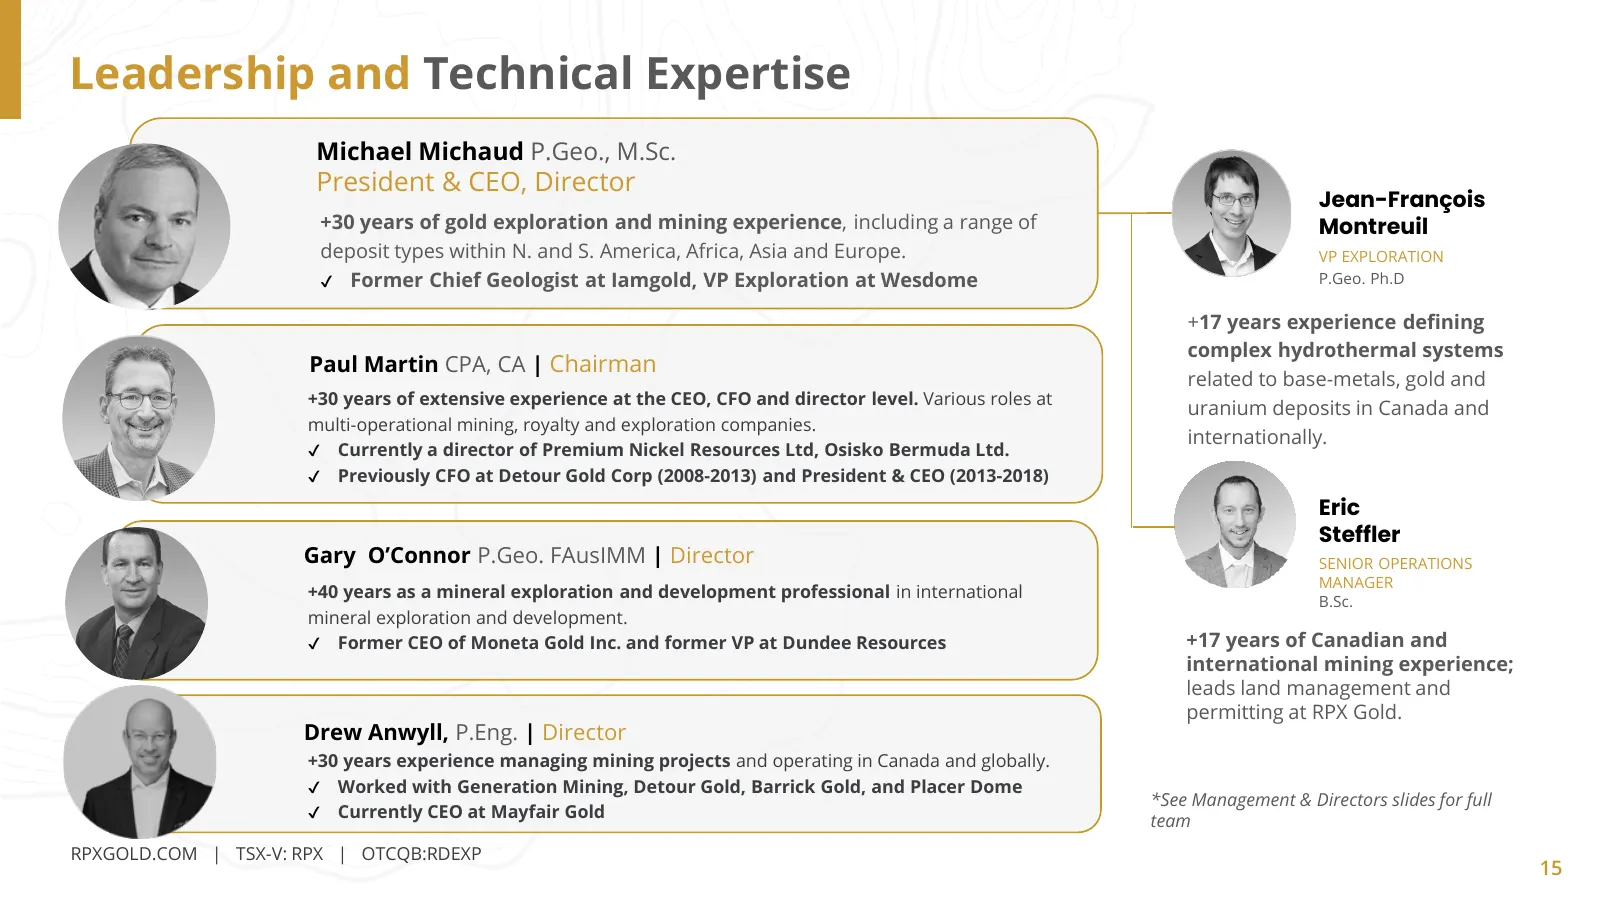
Leadership and Technical Expertise Michael Michaud P.Geo., M.Sc. President & CEO, Director Jean-François +30 years of gold exploration and mining experience, including a range of Montreuil deposit types within N. and S. America, Africa, Asia and Europe. VP EXPLORATION ✔ Former Chief Geologist at Iam
Slide 16: Capital Structure & Shareholder Breakdown
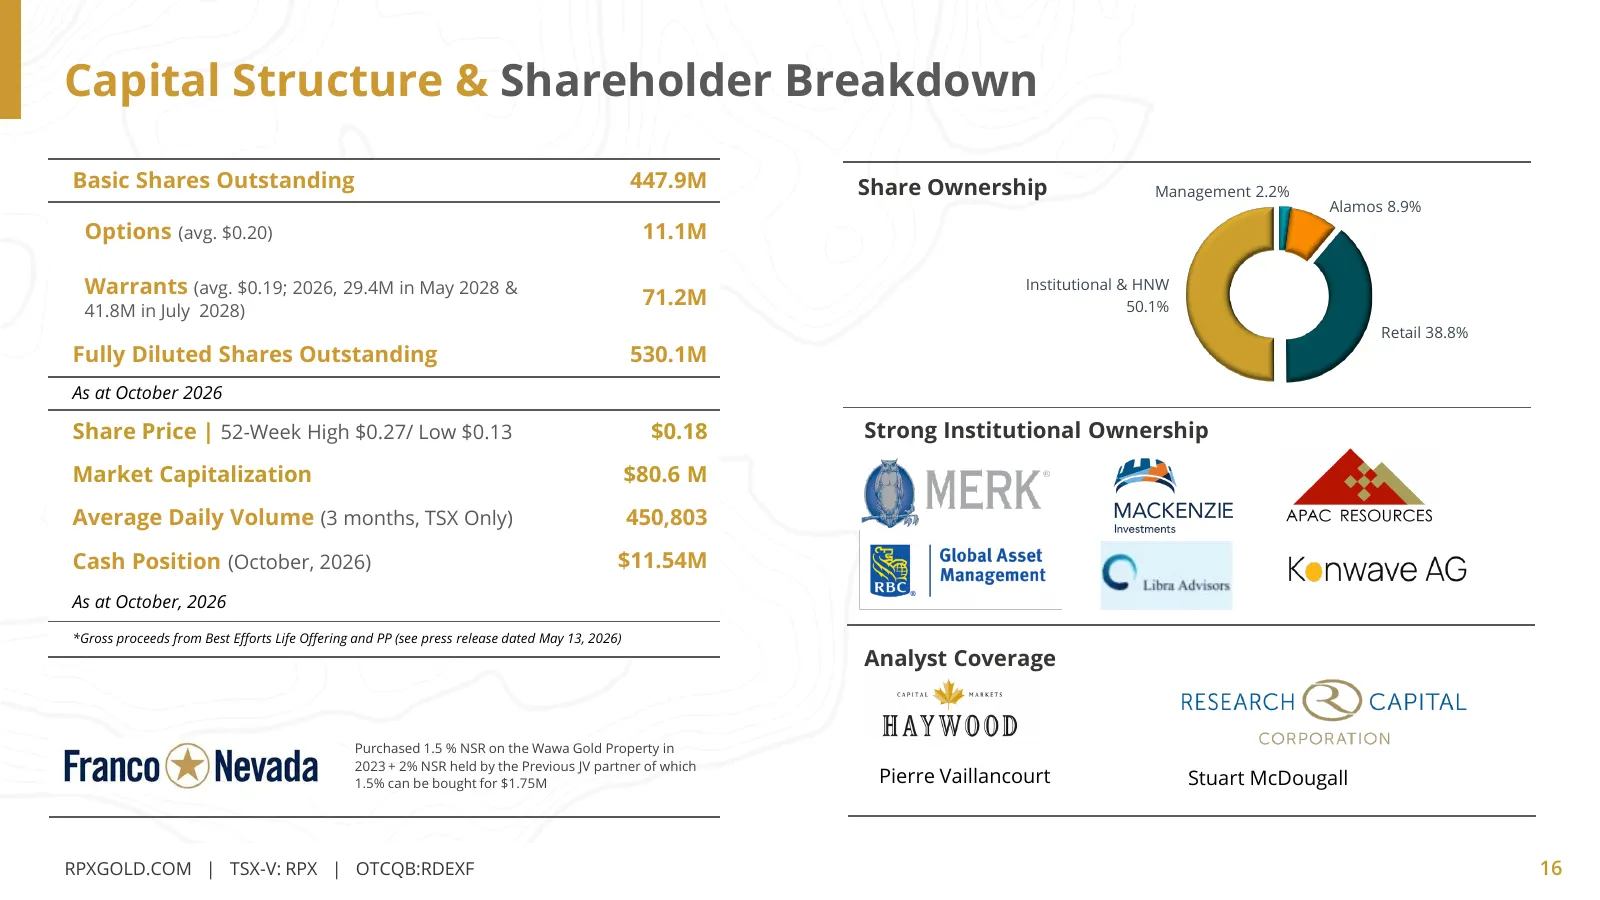
Capital Structure & Shareholder Breakdown Basic Shares Outstanding 447.9M Share Ownership Management 2.2% Alamos 8.9% Options (avg. $0.20) 11.1M Warrants (avg. $0.19; 2026, 29.4M in May 2028 & 71.2M Institutional & HNW 41.8M in July 2028) 50.1% Retail 38.8% Fully Diluted Shares Outstanding 530.1M As
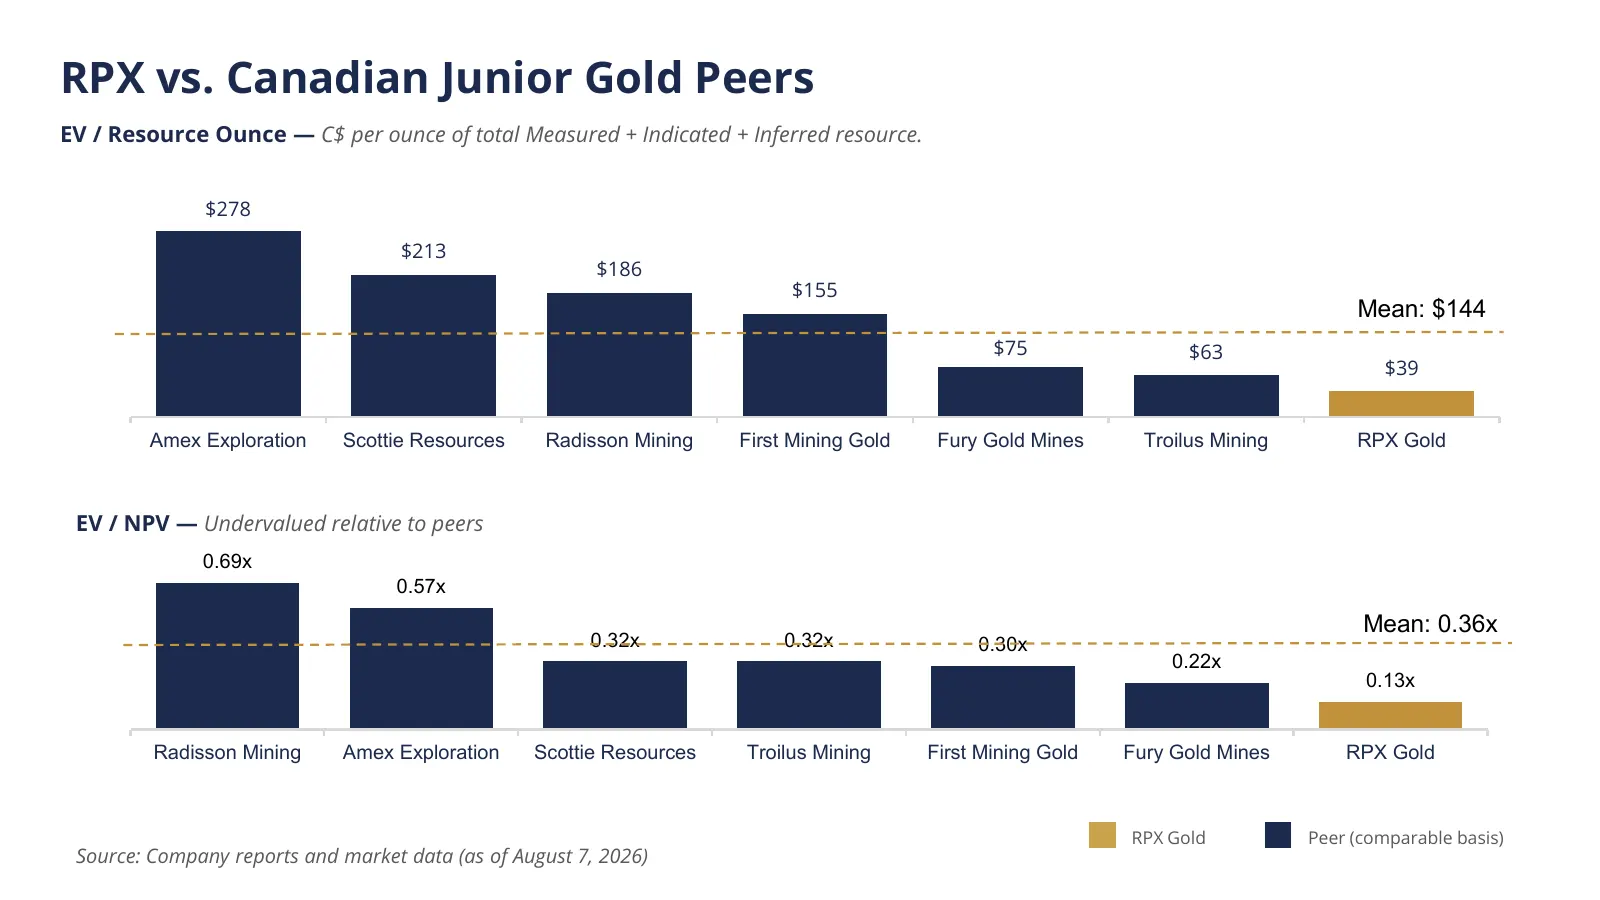
Slide 17: RPX vs. Canadian Junior Gold Peers
RPX vs. Canadian Junior Gold Peers EV / Resource Ounce — C$ per ounce of total Measured + Indicated + Inferred resource. $278 $213 $186 $155 Mean: $144 $75 $63 $39 Amex Exploration Scottie Resources Radisson Mining First Mining Gold Fury Gold Mines Troilus Mining RPX Gold EV / NPV — Undervalued rela
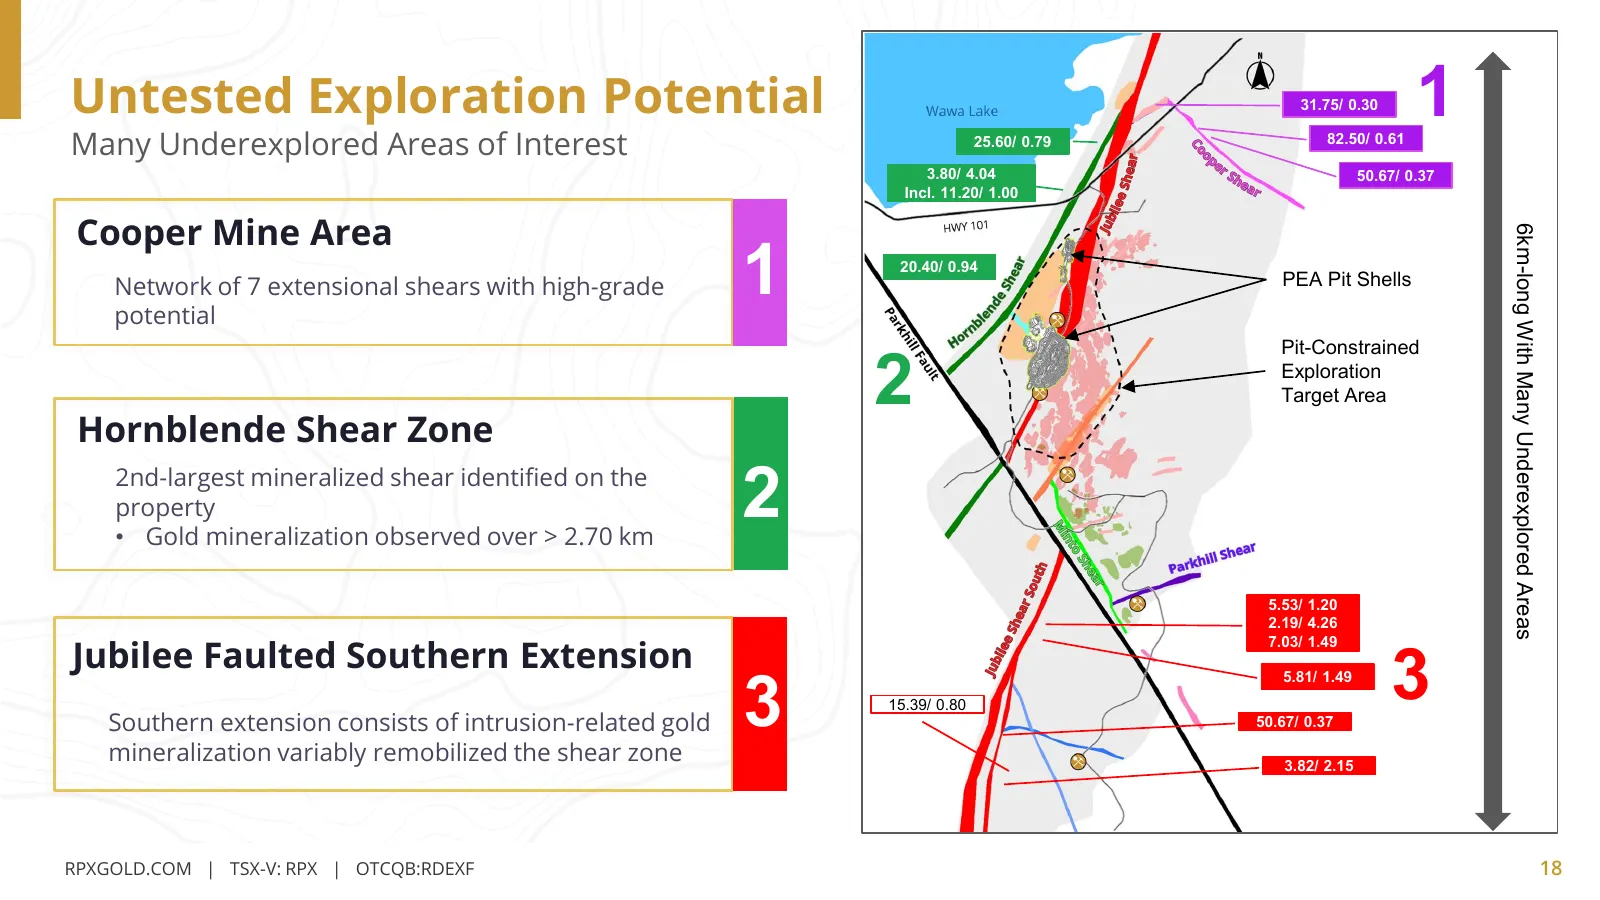
Slide 18: 6km-long With Many Underexplored Areas
Untested Exploration Potential 31.75/ 0.30 1 Many Underexplored Areas of Interest 25.60/ 0.79 82.50/ 0.61 3.80/ 4.04 50.67/ 0.37 Incl. 11.20/ 1.00 Cooper Mine Area 1 6km-long With Many Underexplored Areas 20.40/ 0.94 Network of 7 extensional shears with high-grade PEA Pit Shells potential 2 Pit-Cons
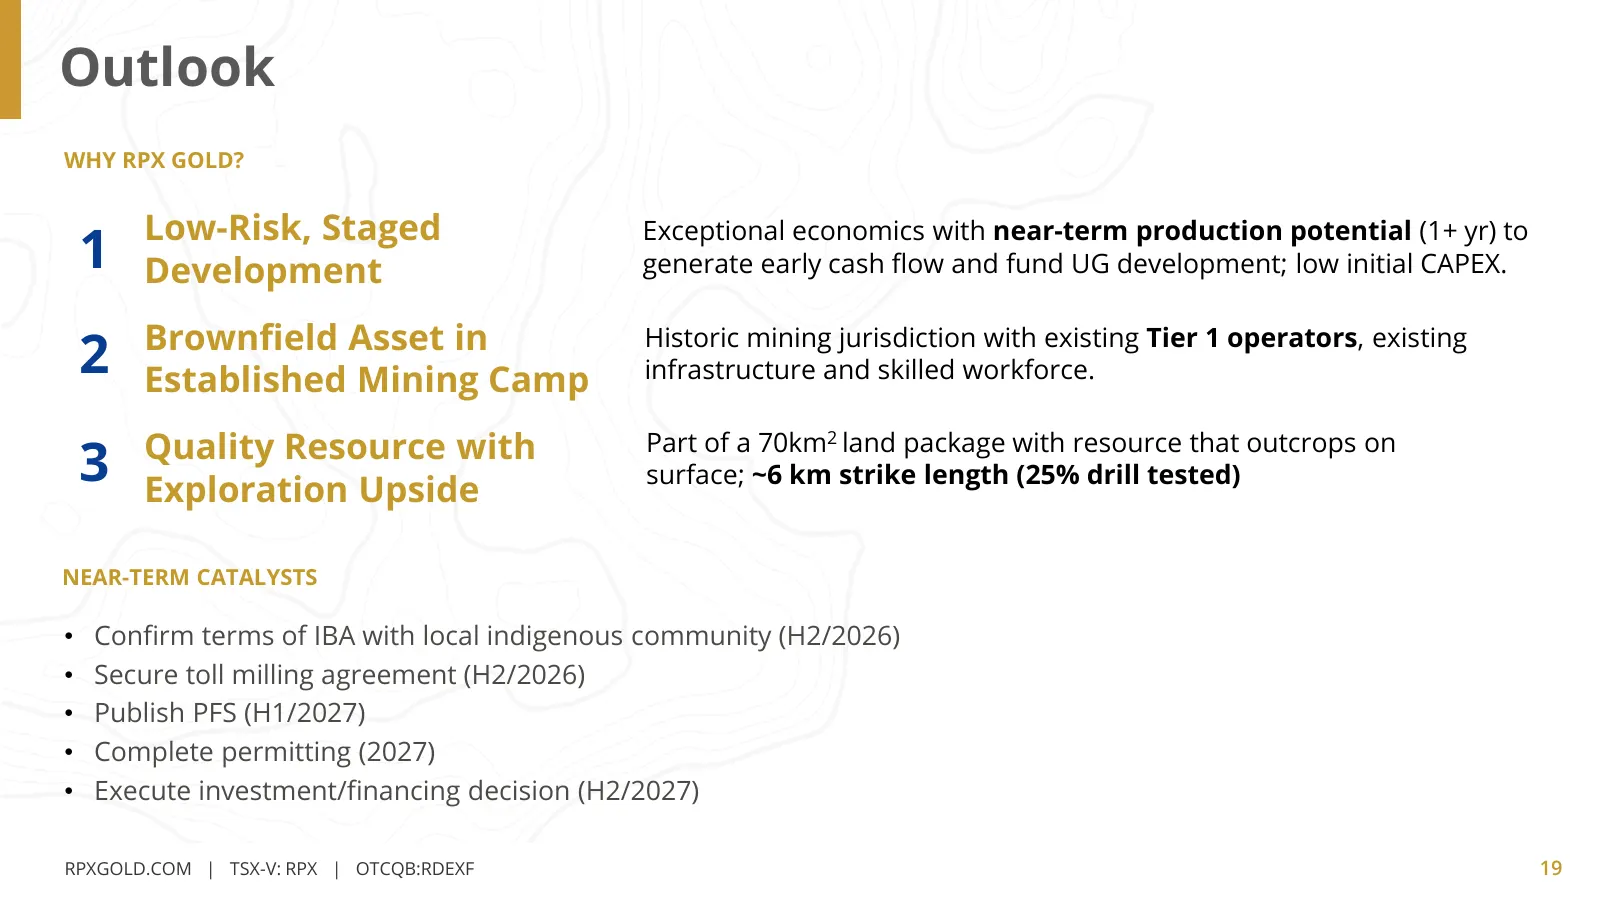
Slide 19: Outlook
Outlook WHY RPX GOLD? Low-Risk, Staged 1 Development ● Exceptional economics with near-term production potential (1+ yr) to generate early cash flow and fund UG development; low initial CAPEX. 2 Brownfield Asset in Established Mining Camp ● Historic mining jurisdiction with existing Tier 1 operators
Slide 20: Contact Us
TSX-V: RPX | OTCQB:RDEXF Contact Us Michael Michaud Manish Grigo Target IR President & CEO Corporate Development Investor Relations mmichaud@rpxgold.com (Consultant) info@rpxgold.com 416-364-7024 mgrigo@rpxgold.com 416-569-3292 Corporate Office 372 Bay Street, Suite 1702 Toronto, ON M5H 2W9, Canada
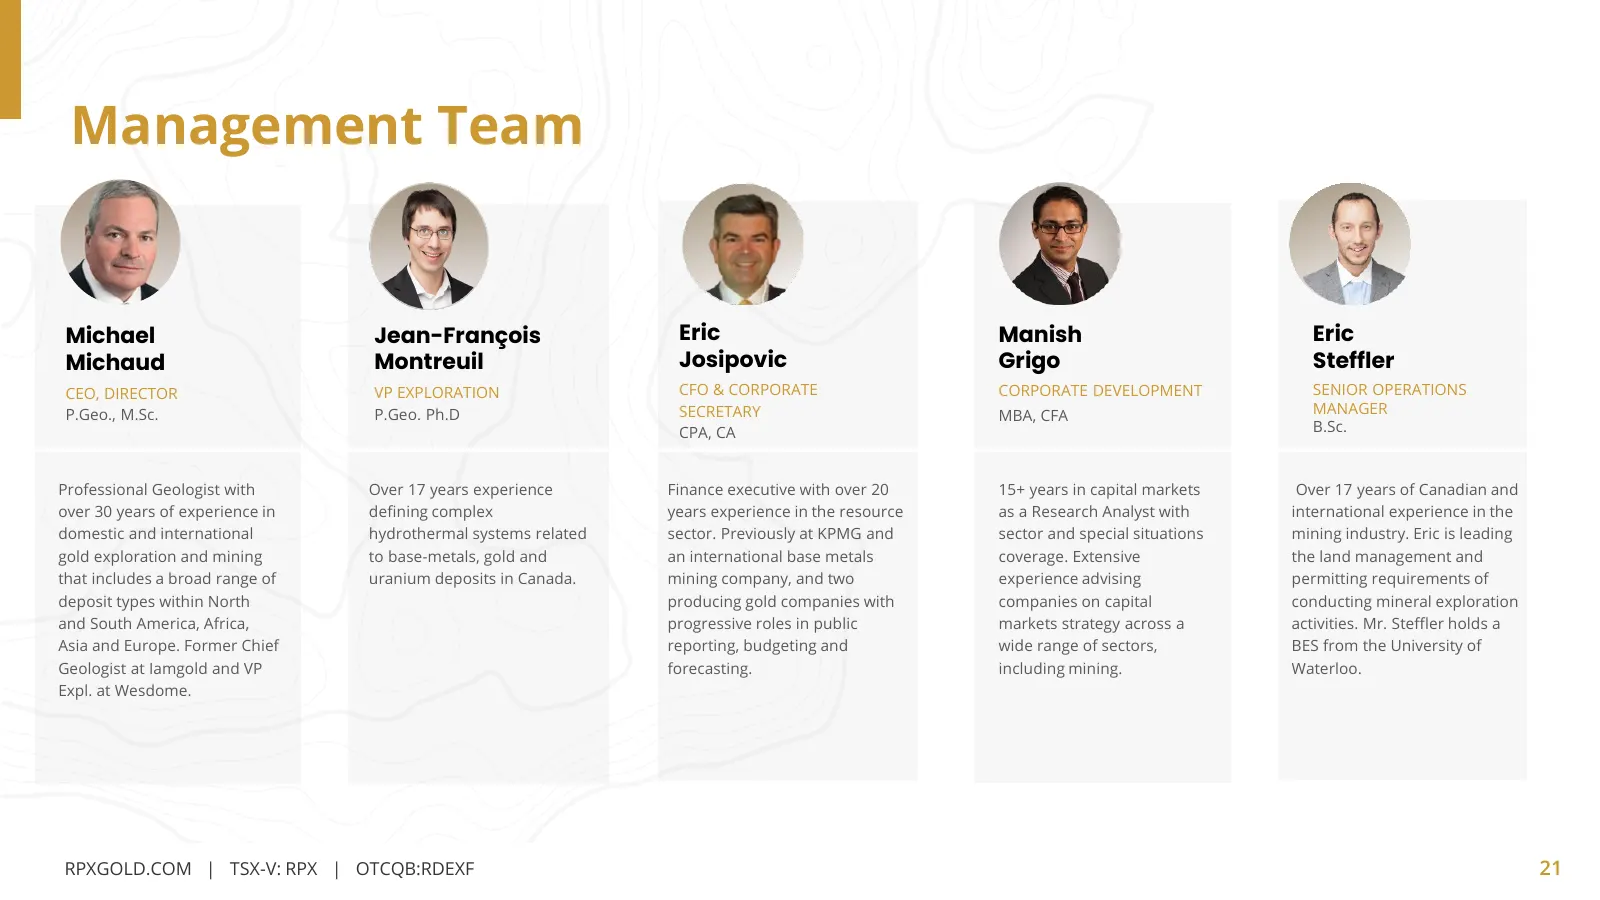
Slide 21: Management Team
Management Team Michael Jean-François Eric Manish Eric Michaud Montreuil Josipovic Grigo Steffler CEO, DIRECTOR VP EXPLORATION CFO & CORPORATE CORPORATE DEVELOPMENT SENIOR OPERATIONS P.Geo., M.Sc. P.Geo. Ph.D SECRETARY MBA, CFA MANAGER CPA, CA B.Sc. Professional Geologist with Over 17 years experien
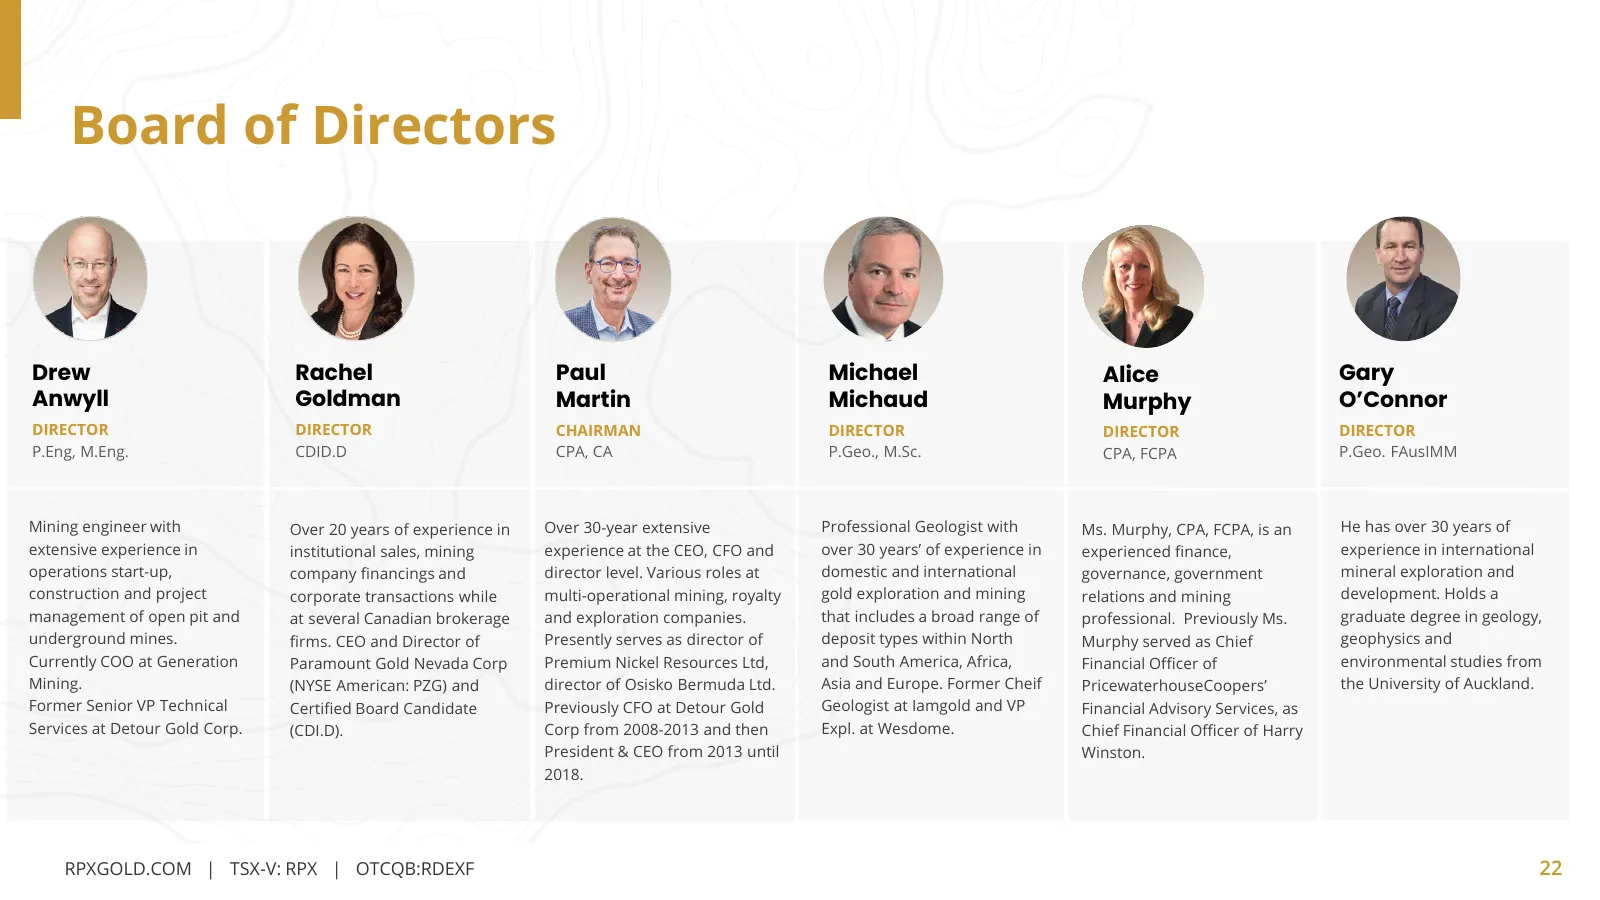
Slide 22: Board of Directors
Board of Directors Drew Rachel Paul Michael Alice Gary Anwyll Goldman Martin Michaud Murphy O’Connor DIRECTOR DIRECTOR CHAIRMAN DIRECTOR DIRECTOR DIRECTOR P.Eng, M.Eng. CDID.D CPA, CA P.Geo., M.Sc. CPA, FCPA P.Geo. FAusIMM Mining engineer with Over 20 years of experience in Over 30-year extensive Pr
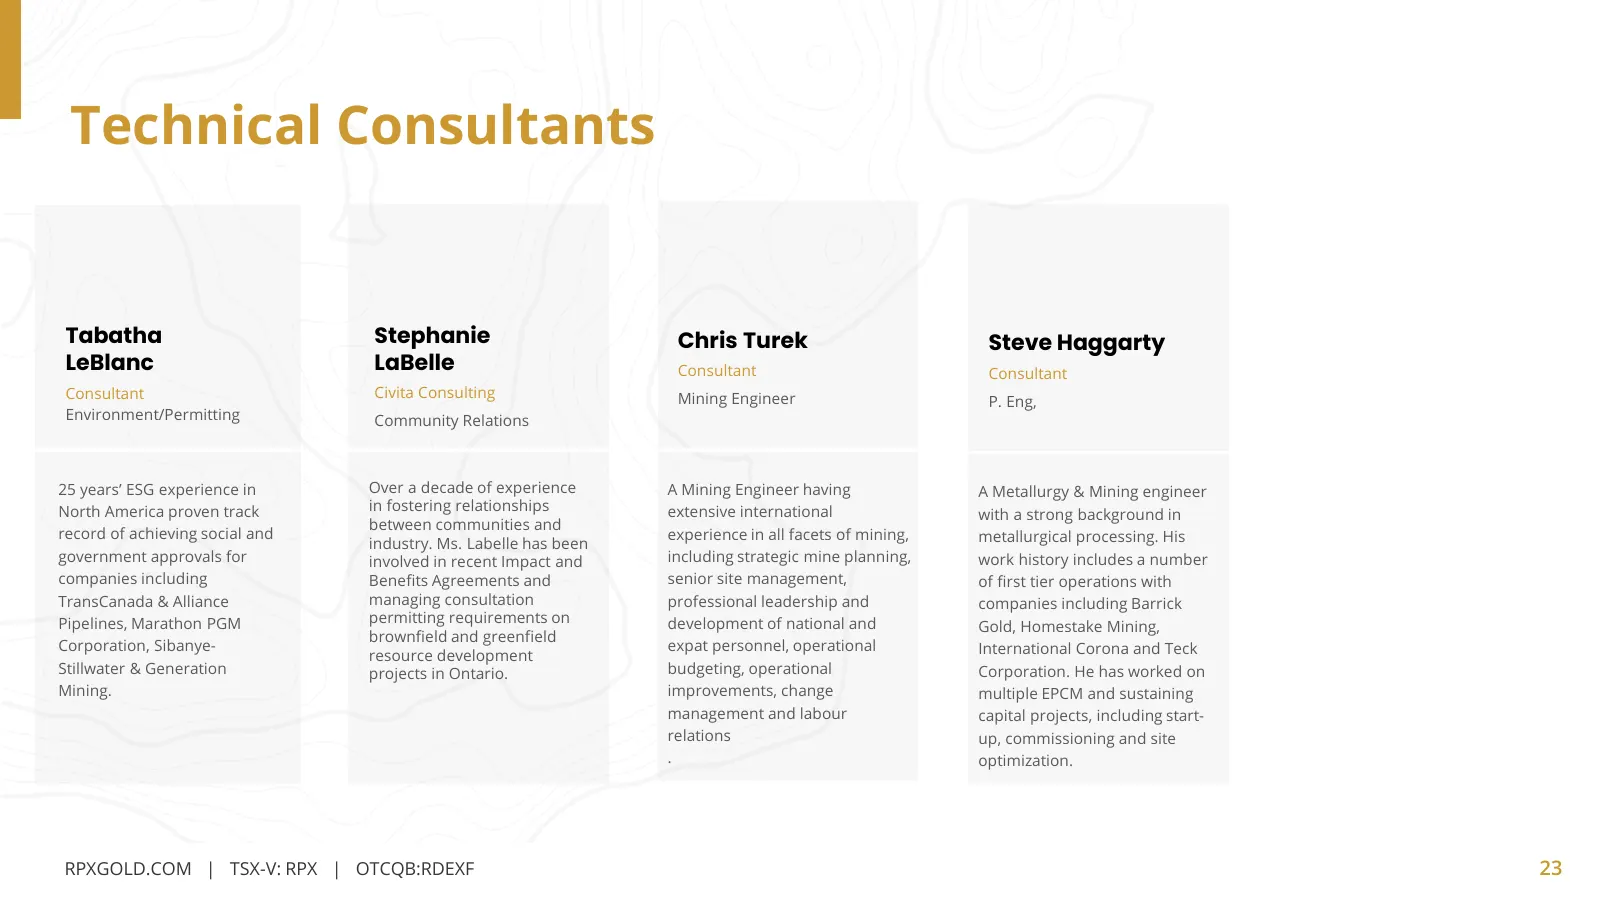
Slide 23: Technical Consultants
Technical Consultants Tabatha Stephanie Chris Turek Steve Haggarty LeBlanc LaBelle Consultant Consultant Consultant Civita Consulting Mining Engineer P. Eng, Environment/Permitting Community Relations 25 years’ ESG experience in Over a decade of experience A Mining Engineer having A Metallurgy & Min
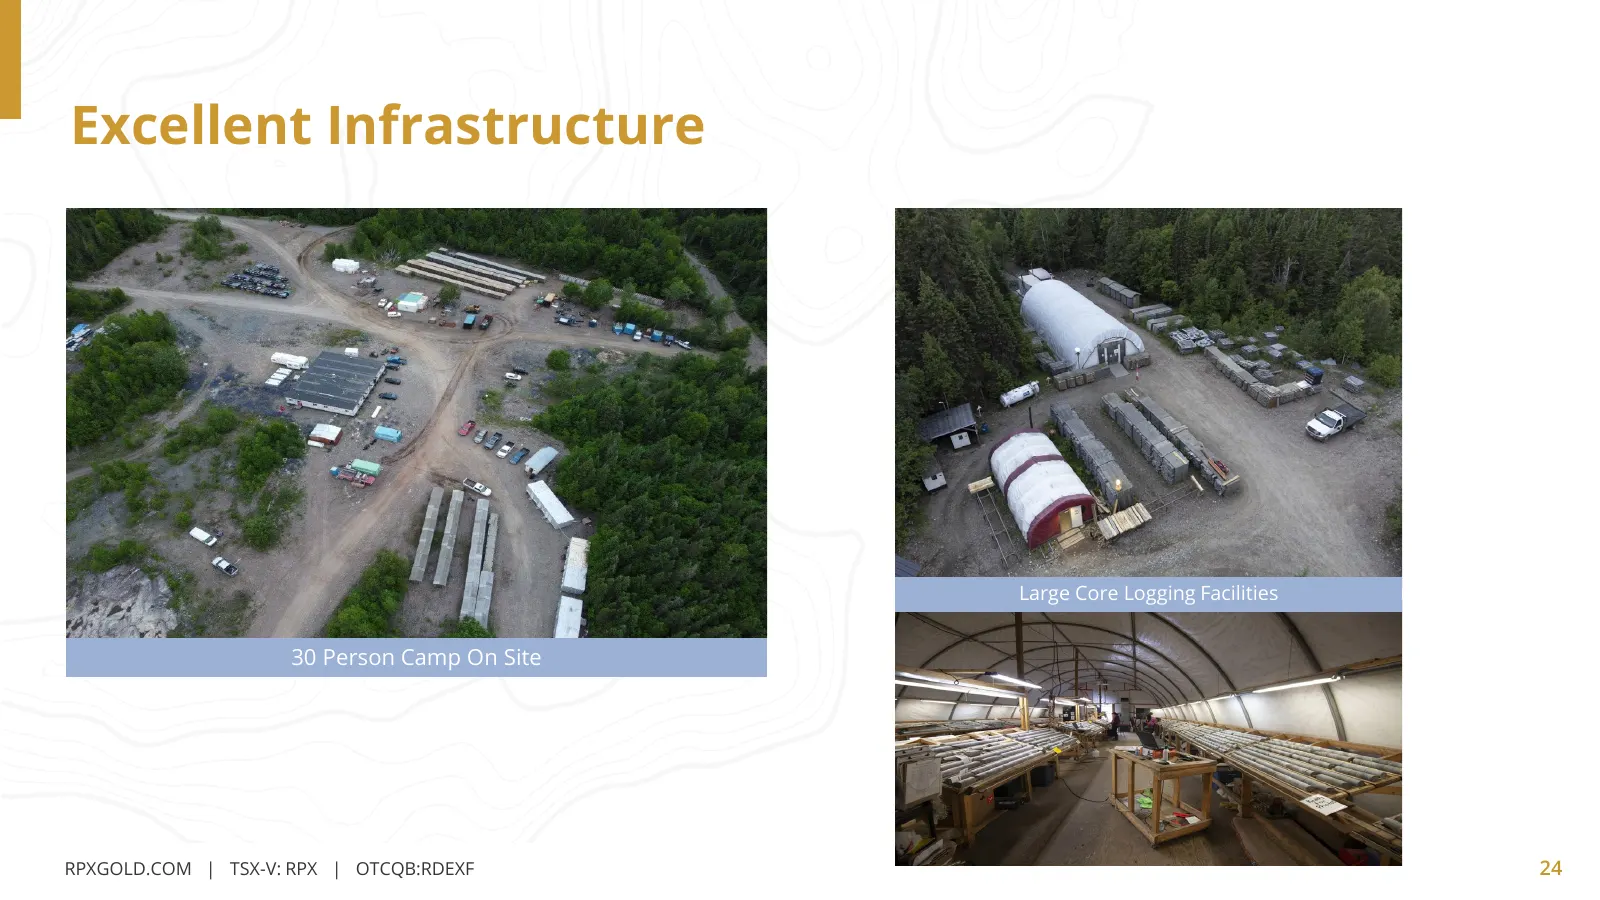
Slide 24: Excellent Infrastructure
Excellent Infrastructure Large Core Logging Facilities 30 Person Camp On Site RPXGOLD.COM | TSX-V: RPX | OTCQB:RDEXP RPXGOLD.COM | TSX-V: RPX | OTCQB:RDEXF 24
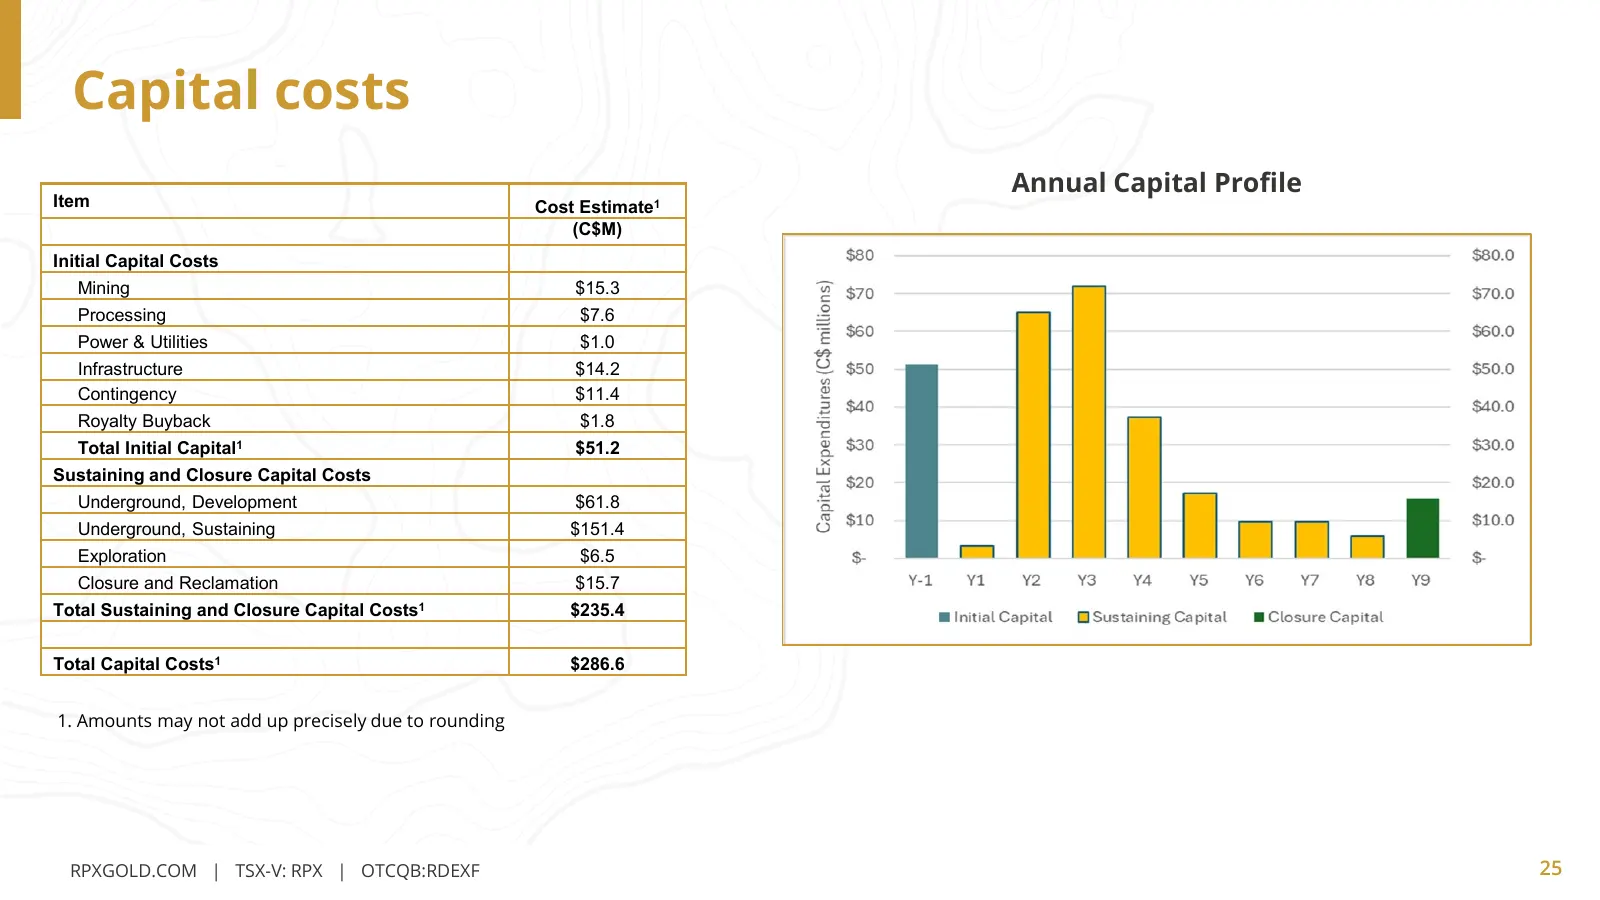
Slide 25: Capital costs
Capital costs Annual Capital Profile Item Cost Estimate1 (C$M) Initial Capital Costs Mining $15.3 Processing $7.6 Power & Utilities $1.0 Infrastructure $14.2 Contingency $11.4 Royalty Buyback $1.8 Total Initial Capital1 $51.2 Sustaining and Closure Capital Costs Underground, Development $61.8 Underg
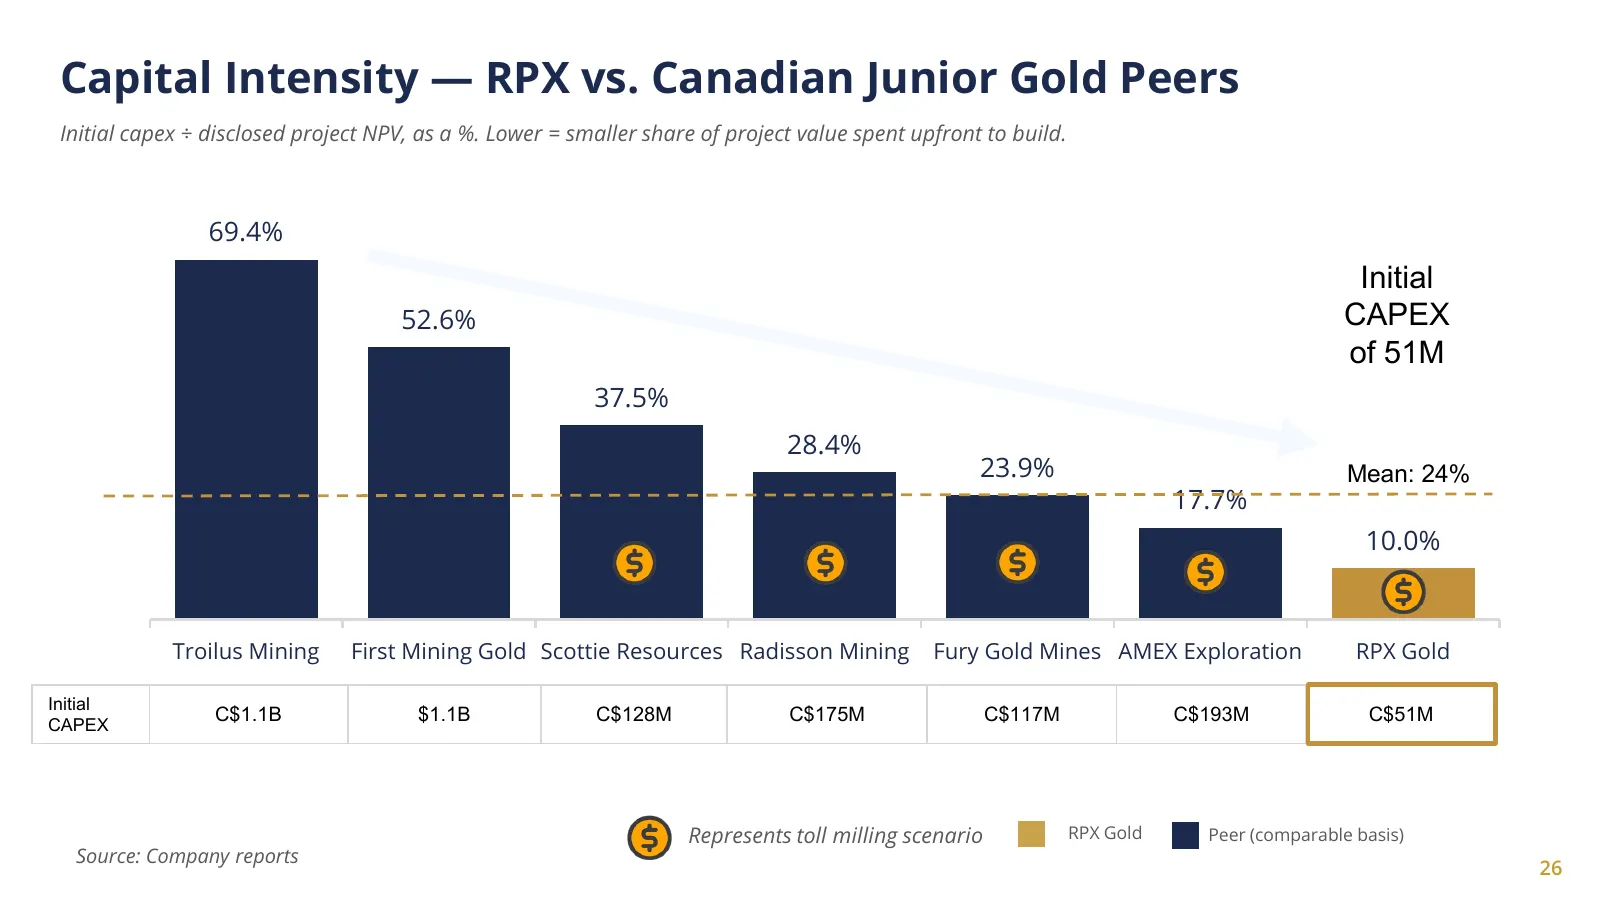
Slide 26: Capital Intensity — RPX vs. Canadian Junior Gold Peers
Capital Intensity — RPX vs. Canadian Junior Gold Peers Initial capex ÷ disclosed project NPV, as a %. Lower = smaller share of project value spent upfront to build. 69.4% Initial 52.6% CAPEX of 51M 37.5% 28.4% 23.9% Mean: 24% 17.7% 10.0% Troilus Mining First Mining Gold Scottie Resources Radisson Mi
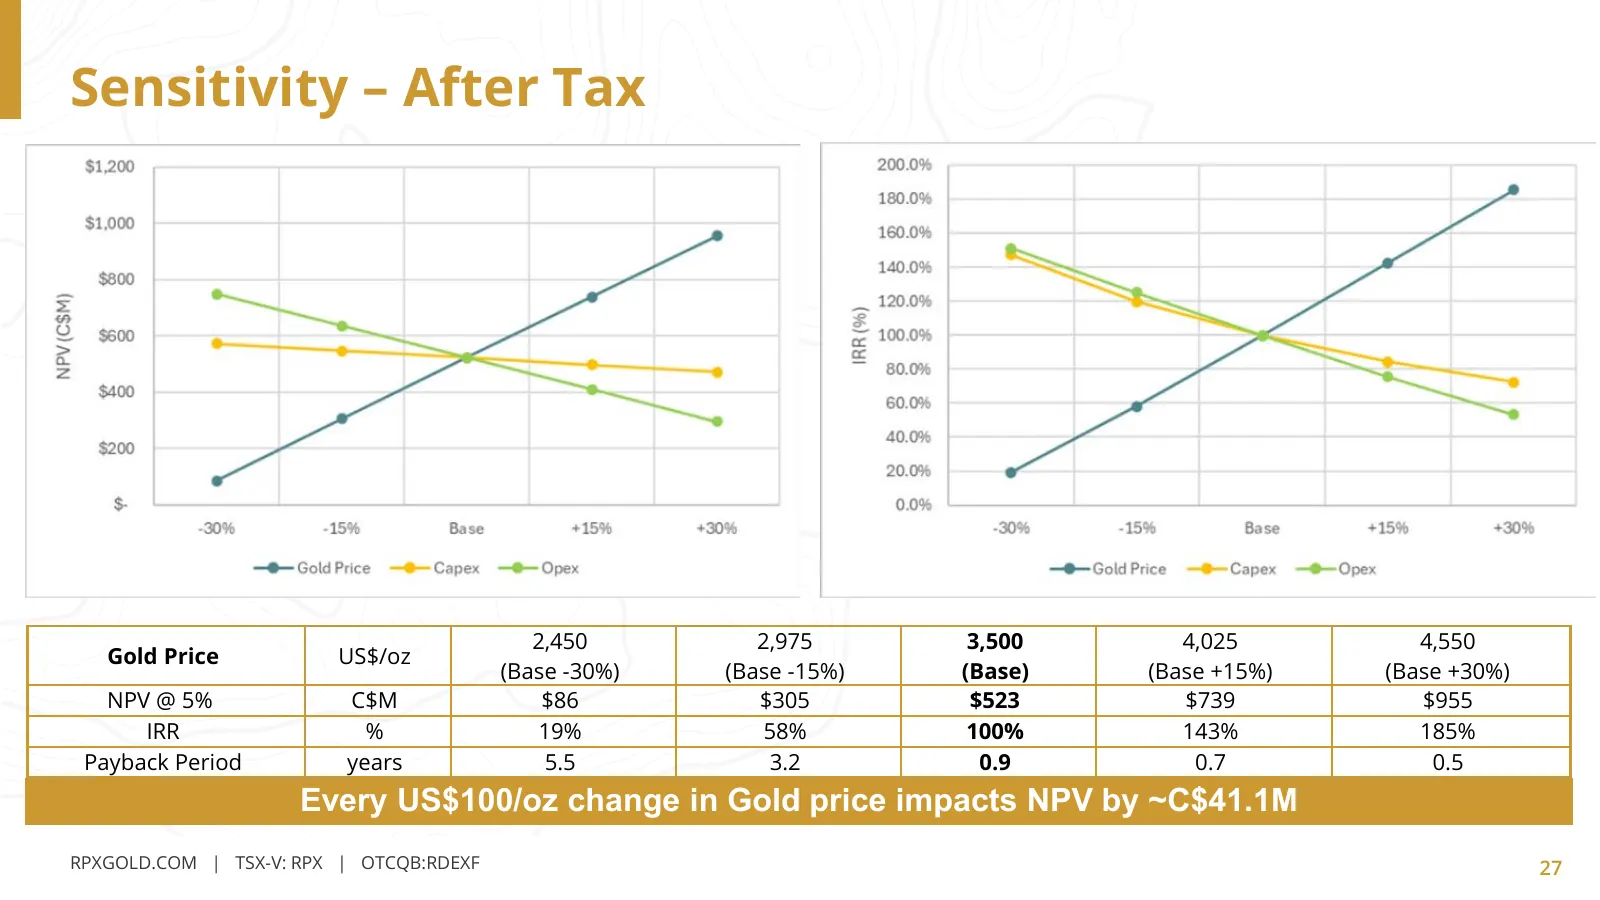
Slide 27: Sensitivity – After Tax
Sensitivity – After Tax 2,450 2,975 3,500 4,025 4,550 Gold Price US$/oz (Base -30%) (Base -15%) (Base) (Base +15%) (Base +30%) NPV @ 5% C$M $86 $305 $523 $739 $955 IRR % 19% 58% 100% 143% 185% Payback Period years 5.5 3.2 0.9 0.7 0.5 Every US$100/oz change in Gold price impacts NPV by ~C$41.1M RPXGO
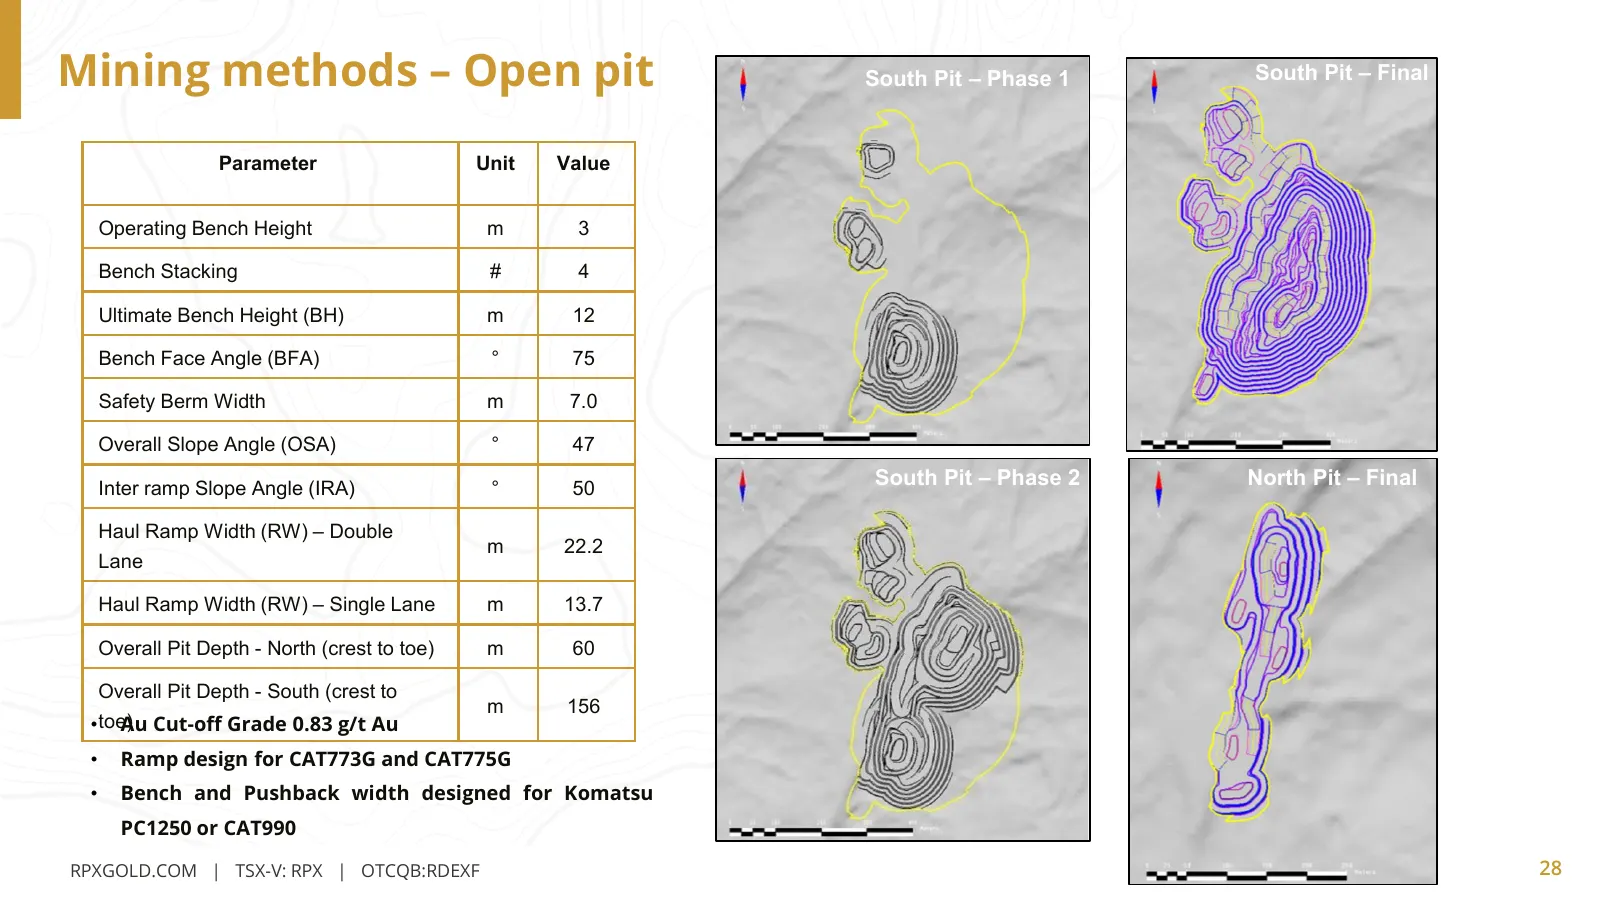
Slide 28: Mining methods – Open pit
Mining methods – Open pit South Pit – Phase 1 South Pit – Final Parameter Unit Value Operating Bench Height m 3 Bench Stacking # 4 Ultimate Bench Height (BH) m 12 Bench Face Angle (BFA) ° 75 Safety Berm Width m 7.0 Overall Slope Angle (OSA) ° 47 Inter ramp Slope Angle (IRA) ° 50 South Pit – Phase 2
Slide 29: Mining methods – Underground
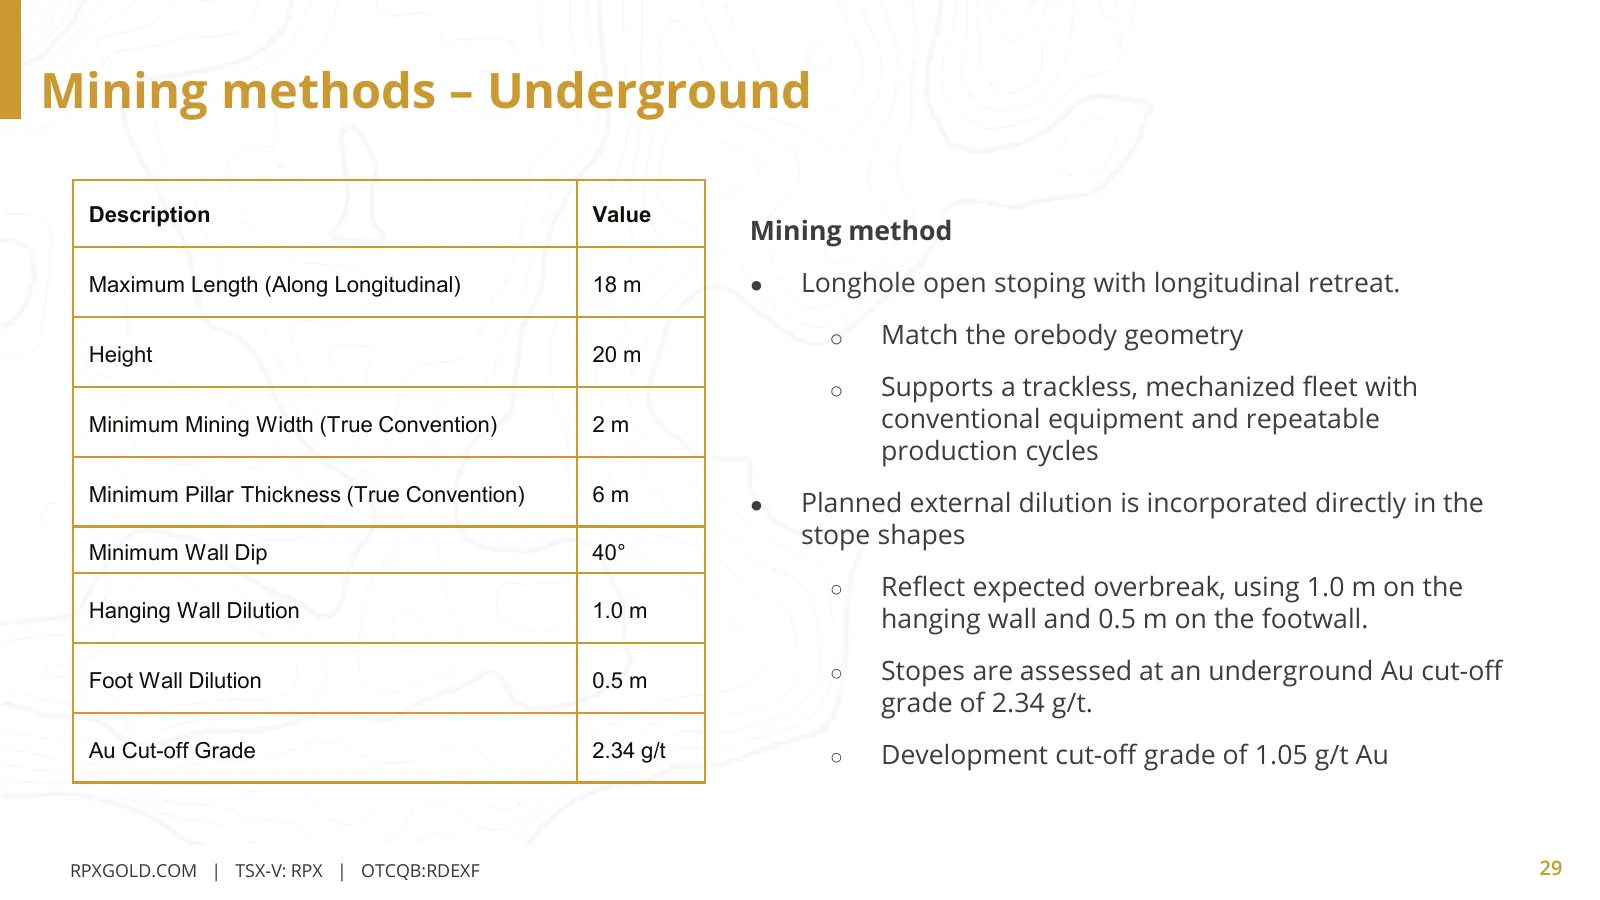
Mining methods – Underground Description Value Mining method Maximum Length (Along Longitudinal) 18 m ● Longhole open stoping with longitudinal retreat. o Match the orebody geometry Height 20 m o Supports a trackless, mechanized fleet with Minimum Mining Width (True Convention) 2m conventional equip
Slide 30: Underground Mine Plan
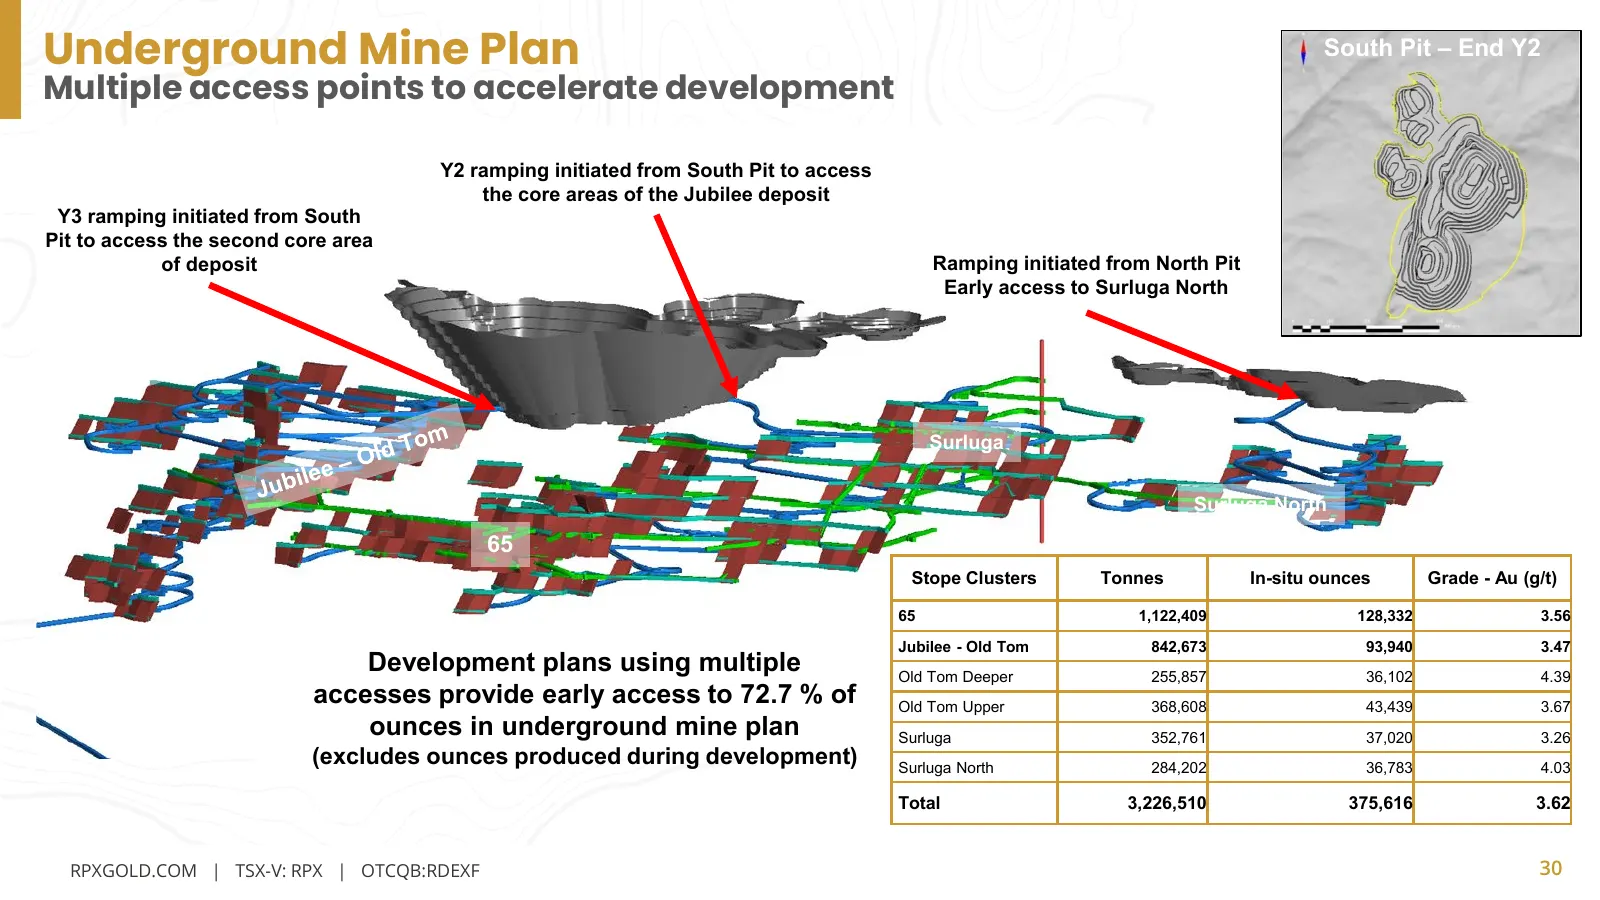
Underground Mine Plan South Pit – End Y2 Multiple access points to accelerate development Y2 ramping initiated from South Pit to access the core areas of the Jubilee deposit Y3 ramping initiated from South Pit to access the second core area of deposit Ramping initiated from North Pit Early access to
Slide 31: Metallurgical Testing
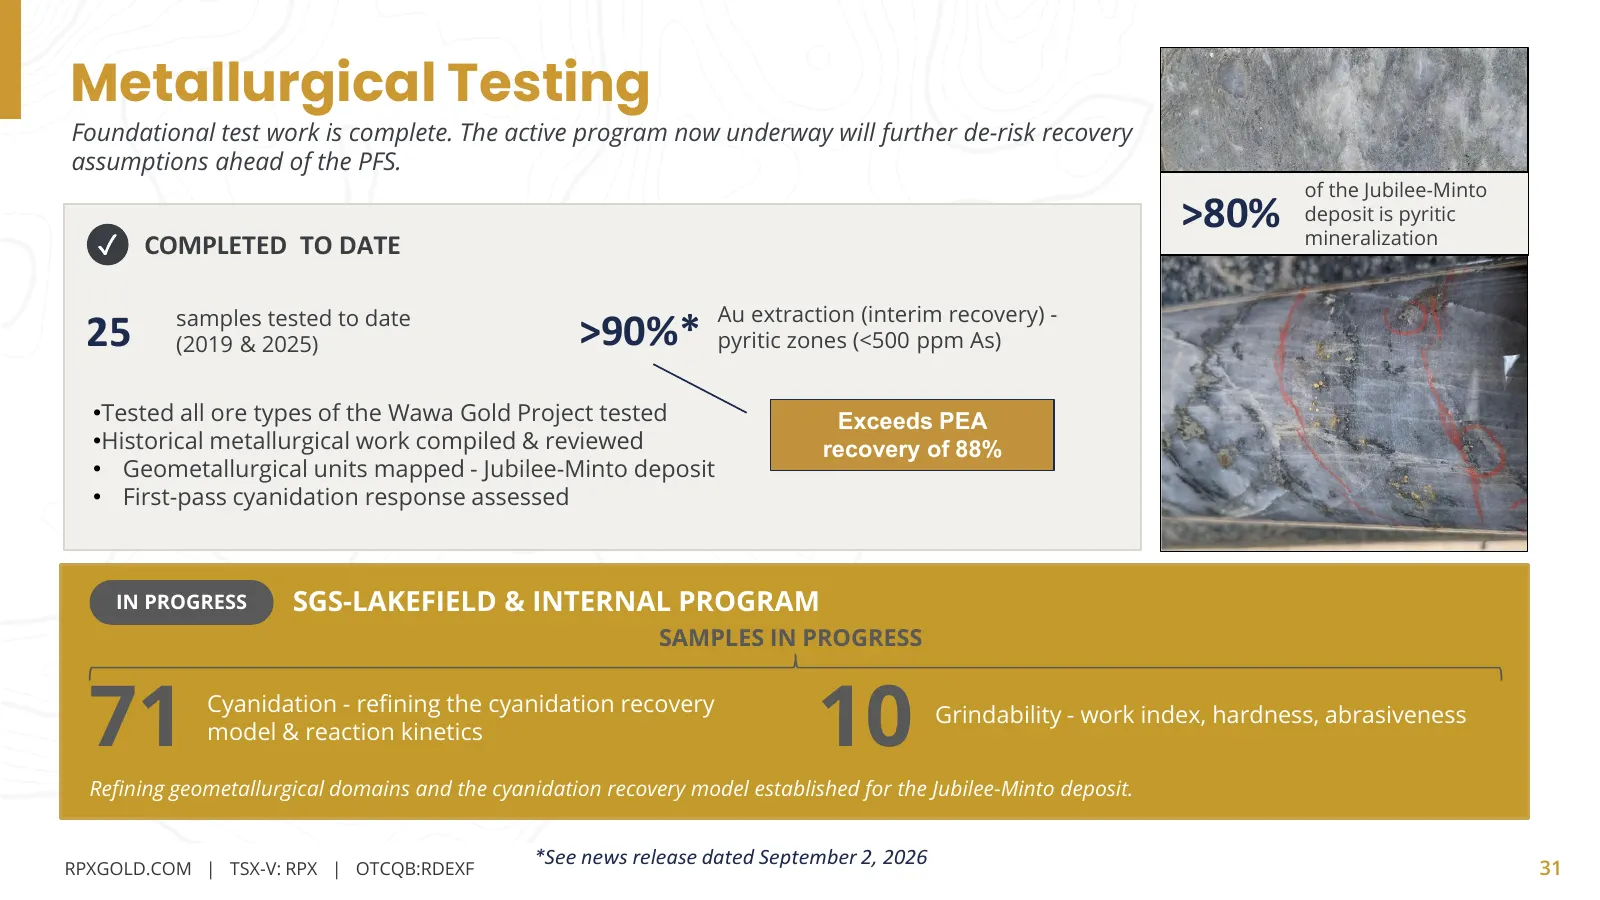
Metallurgical Testing Foundational test work is complete. The active program now underway will further de-risk recovery assumptions ahead of the PFS. of the Jubilee-Minto >80% deposit is pyritic ✓ COMPLETED TO DATE mineralization >90%* pyritic zones (<500 ppm As) Au extraction (interim recovery) - 2
Slide 32: Jubilee-Cooper – Exploration target
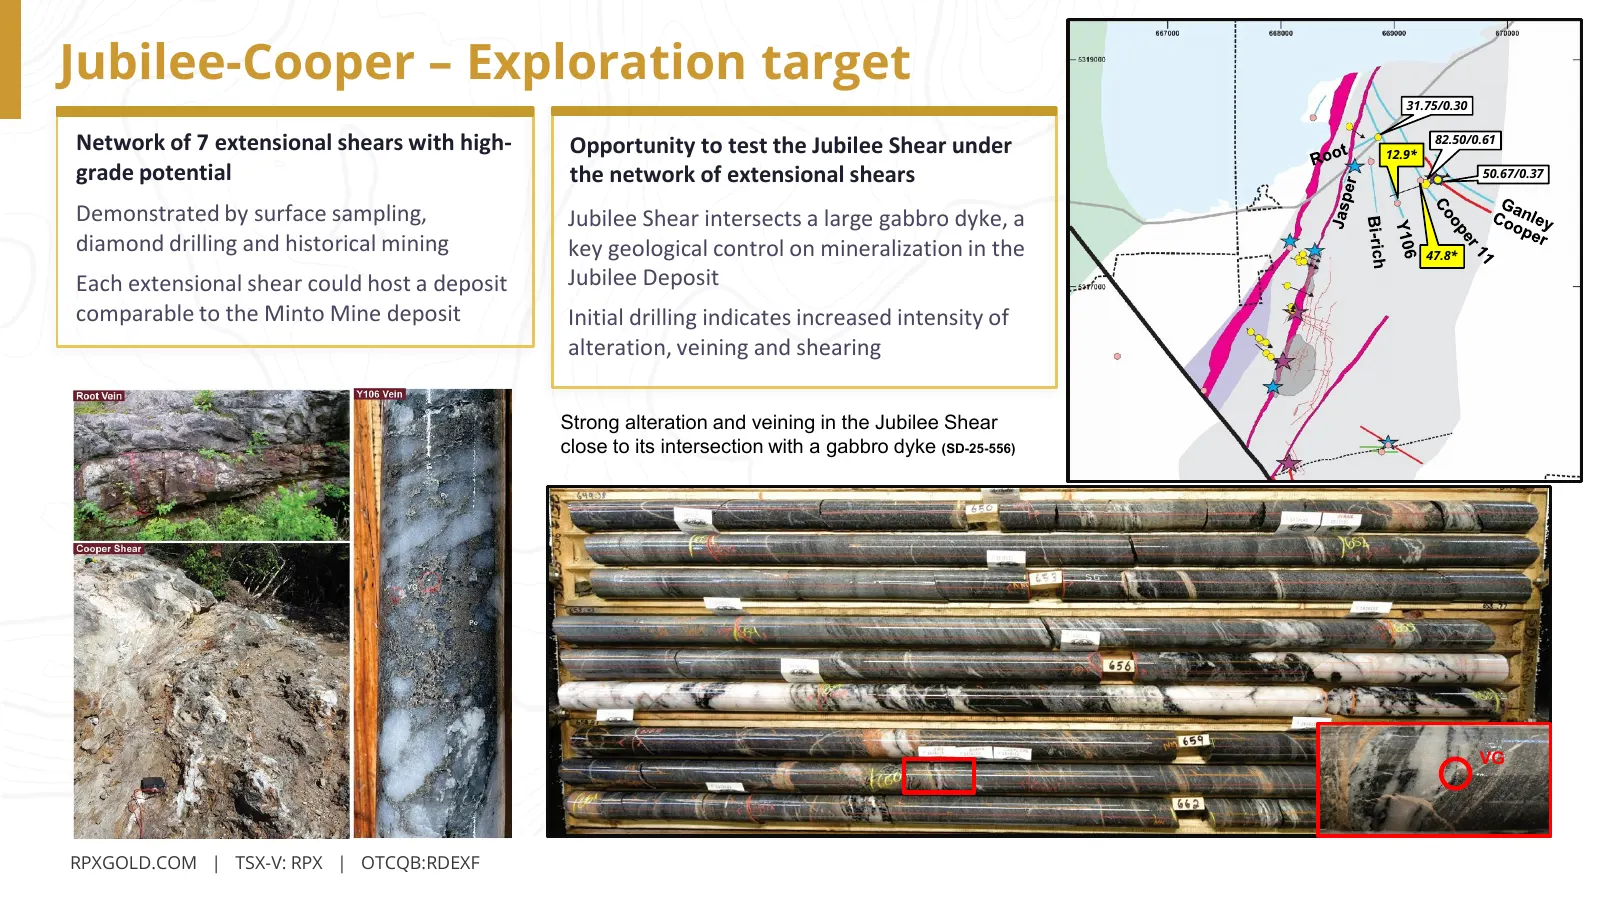
Jubilee-Cooper – Exploration target 31.75/0.30 Network of 7 extensional shears with high- Opportunity to test the Jubilee Shear under 12.9* 82.50/0.61 grade potential the network of extensional shears 50.67/0.37 Demonstrated by surface sampling, Jubilee Shear intersects a large gabbro dyke, a diamon
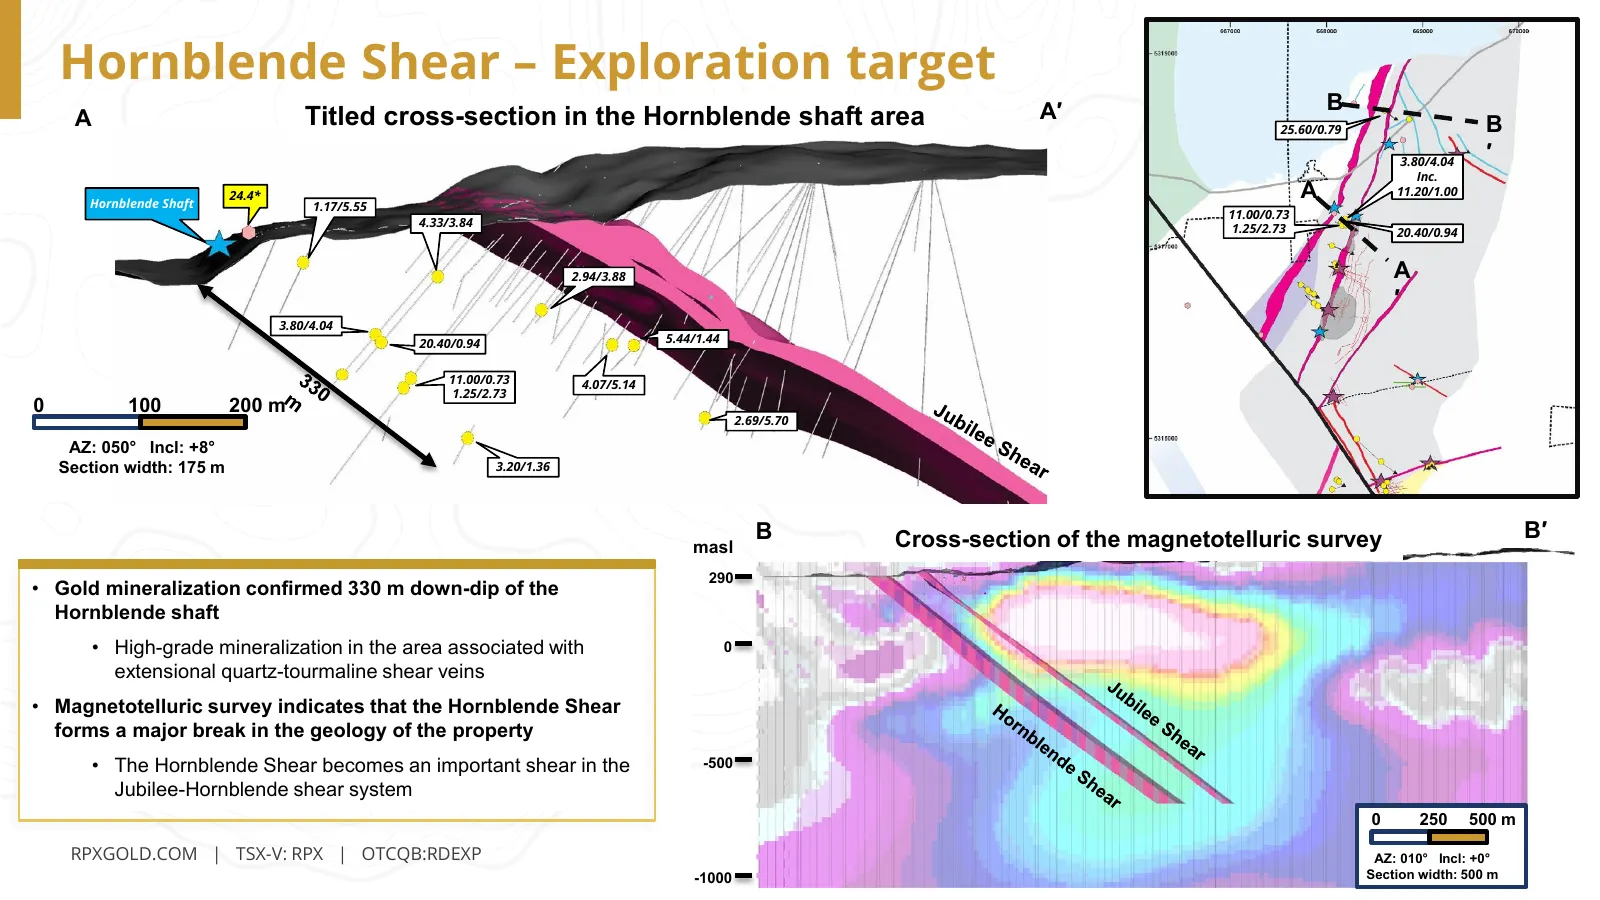
Slide 33: Hornblende Shear – Exploration target
Hornblende Shear – Exploration target A′ B A Titled cross-section in the Hornblende shaft area 25.60/0.79 B 3.80/4.04 ′ Inc. Hornblende Shaft 24.4* A 11.20/1.00 1.17/5.55 11.00/0.73 4.33/3.84 1.25/2.73 20.40/0.94 2.94/3.88 A ′ 3.80/4.04 20.40/0.94 5.44/1.44 11.00/0.73 4.07/5.14 1.25/2.73 0 100 200 m
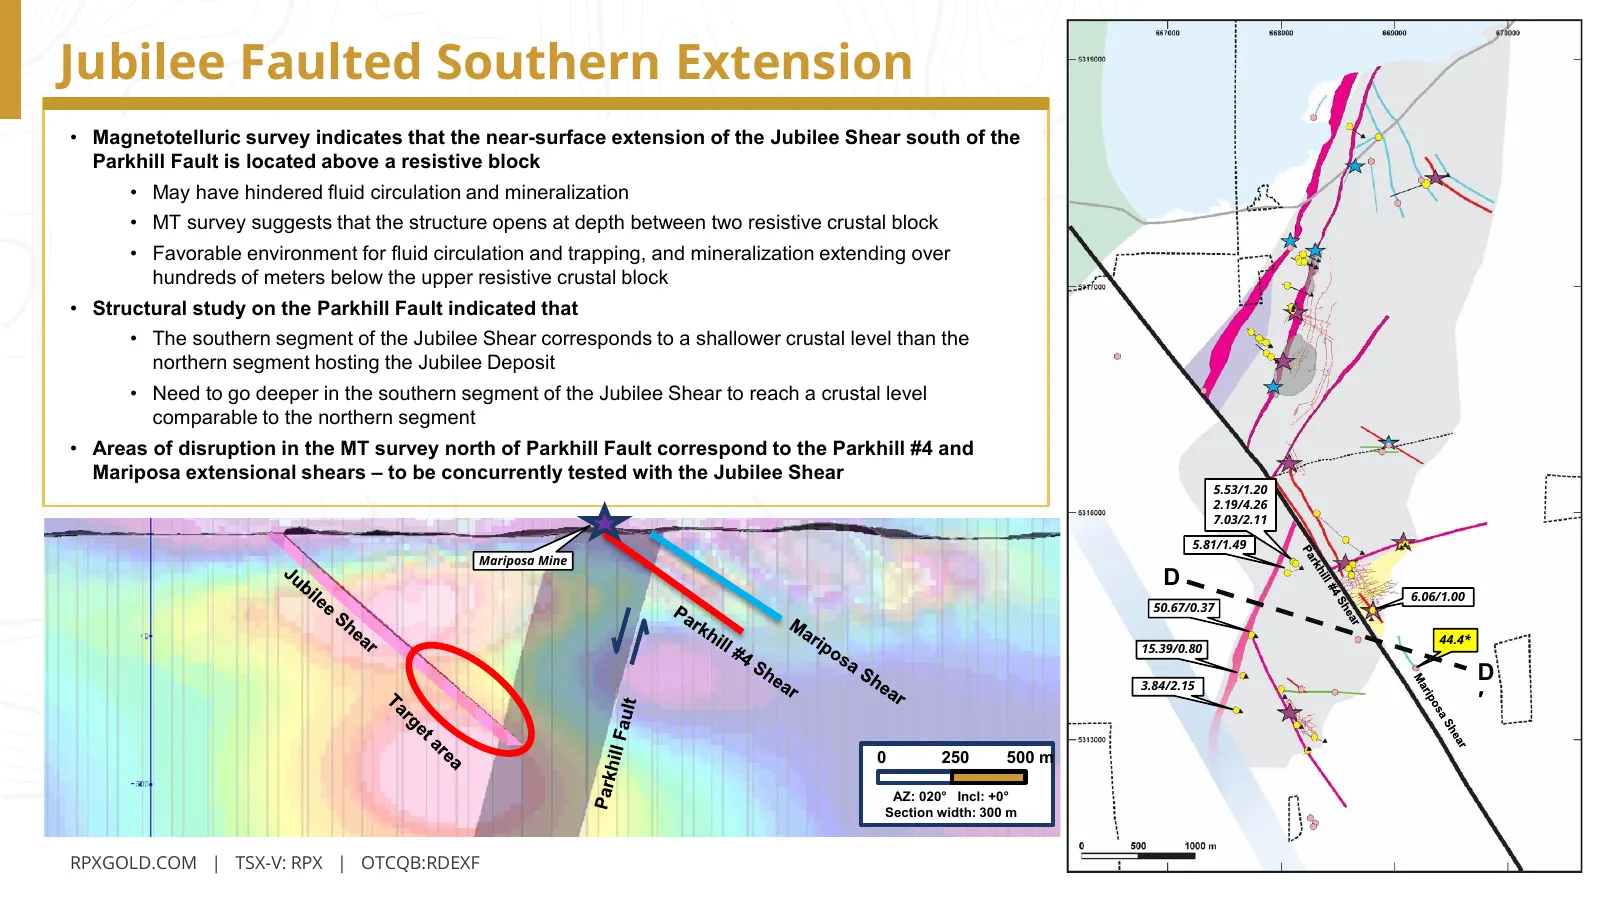
Slide 34: Jubilee Faulted Southern Extension
Jubilee Faulted Southern Extension • Magnetotelluric survey indicates that the near-surface extension of the Jubilee Shear south of the Parkhill Fault is located above a resistive block • May have hindered fluid circulation and mineralization • MT survey suggests that the structure opens at depth be
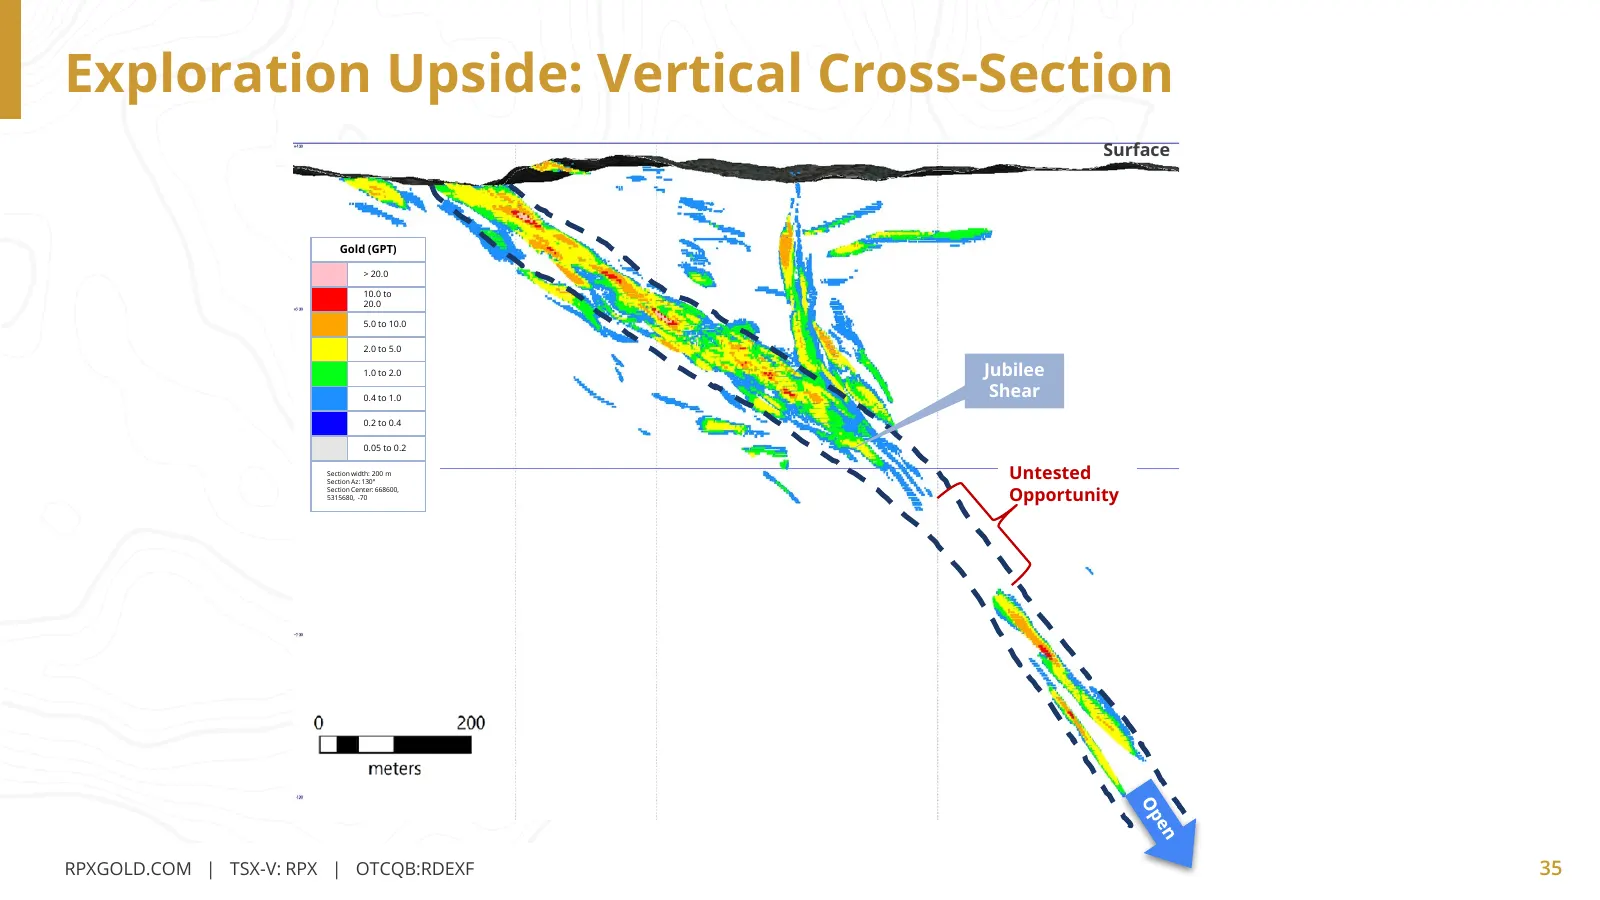
Slide 35: Exploration Upside: Vertical Cross-Section
Exploration Upside: Vertical Cross-Section Surface Gold (GPT) > 20.0 10.0 to 20.0 5.0 to 10.0 2.0 to 5.0 1.0 to 2.0 Jubilee 0.4 to 1.0 Shear 0.2 to 0.4 0.05 to 0.2 Section width: 200 m Section Az: 130° Untested Section Center: 668600, 5315680, -70 Opportunity RPXGOLD.COM | TSX-V: RPX | OTCQB:RDEXP R
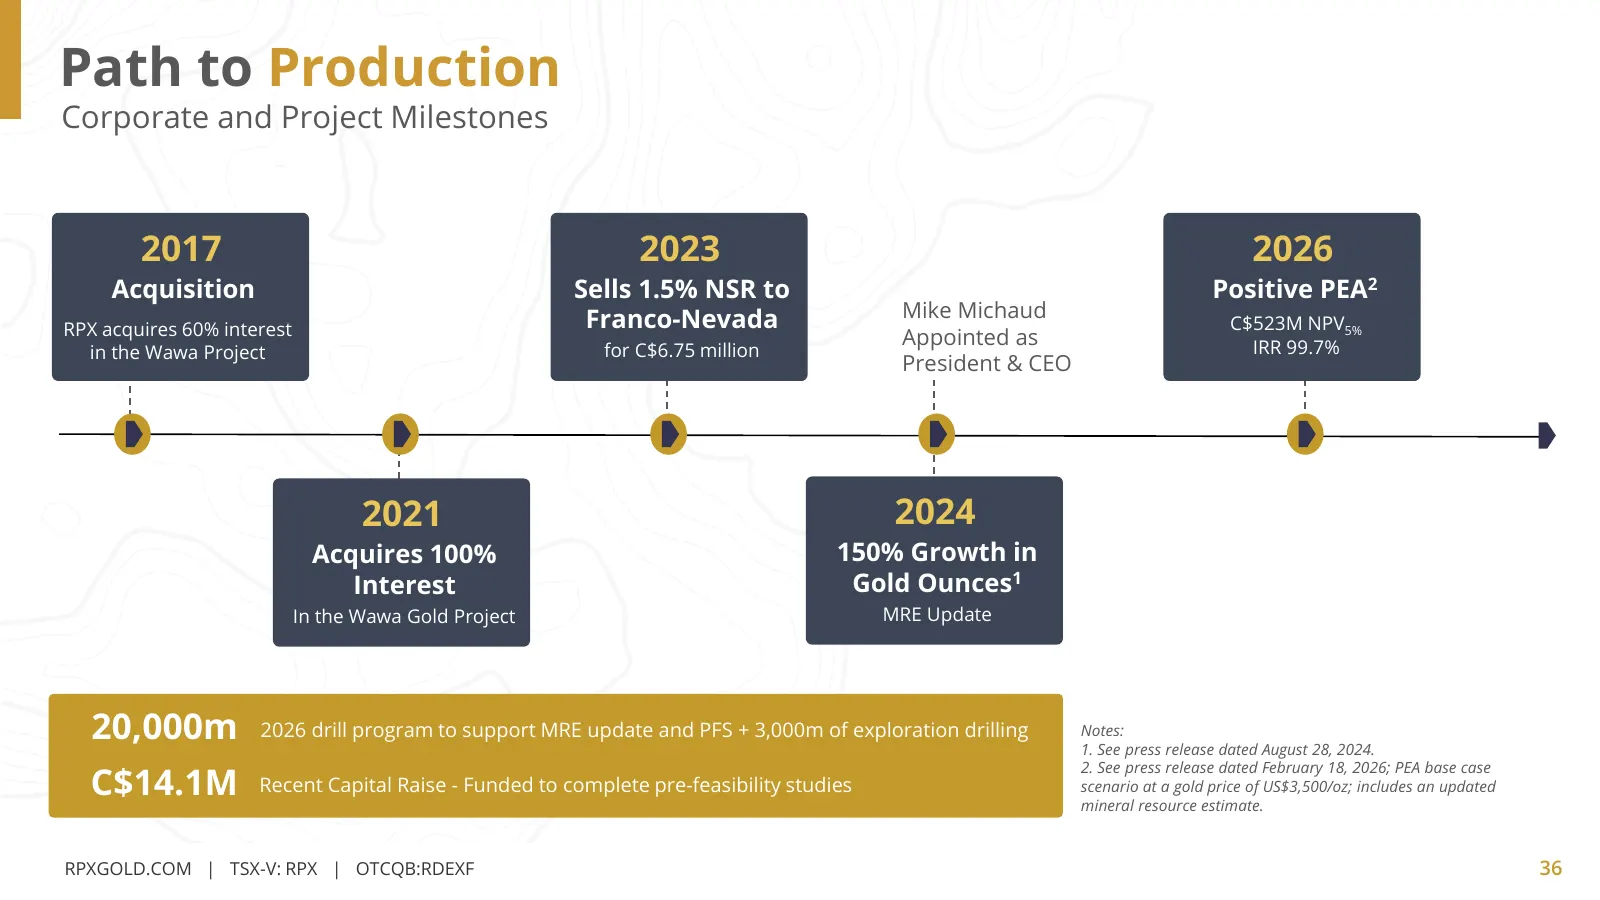
Slide 36: Path to Production
Path to Production Corporate and Project Milestones 2017 2023 2026 Acquisition Sells 1.5% NSR to Positive PEA2 Franco-Nevada Mike Michaud RPX acquires 60% interest C$523M NPV5% Appointed as IRR 99.7% in the Wawa Project for C$6.75 million President & CEO 2021 2024 Acquires 100% 150% Growth in Intere
Source: company website
More decks from RPX Gold
 Investor Presentation (September 2026)36 slides · September 2026
 Investor Presentation (February 2026)17 slides · Feb 19, 2026
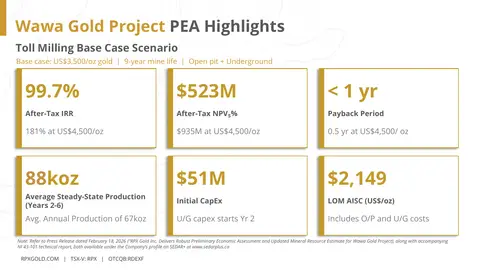 Technical Presentation (February 2026)4 slides · Feb 18, 2026
 Red Pine Exploration — Investor Presentation (July 2025)25 slides · July 2025
 Red Pine Exploration — Investor Presentation (June 2025)25 slides · June 2025
 Red Pine Exploration — Investor Presentation (May 2025)18 slides · May 2025