Barrick Mining Corporation · TSX:ABX
Barrick Mining — BMO Capital Markets Global Metals, Mining & Critical Minerals Conference 2024
18 slides from Barrick Mining's conference presentation, Feb 26, 2024

Slide 1: Delivering Value, Building Growth
…Delivering Value, Building Growth February 2024, Miami
Slide 2: Cautionary Statement on Forward-Looking Information
Cautionary Statement on Forward-Looking Information Certain information contained or incorporated by reference in this presentation, including any information as to our strategy, projects, plans or future financial or operating performance, constitutes “forward-looking statements”. All statements, o
Slide 3: About Barrick
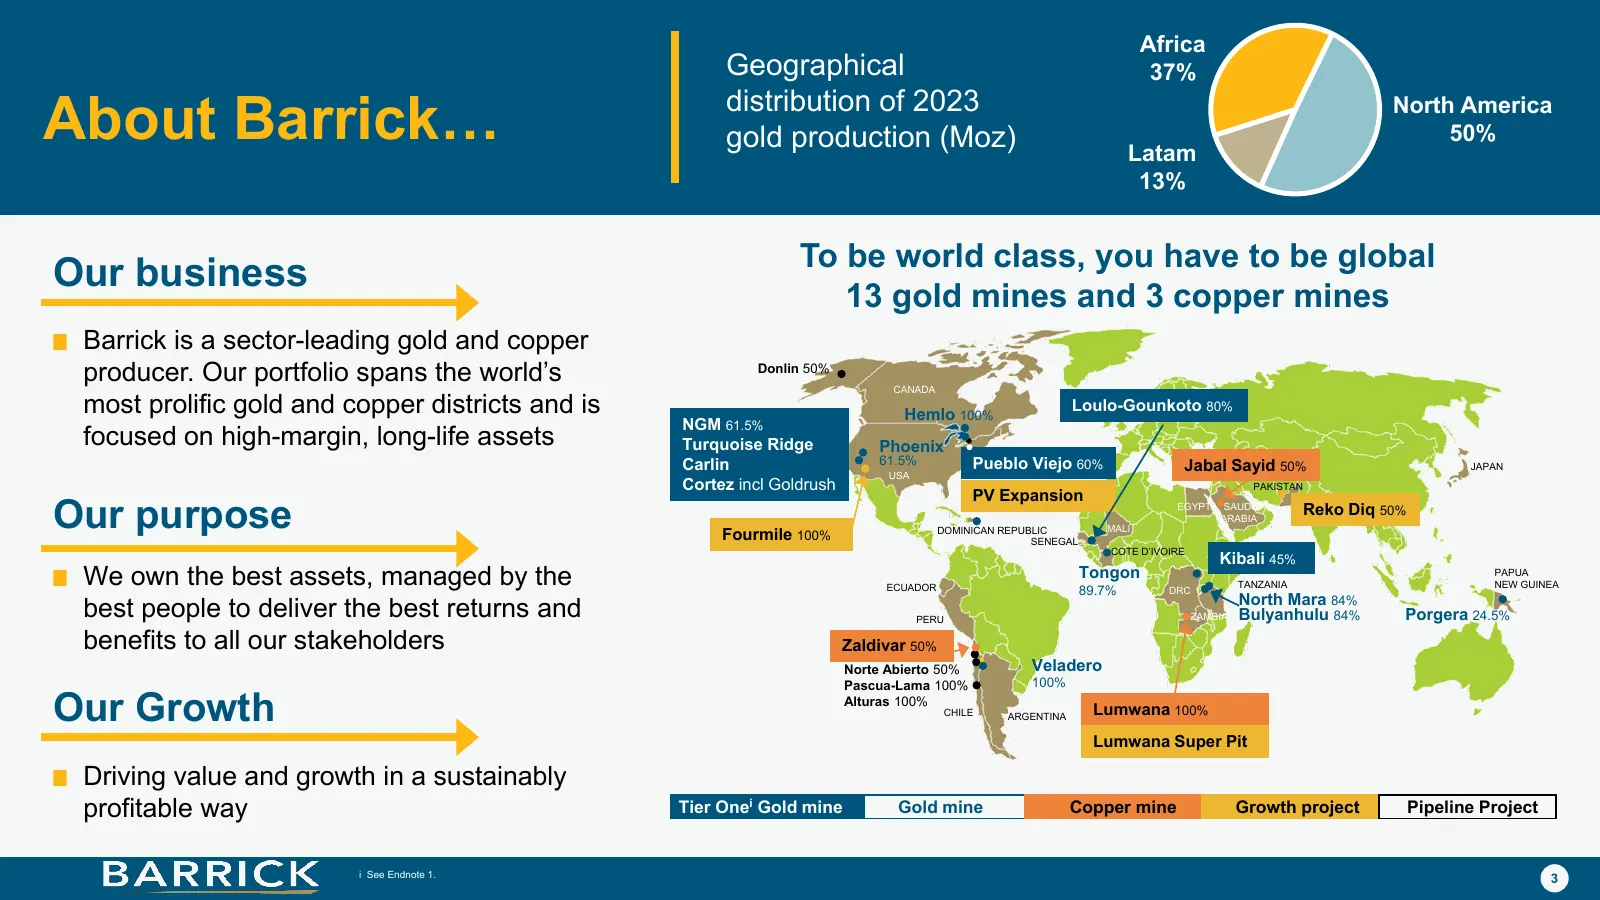
Africa Geographical 37% About Barrick… distribution of 2023 gold production (Moz) Latam North America 50% 13% To be world class, you have to be global Our business 13 gold mines and 3 copper mines Barrick is a sector-leading gold and copper producer. Our portfolio spans the world’s Donlin 50% CANADA
Slide 4: Health & Safety
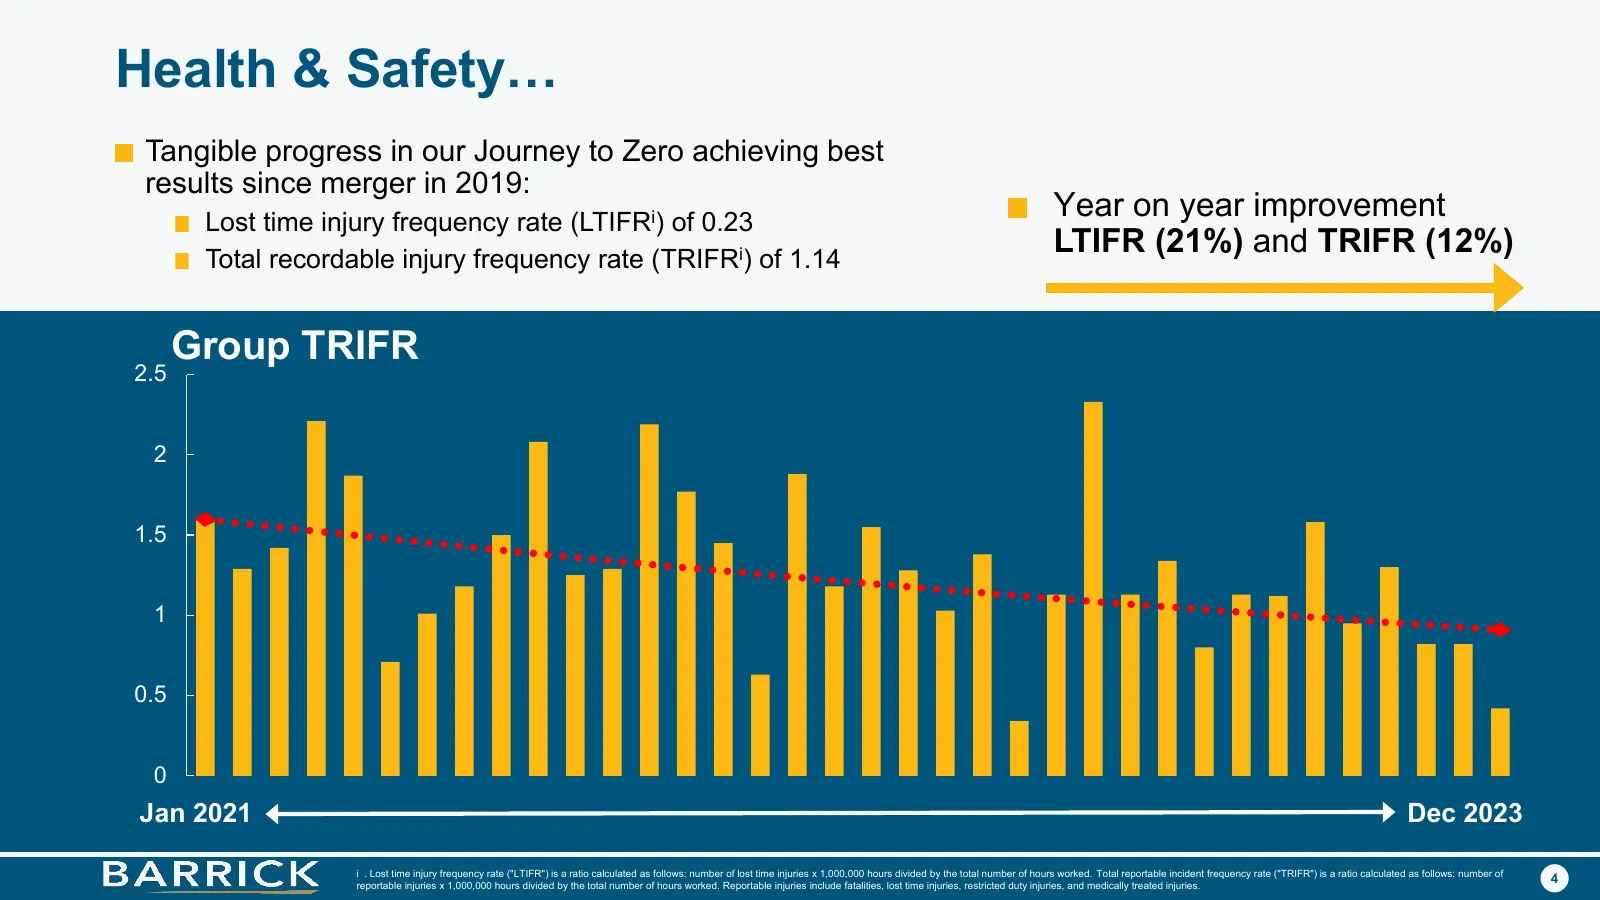
Health & Safety… Tangible progress in our Journey to Zero achieving best results since merger in 2019: Lost time injury frequency rate (LTIFRi) of 0.23 Year on year improvement Total recordable injury frequency rate (TRIFRi) of 1.14 LTIFR (21%) and TRIFR (12%) Group TRIFR 2.5 2 1.5 1 0.5 0 Jan 20
Slide 5: Sustainability
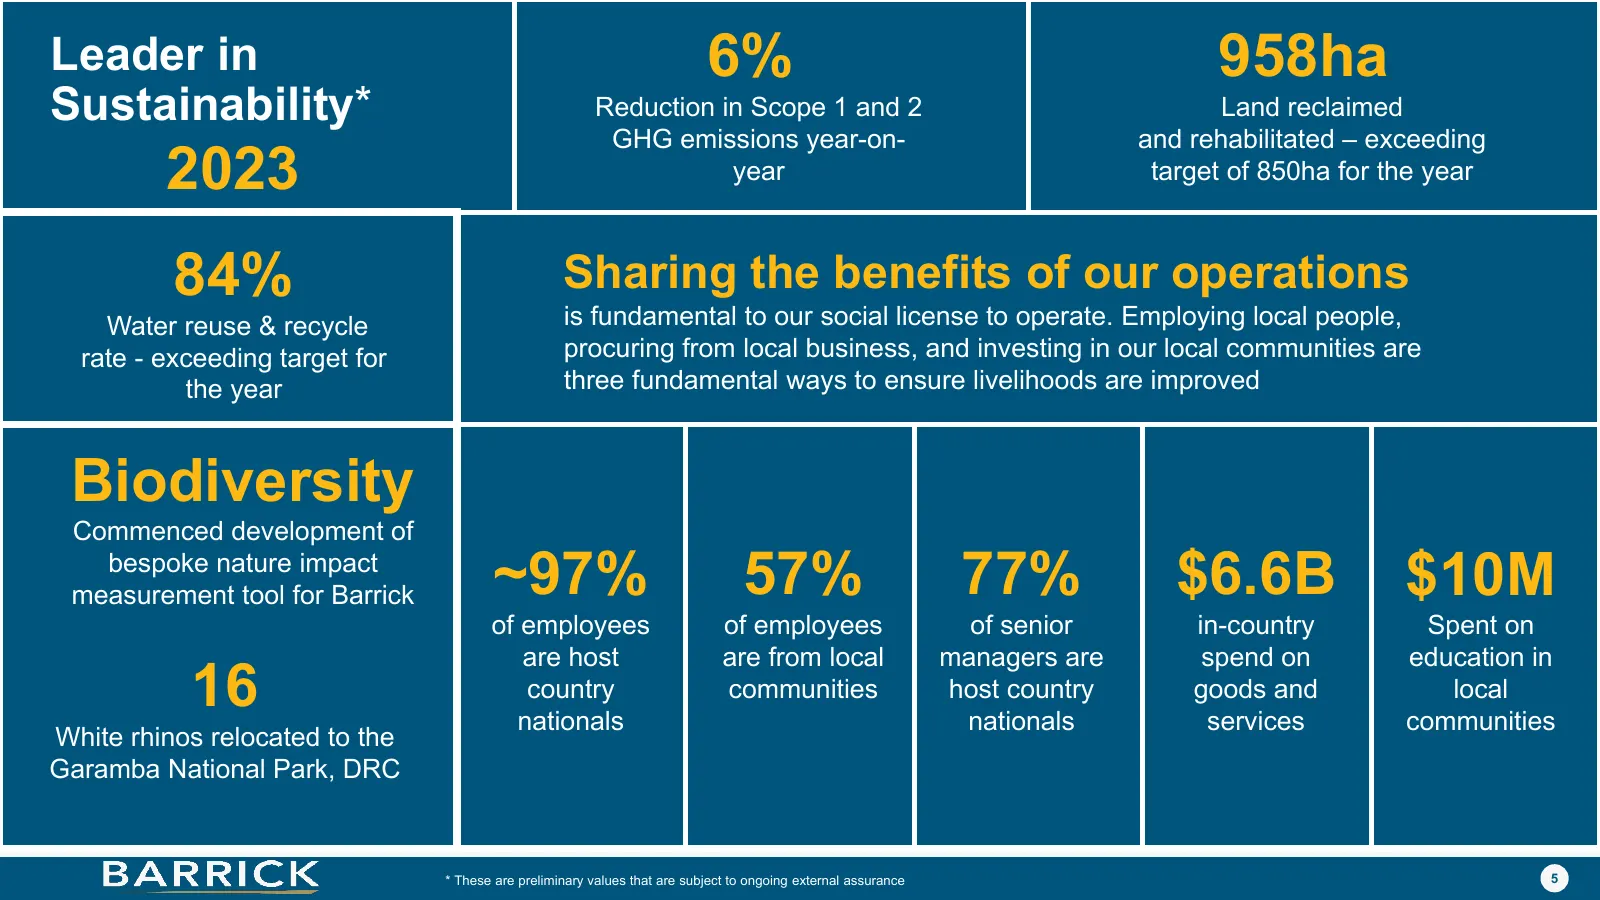
Leader in 6% 958ha Sustainability* Reduction in Scope 1 and 2 Land reclaimed GHG emissions year-on- and rehabilitated – exceeding 2023 year target of 850ha for the year 84% Sharing the benefits of our operations is fundamental to our social license to operate. Employing local people, Water reuse & r
Slide 6: Group Highlights
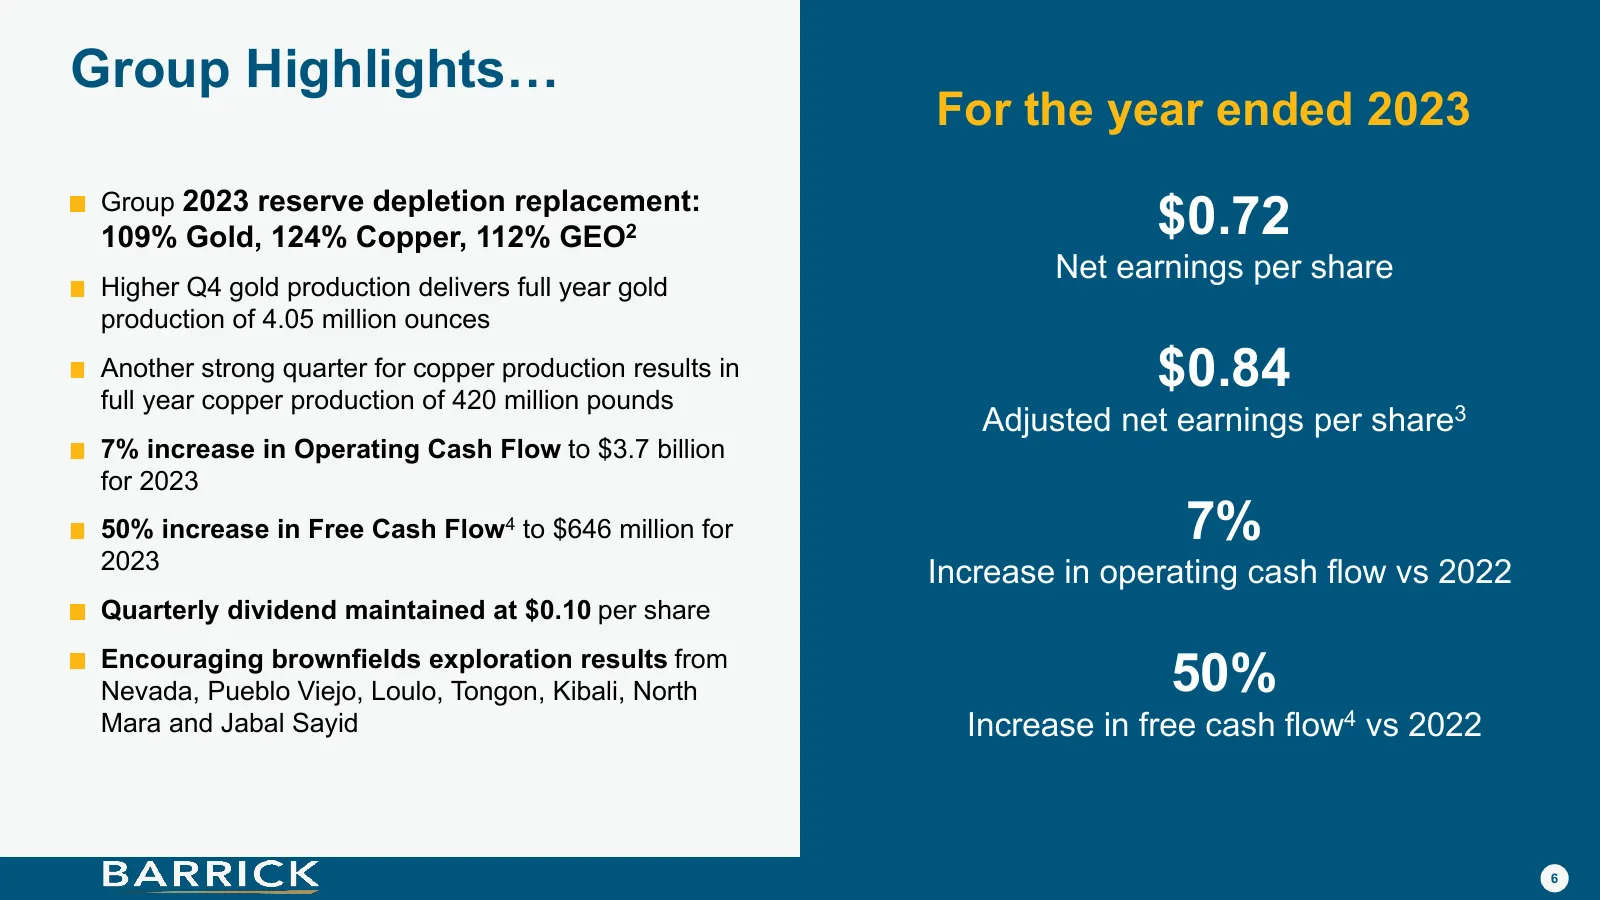
Group Highlights… For the year ended 2023 Group 2023 reserve depletion replacement: 109% Gold, 124% Copper, 112% GEO2 $0.72 Net earnings per share Higher Q4 gold production delivers full year gold production of 4.05 million ounces Another strong quarter for copper production results in full year cop
Slide 7: 2023 Group Operating Results
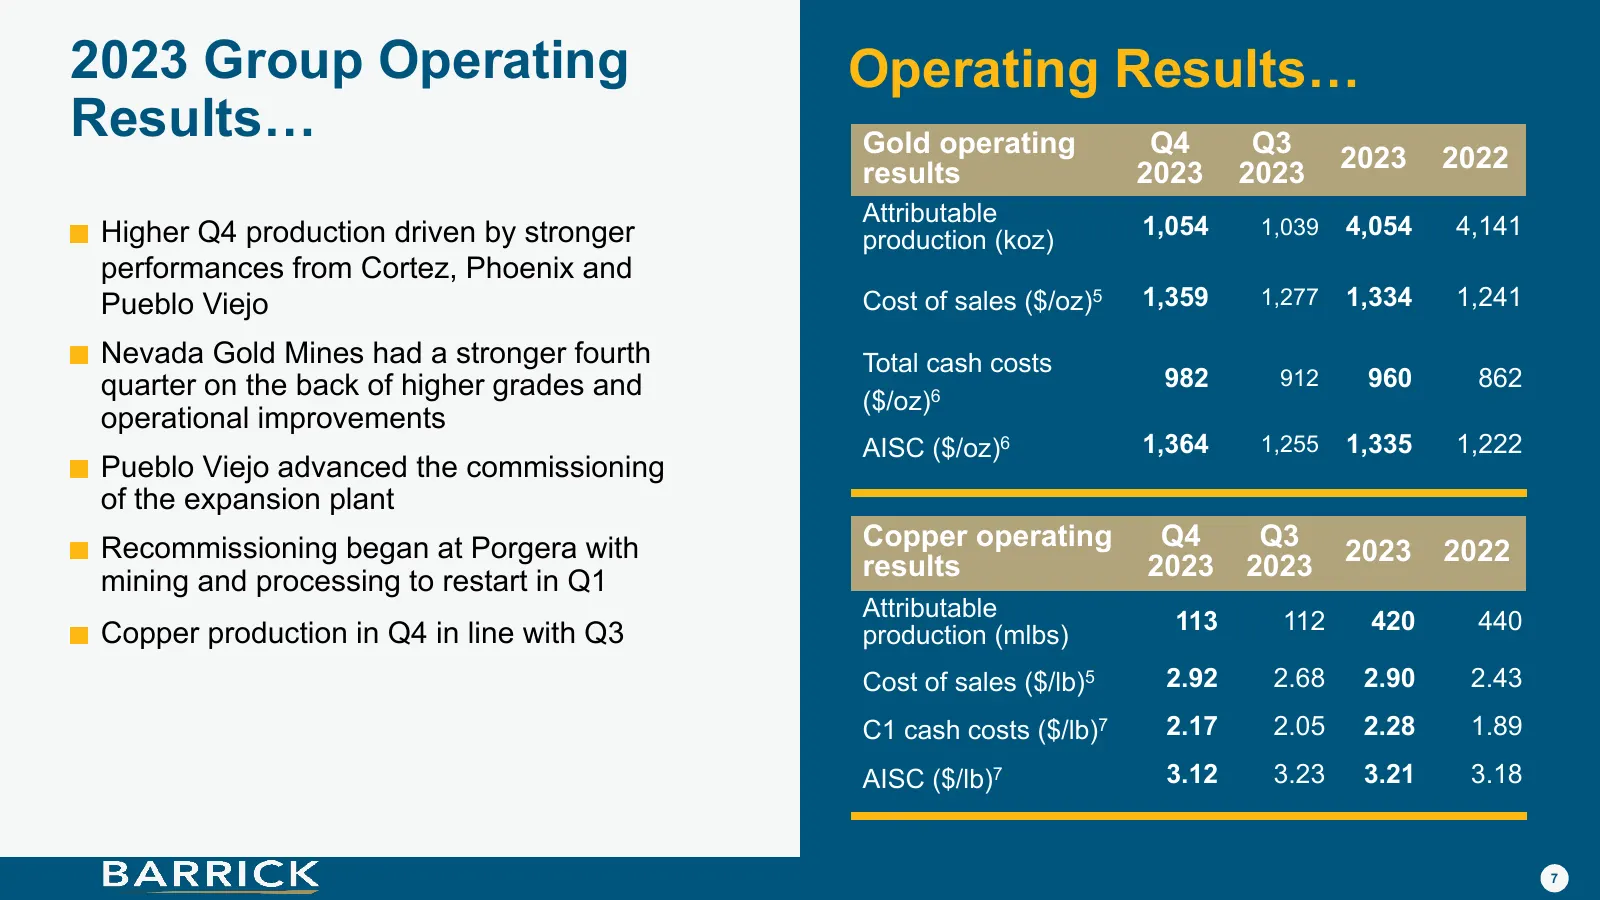
2023 Group Operating Operating Results… Results… Gold operating Q4 Q3 results 2023 2023 2023 2022 Attributable 1,054 1,039 4,054 4,141 Higher Q4 production driven by stronger production (koz) performances from Cortez, Phoenix and Pueblo Viejo Cost of sales ($/oz)5 1,359 1,277 1,334 1,241 Nevada Gold
Slide 8: 2023 Group Financial Results
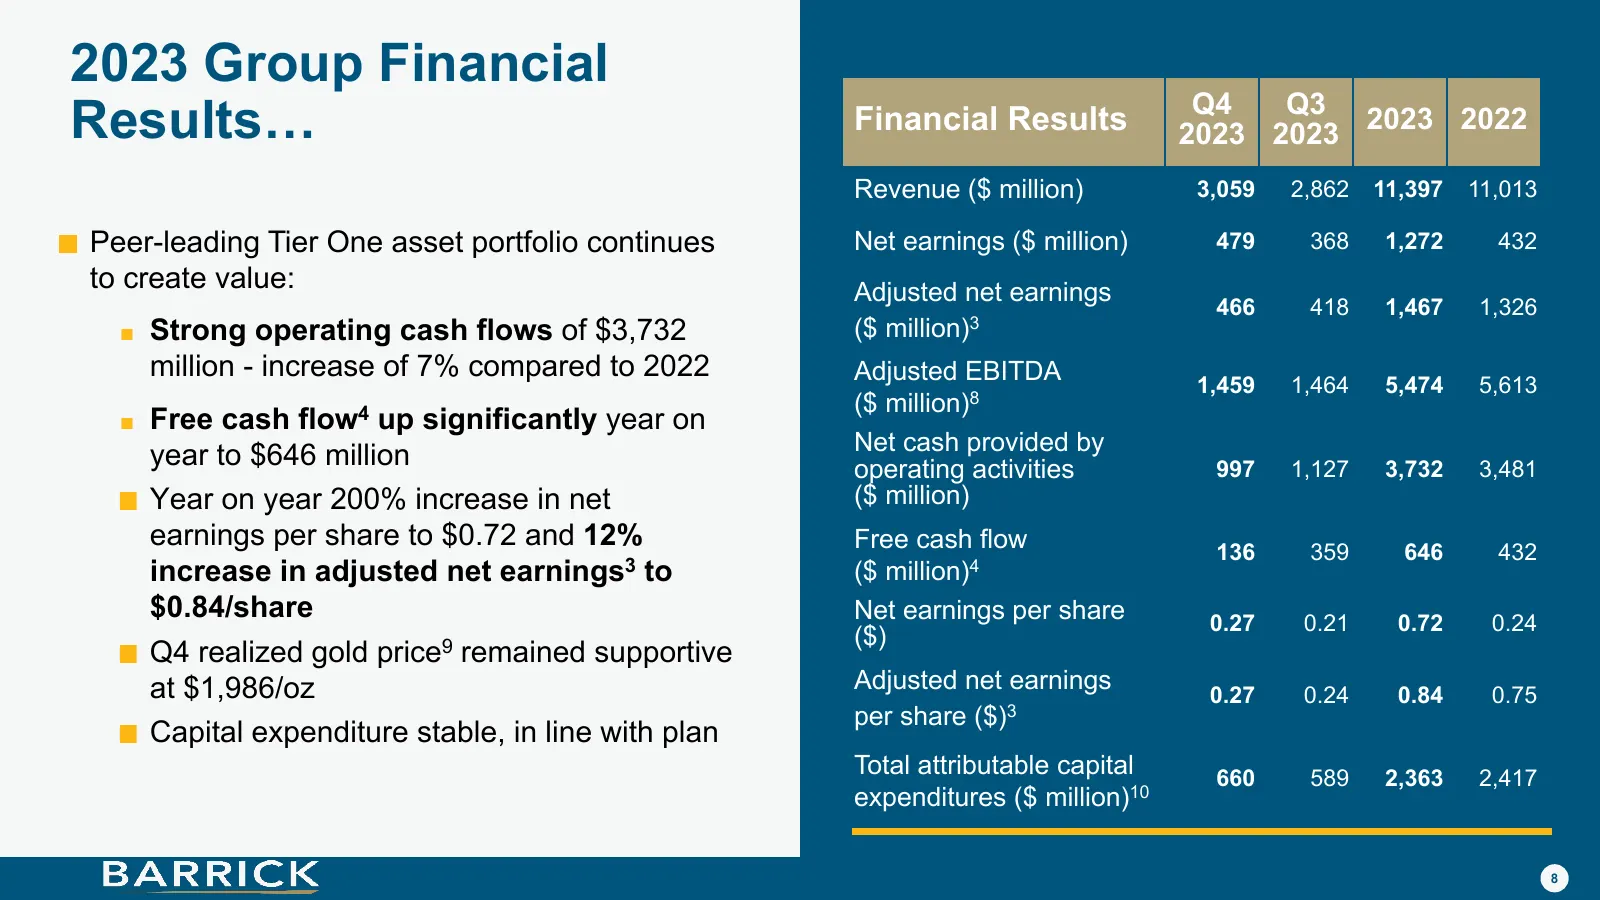
2023 Group Financial Results… Financial Results Q4 Q3 2023 2022 2023 2023 Revenue ($ million) 3,059 2,862 11,397 11,013 Peer-leading Tier One asset portfolio continues Net earnings ($ million) 479 368 1,272 432 to create value: Adjusted net earnings 466 418 1,467 1,326 ■ Strong operating cash flows
Slide 9: Organic replacement of reserves sets us apart
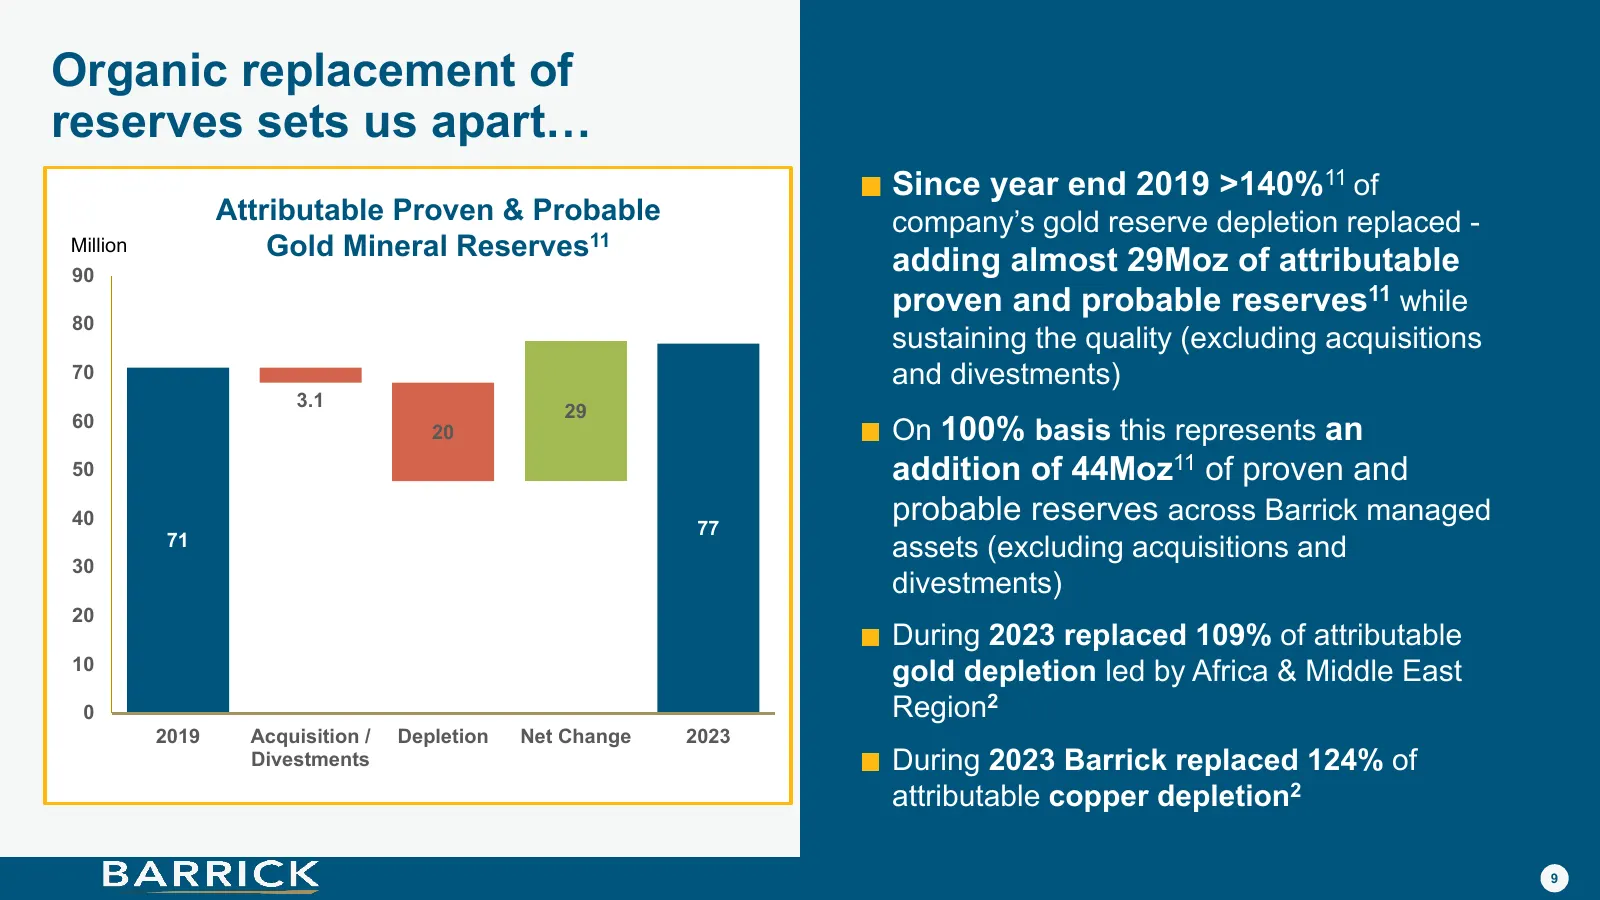
Organic replacement of reserves sets us apart… Since year end 2019 >140%11 of Attributable Proven & Probable company’s gold reserve depletion replaced - Million Gold Mineral Reserves11 90 adding almost 29Moz of attributable proven and probable reserves11 while 80 sustaining the quality (excluding ac
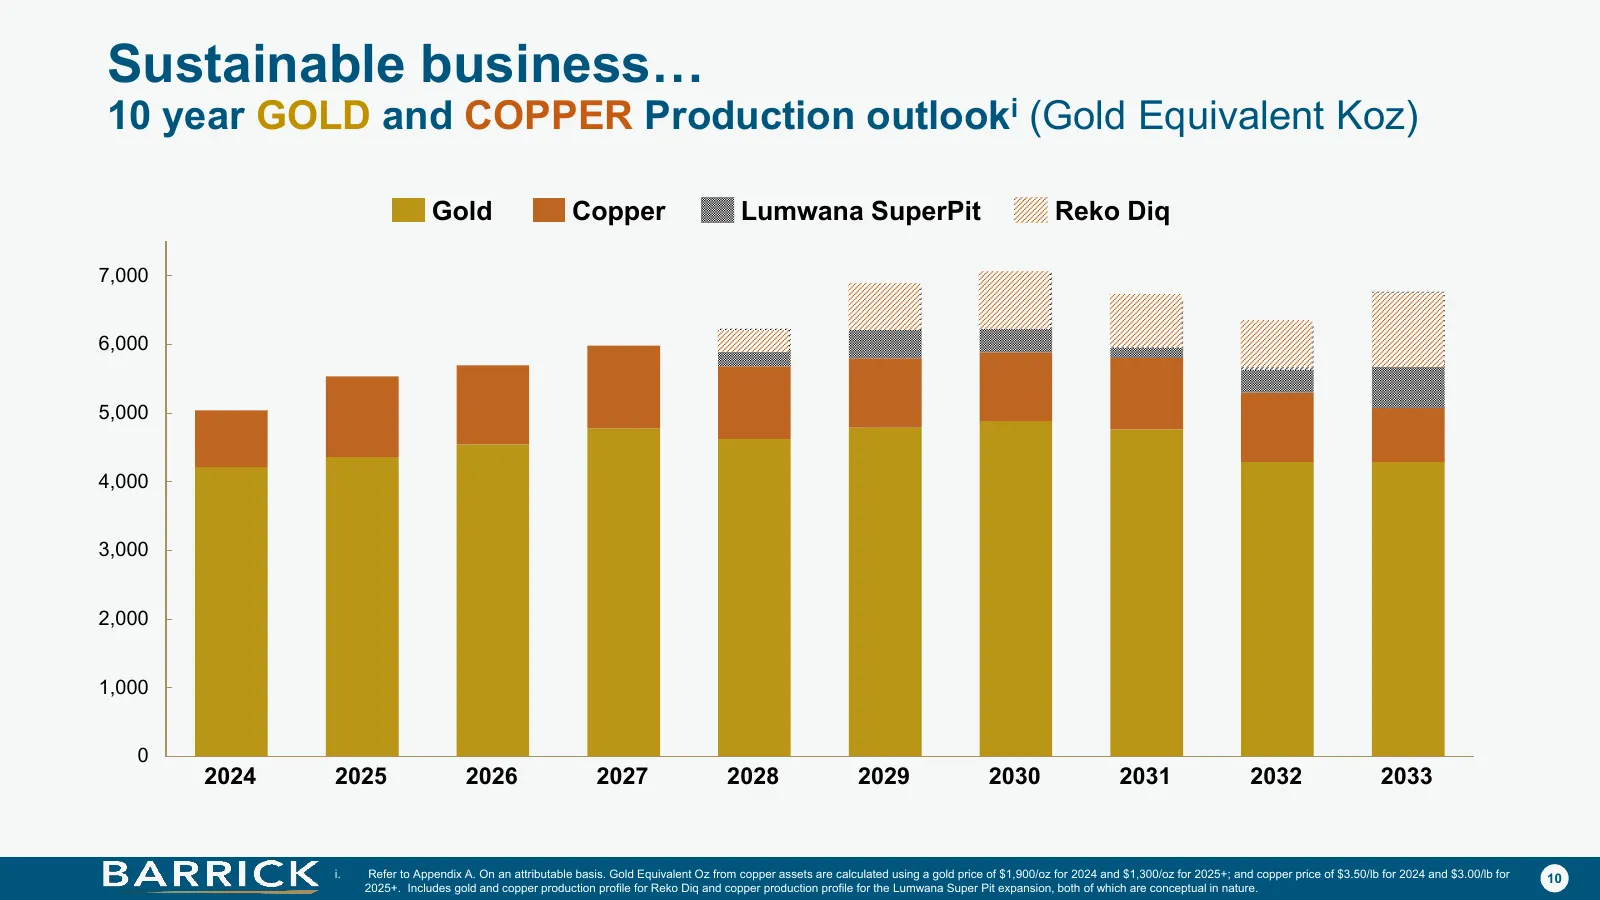
Slide 10: Ten-year gold and copper production outlook
Sustainable business… 10 year GOLD and COPPER Production outlooki (Gold Equivalent Koz) Gold Copper Lumwana SuperPit Reko Diq 7,000 6,000 5,000 4,000 3,000 2,000 1,000 0 2024 2025 2026 2027 2028 2029 2030 2031 2032 2033 i. Refer to Appendix A. On an attributable basis. Gold Equivalent Oz from copper
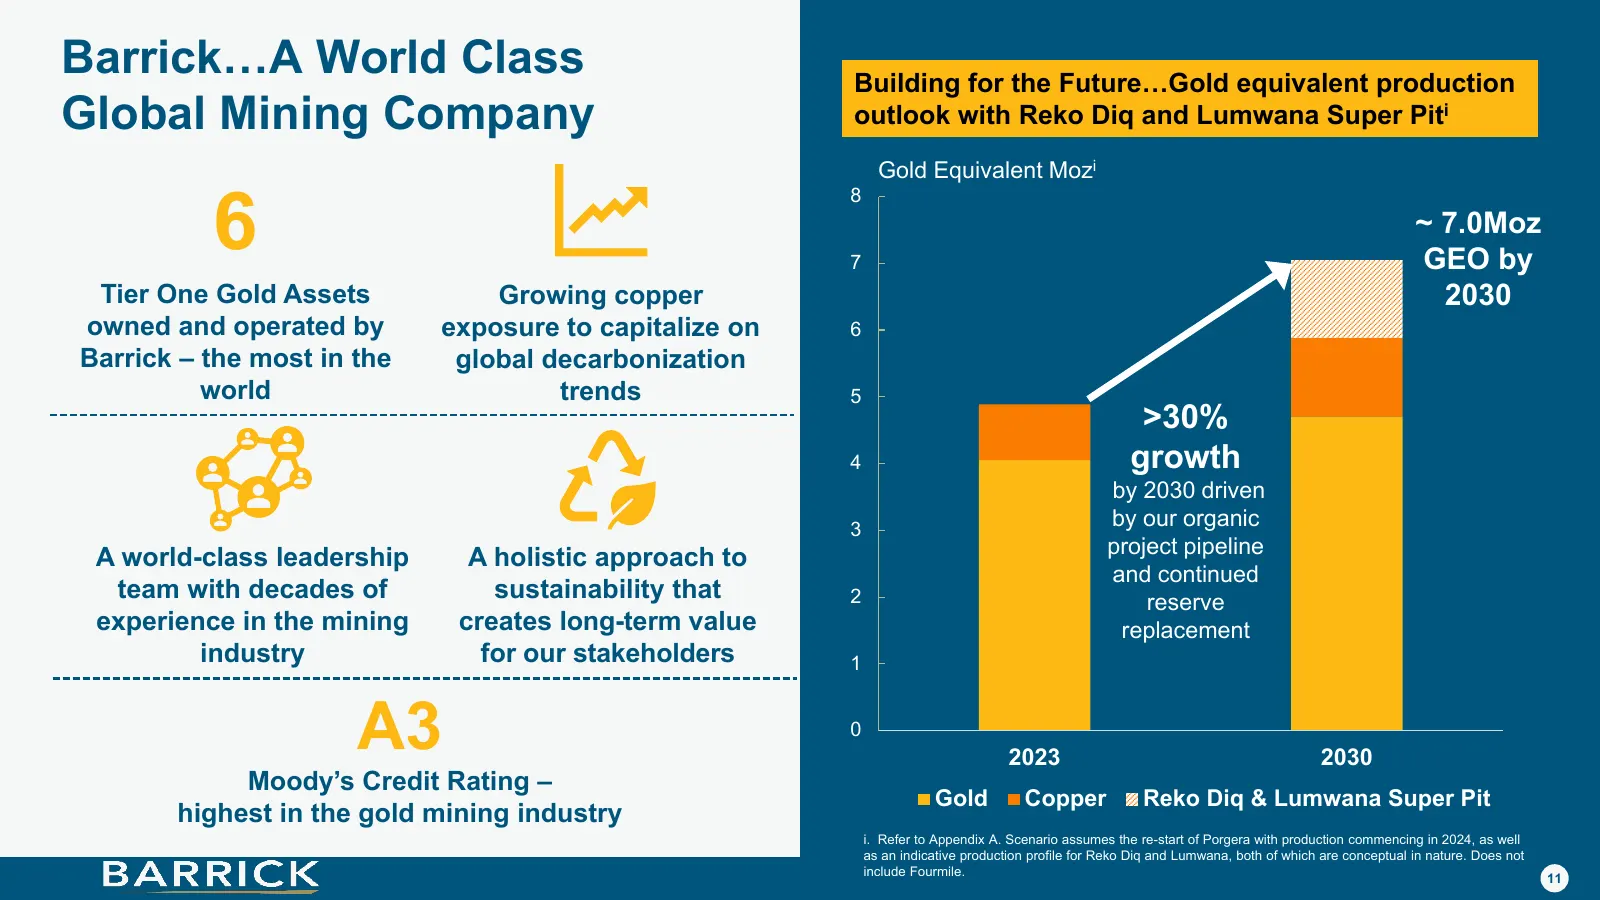
Slide 11: Barrick…A World Class Global Mining Company
Barrick…A World Class Building for the Future…Gold equivalent production Global Mining Company outlook with Reko Diq and Lumwana Super Piti Gold Equivalent Mozi 6 8 ~ 7.0Moz 7 GEO by Tier One Gold Assets Growing copper 2030 owned and operated by exposure to capitalize on 6 Barrick – the most in the
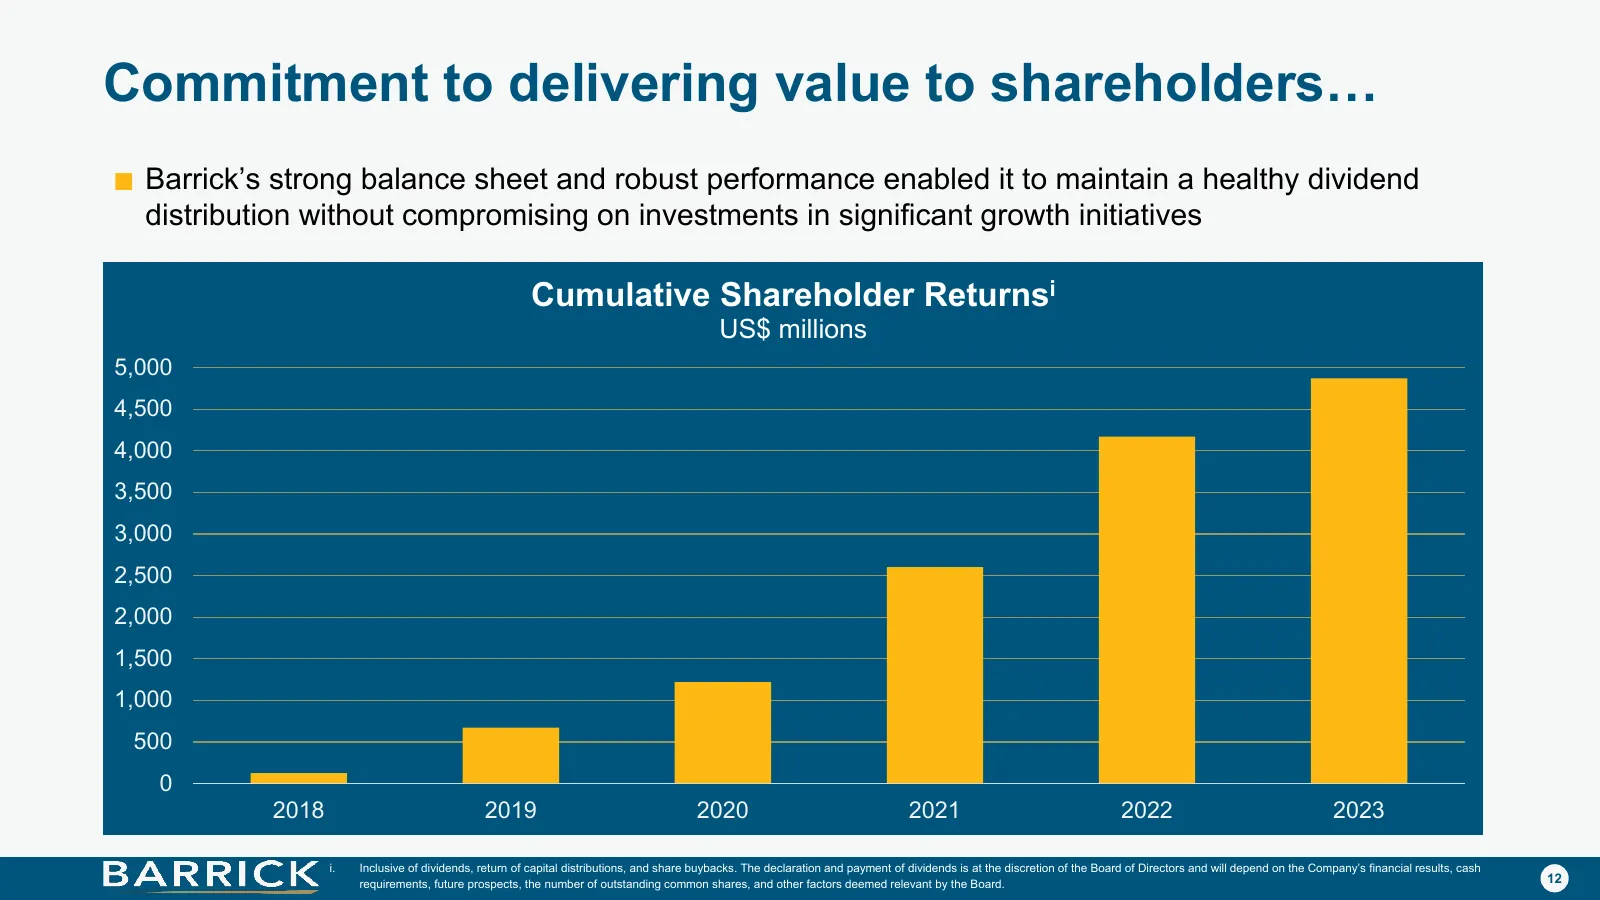
Slide 12: Commitment to delivering value to shareholders
Commitment to delivering value to shareholders… Barrick’s strong balance sheet and robust performance enabled it to maintain a healthy dividend distribution without compromising on investments in significant growth initiatives Cumulative Shareholder Returnsi US$ millions 5,000 4,500 4,000 3,500 3,00
Slide 13: Connect with us
BARRICK GOLD CORPORATION Corporate Office: TD Canada Trust Tower 161 Bay Street, Suite 3700 Toronto, Canada M5J 2S1 Tel: +1 416 861-9911 Toll-free throughout North America: 1 800 720-7415 Connect with us 13
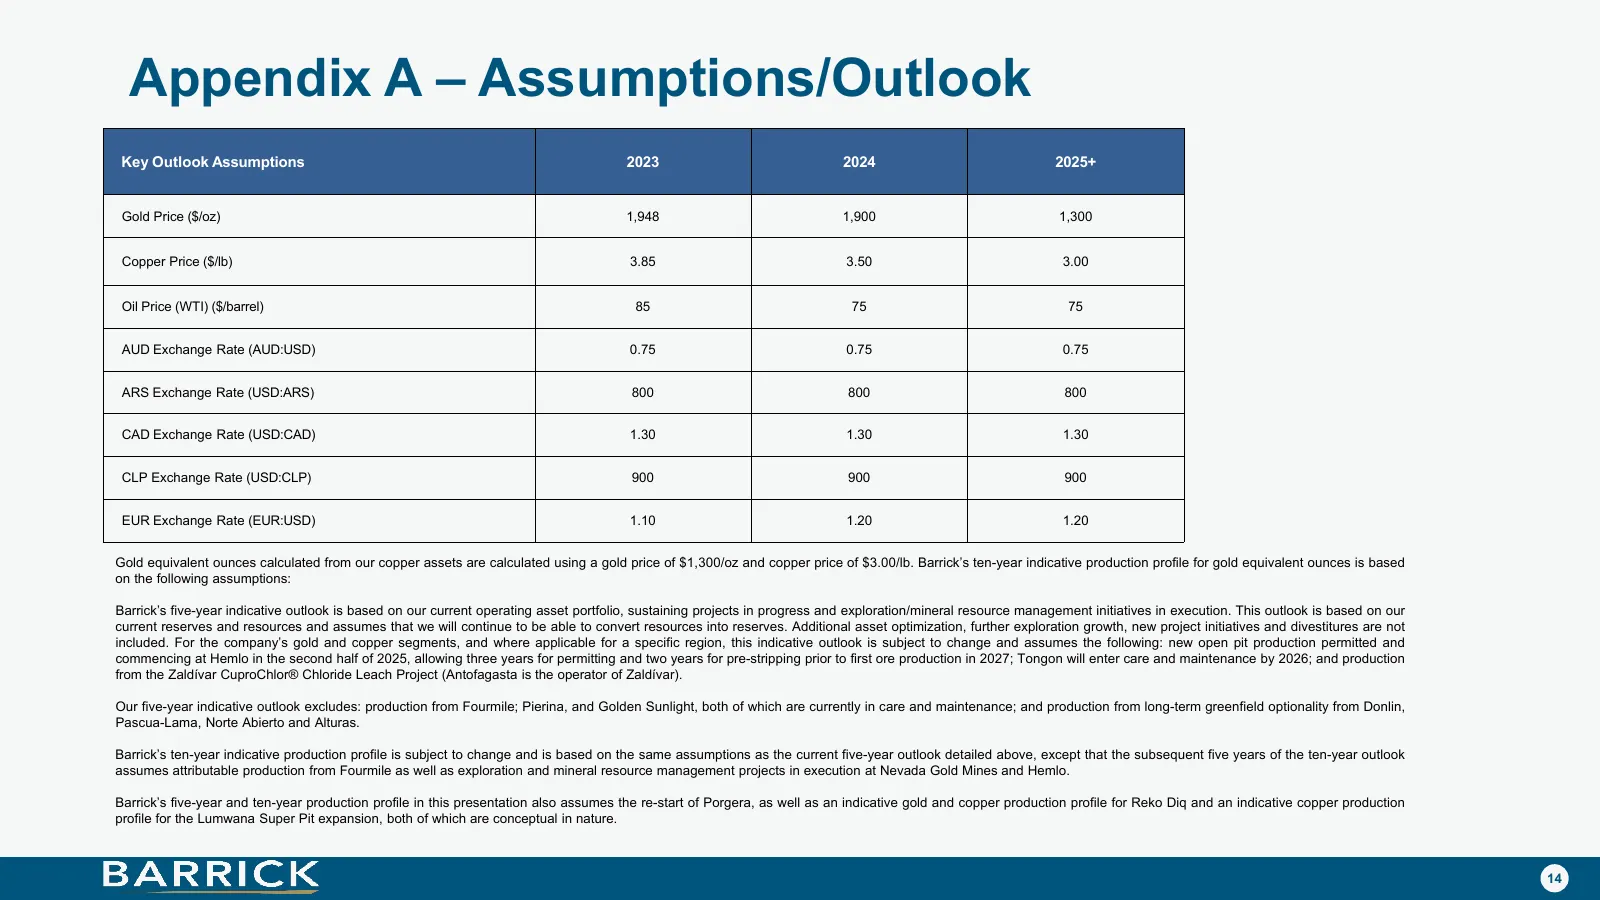
Slide 14: Appendix A – Assumptions/Outlook
Appendix A – Assumptions/Outlook Key Outlook Assumptions 2023 2024 2025+ Gold Price ($/oz) 1,948 1,900 1,300 Copper Price ($/lb) 3.85 3.50 3.00 Oil Price (WTI) ($/barrel) 85 75 75 AUD Exchange Rate (AUD:USD) 0.75 0.75 0.75 ARS Exchange Rate (USD:ARS) 800 800 800 CAD Exchange Rate (USD:CAD) 1.30 1.30
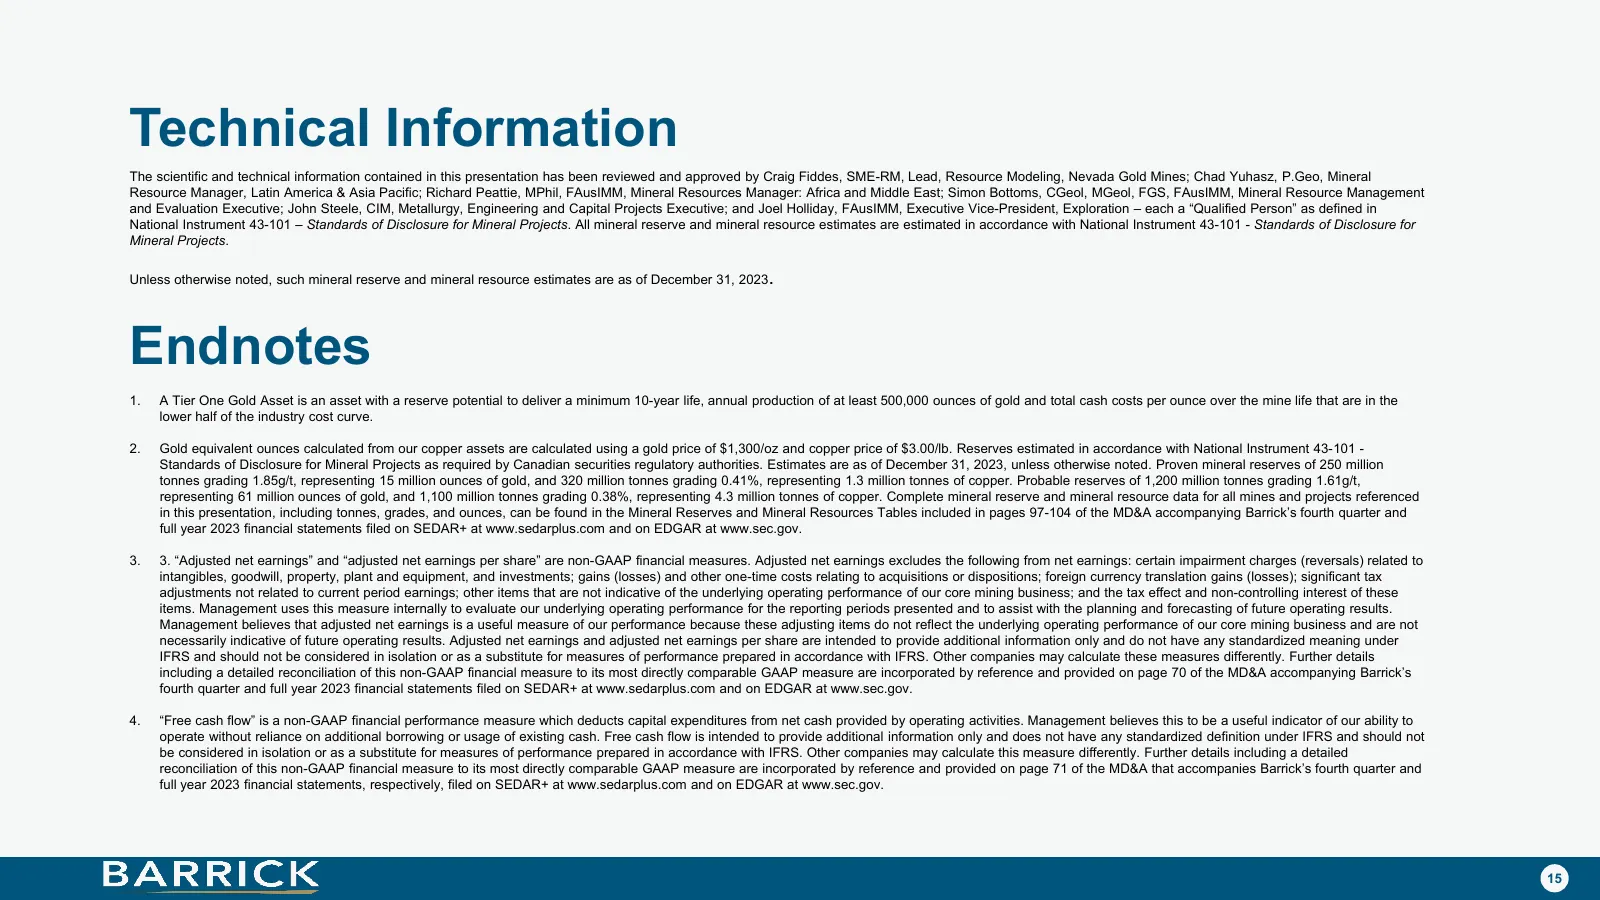
Slide 15: Technical Information
Technical Information The scientific and technical information contained in this presentation has been reviewed and approved by Craig Fiddes, SME-RM, Lead, Resource Modeling, Nevada Gold Mines; Chad Yuhasz, P.Geo, Mineral Resource Manager, Latin America & Asia Pacific; Richard Peattie, MPhil, FAusIM
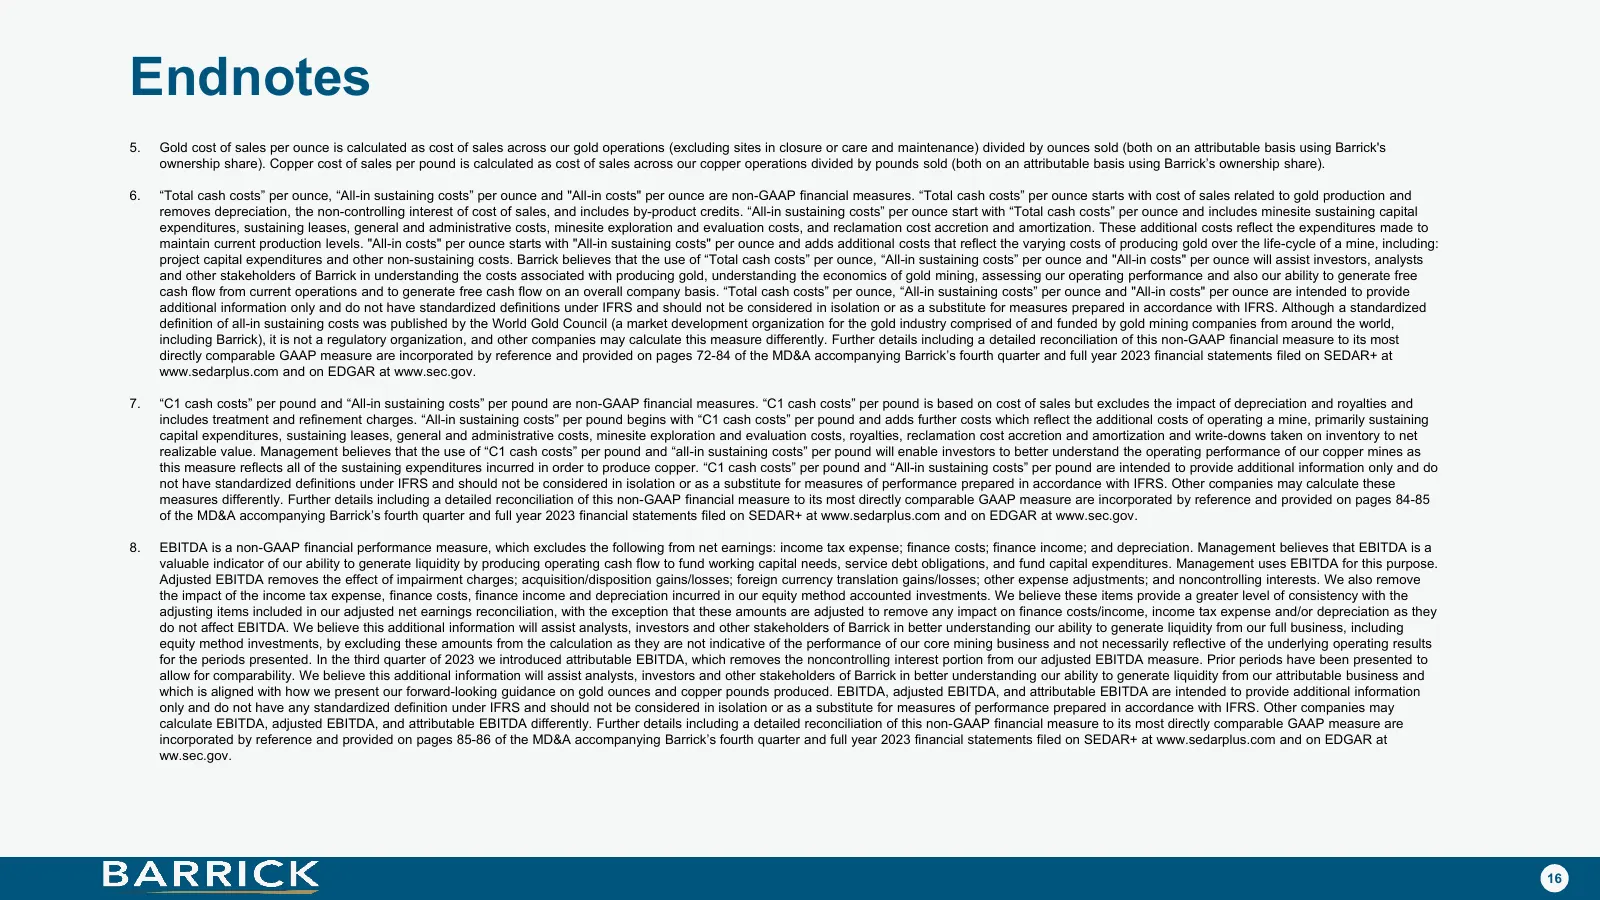
Slide 16: Endnotes
Endnotes 5. Gold cost of sales per ounce is calculated as cost of sales across our gold operations (excluding sites in closure or care and maintenance) divided by ounces sold (both on an attributable basis using Barrick's ownership share). Copper cost of sales per pound is calculated as cost of sale
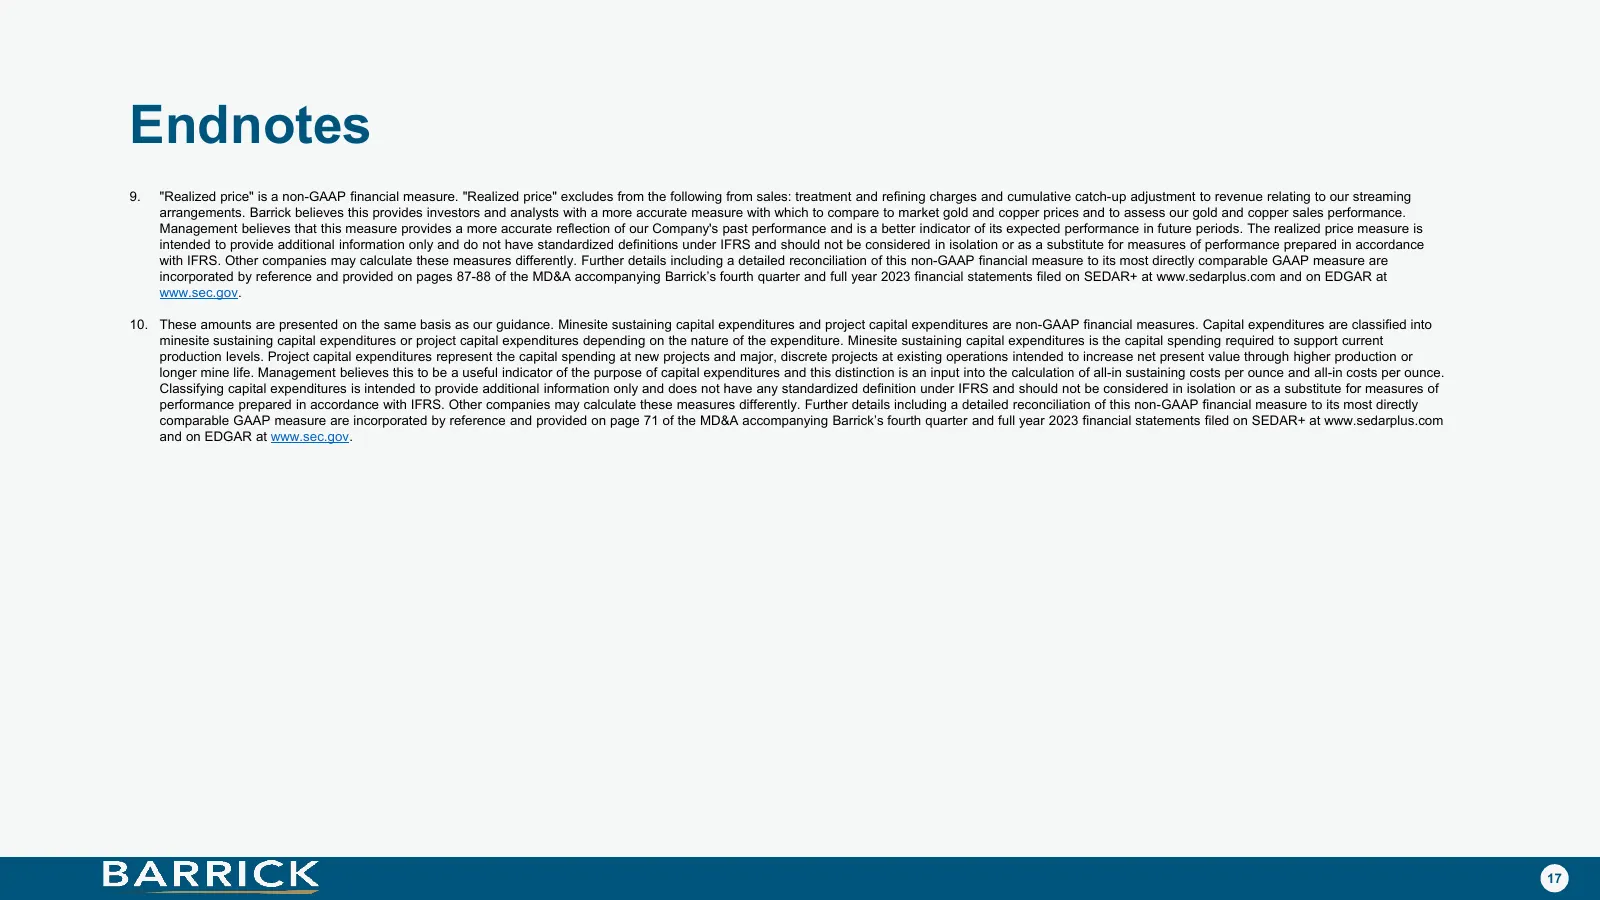
Slide 17: Endnotes
Endnotes 9. "Realized price" is a non-GAAP financial measure. "Realized price" excludes from the following from sales: treatment and refining charges and cumulative catch-up adjustment to revenue relating to our streaming arrangements. Barrick believes this provides investors and analysts with a mor
Slide 18: Endnotes
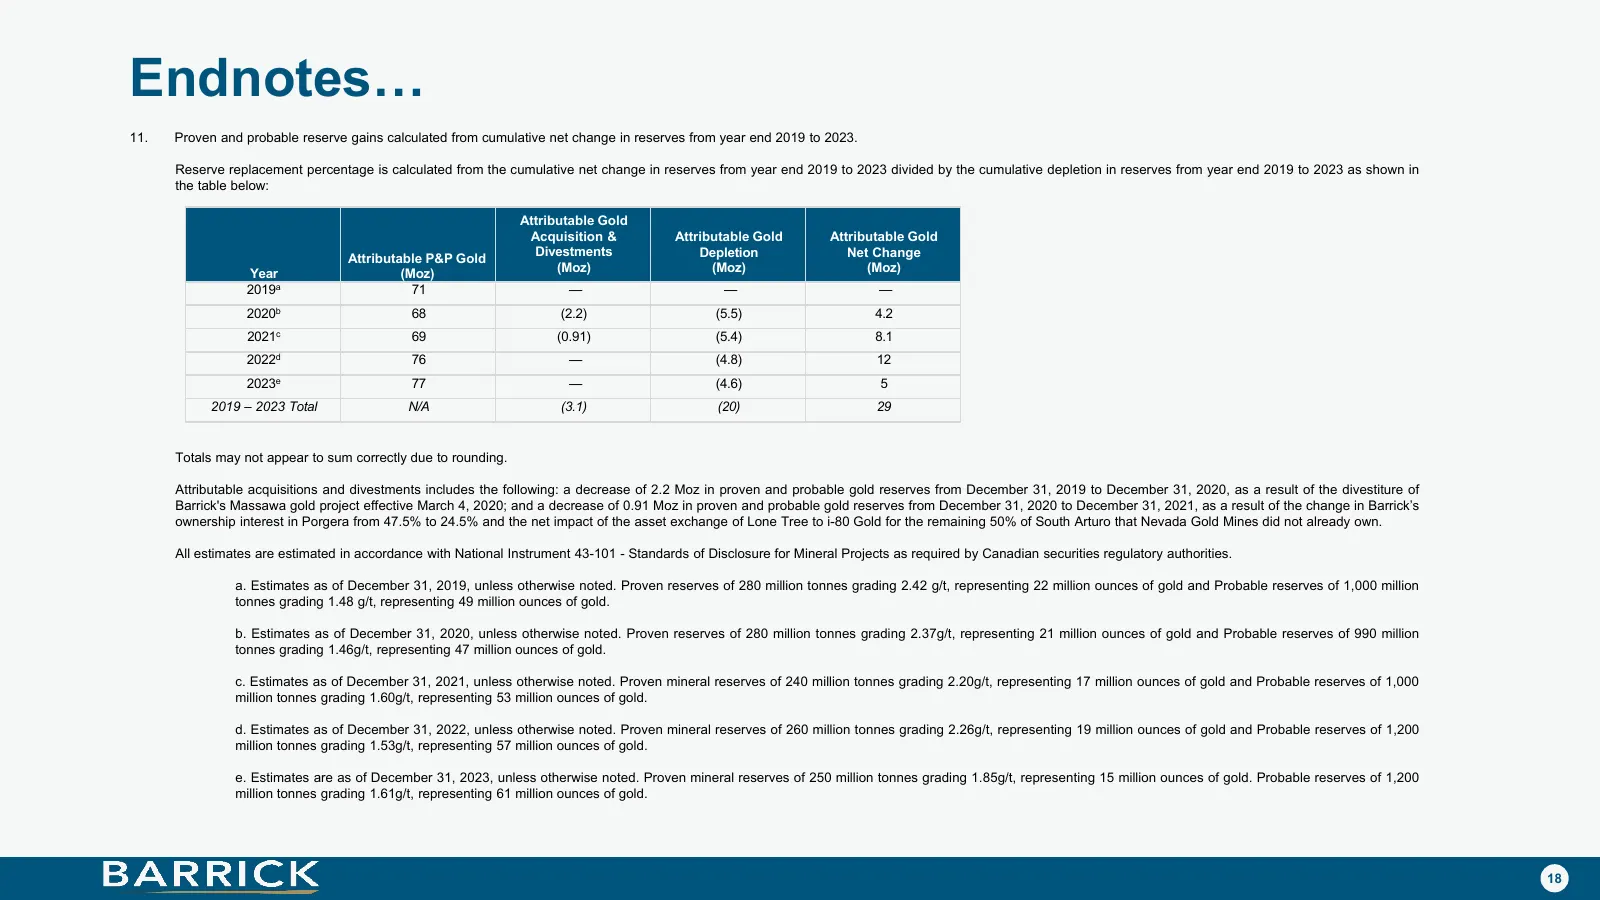
Endnotes… 11. Proven and probable reserve gains calculated from cumulative net change in reserves from year end 2019 to 2023. Reserve replacement percentage is calculated from the cumulative net change in reserves from year end 2019 to 2023 divided by the cumulative depletion in reserves from year e
Source: company website
More decks from Barrick Mining Corporation
 Technical Presentation (November 2026)5 slides · Nov 10, 2026
 Q3 2026 Earnings Presentation29 slides · Nov 9, 2026
 Mining Forum Americas 202619 slides · Sep 29, 2026
 Q2 2026 Earnings Presentation26 slides · Aug 10, 2026
 Q1 2026 Earnings Presentation30 slides · May 11, 2026
 Technical Presentation (February 2026)38 slides · Feb 26, 2026