Curo — Investor Presentation (March 2021)
37 slides from Curo's investor presentation, Mar 22, 2021

Slide 1: March 22, 2021 Investor Update
March 22, 2021 Investor Update
Slide 2: Disclaimer
Disclaimer 2 IMPORTANT: You must read the following information before continuing to the rest of the presentation, which is being provided to you for informational purposes only. Financial information contained in this presentation is unaudited. Forward-Looking Statements This presentation contains

Slide 3: Company Introduction
3 Company Introduction
Slide 4: CURO: Powering Financial Innovation for Consumers
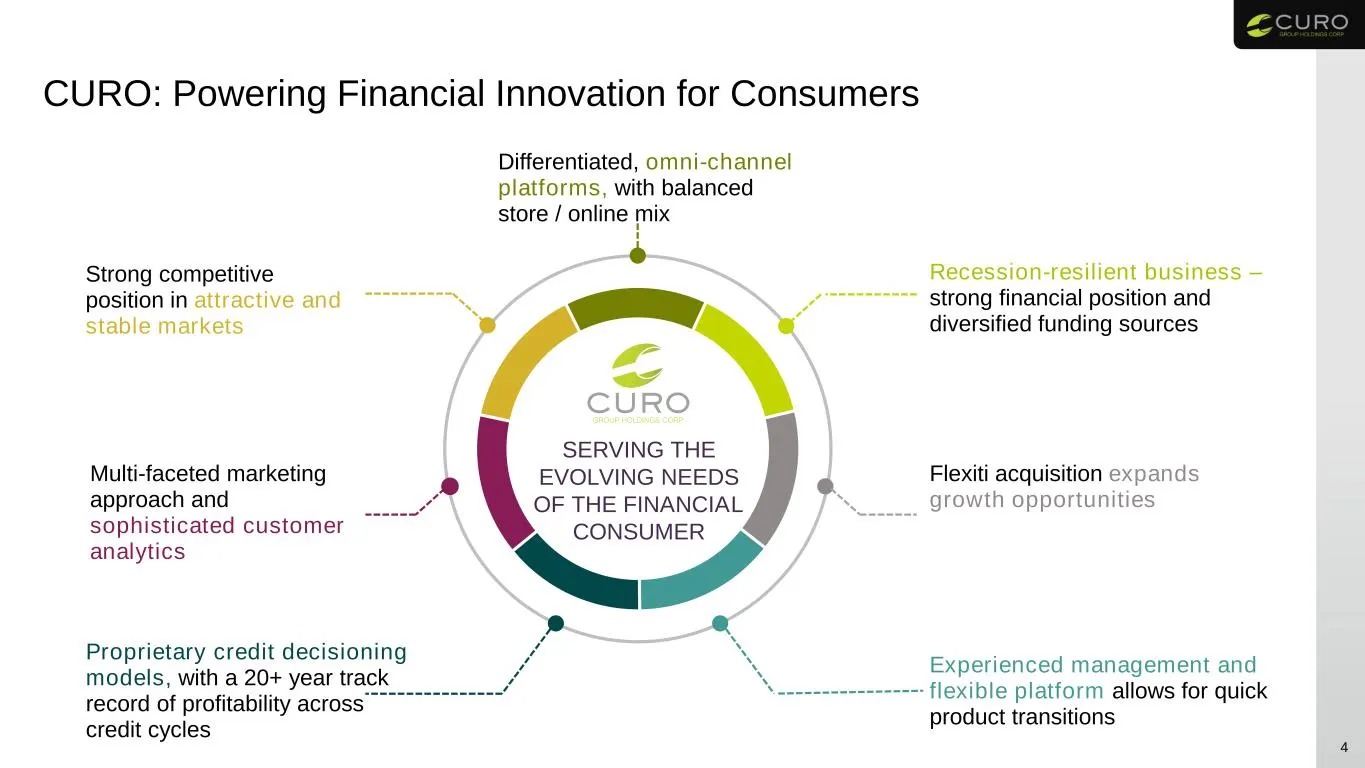
CURO: Powering Financial Innovation for Consumers 4 SERVING THE EVOLVING NEEDS OF THE FINANCIAL CONSUMER Differentiated, omni-channel platforms, with balanced store / online mix Recession-resilient business – strong financial position and diversified funding sources Flexiti acquisition expands growt
Slide 5: CURO at a Glance
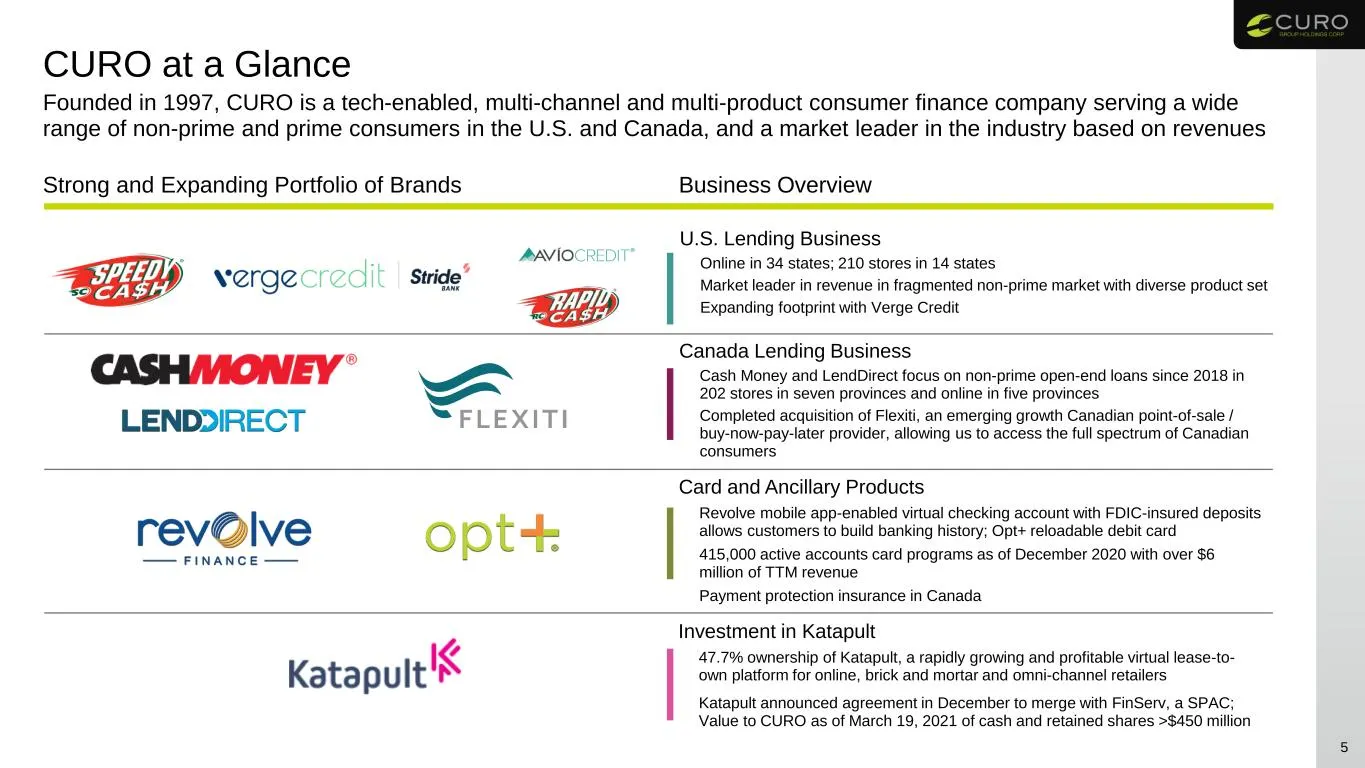
CURO at a Glance 5 Canada Lending Business Cash Money and LendDirect focus on non-prime open-end loans since 2018 in 202 stores in seven provinces and online in five provinces Completed acquisition of Flexiti, an emerging growth Canadian point-of-sale / buy-now-pay-later provider, allowing us to acc
Slide 6: CURO covers all bases for how consumers access credit in the U.S. and Canada
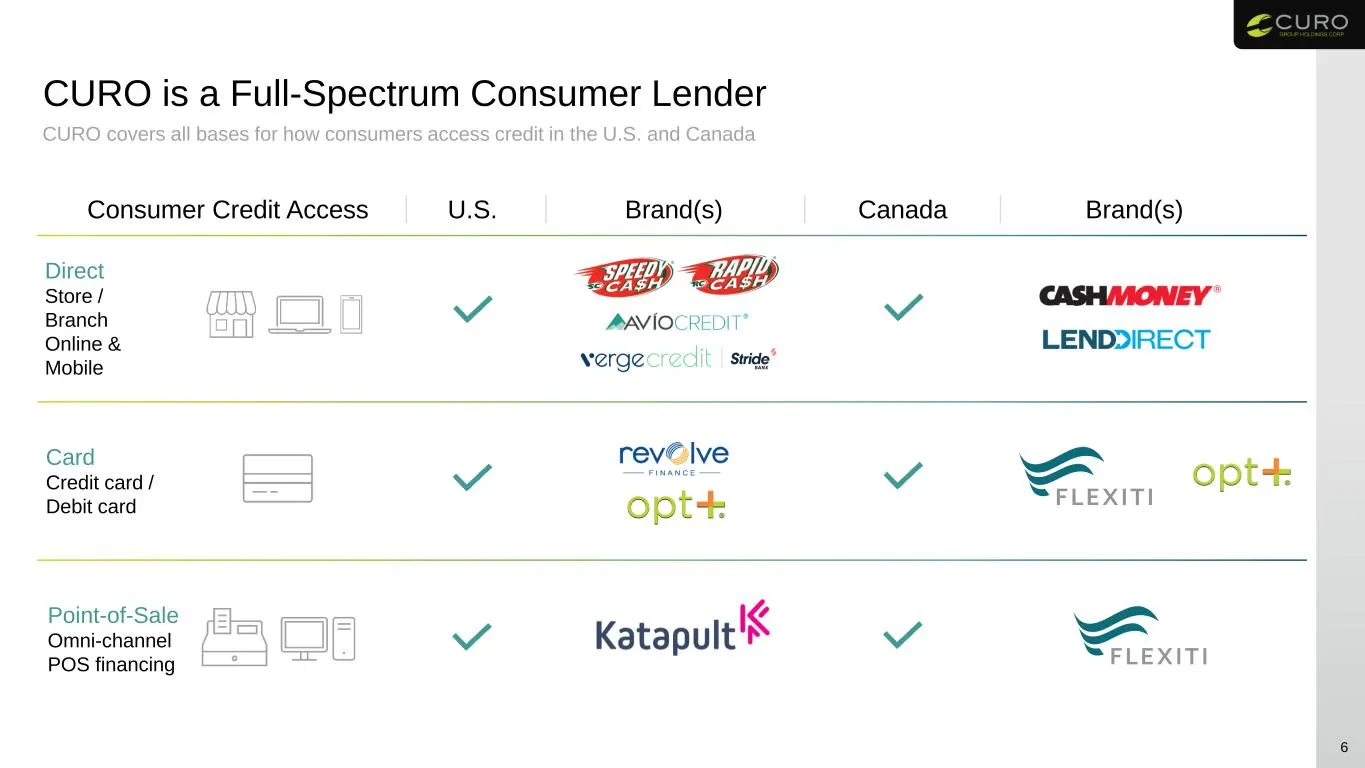
CURO covers all bases for how consumers access credit in the U.S. and Canada CURO is a Full-Spectrum Consumer Lender 6 21% 15% Direct Store / Branch Online & Mobile Card Credit card / Debit card Point-of-Sale Omni-channel POS financing Consumer Credit Access U.S. Brand(s) Canada Brand(s) 6%
Slide 7: CURO's Place in the Alternative Financial Product Market
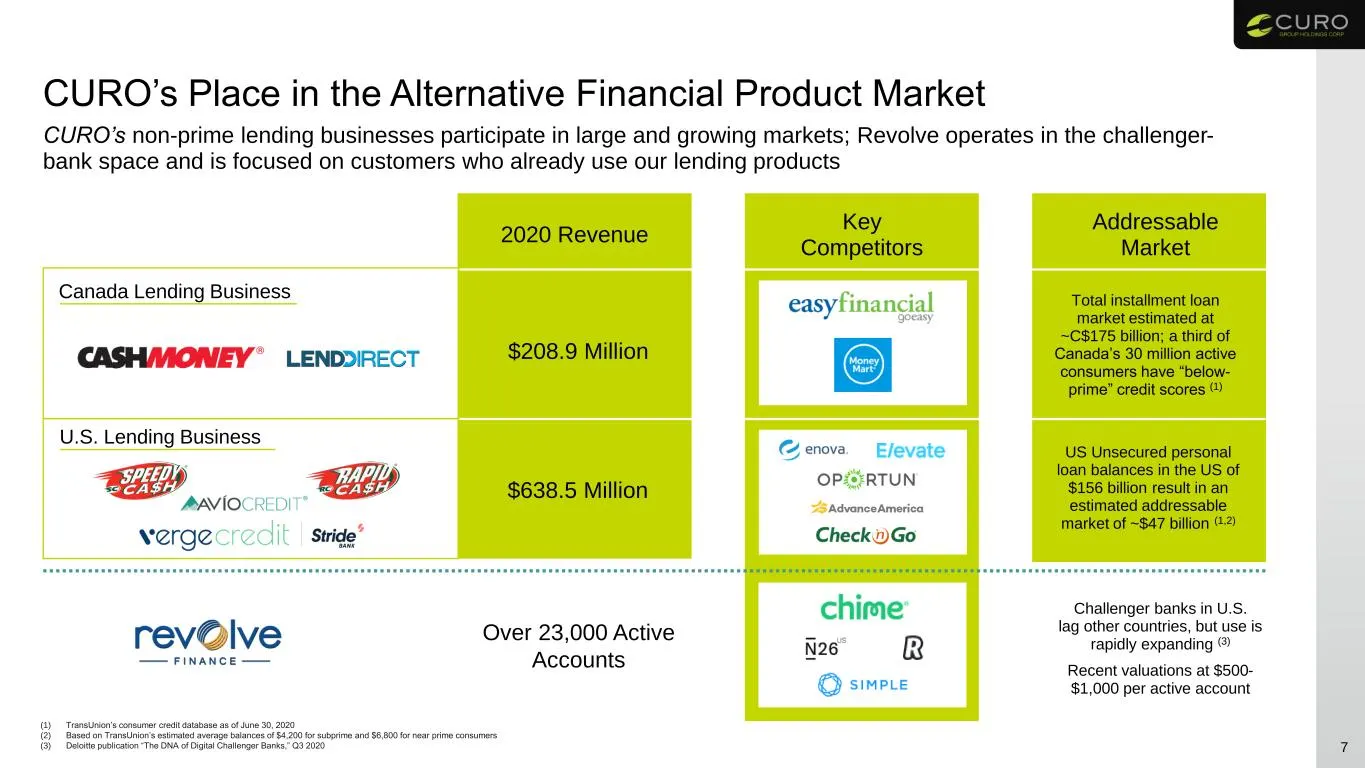
CURO’s Place in the Alternative Financial Product Market 7 (1) TransUnion’s consumer credit database as of June 30, 2020 (2) Based on TransUnion’s estimated average balances of $4,200 for subprime and $6,800 for near prime consumers (3) Deloitte publication “The DNA of Digital Challenger Banks,” Q3
Slide 8: Drive Channel, Product and Geographic Diversification
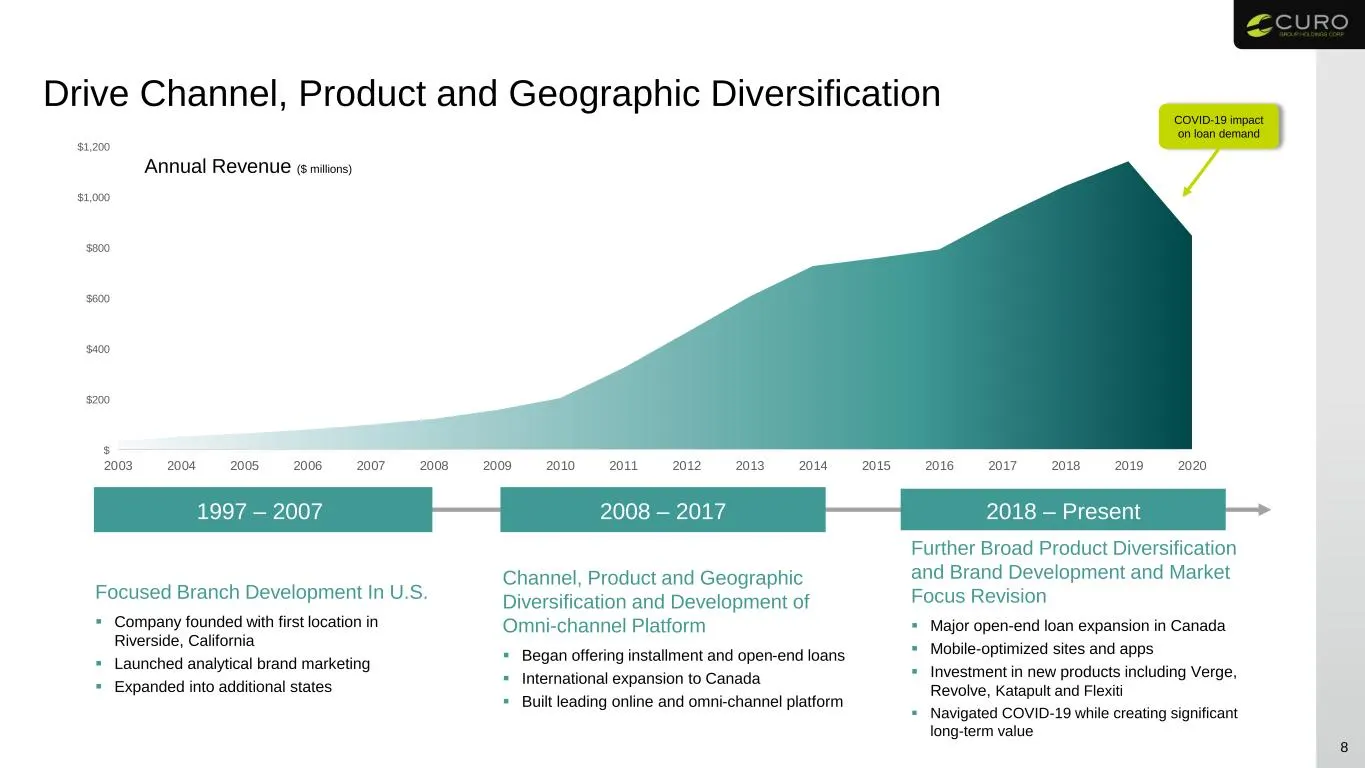
Drive Channel, Product and Geographic Diversification 8 Annual Revenue ($ millions) Focused Branch Development In U.S. Company founded with first location in Riverside, California Launched analytical brand marketing Expanded into additional states Channel, Product and Geographic Diversificatio
Slide 9: Evolving Geographic and Product Mix: Loan Balances
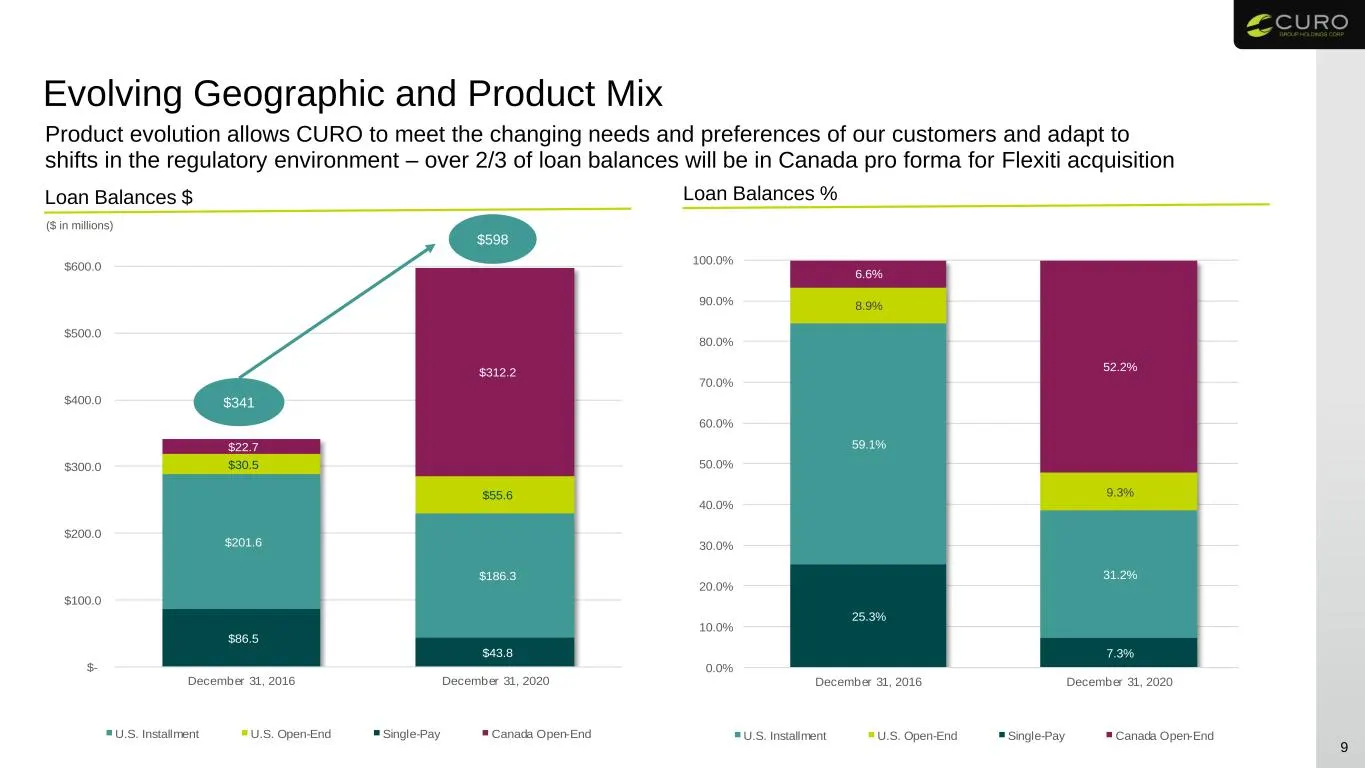
$86.5 $43.8 $201.6 $186.3 $30.5 $55.6 $22.7 $312.2 $- $100.0 $200.0 $300.0 $400.0 $500.0 $600.0 December 31, 2016 December 31, 2020 U.S. Installment U.S. Open-End Single-Pay Canada Open-End Evolving Geographic and Product Mix 9 Loan Balances $ ($ in millions) Product evolution allows CURO to meet th
Slide 10: Evolving Geographic, Channel and Product Mix: Revenue
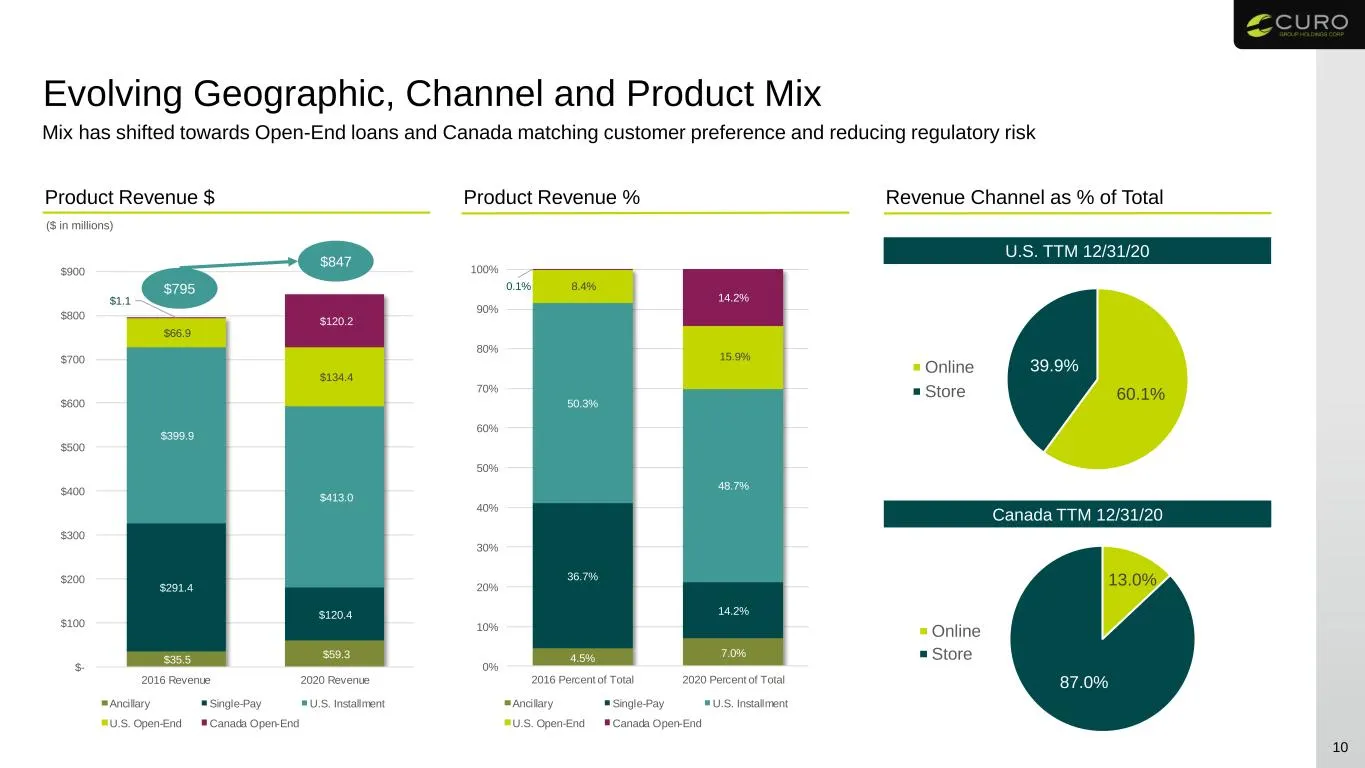
$35.5 $59.3 $291.4 $120.4 $399.9 $413.0 $66.9 $134.4 $1.1 $120.2 $- $100 $200 $300 $400 $500 $600 $700 $800 $900 2016 Revenue 2020 Revenue Ancillary Single-Pay U.S. Installment U.S. Open-End Canada Open-End Evolving Geographic, Channel and Product Mix 10 Mix has shifted towards Open-End loans and Ca
Slide 11: Canadian Alternative Product Mix Shift Creates Value
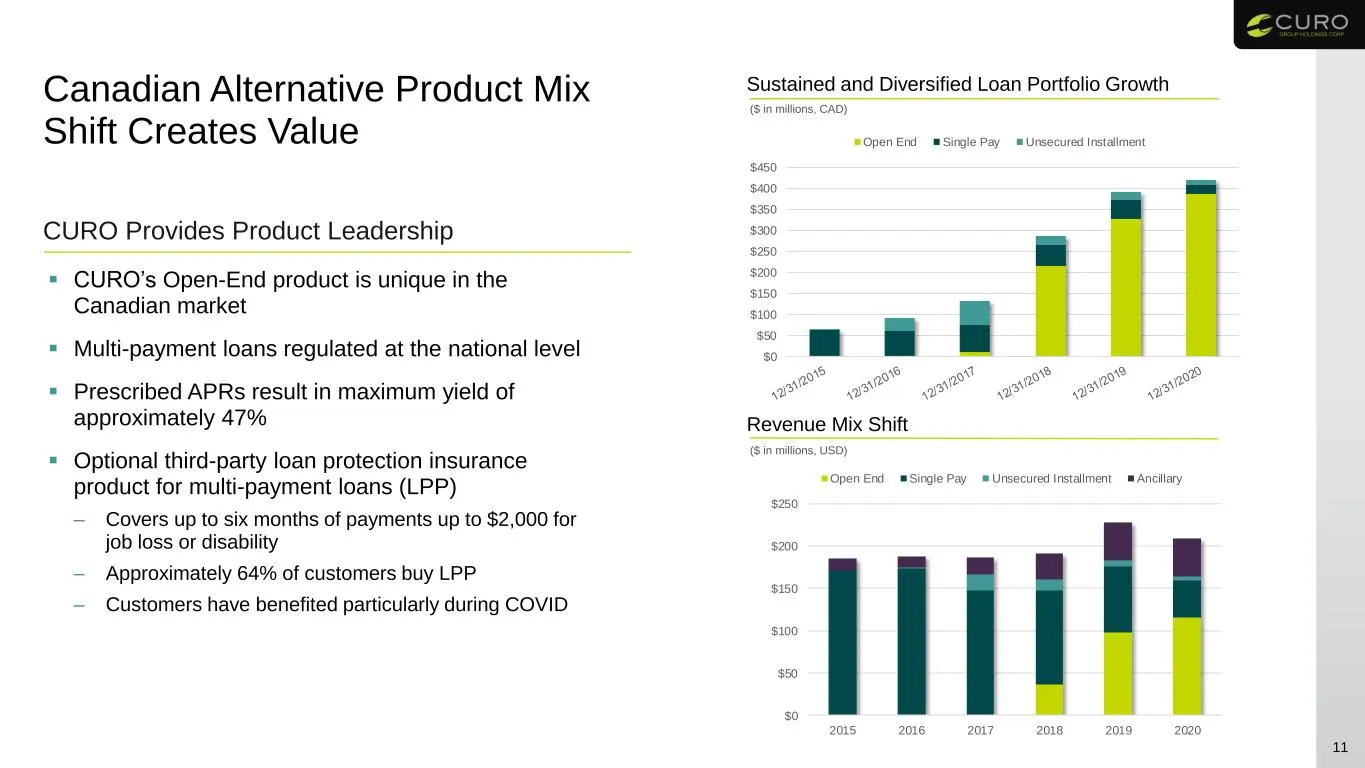
Canadian Alternative Product Mix Shift Creates Value CURO’s Open-End product is unique in the Canadian market Multi-payment loans regulated at the national level Prescribed APRs result in maximum yield of approximately 47% Optional third-party loan protection insurance product for multi-paym
Slide 12: Comparative Value in Canadian Alternative Lending Market
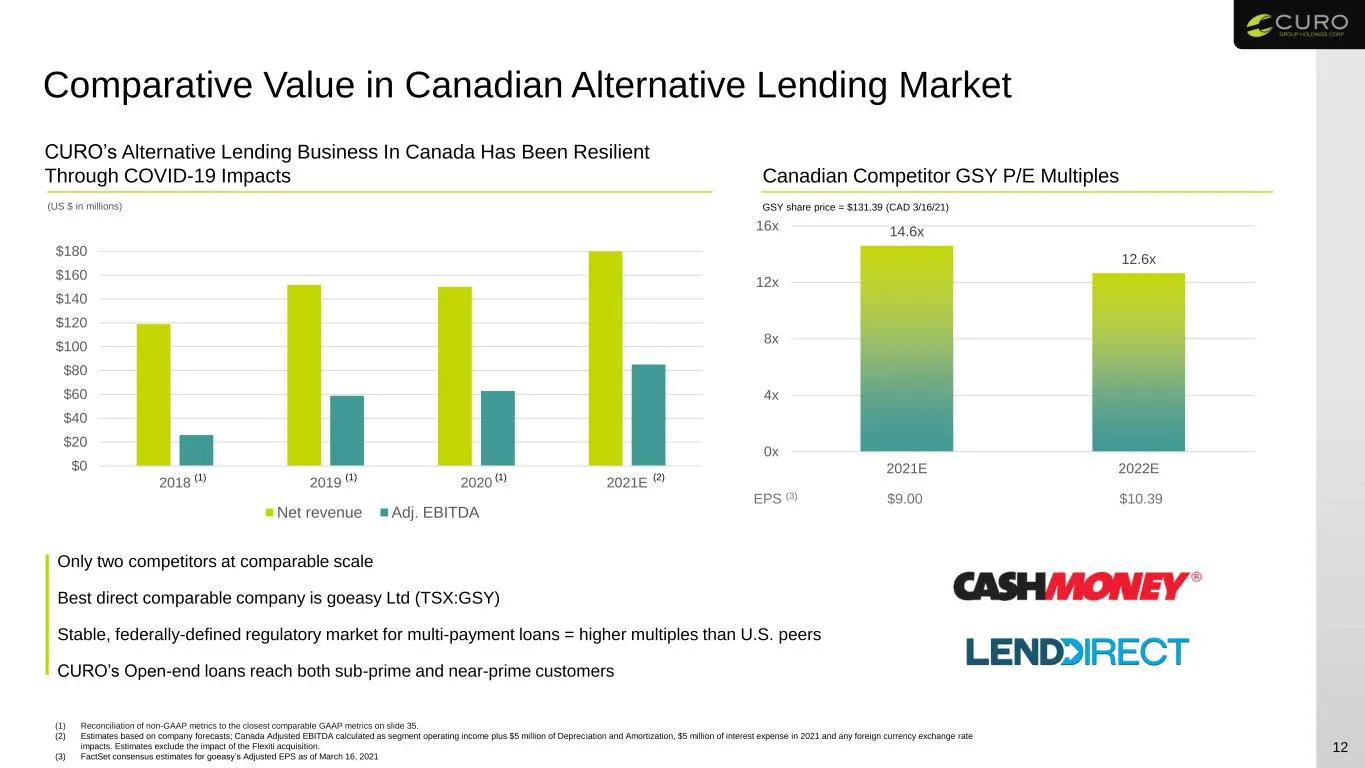
Comparative Value in Canadian Alternative Lending Market 12 CURO’s Alternative Lending Business In Canada Has Been Resilient Through COVID-19 Impacts (US $ in millions) Only two competitors at comparable scale Best direct comparable company is goeasy Ltd (TSX:GSY) Stable, federally-defined regulator
Slide 13: Market Overview
13 Market Overview
Slide 14: The U.S. Personal Loan Market is Large and Growing
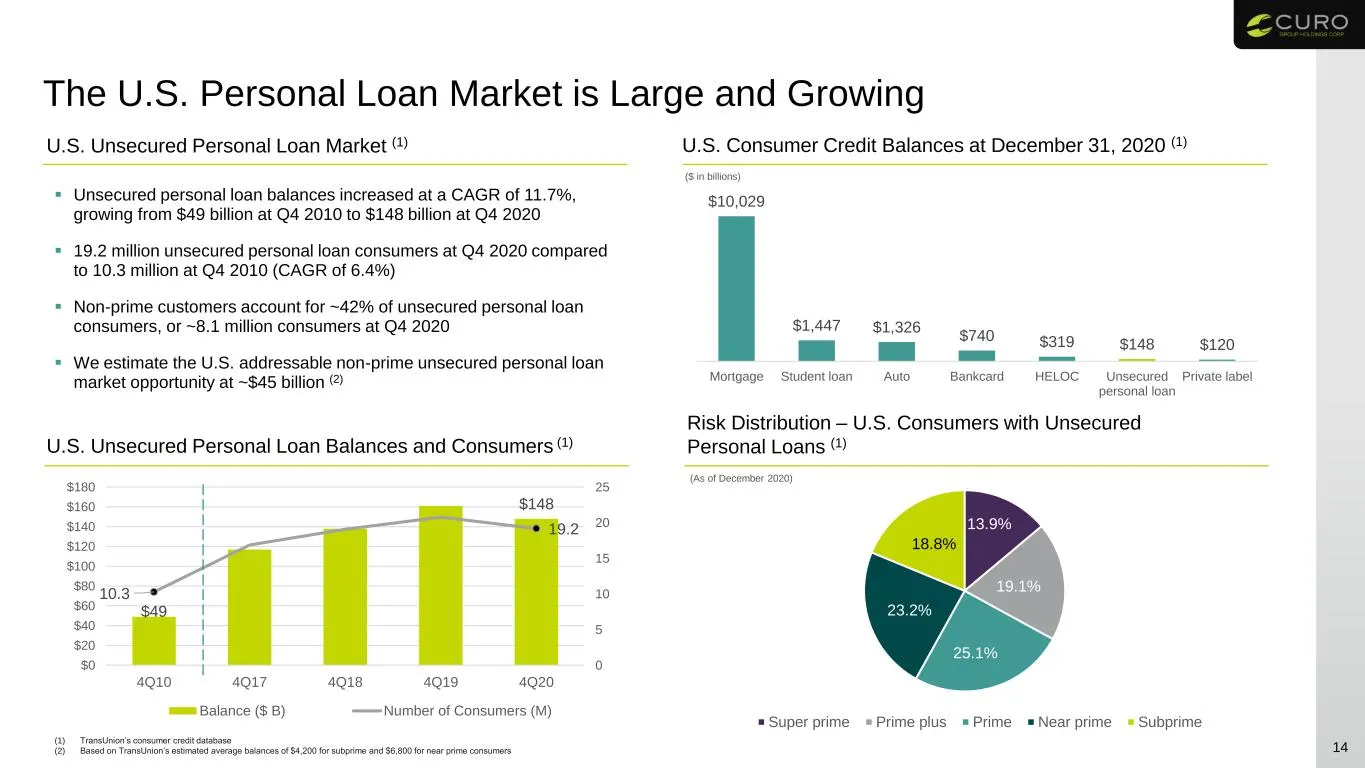
The U.S. Personal Loan Market is Large and Growing (1) TransUnion’s consumer credit database (2) Based on TransUnion’s estimated average balances of $4,200 for subprime and $6,800 for near prime consumers U.S. Consumer Credit Balances at December 31, 2020 (1) U.S. Unsecured Personal Loan Balances an
Slide 15: Large Addressable U.S. Market Remains Underserved
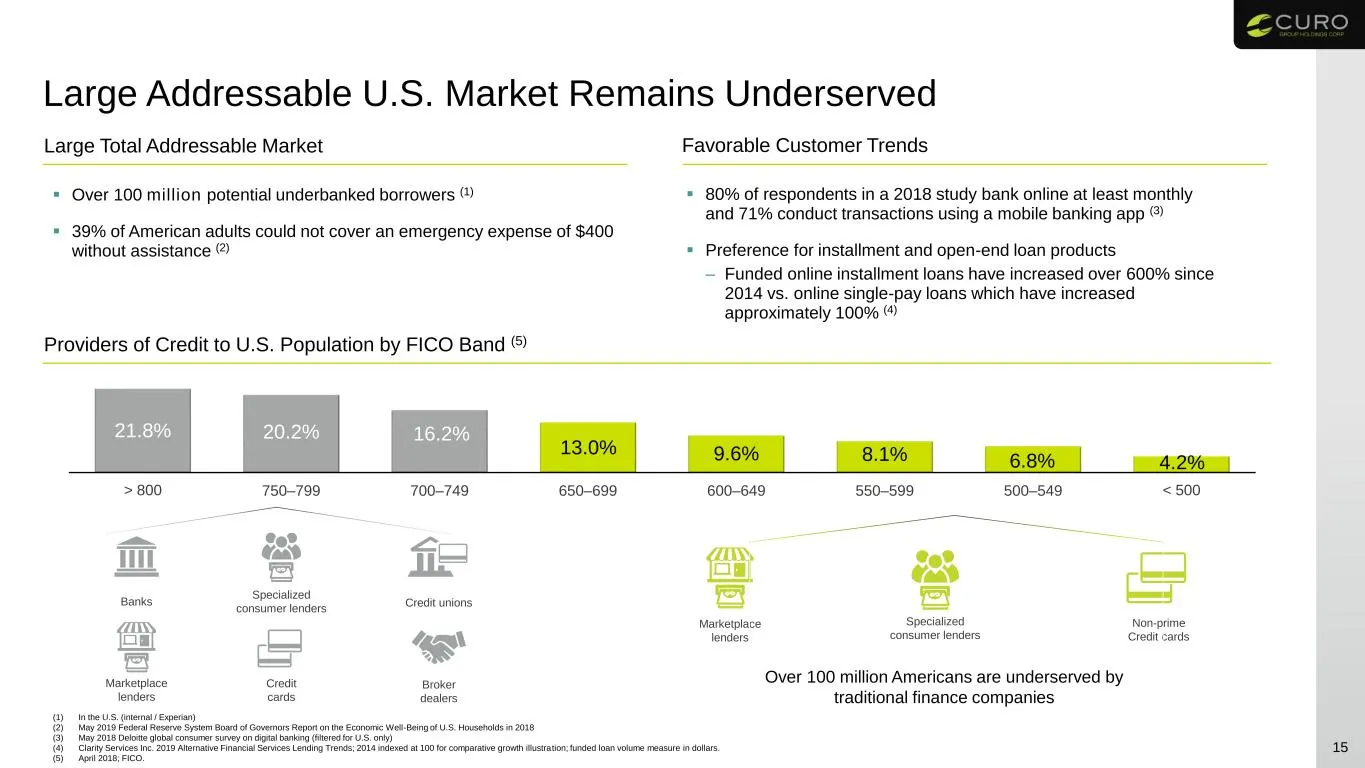
Large Addressable U.S. Market Remains Underserved 15 (1) In the U.S. (internal / Experian) (2) May 2019 Federal Reserve System Board of Governors Report on the Economic Well-Being of U.S. Households in 2018 (3) May 2018 Deloitte global consumer survey on digital banking (filtered for U.S. only) (4)
Slide 16: Evolving U.S. Competitive Landscape
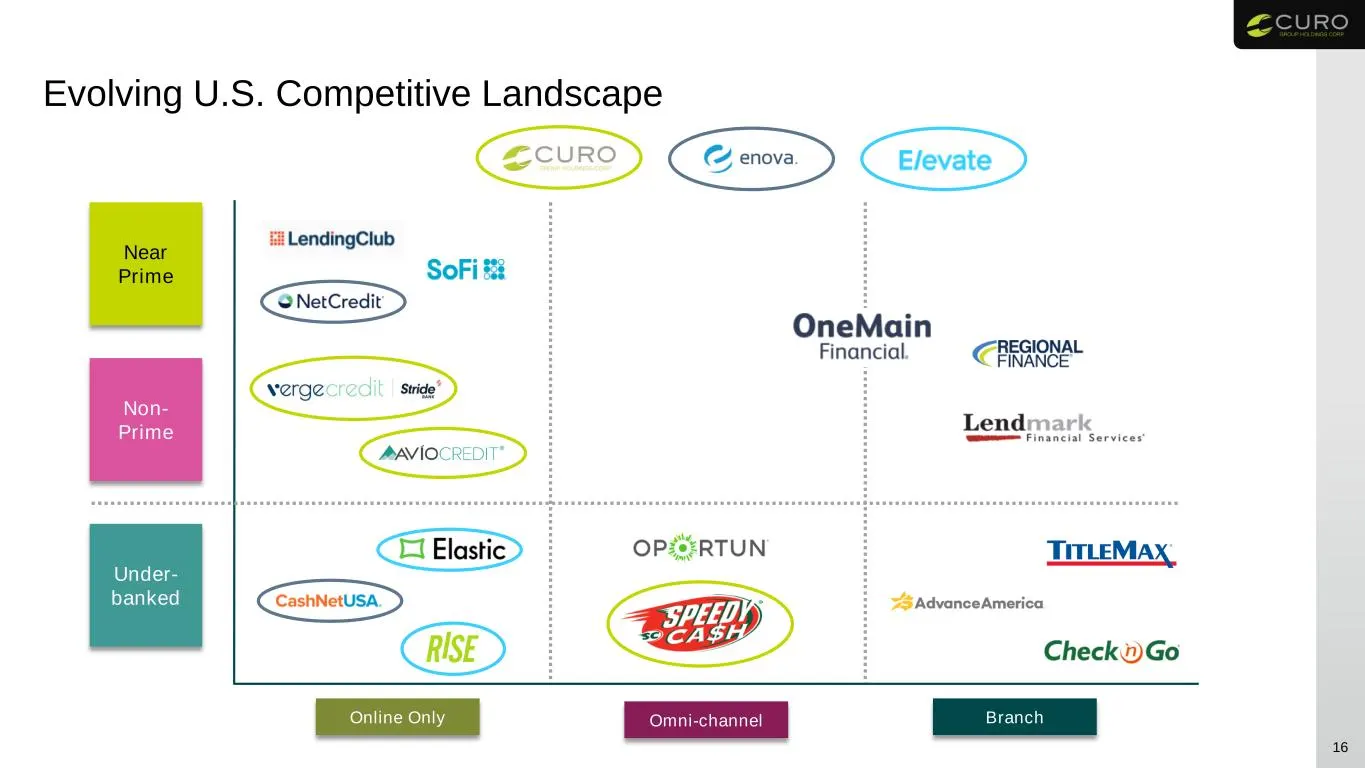
Evolving U.S. Competitive Landscape 16 Online Only Omni-channel Near Prime Non- Prime Under- banked Branch
Slide 17: Only Two Competitors at Scale in Canada
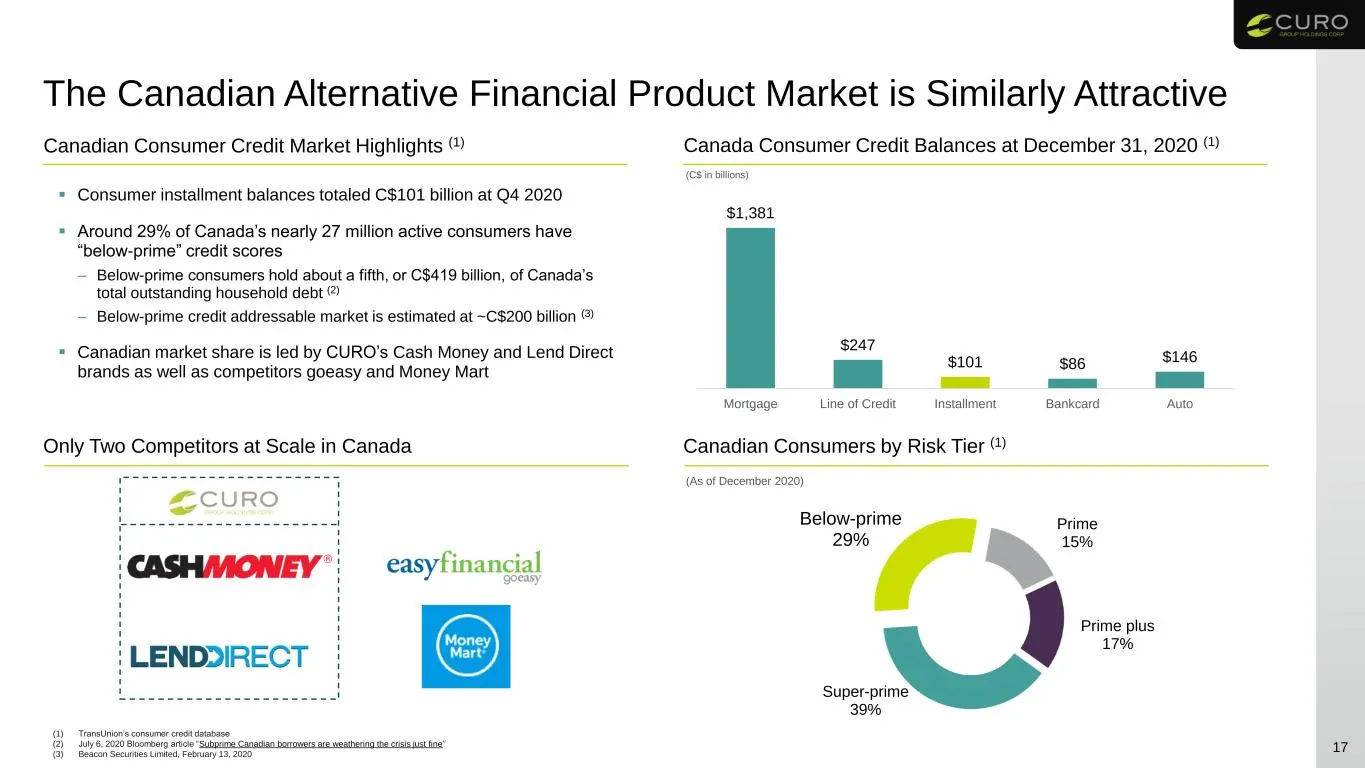
Only Two Competitors at Scale in Canada $1,381 $247 $101 $86 $146 Mortgage Line of Credit Installment Bankcard Auto The Canadian Alternative Financial Product Market is Similarly Attractive 17 (1) TransUnion’s consumer credit database (2) July 6, 2020 Bloomberg article “Subprime Canadian borrowers a
Slide 18: Canadian point-of-sale financing addressable market
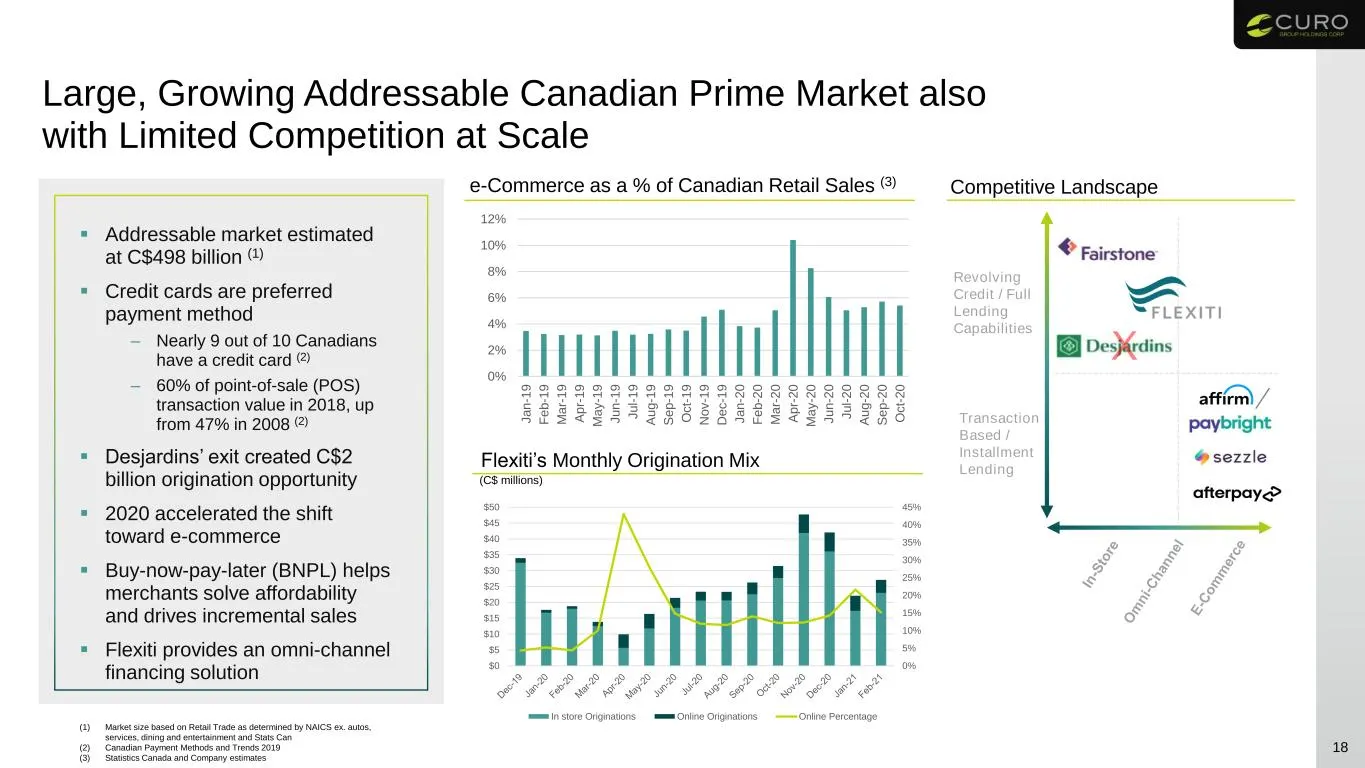
18 (1) Market size based on Retail Trade as determined by NAICS ex. autos, services, dining and entertainment and Stats Can (2) Canadian Payment Methods and Trends 2019 (3) Statistics Canada and Company estimates Addressable market estimated at C$498 billion (1) Credit cards are preferred paymen
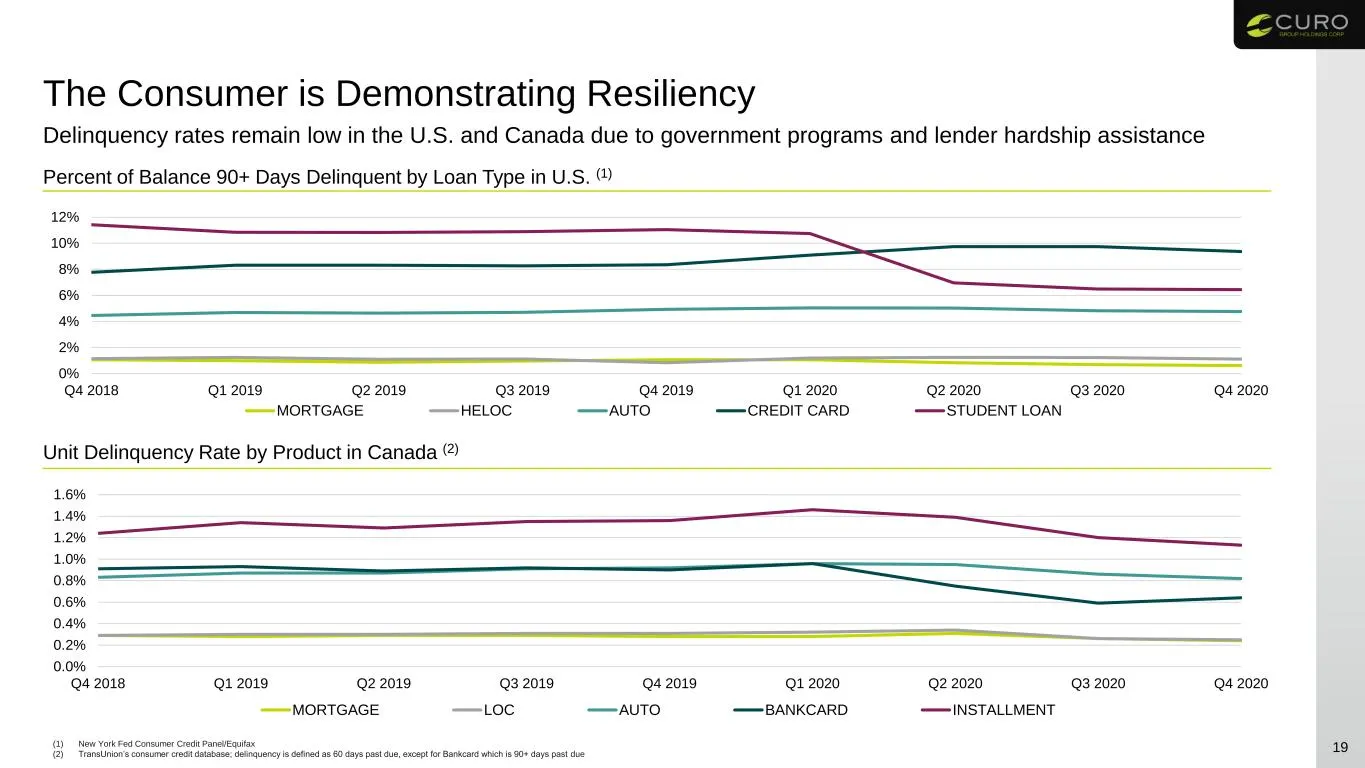
Slide 19: The Consumer is Demonstrating Resiliency
0.0% 0.2% 0.4% 0.6% 0.8% 1.0% 1.2% 1.4% 1.6% Q4 2018 Q1 2019 Q2 2019 Q3 2019 Q4 2019 Q1 2020 Q2 2020 Q3 2020 Q4 2020 MORTGAGE LOC AUTO BANKCARD INSTALLMENT The Consumer is Demonstrating Resiliency 19 Unit Delinquency Rate by Product in Canada (2) Percent of Balance 90+ Days Delinquent by Loan Type i
Slide 20: Strategic Growth Opportunities
20 Strategic Growth Opportunities
Slide 21: Execute on New Growth Opportunities
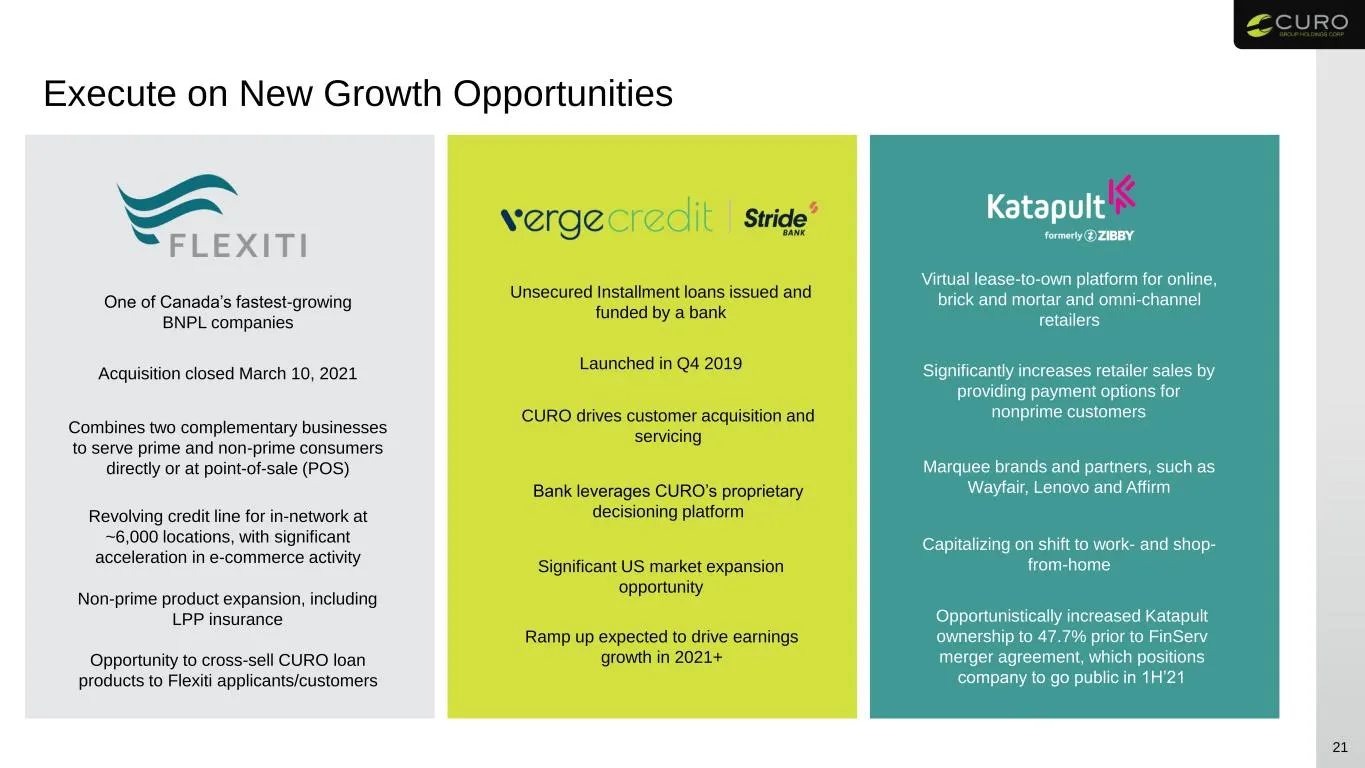
Execute on New Growth Opportunities Virtual lease-to-own platform for online, brick and mortar and omni-channel retailers Significantly increases retailer sales by providing payment options for nonprime customers Marquee brands and partners, such as Wayfair, Lenovo and Affirm Opportunistically incre
Slide 22: Katapult Transaction Summary
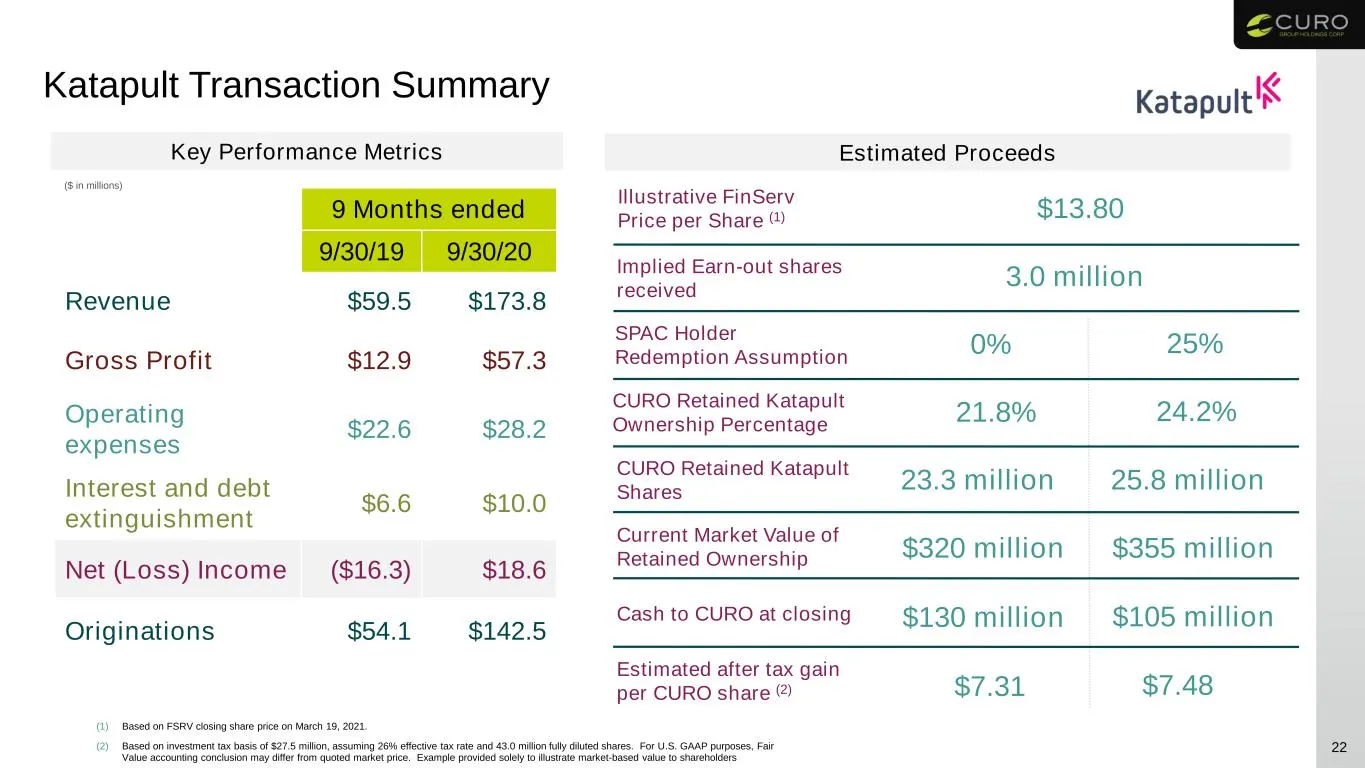
22 Katapult Transaction Summary Key Performance Metrics Illustrative FinServ Price per Share (1) $13.80 0% Estimated Proceeds SPAC Holder Redemption Assumption 25% Cash to CURO at closing $130 million $105 million CURO Retained Katapult Ownership Percentage 3.0 million Implied Earn-out shares receiv
Slide 23: Flexible Product Offerings: Company Overview – Flexiti
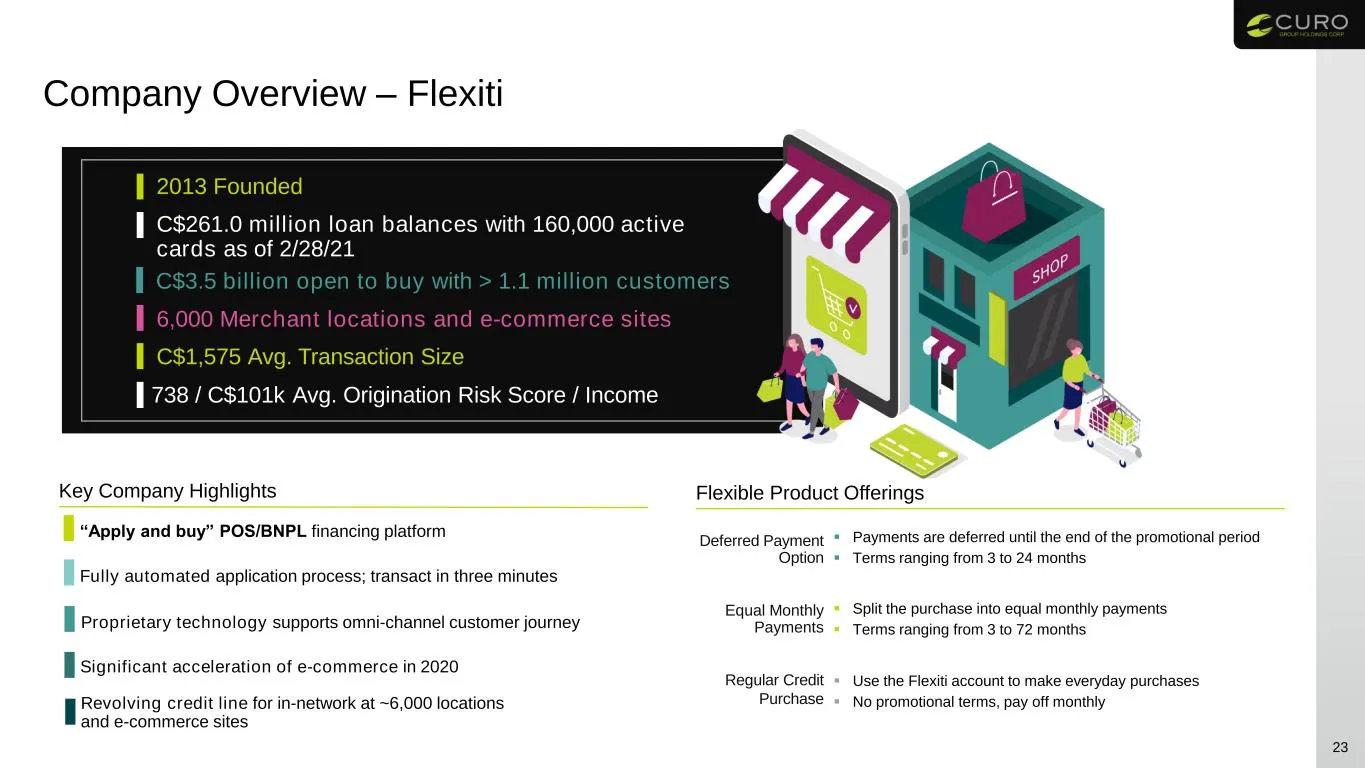
23 Flexible Product Offerings Payments are deferred until the end of the promotional period Terms ranging from 3 to 24 months Split the purchase into equal monthly payments Terms ranging from 3 to 72 months Use the Flexiti account to make everyday purchases No promotional terms, pay off
Slide 24: One of Canada's Fastest-Growing POS/BNPL Lenders
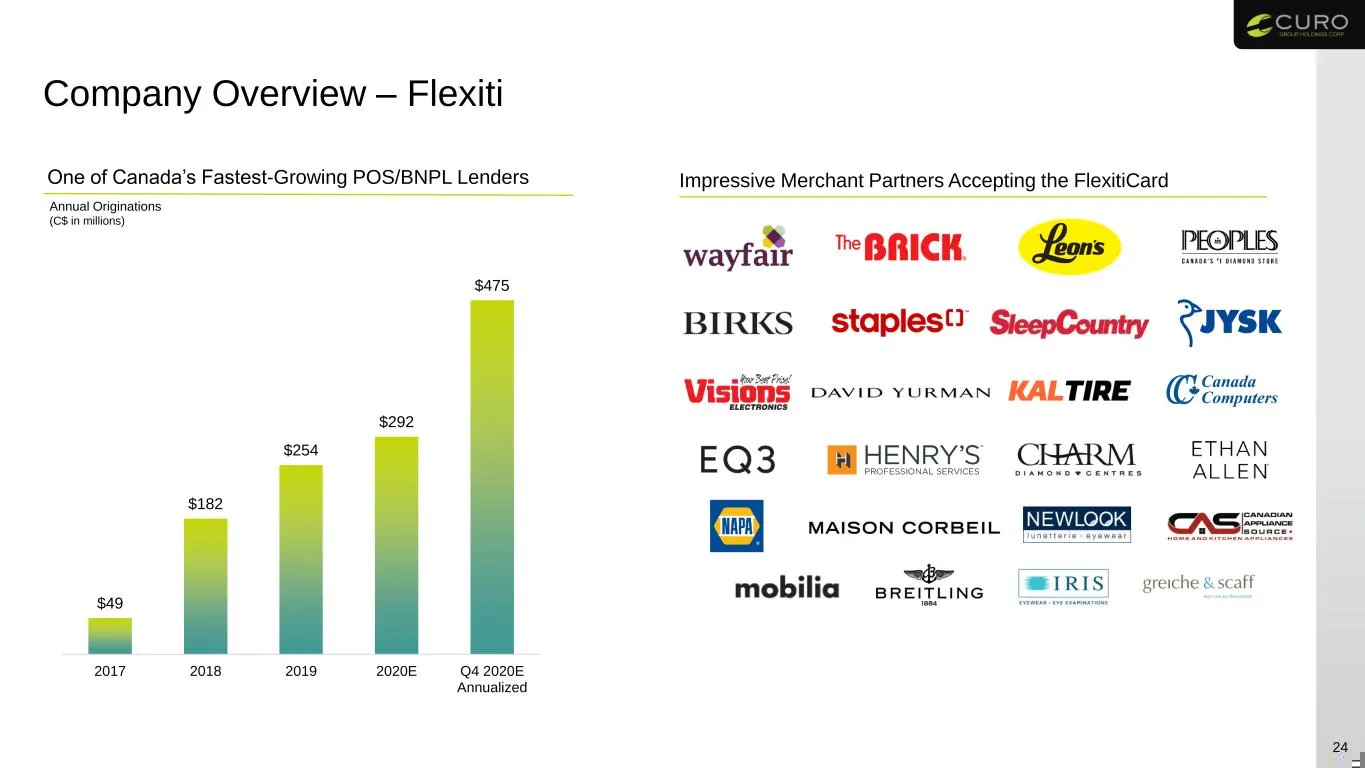
24 One of Canada’s Fastest-Growing POS/BNPL Lenders Annual Originations (C$ in millions) $49 $182 $254 $292 $475 2017 2018 2019 2020E Q4 2020E Annualized Impressive Merchant Partners Accepting the FlexitiCard Company Overview – Flexiti
Slide 25: Company Performance During COVID-19
25 Company Performance During COVID-19
Slide 26: Operating Highlights
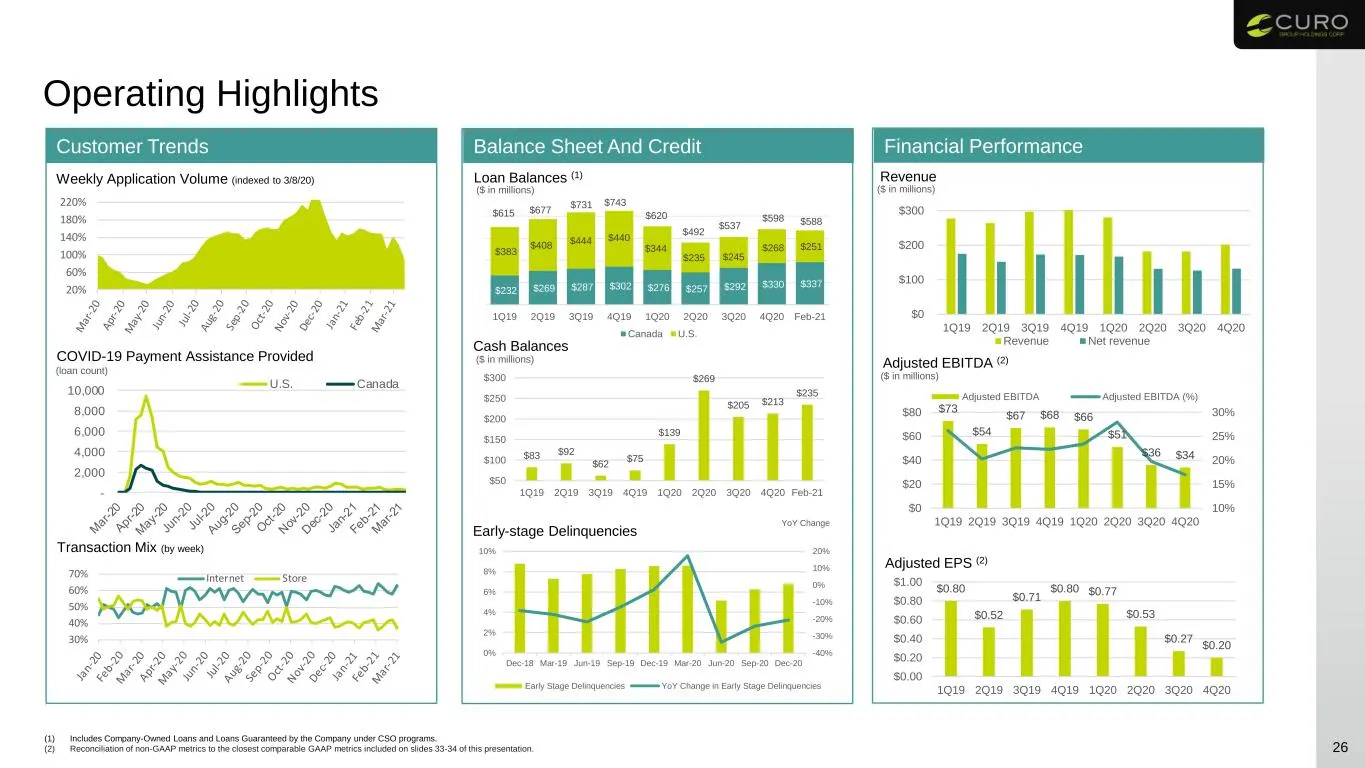
Operating Highlights 26 (1) Includes Company-Owned Loans and Loans Guaranteed by the Company under CSO programs. (2) Reconciliation of non-GAAP metrics to the closest comparable GAAP metrics included on slides 33-34 of this presentation. Customer Trends Weekly Application Volume (indexed to 3/8/20)
Slide 27: Customers are Managing their Finances Prudently
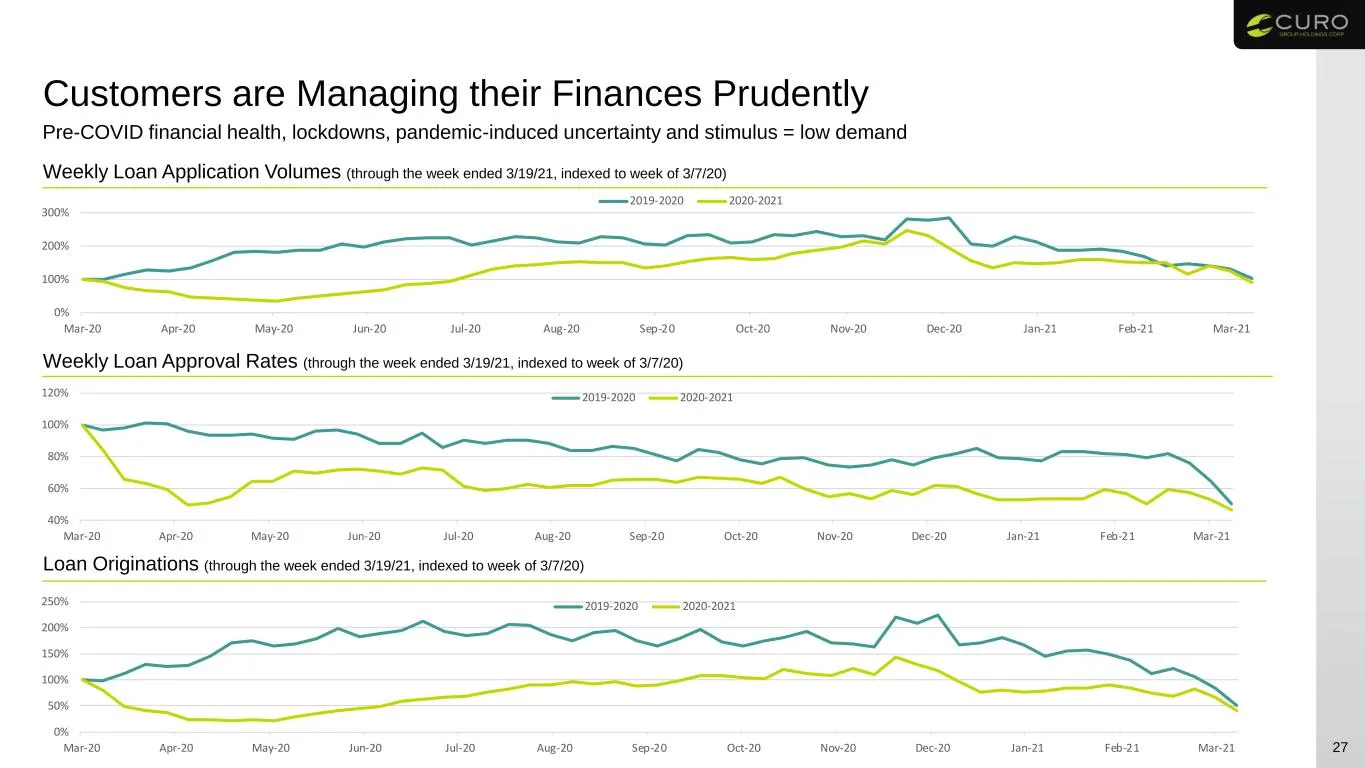
Customers are Managing their Finances Prudently 27 Pre-COVID financial health, lockdowns, pandemic-induced uncertainty and stimulus = low demand Weekly Loan Application Volumes (through the week ended 3/19/21, indexed to week of 3/7/20) Weekly Loan Approval Rates (through the week ended 3/19/21, ind
Slide 28: Customers are Managing their Finances Prudently (cont'd)
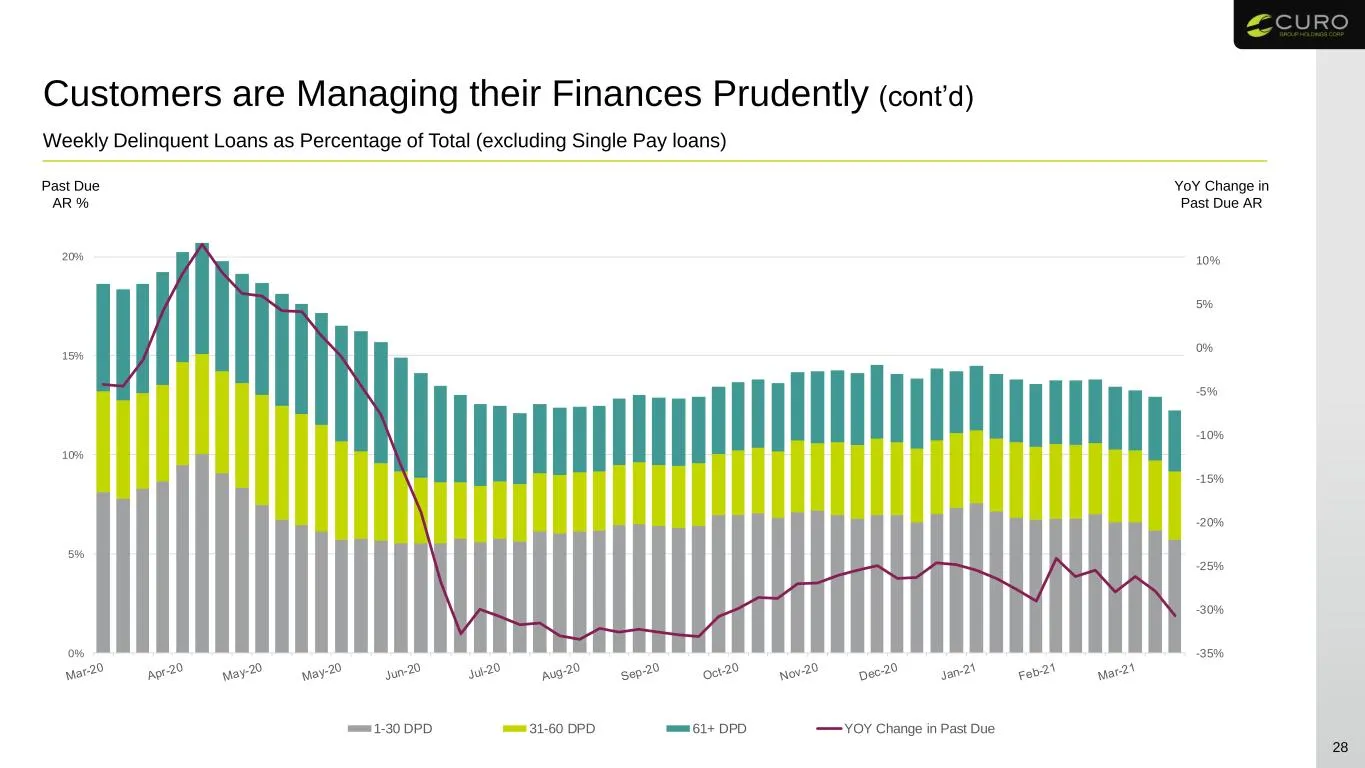
Customers are Managing their Finances Prudently (cont’d) YoY Change in Past Due AR Past Due AR % 28 Weekly Delinquent Loans as Percentage of Total (excluding Single Pay loans) -35% -30% -25% -20% -15% -10% -5% 0% 5% 10% 15% 0% 5% 10% 15% 20% 1-30 DPD 31-60 DPD 61+ DPD YOY Change in Past Due
Slide 29: Q1 2021 Outlook
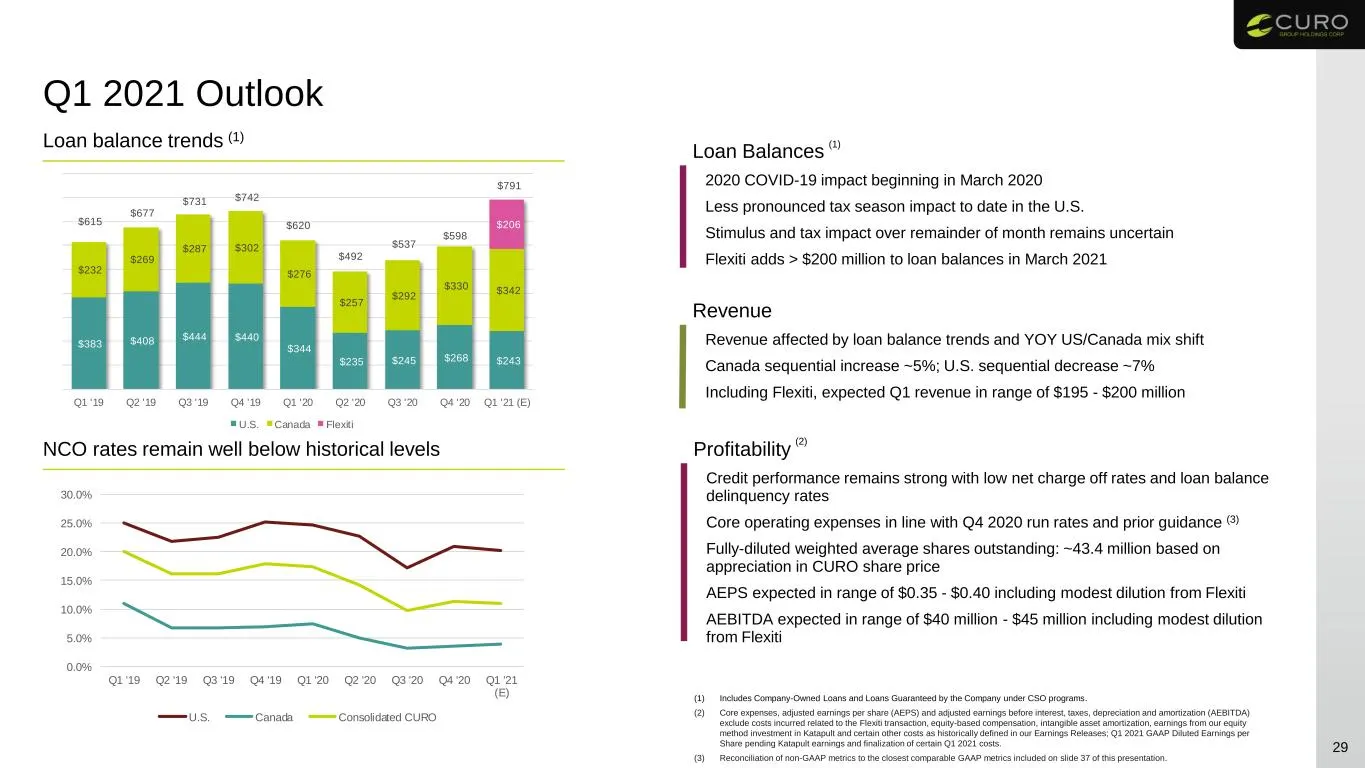
Q1 2021 Outlook 29 Loan balance trends (1) NCO rates remain well below historical levels (1) Includes Company-Owned Loans and Loans Guaranteed by the Company under CSO programs. (2) Core expenses, adjusted earnings per share (AEPS) and adjusted earnings before interest, taxes, depreciation and amort
Slide 30: Strong Debt Capitalization and Liquidity
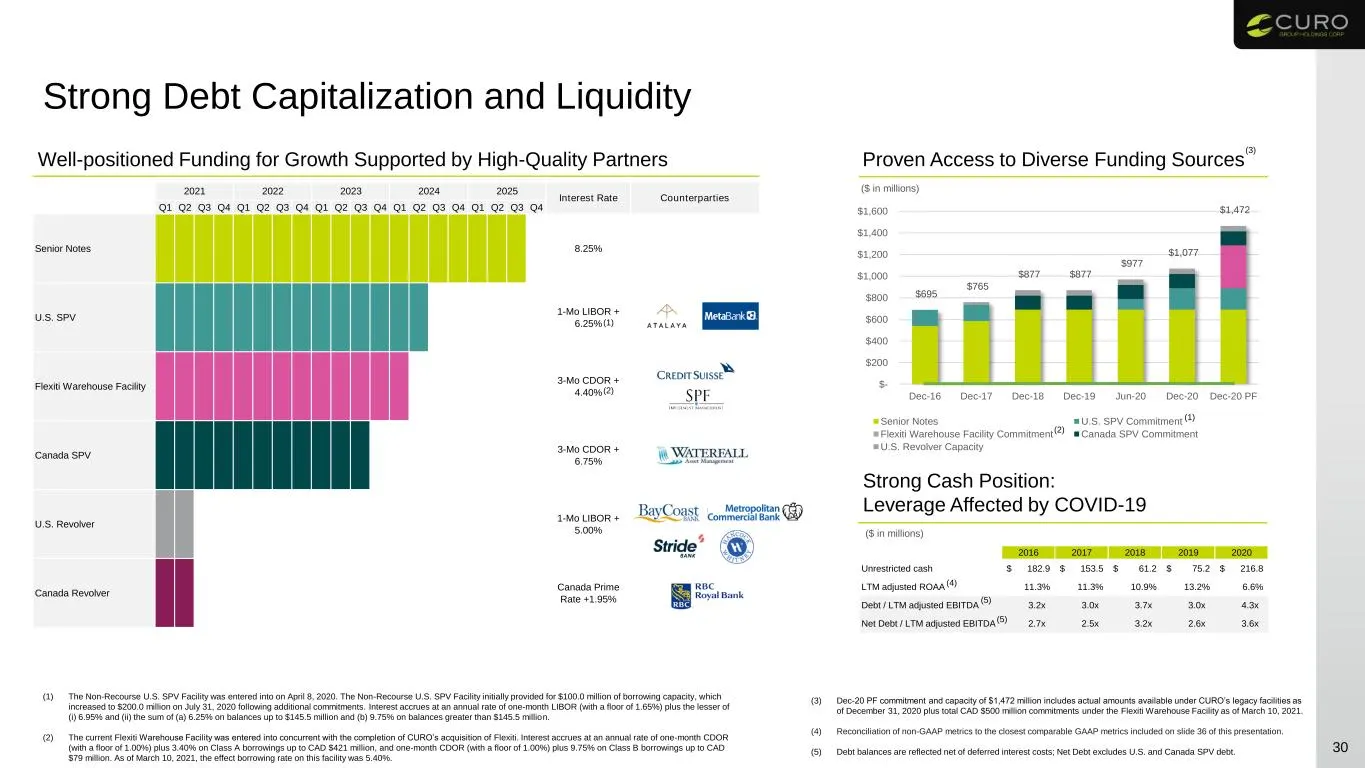
Q1 Q2 Q3 Q4 Q1 Q2 Q3 Q4 Q1 Q2 Q3 Q4 Q1 Q2 Q3 Q4 Q1 Q2 Q3 Q4 Senior Notes 8.25% U.S. SPV 1-Mo LIBOR + 6.25% Flexiti Warehouse Facility 3-Mo CDOR + 4.40% Canada SPV 3-Mo CDOR + 6.75% U.S. Revolver 1-Mo LIBOR + 5.00% Canada Revolver Canada Prime Rate +1.95% Interest Rate Counterparties 2021 2022 2023 2
Slide 31: COVID-19 Customer Care Plan Reinforces our Commitment to Service
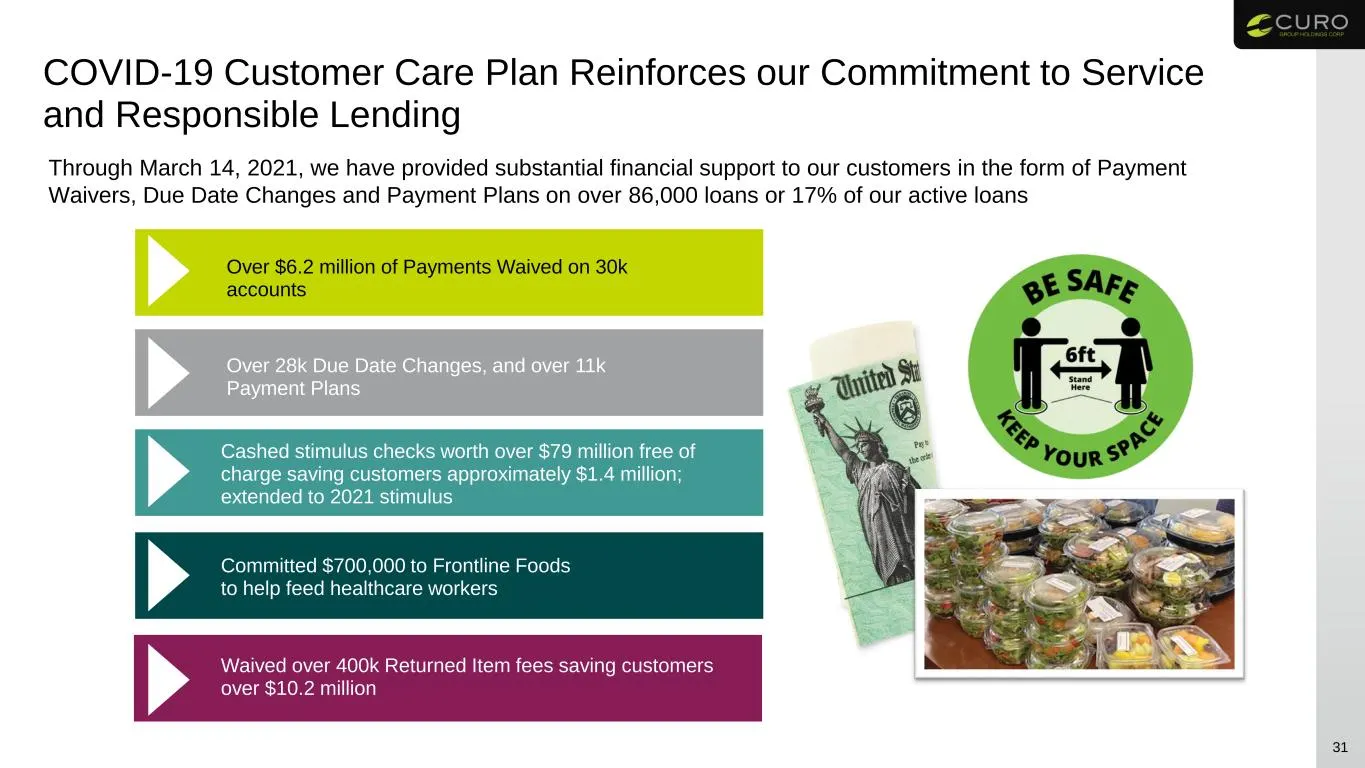
COVID-19 Customer Care Plan Reinforces our Commitment to Service and Responsible Lending 31 Through March 14, 2021, we have provided substantial financial support to our customers in the form of Payment Waivers, Due Date Changes and Payment Plans on over 86,000 loans or 17% of our active loans Over
Slide 32: Appendix
32 Appendix
Slide 33: Historical Consolidated Adjusted EBITDA Reconciliation
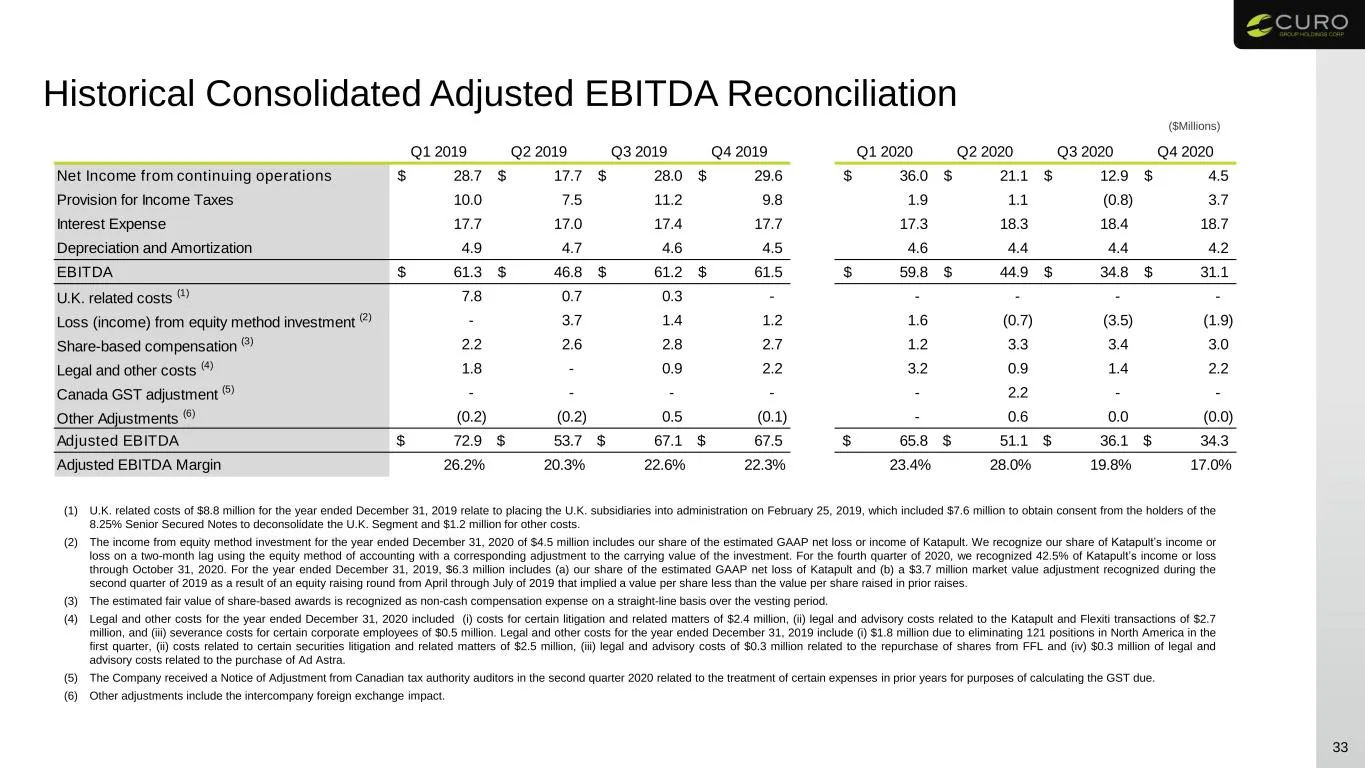
Historical Consolidated Adjusted EBITDA Reconciliation 33 ($Millions) (1) U.K. related costs of $8.8 million for the year ended December 31, 2019 relate to placing the U.K. subsidiaries into administration on February 25, 2019, which included $7.6 million to obtain consent from the holders of the 8.
Slide 34: Historical Consolidated Adjusted Net Income Reconciliation
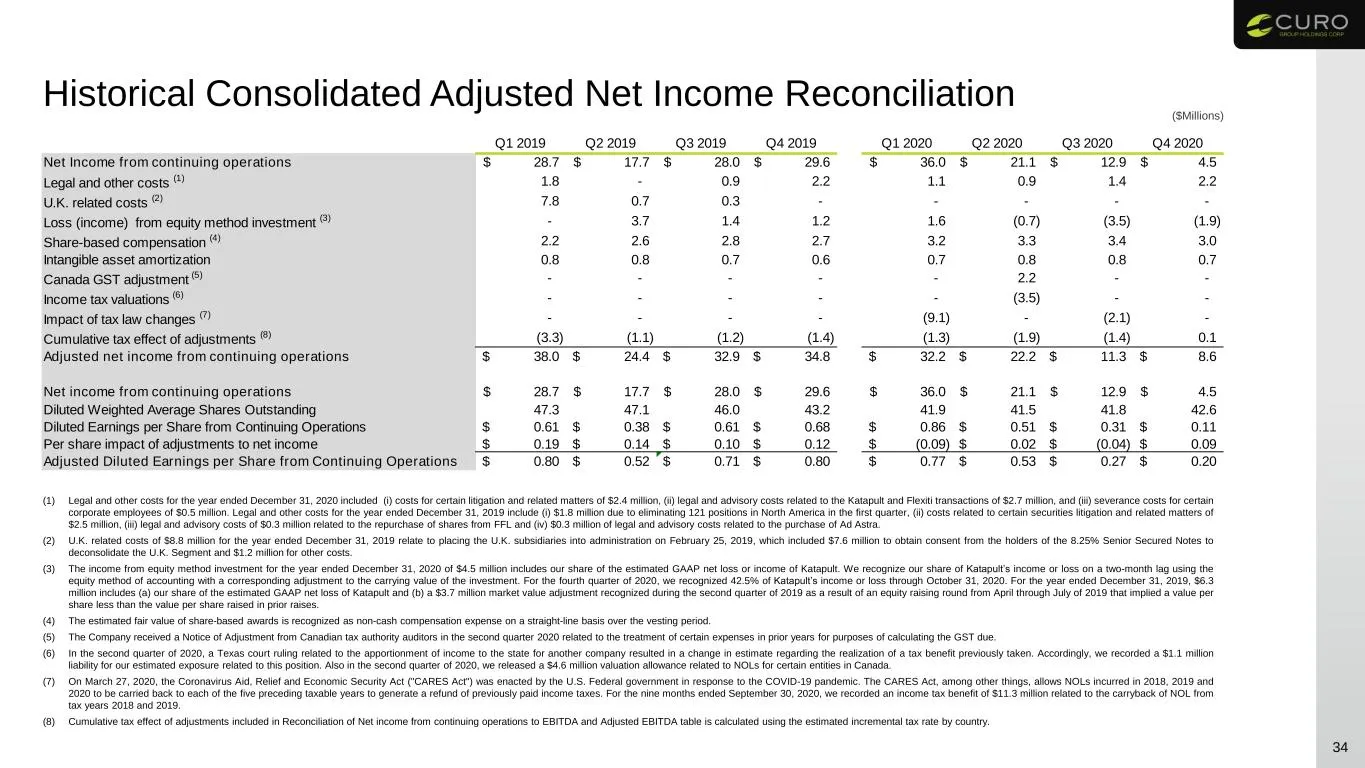
Historical Consolidated Adjusted Net Income Reconciliation 34 ($Millions) (1) Legal and other costs for the year ended December 31, 2020 included (i) costs for certain litigation and related matters of $2.4 million, (ii) legal and advisory costs related to the Katapult and Flexiti transactions of $2
Slide 35: Canada Adjusted EBITDA Reconciliation
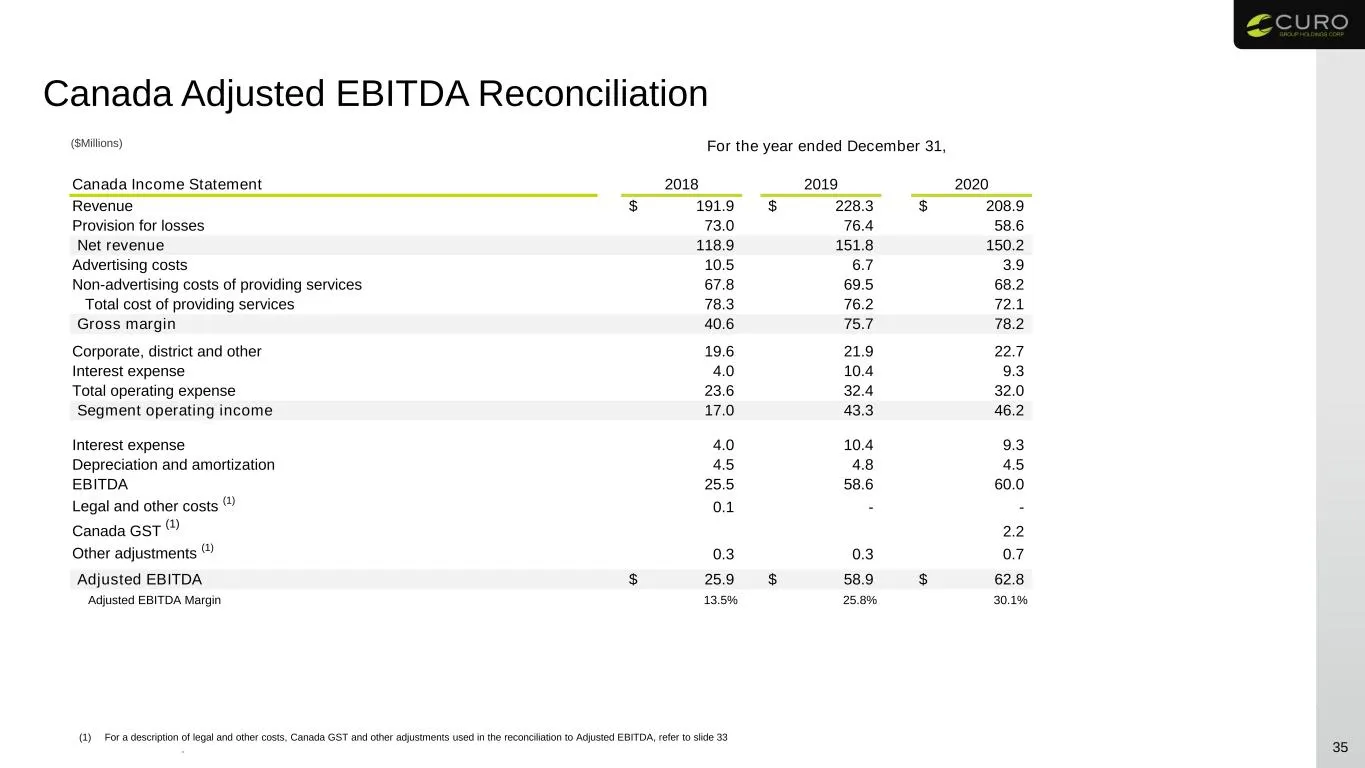
Canada Adjusted EBITDA Reconciliation 35 ($Millions) (1) For a description of legal and other costs, Canada GST and other adjustments used in the reconciliation to Adjusted EBITDA, refer to slide 33 . Canada Income Statement 2018 2019 2020 Revenue 191.9$ 228.3$ 208.9$ Provision for losses 73.0 76.4
Slide 36: Historical Gross Combined Loan Receivables and Adjusted ROAA Reconciliations
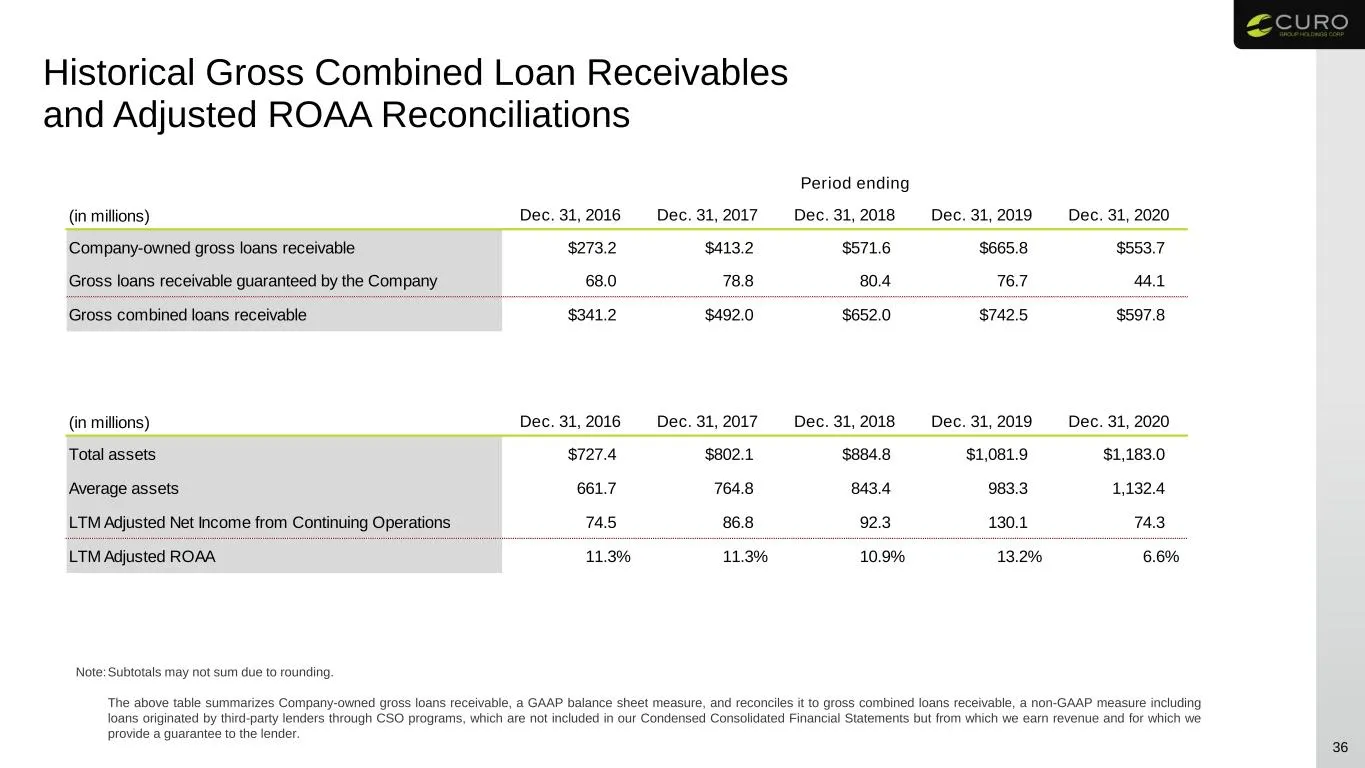
Historical Gross Combined Loan Receivables and Adjusted ROAA Reconciliations 36 Note:Subtotals may not sum due to rounding. The above table summarizes Company-owned gross loans receivable, a GAAP balance sheet measure, and reconciles it to gross combined loans receivable, a non-GAAP measure includin
Slide 37: Core Expenses Reconciliation
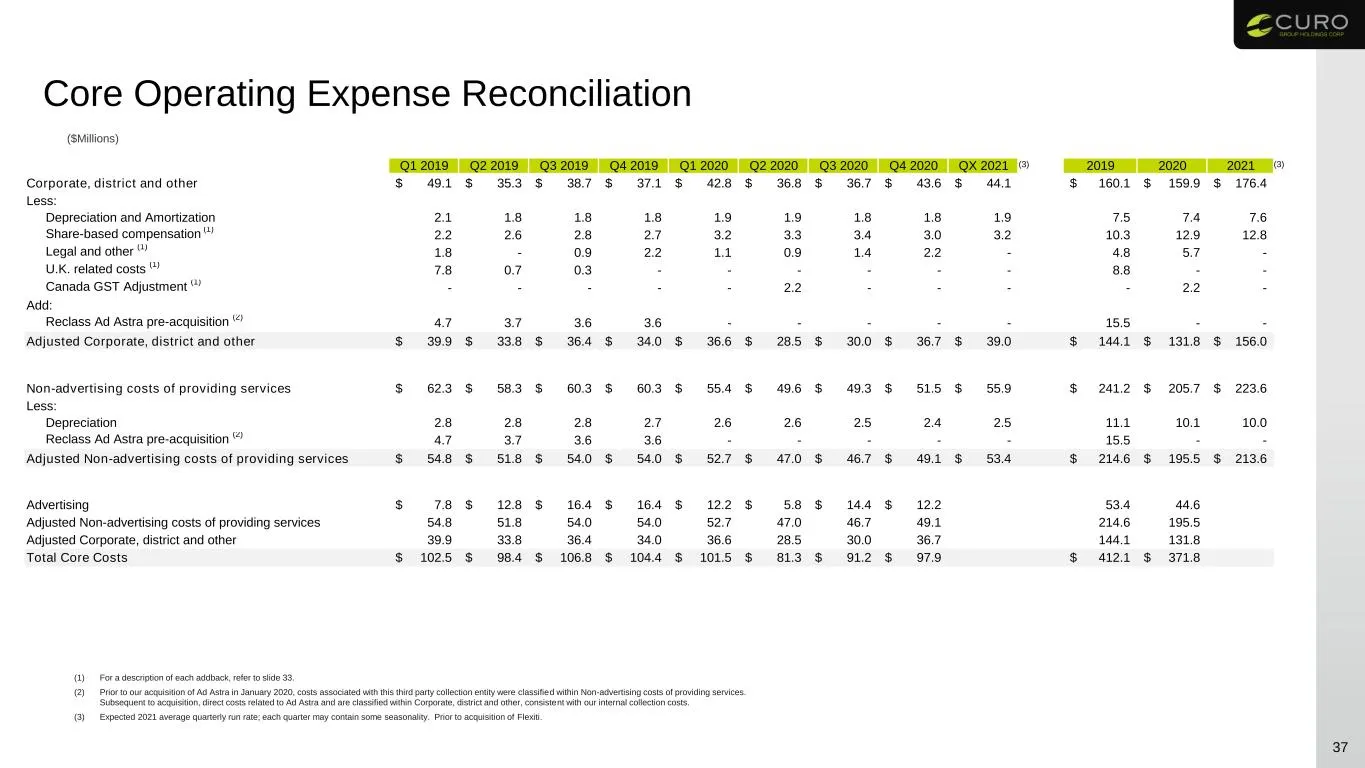
Q1 2019 Q2 2019 Q3 2019 Q4 2019 Q1 2020 Q2 2020 Q3 2020 Q4 2020 QX 2021 2019 2020 2021 Corporate, district and other 49.1$ 35.3$ 38.7$ 37.1$ 42.8$ 36.8$ 36.7$ 43.6$ 44.1$ 160.1$ 159.9$ 176.4$ Less: Depreciation and Amortization 2.1 1.8 1.8 1.8 1.9 1.9 1.8 1.8 1.9 7.5 7.4 7.6 Share-based compensation
Source: SEC EDGAR · 8-K filed Mar 22, 2021
More decks from Curo Group Holdings Corp
 Q4 2023 Earnings Presentation21 slides · Feb 12, 2024
 Investor Presentation (November 2023)15 slides · Nov 13, 2023
 Q3 2023 Earnings Presentation20 slides · Nov 2, 2023
 Debt Investor Presentation (October 2023)21 slides · Oct 23, 2023
 Investor Presentation (September 2023)15 slides · Sep 25, 2023
 Q2 2023 Earnings Presentation21 slides · Aug 3, 2023