Emclaire Financial — Shareholder Meeting (April 2014)
45 slides from Emclaire Financial's shareholder meeting presentation, Apr 22, 2014
Slide 1: 2014 Annual Meeting of Shareholders
Emclaire Financial Corp 2014 ANNUAL MEETING OF SHAREHOLDERS EMCLAIRE FINANCIAL CORP William C, Marsh Emlenton, Pennsylvania Chairman, President and April 22, 2014 Chief Executive Offic
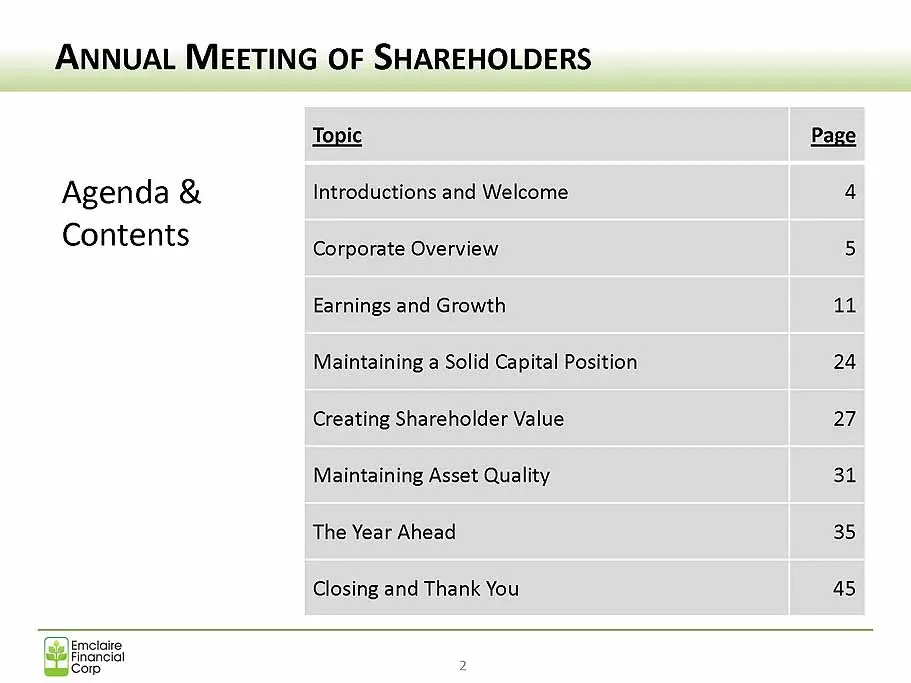
Slide 2: Annual Meeting of Shareholders Agenda & Contents
ANNUAL MEETING OF SHAREHOLDERS Topic Page Agenda & Introductions and Welcome 4 Contents Corporate Overview 5 Earnings and Growth ill, p 24 Creating Shareholder Value 27 Maintaining Asset Quality 31 The Year Ahead 35 Closing and Thank You 45 Emelaire 1S Financia Corp, 2

Slide 3: Legal
LEGAL forward- eceng pale nets and eee relating to othe nh that a e based on the beliefs of well by and informati tion currently available to management. TI hese “forward Jean statements relate to, among other things, expectations of the busin environment in which we operate, projections of future p
Slide 4: Introductions
INTRODUCTIONS * Board of Directors ° Executive Management ¢ Employees ¢ Crowe Horwath, LLP — Leah Blazek
Slide 5: Corporate Overview
CORPORATE OVERVIEW i Industry i ee ny Economy Emclaire & Financial Corp
Slide 6: Overview — Industry
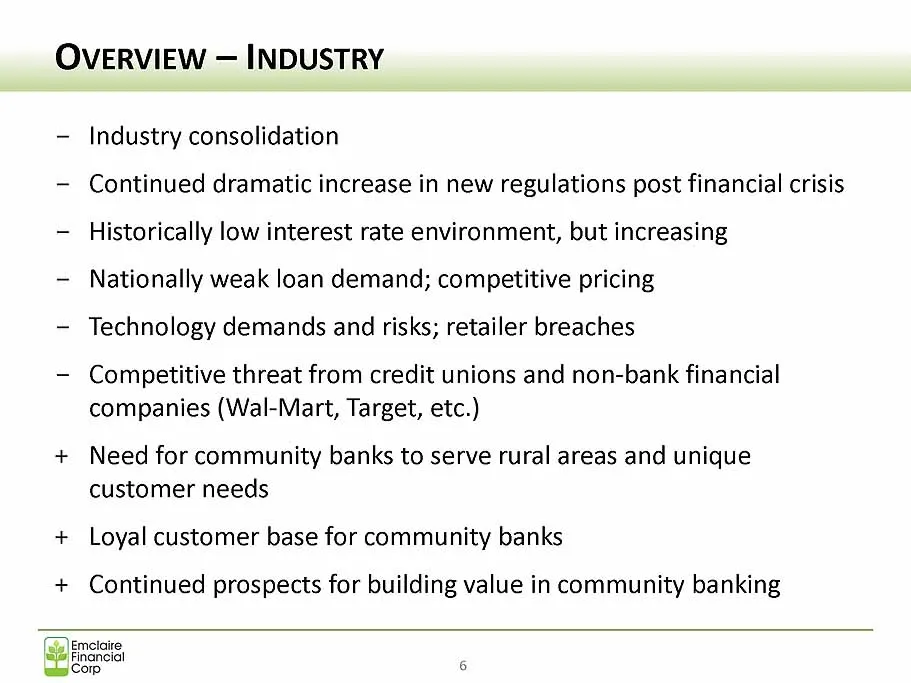
OVERVIEW — INDUSTRY + + Industry consolidation | ra aay Continued d i in new regulations p Historically low interest rate environment, but increasing Nationally weak loan demand; competitive pricing Technology demands and risks; retailer breaches Competitive threat from credit unions and non-bank fi
Slide 7: Overview — Industry Consolidation
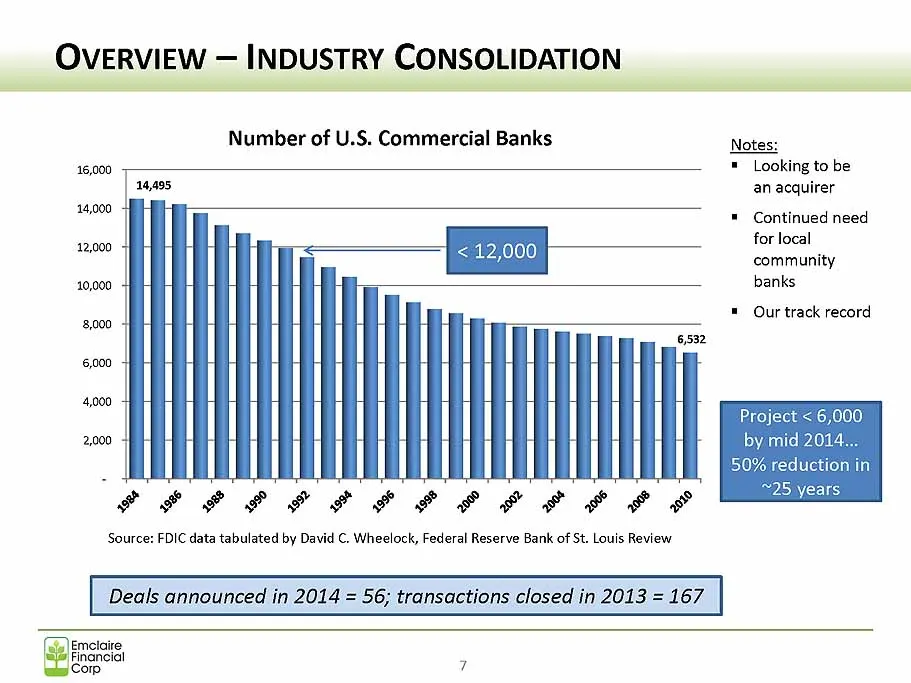
OVERVIEW — INDUSTRY CONSOLIDATION Oe Number of U.S. Notes: * Looking to be an acquirer ™ Continued need for local | Is dit ‘ransactions closed in 2013 = 167 | Emelaire Financial r Corp 7
Slide 8: Overview — Industry Consolidation
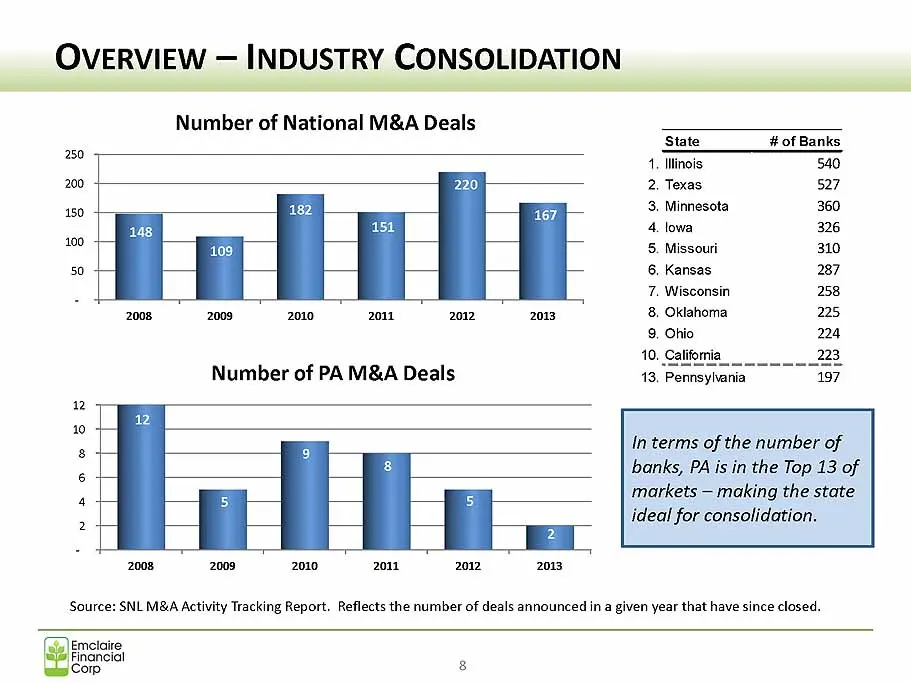
OVERVIEW — INDUSTRY CONSOLIDATION Number of National M&A Deals 2008 2003 2010 2011 2012 2013 State # of Banks 4, Illinois 340 2, Texas $27 ‘3. Minnesota 360 4. lowa 326 5. Missouri 310 6, Kansas 287 7. Wisconsin 258 8, Oklahoma 225, 9, Ohio 224 10.caliomia ma 13, Pennsylvania 197 2008 2009 2010 2011
Slide 9: Overview — Company
OVERVIEW — COMPANY Two new branch offices Stable earnings Consistent balance sheet growth Stable asset quality Stable capital position Positioned for continued expansion Continue to look at acquisition and other growth opportunities that provide value Need for scale
Slide 10: Overview — Economy
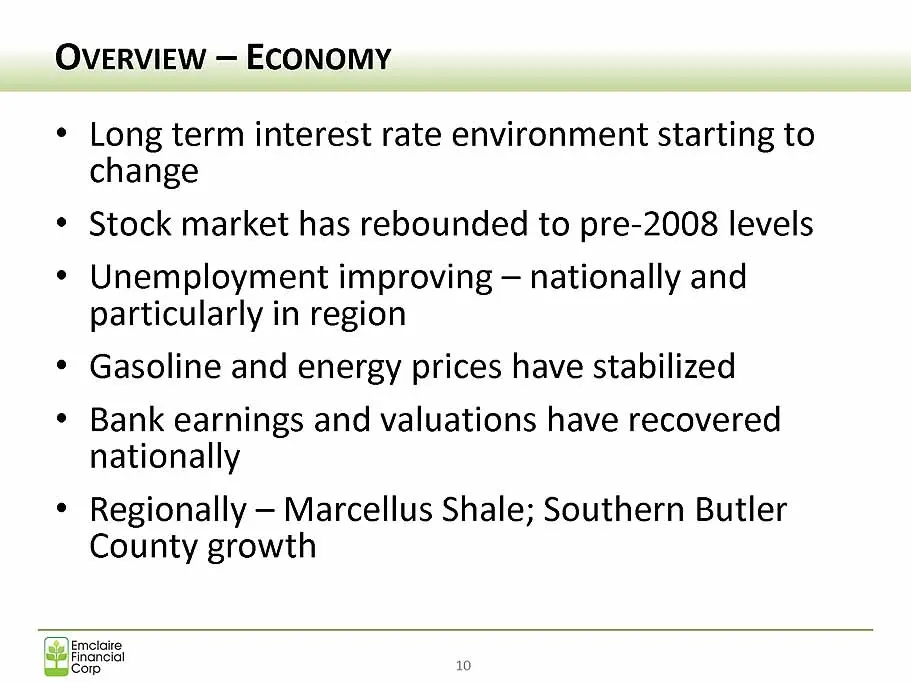
OVERVIEW — ECONOMY ¢ Long term interest rate environment starting to change * Stock market has rebounded to pre-2008 levels ¢ Unemployment improving — nationally and particularly in region * Gasoline and energy prices have stabilized Bank earnings and valuations have recovered nationally Regionally
Slide 11: Earnings and Growth
EARNINGS AND GROWTH | Components of Growth Seine I Financial Cop a
Slide 12: Consolidated Financial Highlights
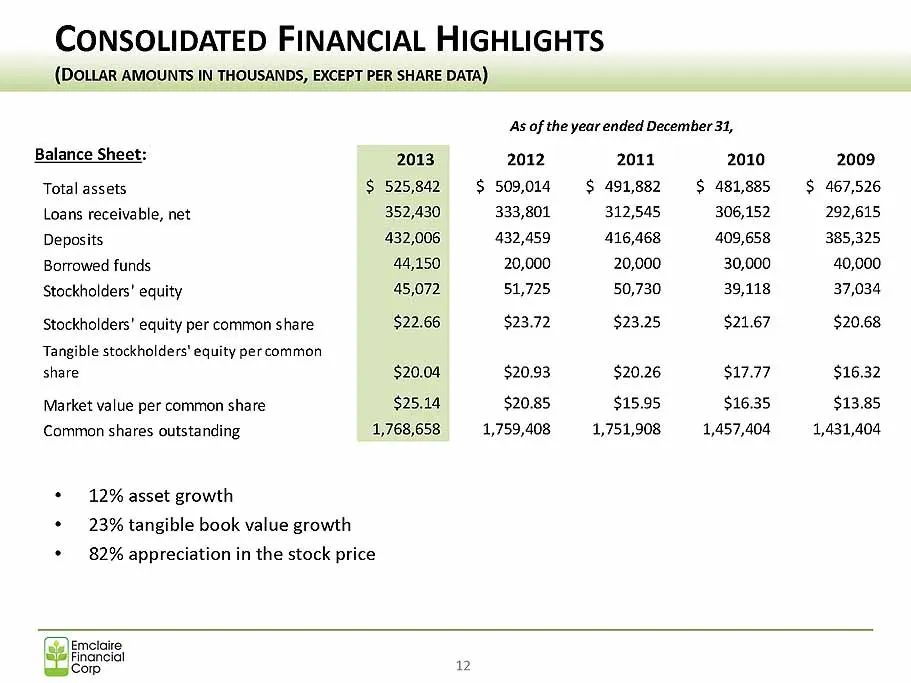
CONSOLIDATED FINANCIAL HIGHLIGHTS As of the year ended December 31, Balance Sheet: 2013 2012 2011 2010 2009 Total a: $ 525,842 $ 509,014 $ 491,882 $ 481,885 $ 467; coans receivable, net 352,430 333, 312; 306,152 292,615 Deposits 432,006 432,459 16,468 409,658 385,325 Borrowed funds , 20,000 20,000 3
Slide 13: Consolidated Financial Highlights
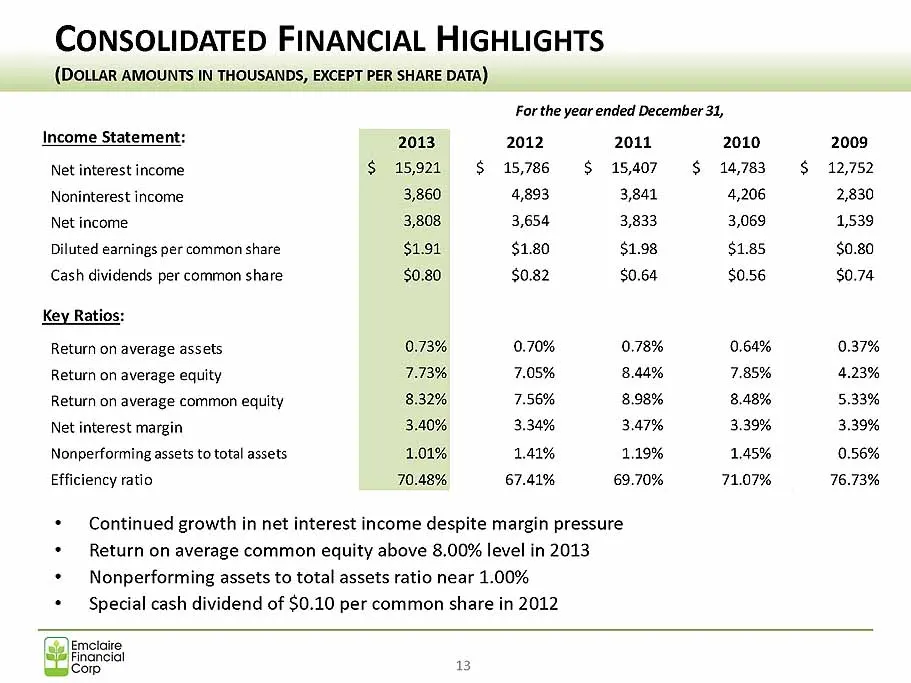
CONSOLIDATED FINANCIAL HIGHLIGHTS Income Statement: 2013 Net interest income $ 15,921 Noninterest income 3,860 income 3,808 Diluted earnings per common share $1.91 Cash dividends per common share $0.80 Key Ratios: Return on average assets 0.73% Return on average equity 7.73% Return on average common
Slide 14: Earnings — 2013 Compared to 2012
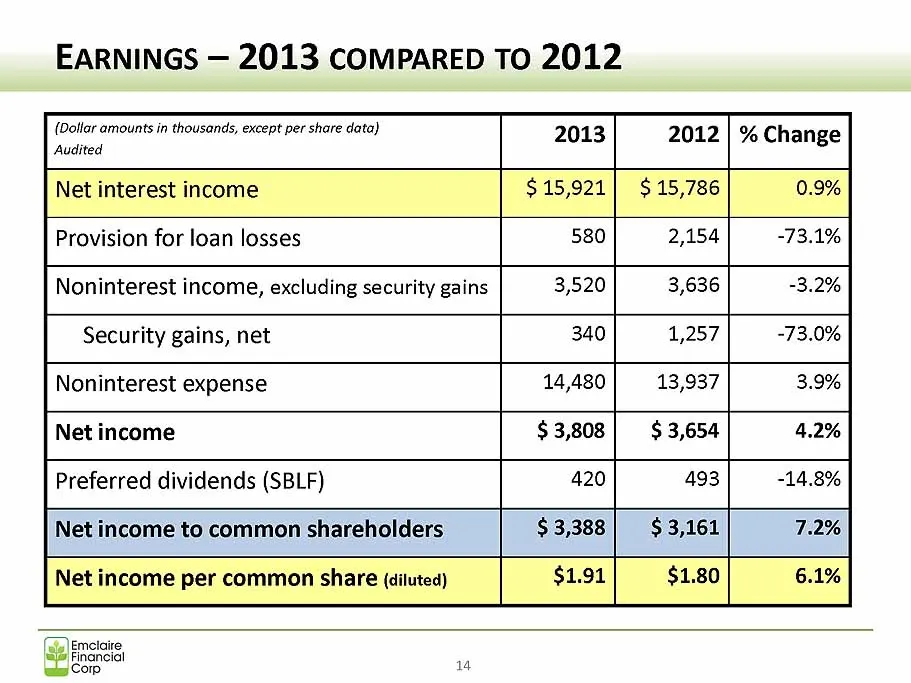
EARNINGS — 2013 COMPARED TO 2012 ‘nualted 2013 2012 | % Change | Net interest income $15,921] $15,786 0.9% Provision for loan losses 580 2,154 -73.1% i i 3,520 3,636 -3.2% Security gains, net 340 1,257 -73.0% Noninterest expense 14,480 13,937 3.9% Net income $3,808] $3,654 4.2% Preferred dividends (
Slide 15: Earnings — 2013 Compared to 2012
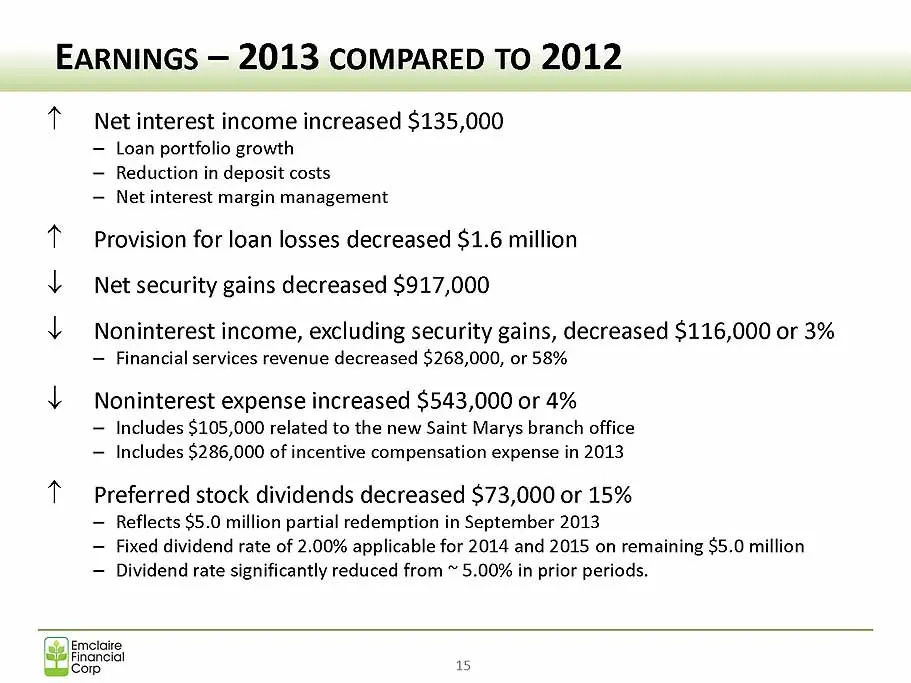
EARNINGS — 2013 COMPARED TO 2012 * i i i "| 000 — Loan portfolio growth — Reduction in deposit costs — Net interest margin management * Provision for loan losses decreased $1.6 million V y gains d d $917,000 J ‘ ; ludi ity gains, decreased $116,000 or 3% _ A A or. V . ; 000 or 4% t i f, J dtd de-ol:
Slide 16: Earnings — 1Q 2014 Compared to 1Q 2013
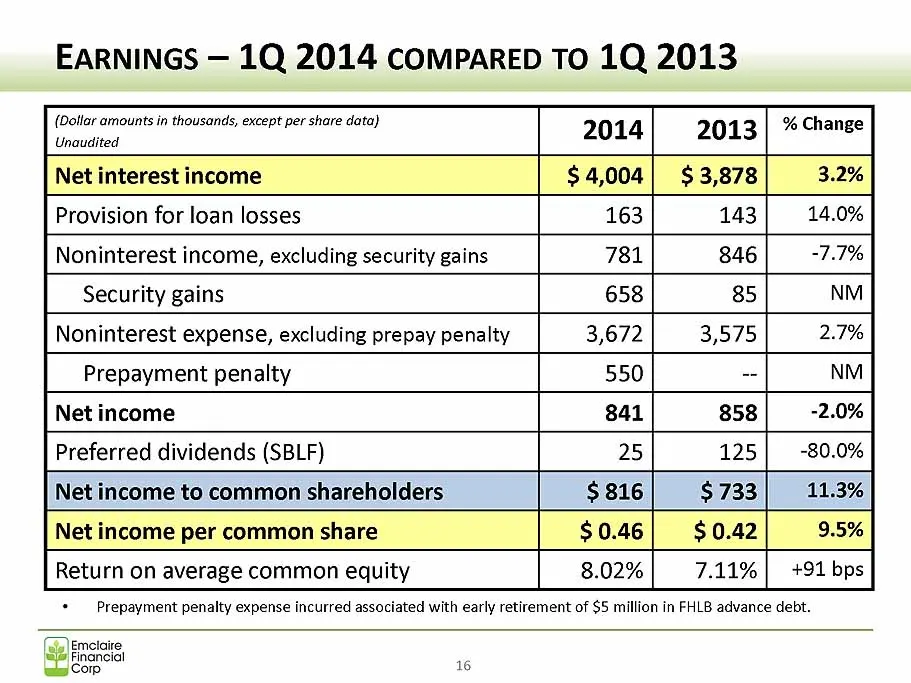
EARNINGS — 1Q 2014 compareD TO 1Q 2013 ees 2014 2013 | % Change | Net interest income $4,004| $3,878 3.2% Provision for loan losses 163 143 14.0% i i 781 846 -7.7% Security gains 658 85 NM i 3,672 3,575 2.7% F 550 a NM Net income 841 858 -2.0% Preferred dividends a 25 125 -80.0% | Net income t $816
Slide 17: Earnings — 1Q 2014 Compared to 1Q 2013
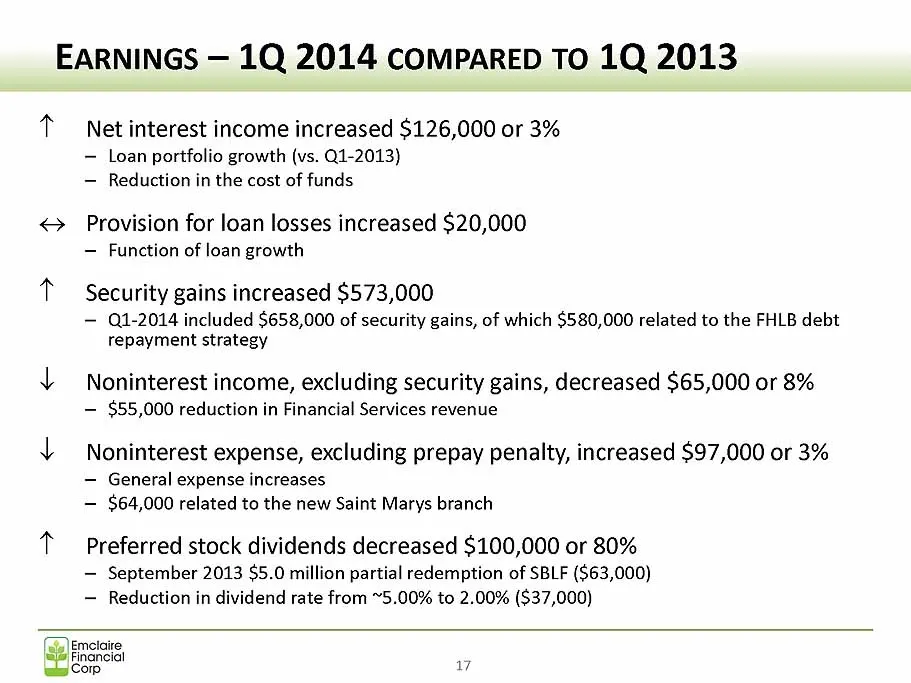
EARNINGS — 1Q 2014 compareD TO 1Q 2013 + 3% — Loan portfolio growth (vs. Q1-2013) — Reduction in the cost of funds © Provision for Function of loan growth -al repayment strategy t Pref ni Leip tereeaeed 80% Emelaire parcial Con 17
Slide 18: Earnings Considerations
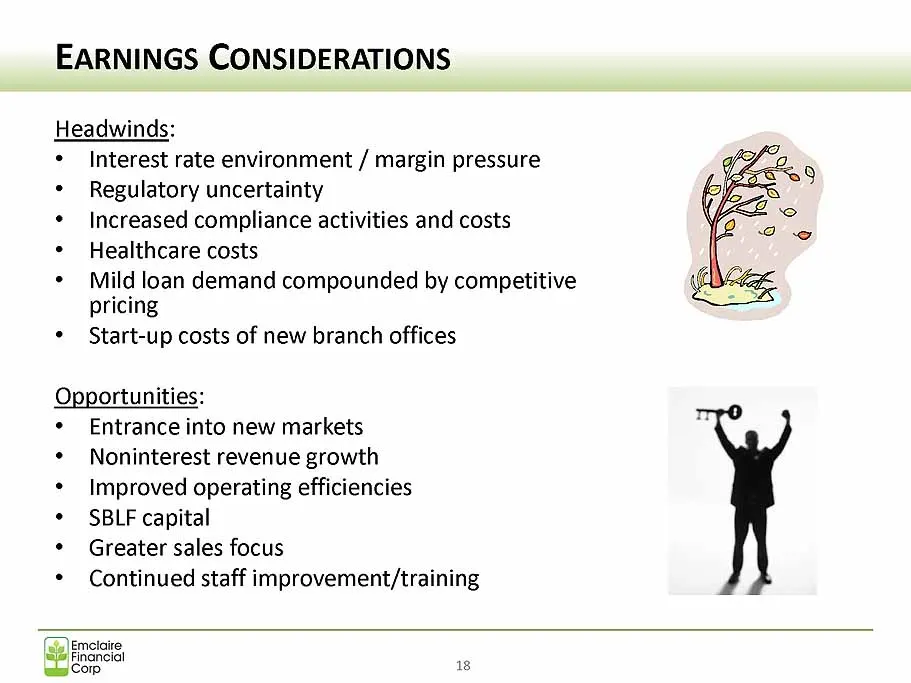
EARNINGS CONSIDERATIONS Headwinds: * Interest rate environment / margin pressure ¢ Regulatory uncertainty and costs ¢ Healthcare costs Mild | / pricing * Start-up costs of new branch offices Opporty tunities Entrance into new markets * Noninterest revenue growth . ar Be PE a cr . SBLF capital Greate
Slide 19: Consolidated Balance Sheets
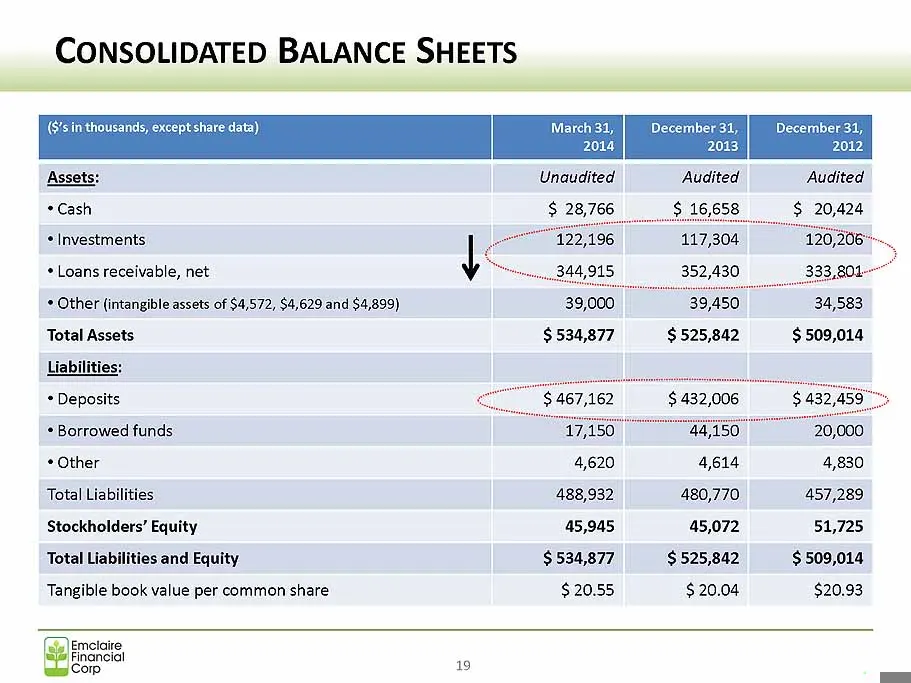
CONSOLIDATED BALANCE SHEETS (Pisin thousands, except share data) March 31, | December 31, December 31, 2014 2013 2012 Assets: Unaudited Audited Audited $ 20,424 117,304 120,208... 352,430 000 -=St« 9, Total Assets $534,877 $525,842 $509,014 Liabi *Cash * Investments * Loans receivable, net * Deposit
Slide 20: Consolidated Balance Sheets
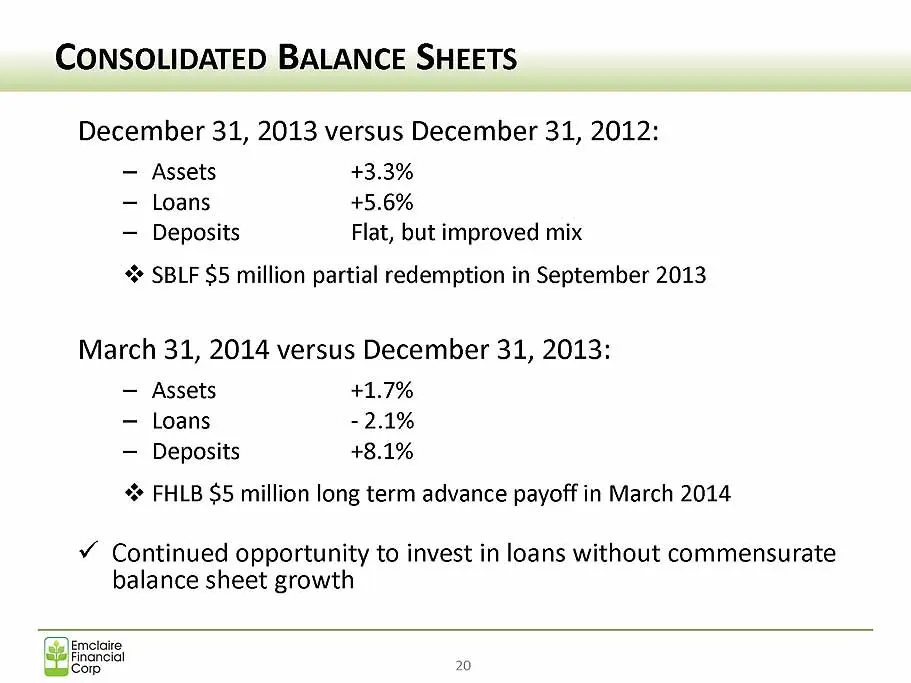
CONSOLIDATED BALANCE SHEETS December 31, 2013 versus December 31, 2012: — Assets +3.3% — Loans +5.6% — Deposits Flat, but improved mix + SBLF $5 million ial red ion i ber 2013 March 31, 2014 versus December 31, 2013: — Assets +1.7% a -2.1% — Deposits +8.1% “ FHLB $5 million long term advance payoff
Slide 21: Balance Sheet Growth
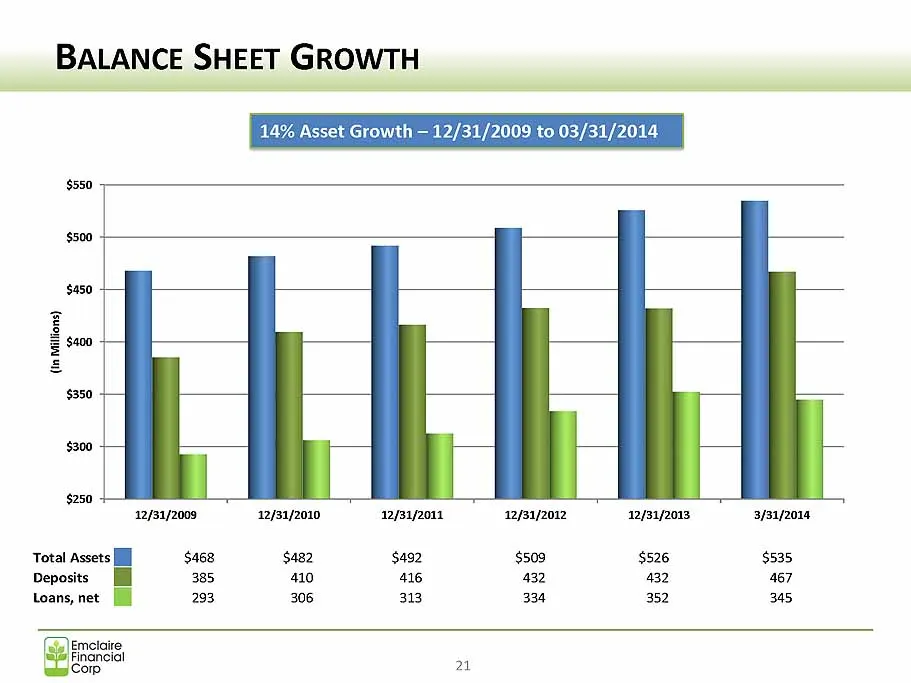
BALANCE SHEET GROWTH 14% Asset Growth — 12/31/2009 to 03/31/2014 $450 + 2 sao 4 $350 $300 $250 32/31/2008 32/31/2010 32/31/2011 22/31/2012 22/31/2013 3/31/2014 Total Assets [il $468 $482 $492 $509 $526 $535 Deposits 385 410 416 432 432 467 Loans, net [i 293 306 313 334 352 345
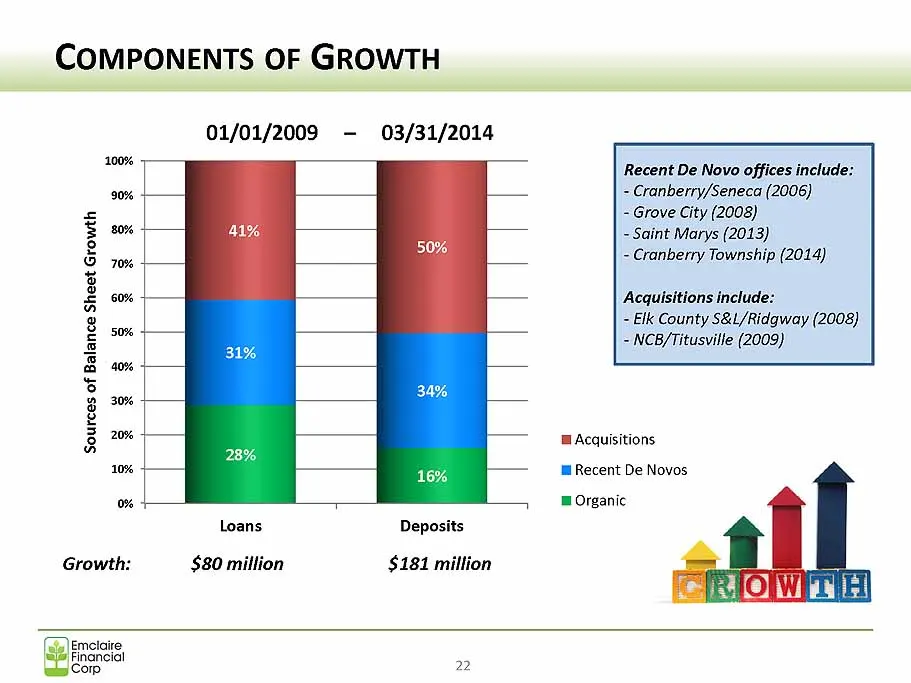
Slide 22: Components of Growth
COMPONENTS OF GROWTH Sources of Balance Sheet Growth 01/01/2009 - 03/31/2014 loans Deposits Growth: $80 million $181 million ra ised De Novo offices include: rranberry/Seneca (2006) - ae ry (201 at ne larys (2013) berry Township (2014) Acquisitions tnciide: - Elk County S&1/Ridgway (2008) - NCB/Titu
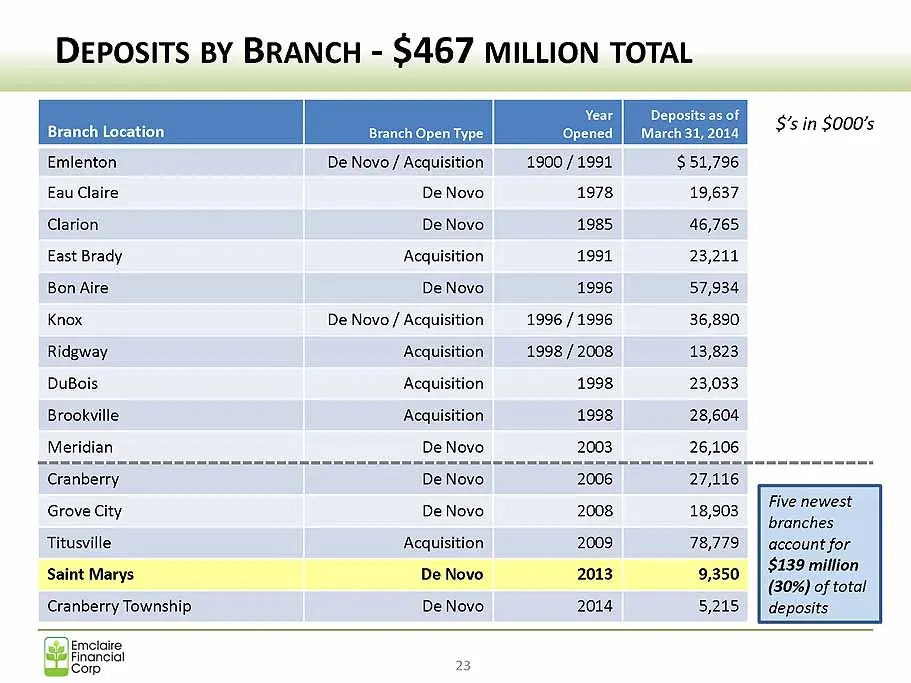
Slide 23: Deposits by Branch - $467 Million Total
DEPOSITS BY BRANCH - $467 MILLION TOTAL Year| Deposits as of Je 7 Branch Location Branch Open Type March 31, 2014 (Maa aeS Emlenton DeNovo/ Acquisition | 1900/1991 $51,796 Eau Claire De Novo 1978 19,637 Clarion De Novo 1985 46,765 East Brady Acquisition 1991 23,211 Bon Aire De Novo 1996 57,934 Knox
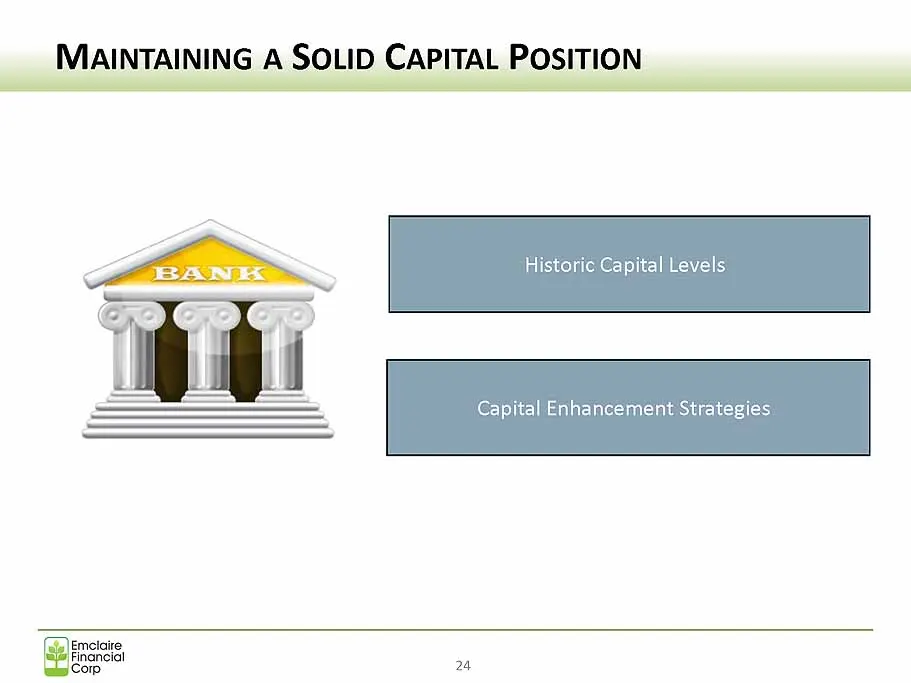
Slide 24: Maintaining a Solid Capital Position
MAINTAINING A SOL p CAPITAL POSITION Historic Capital Levels Capital Enhancement Strategies Emelaire inancial Comp 24
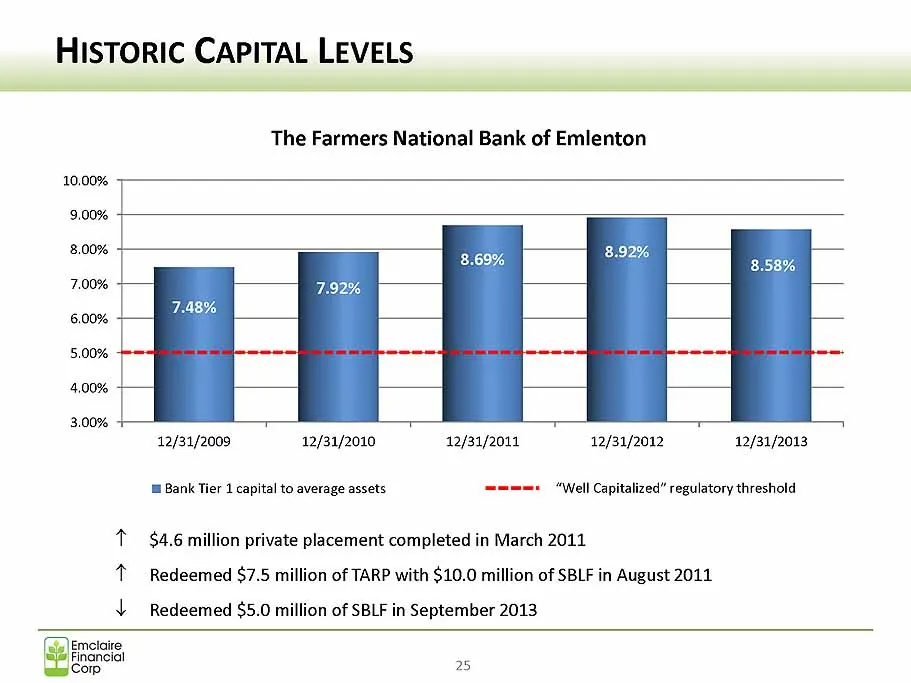
Slide 25: Historic Capital Levels
HisToRic CAPITAL LEVELS 12/31/2009 12/31/2010 12/31/2011 12/31/2012 12/31/2013 “Well Capitalized” regulatory threshold Bank Tier 1 capital to average assets, y V sie —e Emclate inancial Corp 2s
Slide 26: Capital Enhancement Strategies
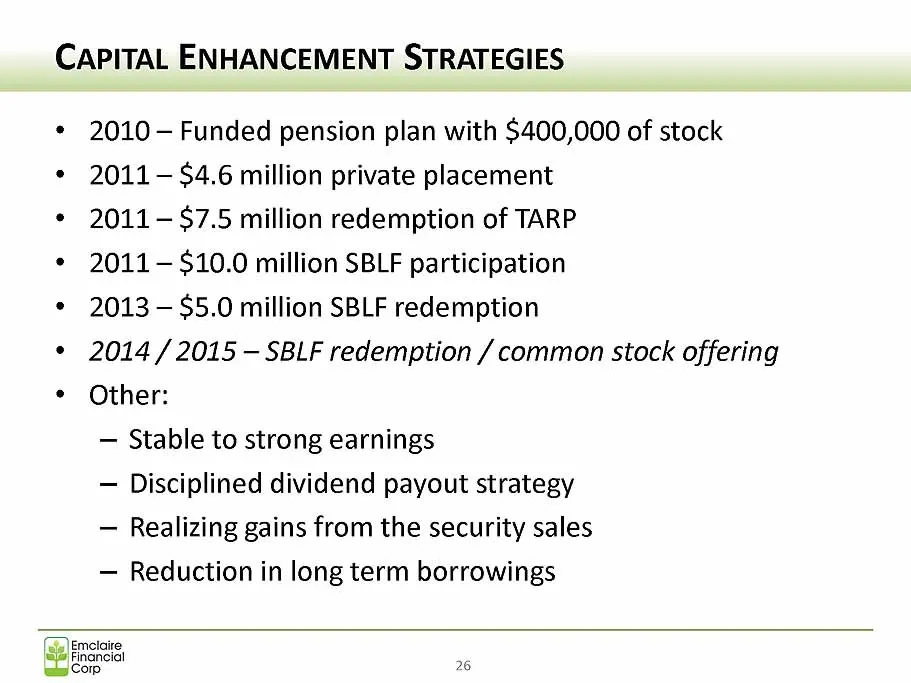
CAPITAL ENHANCEMENT STRATEGIES * 2010 - Funded pension plan with $400,000 of stock * 2011- $4.6 million private placement * 2011-$7.5 million redemption of TARP * 2011-$10.0 million SBLF participation * 2013 -$5.0 million SBLF redemption 2014 / 2015 — SBLF redemption / common stock offering Other: —
Slide 27: Creating Shareholder Value
CREATING SHAREHOLDER VALUE Stock Performance — Long Term | Stock Performance — Short Term | Dividend Recap & Emclaite & Financlel i Comp
Slide 28: Stock Performance — Long Term
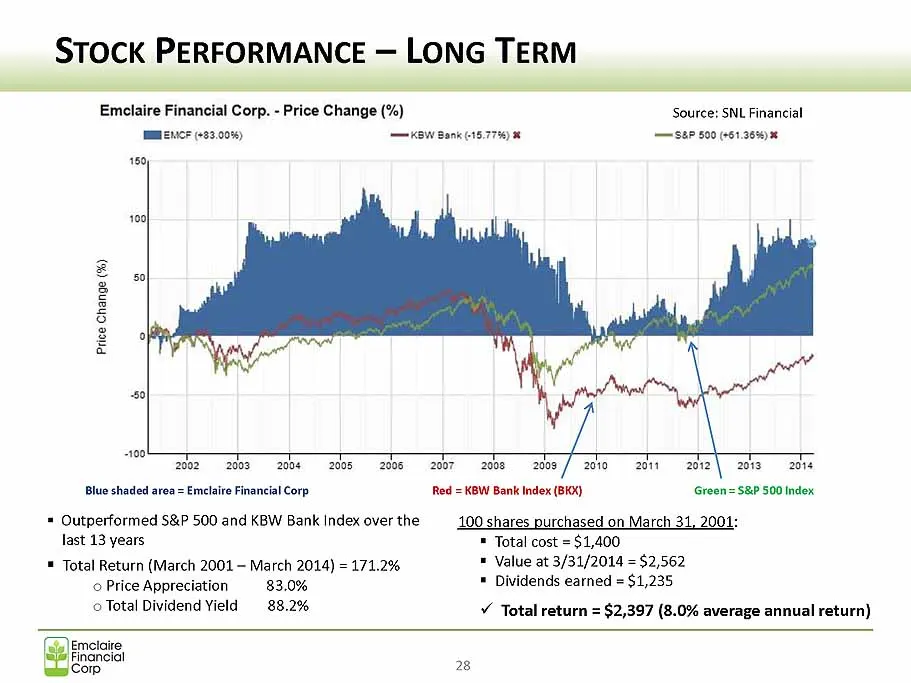
STOCK PERFORMANCE — LONG TERM Price Change (7 Source: SNL Financial ERENCE (485.0%) ee Bank 15.77%) sep 500 61.38%)" & Es 6 g 9 = 50 jz 2003 20s 200820082007 2008 ads / acho 20112012 | aot Blue shaded area = Emclaire Financial Corp Red = KBW Bank Index (BKX) Green = S&P 500 Index. 100 shares purchas
Slide 29: Stock Performance — Short Term
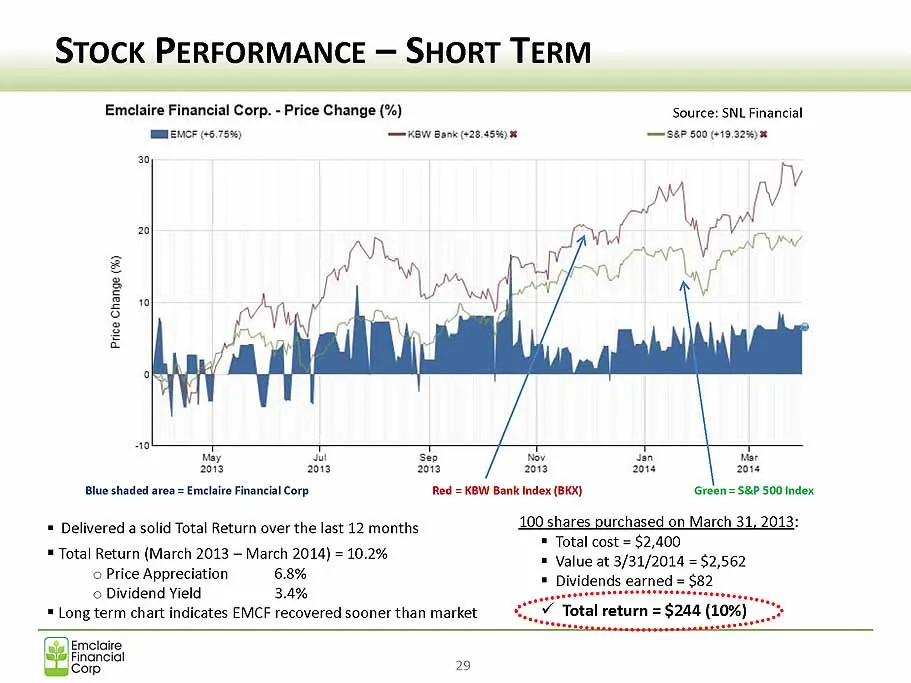
STOCK PERFORMANCE — SHORT TERM Emelaire Financial alee Price Change (%) Source: SNL Financial * ser £00 (19.32%); kSW Bank 28.45%) Price Change (%) Be Ea) 013 Red = KBW Bank Index (BKX) Blue shaded area = Emclaire Financial Corp 100 shares surshased o ‘on March 31, 201: Total cost © Price Appreciati
Slide 30: Dividend Recap
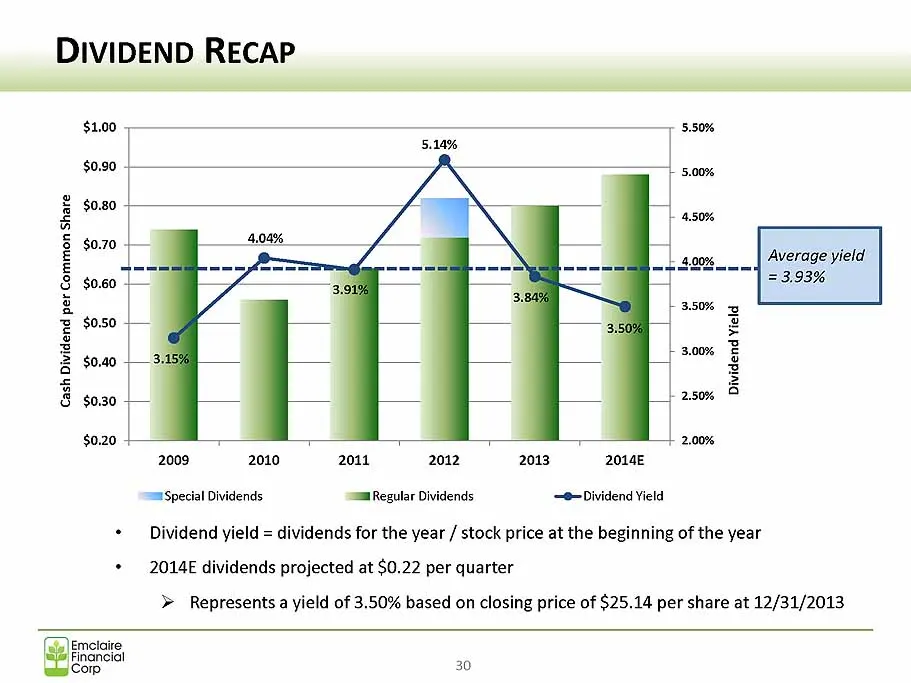
DIVIDEND RECAP $0.70 +— go.60 | $0.50 +— $0.40 -— Cash Dividend per Common Share $0.30 -— $0.20 2009 2010 smiSpecial Dividends Average yield = 3.93% 2011 2012 2013 2014E sam Regular Dividends © Dividend Yield Emelaire Financial Comp
Slide 31: Peer Comparison: Nonperforming Assets and Loan Delinquency
a Peer Comparison: Nonperforming Assets H Peer Comparison: Loan Delinquency (aip)Emctoire Finanetat
Slide 32: Asset Quality — Overview
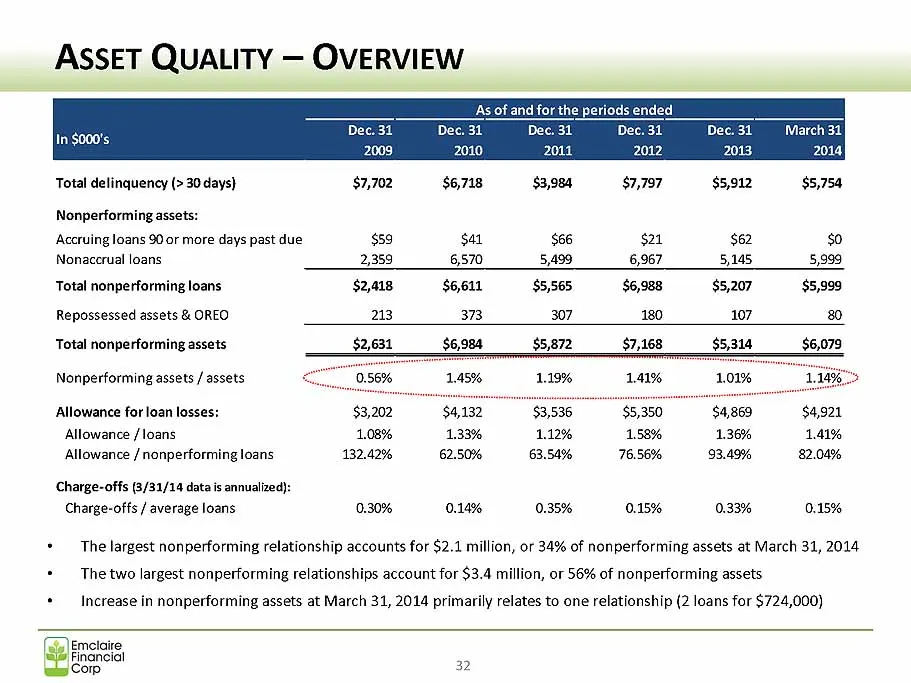
ASSET QUALITY — OVERVIEW ‘As of and forthe periods ended 31 Dec. 31 Dec. 31 2012 1 Dec. 31 2013 Total delinquency (> 30 days) $7,702 $6,718 $3,984 $7,797 nperforming assets: Accruing loans 90 or more days past due $59 $41 $66 Nonacerual loans $5,912 $5,754 Total nonperforming loans Total nonperformi
Slide 33: Asset Quality — Nonperforming Assets
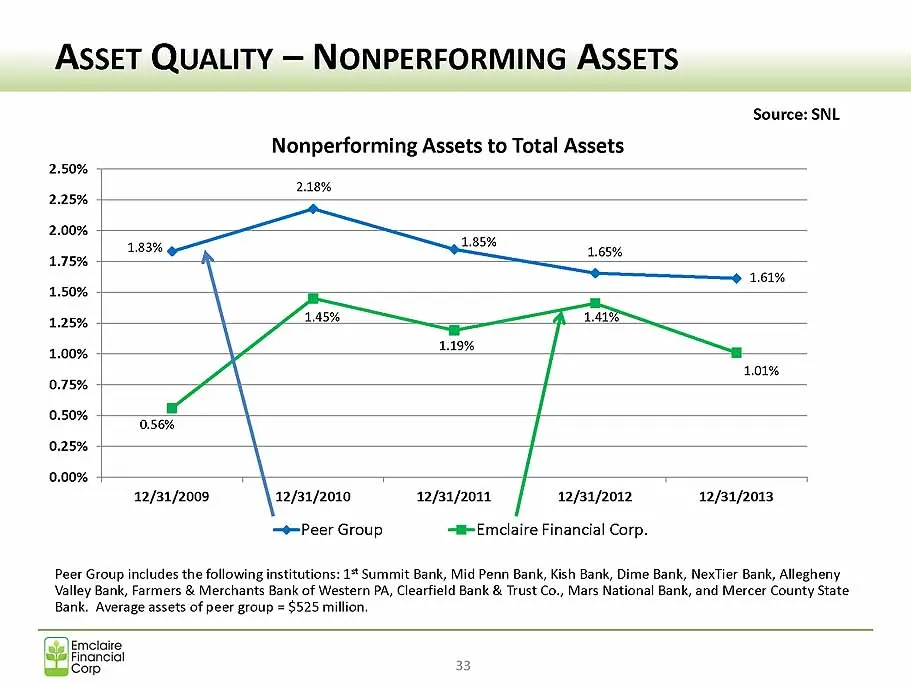
ASSET QUALITY — NONPERFORMING ASSETS Source: SNL i Asset: 2.50% 2.18% 2.255 2.00% | 1.83% 2.85% 1.75% “jr 1.65% \ a eT 1.50% \ =— 1.25% + \ 1.45% en 1.19% Xx / = 0.75% \ / O180% 0.56% \ | 0.25 \ / 0.00% + 7 12/31/2009 \zarpo10 12/31/2011 / 12/31/2012 12/31/2013 Peer Group -@Emclaire Financial Corp.
Slide 34: Asset Quality — Delinquency Trends
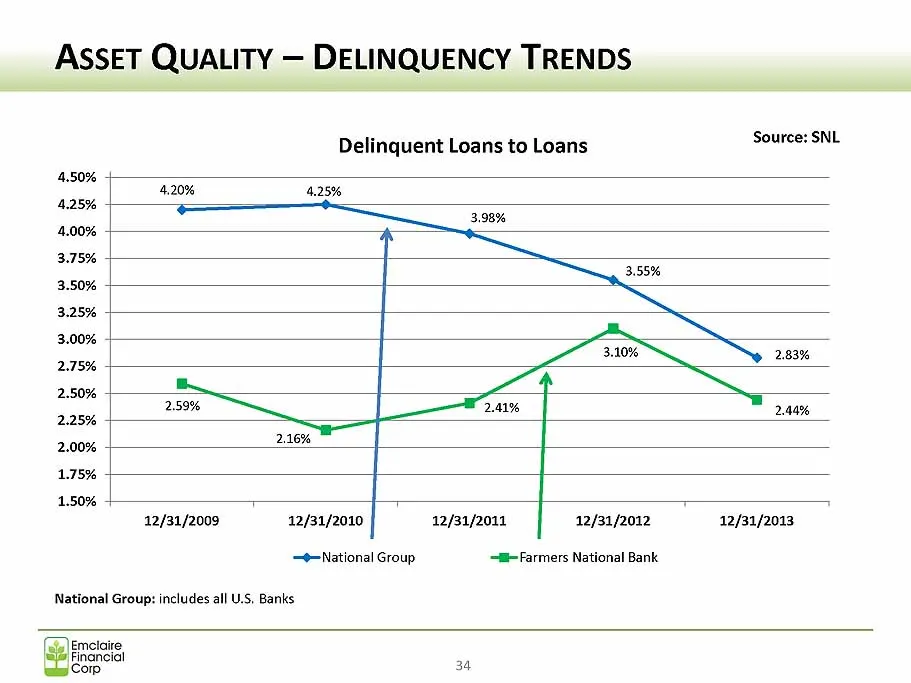
ASSET QUALITY — DELINQUENCY TRENDS Delinquent Loans to Loans Source: SNL 4.20% 4.25% 3.10% Ny 2.83% i 4 = 2.25% 2ee% [ne | 2.44% | | | 1.75% | 1.50% . 12/31/2009 22/34/2010 | 12/31/2011 | 12/31/2012 12/31/2013 @National Group -@-Farmers National Bank National Group: includes all U.S. Banks Emelaire
Slide 35: The Year Ahead
THE YEAR AHEAD Emclate inancial Corp 35
Slide 36: Our Franchise
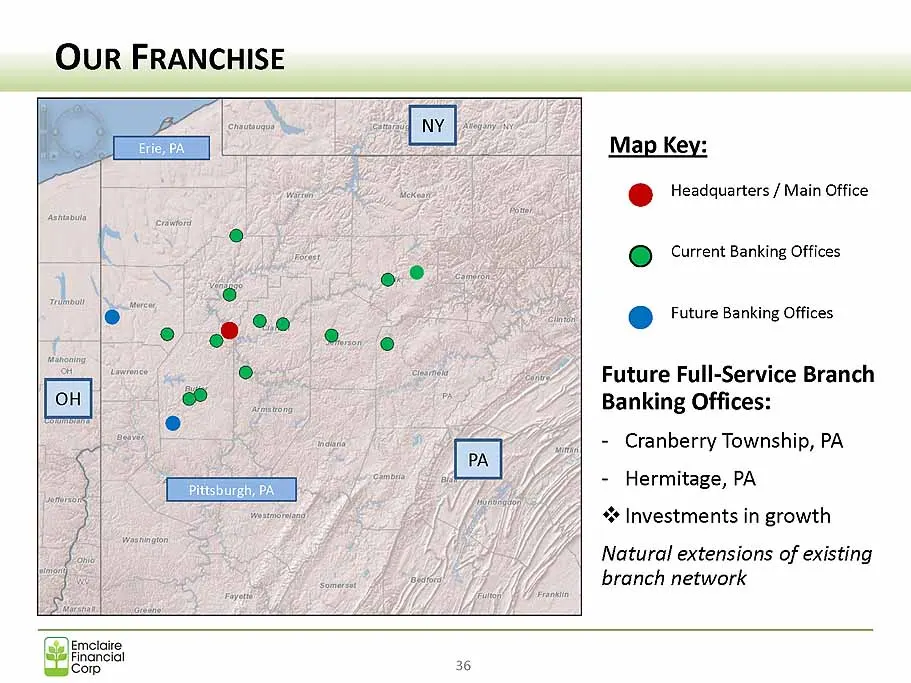
OUR FRANCHISE Map Key: e@ Headquarters / Main Office @ Current Banking Offices @ future Banking Offices Future Full- Service Branch Banking Offices: - Cranberry Township, PA - Hermitage, PA % Investments in growth Natural extensions of existing branch network Emelaire parcial
Slide 37: Market Assessment
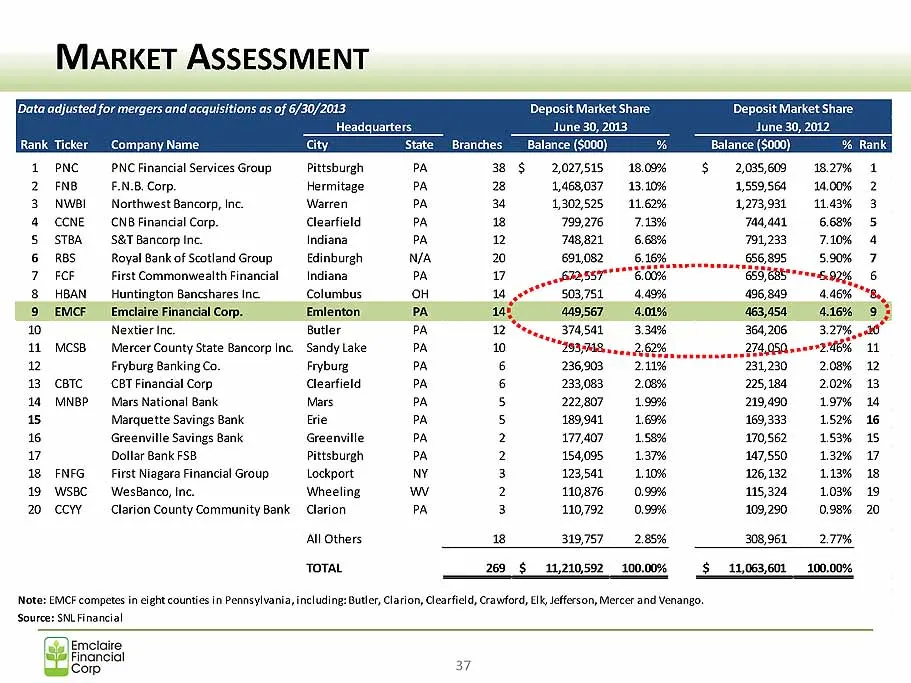
MARKET ASSESSMENT Data adjusted for mergers and acquisitions as of 6/30/2013. Deposit Market Share June 30, 2012 Headquarters ipany Name. State PNC NC Financial Services Group _—Pittsburgh FNB E.N.B. Corp. Hermitage 3 NWBI Kecthees no Ine. Warren 4 CCNE CNB Financi Clearfield S STBA S&T Bancorp Indi
Slide 38: Market Assessment
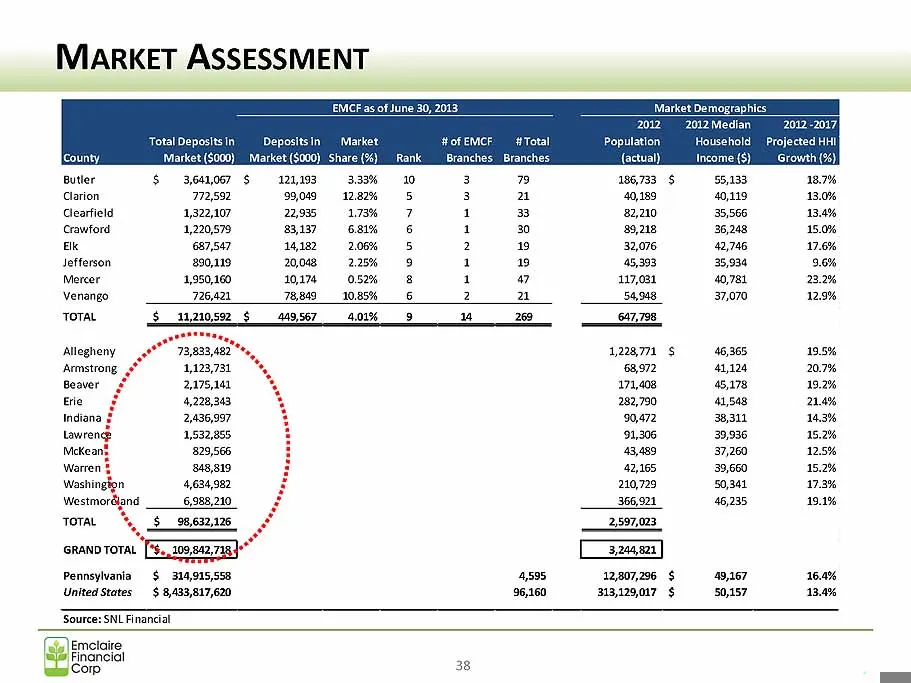
MARKET ASSESSMENT Total Deposits in 000) by Market (5 Butler $3,681,067 Clarion 772592 Clearfield 41,322,107 Crawford 1,220,579 Bk 687,547 Jefferson 290, Mercer 1,950,160 Venango re ral $ Washingépn Westmoréland oral rawoorat [°%.,109,802,738]" Pennsylvania $ 314,915,558 United States $ 8,433,817,62
Slide 39: Opportunities
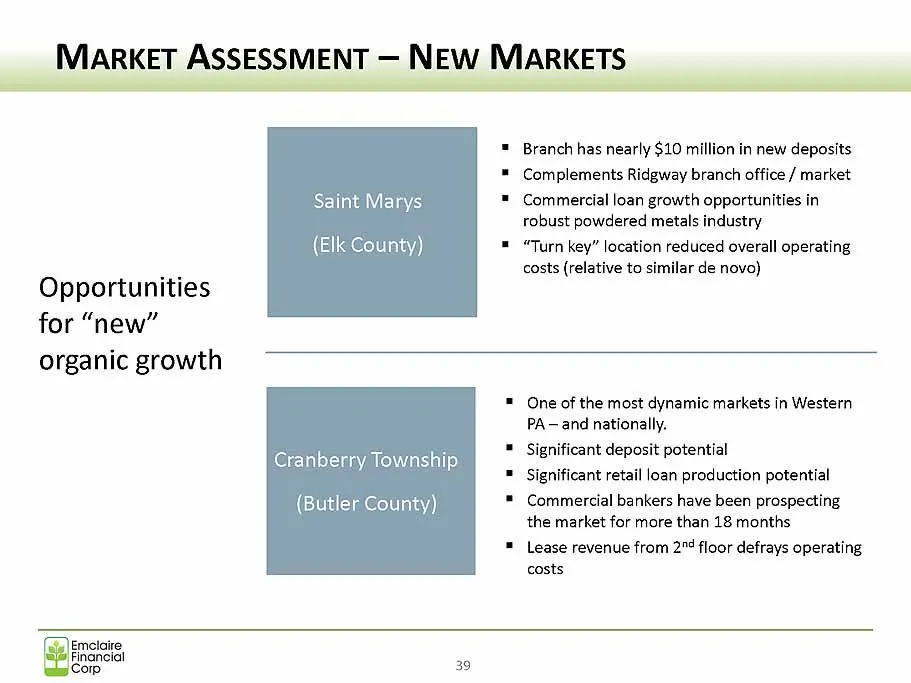
Opportunities organic growth Saint Marys (Elk County) . = Commercial loan growth oopertuntes in robust powdered metals indus costs (relative to similar de novo) Cranberry Township (Butler County) "A — and nationally. . + Ses depot potential . the market for more than 18 months costs (aip)Emctoire Fi
Slide 40: Cranberry Township, PA
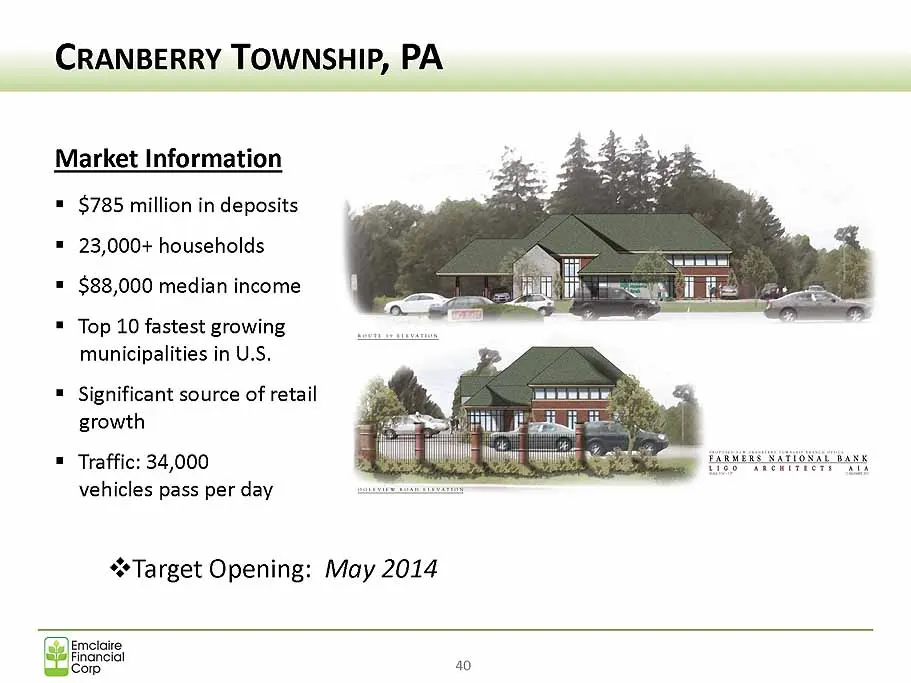
CRANBERRY TOWNSHIP, PA Market Information = $785 million in deposits = 23,000+ households = $88,000 median income Top 10 fastest growing municipalities in U.S. = Significant source of retail rowth = Traffic: 34,000 vehicles pass per day “Target Opening: May 2014 Emclate inancial Corp 40
Slide 41: Investing in People & Systems
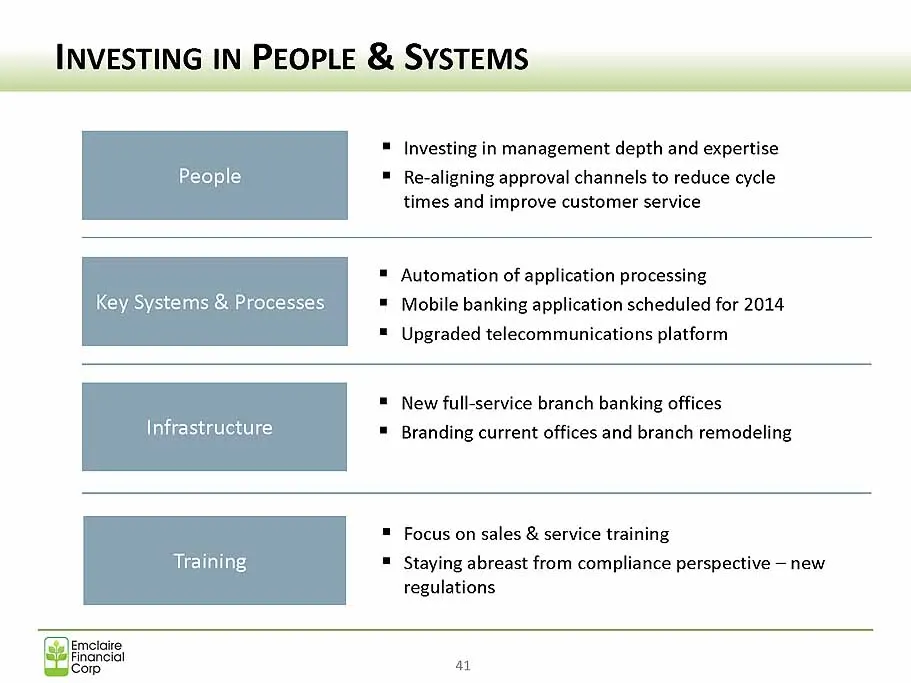
INVESTING IN PEOPL & SYSTEMS People times and improve customer service Key Systems & Processes . i i icati 014 Infrastructure . ™ Focus on sales & service training Training i i i n regulations Emelaire inancial Comp ay
Slide 42: Planned System Investments
PLANNED SYSTEM INVESTMENTS Mobile banking application * Mortgage application processing system (upgrade) Improved Customer Relationship Management (CRM) system (Quest Analytics) ° Objectives: — Attract / retain customers — Increase revenue opportunities — Streamline processes; reduce cycle times — R
Slide 43: Strategy Recap
STRATEGY RECAP * Continued focus on earnings * Continued focus on balance sheet mix ¢ New branch offices, markets and acquisitions * Capital management ¢ Asset quality ¢ Improvement in systems, personnel and technology Emelaire parcial
Slide 44: Well Positioned
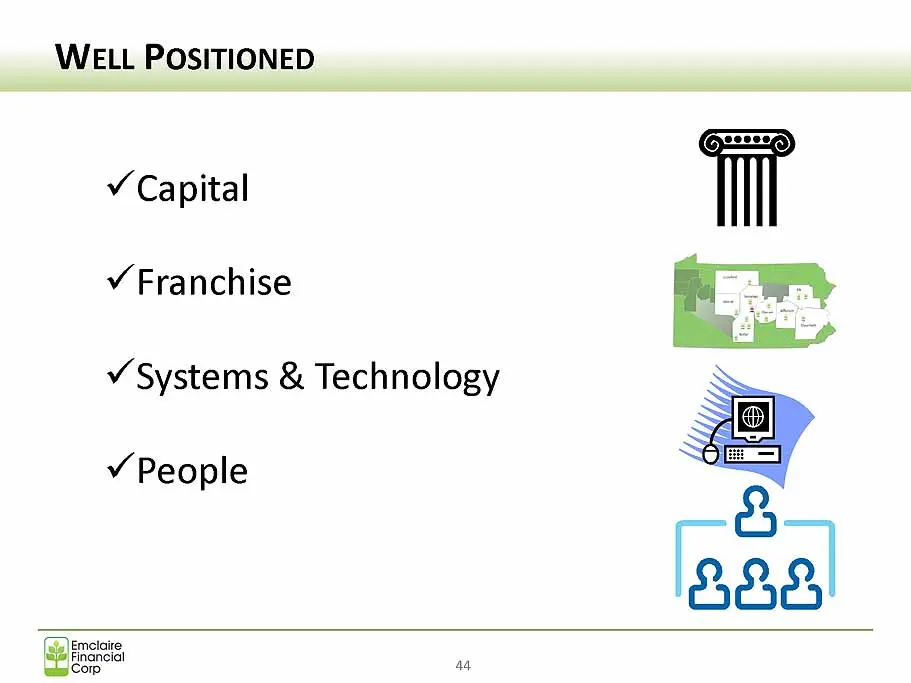
WELL POSITIONED ¥ Capital v Franchise v Systems & Technology ¥ People eres, =f Financial Corp a4

Slide 45: Closing and Thank You
CLOSING AND THANK You Questions and Answers... .. Thank you for your continued confidence and support! Emelaire 3 Financial ‘ Corp as
Source: SEC EDGAR · 8-K filed Apr 22, 2014
More decks from Emclaire Financial Corp
 Merger or Acquisition (March 2022)13 slides · Mar 24, 2022
 Shareholder Meeting (April 2021)36 slides · Apr 21, 2021
 Shareholder Meeting (April 2020)32 slides · Apr 22, 2020
 Raymond James Emerging Bank Symposium (September 2019)23 slides · Sep 4, 2019
 Shareholder Meeting (April 2019)32 slides · Apr 24, 2019
 Shareholder Meeting (April 2018)28 slides · Apr 25, 2018