Vodacom Group Limited · JSE:VOD
Vodacom — H1 2010 Earnings Presentation
42 slides from Vodacom's earnings presentation, Sep 30, 2009
Slide 1: Vodacom Group Limited Interim results
Vodacom Group Limited Interim results 30 September 2009
Slide 2: Disclaimer
Disclaimer The following presentation is being presented to, and is only directed at, persons to whom such presentation may lawfully be communicated (“relevant persons”). Any person who is not a relevant person should not act or rely on this presentation or any of its contents. Information in the fo
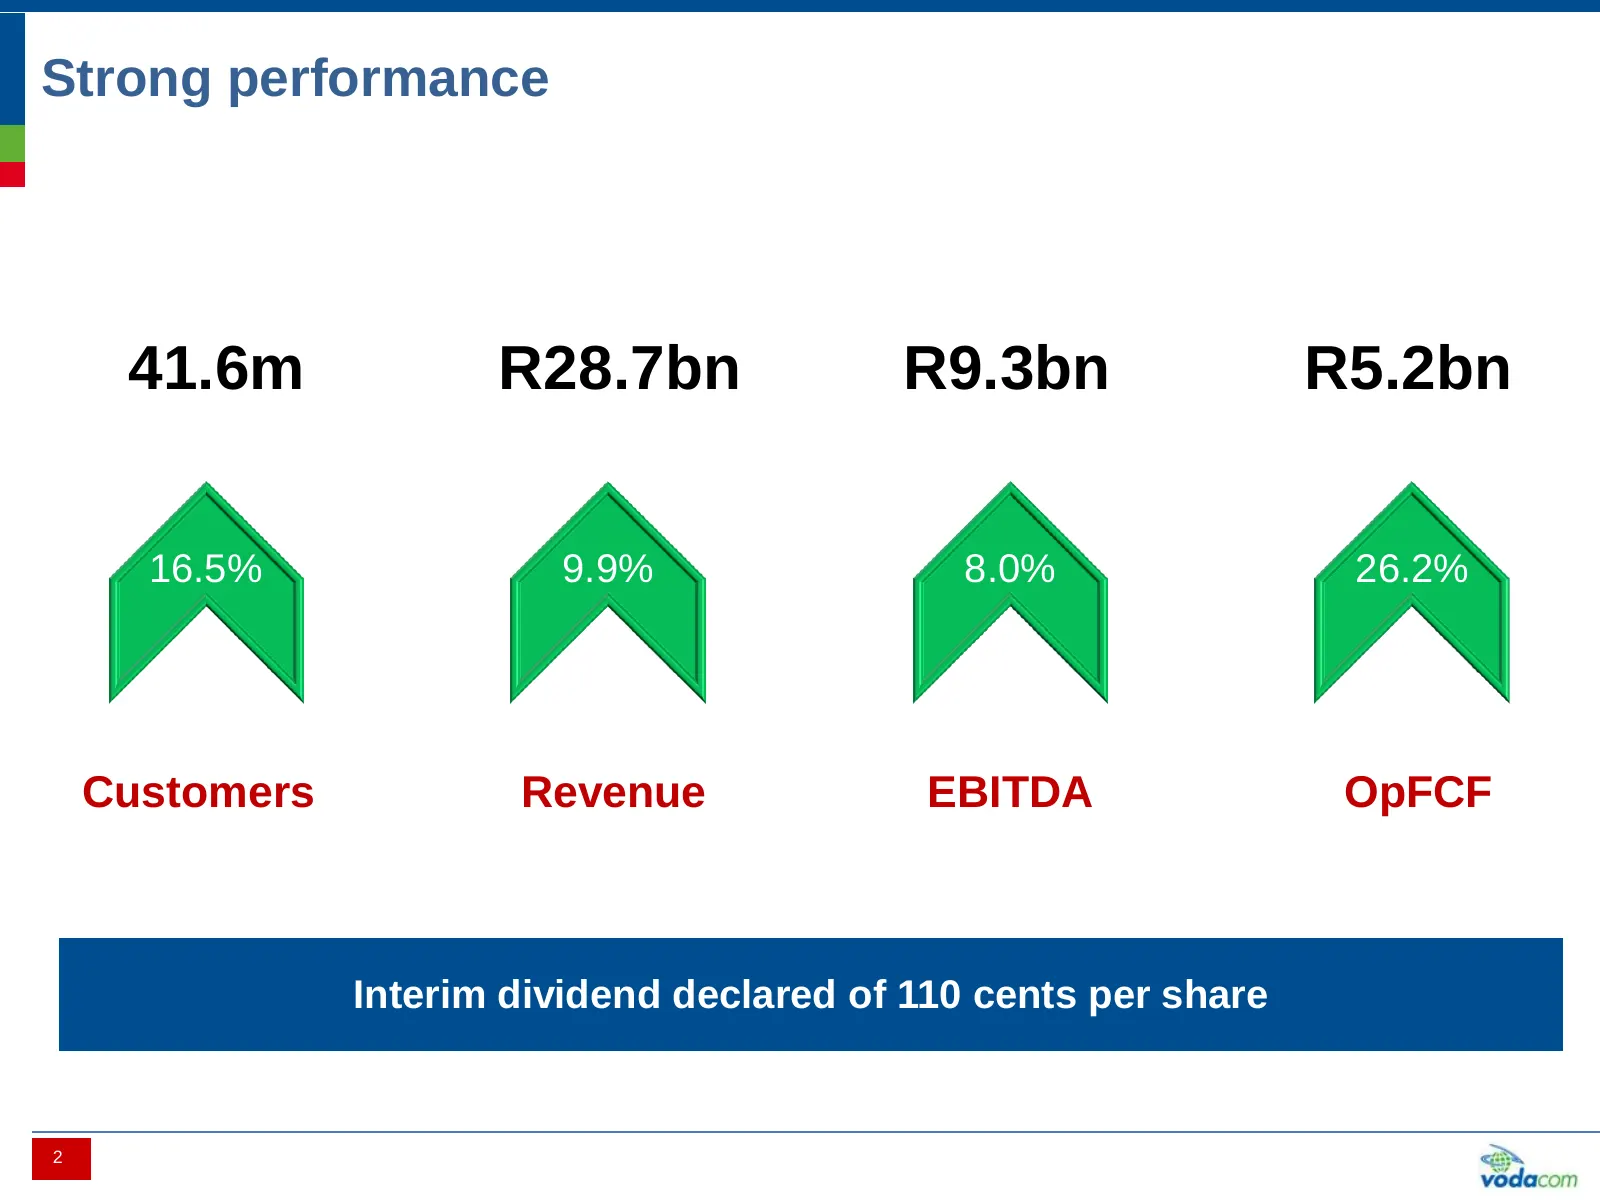
Slide 3: Strong performance
Strong performance 41.6m R28.7bn R9.3bn R5.2bn 16.5% 9.9% 8.0% 26.2% Customers Revenue EBITDA OpFCF Interim dividend declared of 110 cents per share 2 2
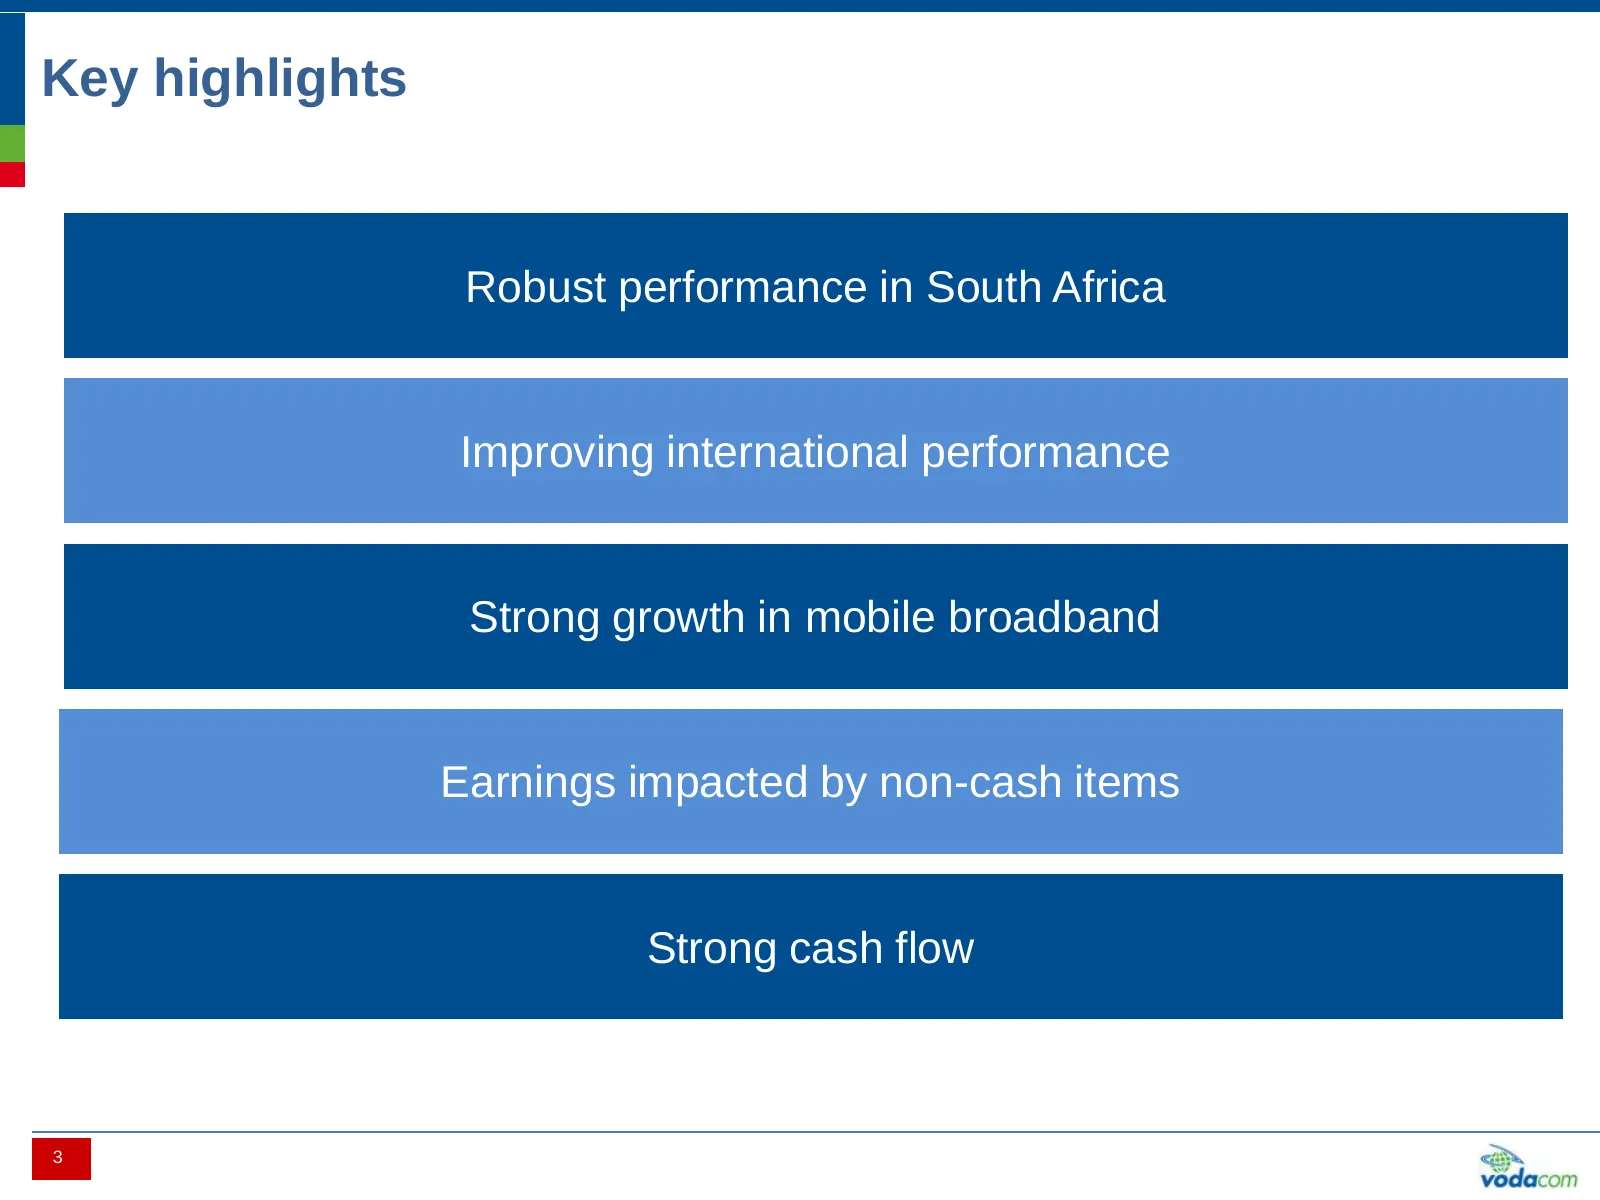
Slide 4: Key highlights
Key highlights Robust performance in South Africa Improving international performance Strong growth in mobile broadband Earnings impacted by non-cash items Strong cash flow 3 3
Slide 5: South Africa
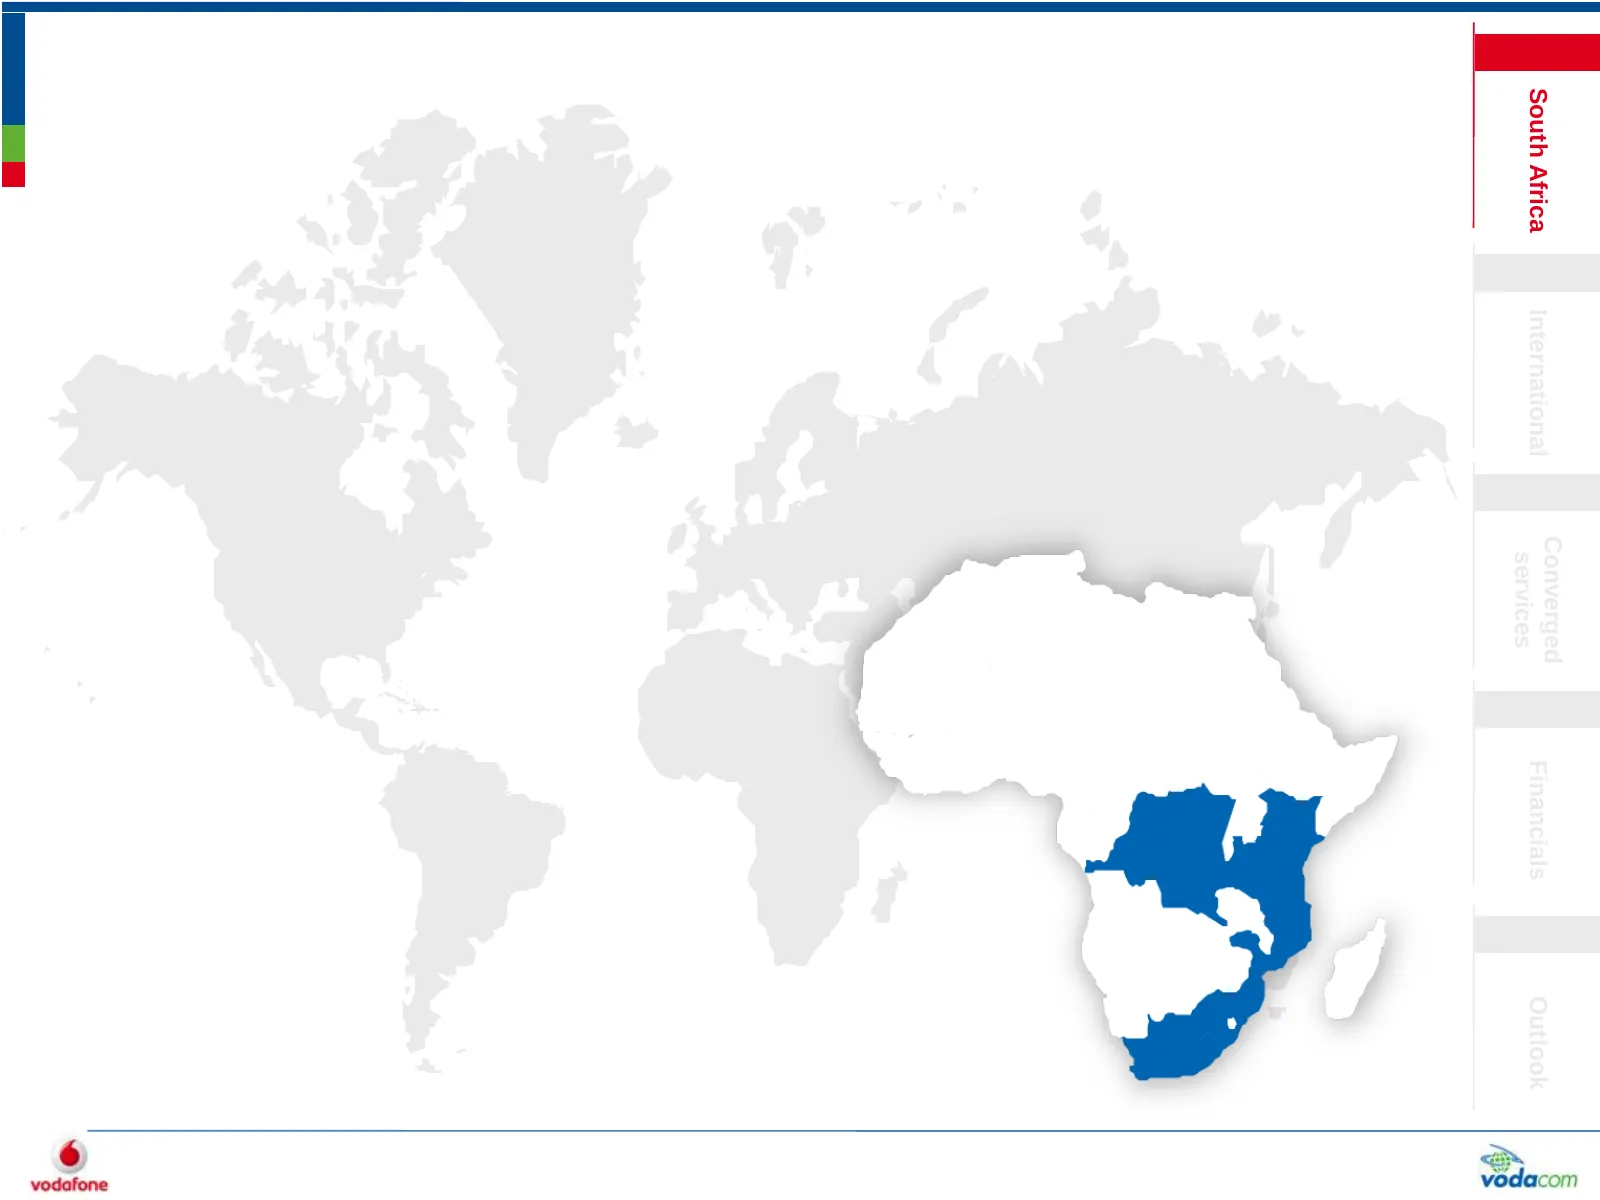
Converged South Africa International Financials Outlook services
Slide 6: South Africa delivered a robust performance
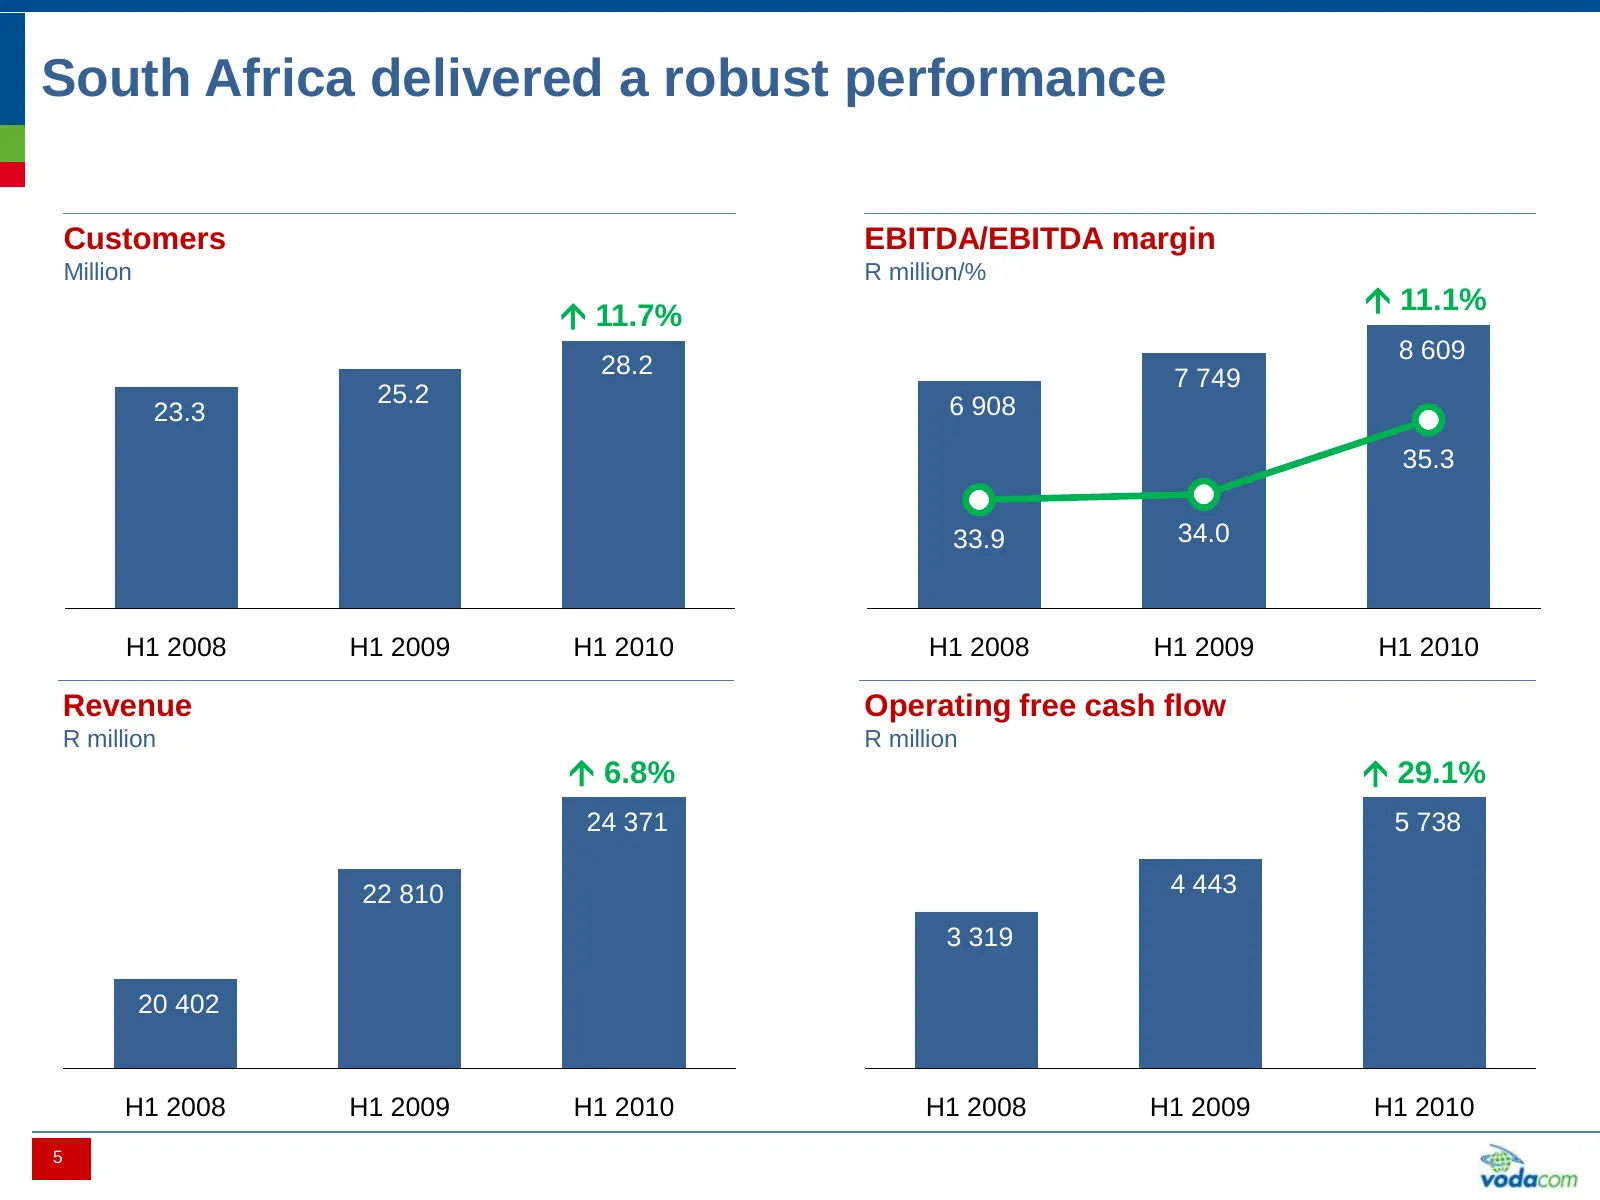
South Africa delivered a robust performance Customers EBITDA/EBITDA margin Million R million/% 11.1% 11.7% 8 609 28.2 7 749 25.2 6 908 23.3 35.3 33.9 34.0 H1 2008 H1 2009 H1 2010 H1 2008 H1 2009 H1 2010 Revenue Operating free cash flow R million R million 6.8% 29.1% 24 371 5 738 22 810 4 443
Slide 7: Headwinds from the recession and RICA
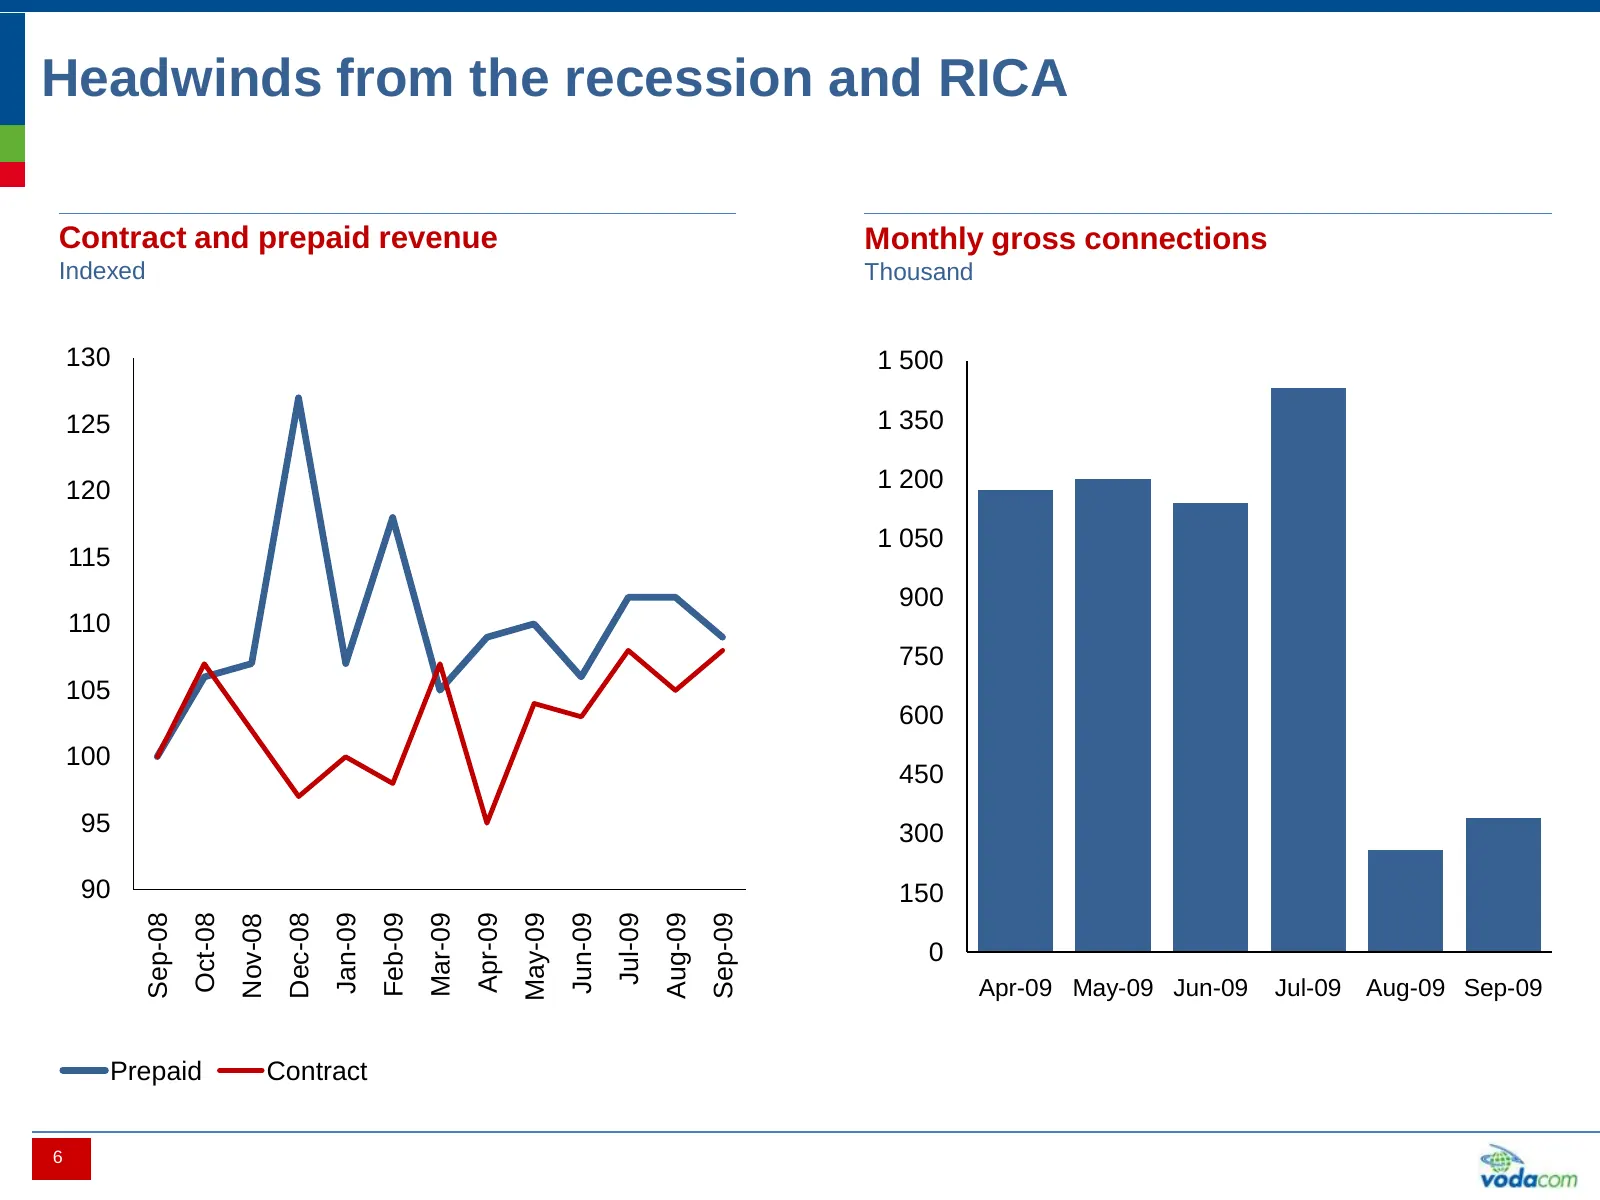
Headwinds from the recession and RICA Contract and prepaid revenue Monthly gross connections Indexed Thousand 130 1 500 125 1 350 120 1 200 1 050 115 900 110 750 105 600 100 450 95 300 90 150 Sep-08 Sep-09 Feb-09 Jan-09 Jun-09 Oct-08 Dec-08 Apr-09 Jul-09 Mar-09 Aug-09 May-09 Nov-08 0 Apr-09 May-09 J
Slide 8: Increased focus on mobile termination rates
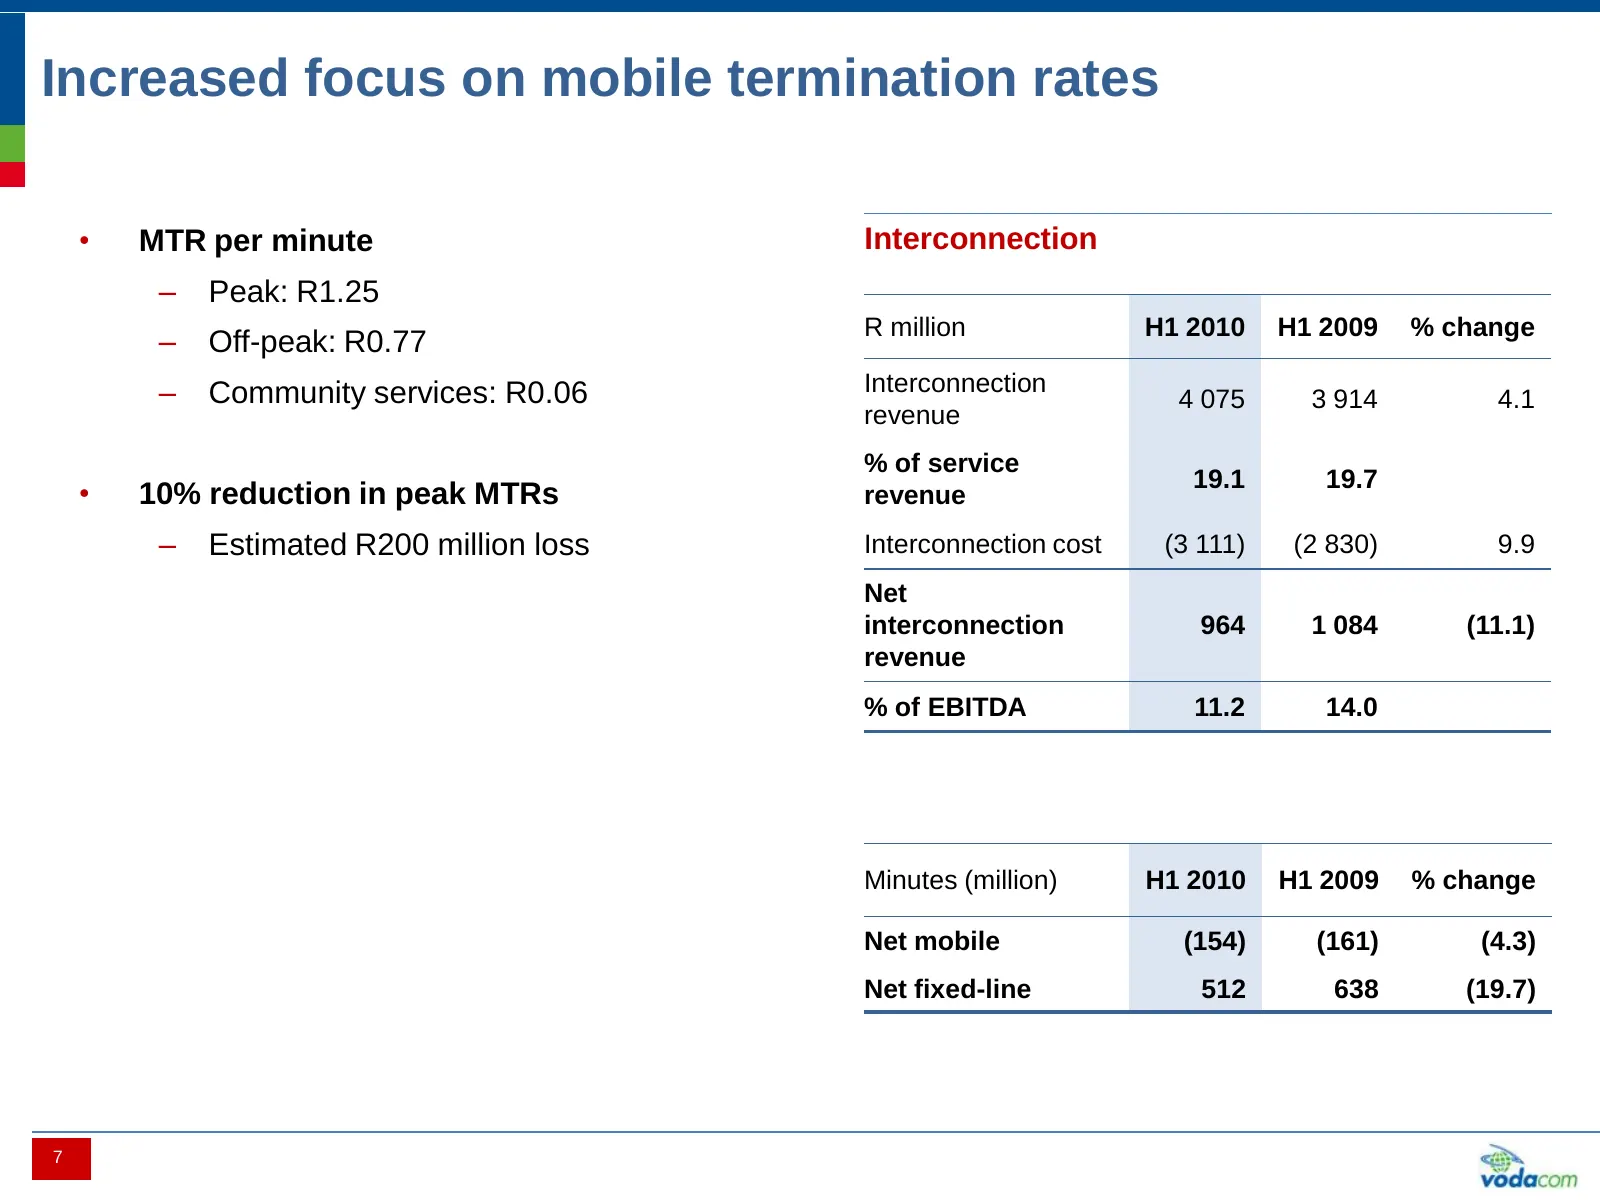
Increased focus on mobile termination rates • MTR per minute Interconnection – Peak: R1.25 R million H1 2010 H1 2009 % change – Off-peak: R0.77 – Community services: R0.06 Interconnection 4 075 3 914 4.1 revenue % of service 19.1 19.7 • 10% reduction in peak MTRs revenue – Estimated R200 million los
Slide 9: Maintained market leading position
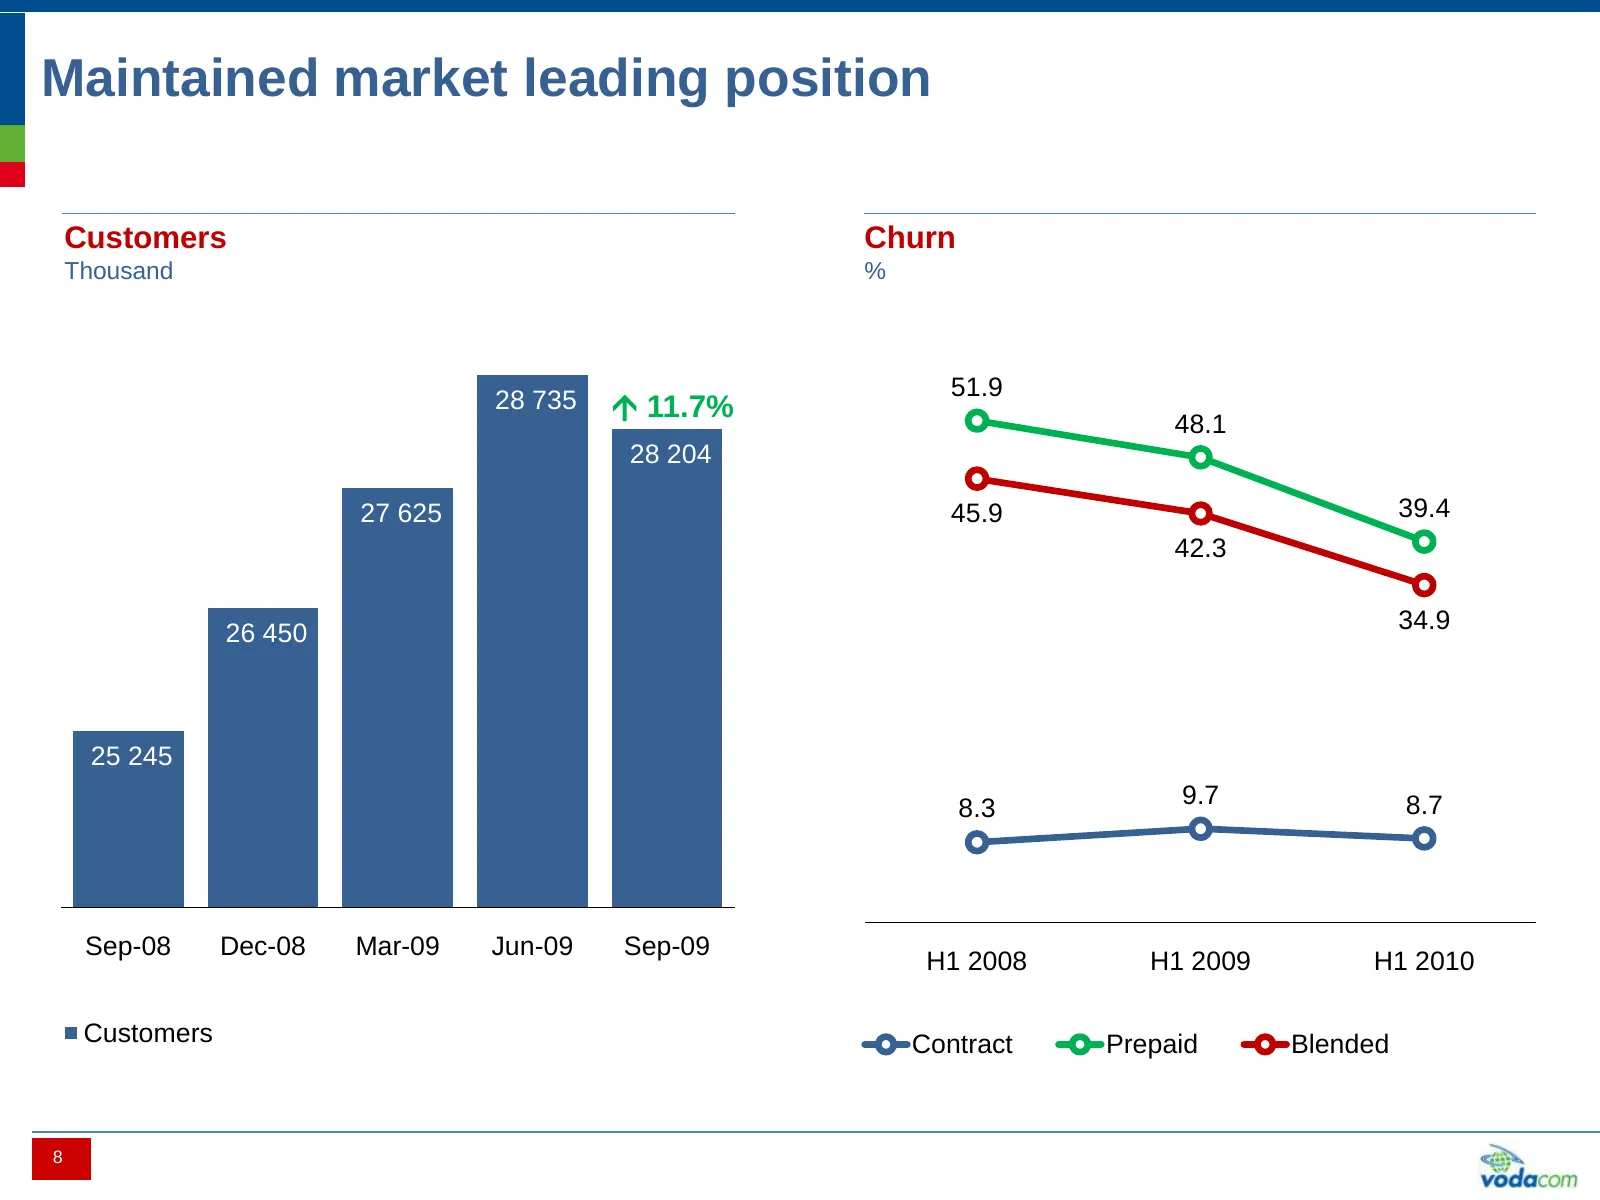
Maintained market leading position Customers Churn Thousand % 51.9 28 735 11.7% 48.1 28 204 27 625 45.9 39.4 42.3 26 450 34.9 25 245 9.7 8.7 8.3 Sep-08 Dec-08 Mar-09 Jun-09 Sep-09 H1 2008 H1 2009 H1 2010 Customers Contract Prepaid Blended 8
Slide 10: Promotional activity resulting in increased usage
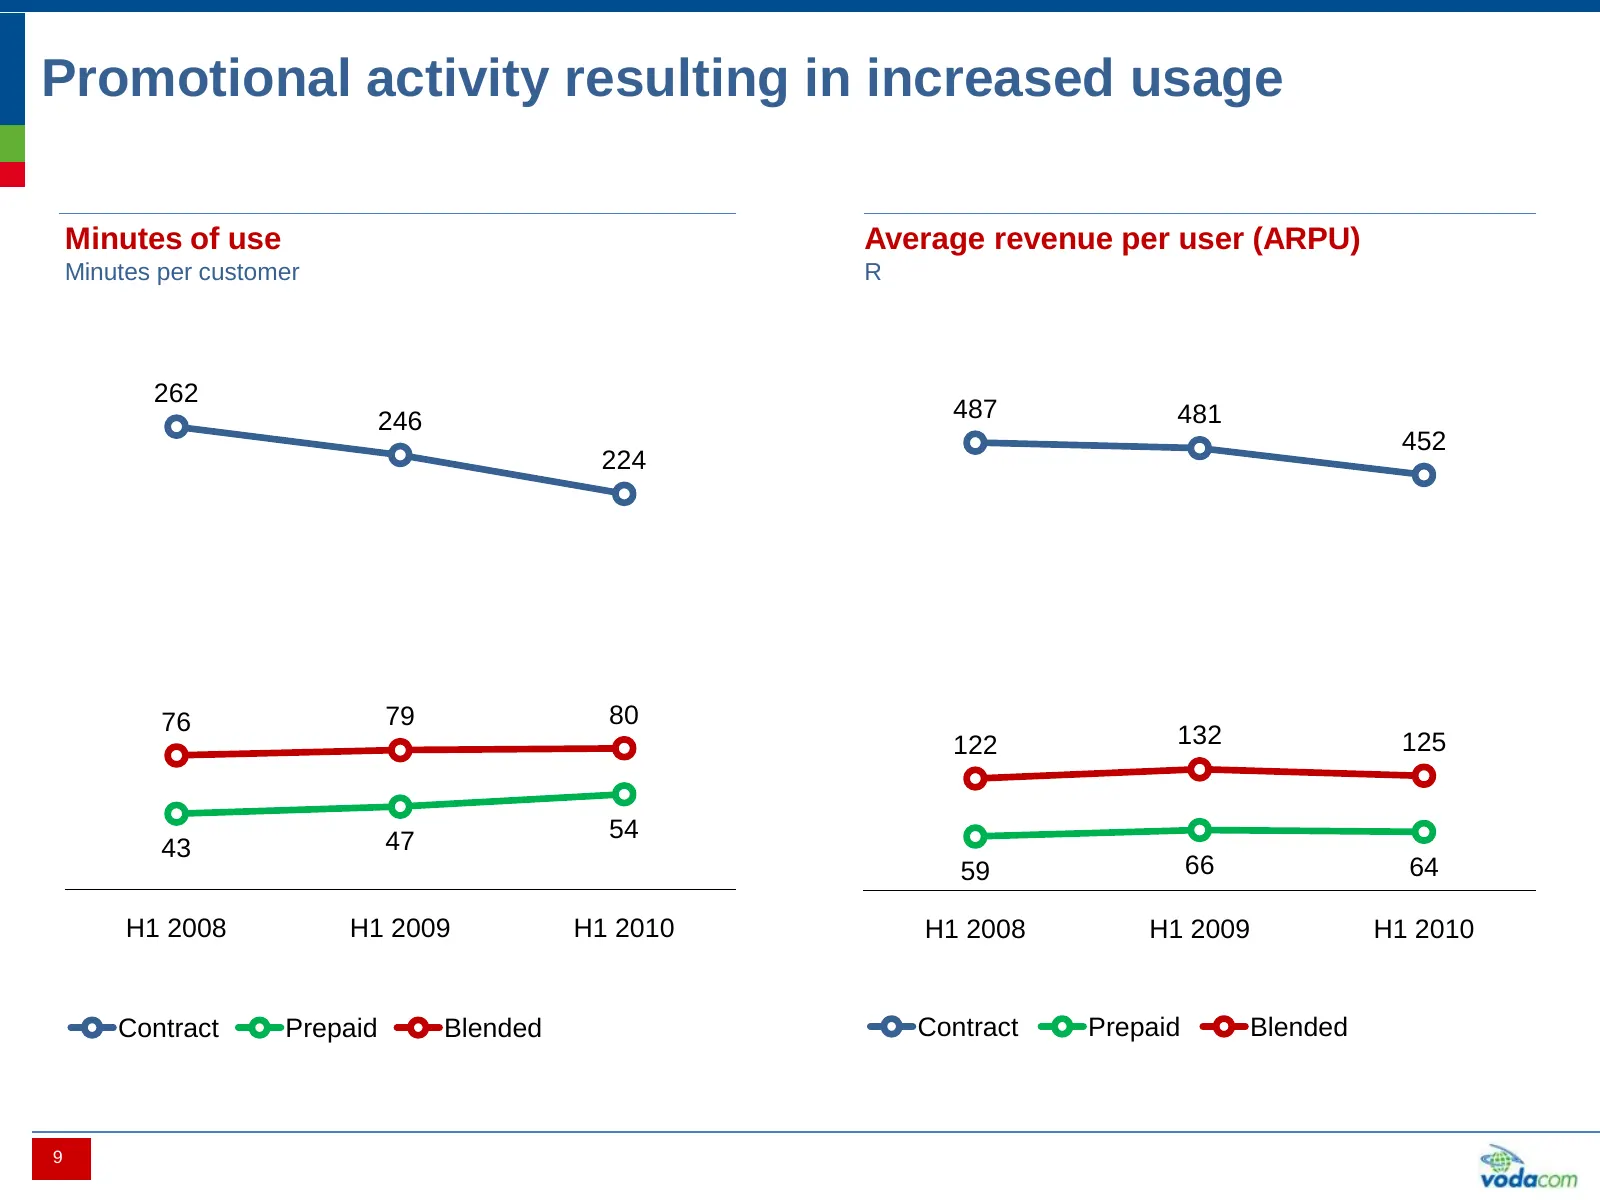
Promotional activity resulting in increased usage Minutes of use Average revenue per user (ARPU) Minutes per customer R 262 246 487 481 452 224 76 79 80 122 132 125 47 54 43 59 66 64 H1 2008 H1 2009 H1 2010 H1 2008 H1 2009 H1 2010 Contract Prepaid Blended Contract Prepaid Blended 9
Slide 11: Growth fuelled by mobile broadband
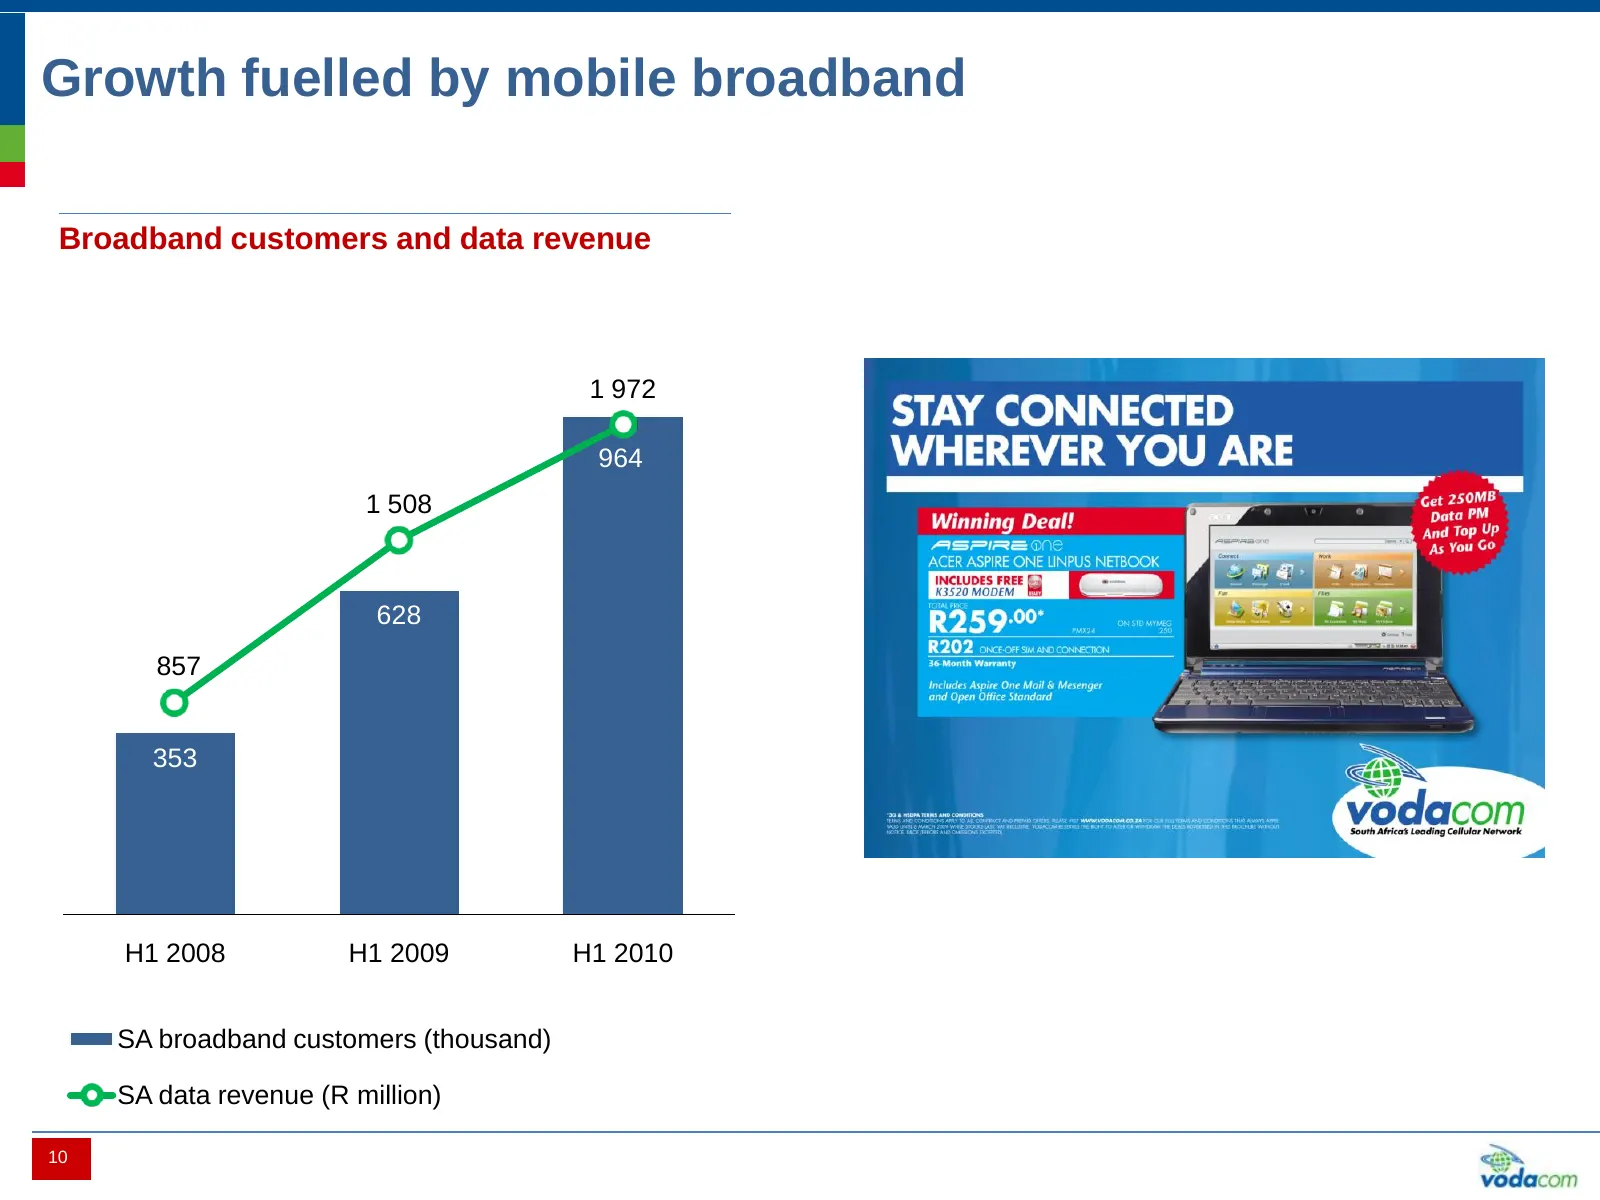
Growth fuelled by mobile broadband Broadband customers and data revenue 1 972 964 1 508 628 857 353 H1 2008 H1 2009 H1 2010 SA broadband customers (thousand) SA data revenue (R million) 10
Slide 12: Investment to support data growth and improve efficiencies
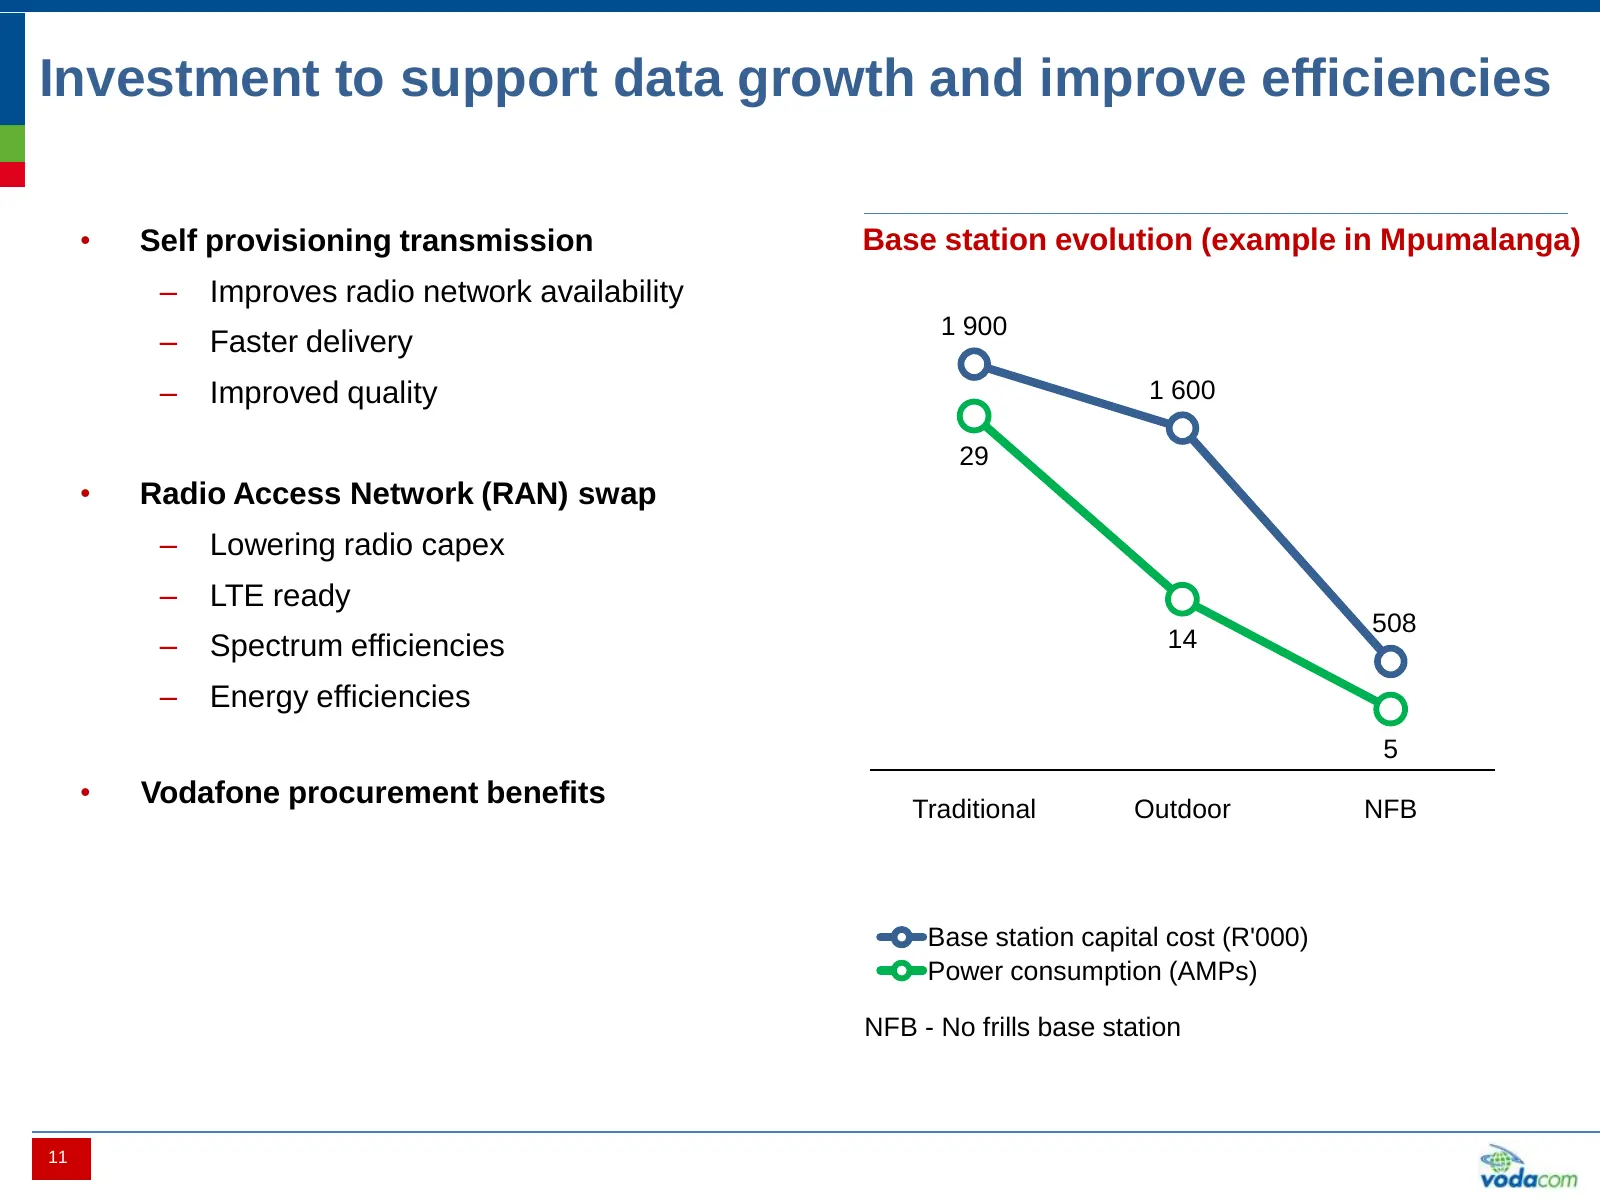
Investment to support data growth and improve efficiencies • Self provisioning transmission Base station evolution (example in Mpumalanga) – Improves radio network availability 1 900 – Faster delivery – Improved quality 1 600 29 • Radio Access Network (RAN) swap – Lowering radio capex – LTE ready 50
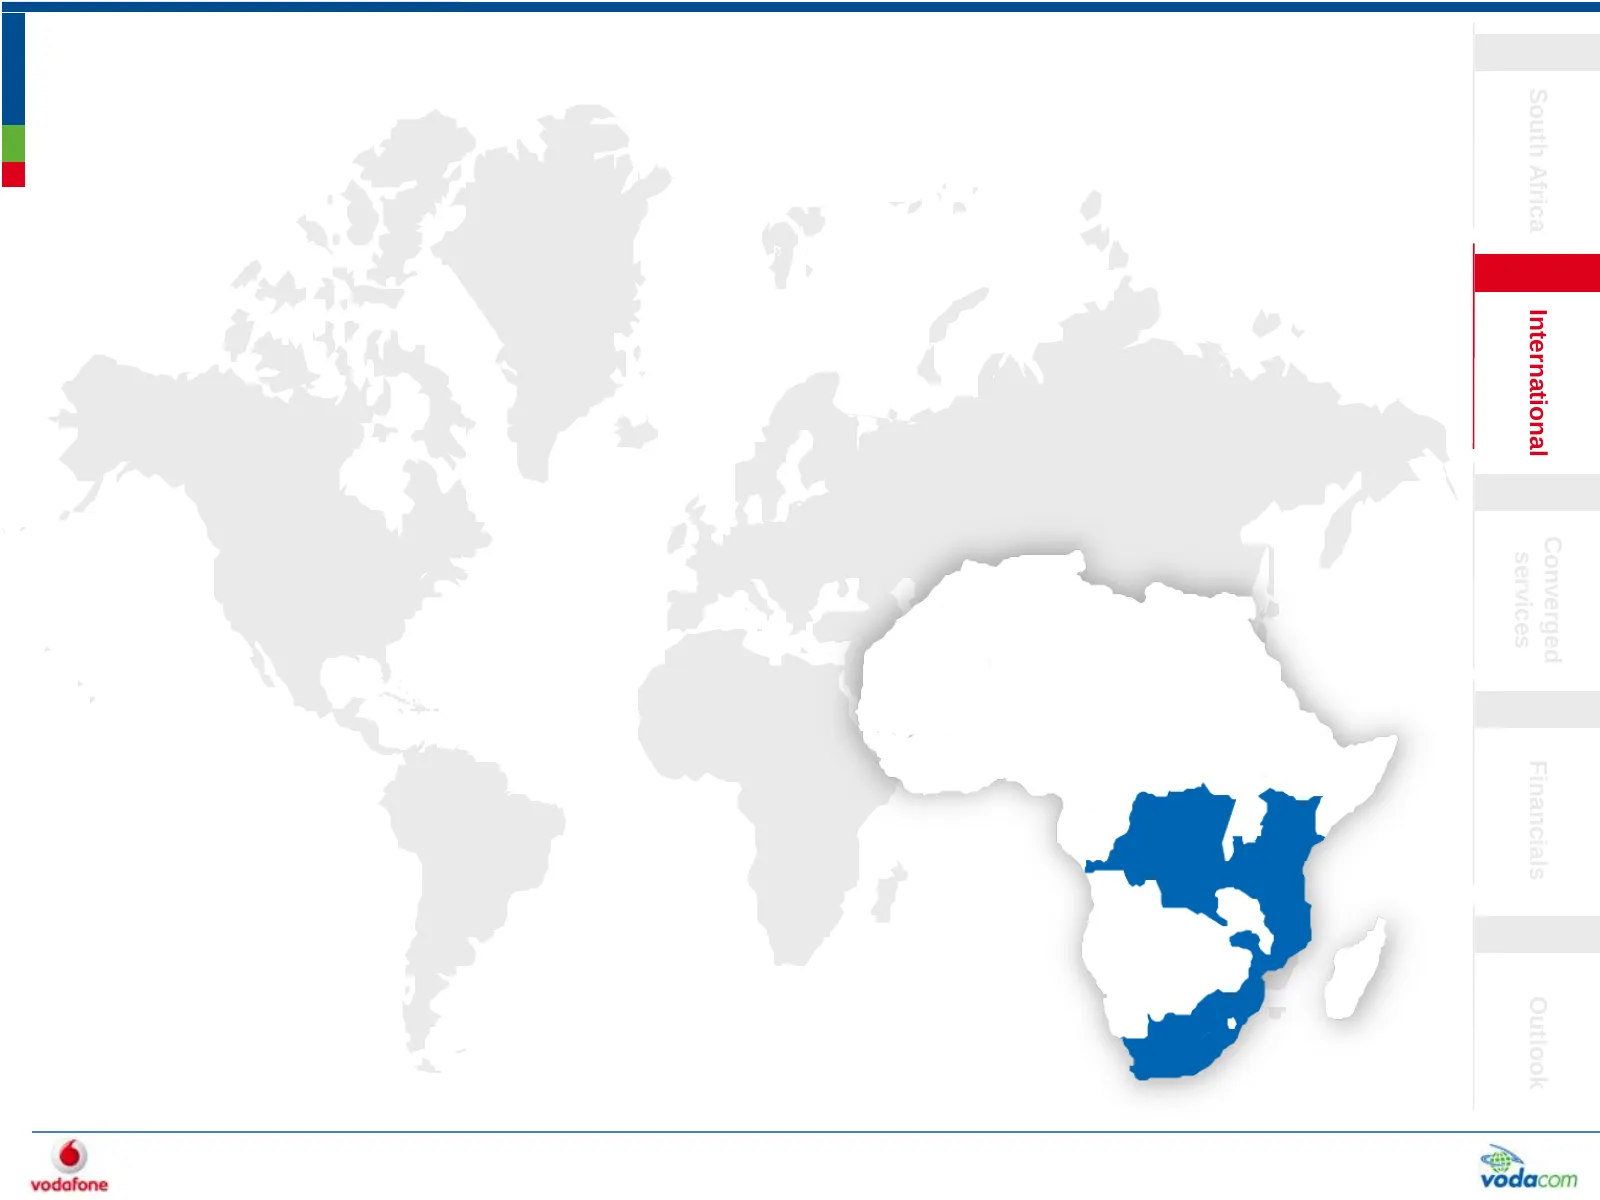
Slide 13: International
Converged South Africa International Financials Outlook services
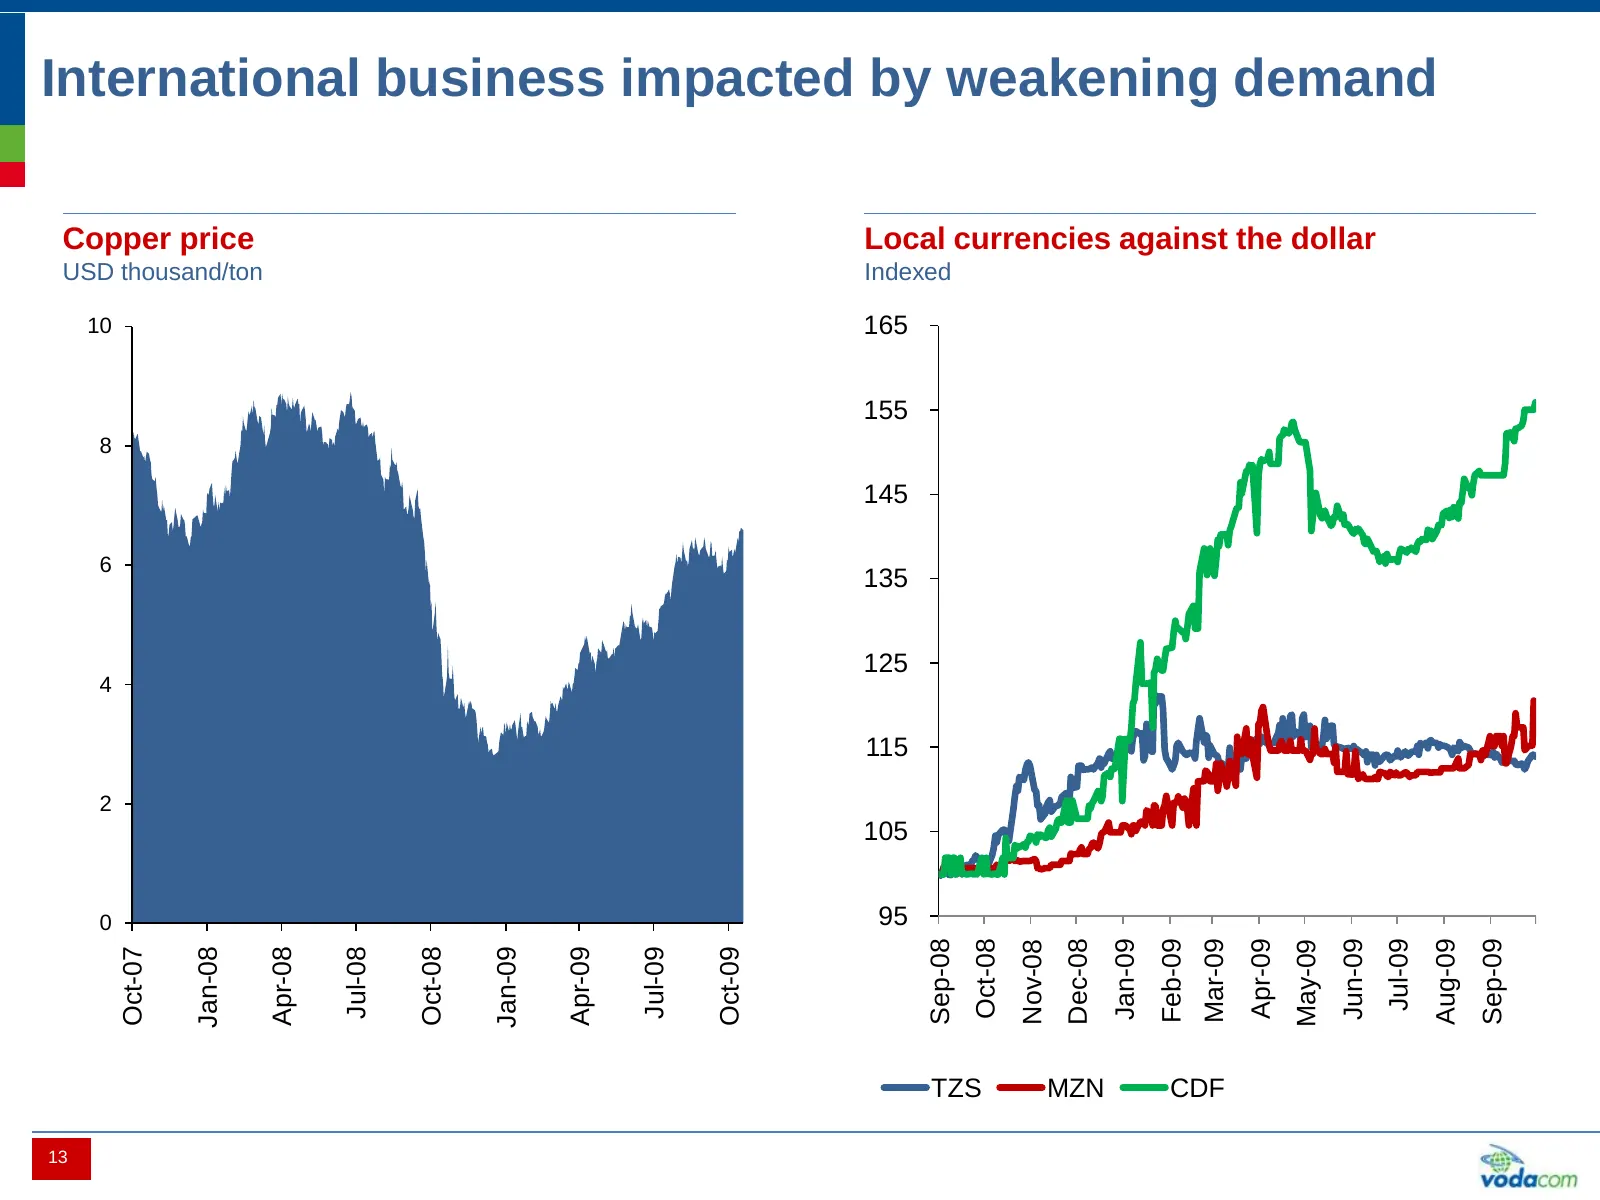
Slide 14: International business impacted by weakening demand
International business impacted by weakening demand Copper price Local currencies against the dollar USD thousand/ton Indexed 10 165 155 8 145 6 135 125 4 115 2 105 0 95 Jan-09 Jun-09 Oct-08 Sep-08 Dec-08 Feb-09 Apr-09 Jul-09 Aug-09 Sep-09 Mar-09 May-09 Nov-08 Jan-08 Jan-09 Apr-08 Apr-09 Oct-07 Oct-
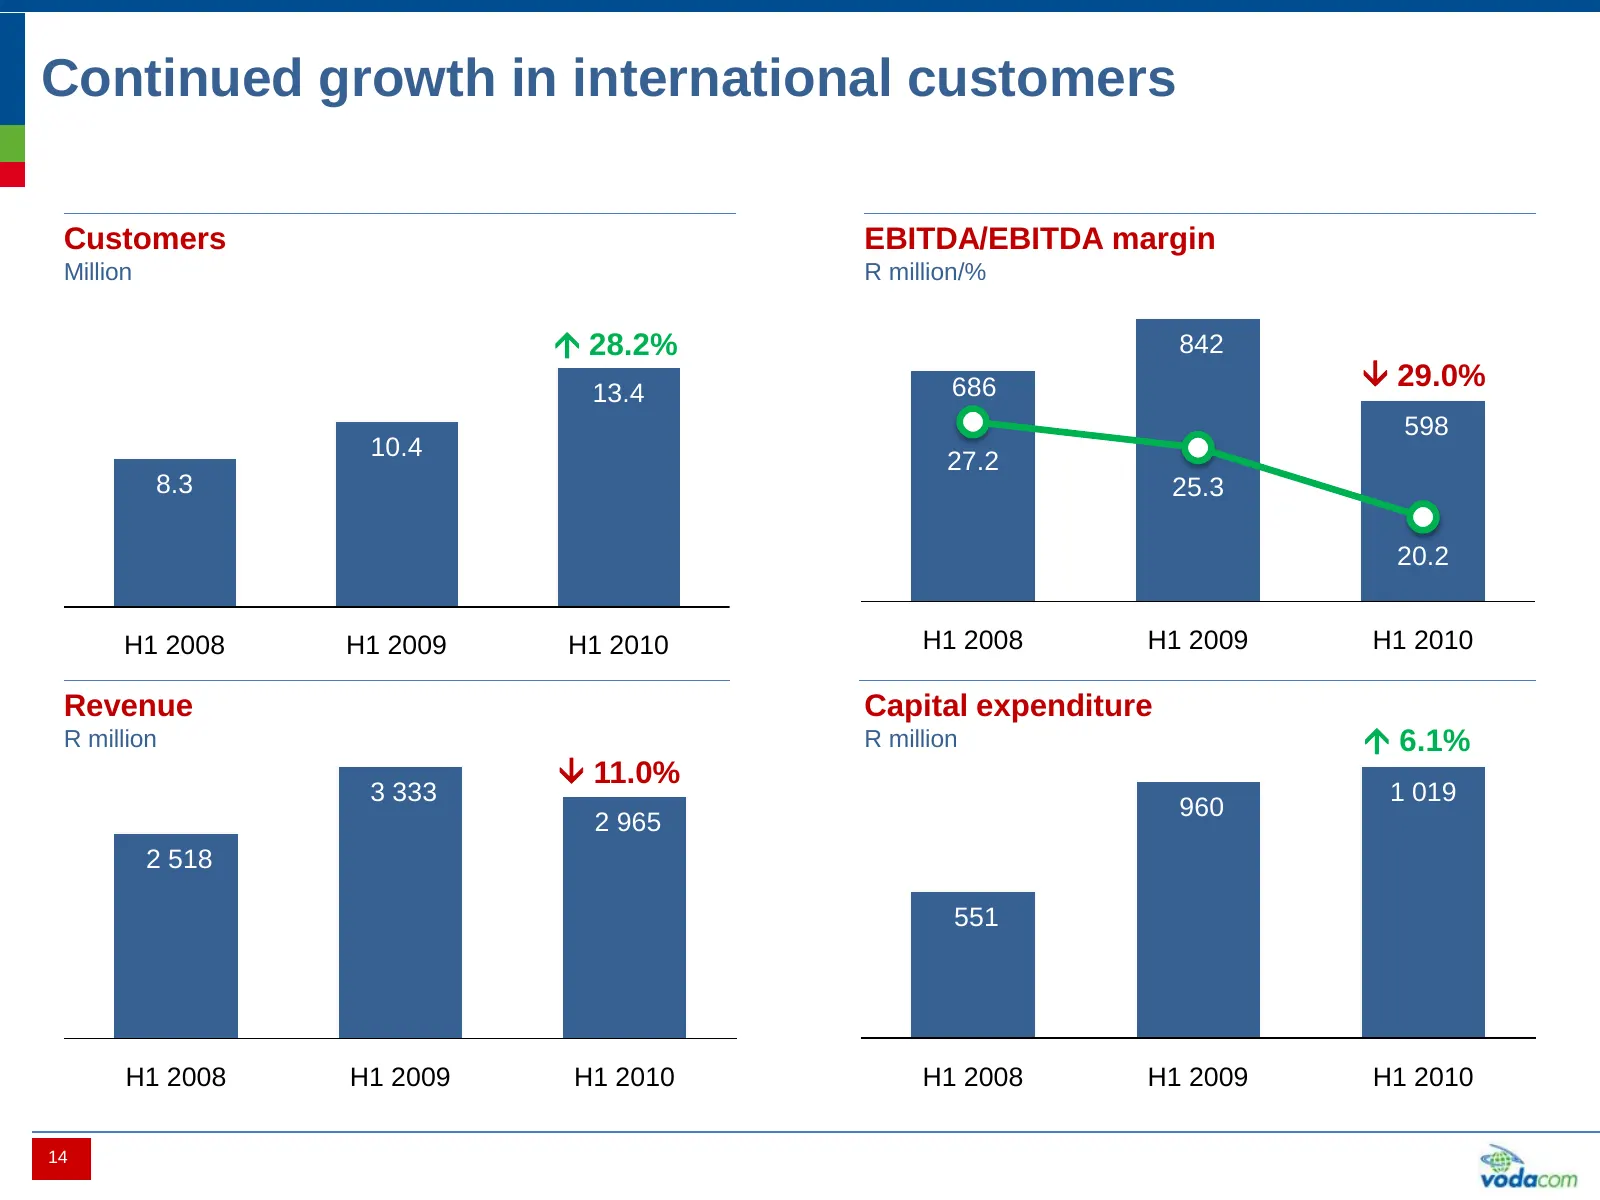
Slide 15: Continued growth in international customers
Continued growth in international customers Customers EBITDA/EBITDA margin Million R million/% 28.2% 842 686 29.0% 13.4 598 10.4 27.2 8.3 25.3 20.2 H1 2008 H1 2009 H1 2010 H1 2008 H1 2009 H1 2010 Revenue Capital expenditure R million R million 6.1% 11.0% 3 333 1 019 960 2 965 2 518 551 H1 20
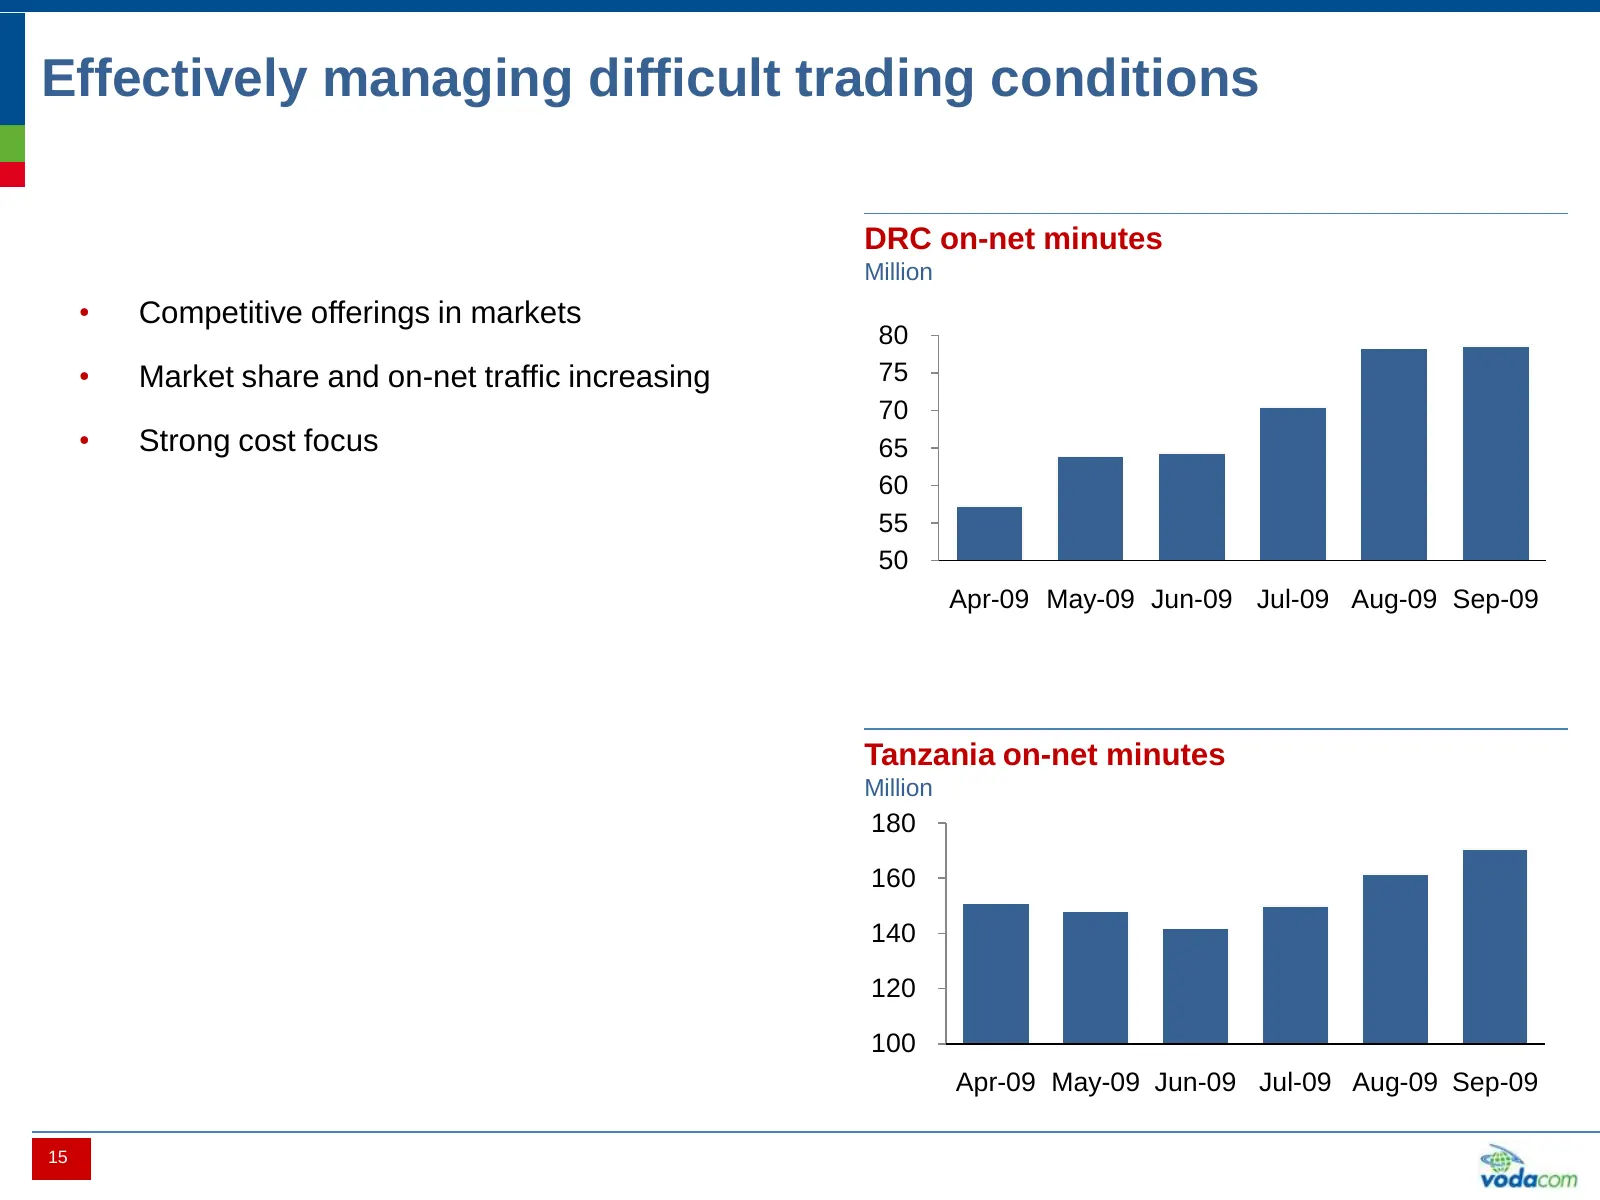
Slide 16: Effectively managing difficult trading conditions
Effectively managing difficult trading conditions DRC on-net minutes Million • Competitive offerings in markets 80 • Market share and on-net traffic increasing 75 70 • Strong cost focus 65 60 55 50 Apr-09 May-09 Jun-09 Jul-09 Aug-09 Sep-09 Tanzania on-net minutes Million 180 160 140 120 100 Apr-09 M
Slide 17: Converged services
Converged South Africa International Financials Outlook services
Slide 18: Advancing total communications strategy
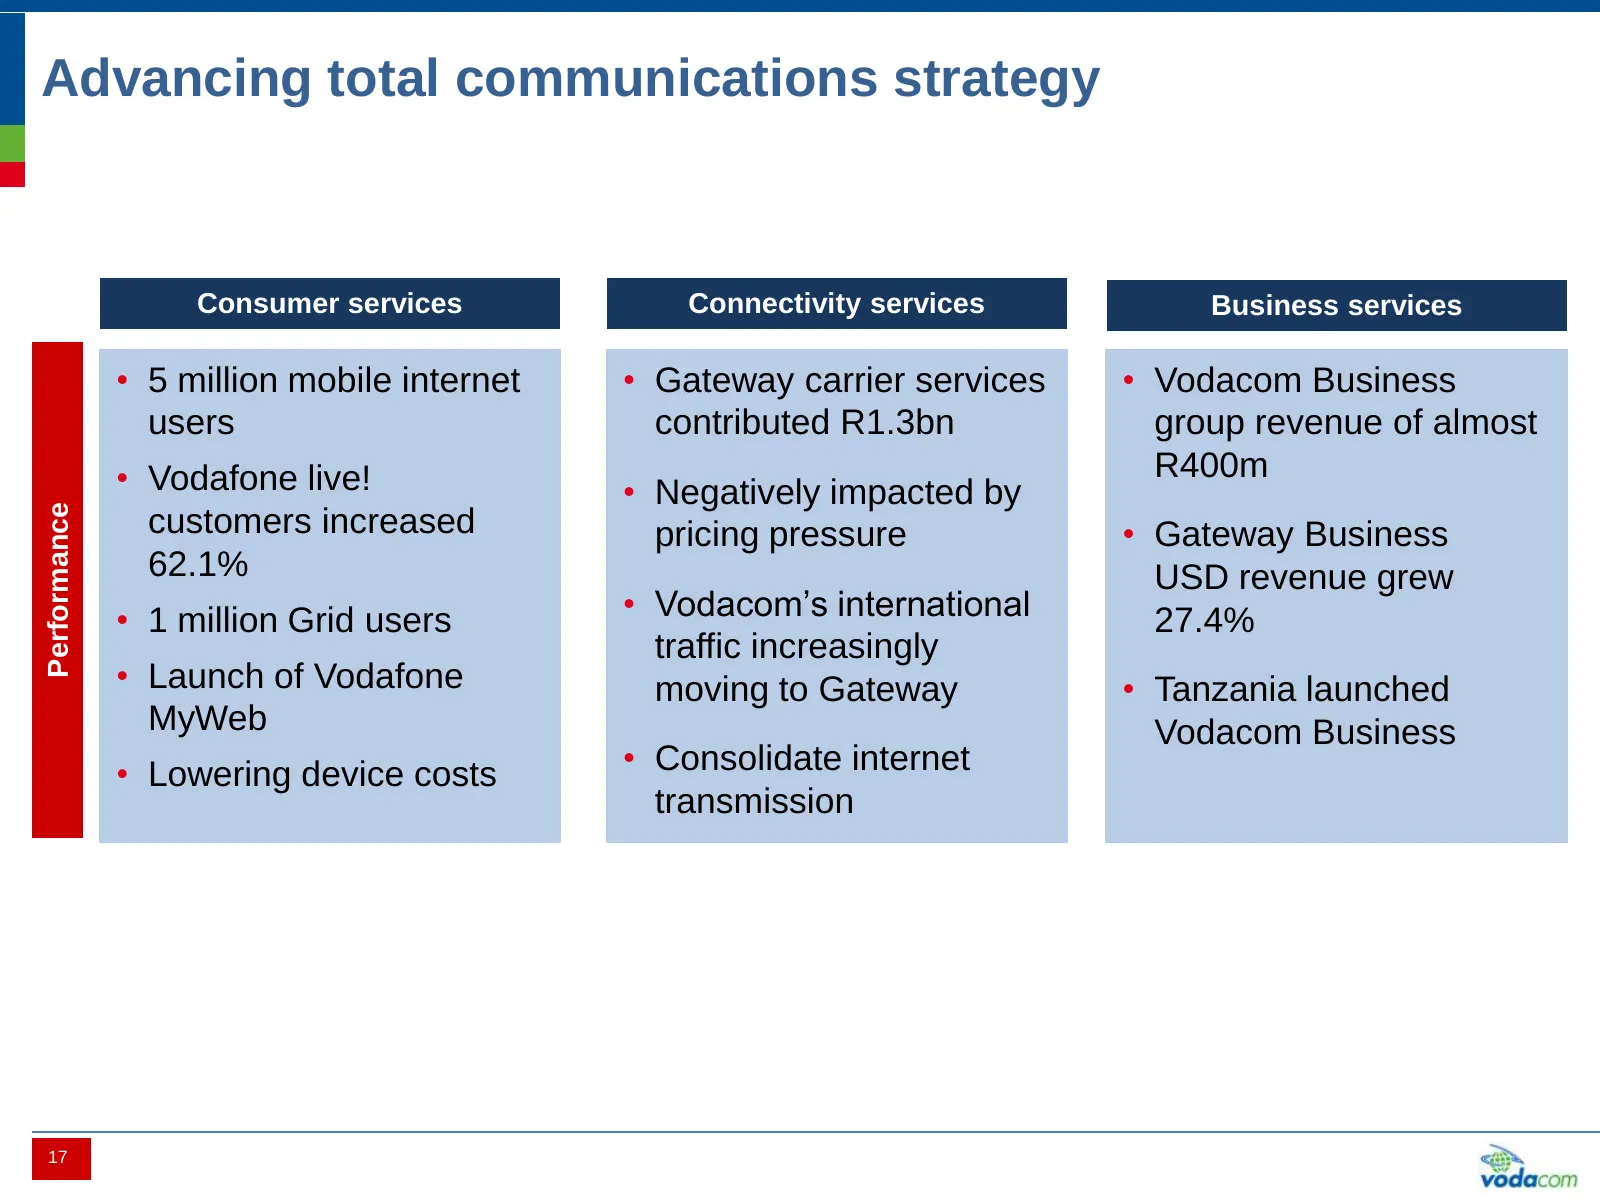
Advancing total communications strategy Consumer services Connectivity services Business services • 5 million mobile internet • Gateway carrier services • Vodacom Business users contributed R1.3bn group revenue of almost • Vodafone live! R400m • Negatively impacted by Performance customers increased
Slide 19: Financials
Highlights South Africa International Financials Outlook
Slide 20: Group income statement
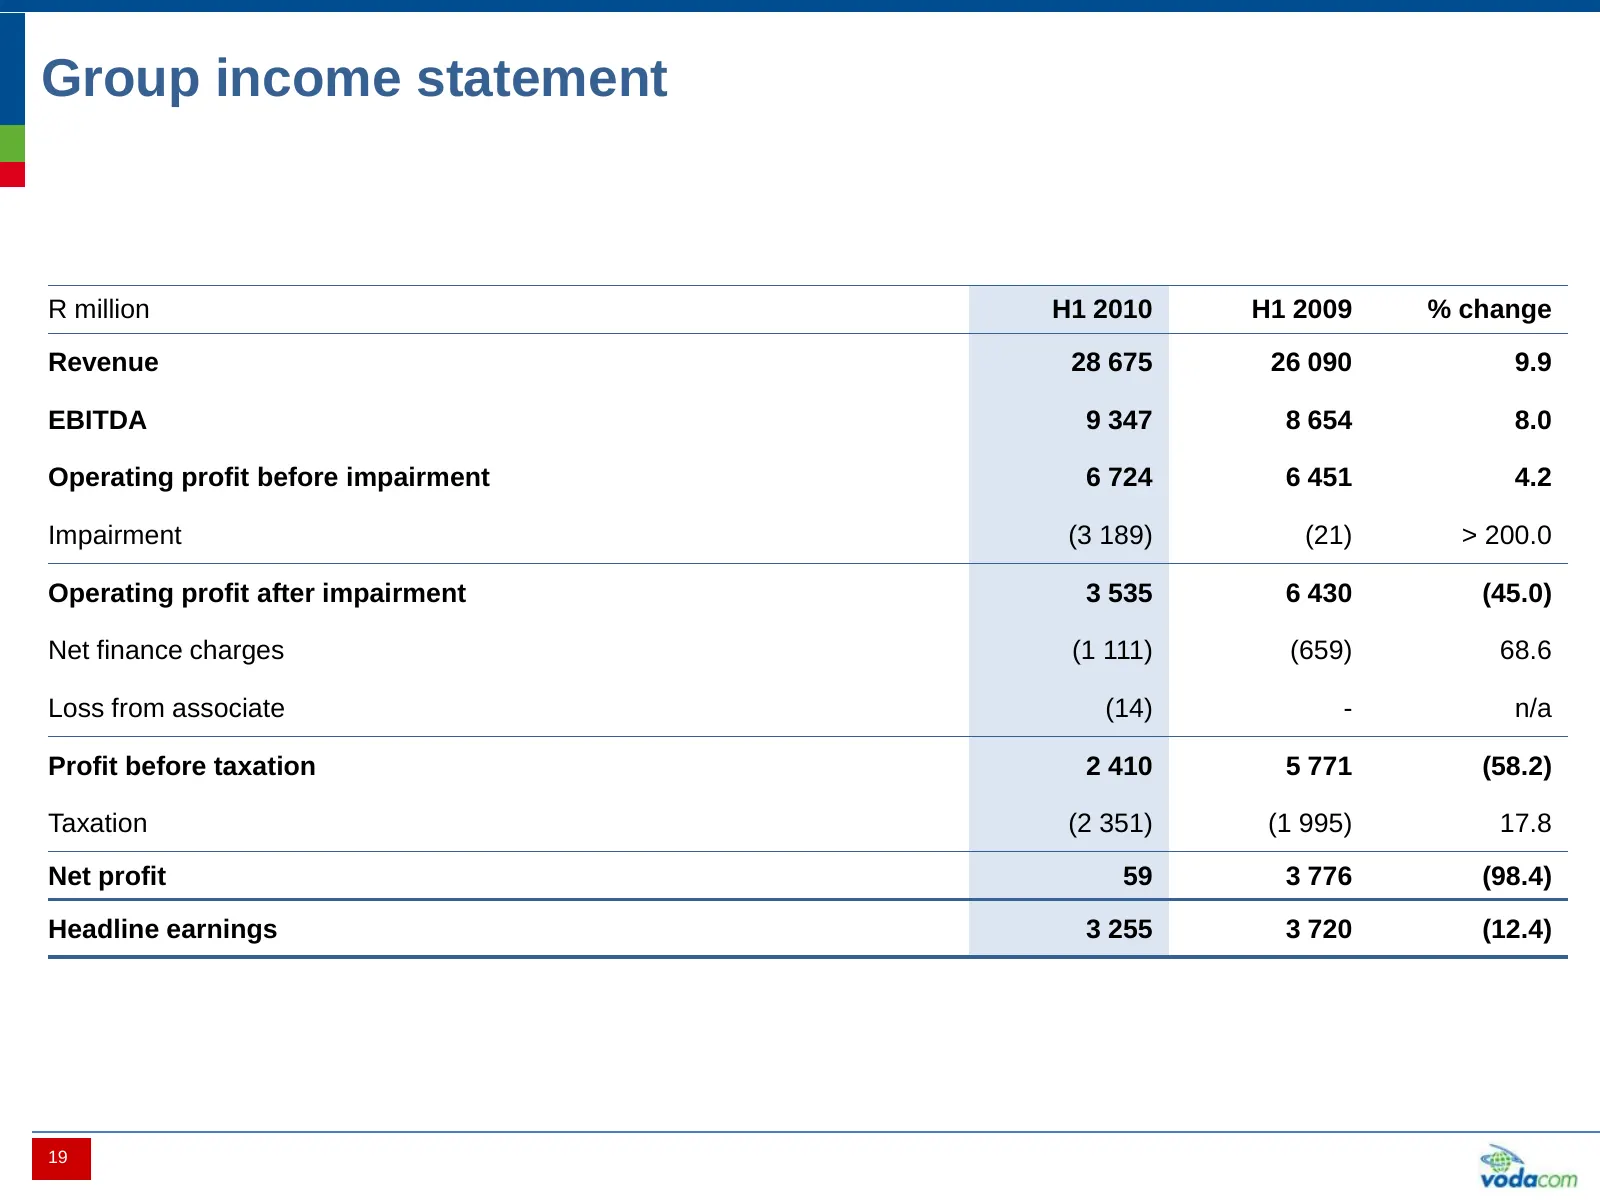
Group income statement R million H1 2010 H1 2009 % change Revenue 28 675 26 090 9.9 EBITDA 9 347 8 654 8.0 Operating profit before impairment 6 724 6 451 4.2 Impairment (3 189) (21) > 200.0 Operating profit after impairment 3 535 6 430 (45.0) Net finance charges (1 111) (659) 68.6 Loss from associat
Slide 21: Normalised revenue growth of 4.7%
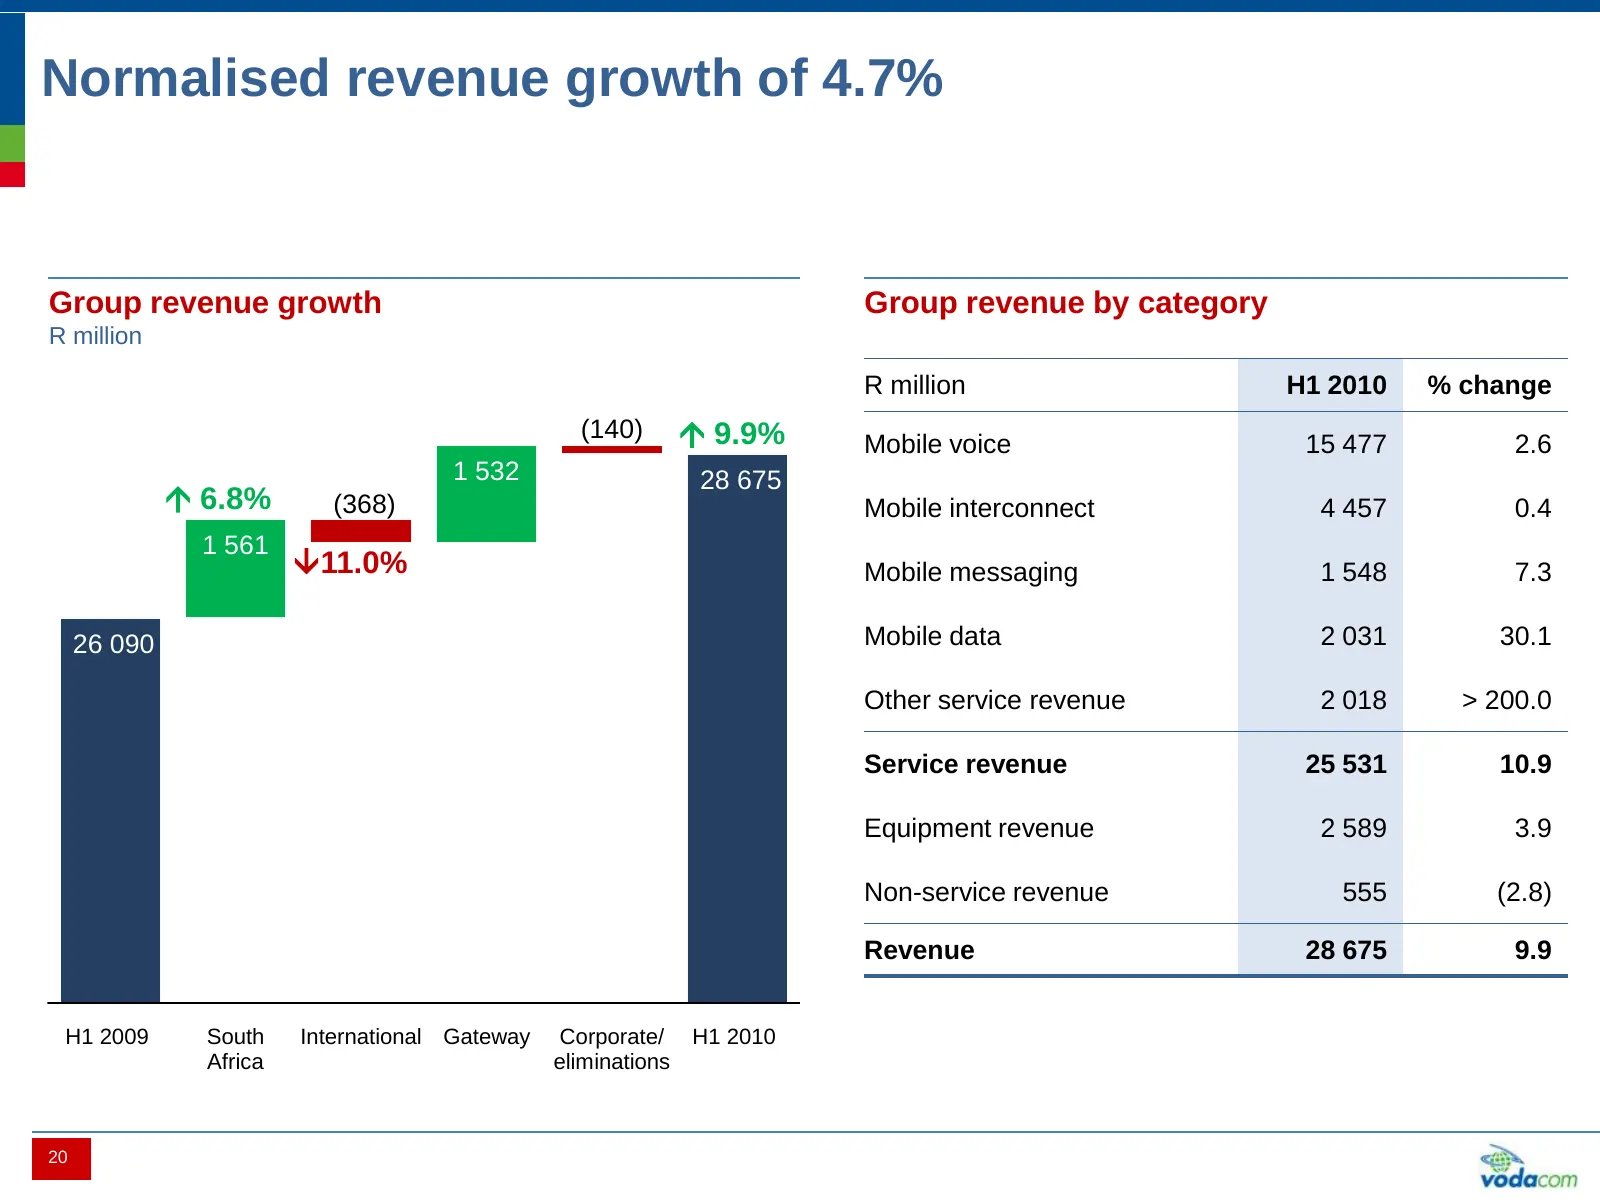
Normalised revenue growth of 4.7% Group revenue growth Group revenue by category R million R million H1 2010 % change (140) 9.9% Mobile voice 15 477 2.6 1 532 28 675 6.8% (368) Mobile interconnect 4 457 0.4 1 561 11.0% Mobile messaging 1 548 7.3 26 090 Mobile data 2 031 30.1 Other service reven
Slide 22: Group operating costs increased 3.2% excluding Gateway
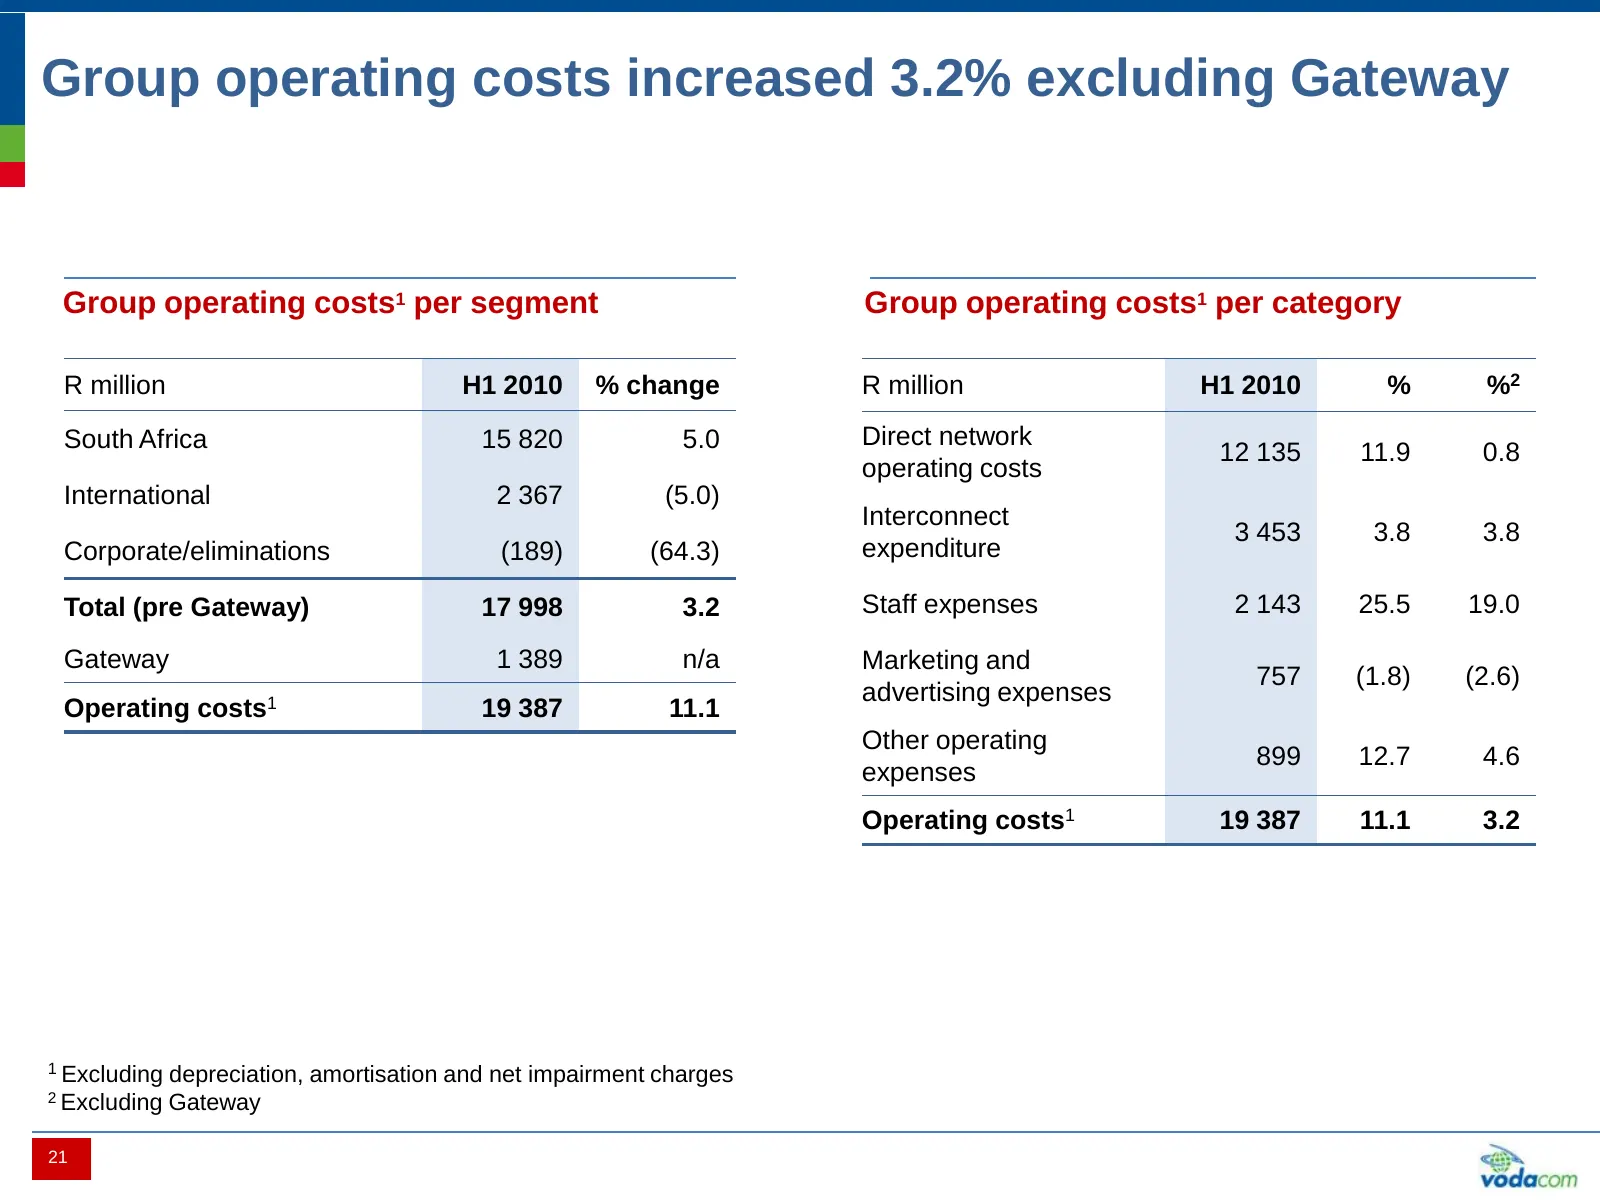
Group operating costs increased 3.2% excluding Gateway Group operating costs1 per segment Group operating costs1 per category R million H1 2010 % change R million H1 2010 % %2 South Africa 15 820 5.0 Direct network 12 135 11.9 0.8 operating costs International 2 367 (5.0) Interconnect 3 453 3.8 3.8
Slide 23: Group EBITDA increased 8%
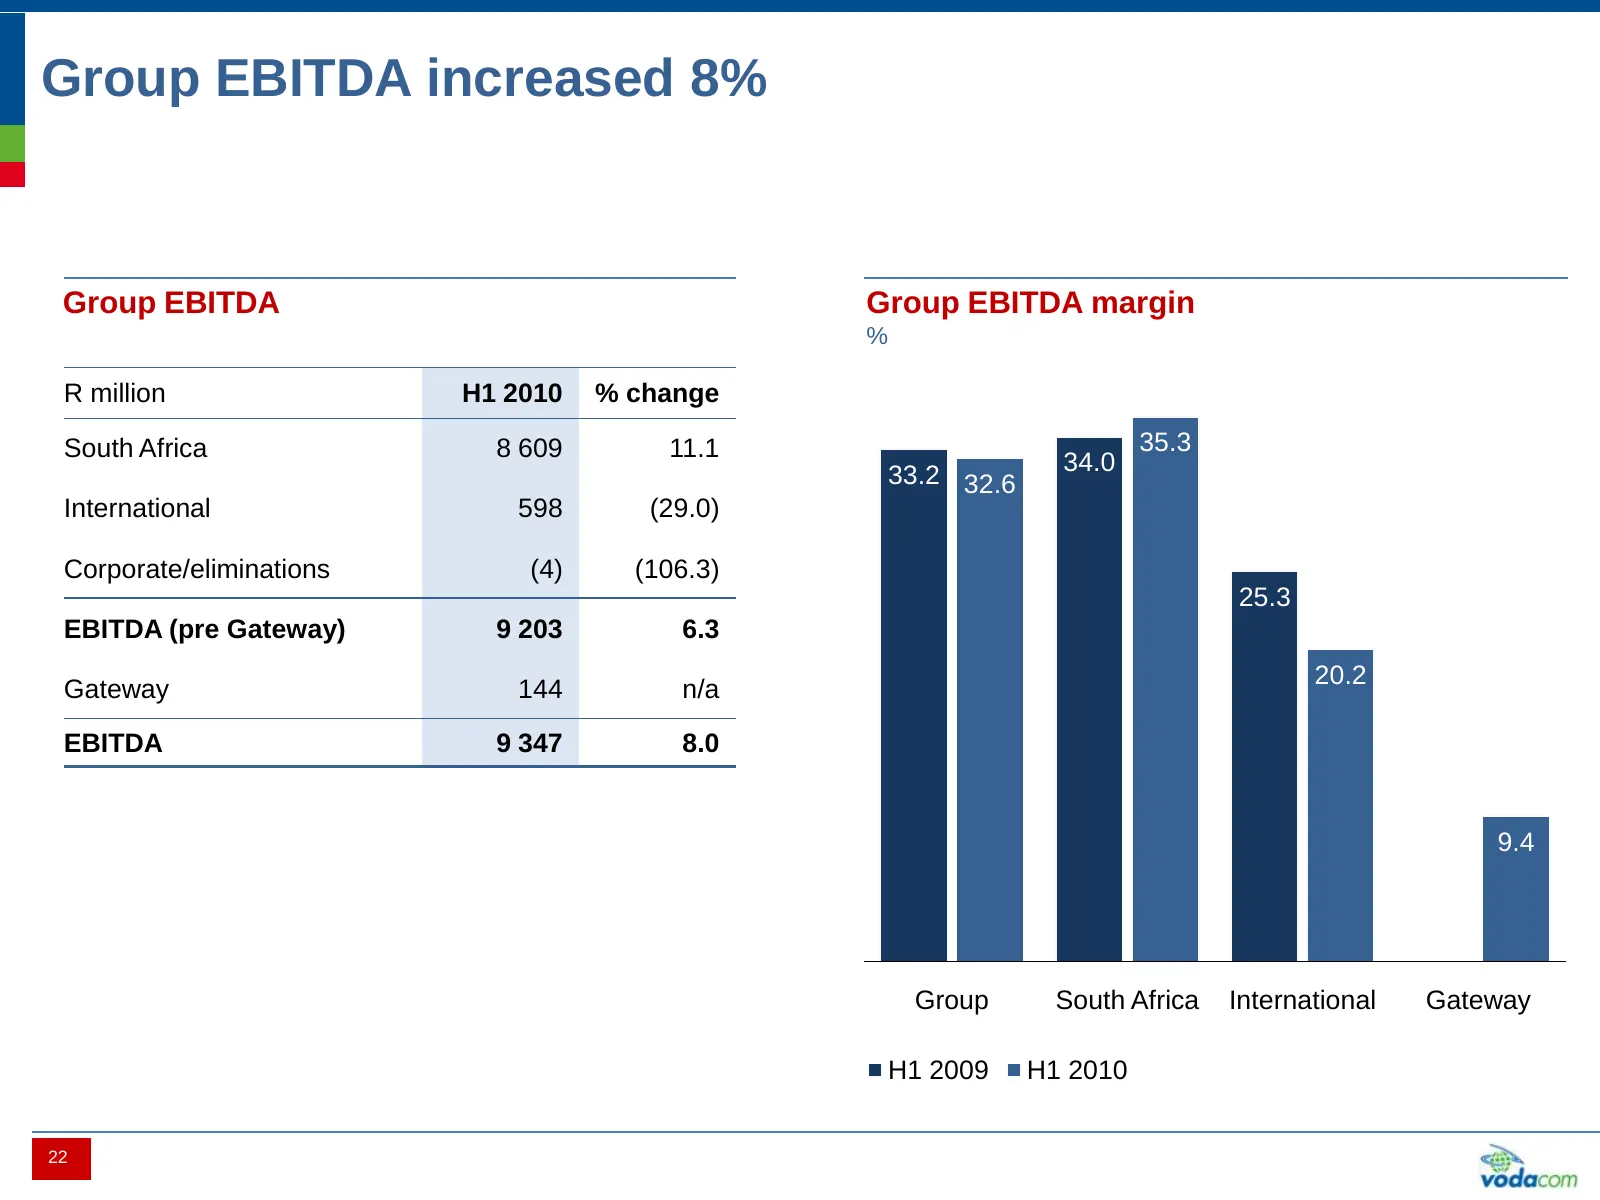
Group EBITDA increased 8% Group EBITDA Group EBITDA margin % R million H1 2010 % change South Africa 8 609 11.1 35.3 33.2 32.6 34.0 International 598 (29.0) Corporate/eliminations (4) (106.3) 25.3 EBITDA (pre Gateway) 9 203 6.3 20.2 Gateway 144 n/a EBITDA 9 347 8.0 9.4 Group South Africa Internation
Slide 24: Group net profit impacted by impairments and higher taxation
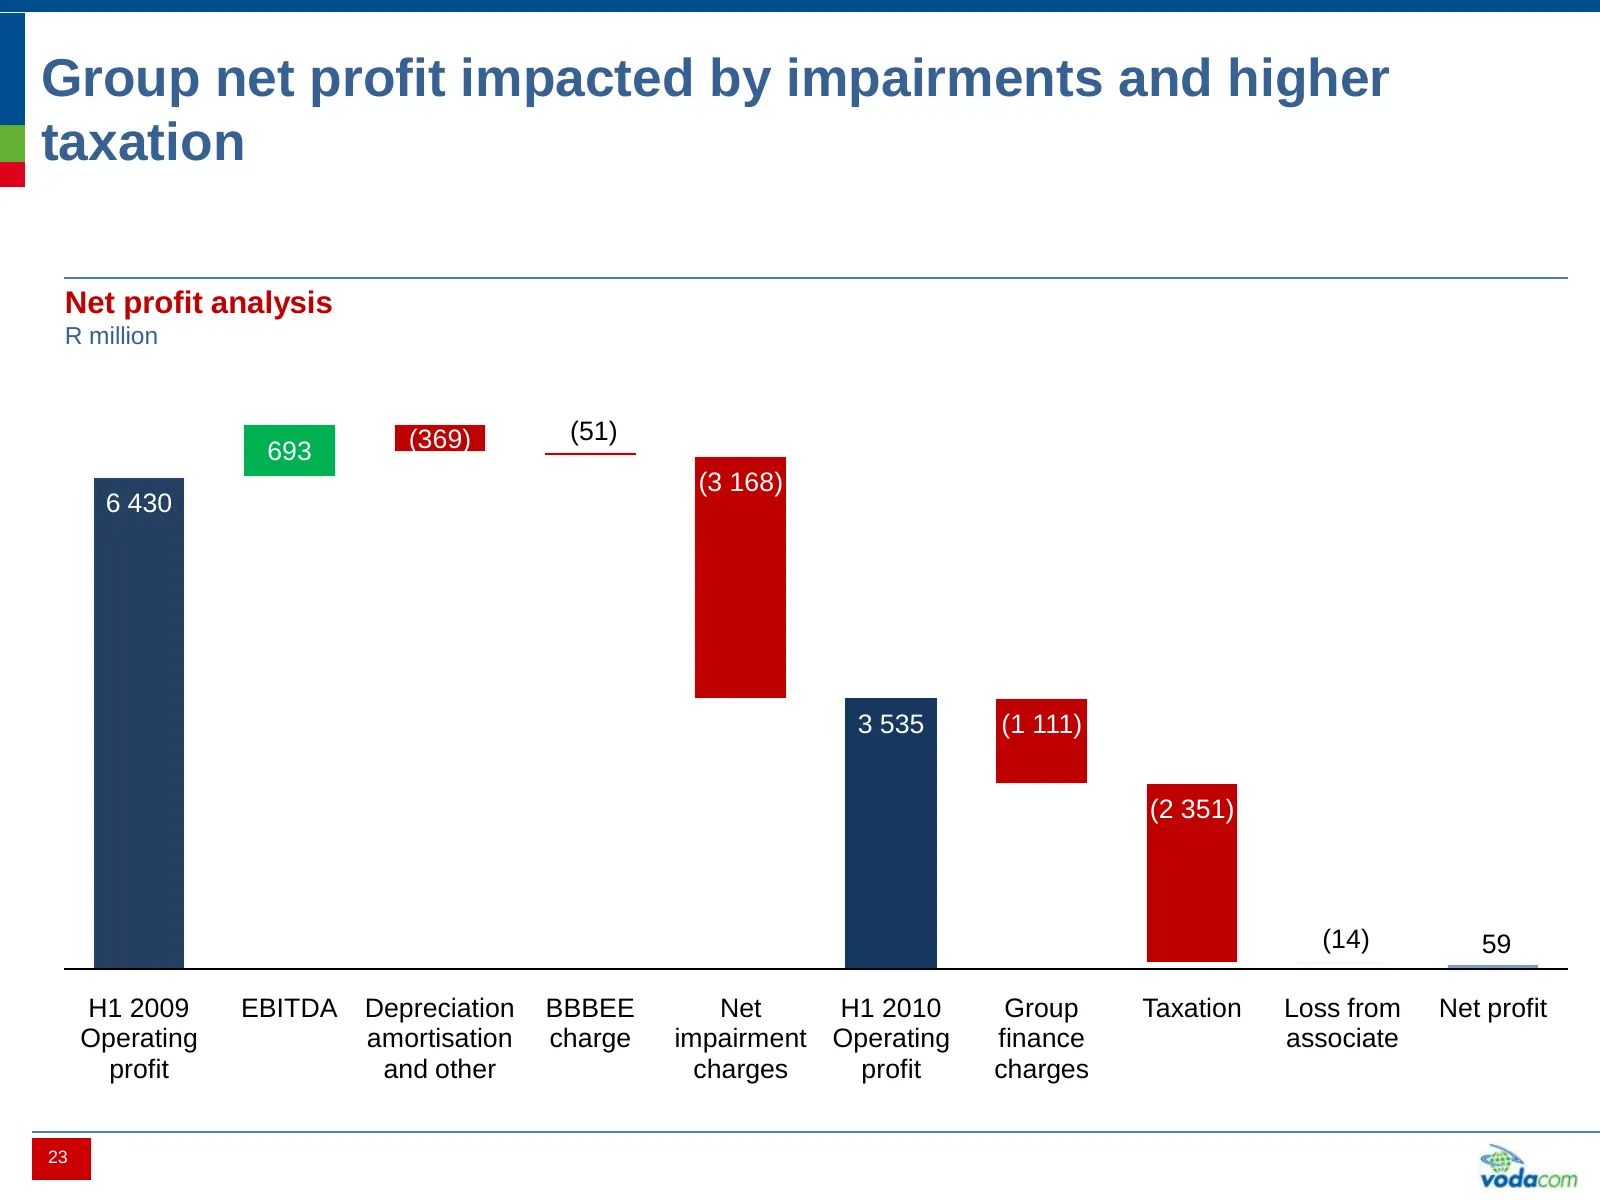
Group net profit impacted by impairments and higher taxation Net profit analysis R million (369) (51) 693 (3 168) 6 430 3 535 (1 111) (2 351) (14) 59 H1 2009 EBITDA Depreciation BBBEE Net H1 2010 Group Taxation Loss from Net profit Operating amortisation charge impairment Operating finance associate
Slide 25: Impairment of Gateway
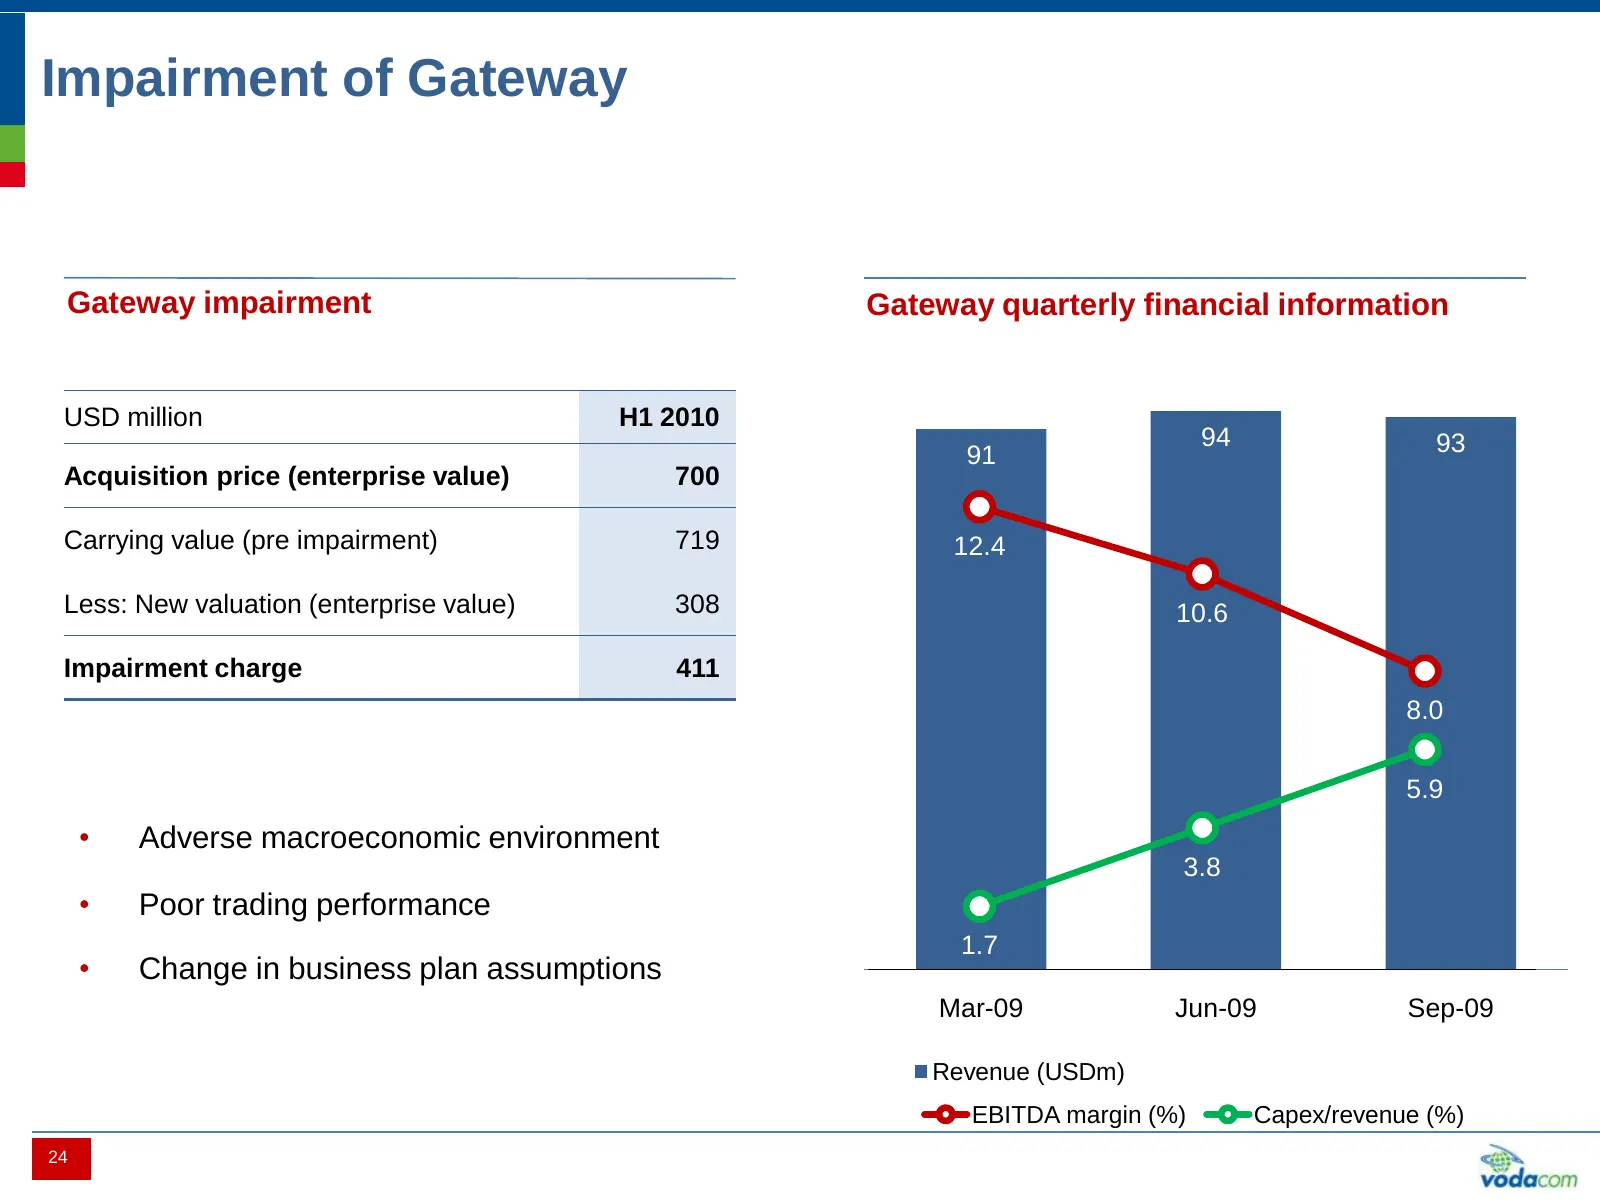
Impairment of Gateway Gateway impairment Gateway quarterly financial information USD million H1 2010 94 93 91 Acquisition price (enterprise value) 700 Carrying value (pre impairment) 719 12.4 Less: New valuation (enterprise value) 308 10.6 Impairment charge 411 8.0 5.9 • Adverse macroeconomic enviro
Slide 26: Group finance charges impacted by higher debt
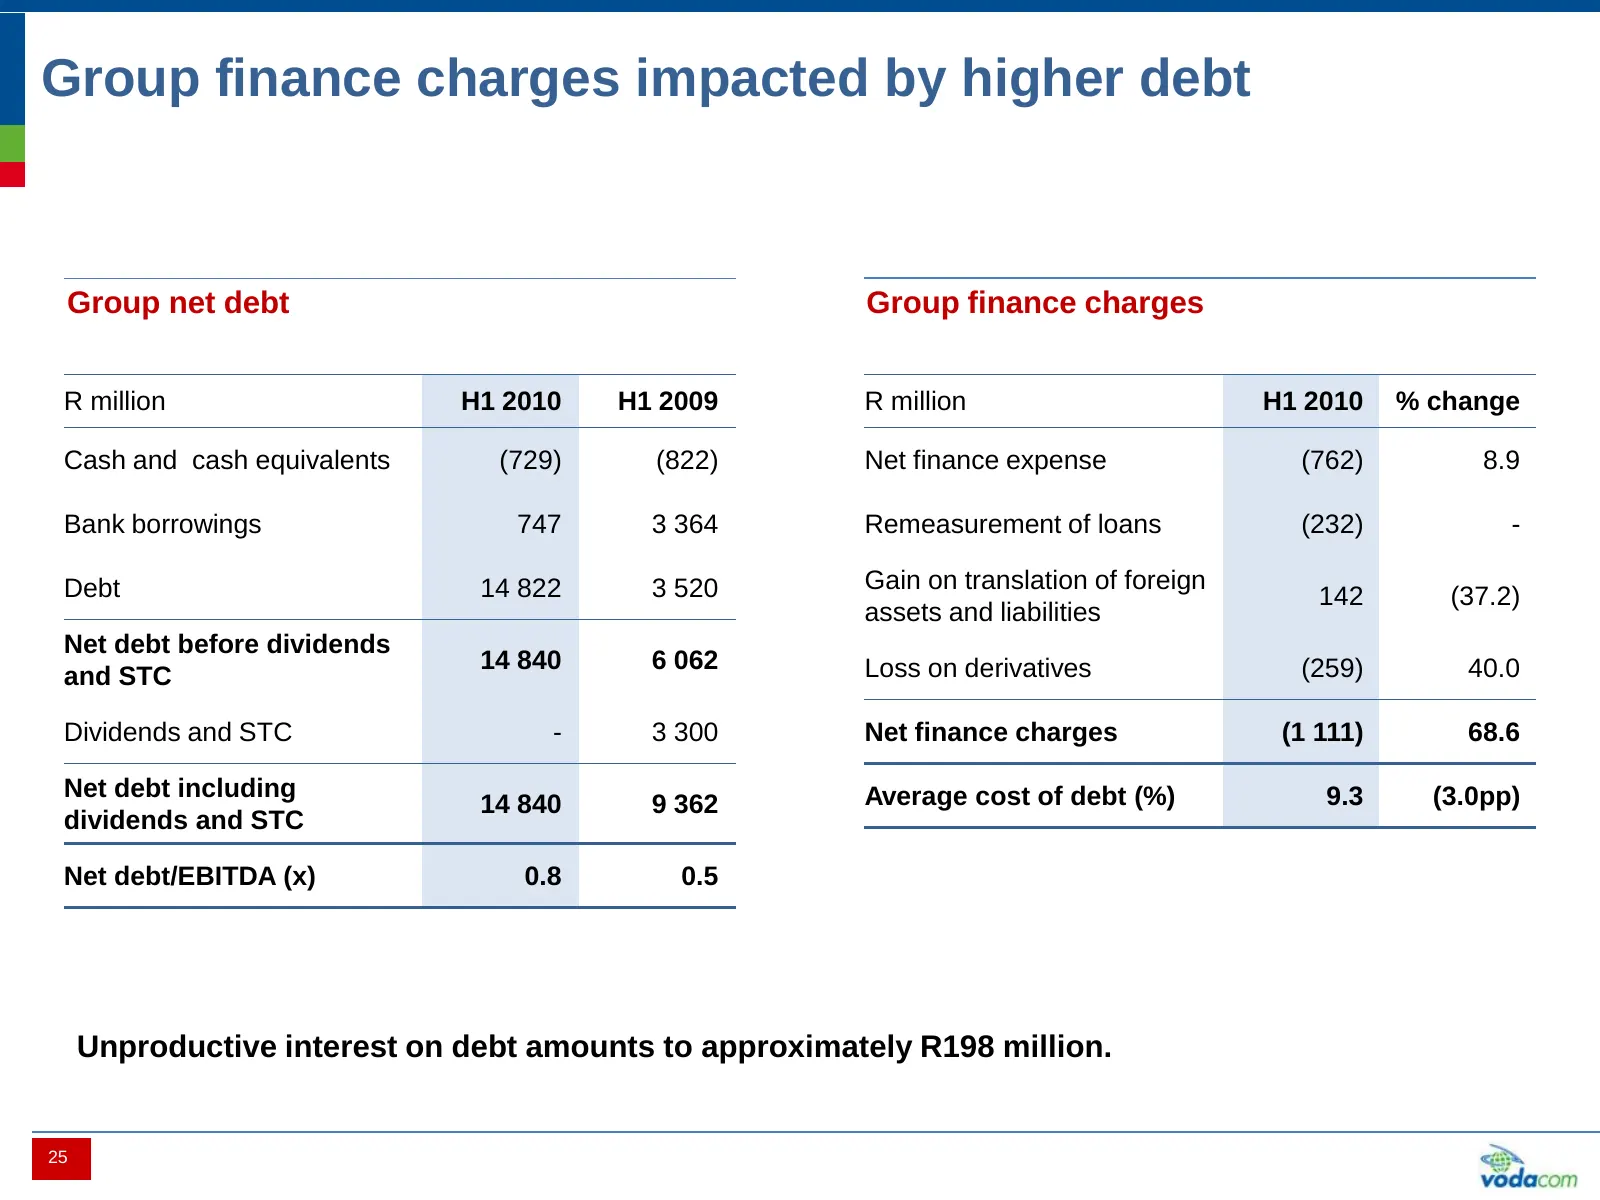
Group finance charges impacted by higher debt Group net debt Group finance charges R million H1 2010 H1 2009 R million H1 2010 % change Cash and cash equivalents (729) (822) Net finance expense (762) 8.9 Bank borrowings 747 3 364 Remeasurement of loans (232) - Debt 14 822 3 520 Gain on translation o
Slide 27: Group taxation expense impacted by non-cash items
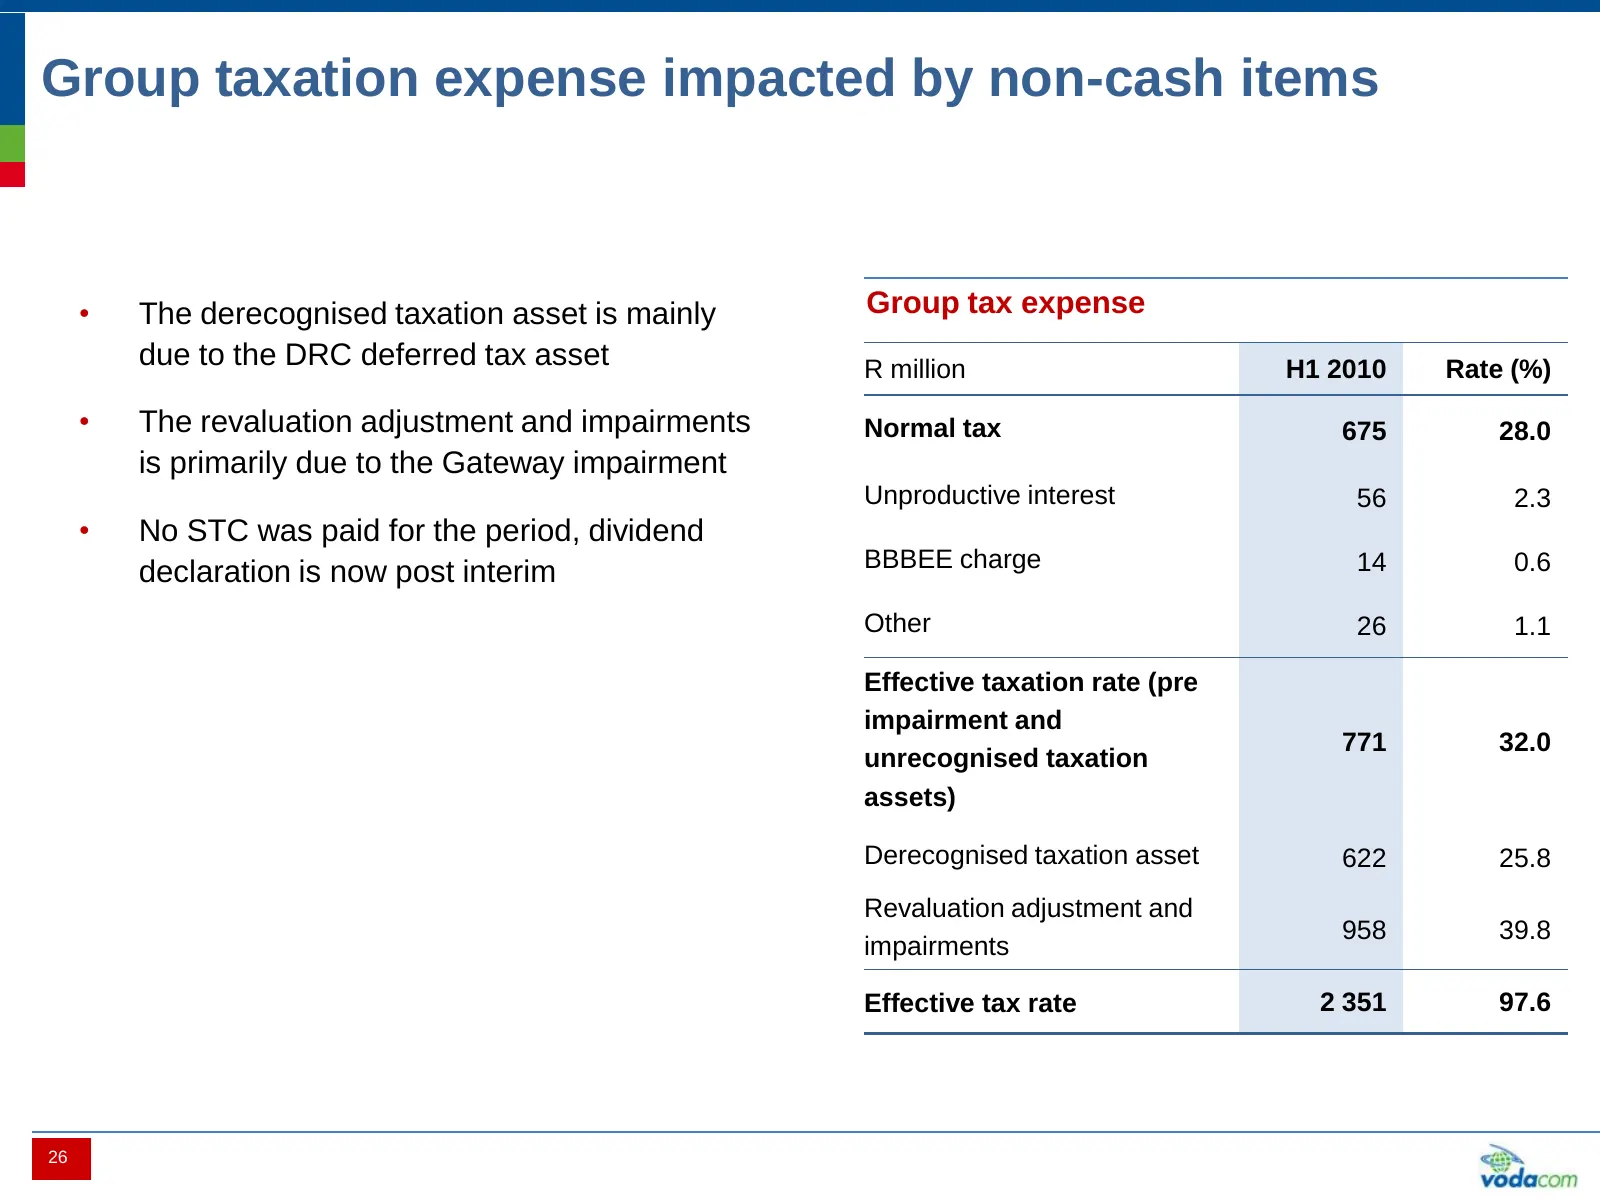
Group taxation expense impacted by non-cash items • The derecognised taxation asset is mainly Group tax expense due to the DRC deferred tax asset R million H1 2010 Rate (%) • The revaluation adjustment and impairments Normal tax 675 28.0 is primarily due to the Gateway impairment Unproductive intere
Slide 28: Core headline earnings per share increased 8.4%
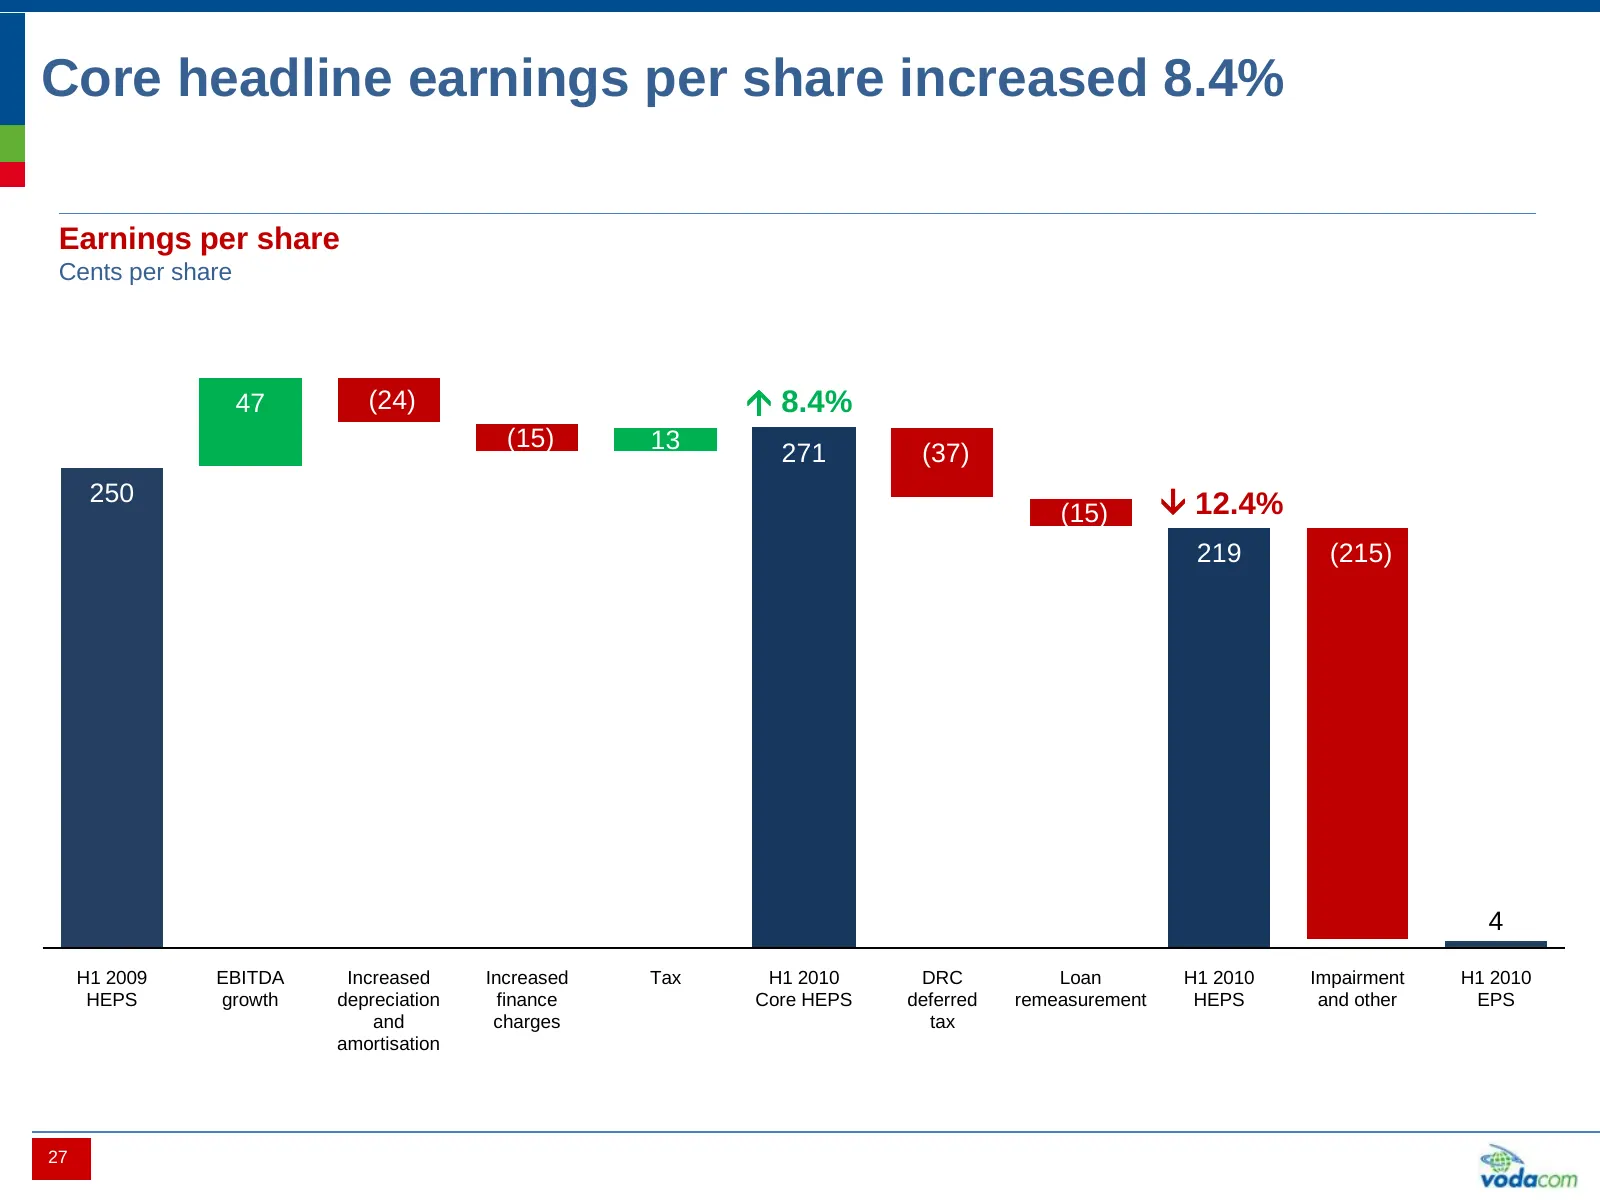
Core headline earnings per share increased 8.4% Earnings per share Cents per share 47 (24) 8.4% (15) 13 271 (37) 250 12.4% (15) 219 (215) 4 H1 2009 EBITDA Increased Increased Tax H1 2010 DRC Loan H1 2010 Impairment H1 2010 HEPS growth depreciation finance Core HEPS deferred remeasurement HEPS an
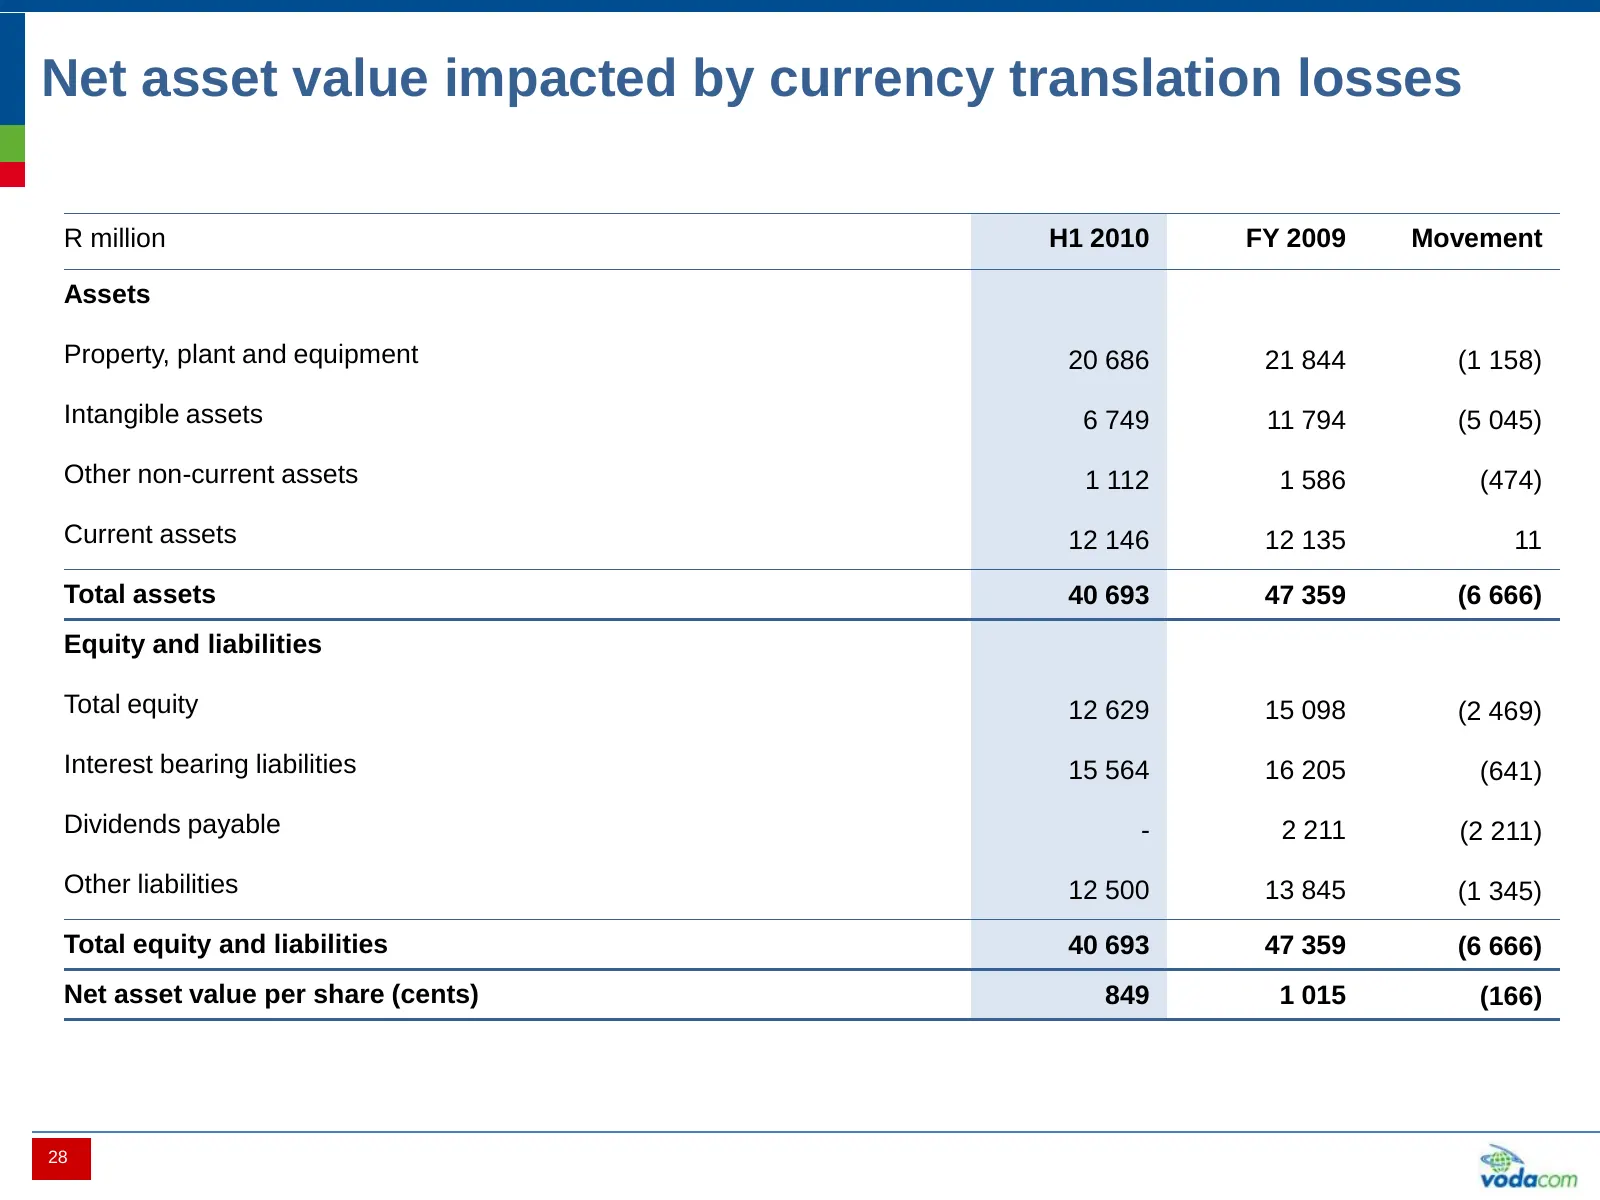
Slide 29: Net asset value impacted by currency translation losses
Net asset value impacted by currency translation losses R million H1 2010 FY 2009 Movement Assets Property, plant and equipment 20 686 21 844 (1 158) Intangible assets 6 749 11 794 (5 045) Other non-current assets 1 112 1 586 (474) Current assets 12 146 12 135 11 Total assets 40 693 47 359 (6 666) E
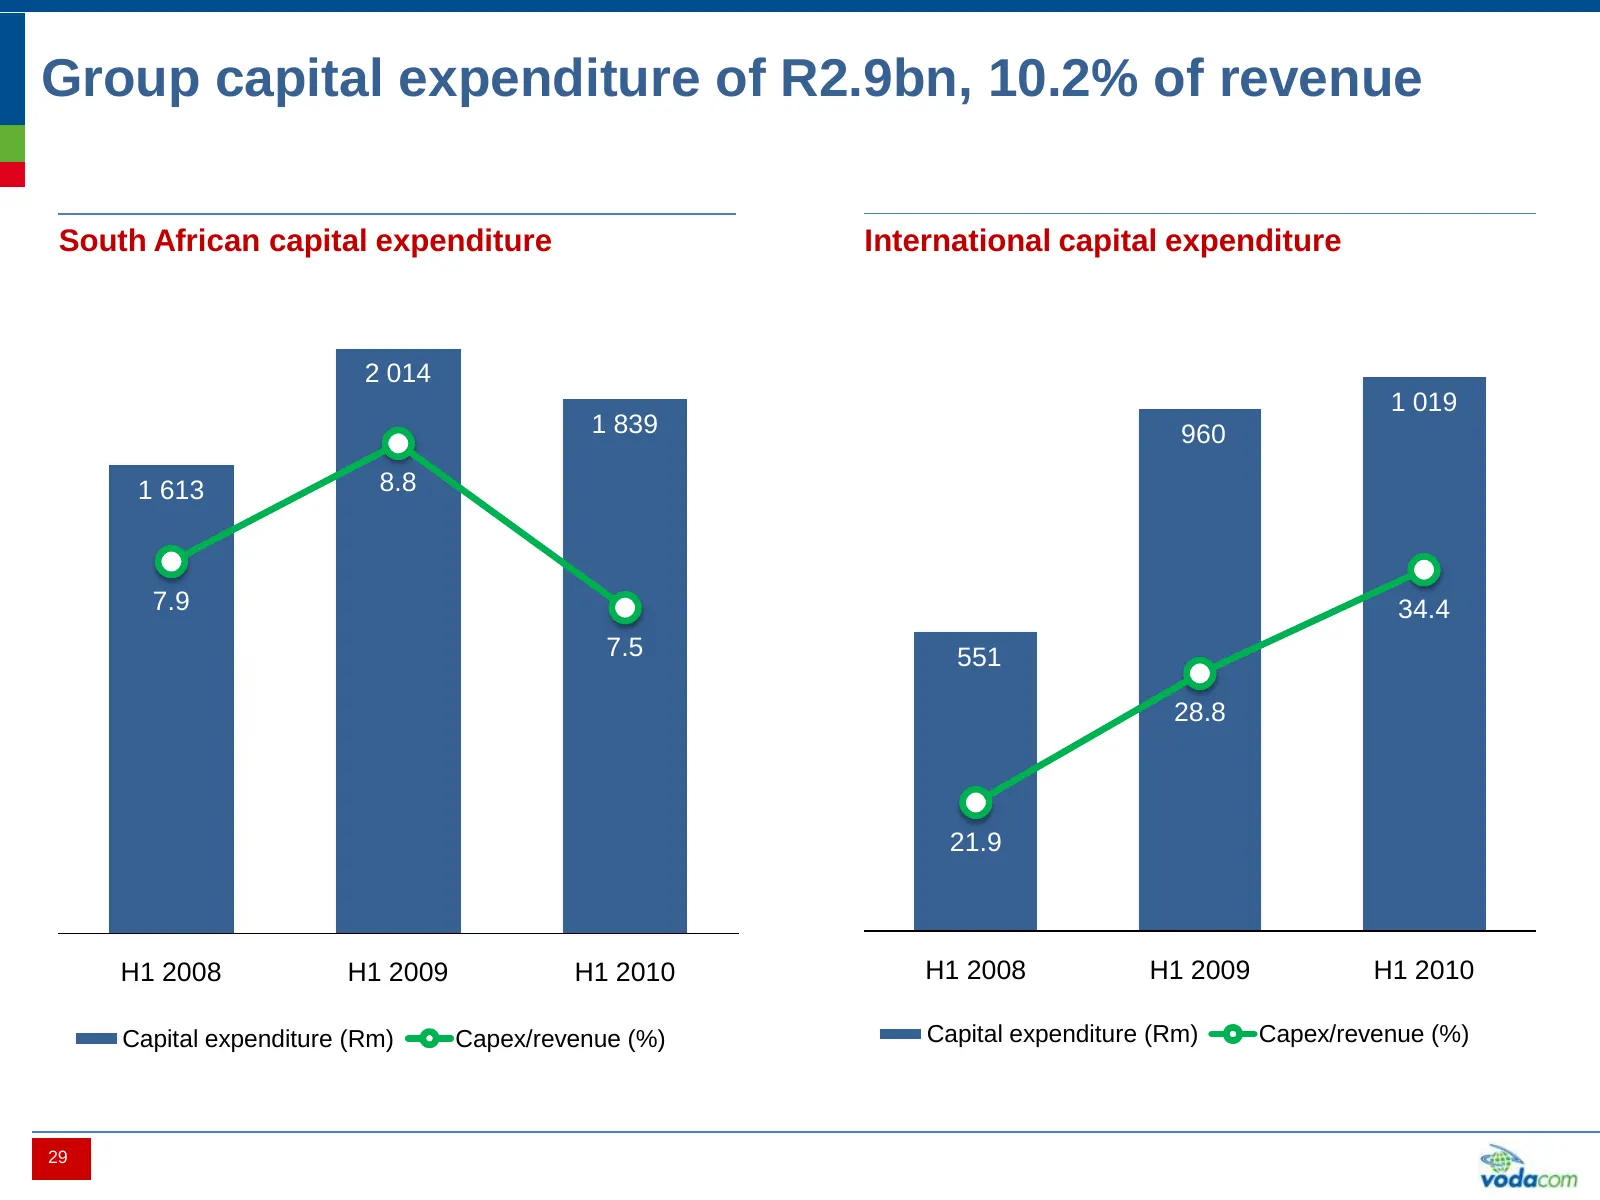
Slide 30: Group capital expenditure of R2.9bn, 10.2% of revenue
Group capital expenditure of R2.9bn, 10.2% of revenue South African capital expenditure International capital expenditure 2 014 1 019 1 839 960 1 613 8.8 7.9 34.4 7.5 551 28.8 21.9 H1 2008 H1 2009 H1 2010 H1 2008 H1 2009 H1 2010 Capital expenditure (Rm) Capex/revenue (%) Capital expenditure (Rm) Cap
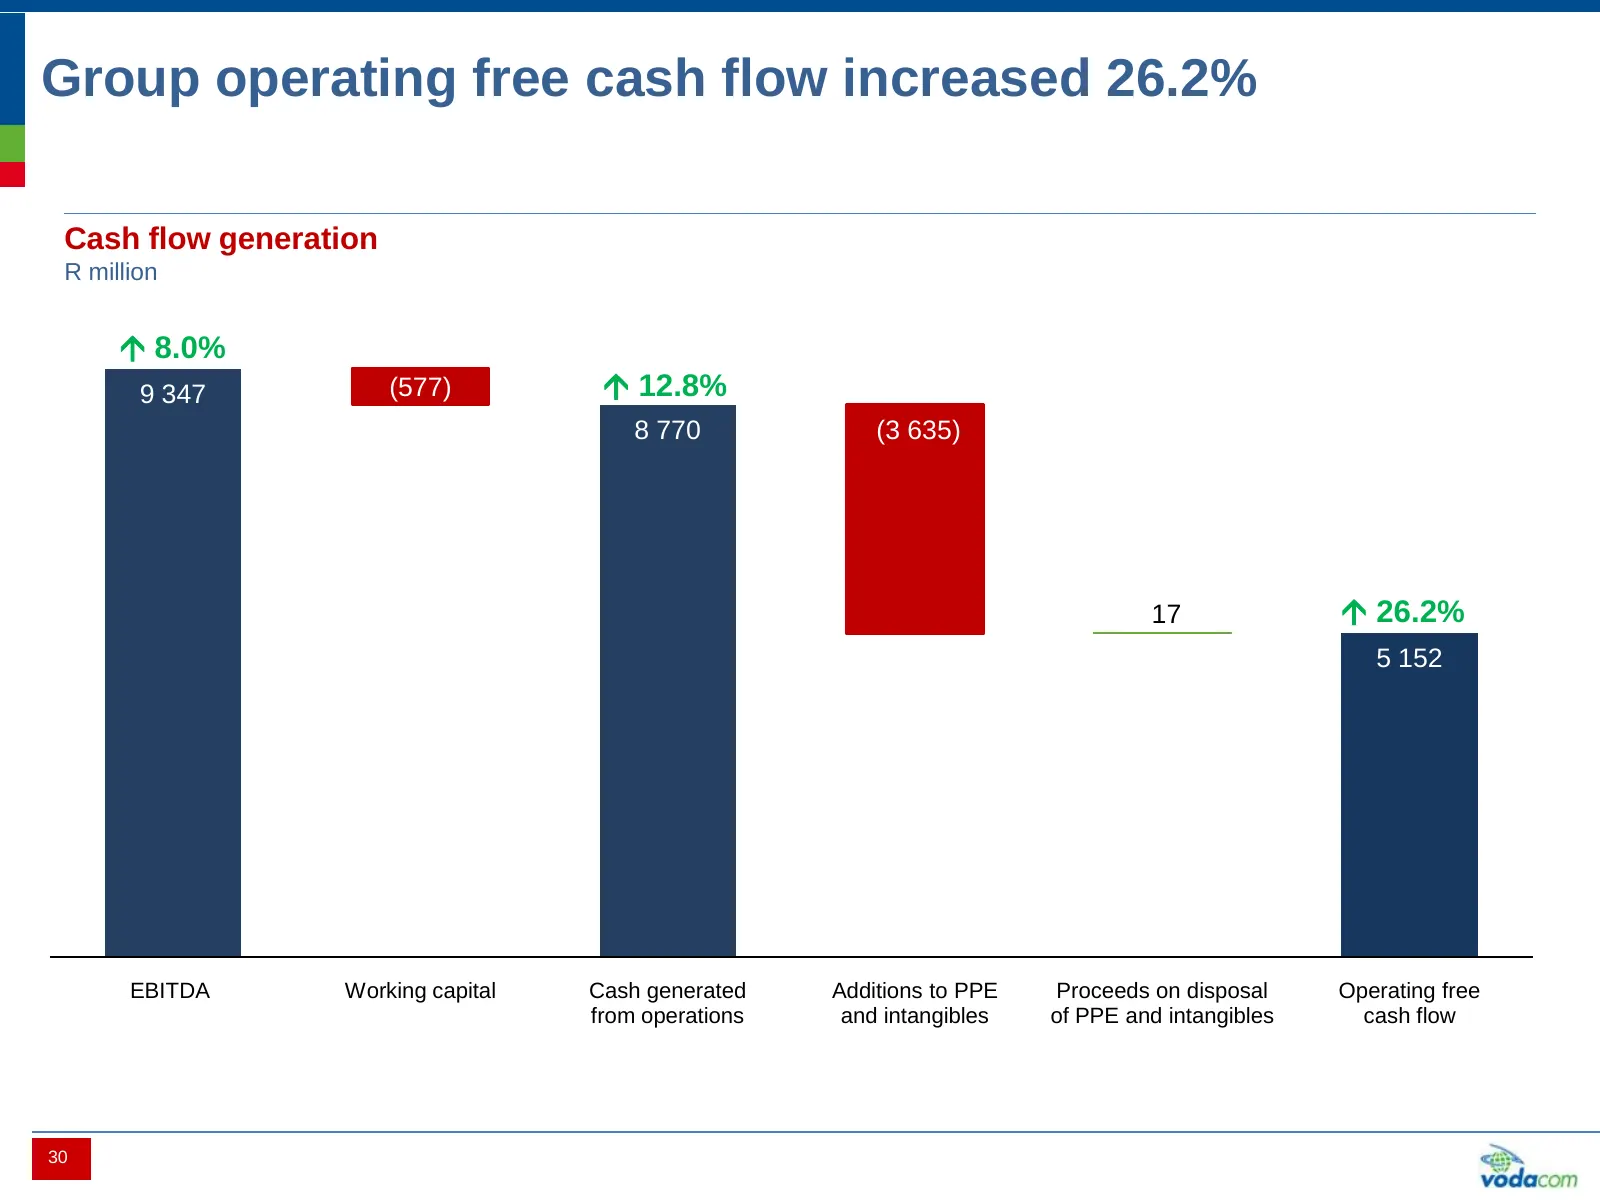
Slide 31: Group operating free cash flow increased 26.2%
Group operating free cash flow increased 26.2% Cash flow generation R million 8.0% 9 347 (577) 12.8% 8 770 (3 635) 17 26.2% 5 152 EBITDA Working capital Cash generated Additions to PPE Proceeds on disposal Operating free from operations and intangibles of PPE and intangibles cash flow 30
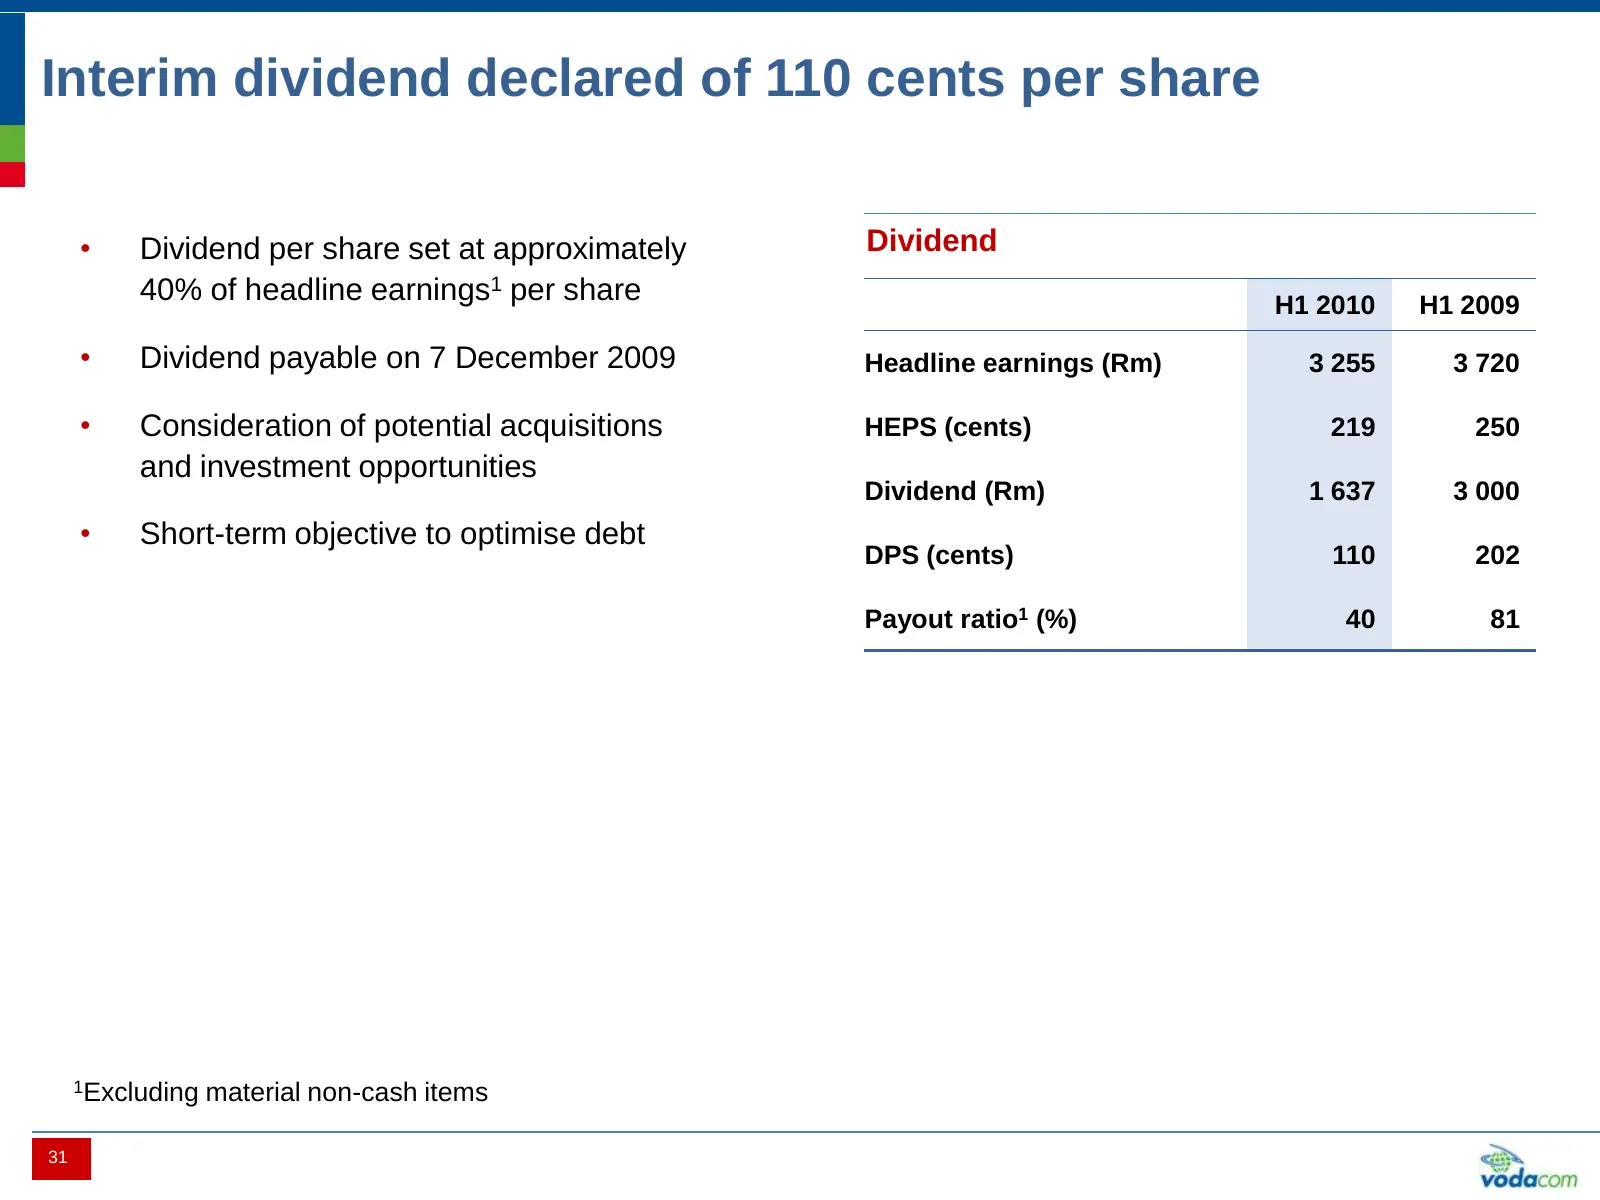
Slide 32: Interim dividend declared of 110 cents per share
Interim dividend declared of 110 cents per share • Dividend per share set at approximately Dividend 40% of headline earnings1 per share H1 2010 H1 2009 • Dividend payable on 7 December 2009 Headline earnings (Rm) 3 255 3 720 • Consideration of potential acquisitions HEPS (cents) 219 250 and investme
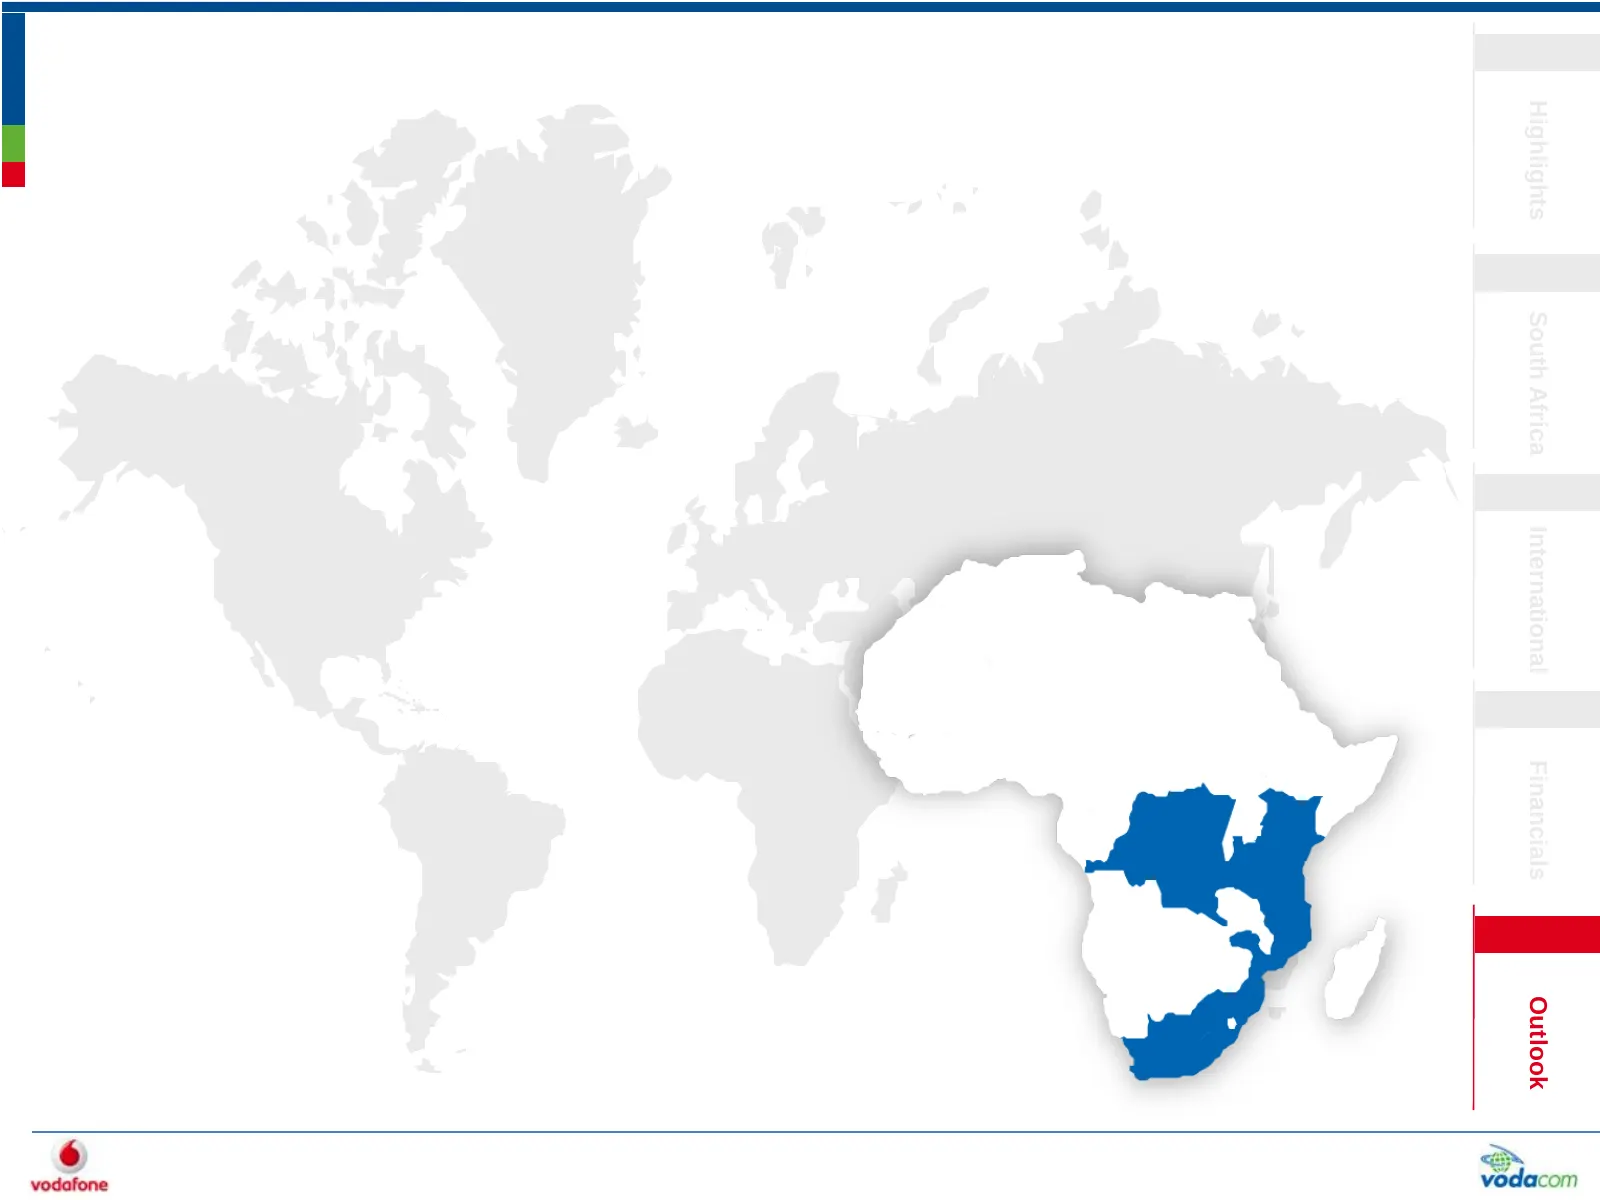
Slide 33: Outlook
Highlights South Africa International Financials Outlook
Slide 34: Outlook
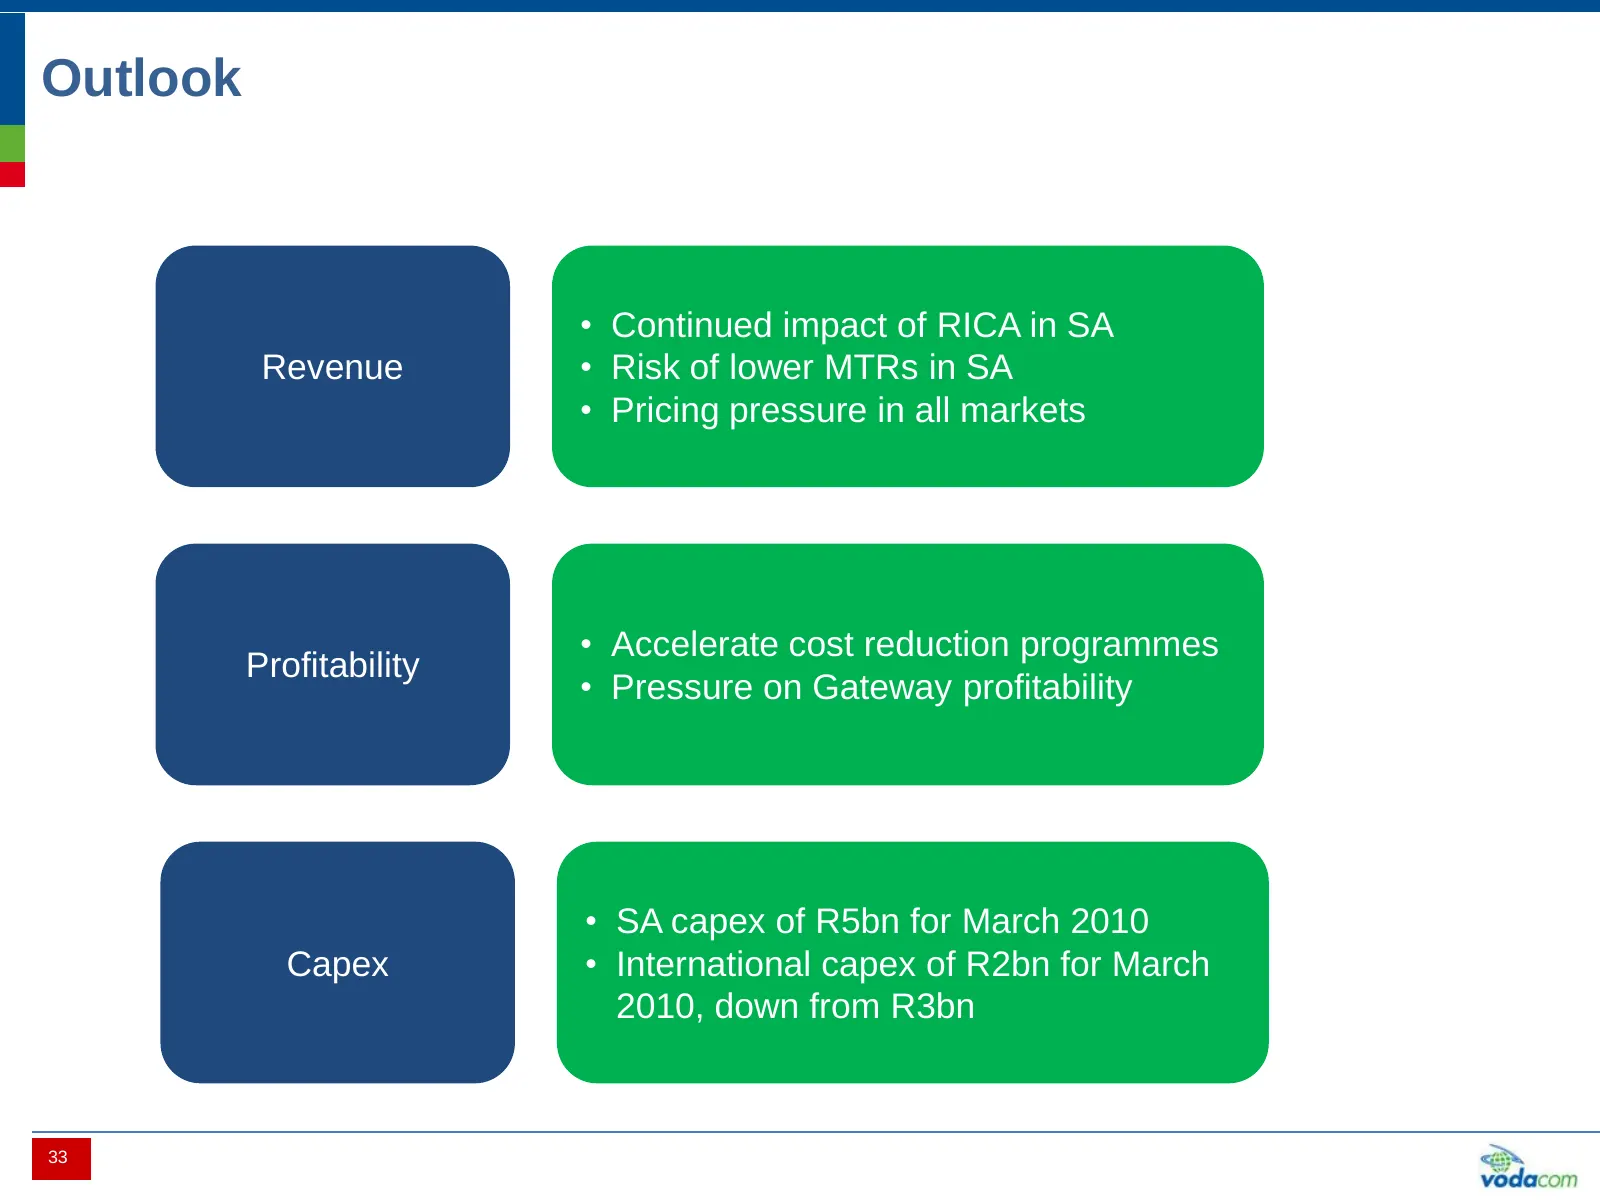
Outlook • Continued impact of RICA in SA Revenue • Risk of lower MTRs in SA • Pricing pressure in all markets • Accelerate cost reduction programmes Profitability • Pressure on Gateway profitability • SA capex of R5bn for March 2010 Capex • International capex of R2bn for March 2010, down from R3bn
Slide 35: Strategic priorities remain unchanged
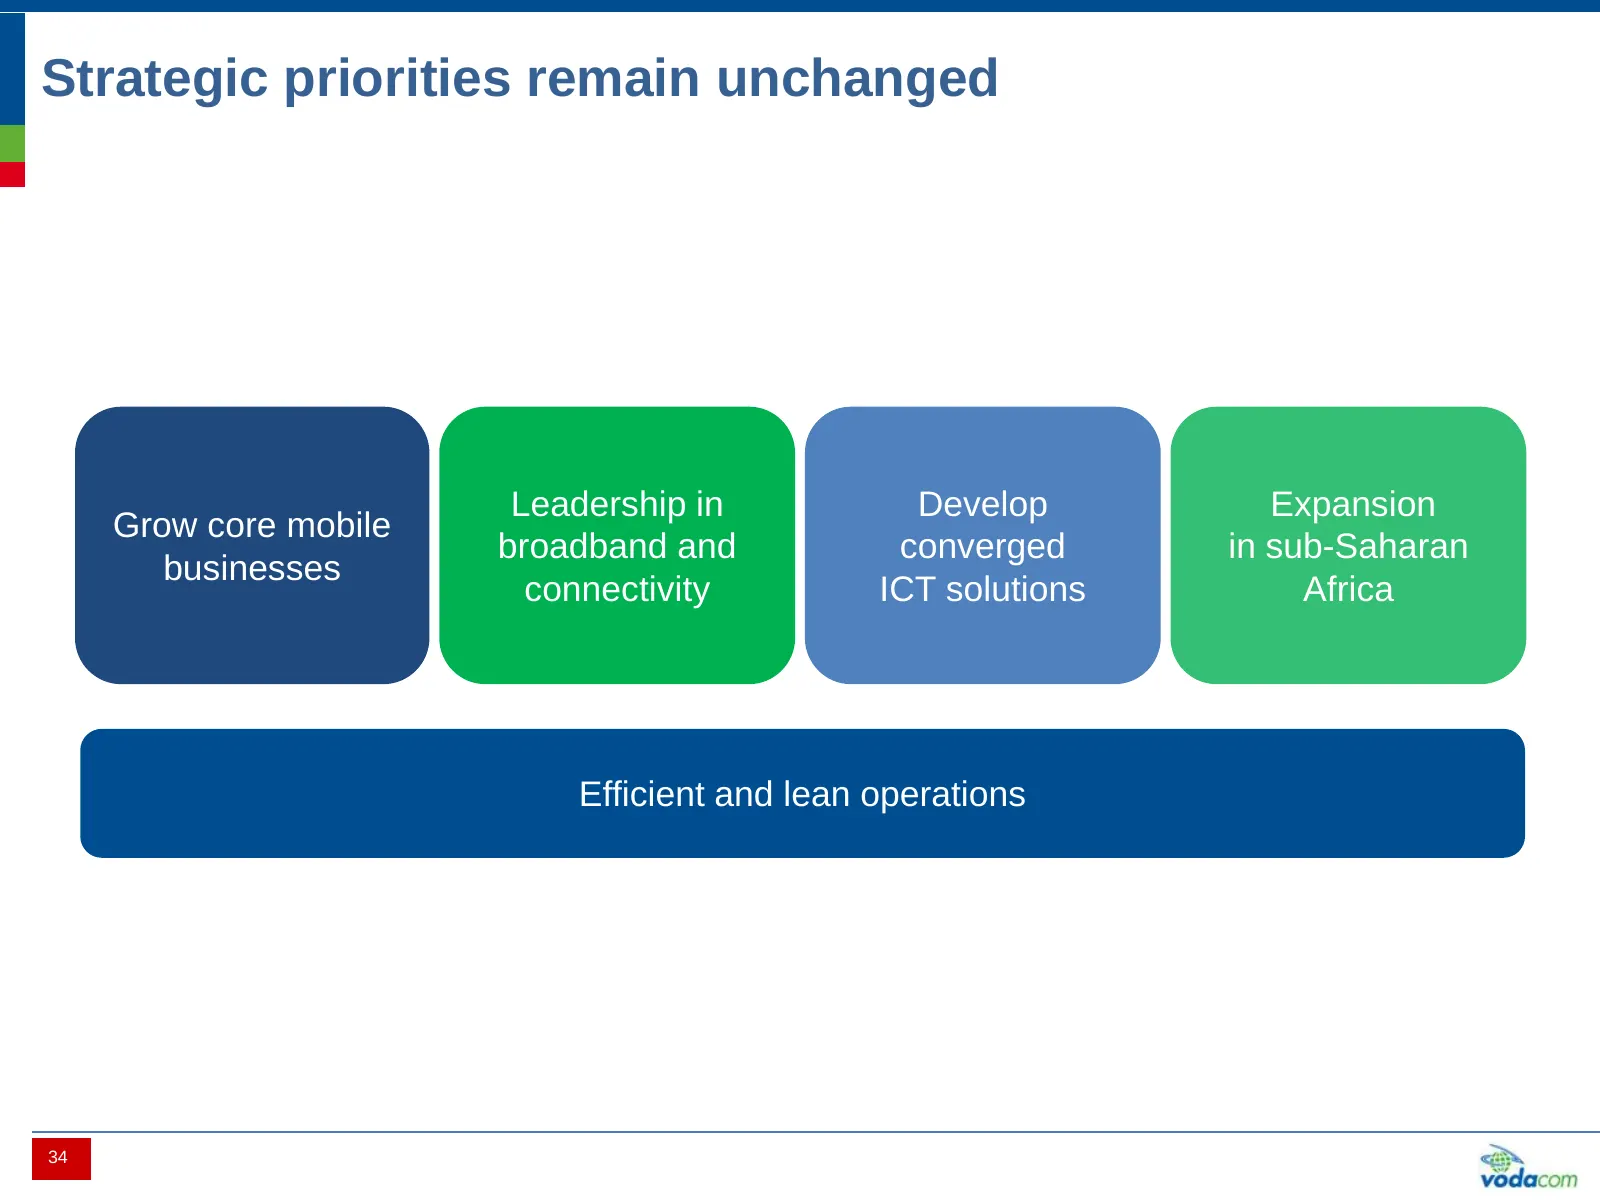
Strategic priorities remain unchanged Leadership in Develop Expansion Grow core mobile broadband and converged in sub-Saharan businesses connectivity ICT solutions Africa Efficient and lean operations 34
Slide 36: Key take-aways
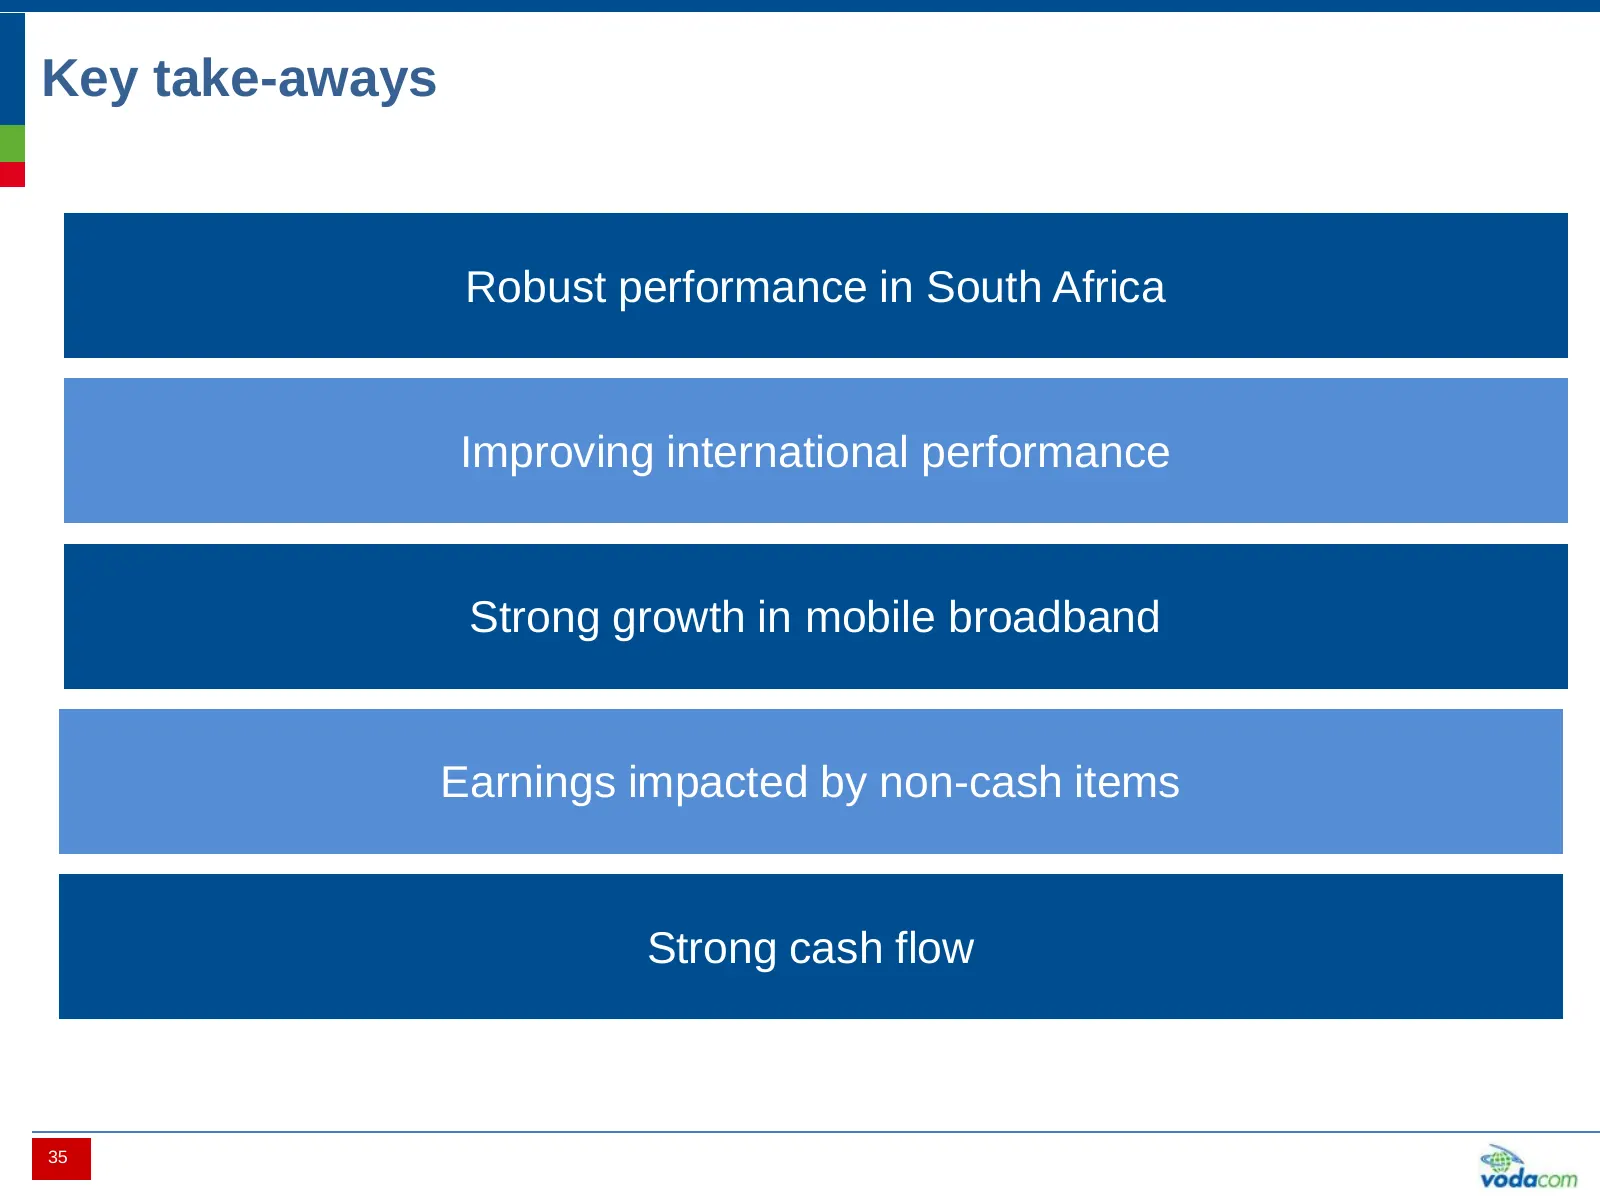
Key take-aways Robust performance in South Africa Improving international performance Strong growth in mobile broadband Earnings impacted by non-cash items Strong cash flow 35 35
Slide 37: Thank you Q&A
Highlights South Africa International Financials Outlook Thank you Q&A
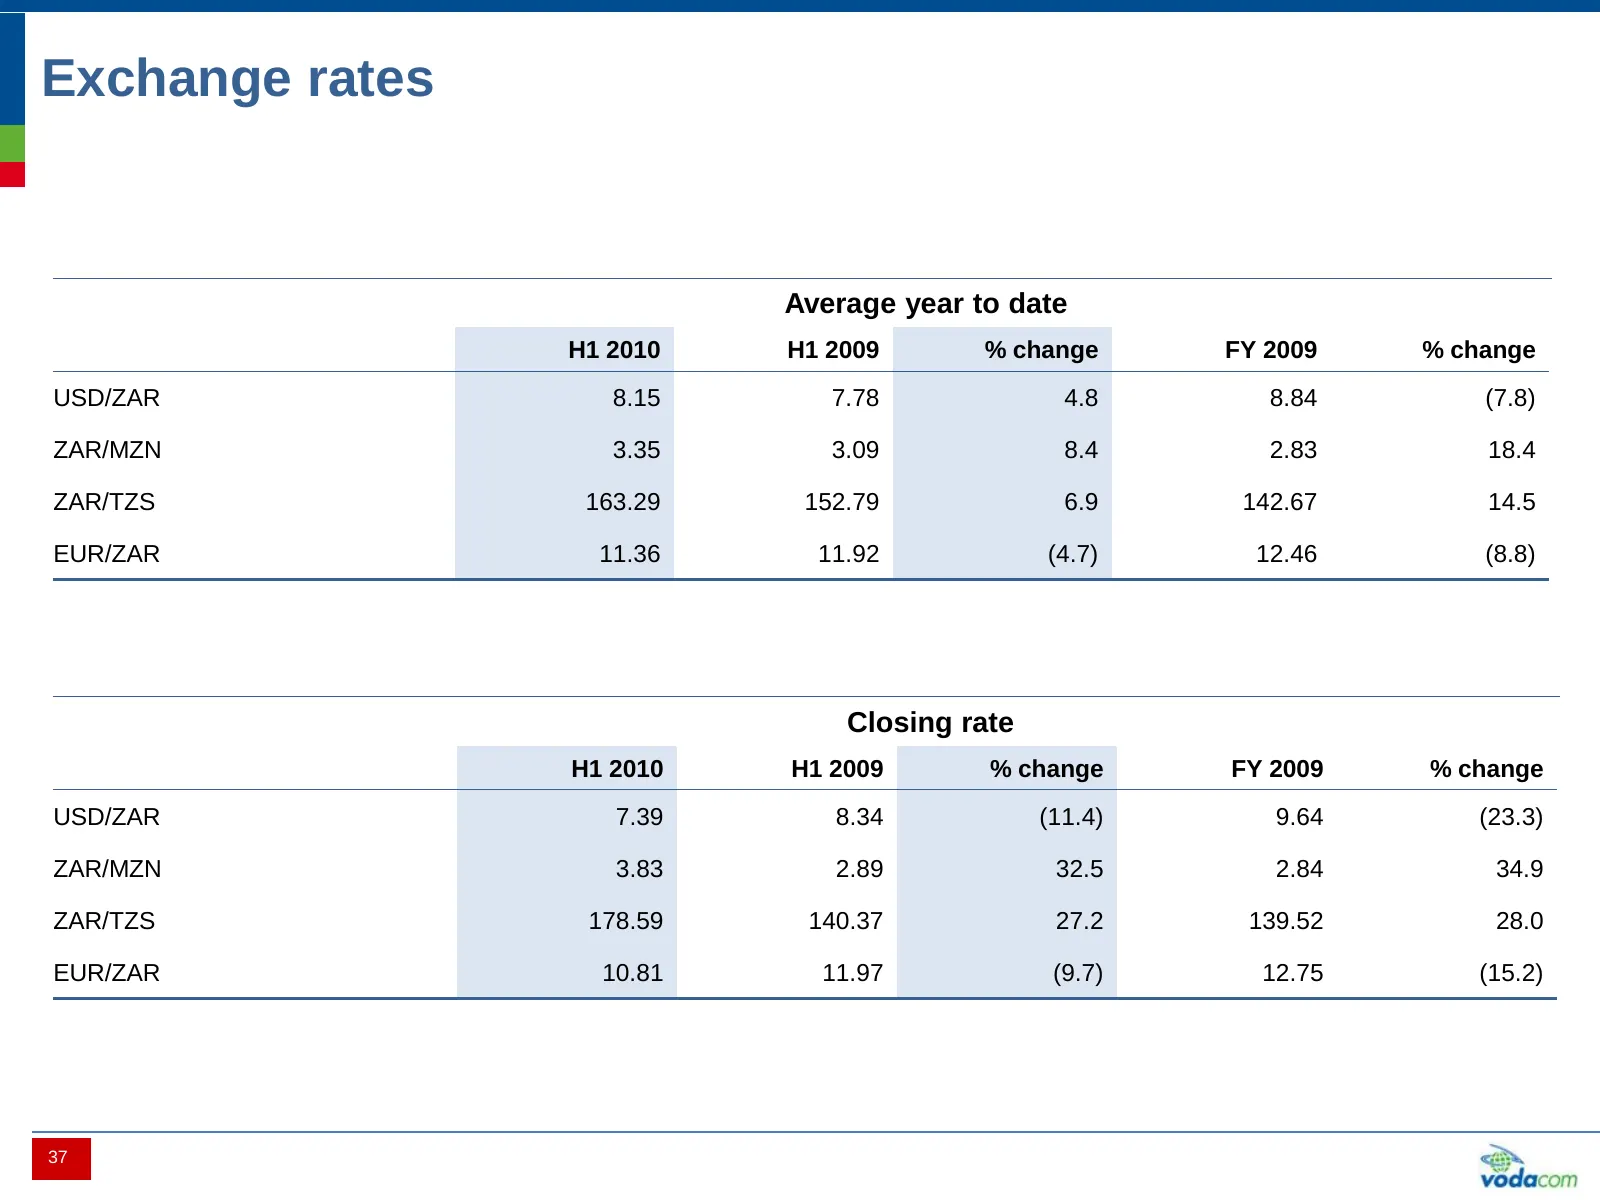
Slide 38: Exchange rates
Exchange rates Average year to date H1 2010 H1 2009 % change FY 2009 % change USD/ZAR 8.15 7.78 4.8 8.84 (7.8) ZAR/MZN 3.35 3.09 8.4 2.83 18.4 ZAR/TZS 163.29 152.79 6.9 142.67 14.5 EUR/ZAR 11.36 11.92 (4.7) 12.46 (8.8) Closing rate H1 2010 H1 2009 % change FY 2009 % change USD/ZAR 7.39 8.34 (11.4) 9
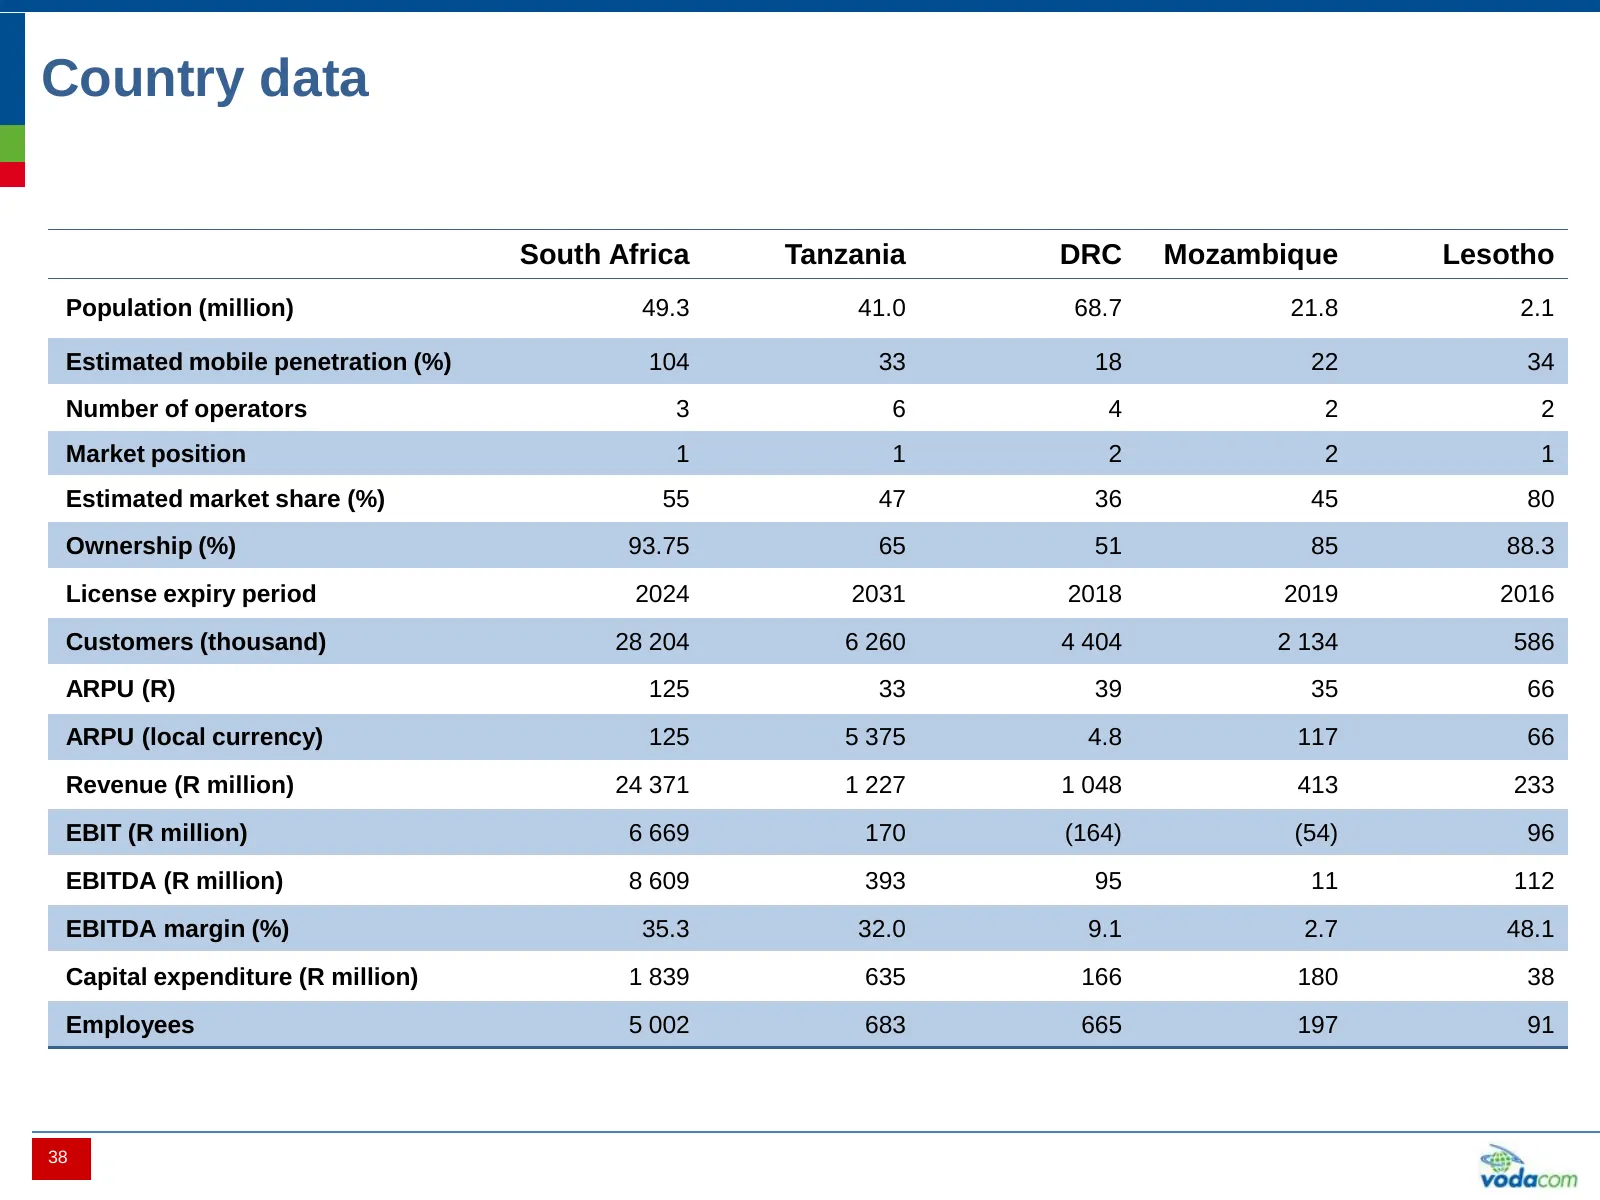
Slide 39: Country data
Country data South Africa Tanzania DRC Mozambique Lesotho Population (million) 49.3 41.0 68.7 21.8 2.1 Estimated mobile penetration (%) 104 33 18 22 34 Number of operators 3 6 4 2 2 Market position 1 1 2 2 1 Estimated market share (%) 55 47 36 45 80 Ownership (%) 93.75 65 51 85 88.3 License expiry p
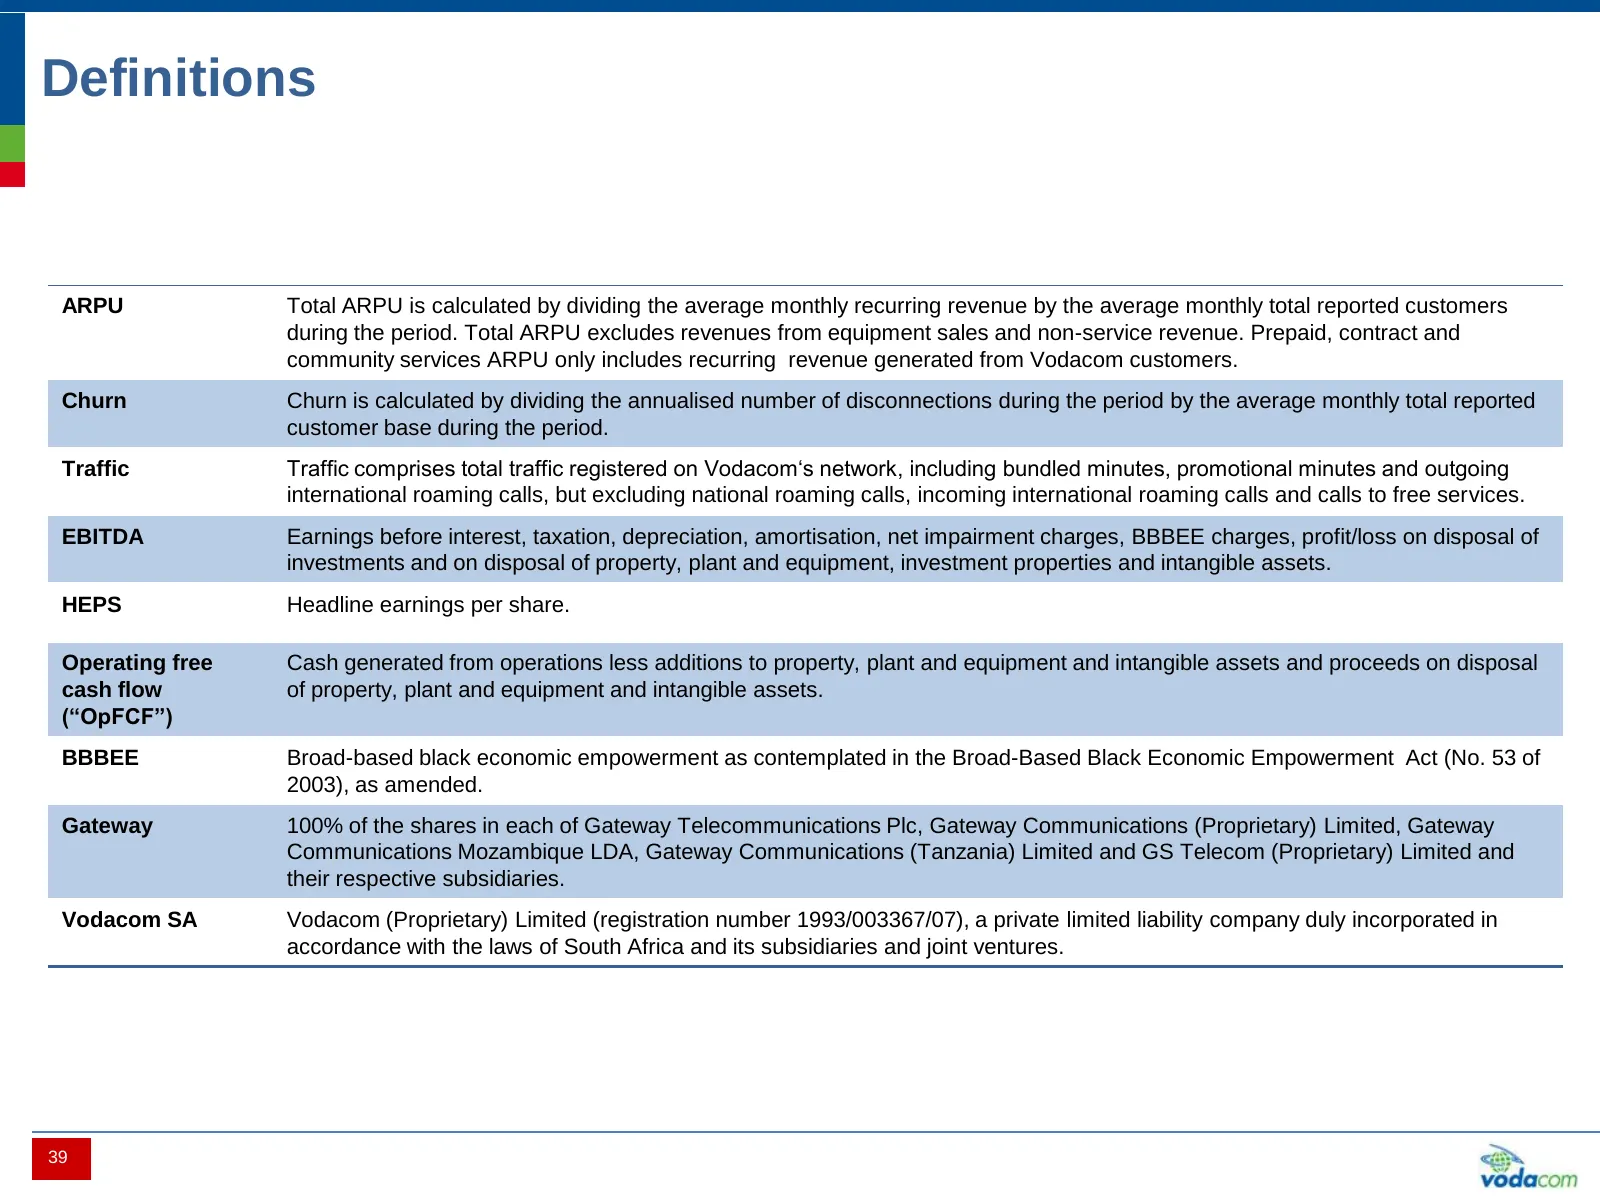
Slide 40: Definitions
Definitions ARPU Total ARPU is calculated by dividing the average monthly recurring revenue by the average monthly total reported customers during the period. Total ARPU excludes revenues from equipment sales and non-service revenue. Prepaid, contract and community services ARPU only includes recurr
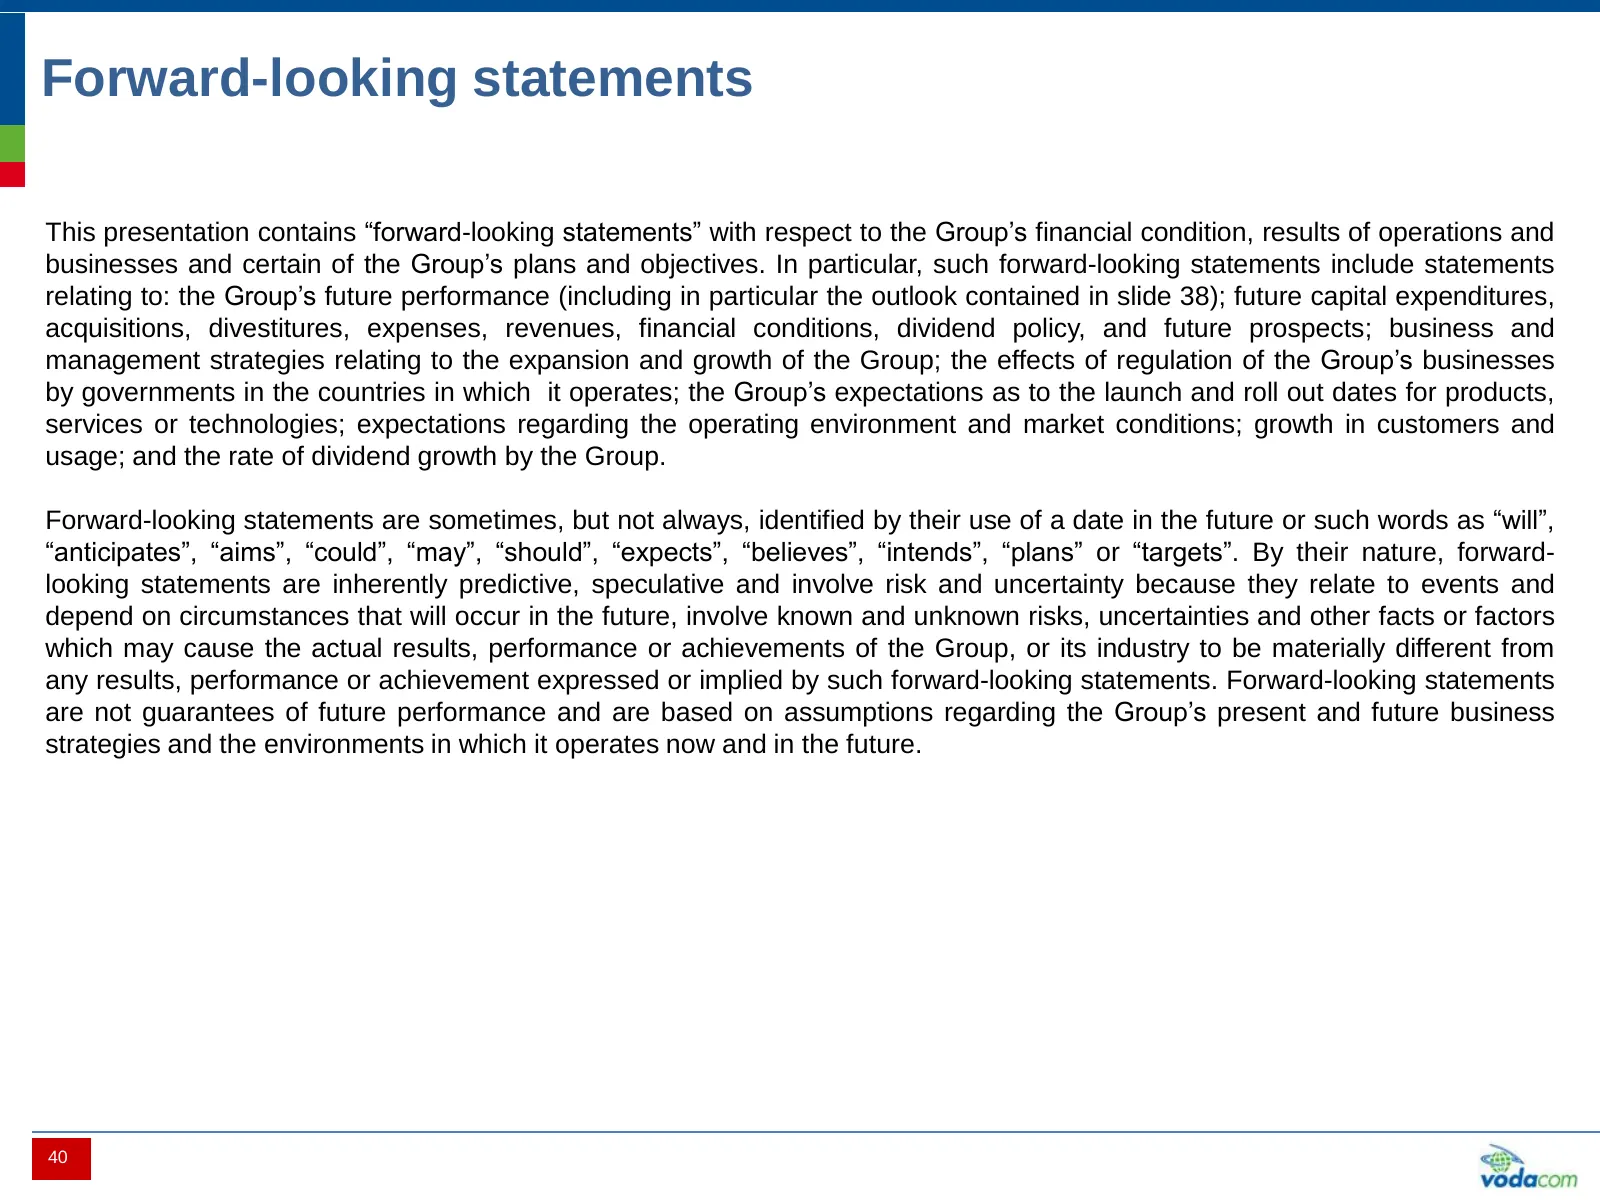
Slide 41: Forward-looking statements
Forward-looking statements This presentation contains “forward-looking statements” with respect to the Group‟s financial condition, results of operations and businesses and certain of the Group‟s plans and objectives. In particular, such forward-looking statements include statements relating to: the

Slide 42: Investor Relations
INVESTOR RELATIONS www.vodacom.com Belinda Williams +27116535195 belinda.williams@vodacom.co.za
Source: Internet Archive copy of vodacom.com
More decks from Vodacom Group Limited
 H1 FY2027 Earnings Presentation40 slides · November 2026
 FY2026 Earnings Presentation39 slides · May 11, 2026
 Merger or Acquisition (December 2025)16 slides · Dec 4, 2025
 Q2 2026 Earnings Presentation39 slides · Nov 10, 2025
 FY2025 Earnings Presentation39 slides · May 19, 2025
 Investor Day (February 2025)34 slides · Feb 19, 2025