Aryzta AG · SIX:ARYN
Aryzta — H1 2020 Earnings Presentation
44 slides from Aryzta's earnings presentation, Mar 10, 2020

Slide 1: ARYZTA AG H1 2020 Results
ARYZTA AG H1 2020 Results 10 March 2020
Slide 2: Forward Looking Statement
Forward Looking Statement This document contains forward looking statements which reflect the Board of Directors' current views and estimates. The forward looking statements involve certain risks and uncertainties that could cause actual results to differ materially from those contained in the forwa
Slide 3: Impact of IFRS 16 Leases adoption
The current financial period includes the impact of the adoption of IFRS 16 Leases. Comparatives have not been restated in accordance with transitional guidelines. To enable analysis versus prior year the H1-20 percentage growth is presented before and after the effects of IFRS 16 in this document.
Slide 4: Continued Strategic & Financial Progress
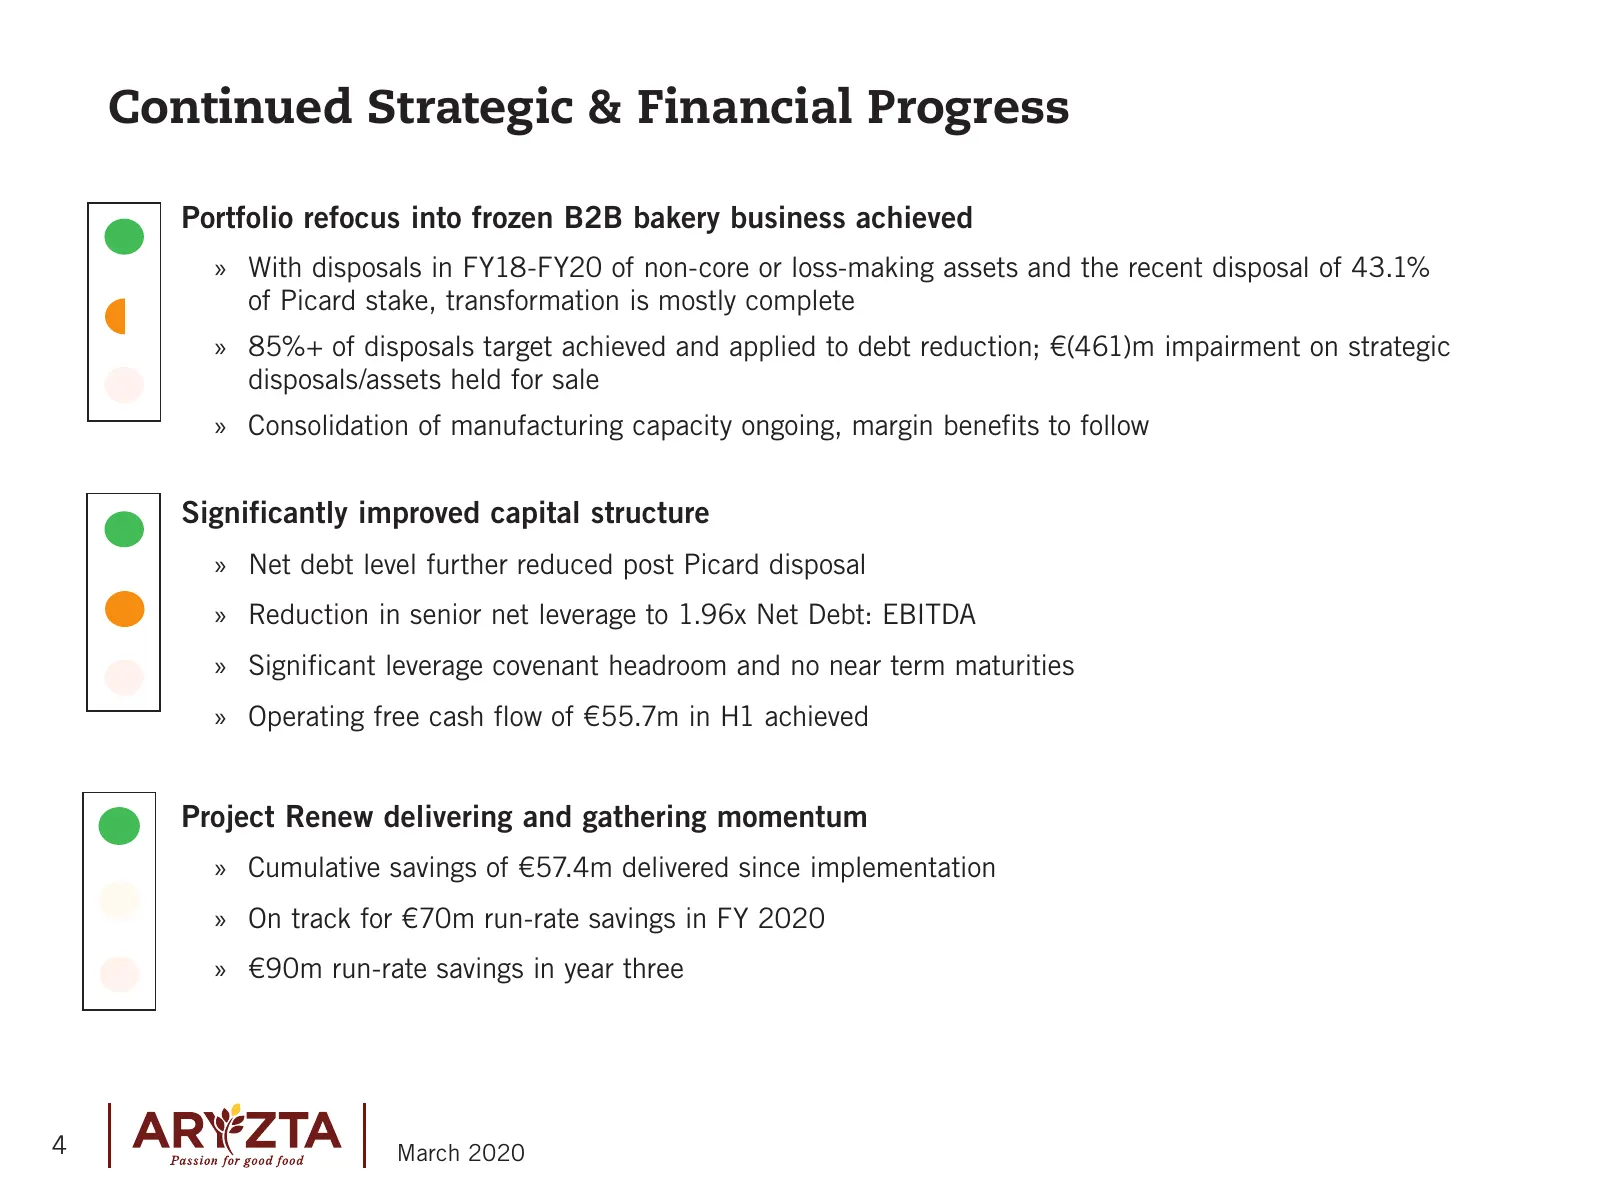
Continued Strategic & Financial Progress Portfolio refocus into frozen B2B bakery business achieved »» With disposals in FY18-FY20 of non-core or loss-making assets and the recent disposal of 43.1% of Picard stake, transformation is mostly complete »» 85%+ of disposals target achieved and applied to
Slide 5: Operational Progress - North America EBITDA Behind; Two Regions on Track
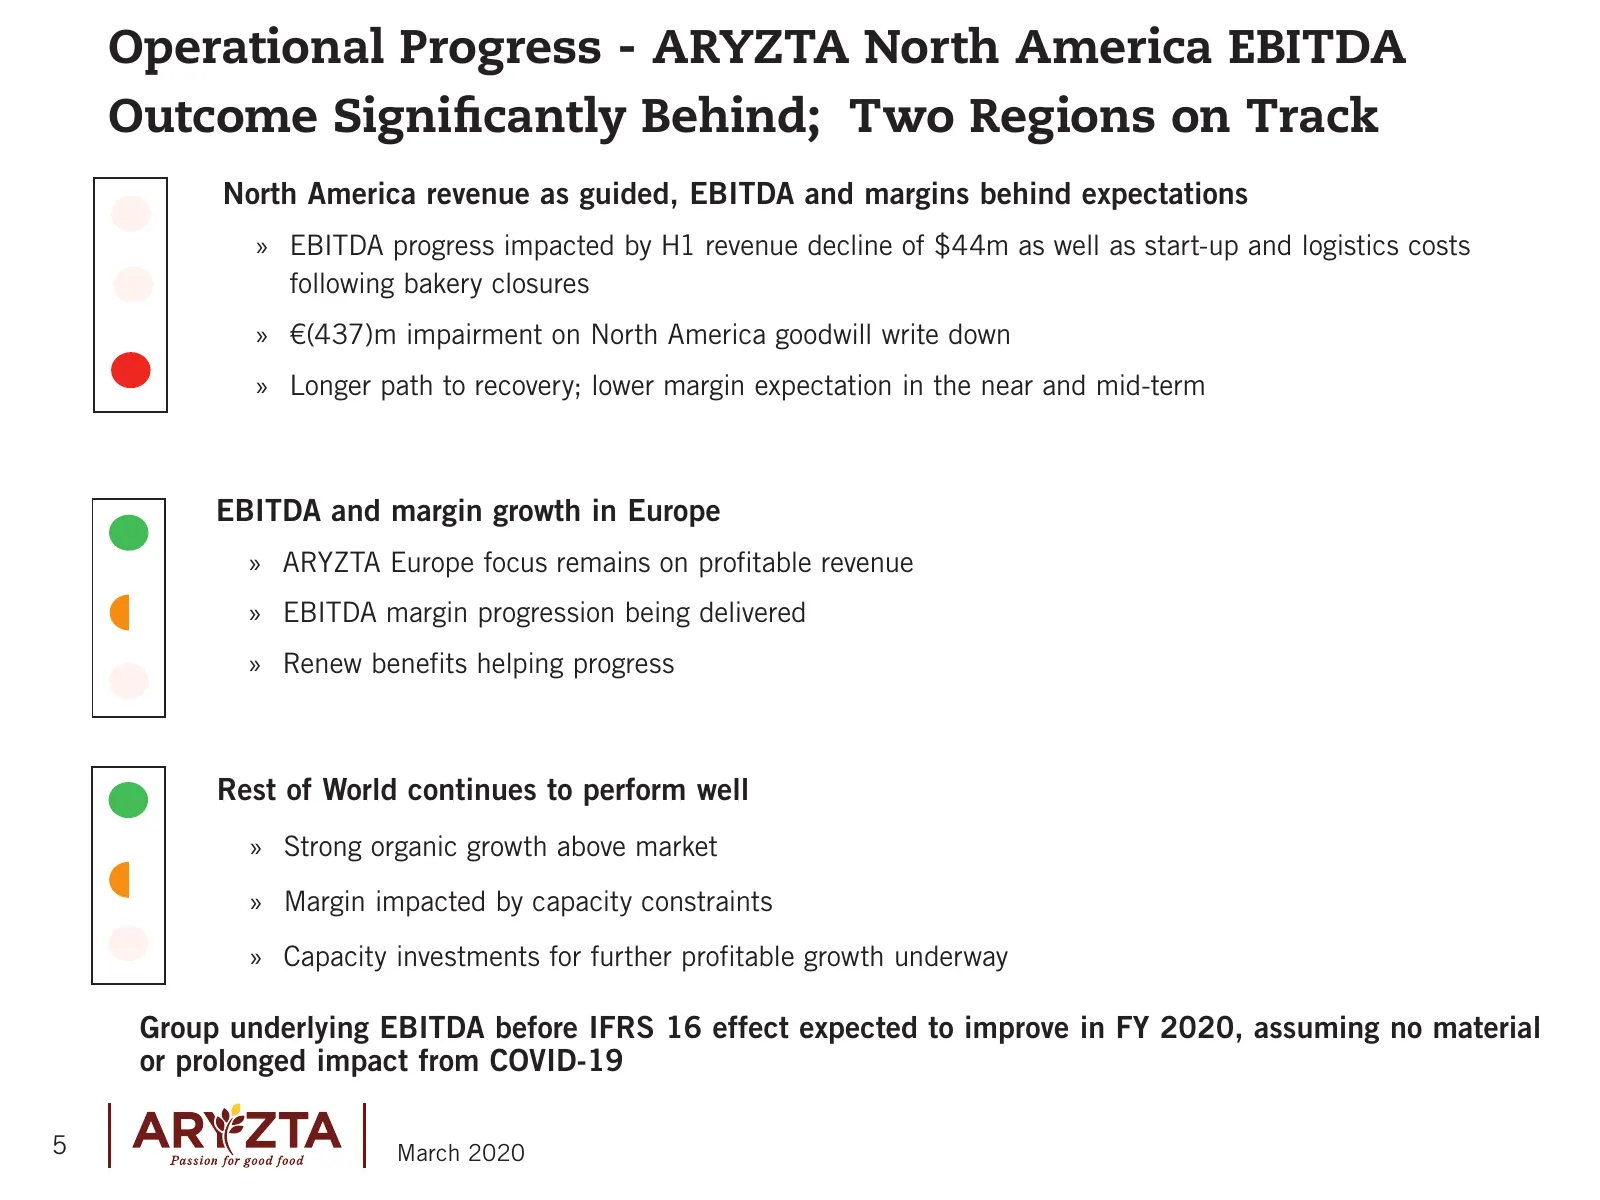
Operational Progress - ARYZTA North America EBITDA Outcome Significantly Behind; Two Regions on Track North America revenue as guided, EBITDA and margins behind expectations »» EBITDA progress impacted by H1 revenue decline of $44m as well as start-up and logistics costs following bakery closures »»

Slide 6: Financial Review
Financial Review 6 March 2020
Slide 7: Financial Overview
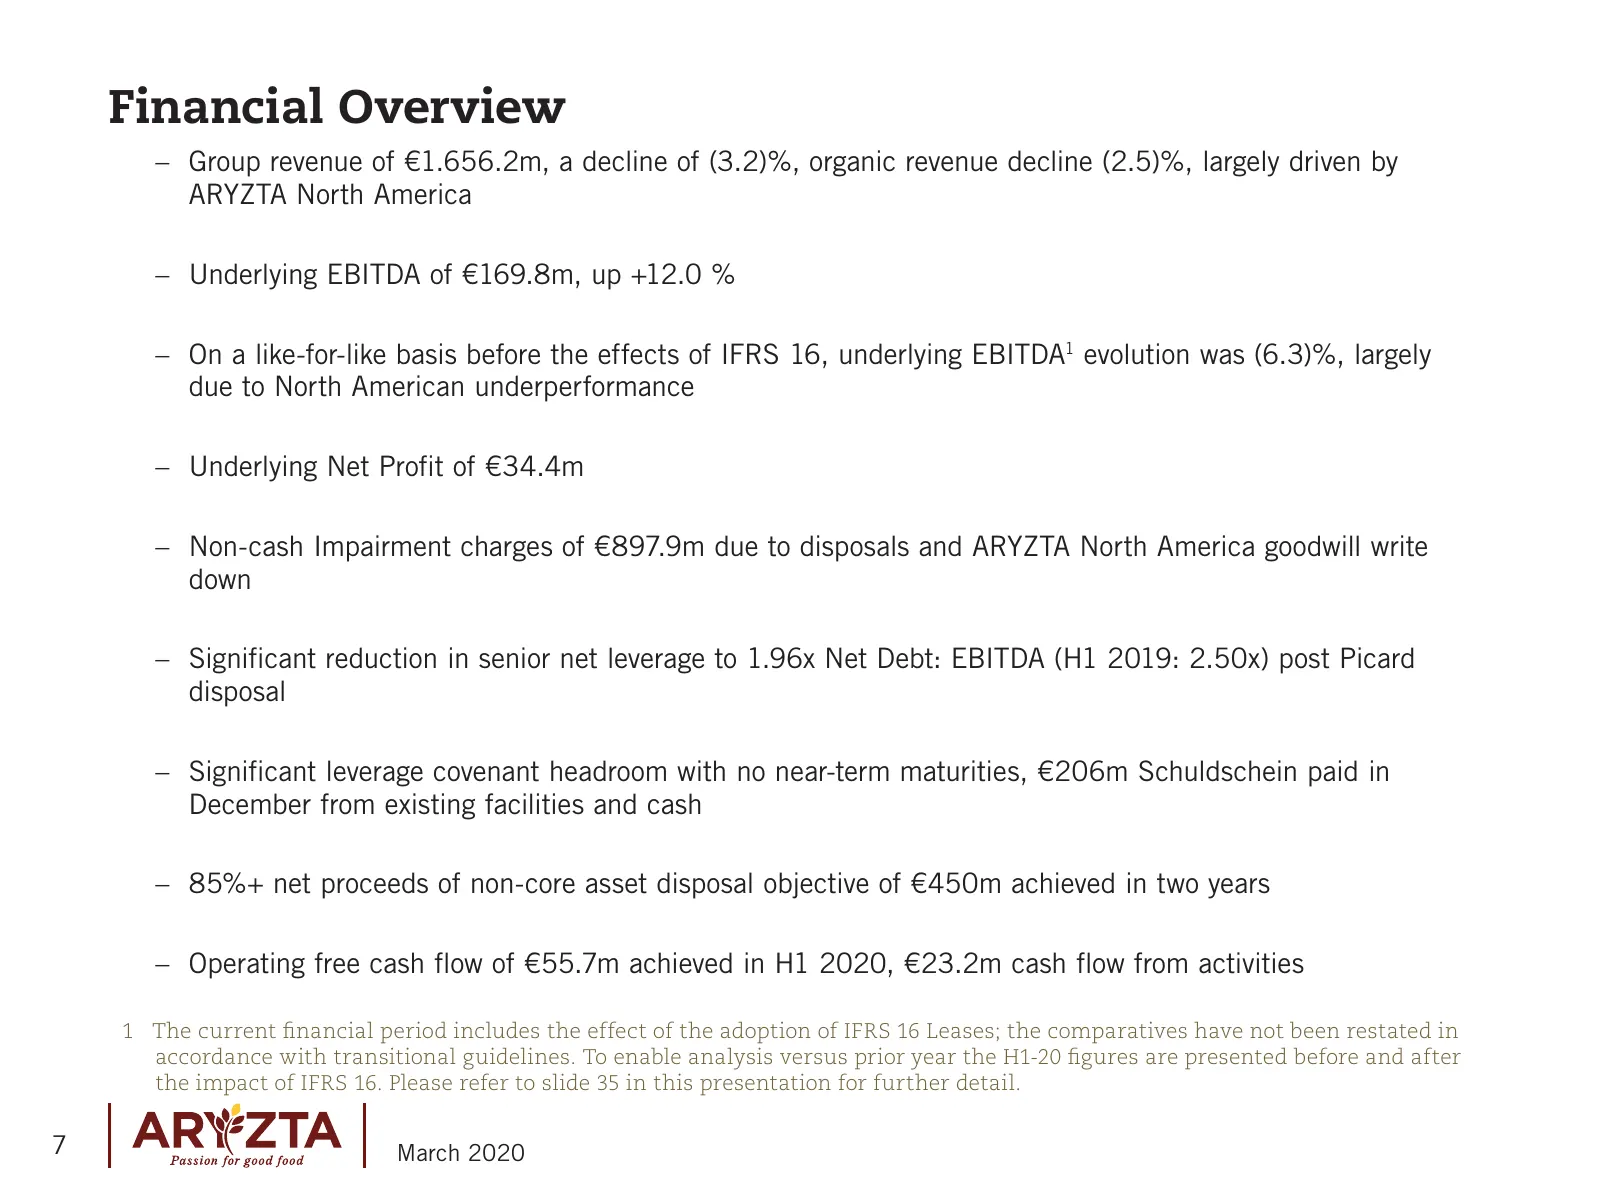
Financial Overview –– Group revenue of €1.656.2m, a decline of (3.2)%, organic revenue decline (2.5)%, largely driven by ARYZTA North America –– Underlying EBITDA of €169.8m, up +12.0 % –– On a like-for-like basis before the effects of IFRS 16, underlying EBITDA1 evolution was (6.3)%, largely due to
Slide 8: Group Underlying Income Statement
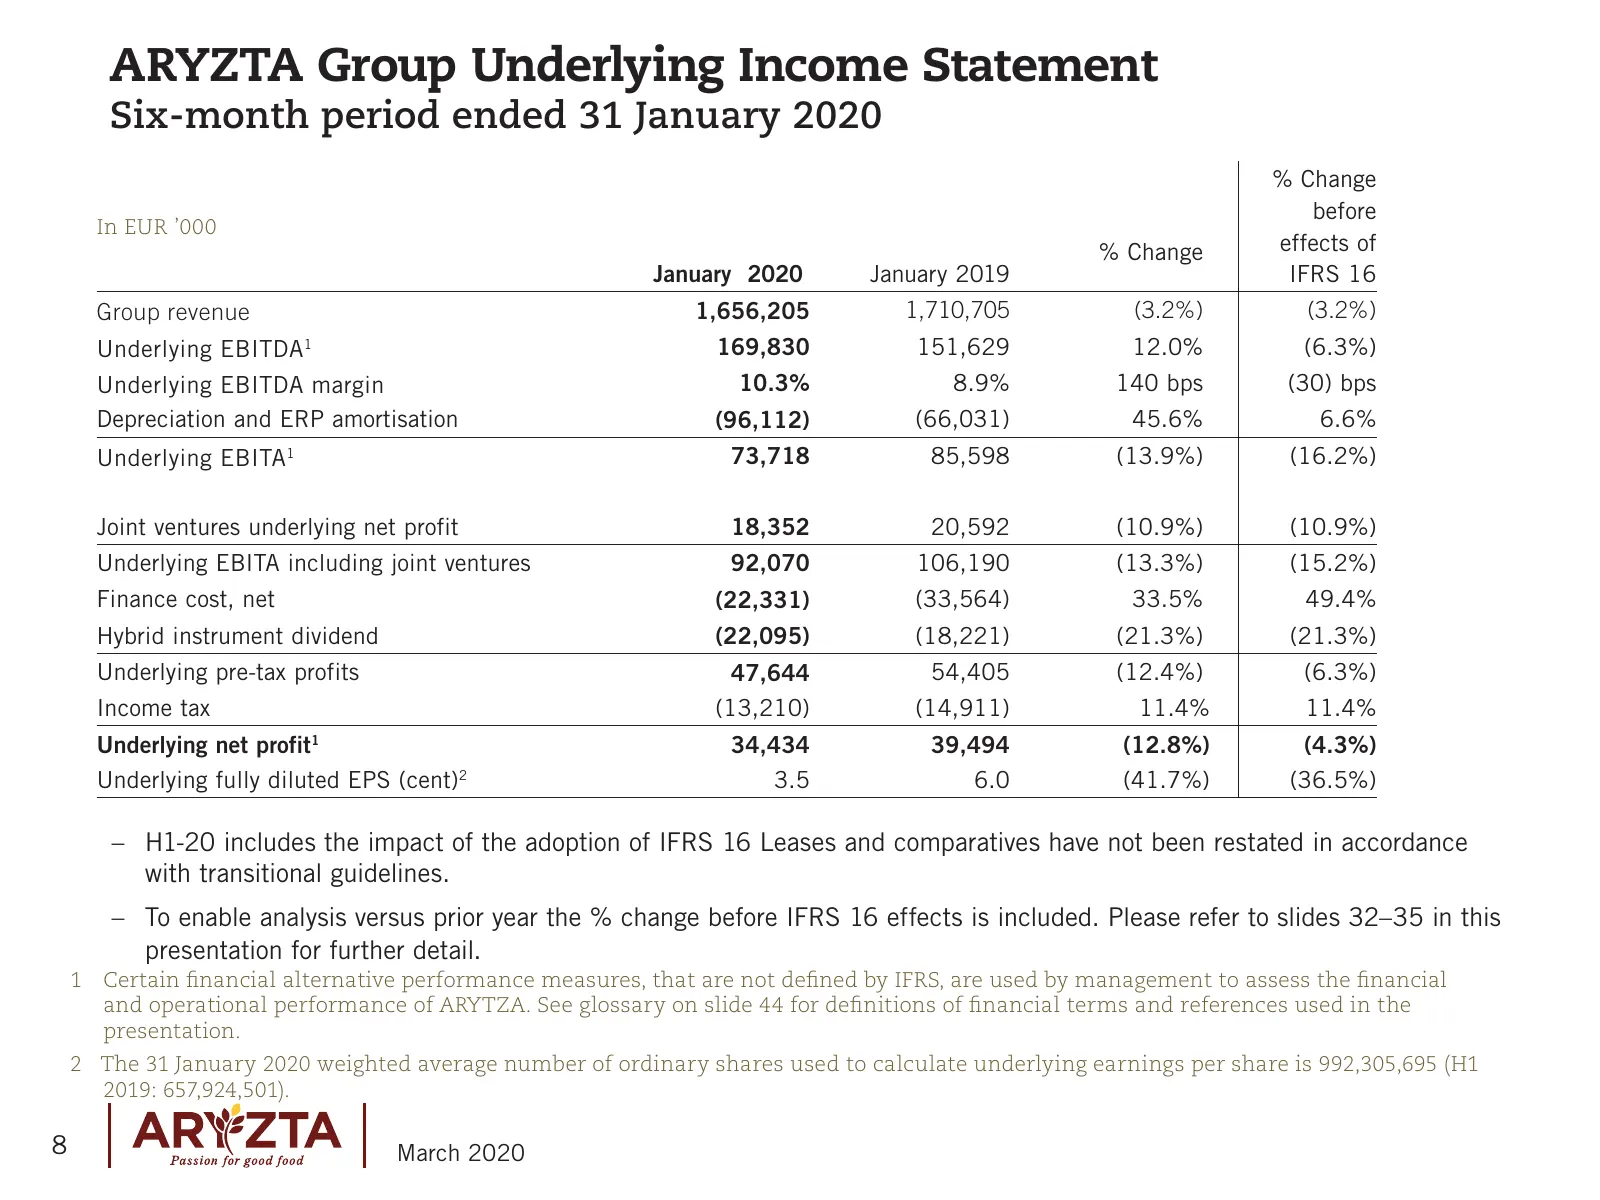
ARYZTA Group Underlying Income Statement Six-month period ended 31 January 2020 % Change before In EUR ’000 % Change effects of January 2020 January 2019 IFRS 16 Group revenue 1,656,205 1,710,705 (3.2%) (3.2%) Underlying EBITDA1 169,830 151,629 12.0% (6.3%) Underlying EBITDA margin 10.3% 8.9% 140 bp
Slide 9: Underlying Income Statement Reconciliation to IFRS
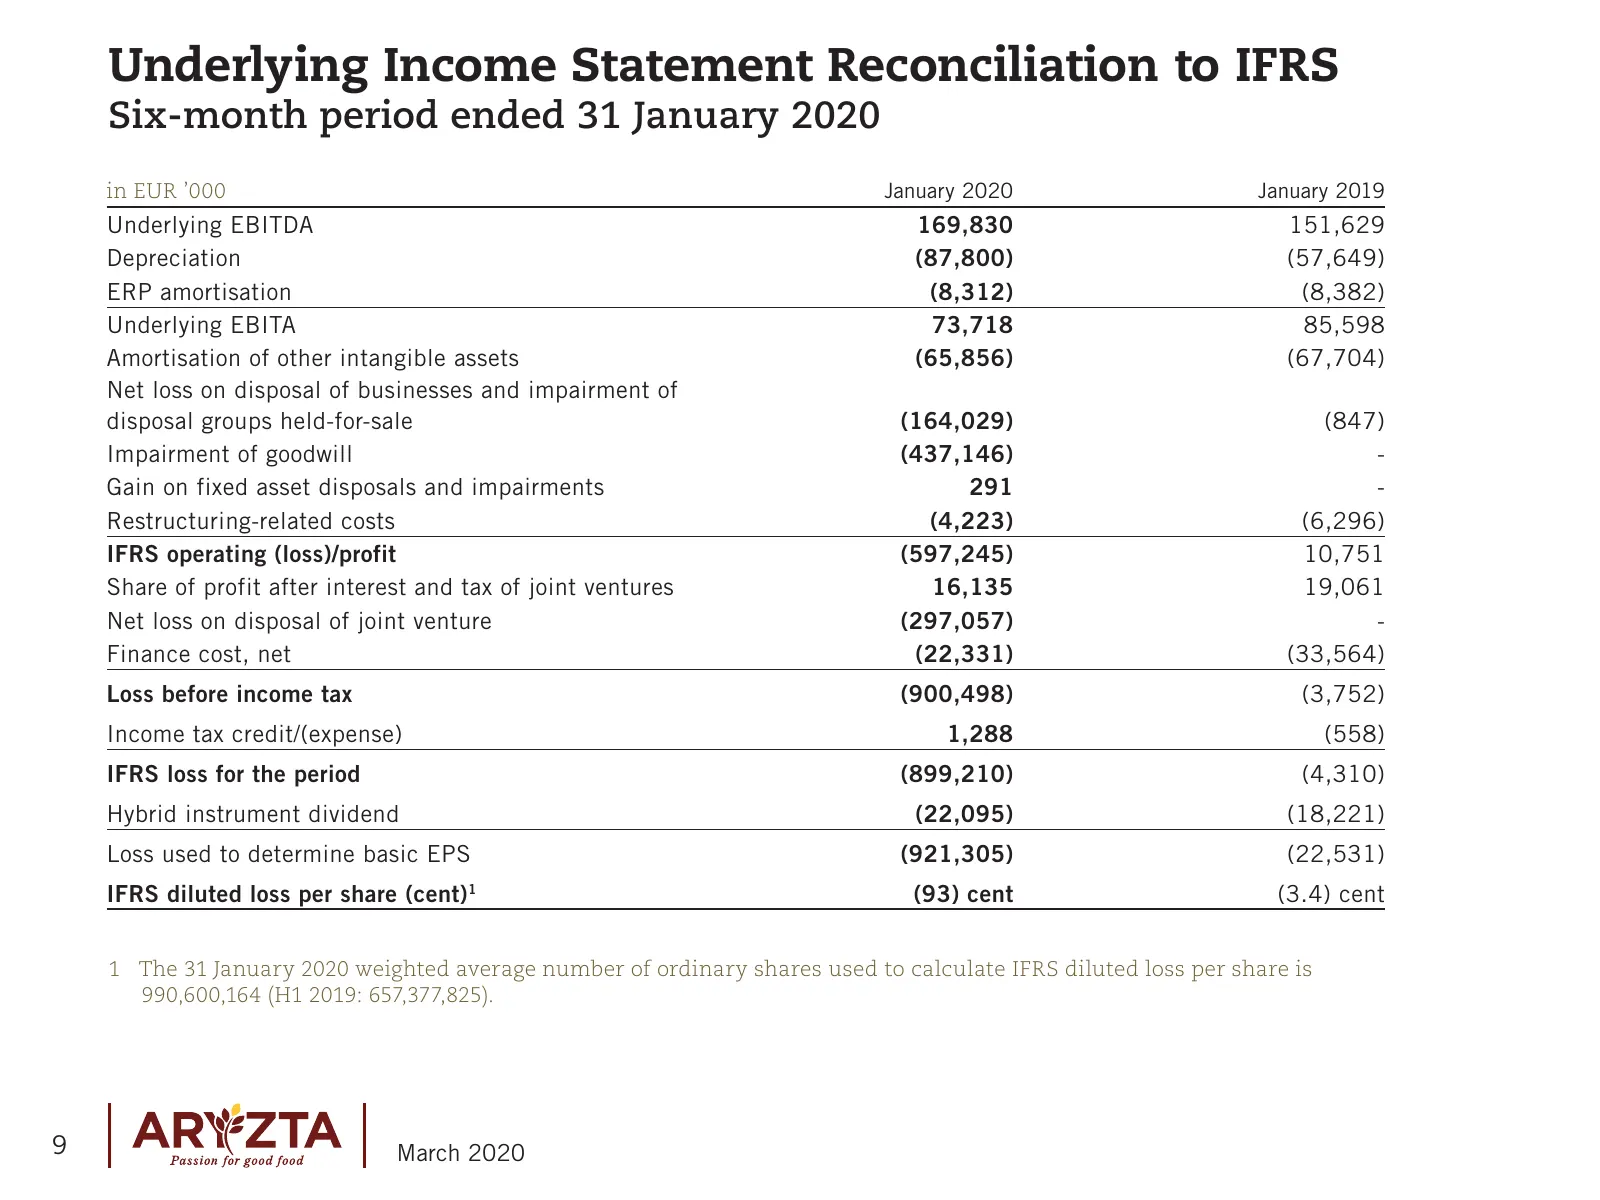
Underlying Income Statement Reconciliation to IFRS Six-month period ended 31 January 2020 in EUR ’000 January 2020 January 2019 Underlying EBITDA 169,830 151,629 Depreciation (87,800) (57,649) ERP amortisation (8,312) (8,382) Underlying EBITA 73,718 85,598 Amortisation of other intangible assets (65
Slide 10: Group Revenue Performance
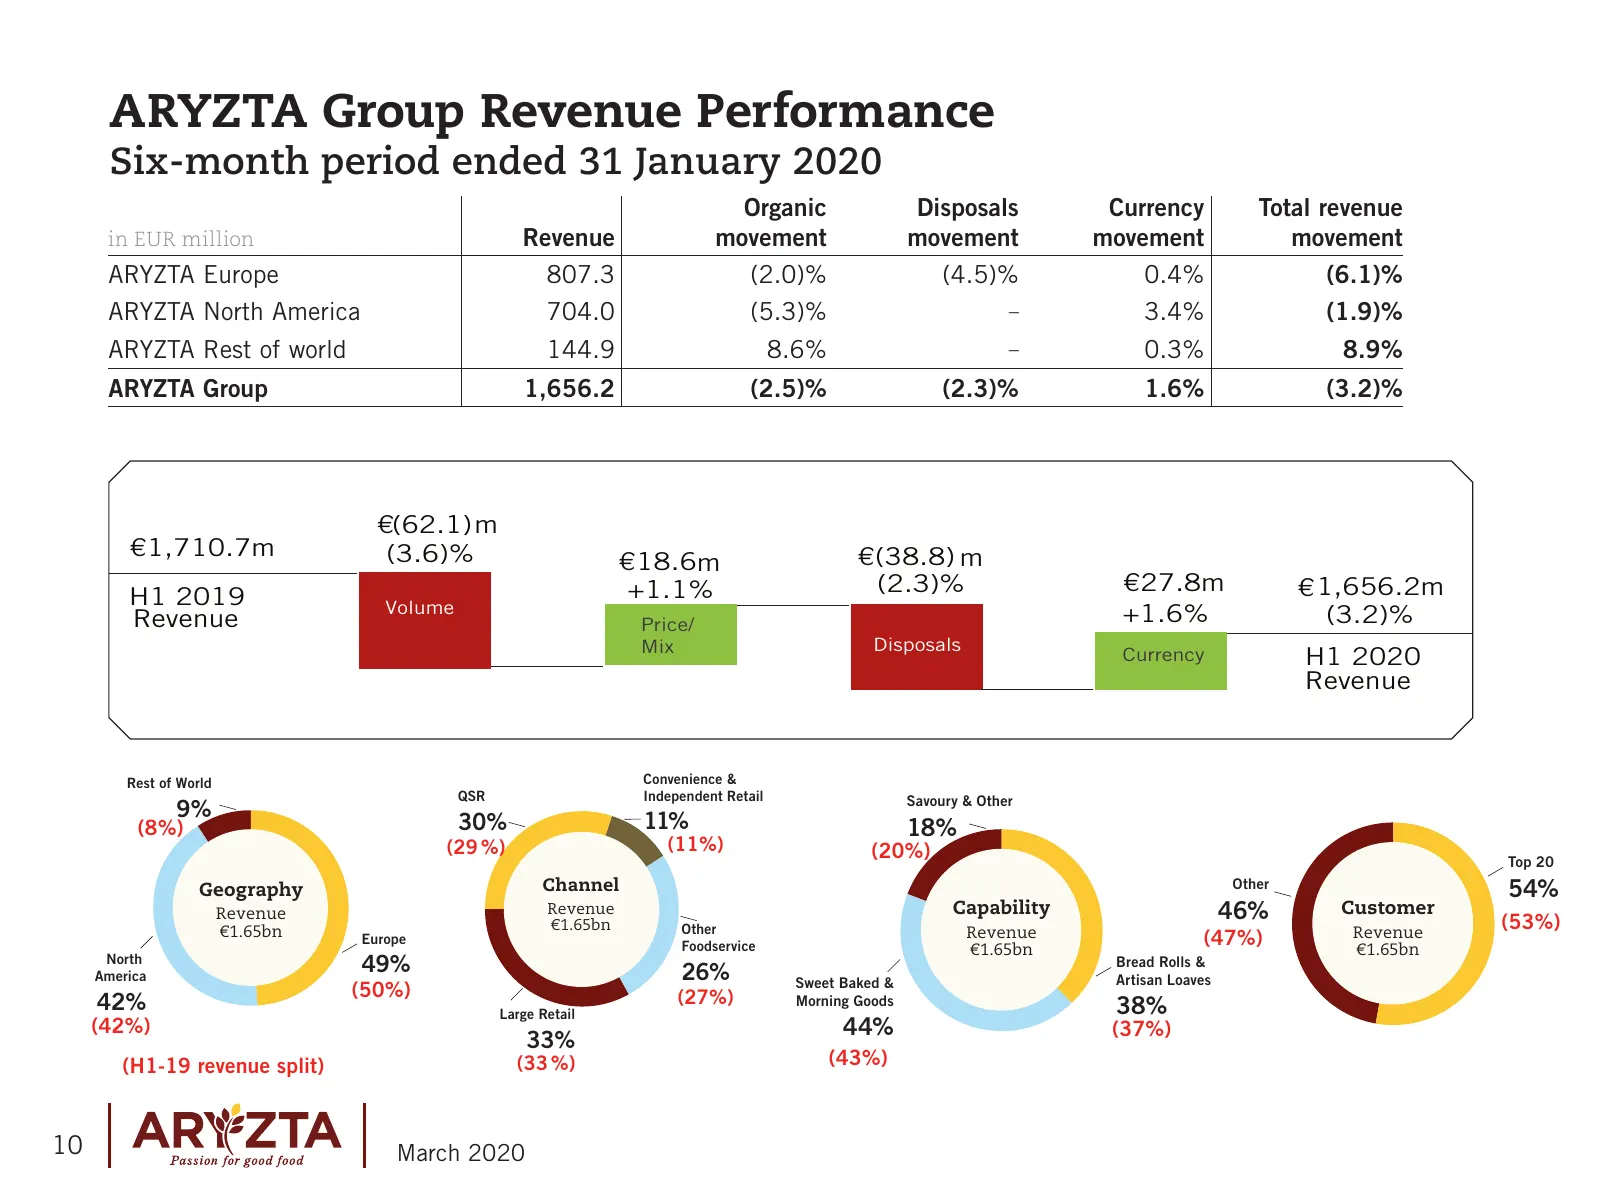
ARYZTA Group Revenue Performance Six-month period ended 31 January 2020 Organic Disposals Currency Total revenue in EUR million Revenue movement movement movement movement ARYZTA Europe 807.3 (2.0)% (4.5)% 0.4% (6.1)% ARYZTA North America 704.0 (5.3)% – 3.4% (1.9)% ARYZTA Rest of world 144.9 8.6% –
Slide 11: Group – Quarterly Organic Revenue
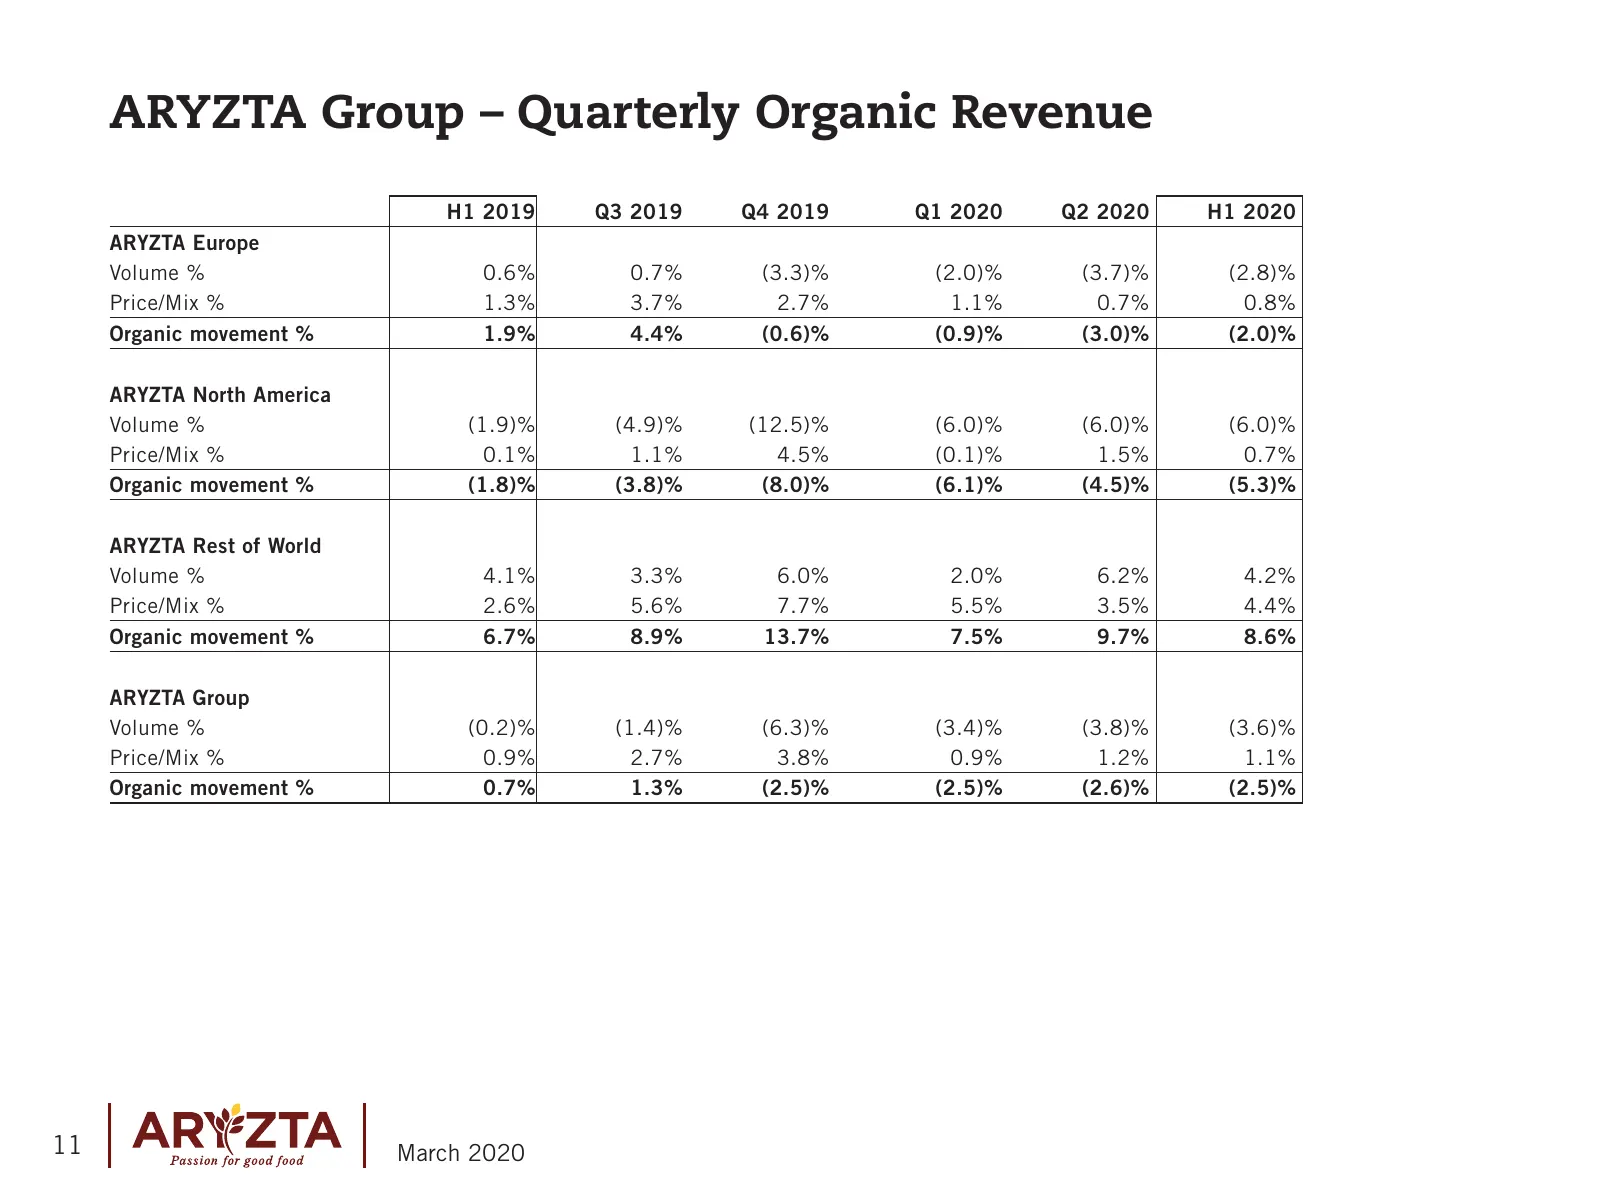
ARYZTA Group – Quarterly Organic Revenue H1 2019 Q3 2019 Q4 2019 Q1 2020 Q2 2020 H1 2020 ARYZTA Europe Volume % 0.6% 0.7% (3.3)% (2.0)% (3.7)% (2.8)% Price/Mix % 1.3% 3.7% 2.7% 1.1% 0.7% 0.8% Organic movement % 1.9% 4.4% (0.6)% (0.9)% (3.0)% (2.0)% ARYZTA North America Volume % (1.9)% (4.9)% (12.5)%
Slide 12: Segmental EBITDA & EBITDA Margin
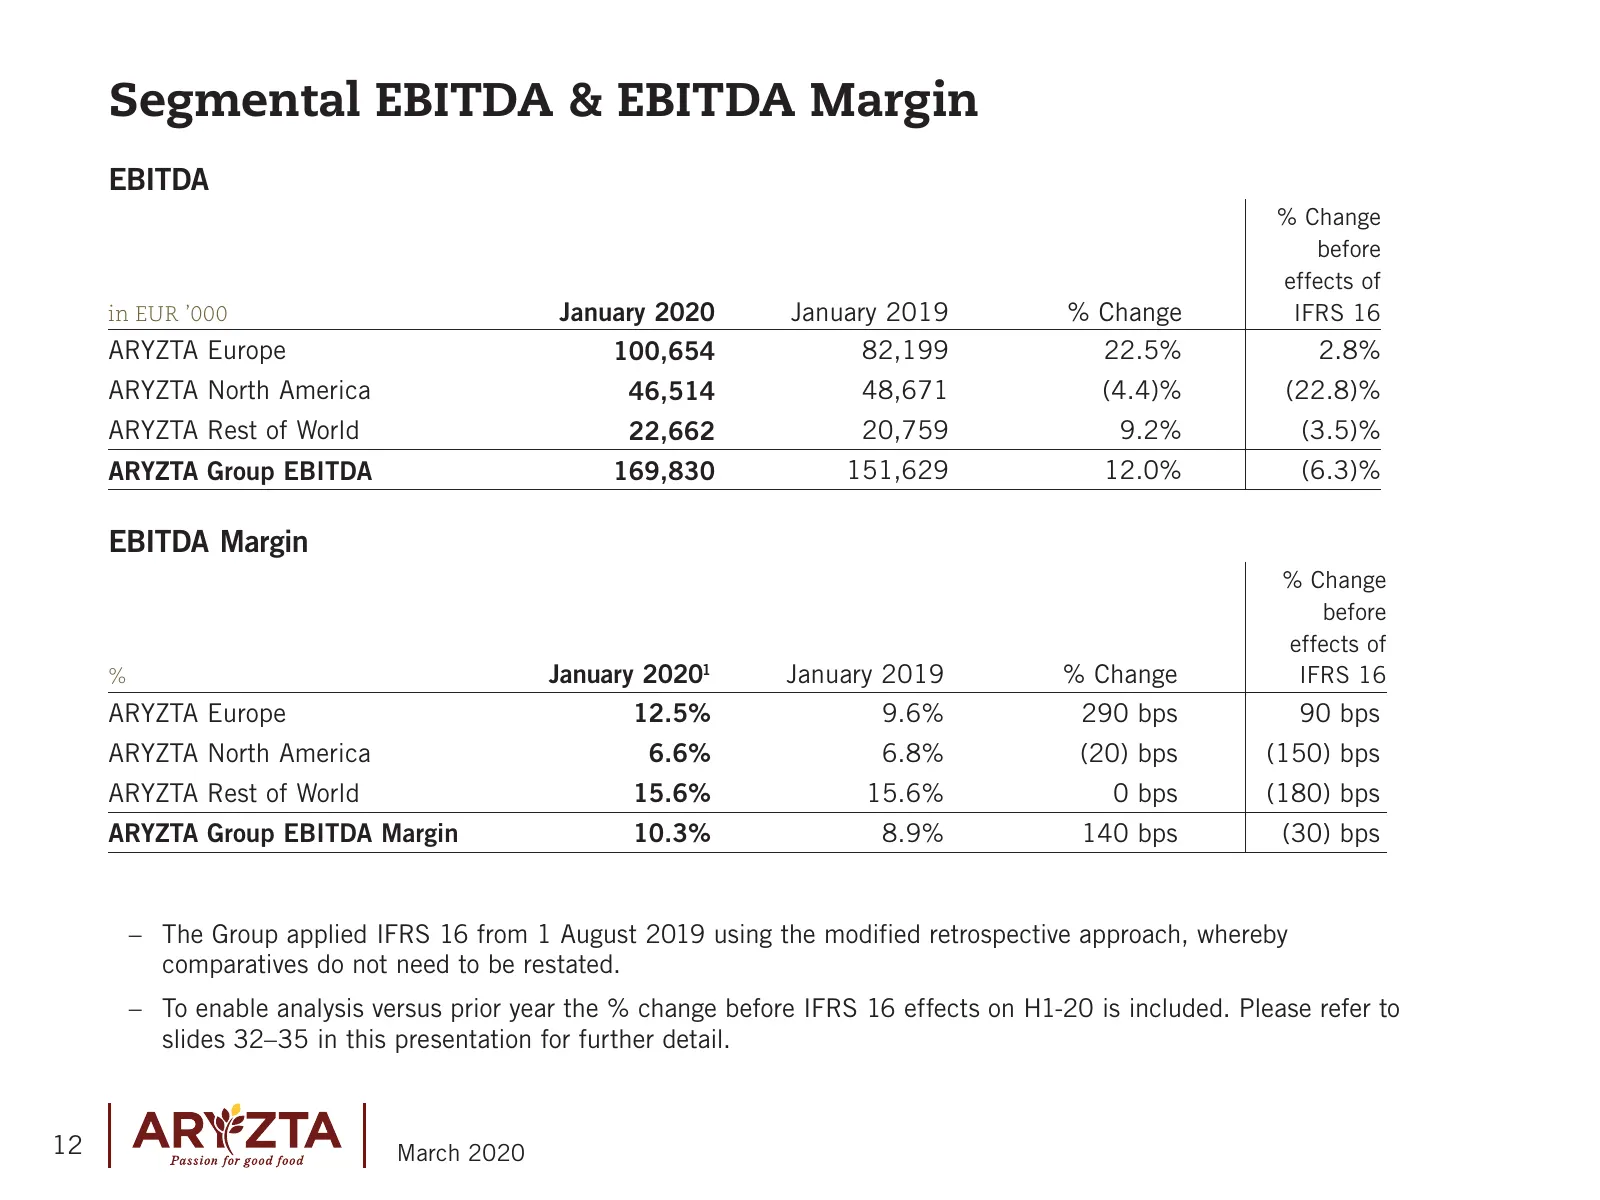
Segmental EBITDA & EBITDA Margin EBITDA % Change before effects of in EUR ’000 January 2020 January 2019 % Change IFRS 16 ARYZTA Europe 100,654 82,199 22.5% 2.8% ARYZTA North America 46,514 48,671 (4.4)% (22.8)% ARYZTA Rest of World 22,662 20,759 9.2% (3.5)% ARYZTA Group EBITDA 169,830 151,629 12.0%
Slide 13: Cash Generation
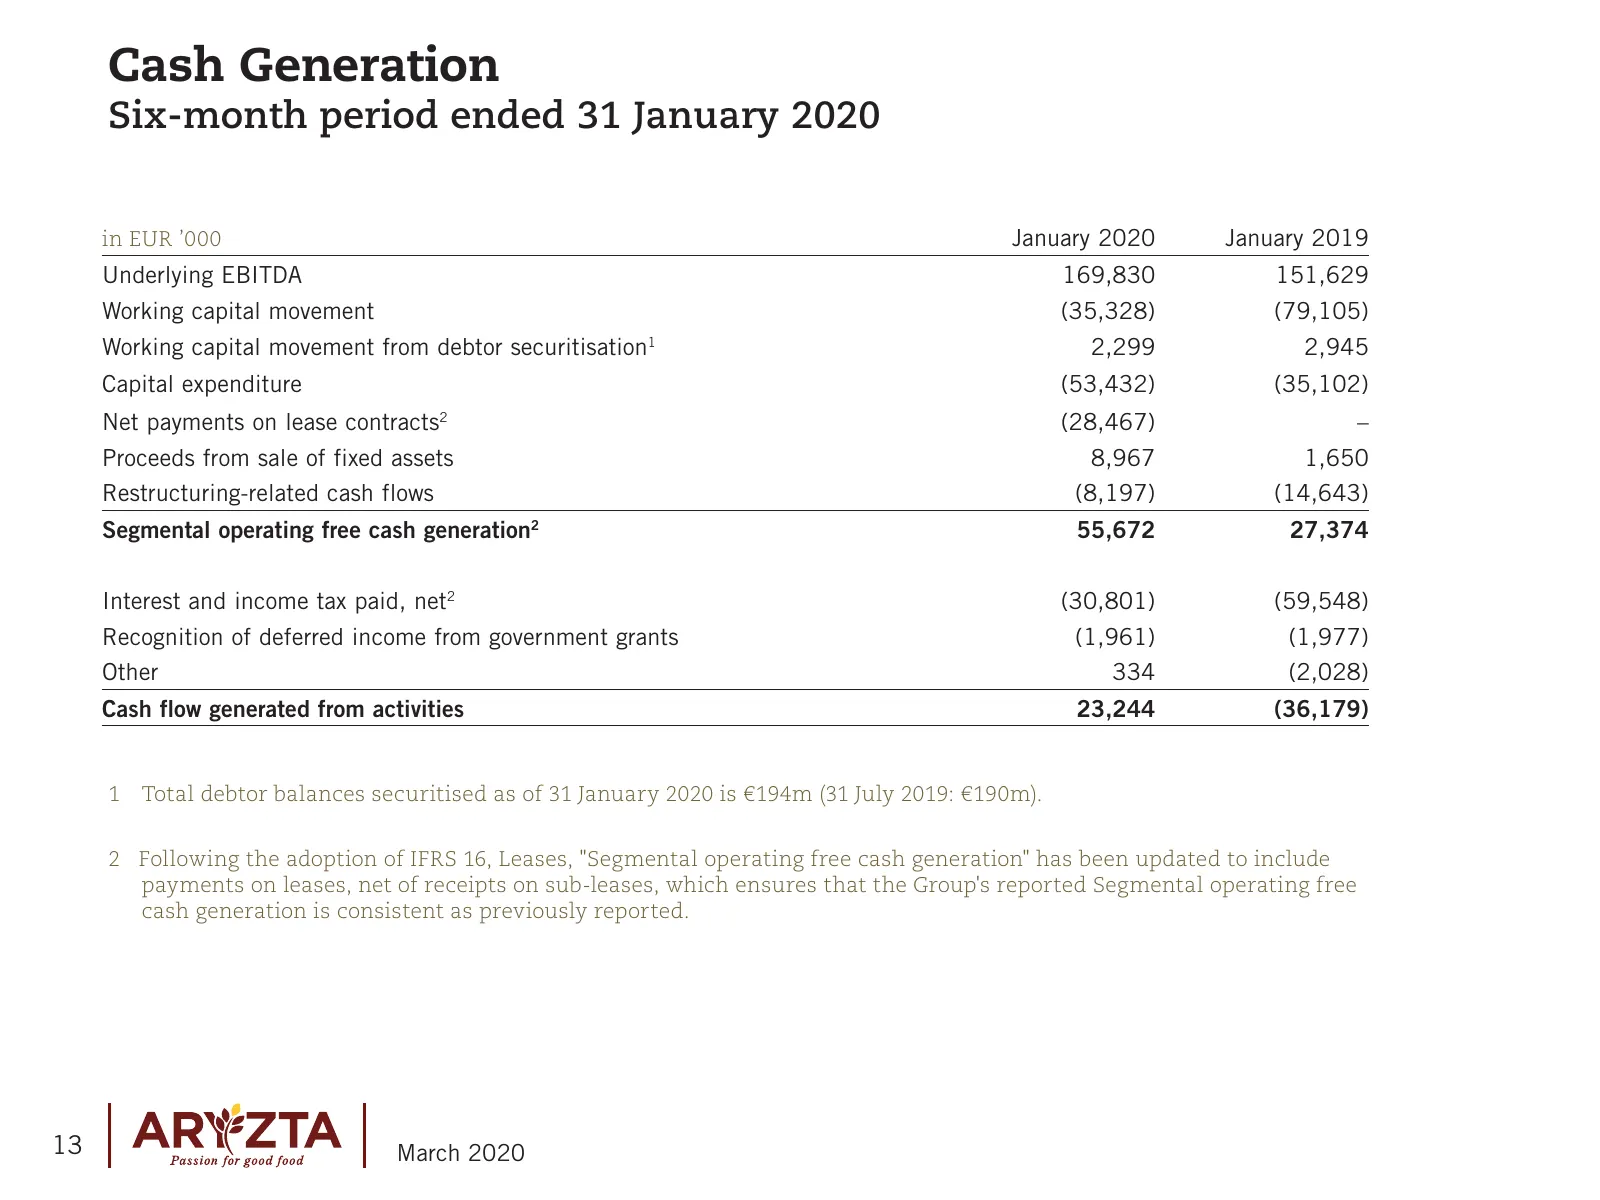
Cash Generation Six-month period ended 31 January 2020 in EUR ’000 January 2020 January 2019 Underlying EBITDA 169,830 151,629 Working capital movement (35,328) (79,105) Working capital movement from debtor securitisation1 2,299 2,945 Capital expenditure (53,432) (35,102) Net payments on lease contr
Slide 14: Net Debt Evolution
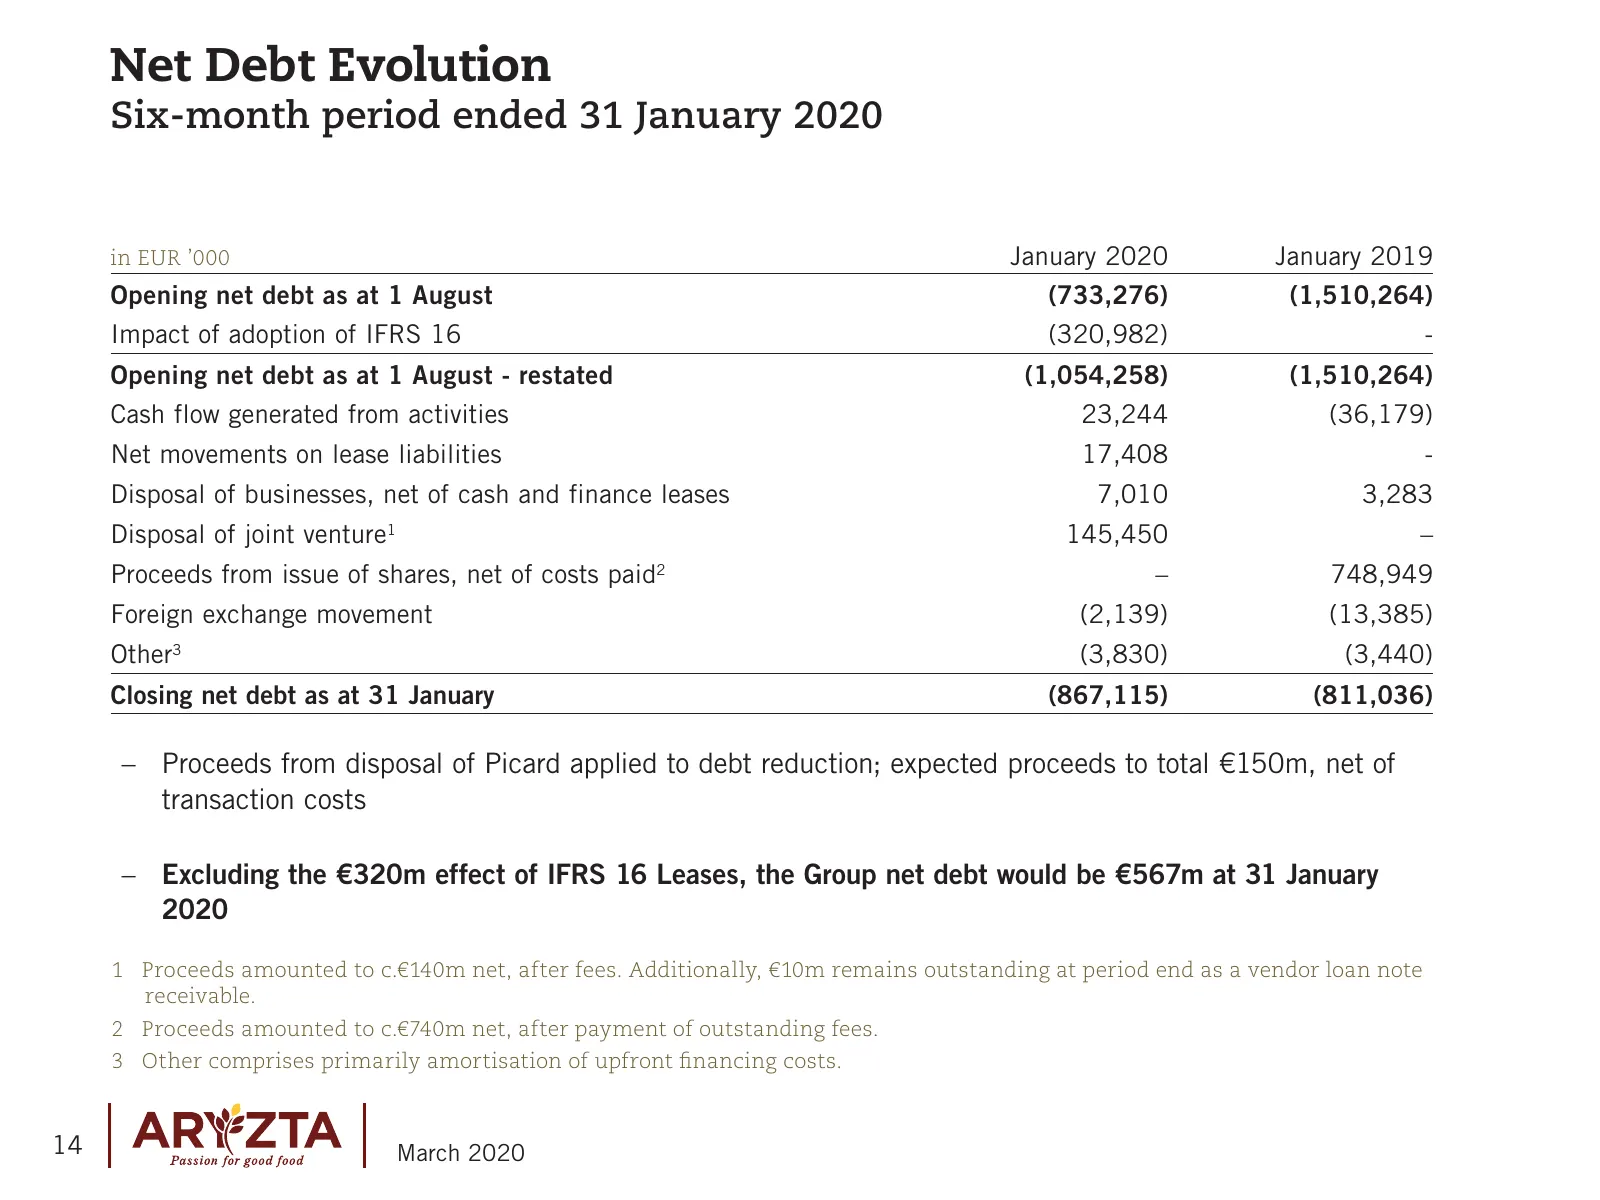
Net Debt Evolution Six-month period ended 31 January 2020 in EUR ’000 January 2020 January 2019 Opening net debt as at 1 August (733,276) (1,510,264) Impact of adoption of IFRS 16 (320,982) - Opening net debt as at 1 August - restated (1,054,258) (1,510,264) Cash flow generated from activities 23,24
Slide 15: Senior Debt Financing Net Debt/EBITDA
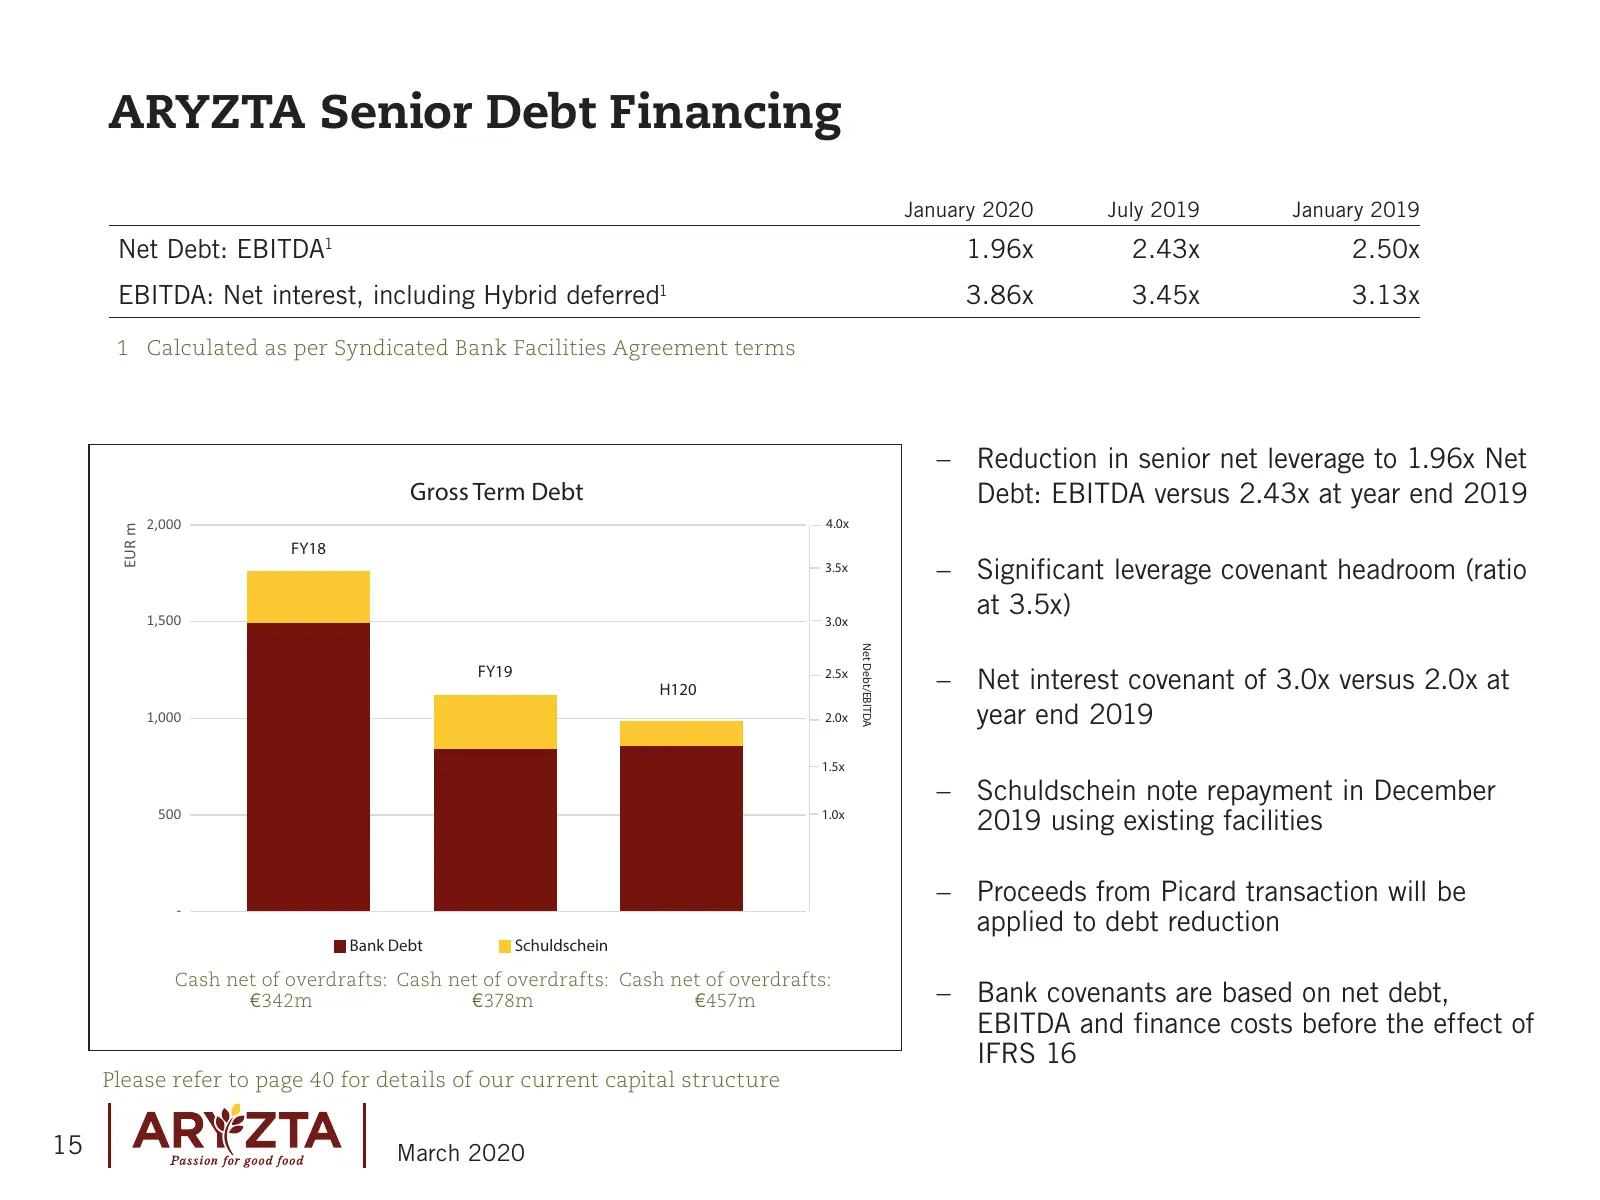
ARYZTA Senior Debt Financing January 2020 July 2019 January 2019 Net Debt: EBITDA 1 1.96x 2.43x 2.50x EBITDA: Net interest, including Hybrid deferred1 3.86x 3.45x 3.13x 1 Calculated as per Syndicated Bank Facilities Agreement terms –– Reduction in senior net leverage to 1.96x Net Gross Term Debt Deb
Slide 16: Impairment, Disposal and Restructuring
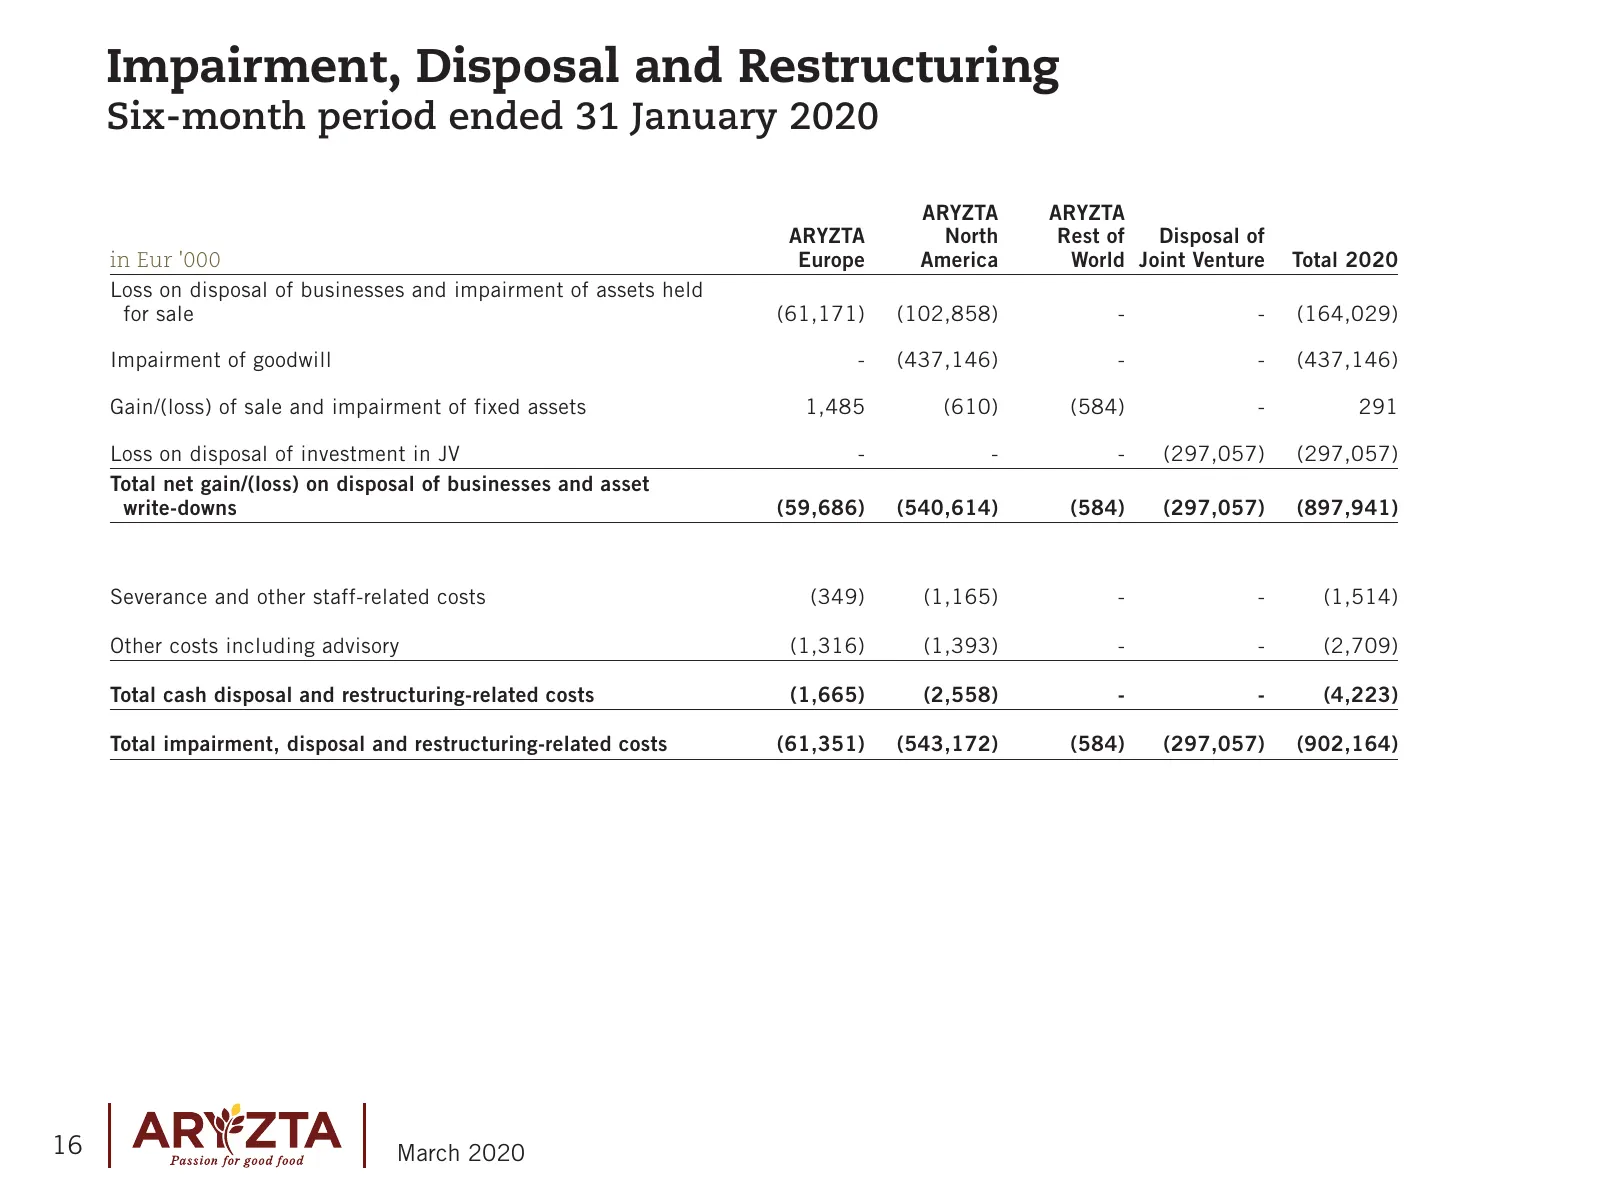
Impairment, Disposal and Restructuring Six-month period ended 31 January 2020 ARYZTA ARYZTA ARYZTA North Rest of Disposal of in Eur '000 Europe America World Joint Venture Total 2020 Loss on disposal of businesses and impairment of assets held for sale (61,171) (102,858) - - (164,029) Impairment of
Slide 17: Segmental Review
Segmental Review 17 March 2020
Slide 18: North America Profile And Prospects
ARYZTA North America Profile And Prospects –– Market leader in an attractive growth sector –– Fully focused frozen B2B bakery business –– Scaled and optimised asset base –– Unique scale, quality and capabilities in core categories: »» Artisan breads »» Donuts »» Buns »» Cookies »» Laminated dough ––
Slide 19: North America
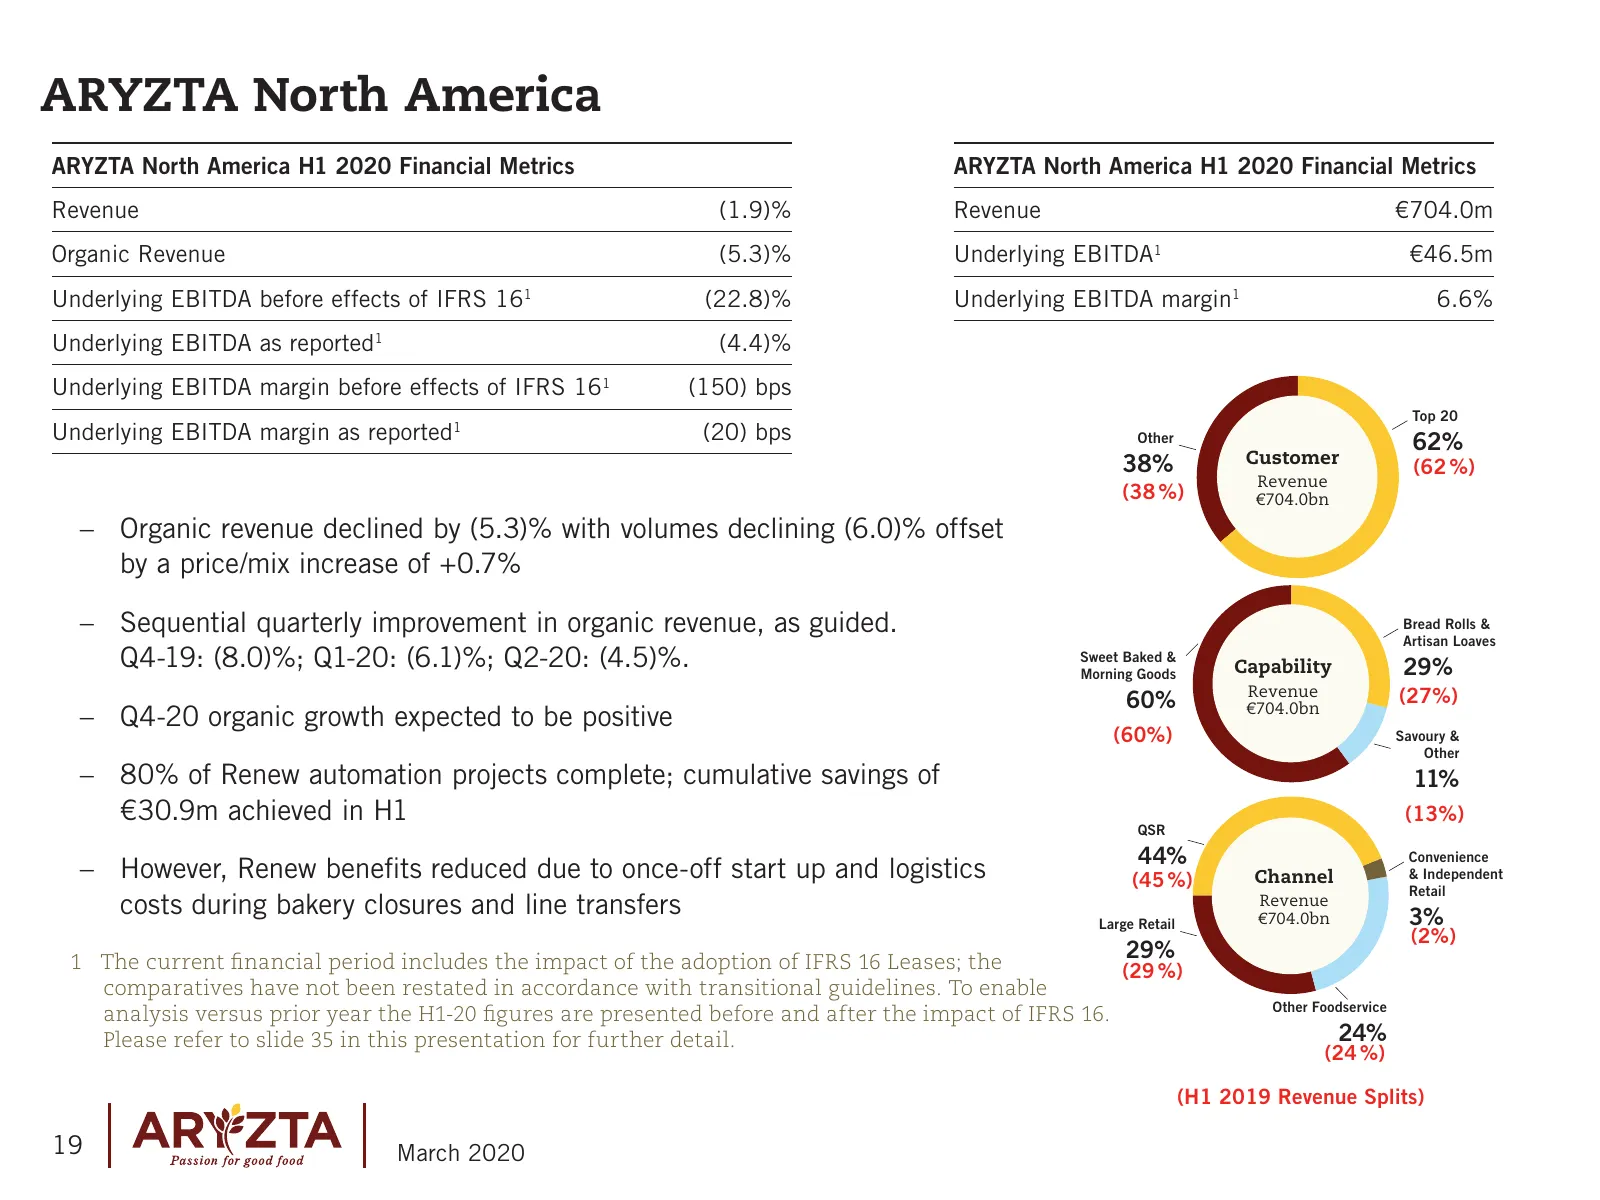
ARYZTA North America ARYZTA North America H1 2020 Financial Metrics ARYZTA North America H1 2020 Financial Metrics Revenue (1.9)% Revenue €704.0m Organic Revenue (5.3)% Underlying EBITDA1 €46.5m Underlying EBITDA before effects of IFRS 161 (22.8)% Underlying EBITDA margin1 6.6% Underlying EBITDA as
Slide 20: North America - H1 2020 Revenue Commercial & Channel Deep Dive
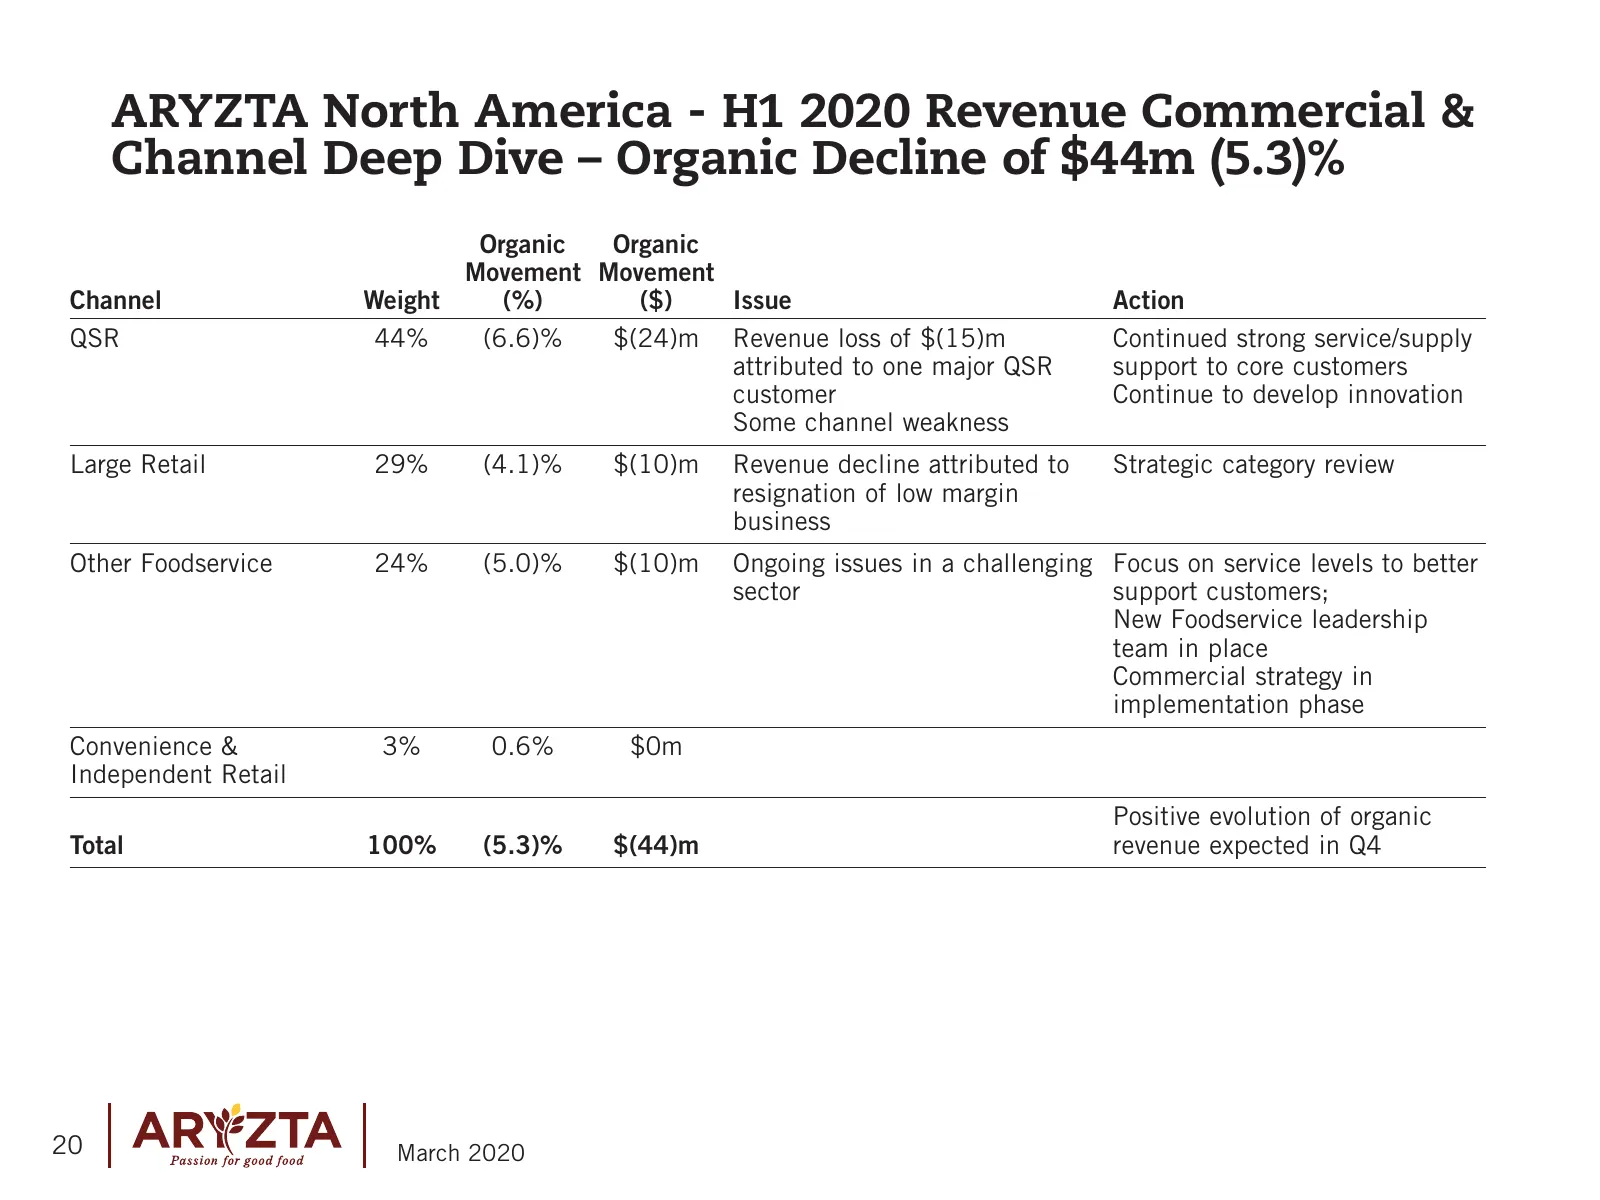
ARYZTA North America - H1 2020 Revenue Commercial & Channel Deep Dive – Organic Decline of $44m (5.3)% Organic Organic Movement Movement Channel Weight (%) ($) Issue Action QSR 44% (6.6)% $(24)m Revenue loss of $(15)m Continued strong service/supply attributed to one major QSR support to core custom
Slide 21: North America - EBITDA Heavily Challenged In Period, Recovery Expected H2
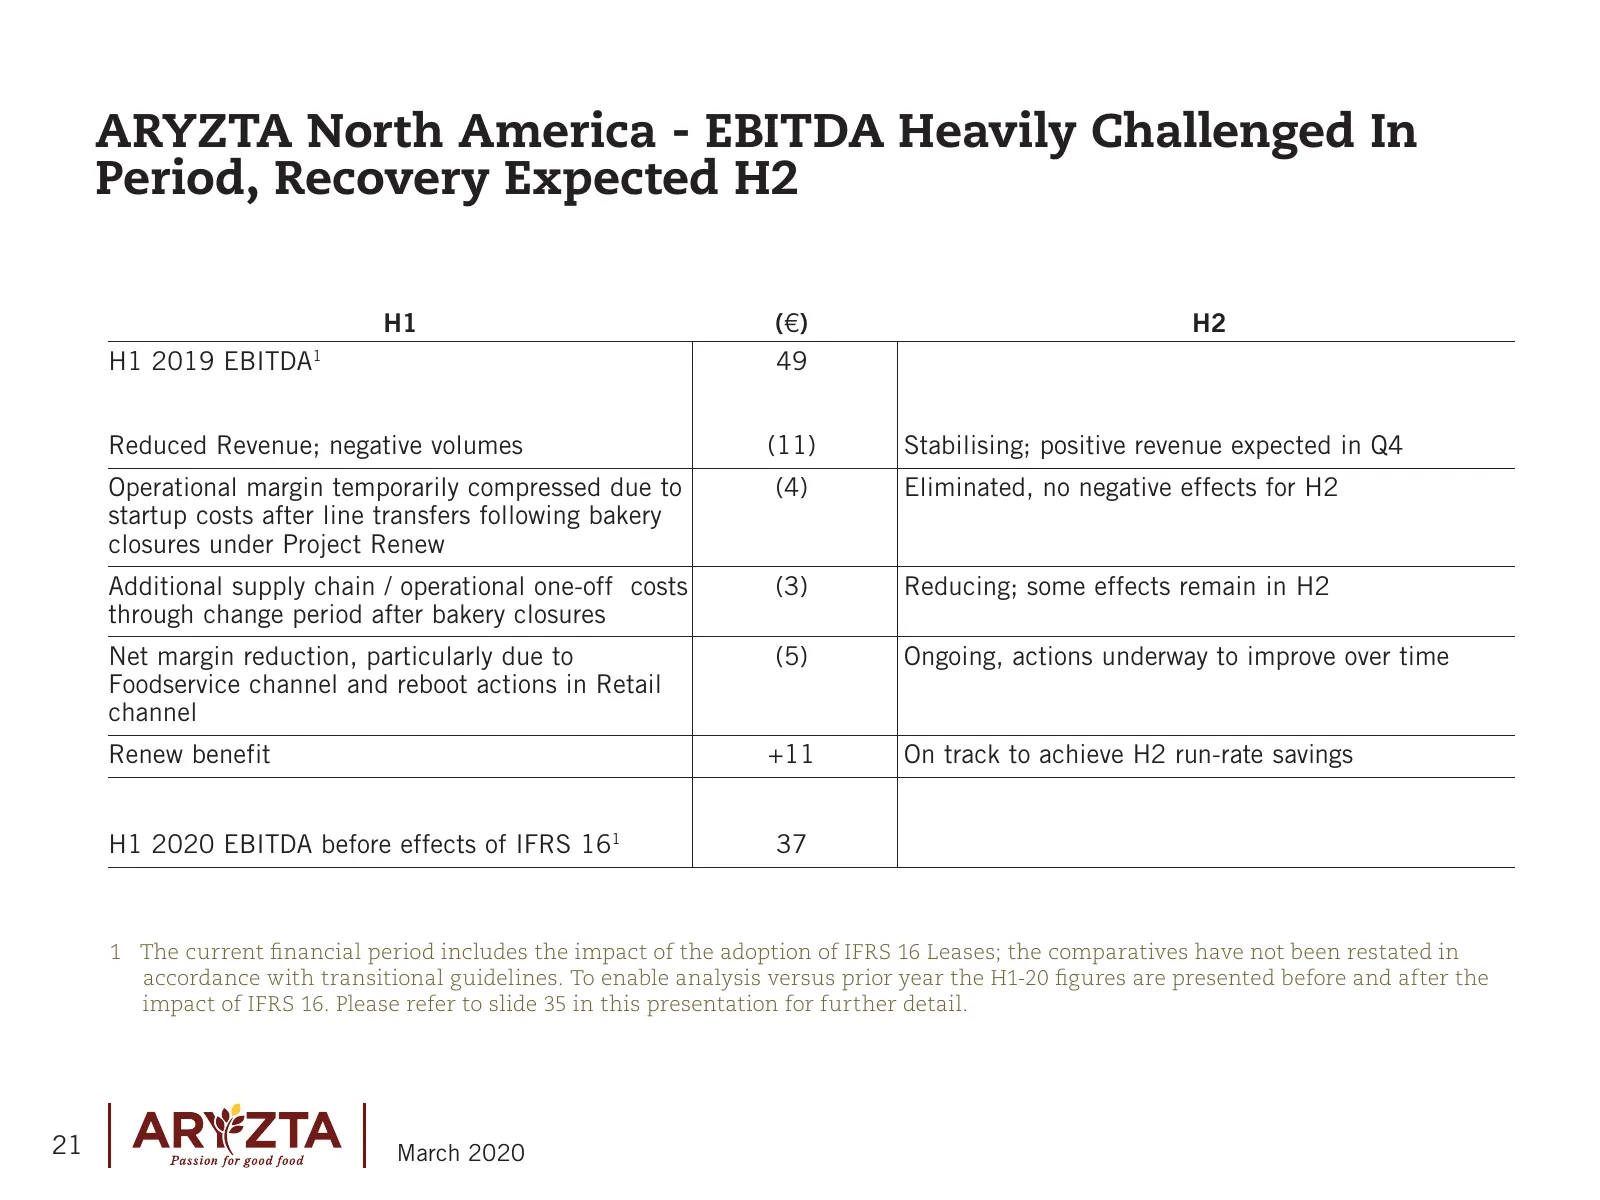
ARYZTA North America - EBITDA Heavily Challenged In Period, Recovery Expected H2 H1 (€) H2 H1 2019 EBITDA 1 49 Reduced Revenue; negative volumes (11) Stabilising; positive revenue expected in Q4 Operational margin temporarily compressed due to (4) Eliminated, no negative effects for H2 startup costs
Slide 22: North America - Key Actions to Deliver Improvement in H2 2020
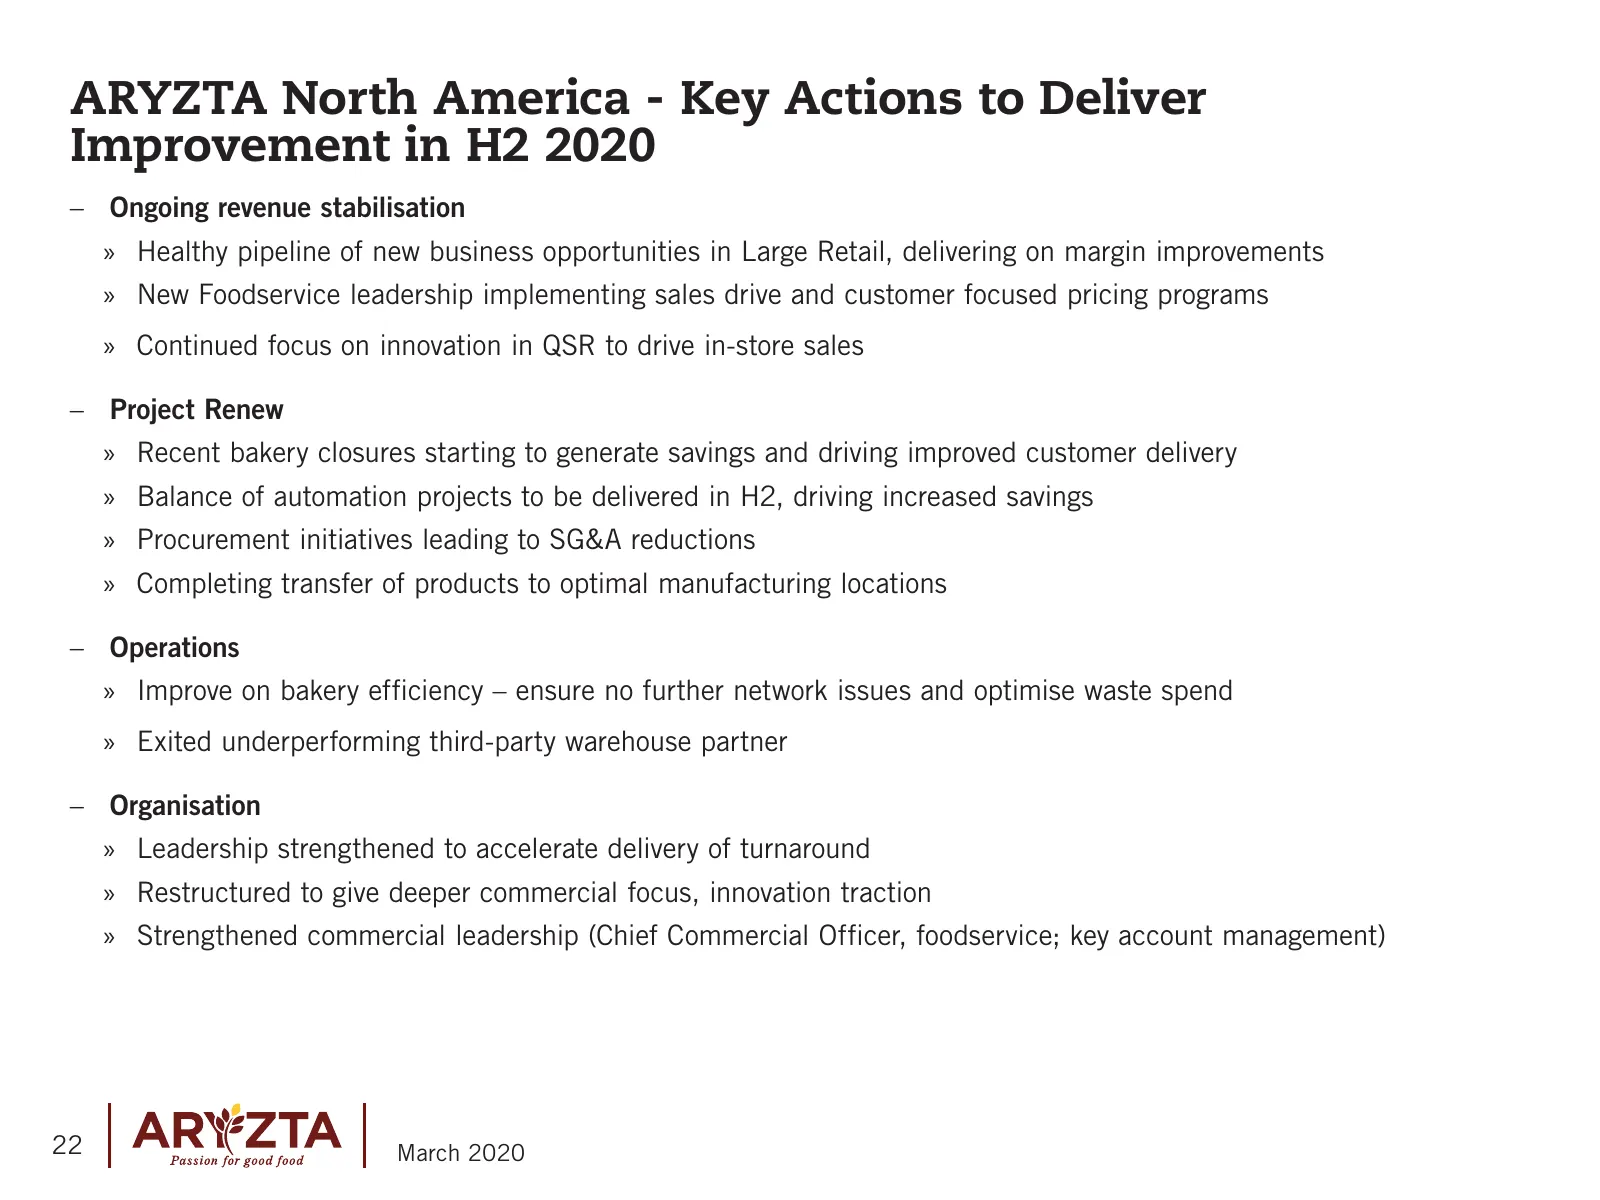
ARYZTA North America - Key Actions to Deliver Improvement in H2 2020 –– Ongoing revenue stabilisation »» Healthy pipeline of new business opportunities in Large Retail, delivering on margin improvements »» New Foodservice leadership implementing sales drive and customer focused pricing programs »» C
Slide 23: Europe
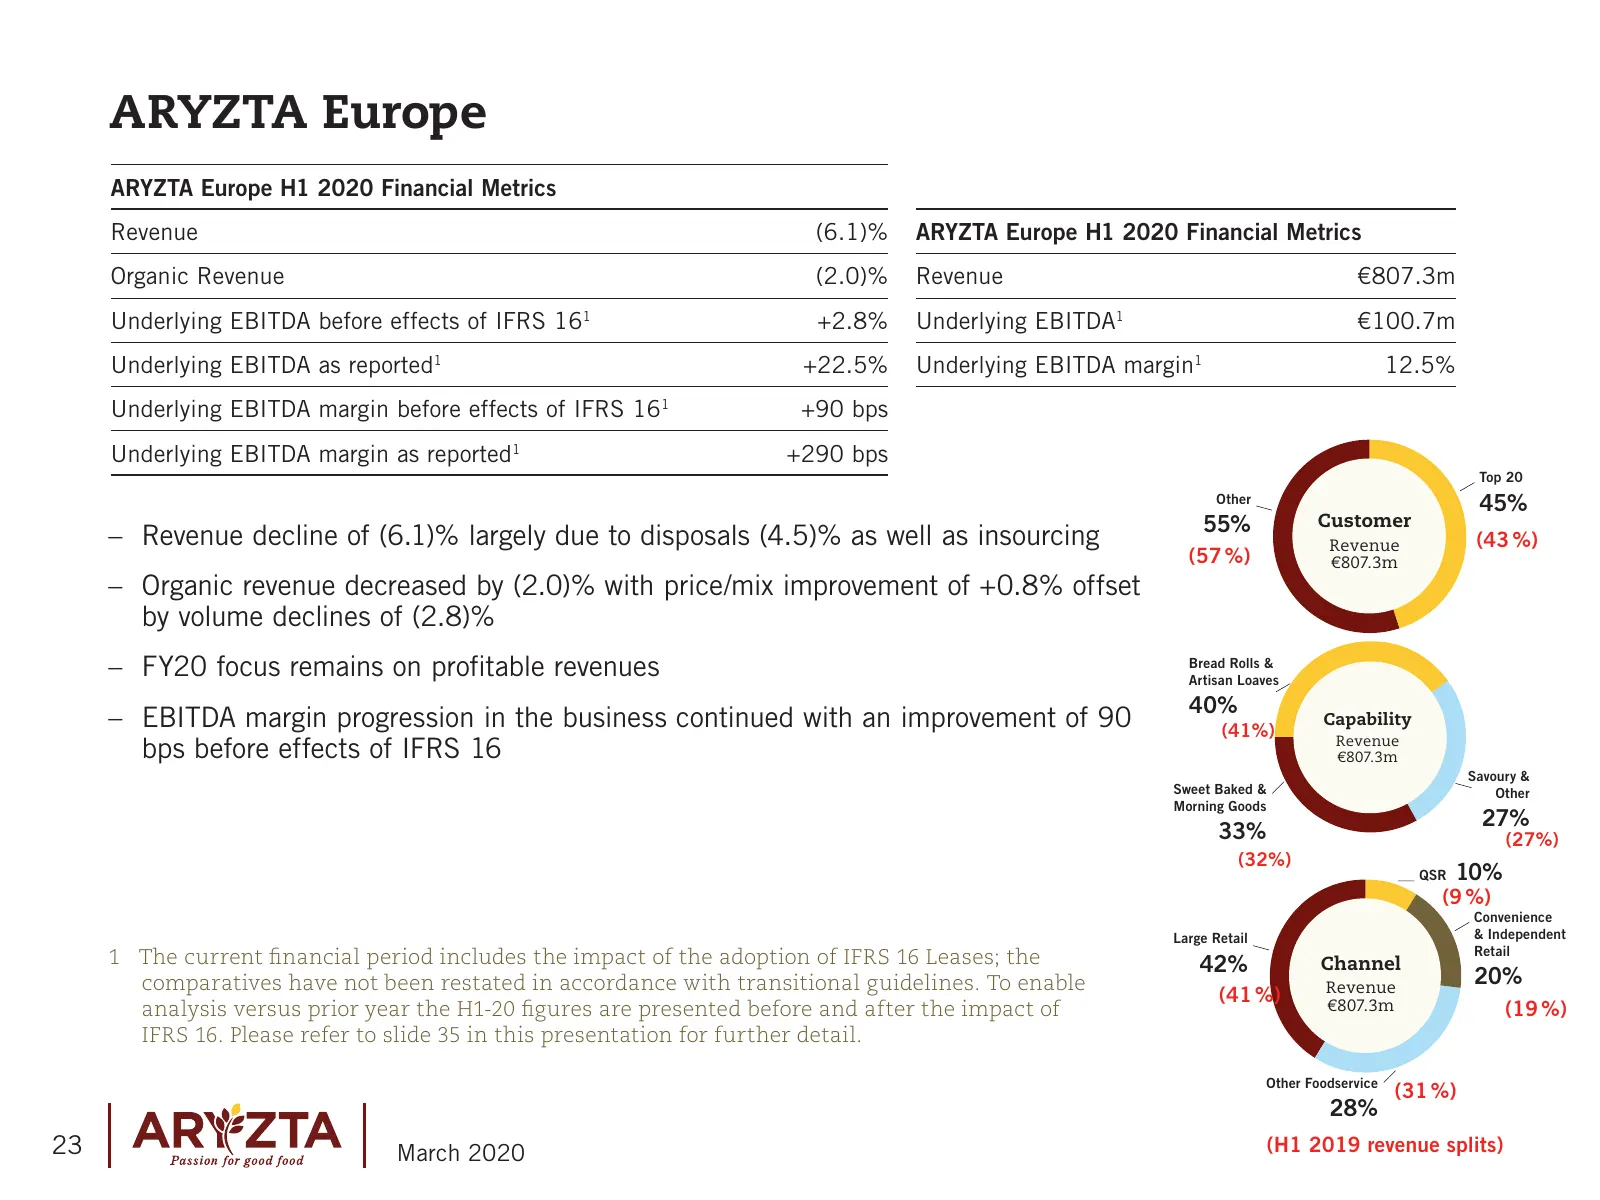
ARYZTA Europe ARYZTA Europe H1 2020 Financial Metrics Revenue (6.1)% ARYZTA Europe H1 2020 Financial Metrics Organic Revenue (2.0)% Revenue €807.3m Underlying EBITDA before effects of IFRS 161 +2.8% Underlying EBITDA1 €100.7m Underlying EBITDA as reported1 +22.5% Underlying EBITDA margin1 12.5% Unde
Slide 24: Europe – FY 2020 Continued Progress
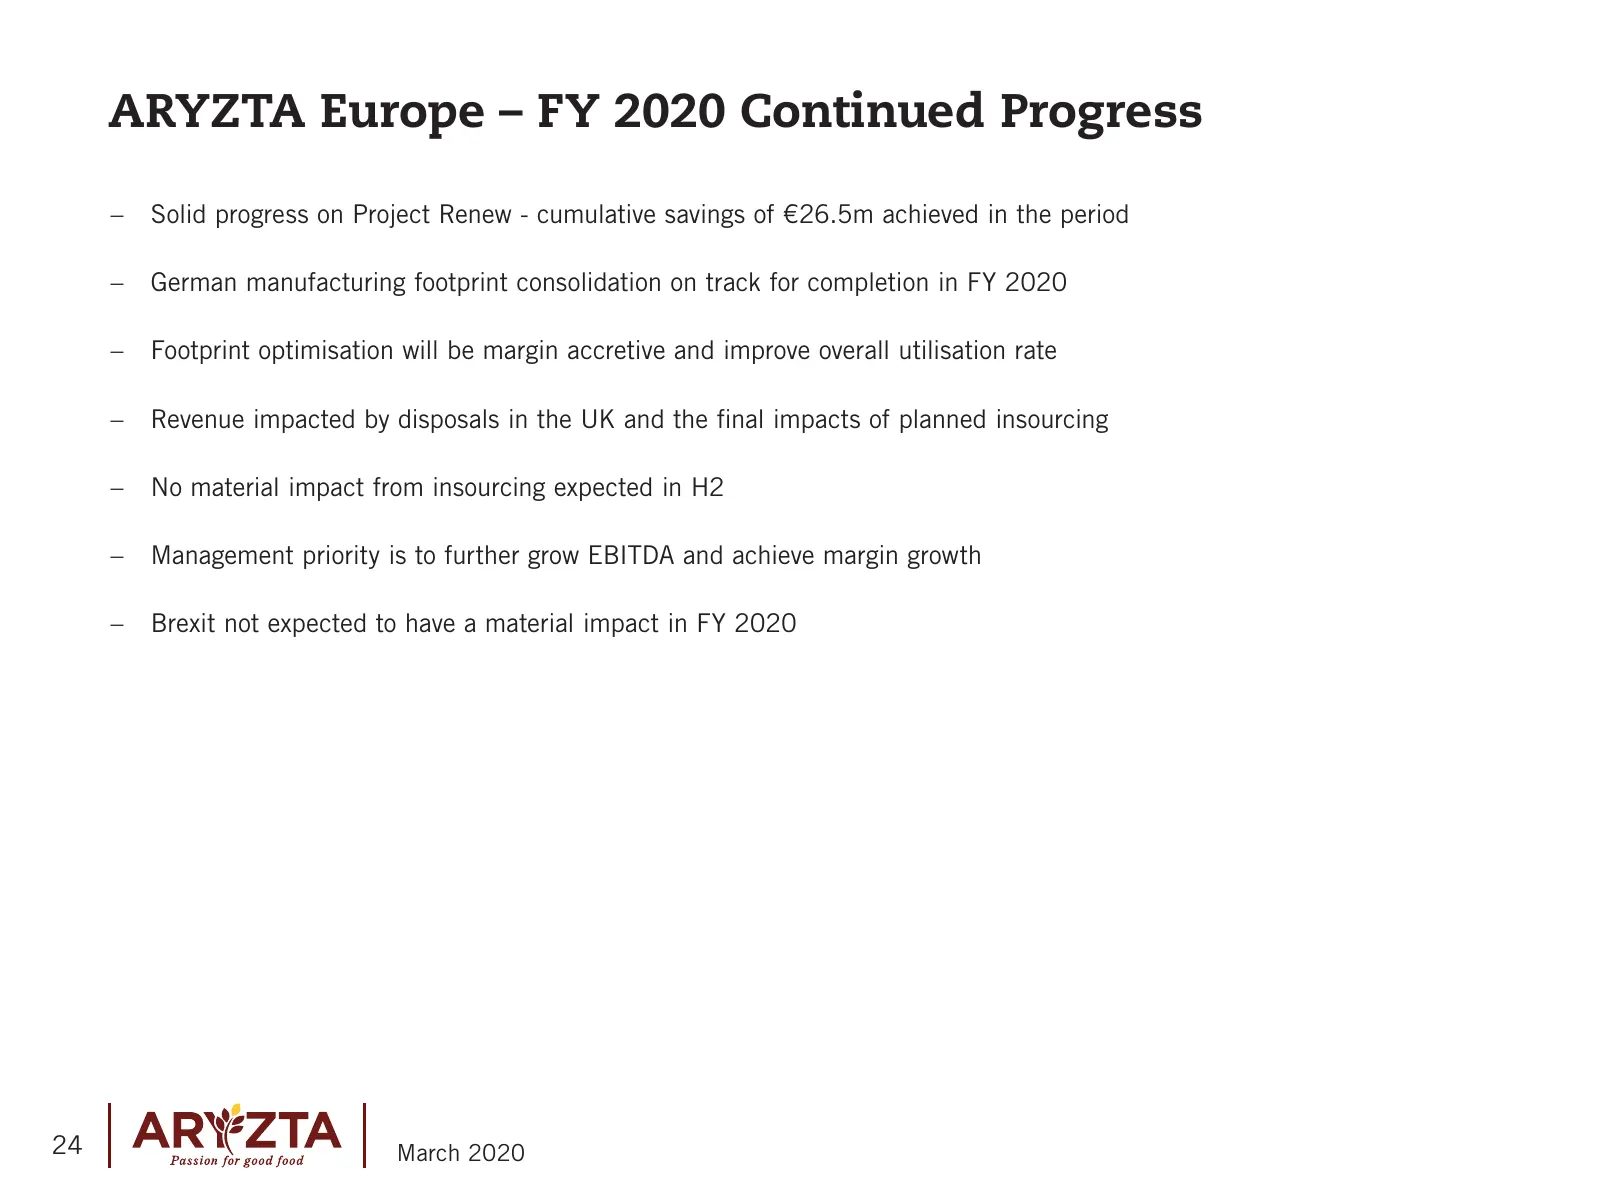
ARYZTA Europe – FY 2020 Continued Progress –– Solid progress on Project Renew - cumulative savings of €26.5m achieved in the period –– German manufacturing footprint consolidation on track for completion in FY 2020 –– Footprint optimisation will be margin accretive and improve overall utilisation ra
Slide 25: Rest of World – Continued Performance
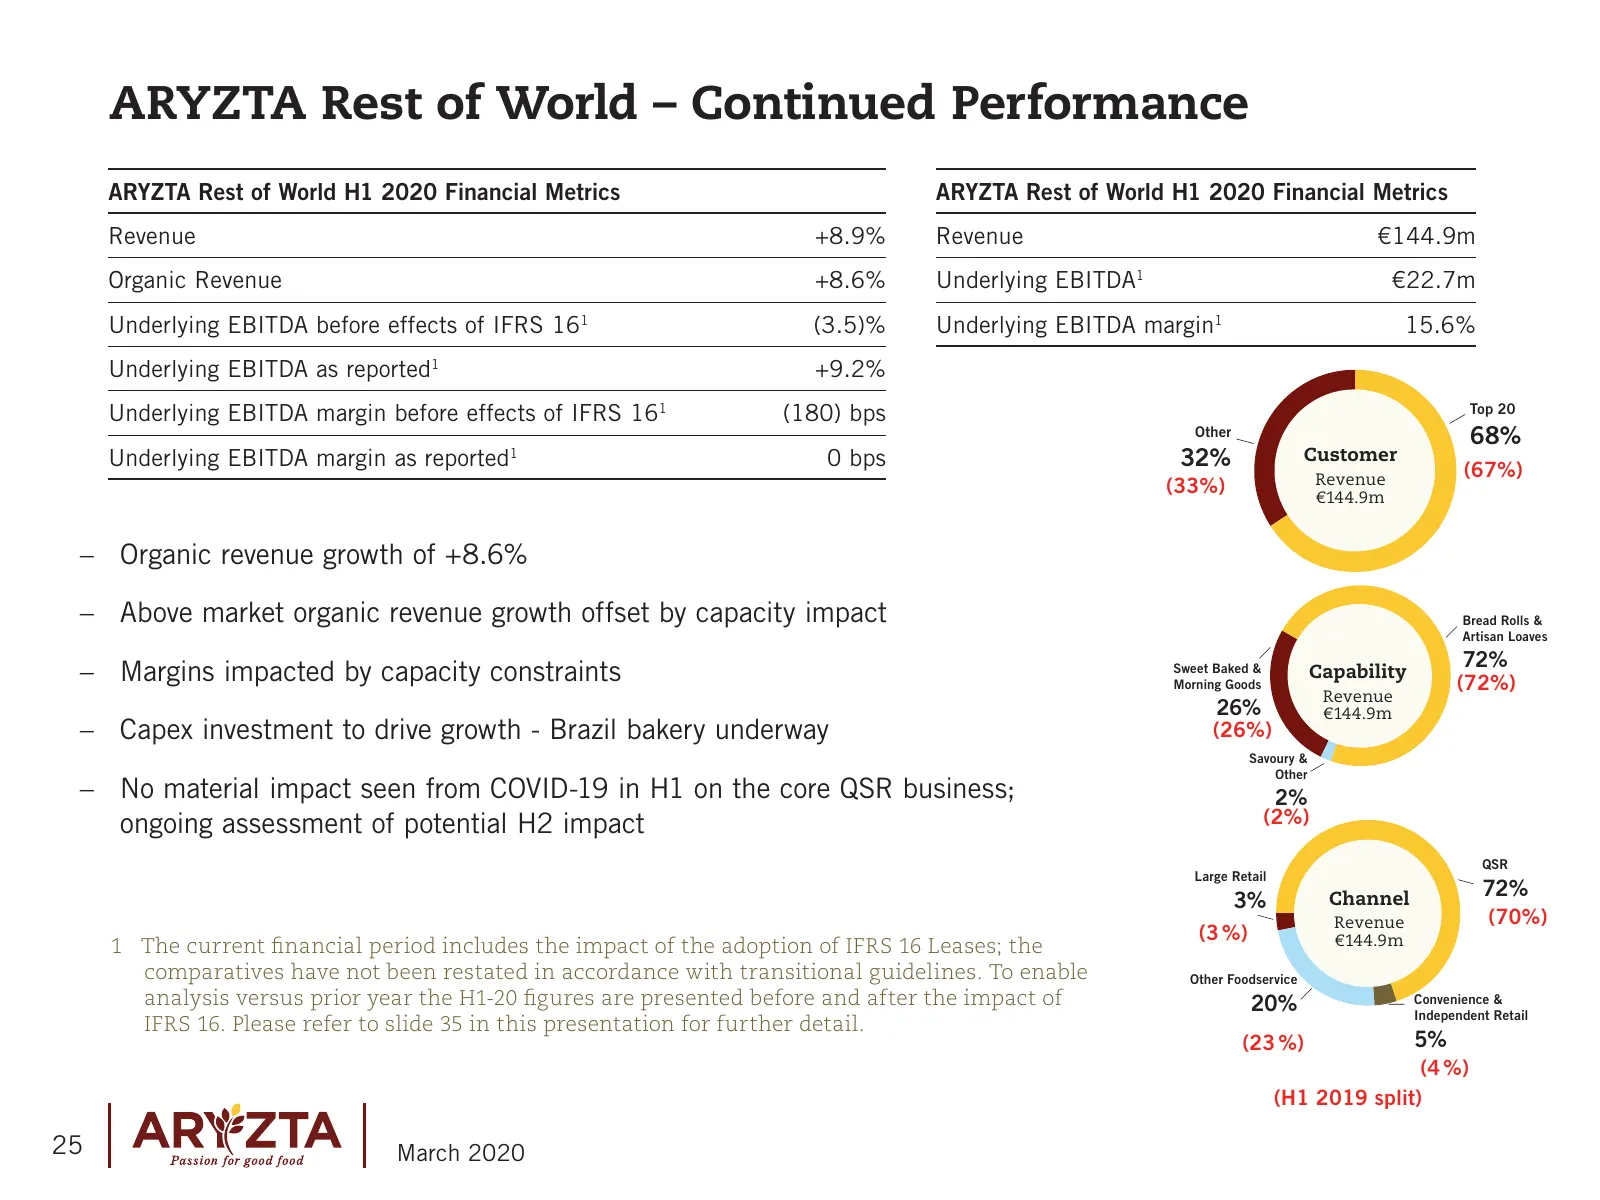
ARYZTA Rest of World – Continued Performance ARYZTA Rest of World H1 2020 Financial Metrics ARYZTA Rest of World H1 2020 Financial Metrics Revenue +8.9% Revenue €144.9m Organic Revenue +8.6% Underlying EBITDA1 €22.7m Underlying EBITDA before effects of IFRS 161 (3.5)% Underlying EBITDA margin1 15.6%

Slide 26: Project Renew
2 | ARYZTA Passion for good food March 2020
Slide 27: Project Renew – Delivering Performance
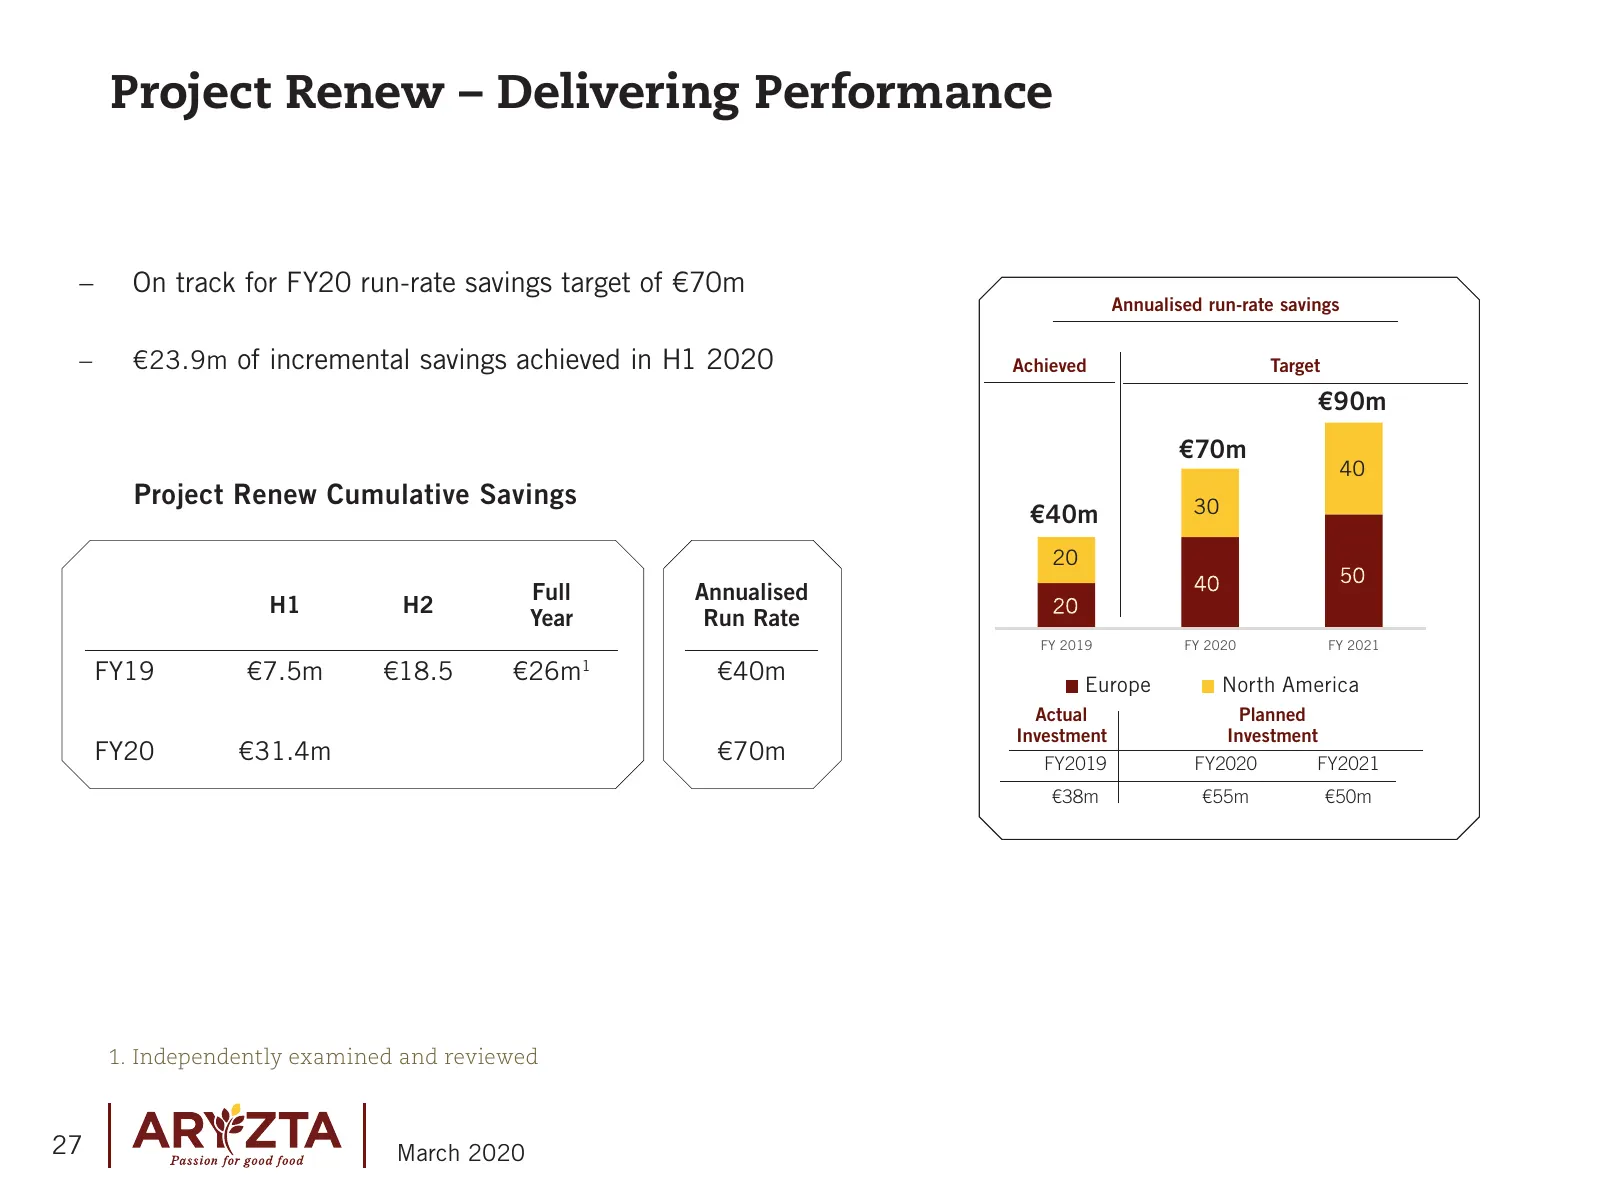
Project Renew – Delivering Performance –– On track for FY20 run-rate savings target of €70m Annualised run-rate savings –– €23.9m of incremental savings achieved in H1 2020 Achieved Target €90m €70m 40 Project Renew Cumulative Savings 30 €40m 20 40 50 Full Annualised H1 H2 20 Year Run Rate FY 2019 F
Slide 28: Project Renew Update
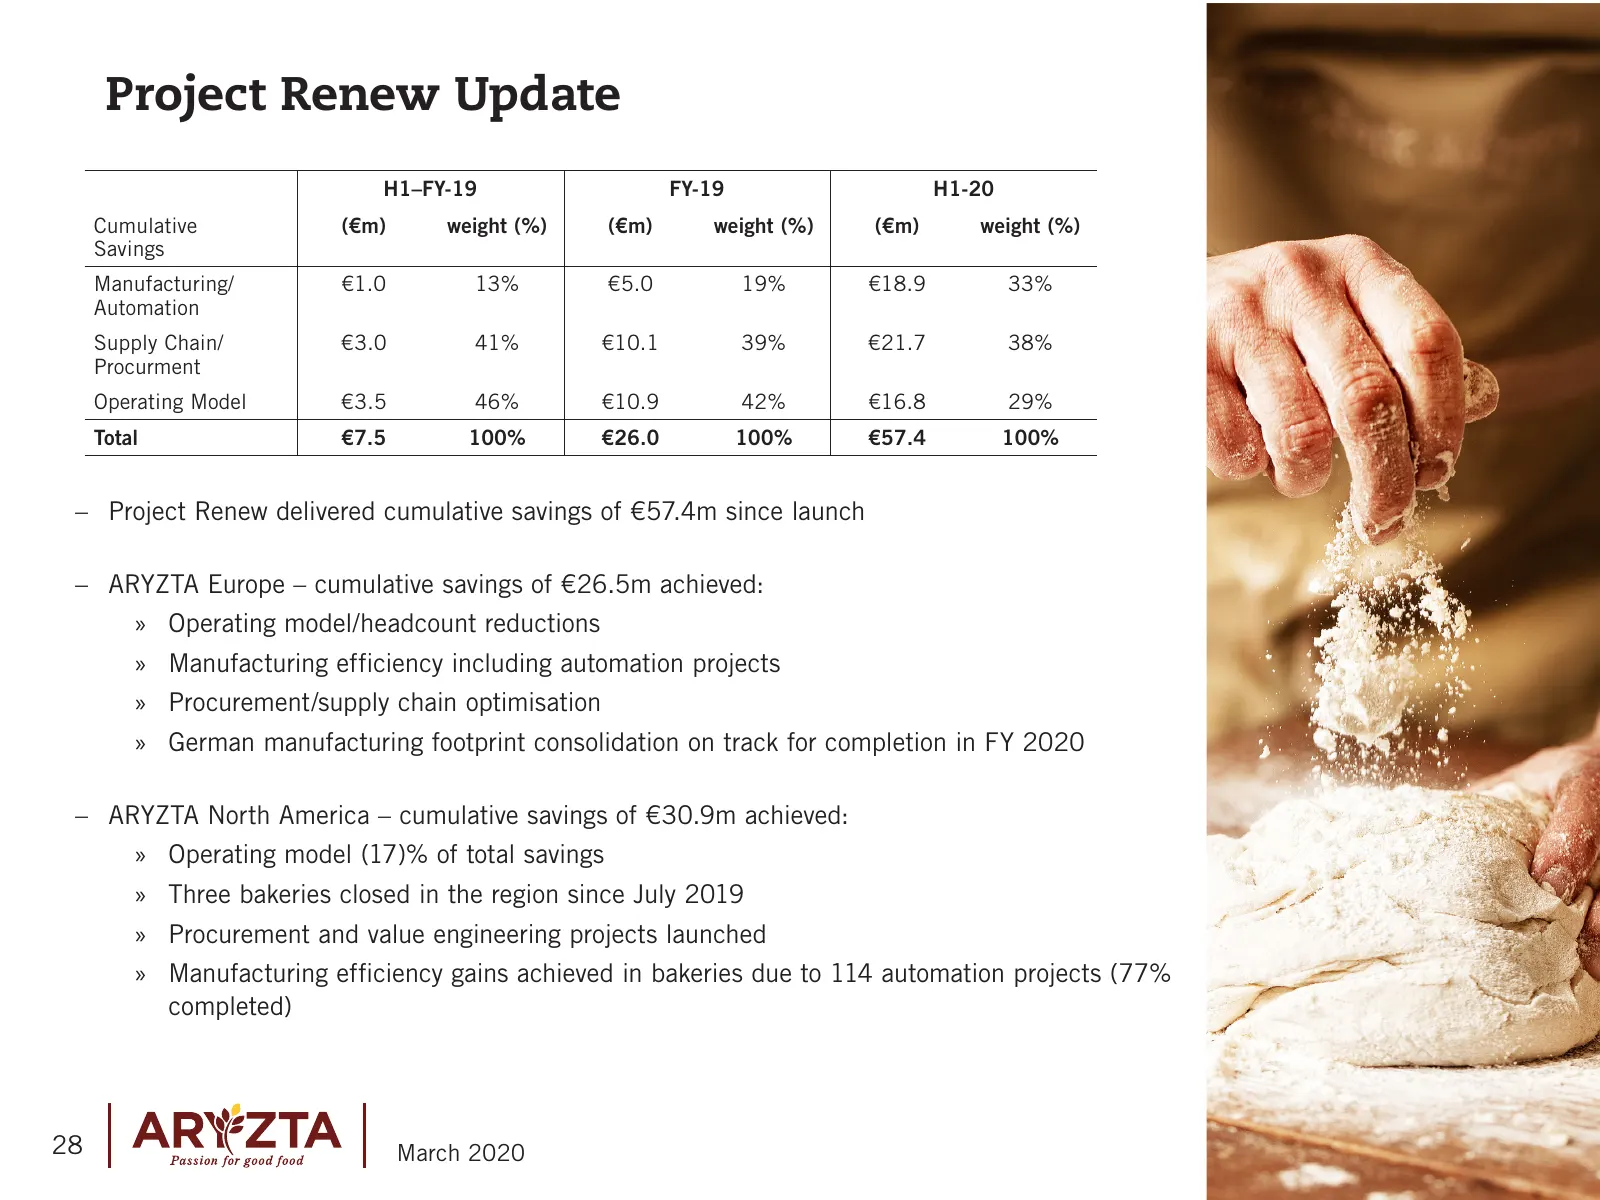
Project Renew Update H1–FY-19 FY-19 H1-20 Cumulative (€m) weight (%) (€m) weight (%) (€m) weight (%) Savings Manufacturing/ €1.0 13% €5.0 19% €18.9 33% Automation Supply Chain/ €3.0 41% €10.1 39% €21.7 38% Procurment Operating Model €3.5 46% €10.9 42% €16.8 29% Total €7.5 100% €26.0 100% €57.4 100%
Slide 29: COVID-19
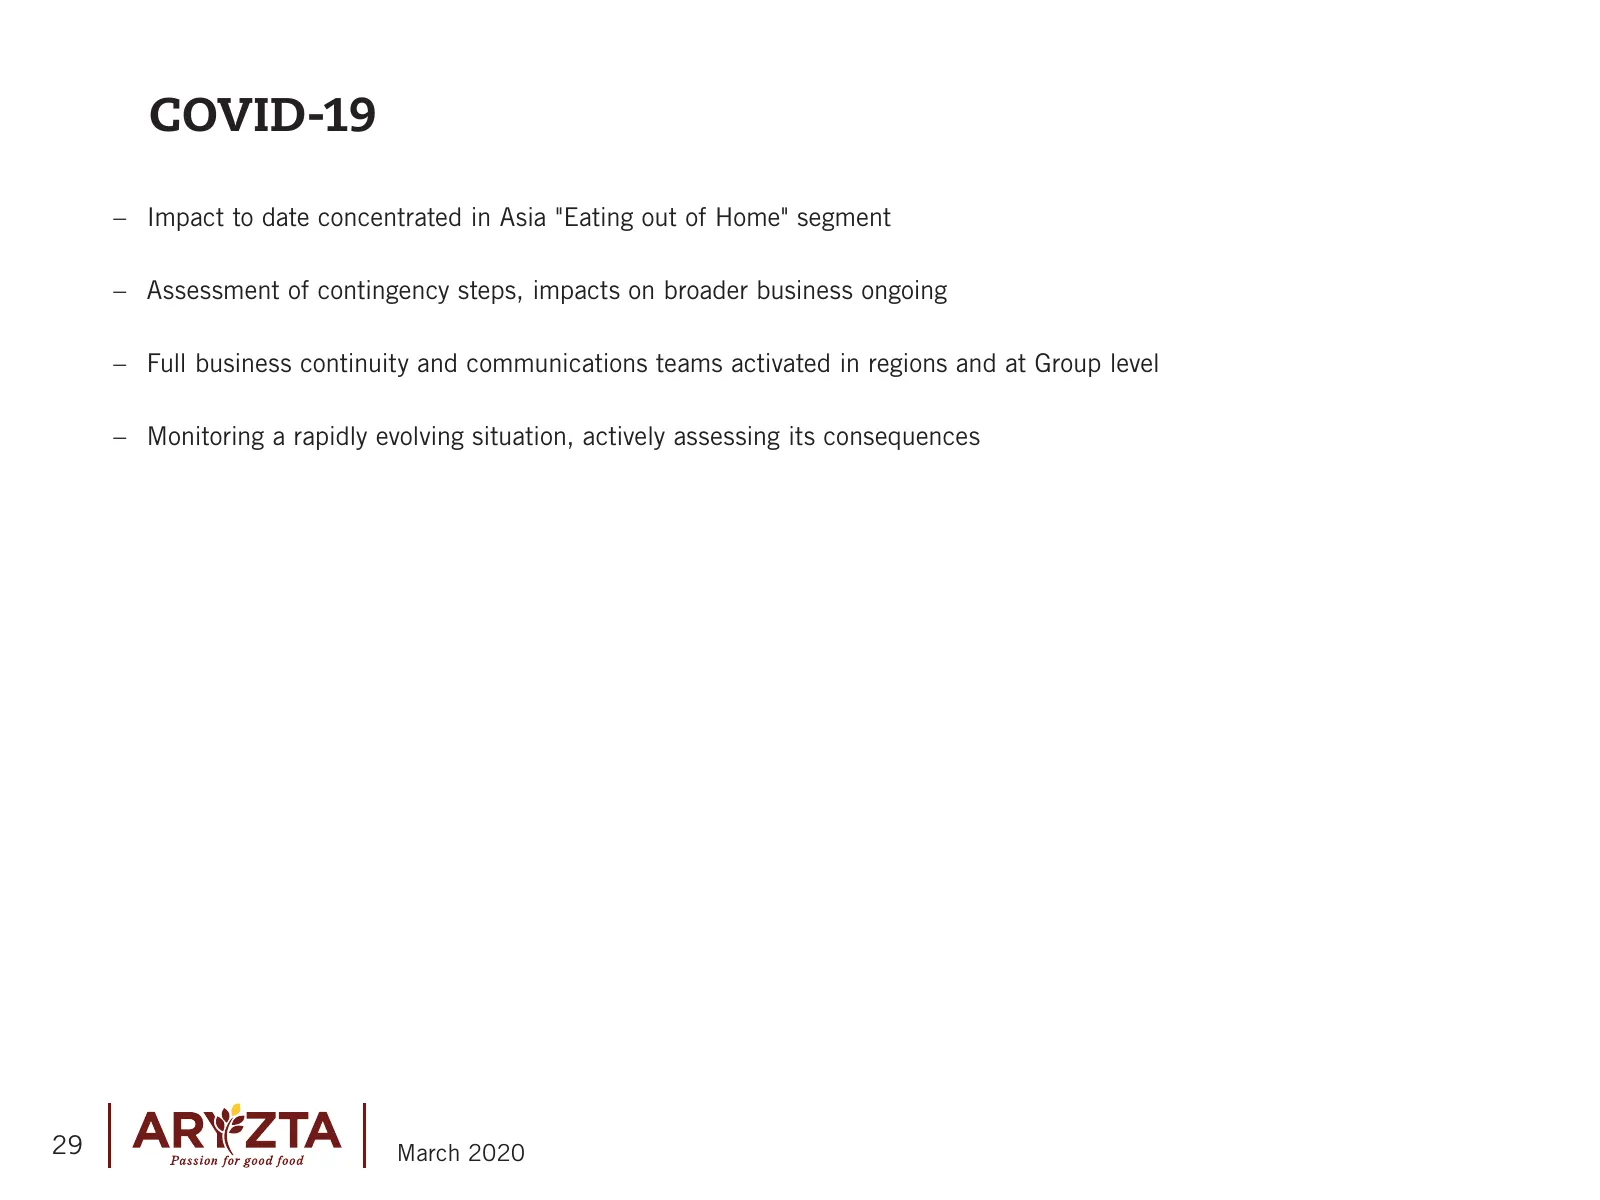
COVID-19 –– Impact to date concentrated in Asia "Eating out of Home" segment –– Assessment of contingency steps, impacts on broader business ongoing –– Full business continuity and communications teams activated in regions and at Group level –– Monitoring a rapidly evolving situation, actively asses
Slide 30: Summary
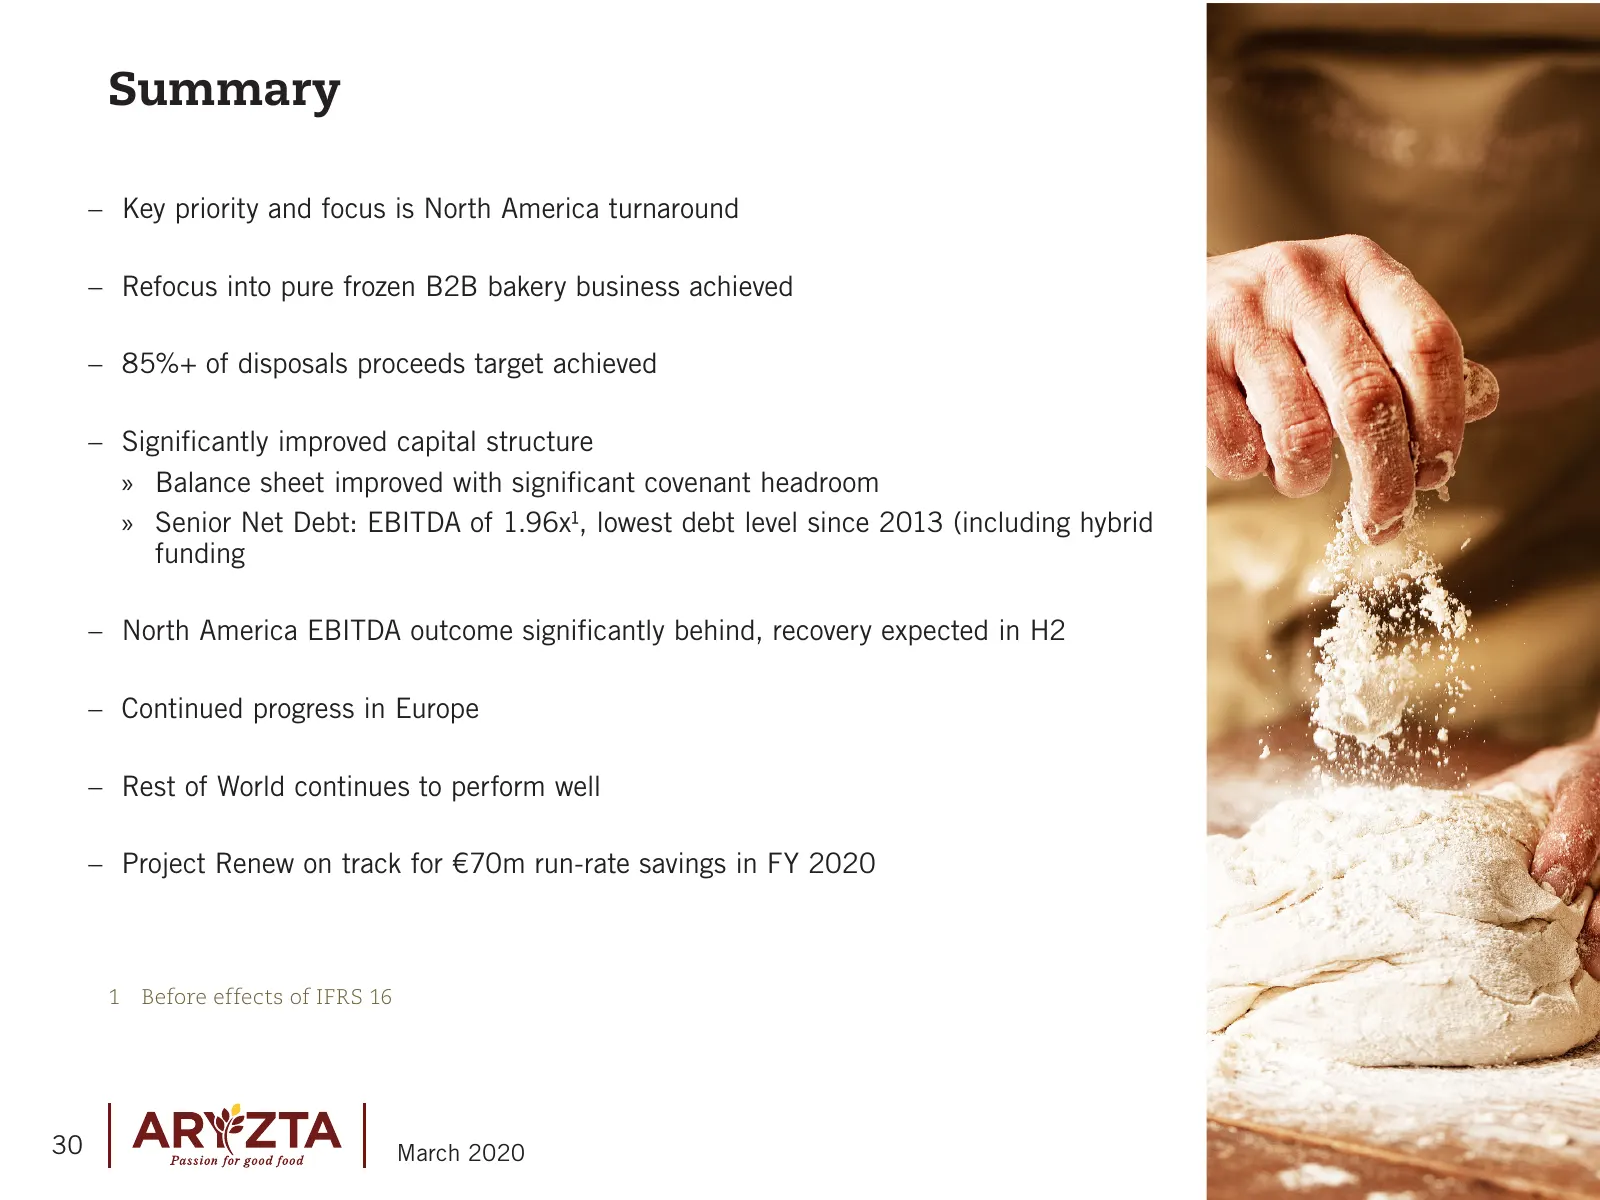
Summary –– Key priority and focus is North America turnaround –– Refocus into pure frozen B2B bakery business achieved –– 85%+ of disposals proceeds target achieved –– Significantly improved capital structure »» Balance sheet improved with significant covenant headroom »» Senior Net Debt: EBITDA of
Slide 31: Outlook
Outlook –– Group underlying EBITDA before effects of IFRS 16 expected to improve in FY 2020. Guidance assumes no material or prolonged impact from COVID-19 in FY 2020. 31 March 2020

Slide 32: Appendix I IFRS 16
Appendix I IFRS 16 32 March 2020
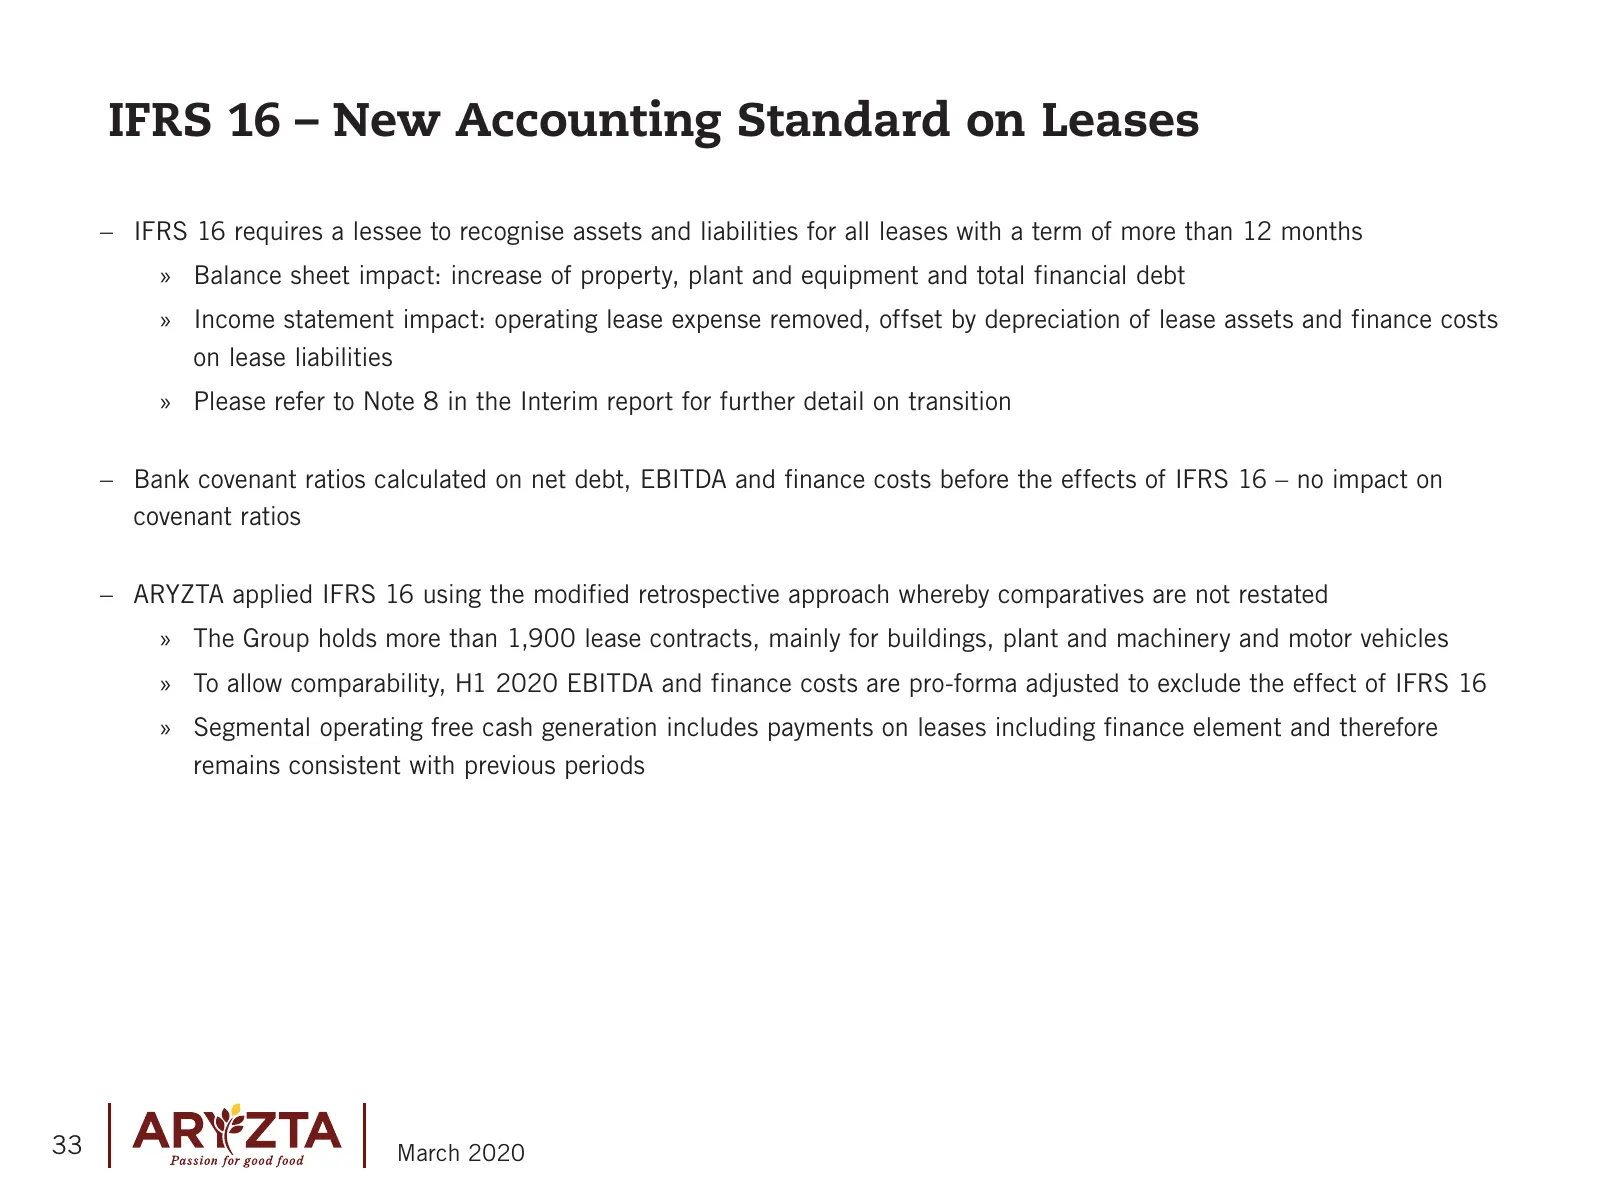
Slide 33: IFRS 16 – New Accounting Standard on Leases
IFRS 16 – New Accounting Standard on Leases –– IFRS 16 requires a lessee to recognise assets and liabilities for all leases with a term of more than 12 months »» Balance sheet impact: increase of property, plant and equipment and total financial debt »» Income statement impact: operating lease expen
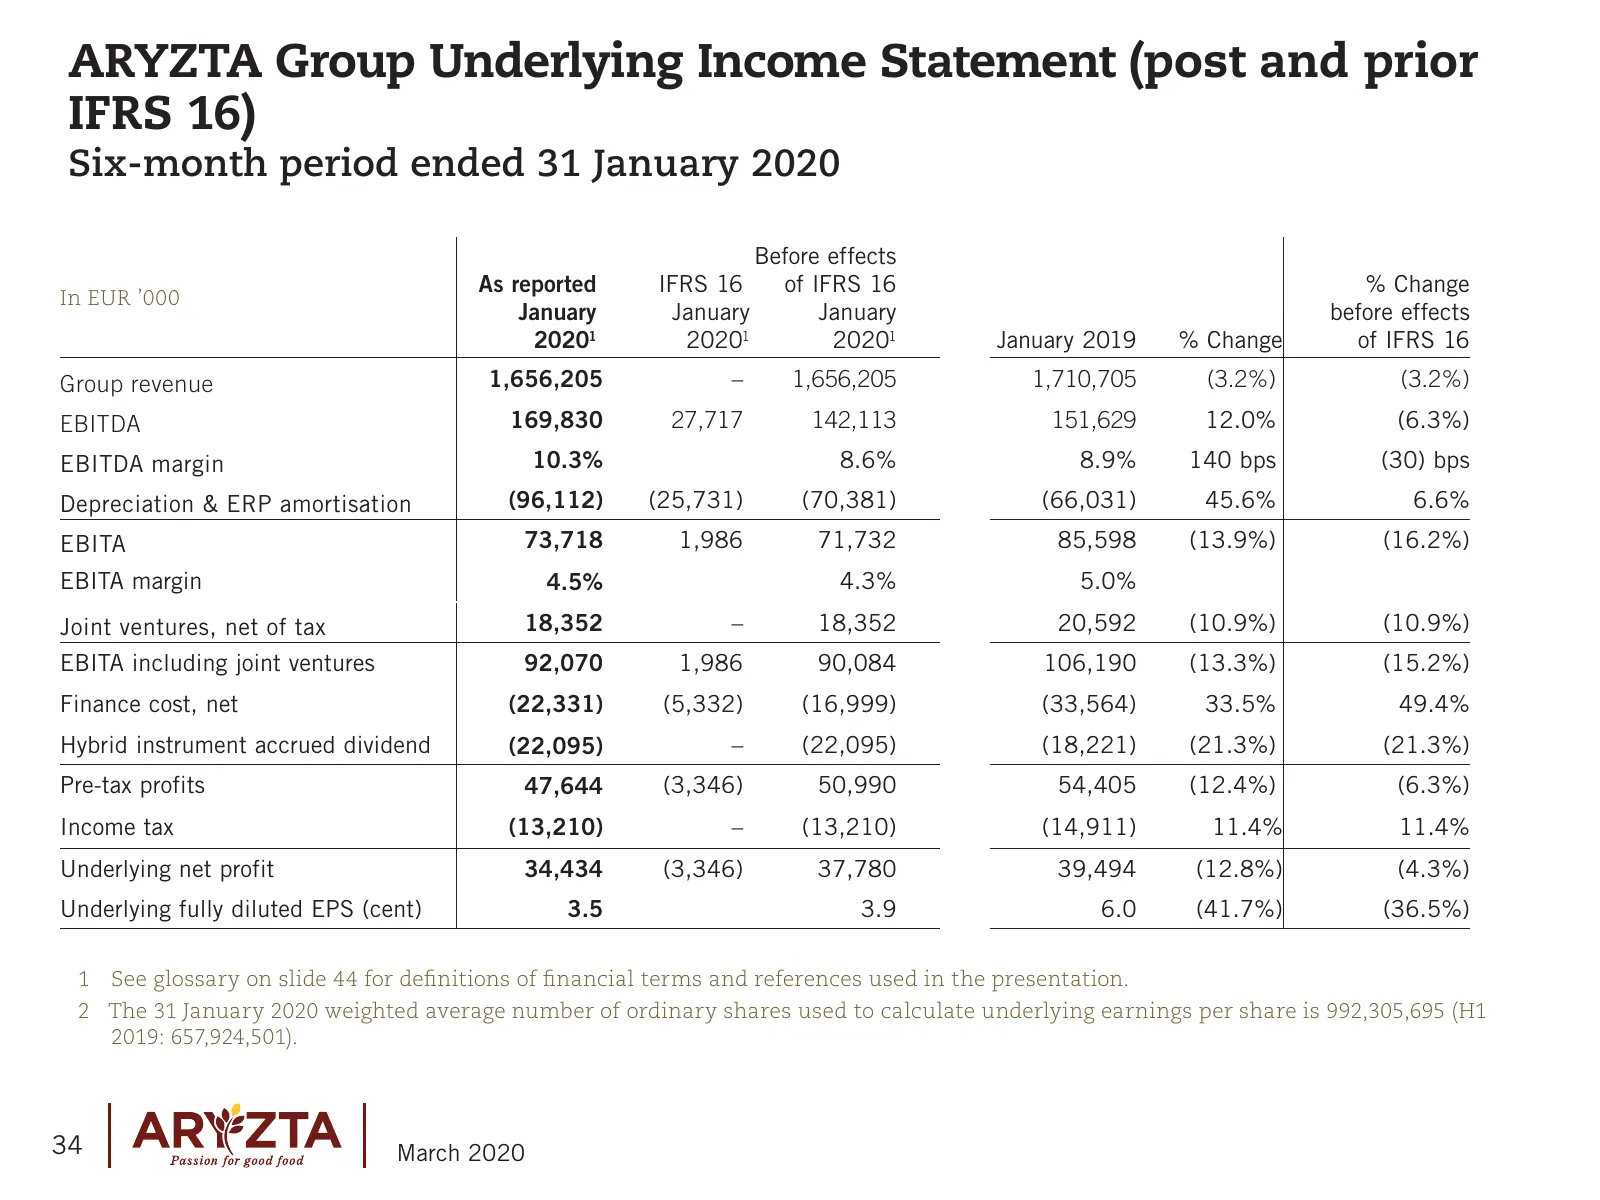
Slide 34: Group Underlying Income Statement (post and prior IFRS 16)
ARYZTA Group Underlying Income Statement (post and prior IFRS 16) Six-month period ended 31 January 2020 Before effects As reported IFRS 16 of IFRS 16 % Change In EUR ’000 January January January before effects 20201 20201 20201 January 2019 % Change of IFRS 16 Group revenue 1,656,205 – 1,656,205 1,
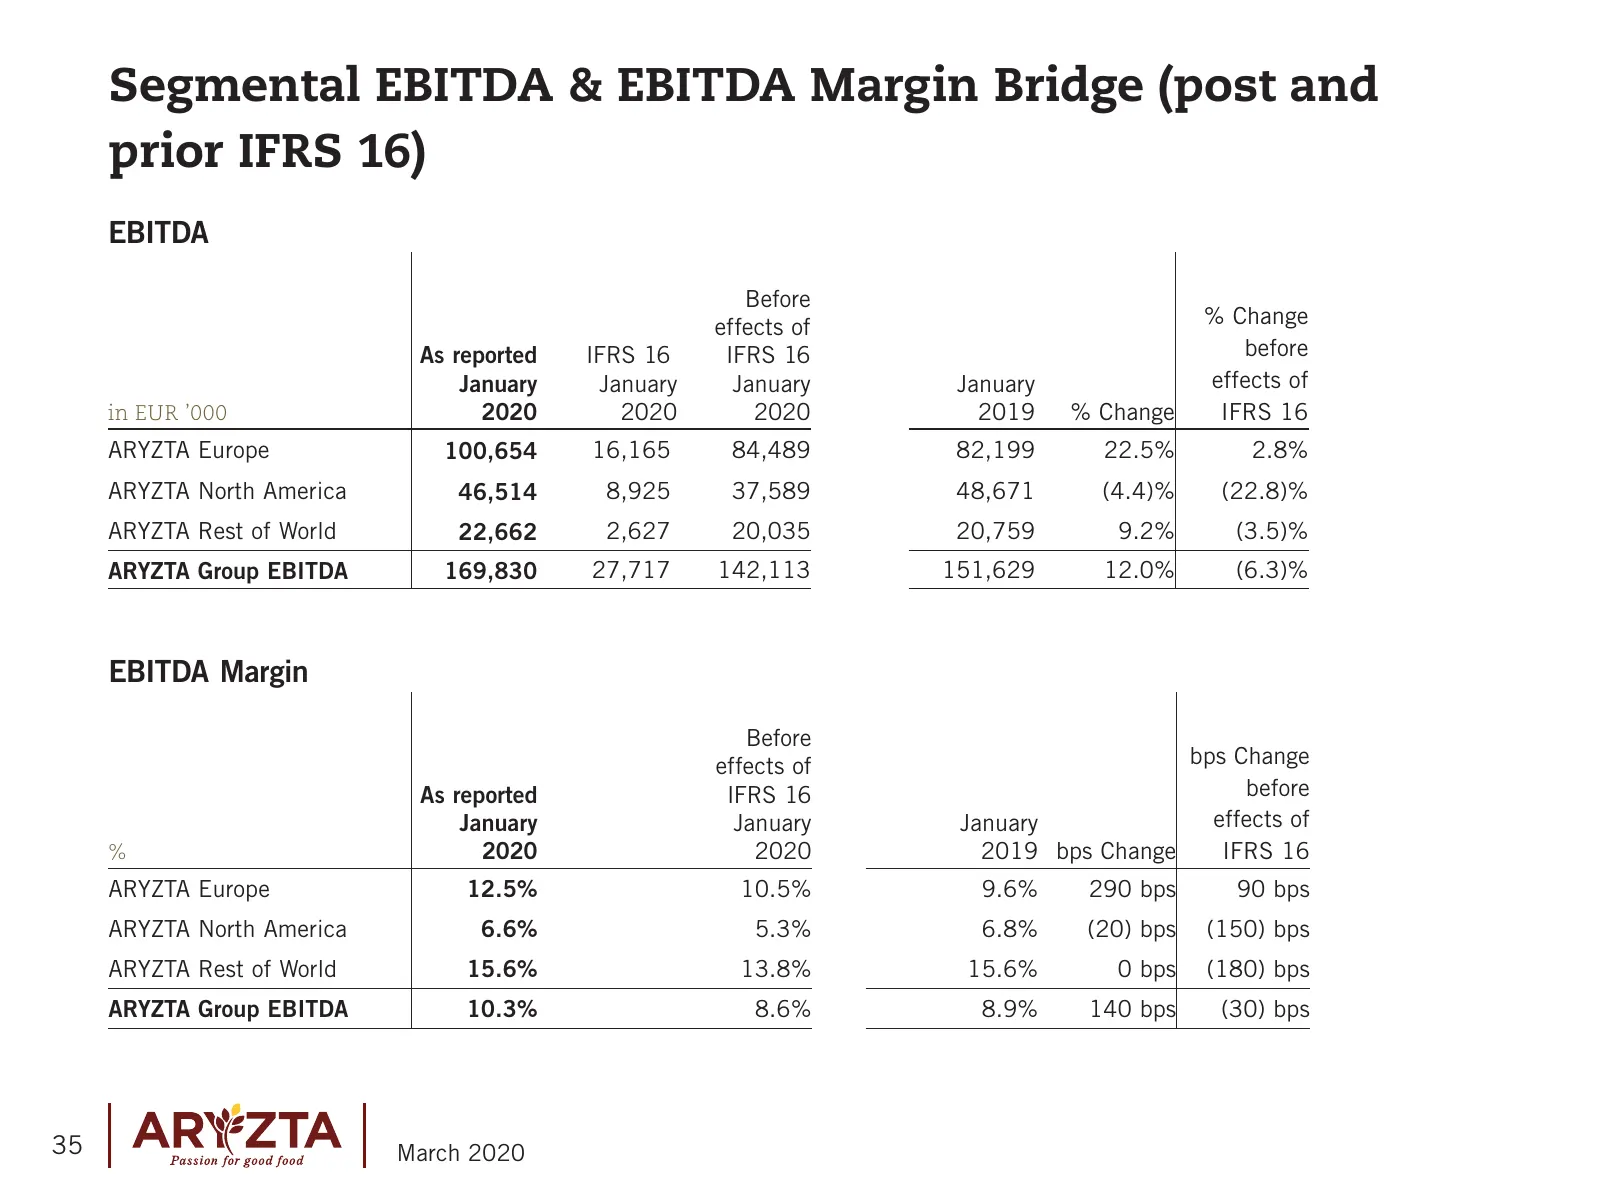
Slide 35: Segmental EBITDA & EBITDA Margin Bridge (post and prior IFRS 16)
Segmental EBITDA & EBITDA Margin Bridge (post and prior IFRS 16) EBITDA Before effects of % Change As reported IFRS 16 IFRS 16 before January January January January effects of in EUR ’000 2020 2020 2020 2019 % Change IFRS 16 ARYZTA Europe 100,654 16,165 84,489 82,199 22.5% 2.8% ARYZTA North America

Slide 36: Appendix II Financials
Appendix II Financials 36 March 2020
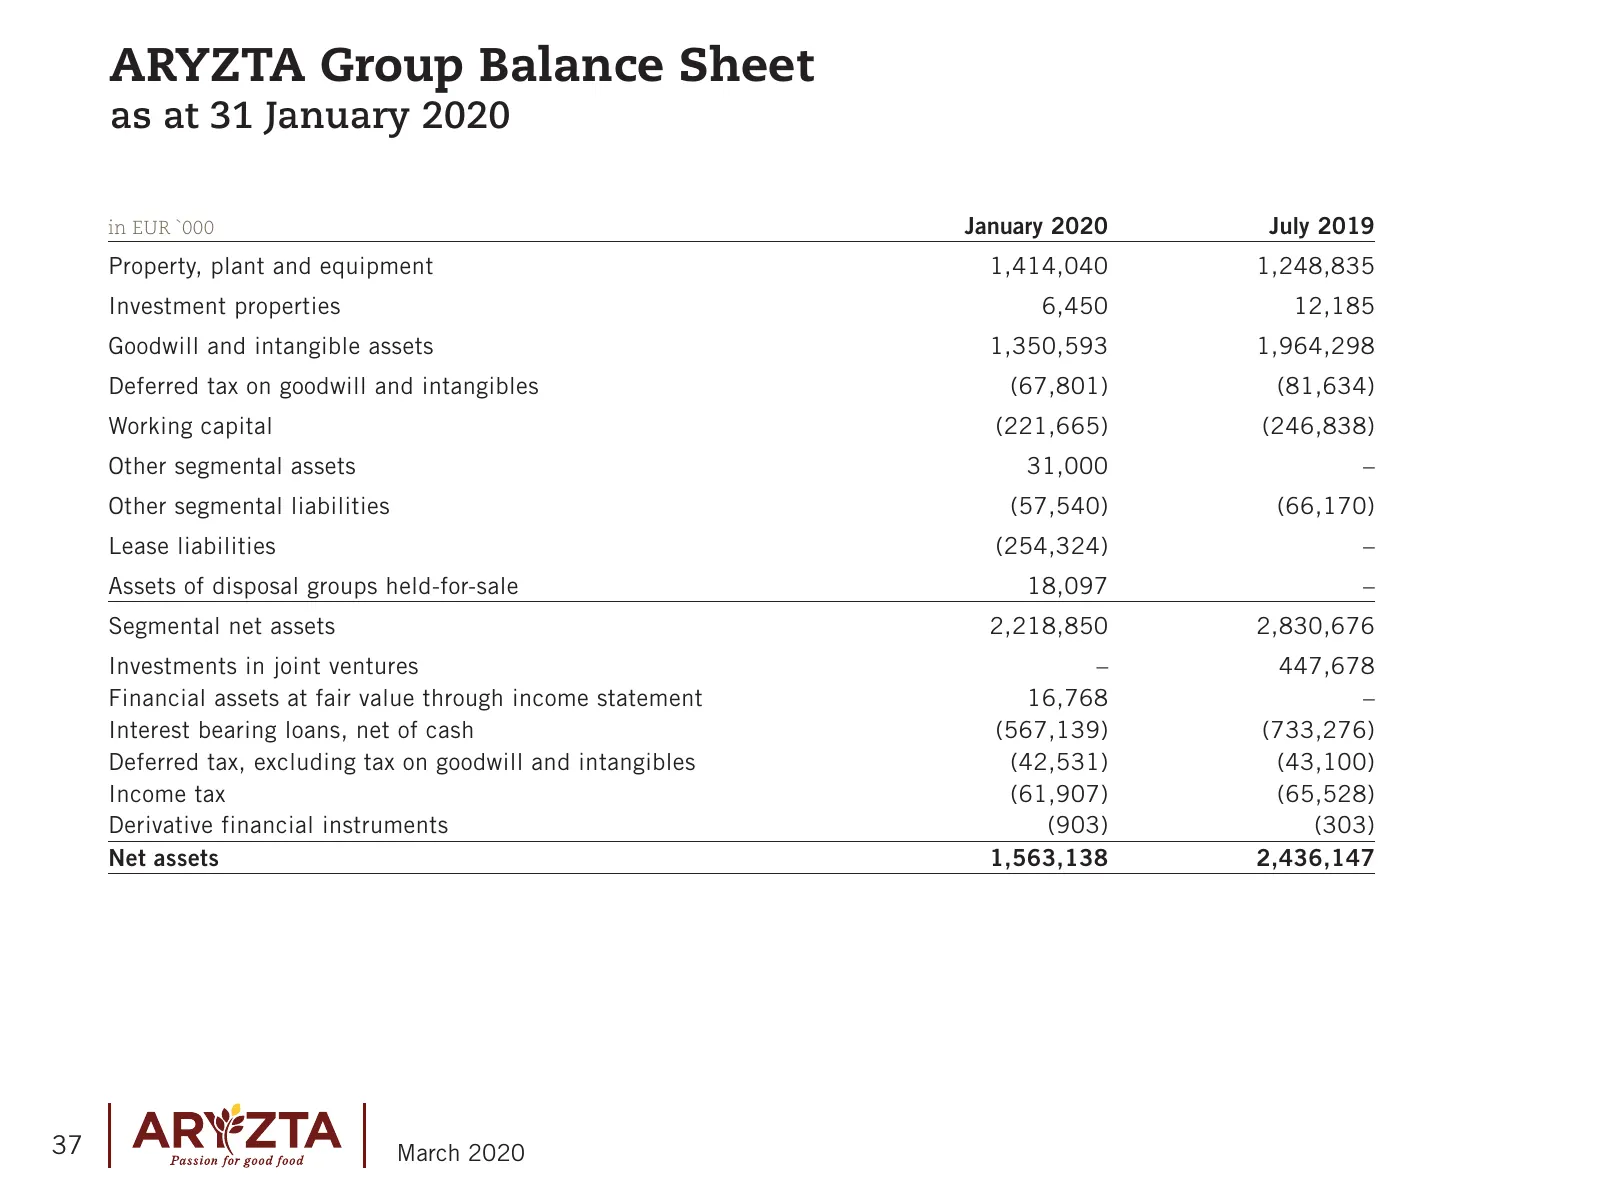
Slide 37: Group Balance Sheet
ARYZTA Group Balance Sheet as at 31 January 2020 in EUR `000 January 2020 July 2019 Property, plant and equipment 1,414,040 1,248,835 Investment properties 6,450 12,185 Goodwill and intangible assets 1,350,593 1,964,298 Deferred tax on goodwill and intangibles (67,801) (81,634) Working capital (221,
Slide 38: Group Gross Term Debt Financing Facilities and Maturities
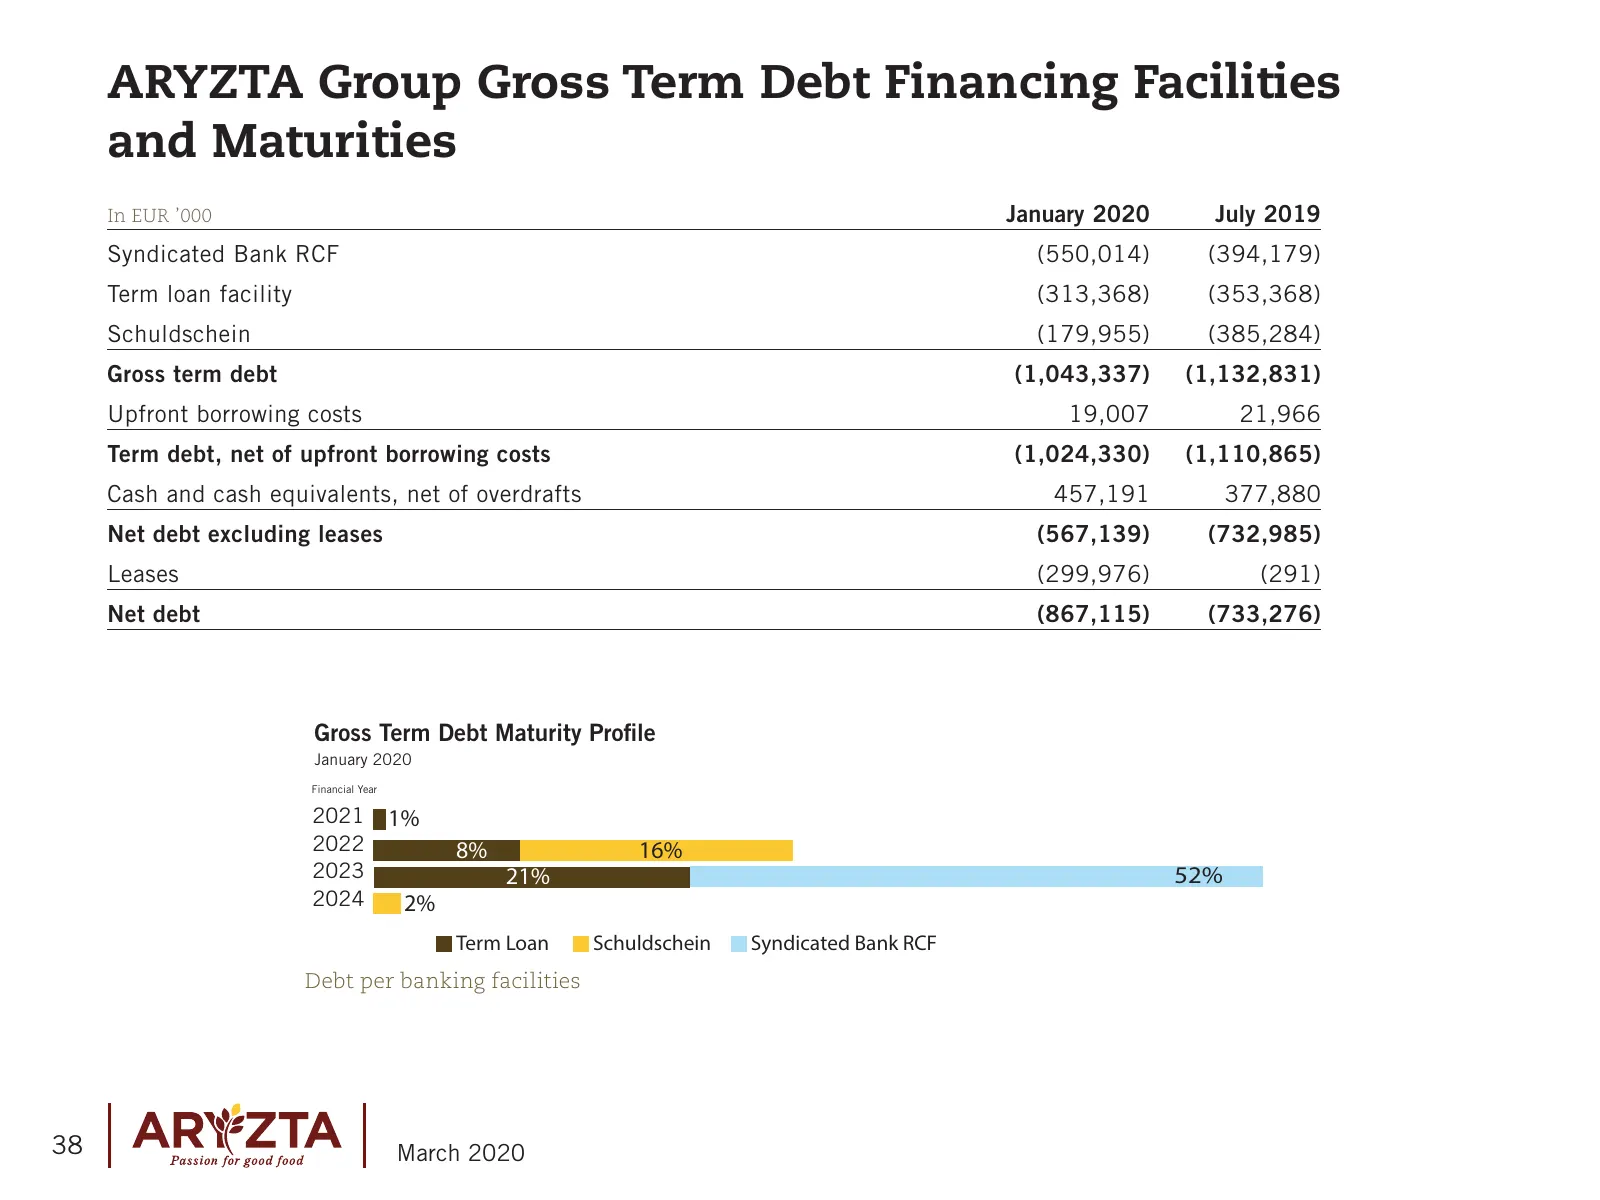
ARYZTA Group Gross Term Debt Financing Facilities and Maturities In EUR ’000 January 2020 July 2019 Syndicated Bank RCF (550,014) (394,179) Term loan facility (313,368) (353,368) Schuldschein (179,955) (385,284) Gross term debt (1,043,337) (1,132,831) Upfront borrowing costs 19,007 21,966 Term debt,
Slide 39: Hybrid Financing
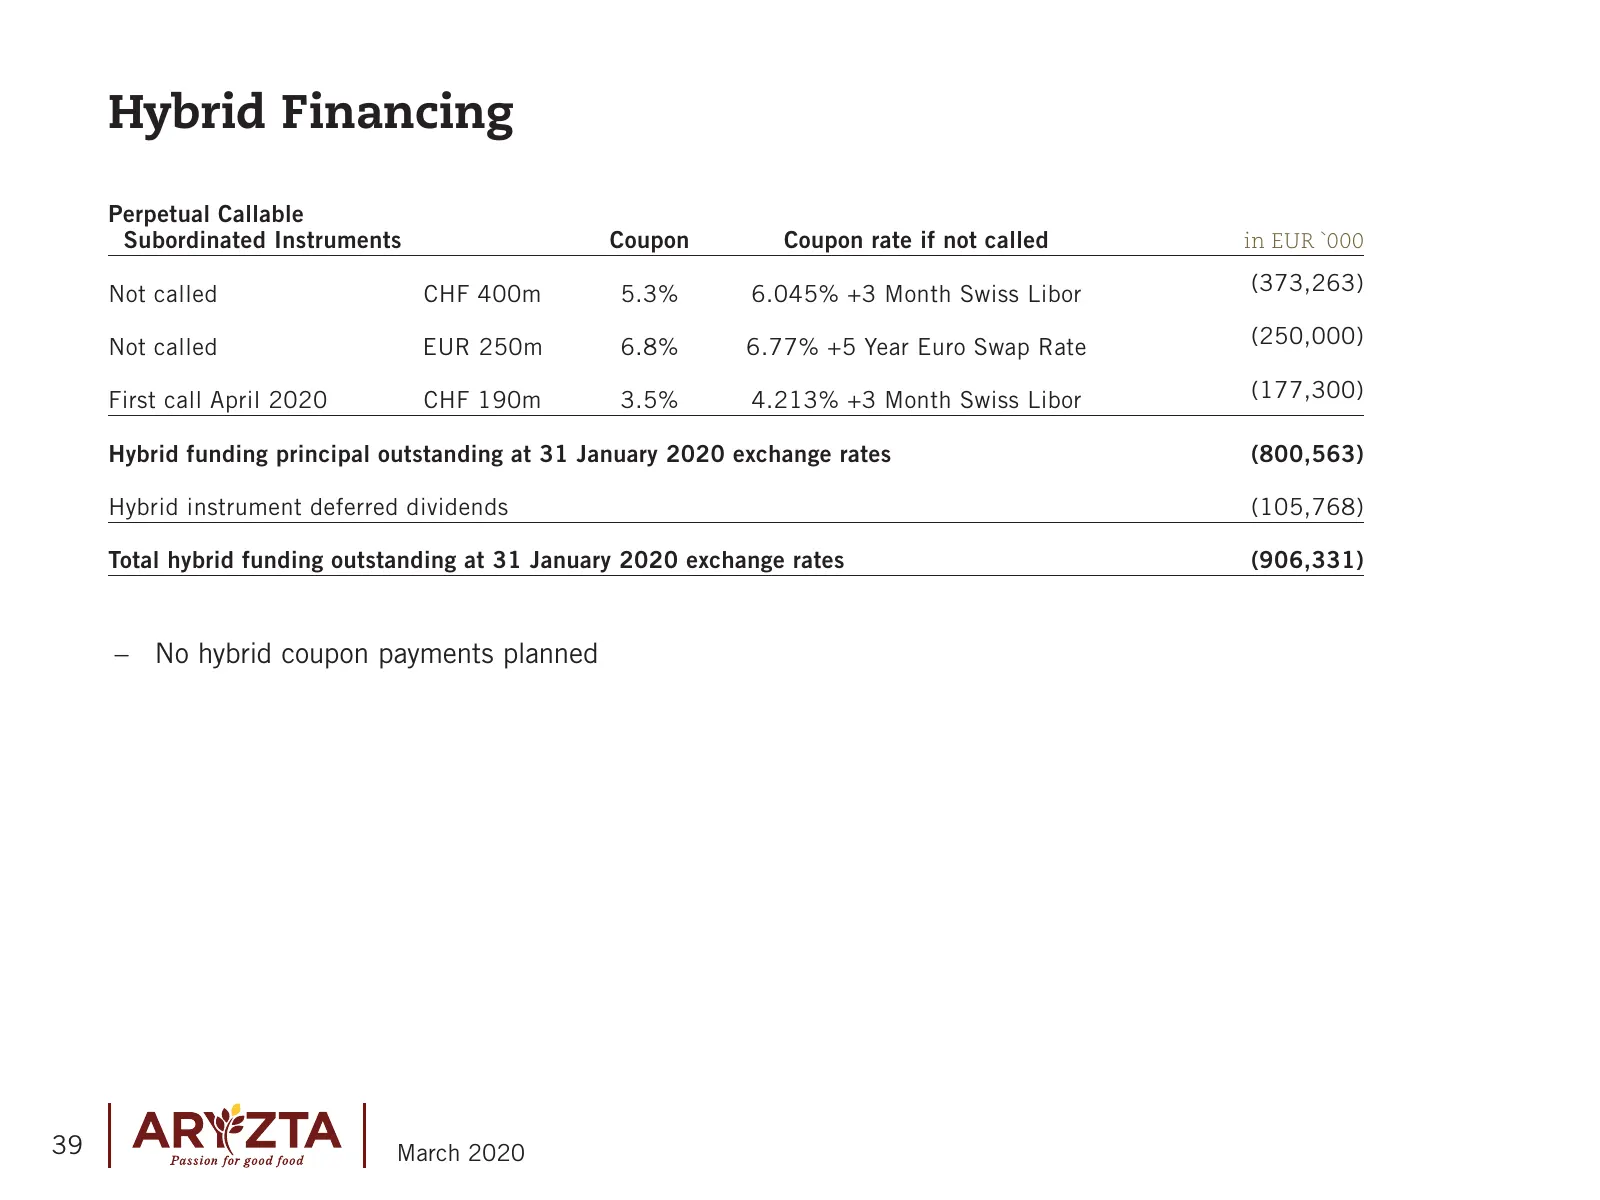
Hybrid Financing Perpetual Callable Subordinated Instruments Coupon Coupon rate if not called in EUR `000 Not called CHF 400m 5.3% 6.045% +3 Month Swiss Libor (373,263) Not called EUR 250m 6.8% 6.77% +5 Year Euro Swap Rate (250,000) First call April 2020 CHF 190m 3.5% 4.213% +3 Month Swiss Libor (17
Slide 40: Current Capital Structure
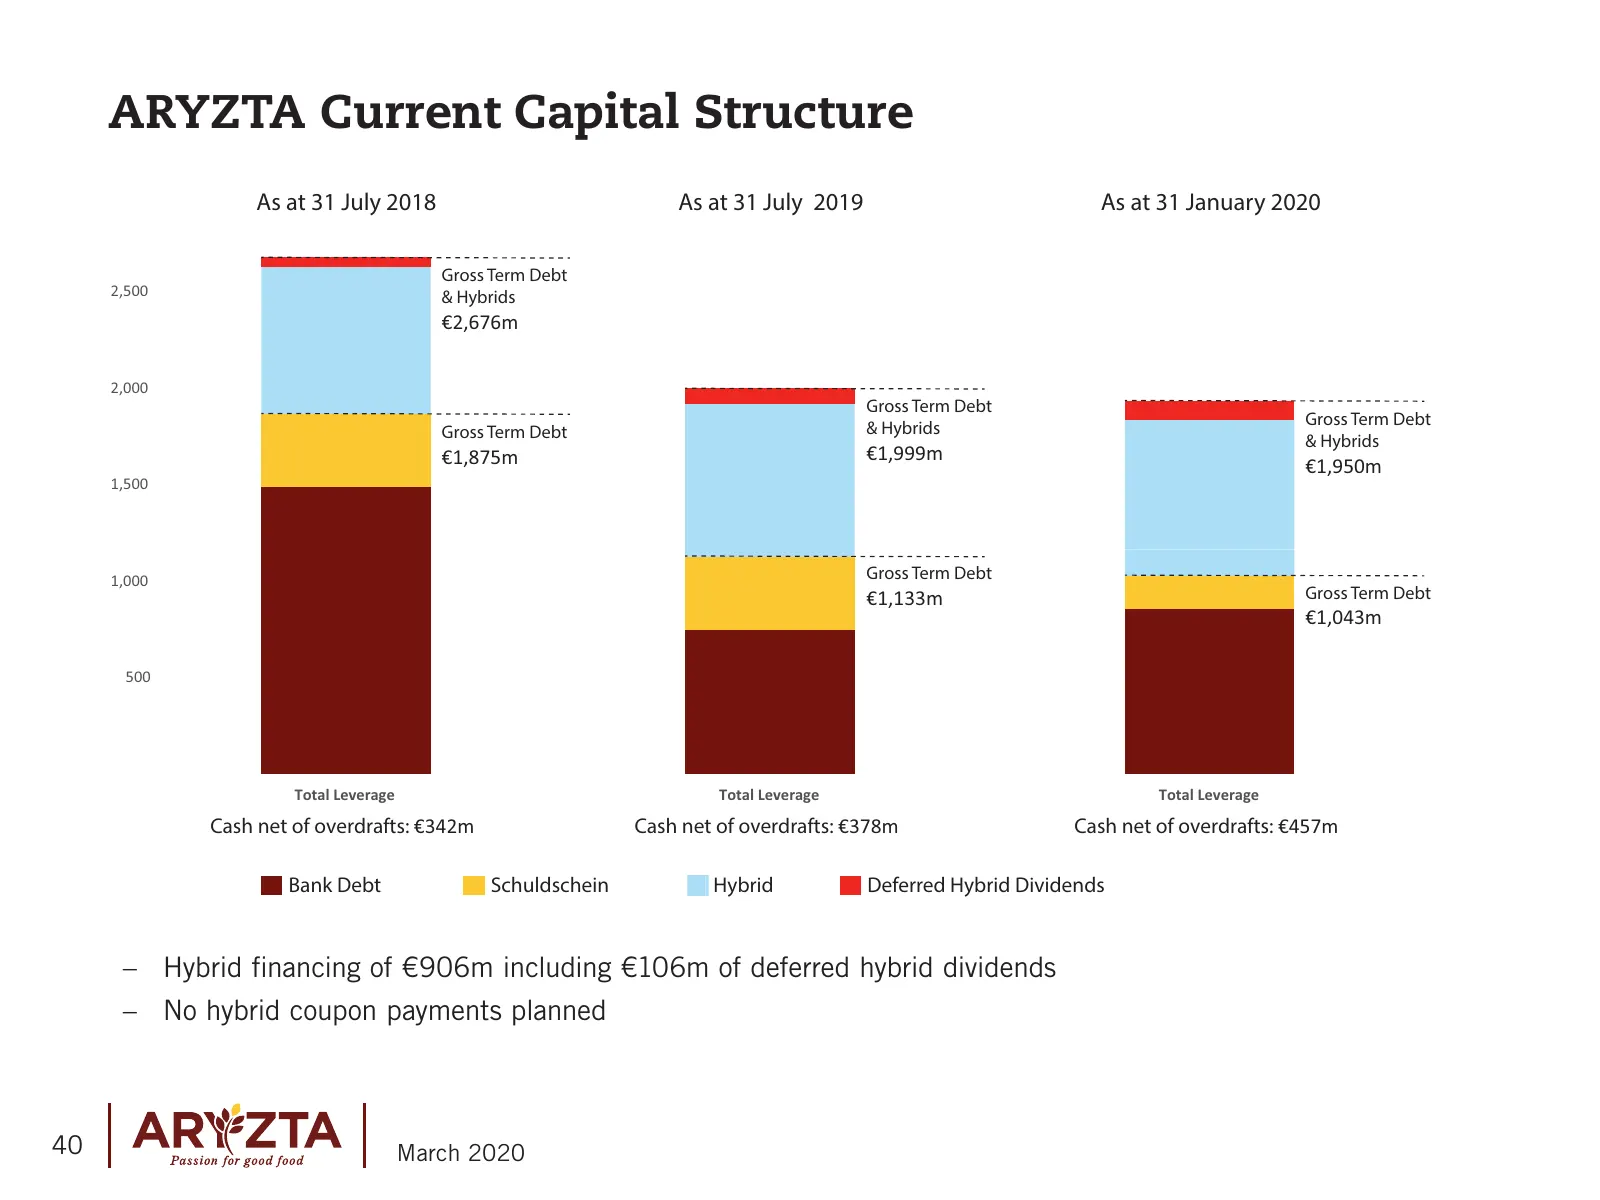
ARYZTA Current Capital Structure As at 31 July 2018 As at 31 July 2019 As at 31 January 2020 Gross Term Debt 2,500 & Hybrids €2,676m 2,000 Gross Term Debt Gross Term Debt Gross Term Debt & Hybrids & Hybrids €1,875m €1,999m €1,950m 1,500 1,000 Gross Term Debt €1,133m Gross Term Debt €1,043m 500 Total
Slide 41: Picard
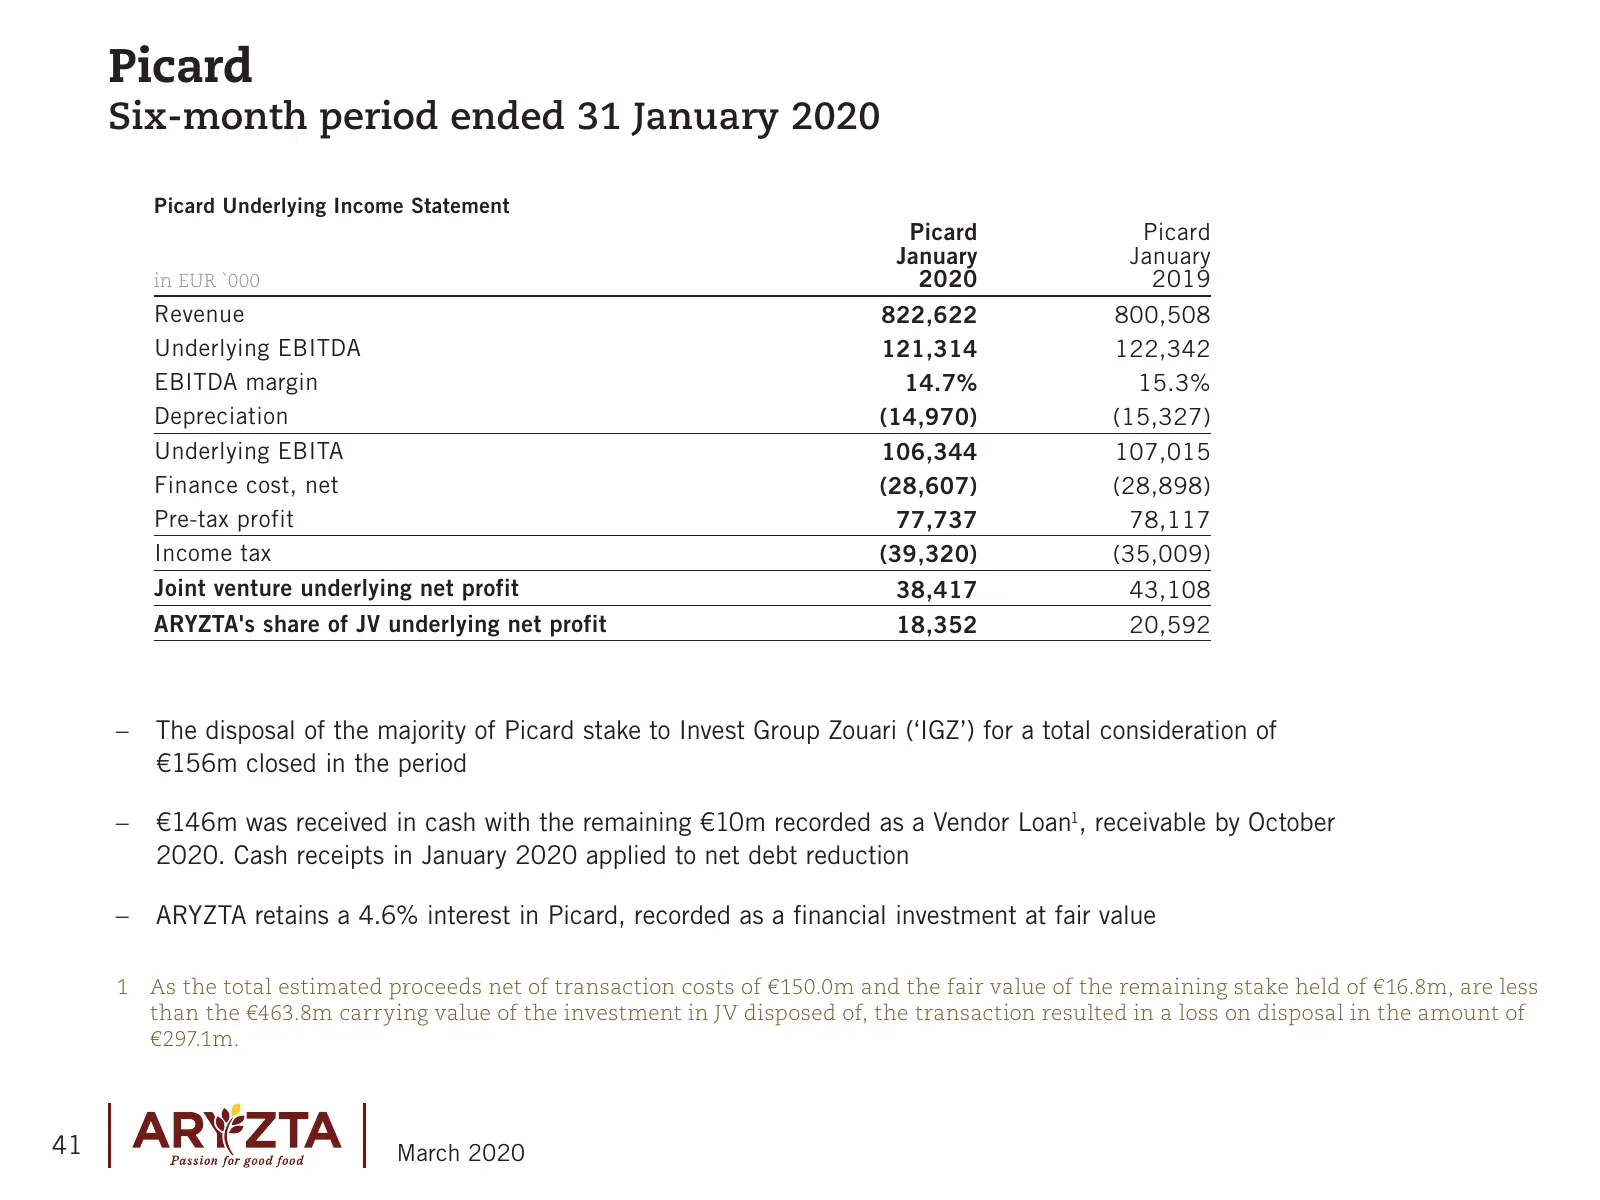
Picard Six-month period ended 31 January 2020 Picard Underlying Income Statement Picard Picard January January in EUR `000 2020 2019 Revenue 822,622 800,508 Underlying EBITDA 121,314 122,342 EBITDA margin 14.7% 15.3% Depreciation (14,970) (15,327) Underlying EBITA 106,344 107,015 Finance cost, net (
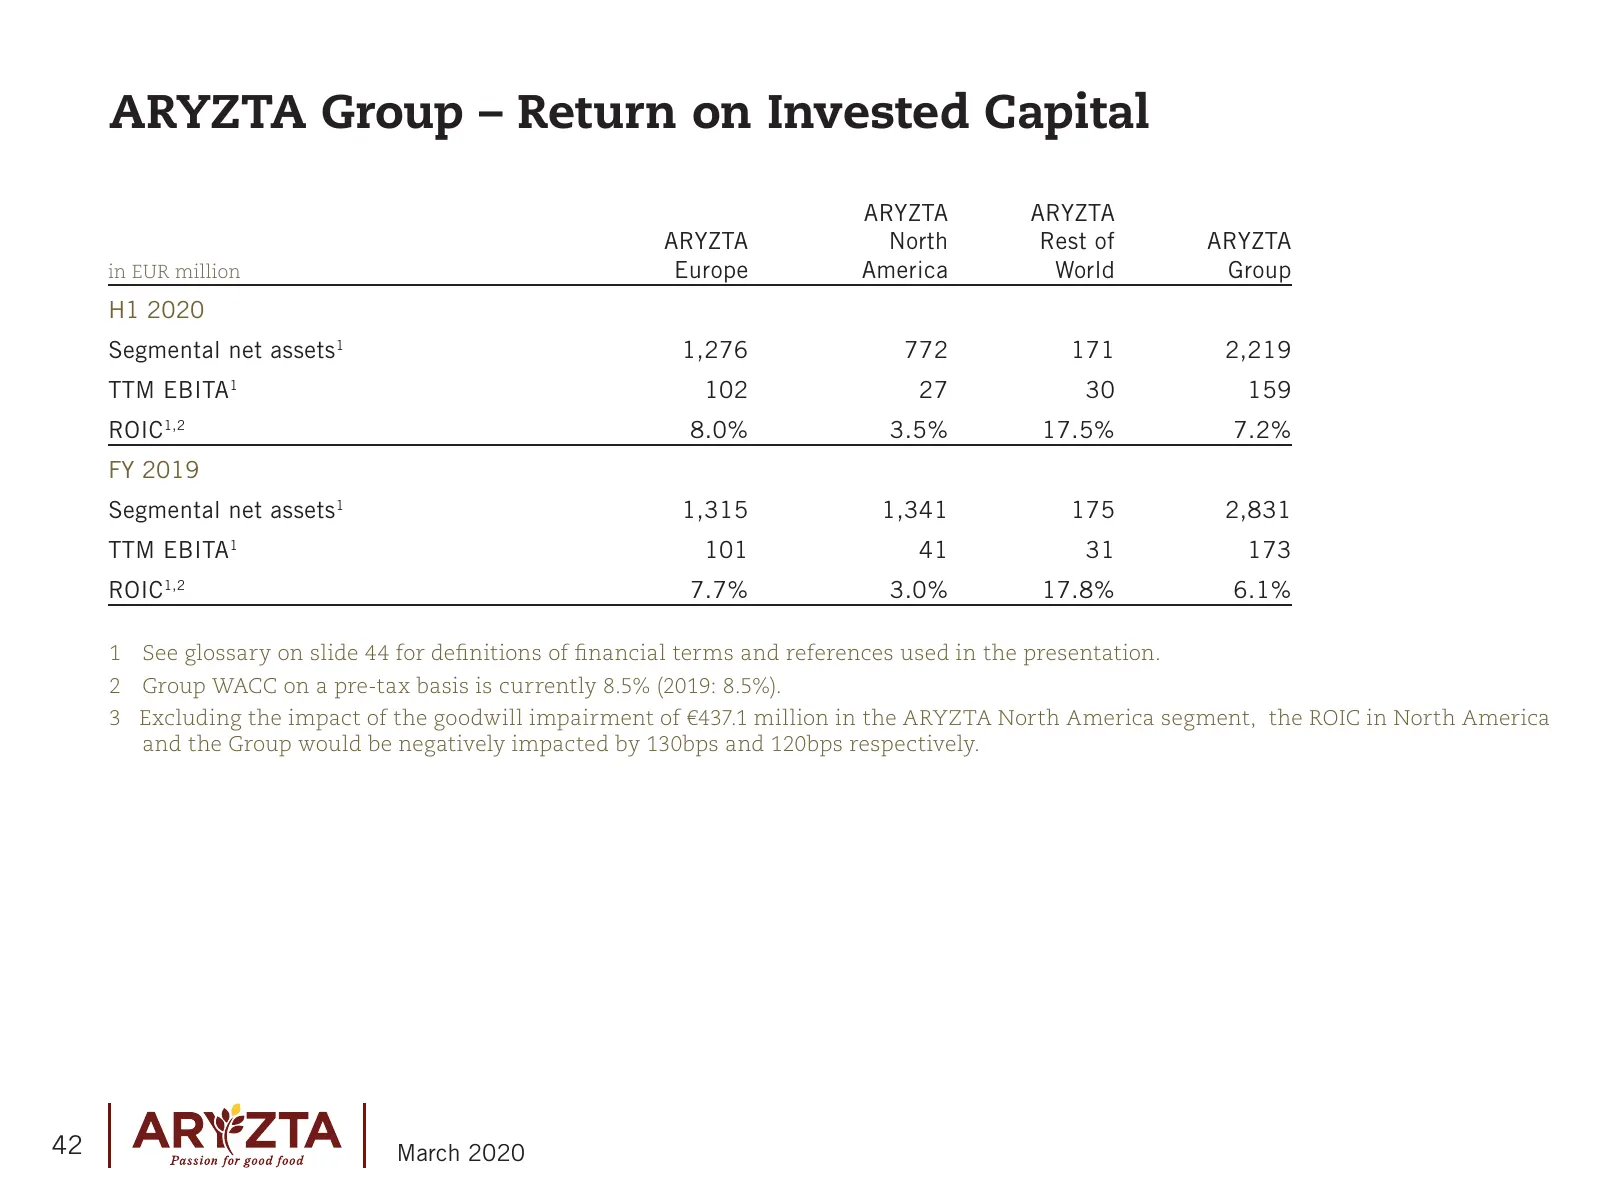
Slide 42: Group – Return on Invested Capital
ARYZTA Group – Return on Invested Capital ARYZTA ARYZTA ARYZTA North Rest of ARYZTA in EUR million Europe America World Group H1 2020 Segmental net assets1 1,276 772 171 2,219 TTM EBITA 1 102 27 30 159 ROIC 1,2 8.0% 3.5% 17.5% 7.2% FY 2019 Segmental net assets1 1,315 1,341 175 2,831 TTM EBITA 1 101
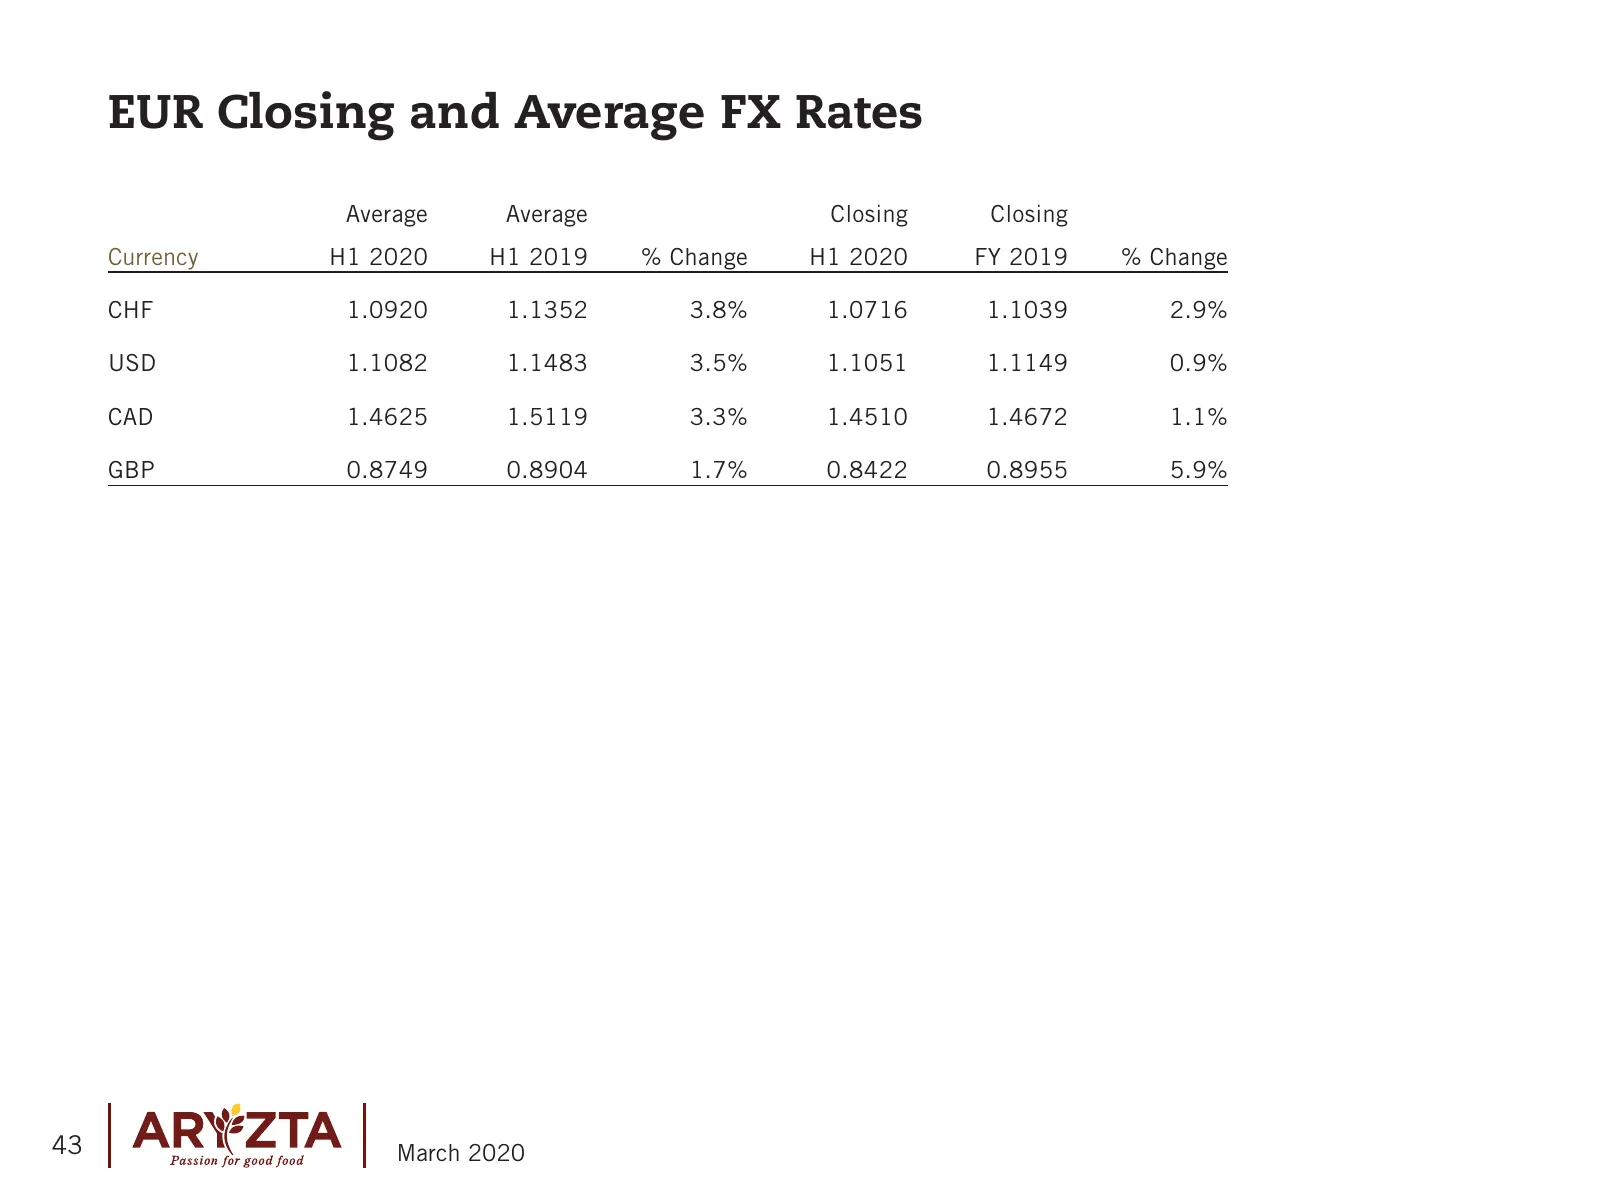
Slide 43: EUR Closing and Average FX Rates
EUR Closing and Average FX Rates Average Average Closing Closing Currency H1 2020 H1 2019 % Change H1 2020 FY 2019 % Change CHF 1.0920 1.1352 3.8% 1.0716 1.1039 2.9% USD 1.1082 1.1483 3.5% 1.1051 1.1149 0.9% CAD 1.4625 1.5119 3.3% 1.4510 1.4672 1.1% GBP 0.8749 0.8904 1.7% 0.8422 0.8955 5.9% 43 March
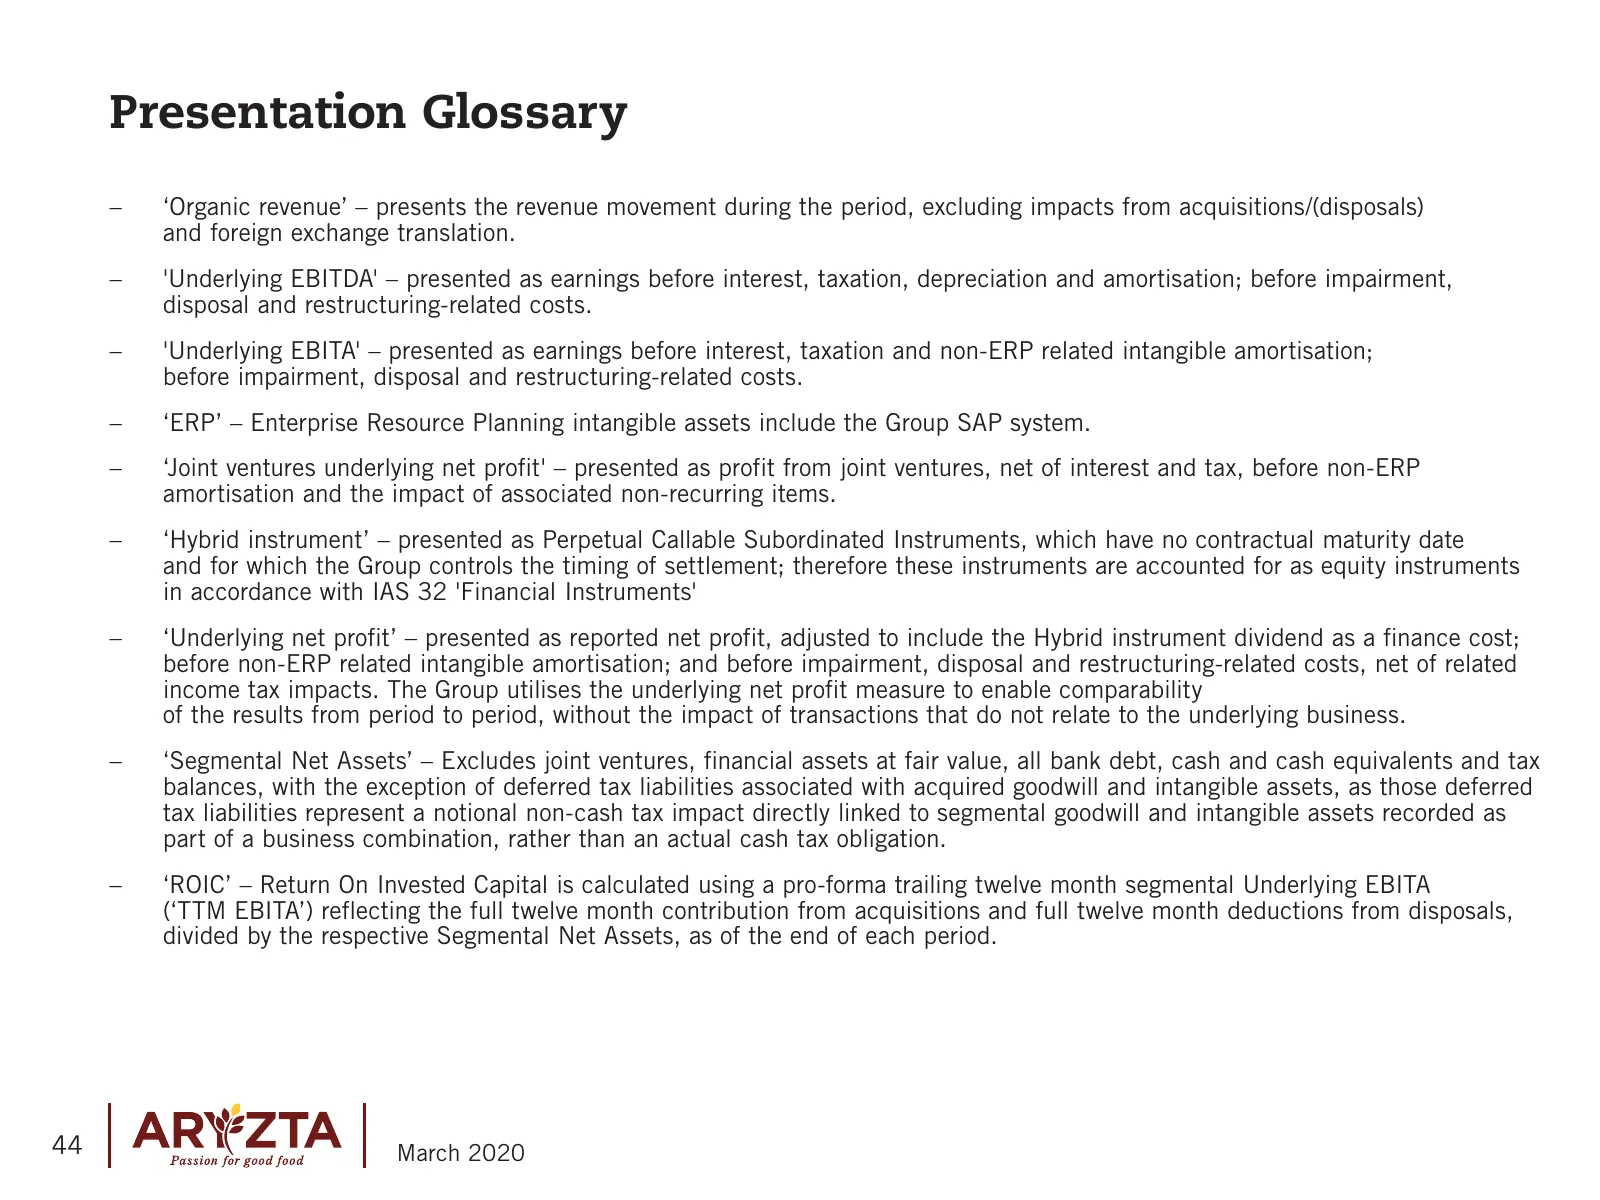
Slide 44: Presentation Glossary
Presentation Glossary –– ‘Organic revenue’ – presents the revenue movement during the period, excluding impacts from acquisitions/(disposals) and foreign exchange translation. –– 'Underlying EBITDA' – presented as earnings before interest, taxation, depreciation and amortisation; before impairment,
Source: Internet Archive copy of aryzta.com
More decks from Aryzta AG
 H1 2026 Earnings Presentation32 slides · Aug 10, 2026
 FY2025 Earnings Presentation7 slides · Jan 22, 2026
 Q3 2025 Earnings Presentation15 slides · Oct 20, 2025
 H1 2025 Earnings Presentation34 slides · Aug 11, 2025
 Investor Day (May 2025)48 slides · May 7, 2025
 Q1 2025 Earnings Presentation35 slides · Mar 2, 2025