ALTERRA CAPITAL — Max Capital Group — Investor Day (February 2008)
64 slides from ALTERRA CAPITAL's investor day presentation, Feb 22, 2008
Slide 1: Max Capital Group Ltd. Investor Day Presentation
EXHIBIT 99.1 MAX CAPITAL GROUP LTD. Nasdaq: MXGL Investor Day Presentation INSURANCE / REINSURANCE February 22, 2008 BERMUDA IRELAND UNITED STATES
Slide 2: Information Concerning Forward Looking Statements
INFORMATION CONCERNING FORWARD LOOKING STATEMENTS This presentation includes statements about future economic performance, finances, expectations, plans and prospects of the Company that constitute forward-looking statements for purposes of the safe harbor provisions of the Private Securities Litiga
Slide 3: Investor Day Overview
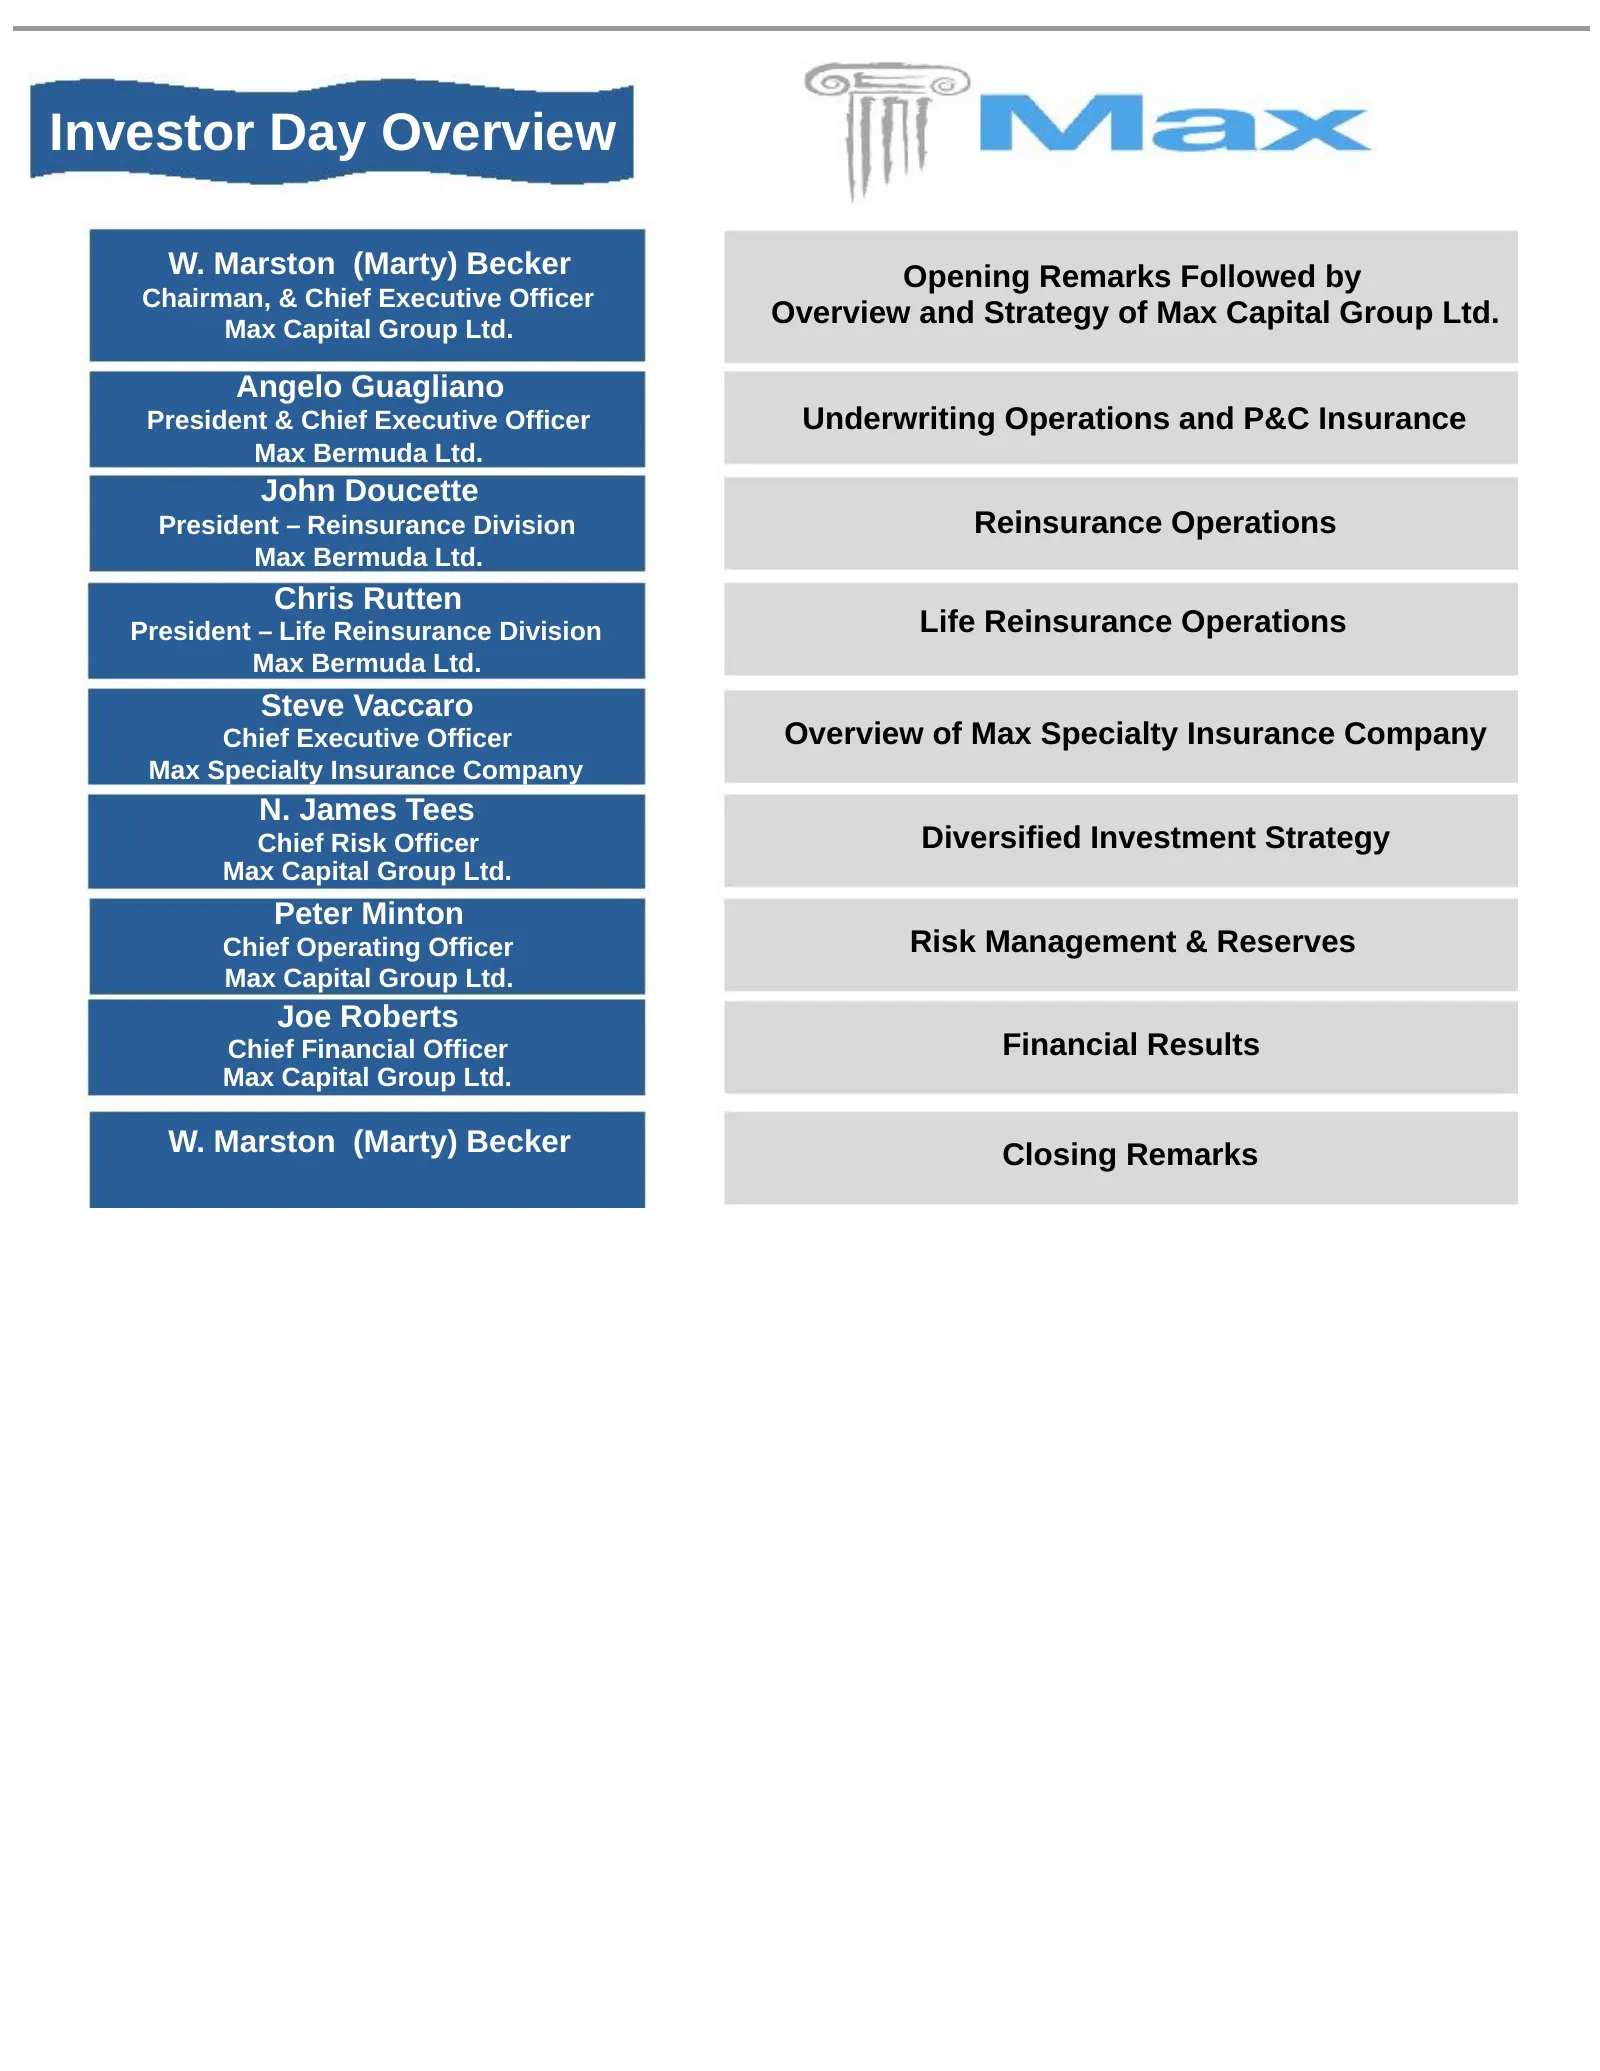
Investor Day Overview W. Marston (Marty) Becker Opening Remarks Followed by Chairman, & Chief Executive Officer Max Capital Group Ltd. Overview and Strategy of Max Capital Group Ltd. Angelo Guagliano President & Chief Executive Officer Underwriting Operations and P&C Insurance Max Bermuda Ltd. John
Slide 4: Max Capital Today
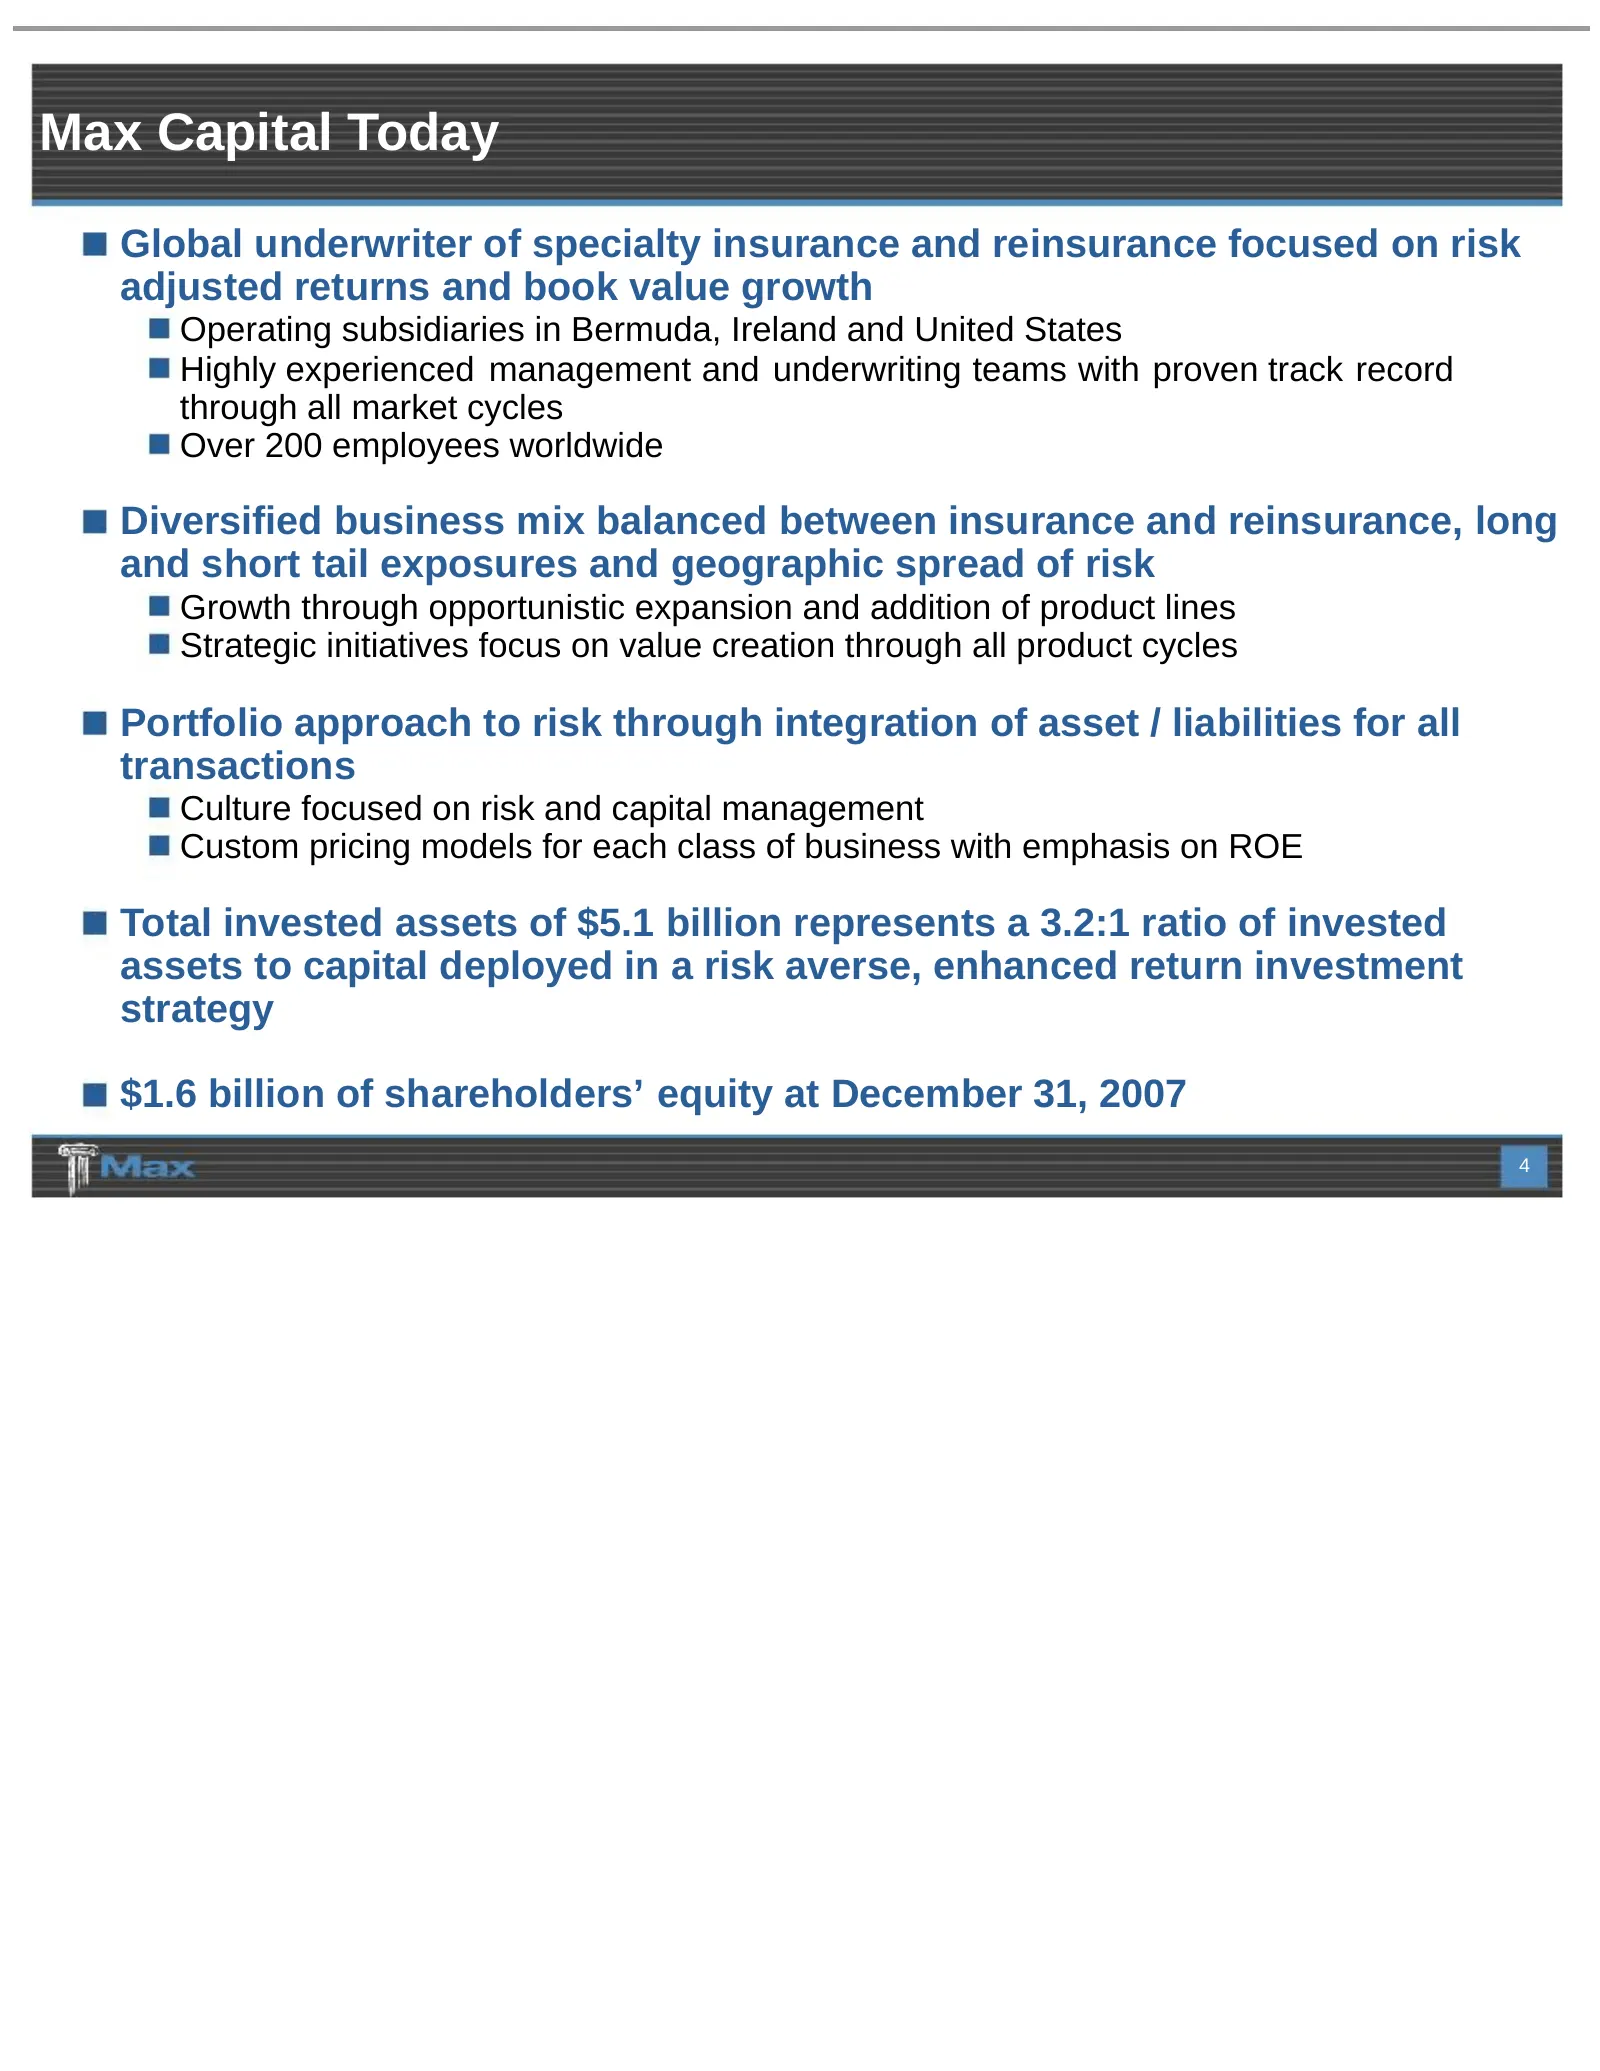
Max Capital Today Global underwriter of specialty insurance and reinsurance focused on risk adjusted returns and book value growth Operating subsidiaries in Bermuda, Ireland and United States Highly experienced management and underwriting teams with proven track record through all market cycles Over
Slide 5: Winning in A Softening Market
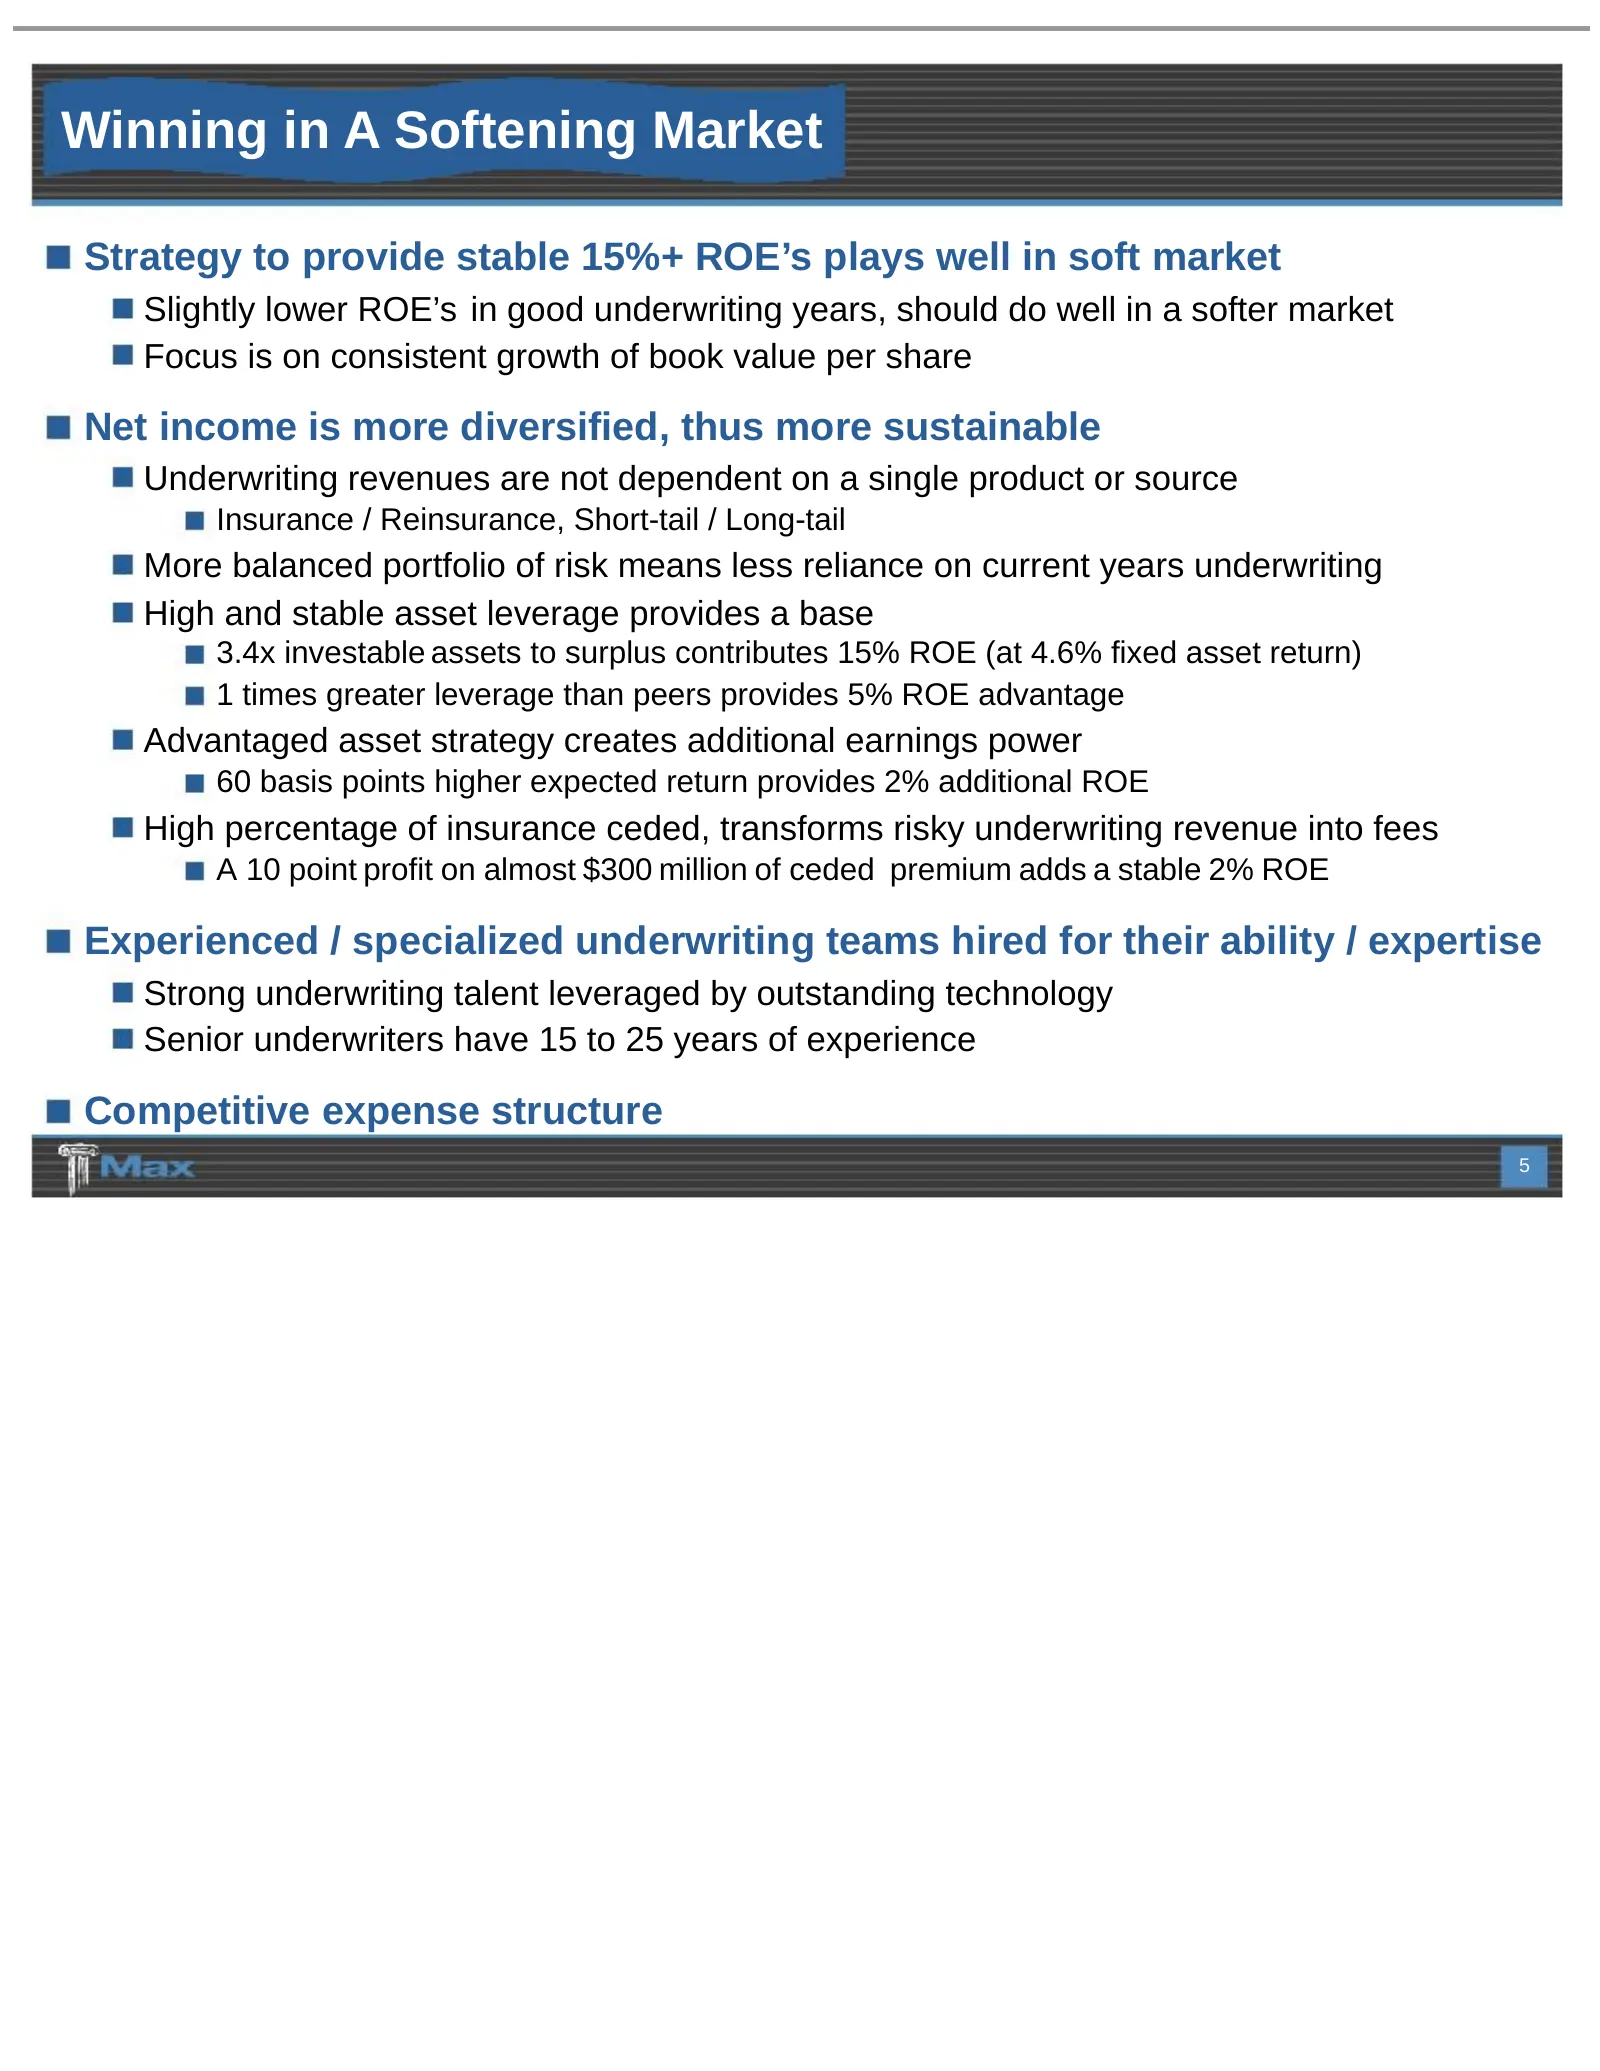
Winning in A Softening Market Strategy to provide stable 15%+ ROE’s plays well in soft market Slightly lower ROE’s in good underwriting years, should do well in a softer market Focus is on consistent growth of book value per share Net income is more diversified, thus more sustainable Underwriting re
Slide 6: Straightforward, Well Capitalized Operating Entities
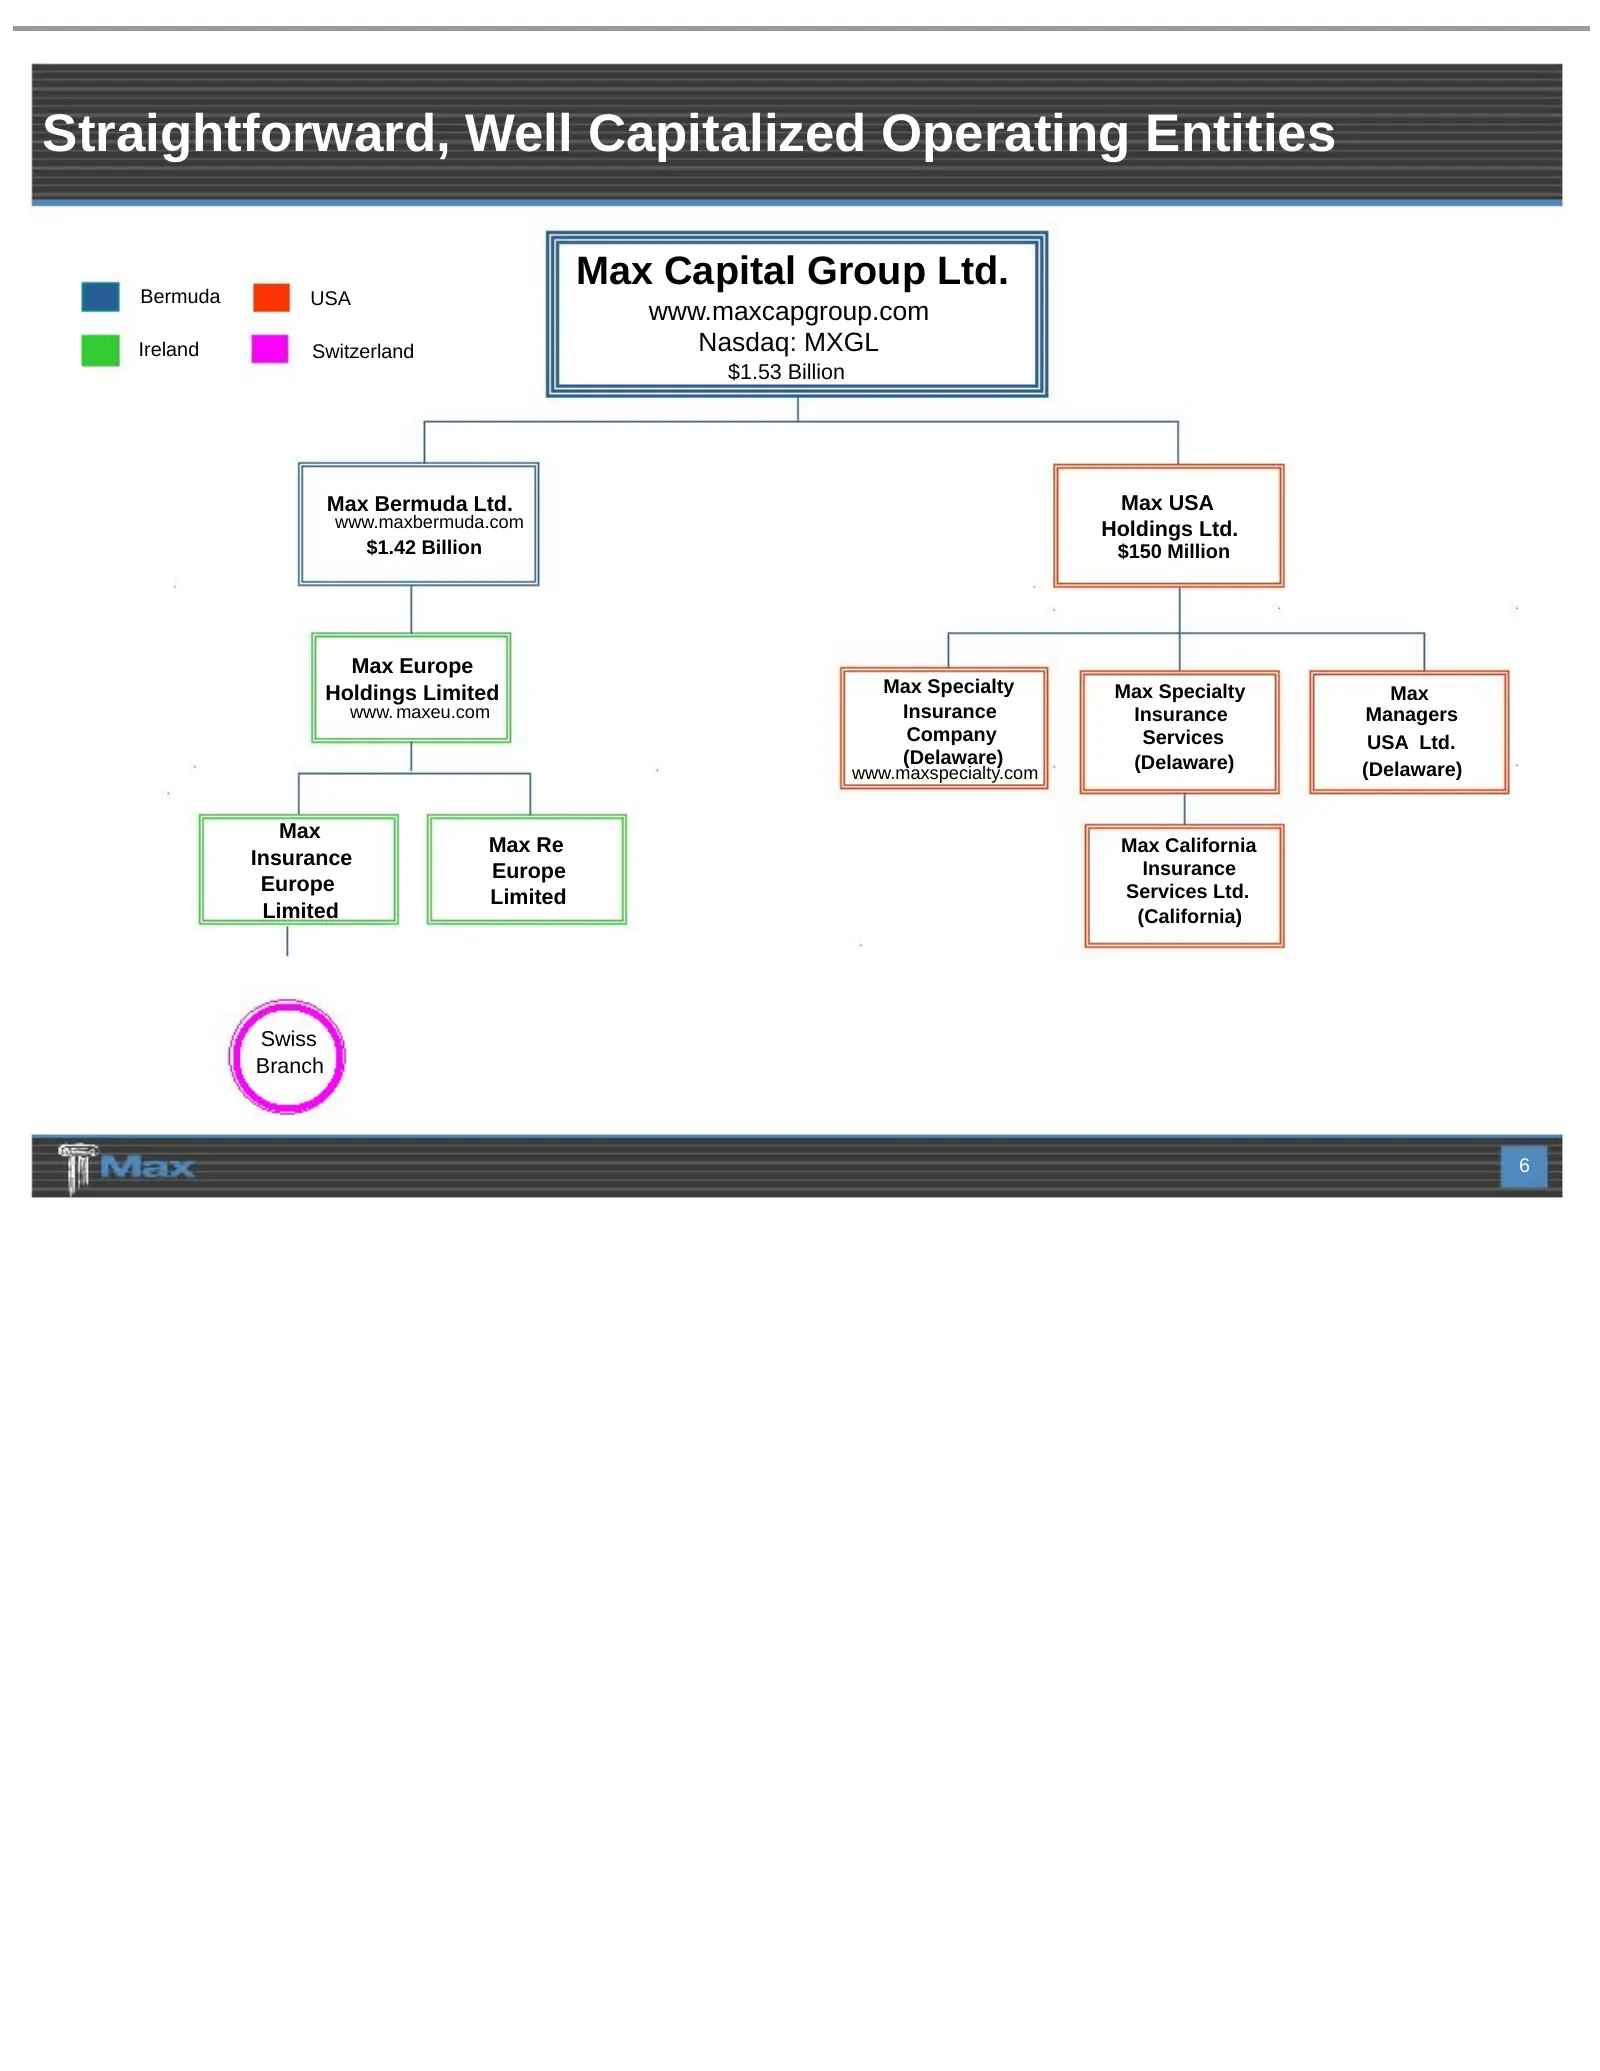
Straightforward, Well Capitalized Operating Entities Bermuda Max Capital Group Ltd. USA www.maxcapgroup.com Ireland Switzerland Nasdaq: MXGL $1.53 Billion Max Bermuda Ltd. Max USA www.maxbermuda.com Holdings Ltd. $1.42 Billion $150 Million Max Europe Holdings Limited Max Specialty Max Specialty Max
Slide 7: Experienced Management Team
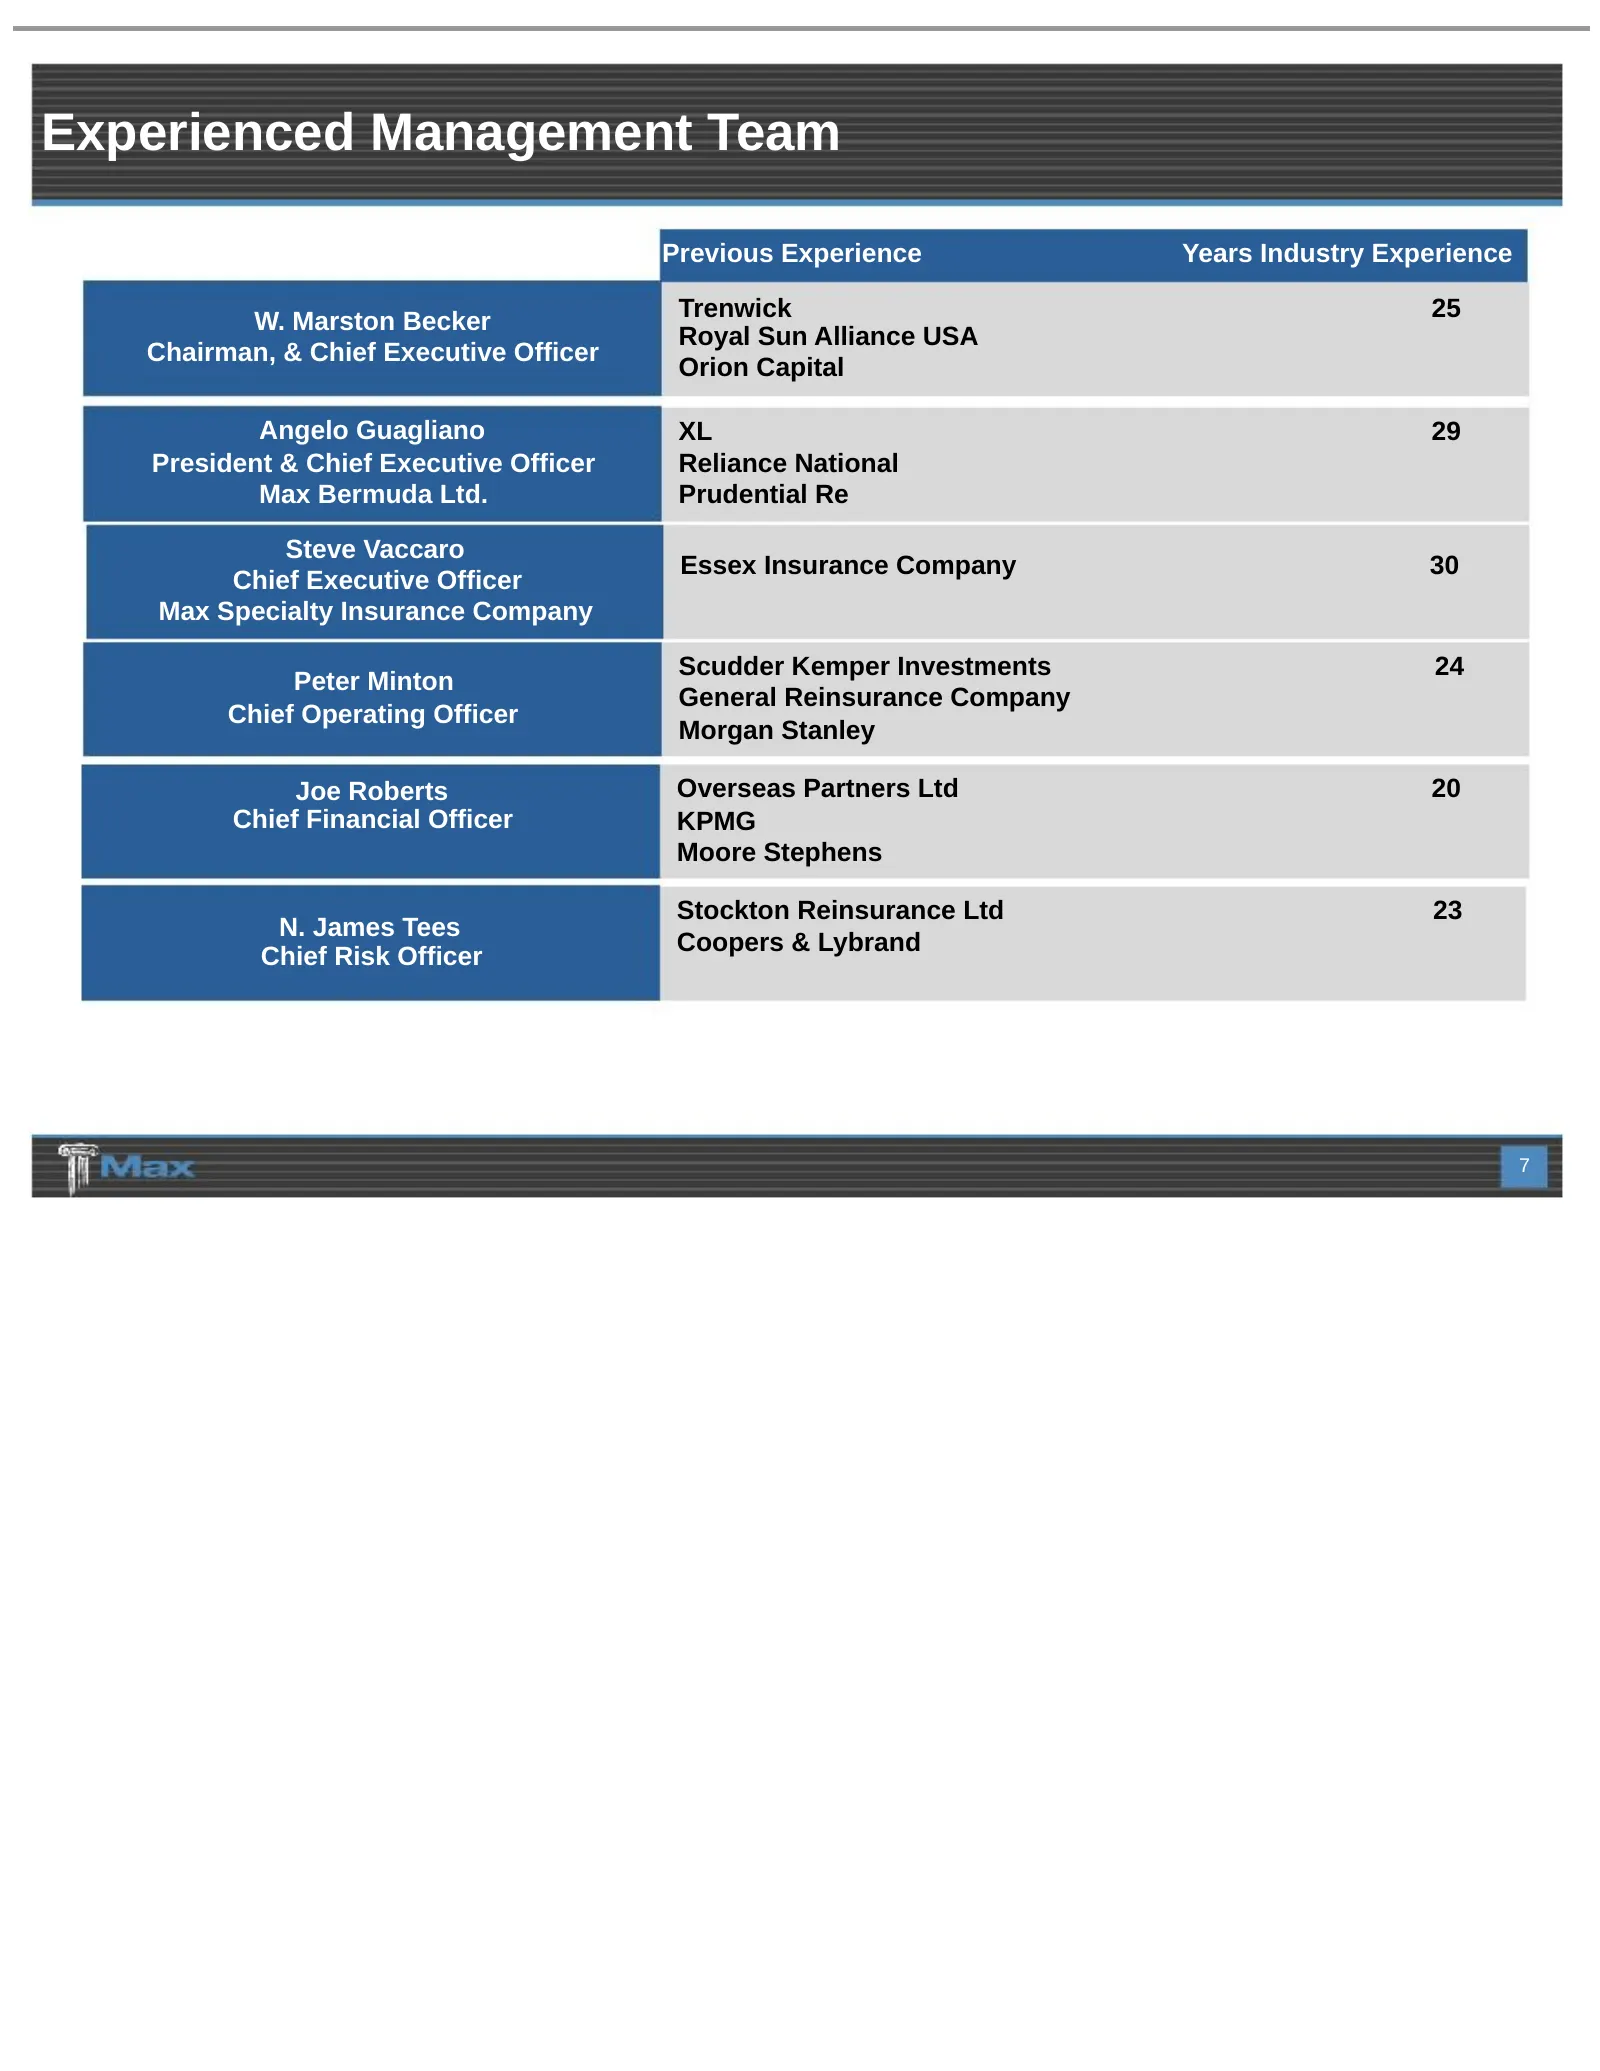
Experienced Management Team Previous Experience Years Industry Experience W. Marston Becker Trenwick 25 Royal Sun Alliance USA Chairman, & Chief Executive Officer Orion Capital Angelo Guagliano XL 29 President & Chief Executive Officer Reliance National Max Bermuda Ltd. Prudential Re Steve Vaccaro E
Slide 8: Strategic Diversification & Expansion Of The Company
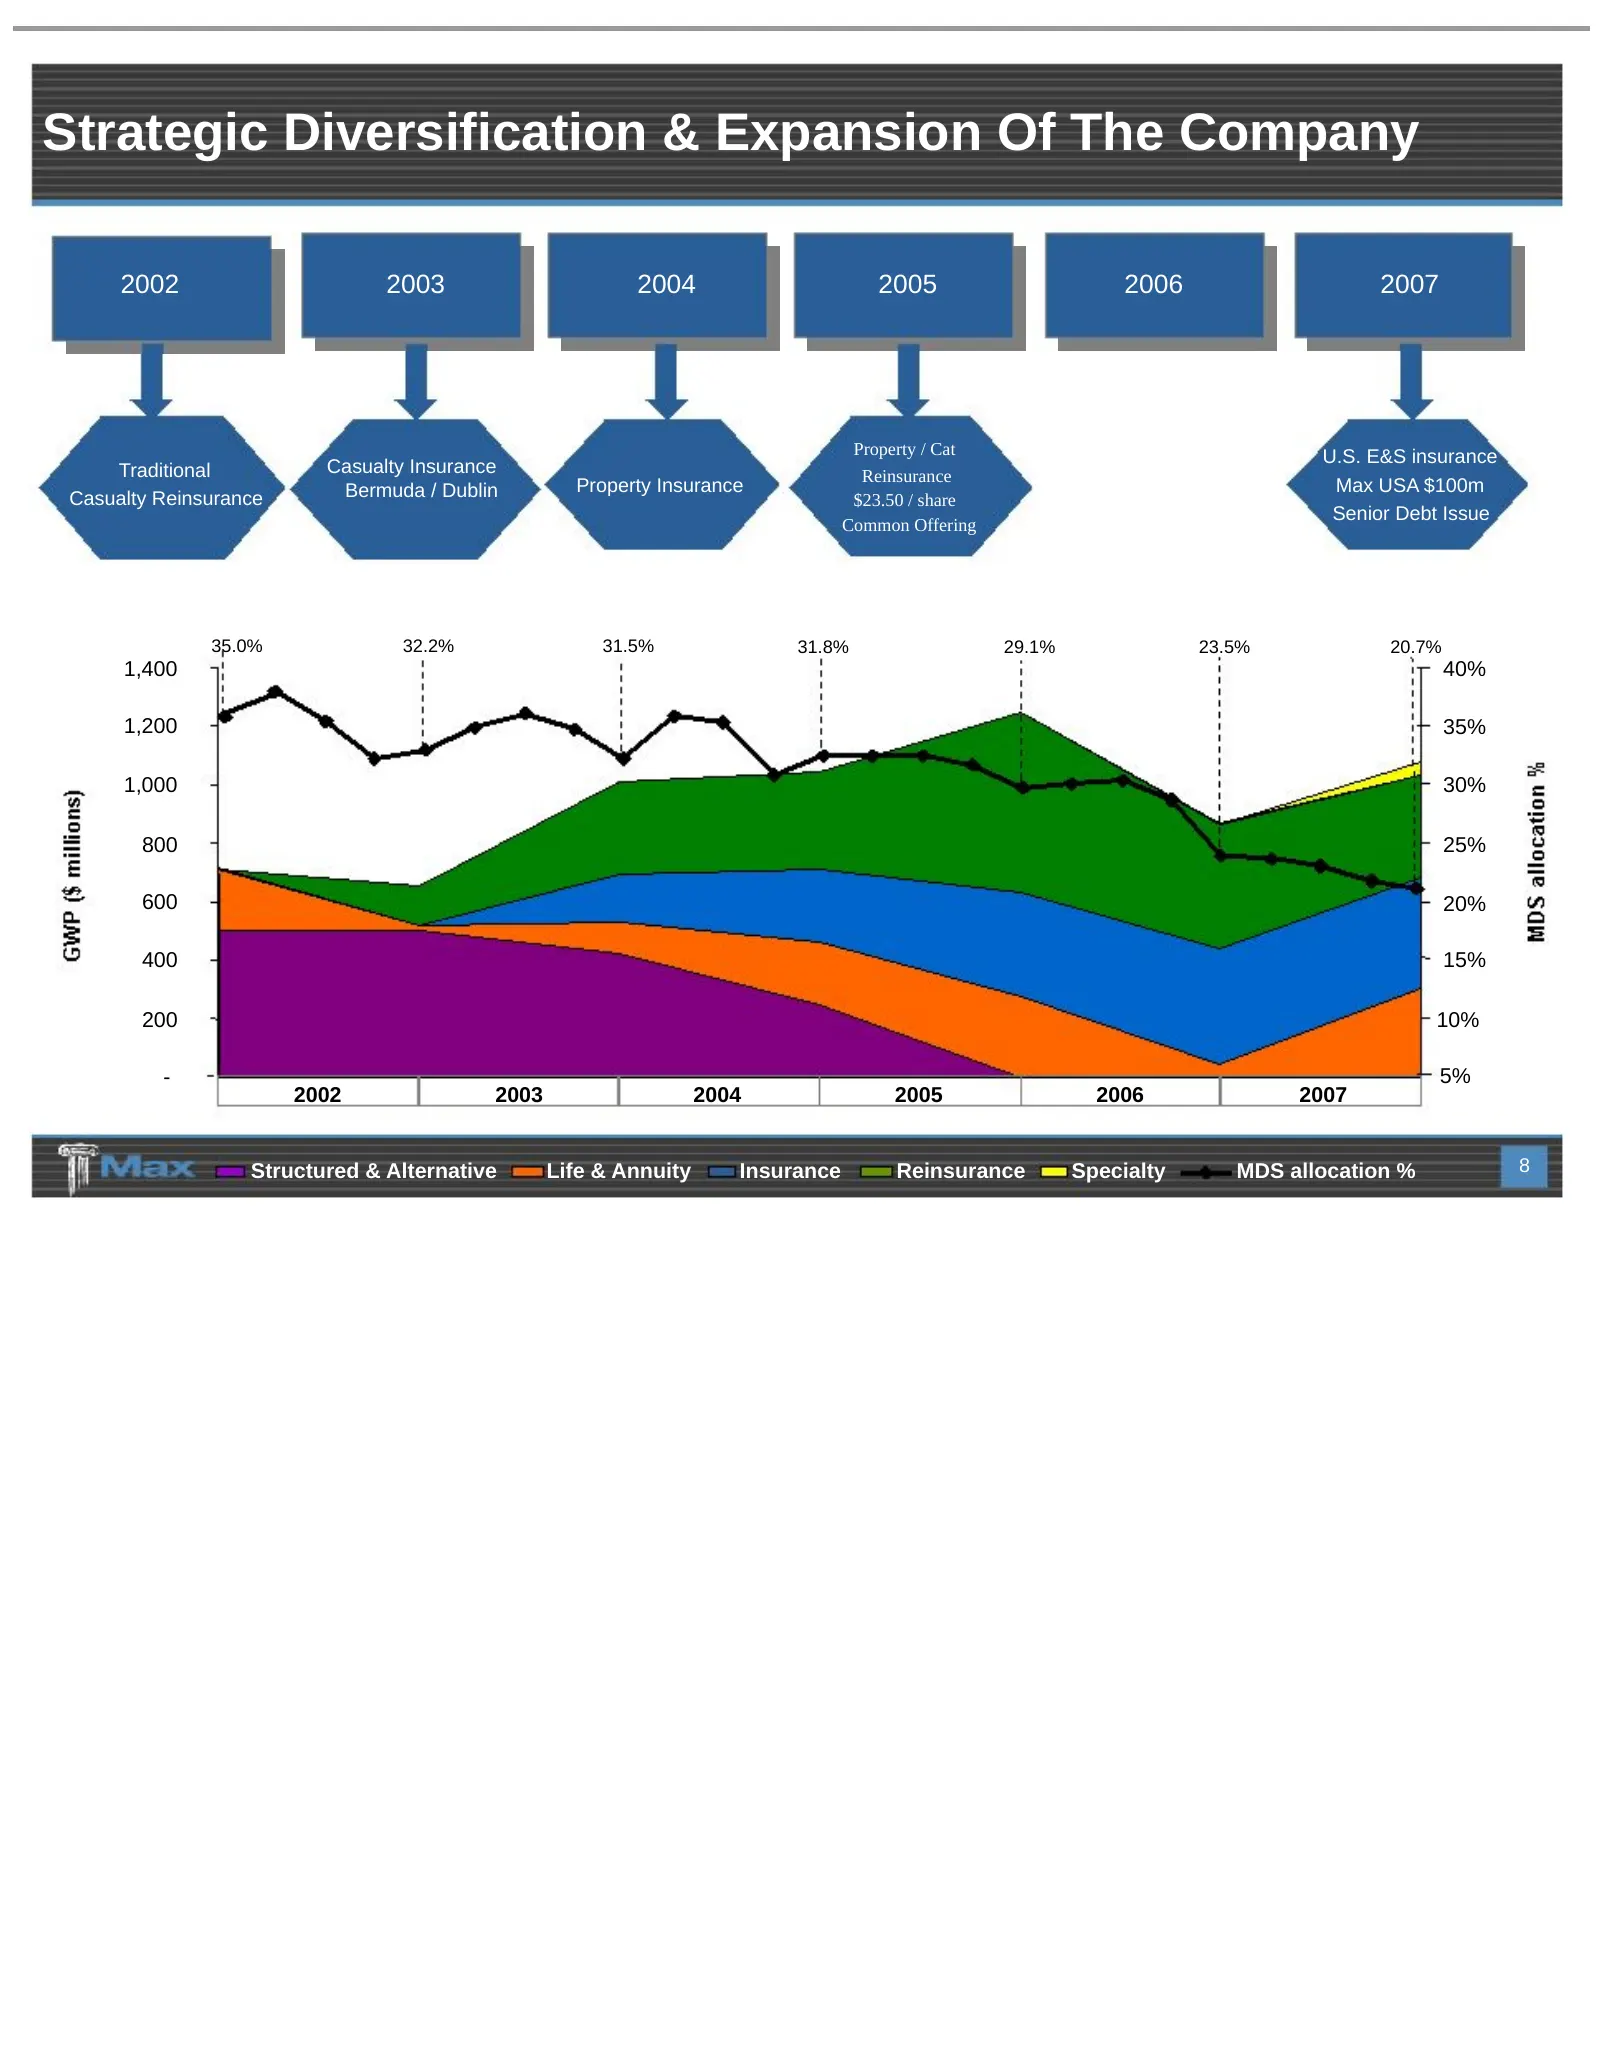
Strategic Diversification & Expansion Of The Company 2002 2003 2004 2005 2006 2007 Property / Cat U.S. E&S insurance Traditional Casualty Insurance Reinsurance Bermuda / Dublin Property Insurance Max USA $100m Casualty Reinsurance $23.50 / share Senior Debt Issue Common Offering Property / Cat Reins
Slide 9: Identifying & Recruiting Franchise Players Has Been Instrumental In Our Success
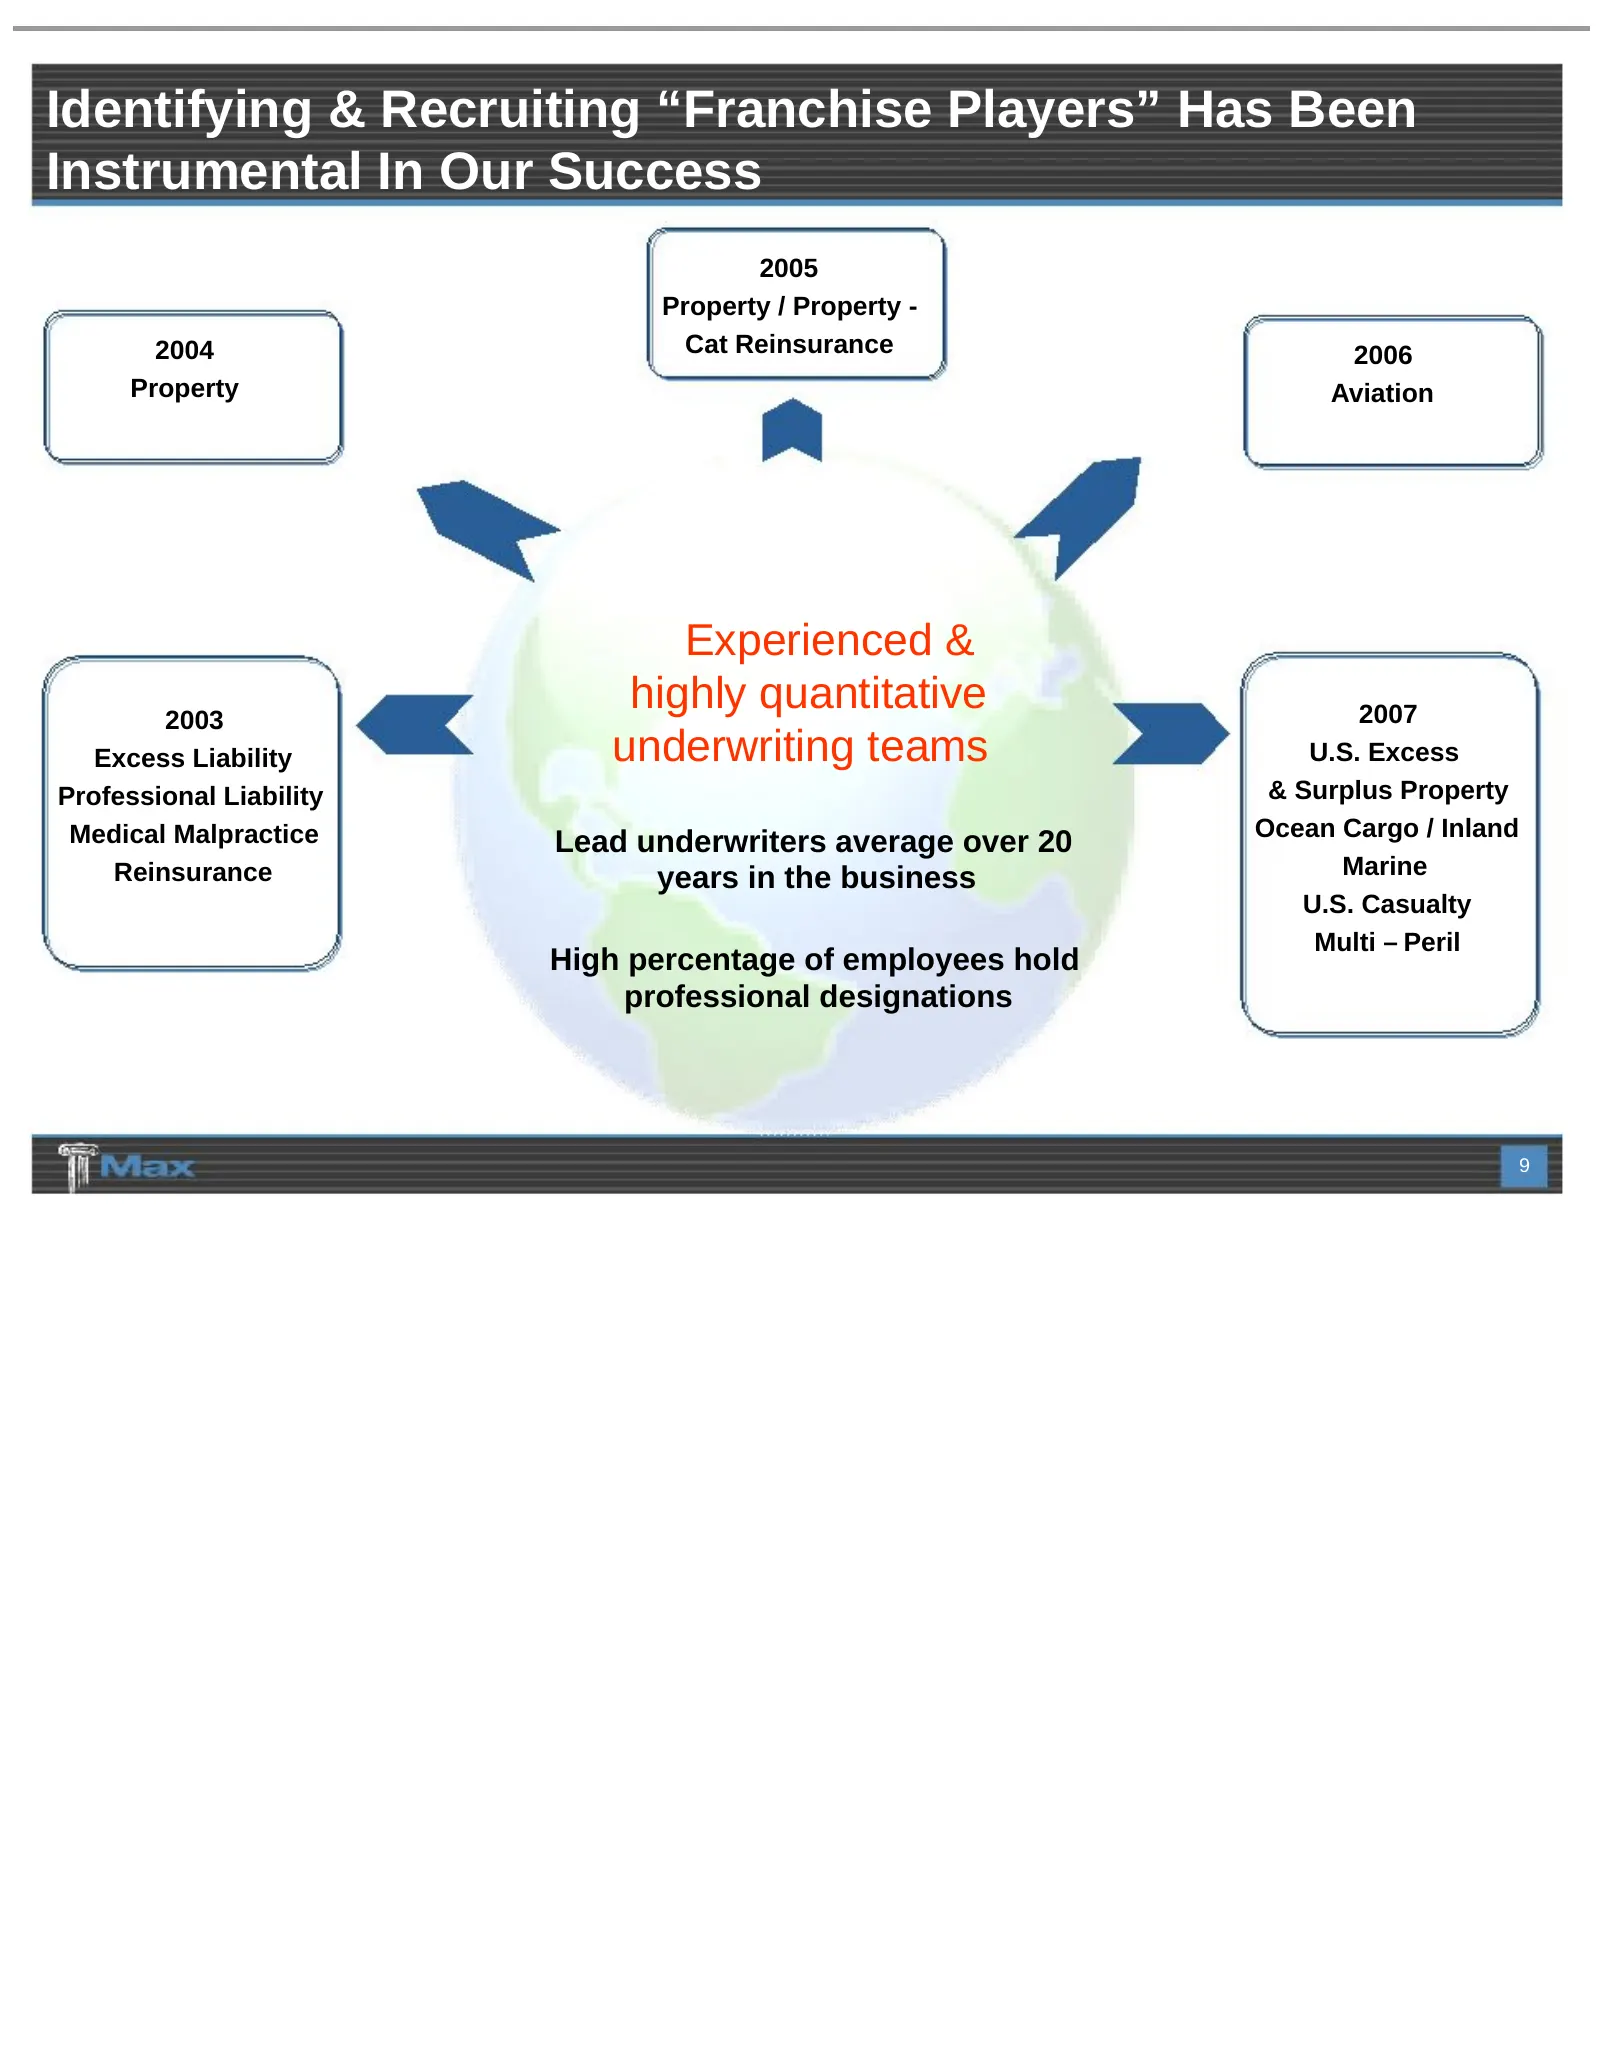
Identifying & Recruiting “Franchise Players” Has Been Instrumental In Our Success 2005 Property / Property - 2004 Cat Reinsurance 2006 Property Aviation Experienced & 2003 highly quantitative 2007 Excess Liability underwriting teams U.S. Excess Professional Liability & Surplus Property Medical Malpr
Slide 10: Operating Strategy
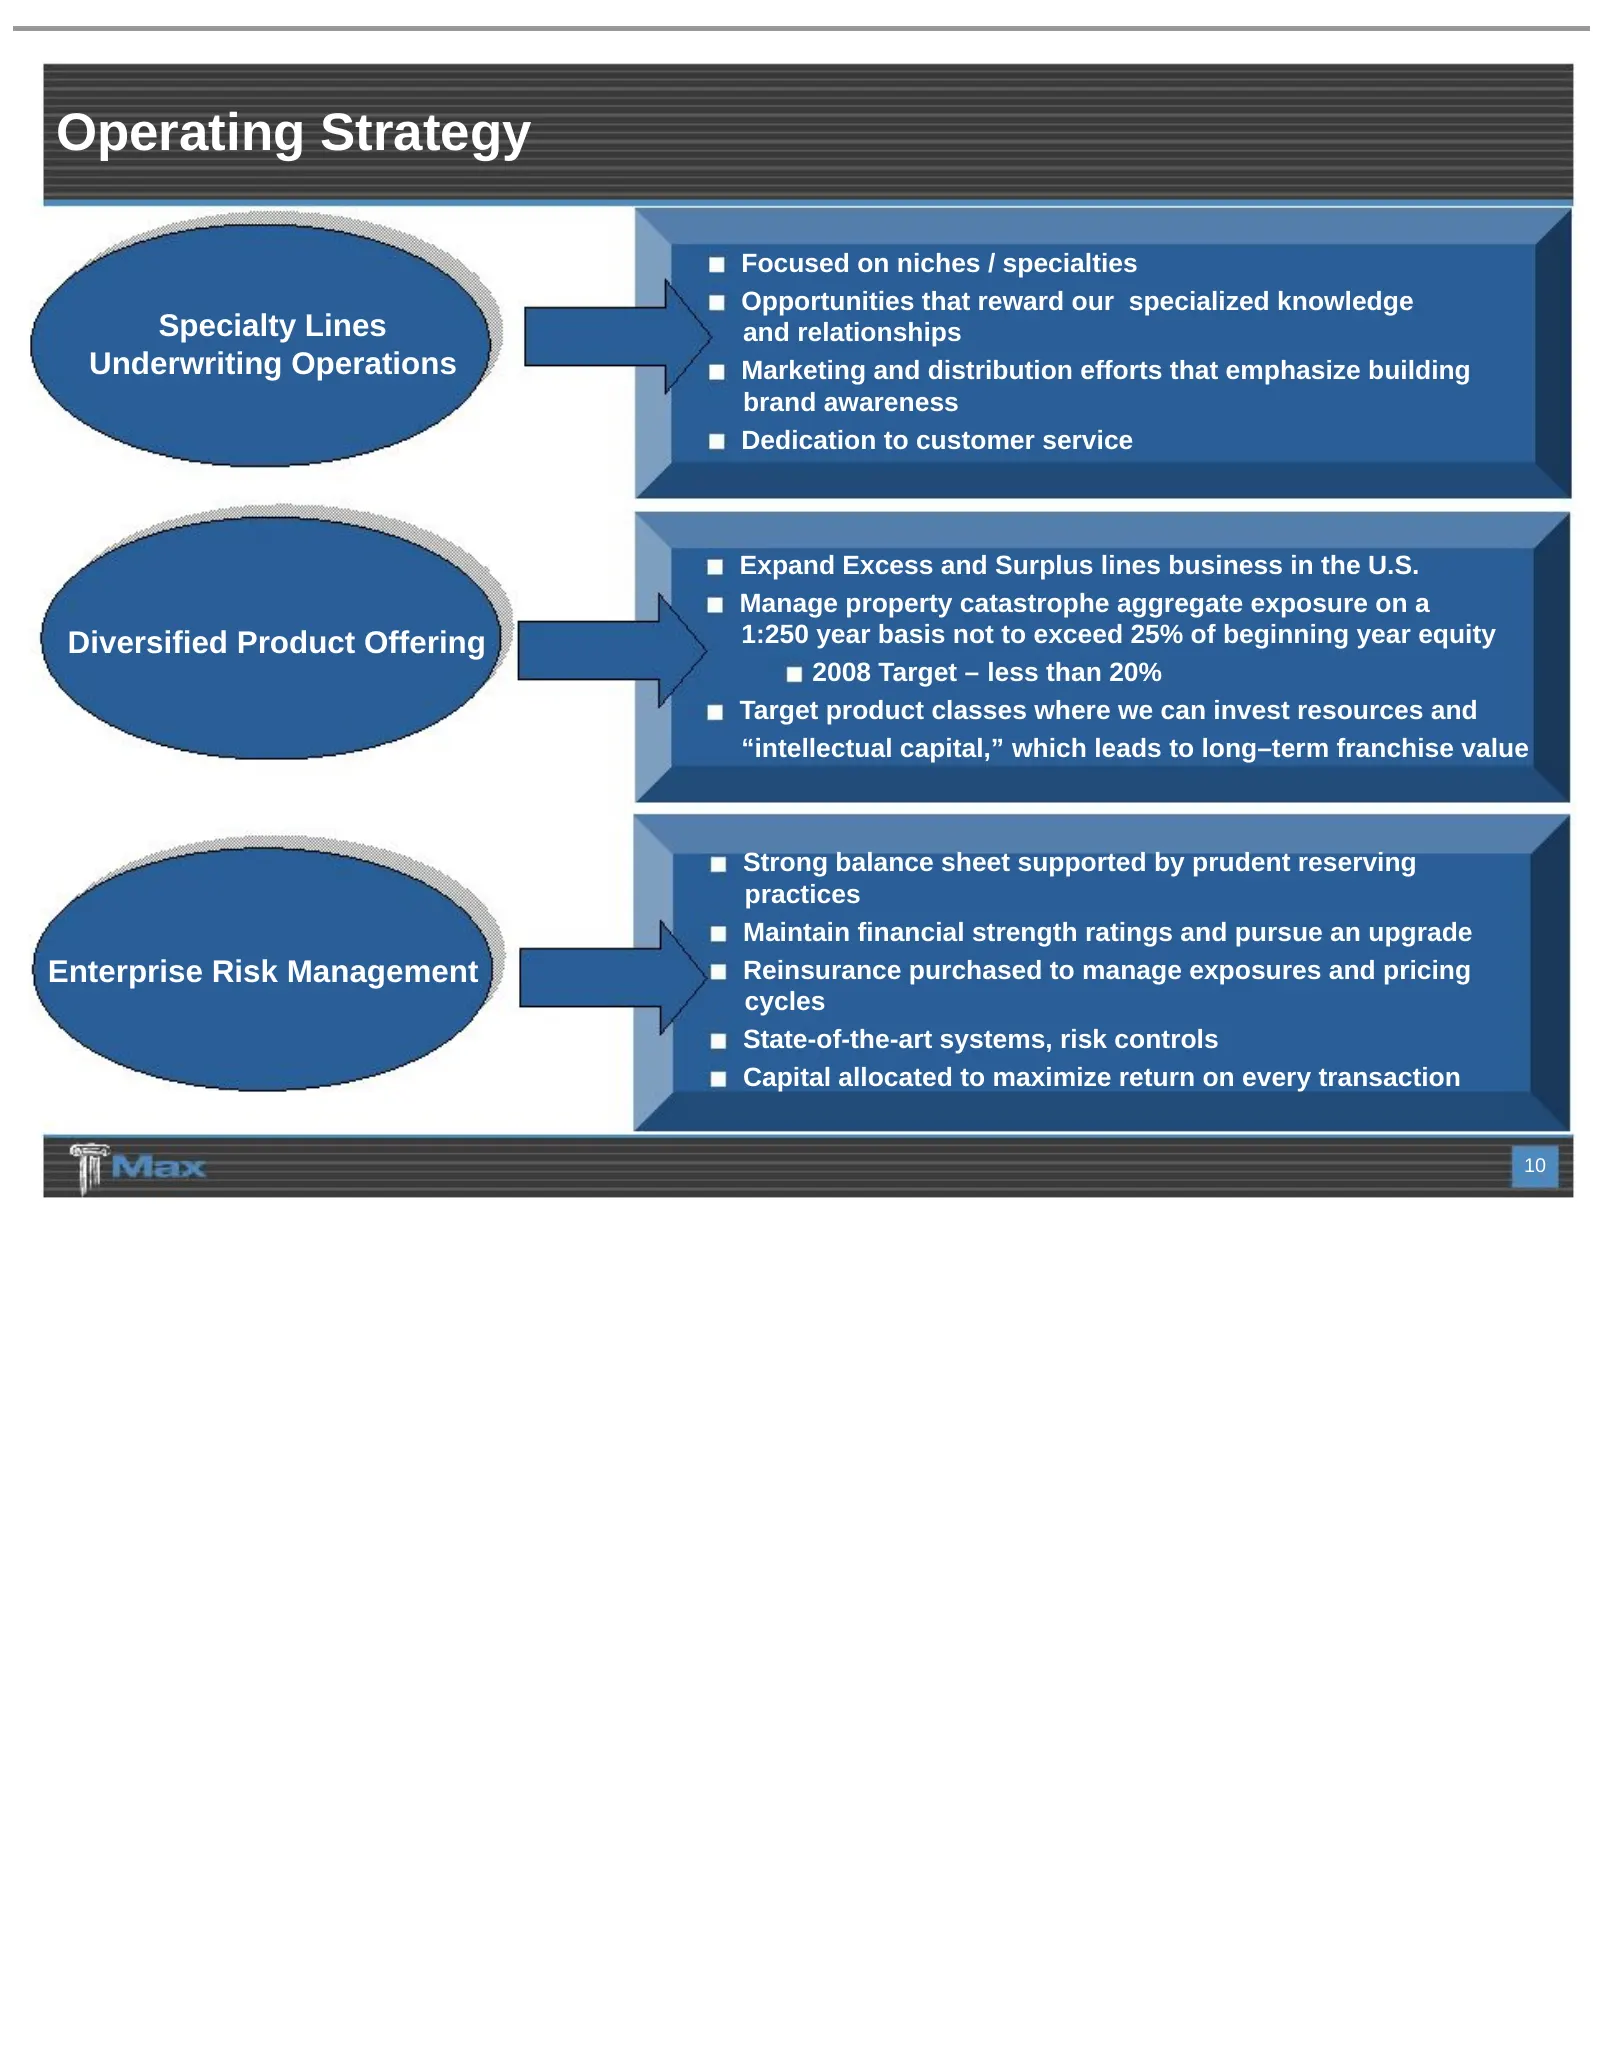
Operating Strategy Focused on niches / specialties Opportunities that reward our specialized knowledge Specialty Lines and relationships Underwriting Operations Marketing and distribution efforts that emphasize building brand awareness Dedication to customer service Expand Excess and Surplus lines b
Slide 11: Financial Objective – Grow Book Value / Create Shareholder Value
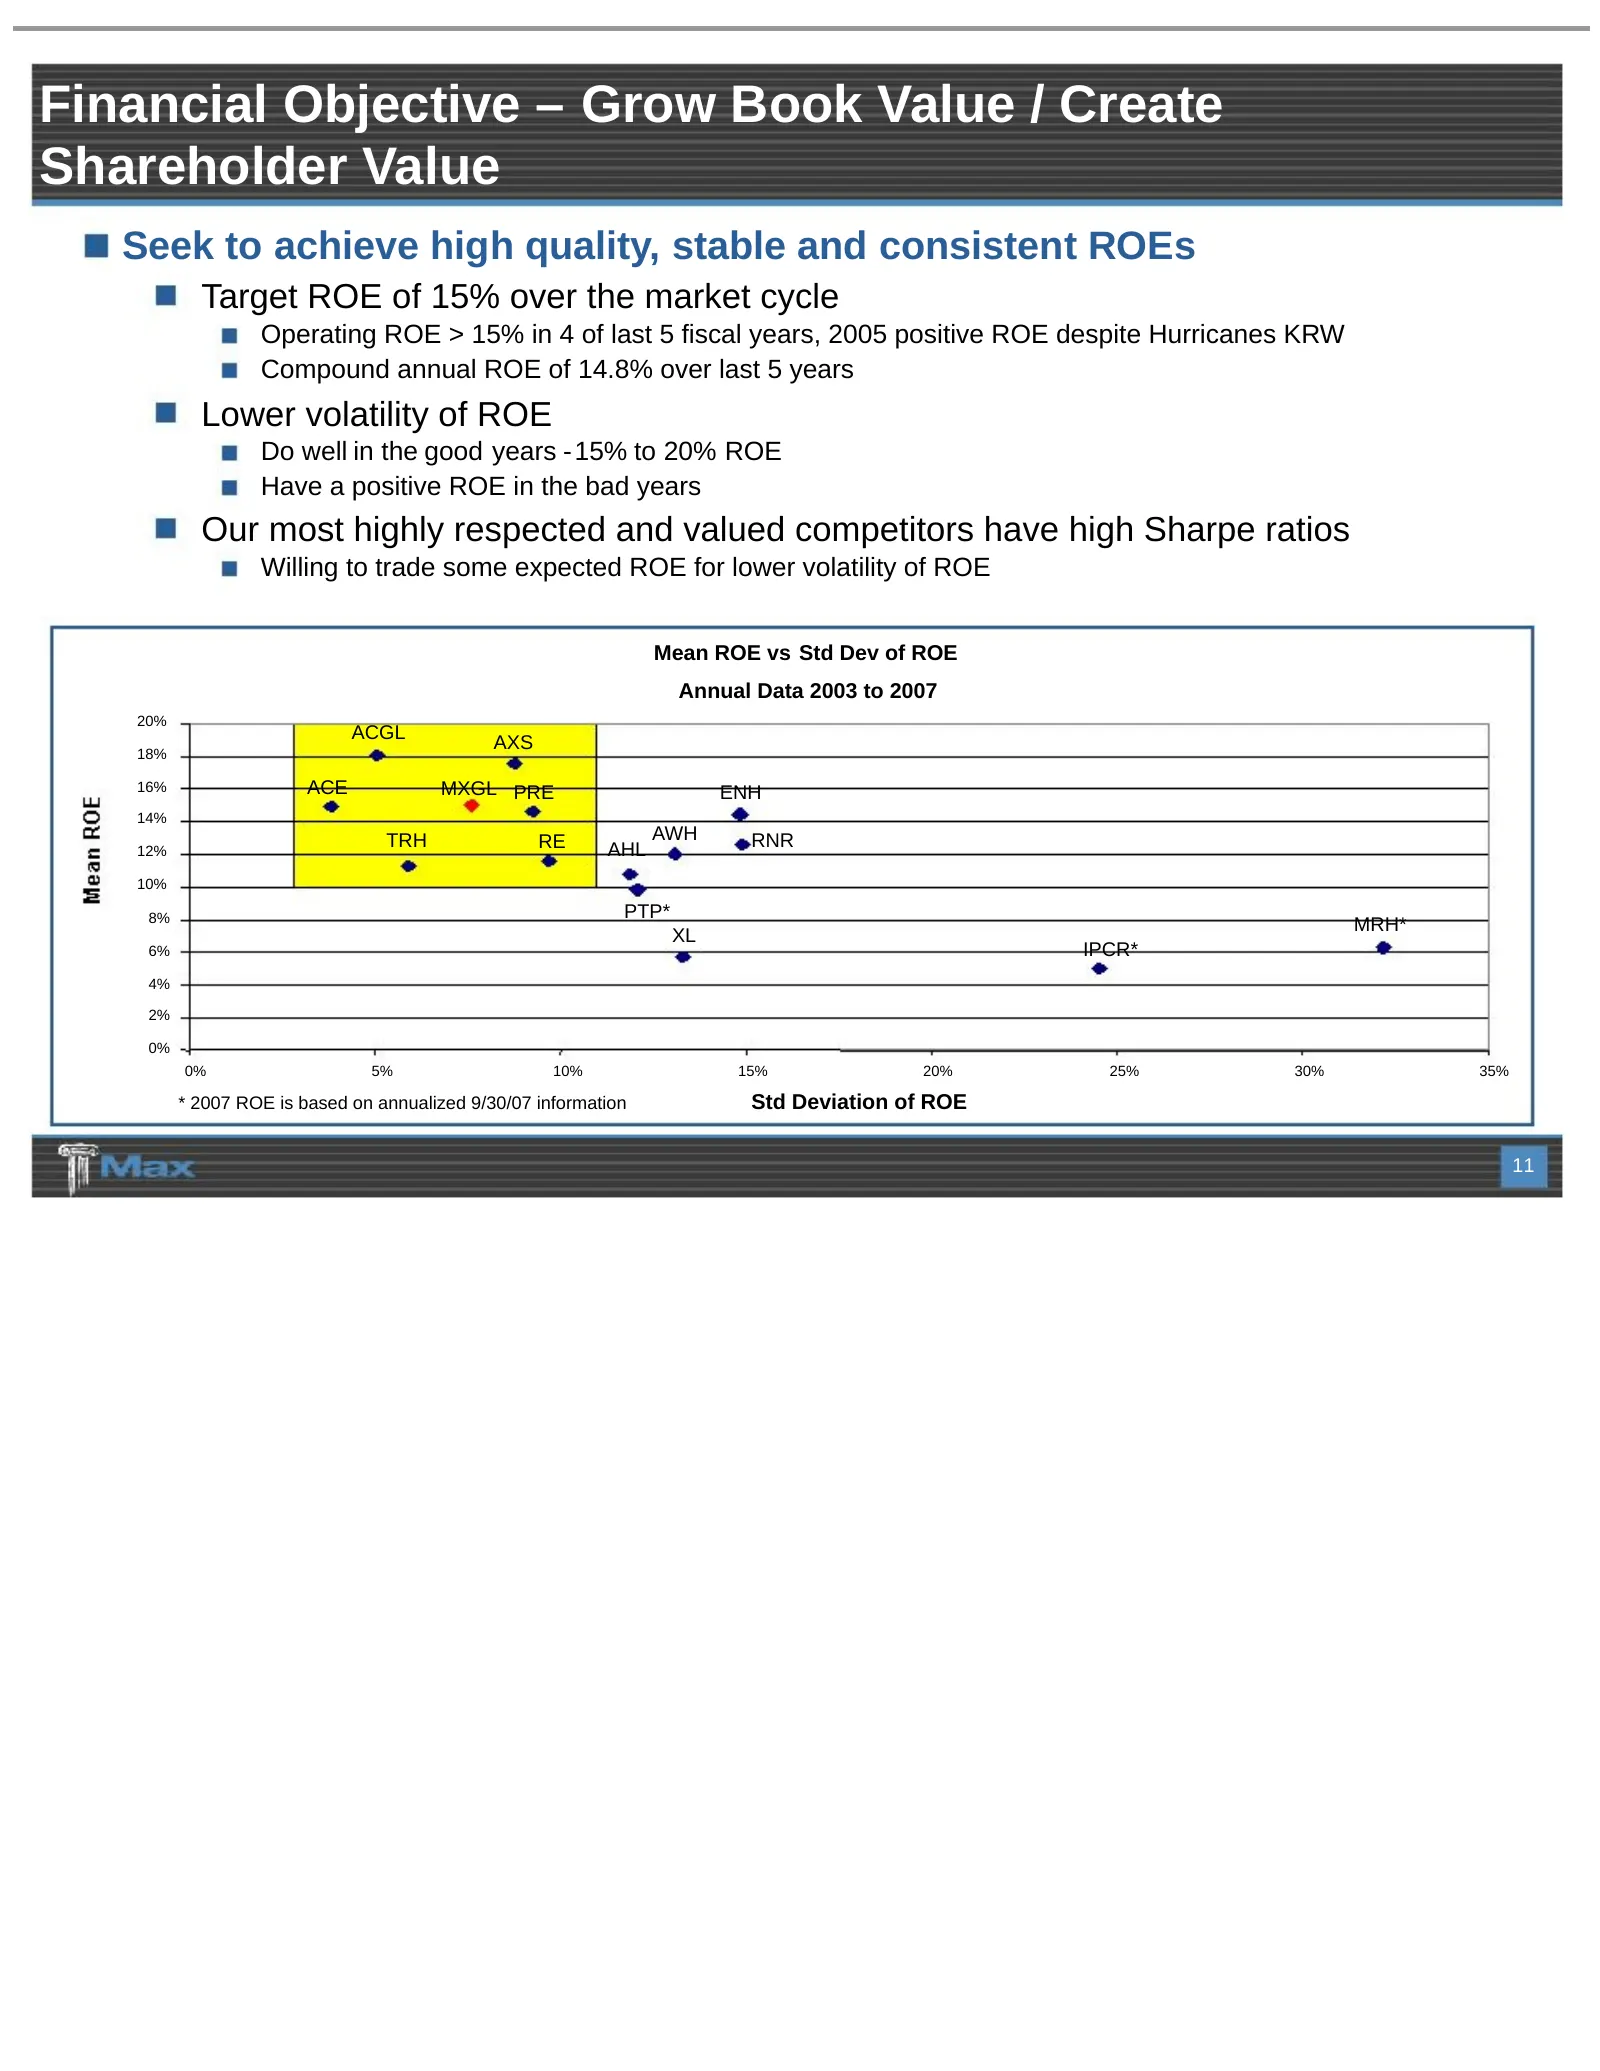
Financial Objective – Grow Book Value / Create Shareholder Value Seek to achieve high quality, stable and consistent ROEs Target ROE of 15% over the market cycle Operating ROE > 15% in 4 of last 5 fiscal years, 2005 positive ROE despite Hurricanes KRW Compound annual ROE of 14.8% over last 5 years L
Slide 12: 5 Years Of Growth: Annualized ROE of 14.8%, Book Value Increased 88.5%
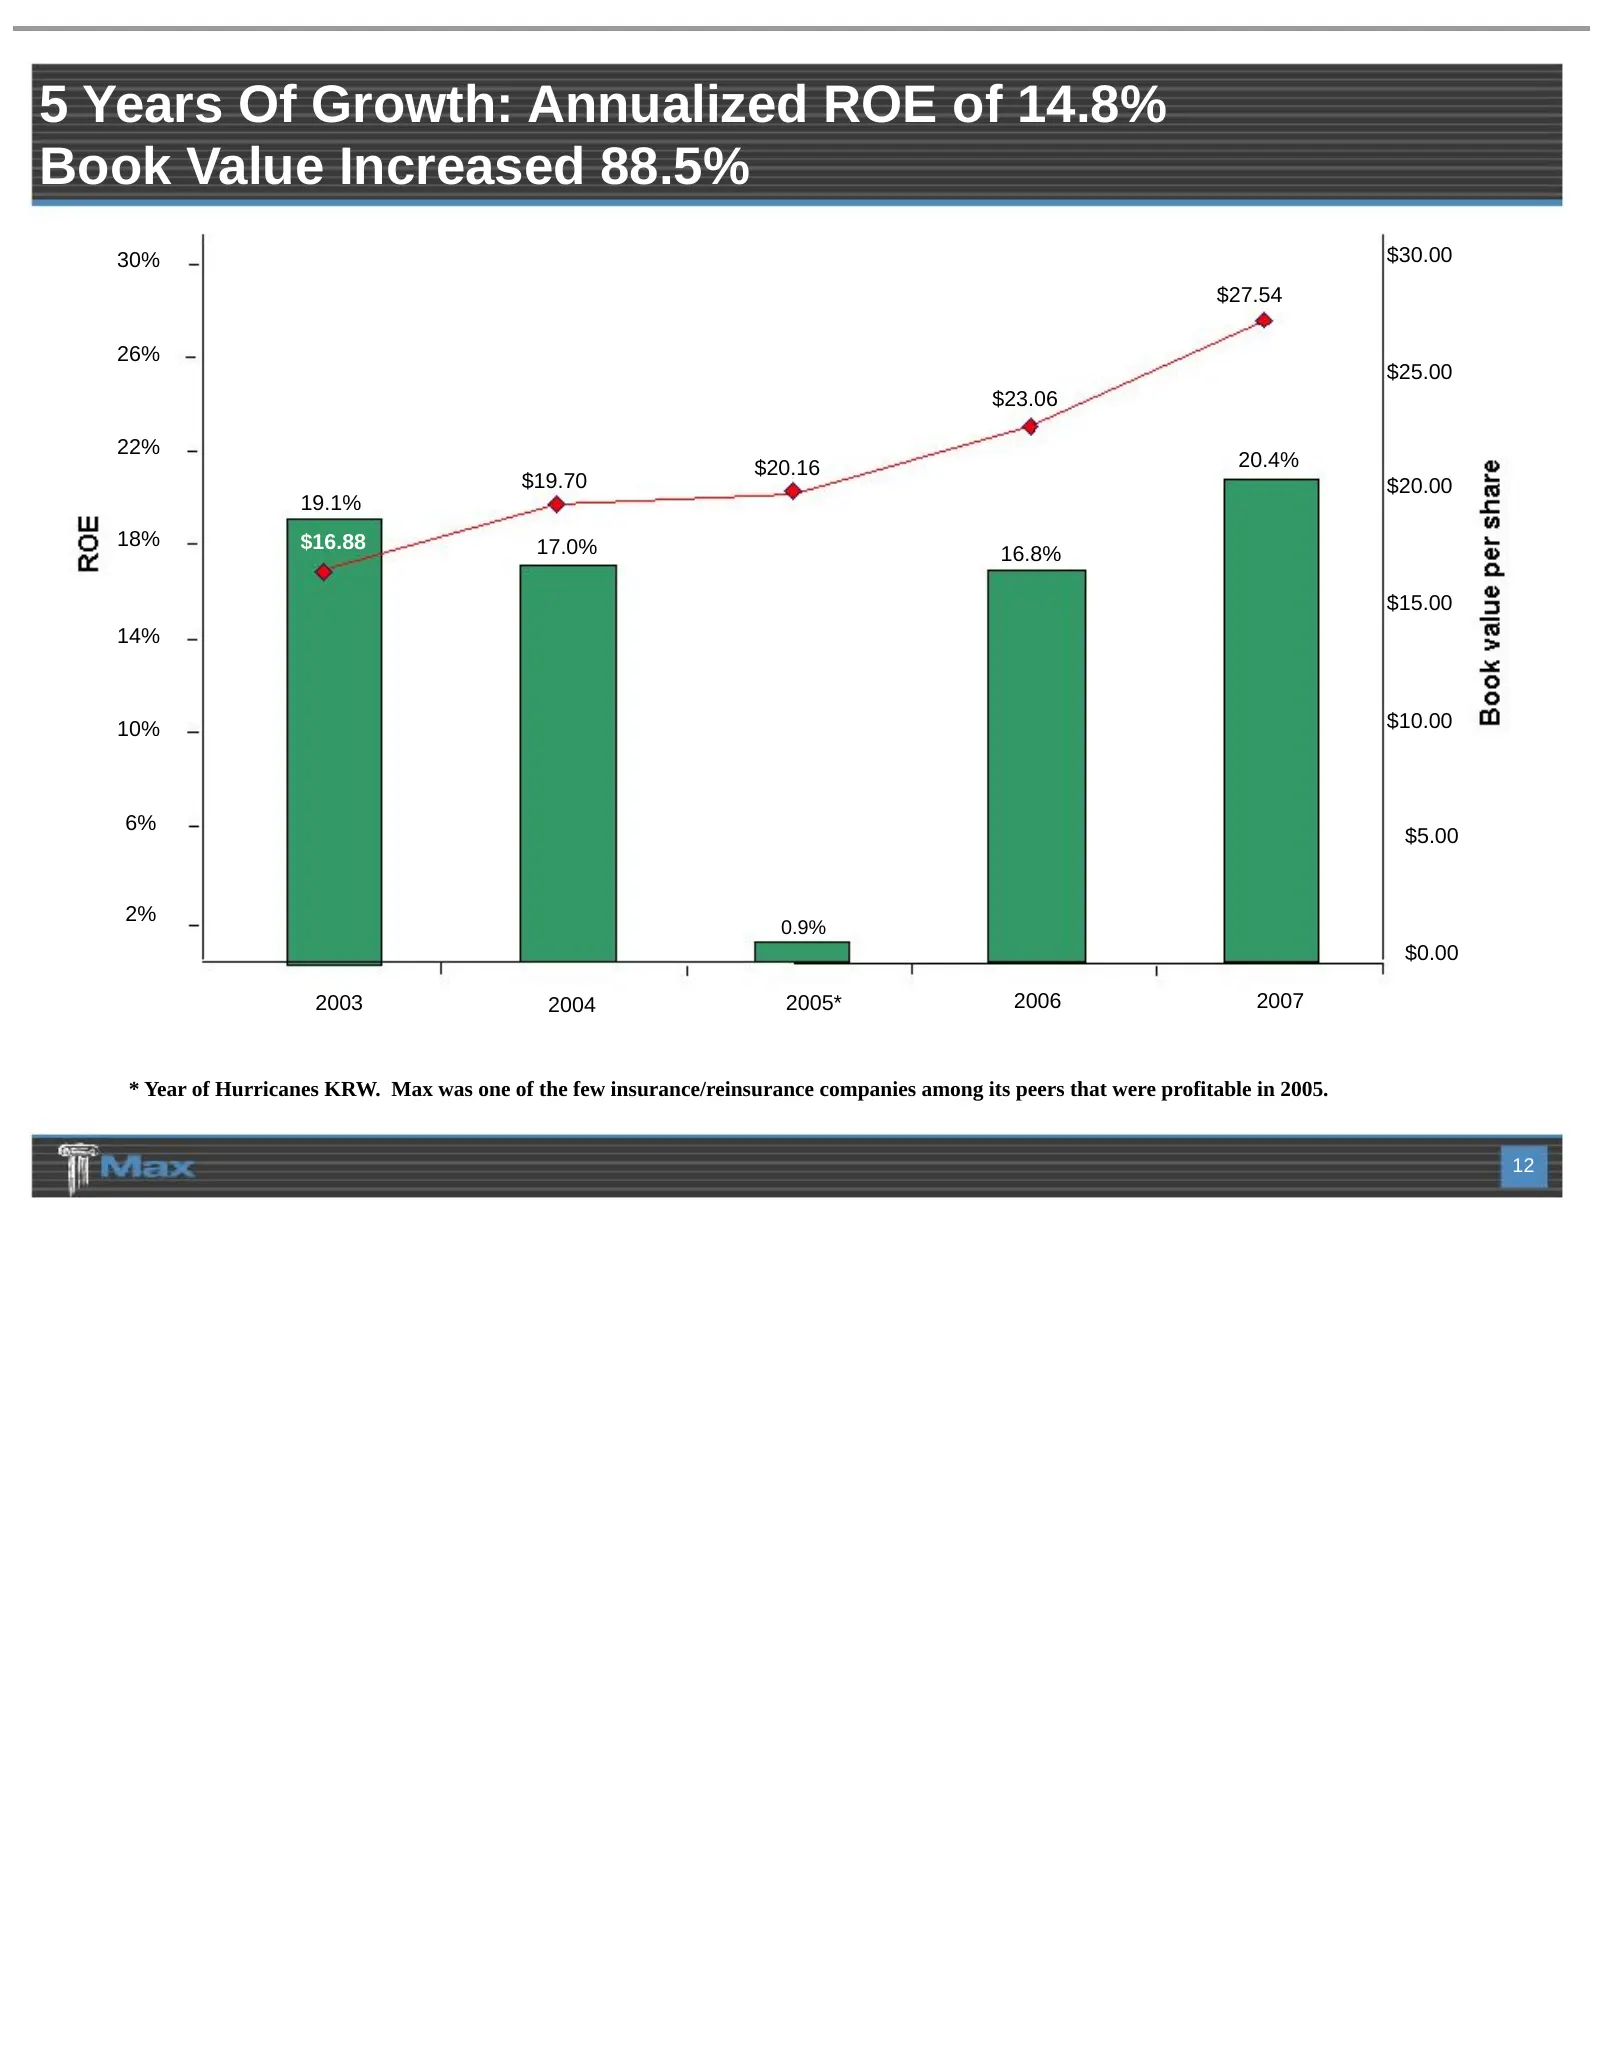
5 Years Of Growth: Annualized ROE of 14.8% Book Value Increased 88.5% 30% $30.00 $27.54 26% $25.00 $23.06 22% $20.16 20.4% $19.70 $20.00 19.1% 18% $16.88 17.0% 16.8% $15.00 14% 10% $10.00 6% $5.00 2% 0.9% $0.00 2003 2004 2005* 2006 2007 * Year of Hurricanes KRW. Max was one of the few insurance/rein
Slide 13: Efficient Capital Management
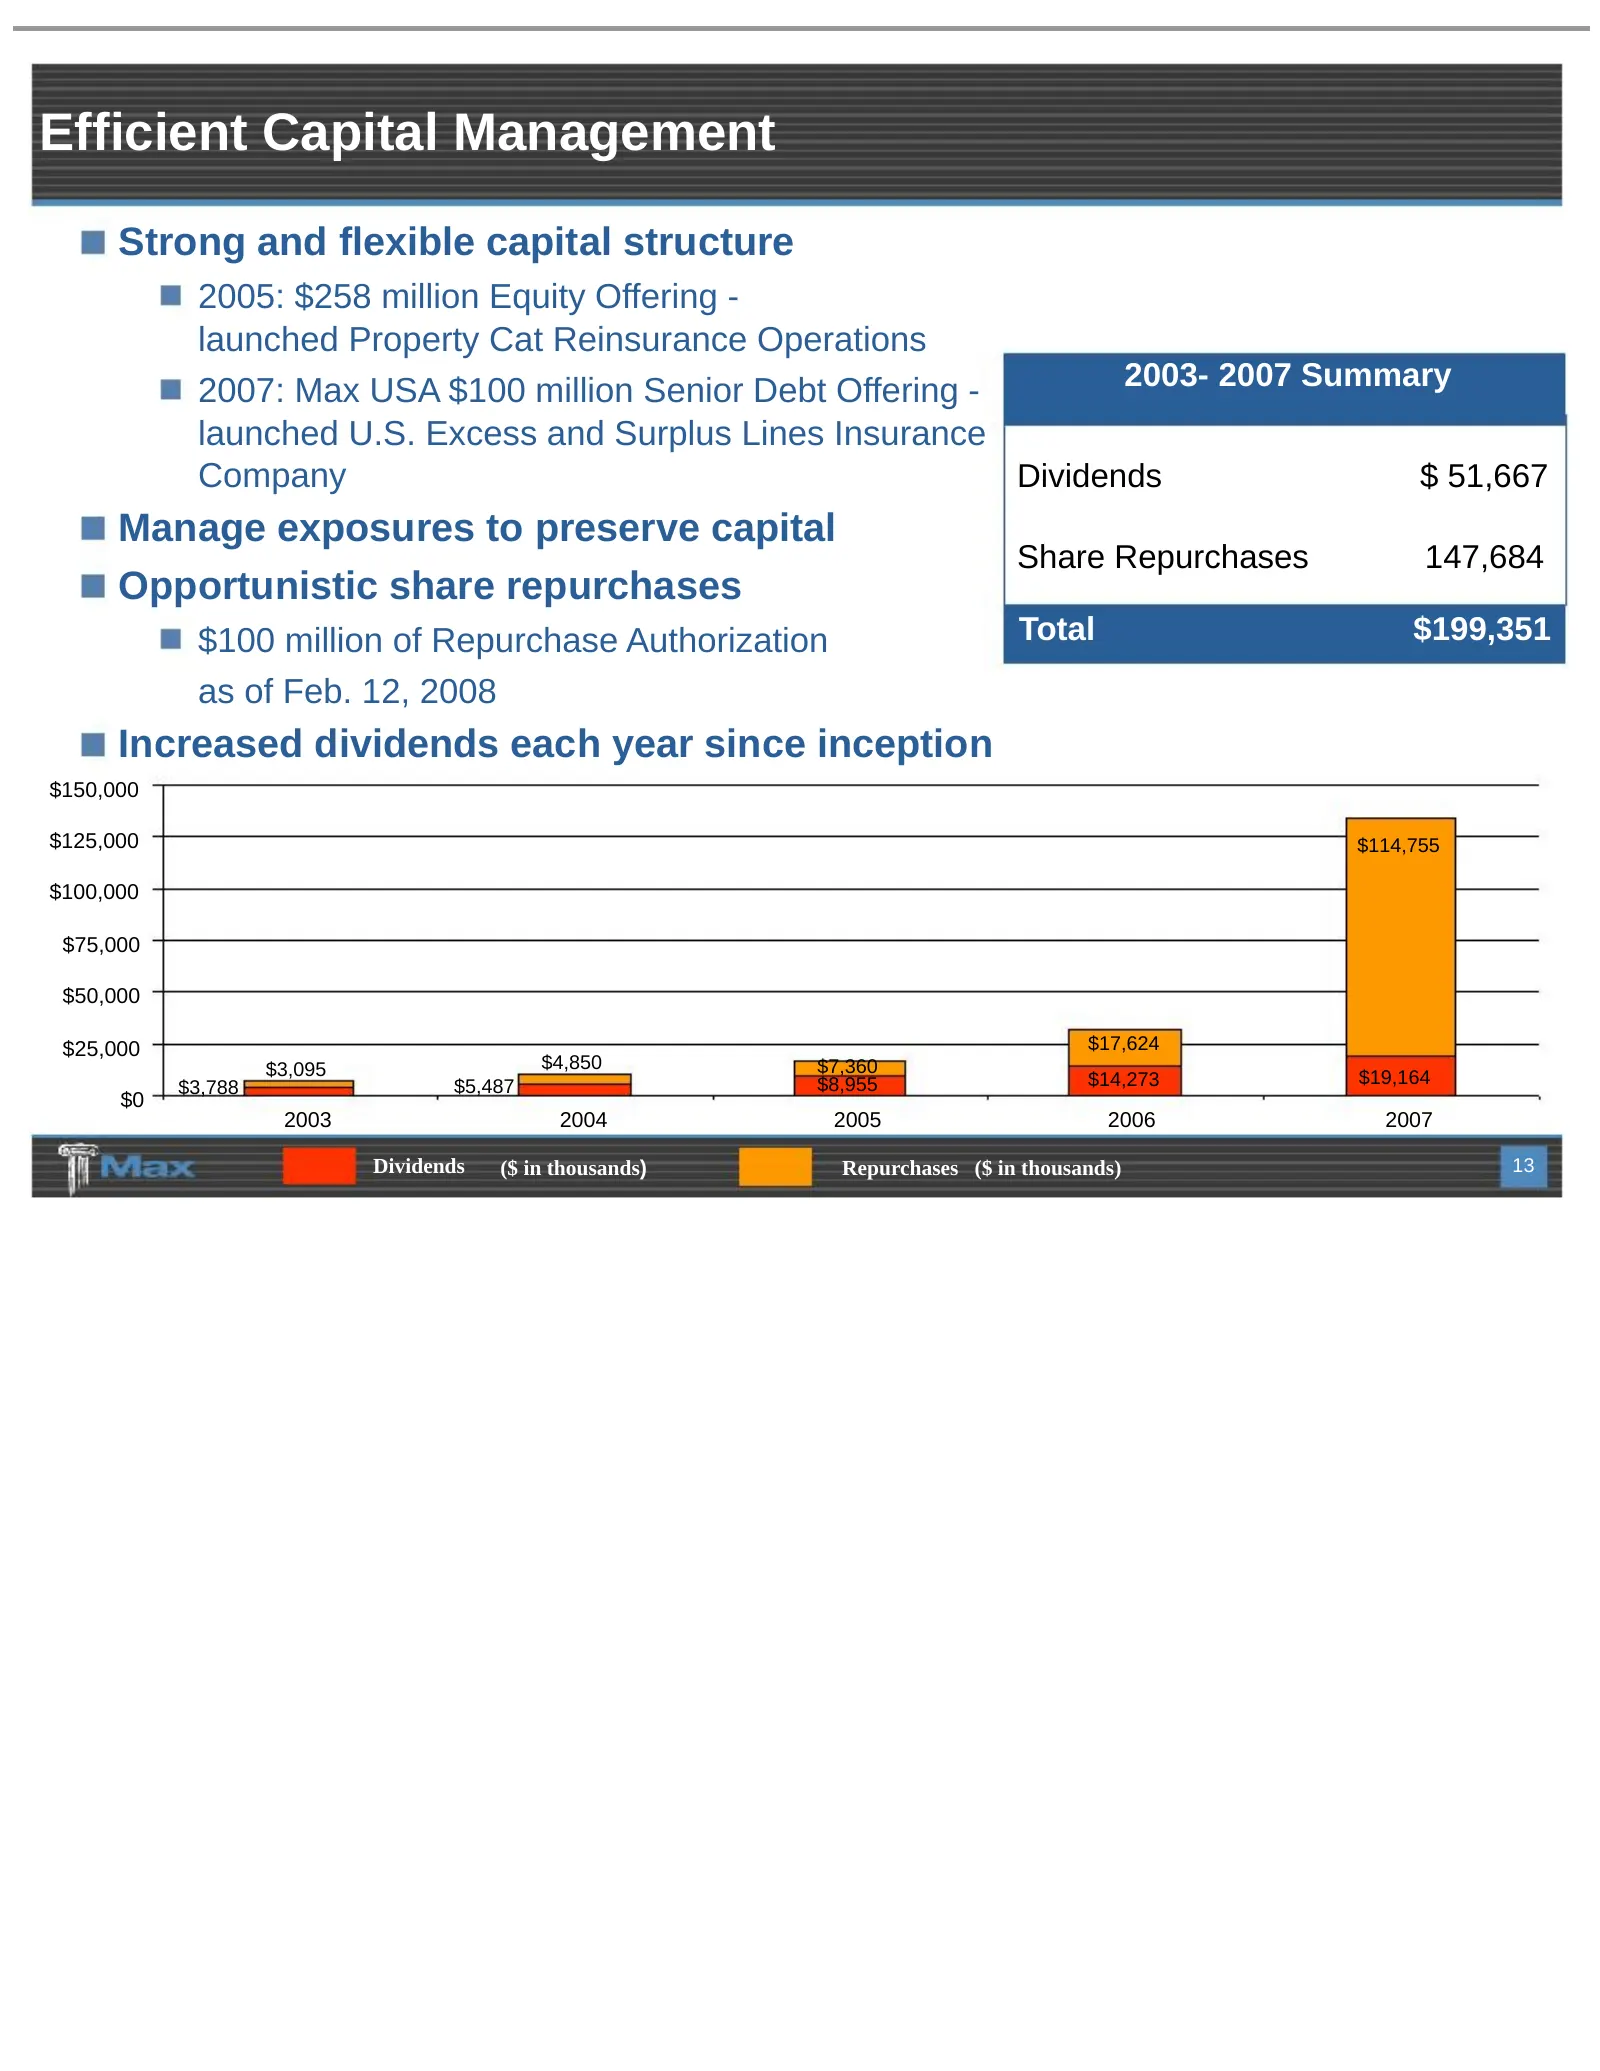
Efficient Capital Management Strong and flexible capital structure 2005: $258 million Equity Offering - launched Property Cat Reinsurance Operations 2003- 2007 Summary 2007: Max USA $100 million Senior Debt Offering - launched U.S. Excess and Surplus Lines Insurance Company Dividends $ 51,667 Manage
Slide 14: Peer Comparison: Max Has Outperformed The S&P 500
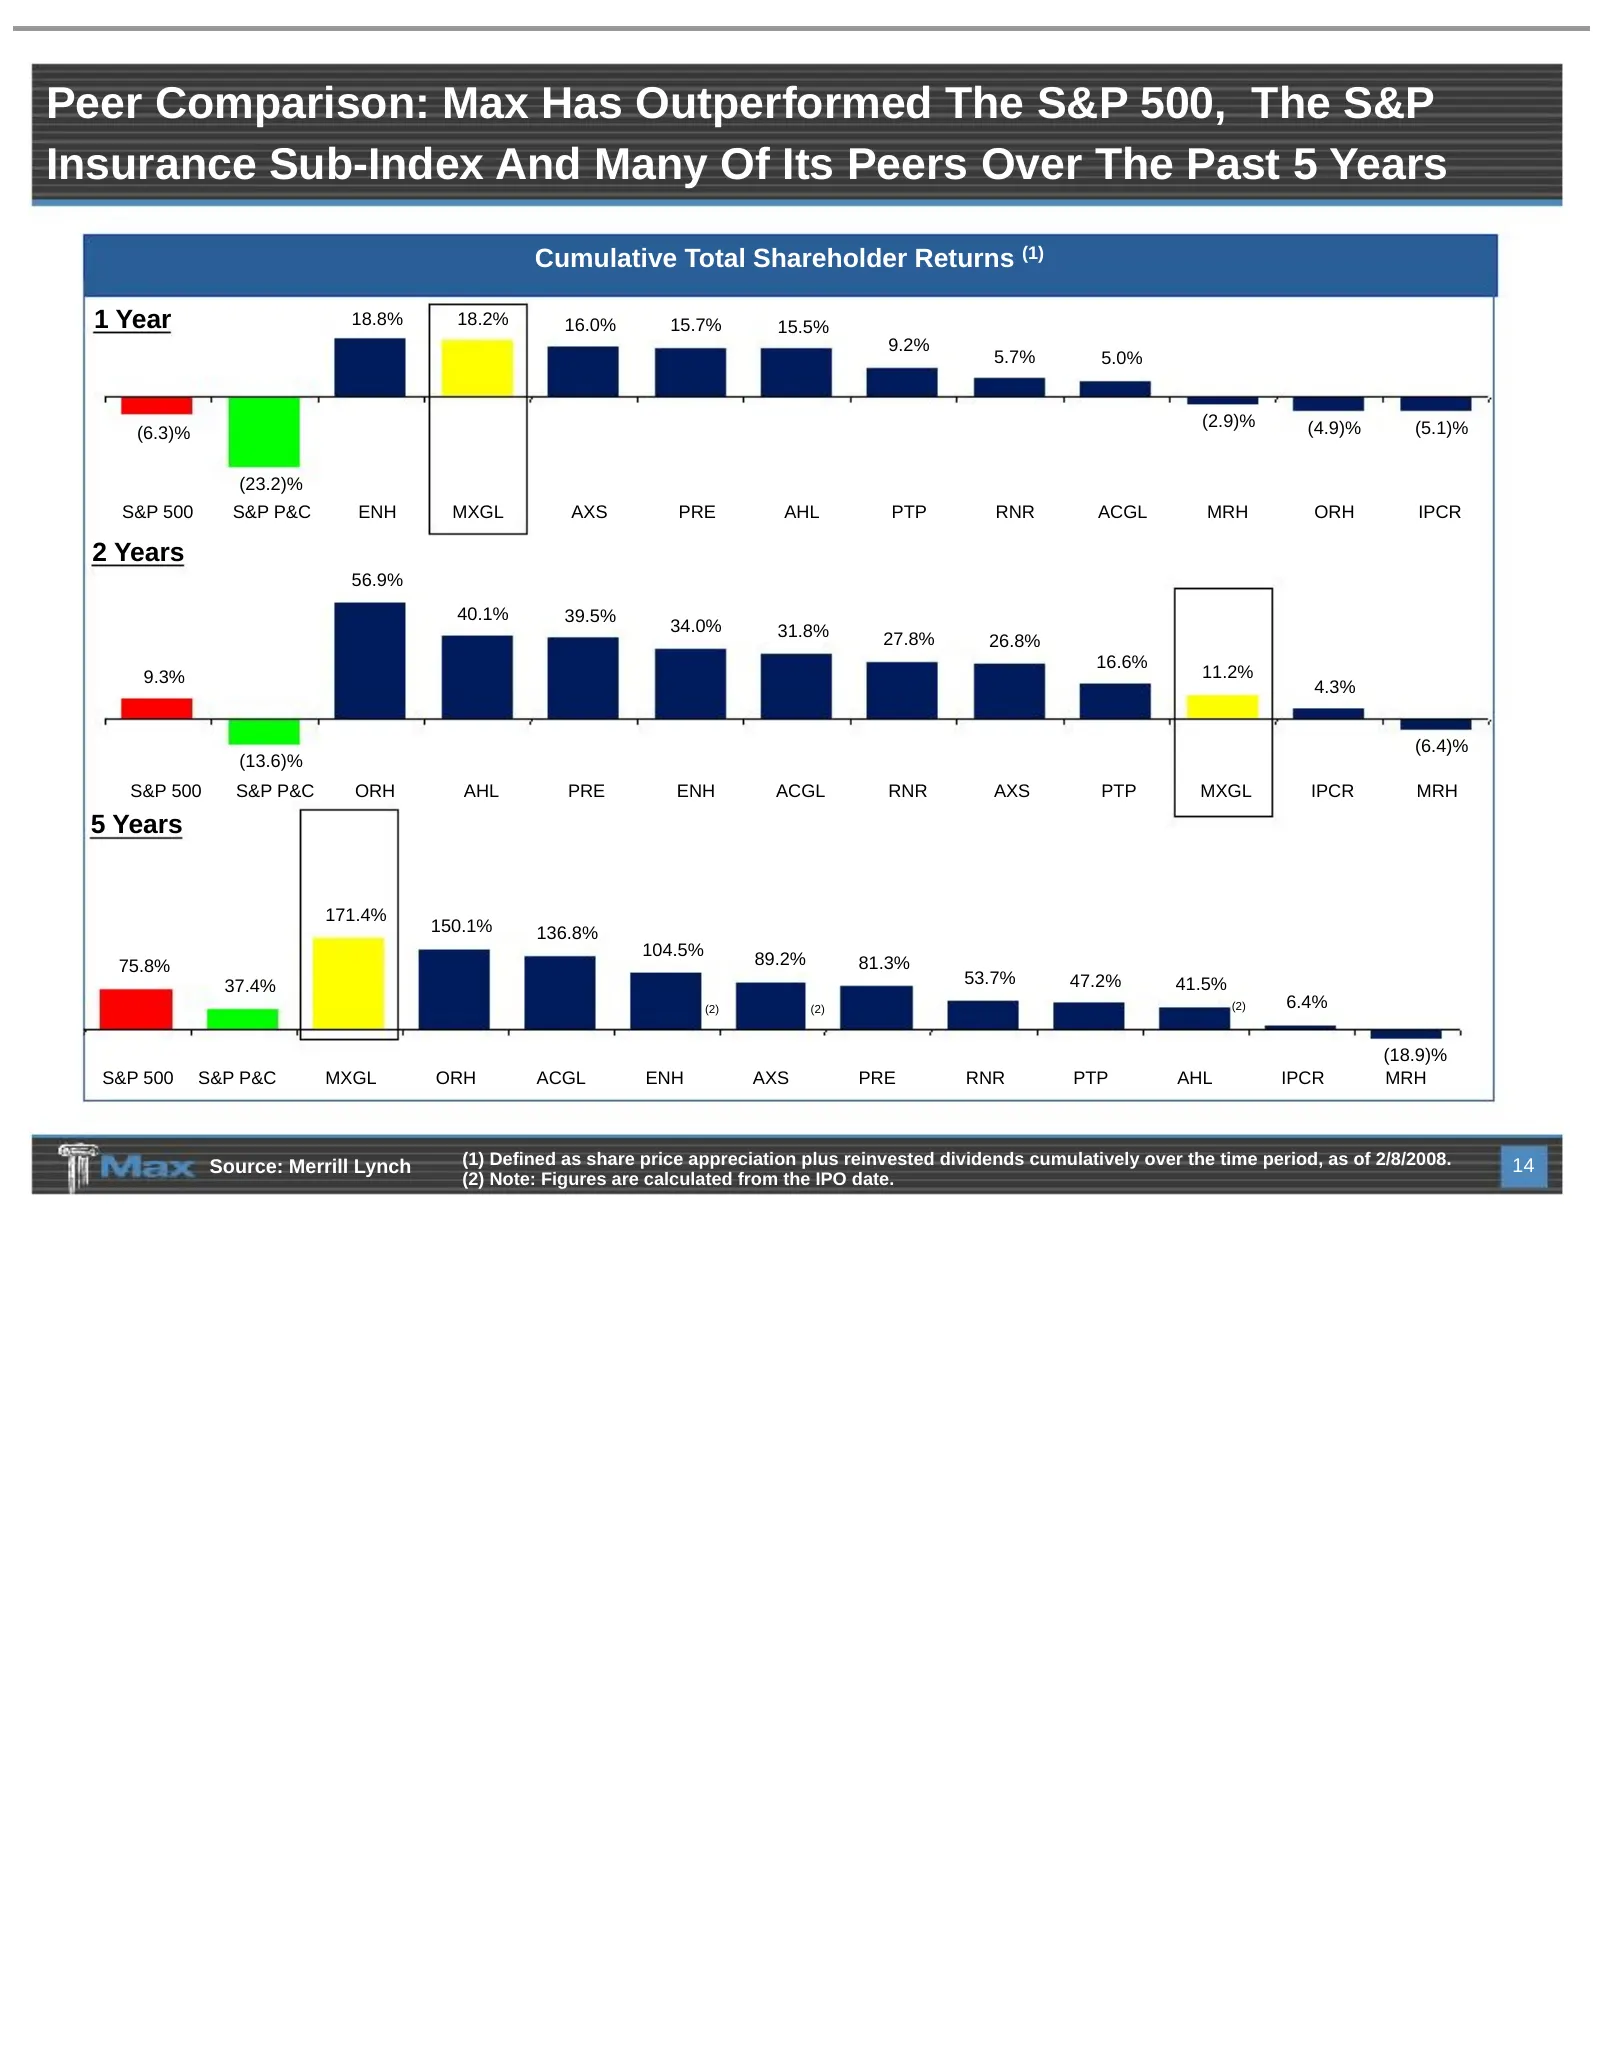
Peer Comparison: Max Has Outperformed The S&P 500, The S&P Insurance Sub-Index And Many Of Its Peers Over The Past 5 Years Cumulative Total Shareholder Returns (1) 1 Year 18.8% 18.2% 16.0% 15.7% 15.5% 9.2% 5.7% 5.0% (2.9)% (4.9)% (5.1)% (6.3)% (23.2)% S&P 500 S&P P&C ENH MXGL AXS PRE AHL PTP RNR ACG
Slide 15: Underwriting Operations & P&C Insurance
Underwriting Operations & P&C Insurance Angelo Guagliano
Slide 16: The Company Is Divided Into Four Underwriting Segments
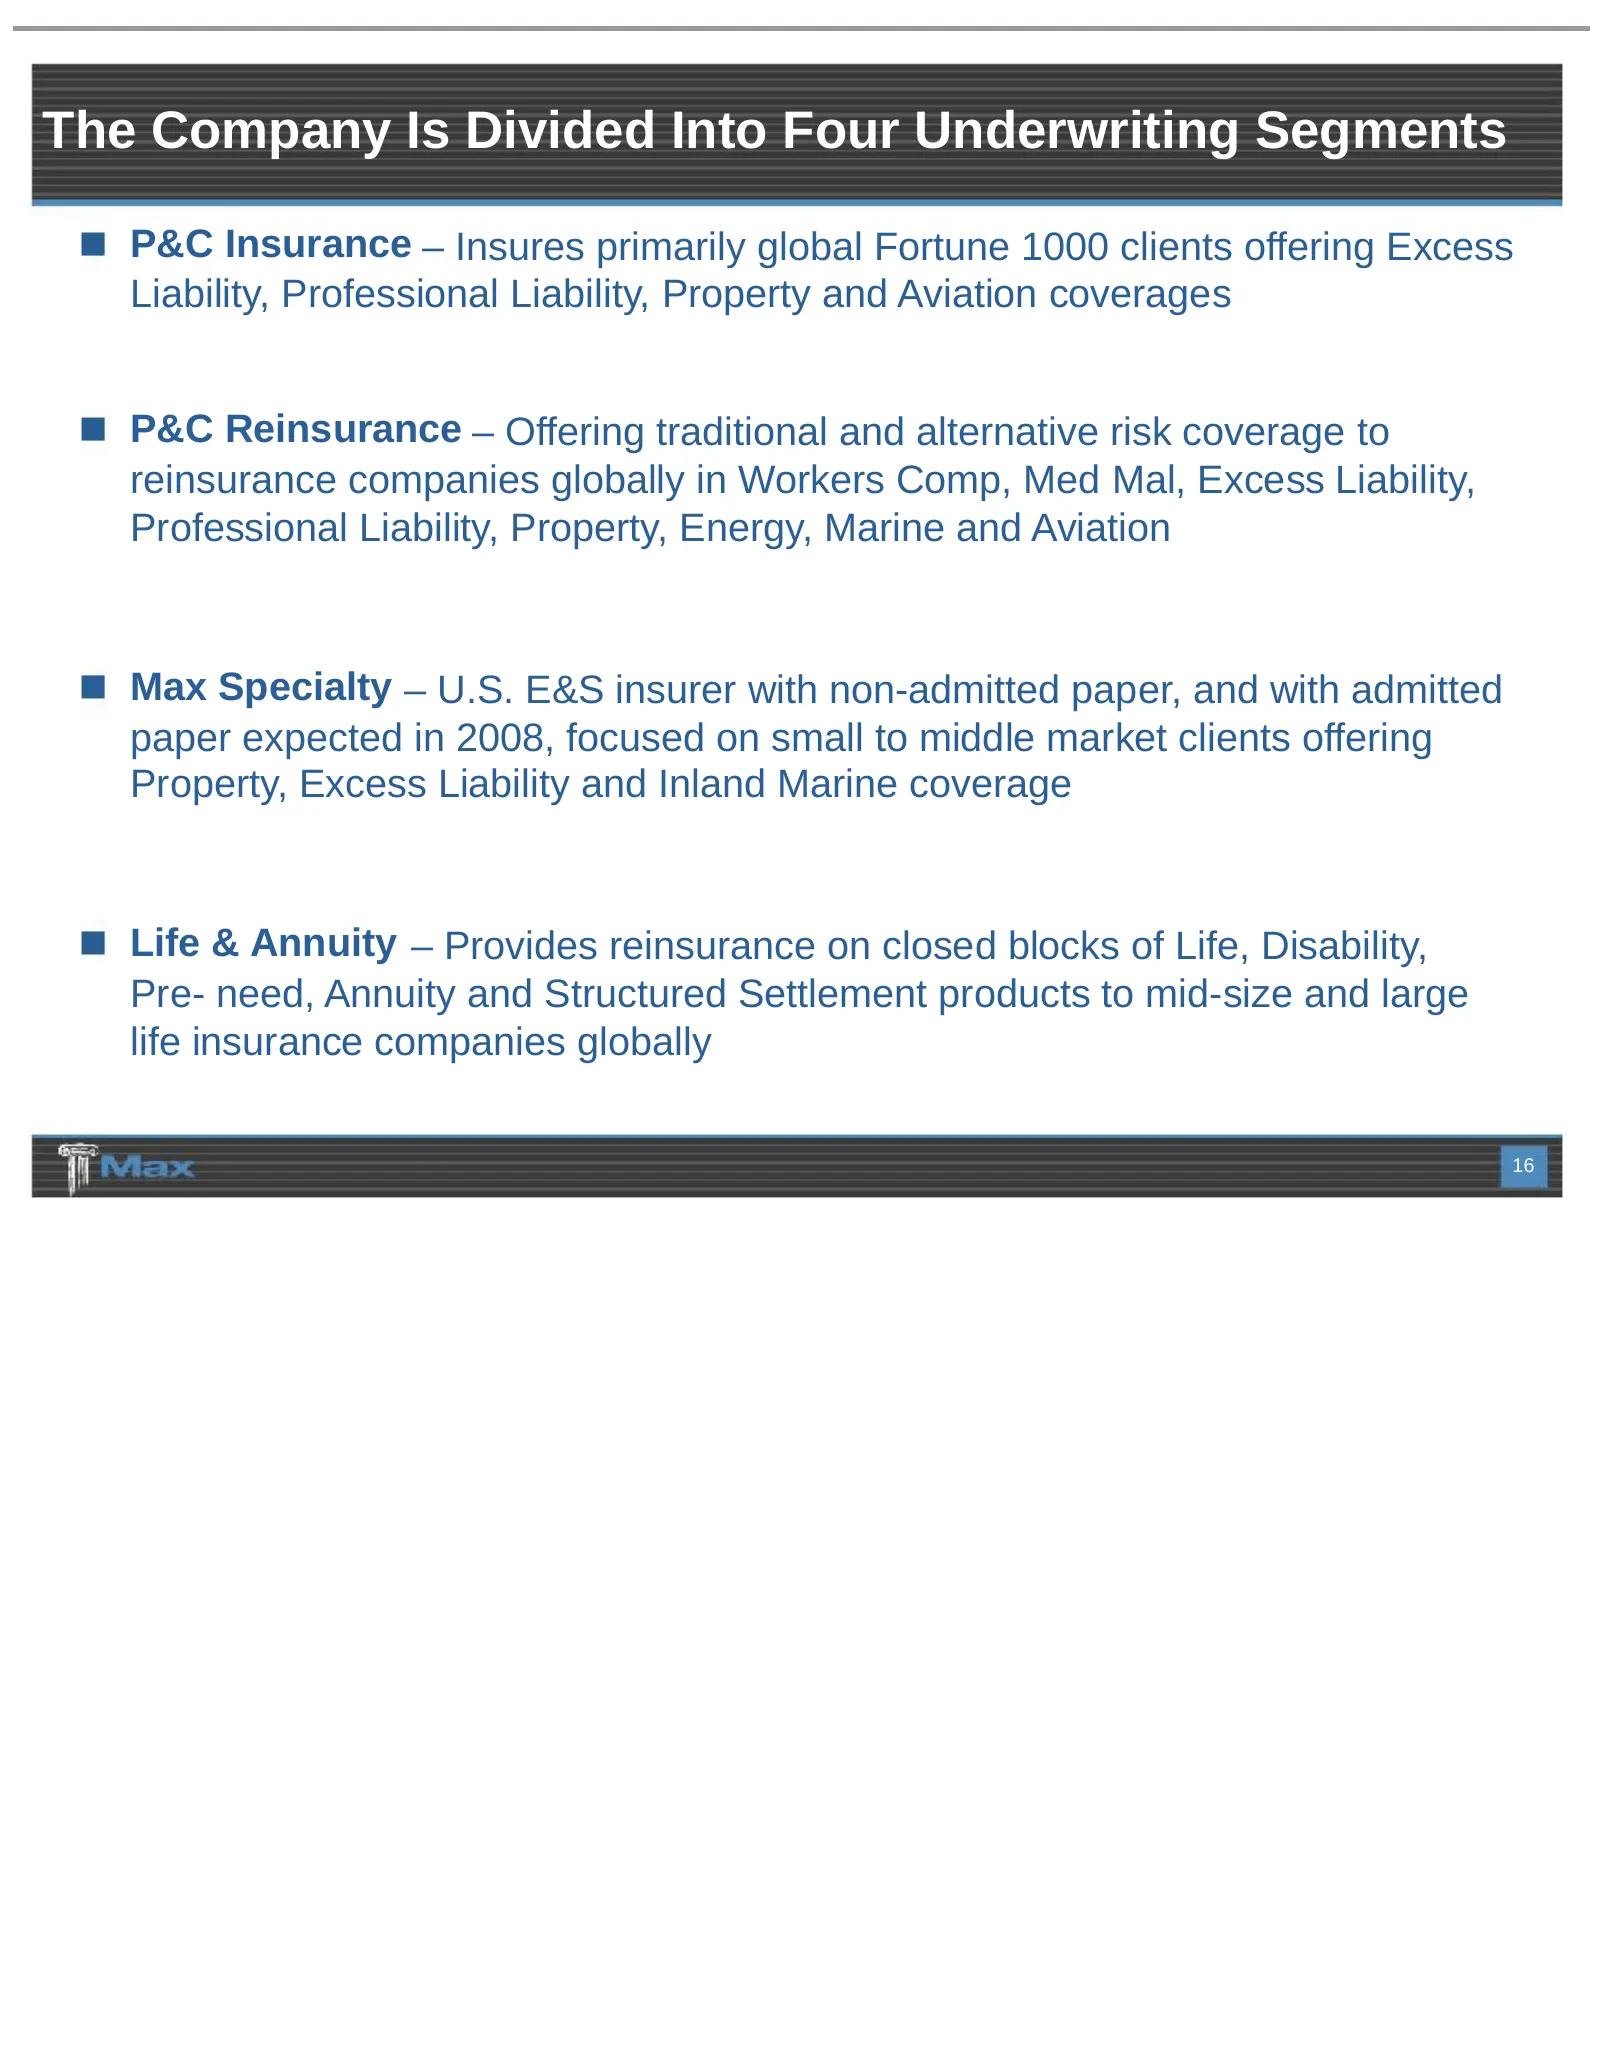
The Company Is Divided Into Four Underwriting Segments P&C Insurance – Insures primarily global Fortune 1000 clients offering Excess Liability, Professional Liability, Property and Aviation coverages P&C Reinsurance – Offering traditional and alternative risk coverage to reinsurance companies global
Slide 17: Diversified Premium Mix: A Key Differentiator
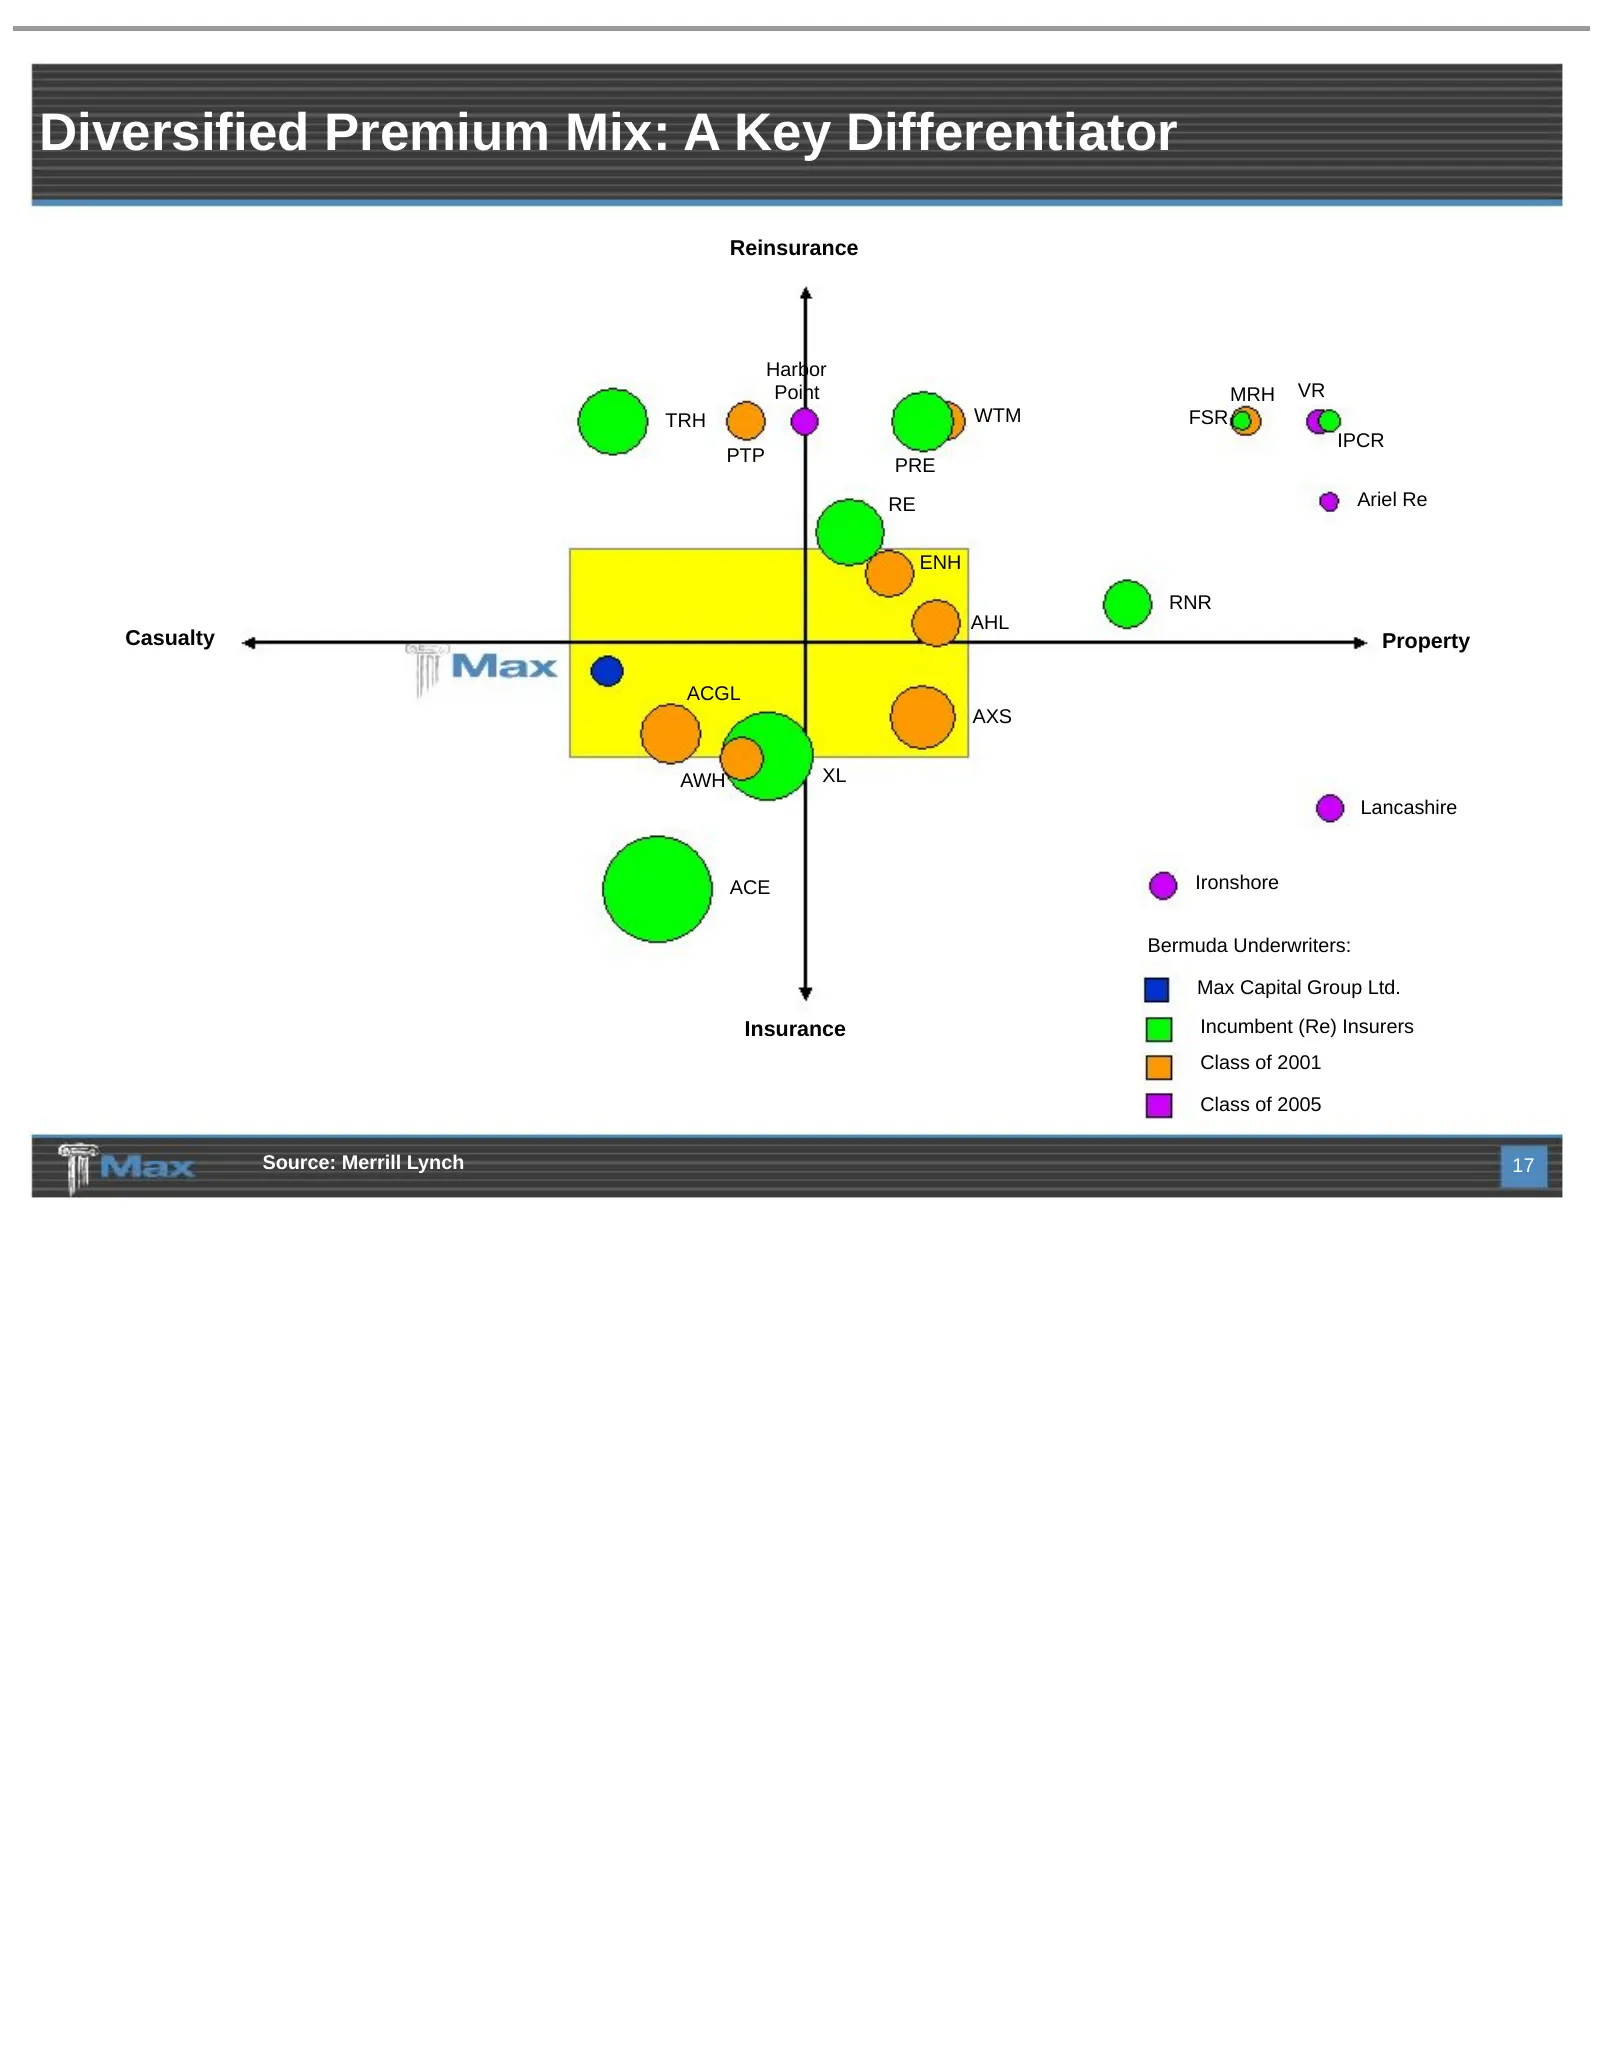
Diversified Premium Mix: A Key Differentiator Reinsurance Harbor Point MRH VR TRH WTM FSR IPCR PTP PRE RE Ariel Re ENH RNR AHL Casualty Property ACGL AXS AWH XL Lancashire ACE Ironshore Bermuda Underwriters: Max Capital Group Ltd. Insurance Incumbent (Re) Insurers Class of 2001 Class of 2005 Source:
Slide 18: Diversified Revenue Sources / Product Lines
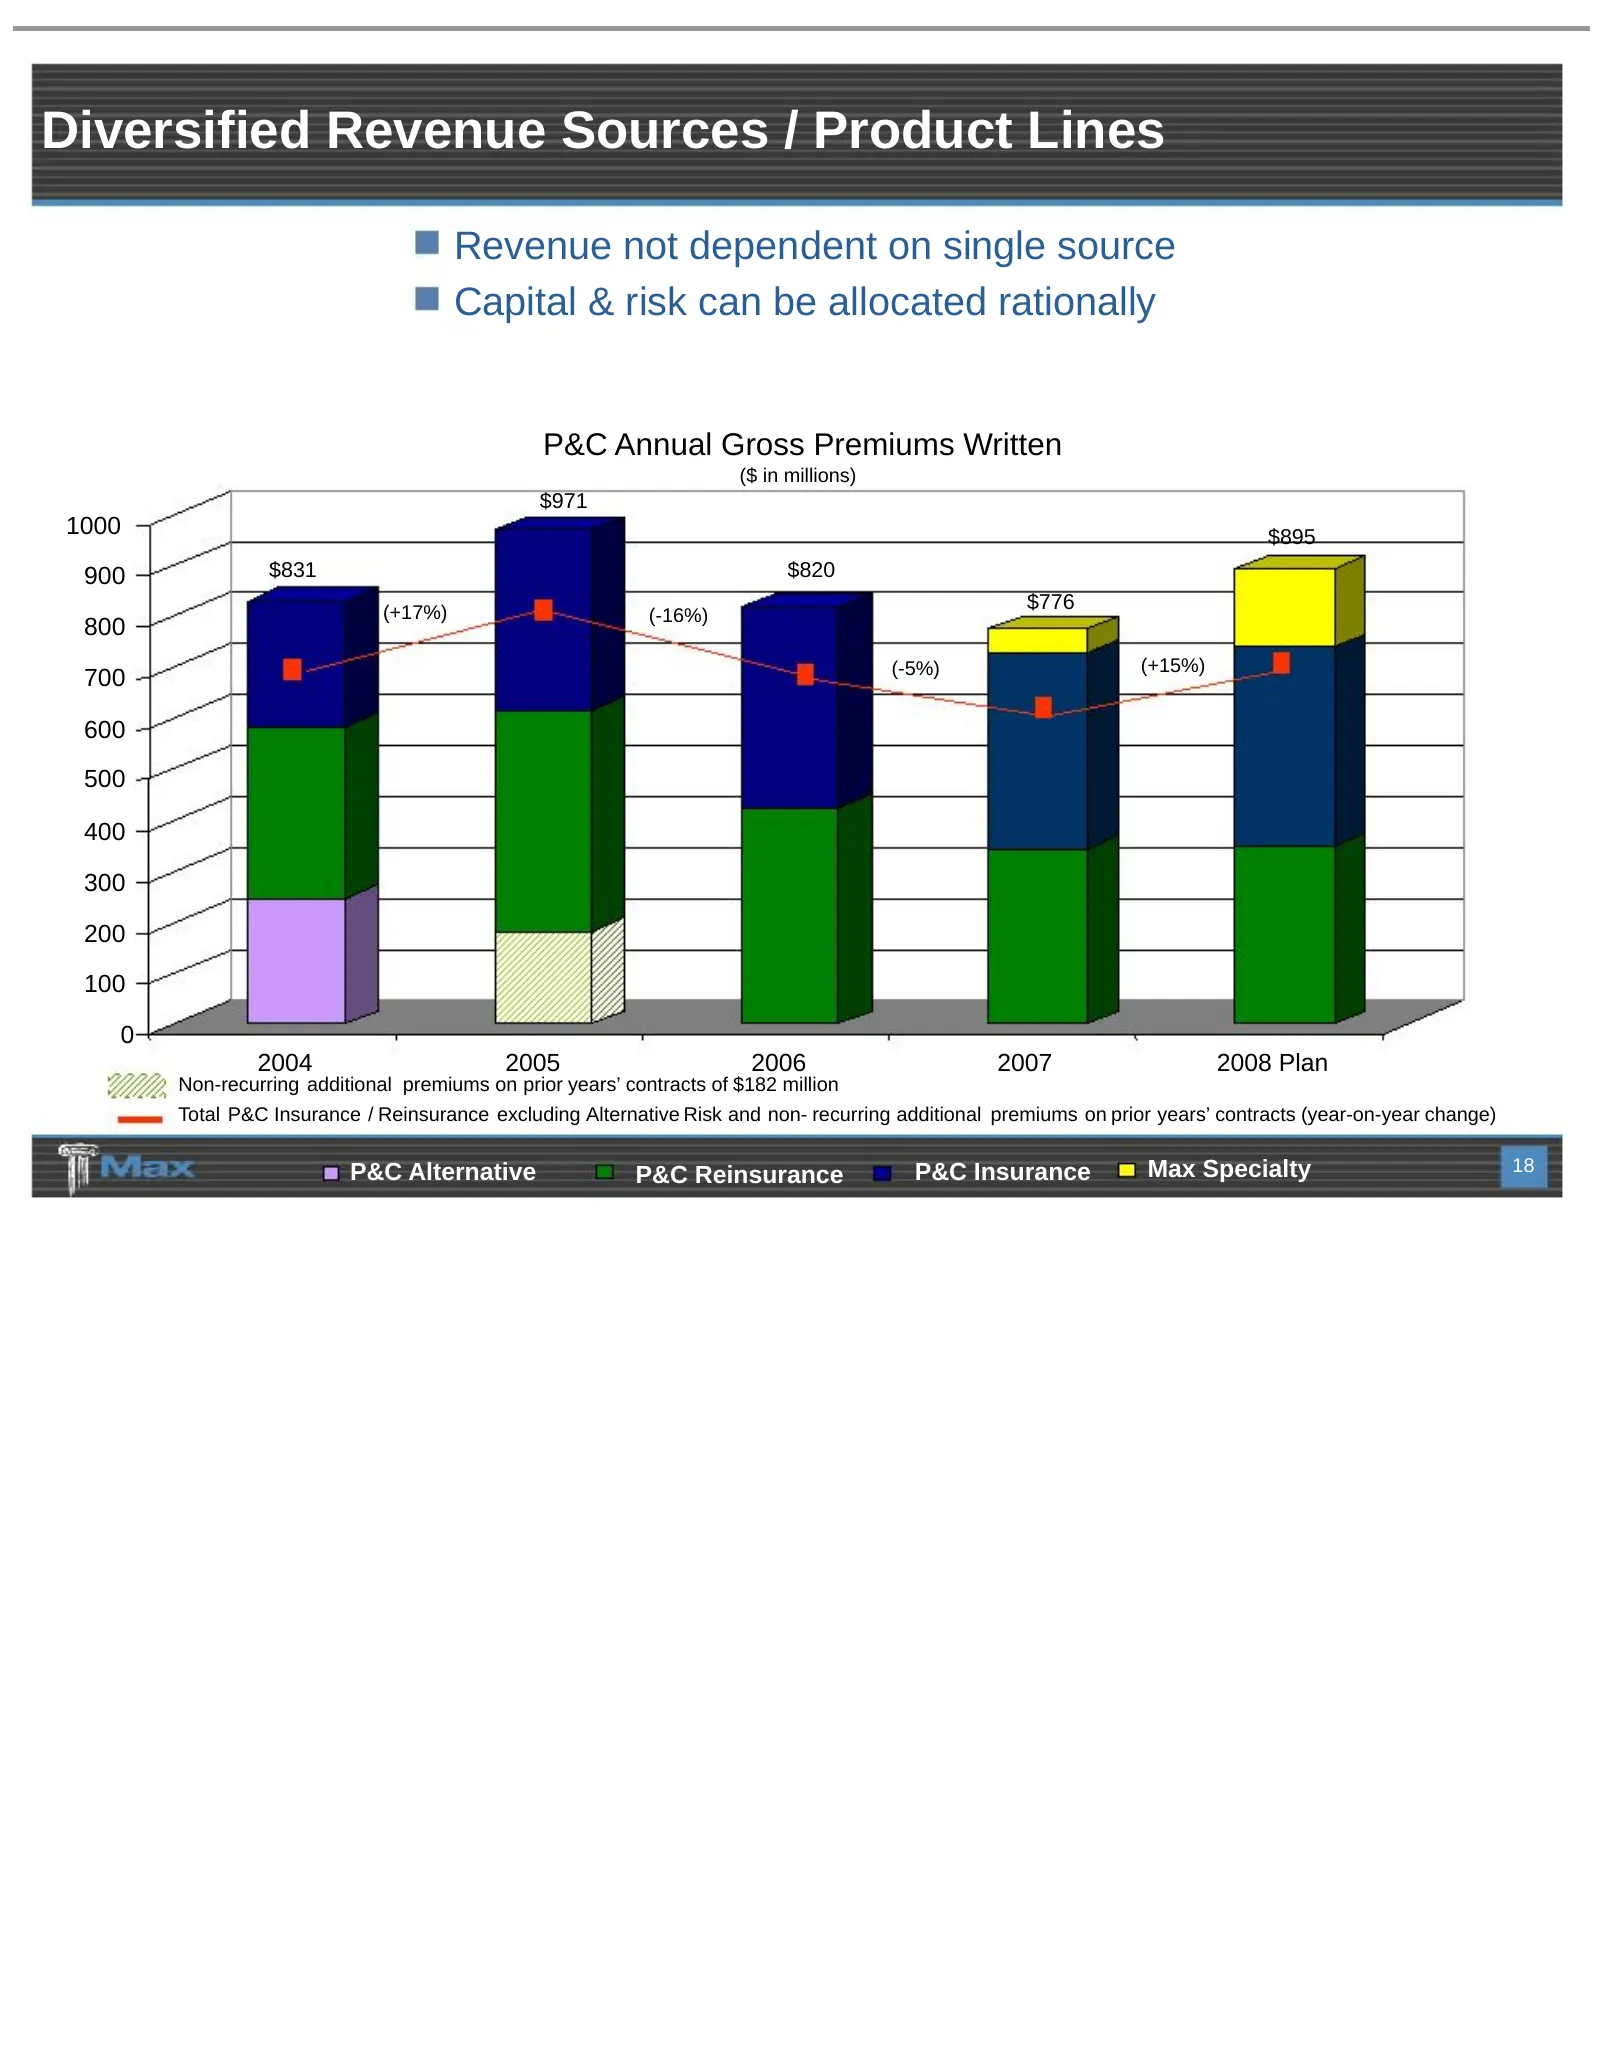
Diversified Revenue Sources / Product Lines Revenue not dependent on single source Capital & risk can be allocated rationally P&C Annual Gross Premiums Written ($ in millions) $971 1000 $895 900 $831 $820 (+17%) $776 (-16%) 800 (-5%) (+15%) 700 600 500 400 300 200 100 0 2004 2005 2006 2007 2008 Plan
Slide 19: Experienced Senior Underwriters - Insurance
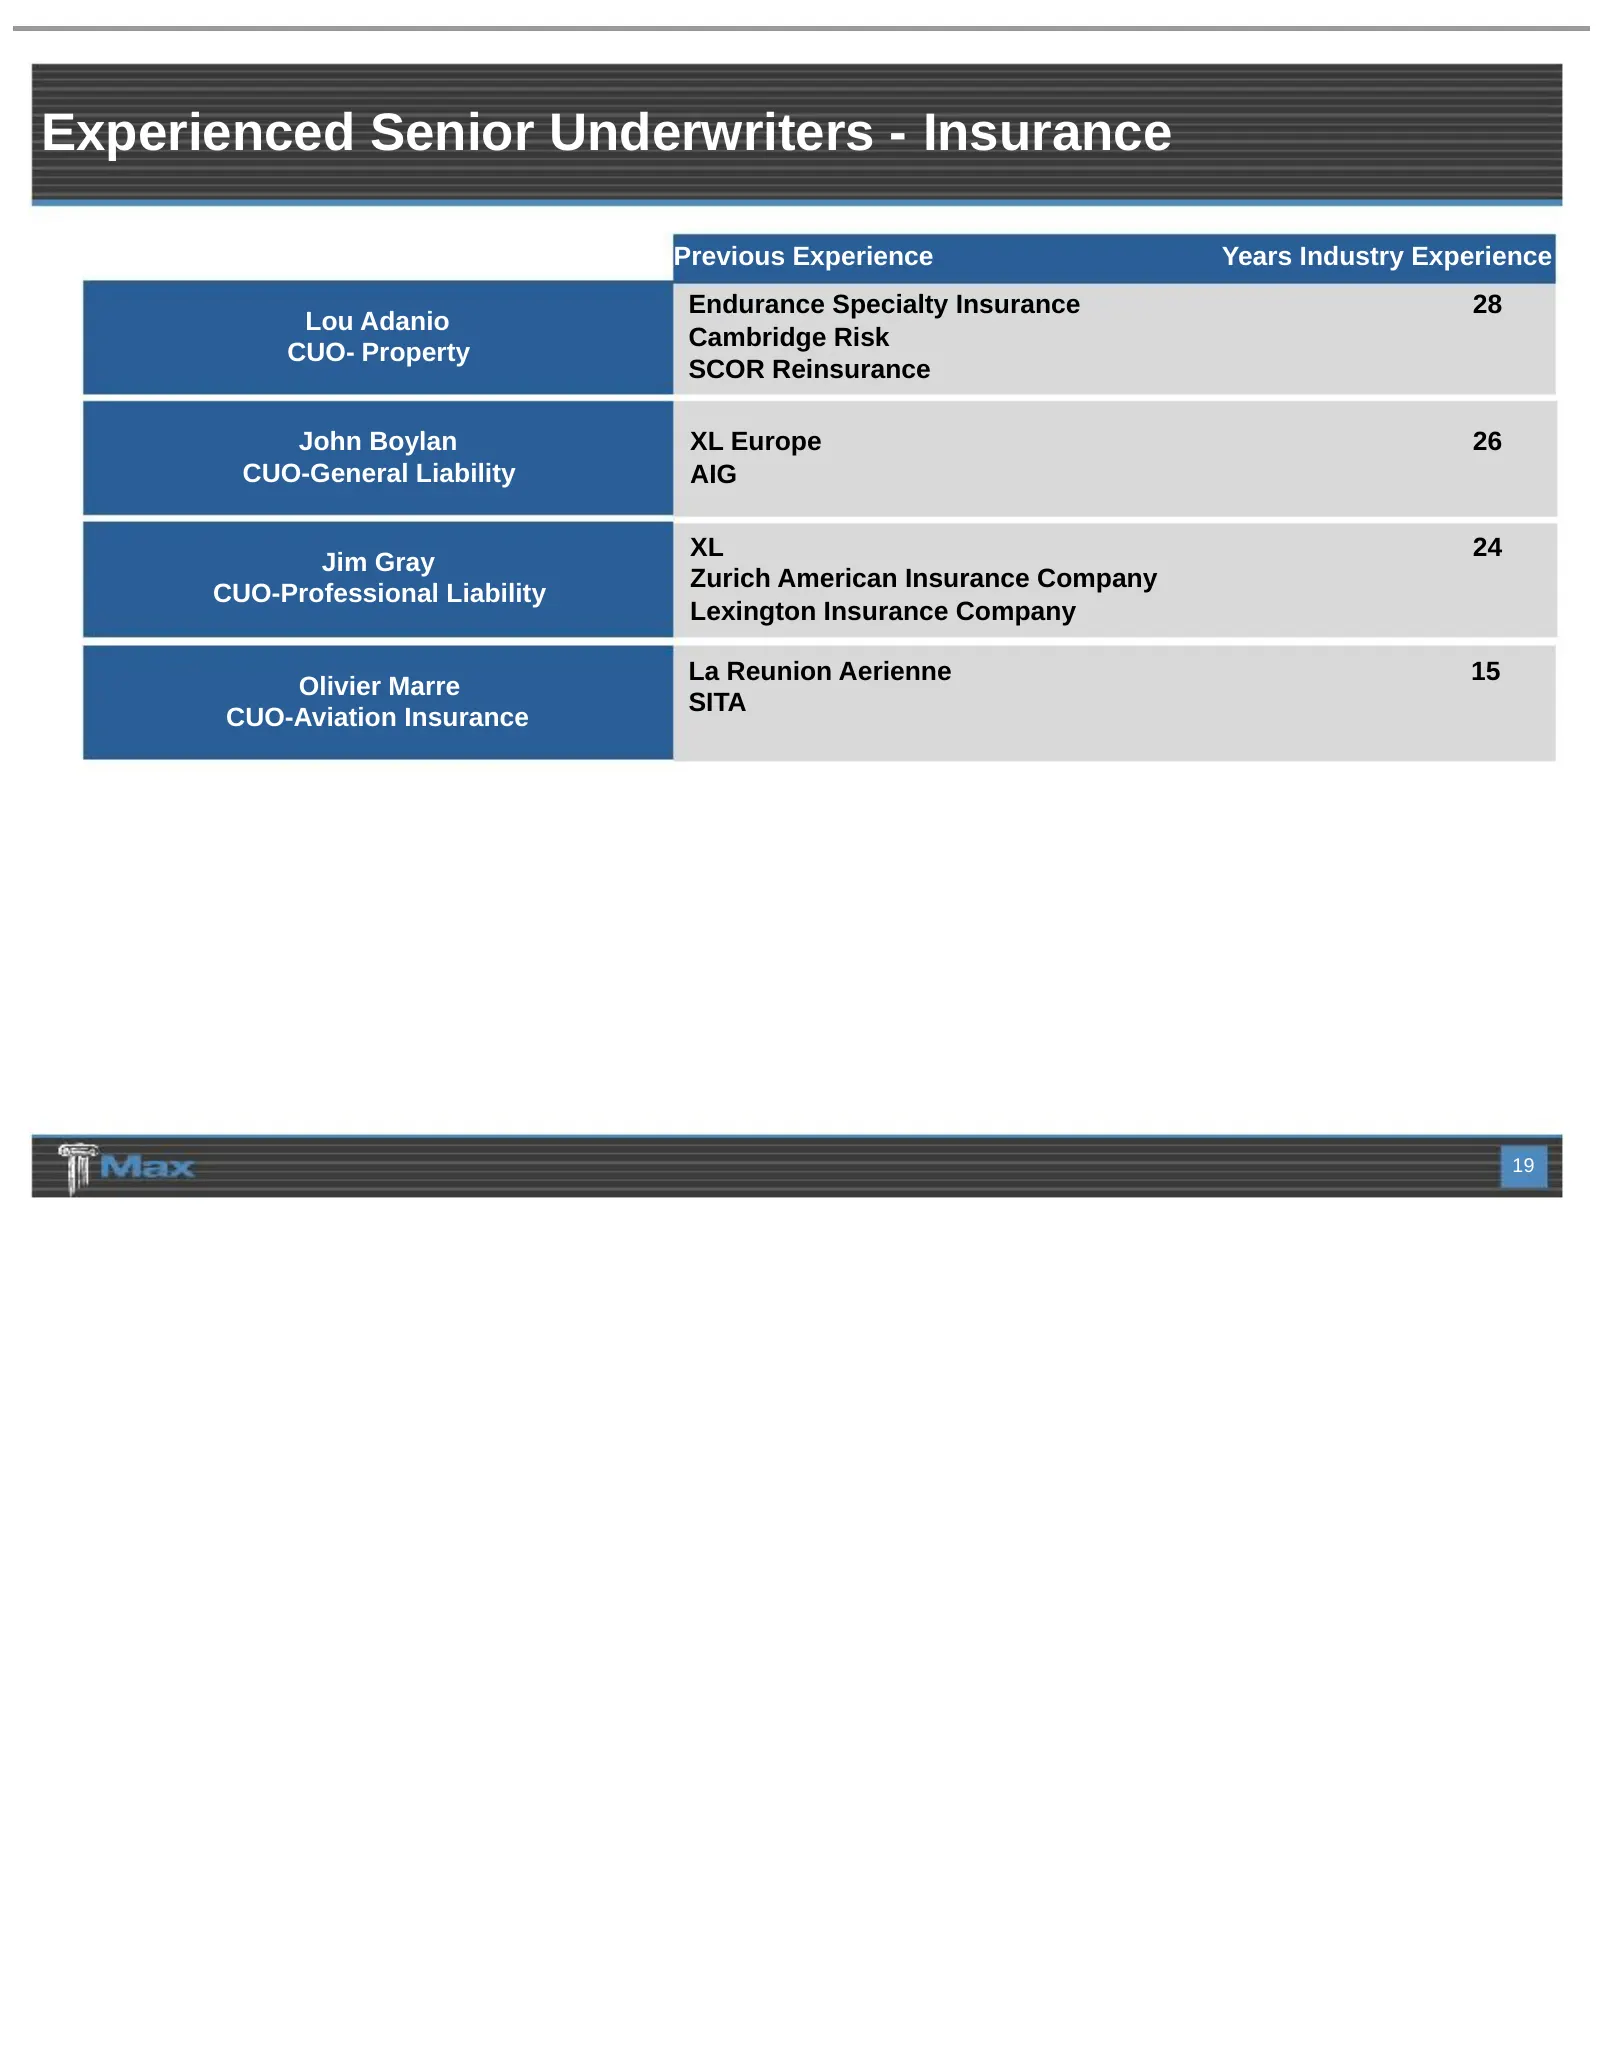
Experienced Senior Underwriters - Insurance Previous Experience Years Industry Experience Endurance Specialty Insurance 28 Lou Adanio Cambridge Risk CUO- Property SCOR Reinsurance John Boylan XL Europe 26 CUO-General Liability AIG XL 24 Jim Gray Zurich American Insurance Company CUO-Professional Lia
Slide 20: P&C Insurance
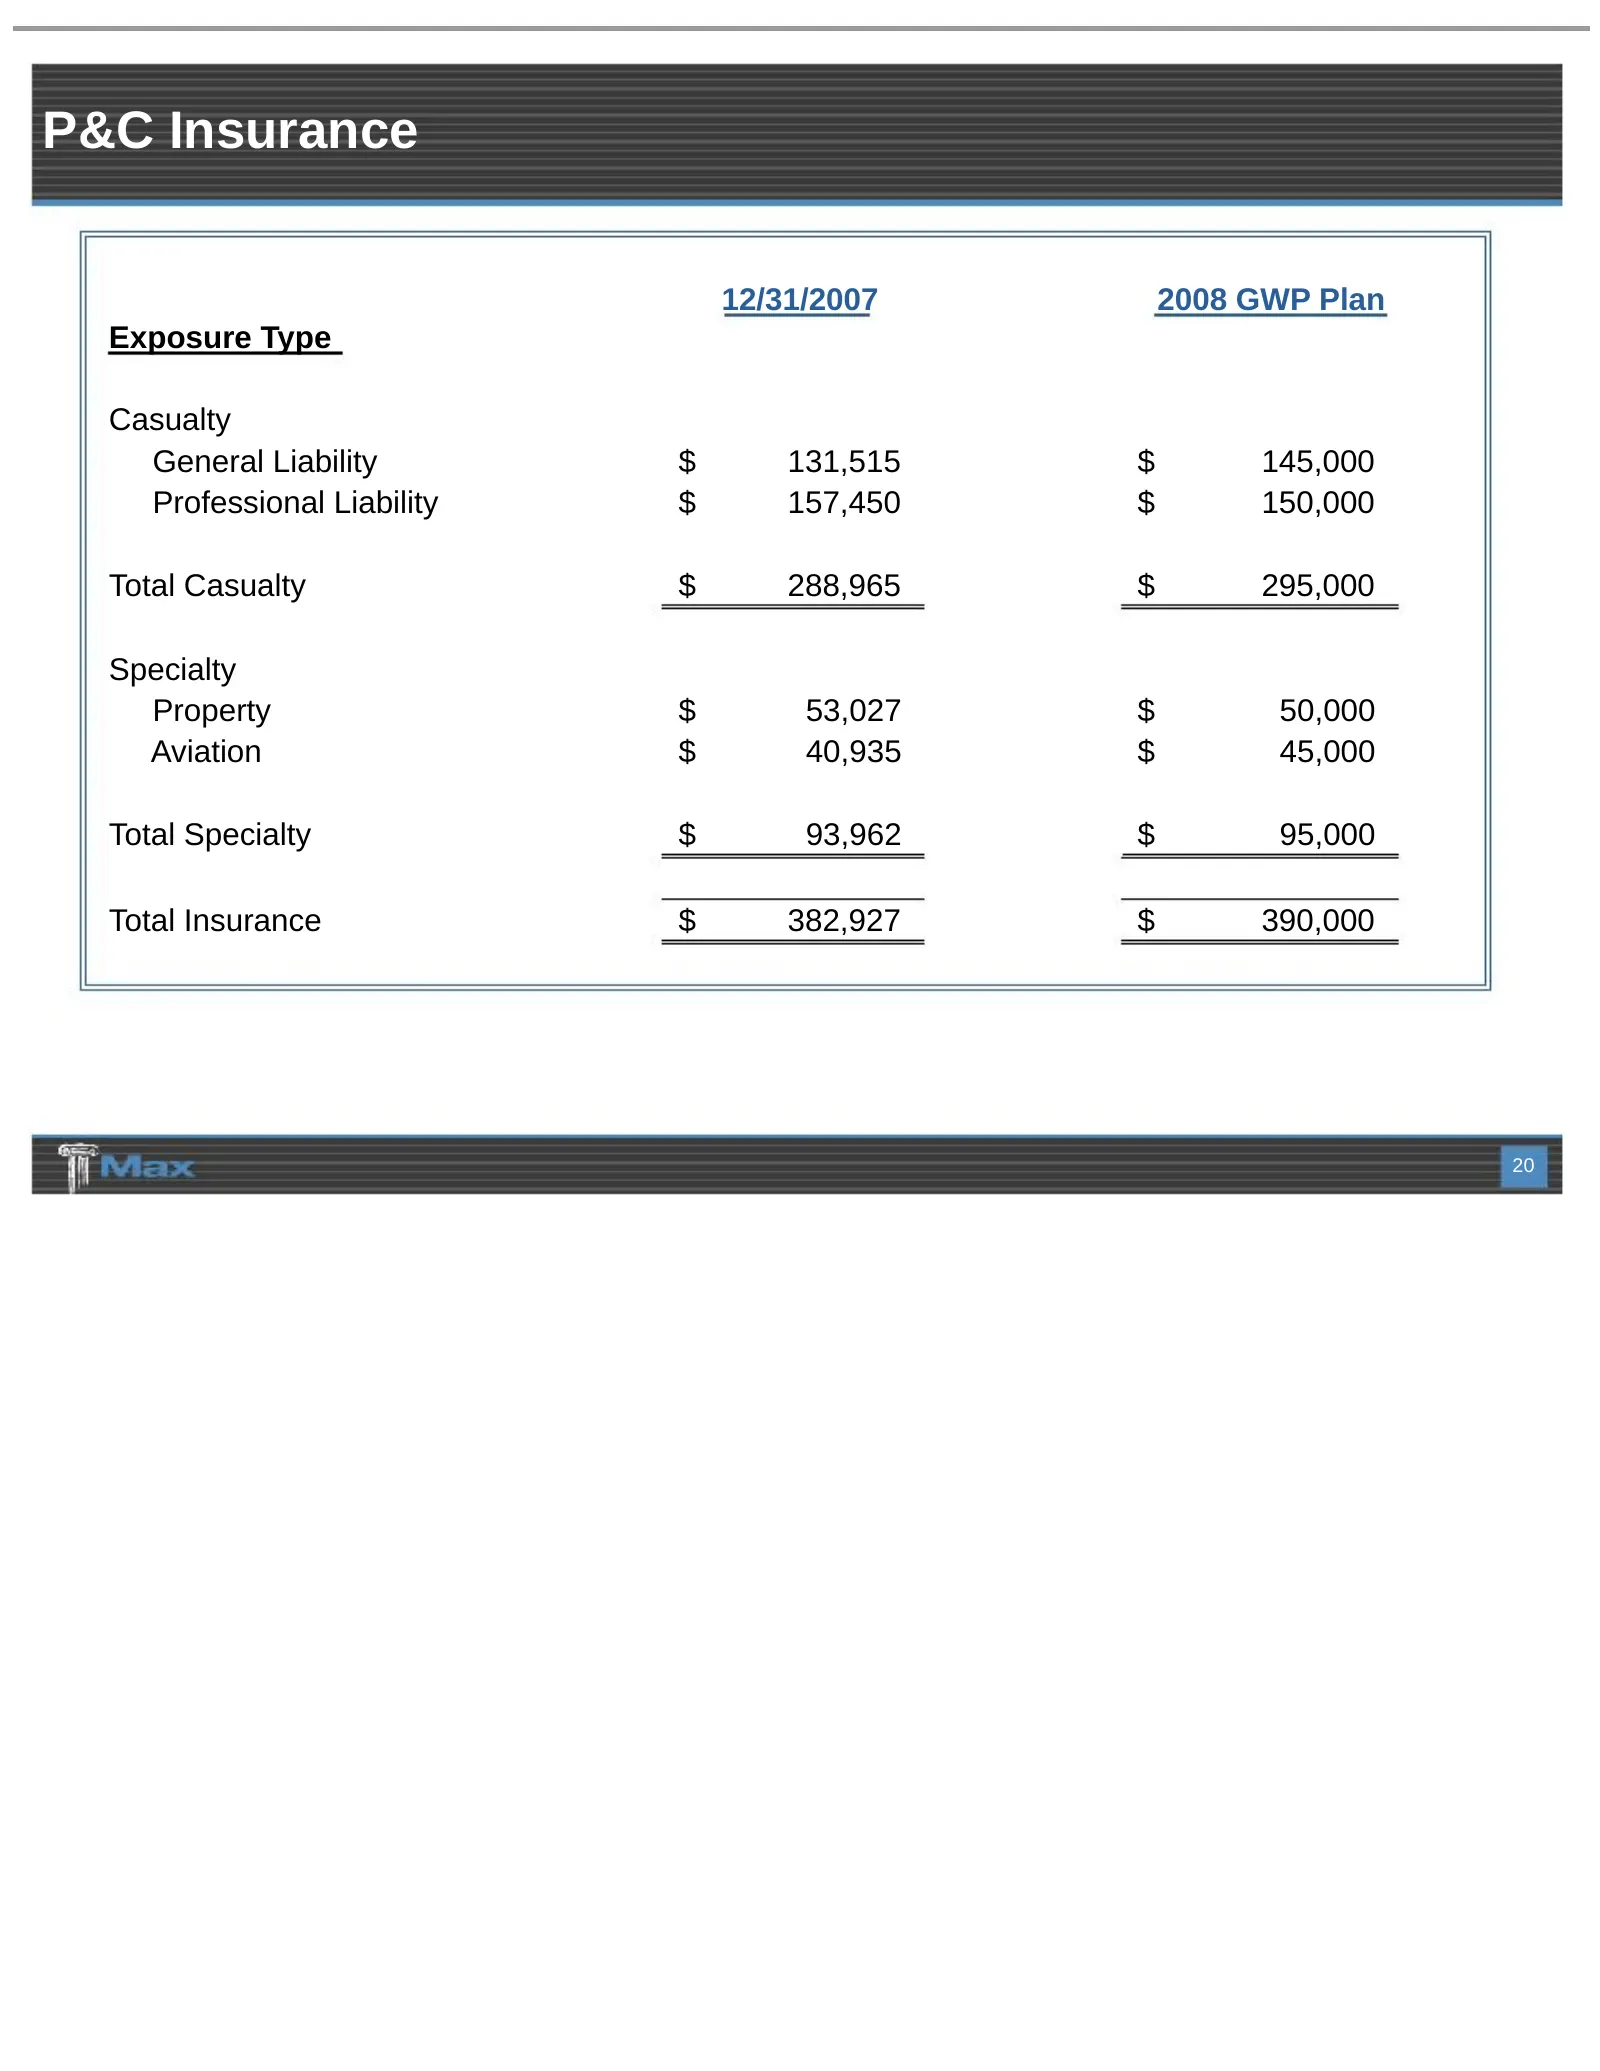
P&C Insurance 12/31/2007 2008 GWP Plan Exposure Type Casualty General Liability $ 131,515 $ 145,000 Professional Liability $ 157,450 $ 150,000 Total Casualty $ 288,965 $ 295,000 Specialty Property $ 53,027 $ 50,000 Aviation $ 40,935 $ 45,000 Total Specialty $ 93,962 $ 95,000 Total Insurance $ 382,92
Slide 21: Casualty Lines
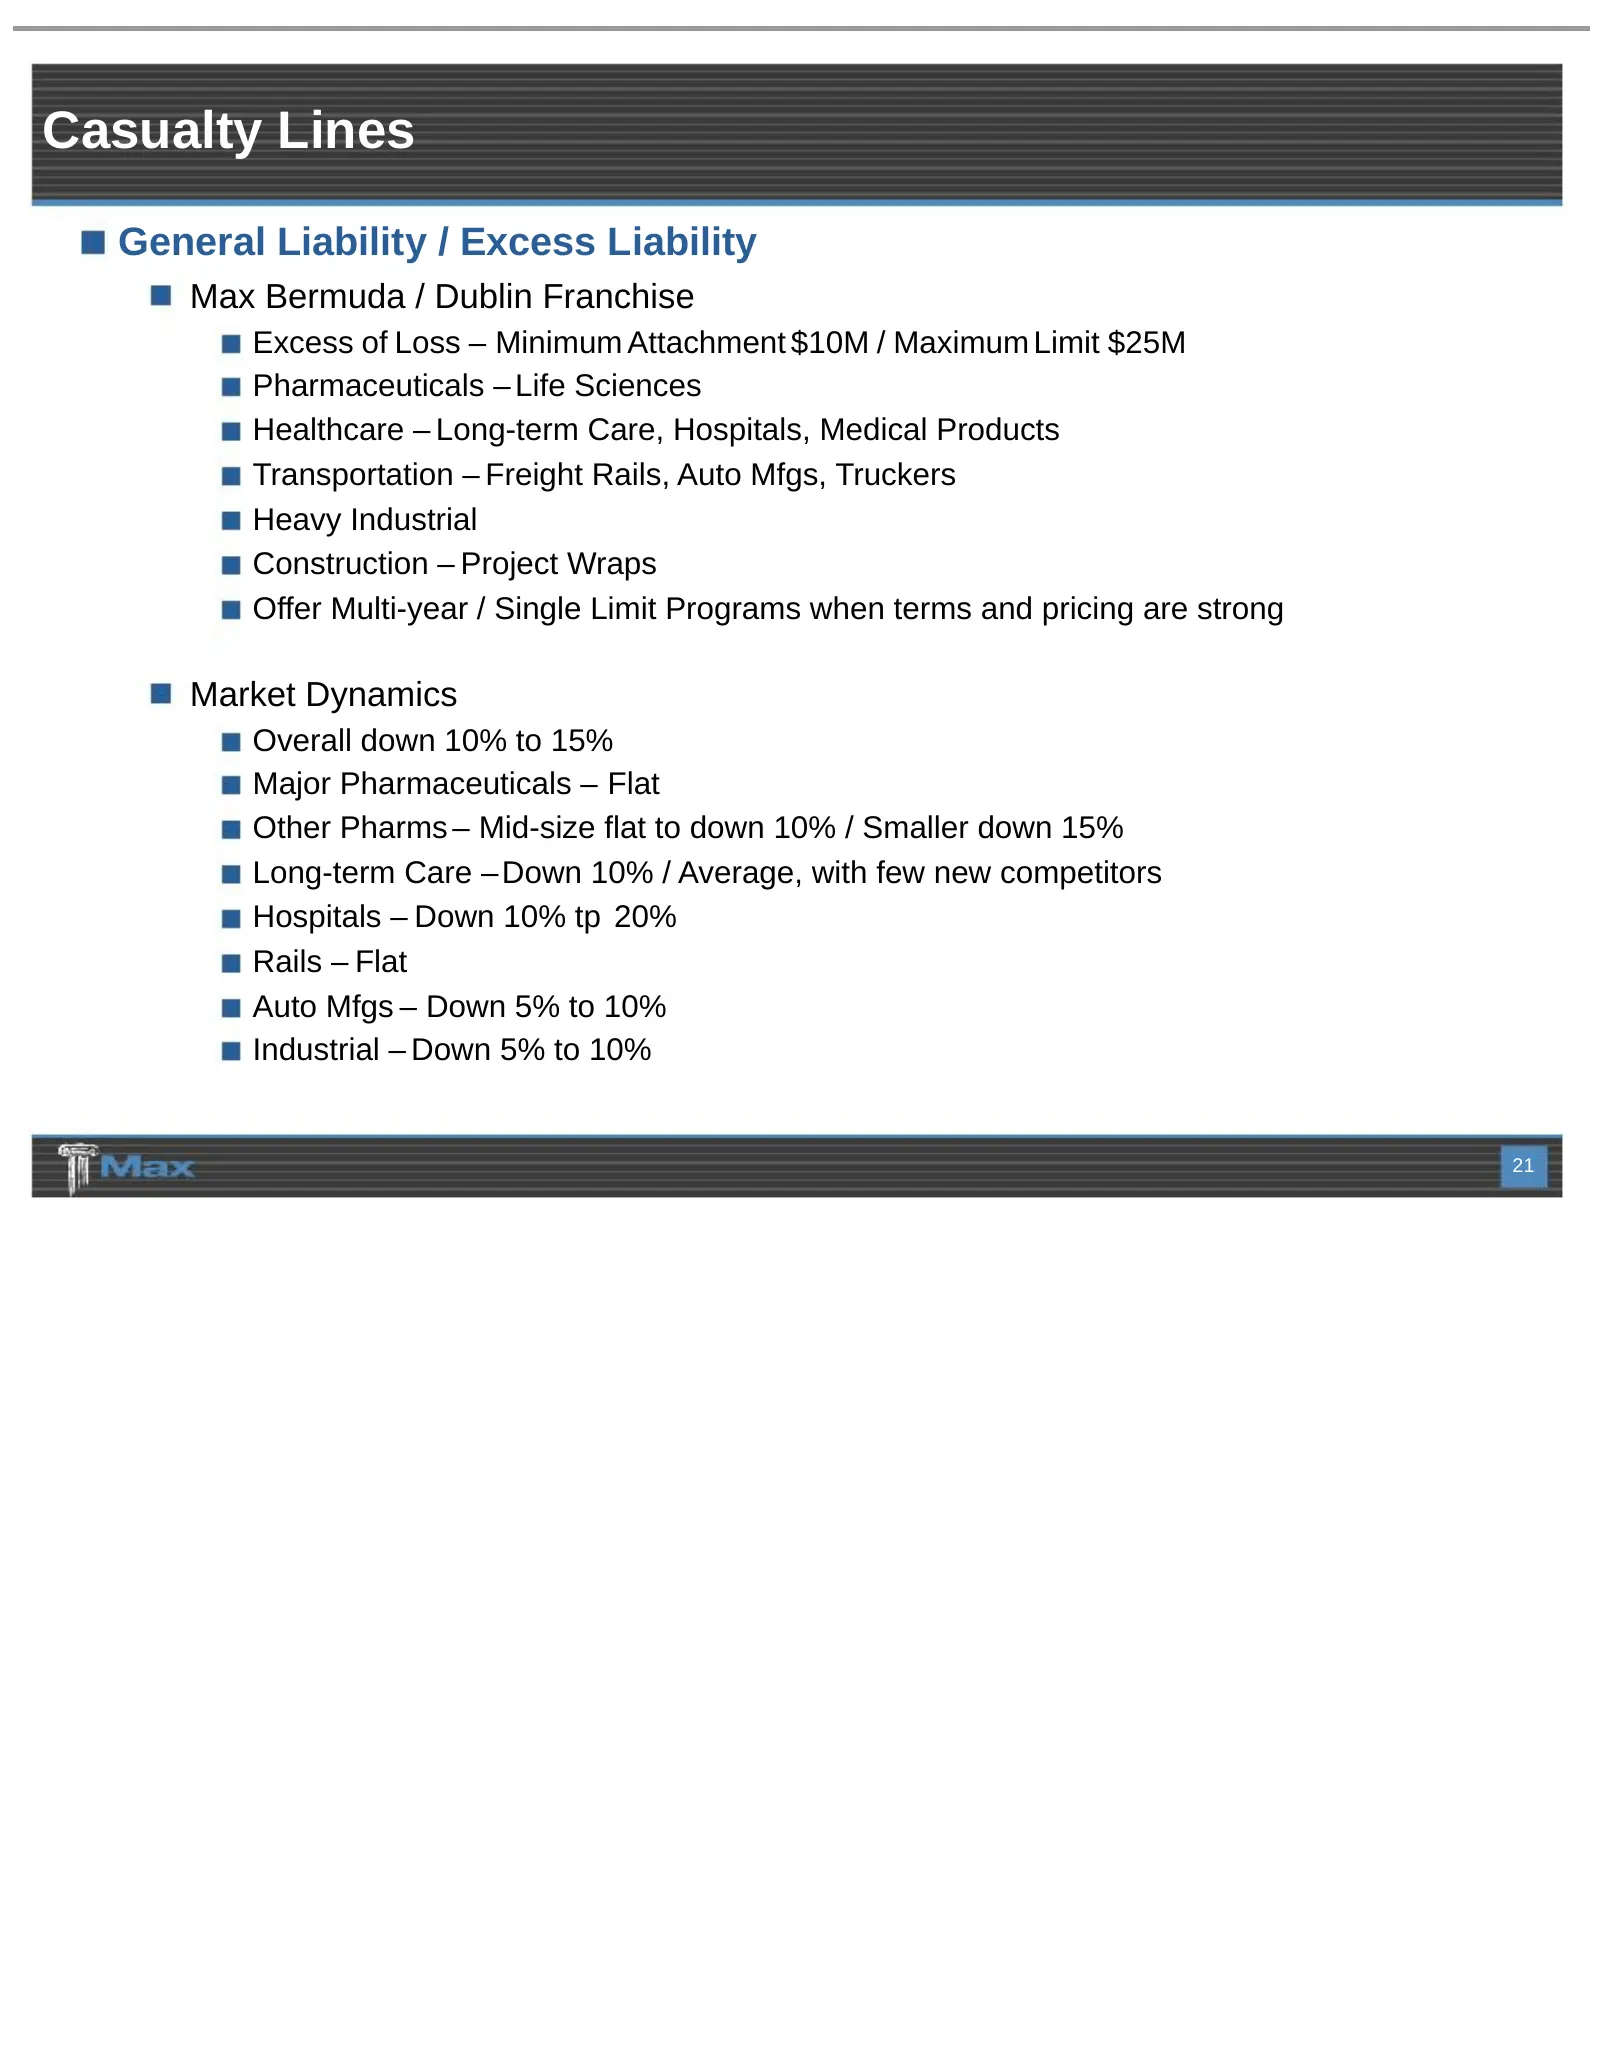
Casualty Lines General Liability / Excess Liability Max Bermuda / Dublin Franchise Excess of Loss – Minimum Attachment $10M / Maximum Limit $25M Pharmaceuticals – Life Sciences Healthcare – Long-term Care, Hospitals, Medical Products Transportation – Freight Rails, Auto Mfgs, Truckers Heavy Industri
Slide 22: Casualty Lines
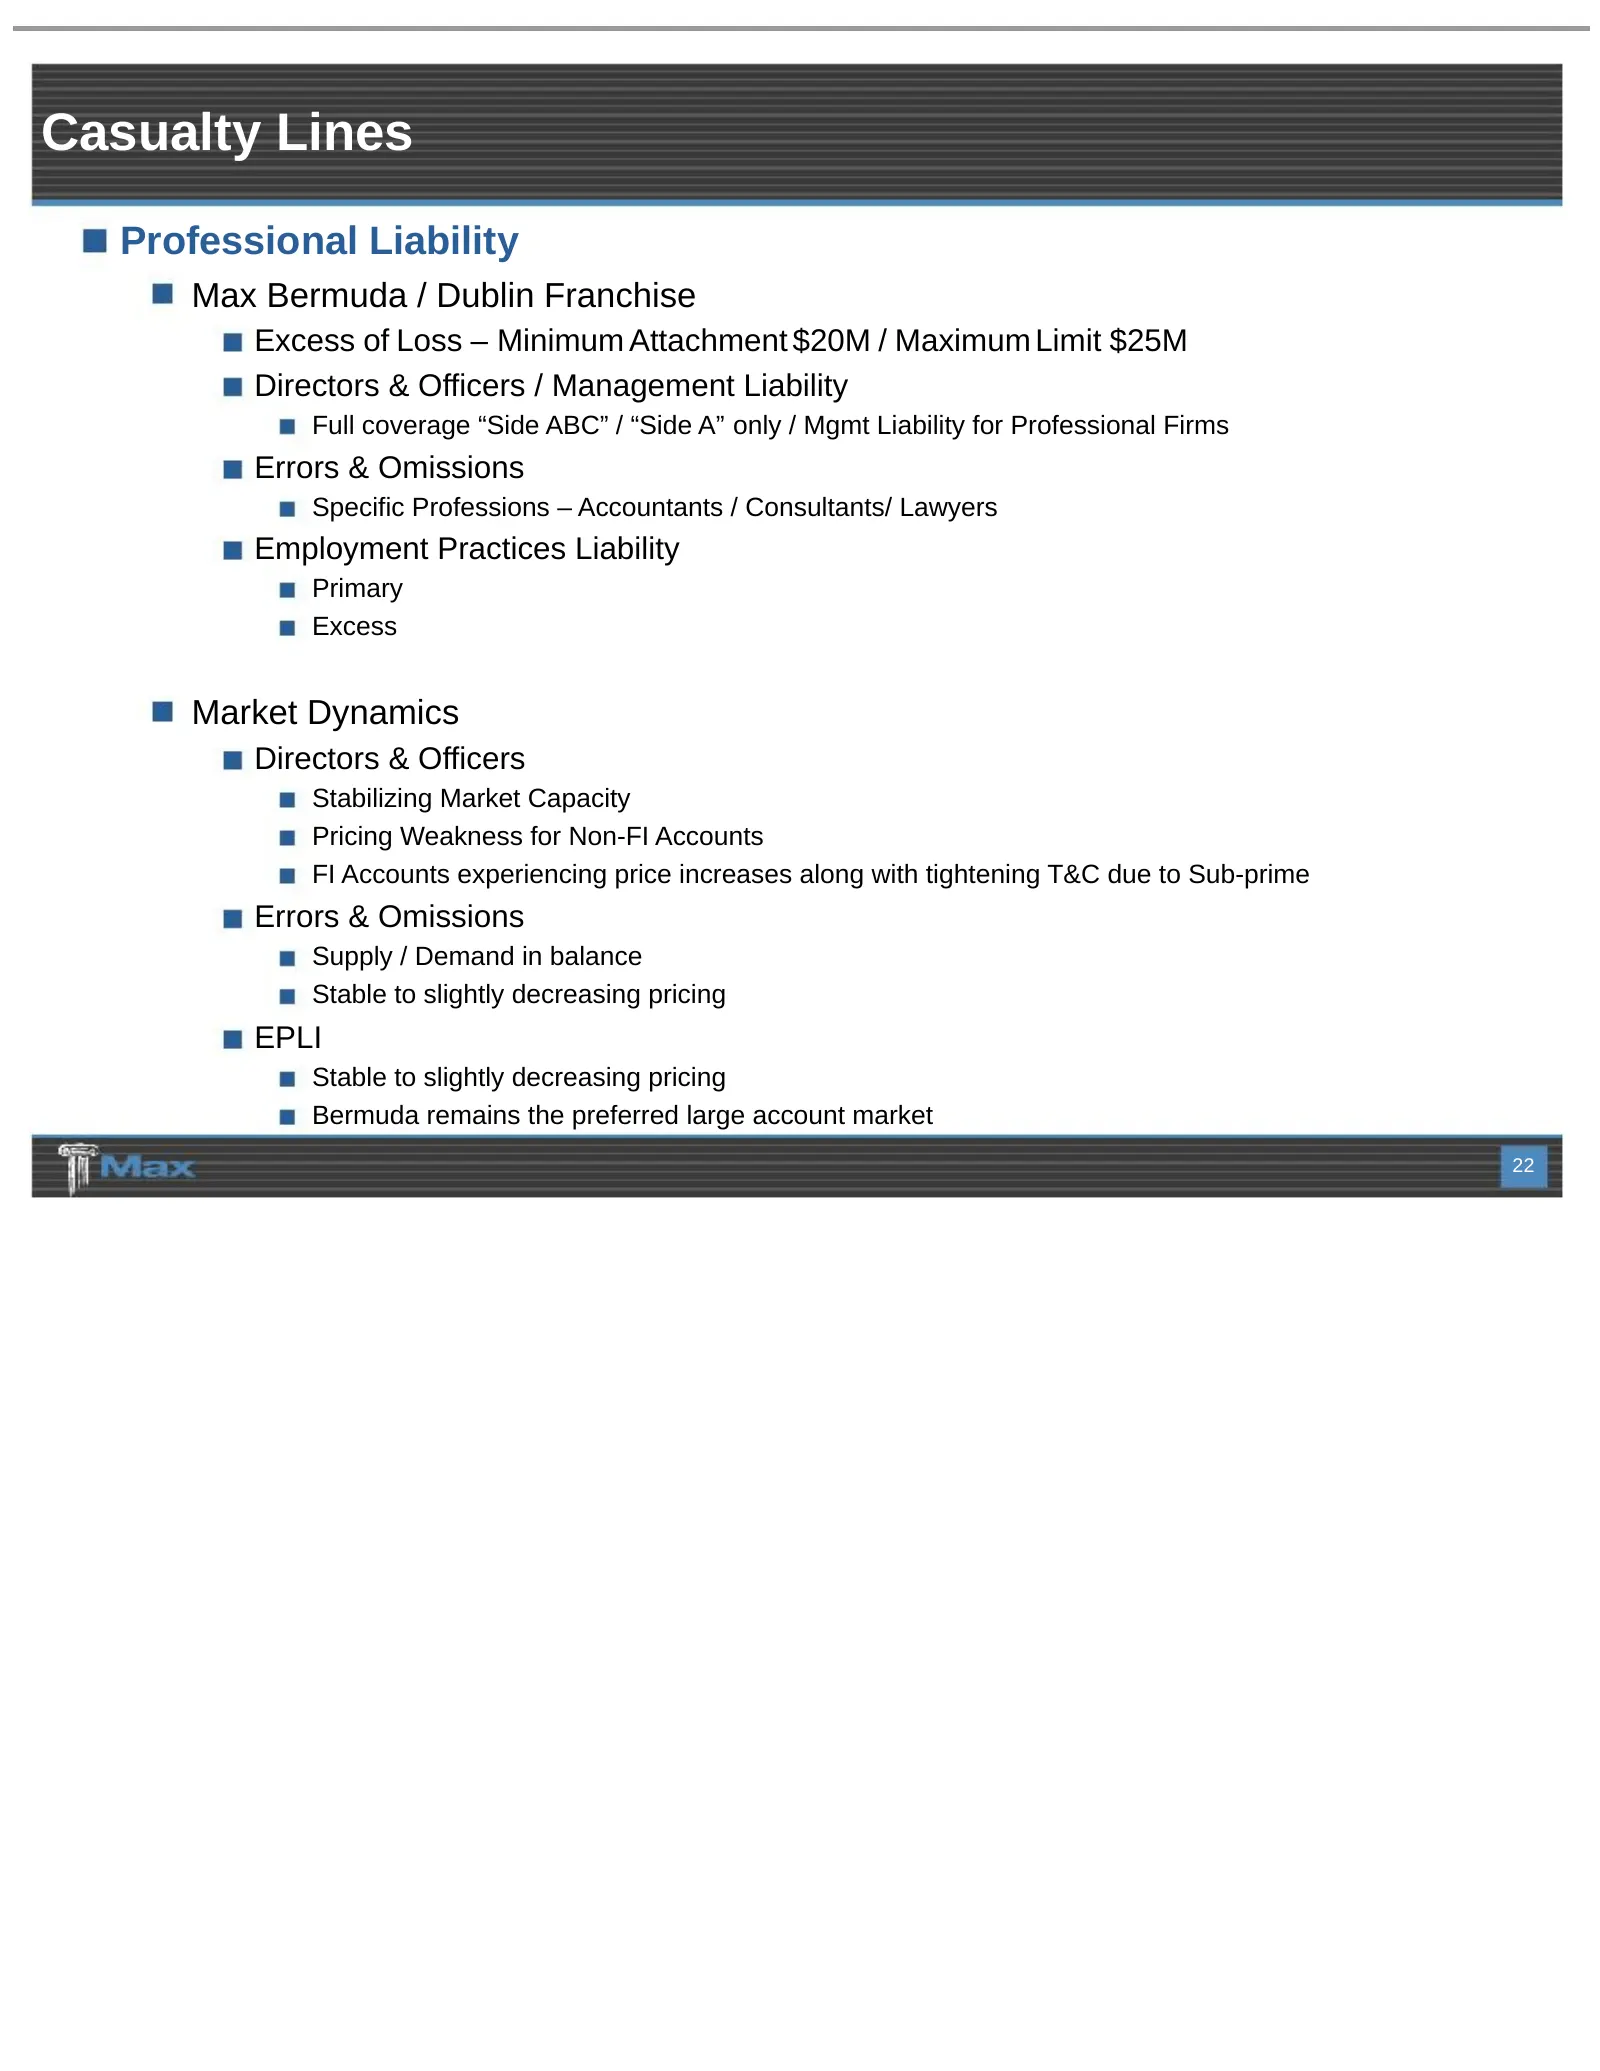
Casualty Lines Professional Liability Max Bermuda / Dublin Franchise Excess of Loss – Minimum Attachment $20M / Maximum Limit $25M Directors & Officers / Management Liability Full coverage “Side ABC” / “Side A” only / Mgmt Liability for Professional Firms Errors & Omissions Specific Professions – Ac
Slide 23: Specialty Lines
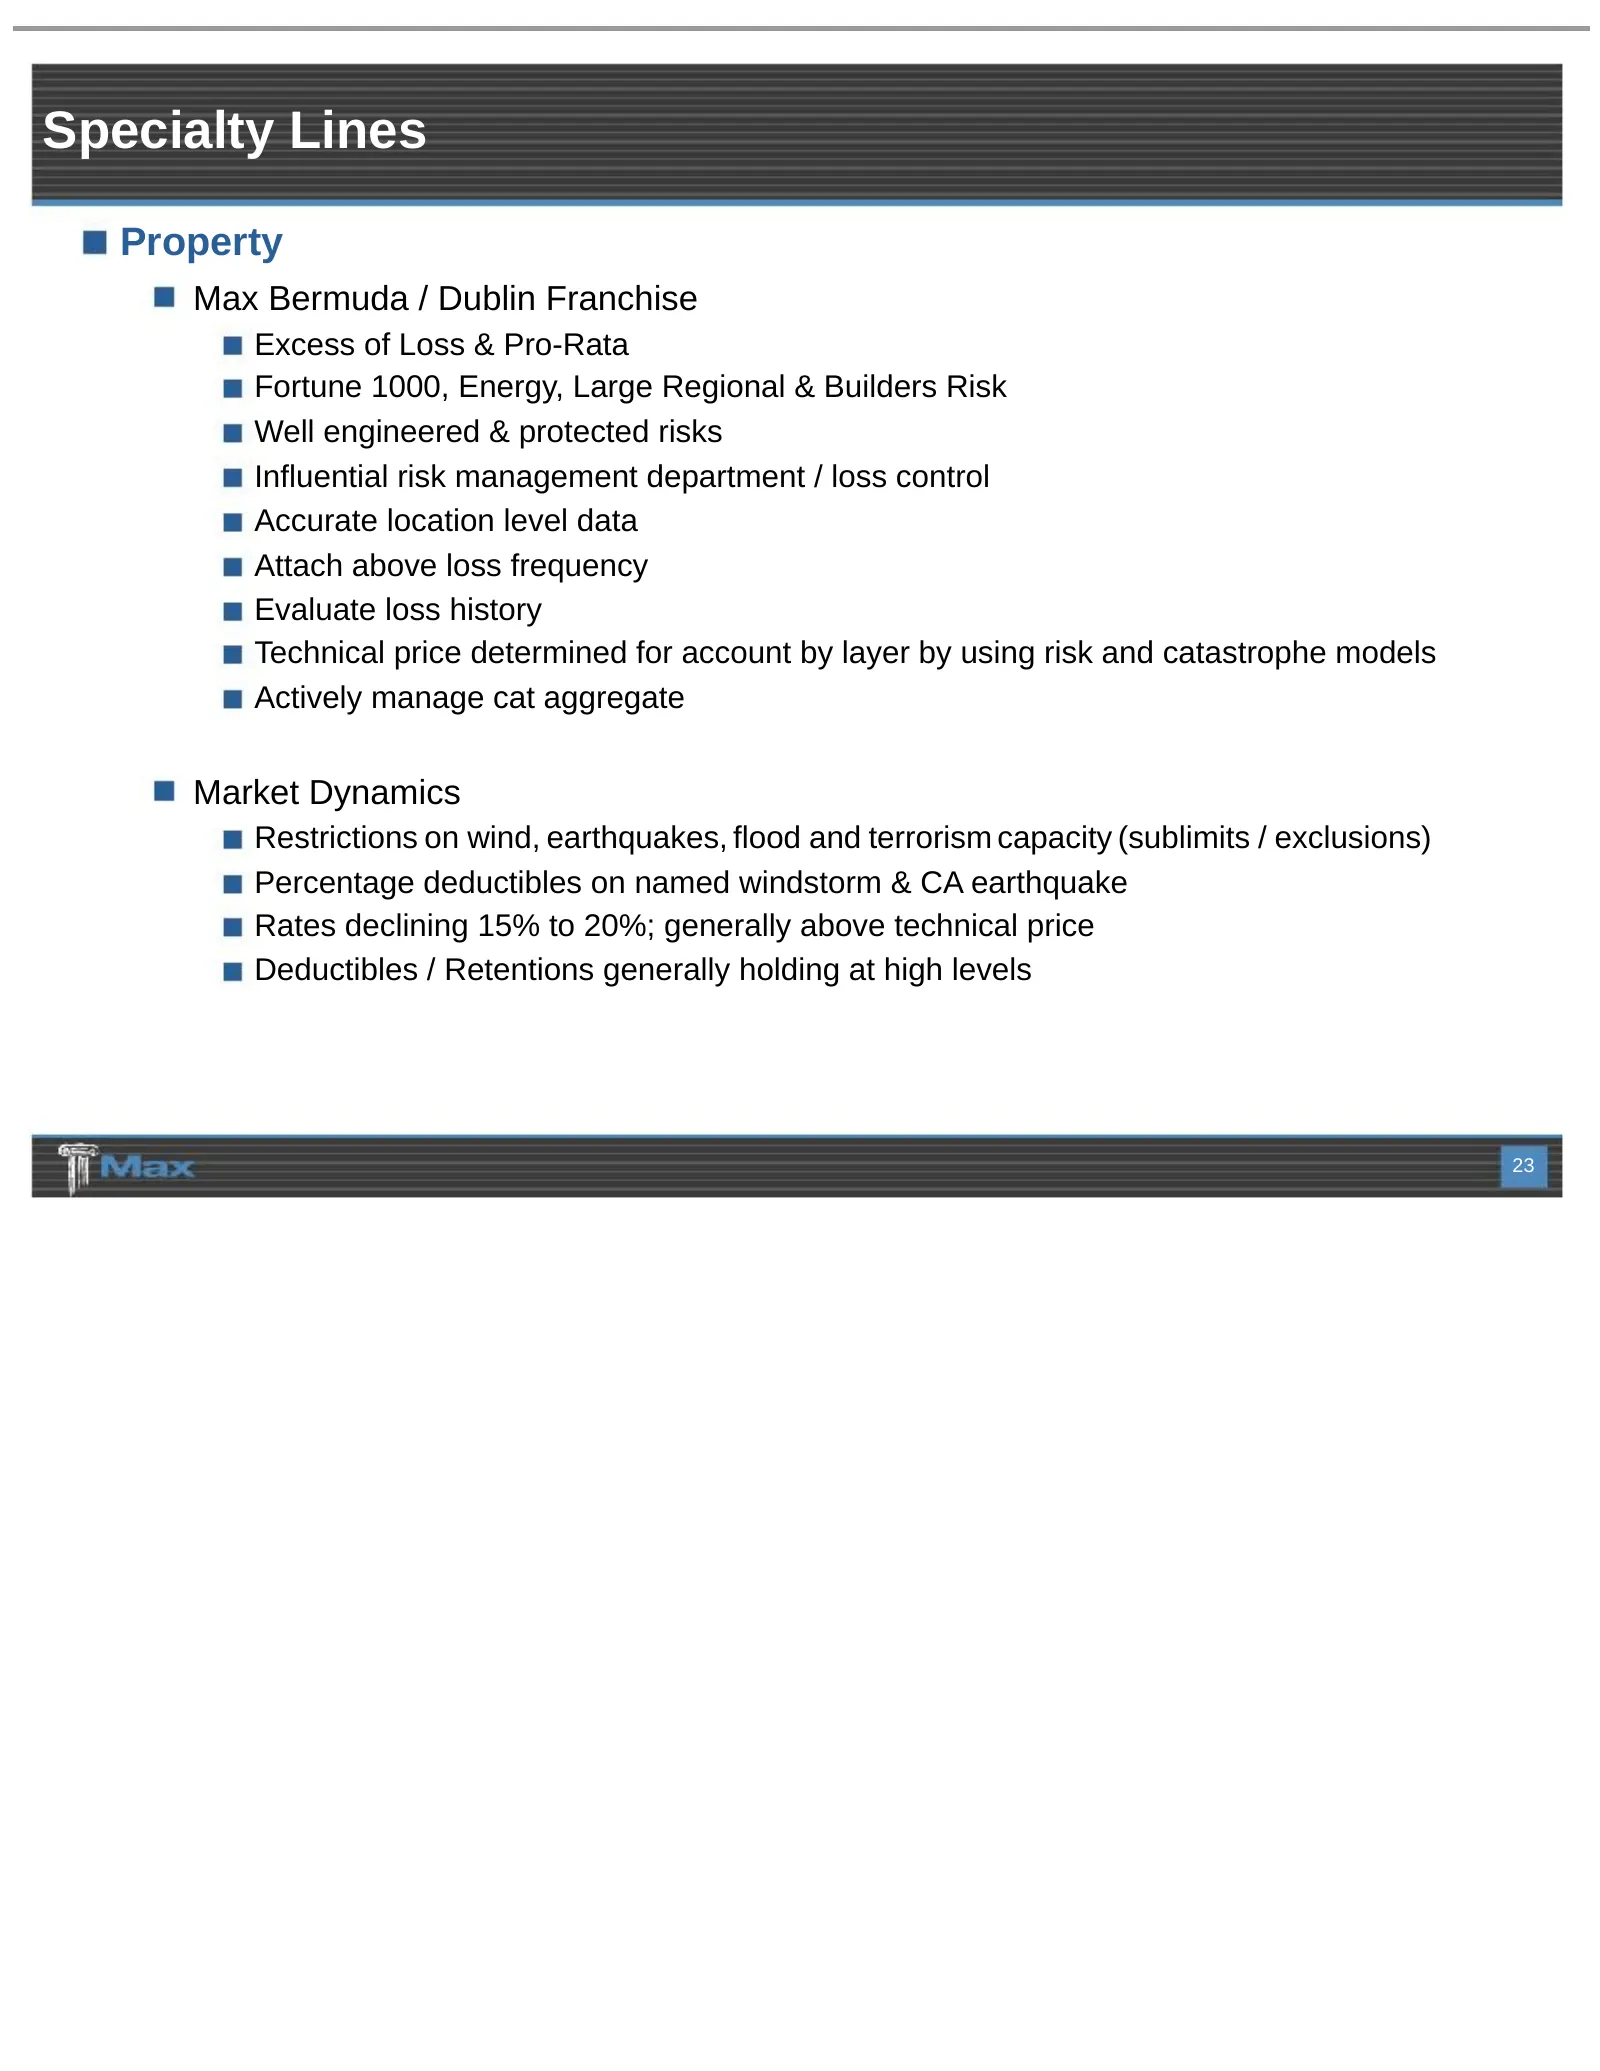
Specialty Lines Property Max Bermuda / Dublin Franchise Excess of Loss & Pro-Rata Fortune 1000, Energy, Large Regional & Builders Risk Well engineered & protected risks Influential risk management department / loss control Accurate location level data Attach above loss frequency Evaluate loss histor
Slide 24: Specialty Lines
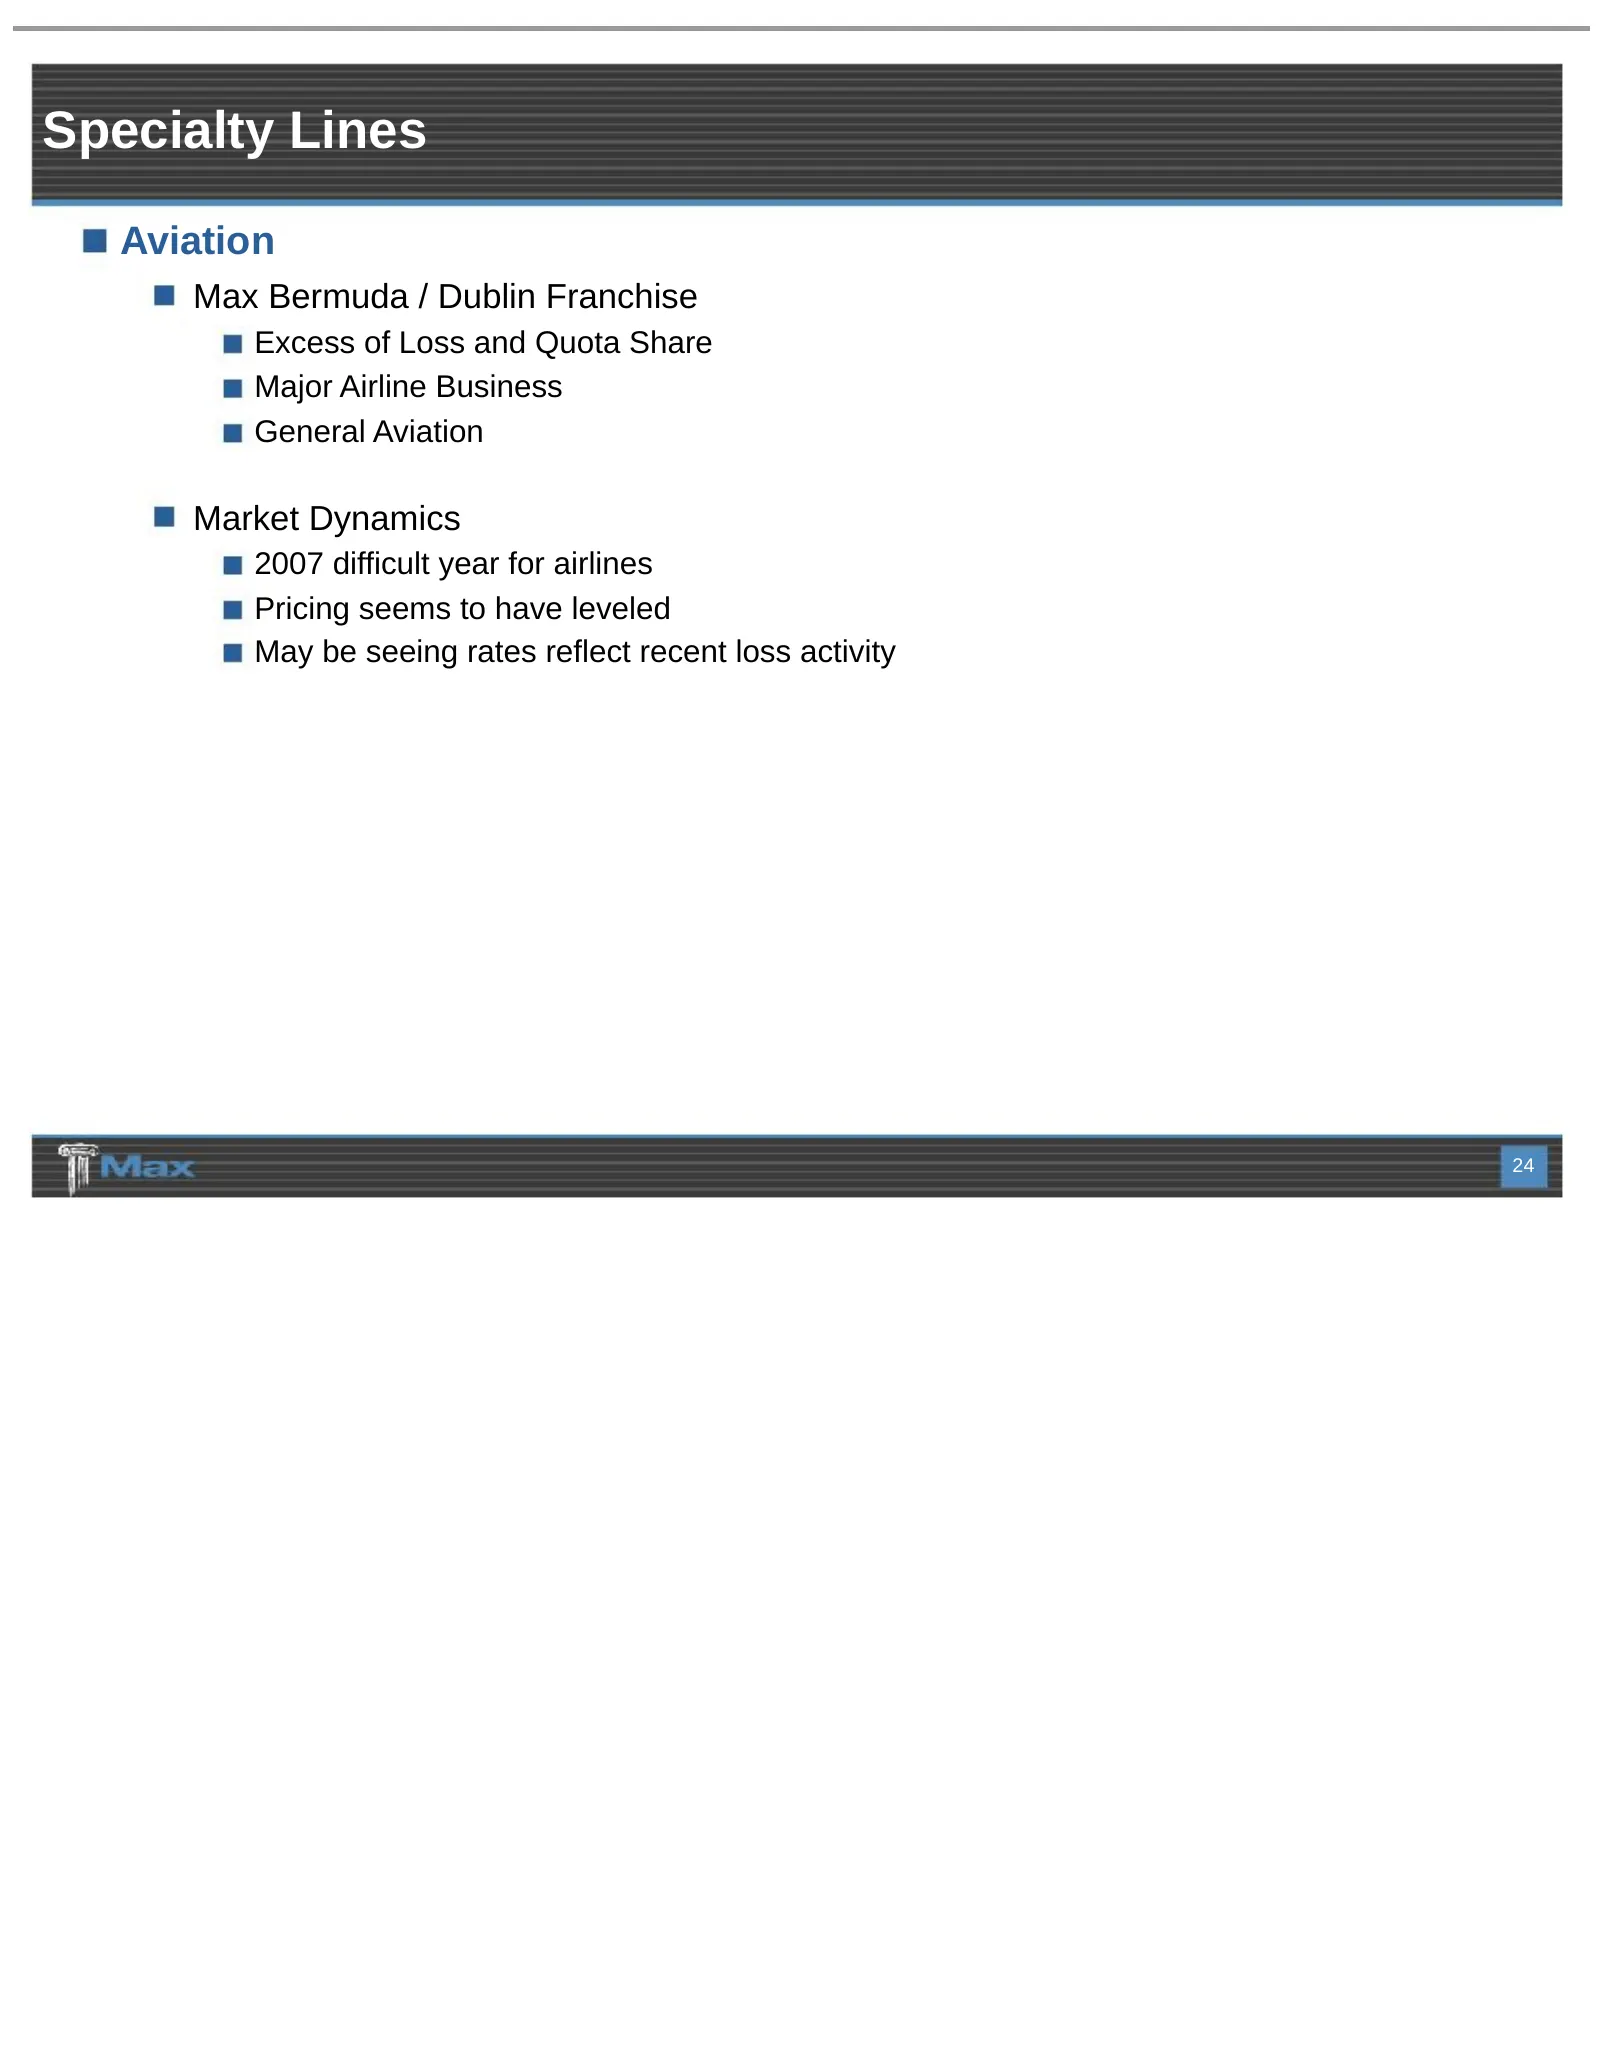
Specialty Lines Aviation Max Bermuda / Dublin Franchise Excess of Loss and Quota Share Major Airline Business General Aviation Market Dynamics 2007 difficult year for airlines Pricing seems to have leveled May be seeing rates reflect recent loss activity 24
Slide 25: Overview of P&C Reinsurance
Overview of P&C Reinsurance John Doucette
Slide 26: Experienced Senior Underwriters – Reinsurance
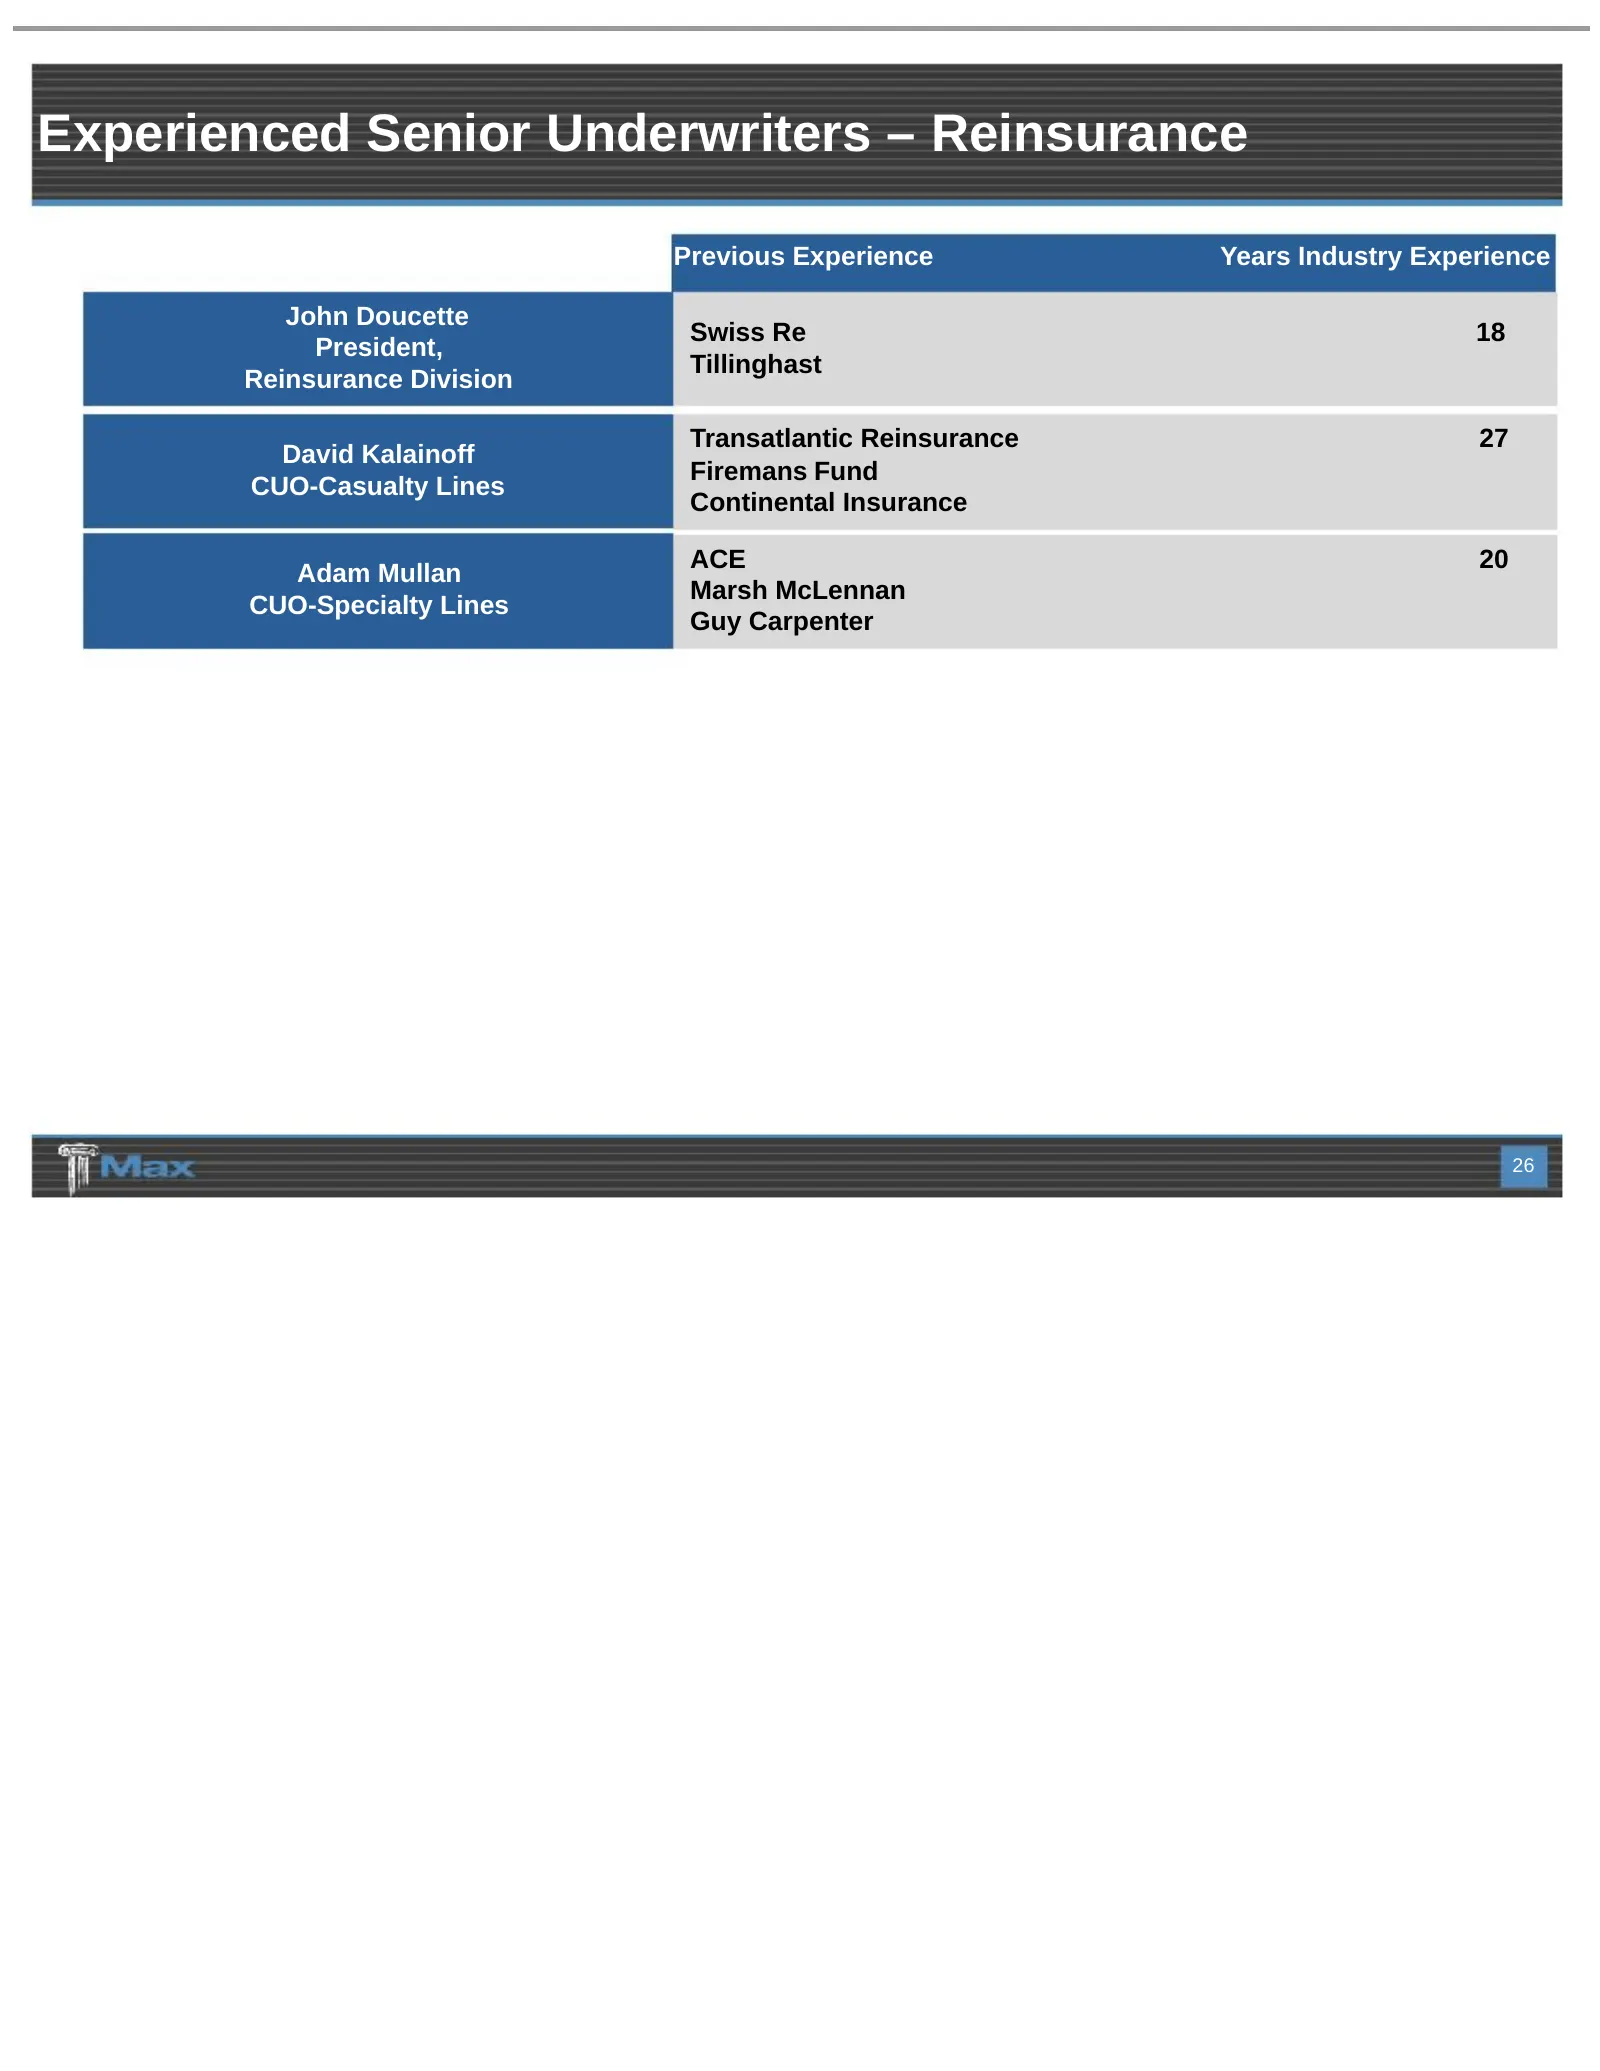
Experienced Senior Underwriters – Reinsurance Previous Experience Years Industry Experience John Doucette Swiss Re 18 President, Tillinghast Reinsurance Division Transatlantic Reinsurance 27 David Kalainoff Firemans Fund CUO-Casualty Lines Continental Insurance ACE 20 Adam Mullan Marsh McLennan CUO-
Slide 27: P&C Reinsurance
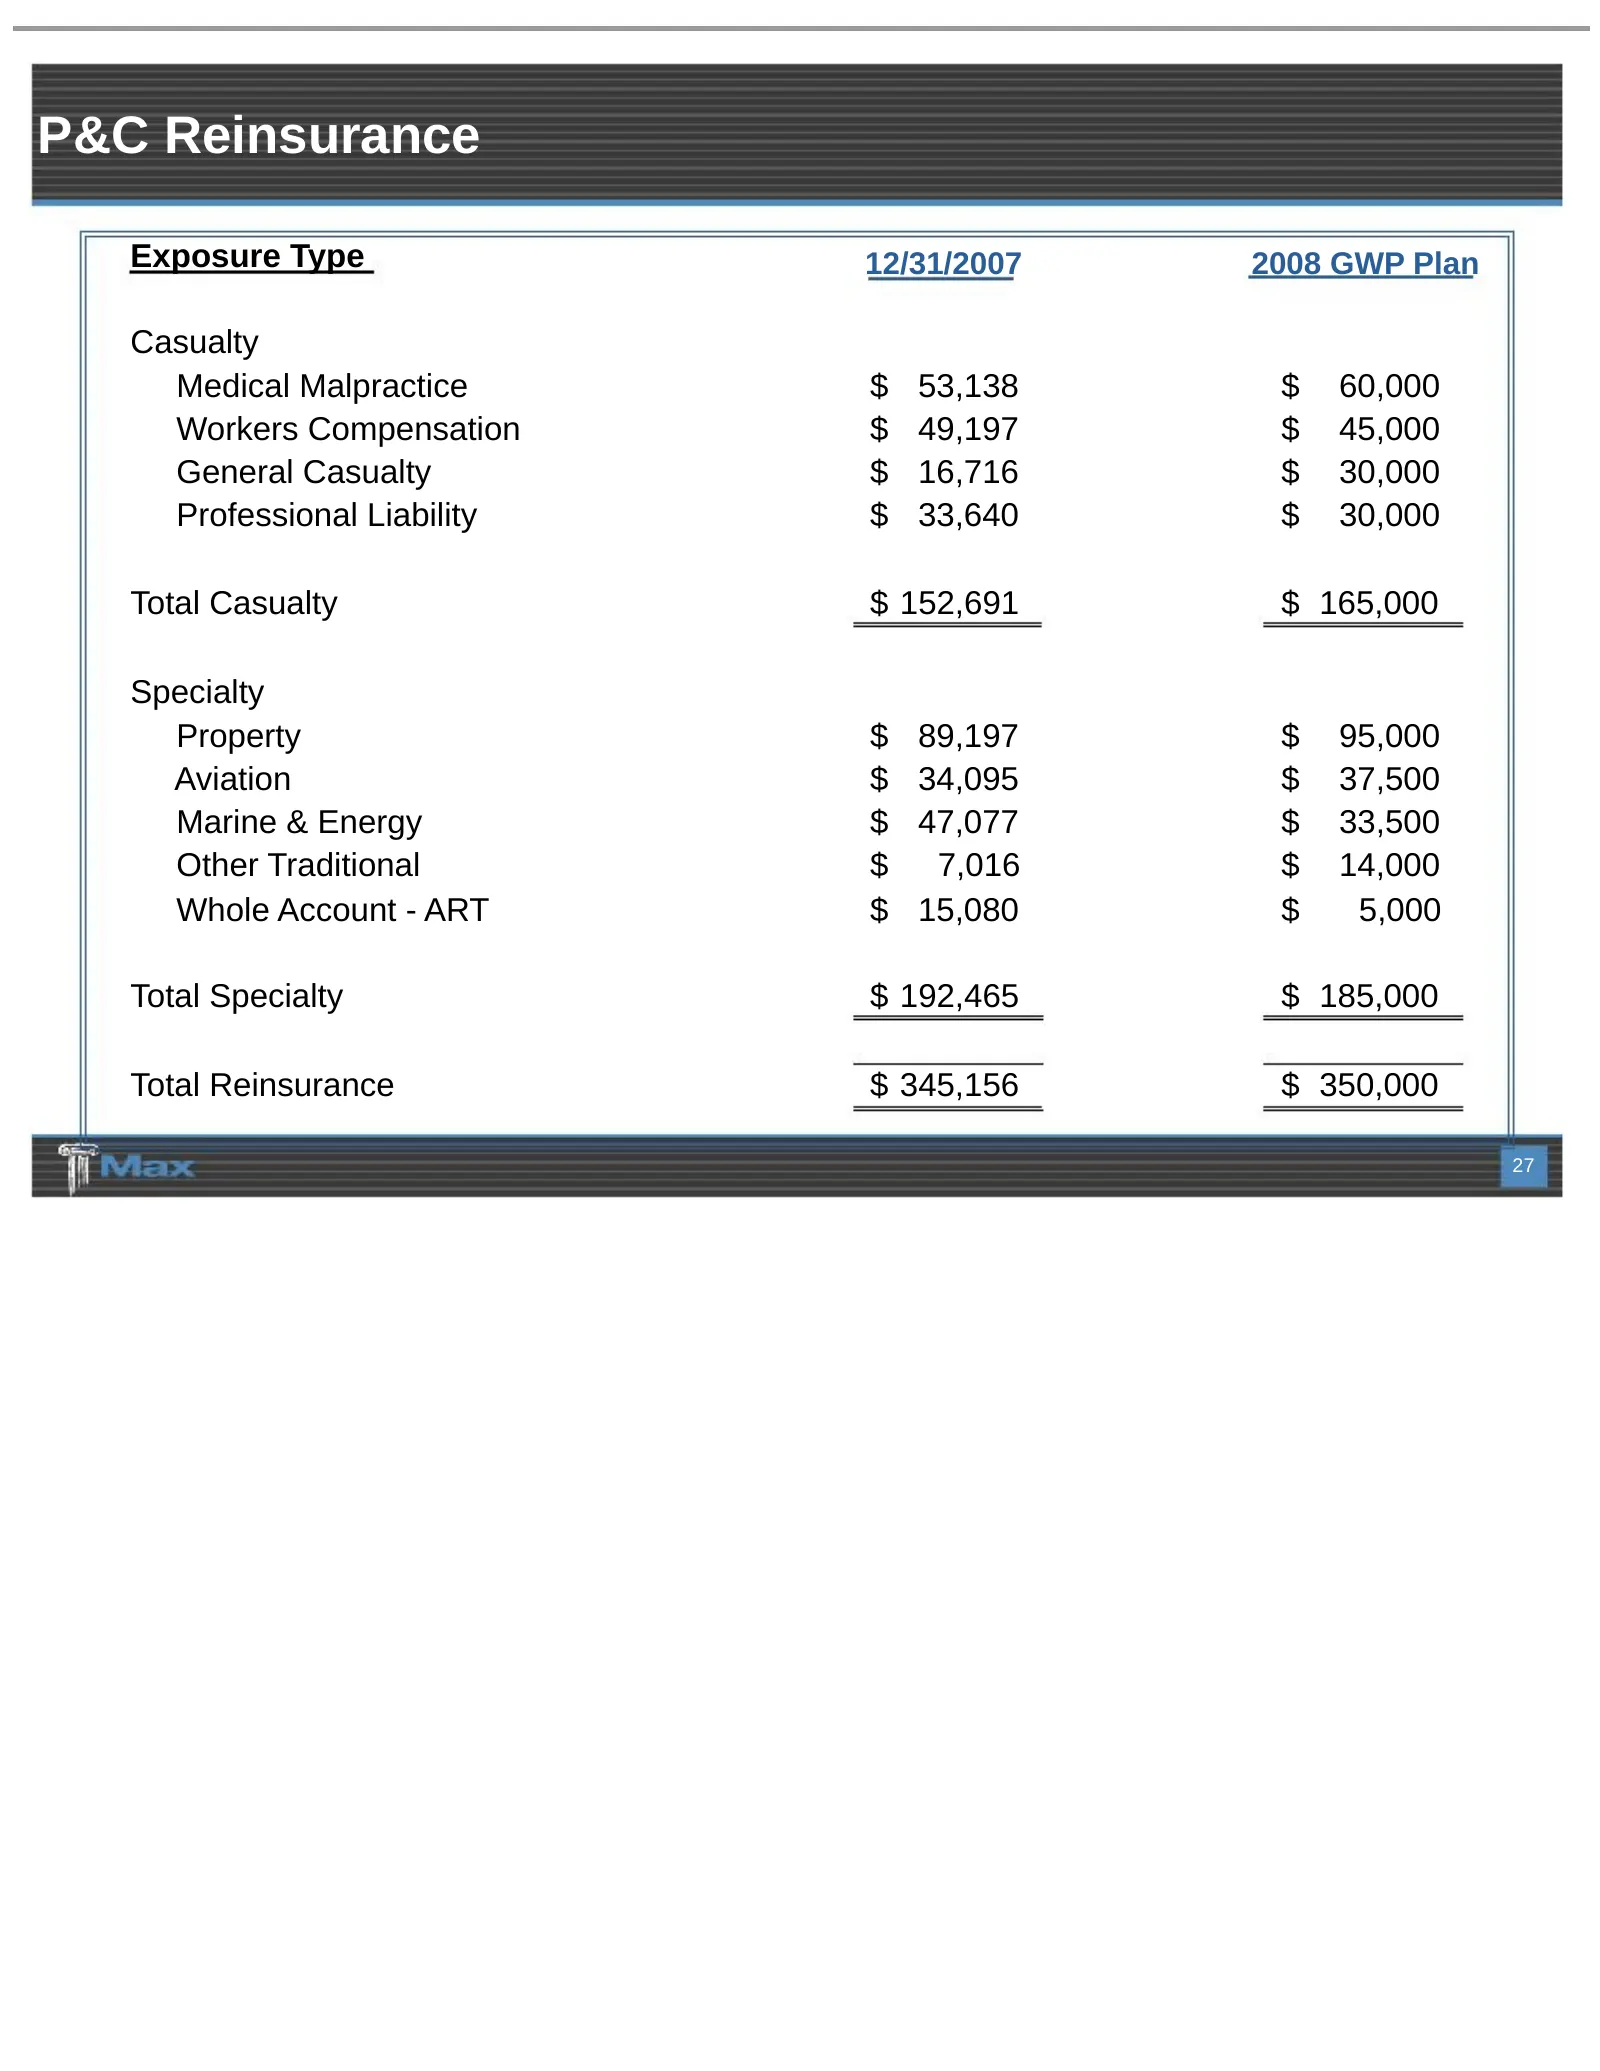
P&C Reinsurance Exposure Type 12/31/2007 2008 GWP Plan Casualty Medical Malpractice $ 53,138 $ 60,000 Workers Compensation $ 49,197 $ 45,000 General Casualty $ 16,716 $ 30,000 Professional Liability $ 33,640 $ 30,000 Total Casualty $ 152,691 $ 165,000 Specialty Property $ 89,197 $ 95,000 Aviation $
Slide 28: Casualty Lines
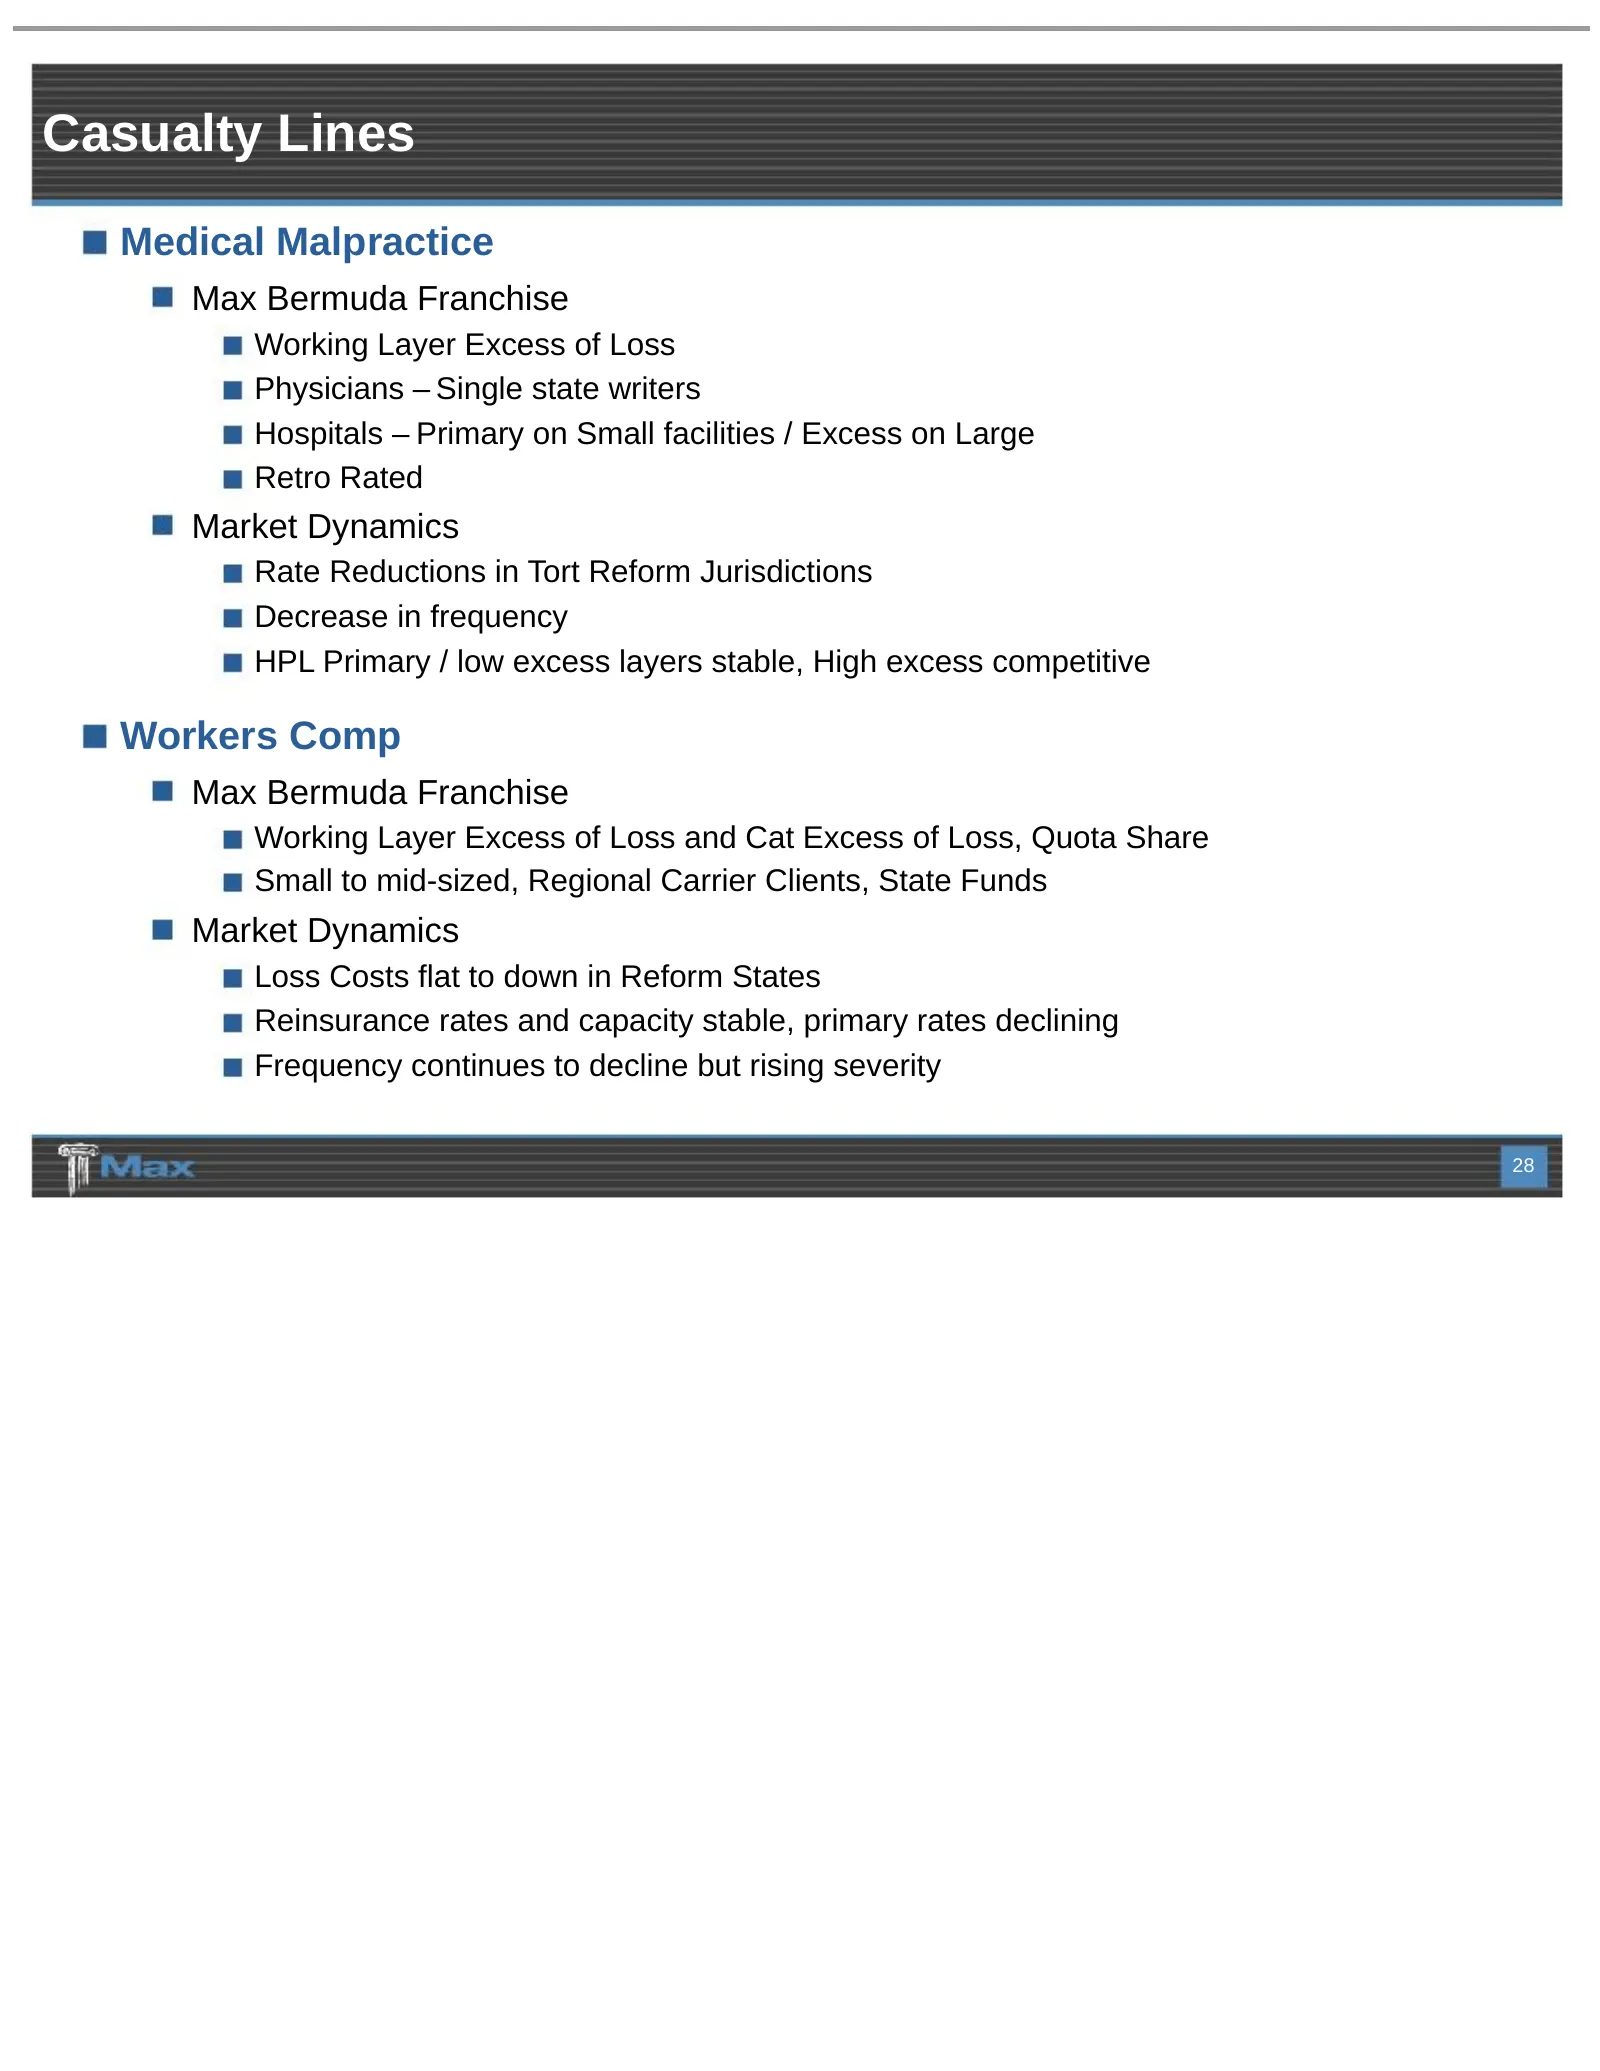
Casualty Lines Medical Malpractice Max Bermuda Franchise Working Layer Excess of Loss Physicians – Single state writers Hospitals – Primary on Small facilities / Excess on Large Retro Rated Market Dynamics Rate Reductions in Tort Reform Jurisdictions Decrease in frequency HPL Primary / low excess la
Slide 29: Casualty Lines
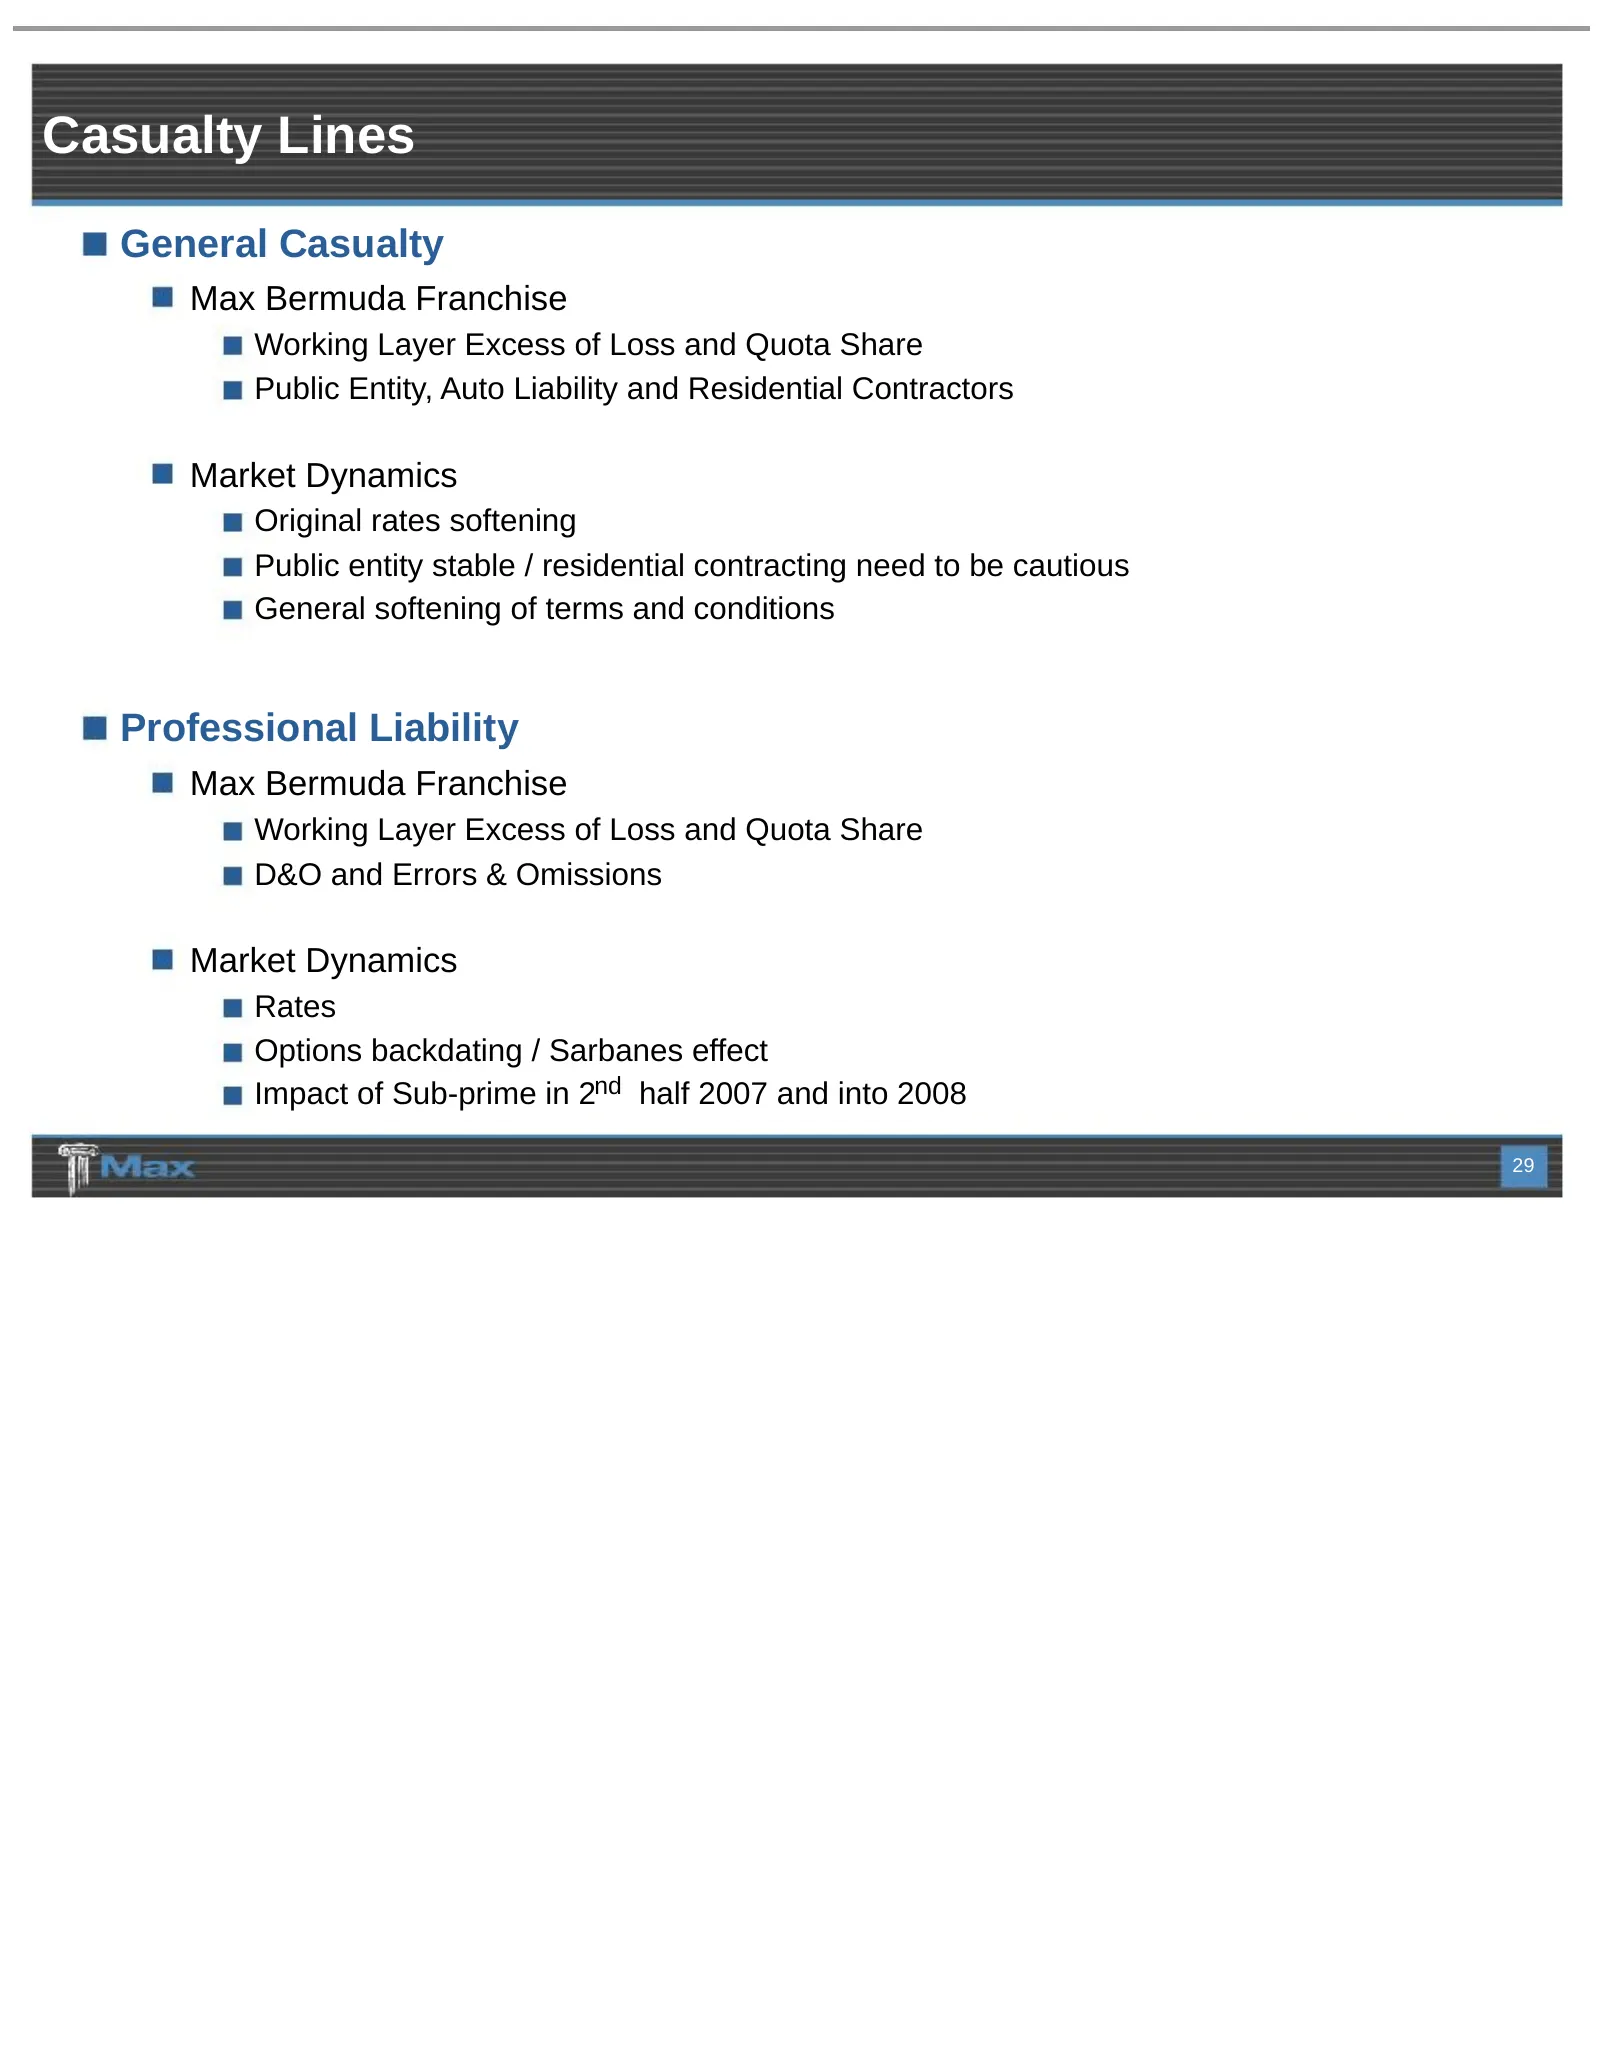
Casualty Lines General Casualty Max Bermuda Franchise Working Layer Excess of Loss and Quota Share Public Entity, Auto Liability and Residential Contractors Market Dynamics Original rates softening Public entity stable / residential contracting need to be cautious General softening of terms and cond
Slide 30: Specialty Lines
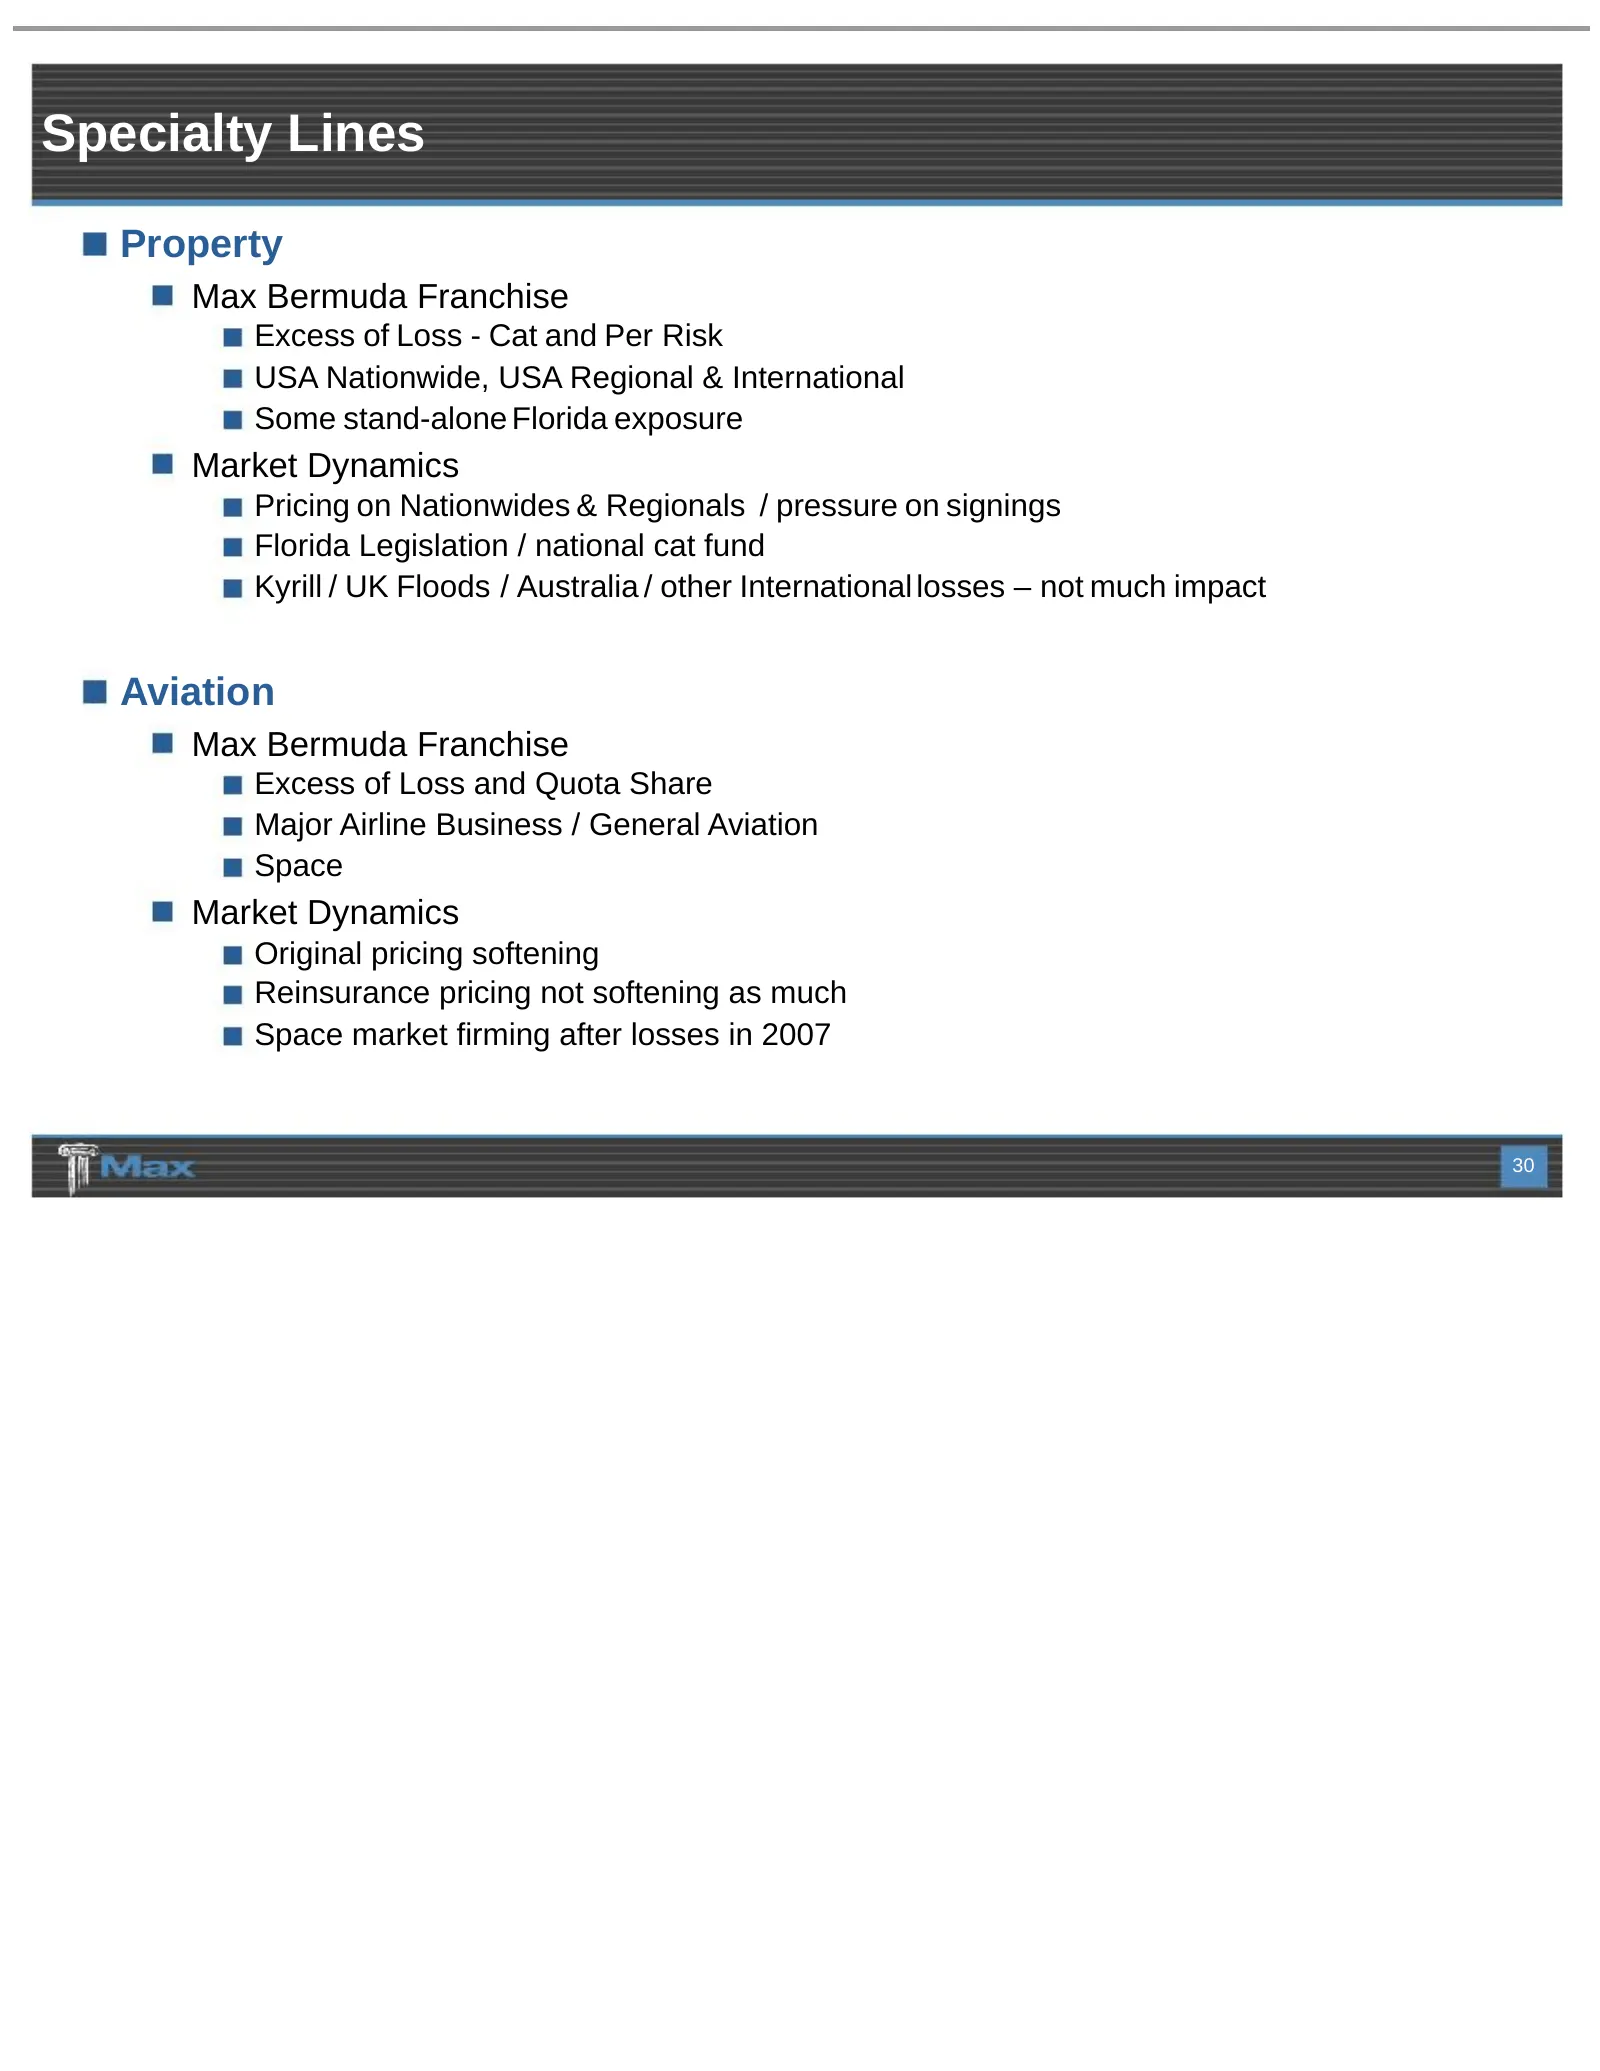
Specialty Lines Property Max Bermuda Franchise Excess of Loss - Cat and Per Risk USA Nationwide, USA Regional & International Some stand-alone Florida exposure Market Dynamics Pricing on Nationwides & Regionals / pressure on signings Florida Legislation / national cat fund Kyrill / UK Floods / Austr
Slide 31: Specialty Lines
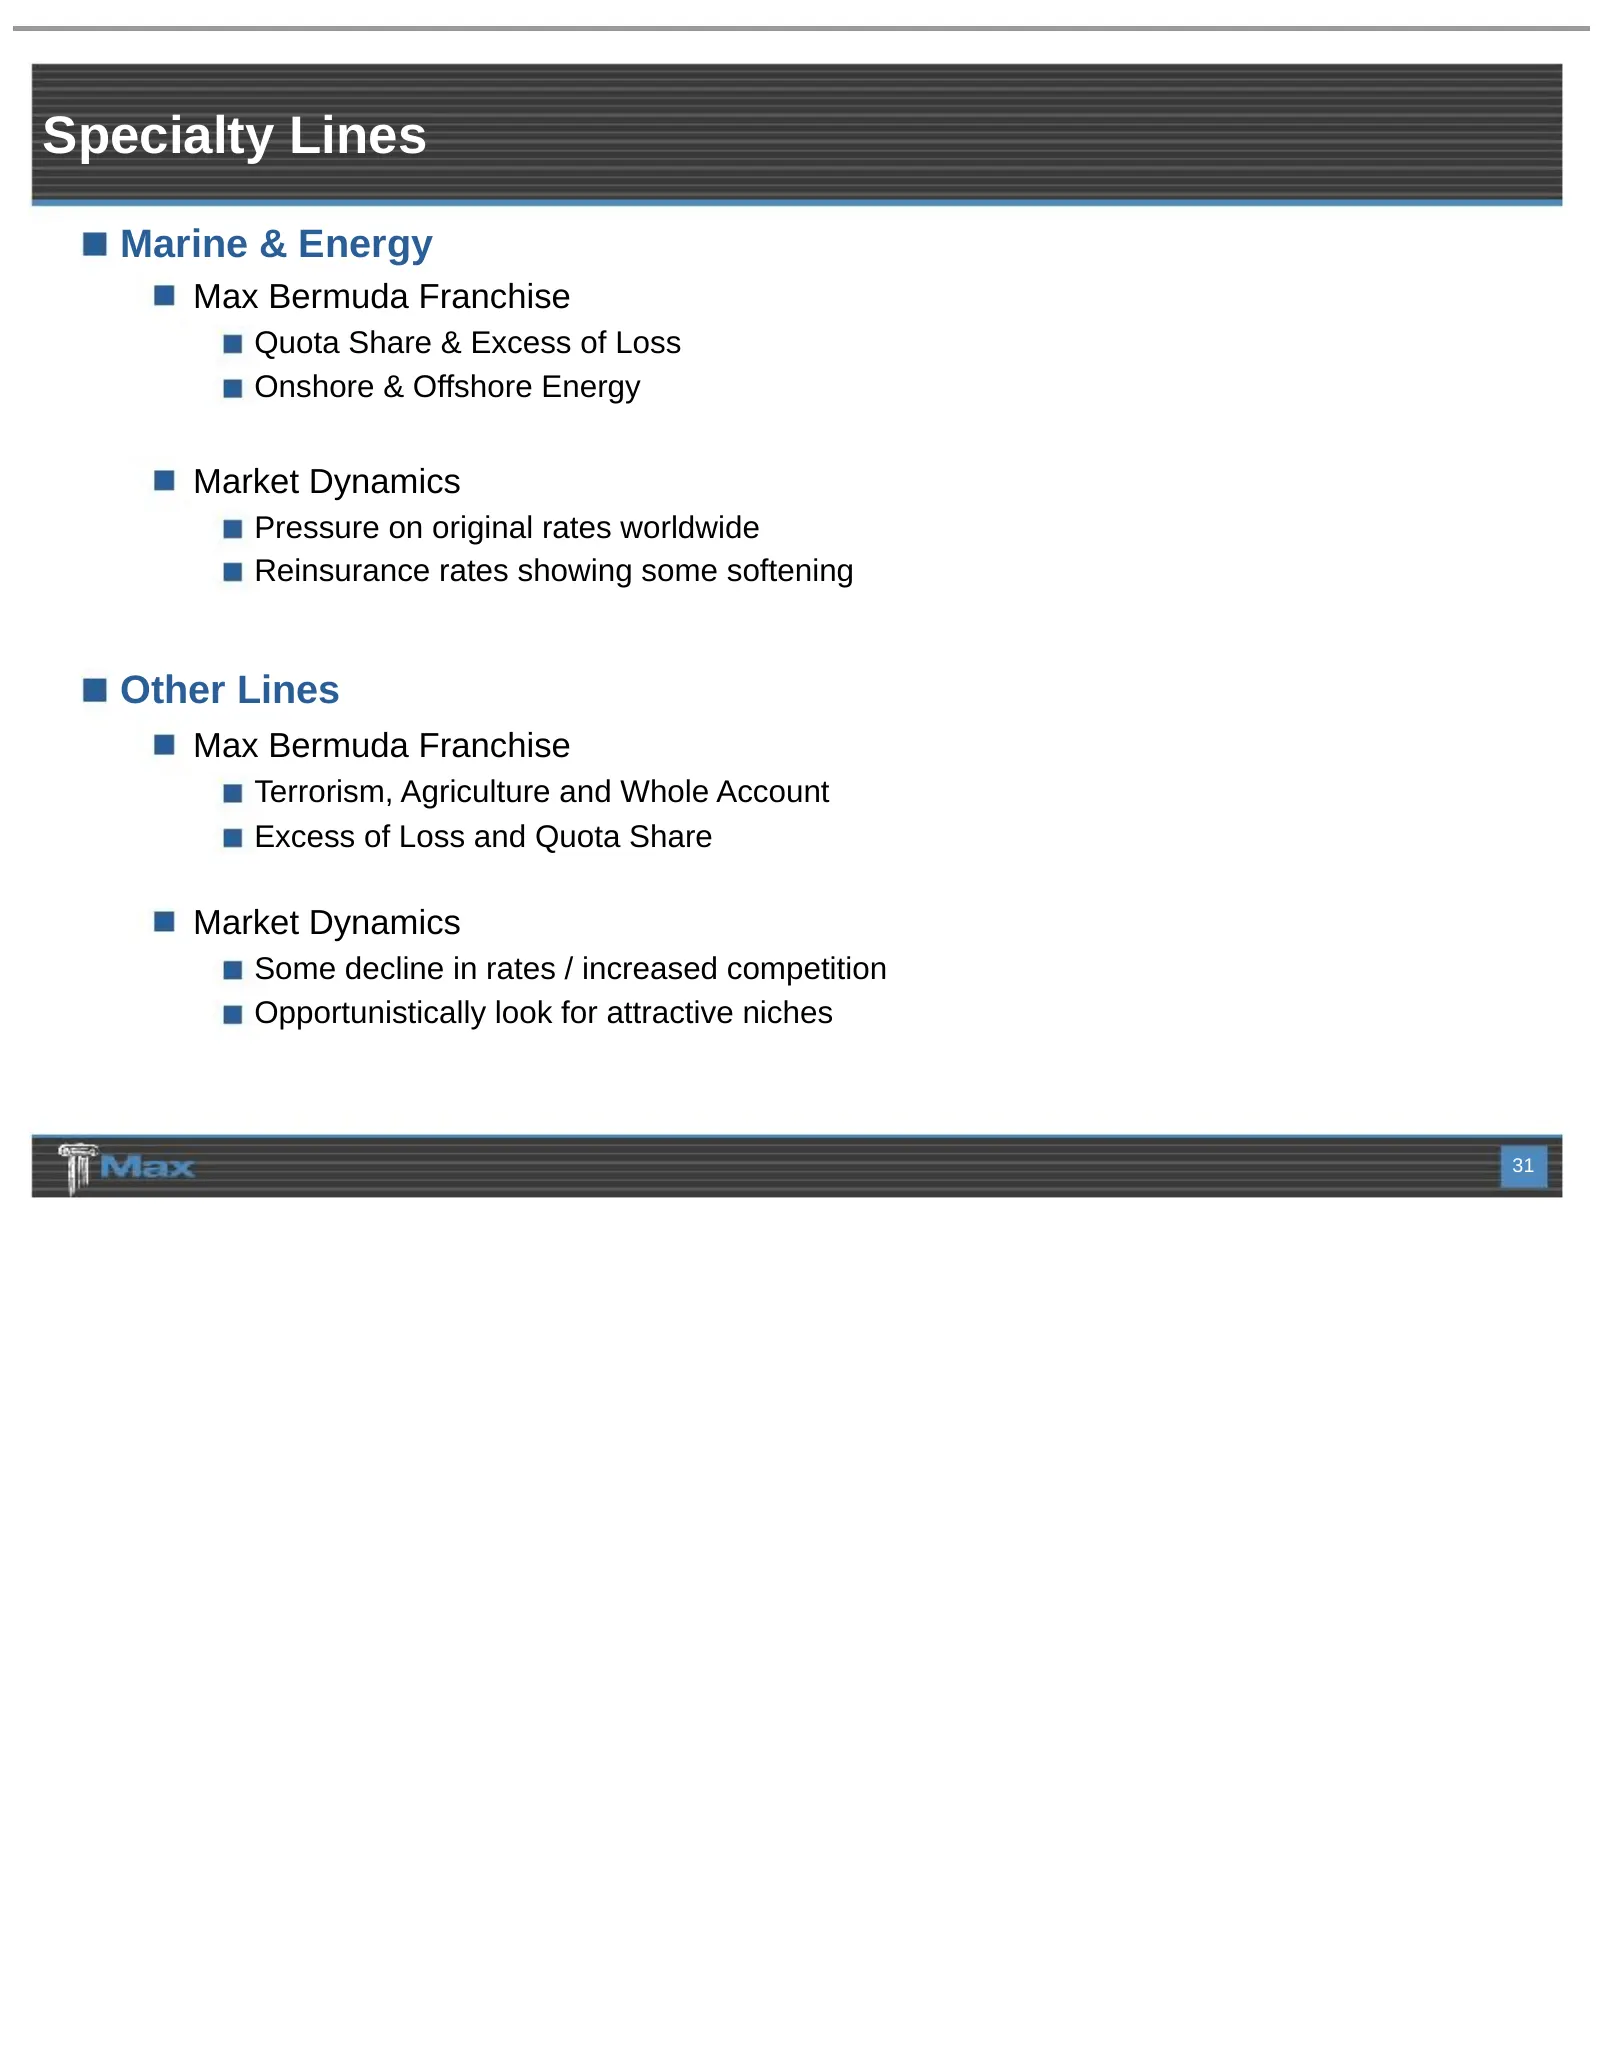
Specialty Lines Marine & Energy Max Bermuda Franchise Quota Share & Excess of Loss Onshore & Offshore Energy Market Dynamics Pressure on original rates worldwide Reinsurance rates showing some softening Other Lines Max Bermuda Franchise Terrorism, Agriculture and Whole Account Excess of Loss and Quo
Slide 32: Overview of Life Reinsurance
Overview of Life Reinsurance Chris Rutten
Slide 33: Life Reinsurance: Experienced Senior Underwriters
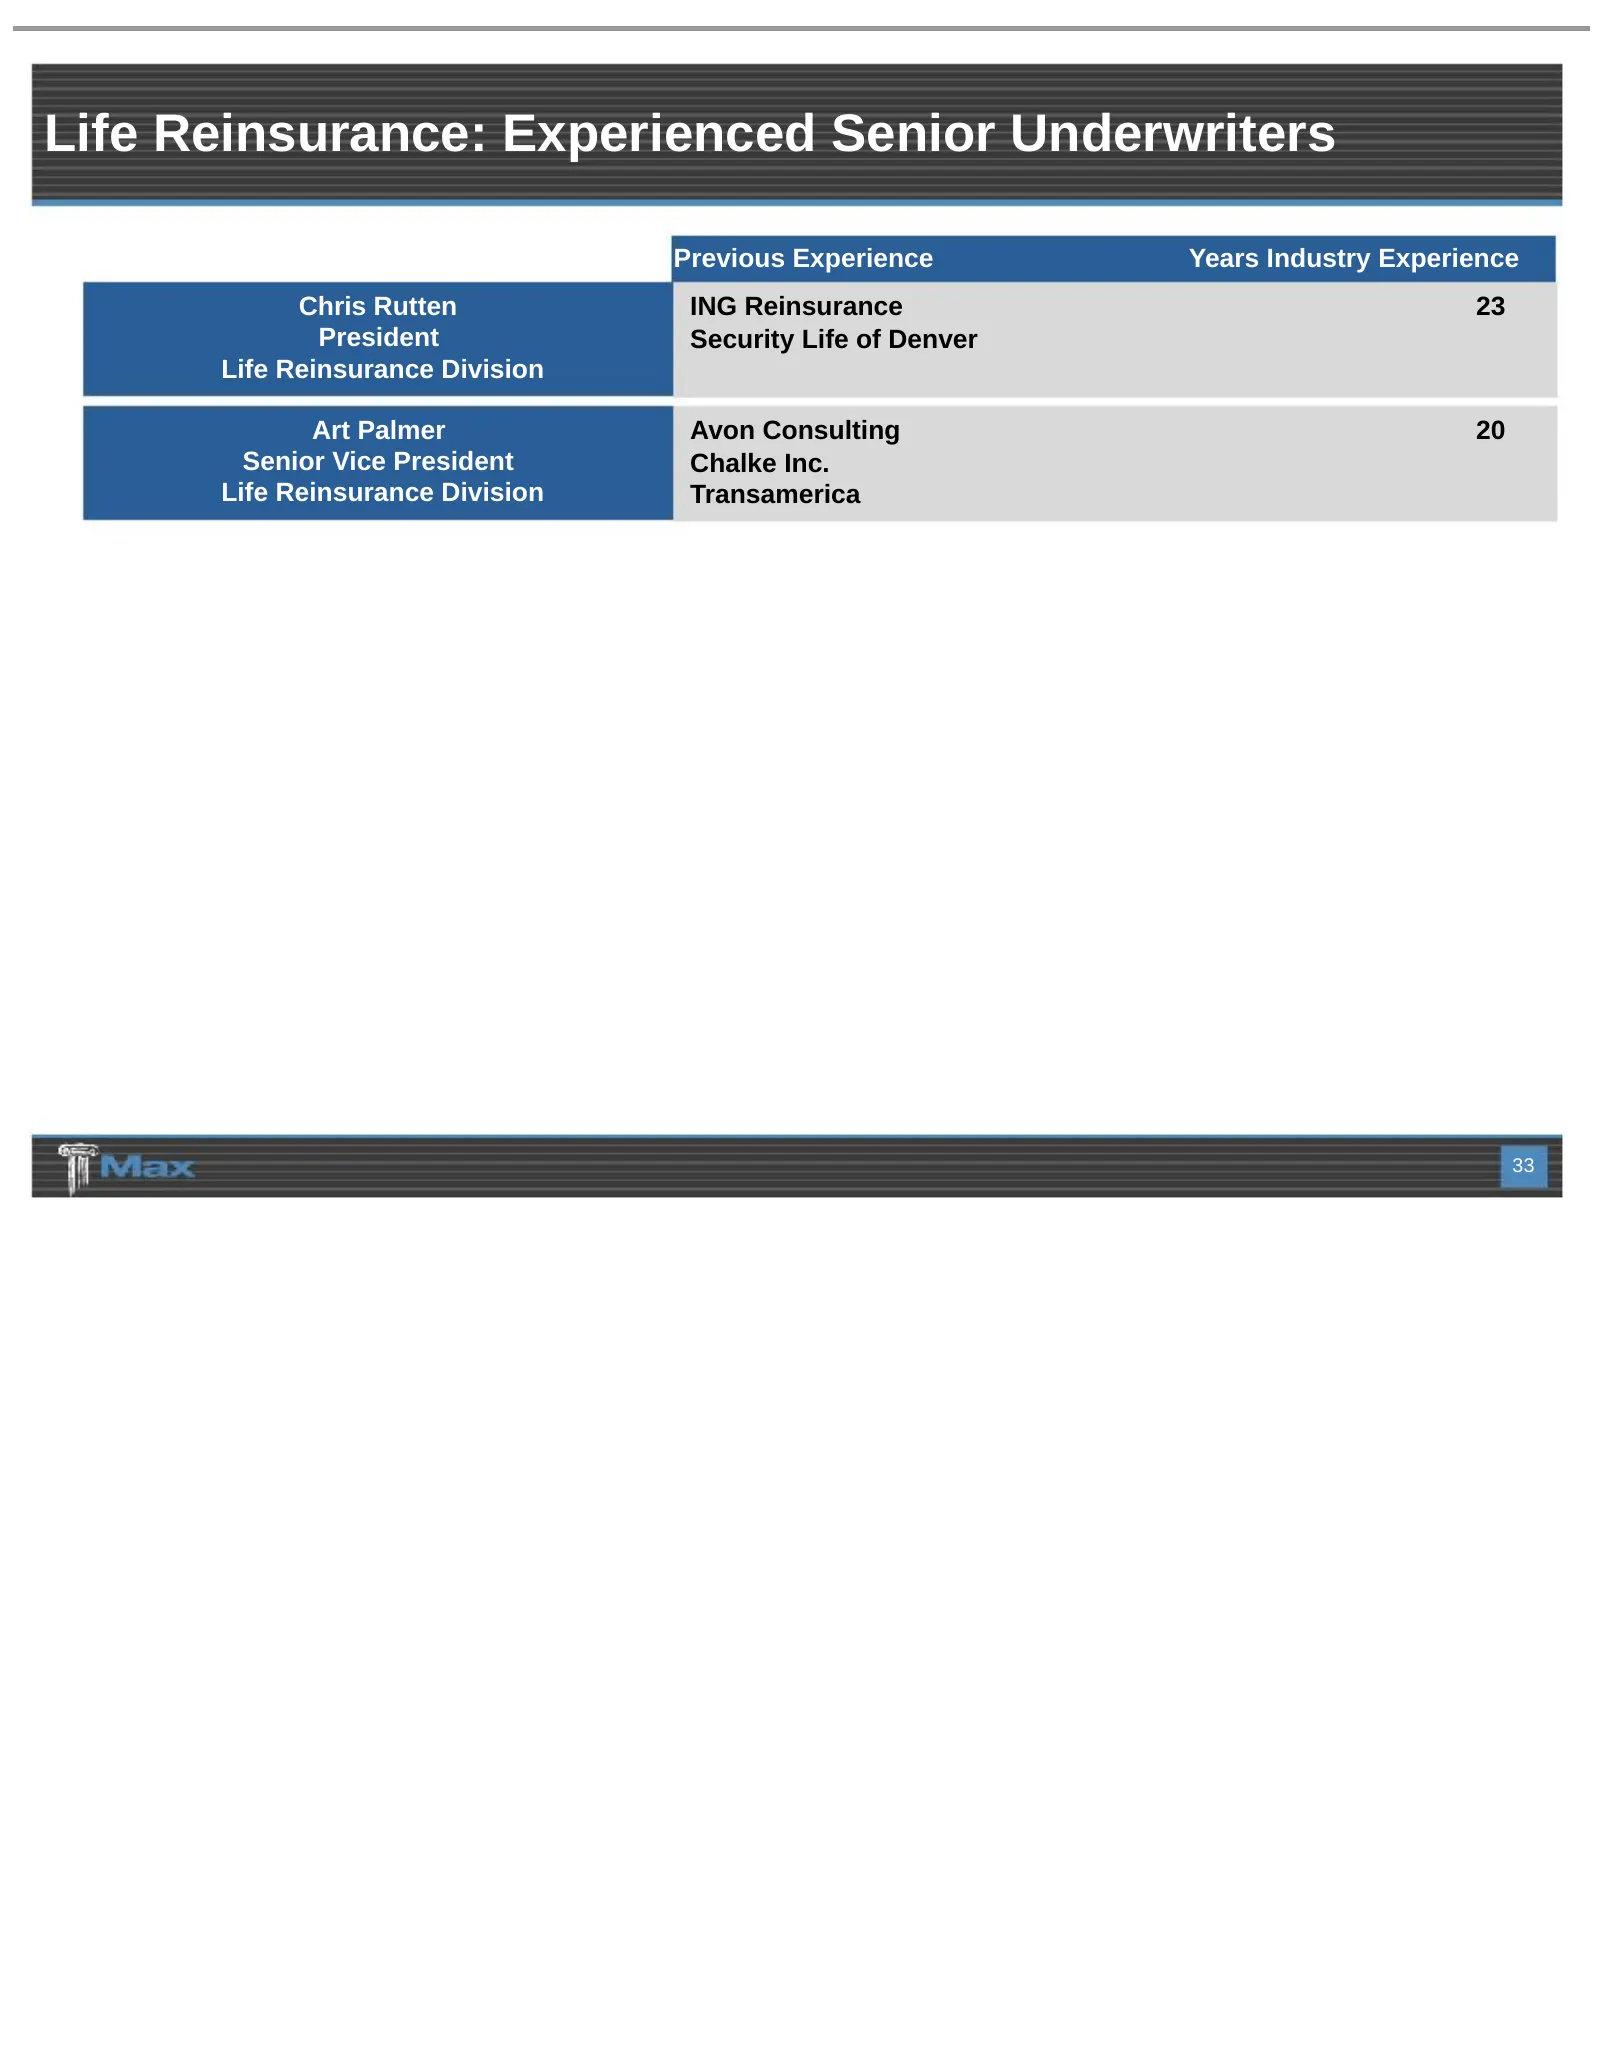
Life Reinsurance: Experienced Senior Underwriters Previous Experience Years Industry Experience Chris Rutten ING Reinsurance 23 President Security Life of Denver Life Reinsurance Division Art Palmer Avon Consulting 20 Senior Vice President Chalke Inc. Life Reinsurance Division Transamerica 33
Slide 34: Life Reinsurance: Long-Tail, Reserve Buy-Out Business
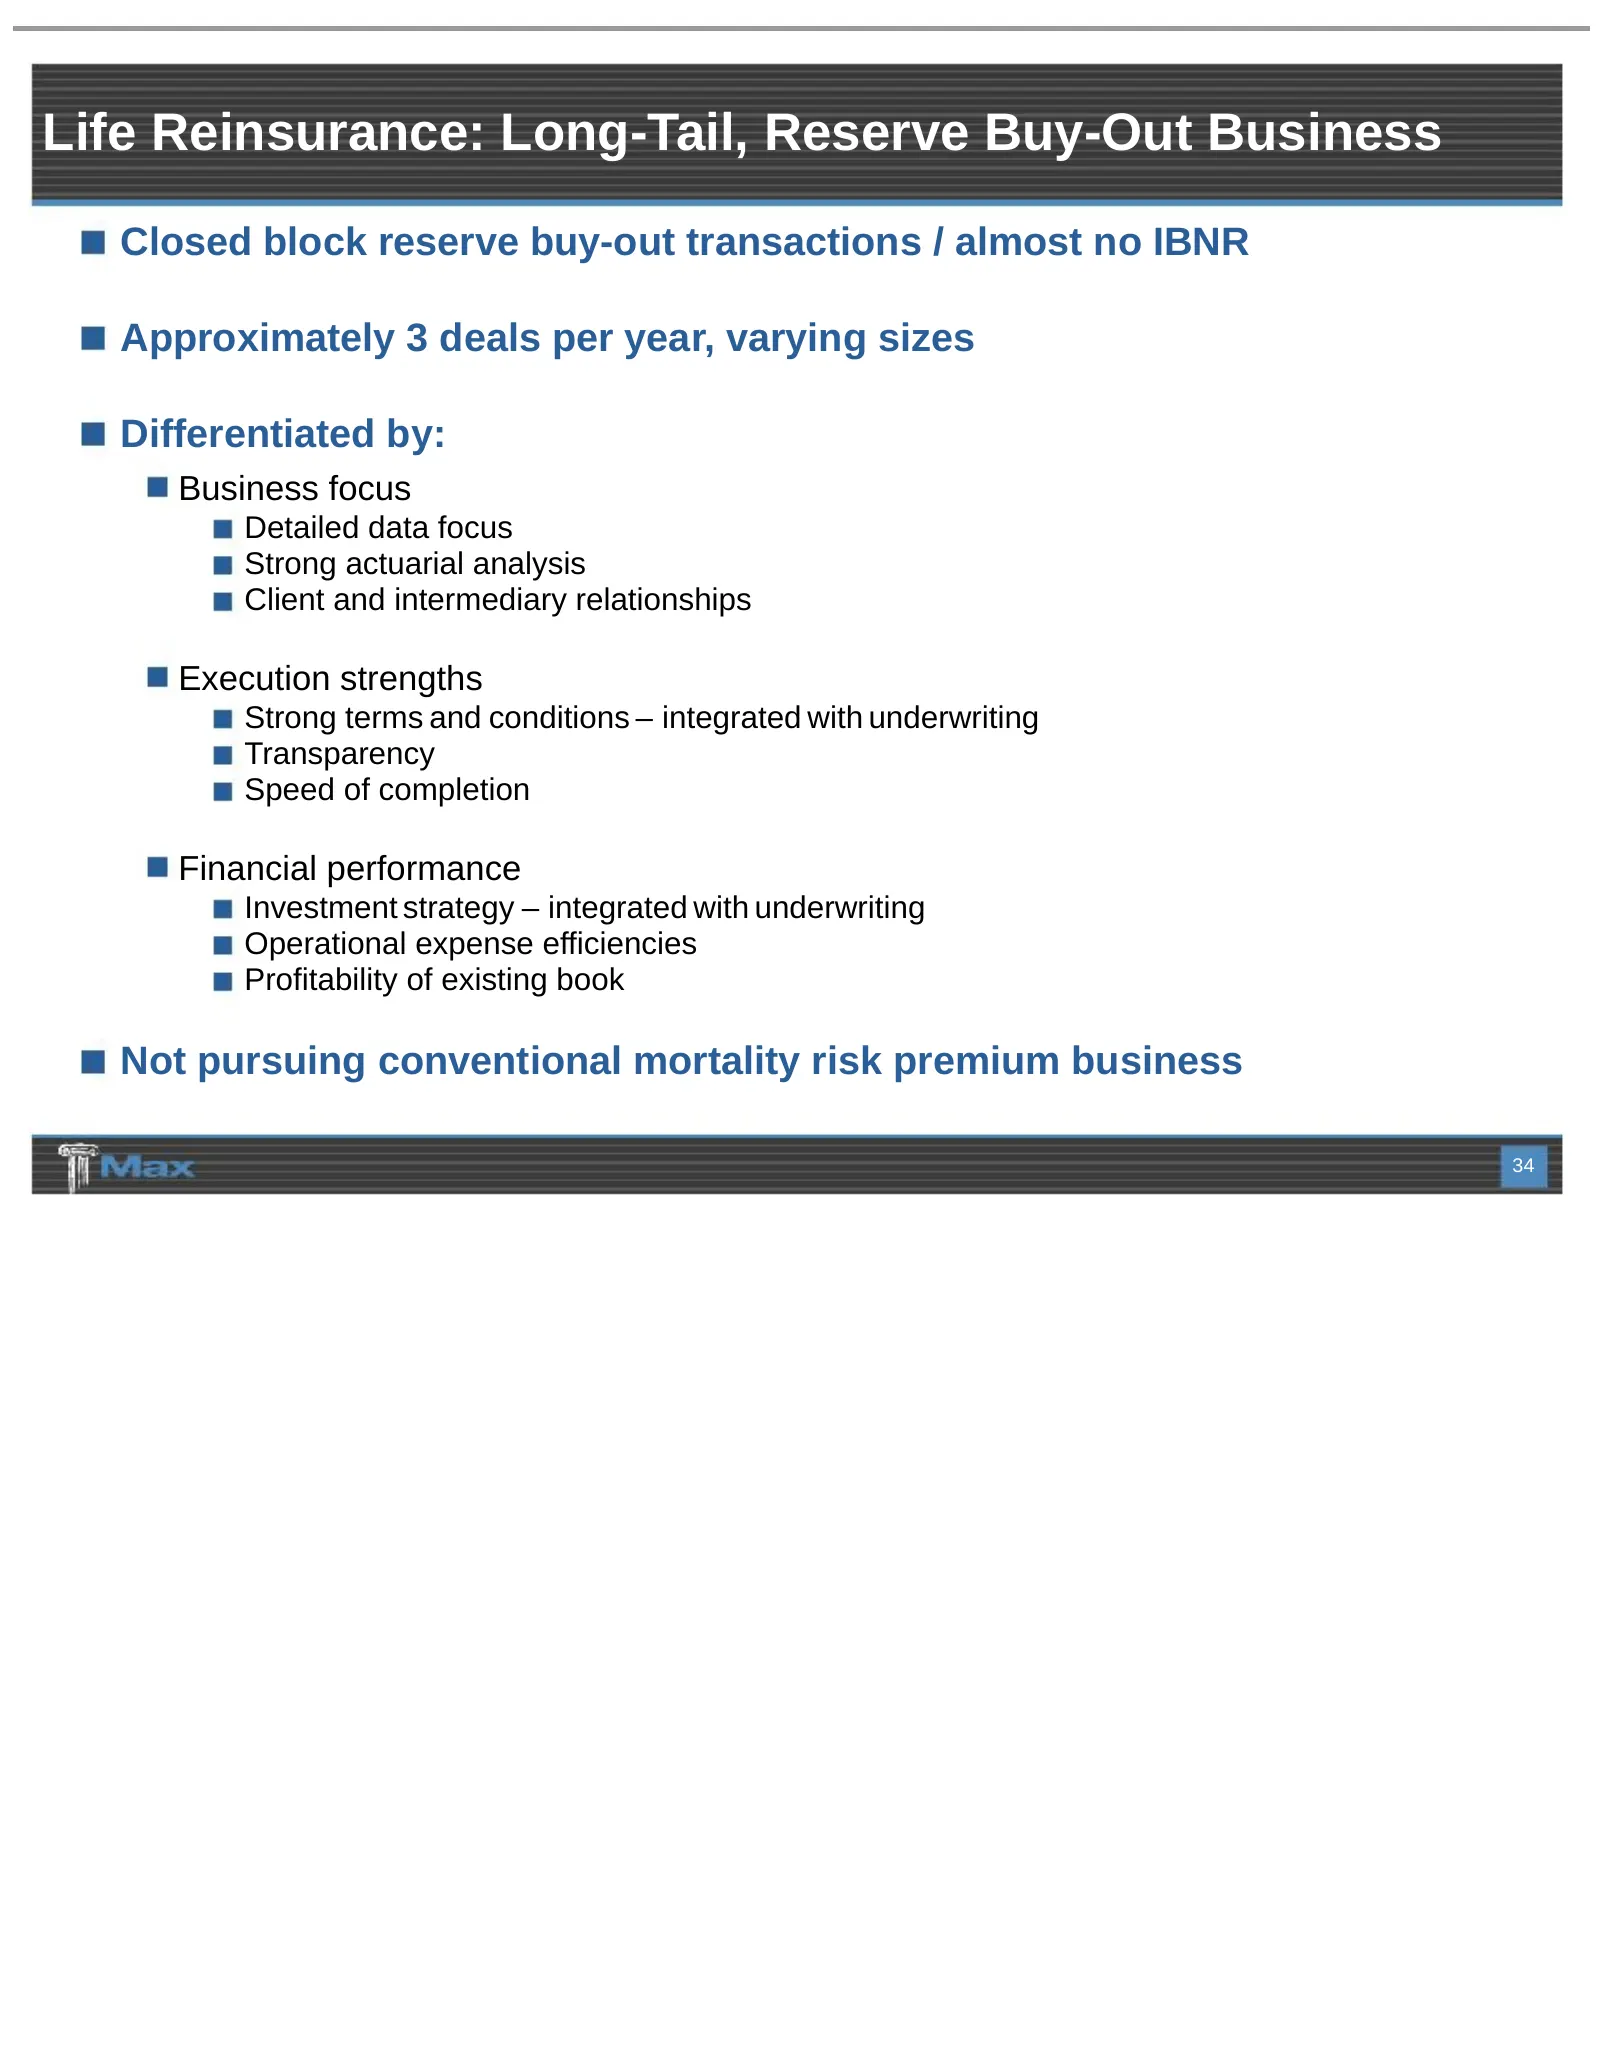
Life Reinsurance: Long-Tail, Reserve Buy-Out Business Closed block reserve buy-out transactions / almost no IBNR Approximately 3 deals per year, varying sizes Differentiated by: Business focus Detailed data focus Strong actuarial analysis Client and intermediary relationships Execution strengths Str
Slide 35: Life Reinsurance: A Profitable Niche Business
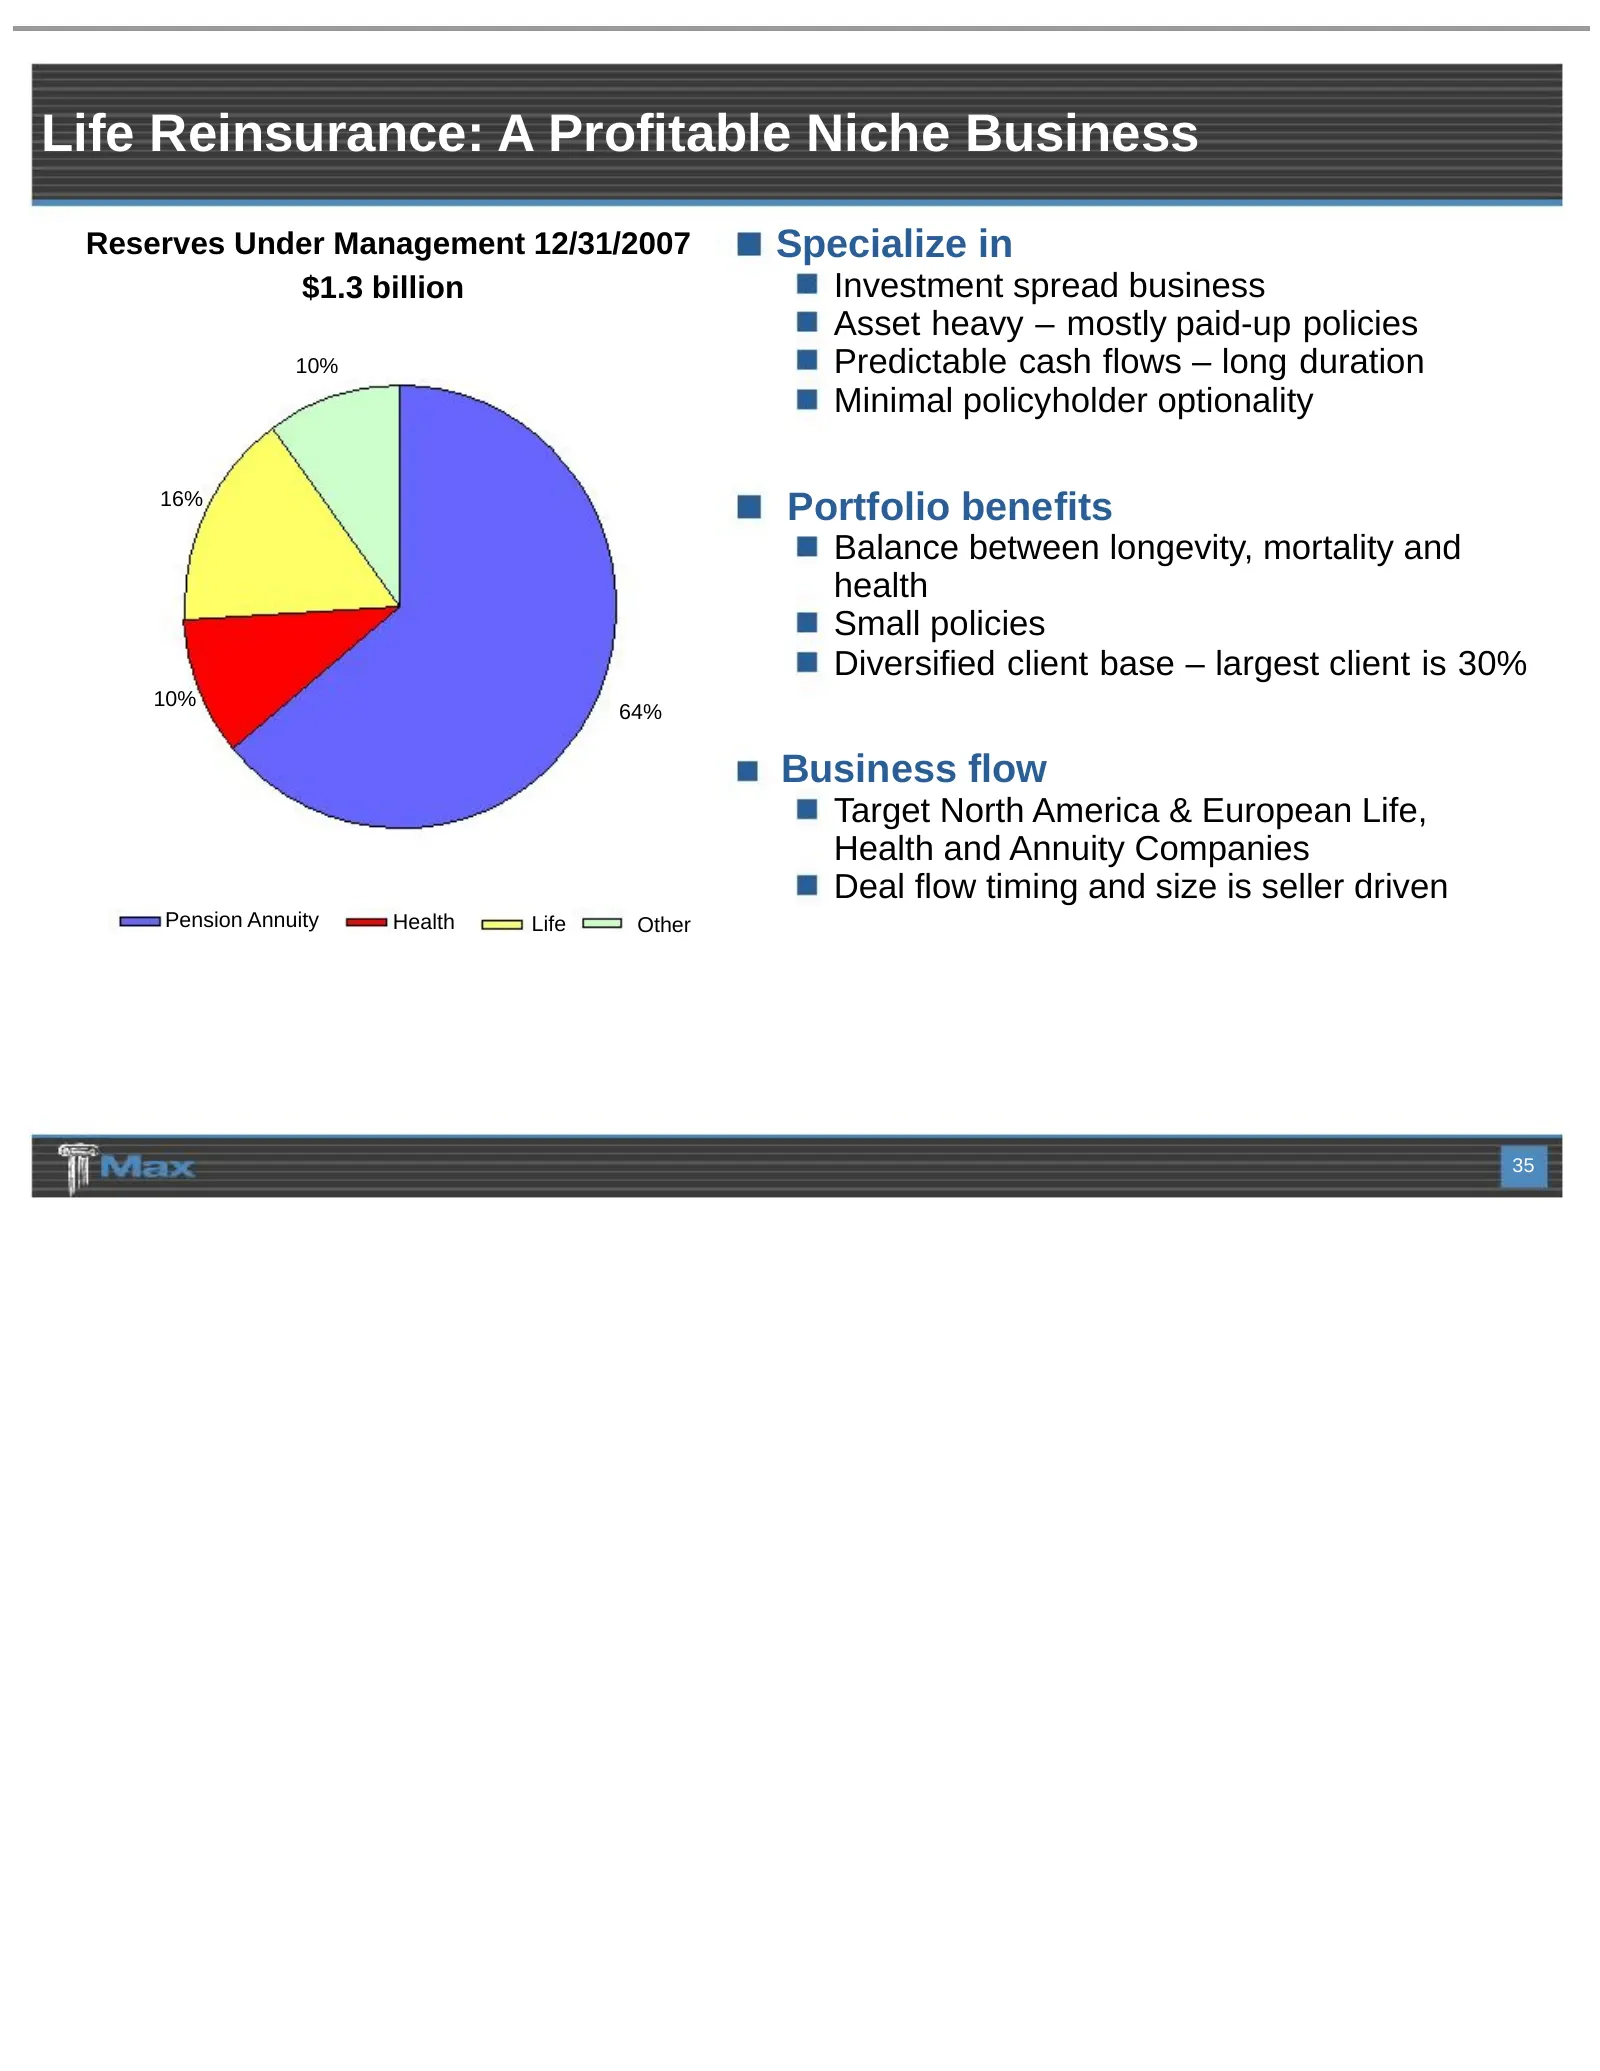
Life Reinsurance: A Profitable Niche Business Reserves Under Management 12/31/2007 Specialize in $1.3 billion Investment spread business Asset heavy – mostly paid-up policies 10% Predictable cash flows – long duration Minimal policyholder optionality 16% Portfolio benefits Balance between longevity,
Slide 36: Life Reinsurance: Premiums And Deposits
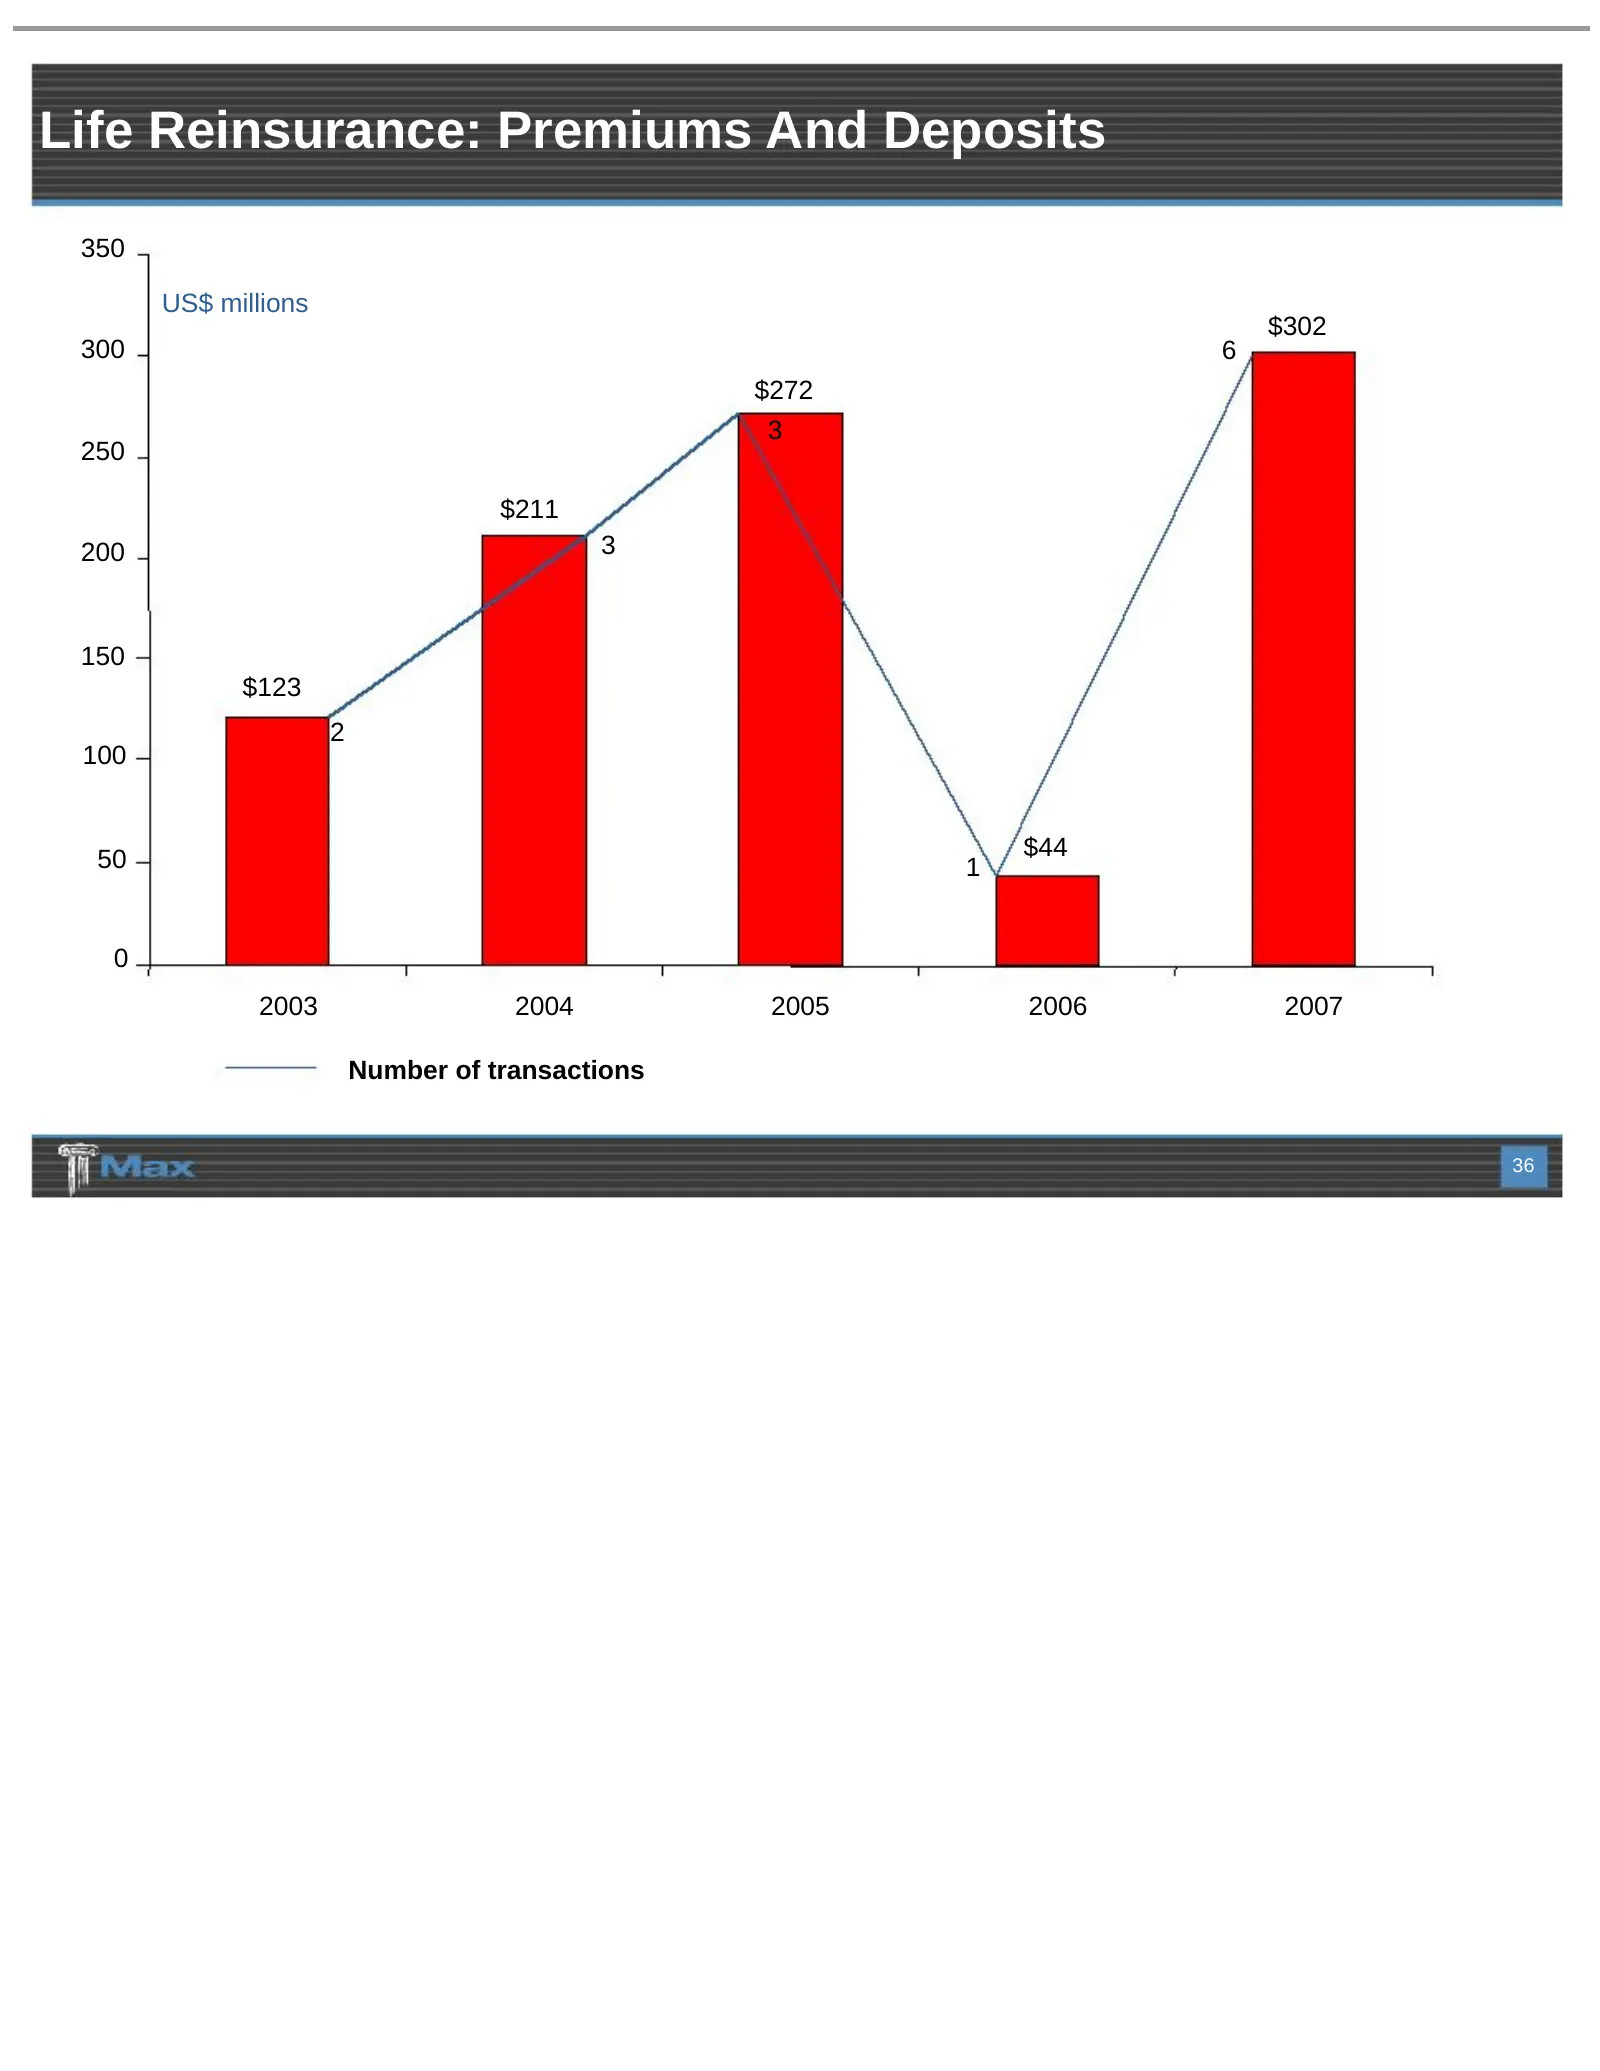
Life Reinsurance: Premiums And Deposits 350 US$ millions $302 300 6 $272 3 250 $211 200 3 150 $123 2 100 50 $44 1 0 2003 2004 2005 2006 2007 Number of transactions 36
Slide 37: Life Reinsurance: Position Within Max
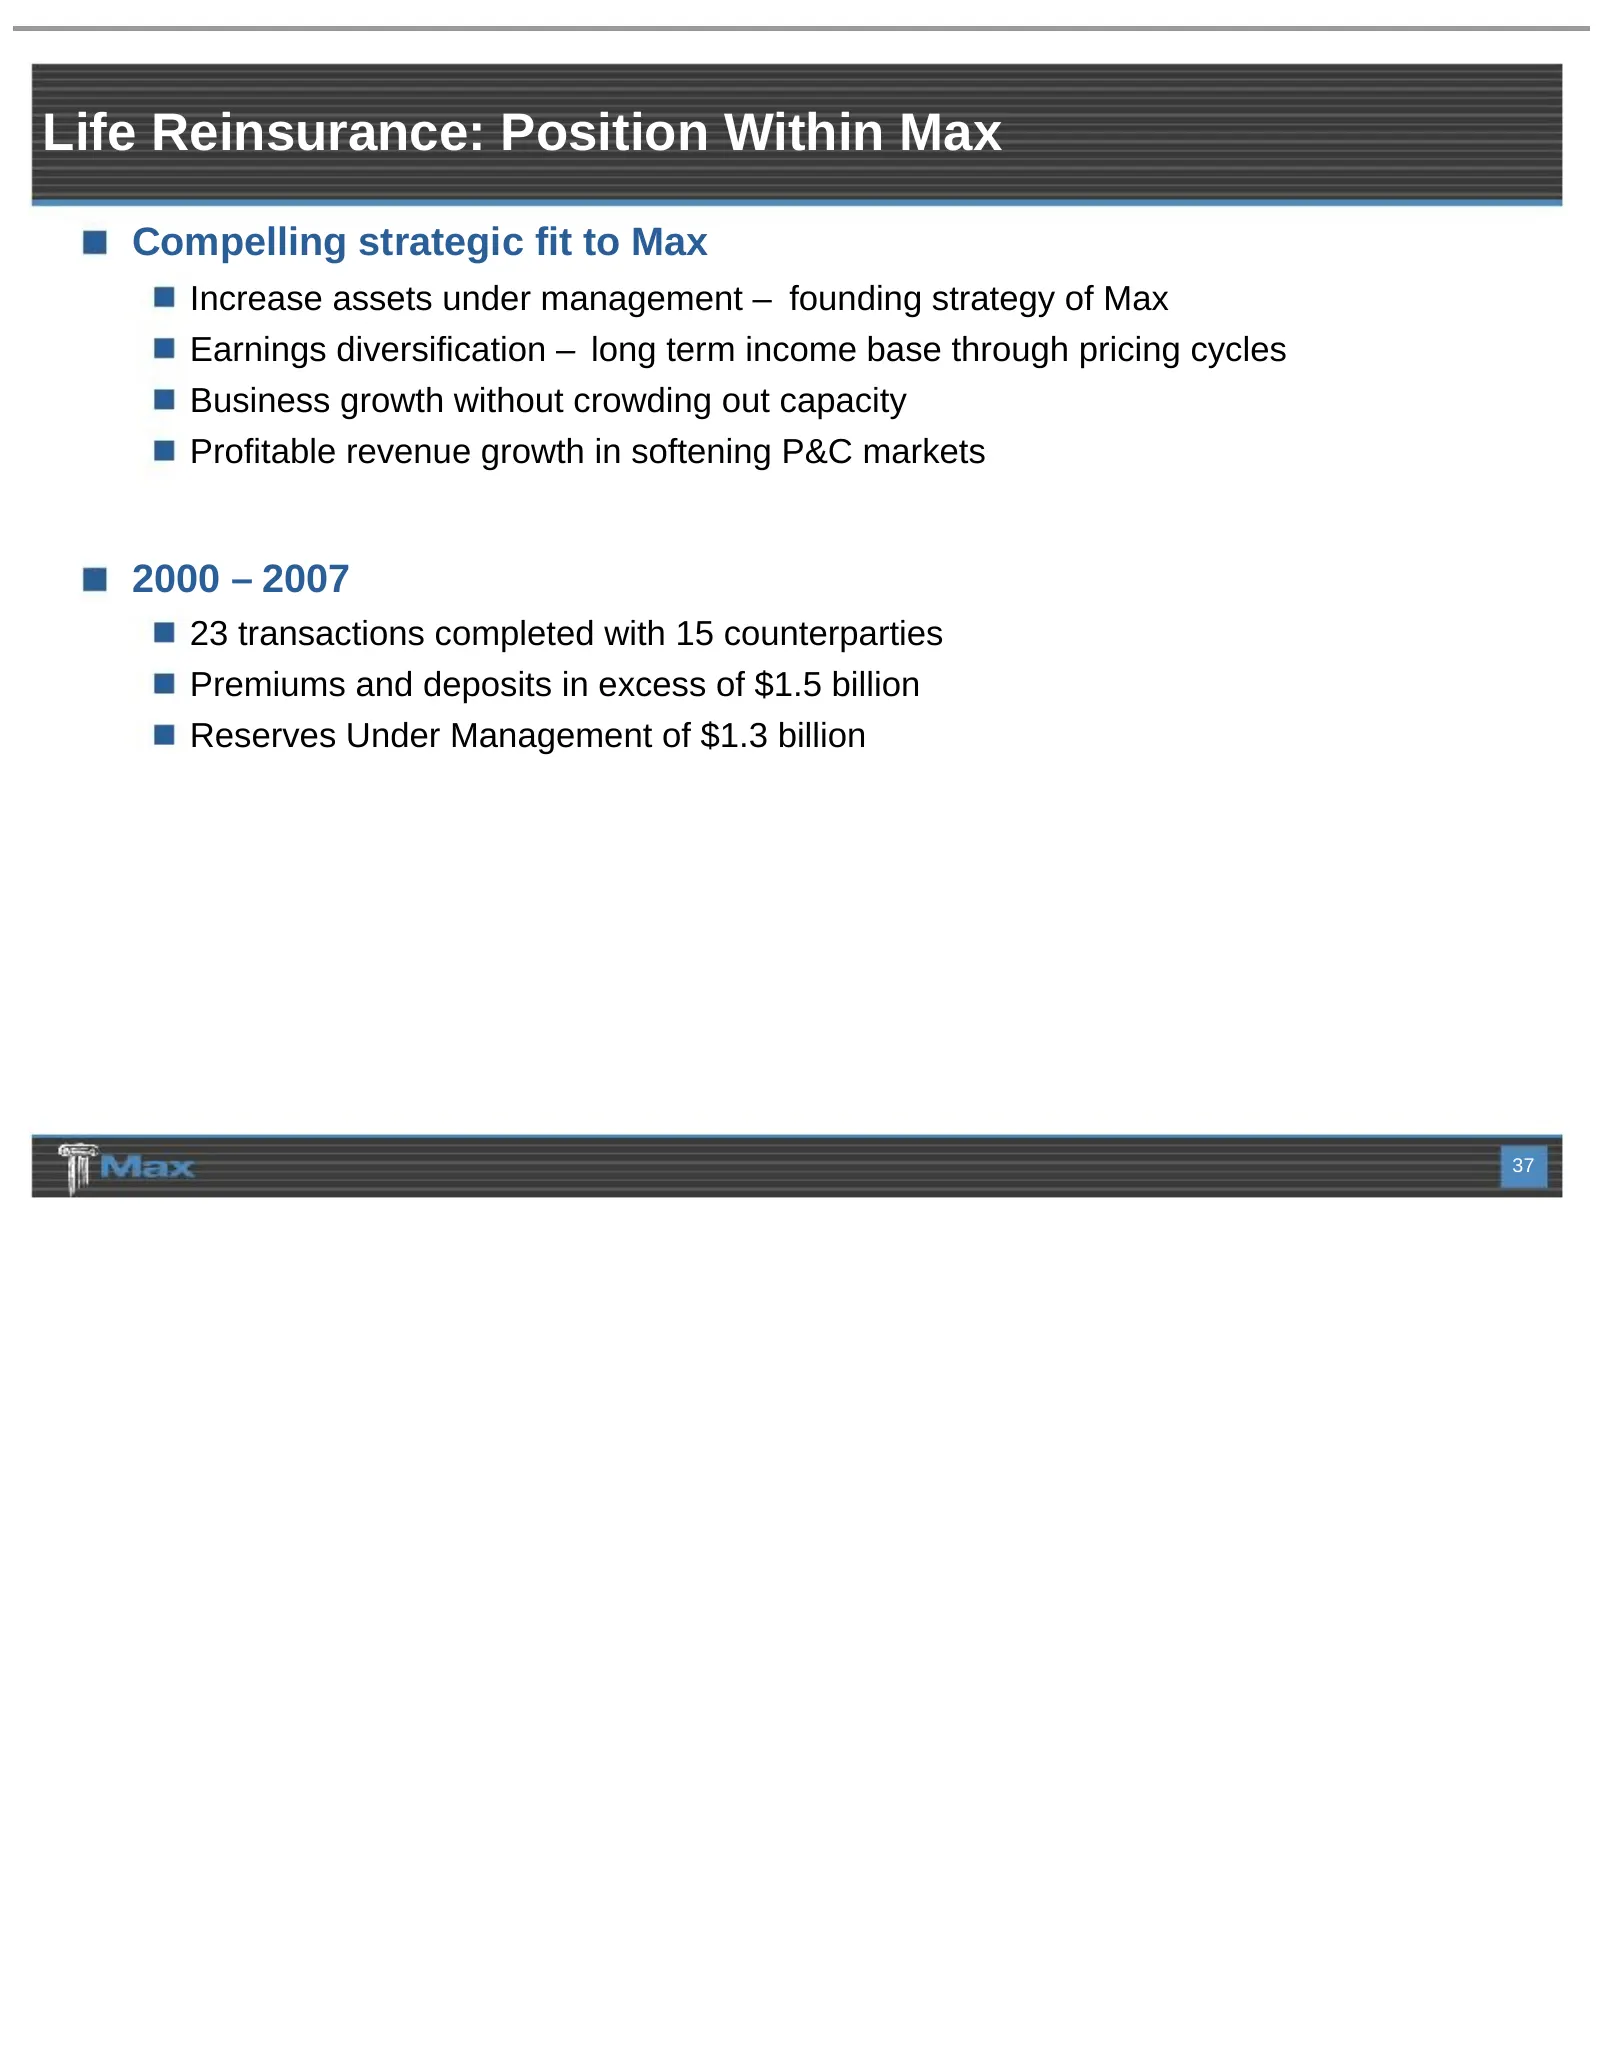
Life Reinsurance: Position Within Max Compelling strategic fit to Max Increase assets under management – founding strategy of Max Earnings diversification – long term income base through pricing cycles Business growth without crowding out capacity Profitable revenue growth in softening P&C markets 2
Slide 38: Life Reinsurance: No Surprises In Business
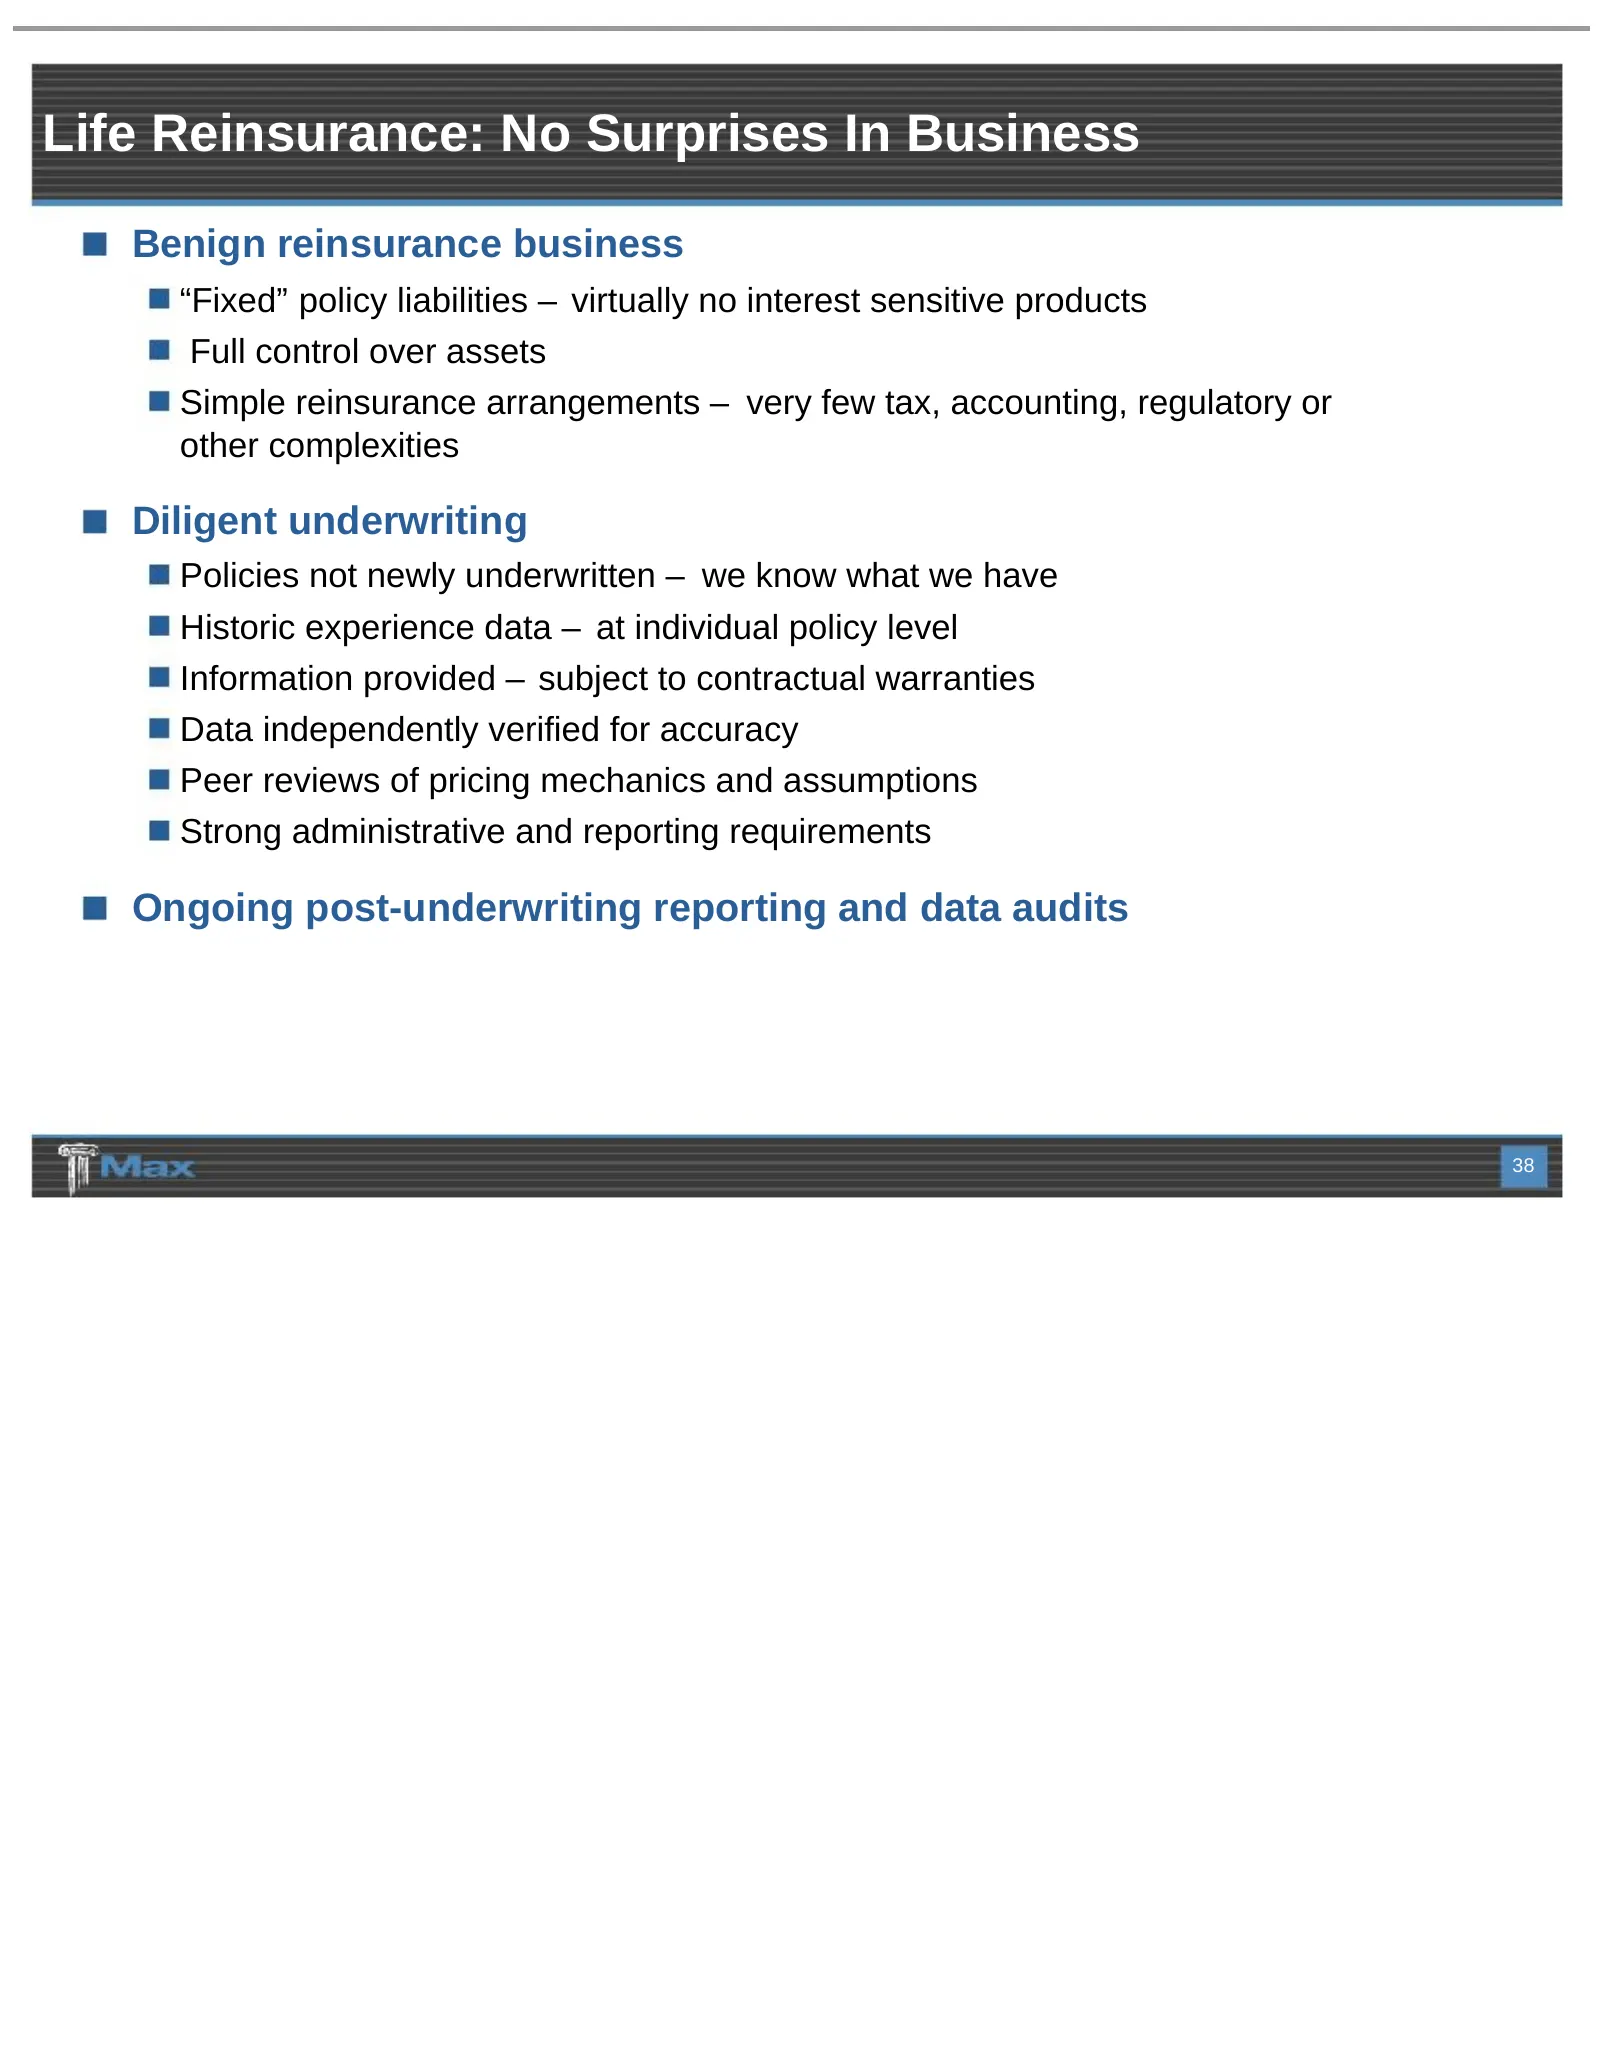
Life Reinsurance: No Surprises In Business Benign reinsurance business “Fixed” policy liabilities – virtually no interest sensitive products Full control over assets Simple reinsurance arrangements – very few tax, accounting, regulatory or other complexities Diligent underwriting Policies not newly
Slide 39: Life Reinsurance: Helpful Analytics?
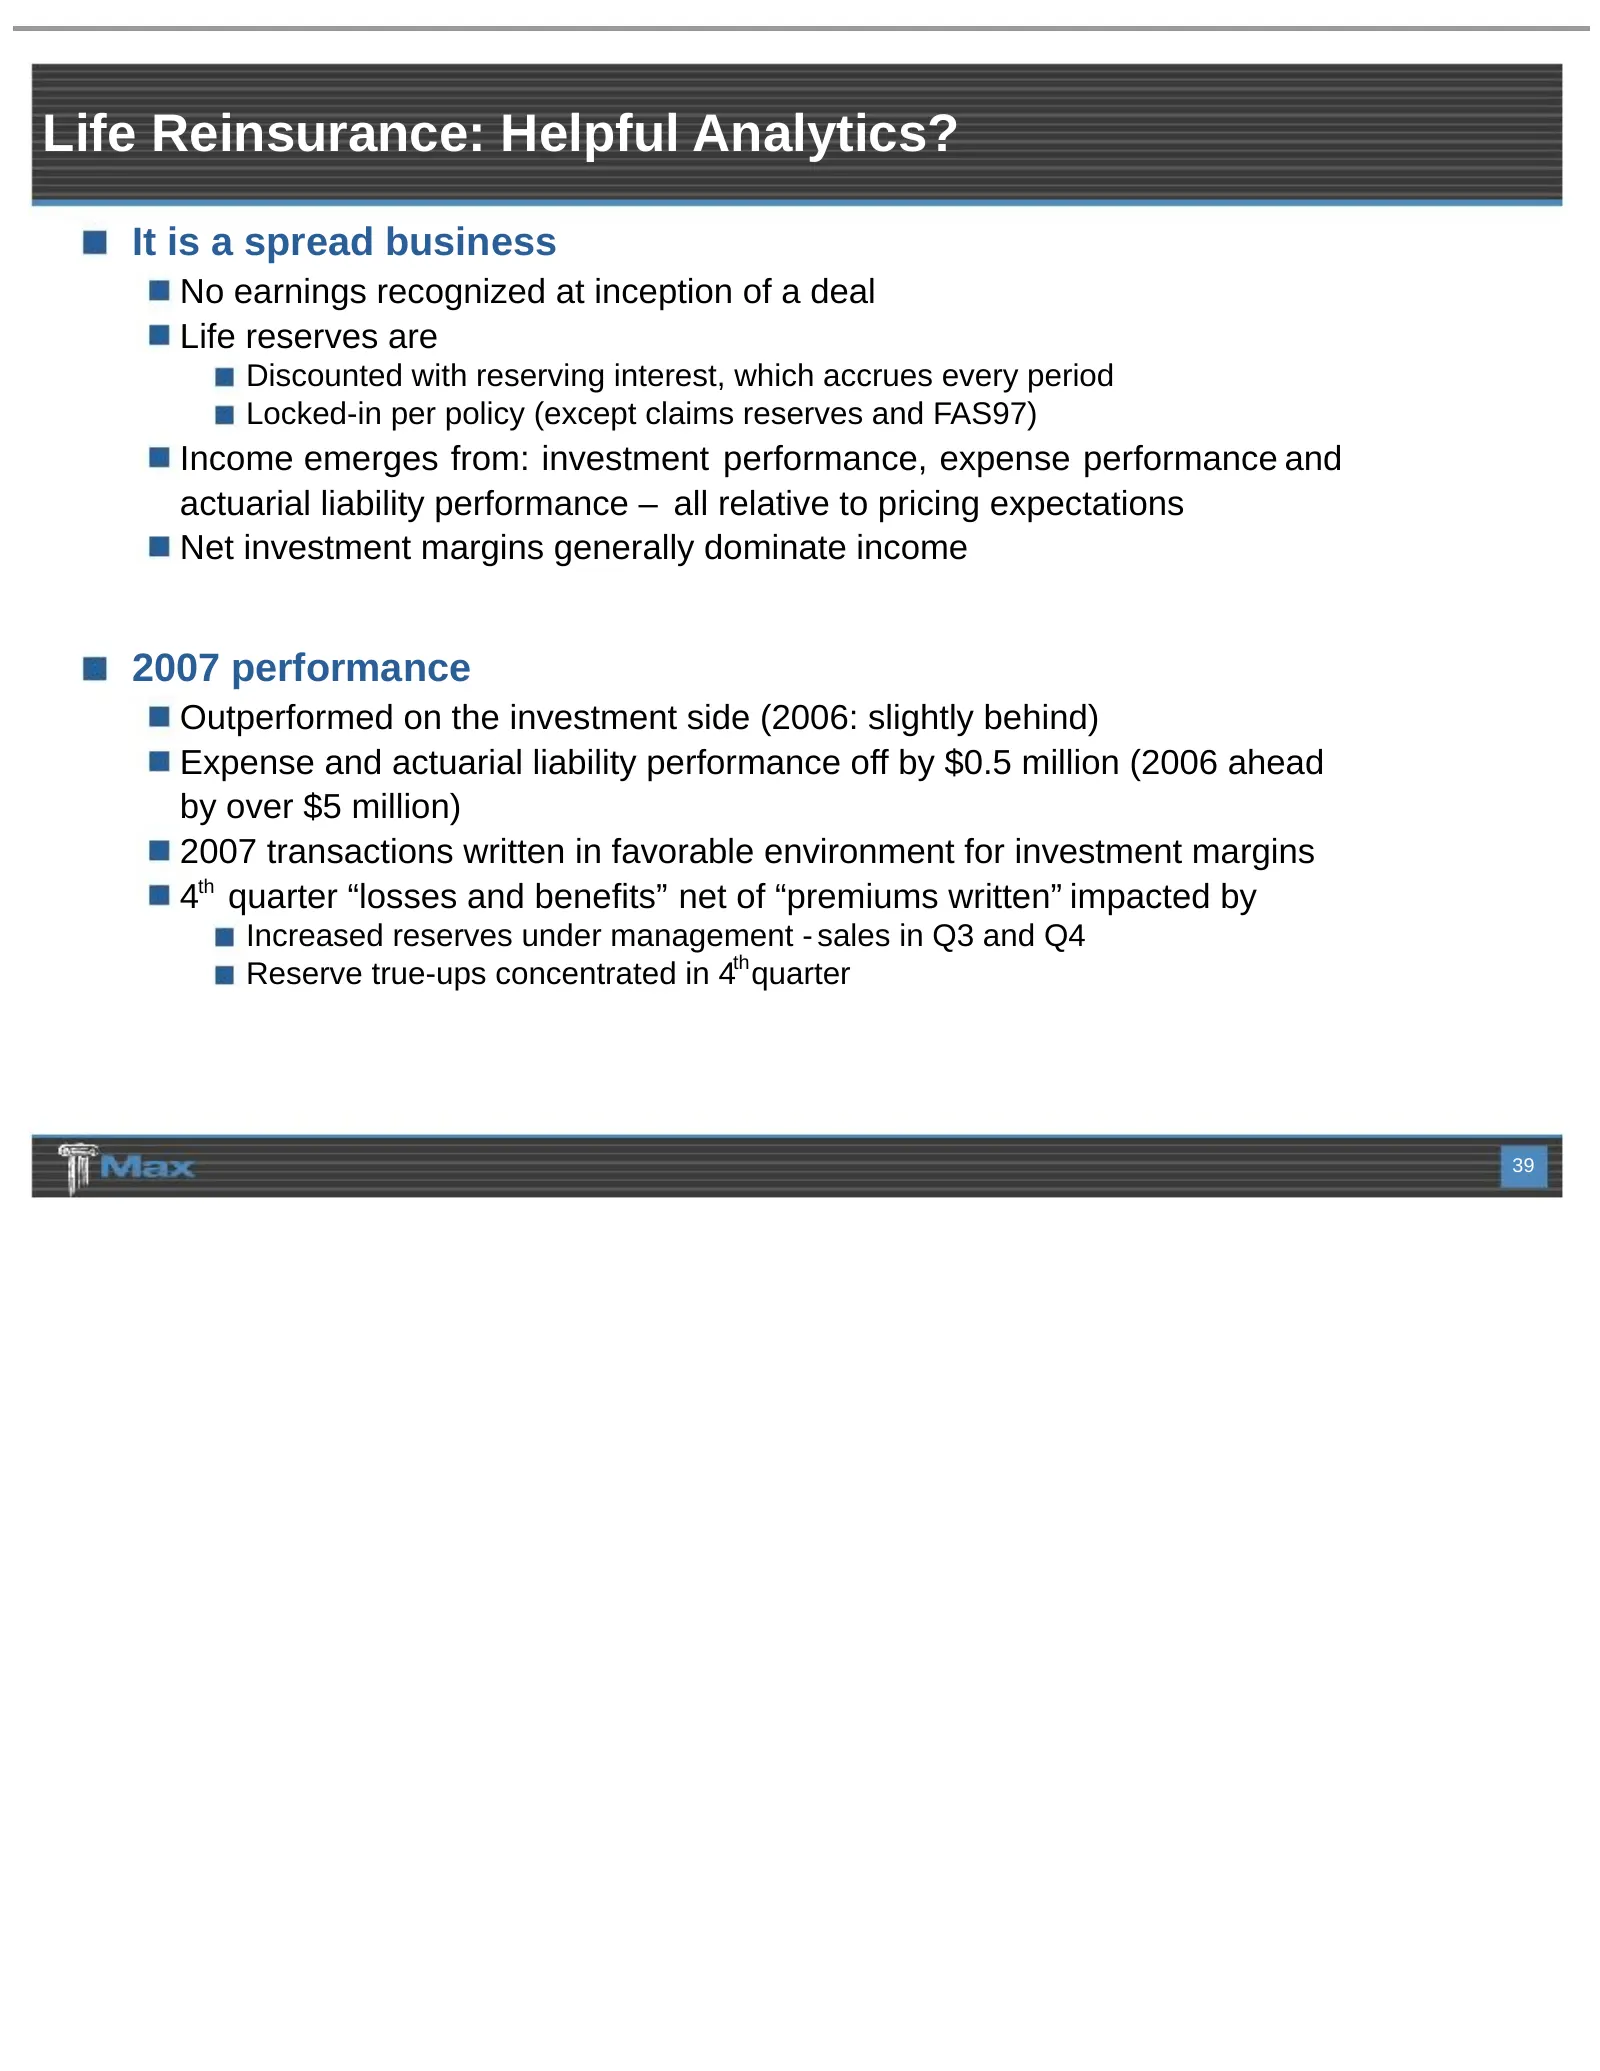
Life Reinsurance: Helpful Analytics? It is a spread business No earnings recognized at inception of a deal Life reserves are Discounted with reserving interest, which accrues every period Locked-in per policy (except claims reserves and FAS97) Income emerges from: investment performance, expense per
Slide 40: Max Specialty Insurance Company
Max Specialty Insurance Company Steve Vaccaro
Slide 41: Max Specialty: Experience
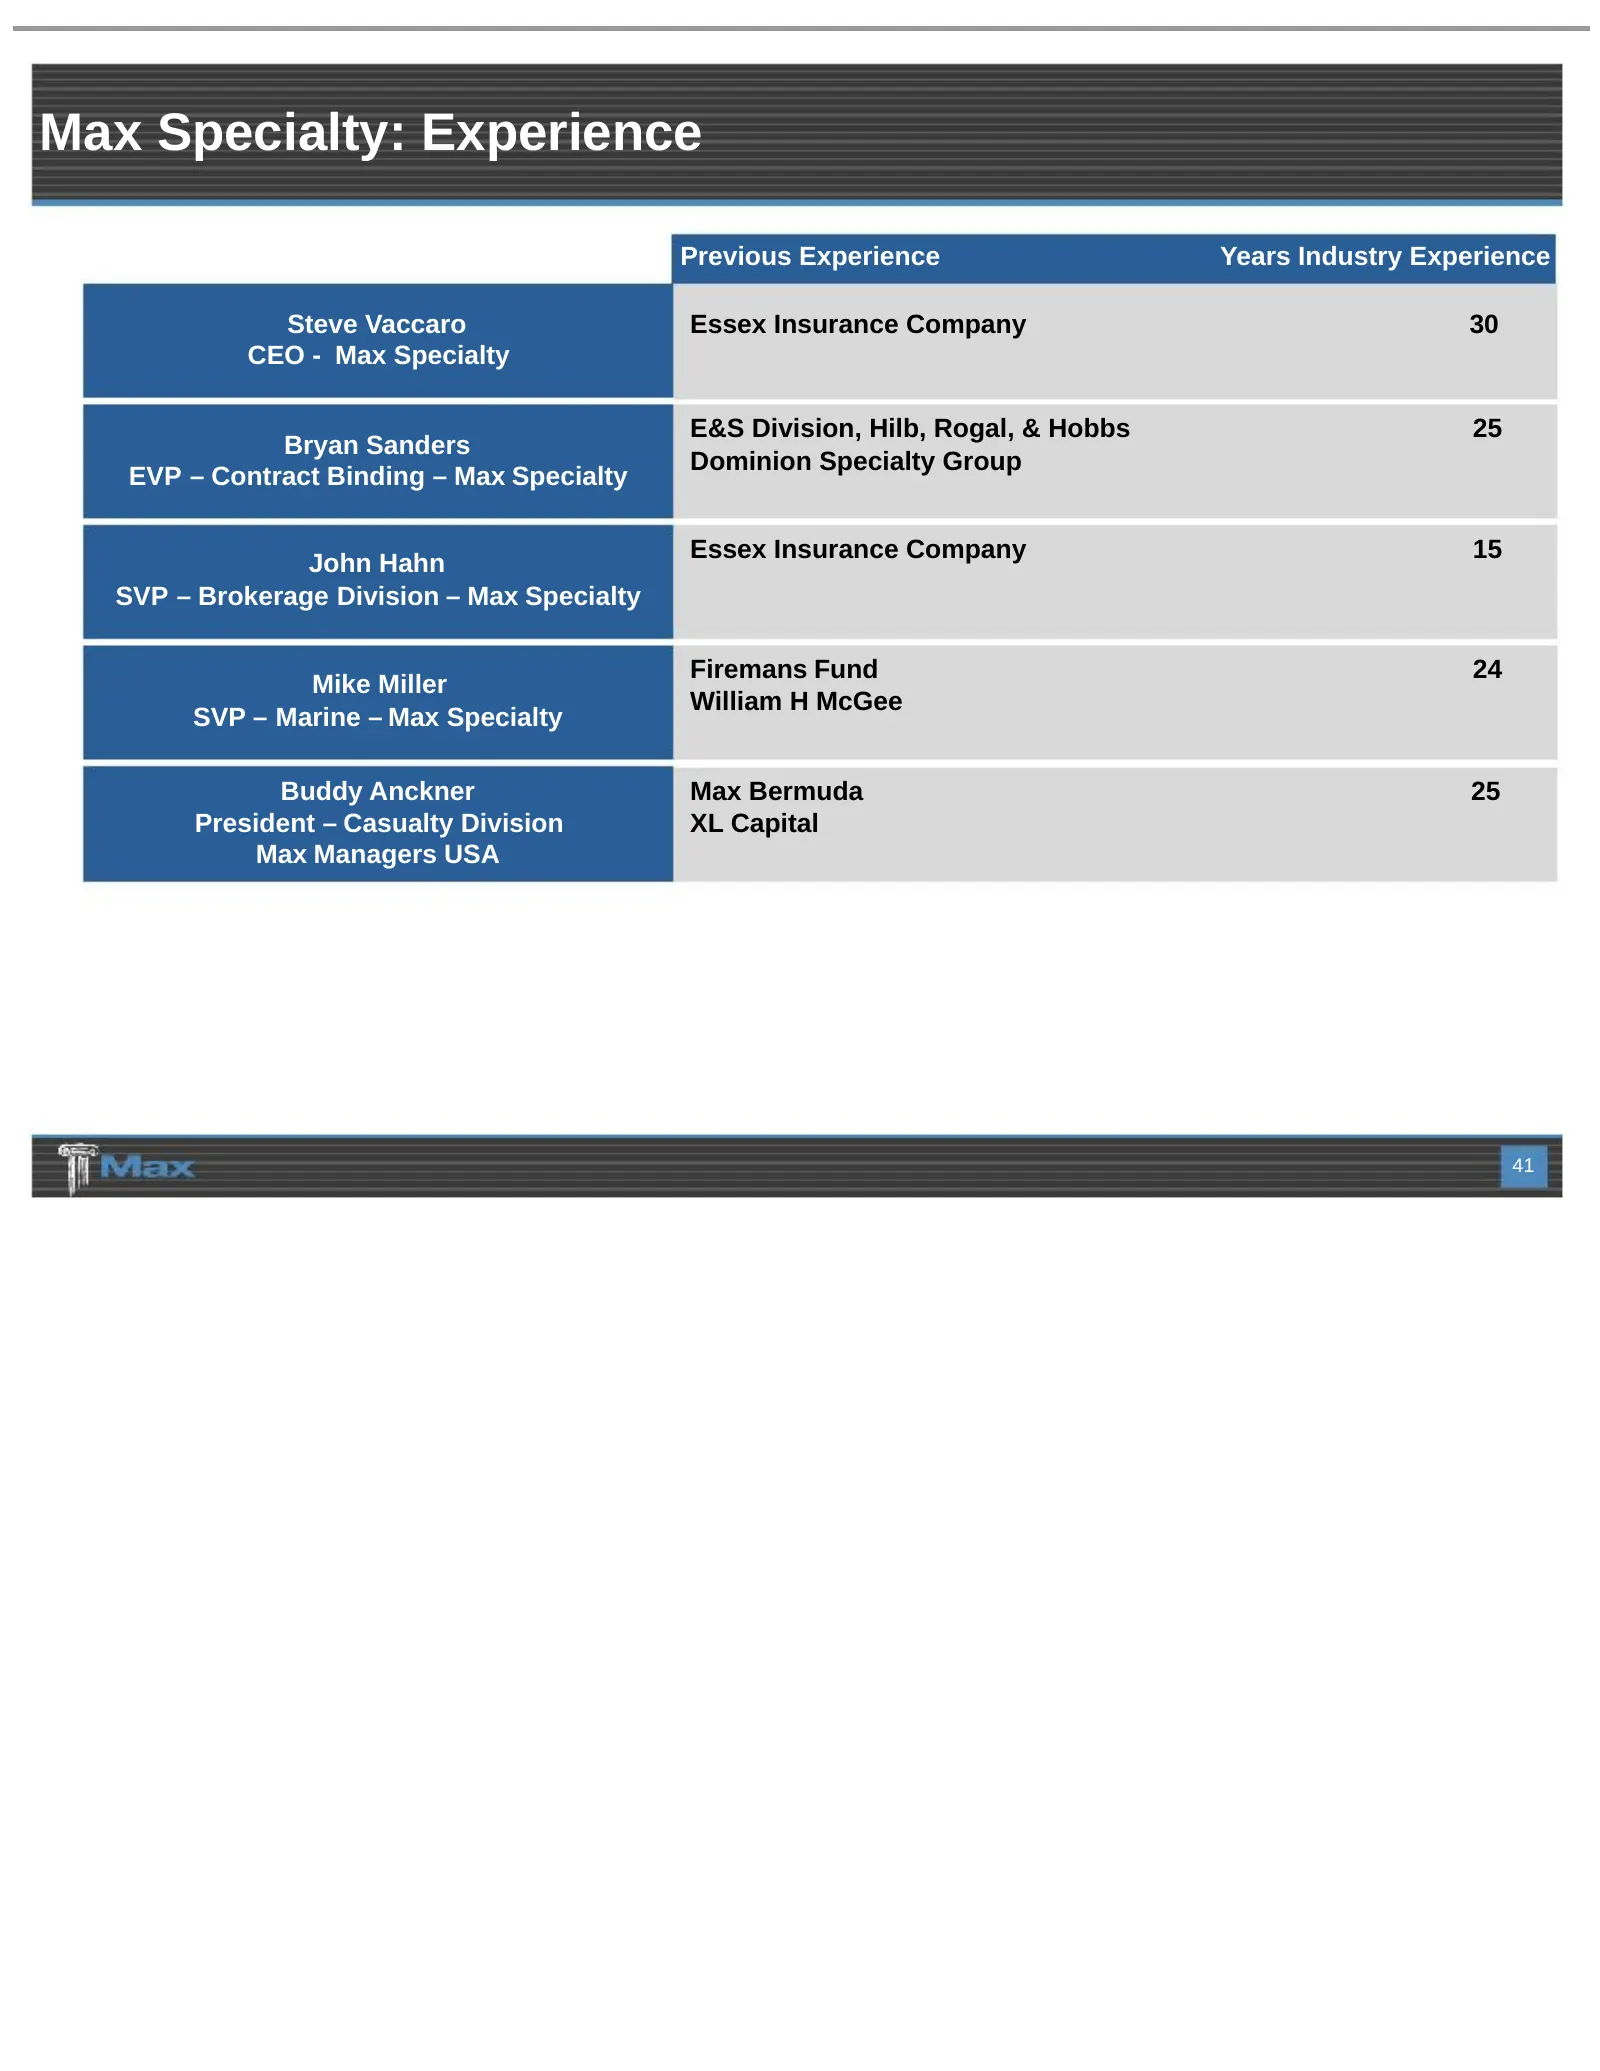
Max Specialty: Experience Previous Experience Years Industry Experience Steve Vaccaro Essex Insurance Company 30 CEO - Max Specialty E&S Division, Hilb, Rogal, & Hobbs 25 Bryan Sanders Dominion Specialty Group EVP – Contract Binding – Max Specialty Essex Insurance Company 15 John Hahn SVP – Brokerag
Slide 42: Max Specialty Insurance Company
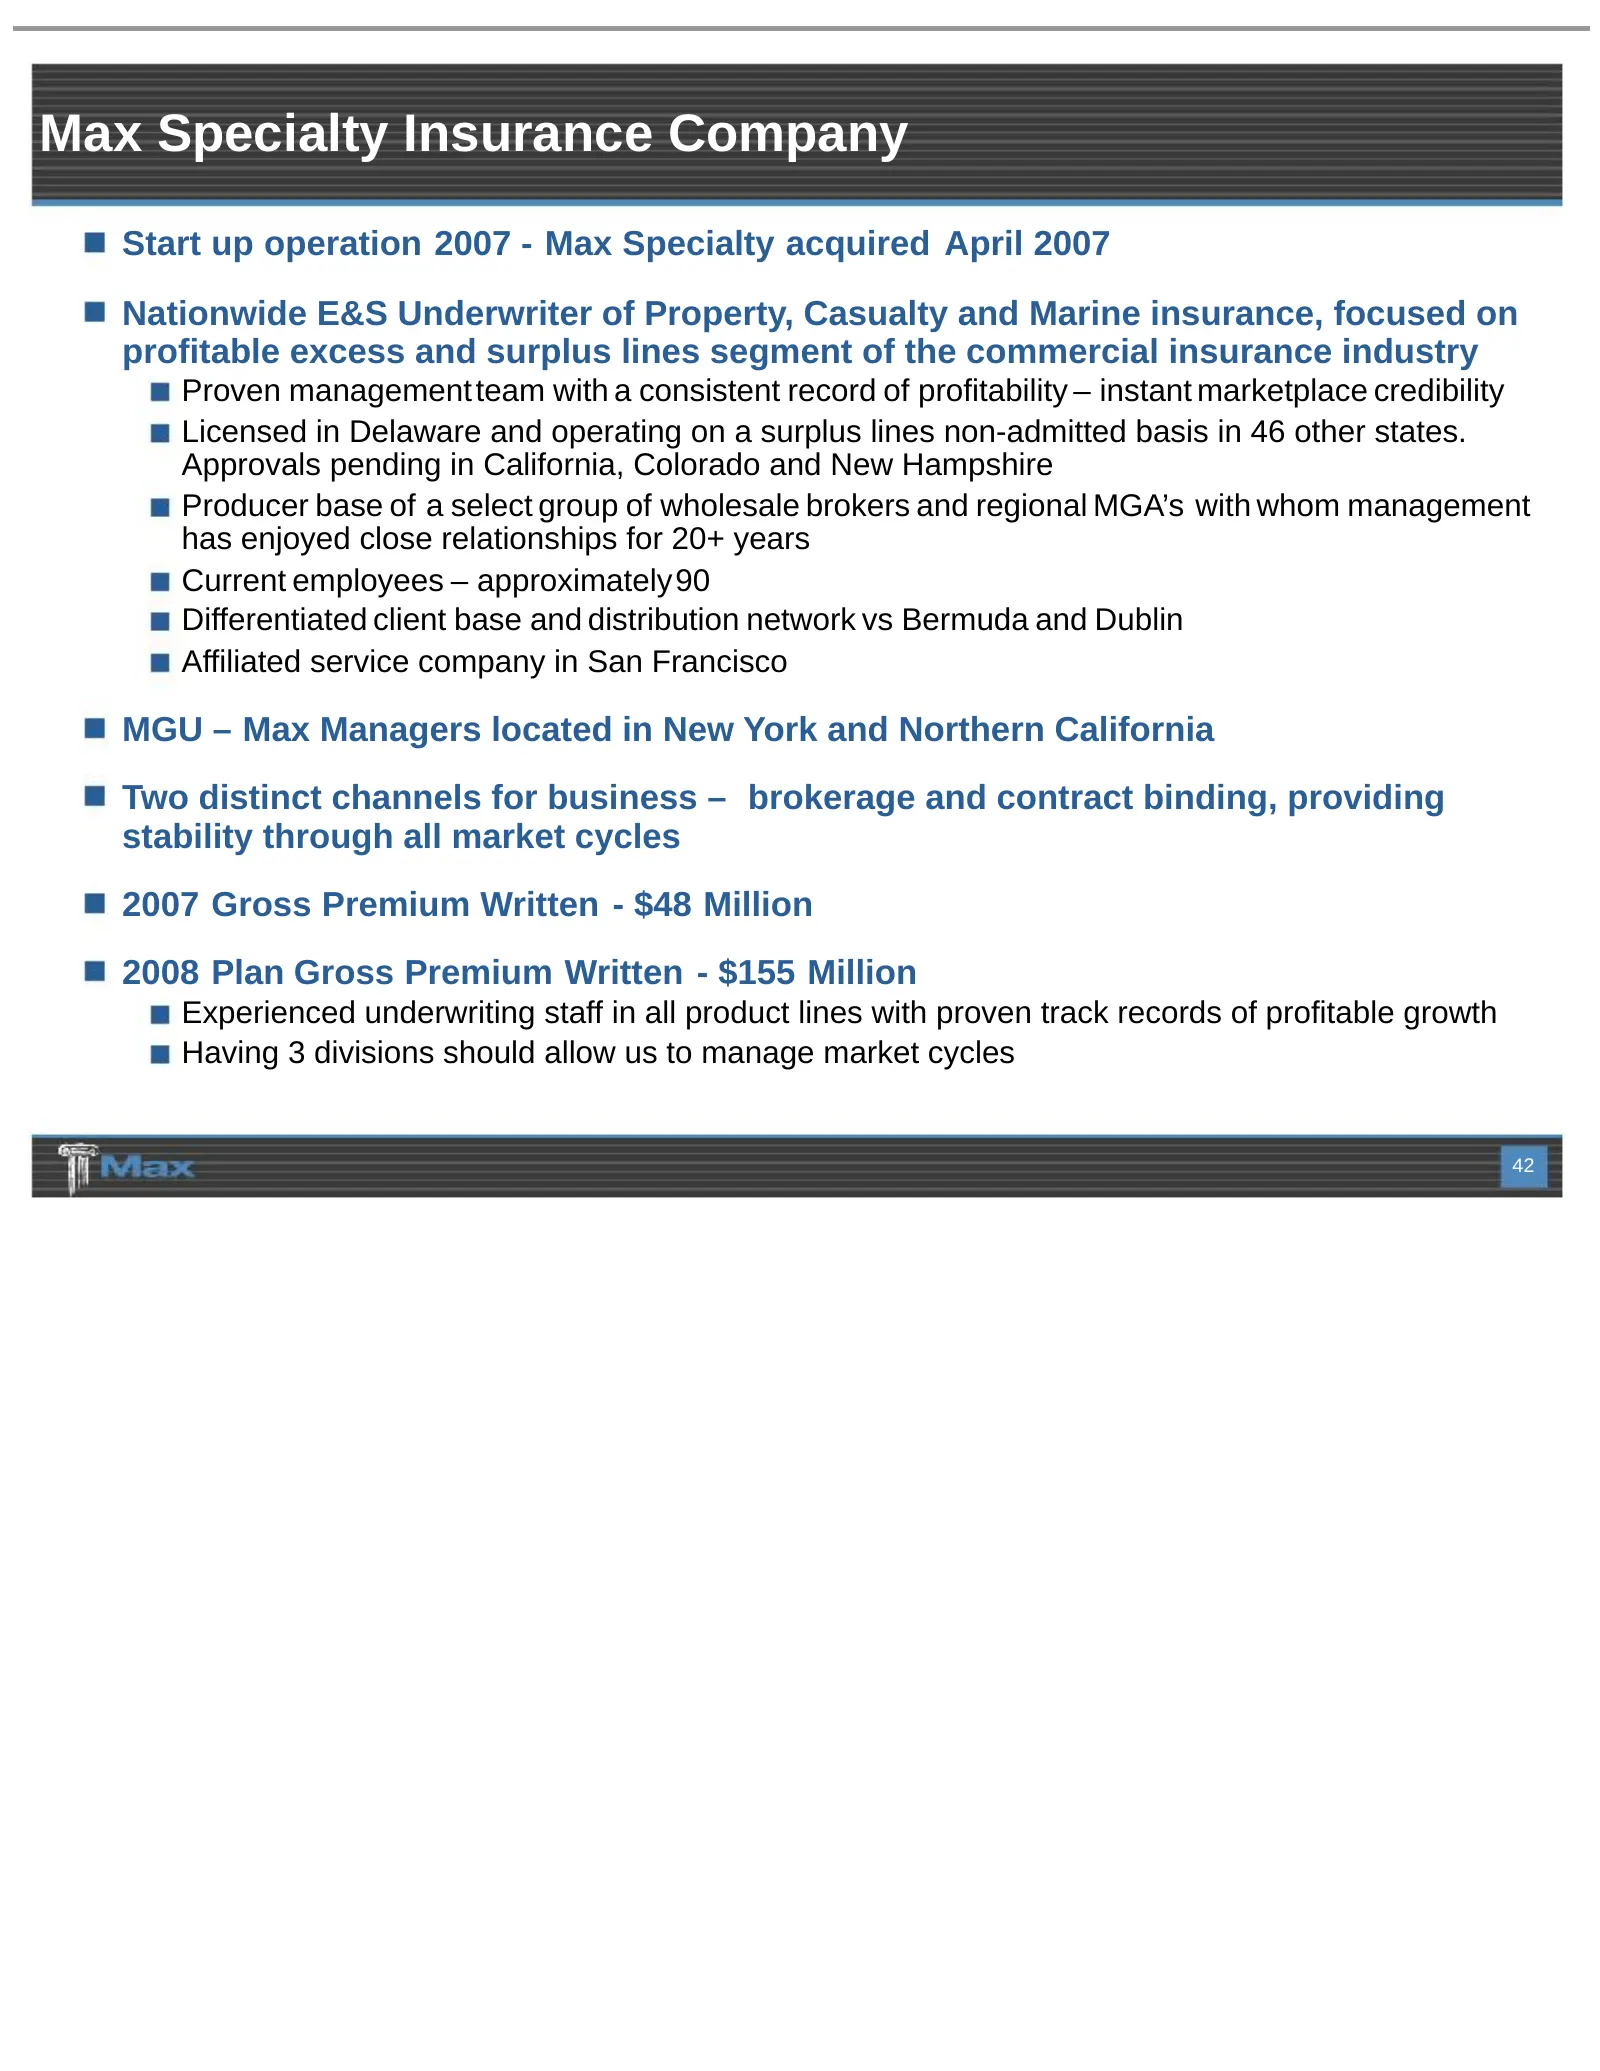
Max Specialty Insurance Company Start up operation 2007 - Max Specialty acquired April 2007 Nationwide E&S Underwriter of Property, Casualty and Marine insurance, focused on profitable excess and surplus lines segment of the commercial insurance industry Proven management team with a consistent reco
Slide 43: Underwriting: Overview / Products
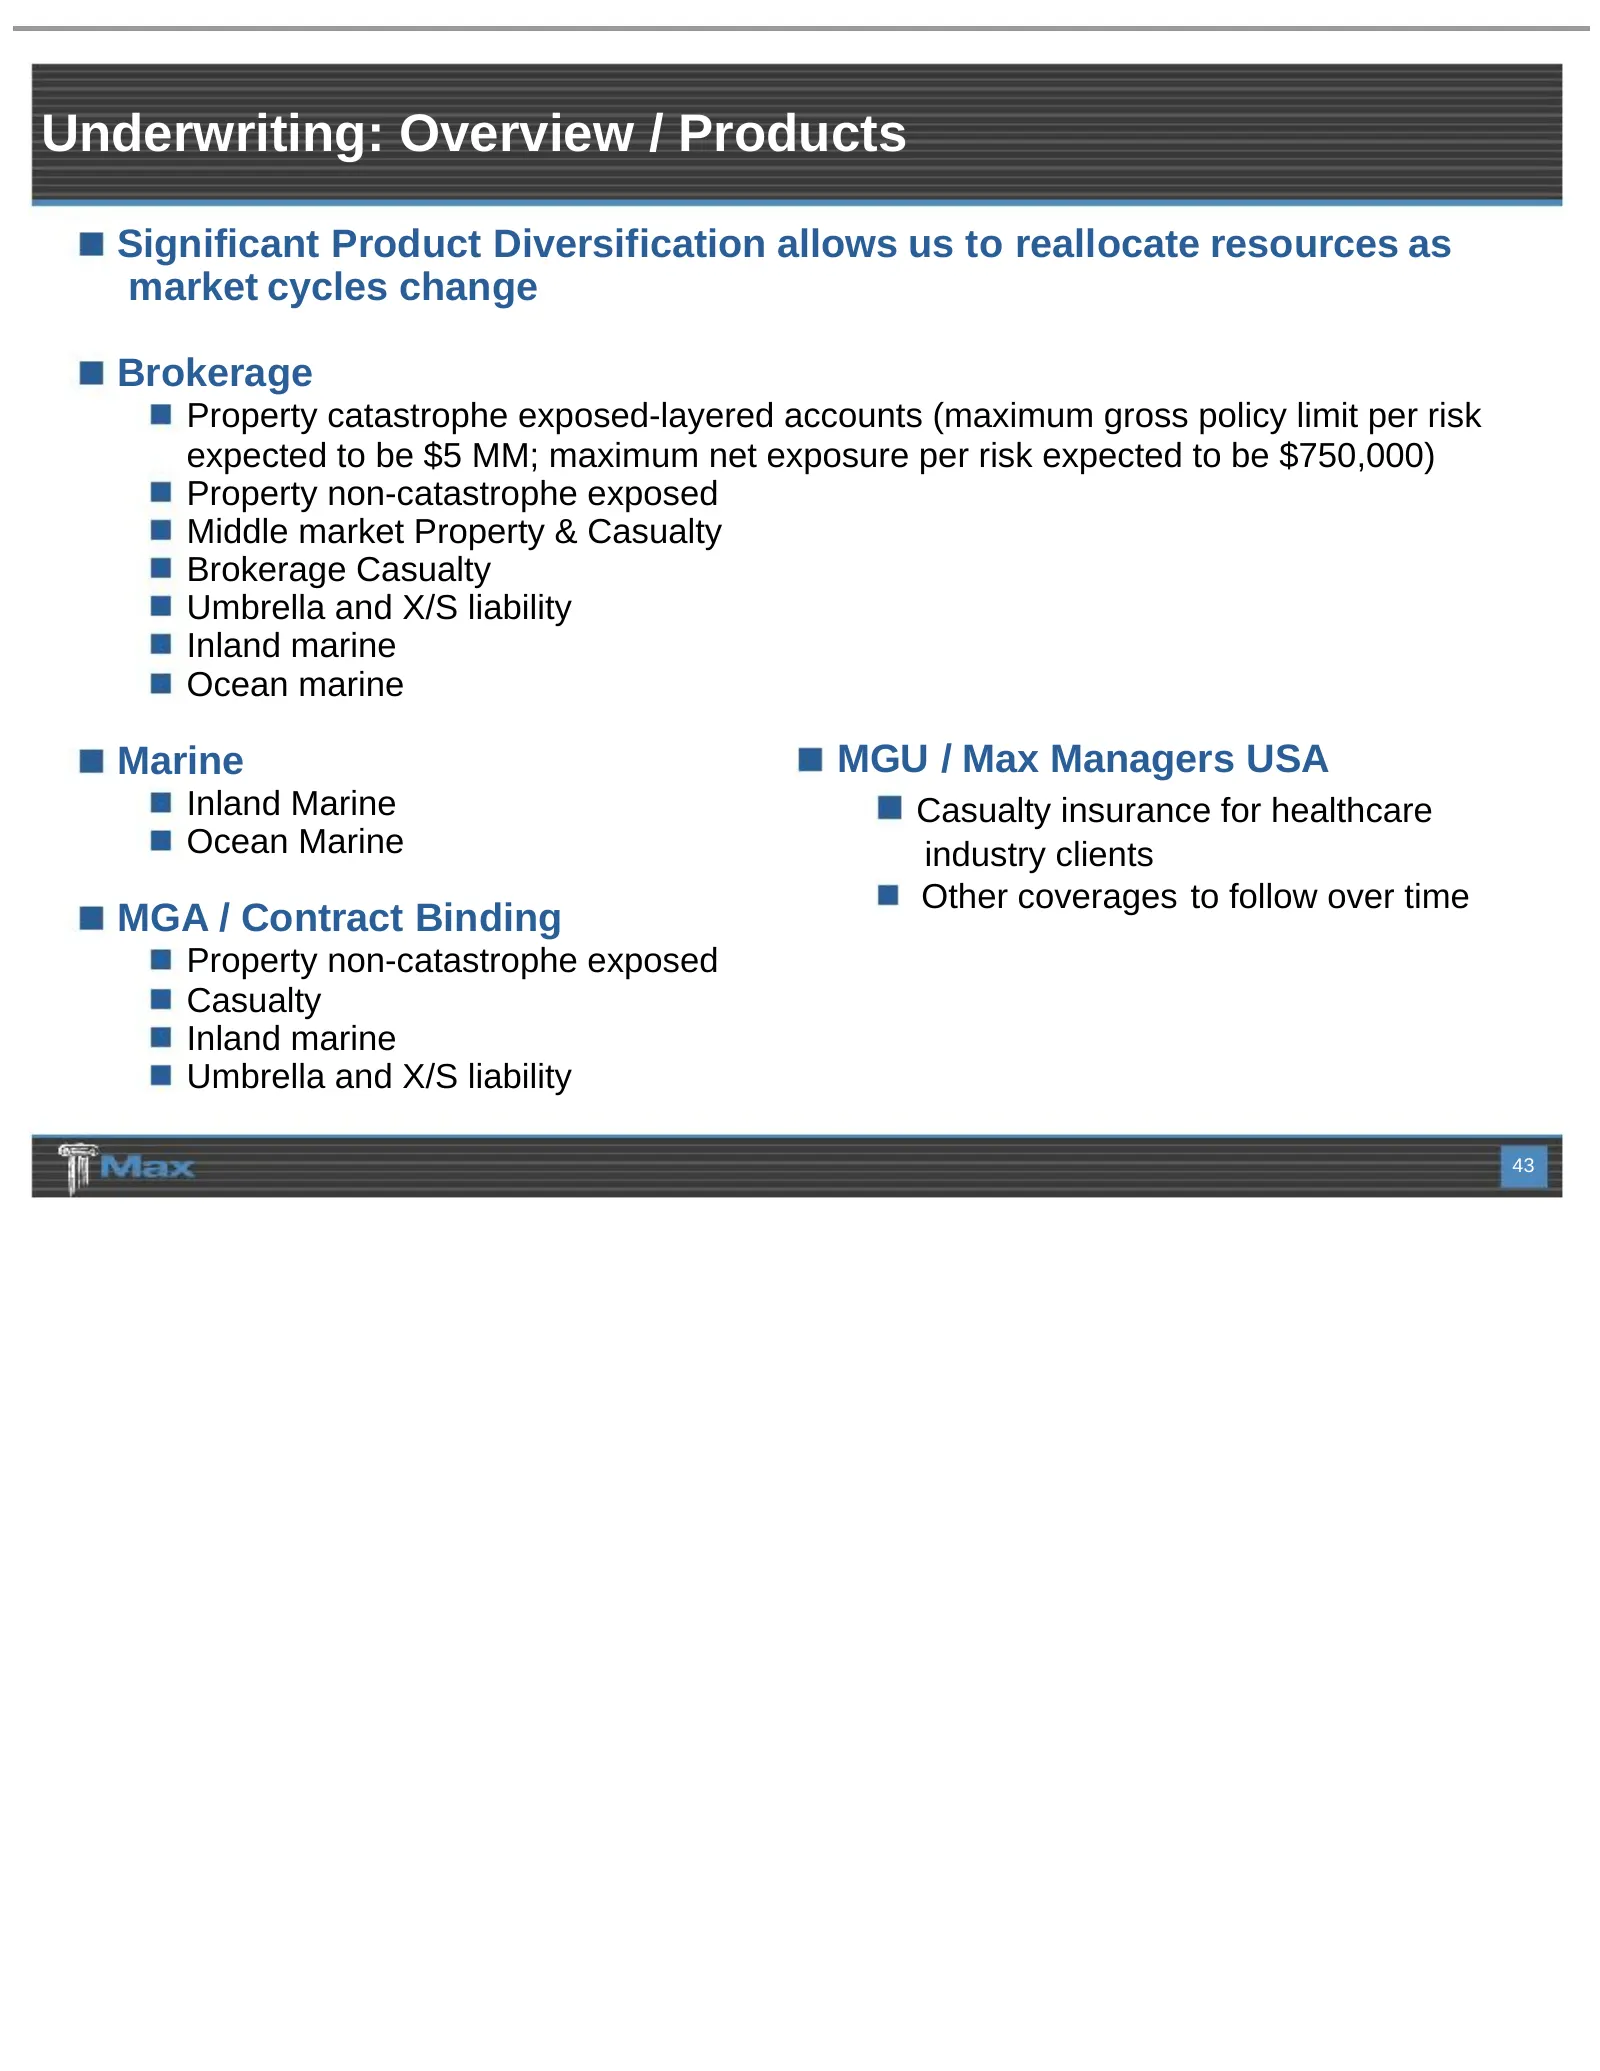
Underwriting: Overview / Products Significant Product Diversification allows us to reallocate resources as market cycles change Brokerage Property catastrophe exposed-layered accounts (maximum gross policy limit per risk expected to be $5 MM; maximum net exposure per risk expected to be $750,000) Pr
Slide 44: Relationships And Risk Management
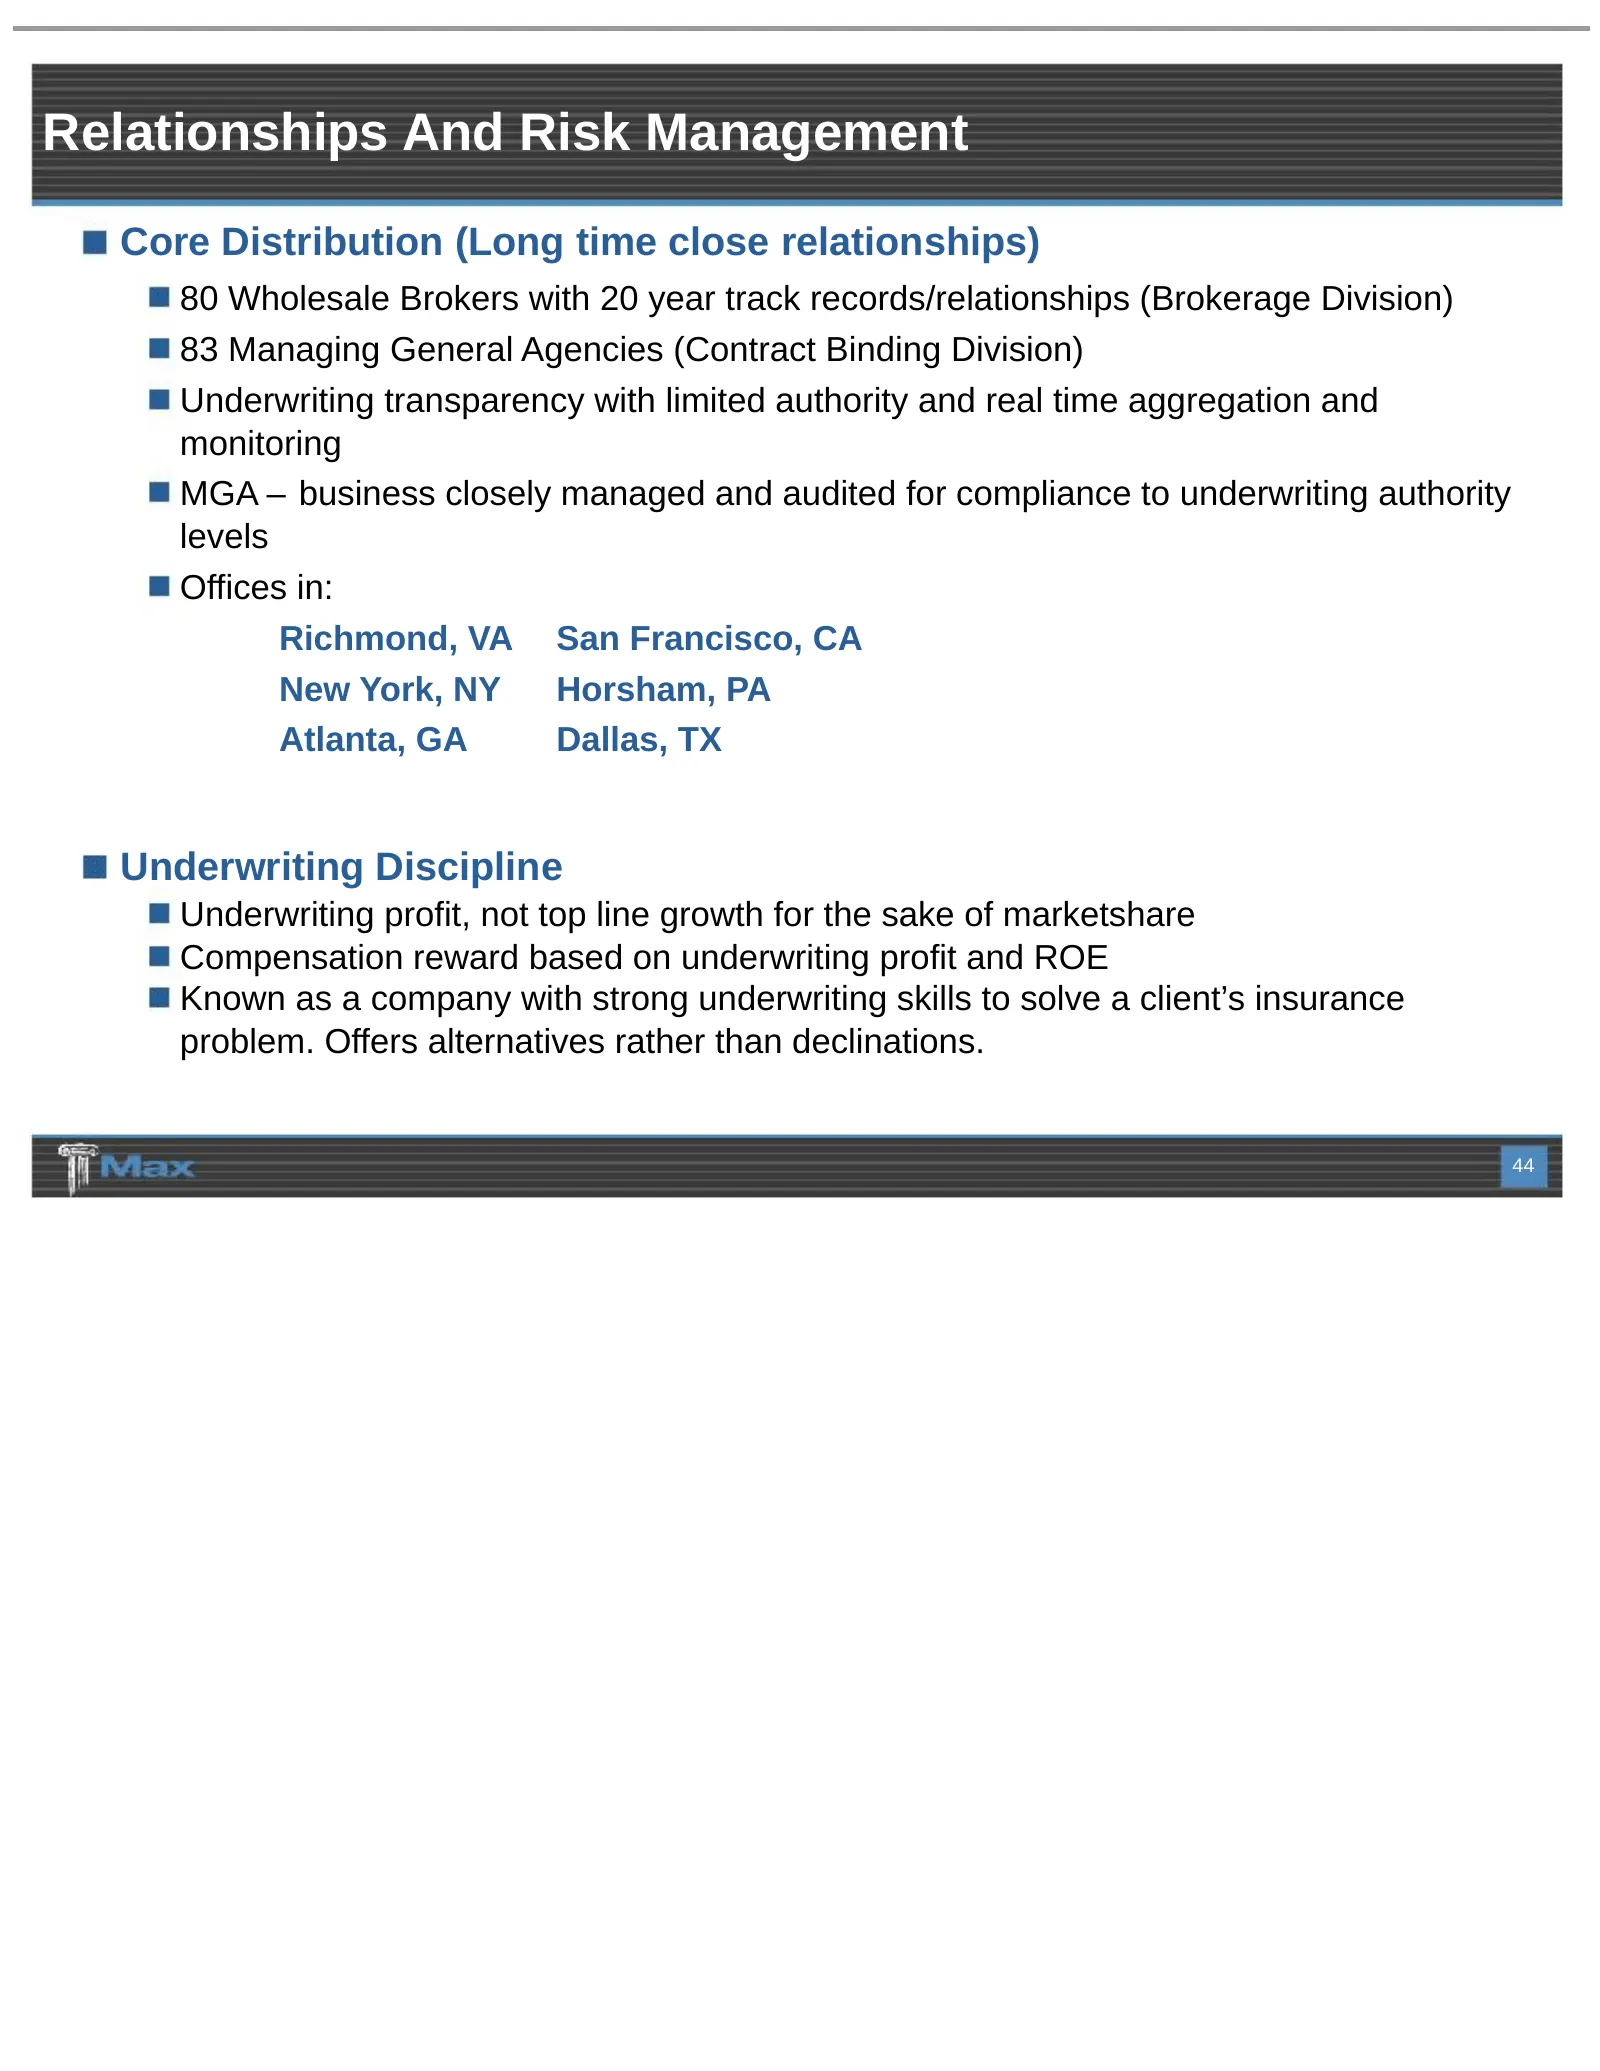
Relationships And Risk Management Core Distribution (Long time close relationships) 80 Wholesale Brokers with 20 year track records/relationships (Brokerage Division) 83 Managing General Agencies (Contract Binding Division) Underwriting transparency with limited authority and real time aggregation a
Slide 45: Diversified Investment Strategy
Diversified Investment Strategy N. James Tees
Slide 46: Diversified And Strategic Asset Allocation
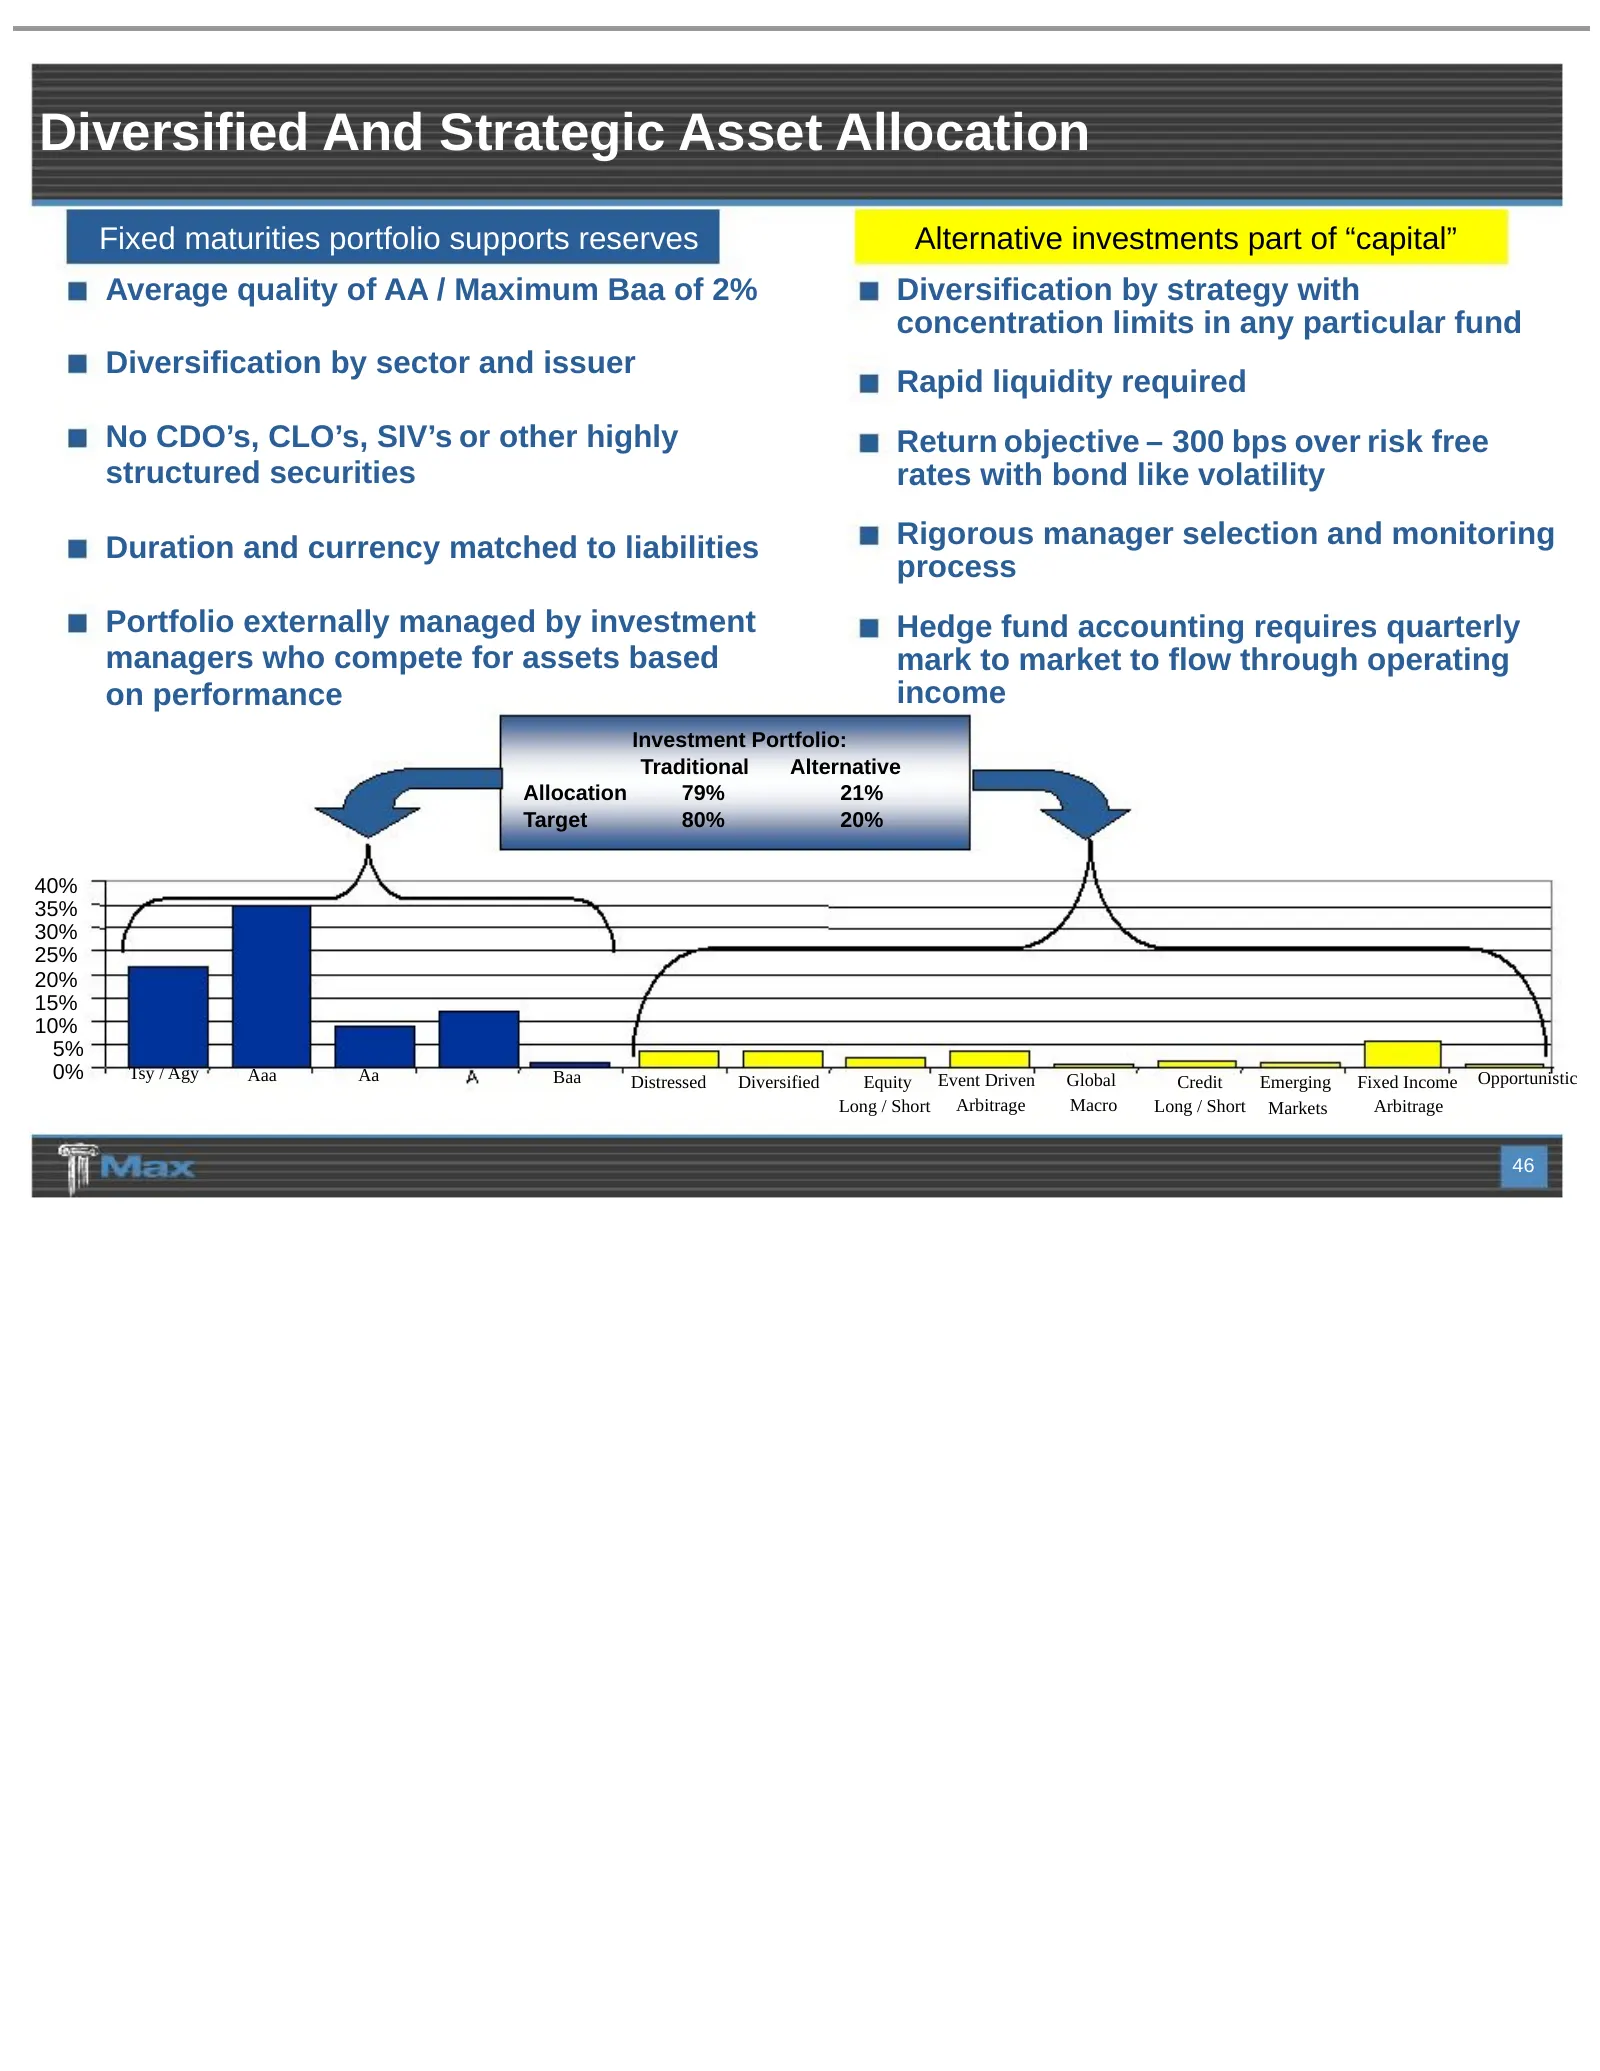
Diversified And Strategic Asset Allocation Fixed maturities portfolio supports reserves Alternative investments part of “capital” Average quality of AA / Maximum Baa of 2% Diversification by strategy with concentration limits in any particular fund Diversification by sector and issuer Rapid liquidit
Slide 47: Investment Strategy: Risk Averse Enhanced Returns
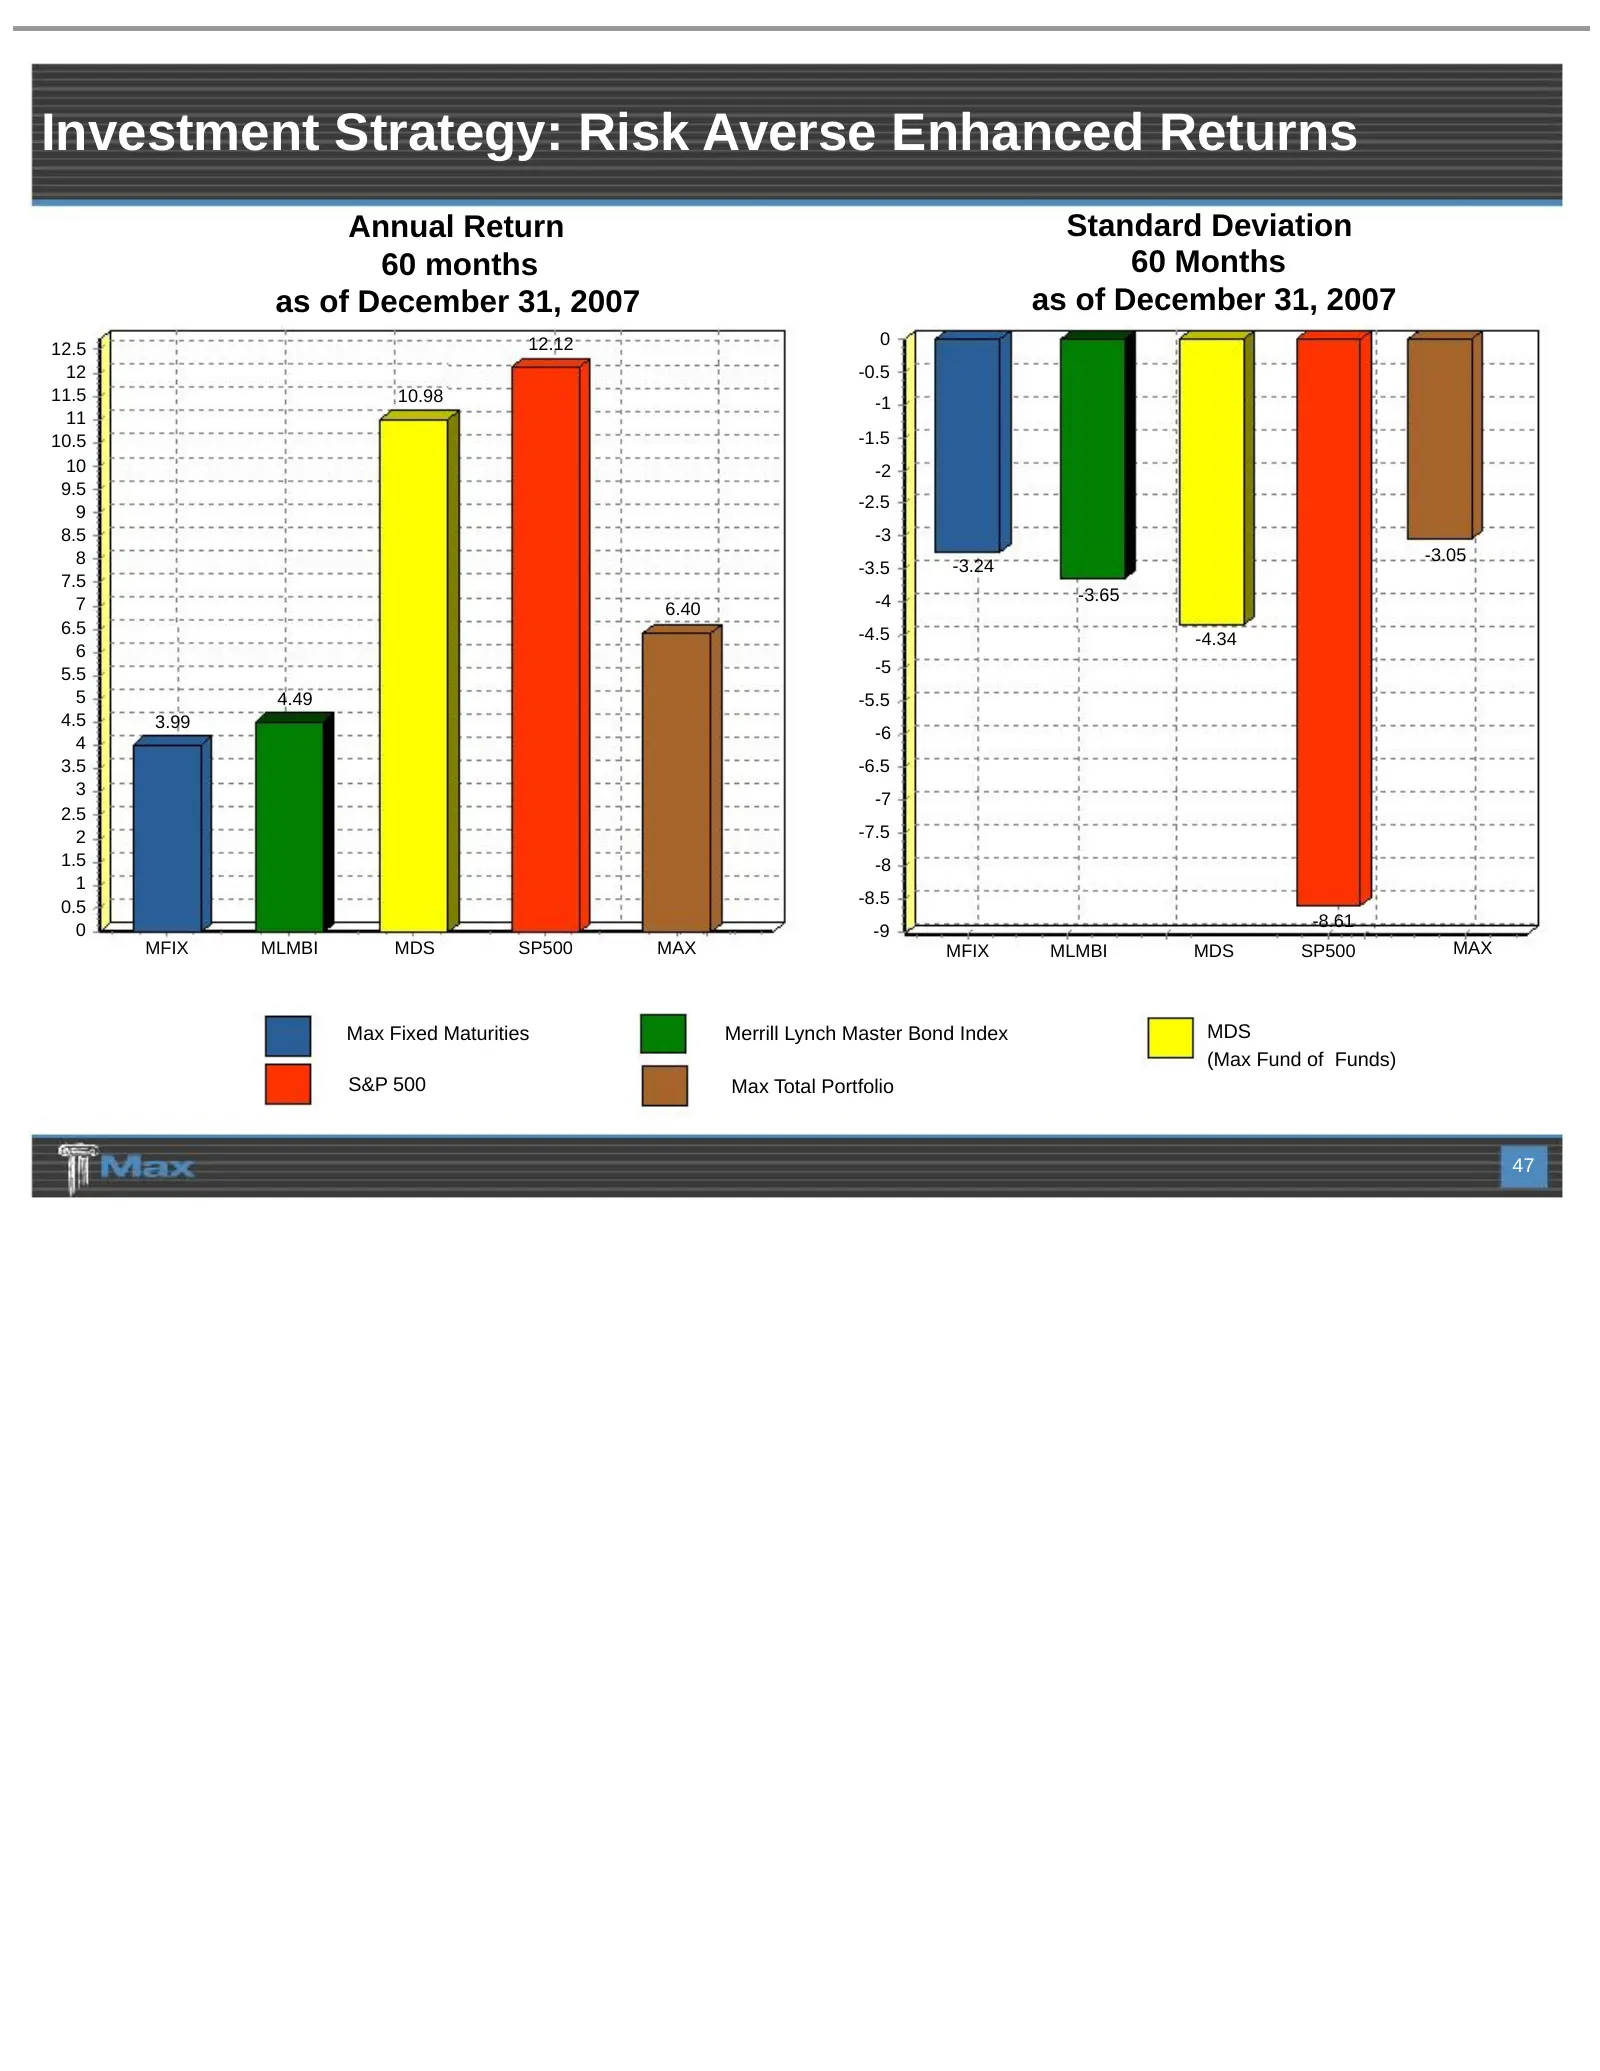
Investment Strategy: Risk Averse Enhanced Returns Annual Return Standard Deviation 60 months 60 Months as of December 31, 2007 as of December 31, 2007 12.12 0 12.5 12 -0.5 11.5 10.98 -1 11 10.5 -1.5 10 -2 9.5 -2.5 9 8.5 -3 8 -3.05 -3.5 -3.24 7.5 -4 -3.65 7 6.40 6.5 -4.5 -4.34 6 5.5 -5 5 4.49 -5.5 4.
Slide 48: Investments With Exposure To Sub-prime And Alt-A
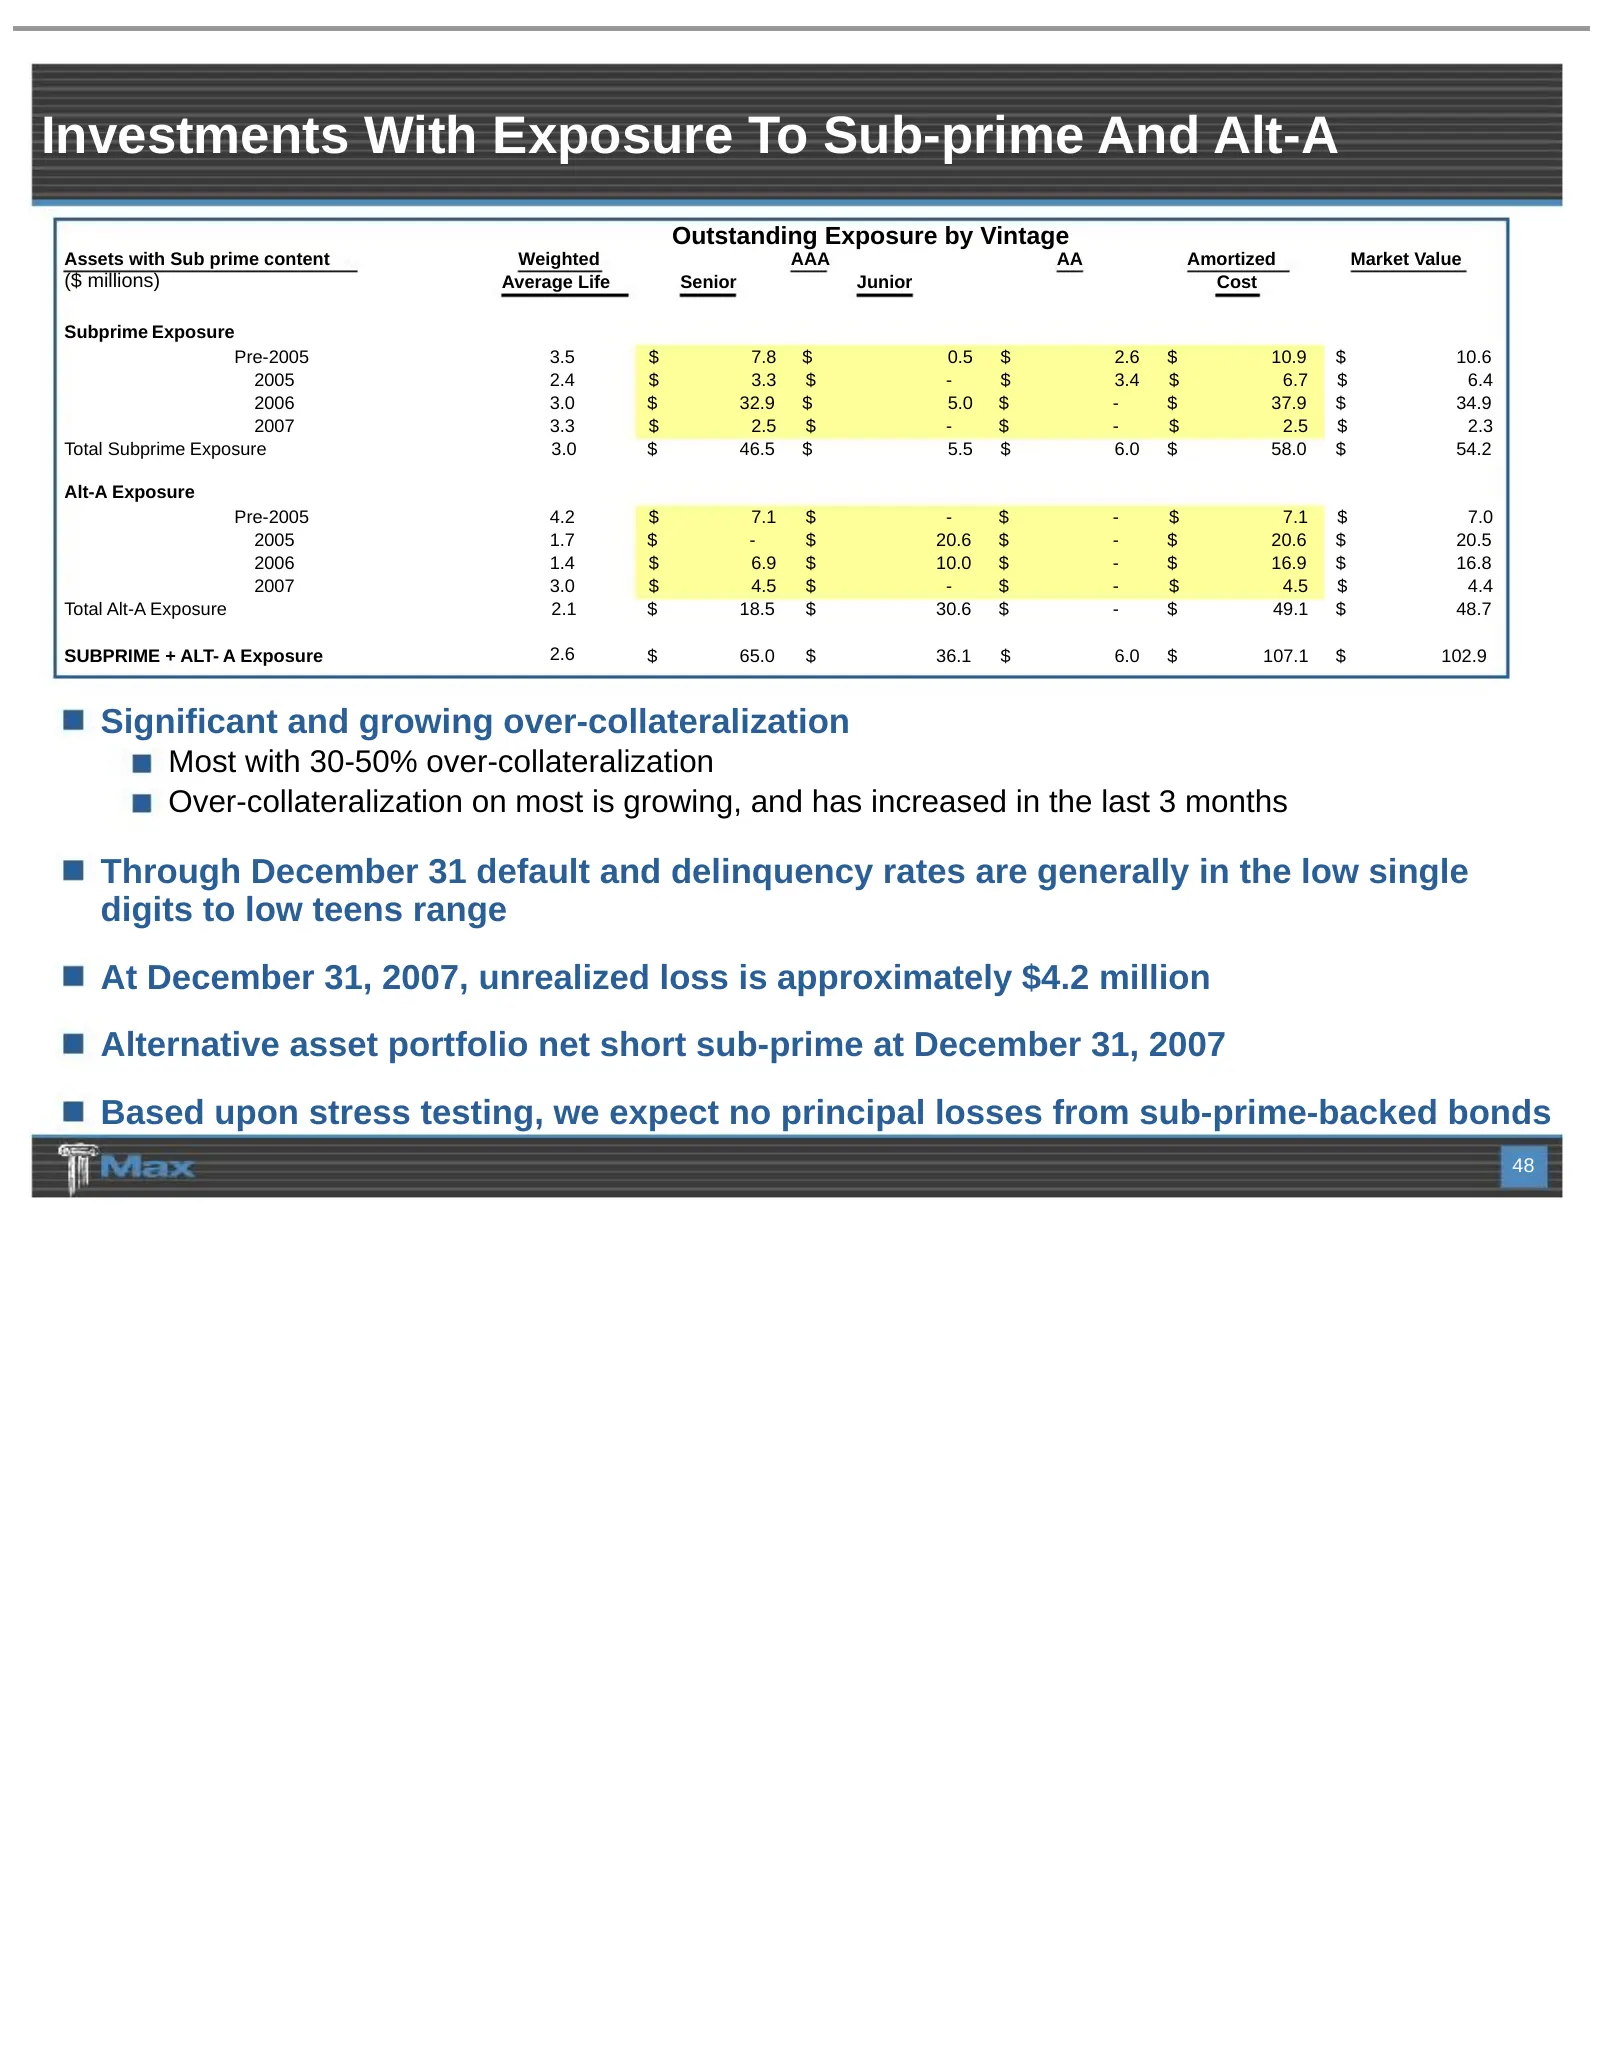
Investments With Exposure To Sub-prime And Alt-A Outstanding Exposure by Vintage Assets with Sub prime content Weighted AAA AA Amortized Market Value ($ millions) Average Life Senior Junior Cost Subprime Exposure Pre-2005 3.5 $ 7.8 $ 0.5 $ 2.6 $ 10.9 $ 10.6 2005 2.4 $ 3.3 $ - $ 3.4 $ 6.7 $ 6.4 2006
Slide 49: Risk Management & Reserves
Risk Management & Reserves Peter Minton
Slide 50: Managing Risk For Maximum Reward
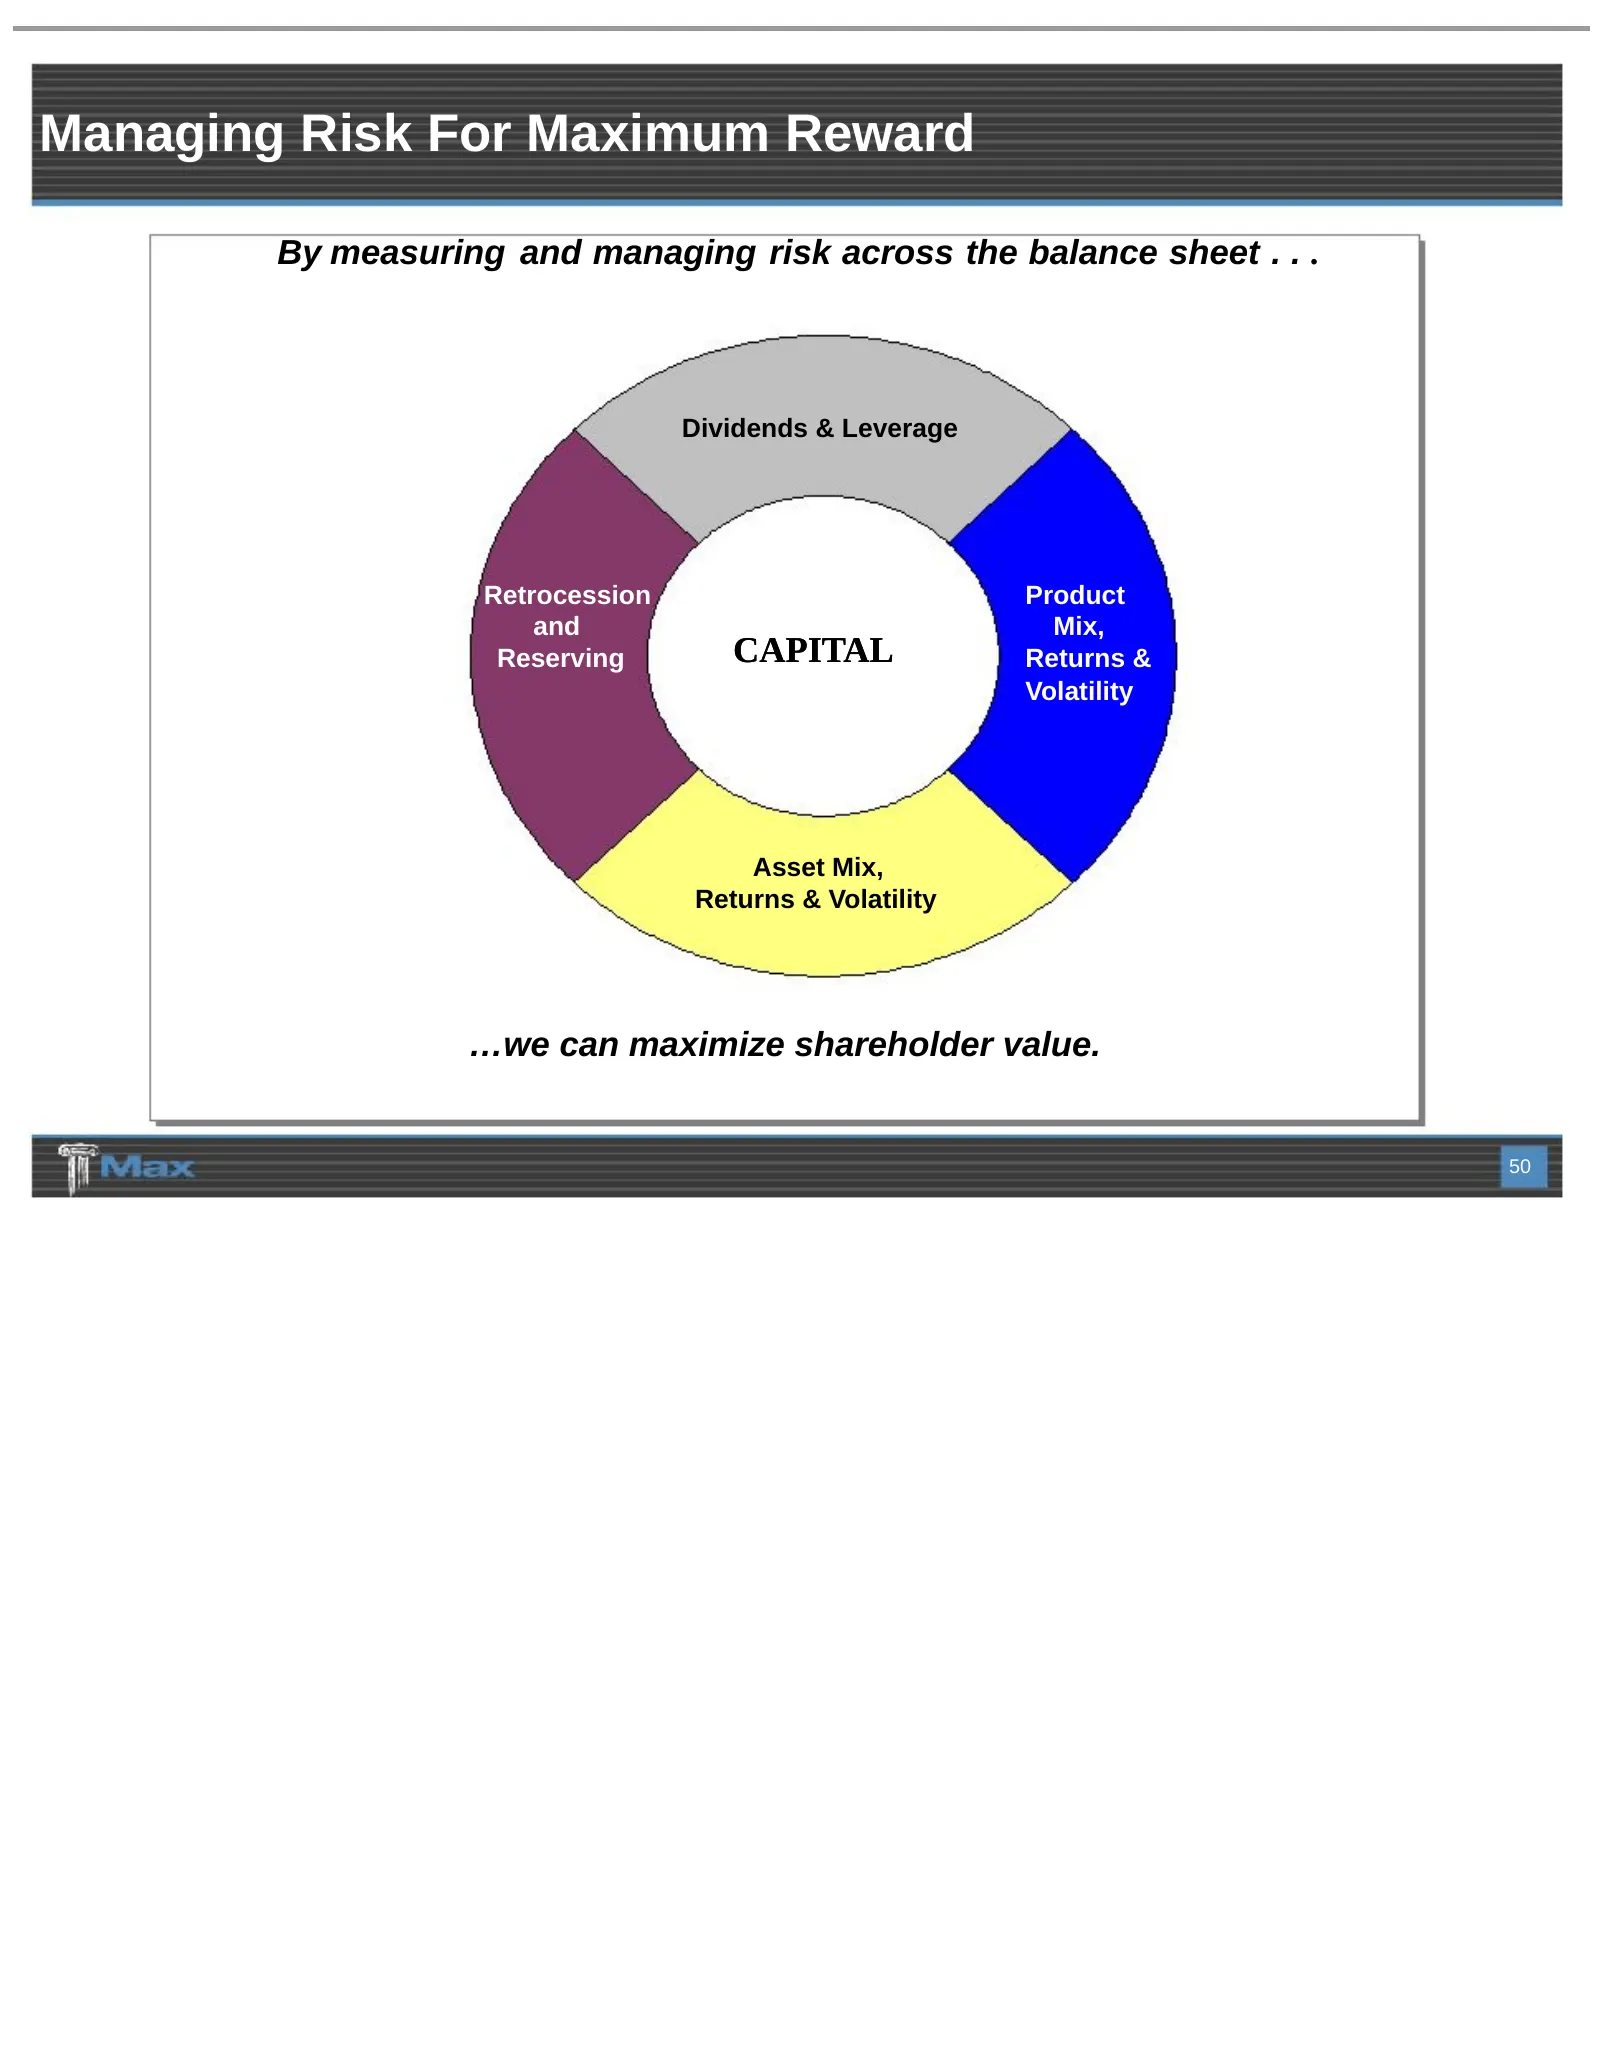
Managing Risk For Maximum Reward By measuring and managing risk across the balance sheet . . . Dividends & Leverage Retrocession Product and Mix, Reserving CAPITAL Returns & Volatility Asset Mix, Returns & Volatility …we can maximize shareholder value. 50
Slide 51: Leading Edge Risk Management
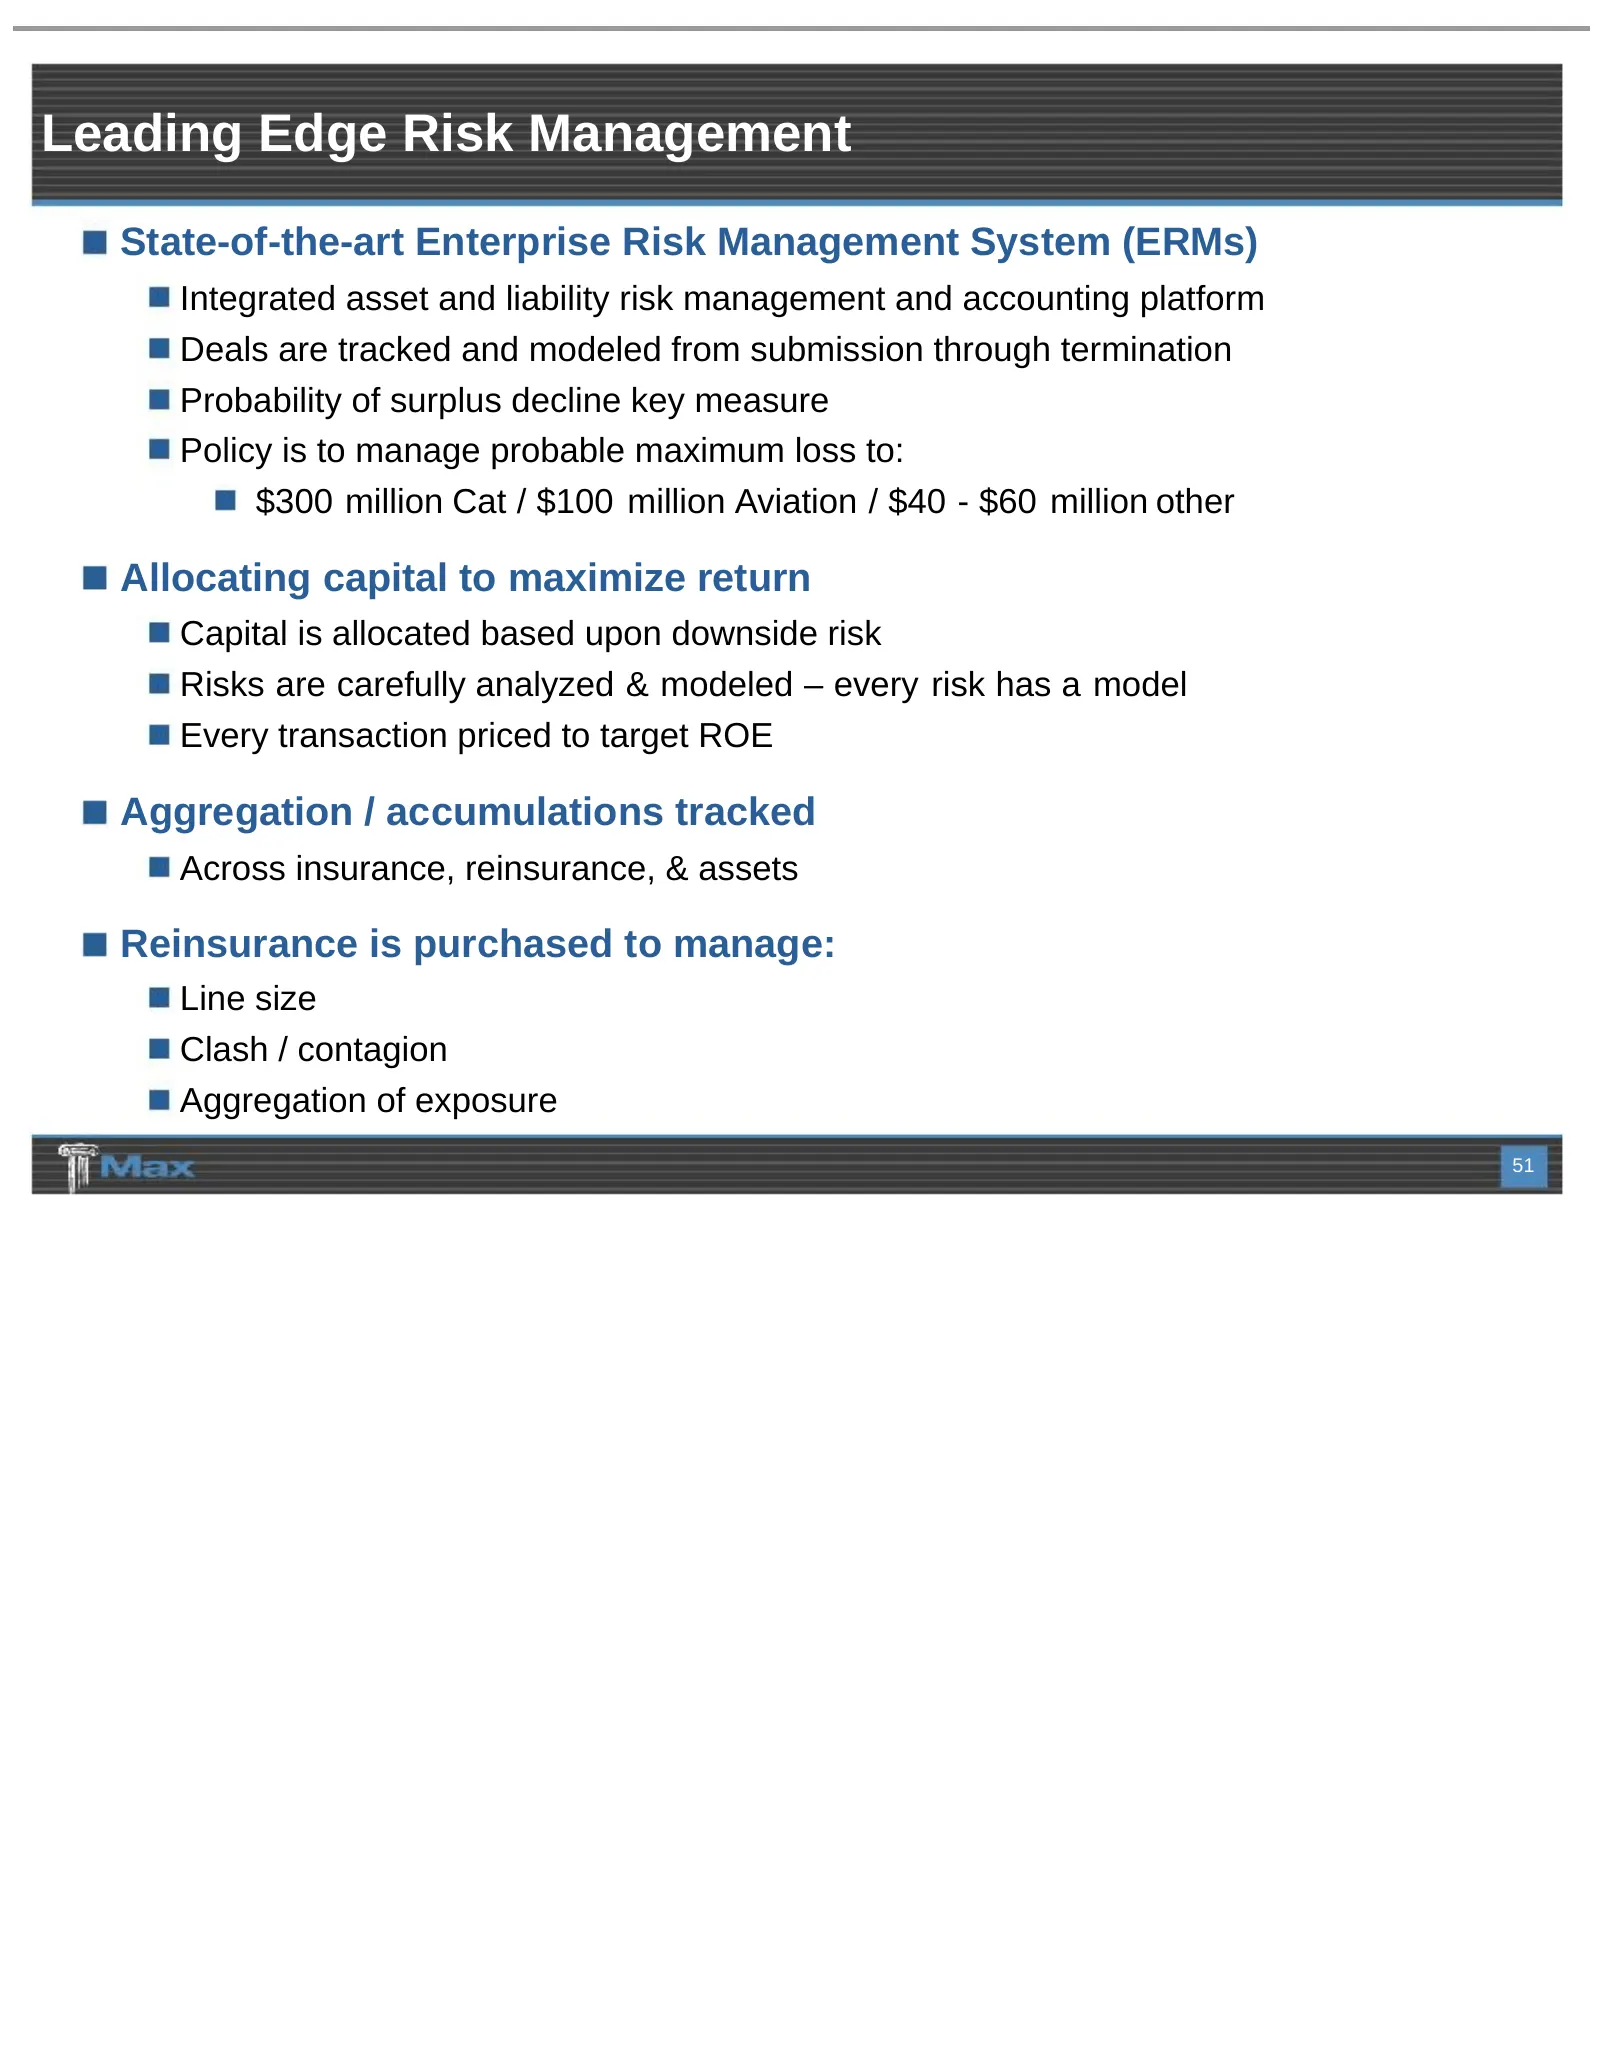
Leading Edge Risk Management State-of-the-art Enterprise Risk Management System (ERMs) Integrated asset and liability risk management and accounting platform Deals are tracked and modeled from submission through termination Probability of surplus decline key measure Policy is to manage probable maxi
Slide 52: A Robust Reserving Process
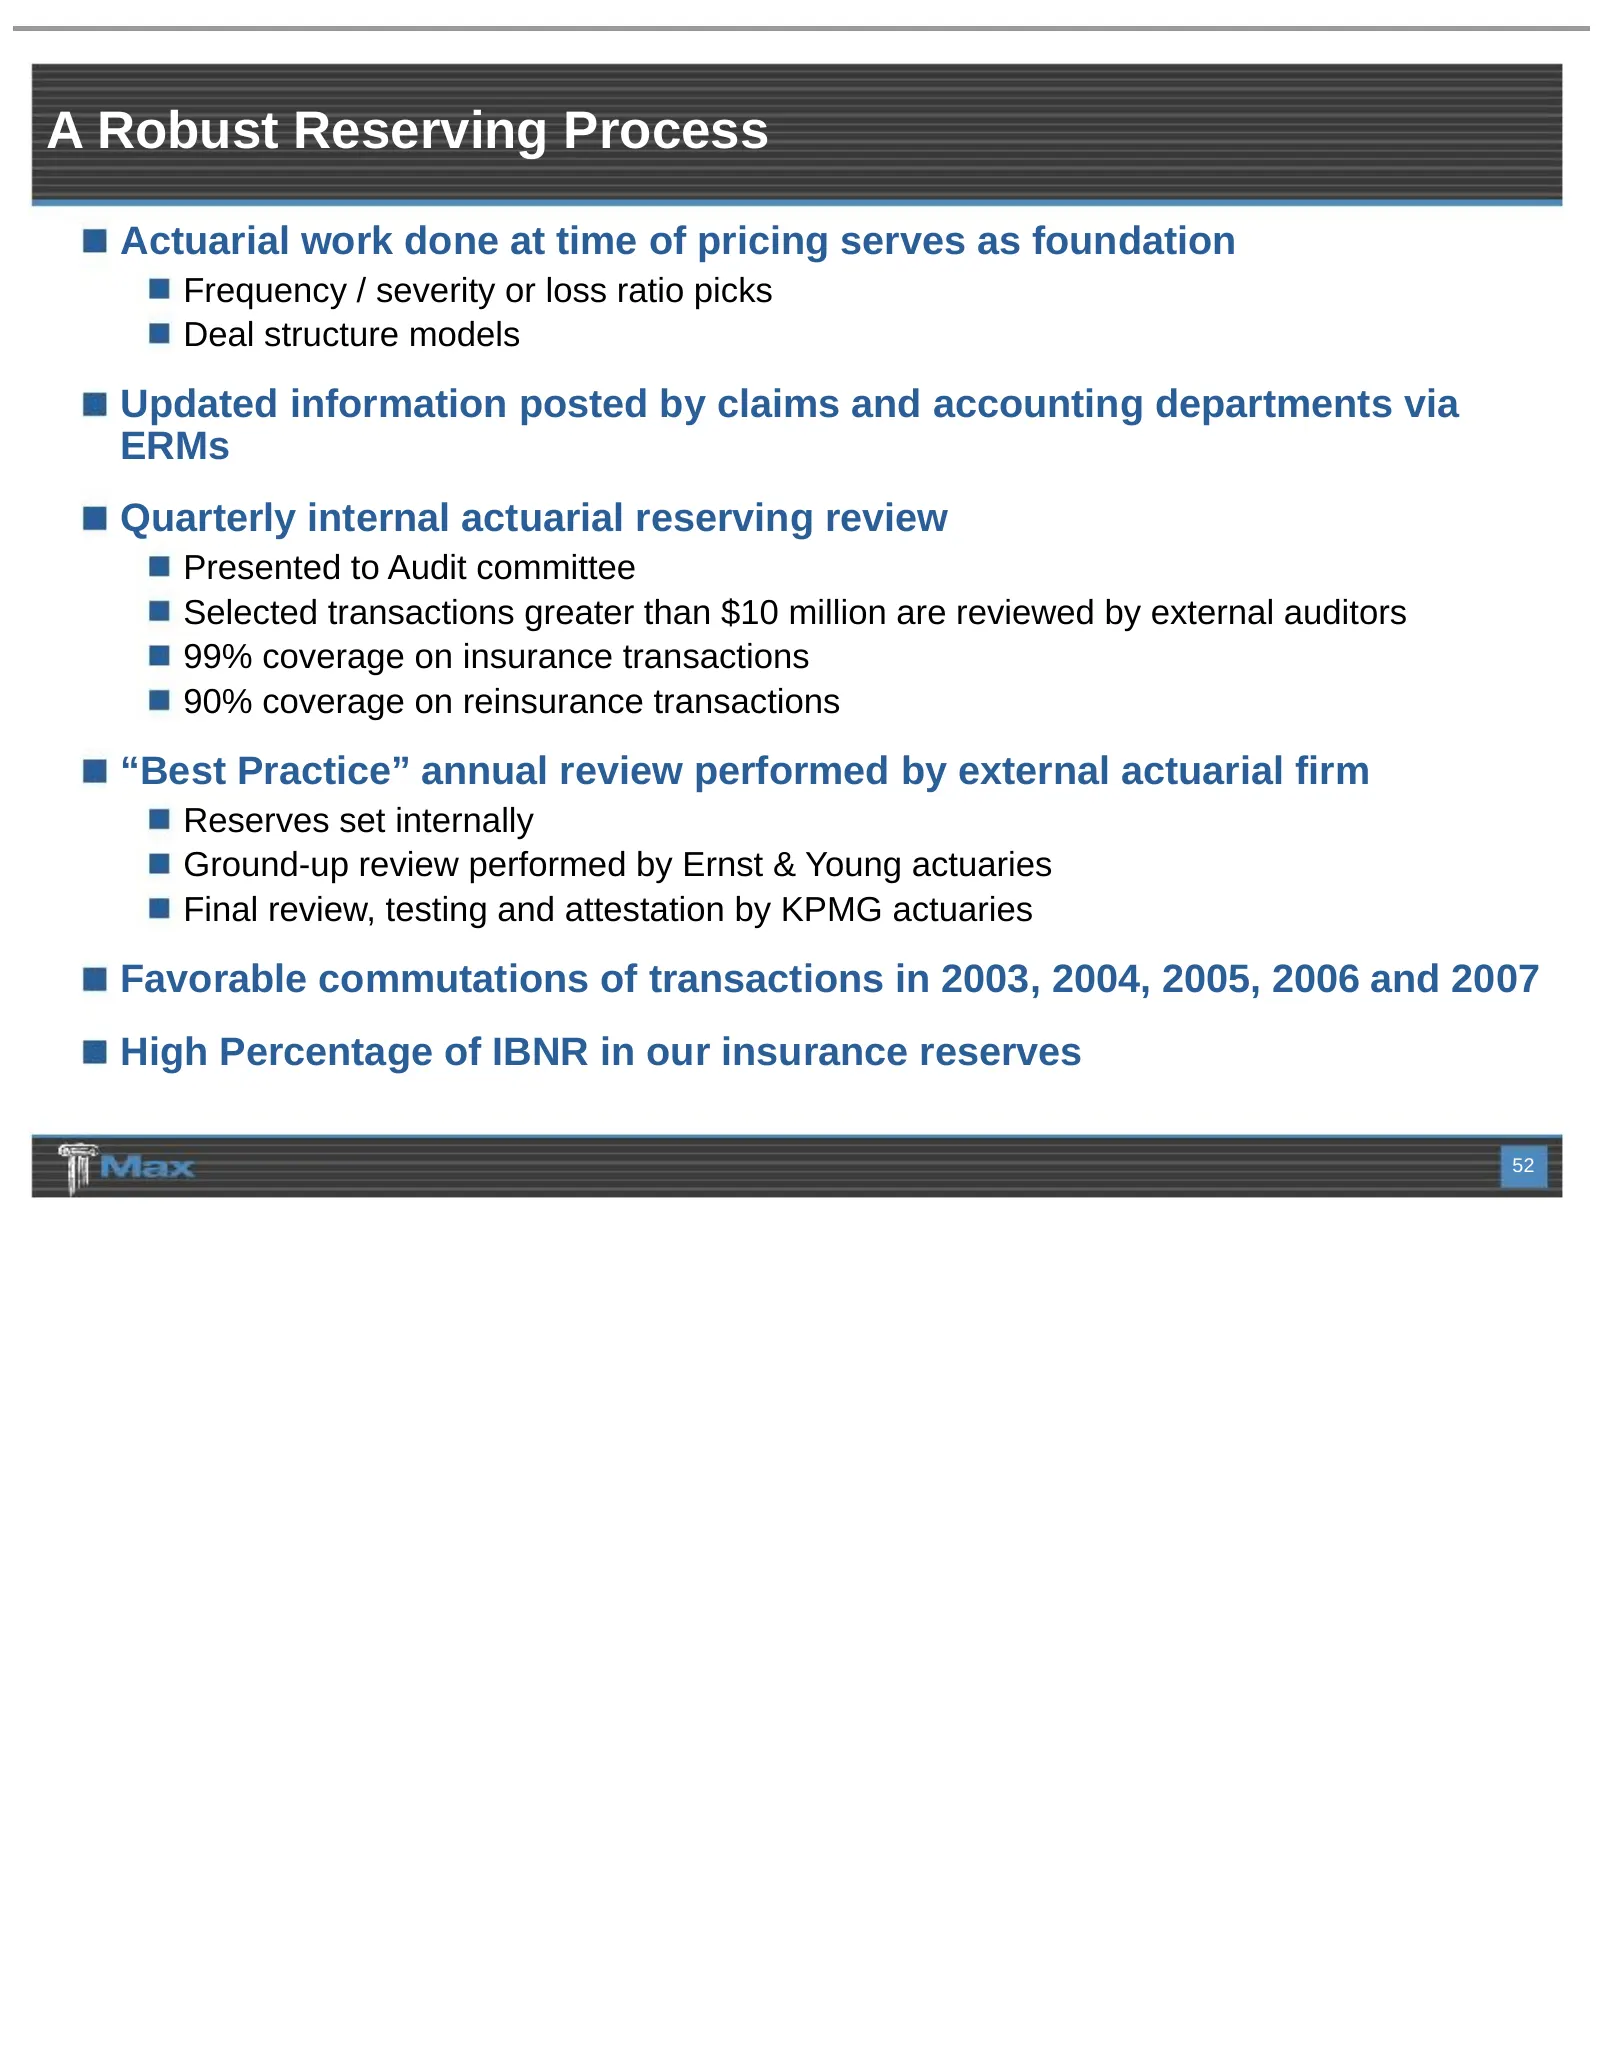
A Robust Reserving Process Actuarial work done at time of pricing serves as foundation Frequency / severity or loss ratio picks Deal structure models Updated information posted by claims and accounting departments via ERMs Quarterly internal actuarial reserving review Presented to Audit committee Se
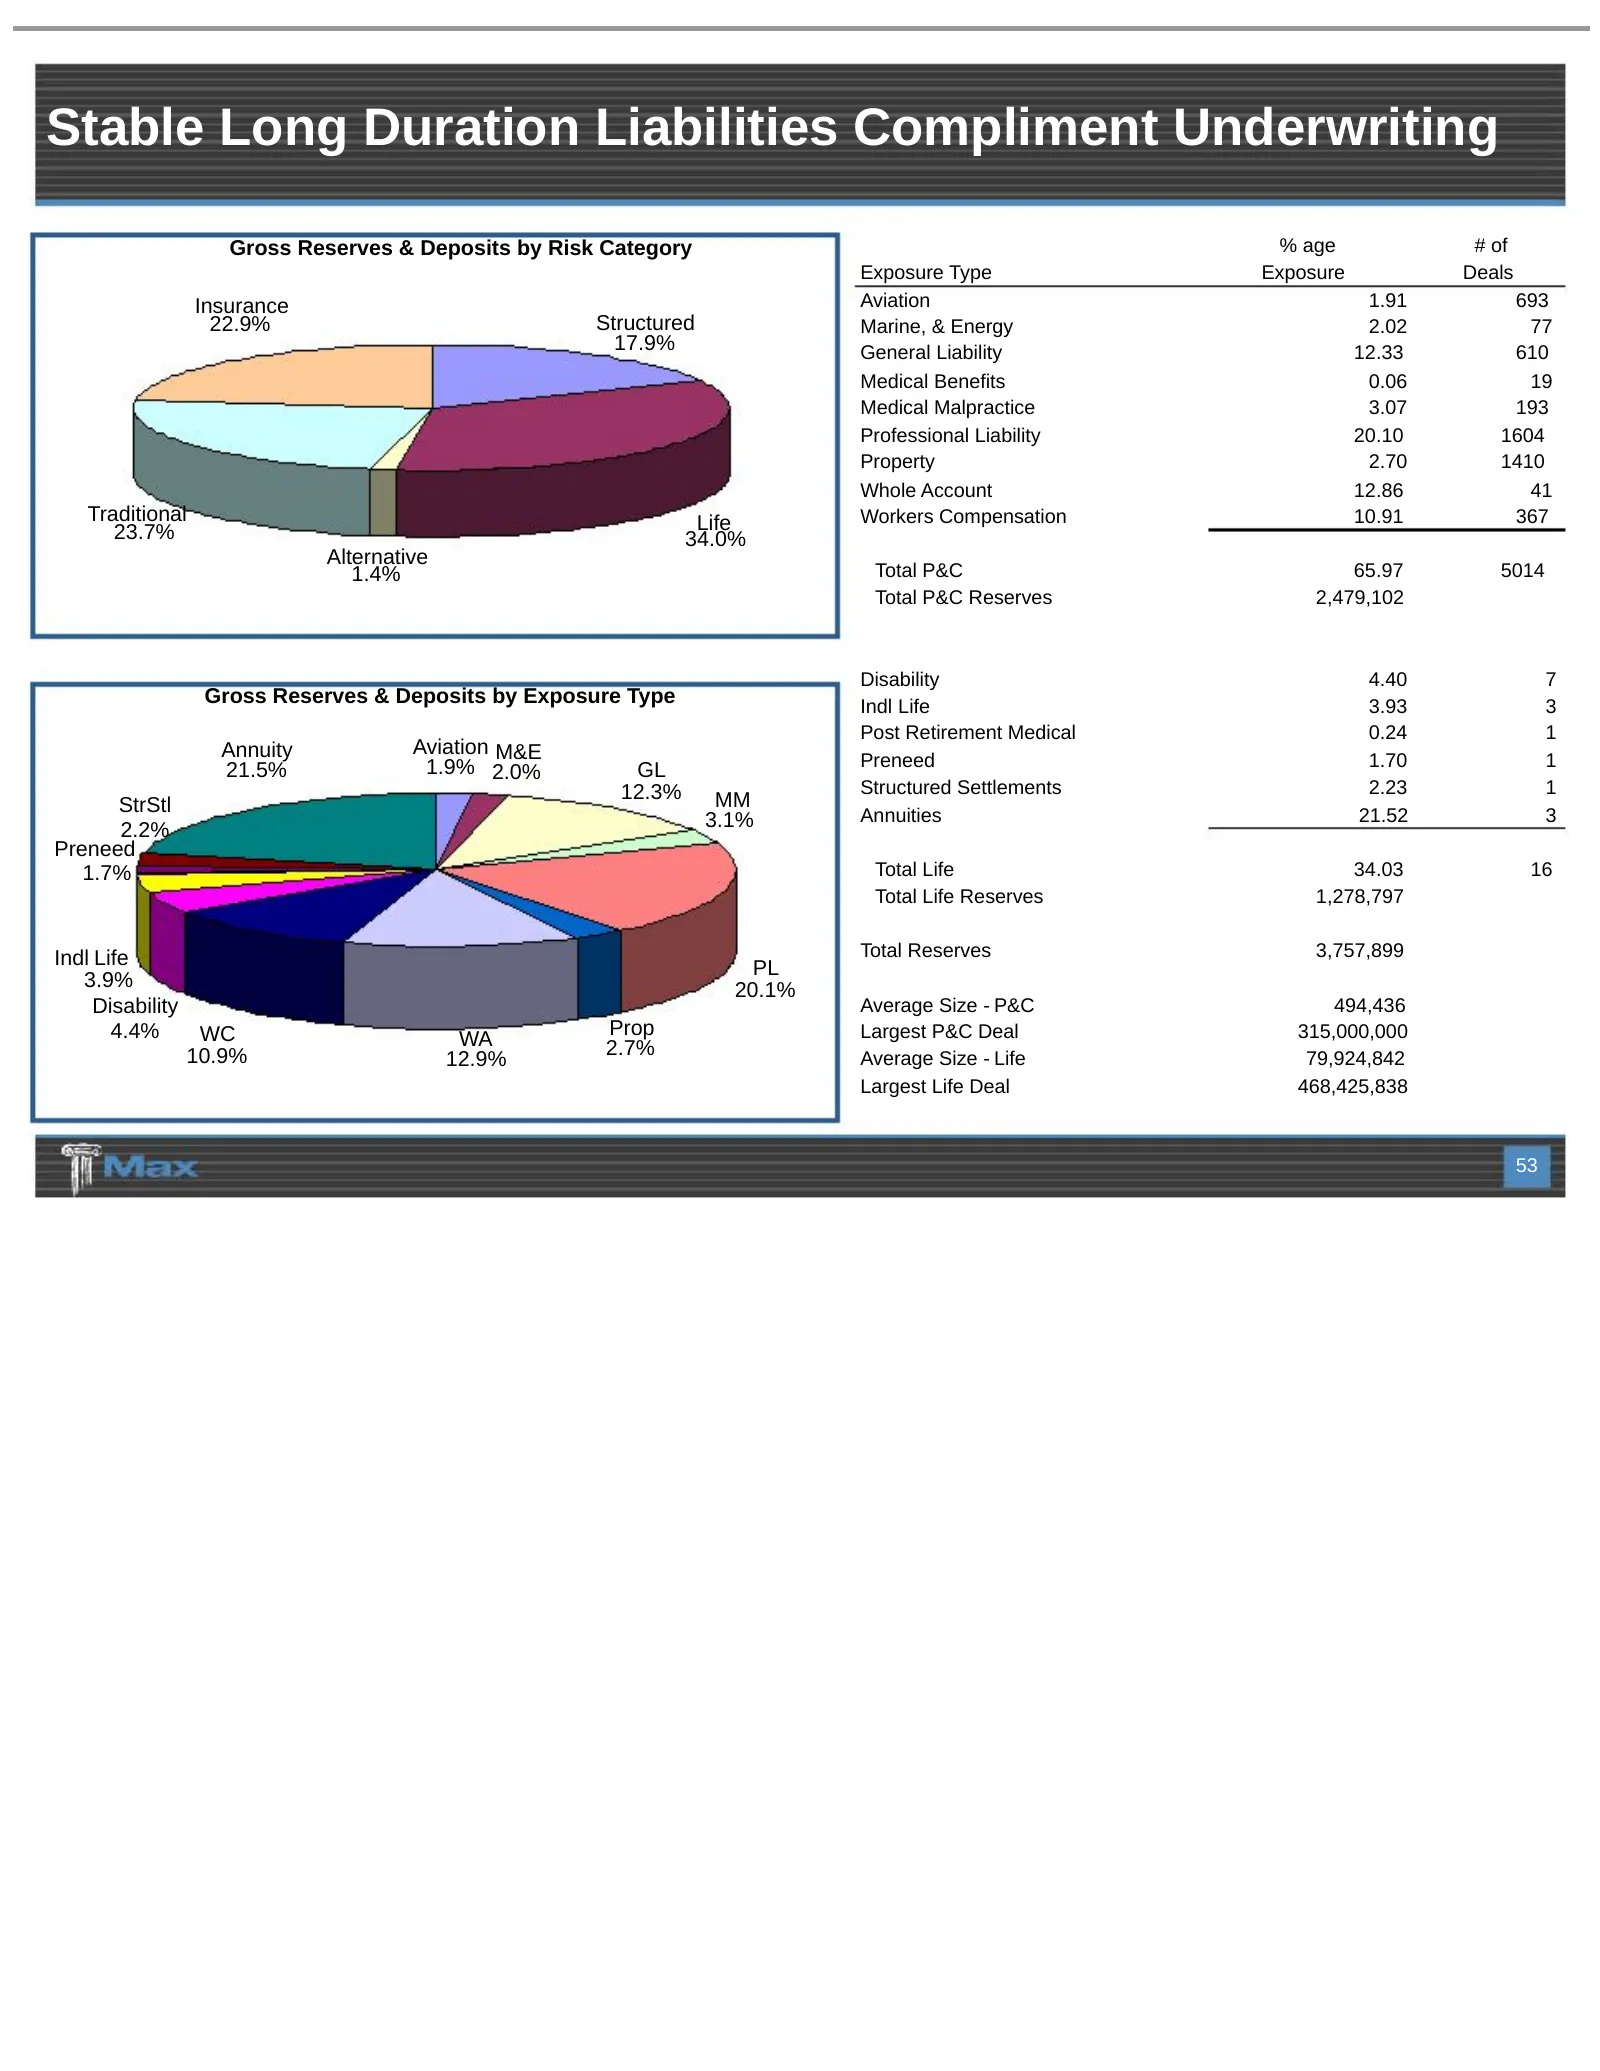
Slide 53: Stable Long Duration Liabilities Compliment Underwriting
Stable Long Duration Liabilities Compliment Underwriting Gross Reserves & Deposits by Risk Category % age # of Exposure Type Exposure Deals Insurance Aviation 1.91 693 22.9% Structured Marine, & Energy 2.02 77 17.9% General Liability 12.33 610 Medical Benefits 0.06 19 Medical Malpractice 3.07 193 Pr
Slide 54: Financial Results
Financial Results Joe Roberts
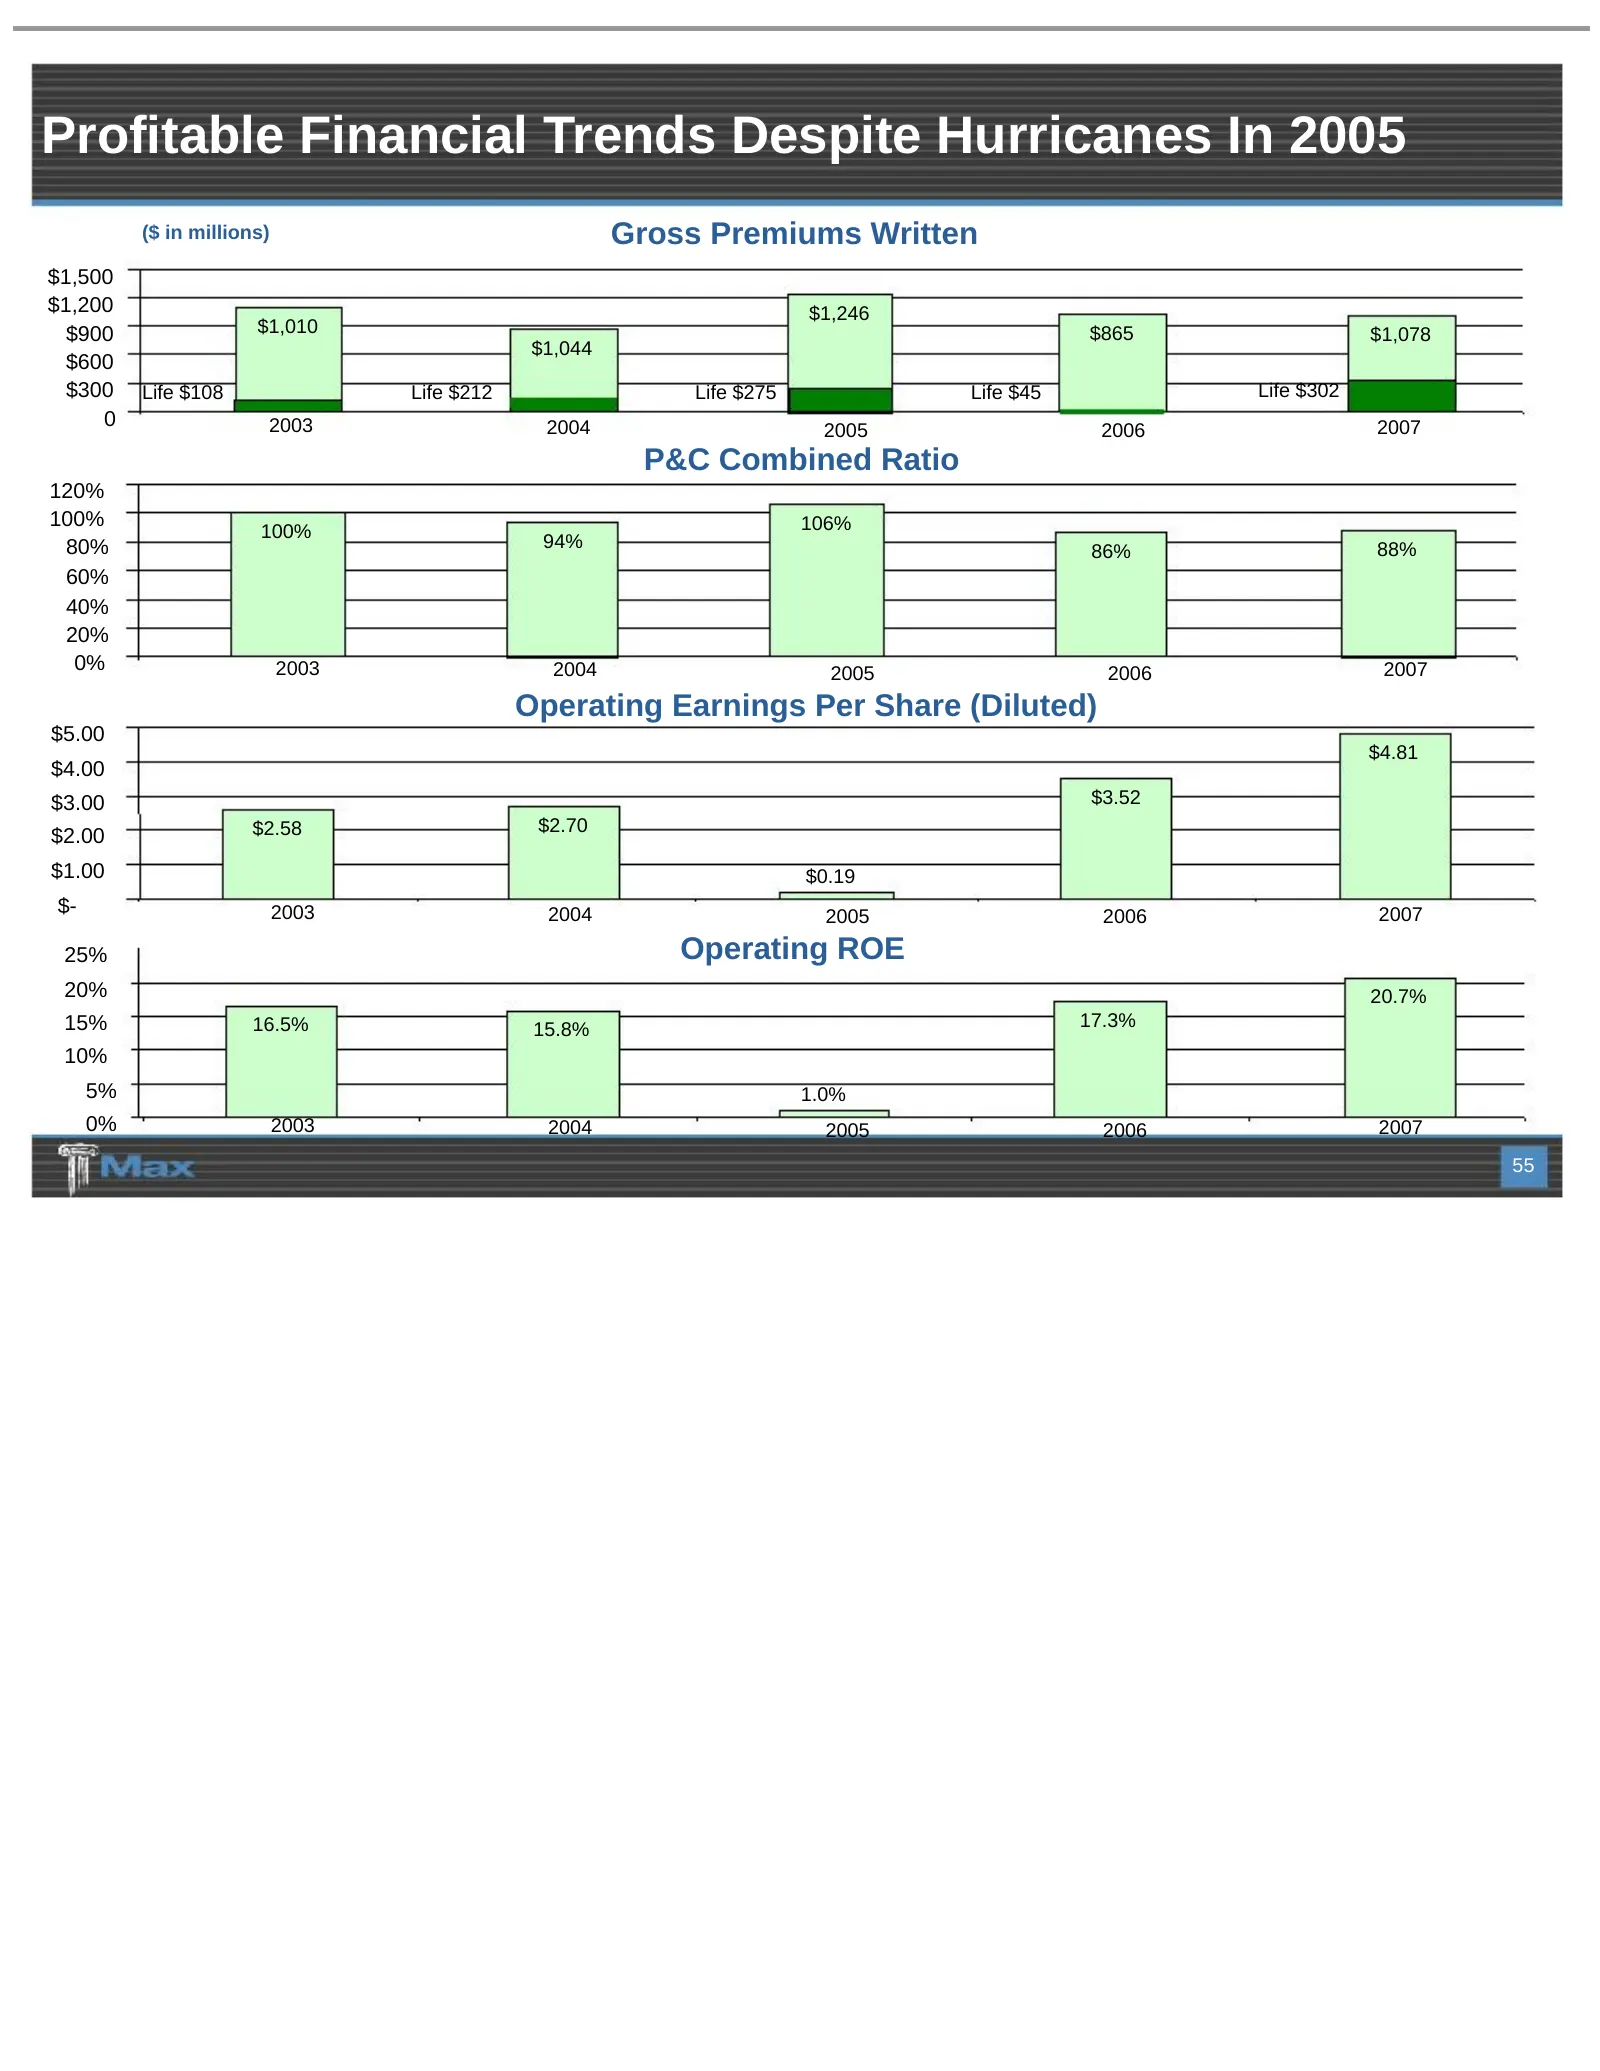
Slide 55: Profitable Financial Trends Despite Hurricanes In 2005
Profitable Financial Trends Despite Hurricanes In 2005 ($ in millions) Gross Premiums Written $1,500 $1,200 $1,246 $900 $1,010 $865 $1,078 $1,044 $600 $300 Life $108 Life $212 Life $275 Life $45 Life $302 0 2003 2004 2007 2005 2006 P&C Combined Ratio 120% 100% 106% 100% 80% 94% 88% 86% 60% 40% 20% 0
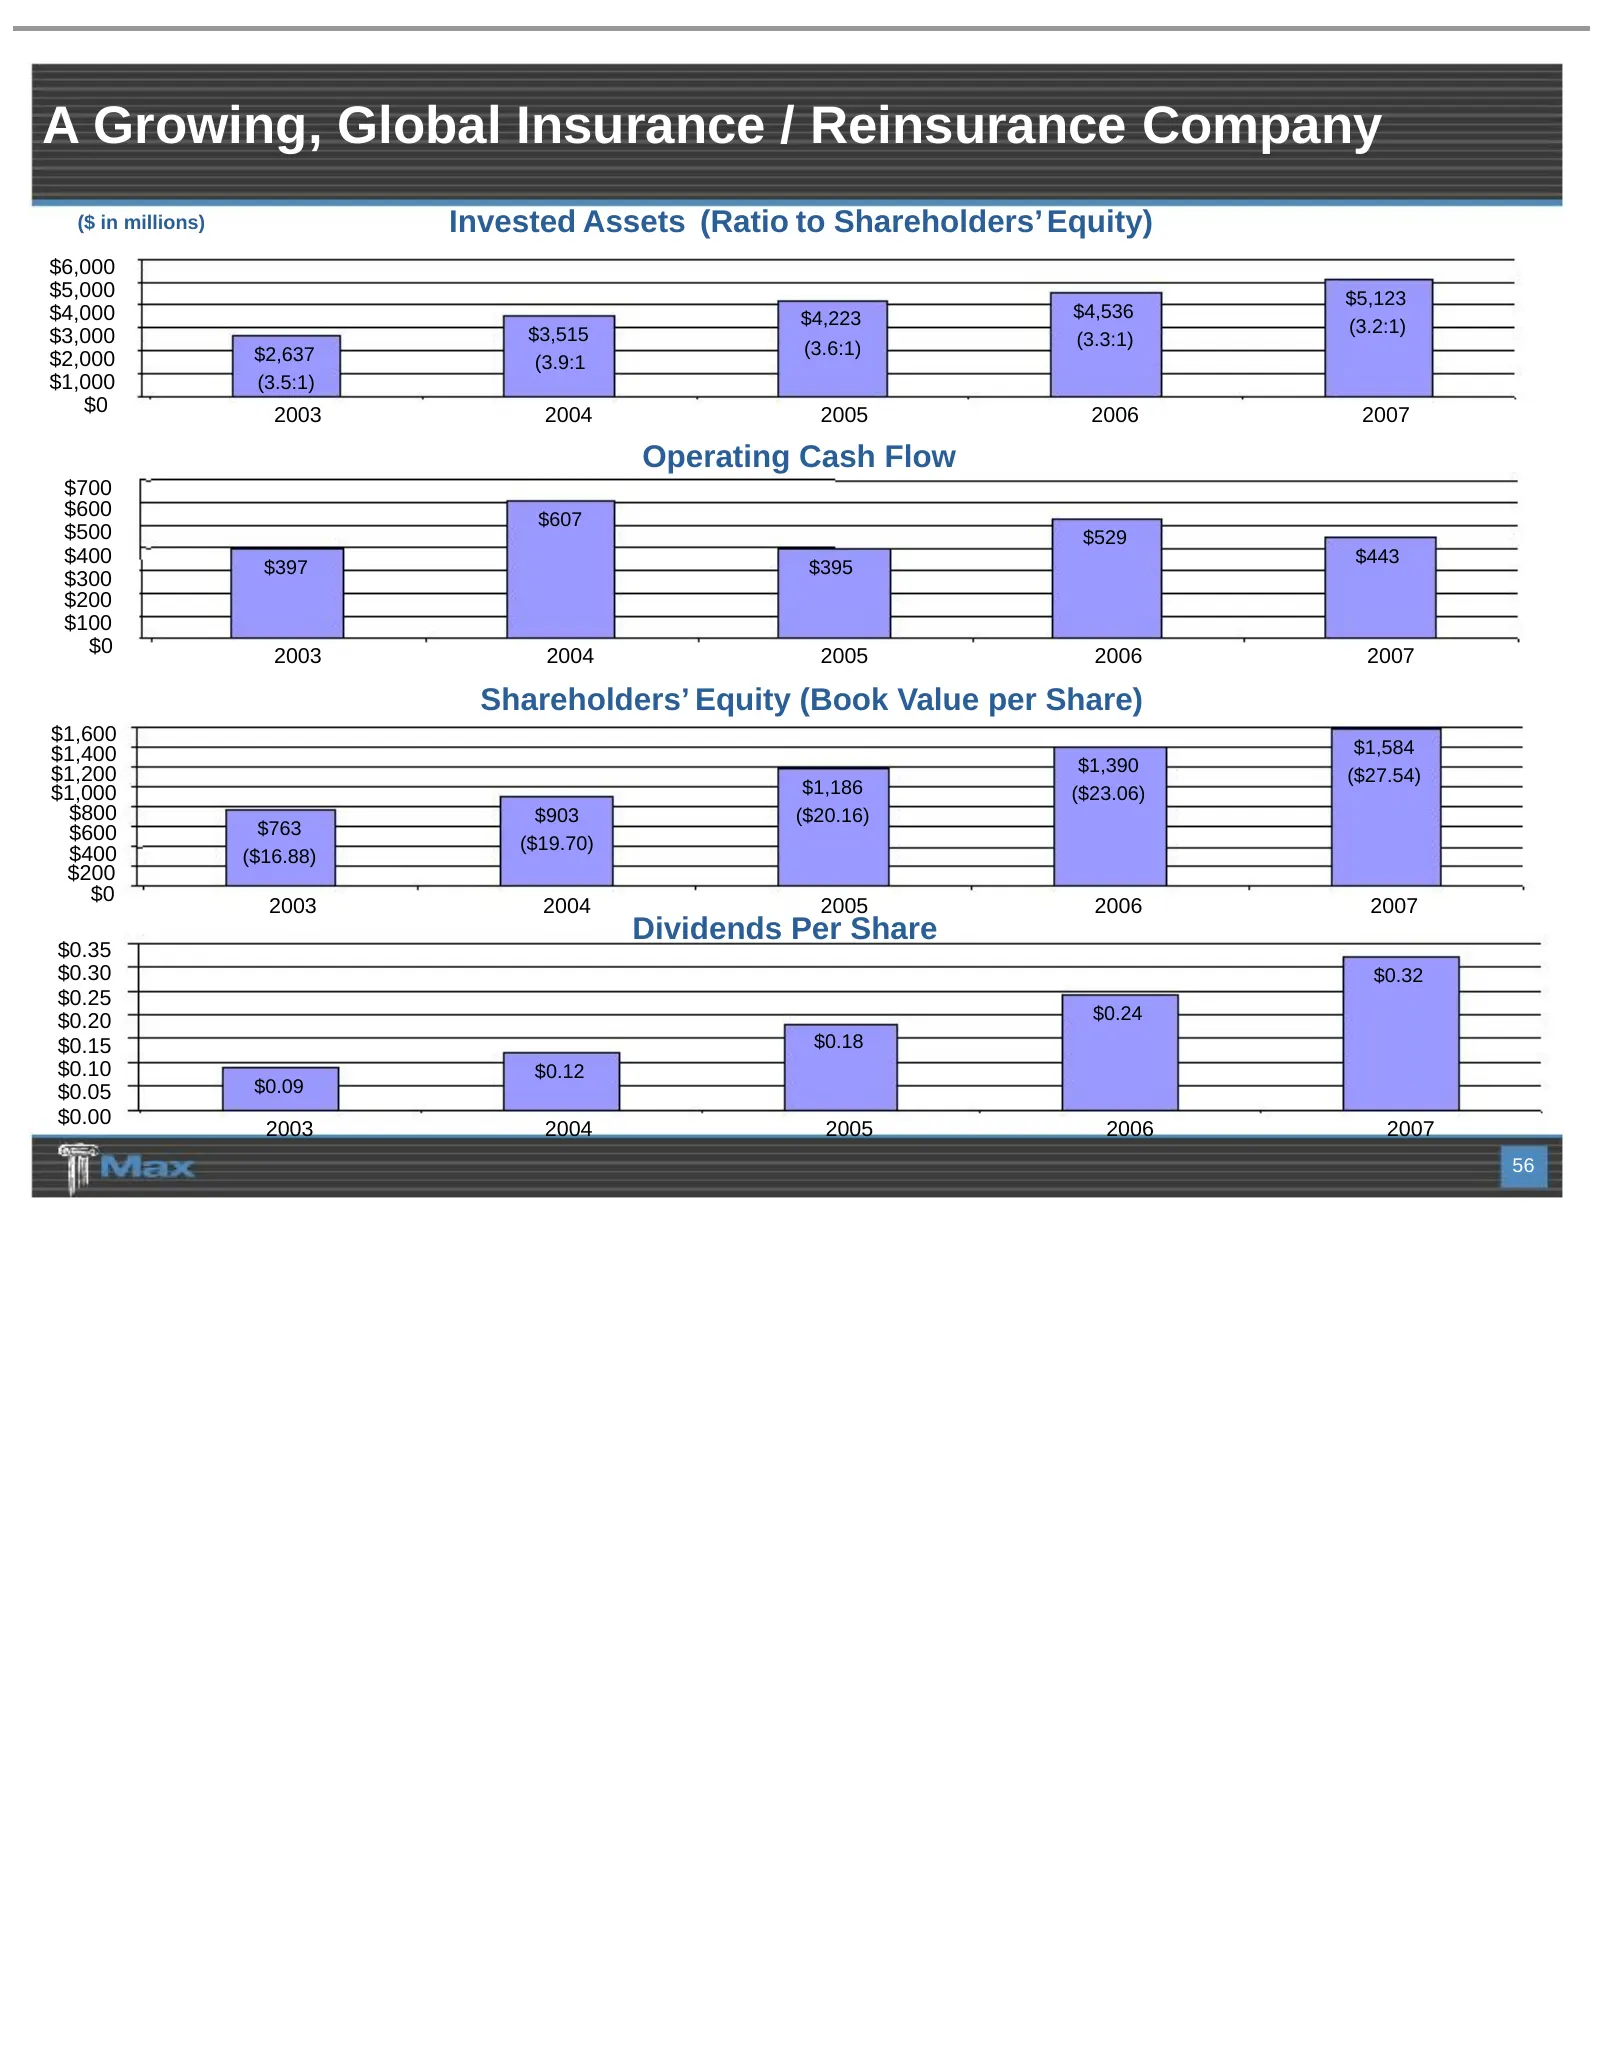
Slide 56: A Growing, Global Insurance / Reinsurance Company
A Growing, Global Insurance / Reinsurance Company ($ in millions) Invested Assets (Ratio to Shareholders’ Equity) $6,000 $5,000 $5,123 $4,000 $4,223 $4,536 $3,515 (3.2:1) $3,000 (3.3:1) $2,637 (3.6:1) $2,000 (3.9:1 $1,000 (3.5:1) $0 2003 2004 2005 2006 2007 Operating Cash Flow $700 $600 $607 $500 $5
Slide 57: 2008 Guidance
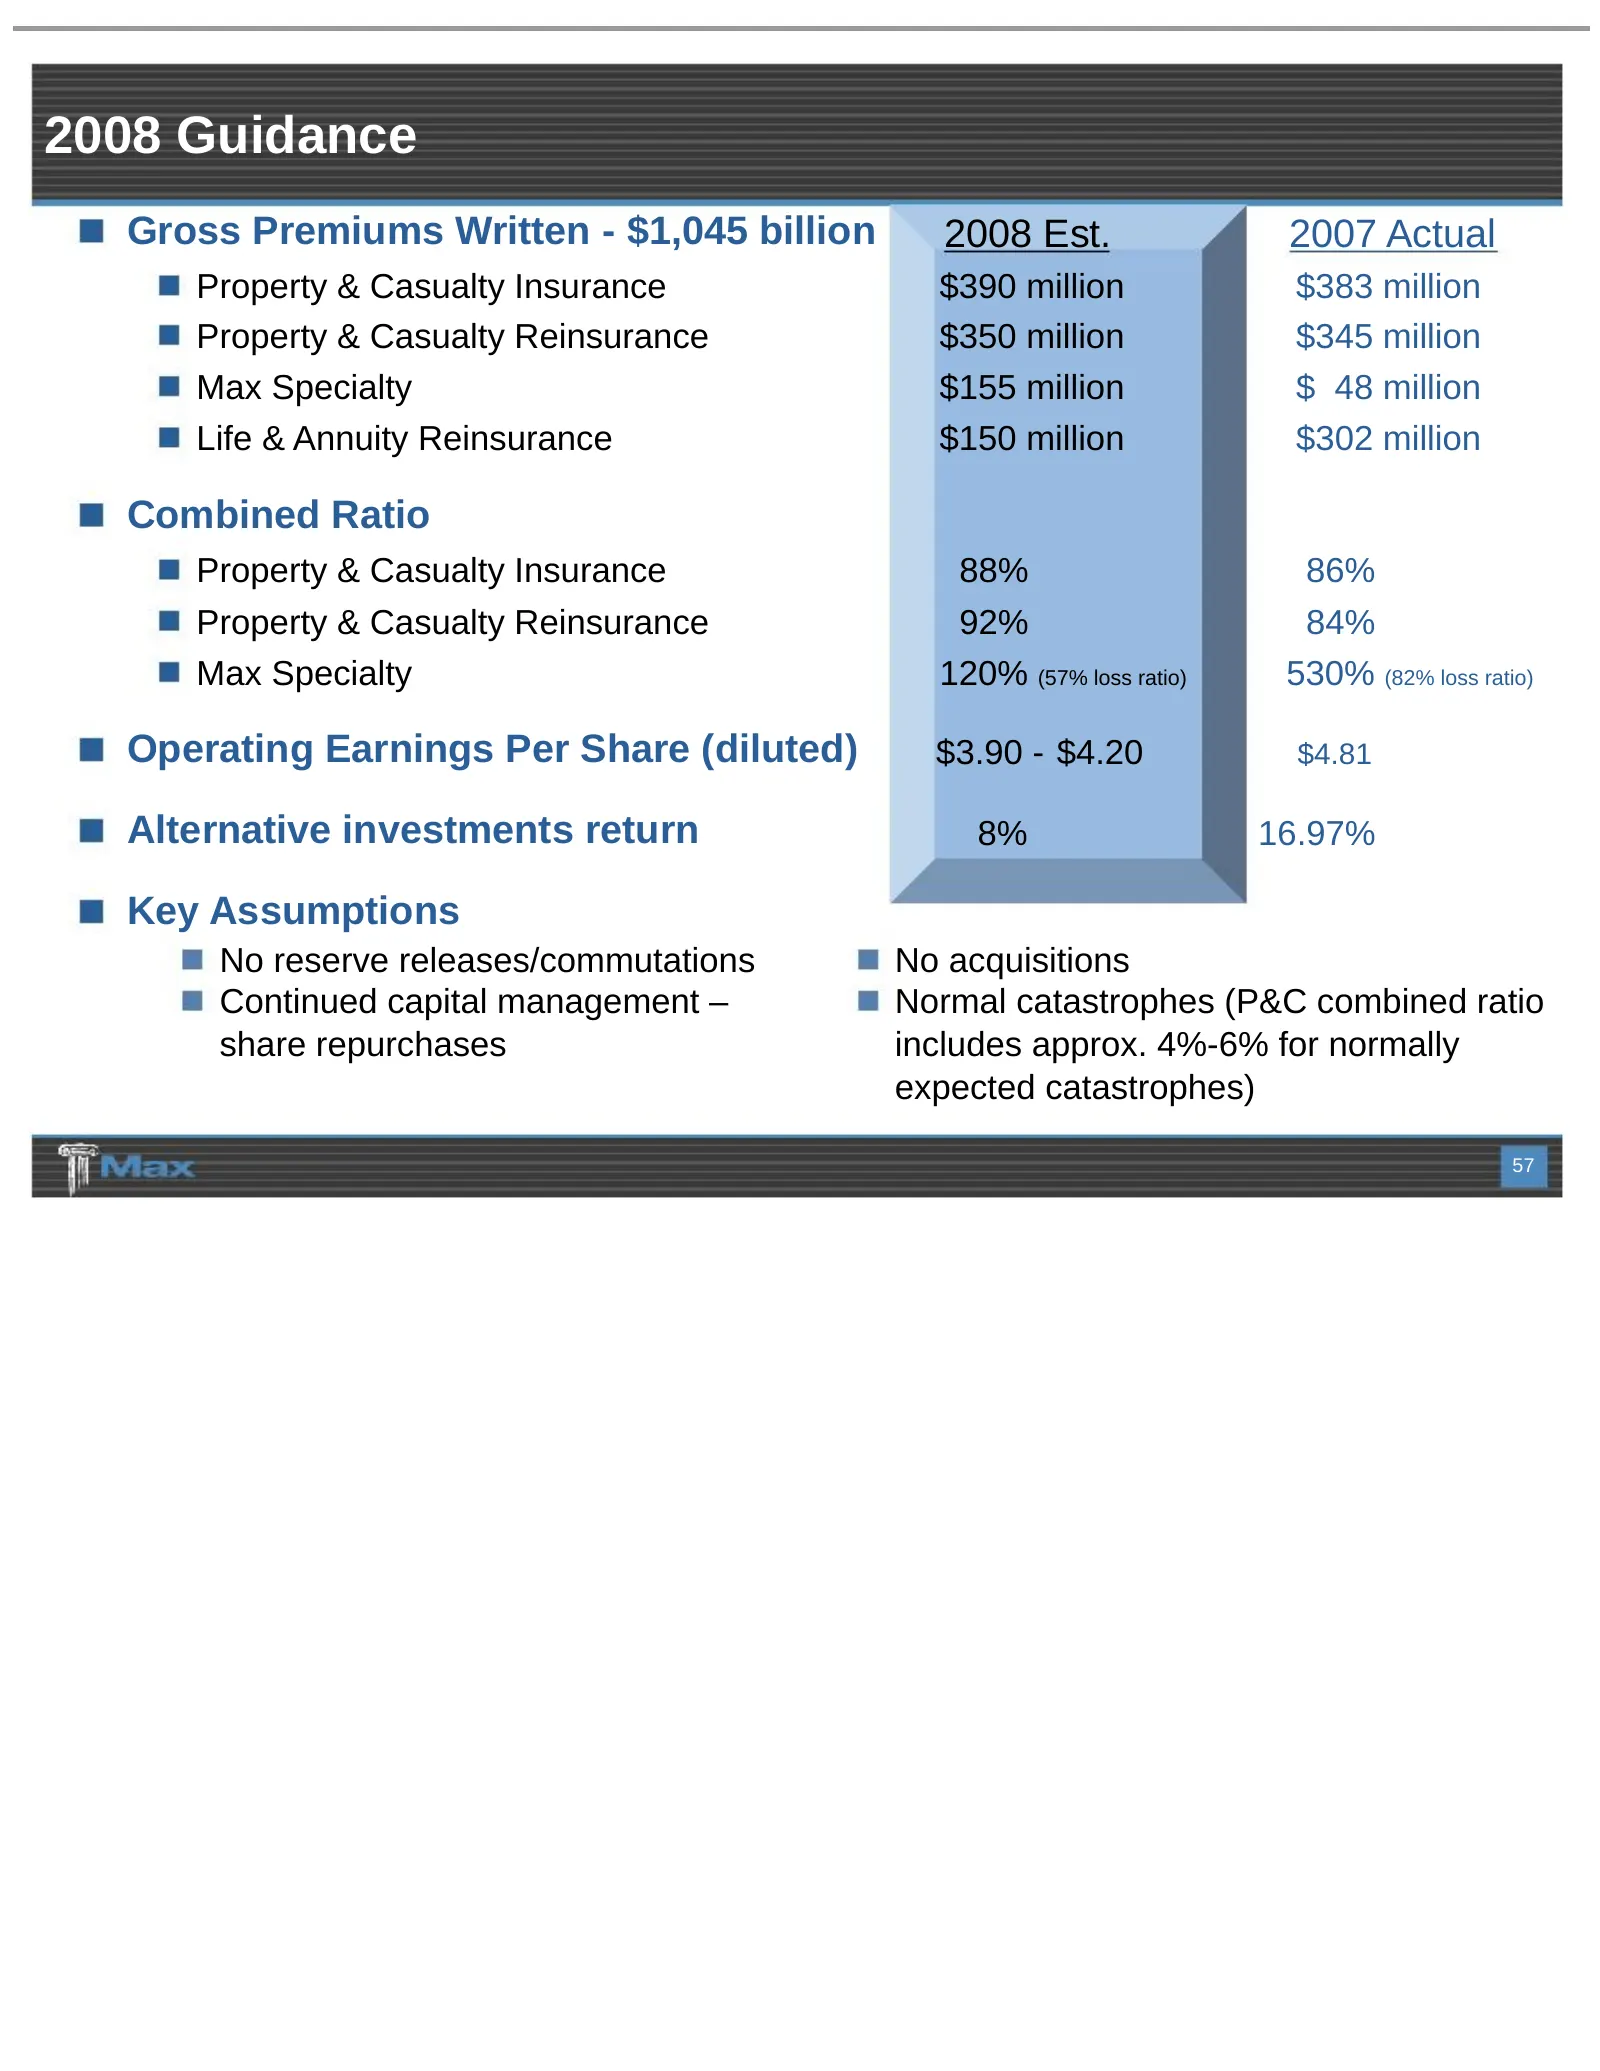
2008 Guidance Gross Premiums Written - $1,045 billion 2008 Est. 2007 Actual Property & Casualty Insurance $390 million $383 million Property & Casualty Reinsurance $350 million $345 million Max Specialty $155 million $ 48 million Life & Annuity Reinsurance $150 million $302 million Combined Ratio Pr
Slide 58: Max's Expected 2008 Risk / Reward Position
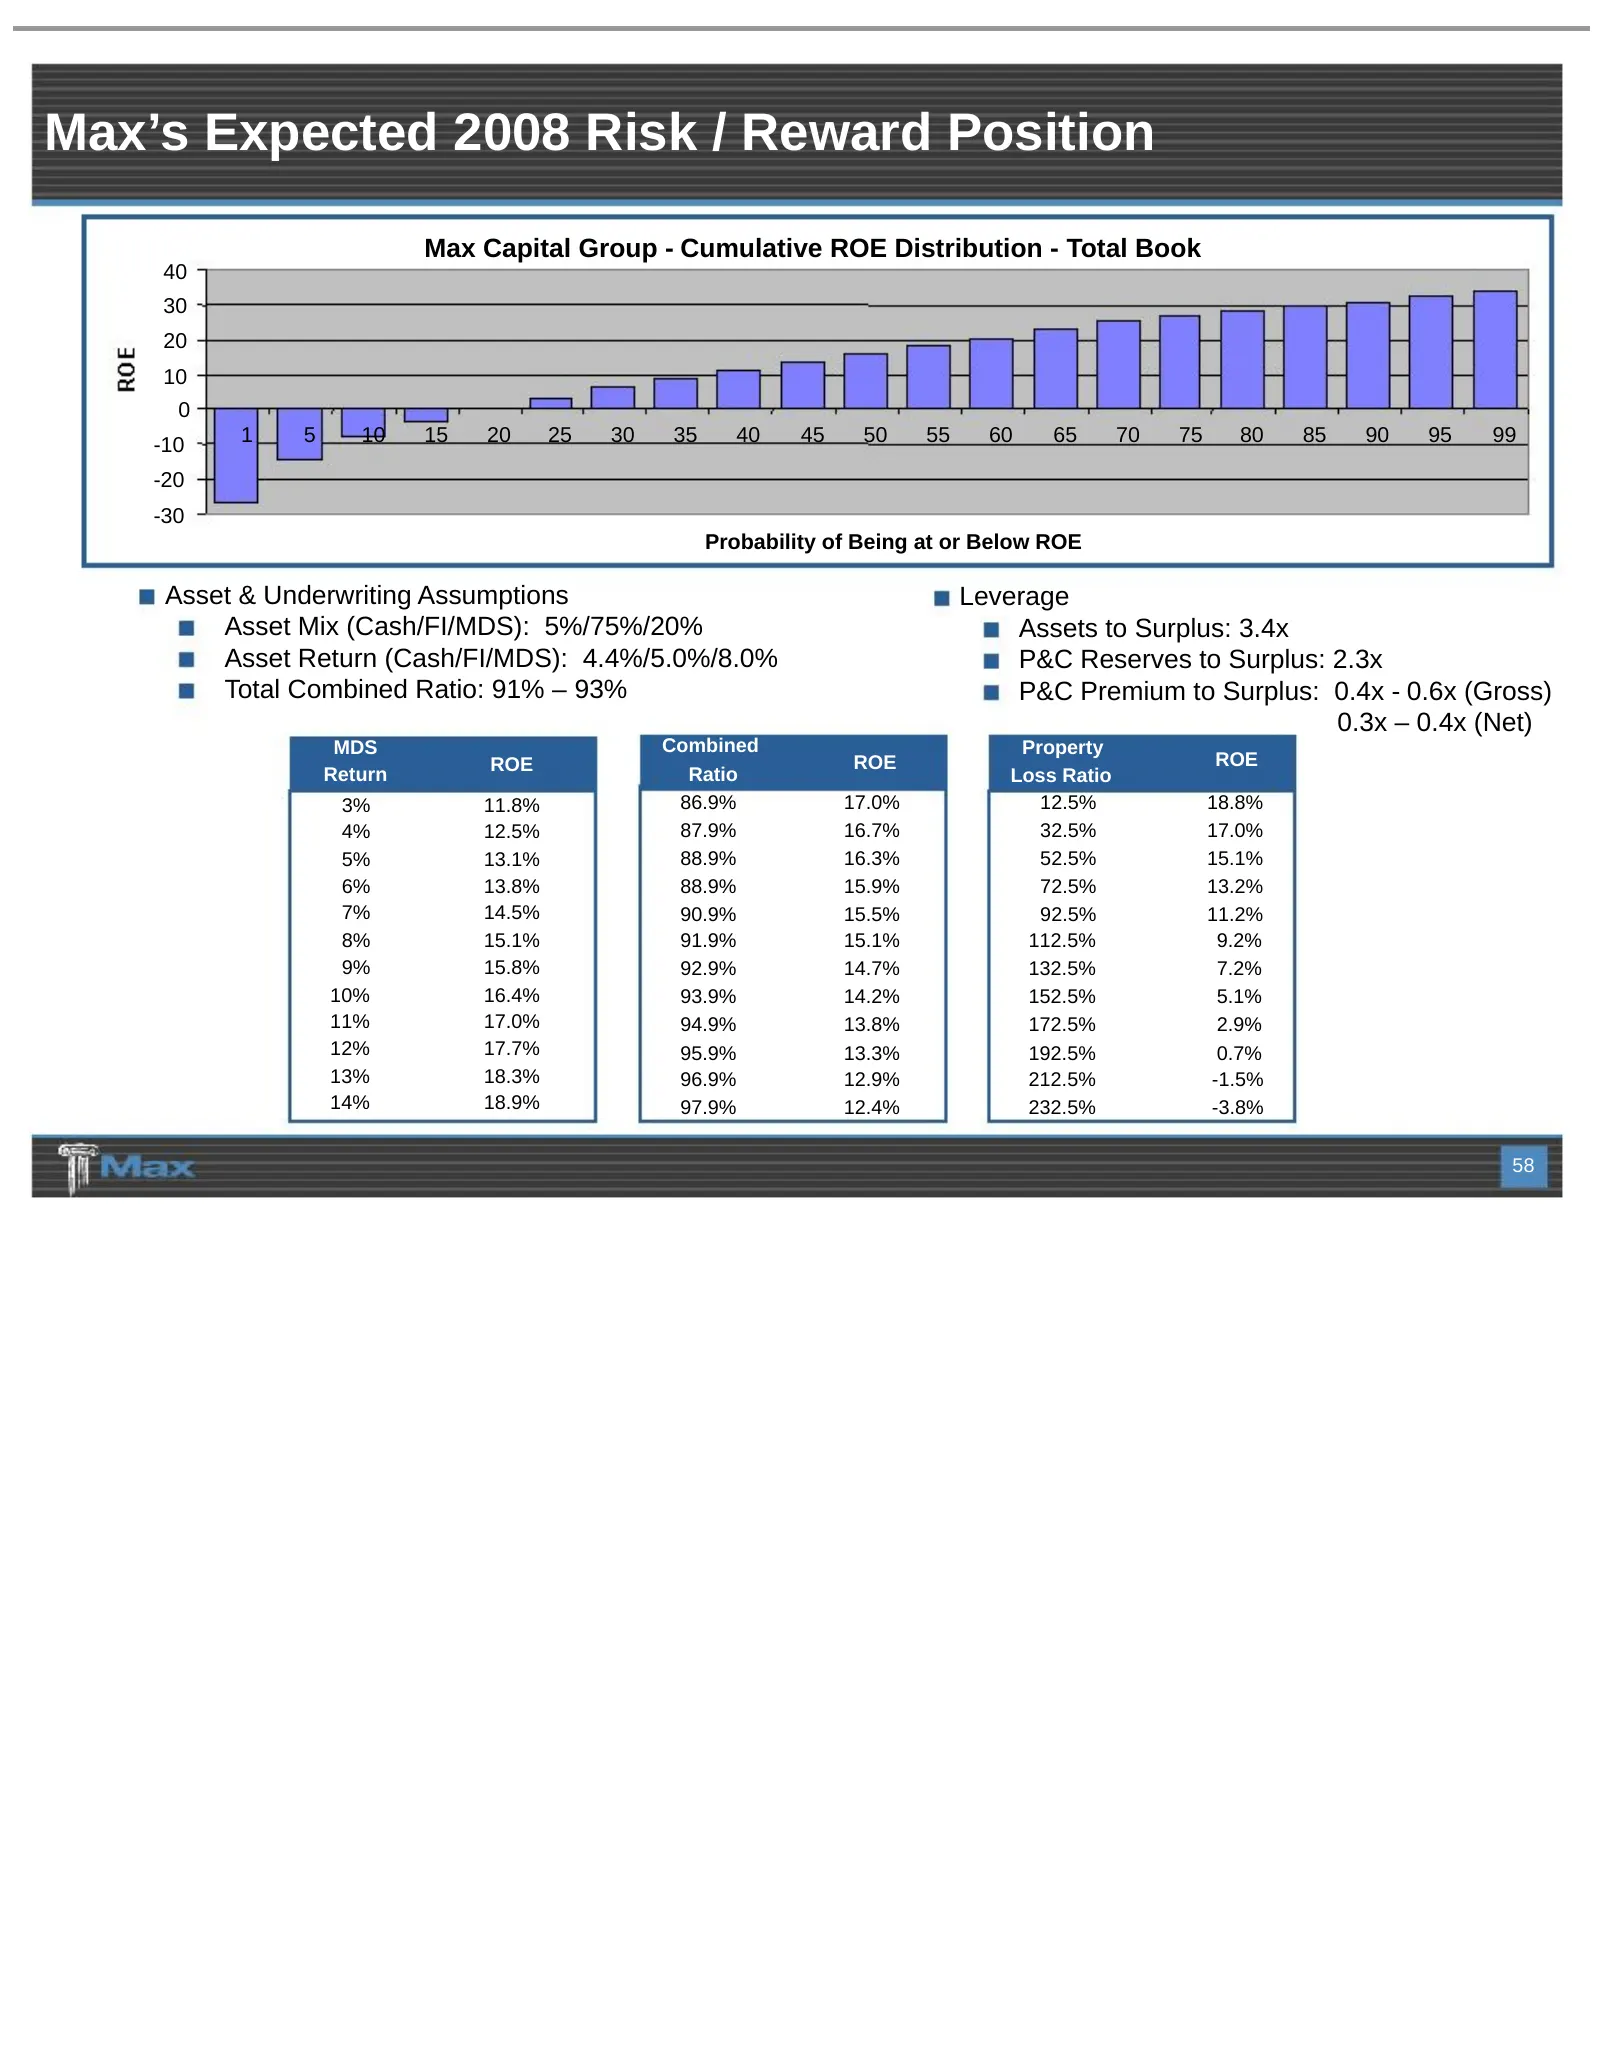
Max’s Expected 2008 Risk / Reward Position Max Capital Group - Cumulative ROE Distribution - Total Book 40 30 20 10 0 -10 1 5 10 15 20 25 30 35 40 45 50 55 60 65 70 75 80 85 90 95 99 -20 -30 Probability of Being at or Below ROE Asset & Underwriting Assumptions Leverage Asset Mix (Cash/FI/MDS): 5%/75
Slide 59: Year-End Results
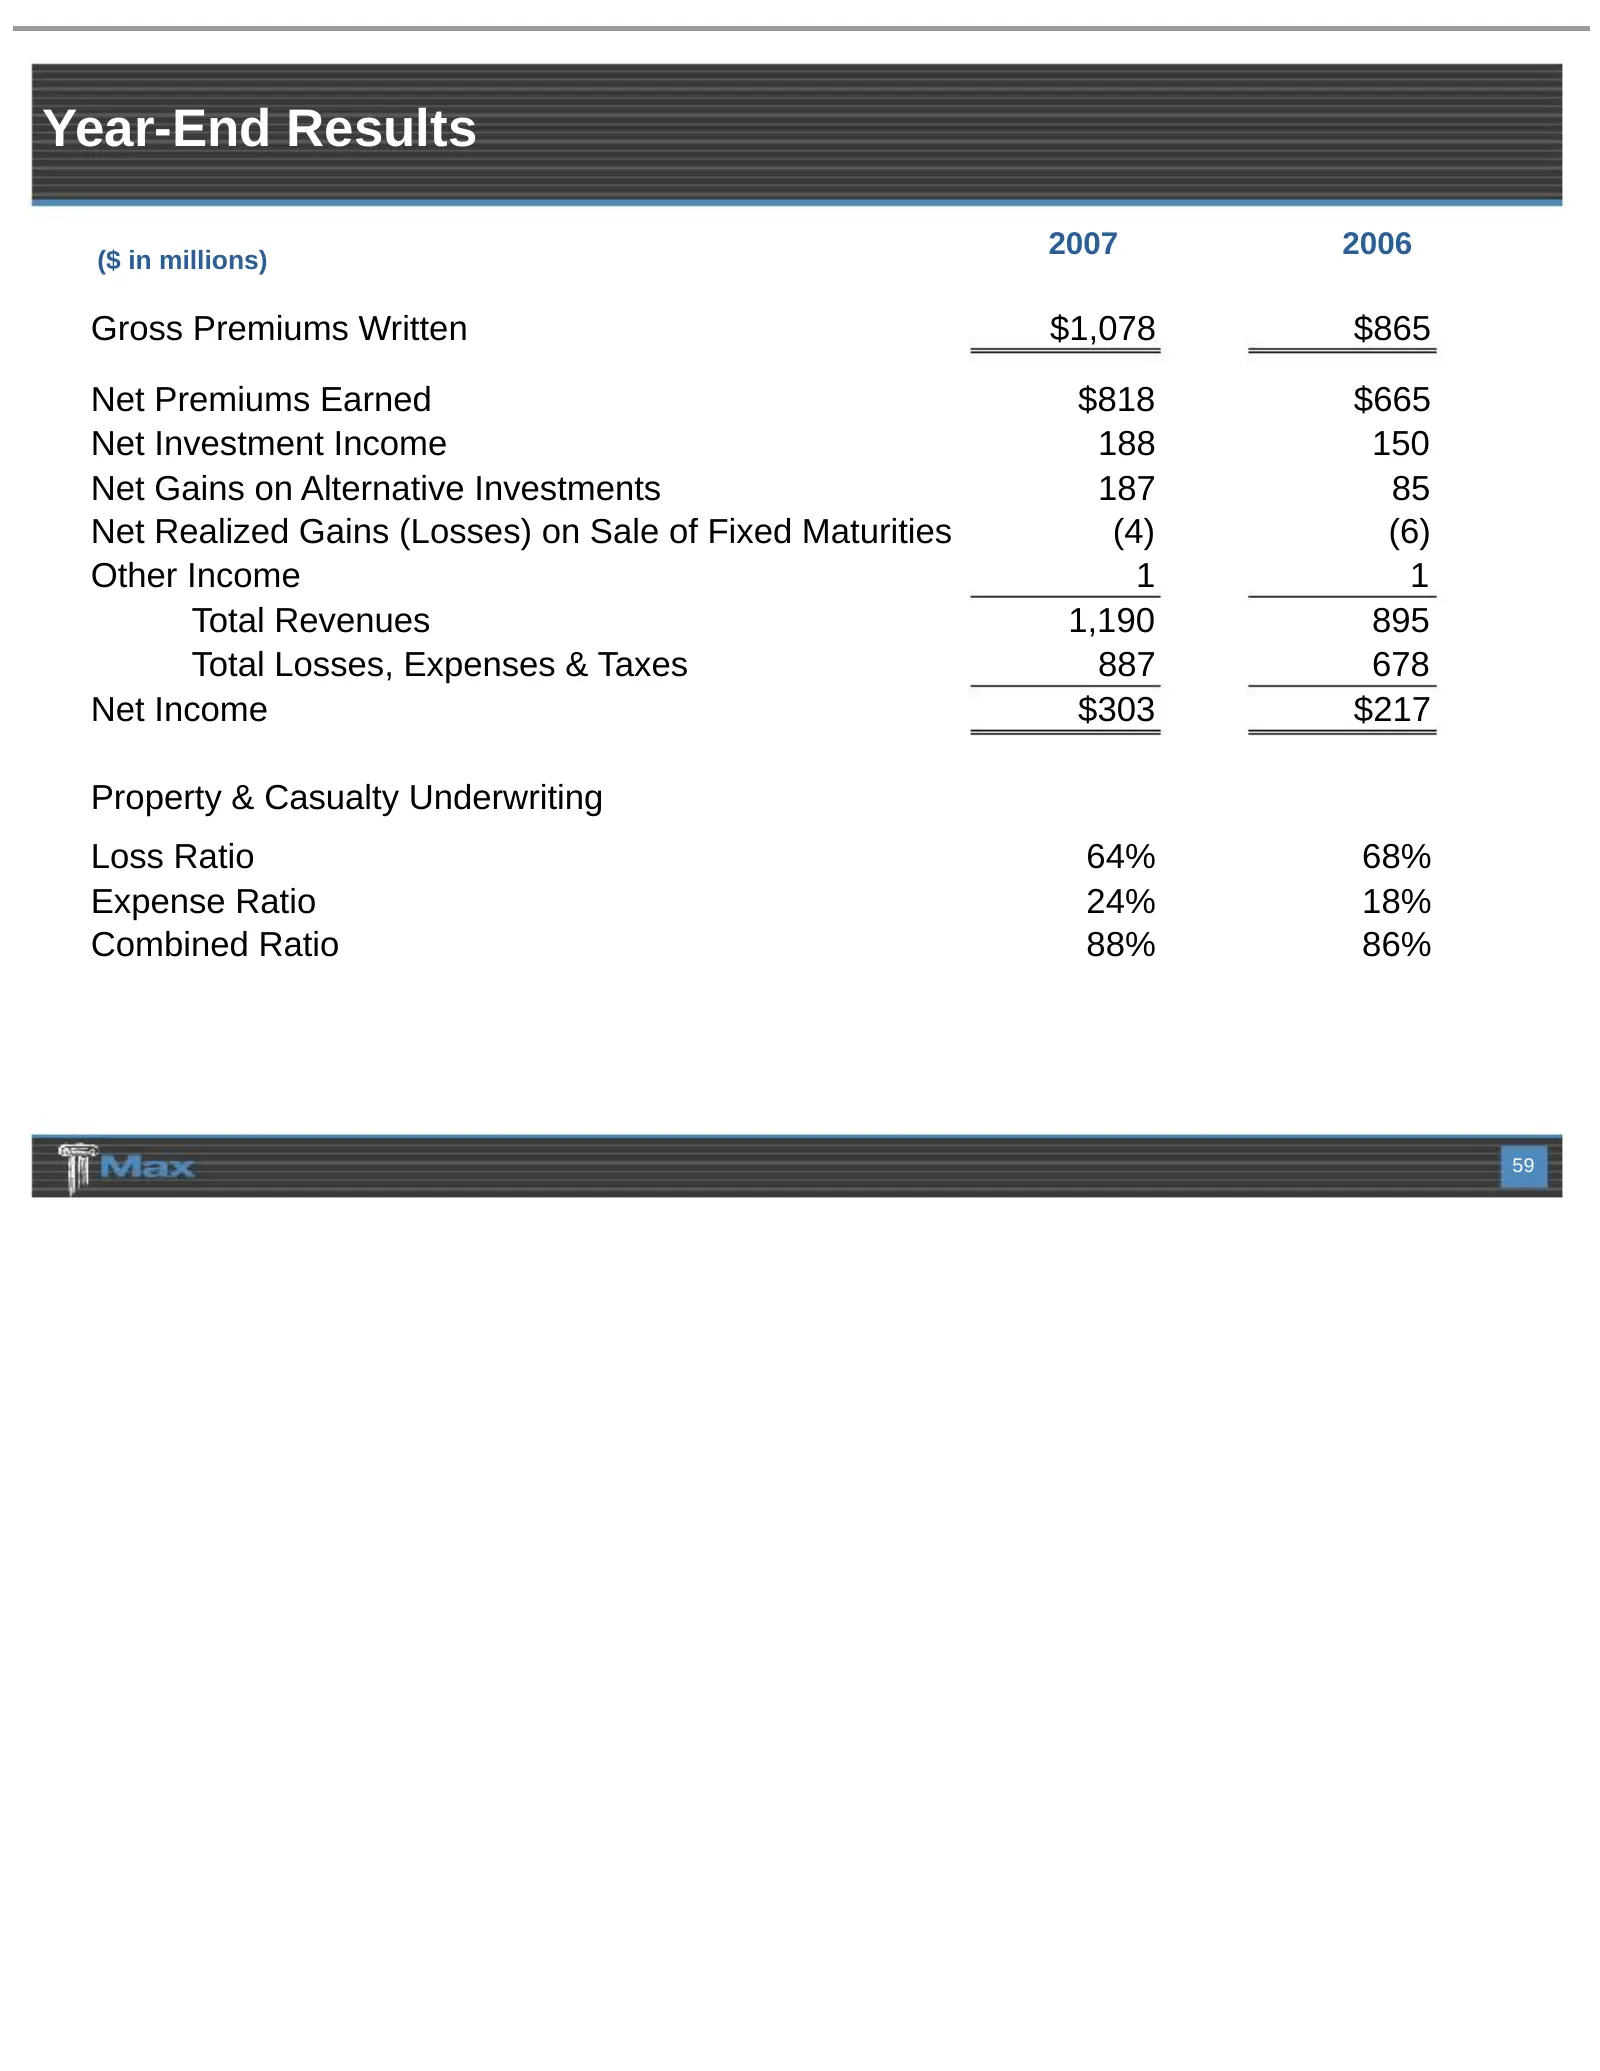
Year-End Results ($ in millions) 2007 2006 Gross Premiums Written $1,078 $865 Net Premiums Earned $818 $665 Net Investment Income 188 150 Net Gains on Alternative Investments 187 85 Net Realized Gains (Losses) on Sale of Fixed Maturities (4) (6) Other Income 1 1 Total Revenues 1,190 895 Total Losses
Slide 60: Strong Balance Sheet
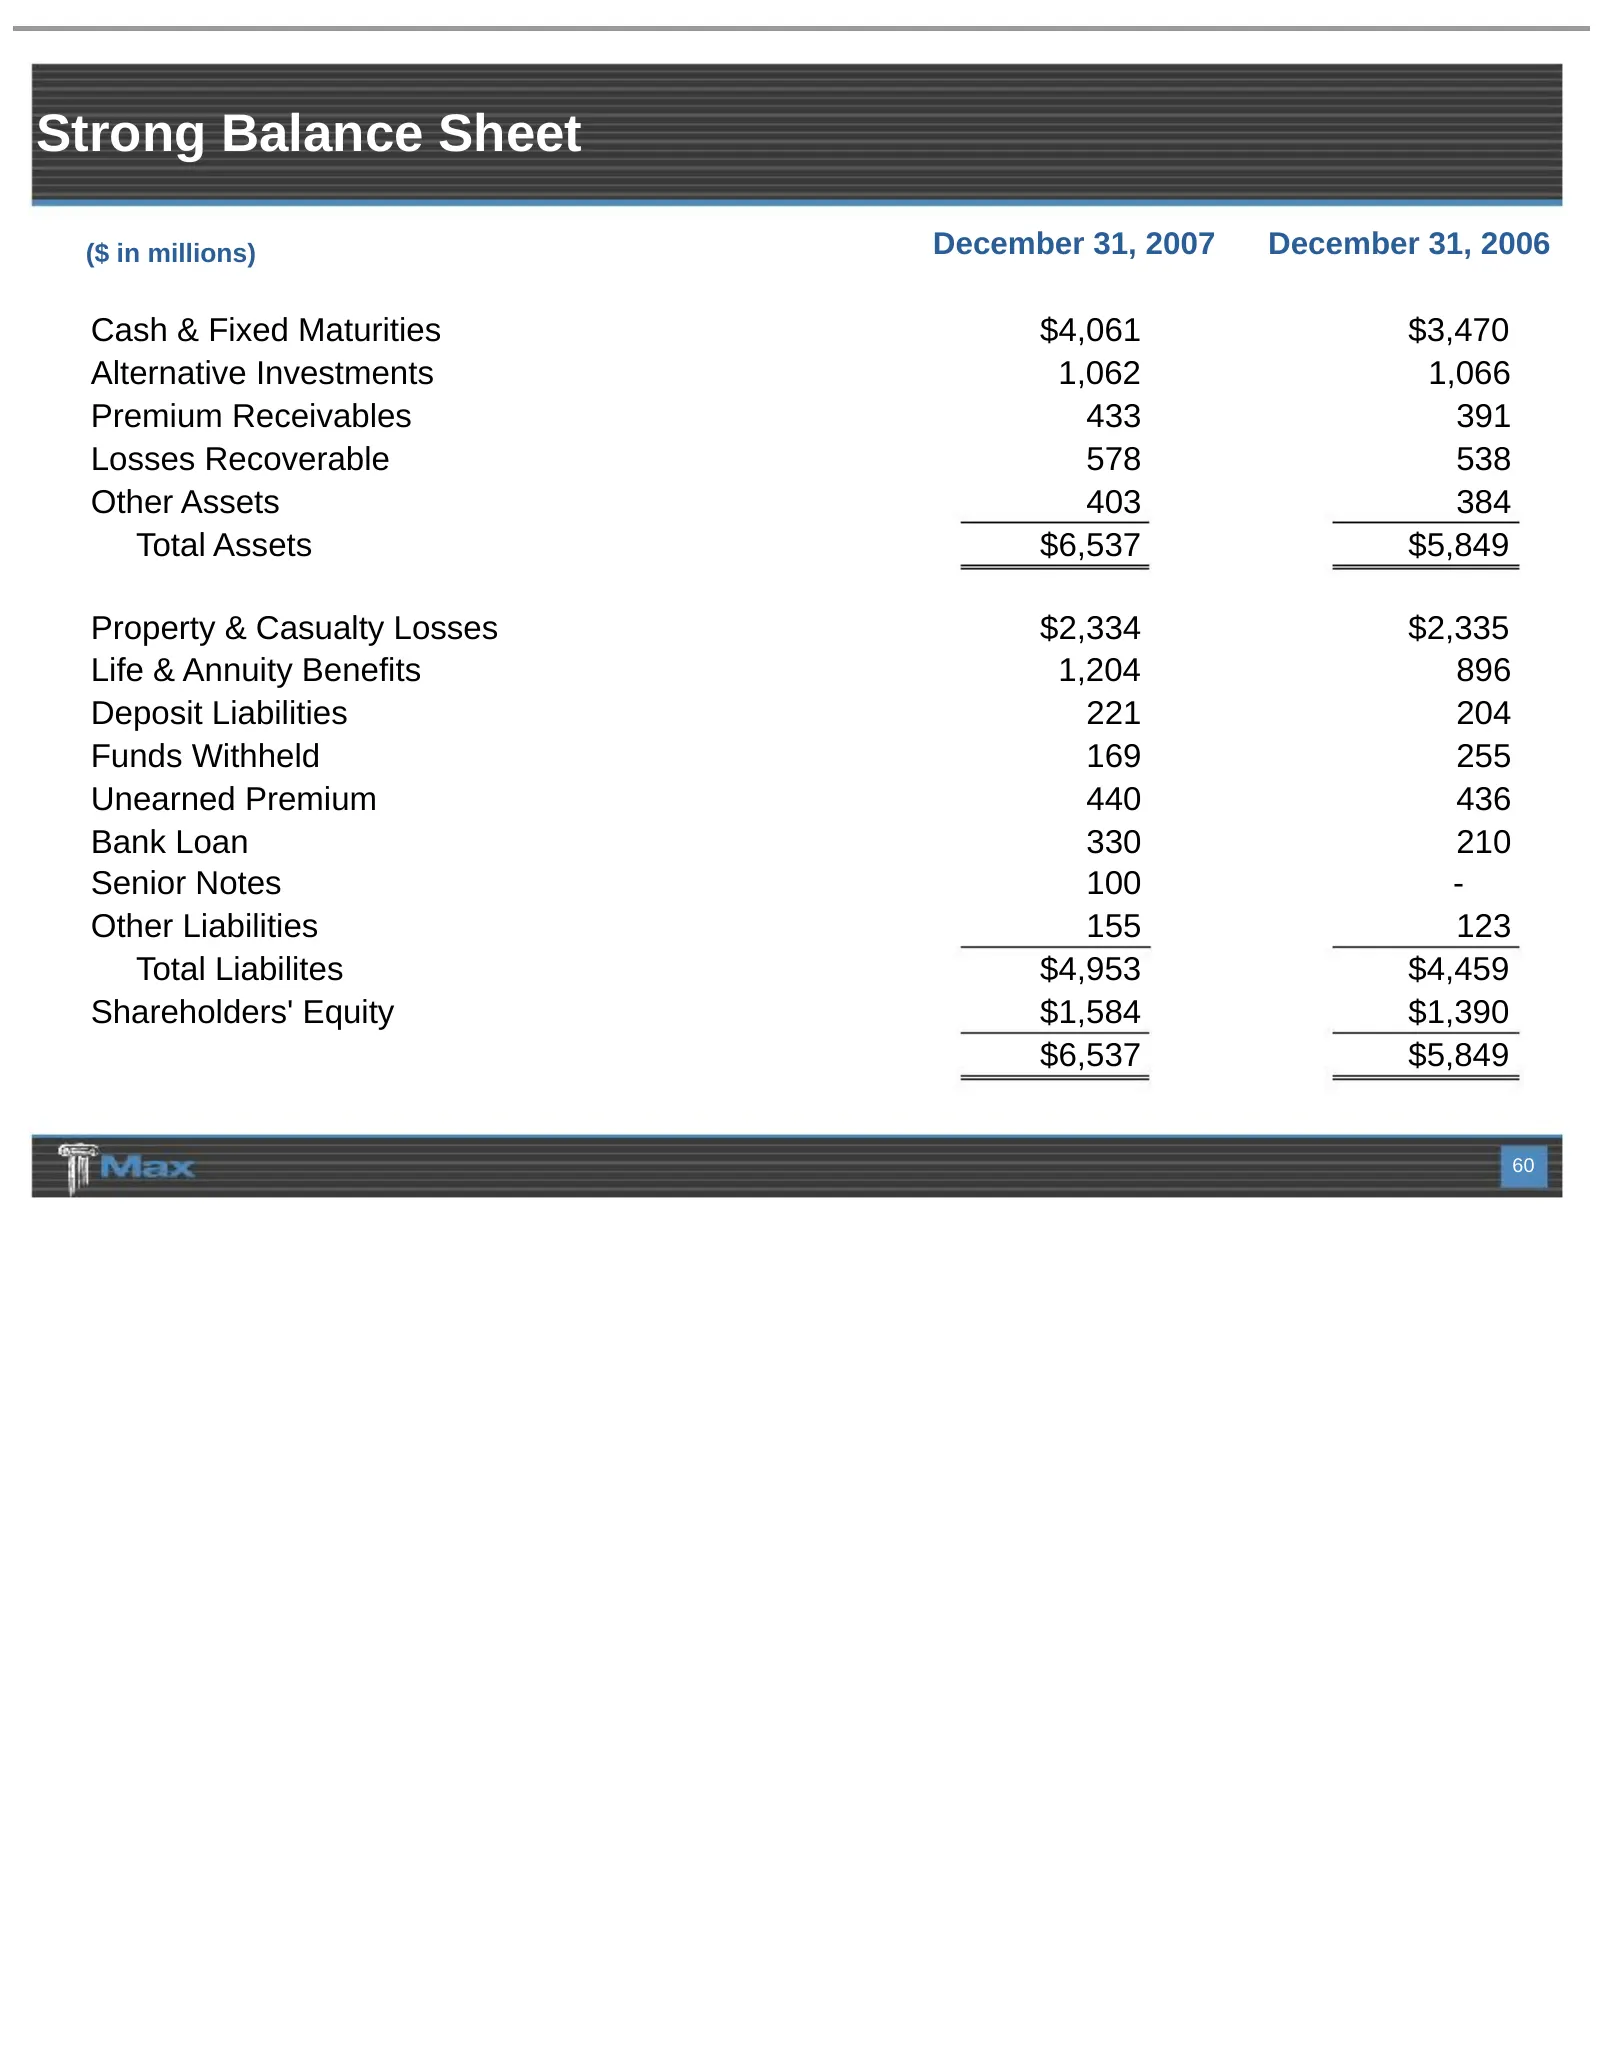
Strong Balance Sheet ($ in millions) December 31, 2007 December 31, 2006 Cash & Fixed Maturities $4,061 $3,470 Alternative Investments 1,062 1,066 Premium Receivables 433 391 Losses Recoverable 578 538 Other Assets 403 384 Total Assets $6,537 $5,849 Property & Casualty Losses $2,334 $2,335 Life & An
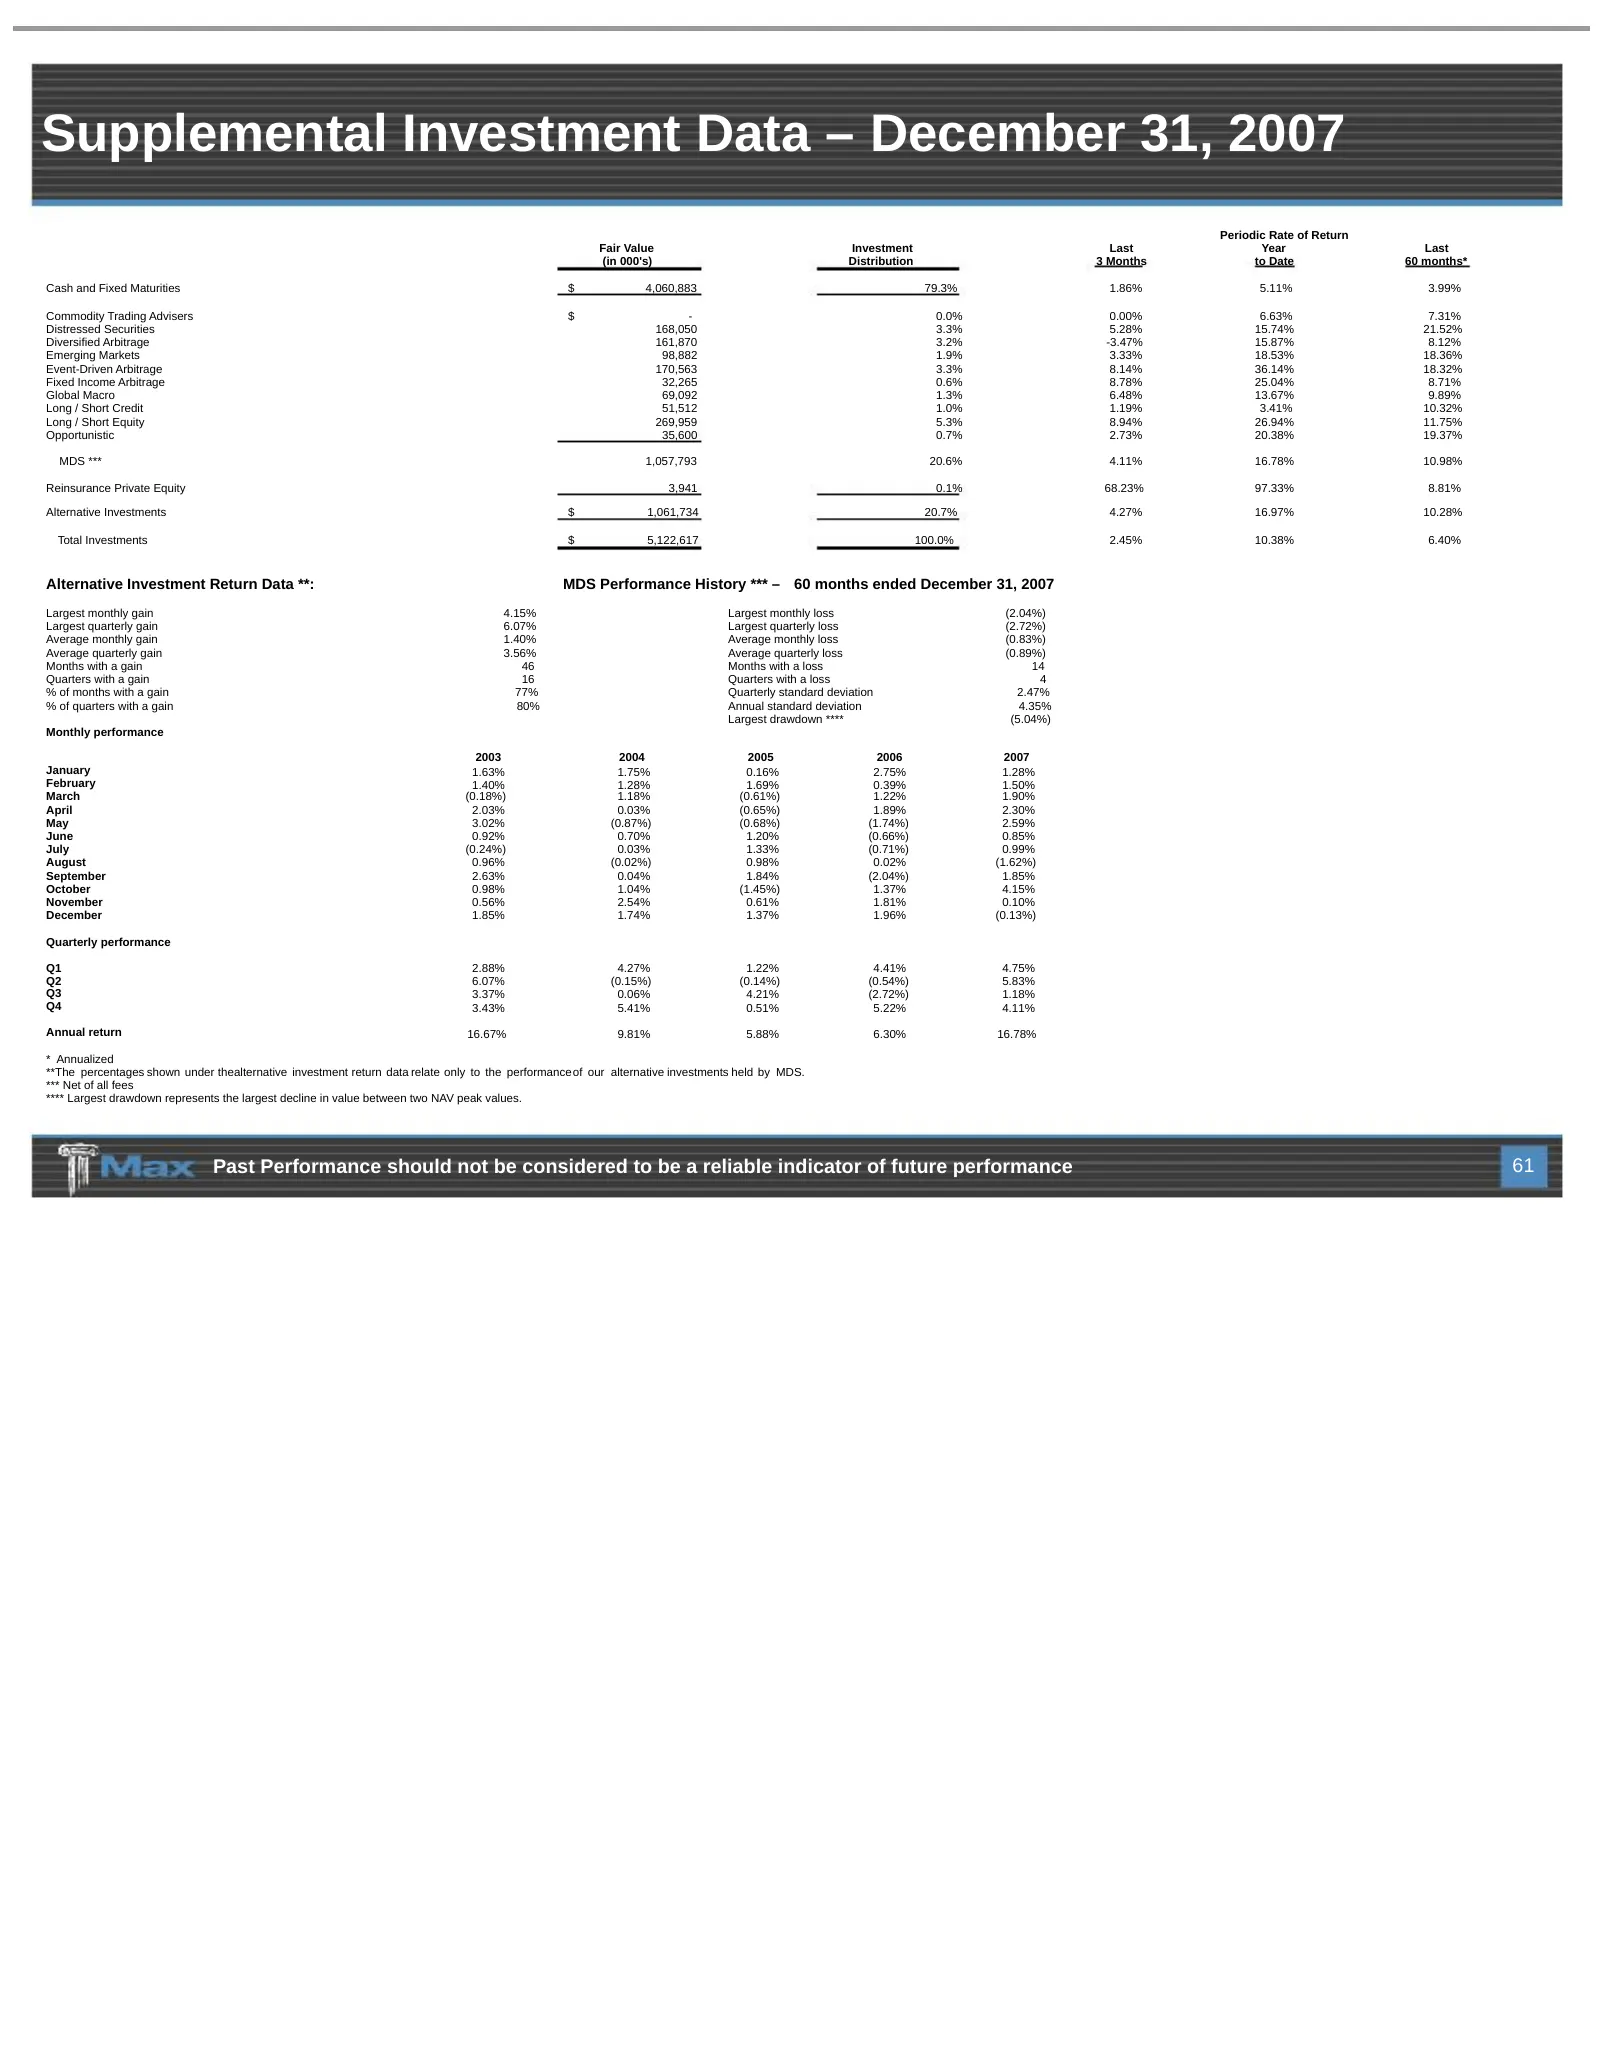
Slide 61: Supplemental Investment Data – December 31, 2007
Supplemental Investment Data – December 31, 2007 Periodic Rate of Return Fair Value Investment Last Year Last (in 000's) Distribution 3 Months to Date 60 months* Cash and Fixed Maturities $ 4,060,883 79.3% 1.86% 5.11% 3.99% Commodity Trading Advisers $ - 0.0% 0.00% 6.63% 7.31% Distressed Securities
Slide 62: Final Remarks
Final Remarks W. Marston (Marty) Becker
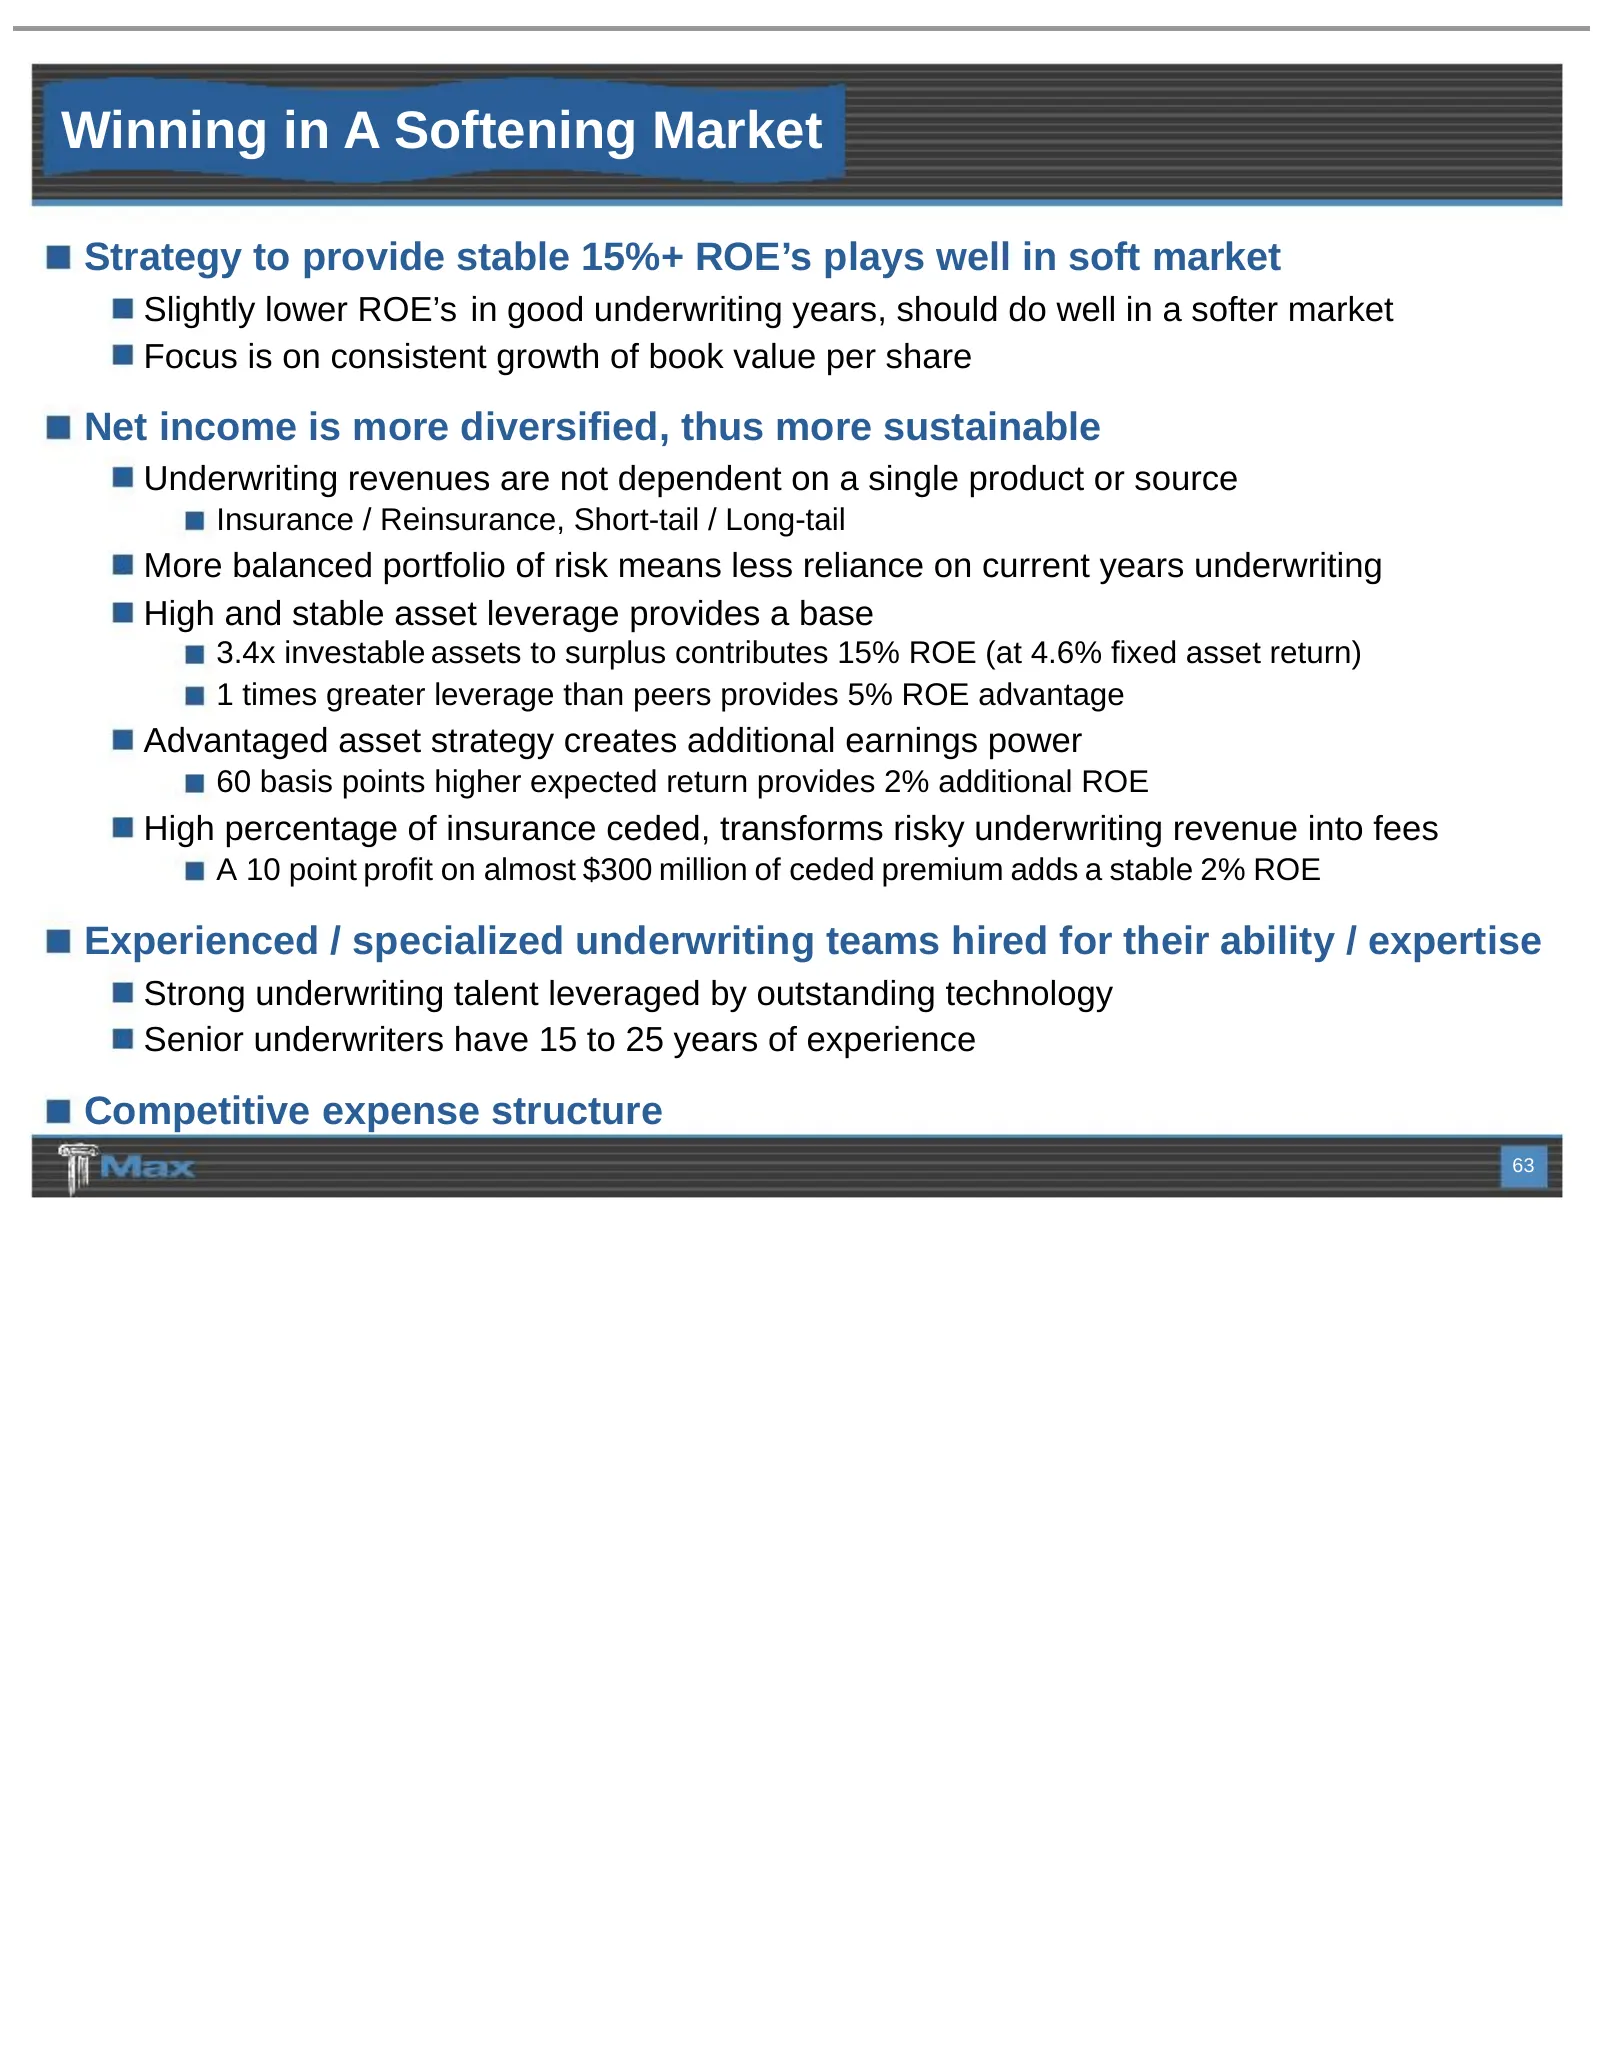
Slide 63: Winning in A Softening Market
Winning in A Softening Market Strategy to provide stable 15%+ ROE’s plays well in soft market Slightly lower ROE’s in good underwriting years, should do well in a softer market Focus is on consistent growth of book value per share Net income is more diversified, thus more sustainable Underwriting re
Slide 64: Max Capital Group Ltd. Investor Day Presentation
MAX CAPITAL GROUP LTD. Nasdaq: MXGL Investor Day Presentation INSURANCE / REINSURANCE February 22, 2008 BERMUDA IRELAND UNITED STATES
Source: SEC EDGAR · 8-K filed Feb 22, 2008
More decks from ALTERRA CAPITAL HOLDINGS Ltd
 Merger or Acquisition (December 2012)16 slides · Dec 19, 2012
 Investor Presentation (November 2012)32 slides · Nov 29, 2012
 Investor Presentation (September 2012)12 slides · Sep 12, 2012
 Investor Presentation (August 2012)33 slides · Aug 29, 2012
 Q1 2012 Earnings Presentation32 slides · May 25, 2012
 Q1 2012 Earnings Presentation28 slides · May 11, 2012