ALTERRA CAPITAL — Investor Presentation (November 2012)
32 slides from ALTERRA CAPITAL's investor presentation, Nov 29, 2012
Slide 1: Investor Presentation
Exhibit 99.1 Investor Presentation Quarter Ended September 30, 2012
Slide 2: Cautionary Note Regarding Forward-Looking Statements
Cautionary Note Regarding Forward-Looking Statements This presentation may include forward-looking statements that reflect Alterra’s current views with respect to future events and financial performance. Statements that include the words “expect,” “intend,” “plan,” “believe,” “project,” “anticipate,
Slide 3: Alterra's Franchise is Well Positioned For Success
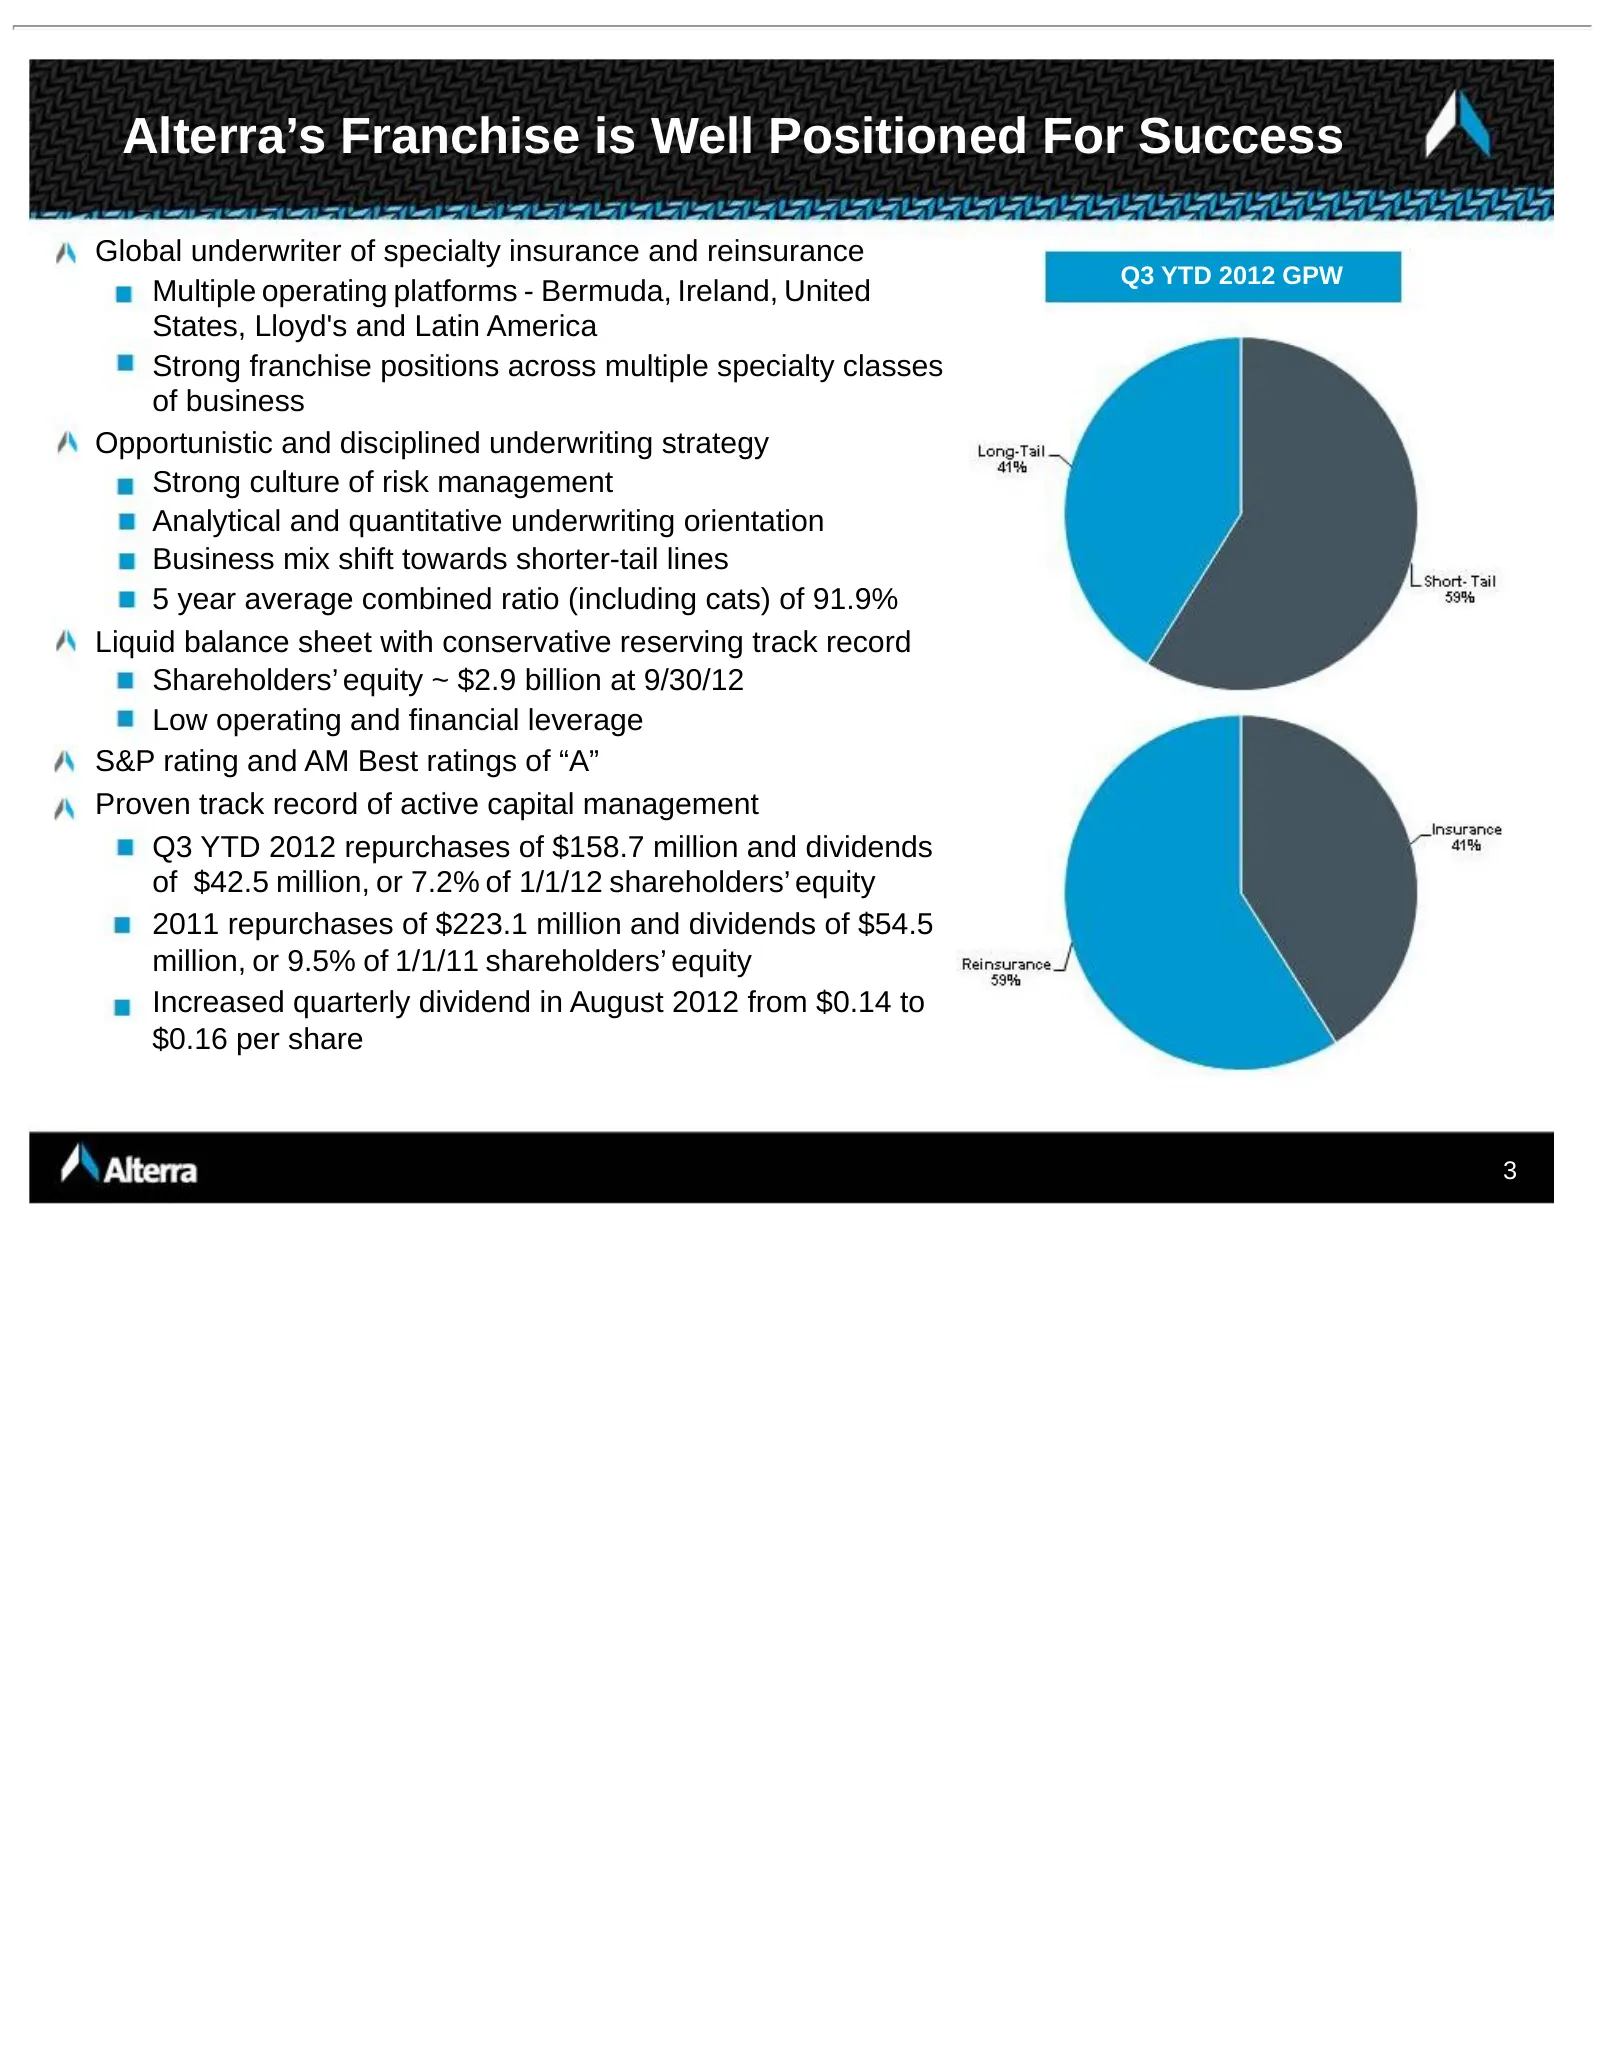
Alterra’s Franchise is Well Positioned For Success Global underwriter of specialty insurance and reinsurance Q3 YTD 2012 GPW Multiple operating platforms - Bermuda, Ireland, United States, Lloyd's and Latin America Strong franchise positions across multiple specialty classes of business Opportunisti
Slide 4: Third Quarter 2012 Results
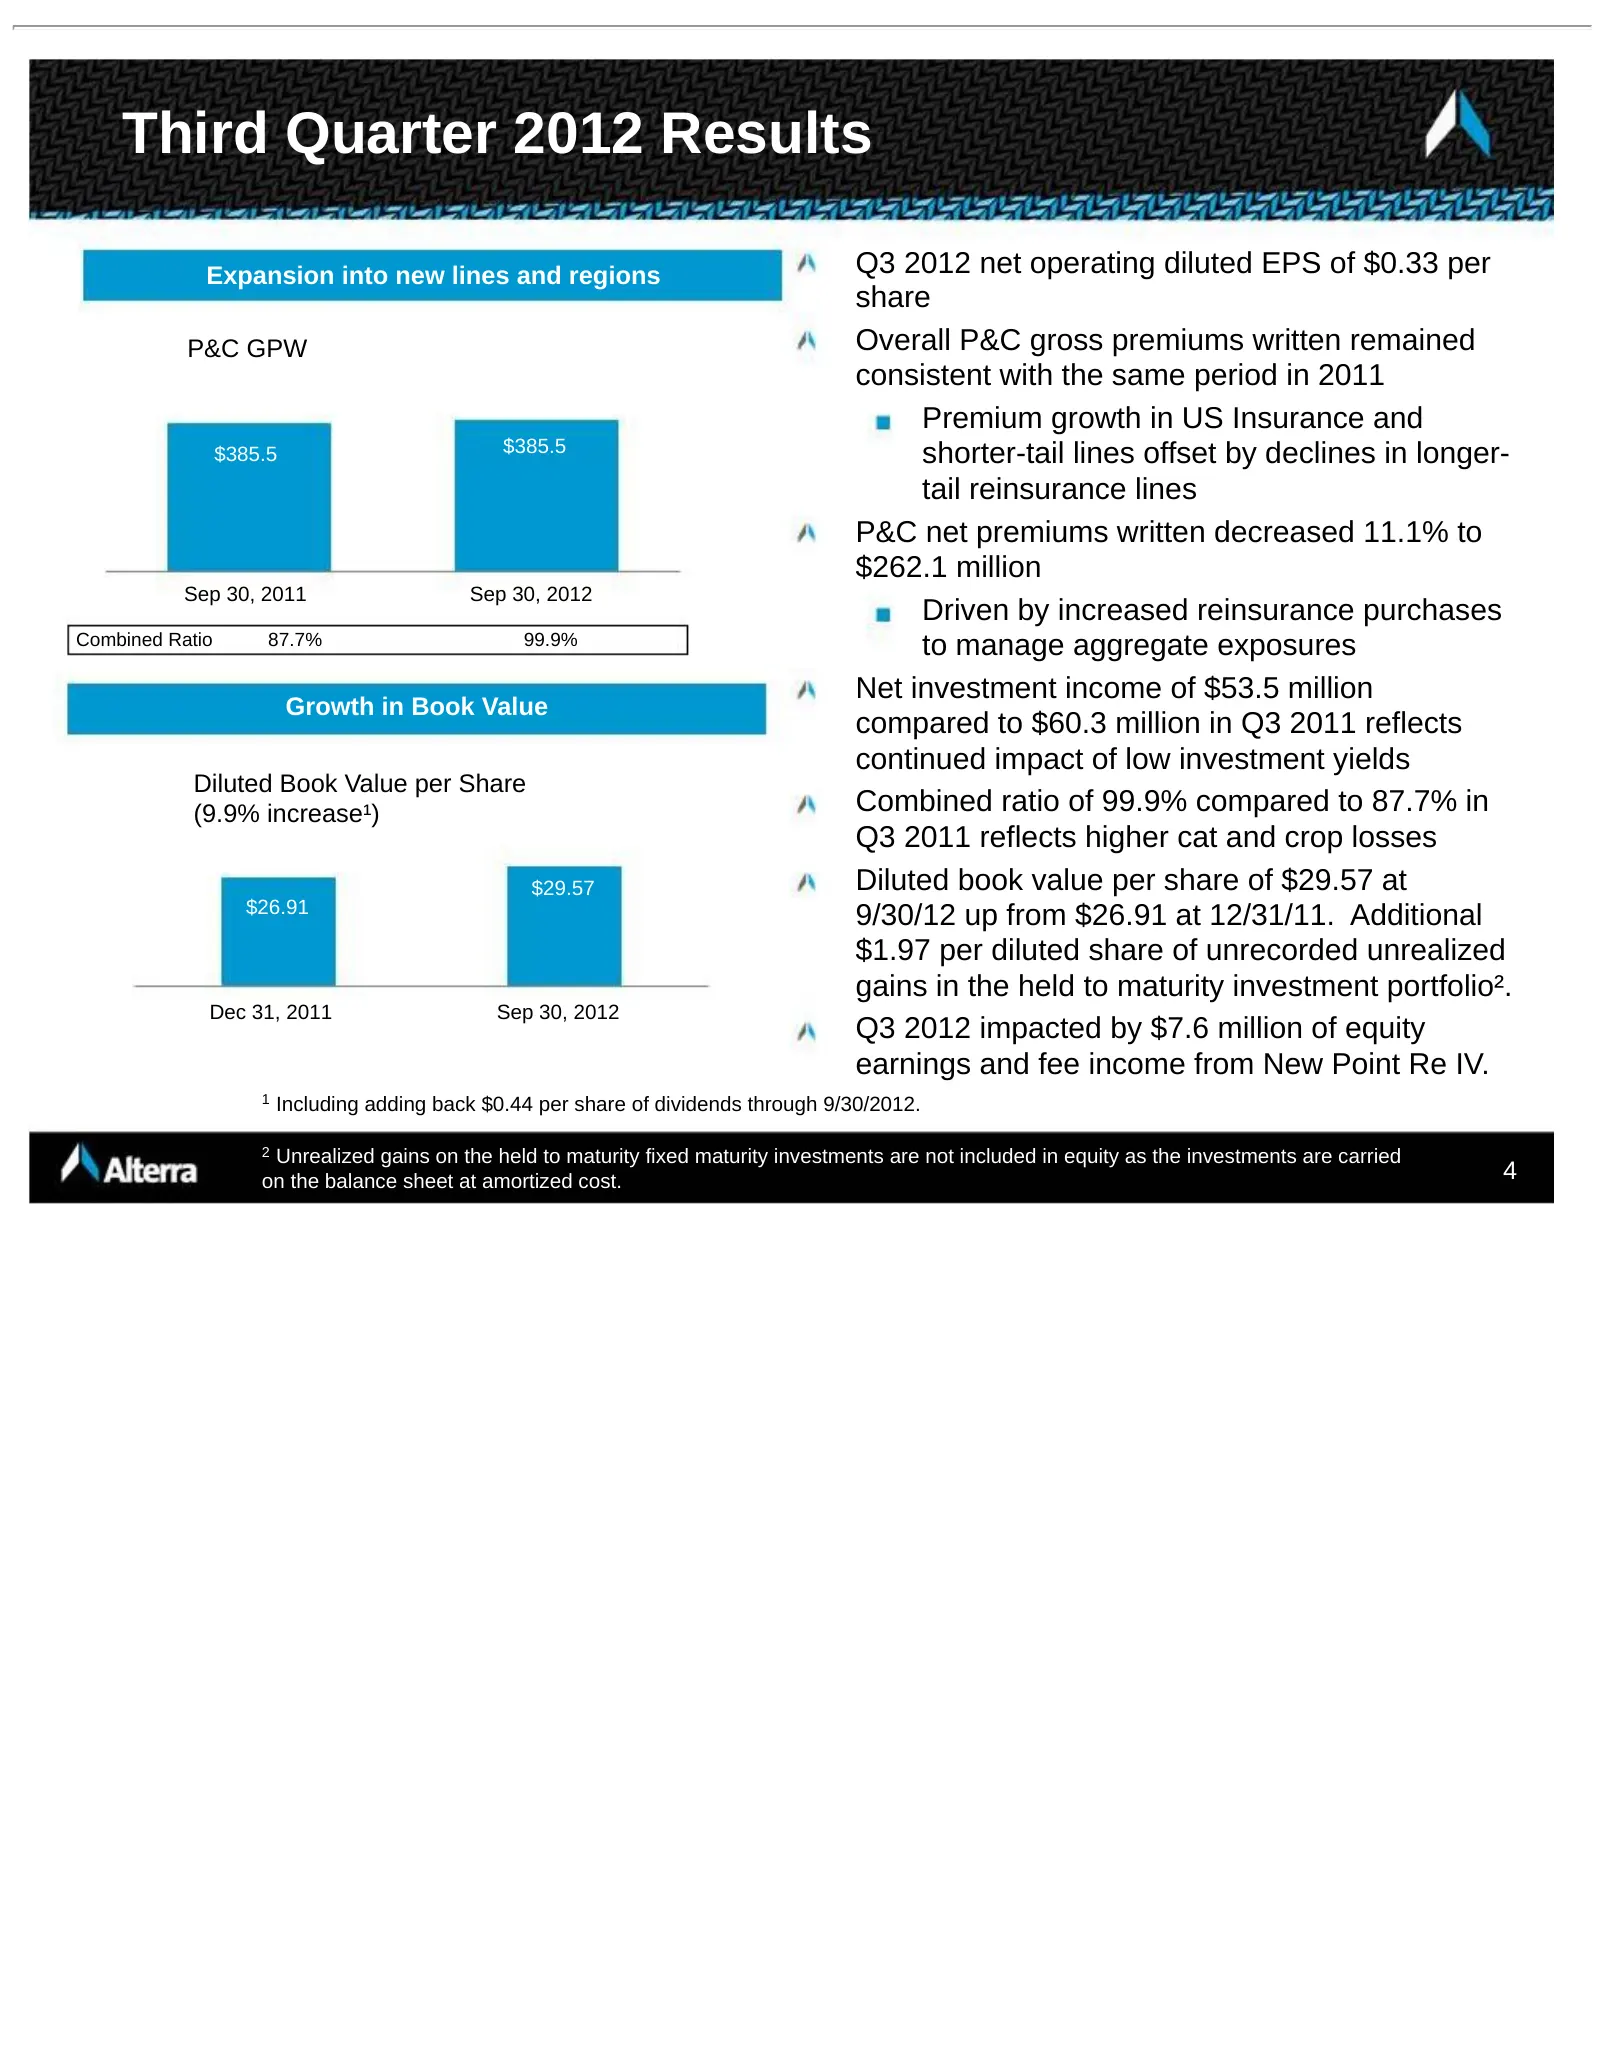
Third Quarter 2012 Results Expansion into new lines and regions Q3 2012 net operating diluted EPS of $0.33 per share P&C GPW Overall P&C gross premiums written remained consistent with the same period in 2011 Premium growth in US Insurance and $385.5 $385.5 shorter-tail lines offset by declines in l
Slide 5: Growth in Reinsurance Segment Property Premiums
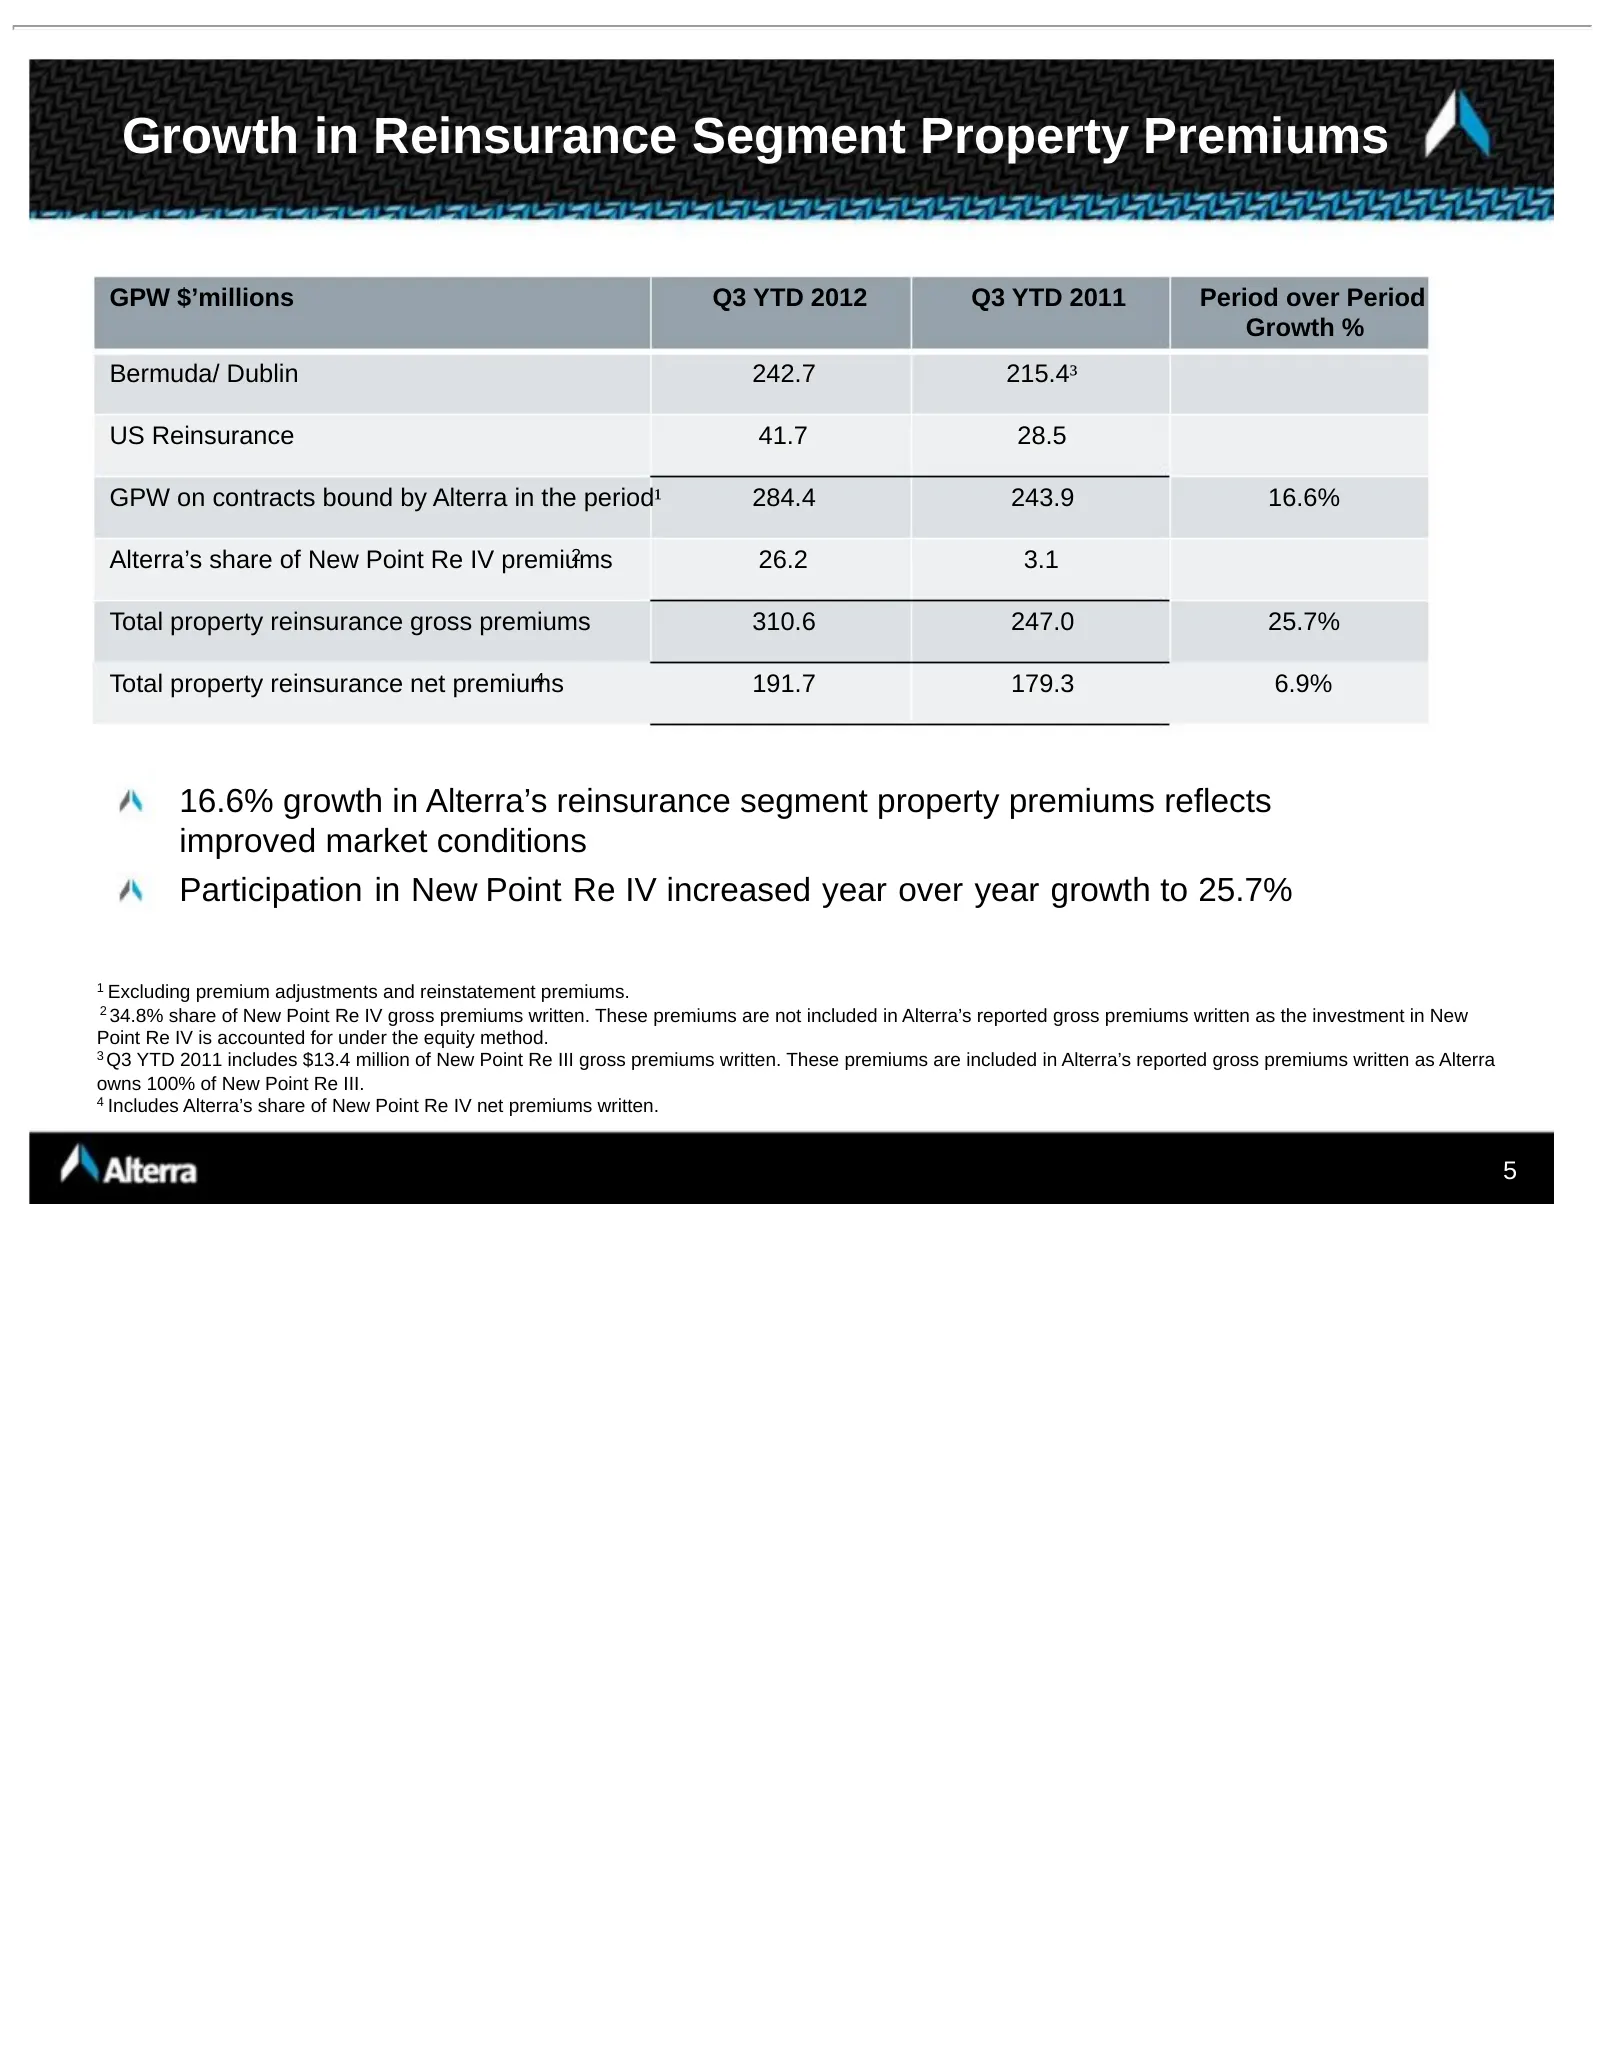
Growth in Reinsurance Segment Property Premiums GPW $’millions Q3 YTD 2012 Q3 YTD 2011 Period over Period Growth % Bermuda/ Dublin 242.7 215.4³ US Reinsurance 41.7 28.5 GPW on contracts bound by Alterra in the period¹ 284.4 243.9 16.6% Alterra’s share of New Point Re IV premiums 2 26.2 3.1 Total pro
Slide 6: New Point IV and V
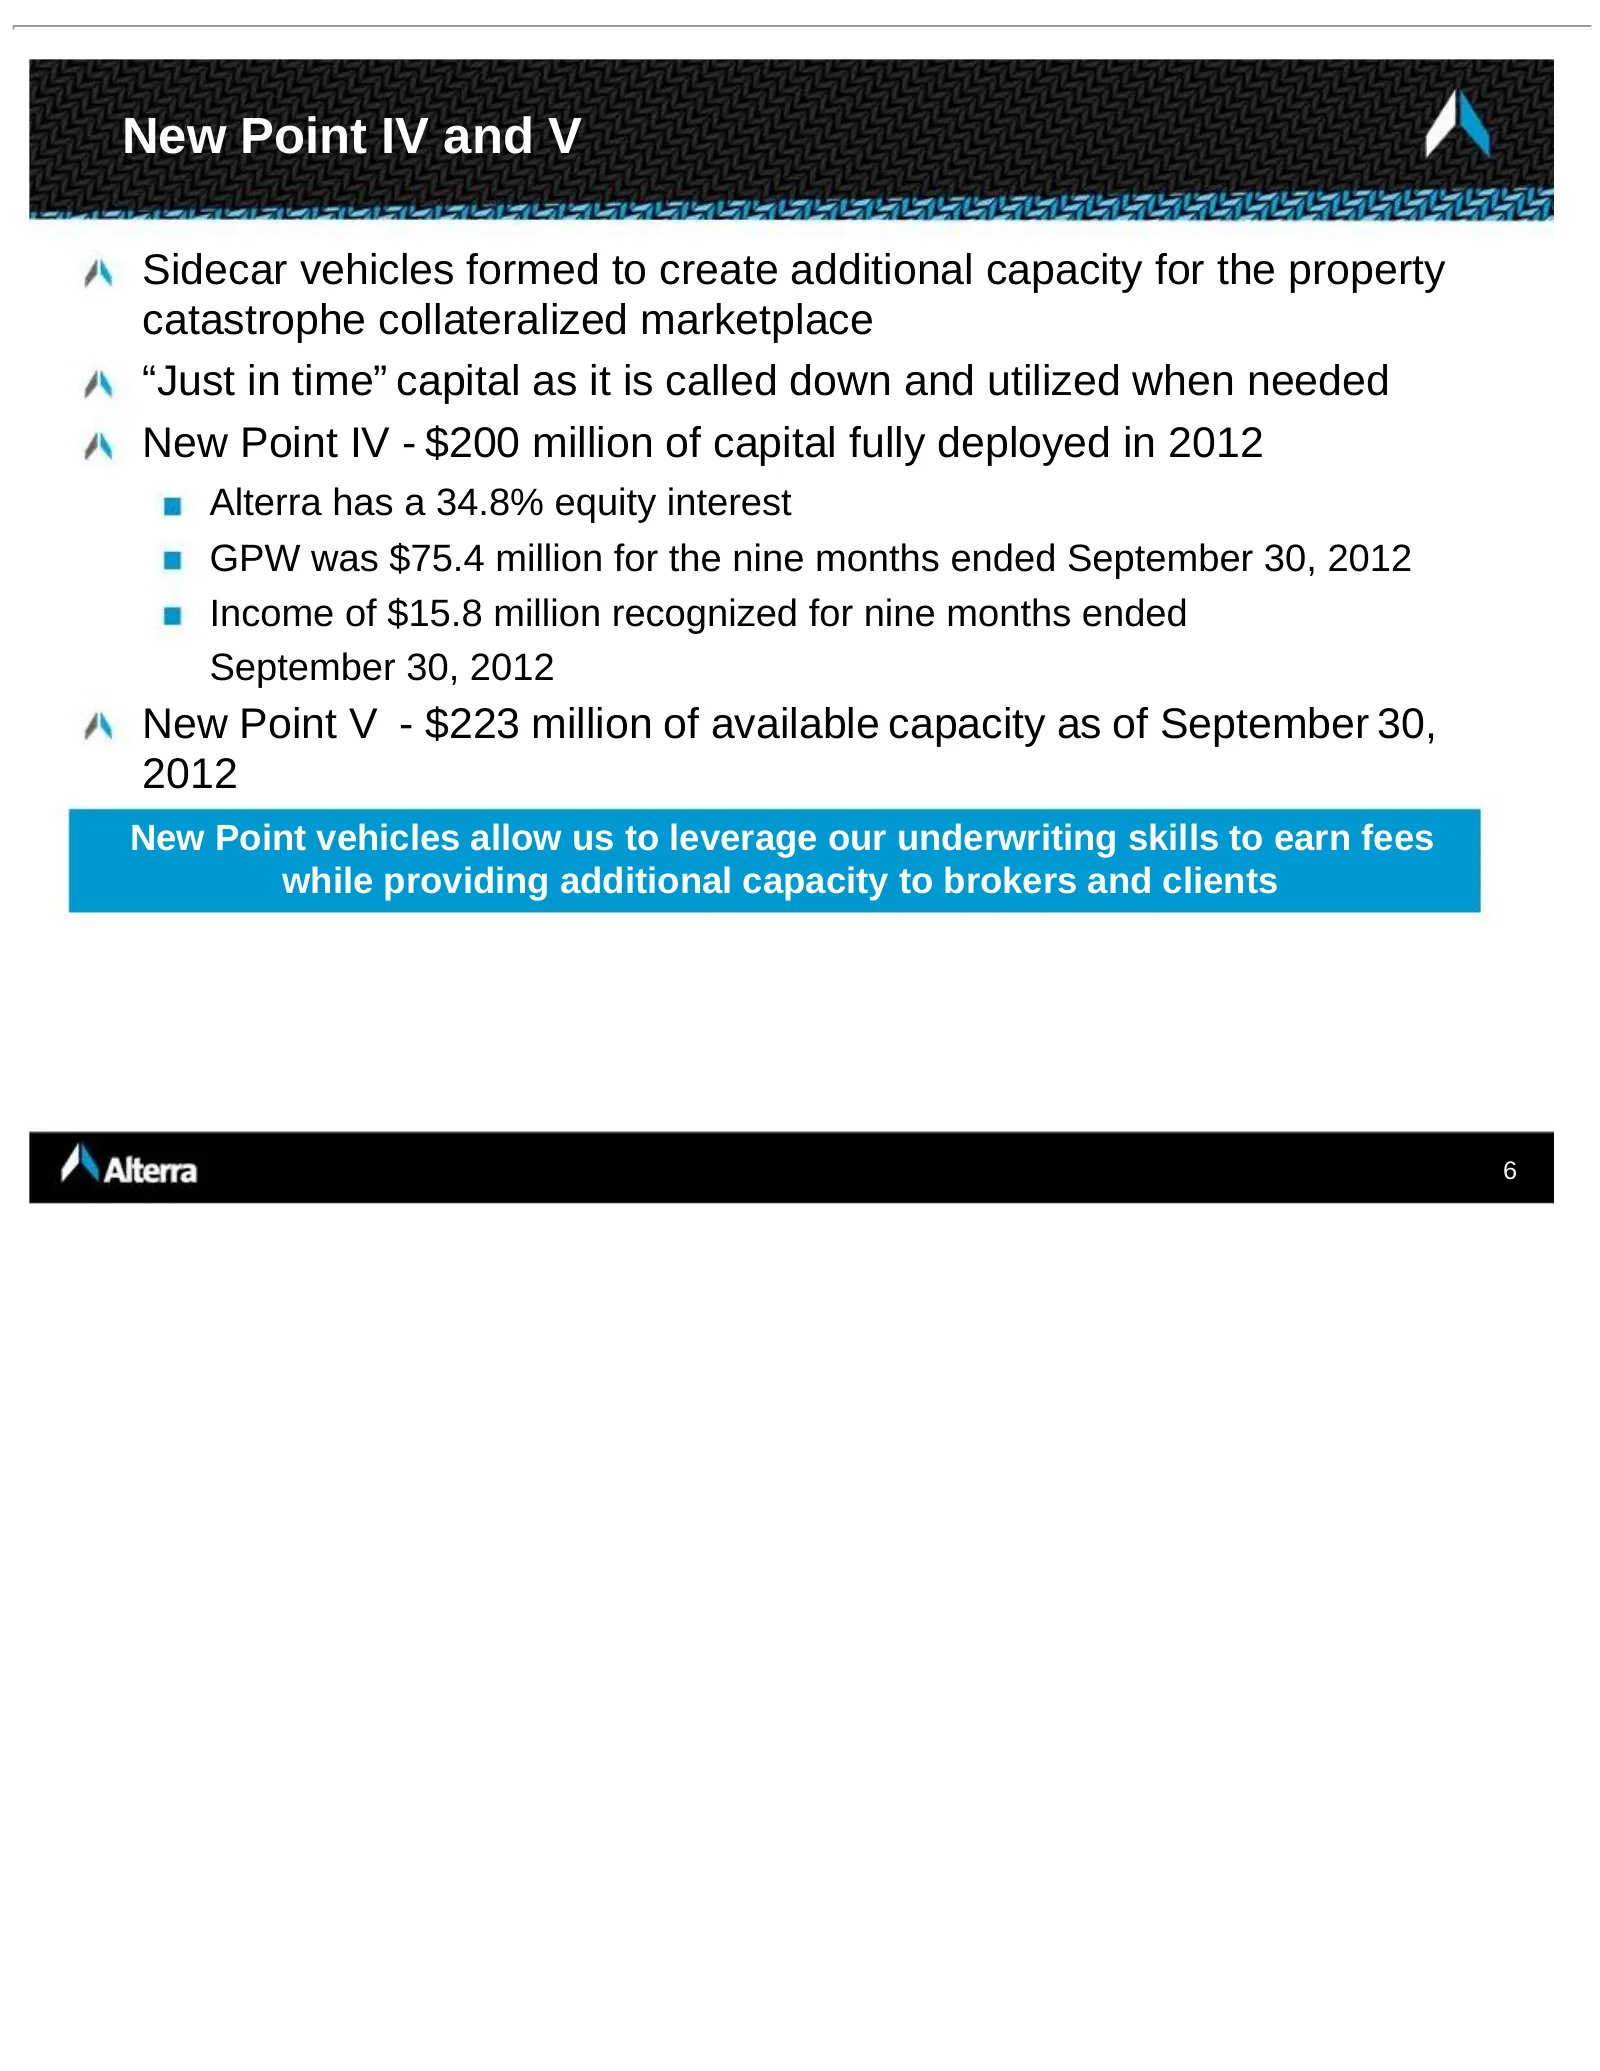
New Point IV and V Sidecar vehicles formed to create additional capacity for the property catastrophe collateralized marketplace “Just in time” capital as it is called down and utilized when needed New Point IV - $200 million of capital fully deployed in 2012 Alterra has a 34.8% equity interest GPW
Slide 7: Market Transitioning. . .
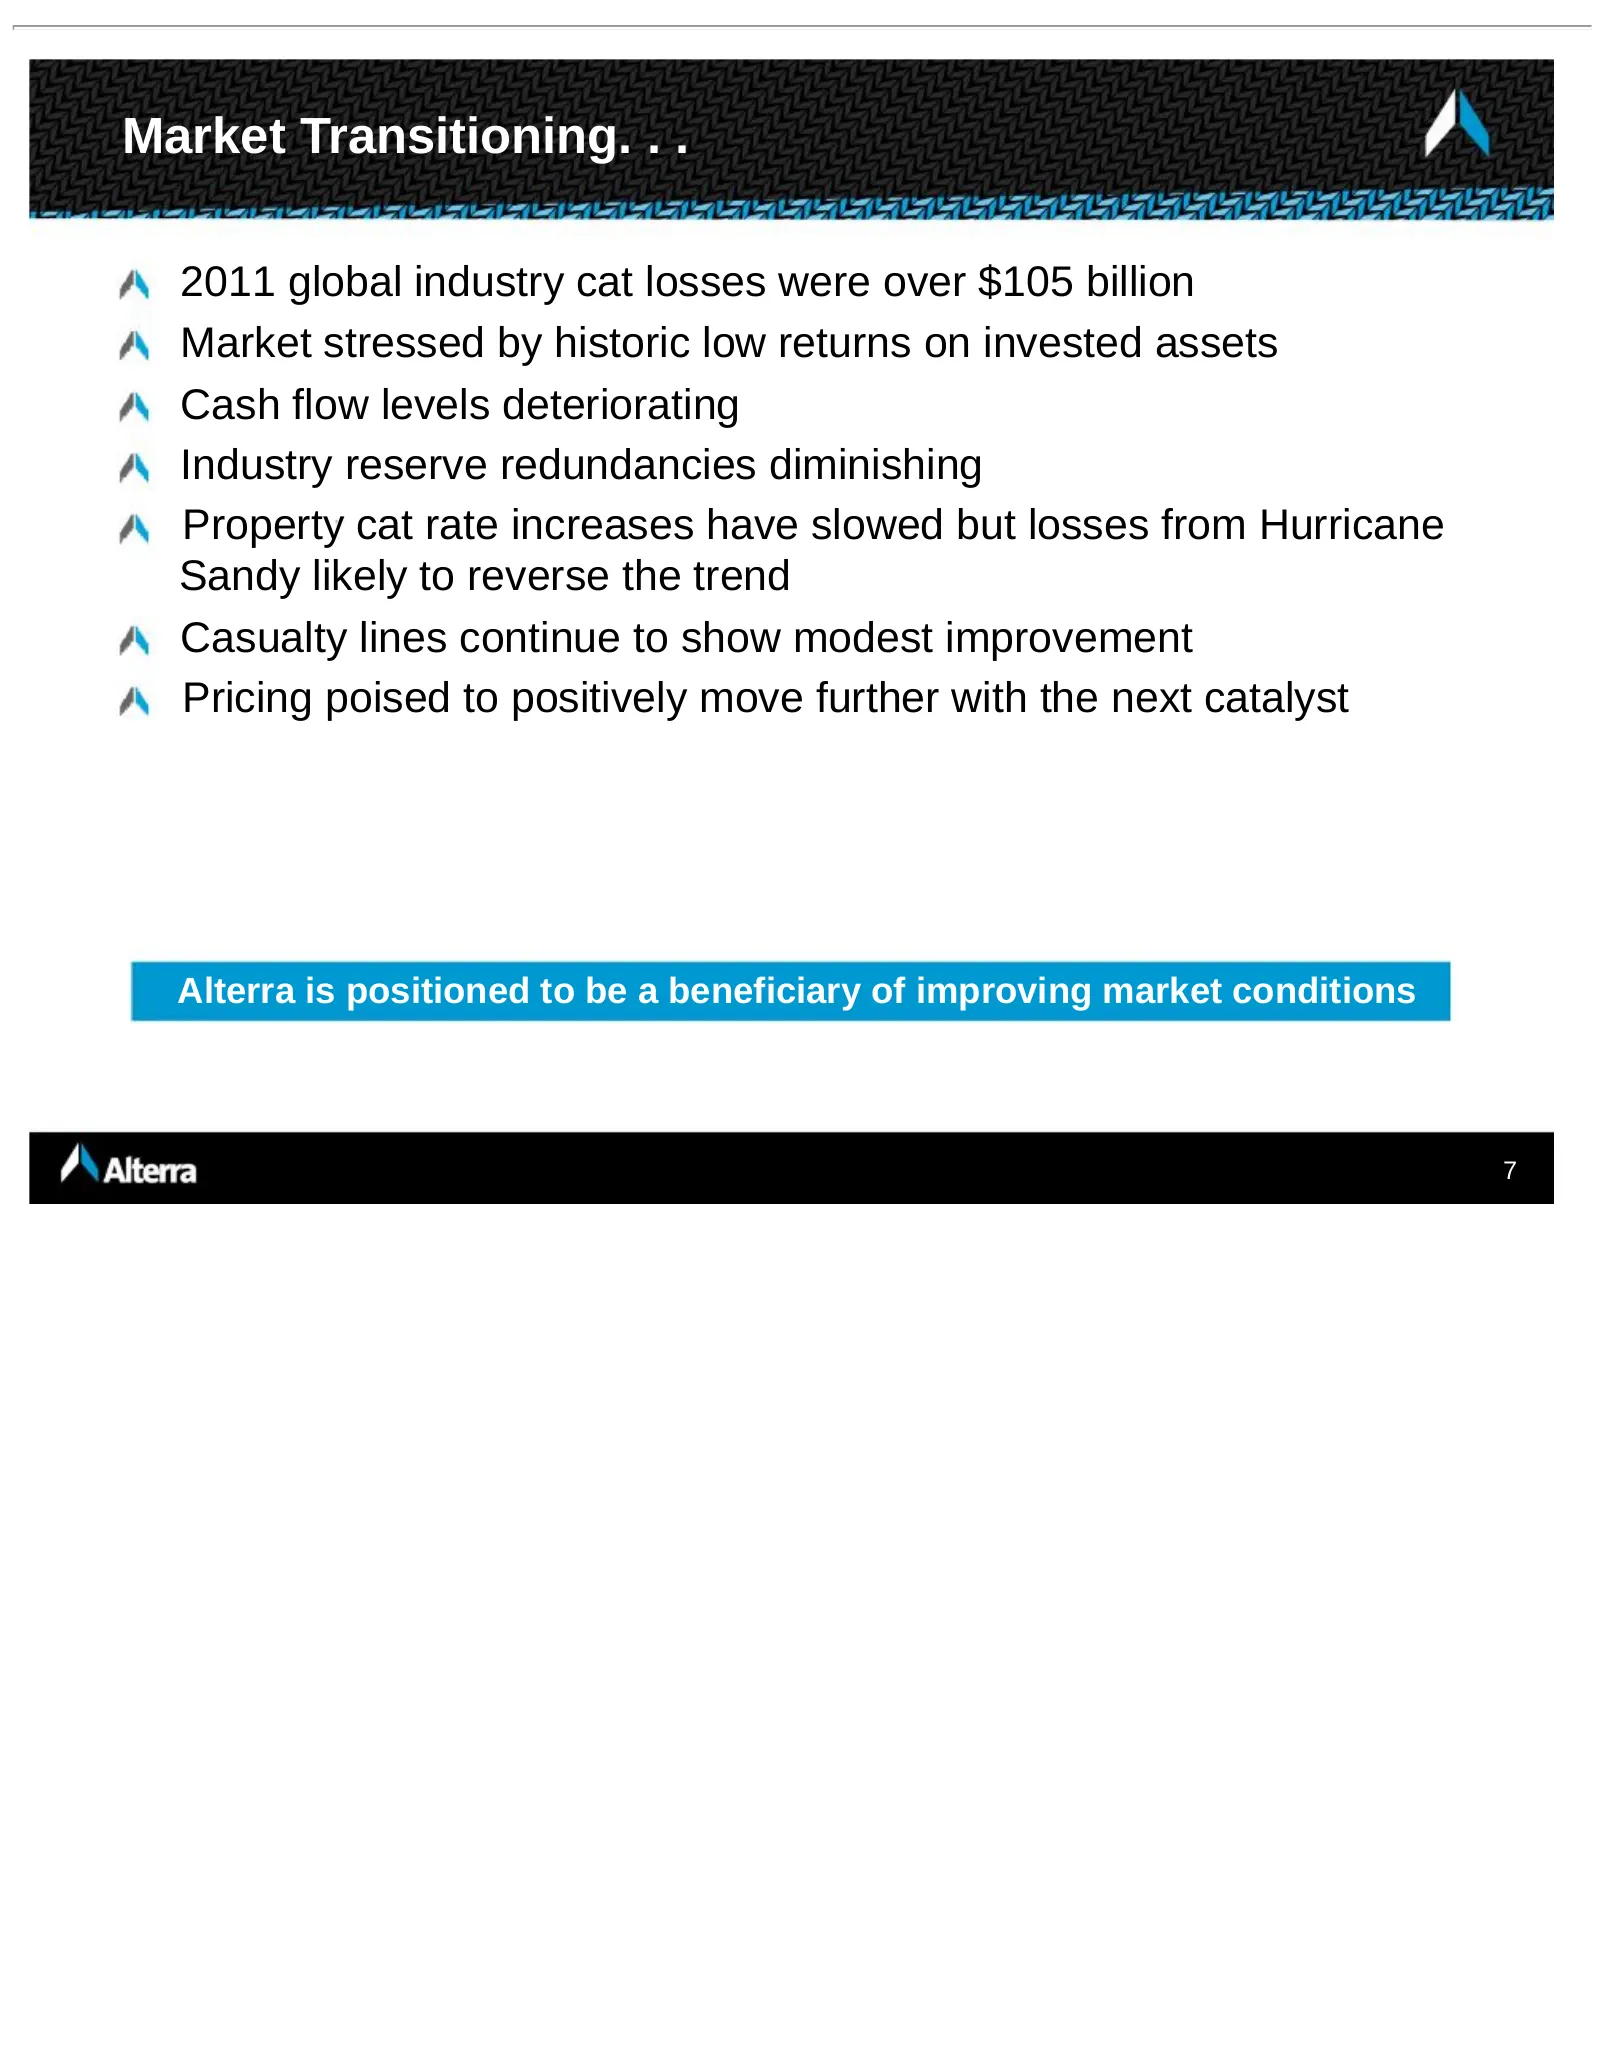
Market Transitioning. . . 2011 global industry cat losses were over $105 billion Market stressed by historic low returns on invested assets Cash flow levels deteriorating Industry reserve redundancies diminishing Property cat rate increases have slowed but losses from Hurricane Sandy likely to rever
Slide 8: Pricing Is Improving For The First Time Since 1999. . .
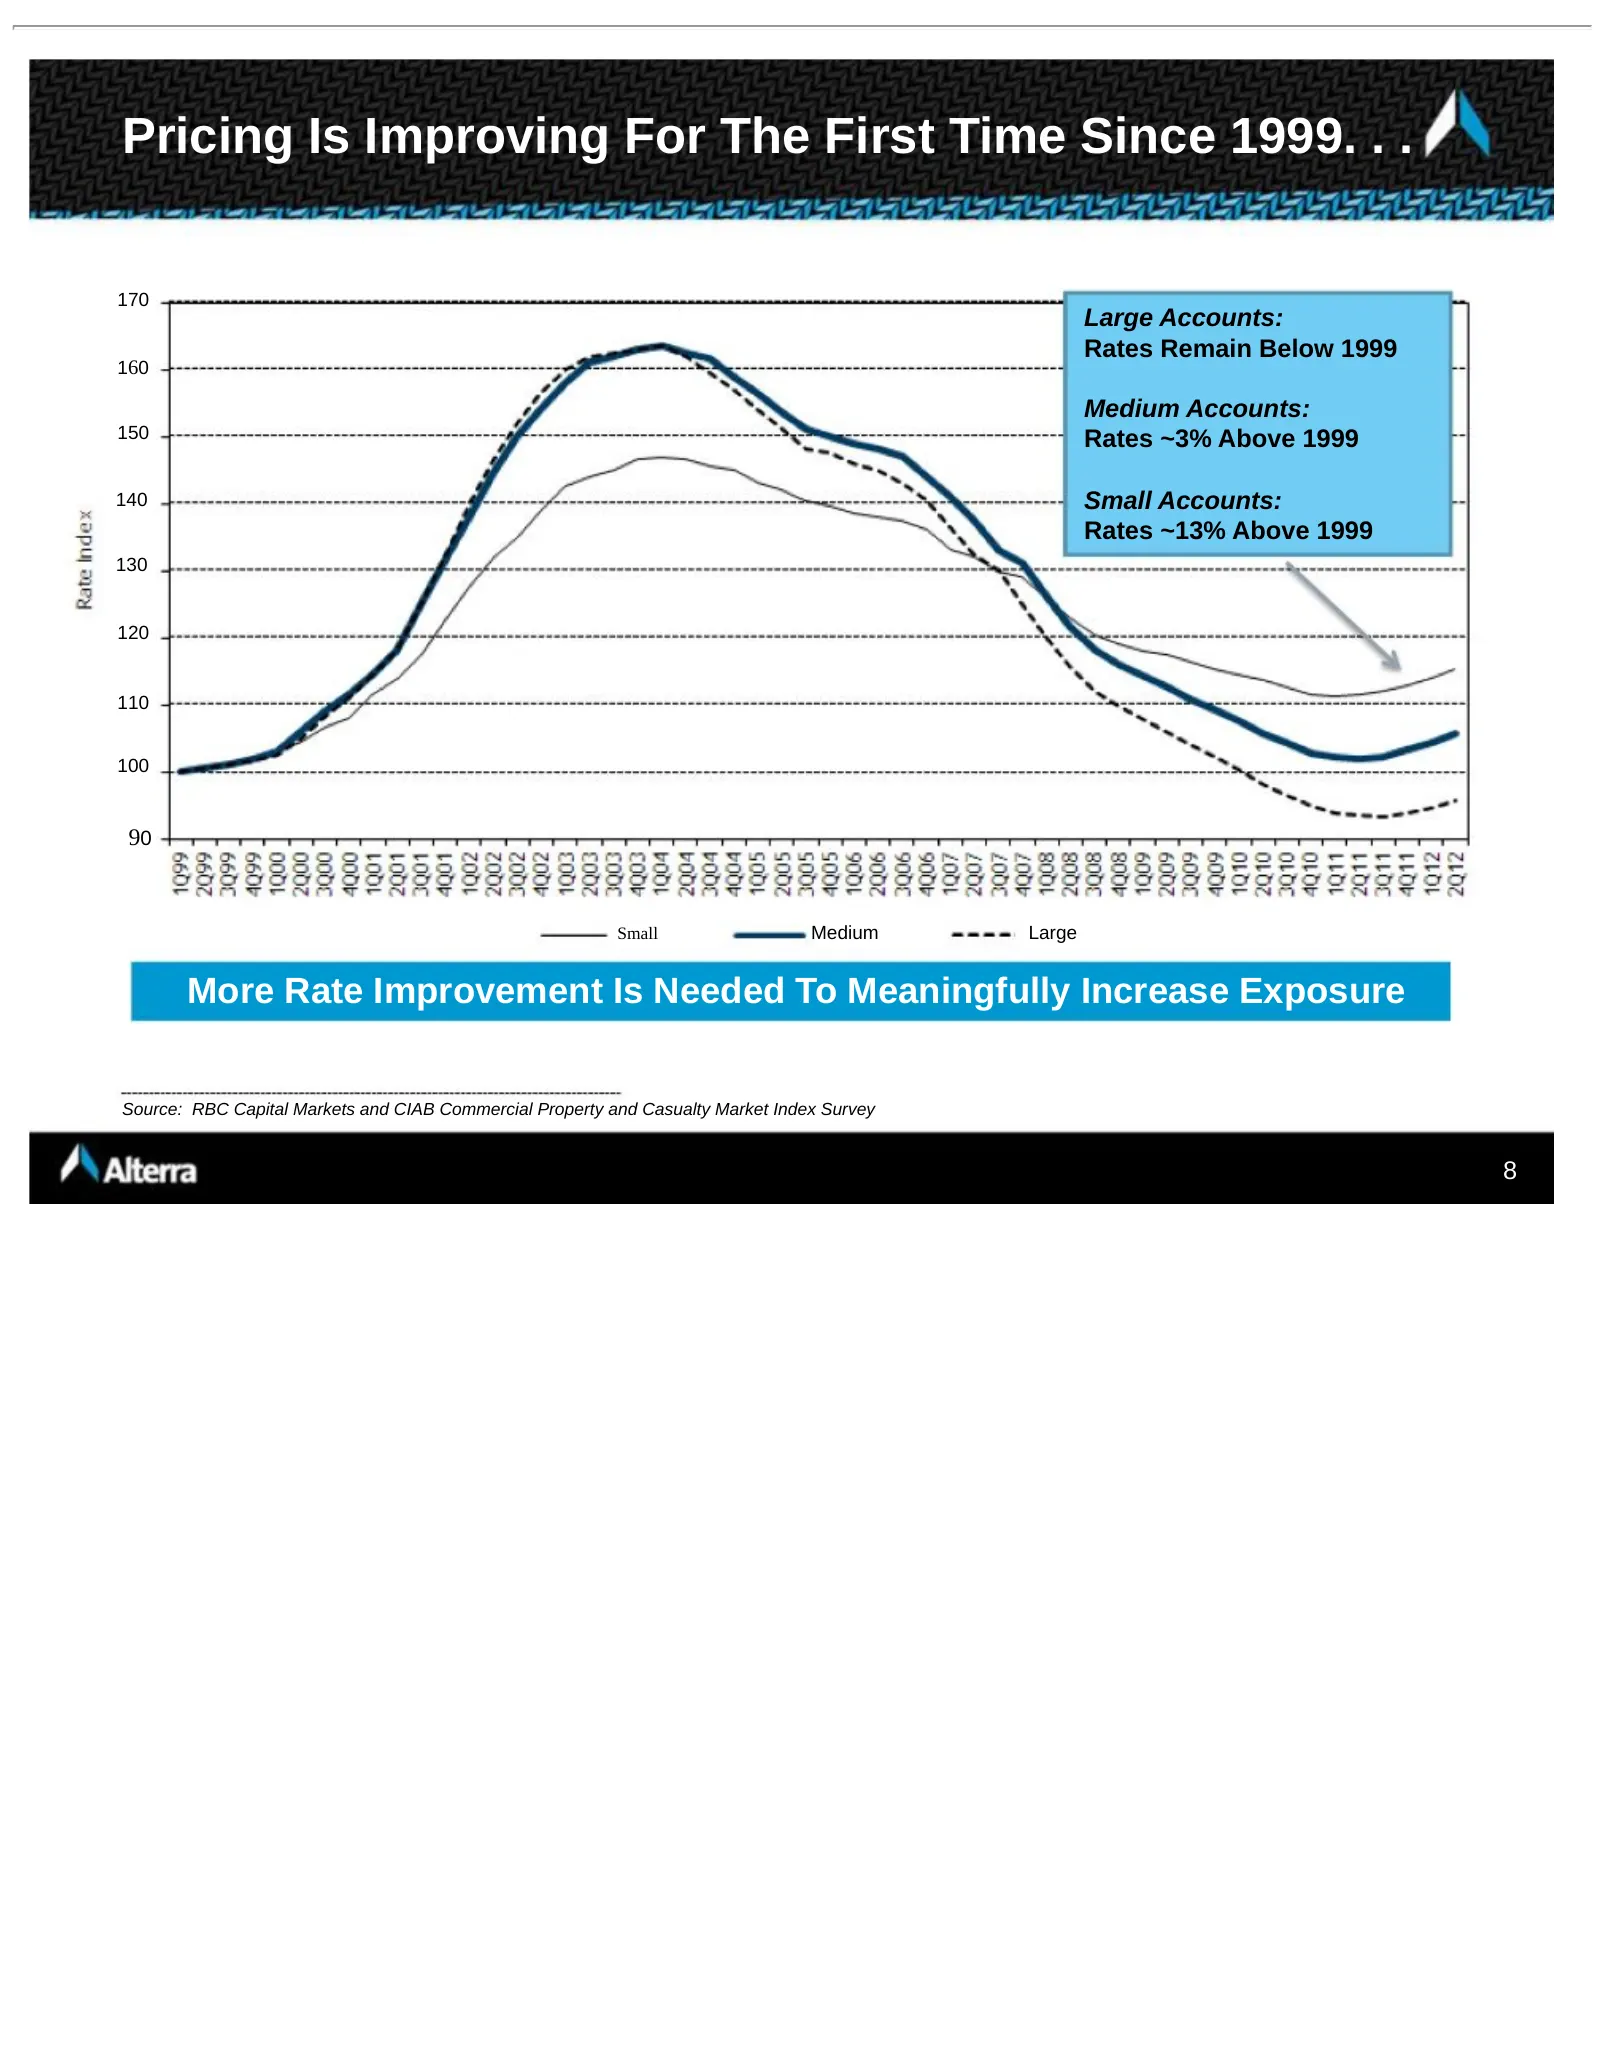
Pricing Is Improving For The First Time Since 1999. . . 170 Large Accounts: Rates Remain Below 1999 160 Medium Accounts: 150 Rates ~3% Above 1999 140 Small Accounts: Rates ~13% Above 1999 130 120 110 100 90 Small Medium Large More Rate Improvement Is Needed To Meaningfully Increase Exposure Source:
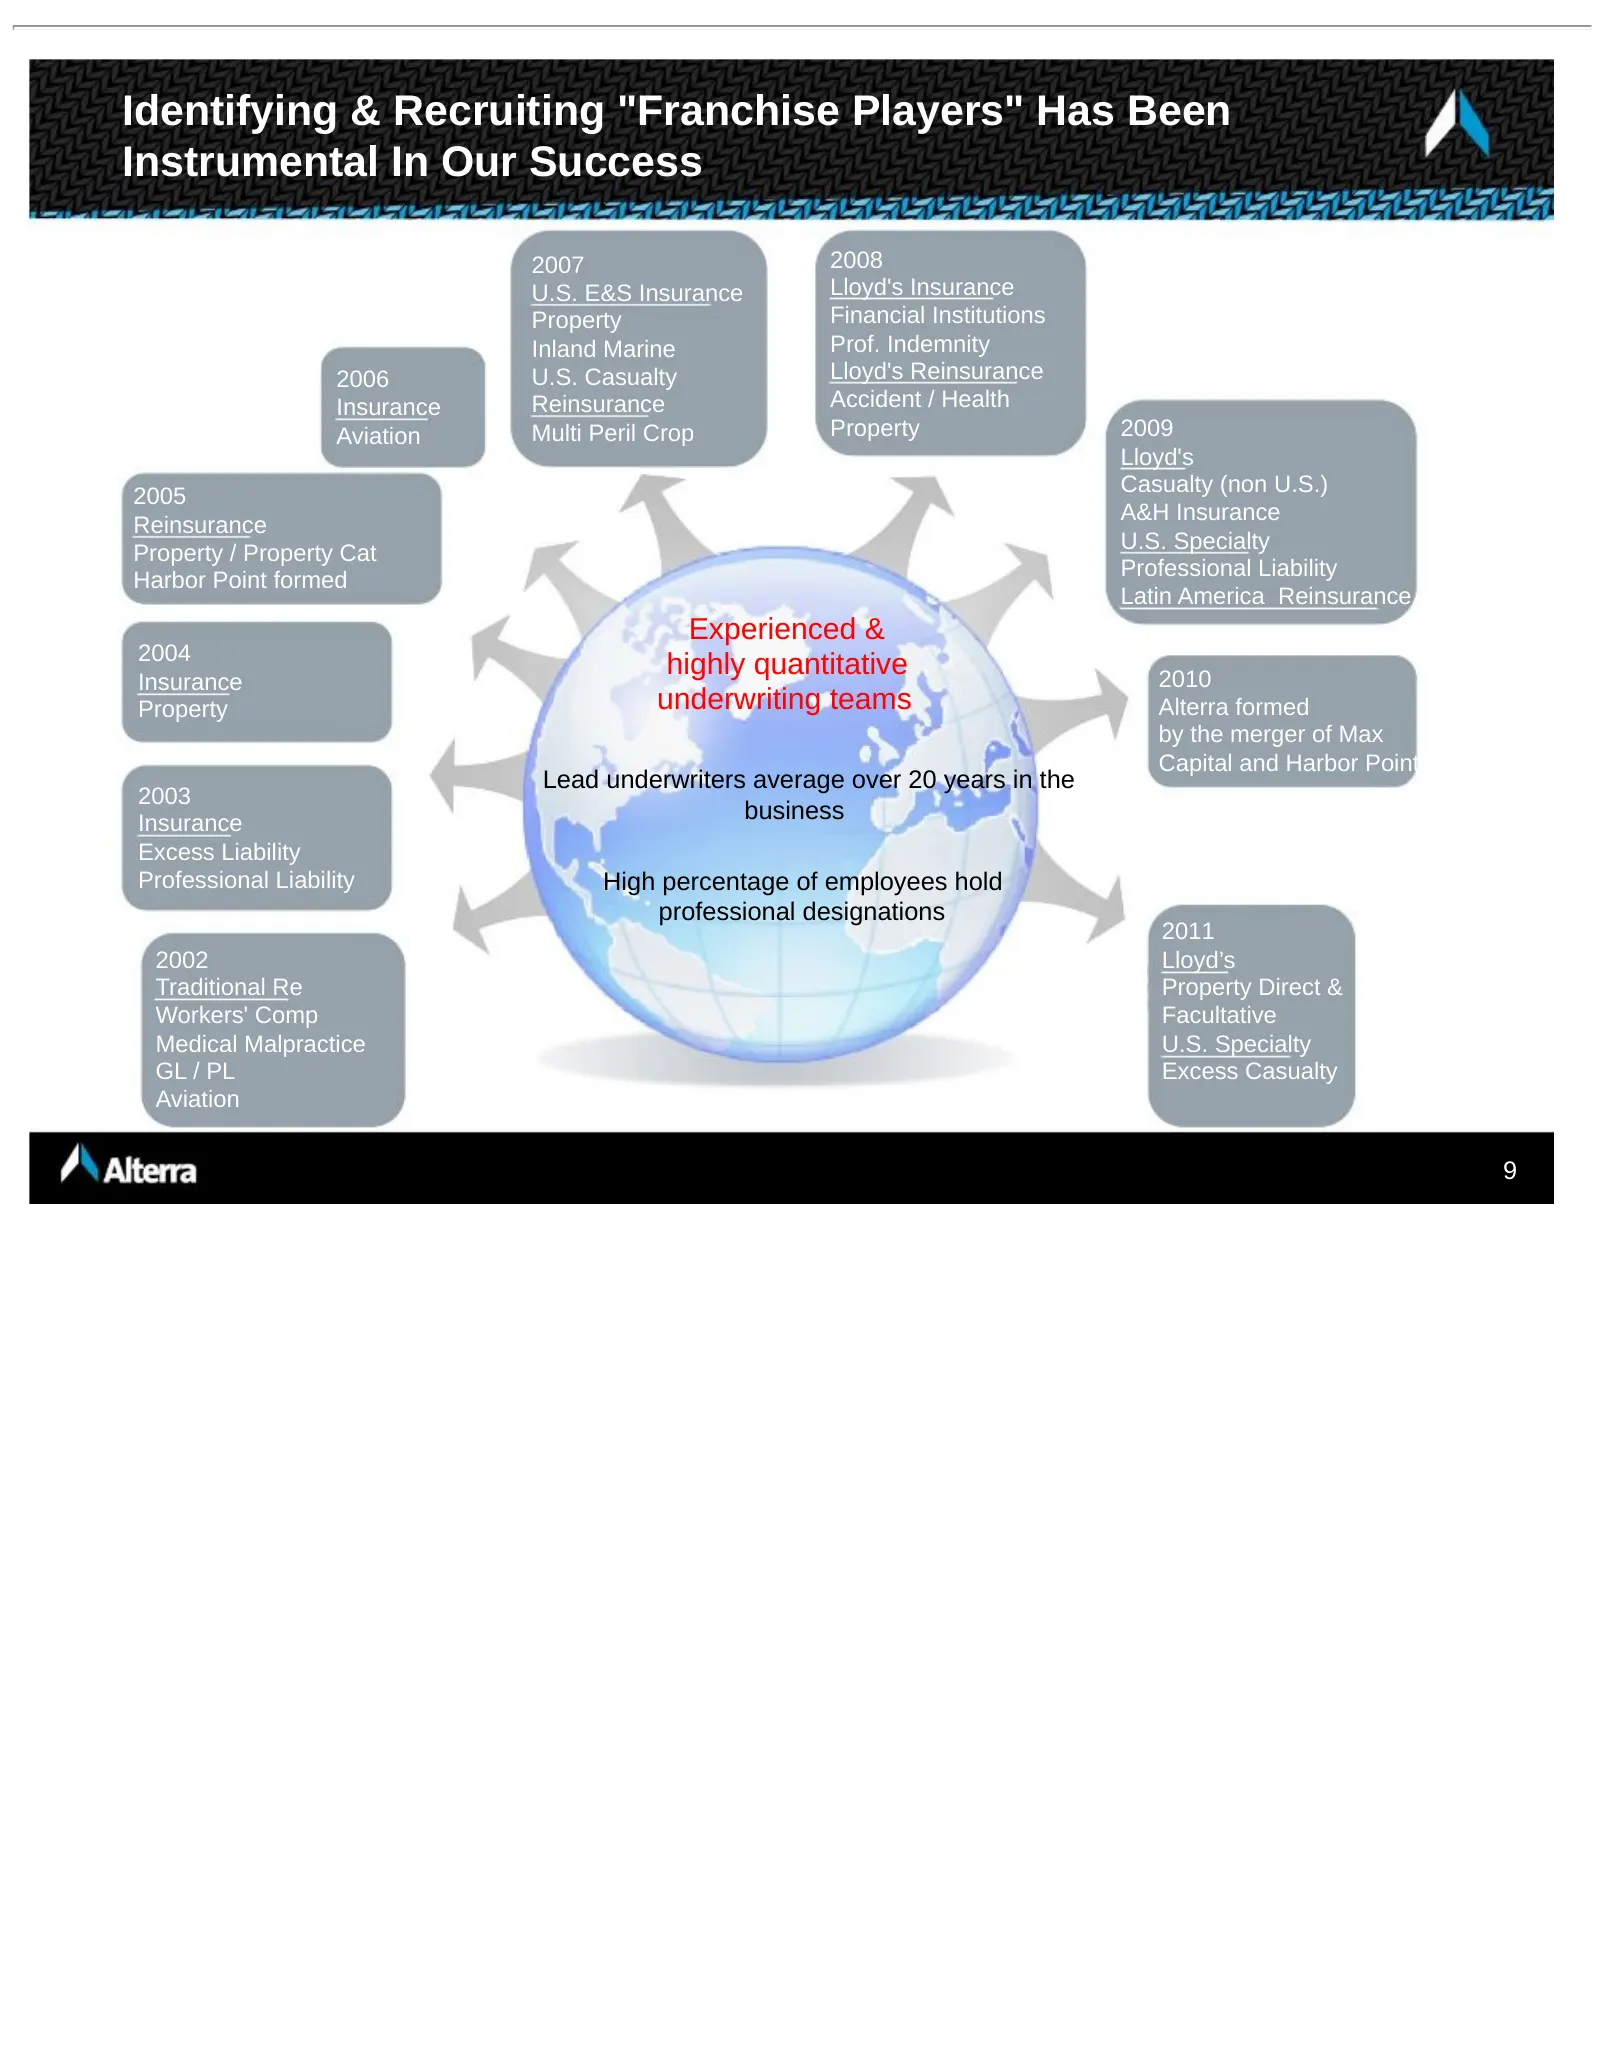
Slide 9: Identifying & Recruiting "Franchise Players" Has Been Instrumental In Our Success
Identifying & Recruiting "Franchise Players" Has Been Instrumental In Our Success 2007 2008 U.S. E&S Insurance Lloyd's Insurance Property Financial Institutions Inland Marine Prof. Indemnity 2006 U.S. Casualty Lloyd's Reinsurance Insurance Reinsurance Accident / Health Aviation Multi Peril Crop Prop
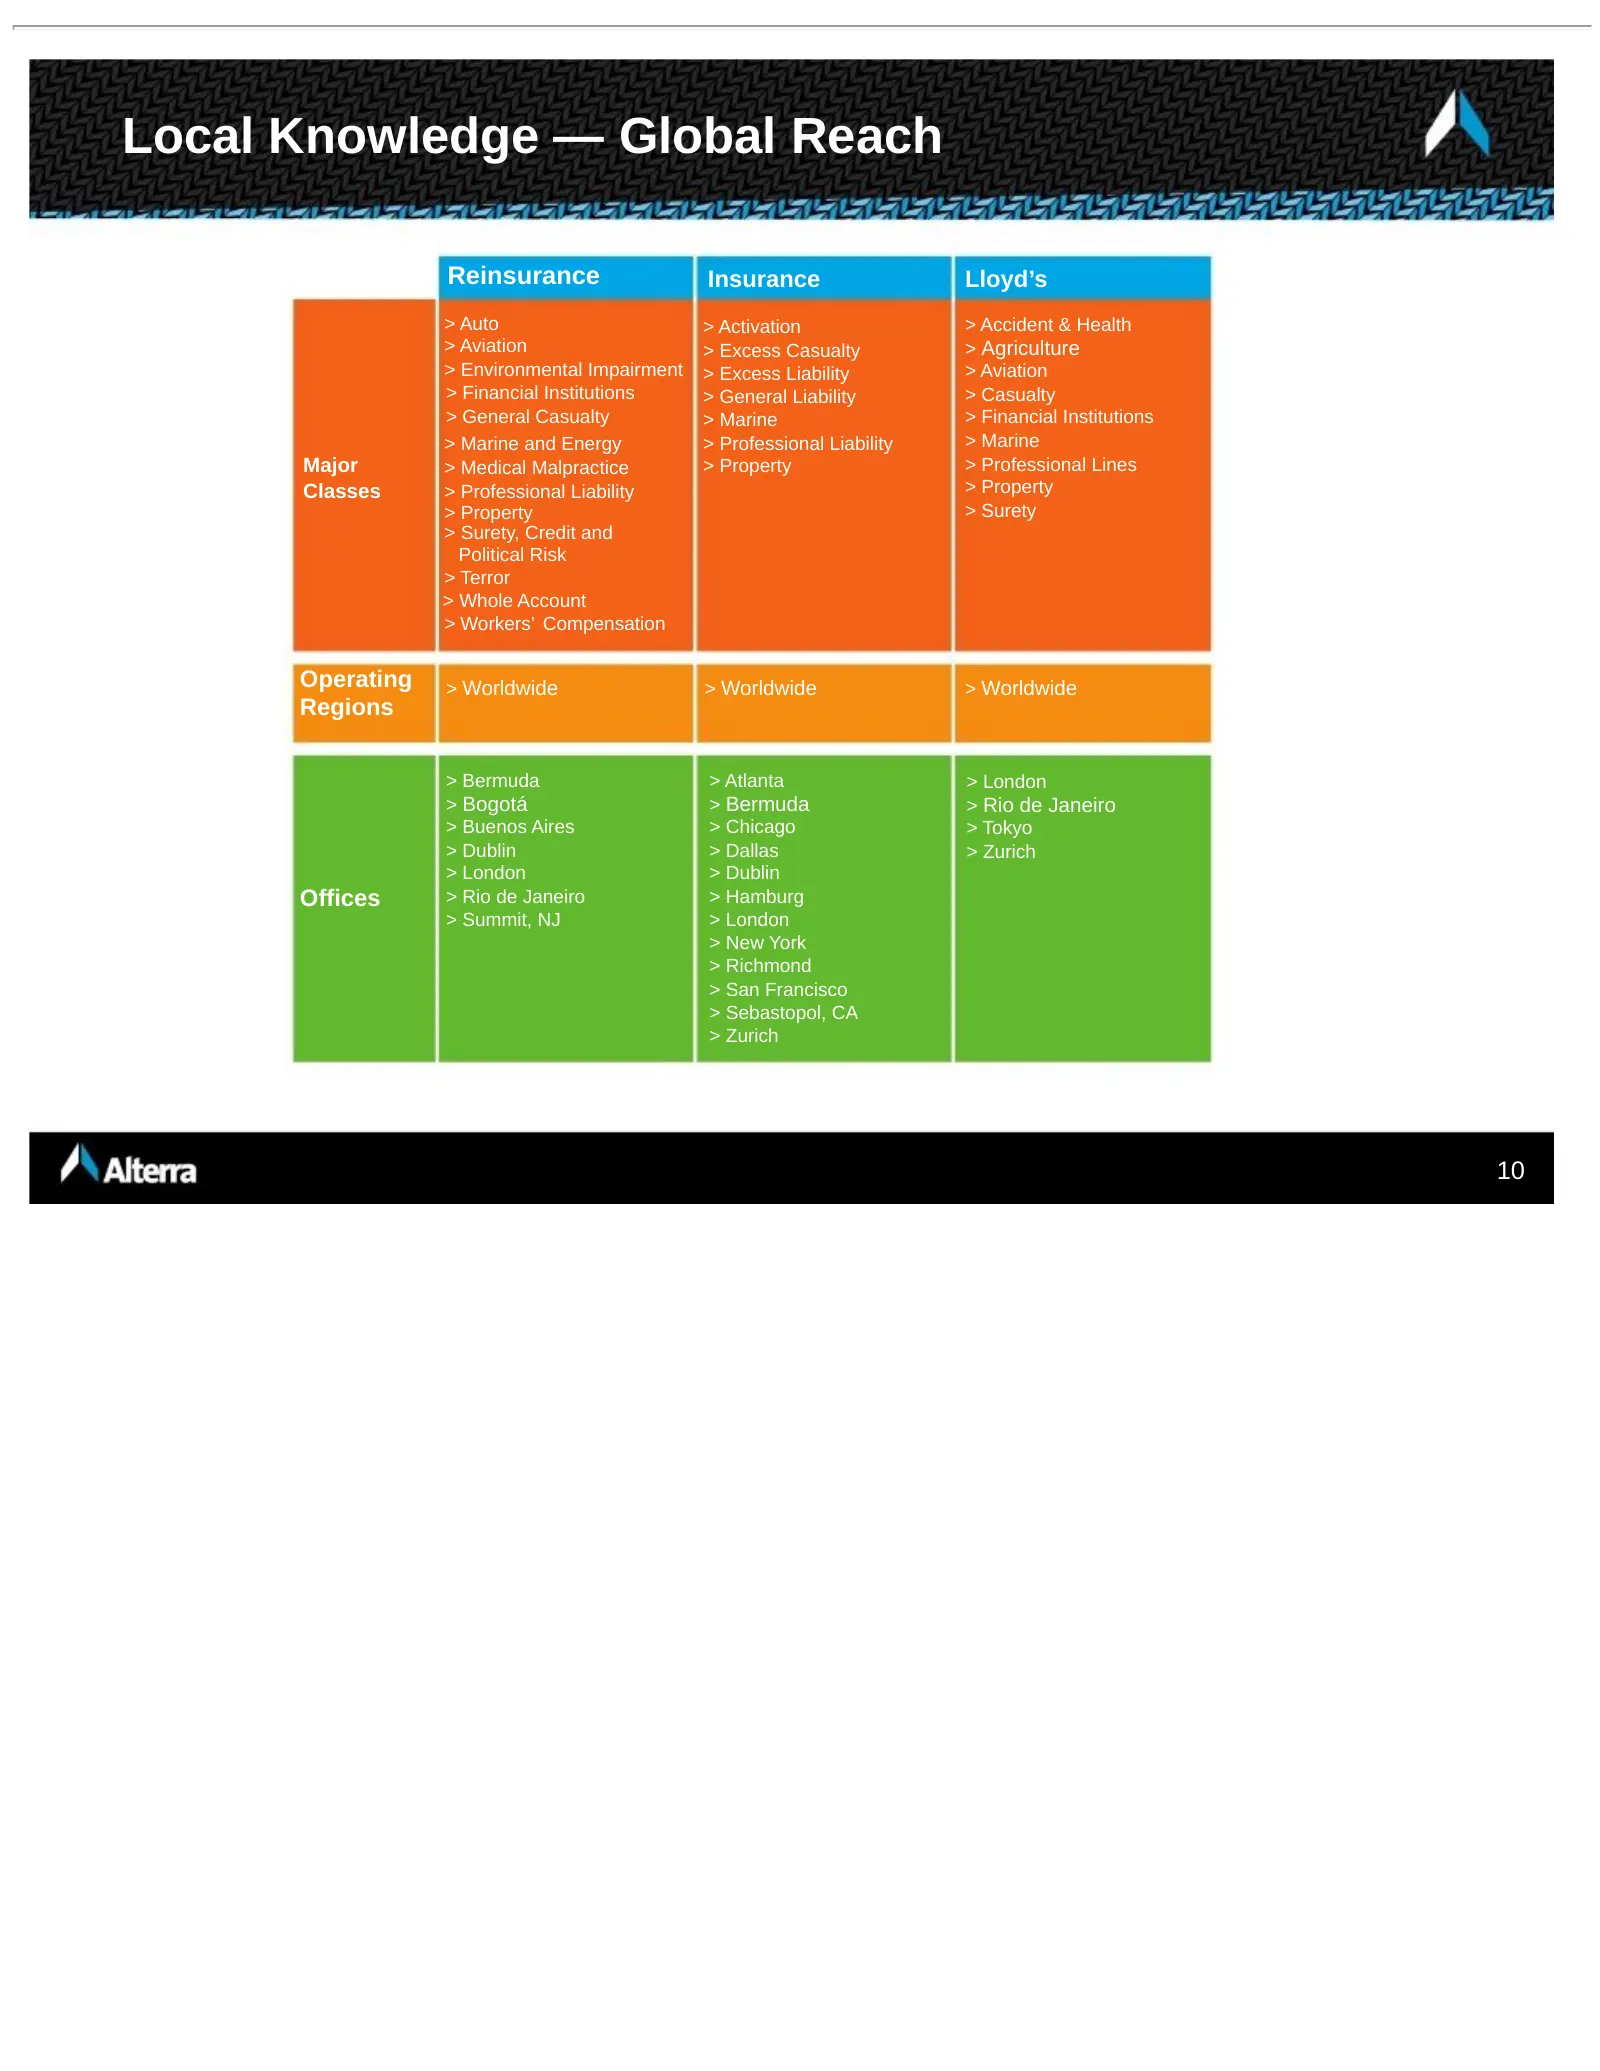
Slide 10: Local Knowledge — Global Reach
Local Knowledge — Global Reach Reinsurance Insurance Lloyd’s > Auto > Activation > Accident & Health > Aviation > Excess Casualty > Agriculture > Environmental Impairment > Excess Liability > Aviation > Financial Institutions > General Liability > Casualty > General Casualty > Marine > Financial Ins
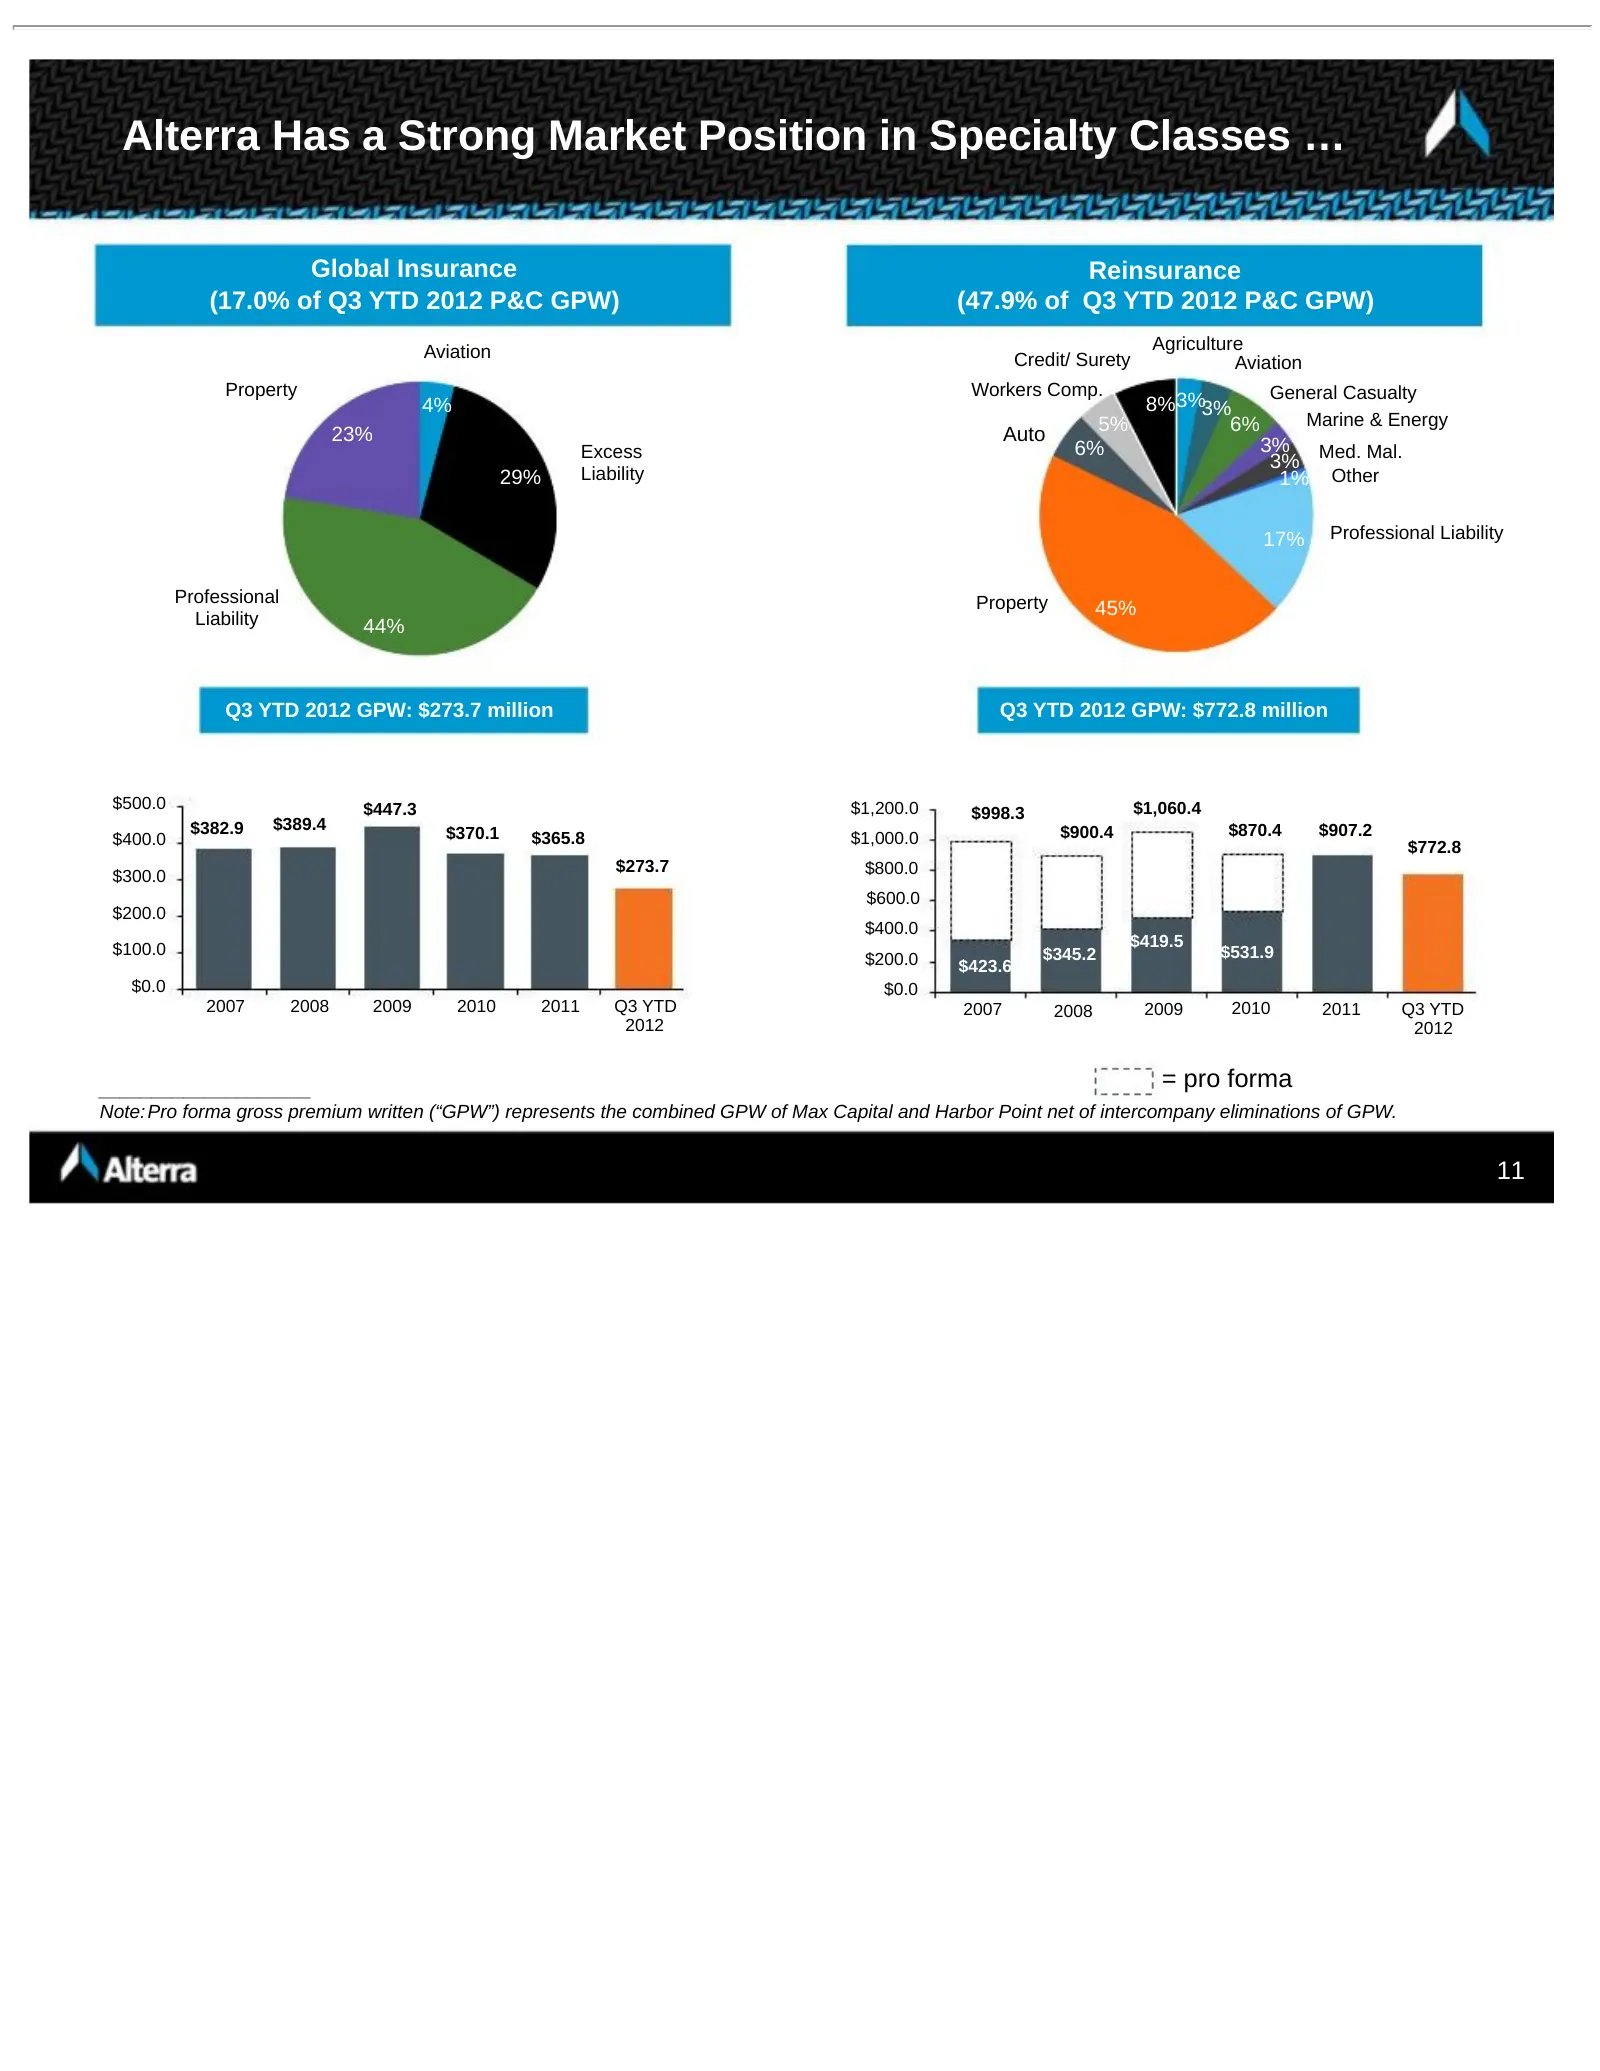
Slide 11: Alterra Has a Strong Market Position in Specialty Classes
Alterra Has a Strong Market Position in Specialty Classes … Global Insurance Reinsurance (17.0% of Q3 YTD 2012 P&C GPW) (47.9% of Q3 YTD 2012 P&C GPW) Aviation Agriculture Credit/ Surety Aviation Property Workers Comp. General Casualty 4% 8%3%3% 5% 6% Marine & Energy 23% Auto Excess 6% 3% Med. Mal.
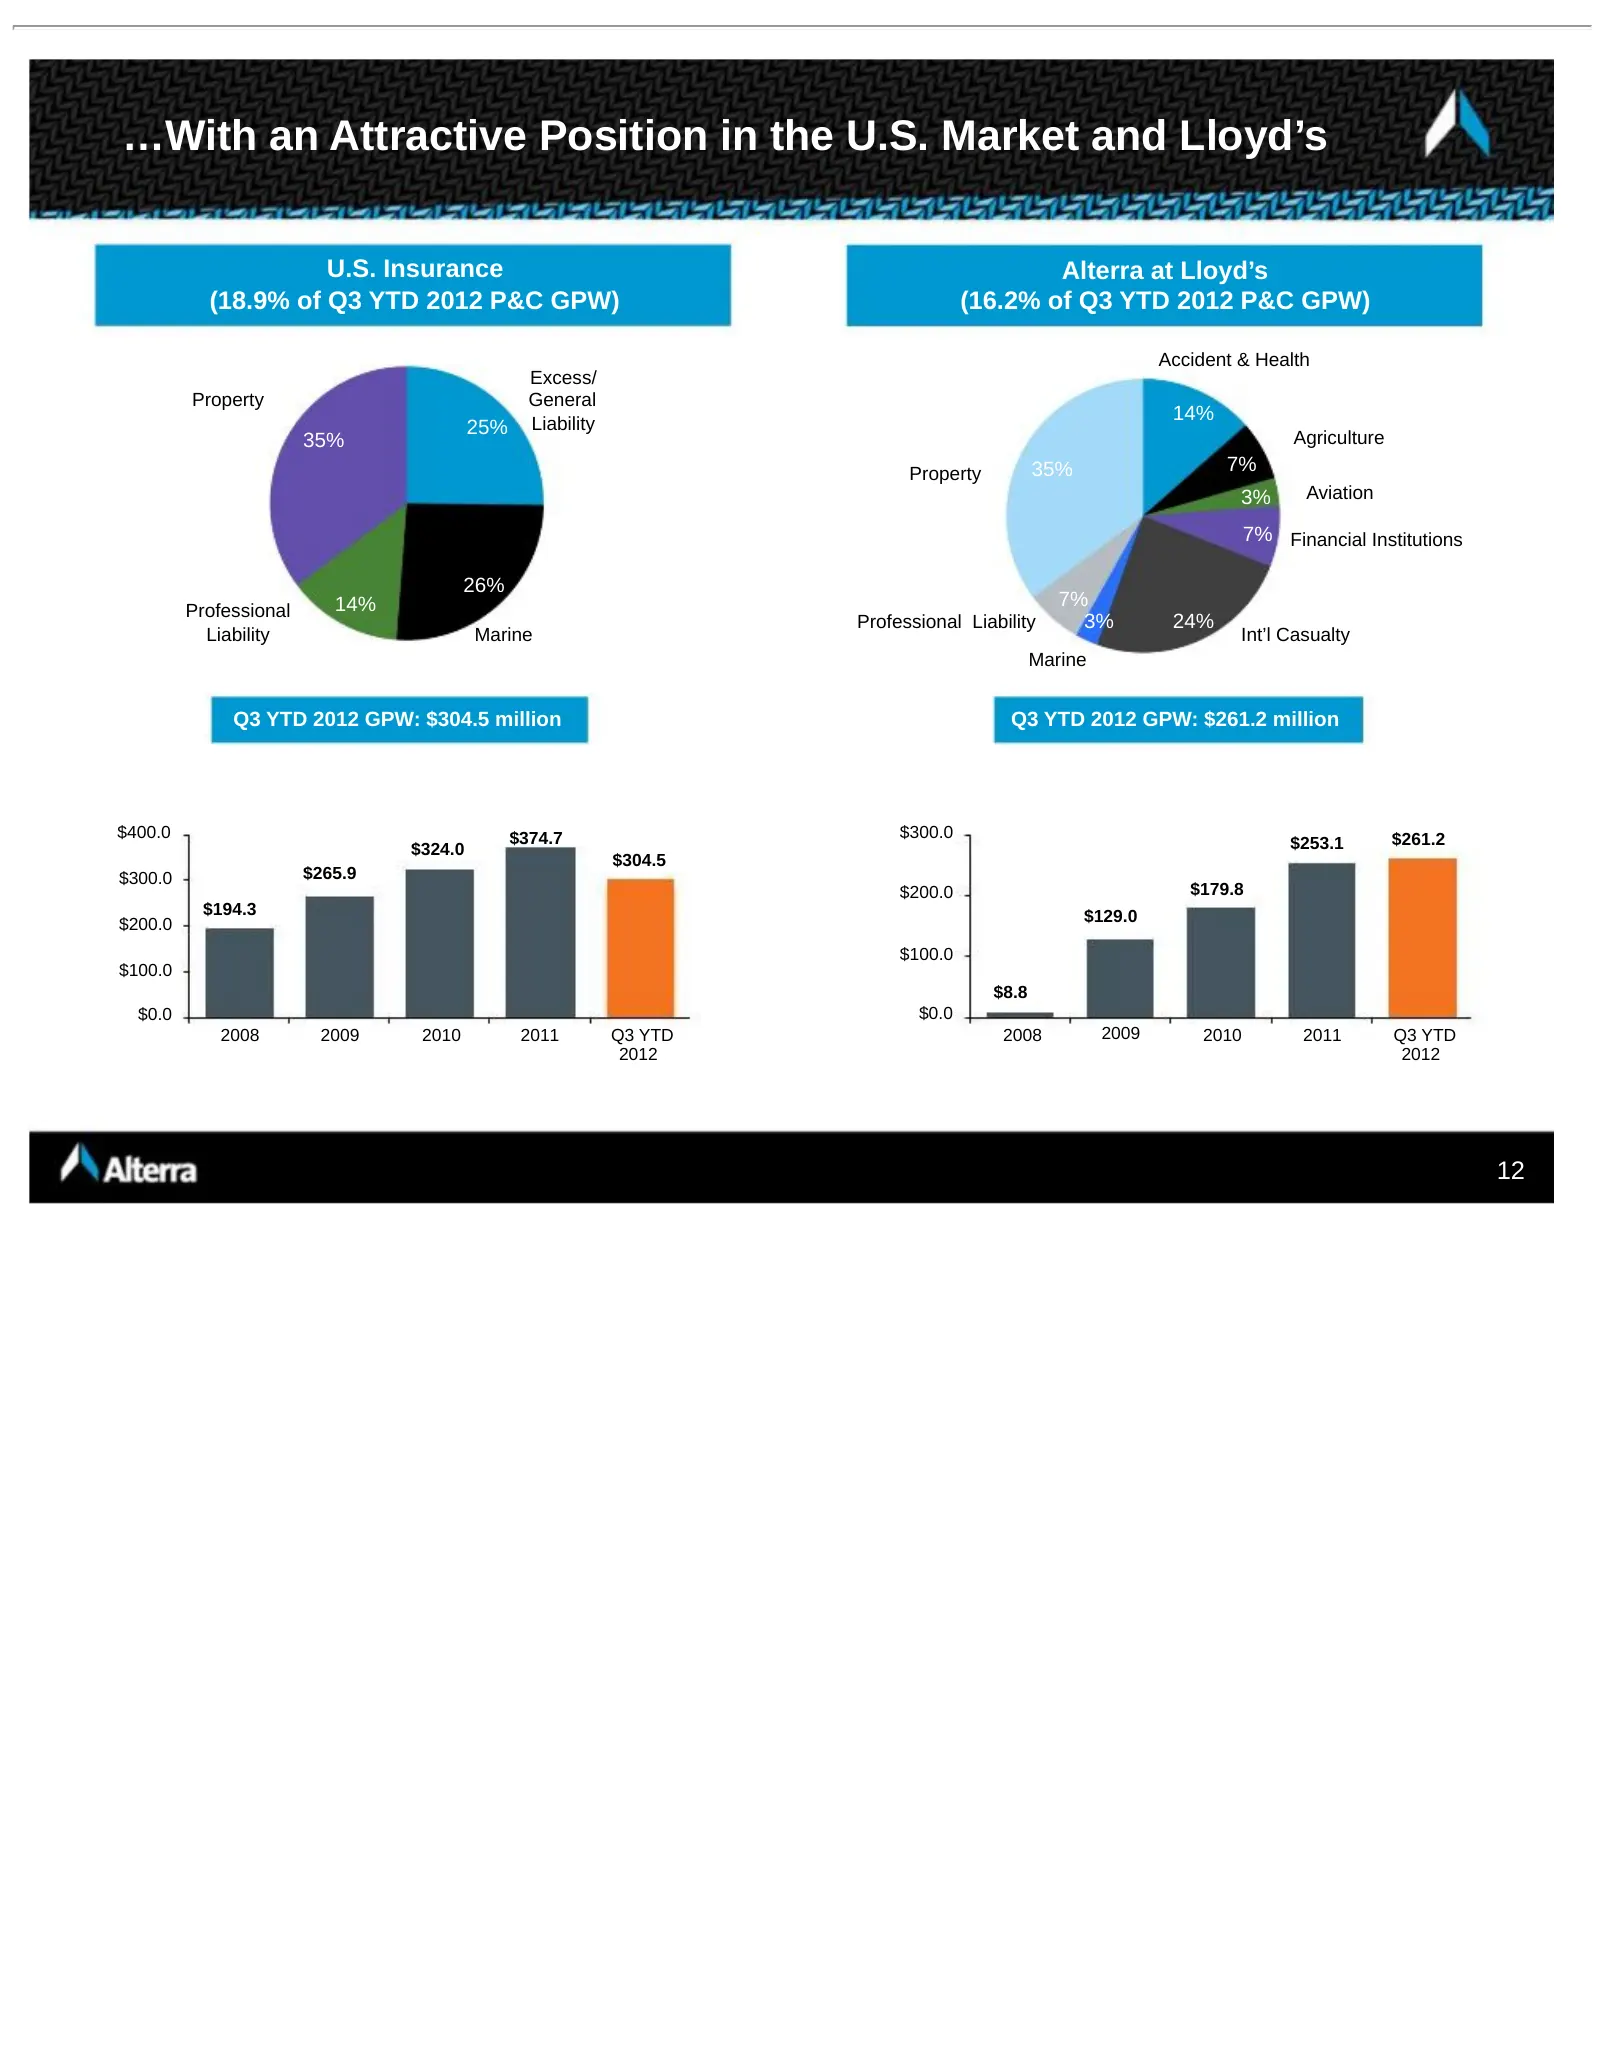
Slide 12: With an Attractive Position in the U.S. Market and Lloyd's
…With an Attractive Position in the U.S. Market and Lloyd’s U.S. Insurance Alterra at Lloyd’s (18.9% of Q3 YTD 2012 P&C GPW) (16.2% of Q3 YTD 2012 P&C GPW) Accident & Health Excess/ Property General Liability 14% 25% Agriculture 35% Property 35% 7% 3% Aviation 7% Financial Institutions 26% 14% 7% Pr
Slide 13: Diversified and Balanced Business Mix
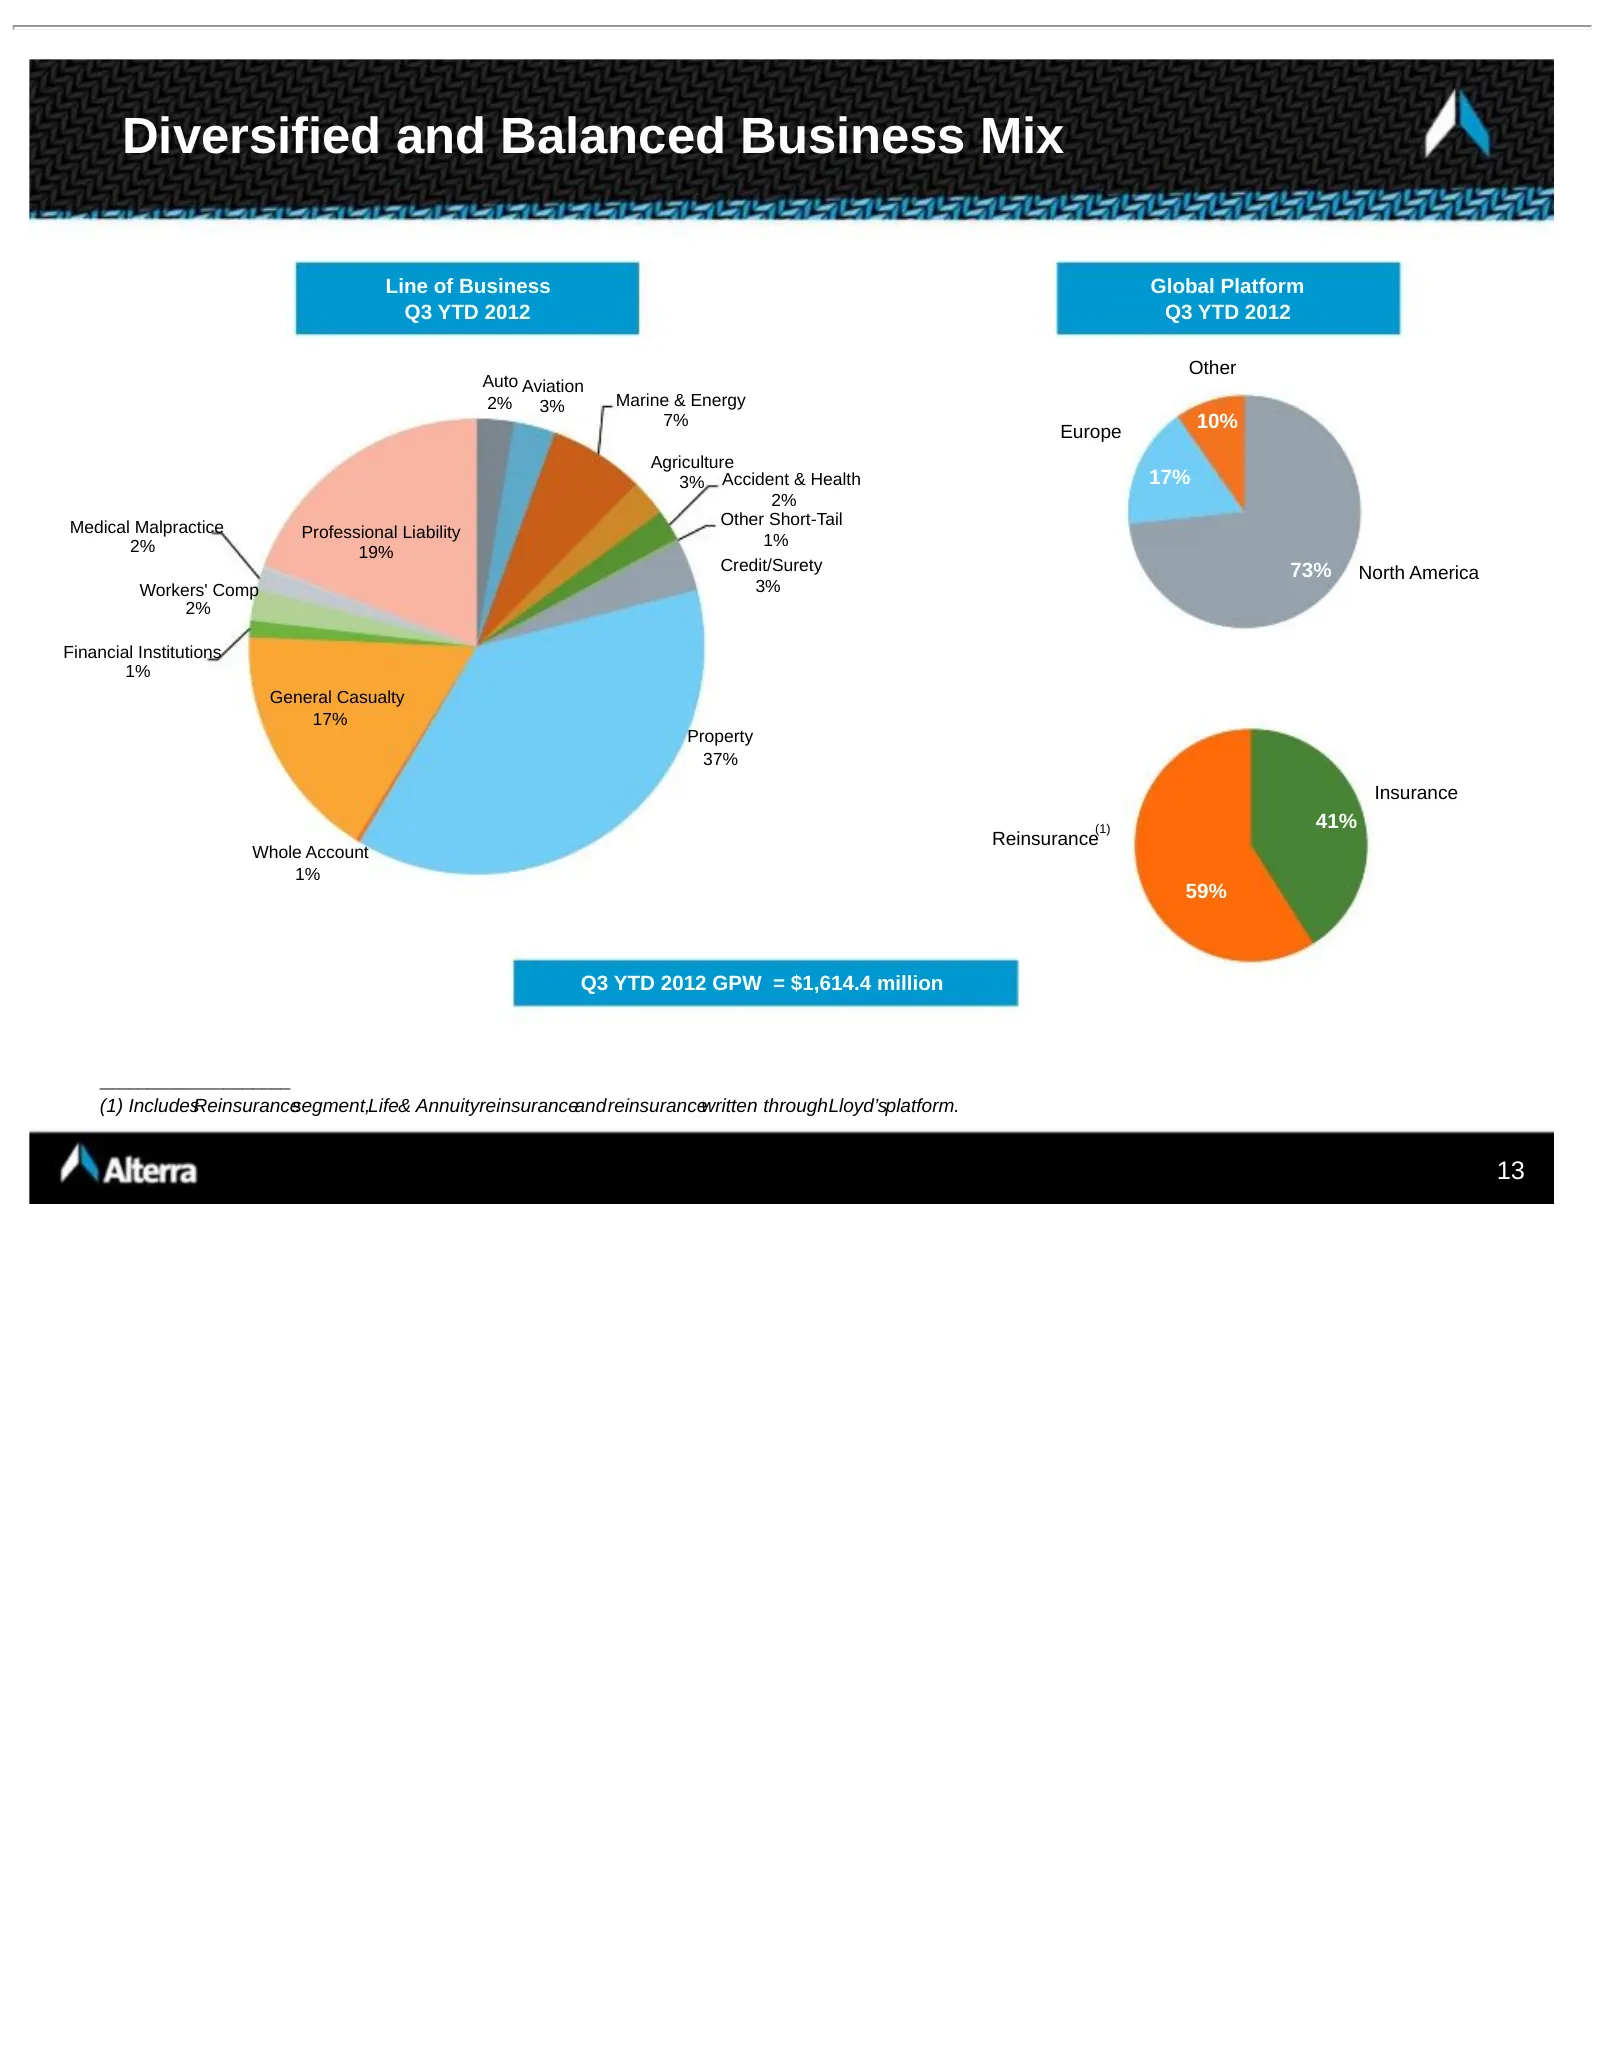
Diversified and Balanced Business Mix Line of Business Global Platform Q3 YTD 2012 Q3 YTD 2012 Other Auto Aviation 2% 3% Marine & Energy 7% Europe 10% Agriculture 3% Accident & Health 17% 2% Medical Malpractice Other Short-Tail Professional Liability 1% 2% 19% Credit/Surety 73% North America Workers
Slide 14: Diversified Platforms Generate More Consistent Margins
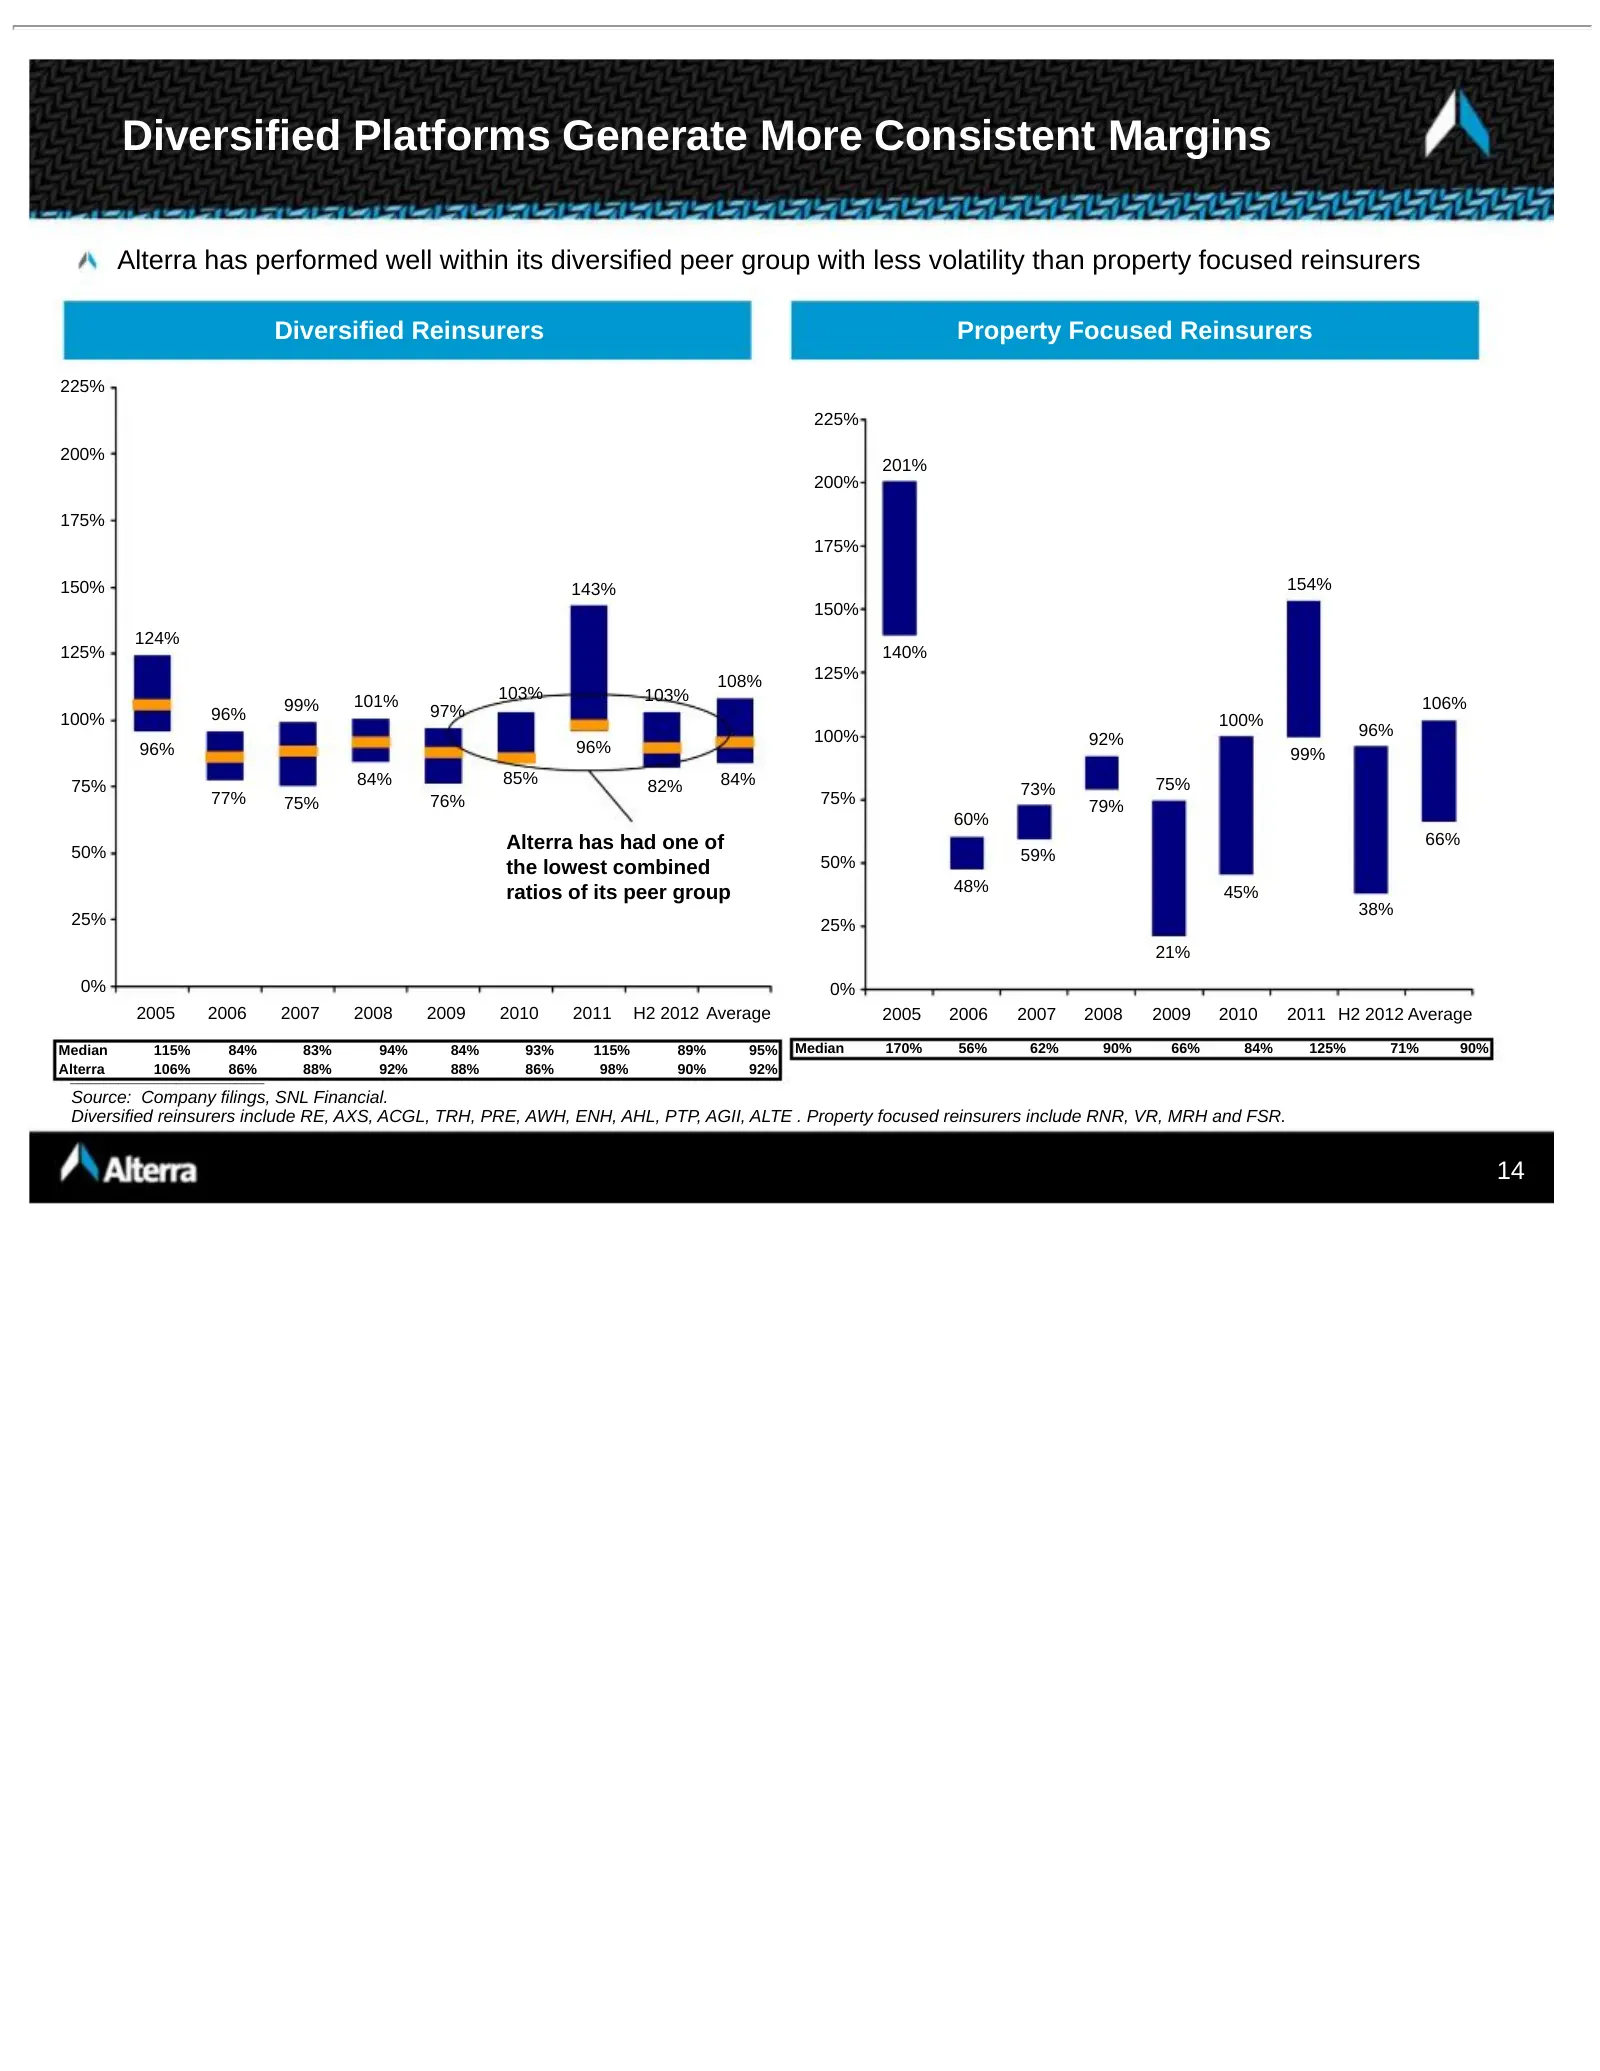
Diversified Platforms Generate More Consistent Margins Alterra has performed well within its diversified peer group with less volatility than property focused reinsurers Diversified Reinsurers Property Focused Reinsurers 225% 225% 200% 201% 200% 175% 175% 150% 143% 154% 150% 124% 125% 140% 108% 125%
Slide 15: 3 Year Return on Equity
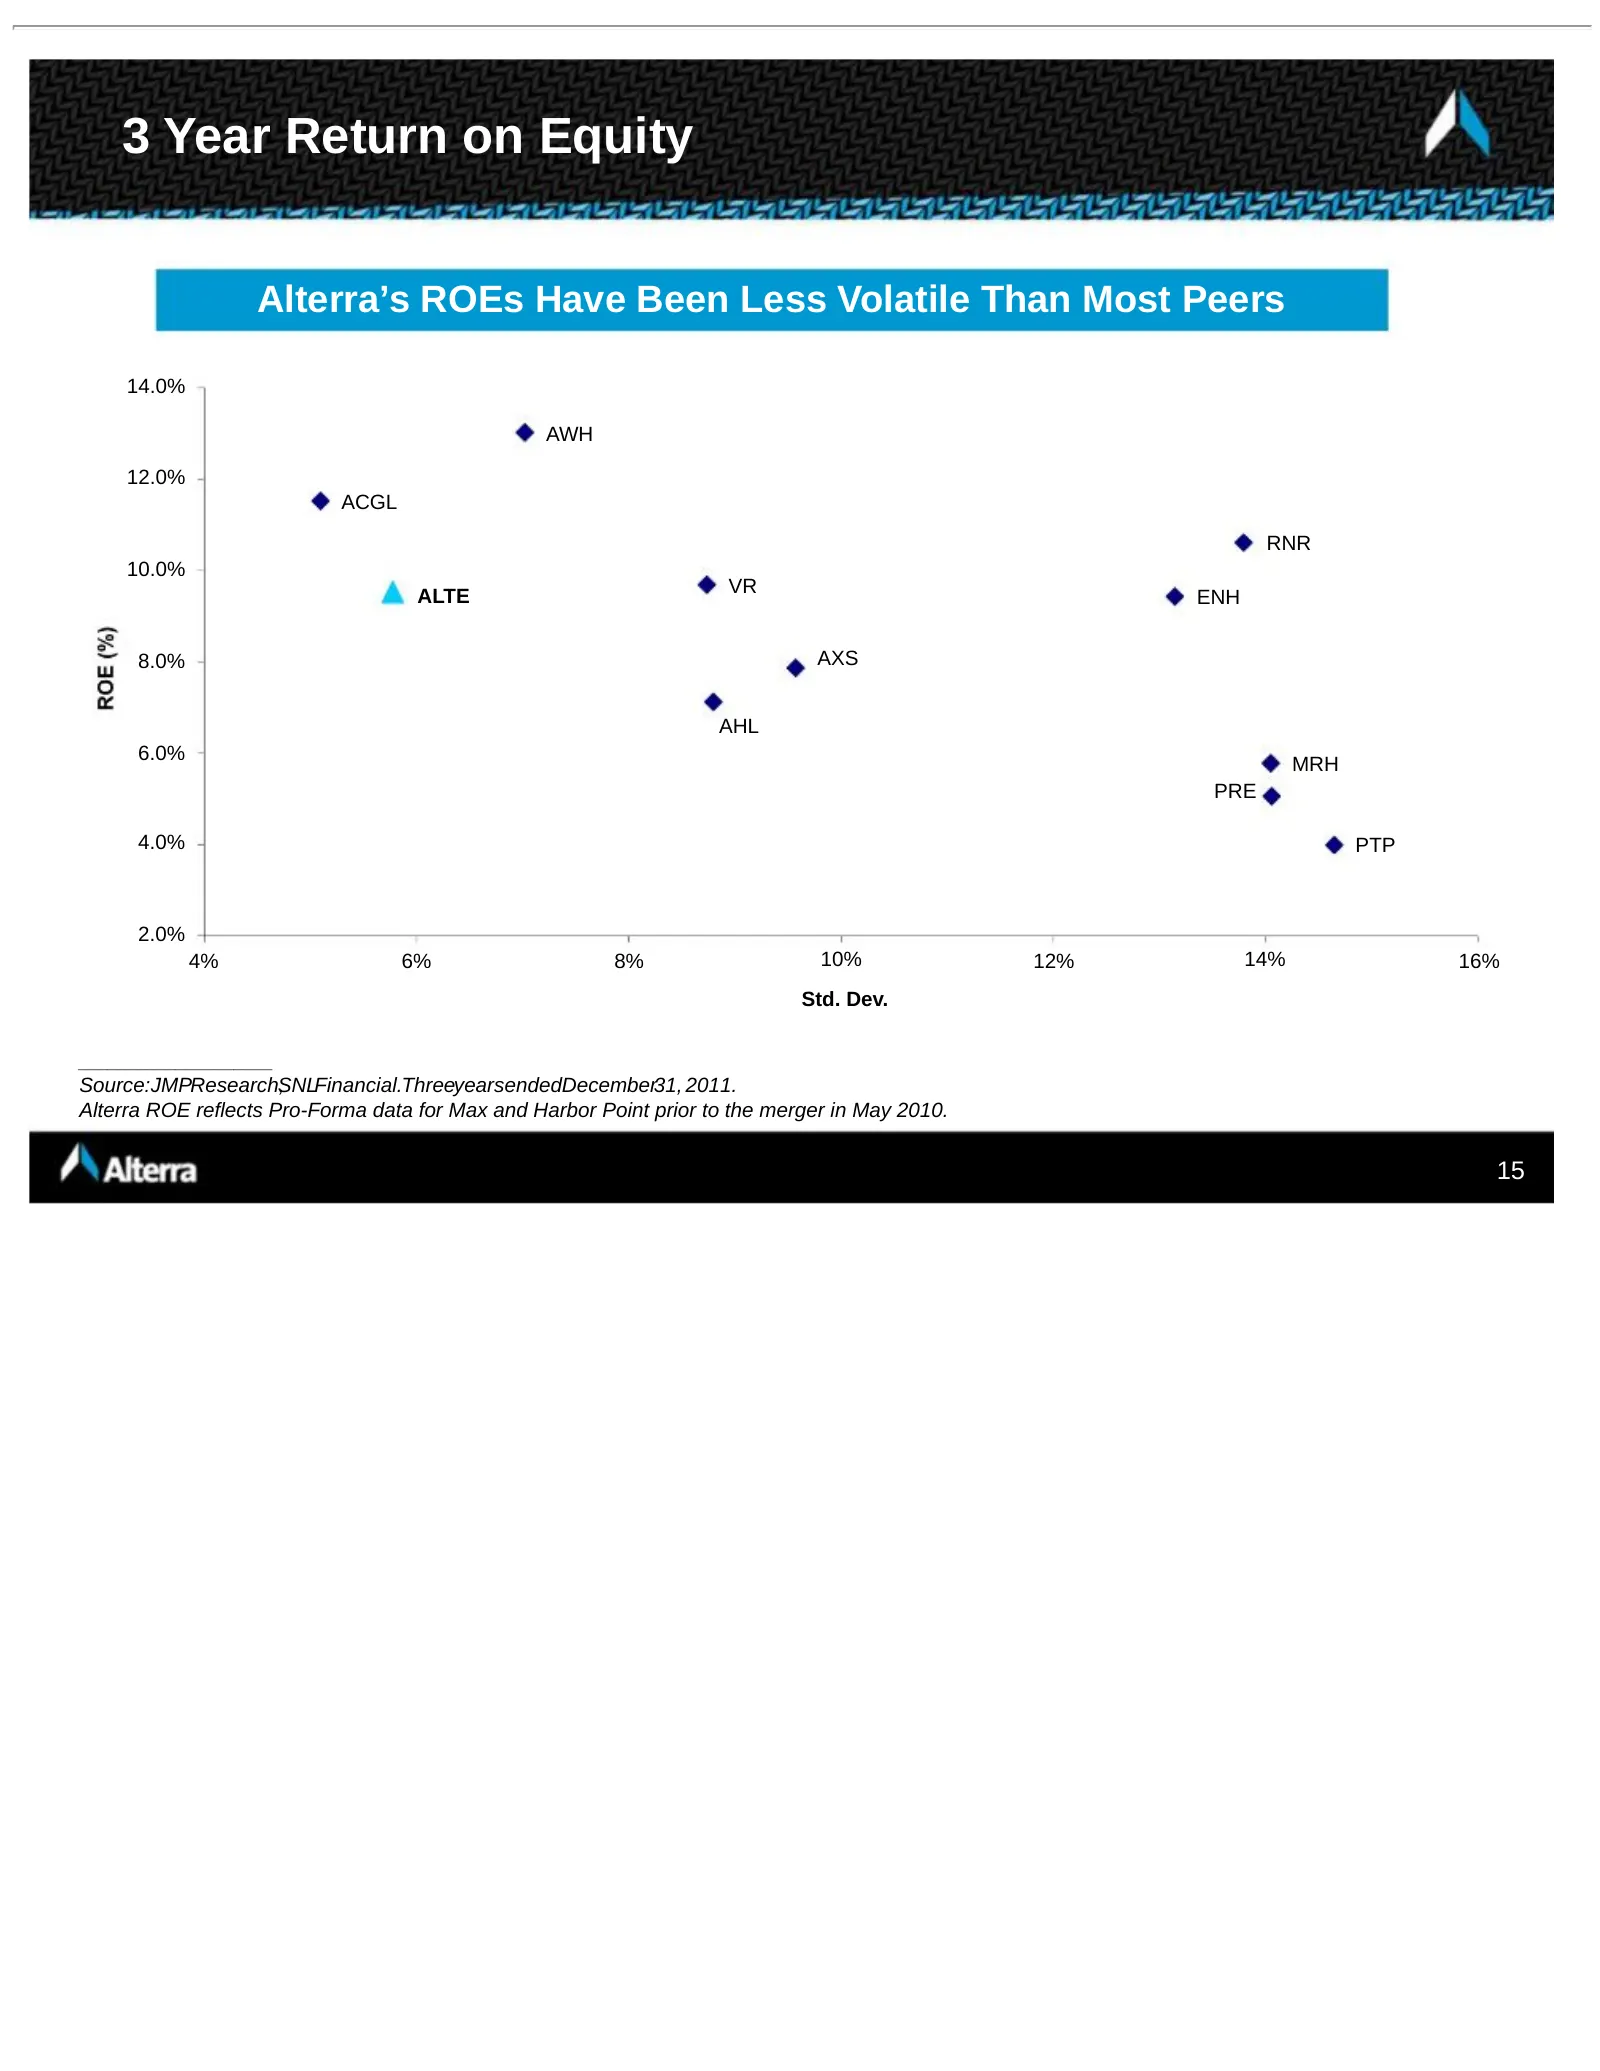
3 Year Return on Equity Alterra’s ROEs Have Been Less Volatile Than Most Peers 14.0% AWH 12.0% ACGL RNR 10.0% ALTE VR ENH 8.0% AXS AHL 6.0% MRH PRE 4.0% PTP 2.0% 4% 6% 8% 10% 12% 14% 16% Std. Dev. ____________________ Source:JMPResearch,SNLFinancial.ThreeyearsendedDecember31, 2011. Alterra ROE refle
Slide 16: Active Capital Management
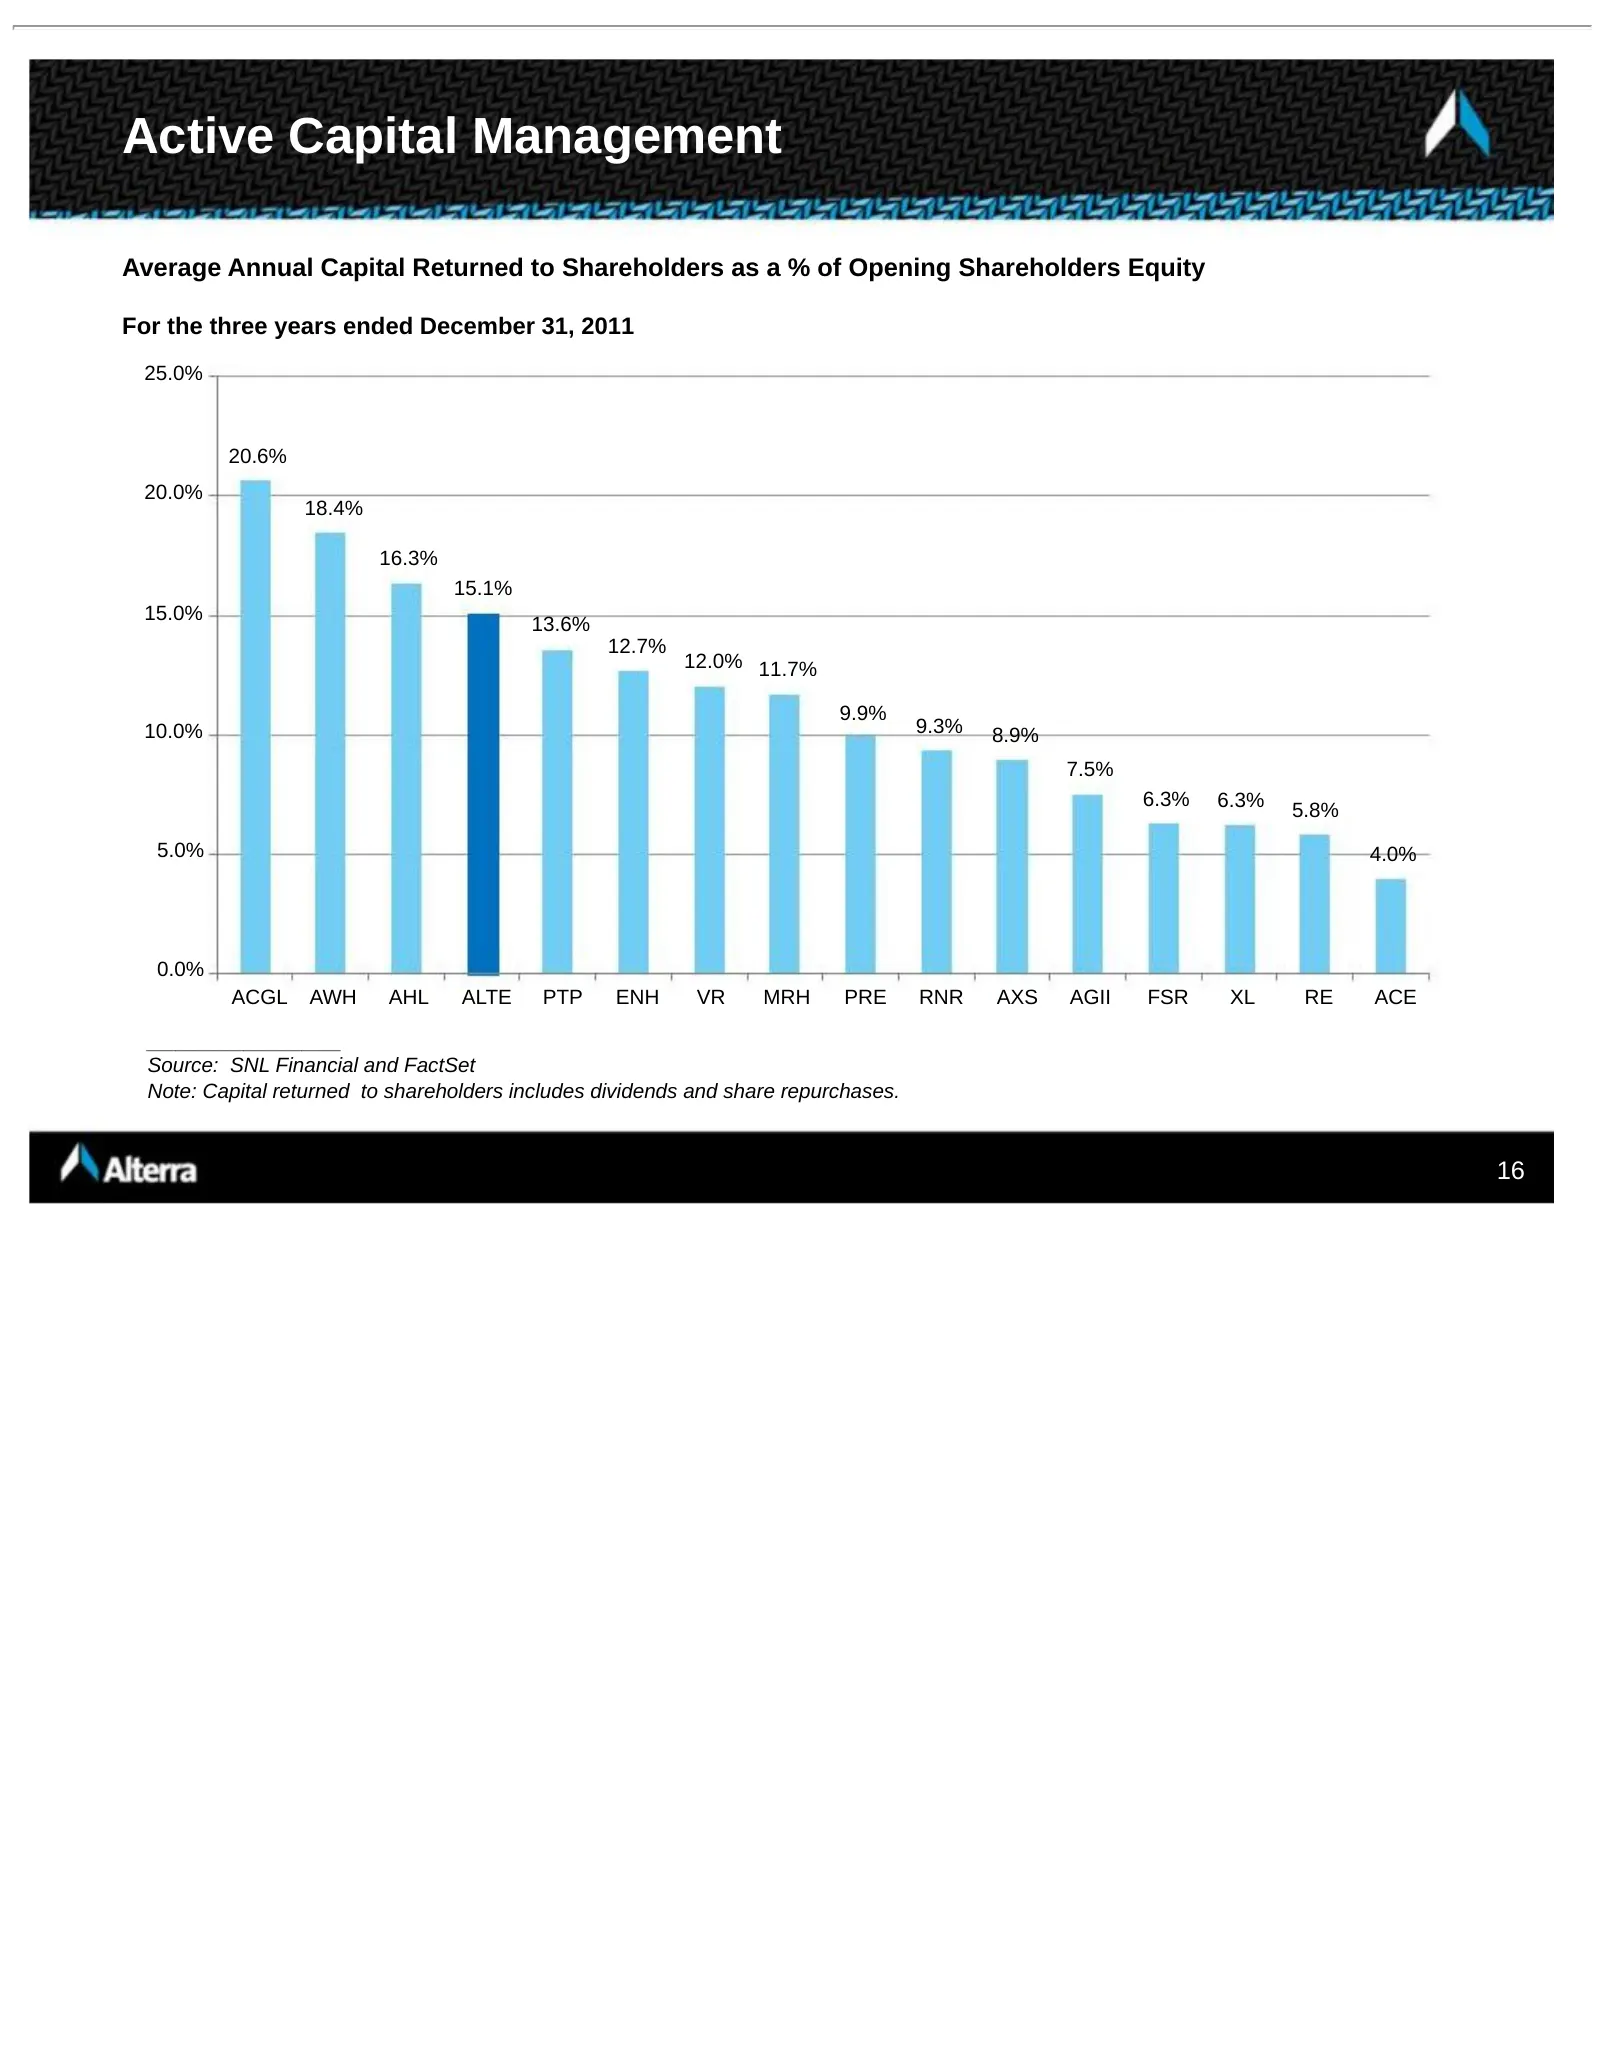
Active Capital Management Average Annual Capital Returned to Shareholders as a % of Opening Shareholders Equity For the three years ended December 31, 2011 25.0% 20.6% 20.0% 18.4% 16.3% 15.1% 15.0% 13.6% 12.7% 12.0% 11.7% 9.9% 10.0% 9.3% 8.9% 7.5% 6.3% 6.3% 5.8% 5.0% 4.0% 0.0% ACGL AWH AHL ALTE PTP
Slide 17: Superior Risk Management
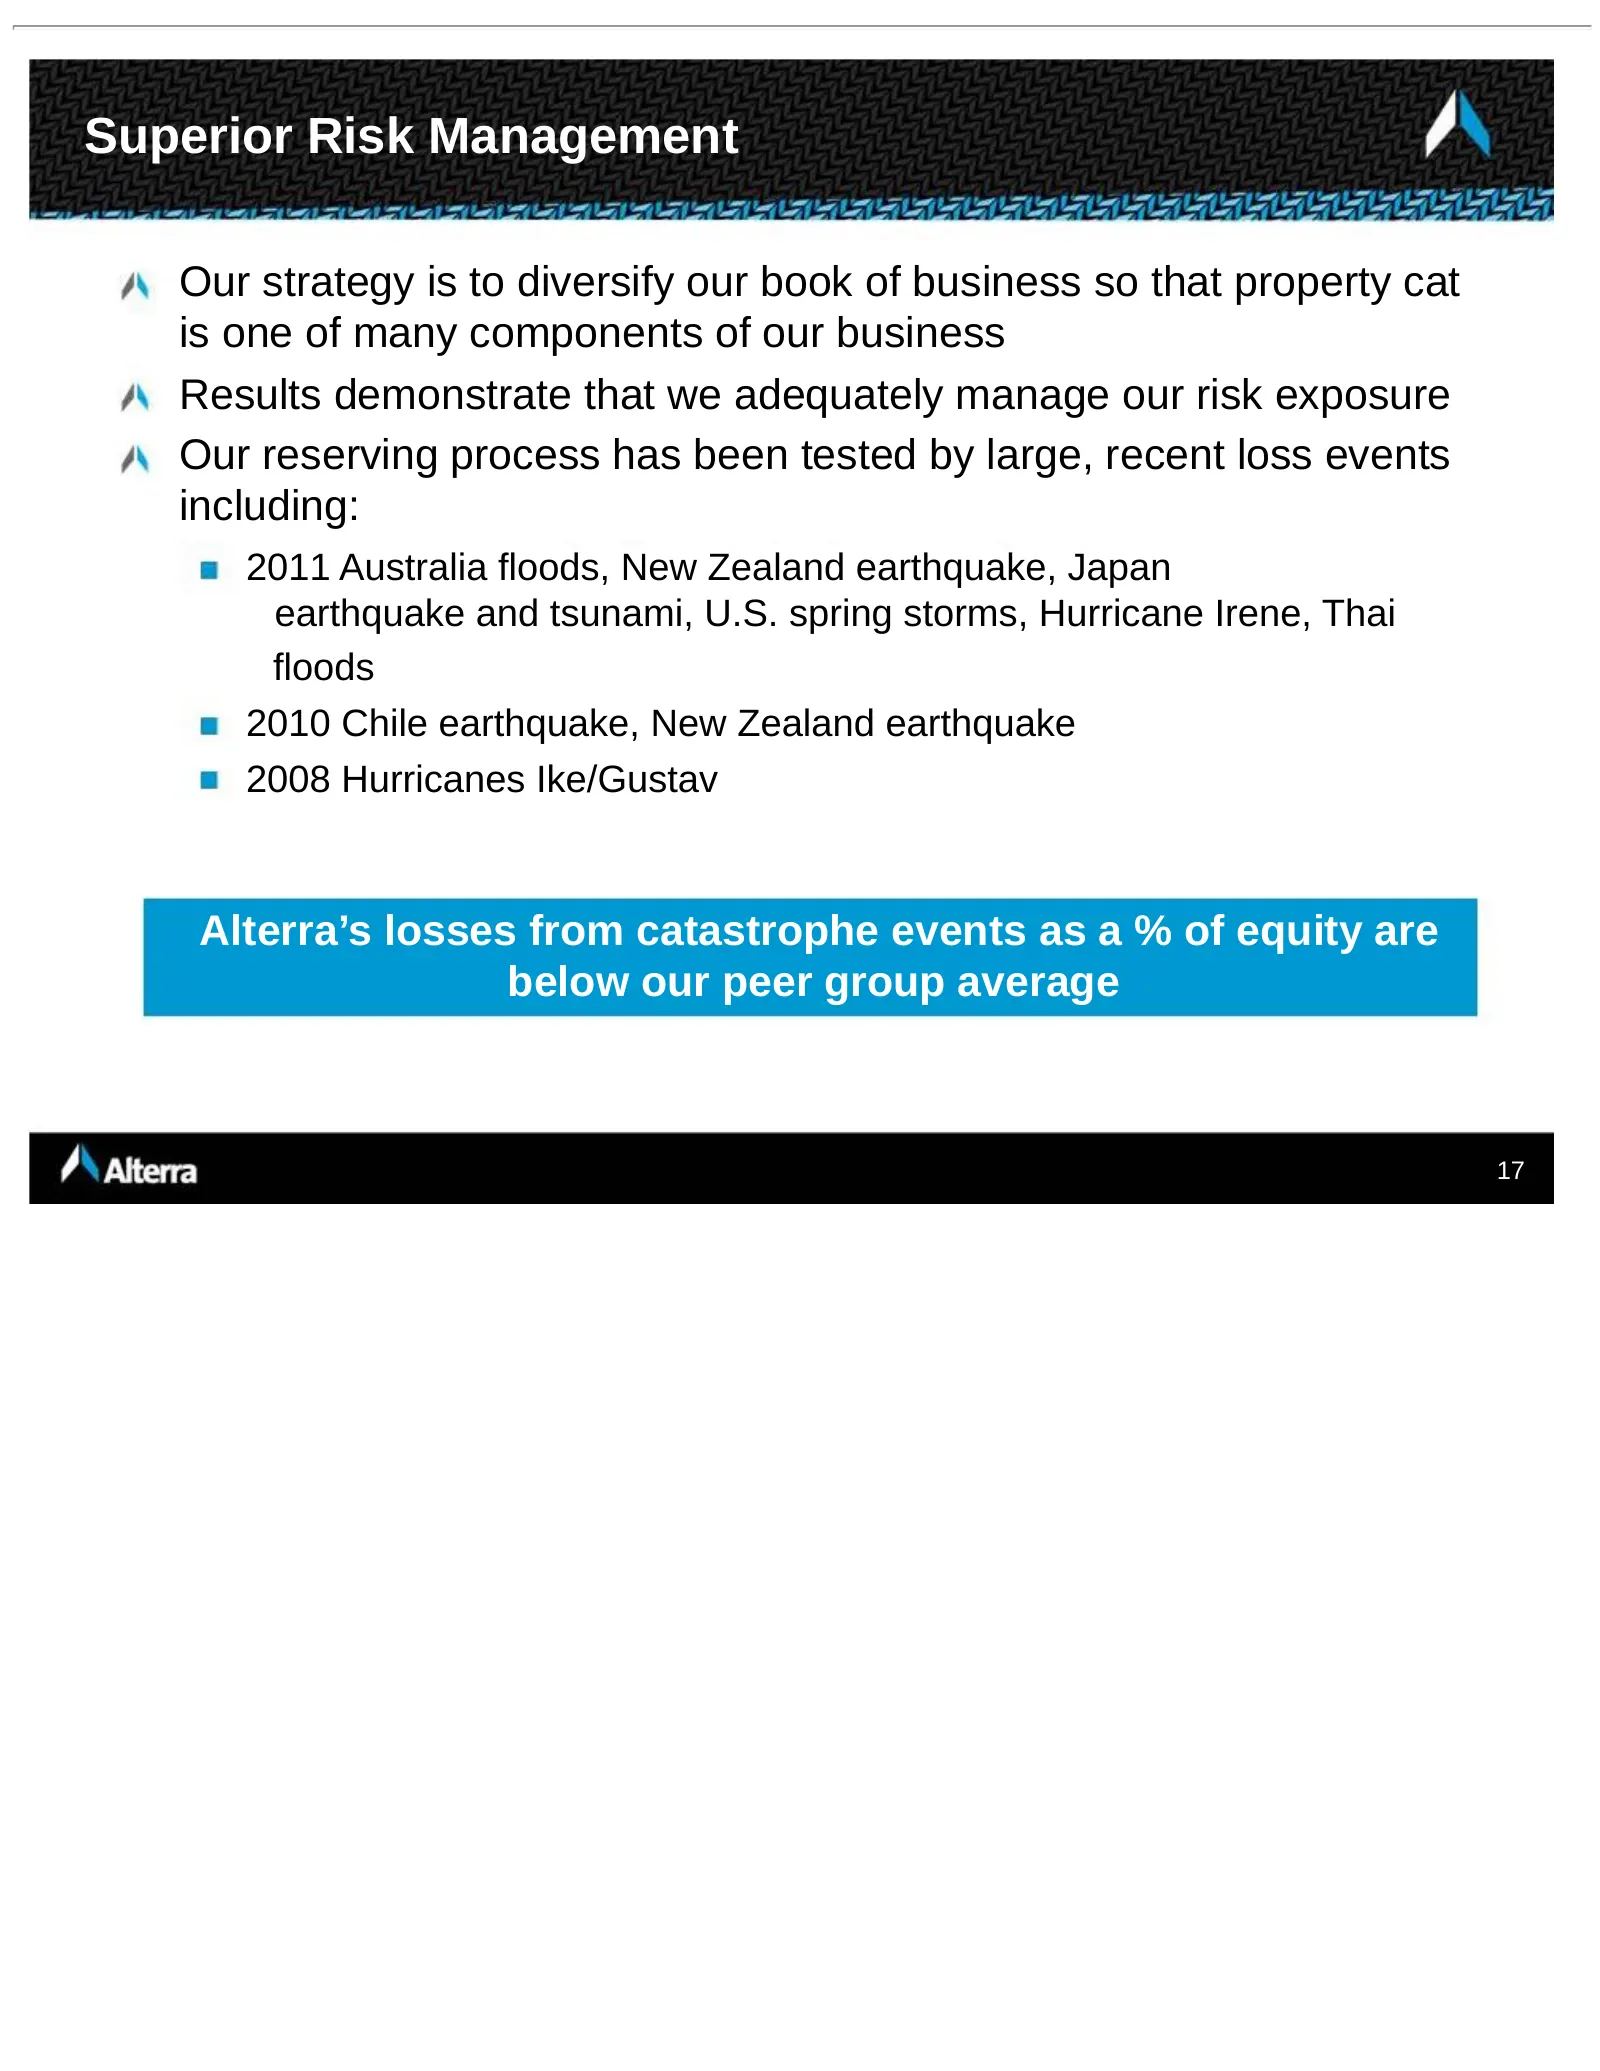
Superior Risk Management Our strategy is to diversify our book of business so that property cat is one of many components of our business Results demonstrate that we adequately manage our risk exposure Our reserving process has been tested by large, recent loss events including: 2011 Australia flood
Slide 18: Peer PML's as a Percent of Shareholder's Equity
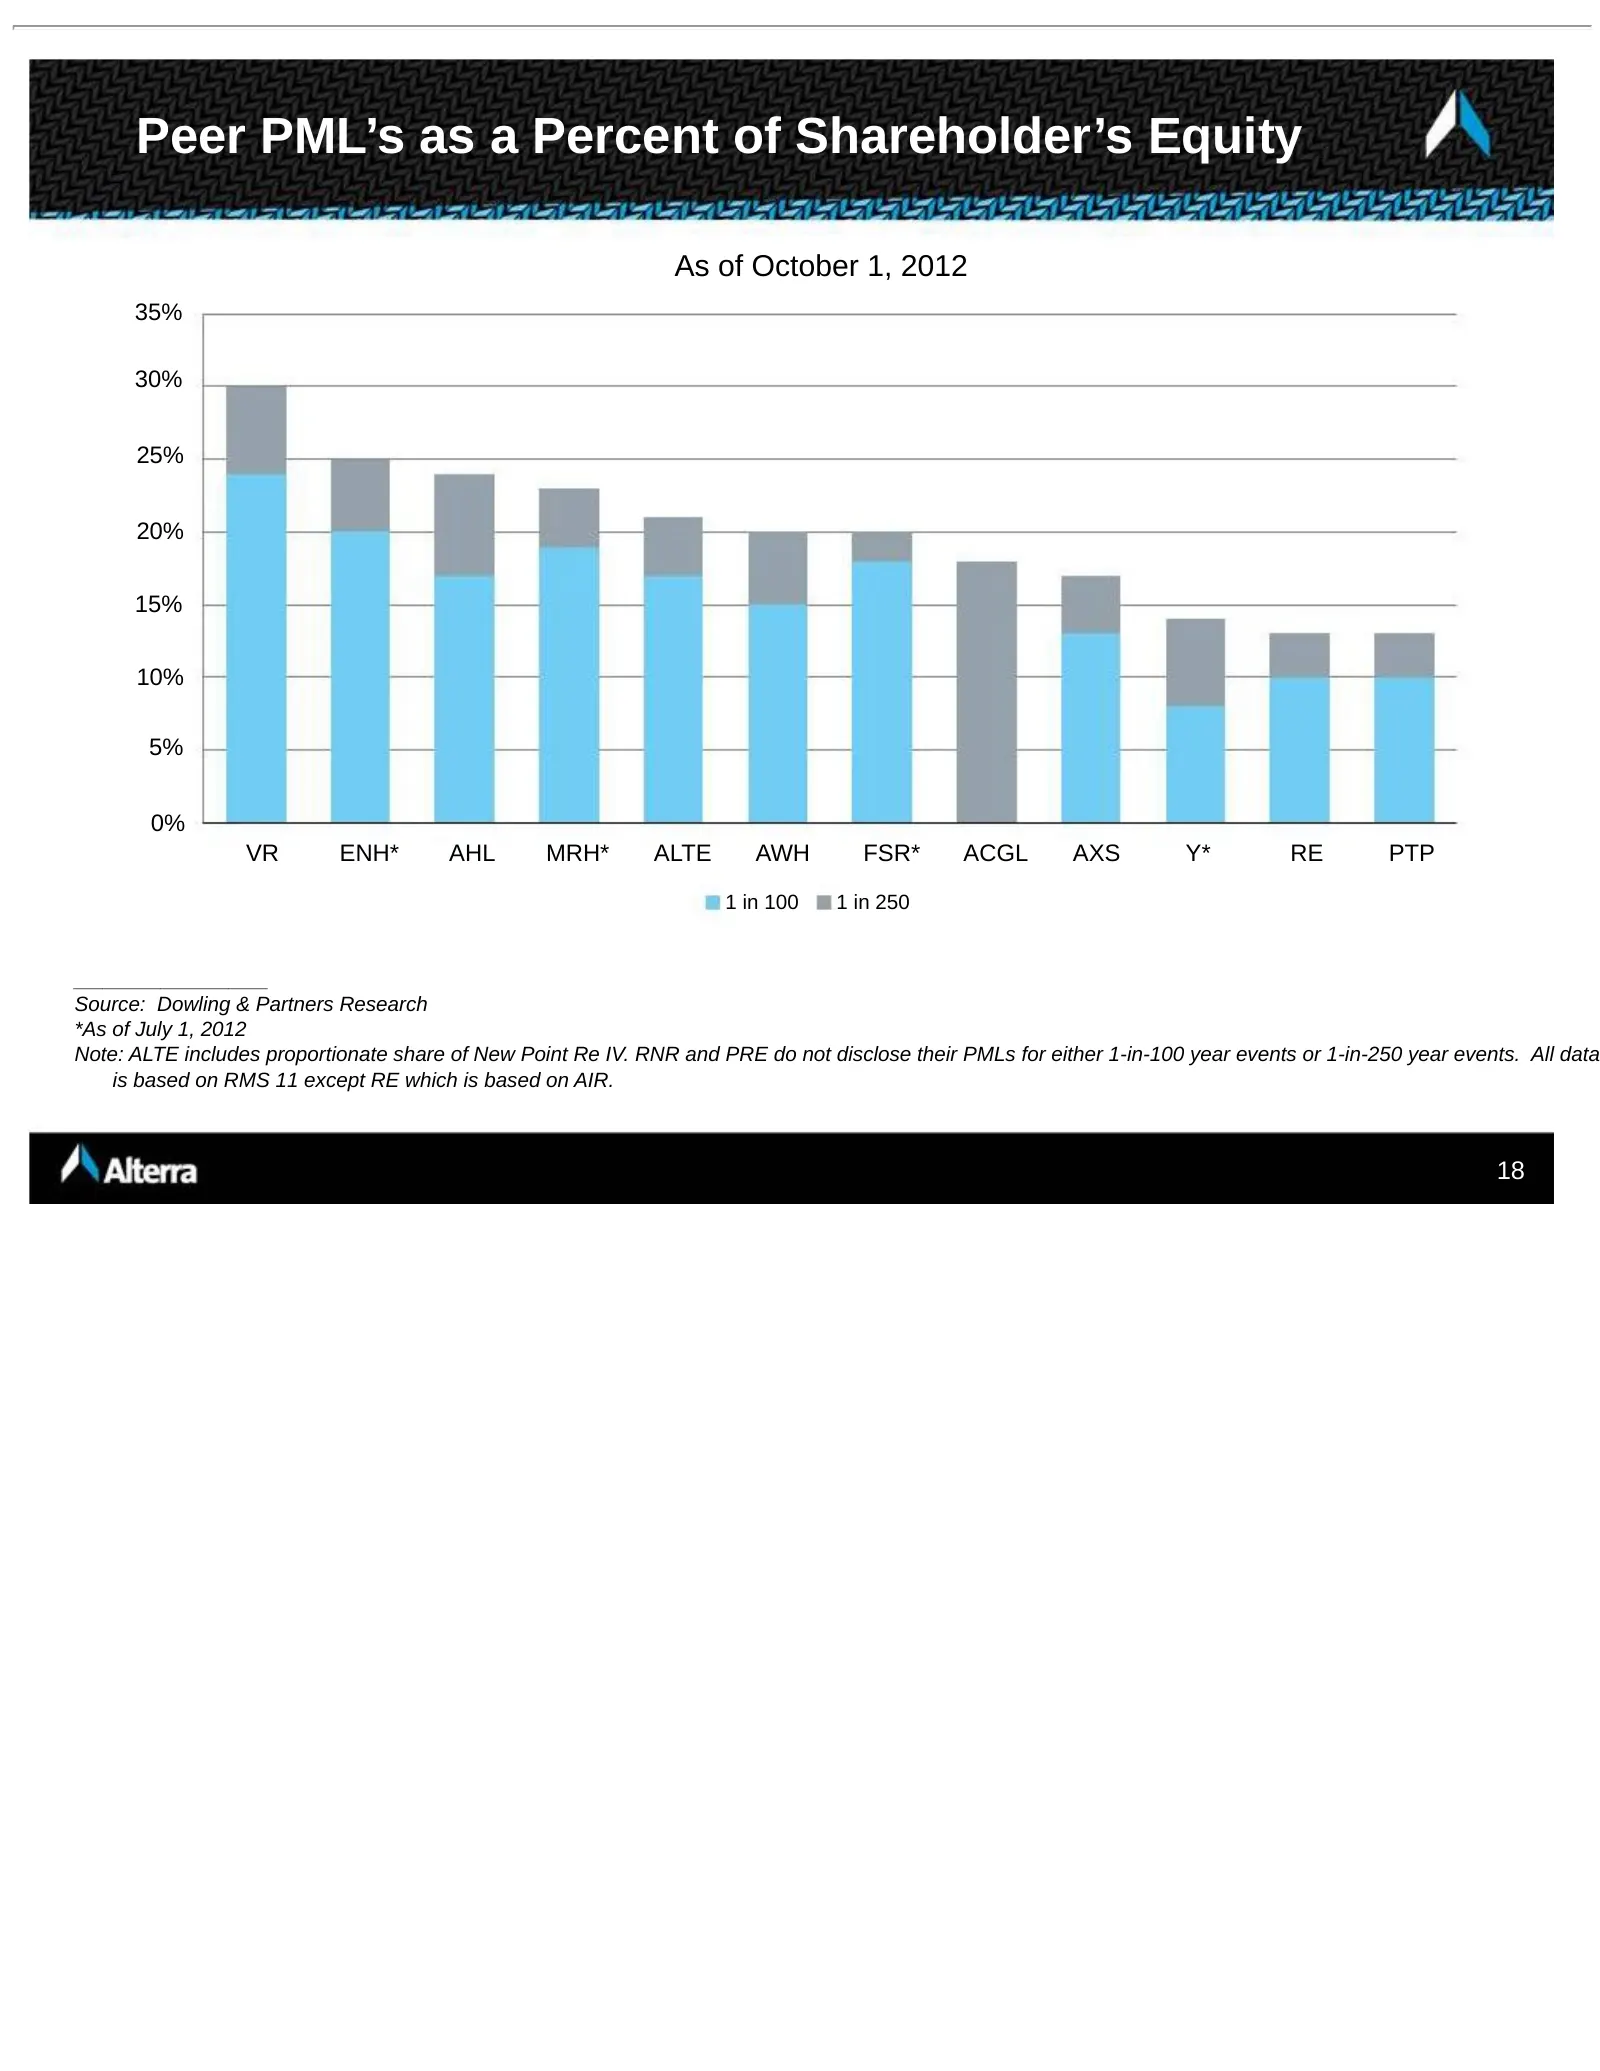
Peer PML’s as a Percent of Shareholder’s Equity As of October 1, 2012 35% 30% 25% 20% 15% 10% 5% 0% VR ENH* AHL MRH* ALTE AWH FSR* ACGL AXS Y* RE PTP 1 in 100 1 in 250 ____________________ Source: Dowling & Partners Research *As of July 1, 2012 Note: ALTE includes proportionate share of New Point Re
Slide 19: 2011 – "The Year of The Cat"
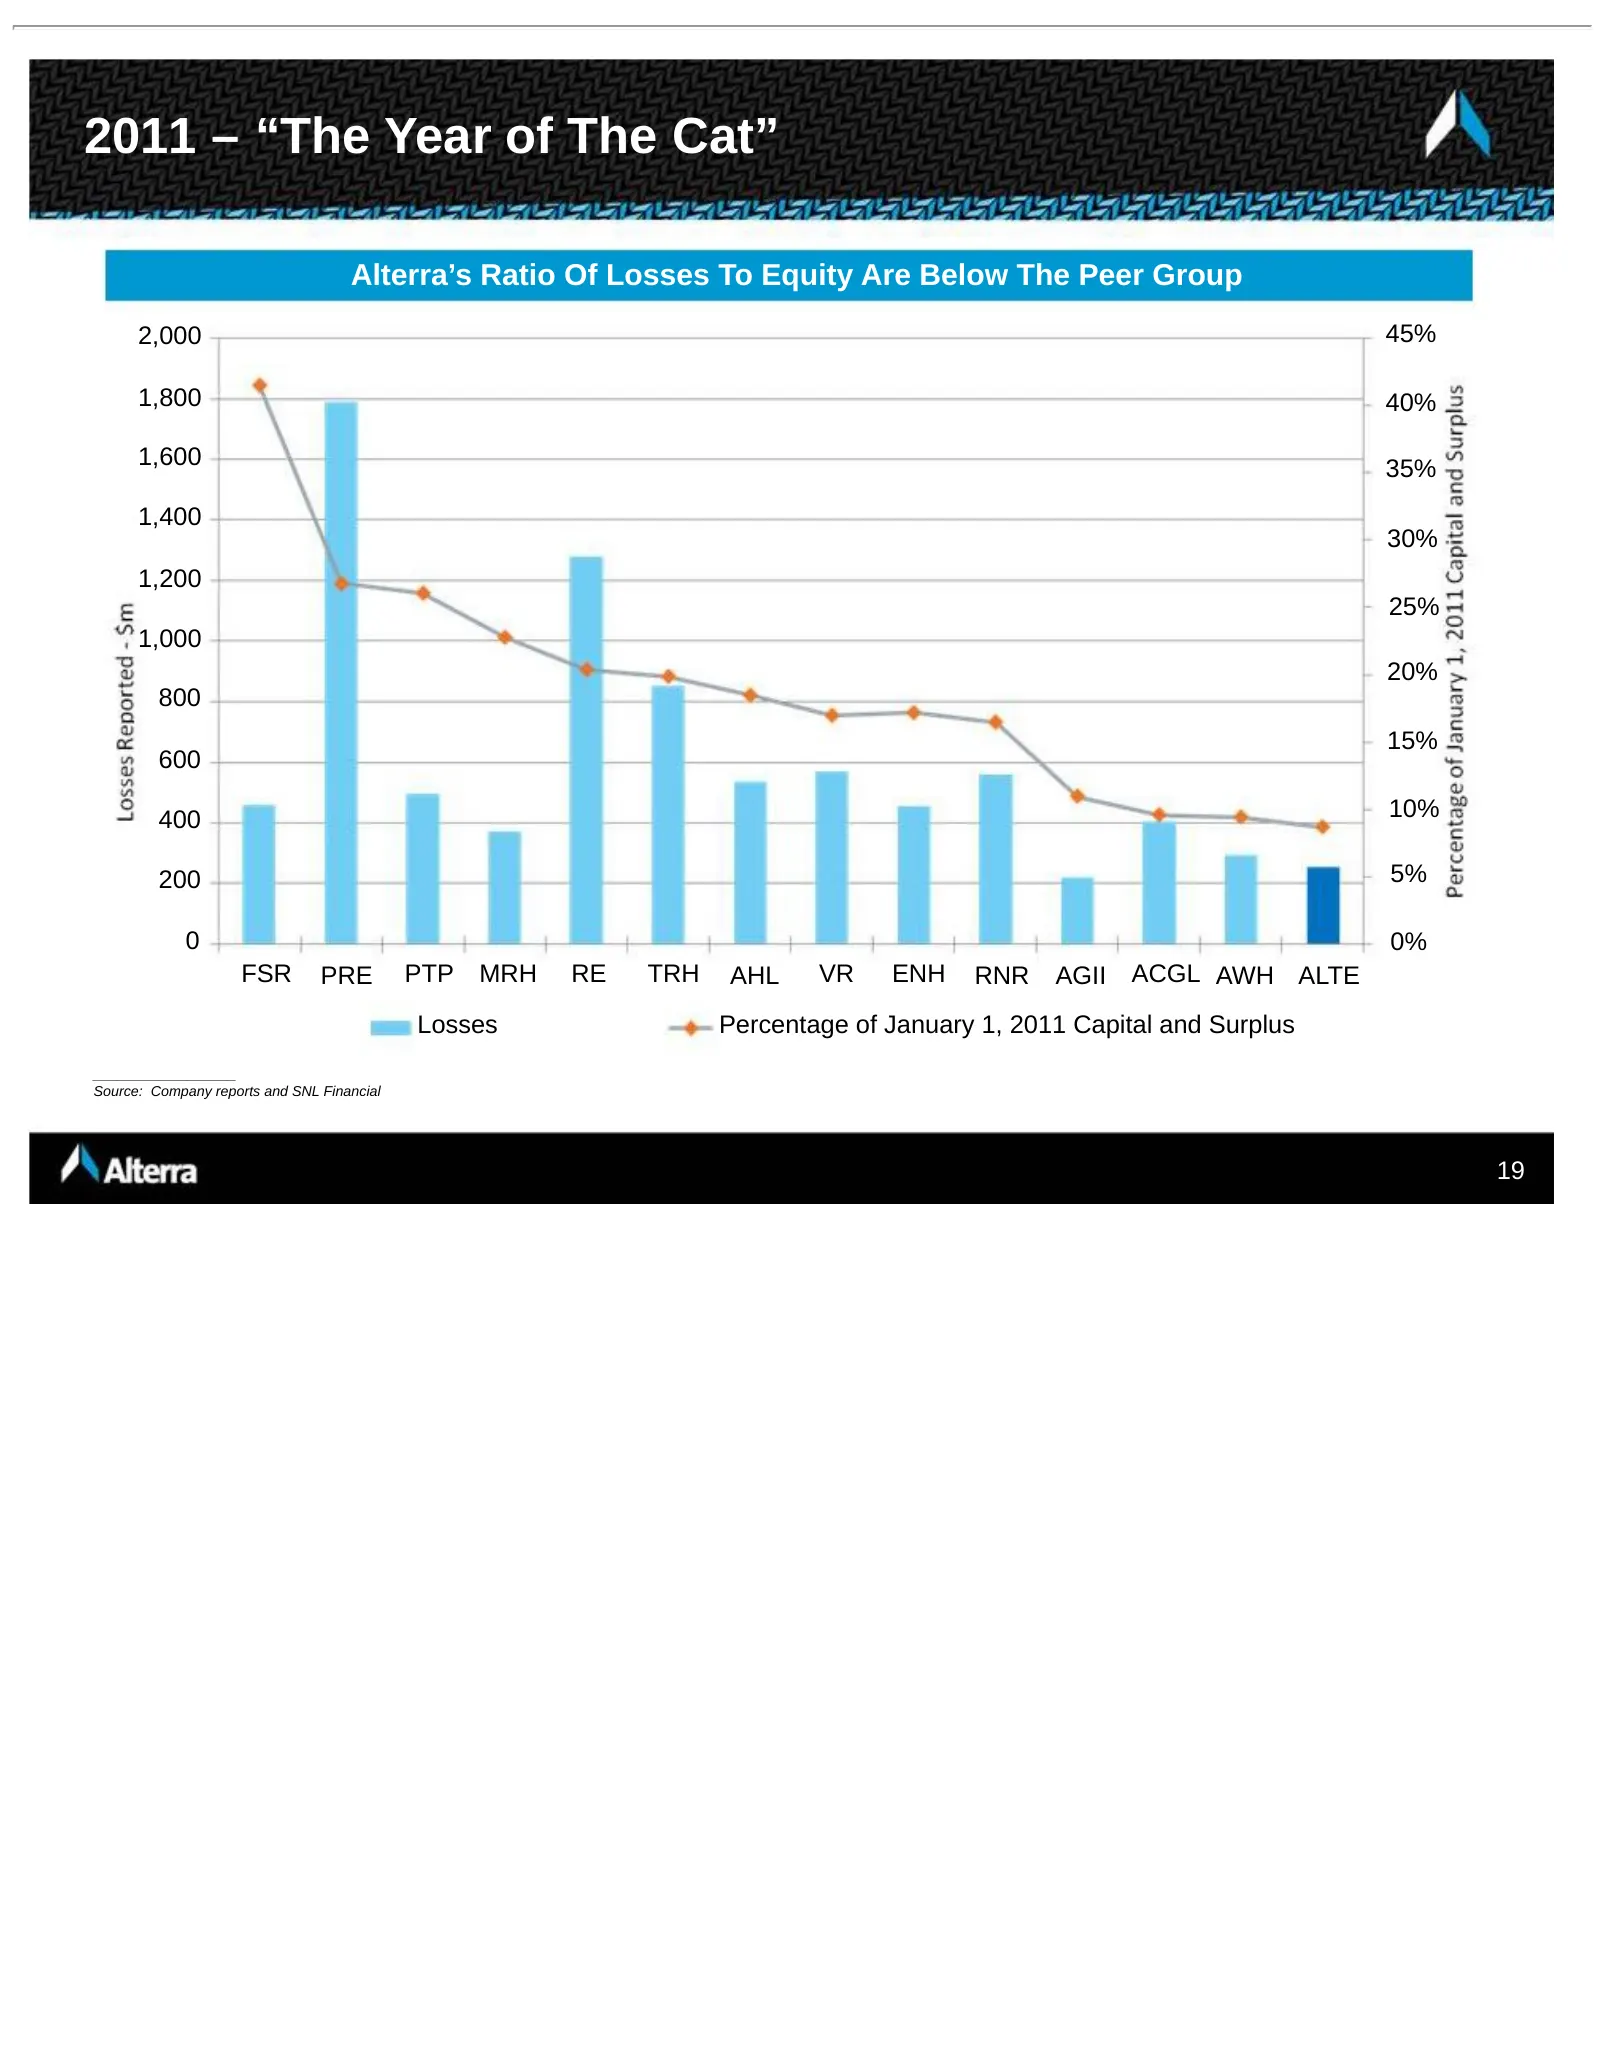
2011 – “The Year of The Cat” Alterra’s Ratio Of Losses To Equity Are Below The Peer Group 2,000 45% 1,800 40% 1,600 35% 1,400 30% 1,200 25% 1,000 20% 800 15% 600 400 10% 200 5% 0 0% FSR PRE PTP MRH RE TRH AHL VR ENH RNR AGII ACGL AWH ALTE Losses Percentage of January 1, 2011 Capital and Surplus ____
Slide 20: 2010 – Chile Earthquake / Windstorm Xynthia / September New Zealand Earthquake
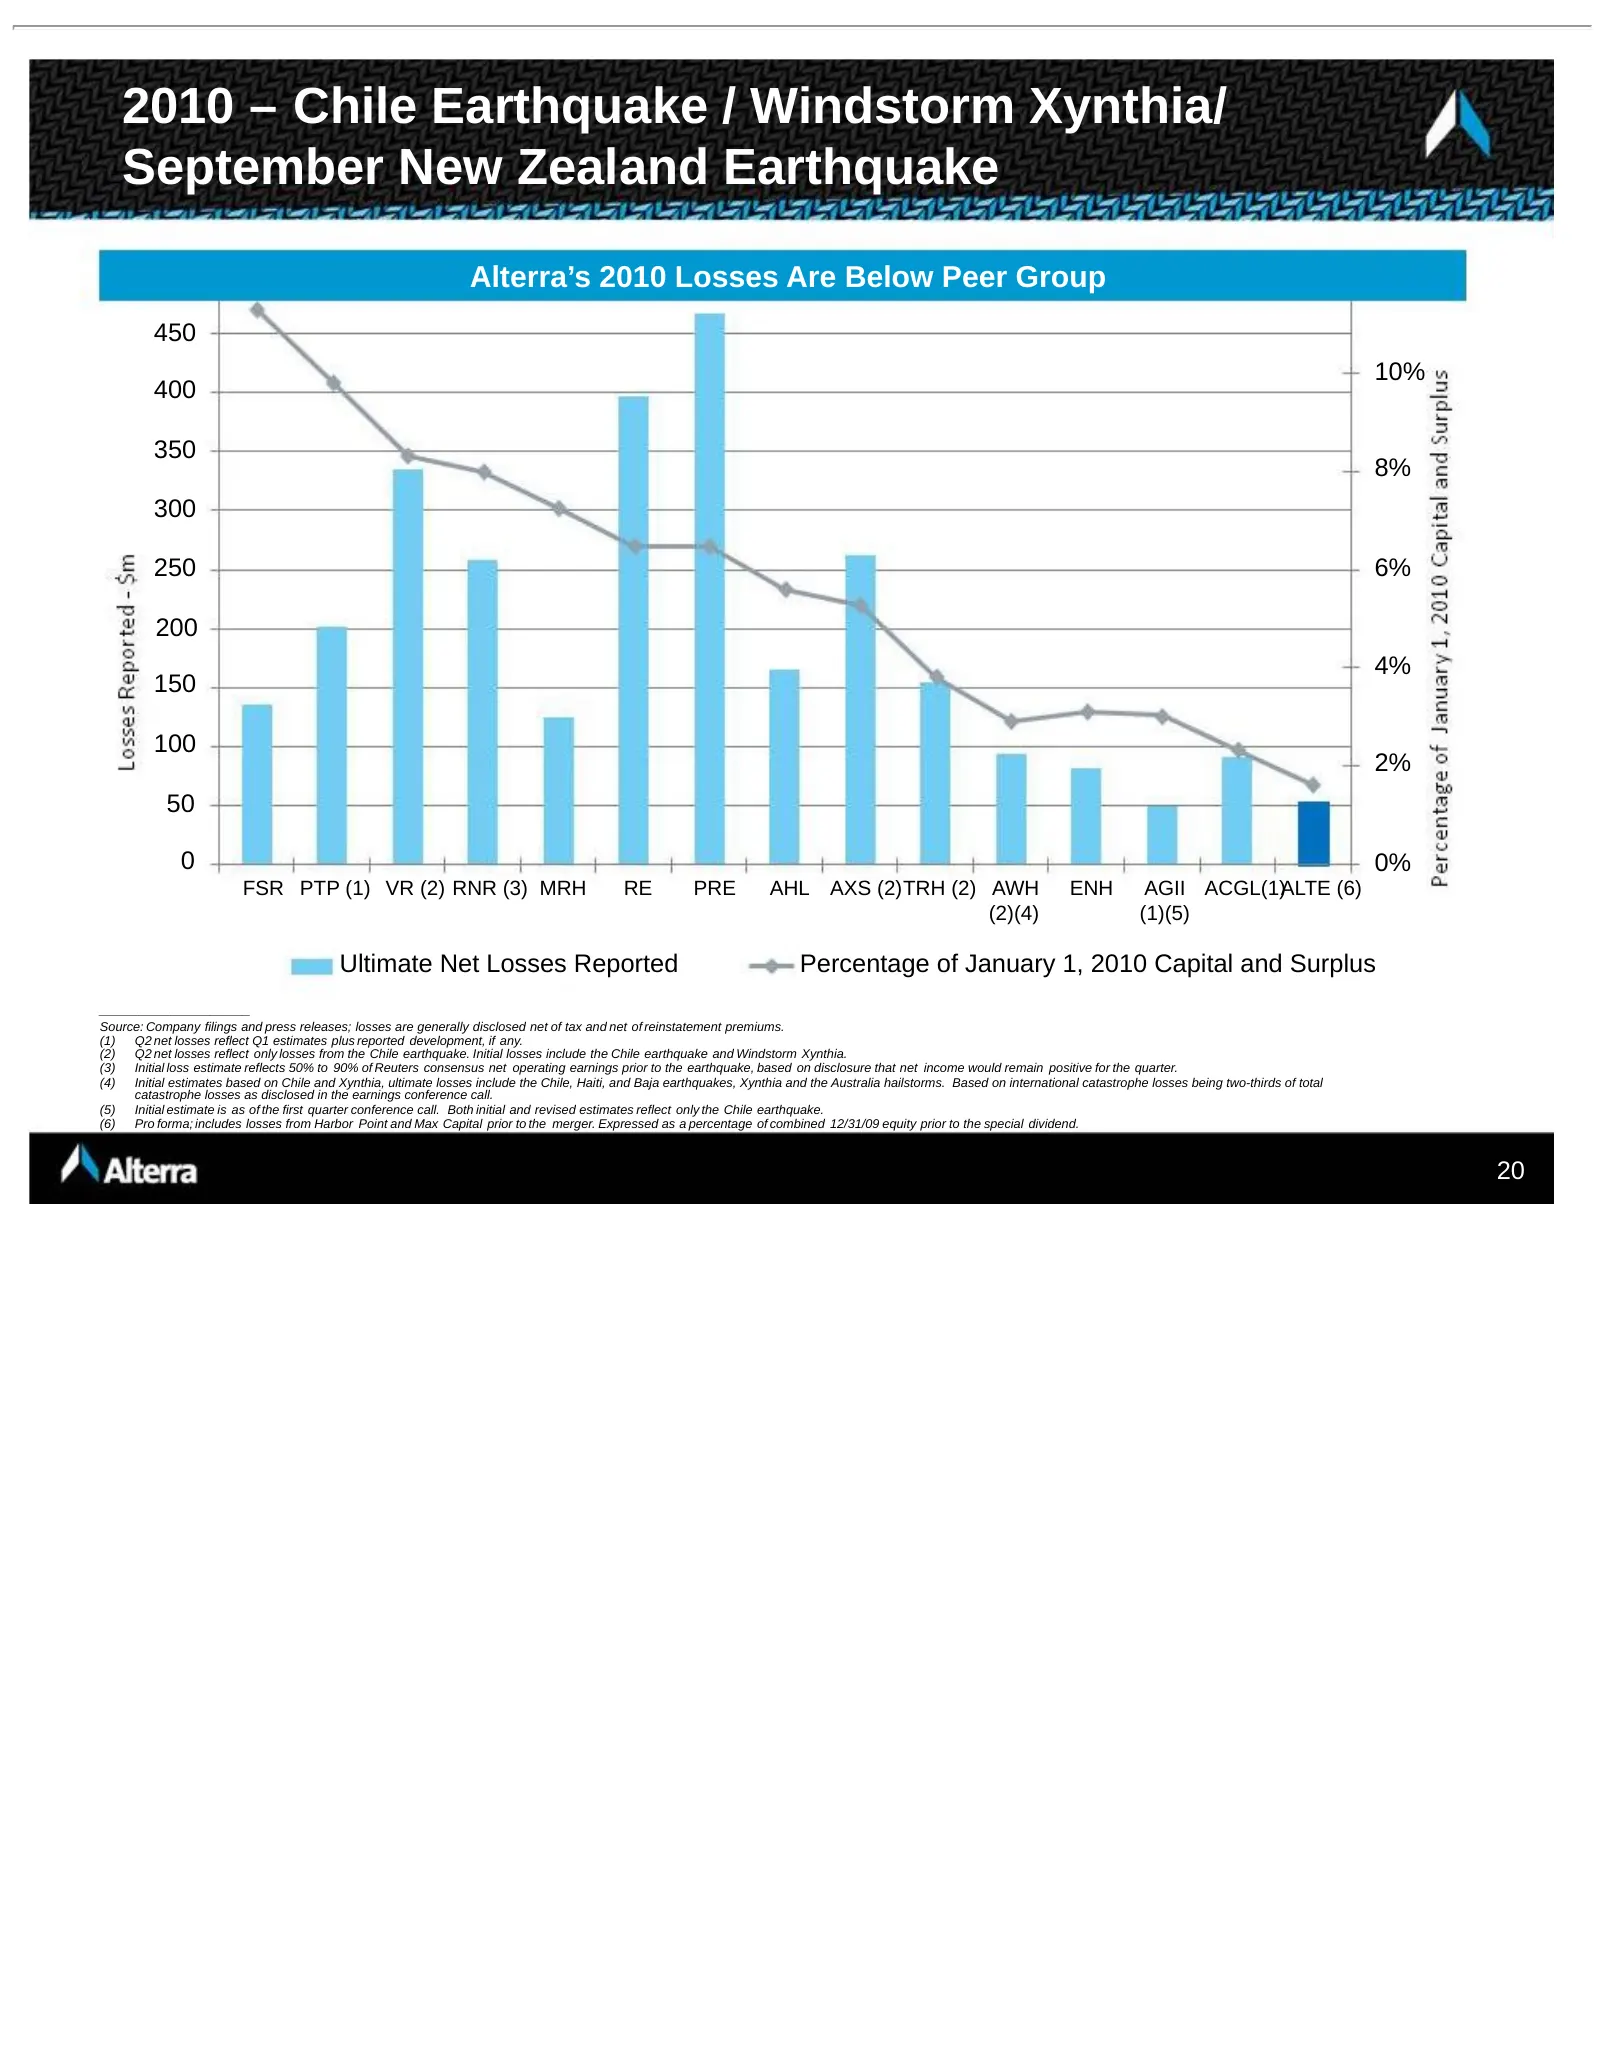
2010 – Chile Earthquake / Windstorm Xynthia/ September New Zealand Earthquake Alterra’s 2010 Losses Are Below Peer Group 450 10% 400 350 8% 300 250 6% 200 4% 150 100 2% 50 0 0% FSR PTP (1) VR (2) RNR (3) MRH RE PRE AHL AXS (2)TRH (2) AWH ENH AGII ACGL(1)ALTE (6) (2)(4) (1)(5) Ultimate Net Losses Rep
Slide 21: 2008 – Hurricanes Ike / Gustav
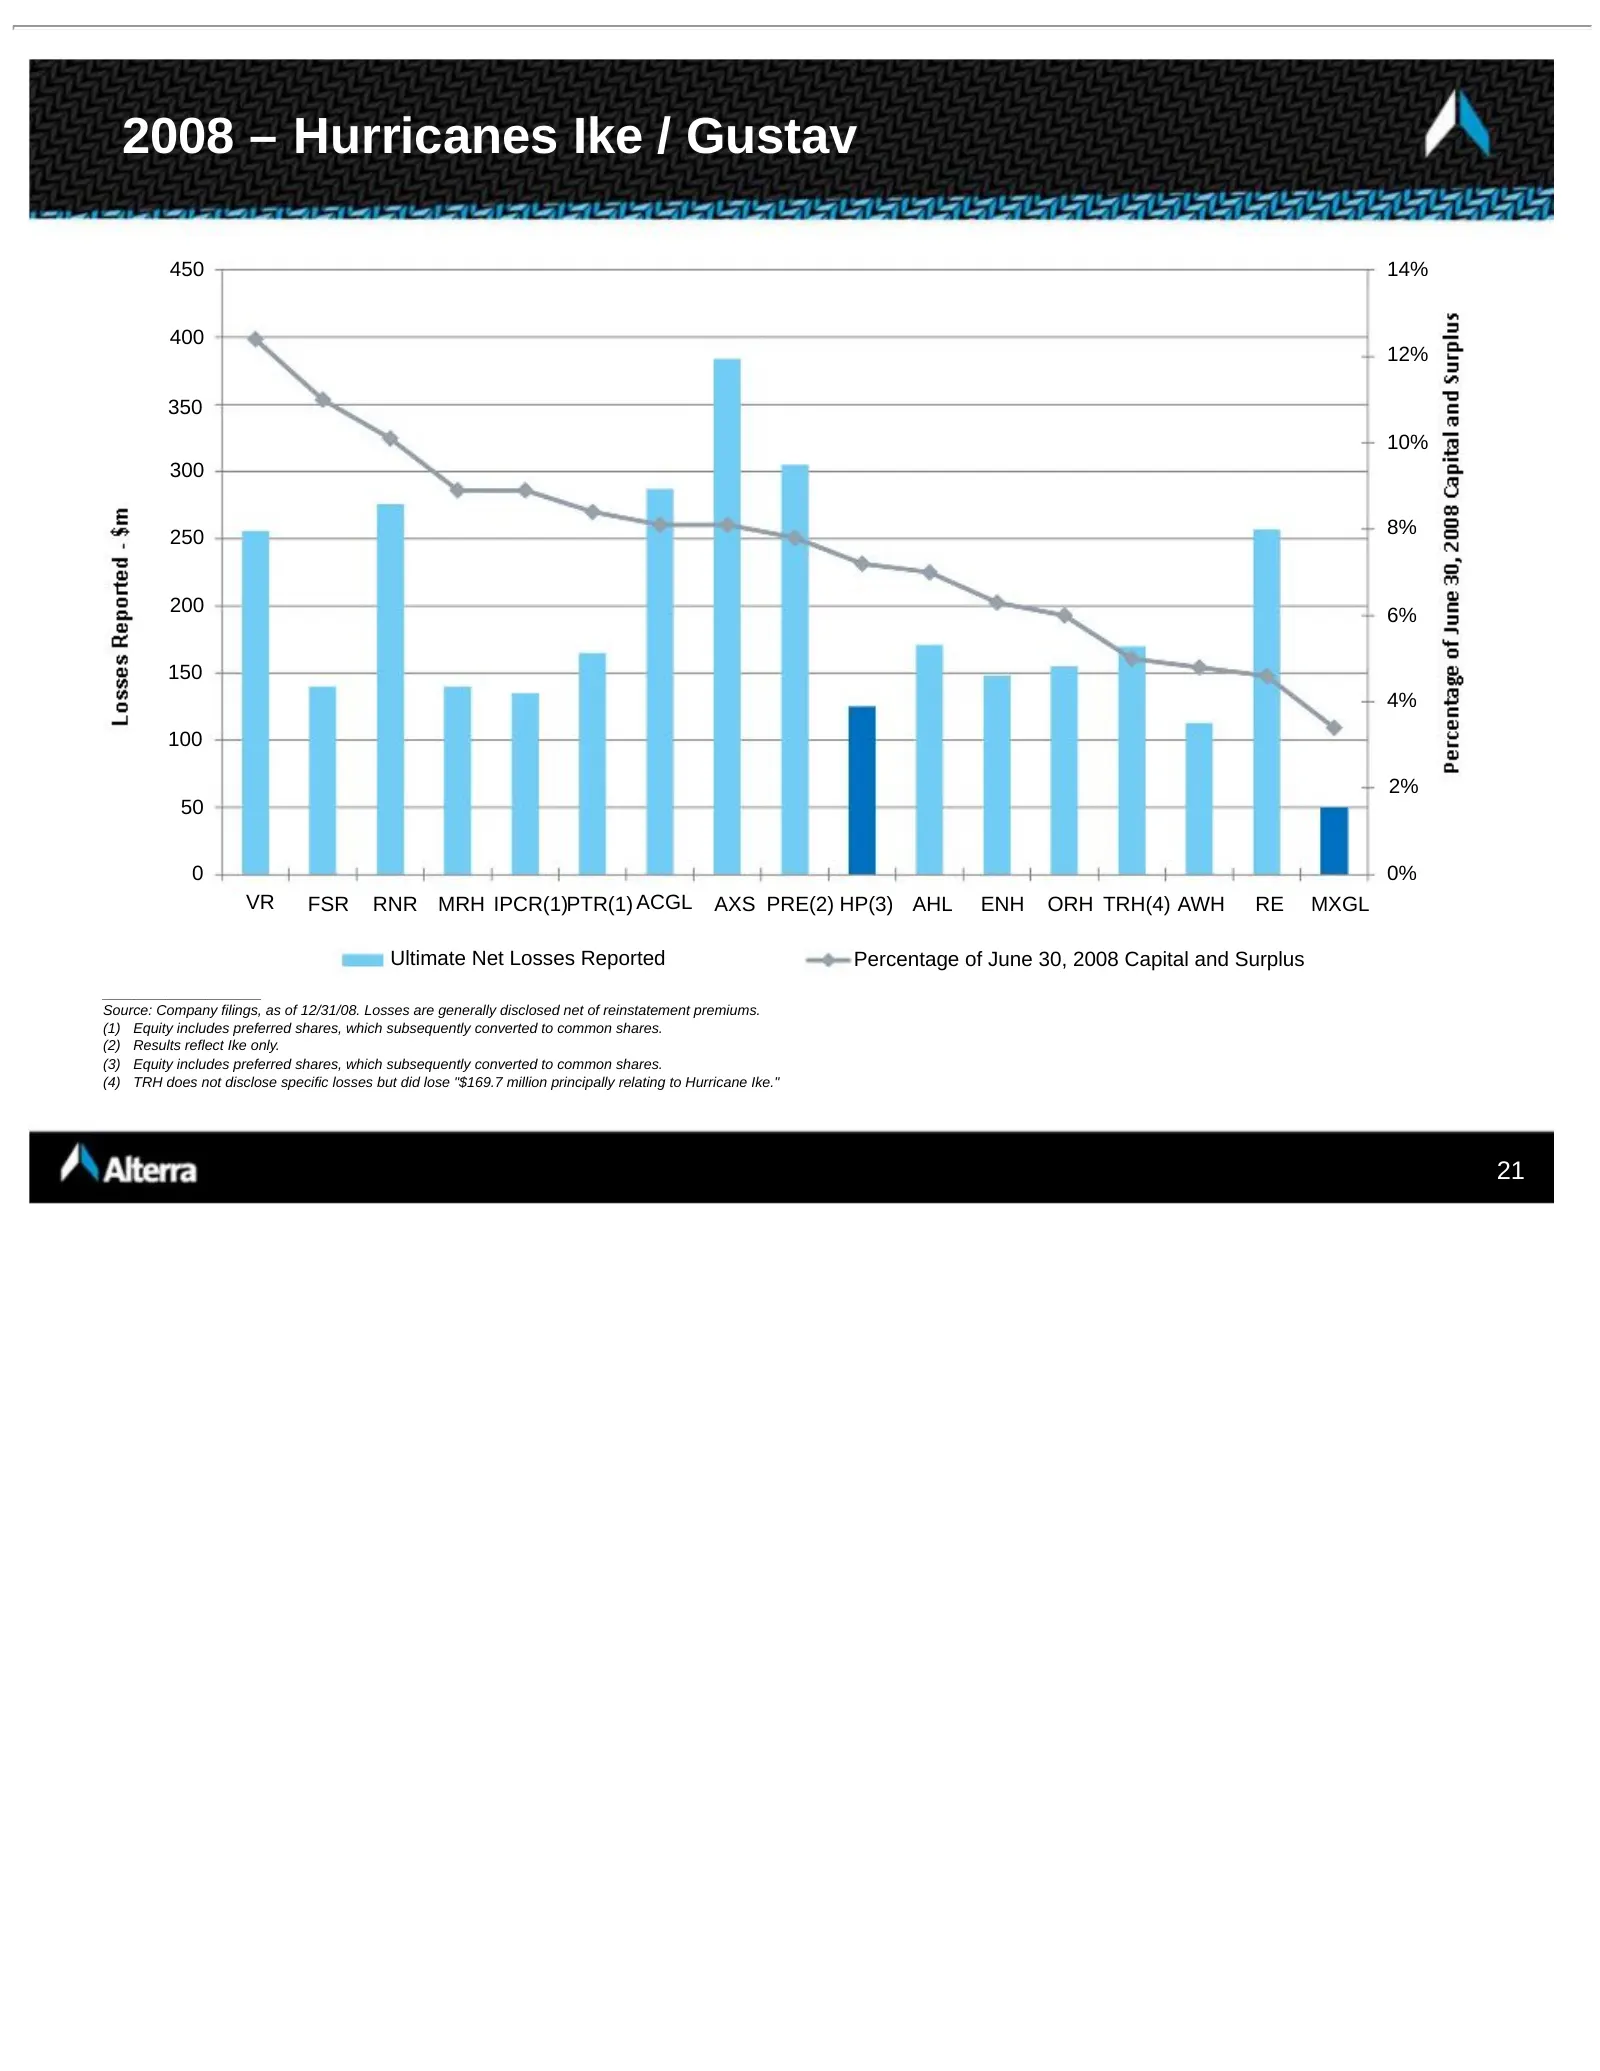
2008 – Hurricanes Ike / Gustav 450 14% 400 12% 350 10% 300 250 8% 200 6% 150 4% 100 2% 50 0 0% VR FSR RNR MRH IPCR(1)PTR(1) ACGL AXS PRE(2) HP(3) AHL ENH ORH TRH(4) AWH RE MXGL Ultimate Net Losses Reported Percentage of June 30, 2008 Capital and Surplus ____________________ Source: Company filings,
Slide 22: Cat Aggregate & PML Management
Cat Aggregate & PML Management PML goal of no more than 25% of starting capital in 1 in 250 year event Adjust position as market pricing makes risk/reward attractive Use RMS with “all switches on” and gross-up factors on standard model Incorporate AIR, market share, industry and client historical lo
Slide 23: Disciplined Underwriting Management
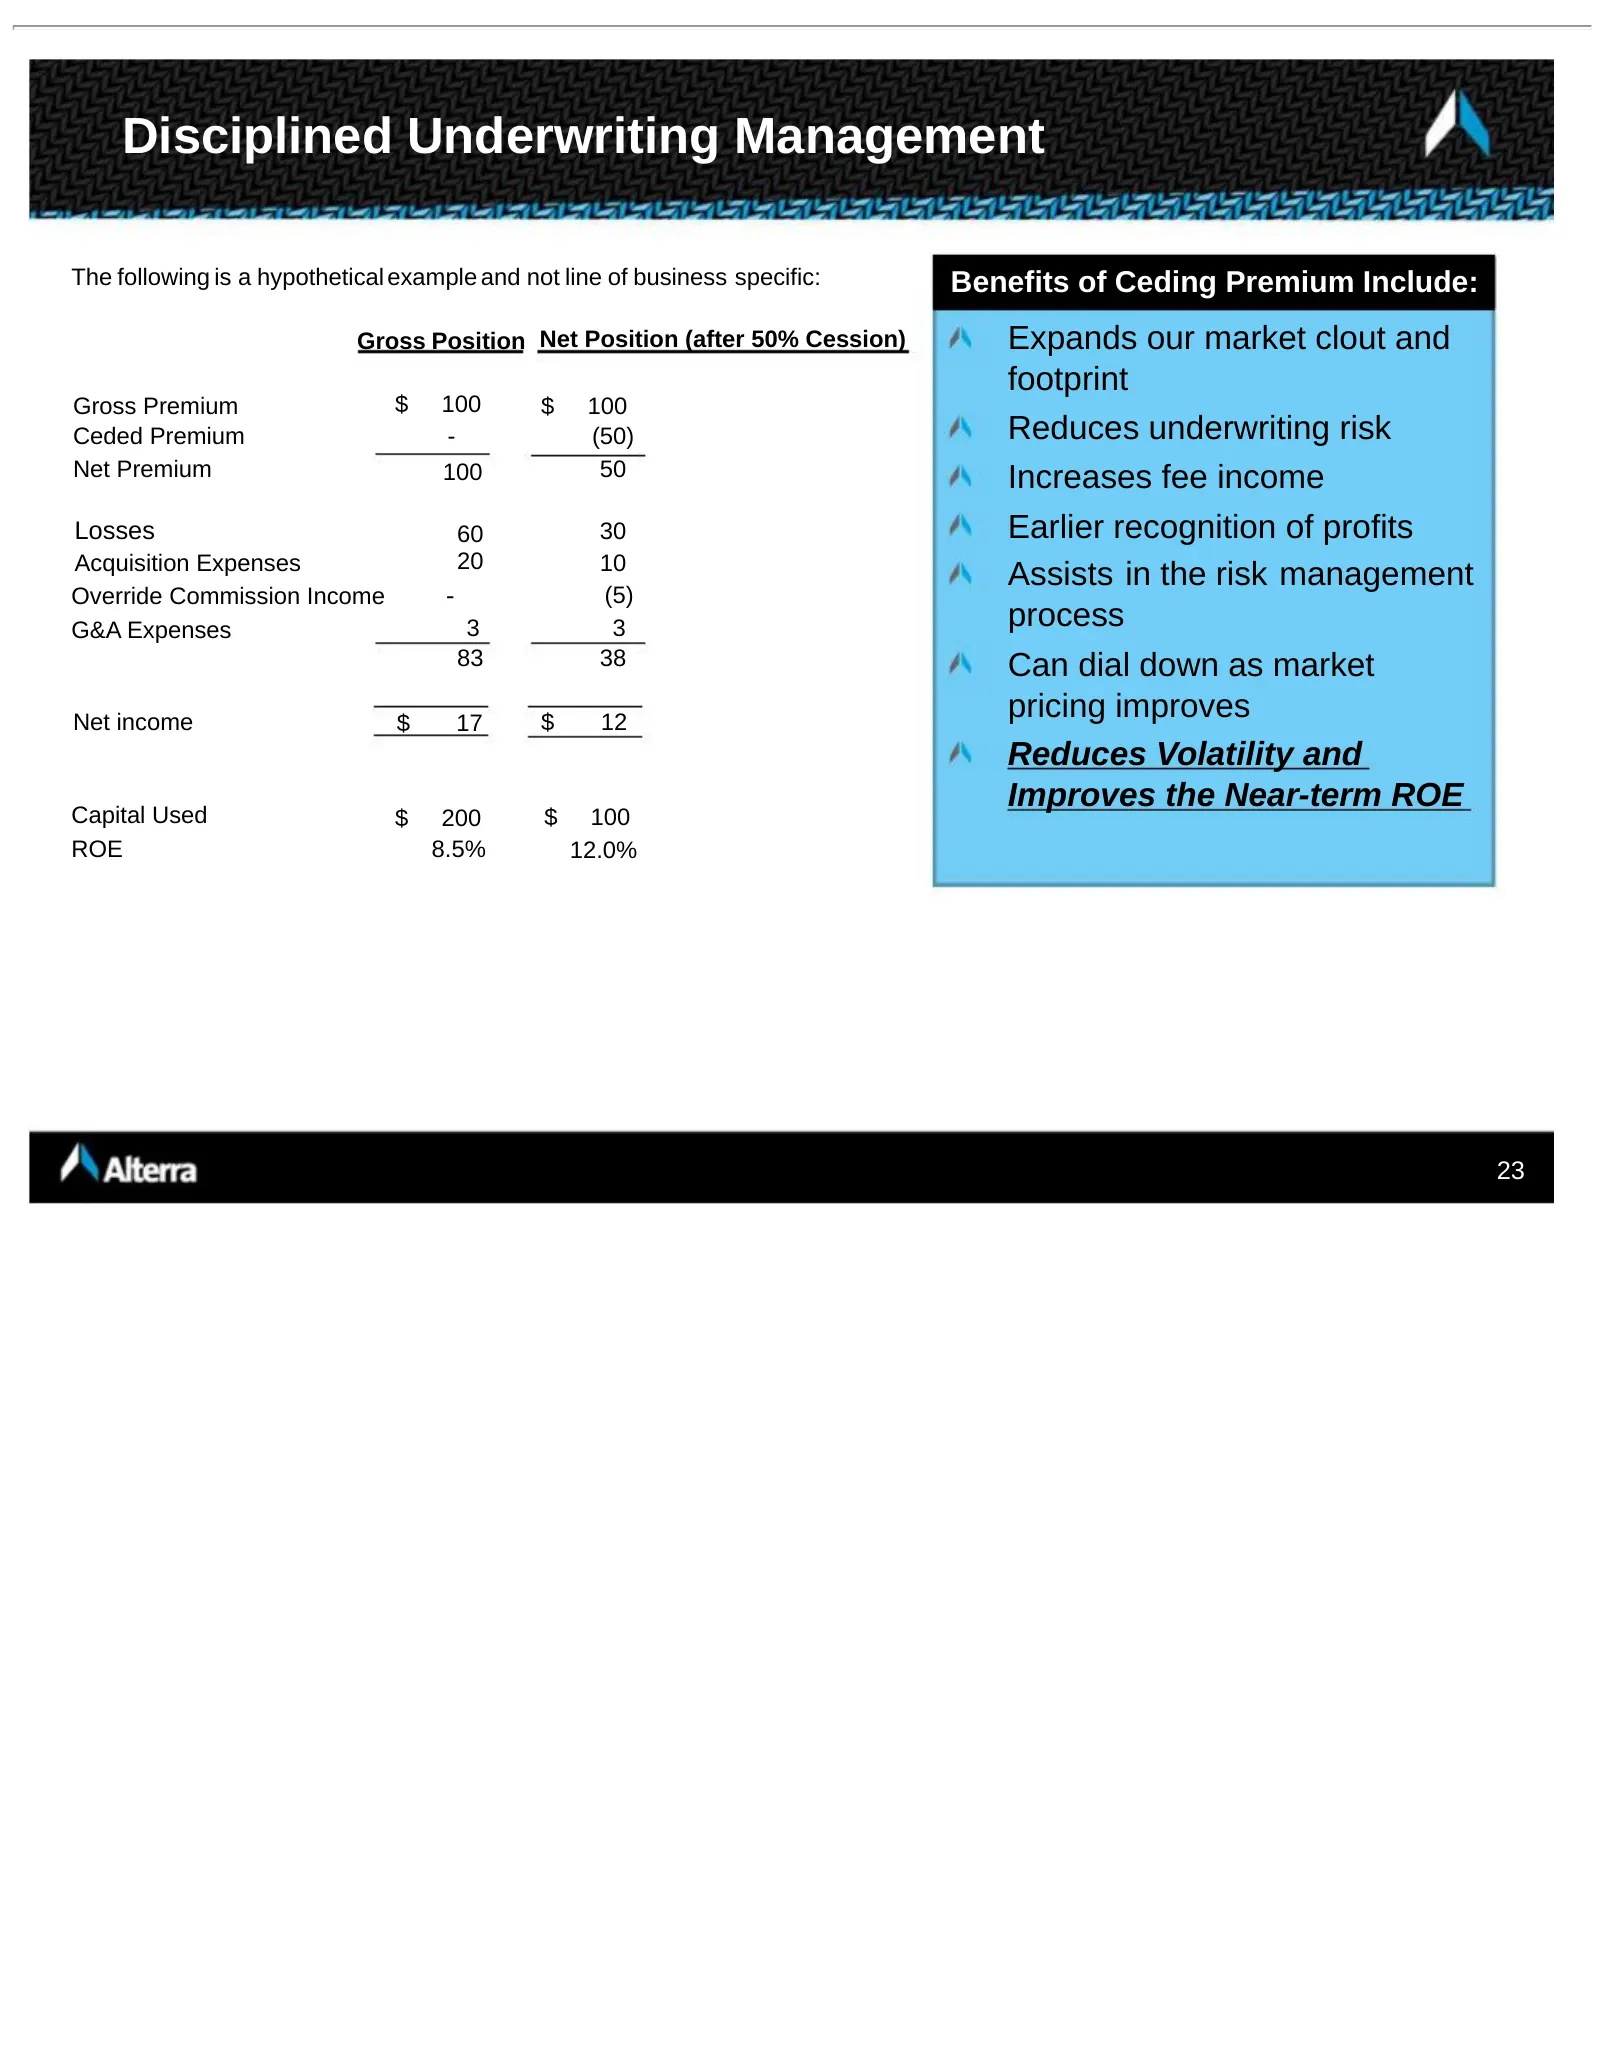
Disciplined Underwriting Management The following is a hypothetical example and not line of business specific: Benefits of Ceding Premium Include: Gross Position Net Position (after 50% Cession) Expands our market clout and footprint Gross Premium $ 100 $ 100 Ceded Premium - (50) Reduces underwritin
Slide 24: Reserve for Losses and Loss Expenses
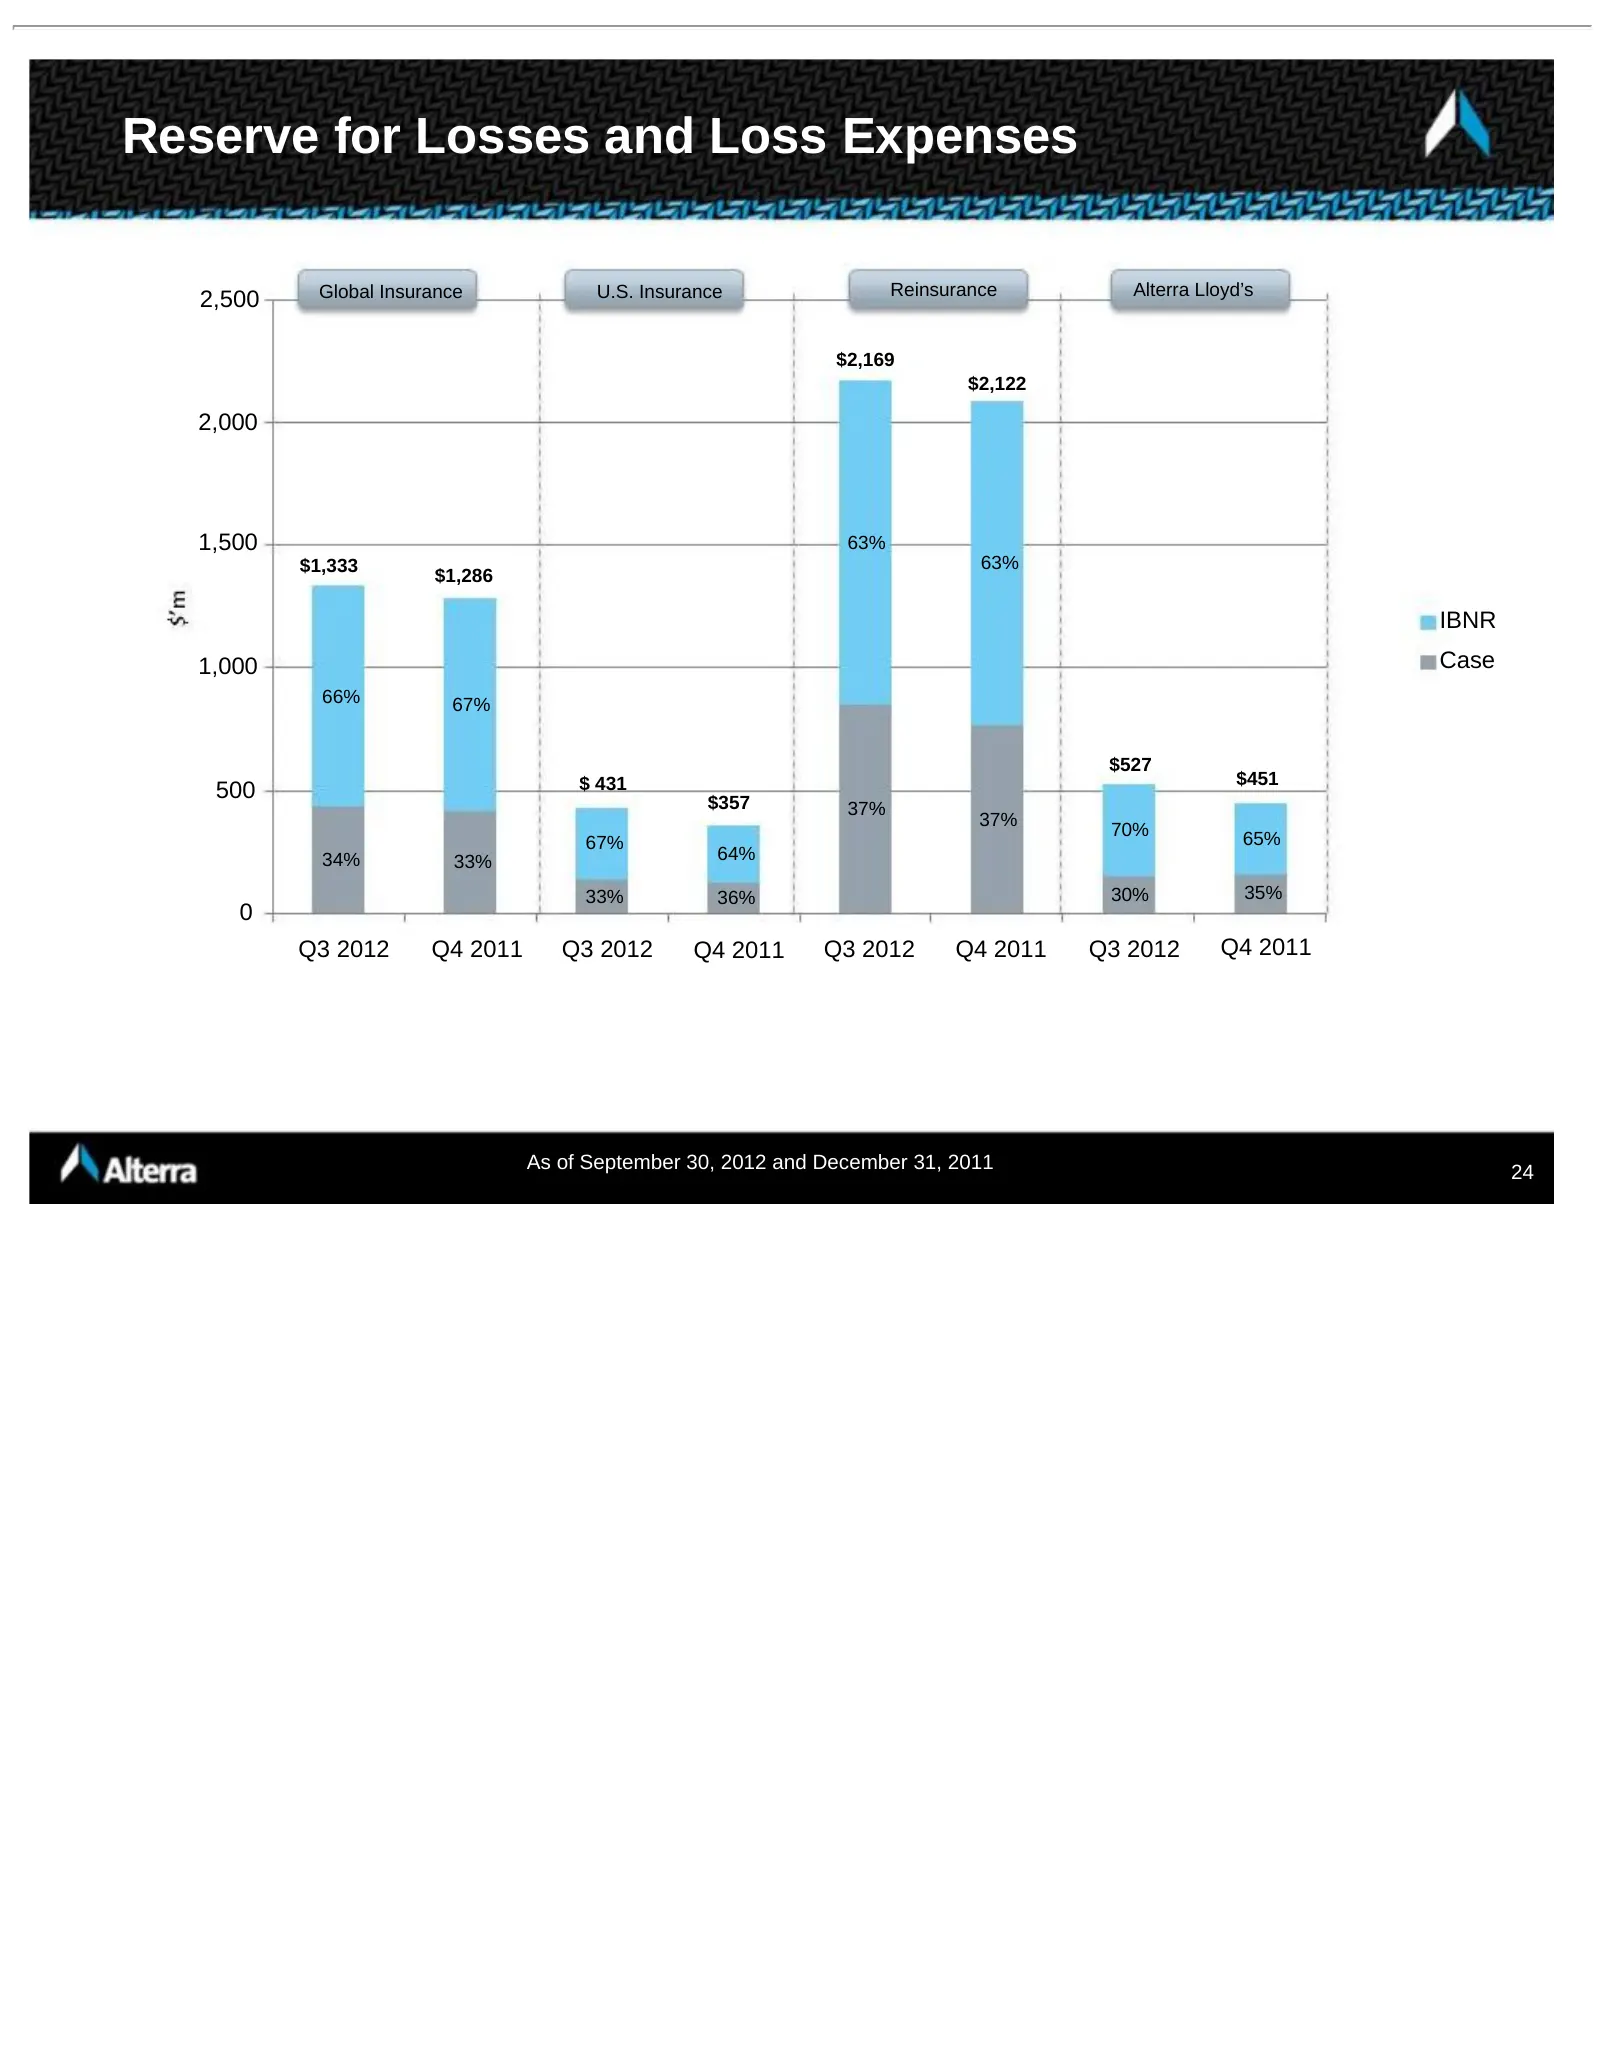
Reserve for Losses and Loss Expenses Global Insurance U.S. Insurance Reinsurance Alterra Lloyd’s 2,500 $2,169 $2,122 2,000 1,500 63% $1,333 63% $1,286 IBNR 1,000 Case 66% 67% $527 $ 431 $451 500 $357 37% 37% 70% 67% 65% 34% 33% 64% 33% 36% 30% 35% 0 Q3 2012 Q4 2011 Q3 2012 Q4 2011 Q3 2012 Q4 2011 Q3
Slide 25: Reserve Development History
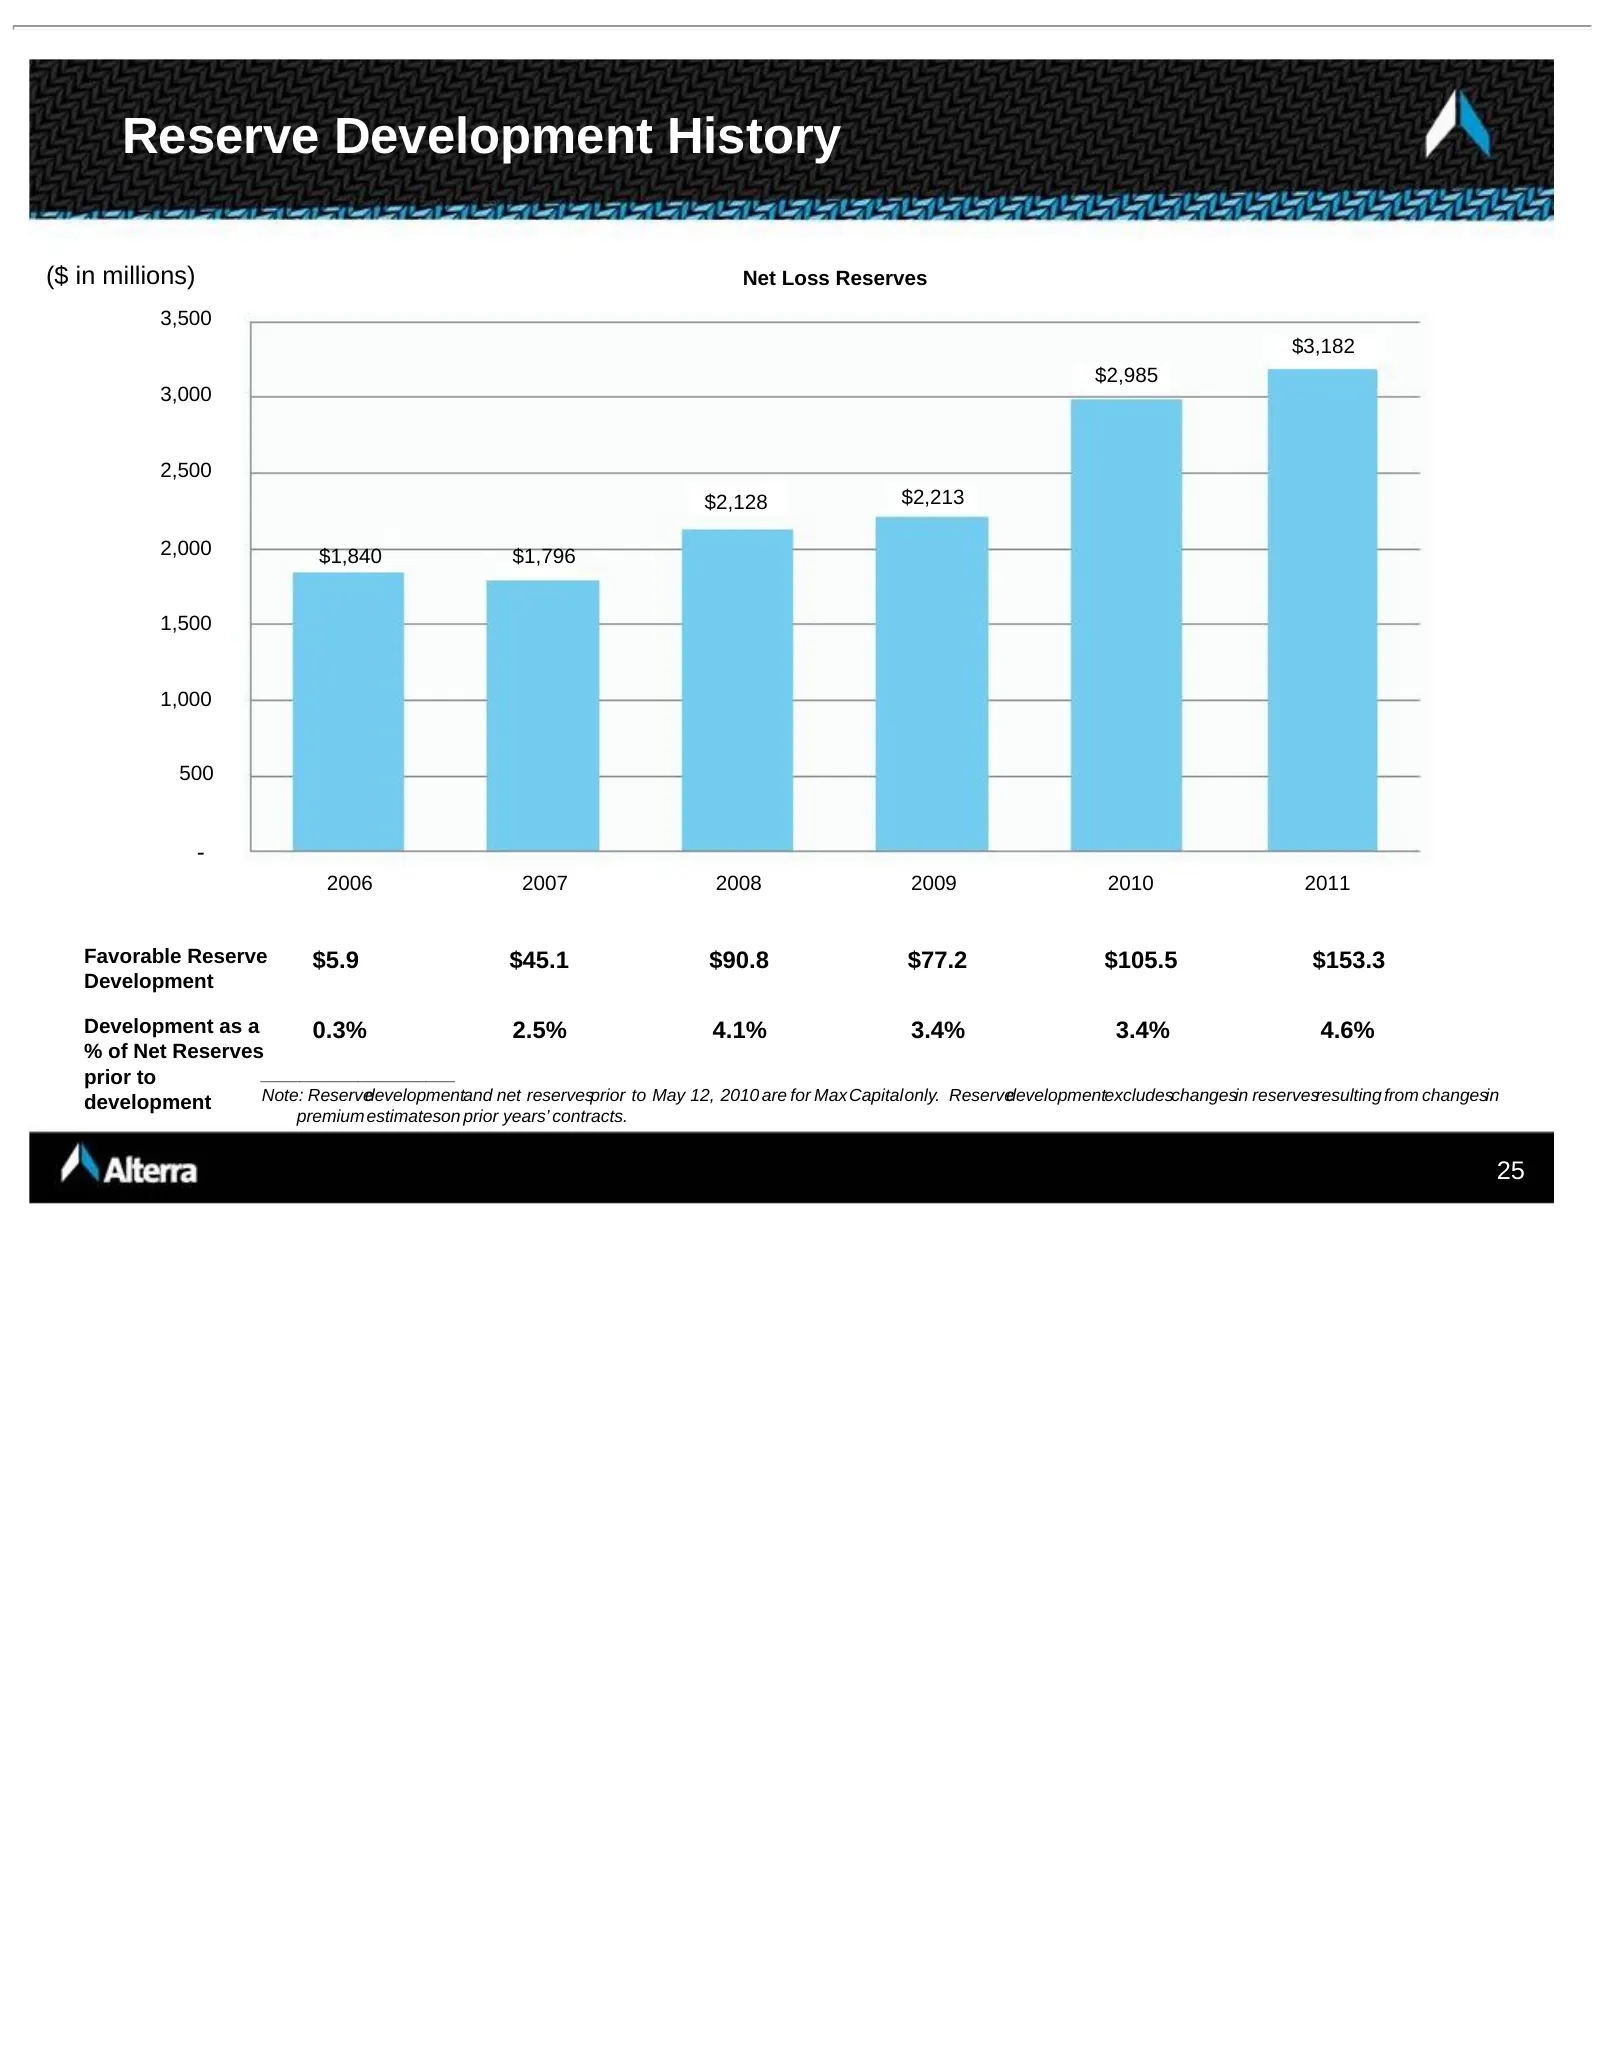
Reserve Development History ($ in millions) Net Loss Reserves 3,500 $3,182 $2,985 3,000 2,500 $2,128 $2,213 2,000 $1,840 $1,796 1,500 1,000 500 - 2006 2007 2008 2009 2010 2011 Favorable Reserve $5.9 $45.1 $90.8 $77.2 $105.5 $153.3 Development Development as a 0.3% 2.5% 4.1% 3.4% 3.4% 4.6% % of Net R
Slide 26: High Quality, Liquid Investment Portfolio
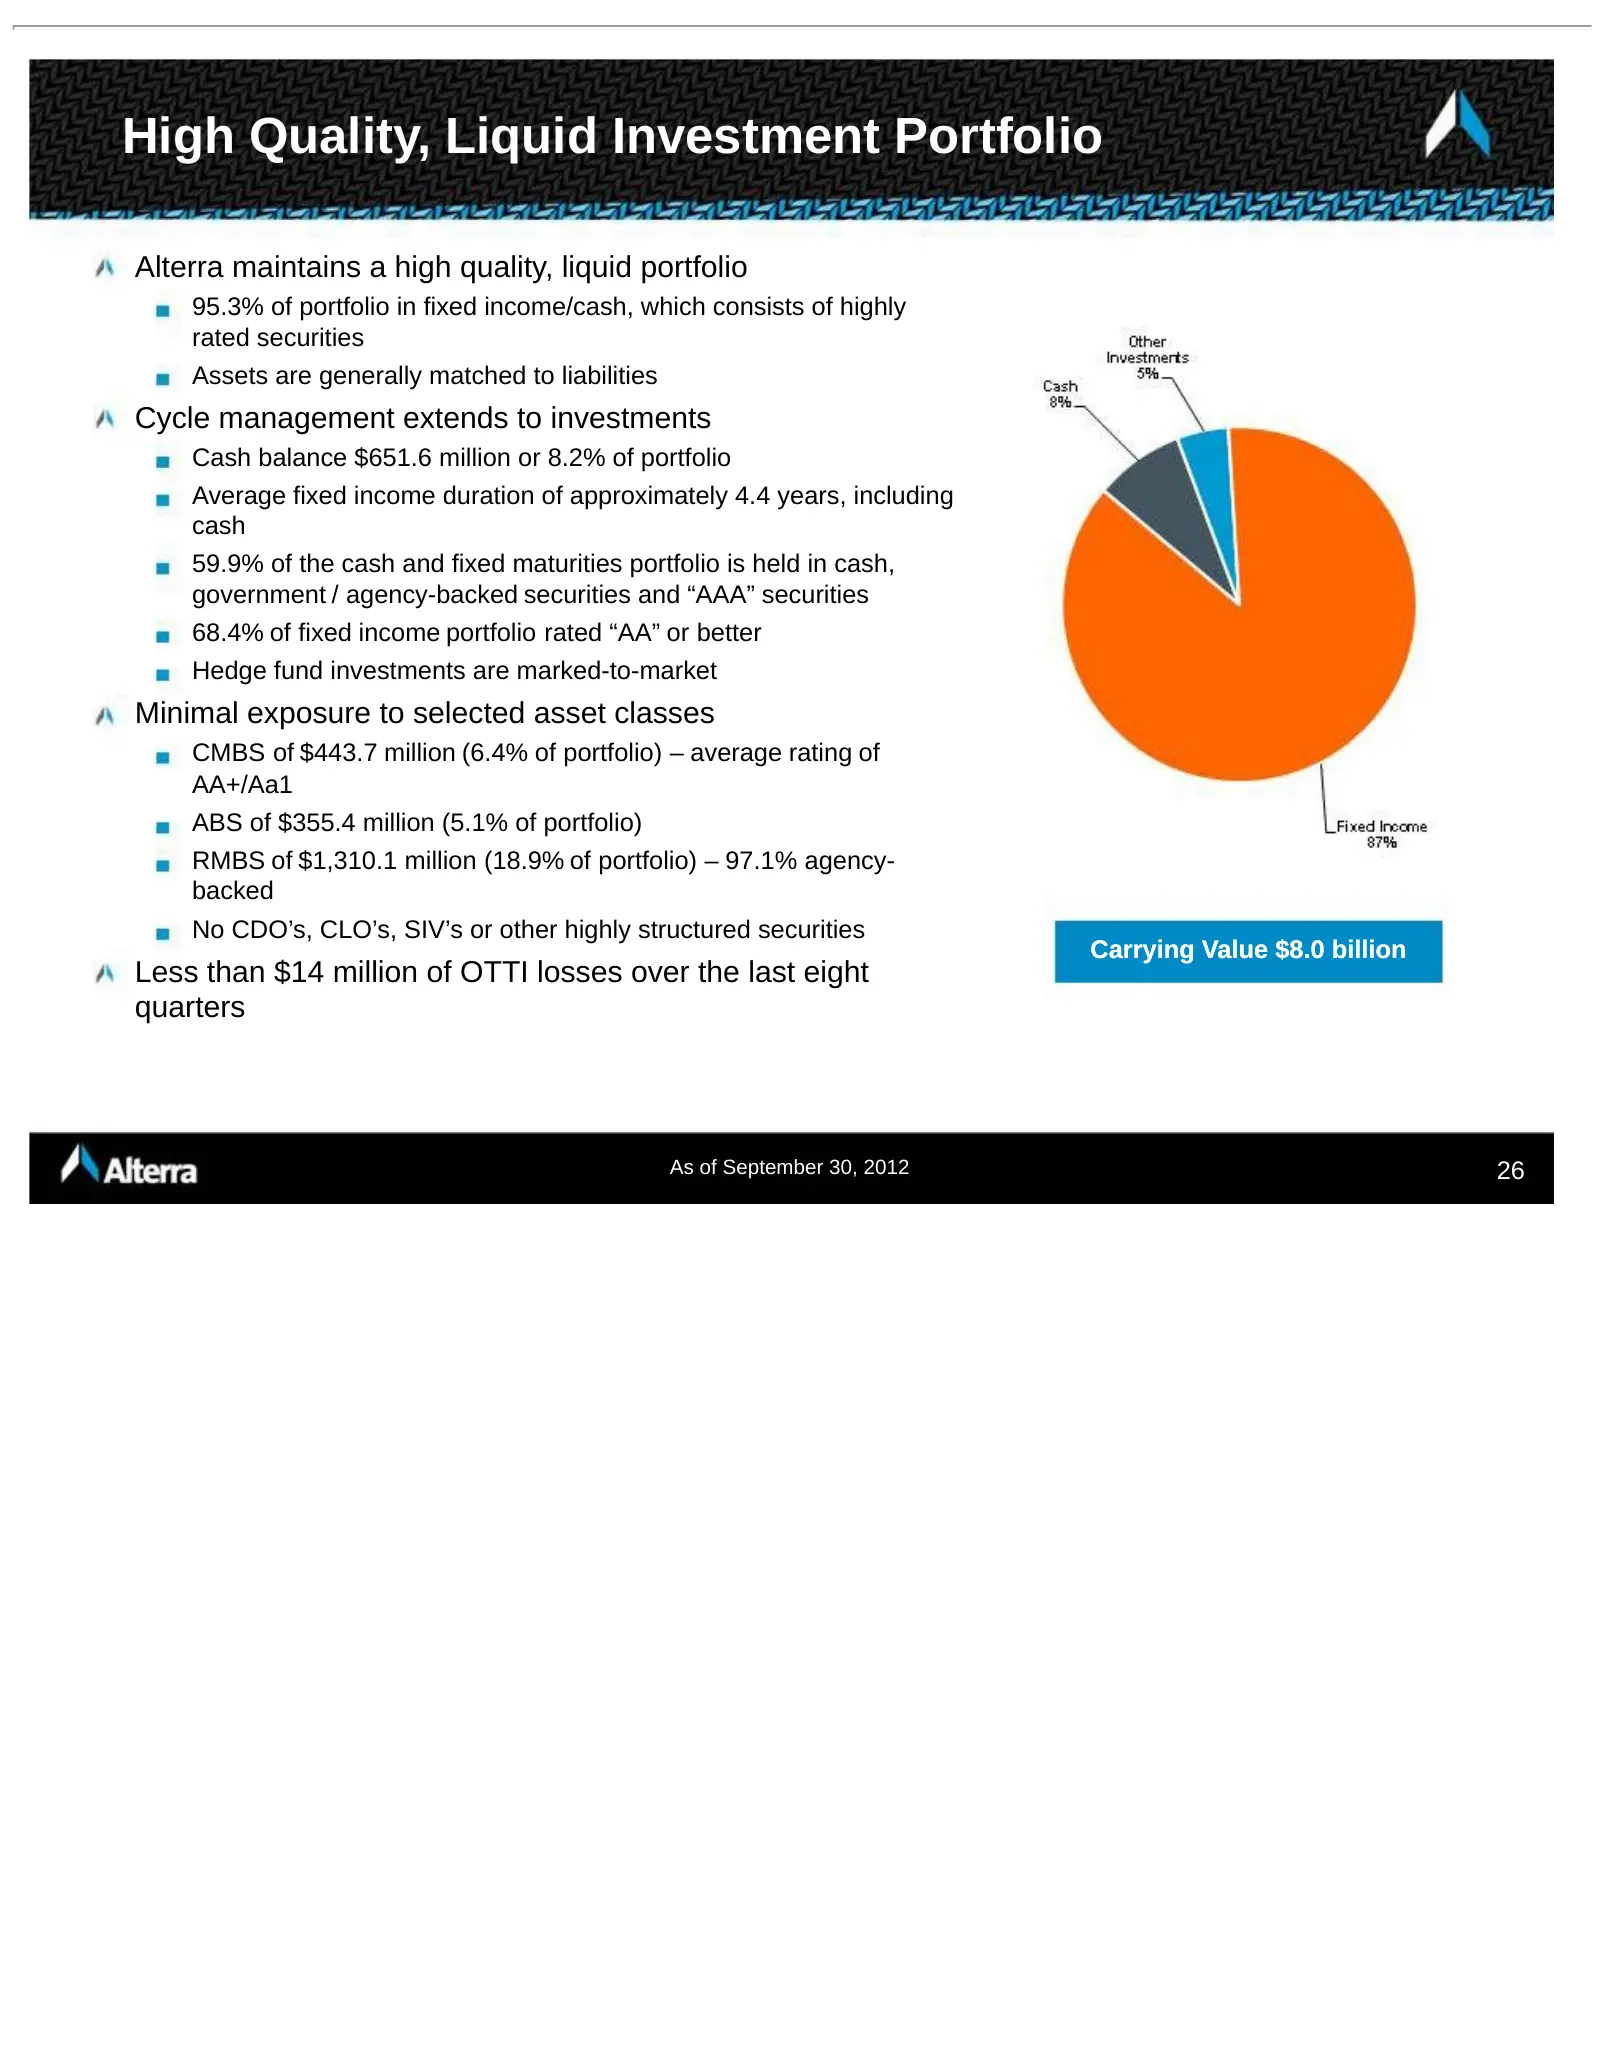
High Quality, Liquid Investment Portfolio Alterra maintains a high quality, liquid portfolio 95.3% of portfolio in fixed income/cash, which consists of highly rated securities Assets are generally matched to liabilities Cycle management extends to investments Cash balance $651.6 million or 8.2% of p
Slide 27: European Exposure
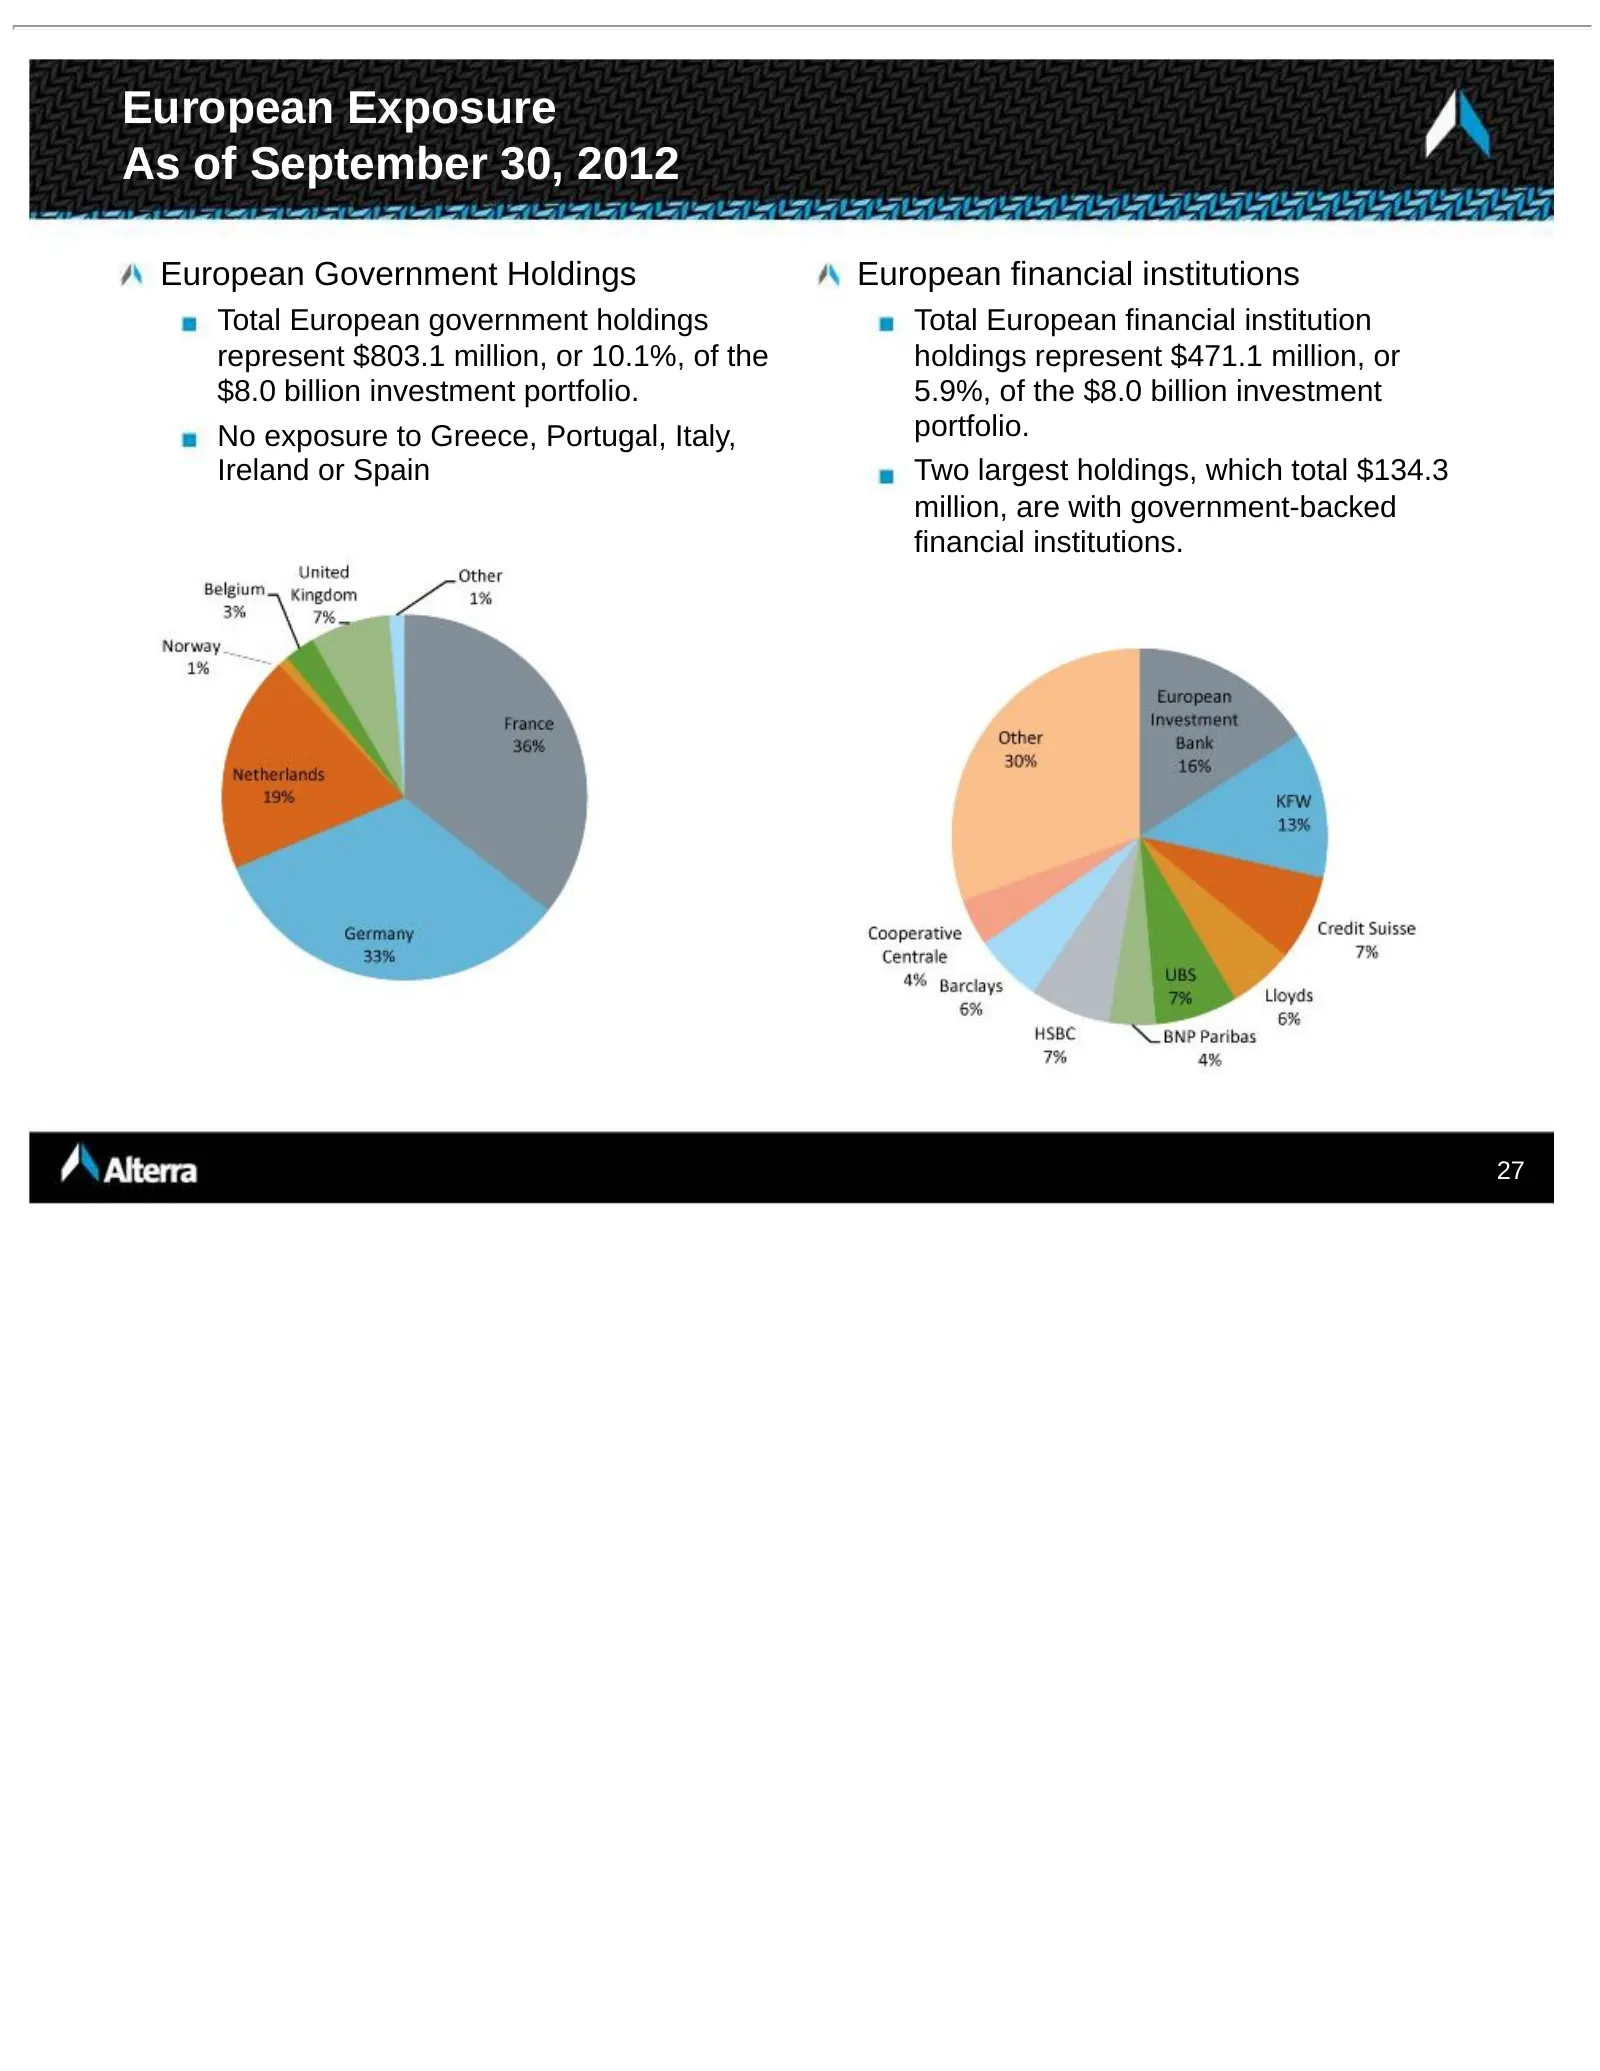
European Exposure As of September 30, 2012 European Government Holdings European financial institutions Total European government holdings Total European financial institution represent $803.1 million, or 10.1%, of the holdings represent $471.1 million, or $8.0 billion investment portfolio. 5.9%, of
Slide 28: Well Positioned to Build Shareholder Value
Well Positioned to Build Shareholder Value Franchise positions in attractive specialty markets Established operating platforms provide global access to business Diversified business portfolio across casualty and property lines Opportunistic approach – nimble and responsive to market trends High-qual
Slide 29: Appendices
Appendices 29
Slide 30: Strong Balance Sheet
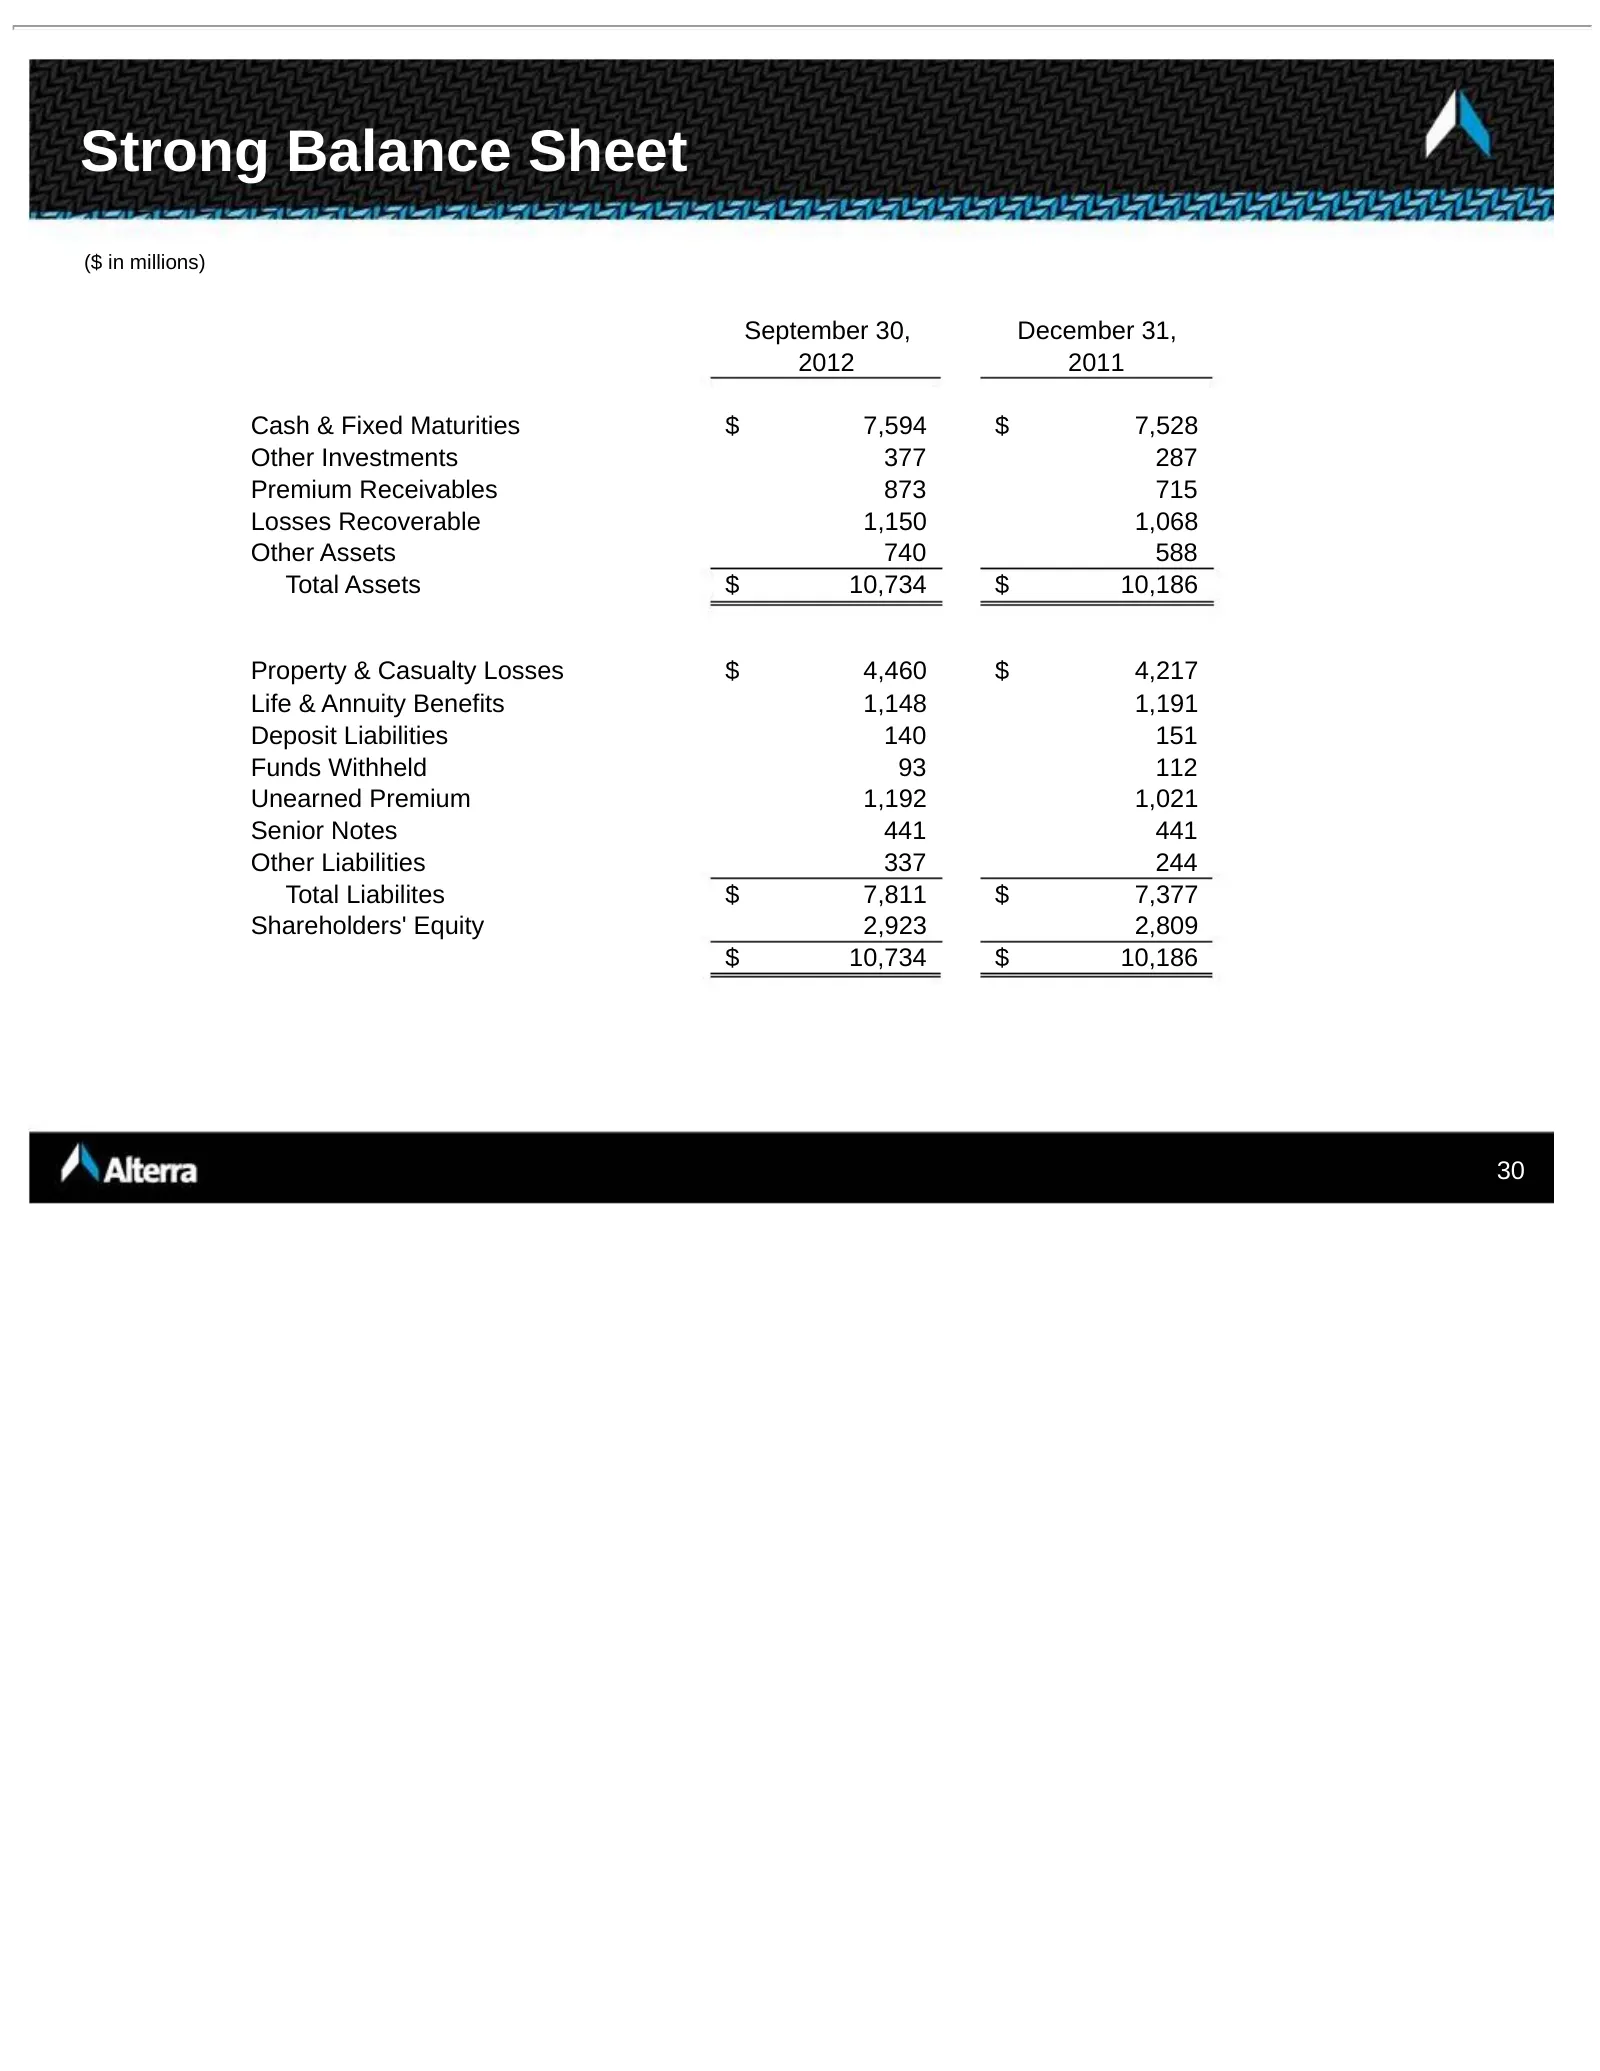
Strong Balance Sheet ($ in millions) September 30, December 31, 2012 2011 Cash & Fixed Maturities $ 7,594 $ 7,528 Other Investments 377 287 Premium Receivables 873 715 Losses Recoverable 1,150 1,068 Other Assets 740 588 Total Assets $ 10,734 $ 10,186 Property & Casualty Losses $ 4,460 $ 4,217 Life &
Slide 31: YTD Results Comparison
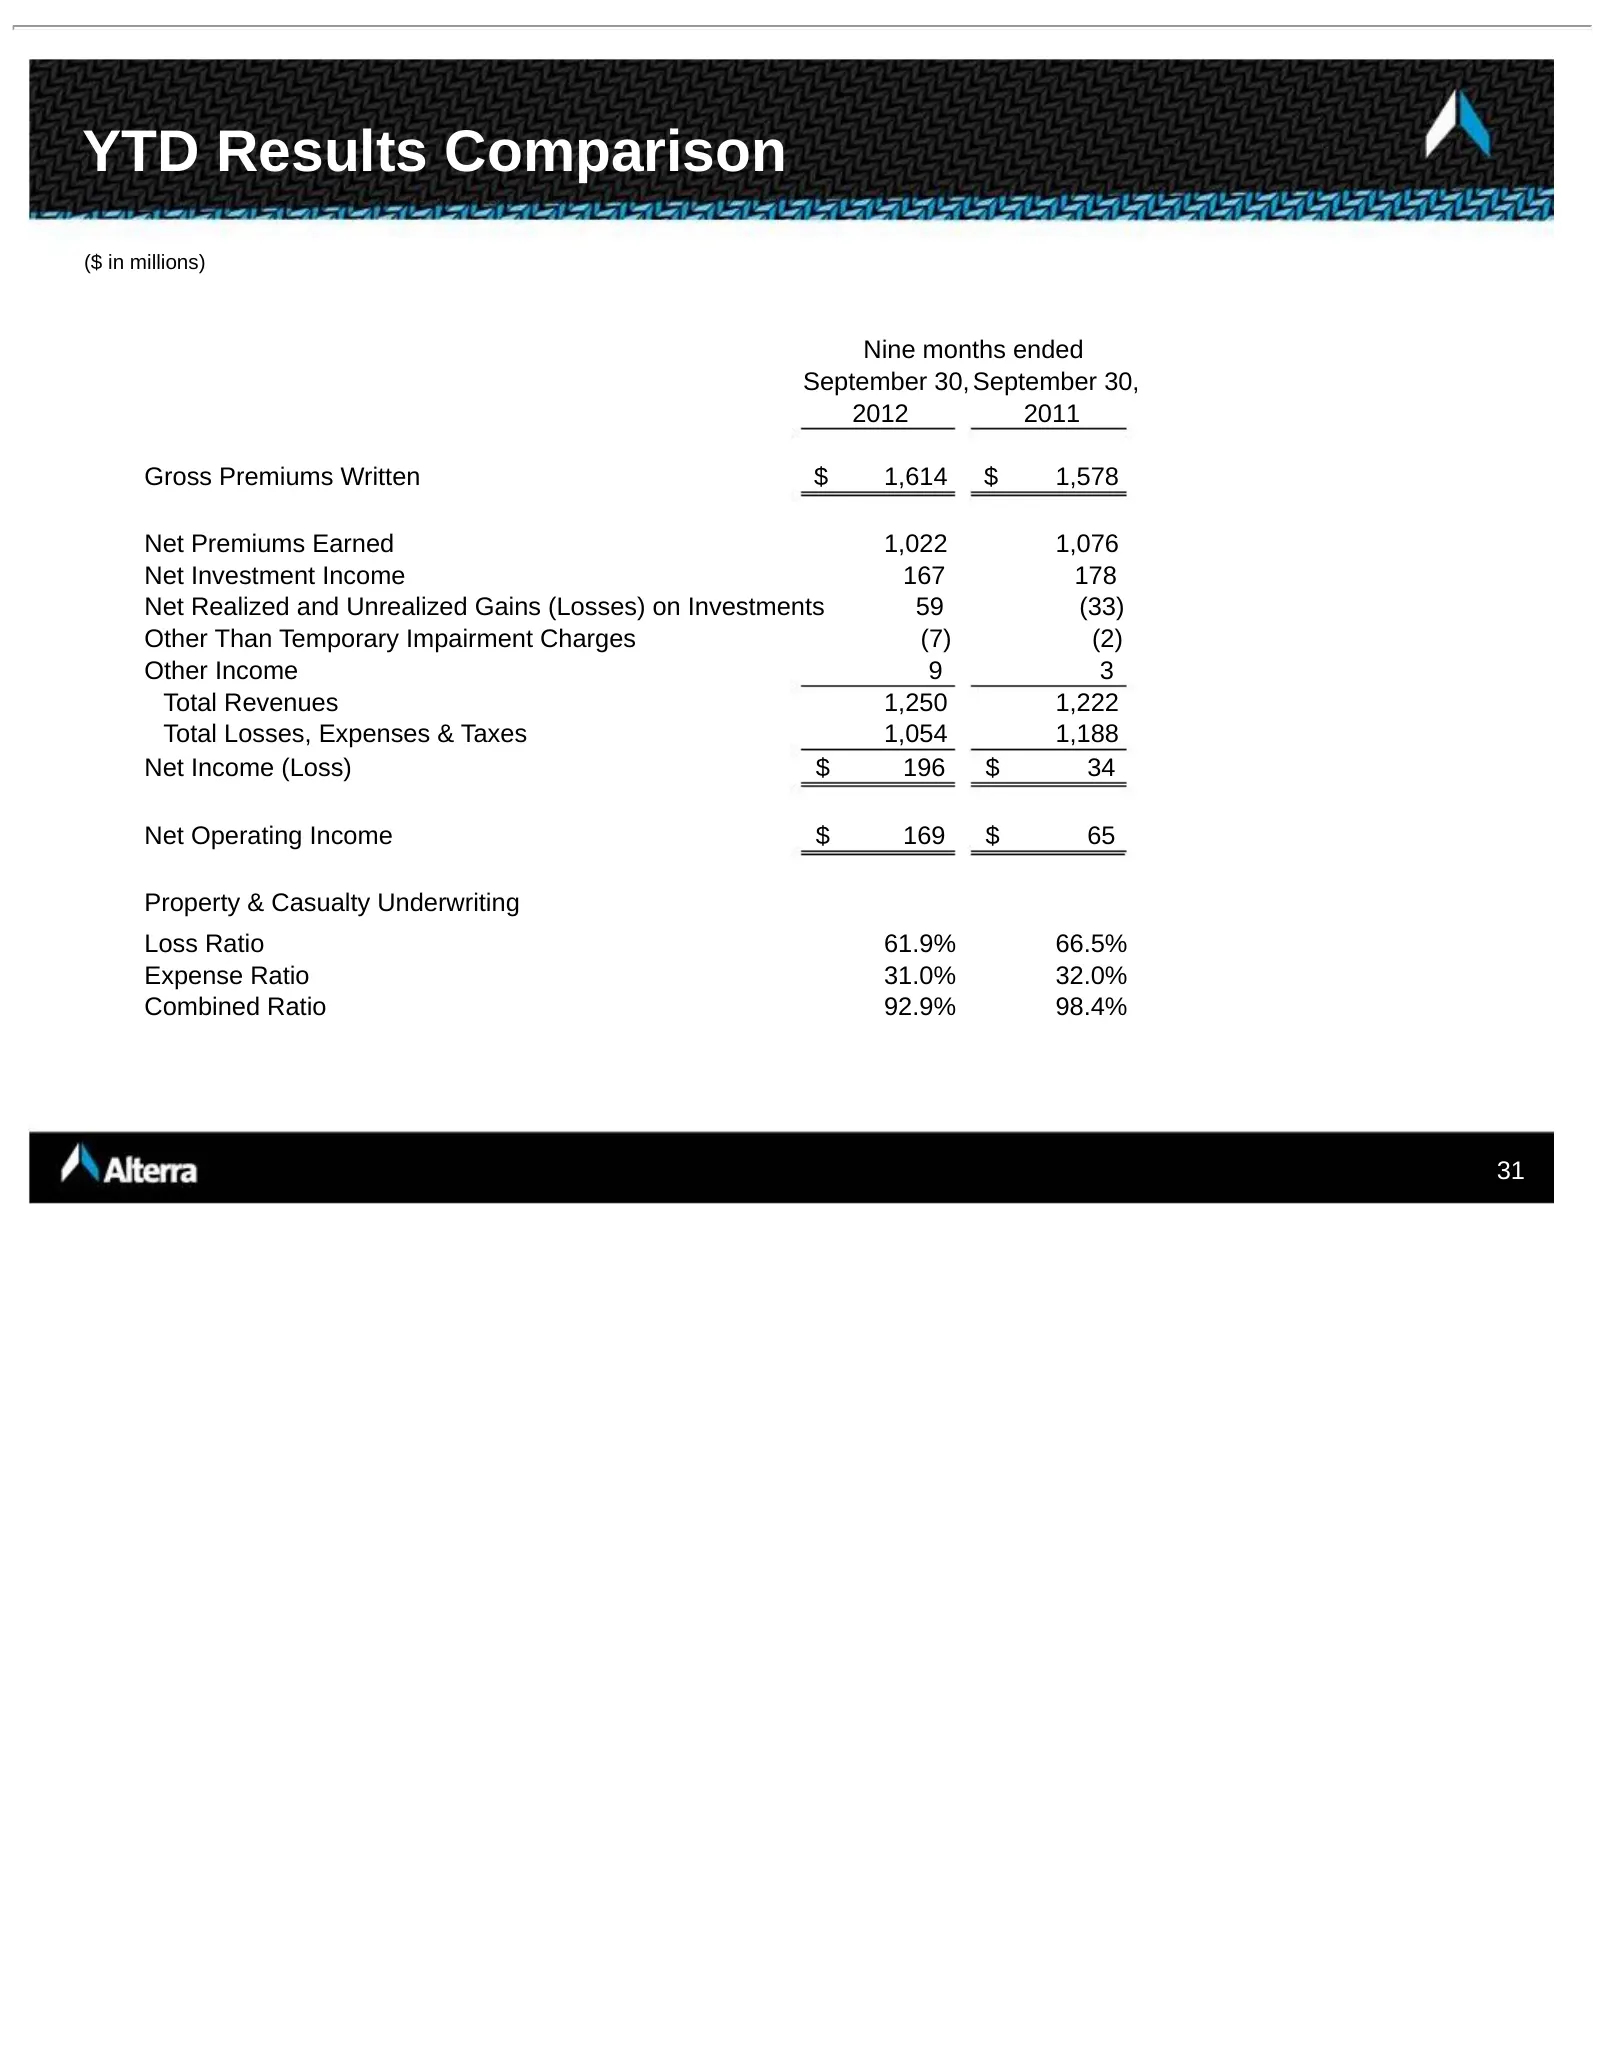
YTD Results Comparison ($ in millions) Nine months ended September 30, September 30, 2012 2011 Gross Premiums Written $ 1,614 $ 1,578 Net Premiums Earned 1,022 1,076 Net Investment Income 167 178 Net Realized and Unrealized Gains (Losses) on Investments 59 (33) Other Than Temporary Impairment Charge
Slide 32: Diversified Operating Platform
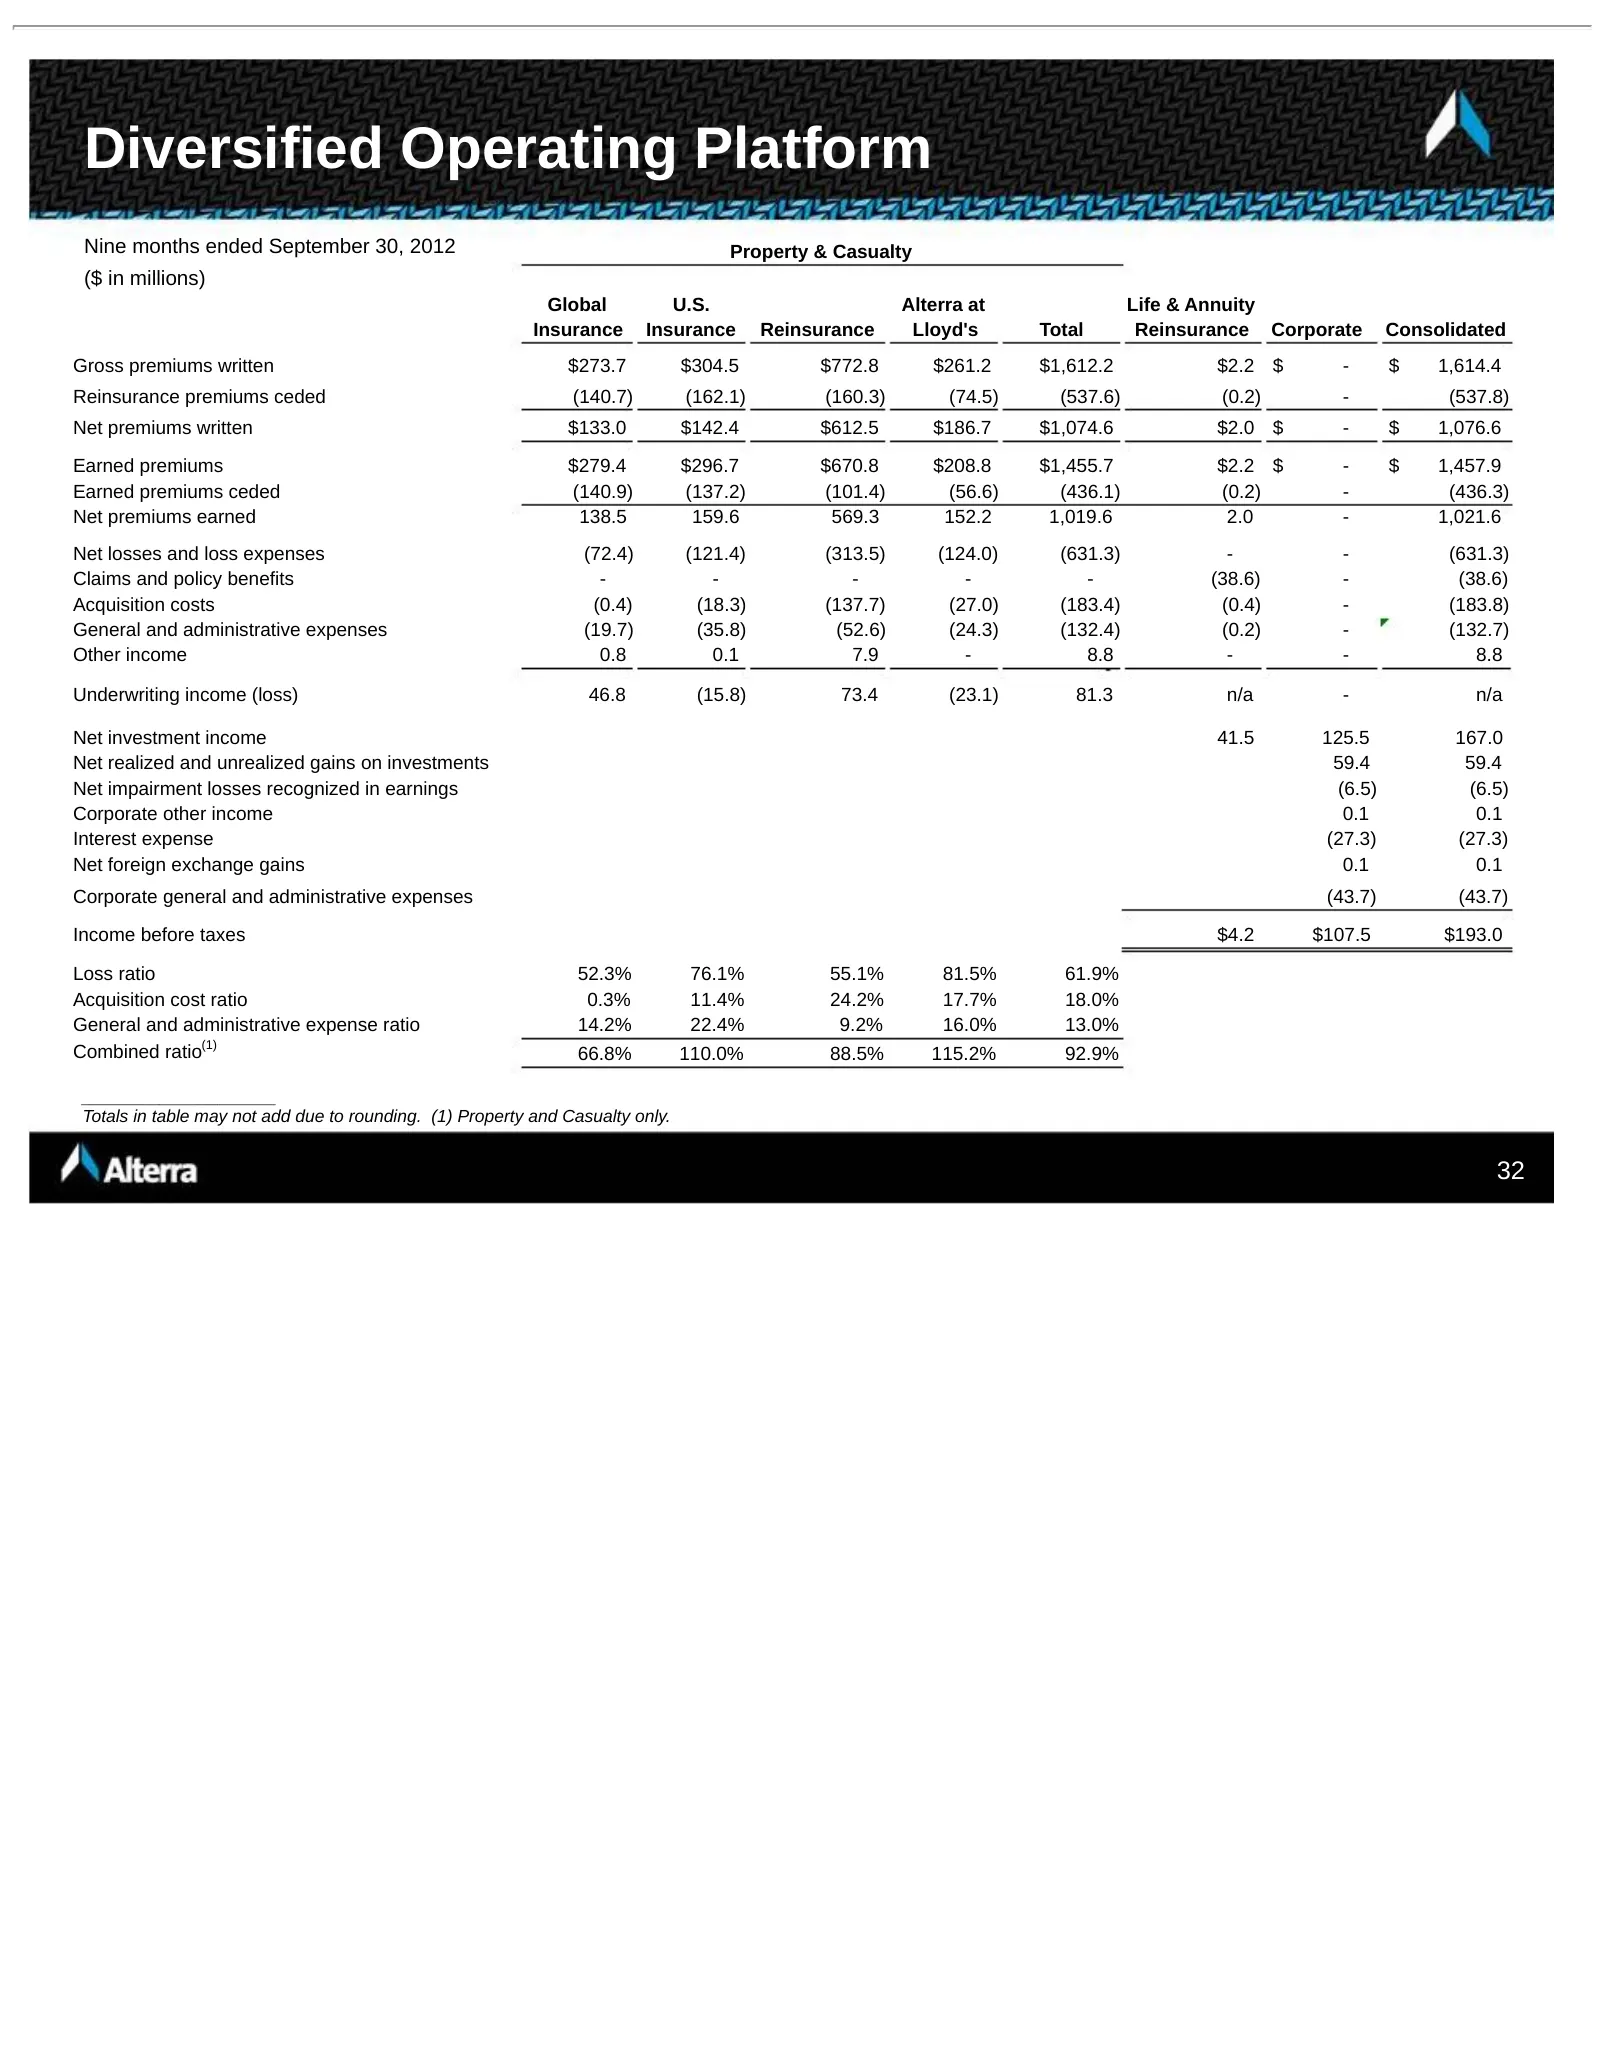
Diversified Operating Platform Nine months ended September 30, 2012 Property & Casualty ($ in millions) Global U.S. Alterra at Life & Annuity Insurance Insurance Reinsurance Lloyd's Total Reinsurance Corporate Consolidated Gross premiums written $273.7 $304.5 $772.8 $261.2 $1,612.2 $2.2 $ - $ 1,614.
Source: SEC EDGAR · 8-K filed Nov 29, 2012
More decks from ALTERRA CAPITAL HOLDINGS Ltd
 Merger or Acquisition (December 2012)16 slides · Dec 19, 2012
 Investor Presentation (September 2012)12 slides · Sep 12, 2012
 Investor Presentation (August 2012)33 slides · Aug 29, 2012
 Q1 2012 Earnings Presentation32 slides · May 25, 2012
 Q1 2012 Earnings Presentation28 slides · May 11, 2012
 Q4 2011 Earnings Presentation28 slides · Feb 13, 2012