Tellurian — Investor Presentation (January 2019)
37 slides from Tellurian's investor presentation, Jan 7, 2019
Slide 1: Disclaimer
2 Disclaimer
Slide 2: Introduction
Introduction 3 Introduction
Slide 3: Tellurian is capturing LNG value
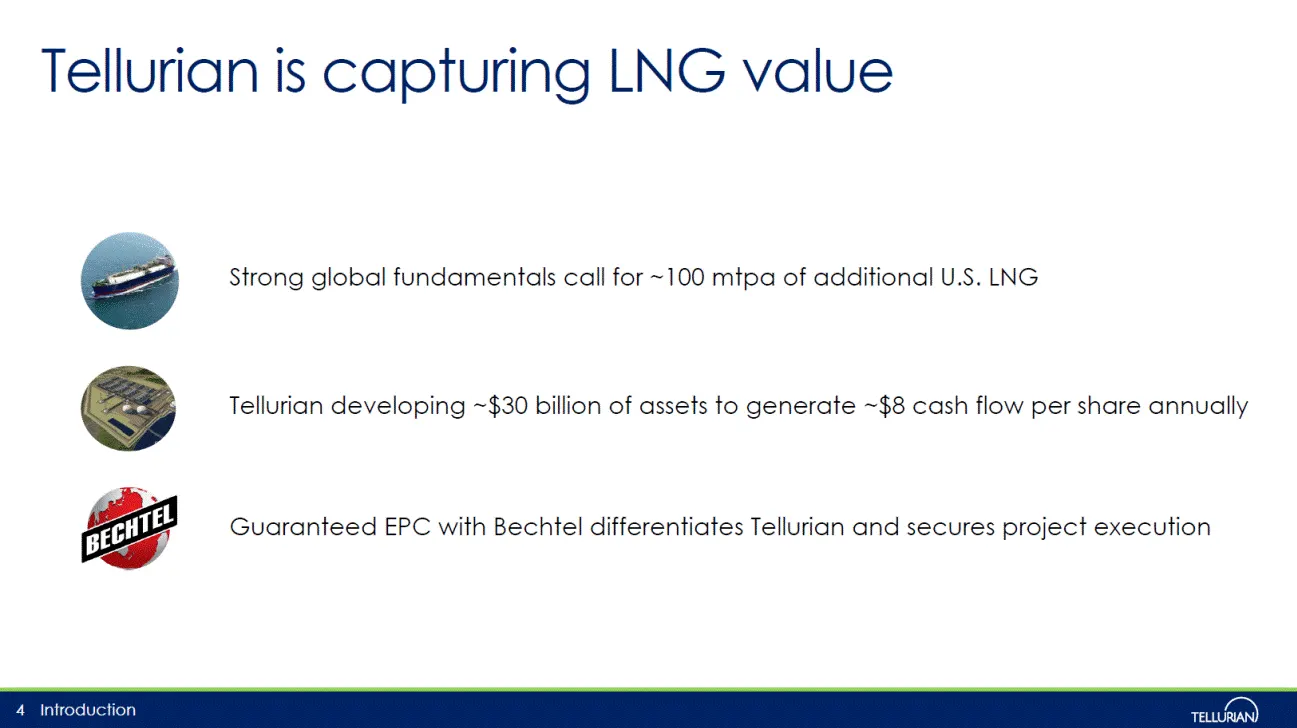
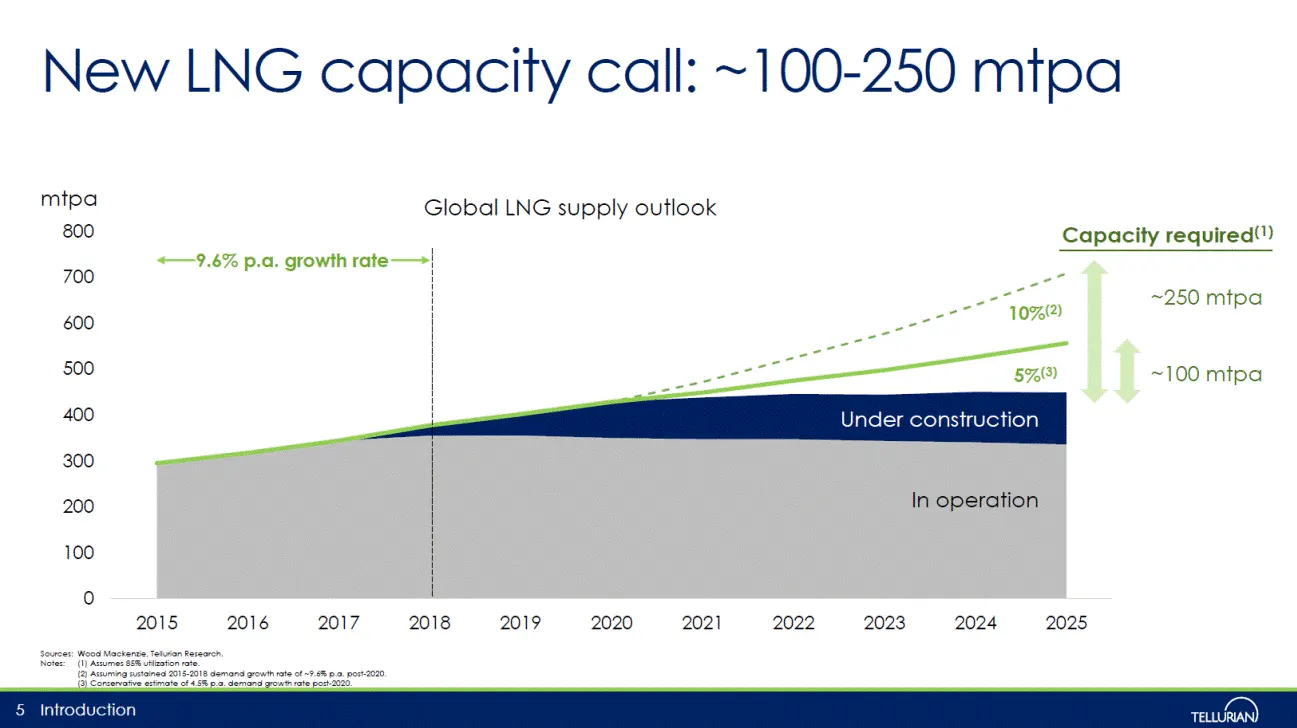
Tellurian is capturing LNG value Introduction 4 Strong global fundamentals call for ~100 mtpa of additional U.S. LNG Tellurian developing ~$30 billion of assets to generate ~$8 cash flow per share annually Guaranteed EPC with Bechtel differentiates Tellurian and secures project execution
Slide 4: New LNG capacity call: ~100-250 mtpa
New LNG capacity call: ~100-250 mtpa Introduction Sources: Wood Mackenzie, Tellurian Research. Notes: (1) Assumes 85% utilization rate. (2) Assuming sustained 2015-2018 demand growth rate of ~9.6% p.a. post-2020. (3) Conservative estimate of 4.5% p.a. demand growth rate post-2020. 5 mtpa Under const
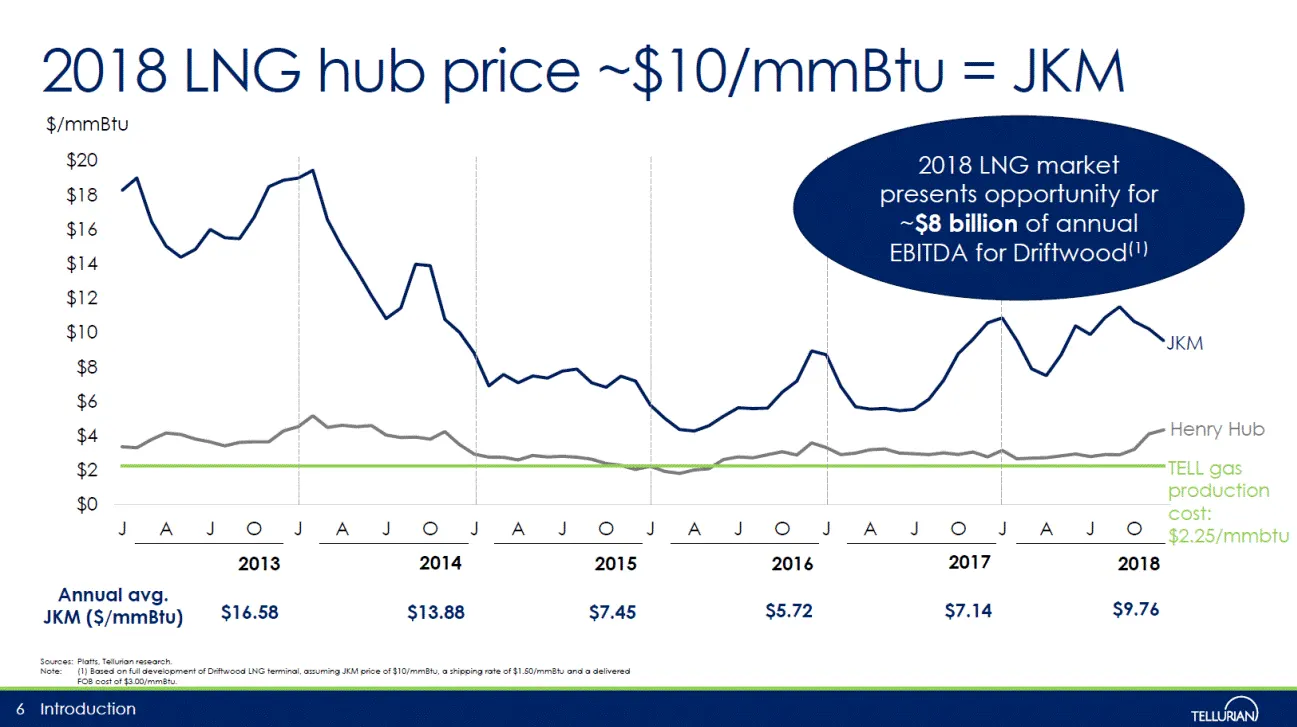
Slide 5: 2018 LNG market presents opportunity for ~$8 billion of annual EBITDA
$16.58 JKM TELL gas production cost: $2.25/mmbtu 2018 LNG hub price ~$10/mmBtu = JKM Introduction Sources: Platts, Tellurian research. Note: (1) Based on full development of Driftwood LNG terminal, assuming JKM price of $10/mmBtu, a shipping rate of $1.50/mmBtu and a delivered FOB cost of $3.00/mmBt
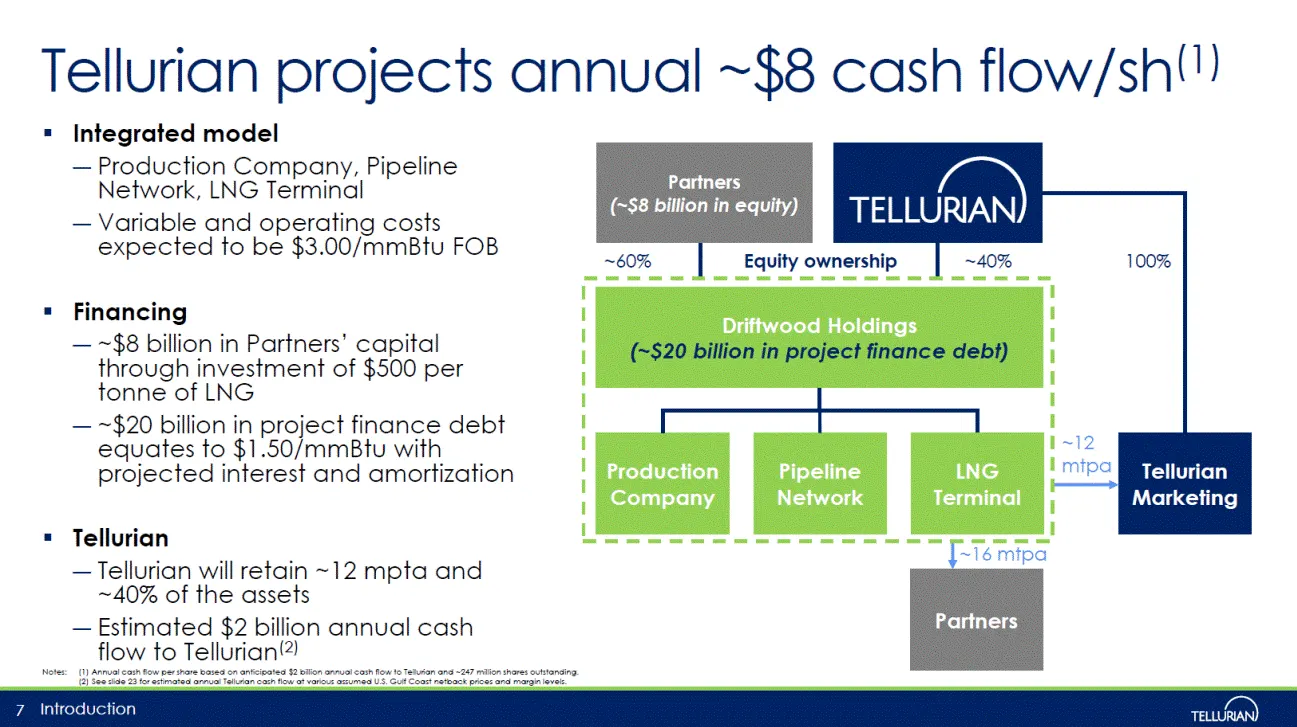
Slide 6: Integrated model: Production Company, Pipeline Network, LNG Terminal
Integrated model Production Company, Pipeline Network, LNG Terminal Variable and operating costs expected to be $3.00/mmBtu FOB Financing ~$8 billion in Partners’ capital through investment of $500 per tonne of LNG ~$20 billion in project finance debt equates to $1.50/mmBtu with projected interest a
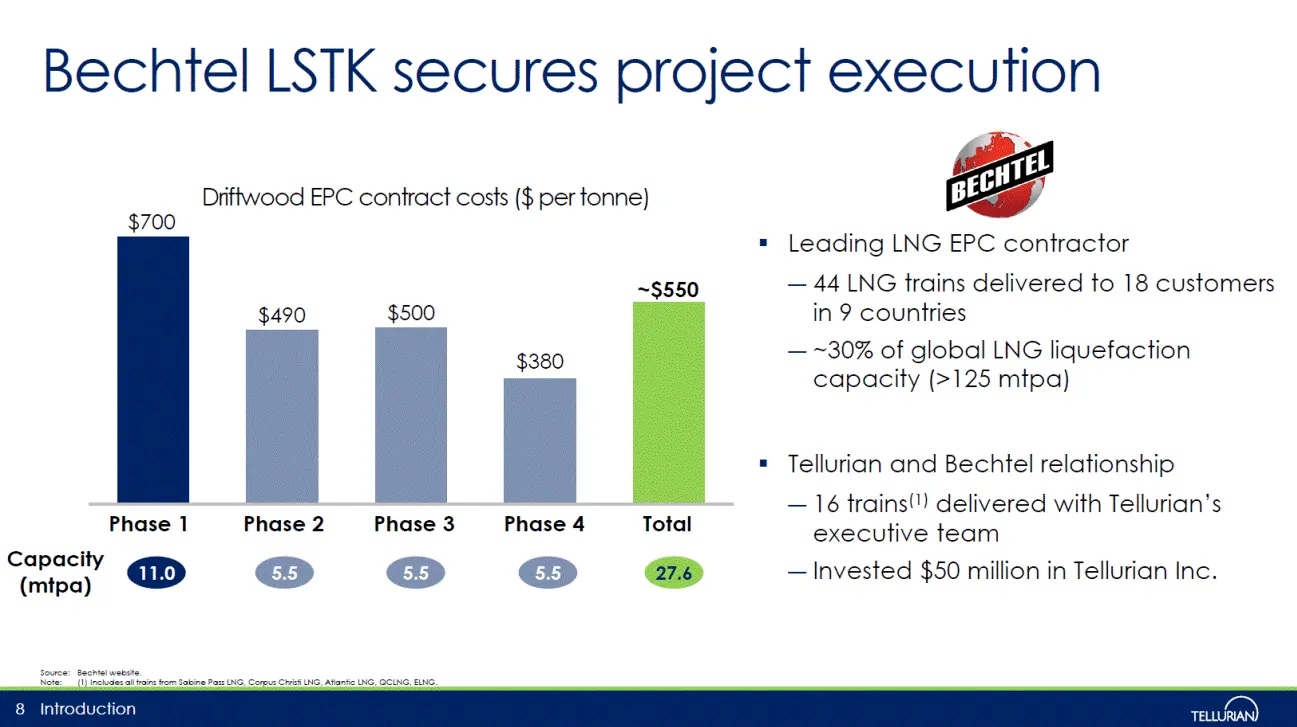
Slide 7: Bechtel LSTK secures project execution
Phase 1 Phase 2 Phase 3 Phase 4 Total Bechtel LSTK secures project execution Introduction Leading LNG EPC contractor 44 LNG trains delivered to 18 customers in 9 countries ~30% of global LNG liquefaction capacity (>125 mtpa) Tellurian and Bechtel relationship 16 trains(1) delivered with Tellurian’s
Slide 8: Tellurian and Vitol sign JKM-indexed MOU
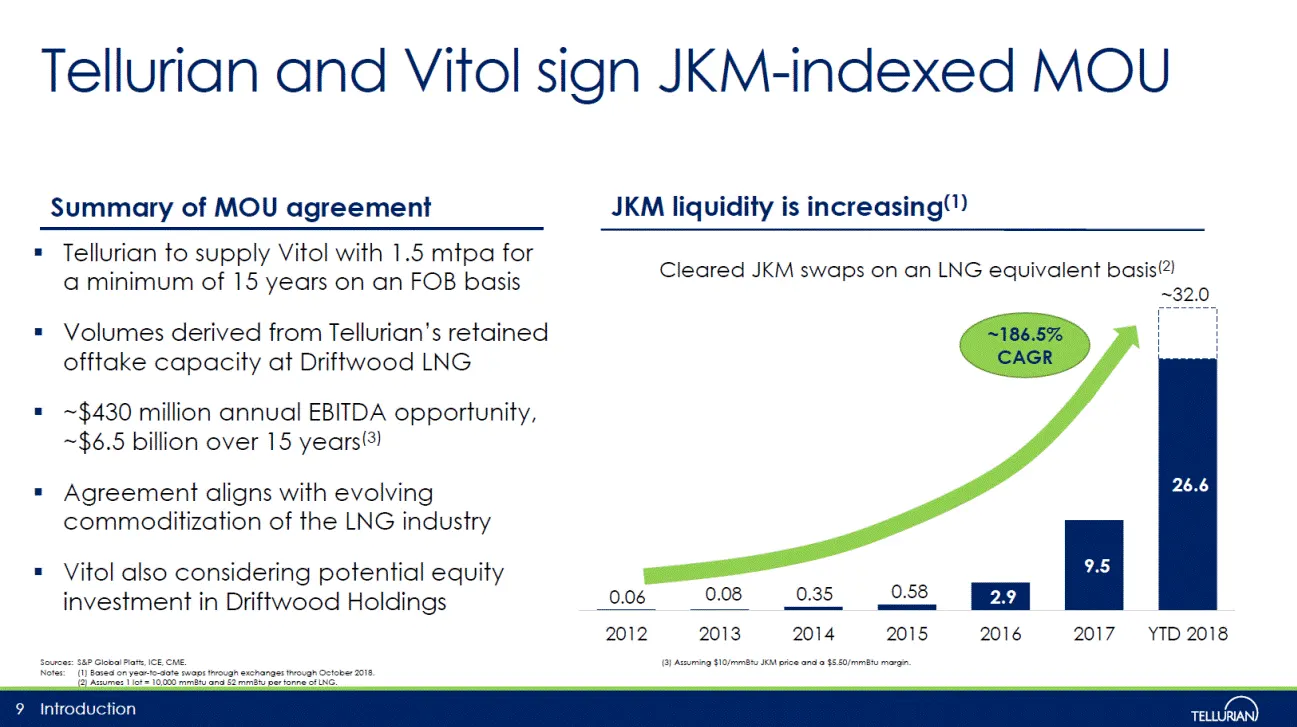
Tellurian and Vitol sign JKM-indexed MOU Introduction Tellurian to supply Vitol with 1.5 mtpa for a minimum of 15 years on an FOB basis Volumes derived from Tellurian’s retained offtake capacity at Driftwood LNG ~$430 million annual EBITDA opportunity, ~$6.5 billion over 15 years(3) Agreement aligns
Slide 9: Final Investment Decision expected 1H 2019
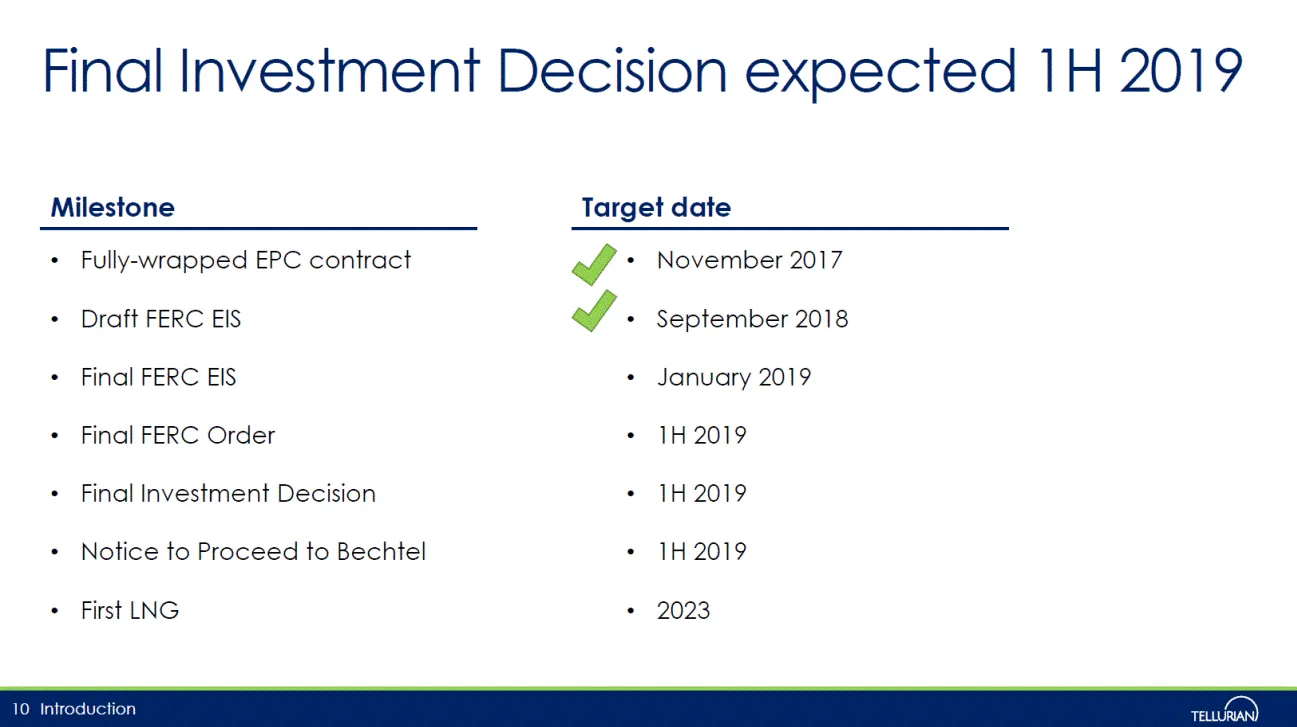
Final Investment Decision expected 1H 2019 Introduction 10 Fully-wrapped EPC contract Draft FERC EIS Final FERC EIS Final FERC Order Final Investment Decision Notice to Proceed to Bechtel First LNG Milestone Target date November 2017 September 2018 January 2019 1H 2019 1H 2019 1H 2019 2023
Slide 10: Tellurian differentiated to provide value
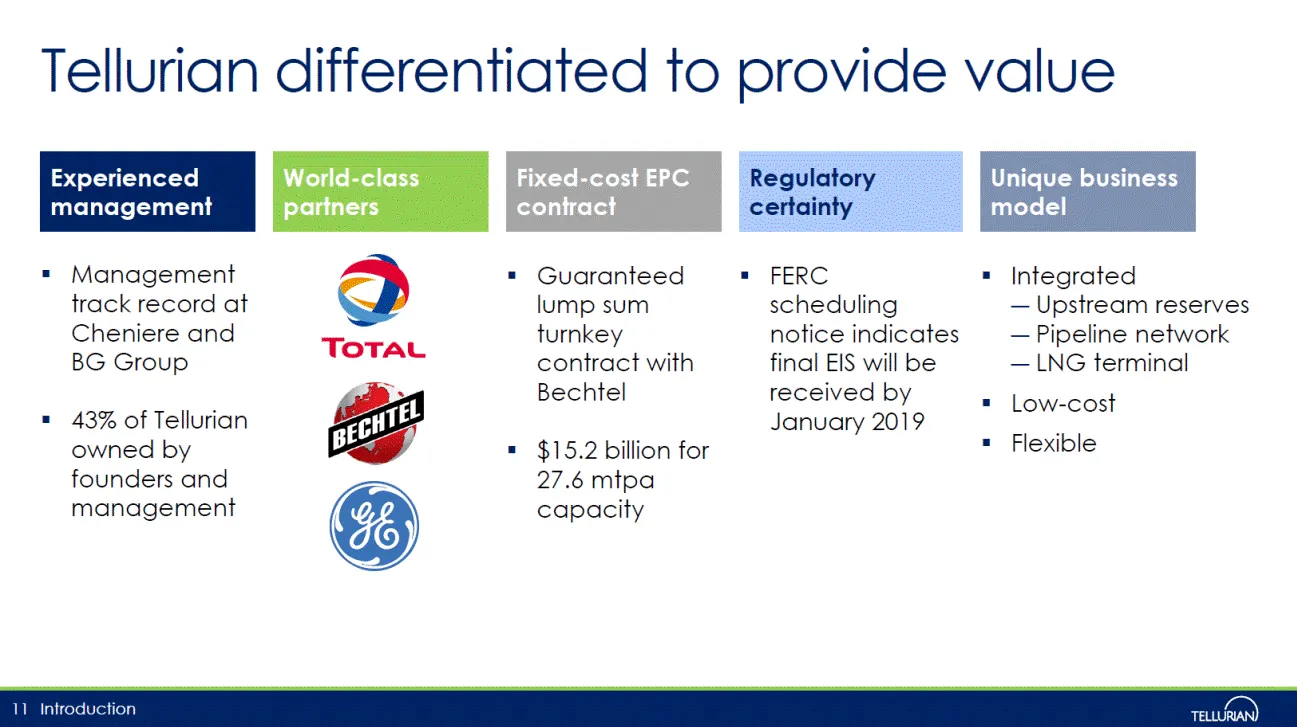
Tellurian differentiated to provide value Introduction 11 Management track record at Cheniere and BG Group 43% of Tellurian owned by founders and management Guaranteed lump sum turnkey contract with Bechtel $15.2 billion for 27.6 mtpa capacity FERC scheduling notice indicates final EIS will be recei
Slide 11: Contact us
Social media Contact us Amit Marwaha Director, Investor Relations & Finance +1 832 485 2004 amit.marwaha@tellurianinc.com Joi Lecznar SVP, Public Affairs & Communication +1 832 962 4044 joi.lecznar@tellurianinc.com 12 Introduction @TellurianLNG
Slide 12: Project details
Project details 13 Project details
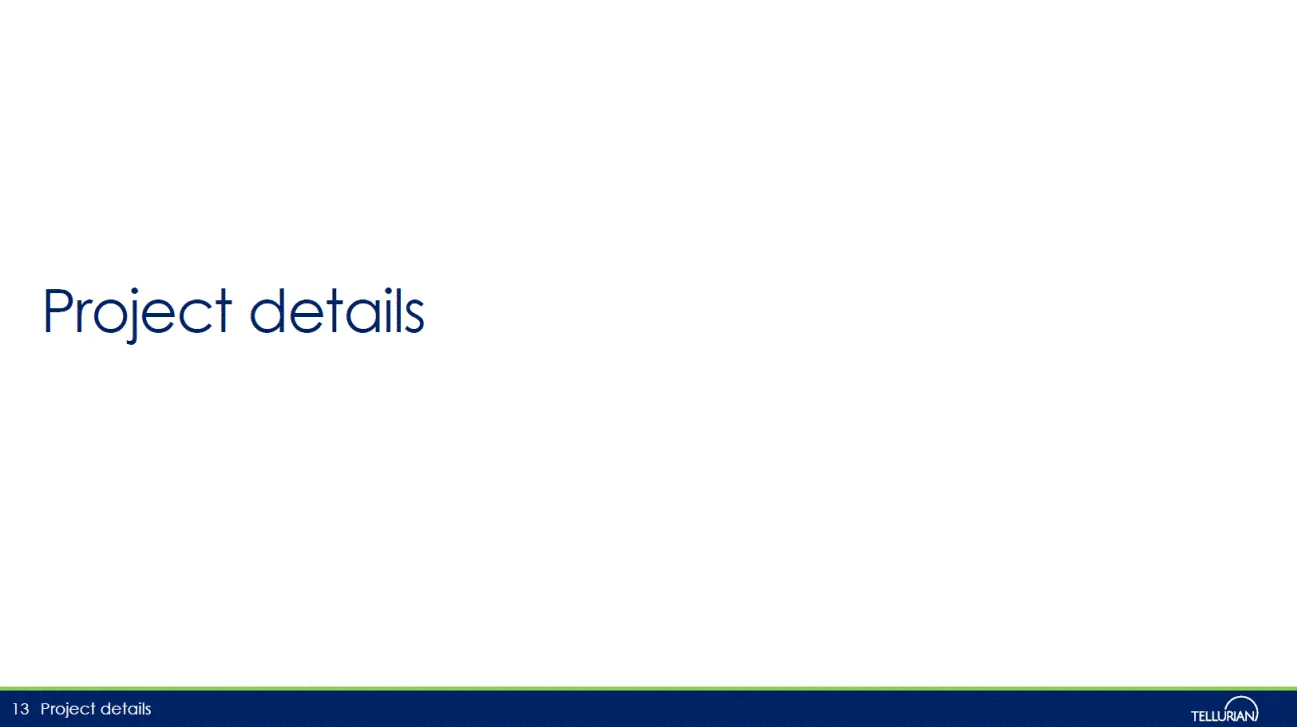
Slide 13: Integrated to manage three risks
Basin 10,800 Haynesville acres 1.4 Tcf of resource Intend to acquire 15 Tcf Basis ~$7 billion of pipeline projects, providing access to Haynesville, Permian, & Appalachia supply Integrated to manage three risks Project details 14 Construction ~$15 billion liquefaction project in Louisiana
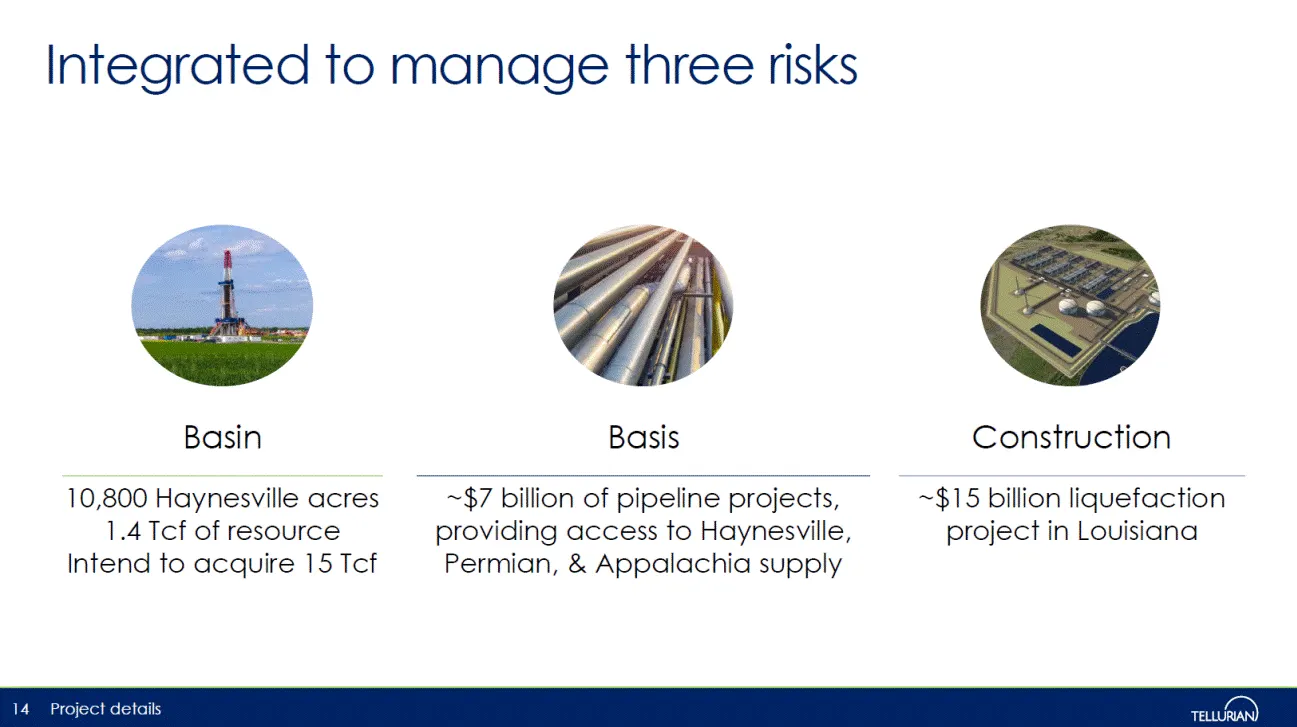
Slide 14: Driftwood LNG terminal
Driftwood LNG terminal Note: (1) Based on engineering, procurement, and construction agreements executed with Bechtel. 15 Driftwood LNG terminal Land ~1,000 acres near Lake Charles, LA Capacity ~27.6 mtpa Trains Up to 20 trains of ~1.38 mtpa each Chart heat exchangers GE LM6000 PF+ compressors Stora
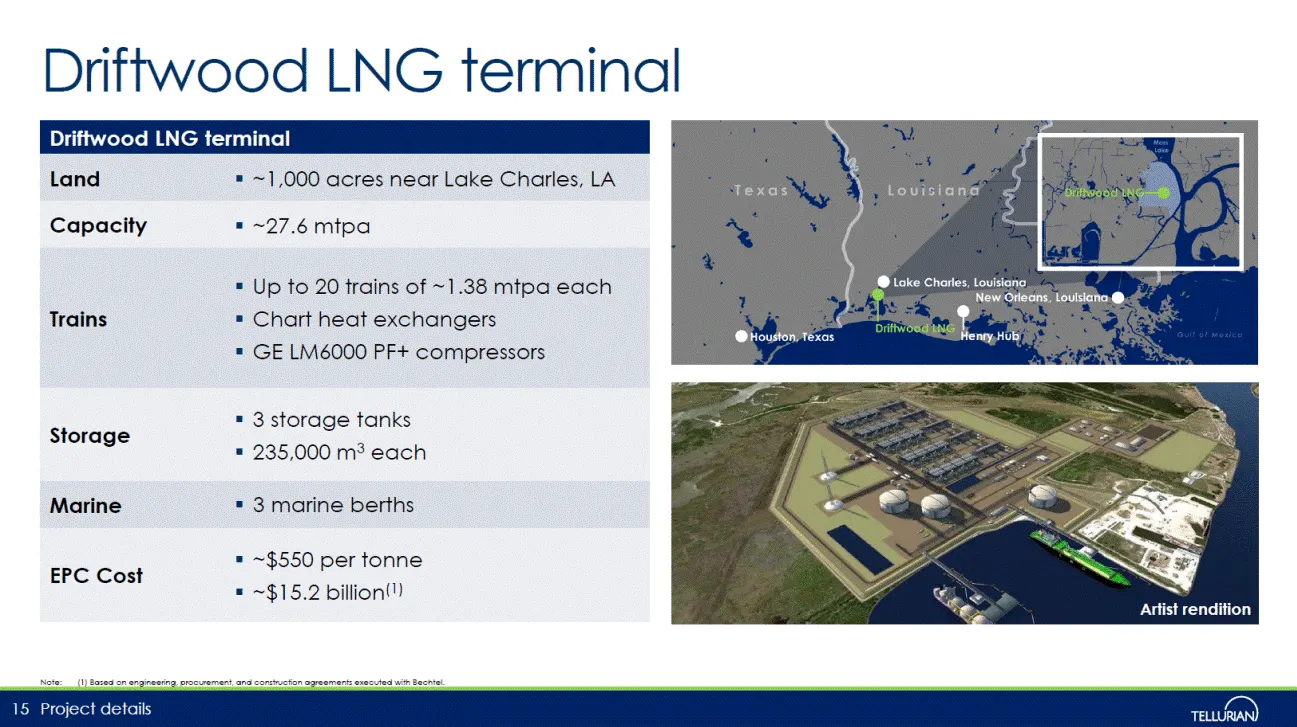
Slide 15: Pipeline network
Pipeline network Note: (1) Included in Driftwood Holdings at full development; commercial and regulatory processes in progress and financial structuring under review. 16 Project details Driftwood Pipeline(1) Capacity (Bcf/d) 4.0 Cost ($ billions) $2.2 Length (miles) 96 Diameter (inches) 48 Compressi
Slide 16: >100 Tcf available resources in Haynesville
>100 Tcf available resources in Haynesville Project details Sources: IHS Enerdeq; 1Derrick; investor presentations; Tellurian research. Note: (1) Estimated resources based on acreage. 17 Driftwood Holdings plans to fund and purchase 15 Tcf Potential acquisition targets: Range of resources per target
Slide 17: Driftwood Holdings' financing
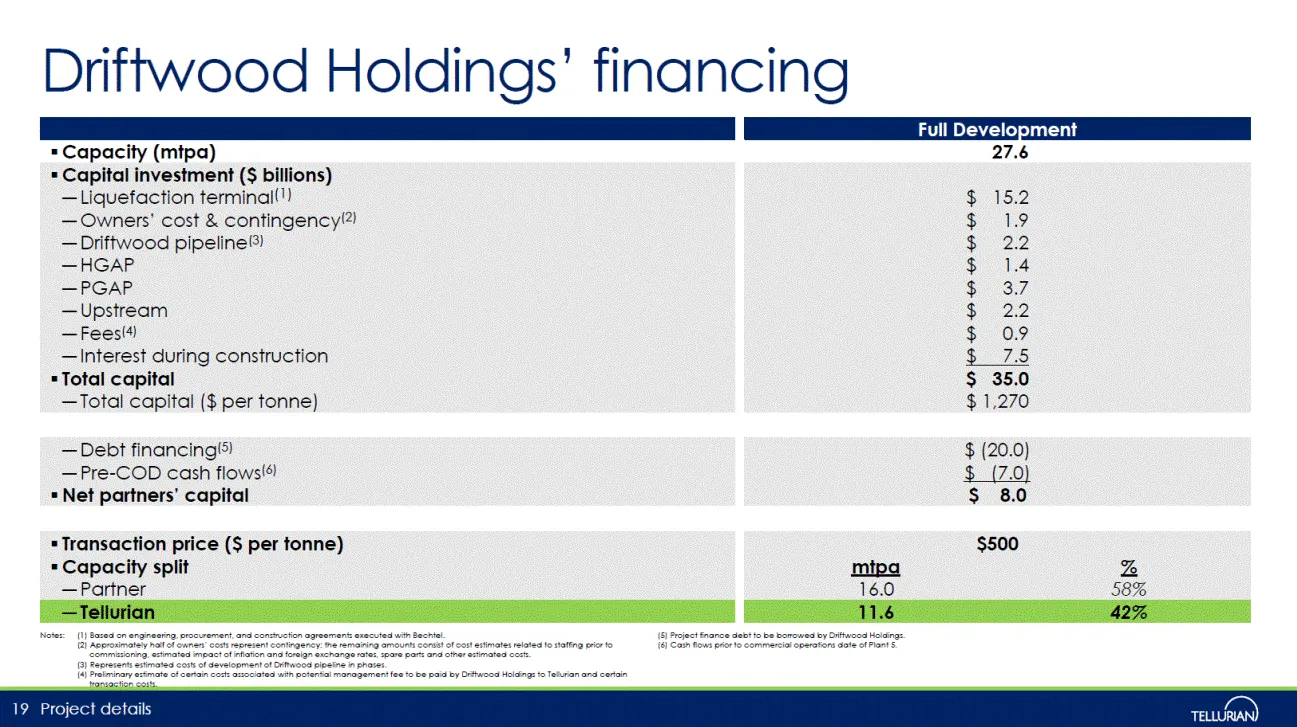
Driftwood Holdings’ financing Project details 19 Full Development Capacity (mtpa) 27.6 Capital investment ($ billions) Liquefaction terminal(1) $ 15.2 Owners’ cost & contingency(2) $ 1.9 Driftwood pipeline(3) $ 2.2 HGAP $ 1.4 PGAP $ 3.7 Upstream $ 2.2 Fees(4) $ 0.9 Interest during construction $ 7.5
Slide 18: Driftwood Holdings' operating costs
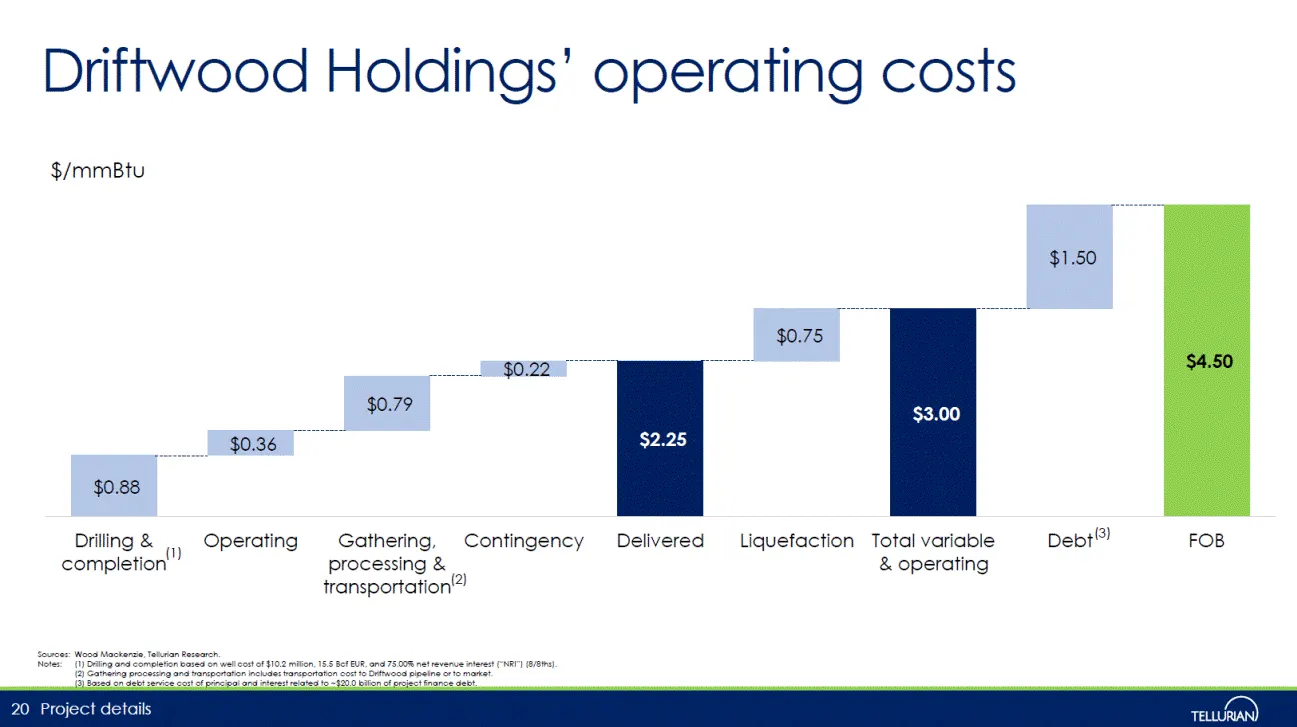
Driftwood Holdings’ operating costs Project details Sources: Wood Mackenzie, Tellurian Research. Notes: (1) Drilling and completion based on well cost of $10.2 million, 15.5 Bcf EUR, and 75.00% net revenue interest (“NRI”) (8/8ths). (2) Gathering processing and transportation includes transportation
Slide 19: Margins and price signals
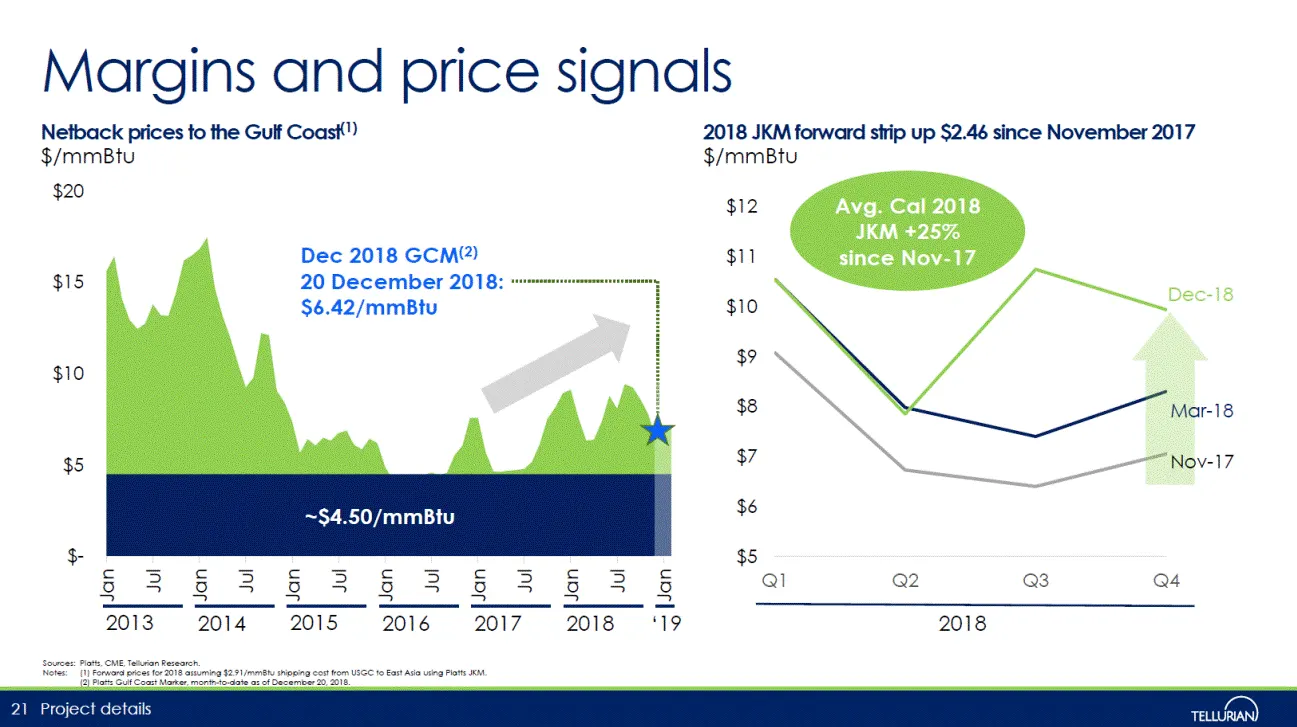
Margins and price signals Project details Netback prices to the Gulf Coast(1) Sources: Platts, CME, Tellurian Research. Notes: (1) Forward prices for 2018 assuming $2.91/mmBtu shipping cost from USGC to East Asia using Platts JKM. (2) Platts Gulf Coast Marker, month-to-date as of December 20, 2018.
Slide 20: Returns to Driftwood Holdings' partners
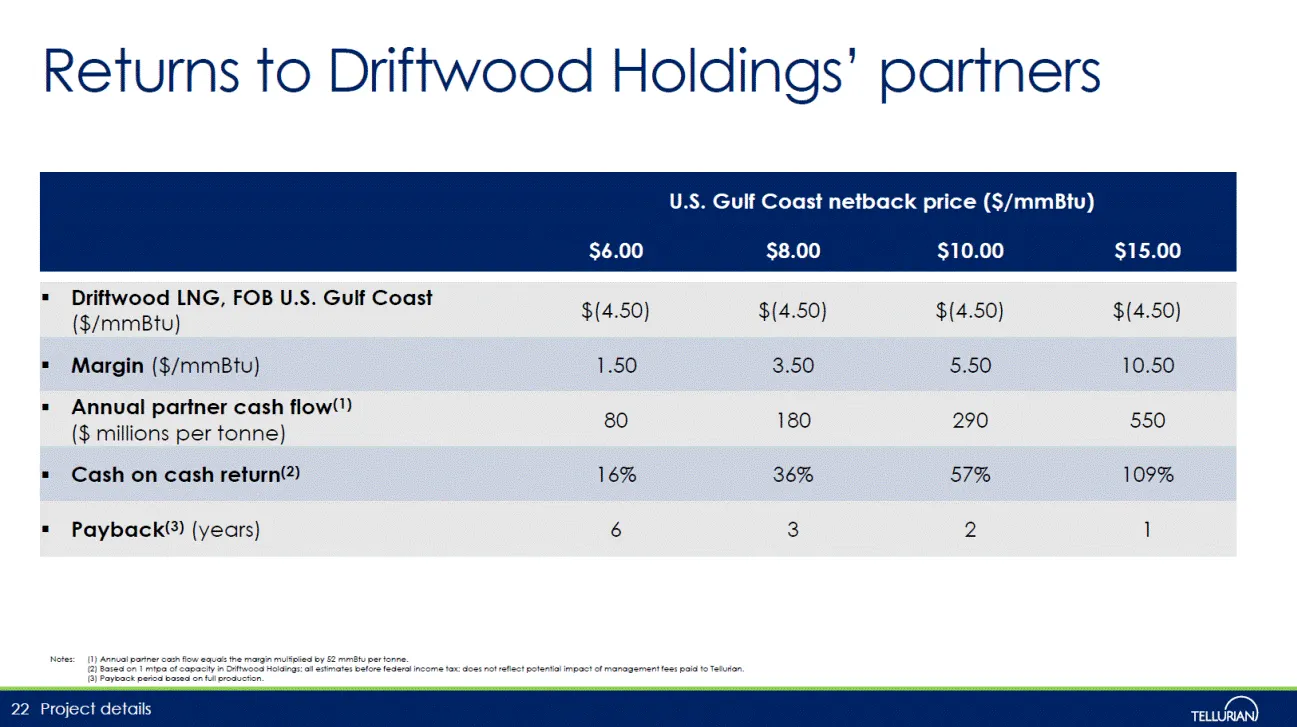
Returns to Driftwood Holdings’ partners Project details 22 U.S. Gulf Coast netback price ($/mmBtu) $6.00 $8.00 $10.00 $15.00 Driftwood LNG, FOB U.S. Gulf Coast ($/mmBtu) $(4.50) $(4.50) $(4.50) $(4.50) Margin ($/mmBtu) 1.50 3.50 5.50 10.50 Annual partner cash flow(1) ($ millions per tonne) 80 180 29
Slide 21: Value to Tellurian Inc.
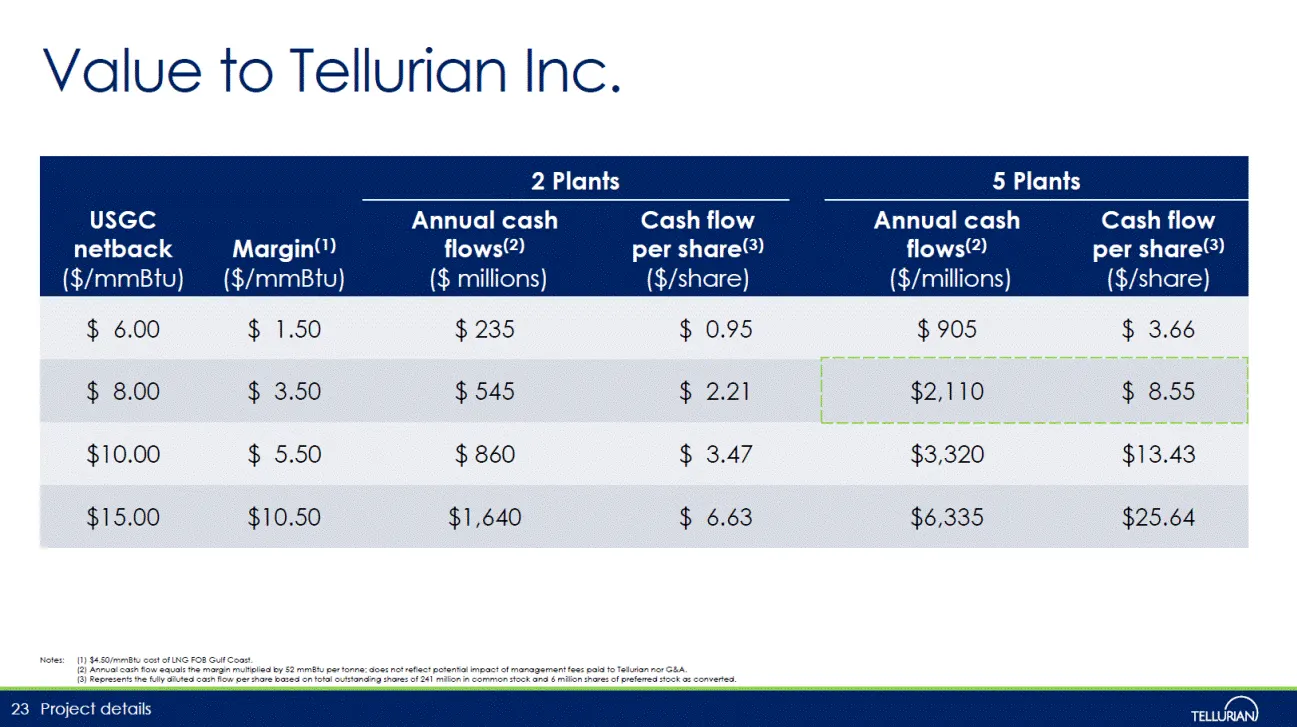
USGC netback ($/mmBtu) Margin(1) ($/mmBtu) 2 Plants 5 Plants Annual cash flows(2) ($ millions) Cash flow per share(3) ($/share) Annual cash flows(2) ($/millions) Cash flow per share(3) ($/share) $ 6.00 $ 1.50 $ 235 $ 0.95 $ 905 $ 3.66 $ 8.00 $ 3.50 $ 545 $ 2.21 $2,110 $ 8.55 $10.00 $ 5.50 $ 860 $ 3.
Slide 22: Additional detail
Additional detail 24 Additional detail

Slide 23: Global commodity requires low-cost solutions
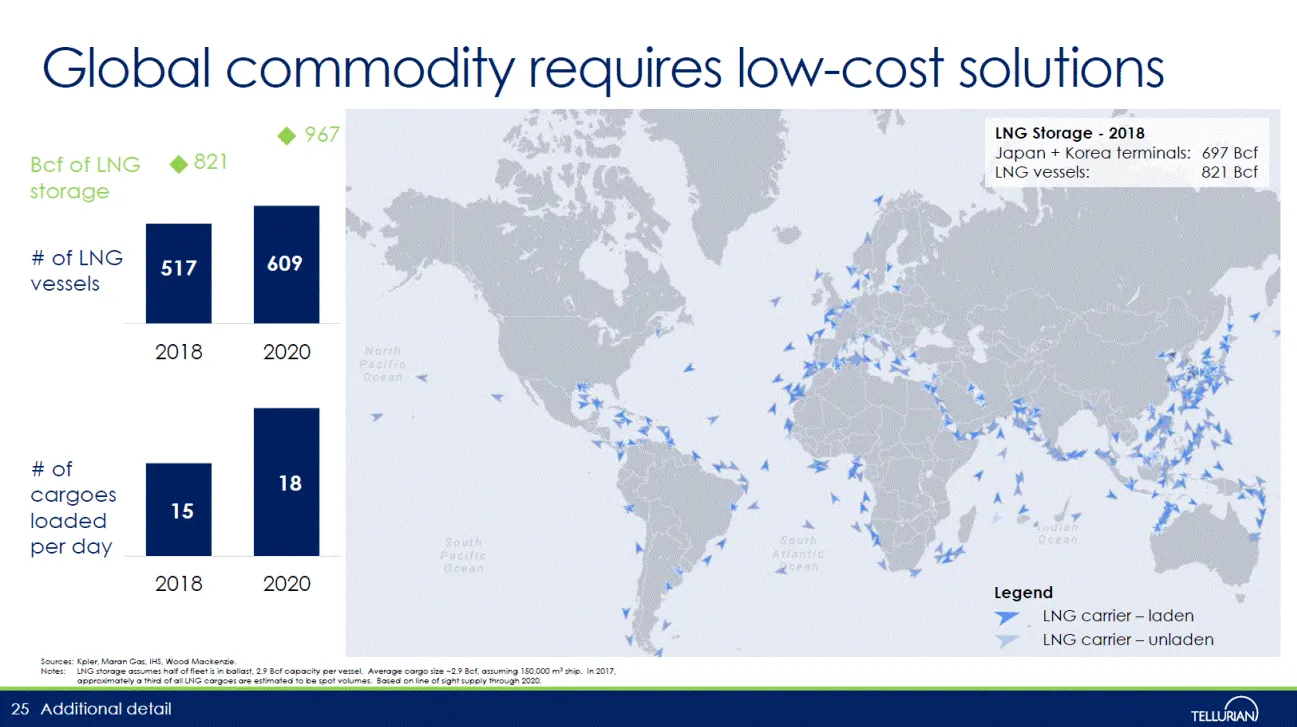
Sources: Kpler, Maran Gas, IHS, Wood Mackenzie. Notes: LNG storage assumes half of fleet is in ballast, 2.9 Bcf capacity per vessel. Average cargo size ~2.9 Bcf, assuming 150,000 m3 ship. In 2017, approximately a third of all LNG cargoes are estimated to be spot volumes. Based on line of sight suppl
Slide 24: Owning pipeline infrastructure mitigates basis risk
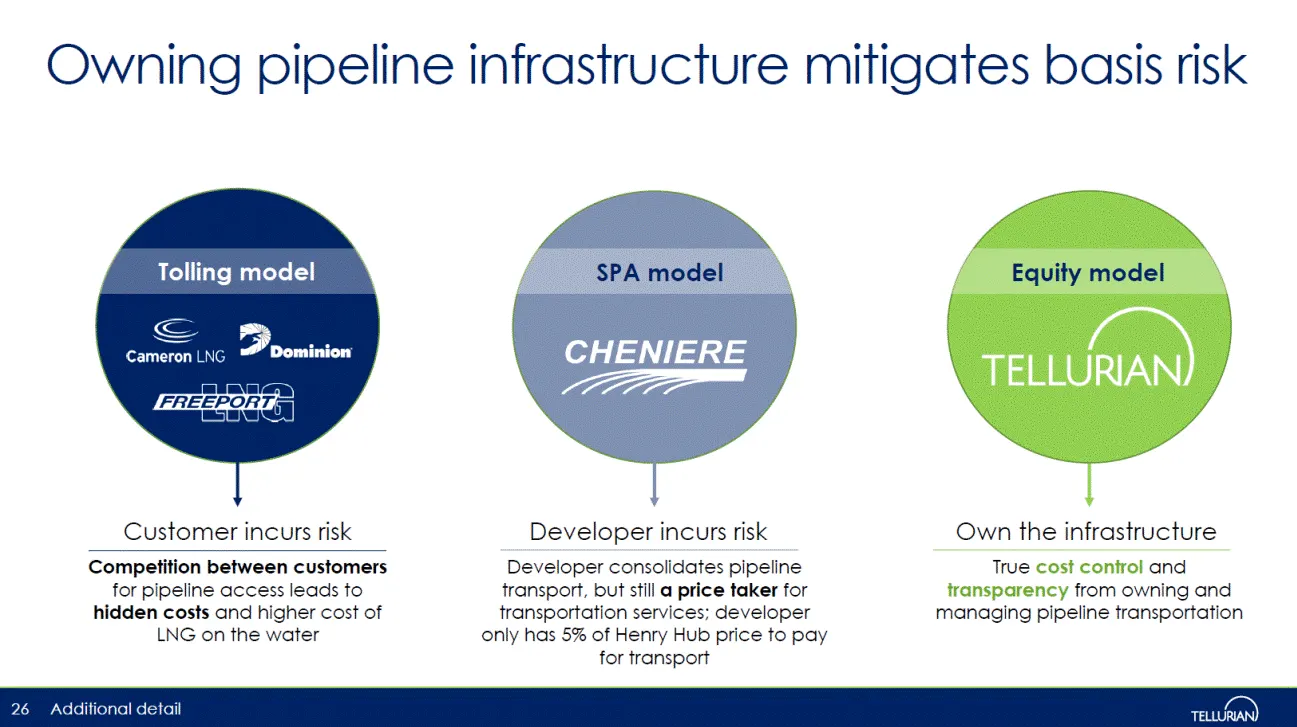
Owning pipeline infrastructure mitigates basis risk Additional detail 26 Tolling model SPA model Equity model Customer incurs risk Competition between customers for pipeline access leads to hidden costs and higher cost of LNG on the water Developer incurs risk Developer consolidates pipeline transpo
Slide 25: Building a low-cost global gas business
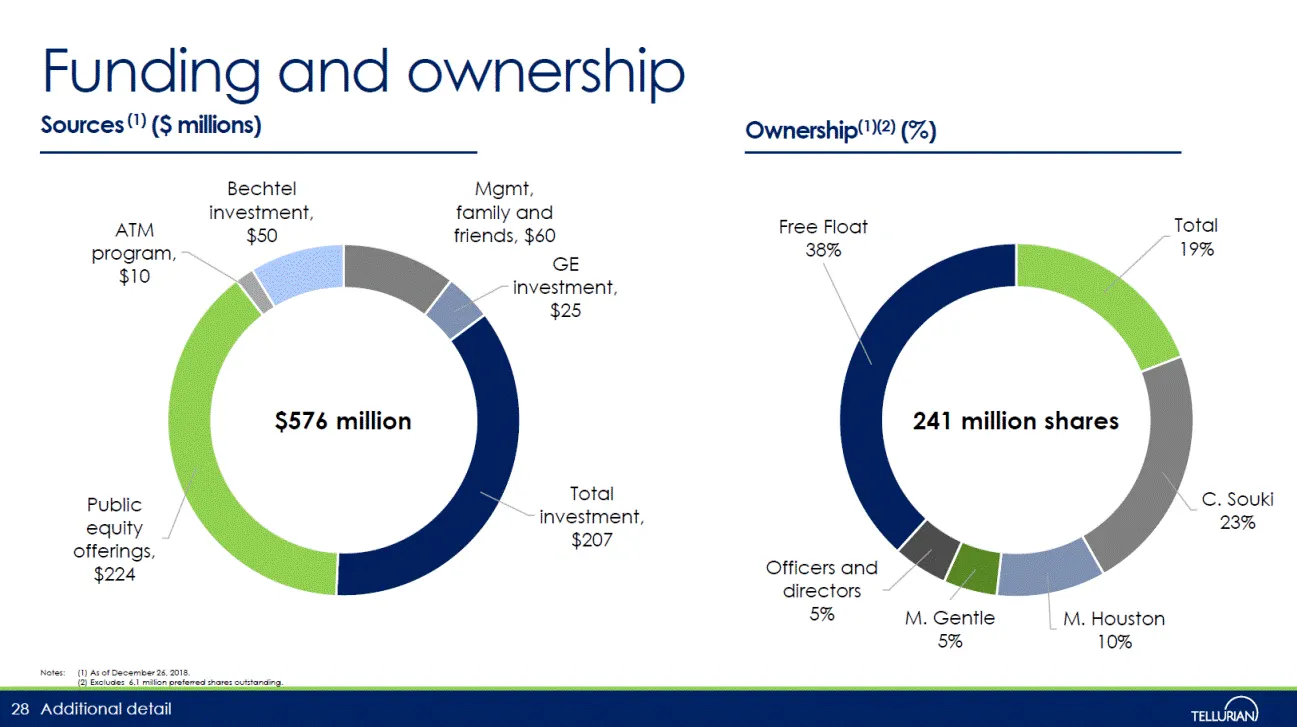
Building a low-cost global gas business 27 Additional detail June Raise approximately $115 million in public equity March Bechtel invests $50 million in Tellurian Feb/March Announce open seasons for Haynesville Global Access Pipeline and Permian Global Access Pipeline December Raise approximately $1
Slide 26: Driftwood vs. competitors – cost per tonne
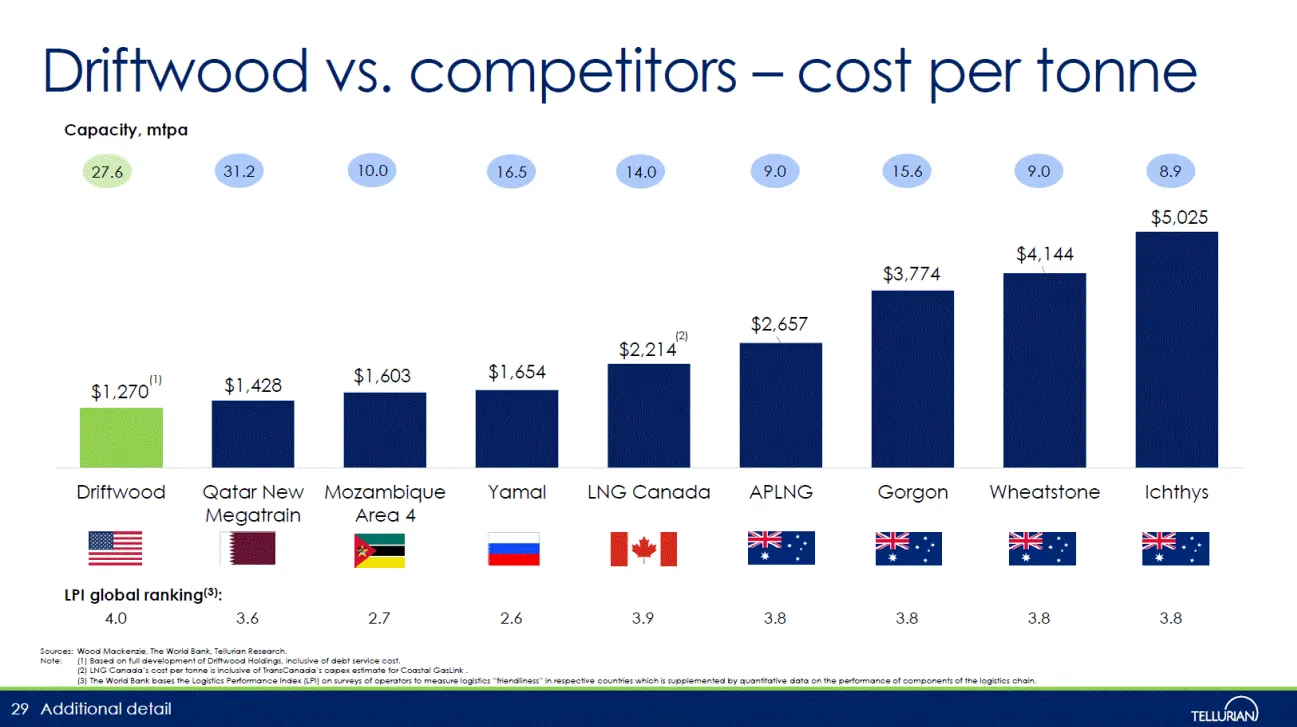
Driftwood vs. competitors – cost per tonne Sources: Wood Mackenzie, The World Bank, Tellurian Research. Note: (1) Based on full development of Driftwood Holdings, inclusive of debt service cost. (2) LNG Canada’s cost per tonne is inclusive of TransCanada’s capex estimate for Coastal GasLink . (3) Th
Slide 27: Integrated model prevalent internationally
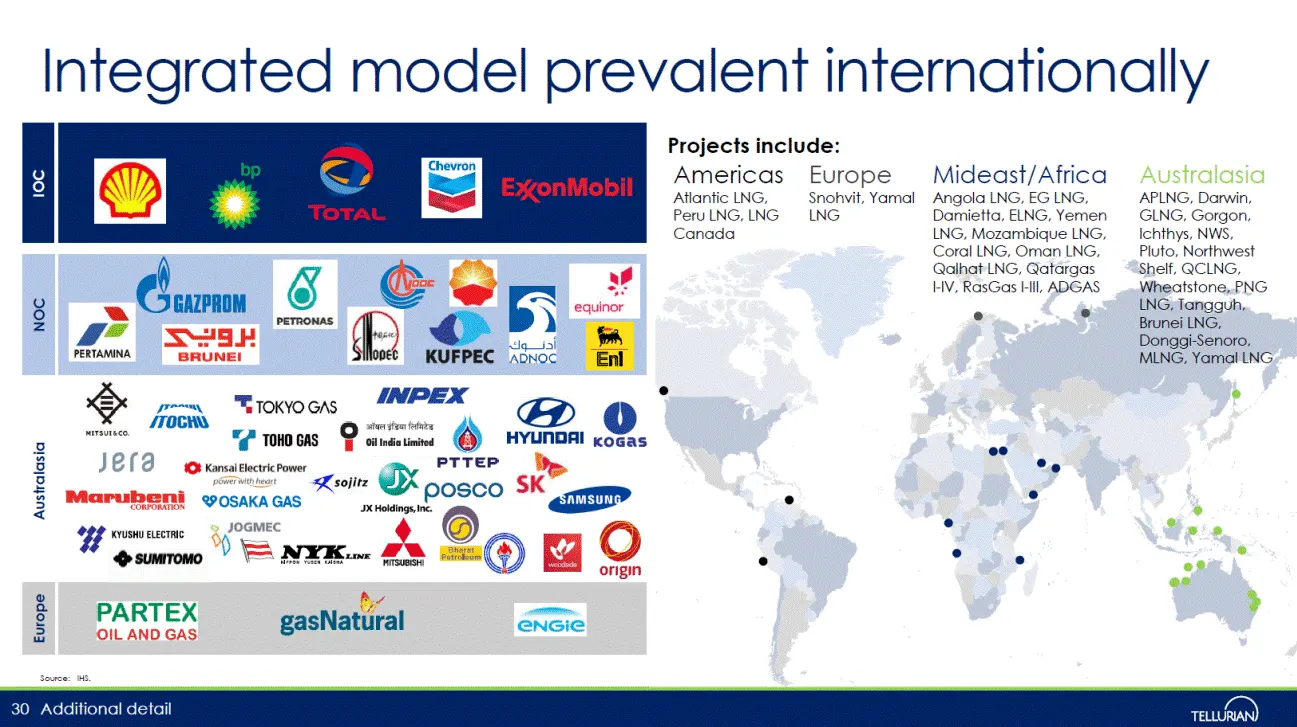
Integrated model prevalent internationally Source: IHS. 30 Projects include: Australasia APLNG, Darwin, GLNG, Gorgon, Ichthys, NWS, Pluto, Northwest Shelf, QCLNG, Wheatstone, PNG LNG, Tangguh, Brunei LNG, Donggi-Senoro, MLNG, Yamal LNG Mideast/Africa Angola LNG, EG LNG, Damietta, ELNG, Yemen LNG, Mo
Slide 28: Site characteristics determine long-run costs
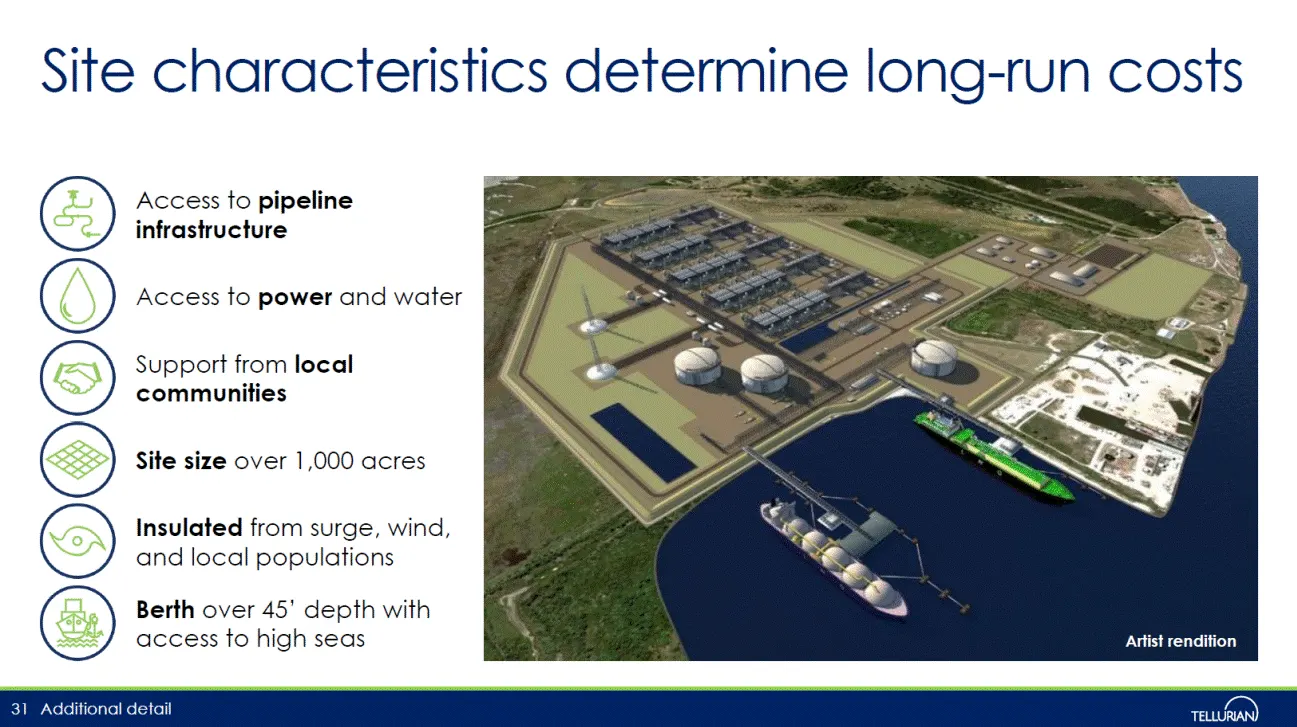
Site characteristics determine long-run costs Additional detail 31 Access to power and water Berth over 45’ depth with access to high seas Support from local communities Access to pipeline infrastructure Site size over 1,000 acres Insulated from surge, wind, and local populations Artist rendition
Slide 29: Key terms of EPC agreements with Bechtel
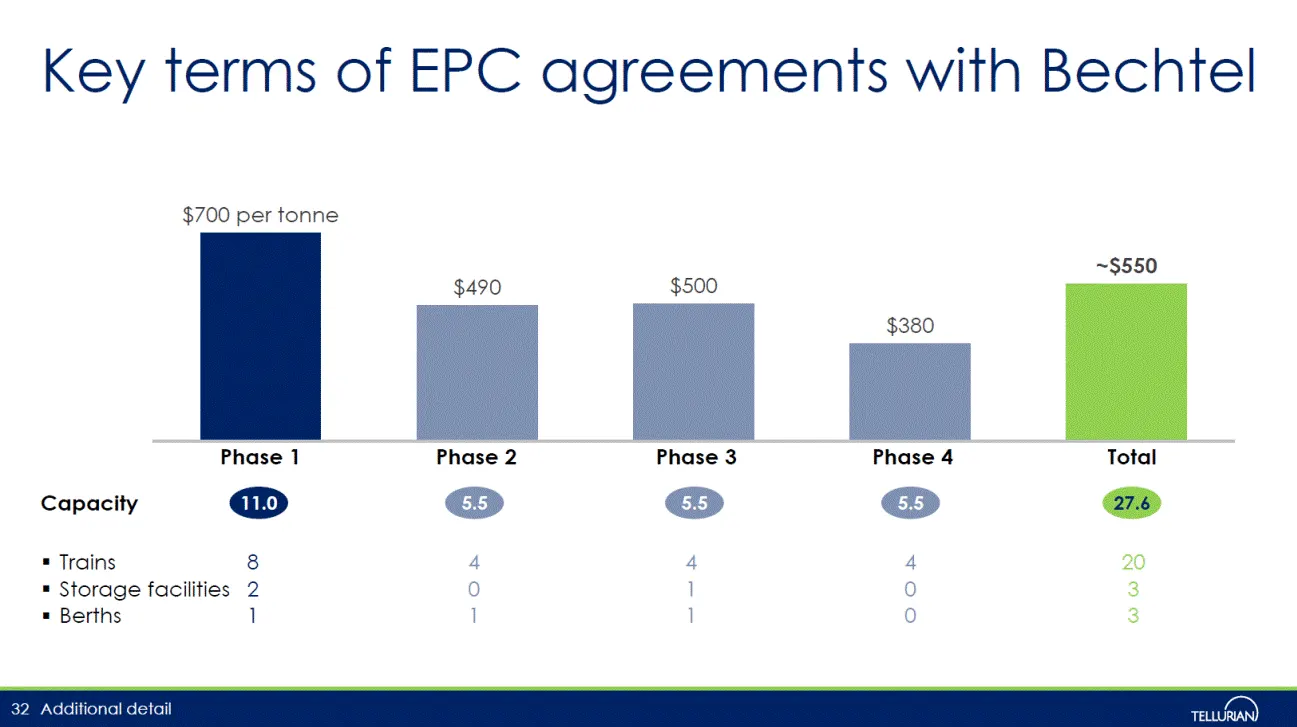
Key terms of EPC agreements with Bechtel Additional detail 32 Trains 8 4 4 4 20 Storage facilities 2 0 1 0 3 Berths 1 1 1 0 3 Phase 1 Phase 2 Phase 3 Phase 4 Total 11.0 5.5 5.5 5.5 27.6 Capacity $700 per tonne $490 $500 $380 ~$550
Slide 30: Construction budget breakdown
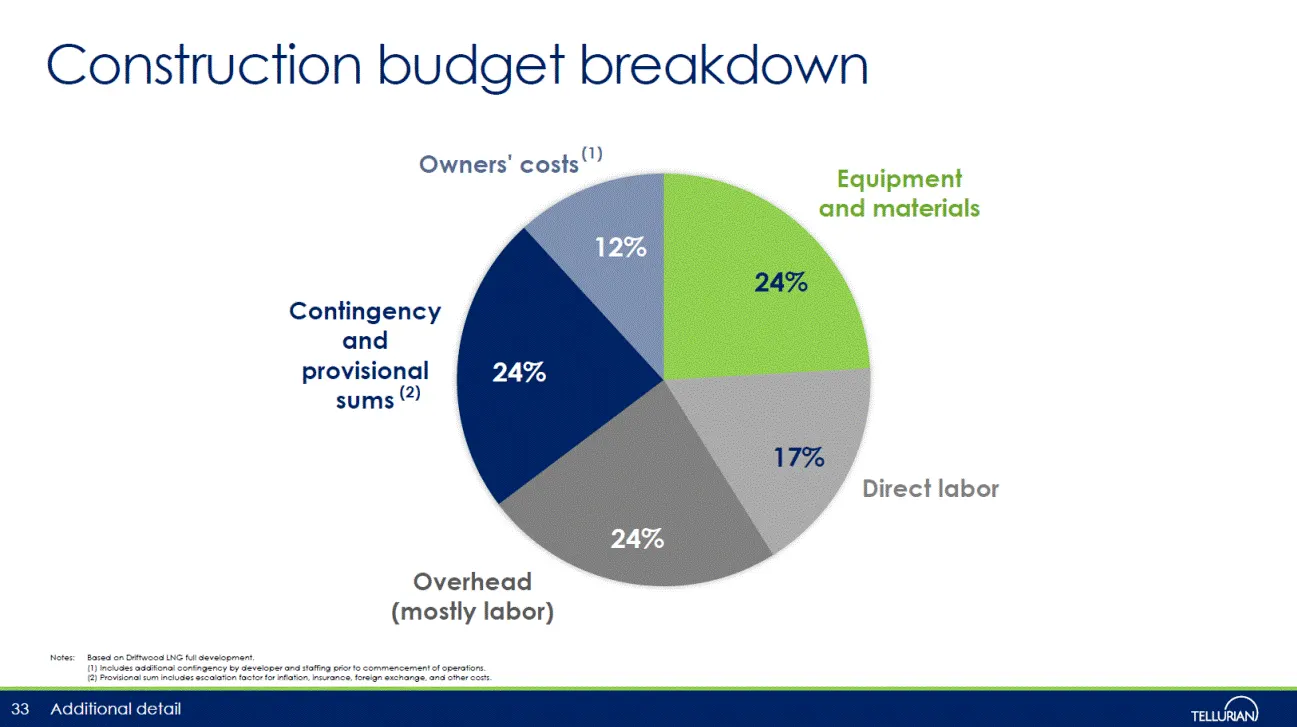
Construction budget breakdown Additional detail Notes: Based on Driftwood LNG full development. (1) Includes additional contingency by developer and staffing prior to commencement of operations. (2) Provisional sum includes escalation factor for inflation, insurance, foreign exchange, and other cost
Slide 31: Driftwood Holdings' financing
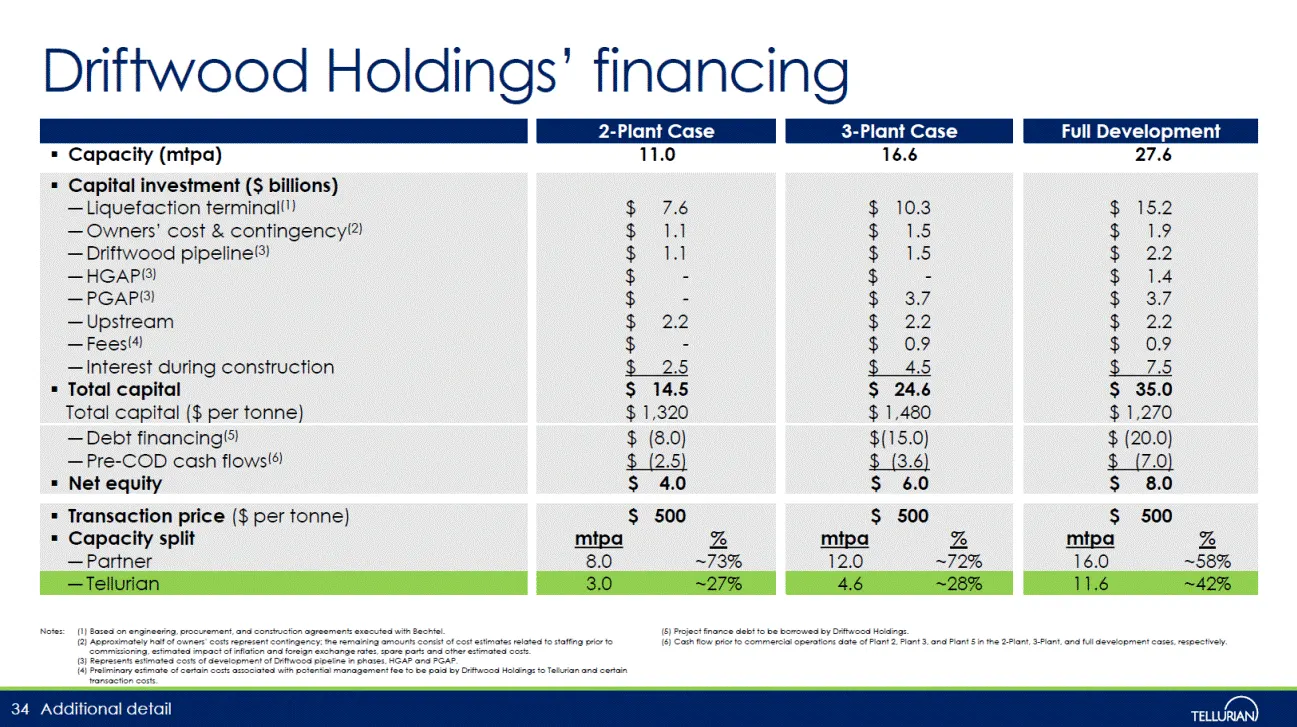
Driftwood Holdings’ financing Additional detail 34 2-Plant Case 3-Plant Case Full Development Capacity (mtpa) 11.0 16.6 27.6 Capital investment ($ billions) Liquefaction terminal(1) $ 7.6 $ 10.3 $ 15.2 Owners’ cost & contingency(2) $ 1.1 $ 1.5 $ 1.9 Driftwood pipeline(3) $ 1.1 $ 1.5 $ 2.2 HGAP(3) $
Slide 32: Corpus Christi LNG and Driftwood LNG examples
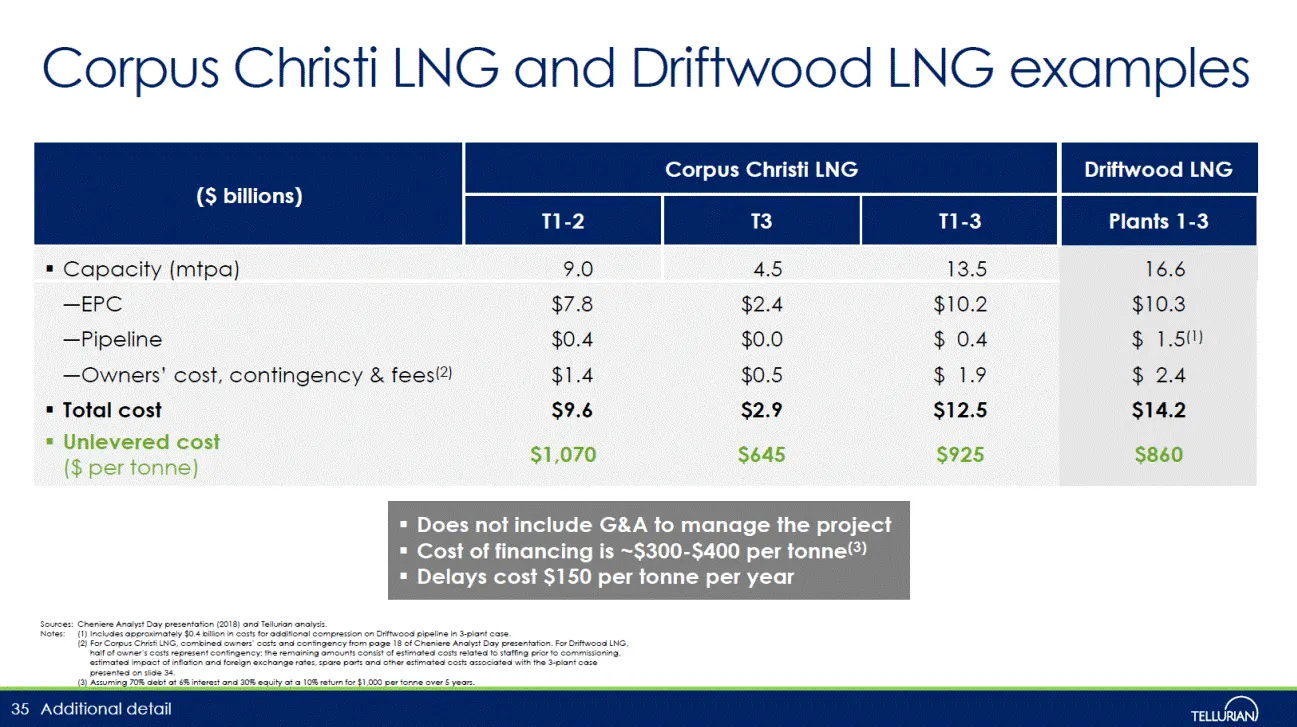
Corpus Christi LNG and Driftwood LNG examples Additional detail Sources: Cheniere Analyst Day presentation (2018) and Tellurian analysis. Notes: (1) Includes approximately $0.4 billion in costs for additional compression on Driftwood pipeline in 3-plant case. (2) For Corpus Christi LNG, combined own
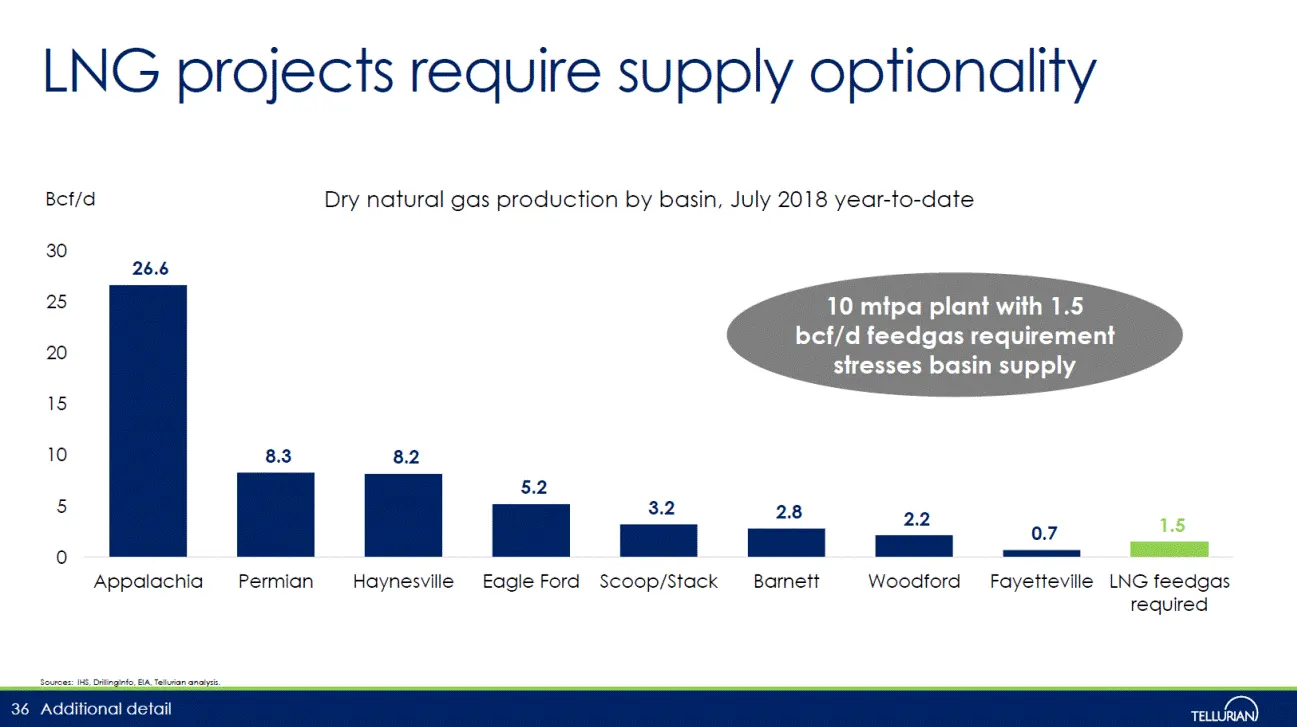
Slide 33: LNG projects require supply optionality
LNG projects require supply optionality Additional detail Sources: IHS, DrillingInfo, EIA, Tellurian analysis. 36 10 mtpa plant with 1.5 bcf/d feedgas requirement stresses basin supply
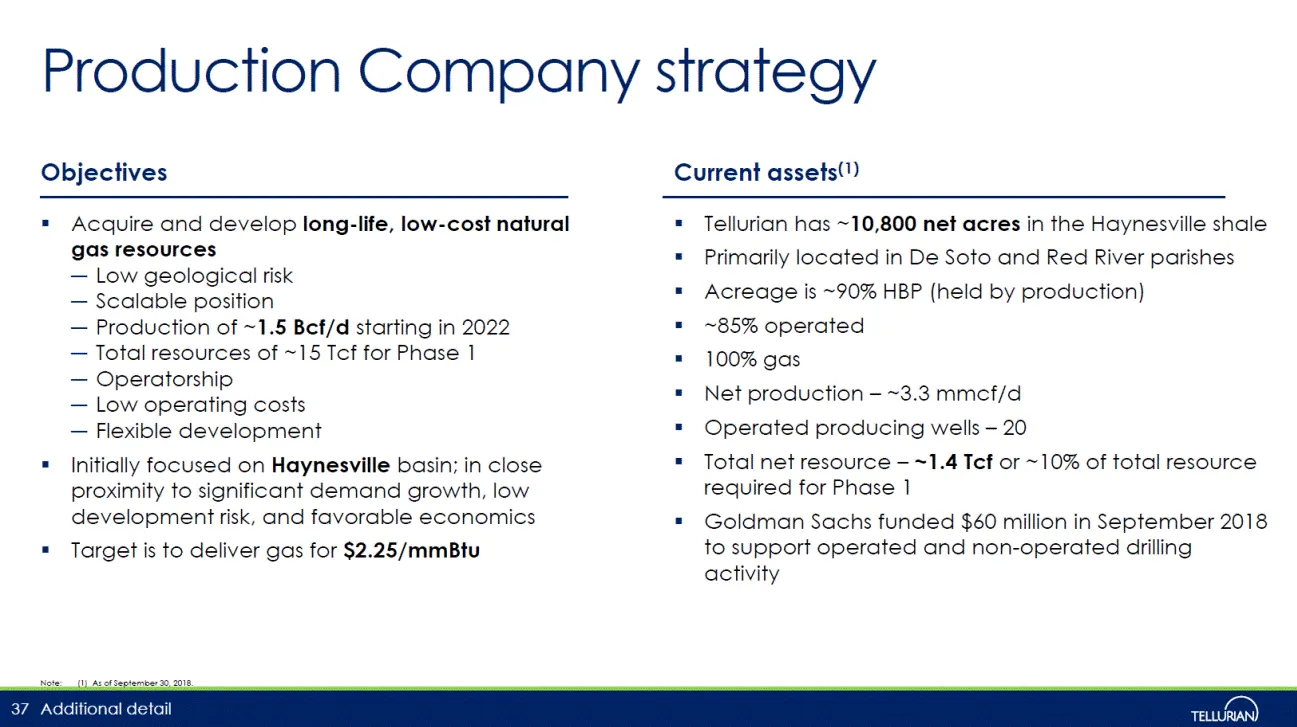
Slide 34: Production Company strategy
Production Company strategy Acquire and develop long-life, low-cost natural gas resources Low geological risk Scalable position Production of ~1.5 Bcf/d starting in 2022 Total resources of ~15 Tcf for Phase 1 Operatorship Low operating costs Flexible development Initially focused on Haynesville basi
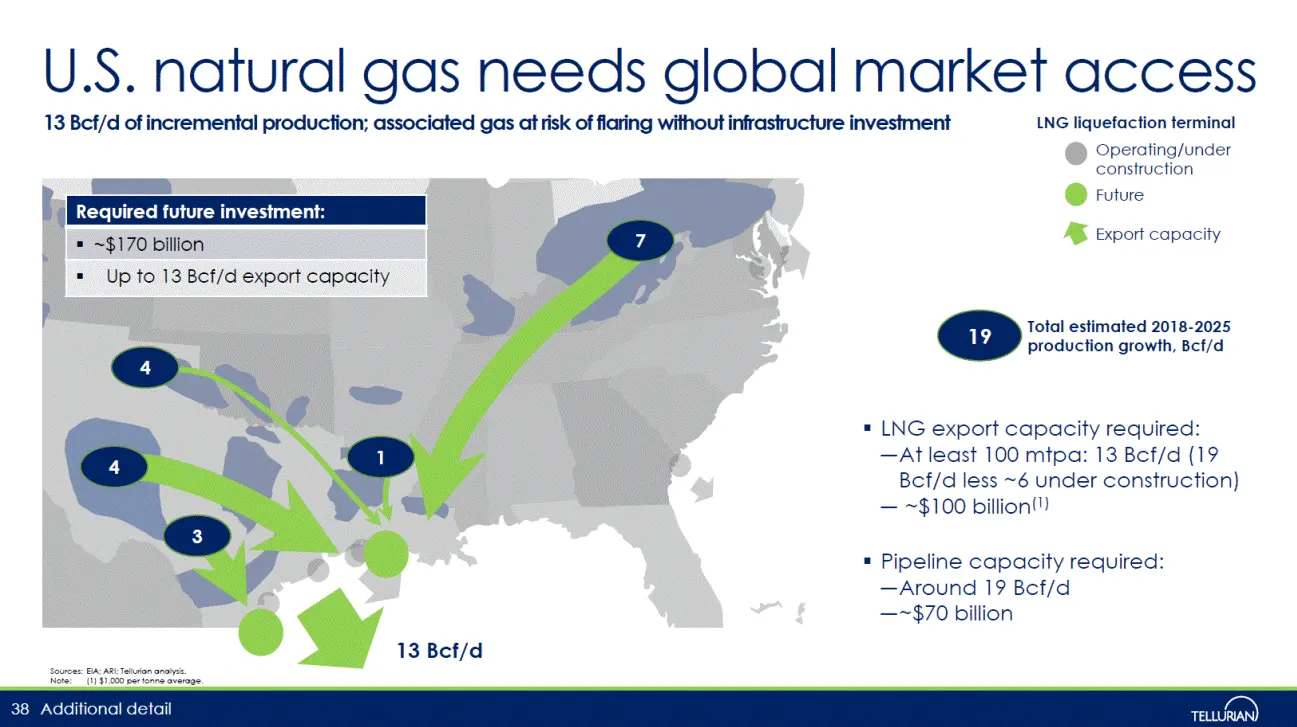
Slide 35: U.S. natural gas needs global market access
13 Bcf/d 4 4 7 1 3 U.S. natural gas needs global market access Additional detail 38 13 Bcf/d of incremental production; associated gas at risk of flaring without infrastructure investment Sources: EIA; ARI; Tellurian analysis. Note: (1) $1,000 per tonne average. LNG export capacity required: At leas
Slide 36: PGAP connects constrained gas to SWLA
PGAP connects constrained gas to SWLA Additional detail Takeaway constraints in the Permian Southwest Louisiana demand Sources: Company data, Goldman Sachs, Wells Fargo Equity Research, RBN Energy, Tellurian estimates. Notes: (1) LNG demand based on ambient capacity (2) Includes Driftwood LNG, Sabin
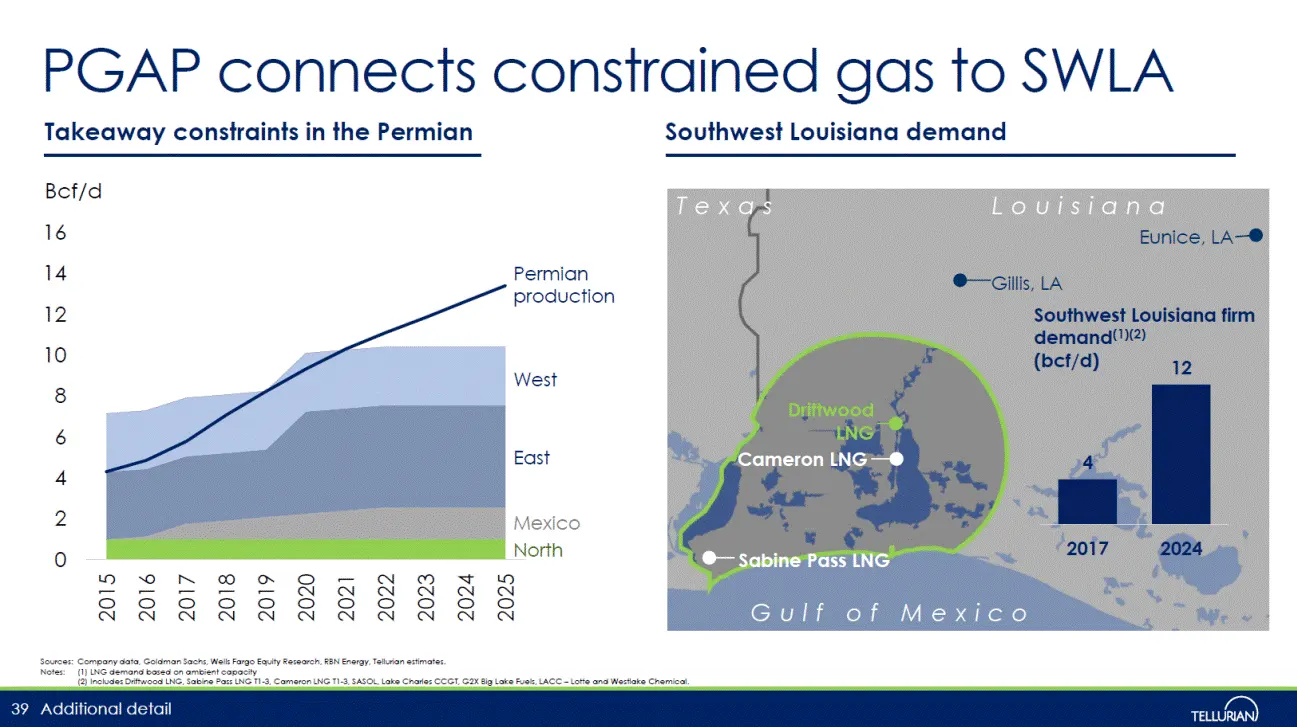
Slide 37: PGAP connects constrained gas to SWLA
PGAP connects constrained gas to SWLA Takeaway constraints in the Permian Southwest Louisiana demand Bef/d 1 16 Eunice, LA-® 14 Permian @—Gillis, LA production ‘ 12 Southwest Louisiana firm demand(v2) 10 (bet/a) West 8 6 4 2 ie} 2015 2016 2017 2018 2019 2020 2021 2022 2023 2024
Source: SEC EDGAR · 8-K filed Jan 7, 2019
More decks from Tellurian Inc
 Merger or Acquisition (July 2024)27 slides · Jul 22, 2024
 Investor Presentation (March 2024)16 slides · Mar 4, 2024
 Investor Presentation (August 2023)20 slides · Aug 7, 2023
 Investor Presentation (May 2023)20 slides · May 3, 2023
 Investor Presentation (February 2023)21 slides · Feb 22, 2023
 Investor Presentation (November 2022)19 slides · Nov 2, 2022