Chemed Corp · NYSE:CHE
Chemed — Investor Presentation (September 2025)
47 slides from Chemed's investor presentation, September 2025
Slide 1: Results as of 09/30/25
CHEMEI) CHEMED CORPORATION Results as of 09/30/25
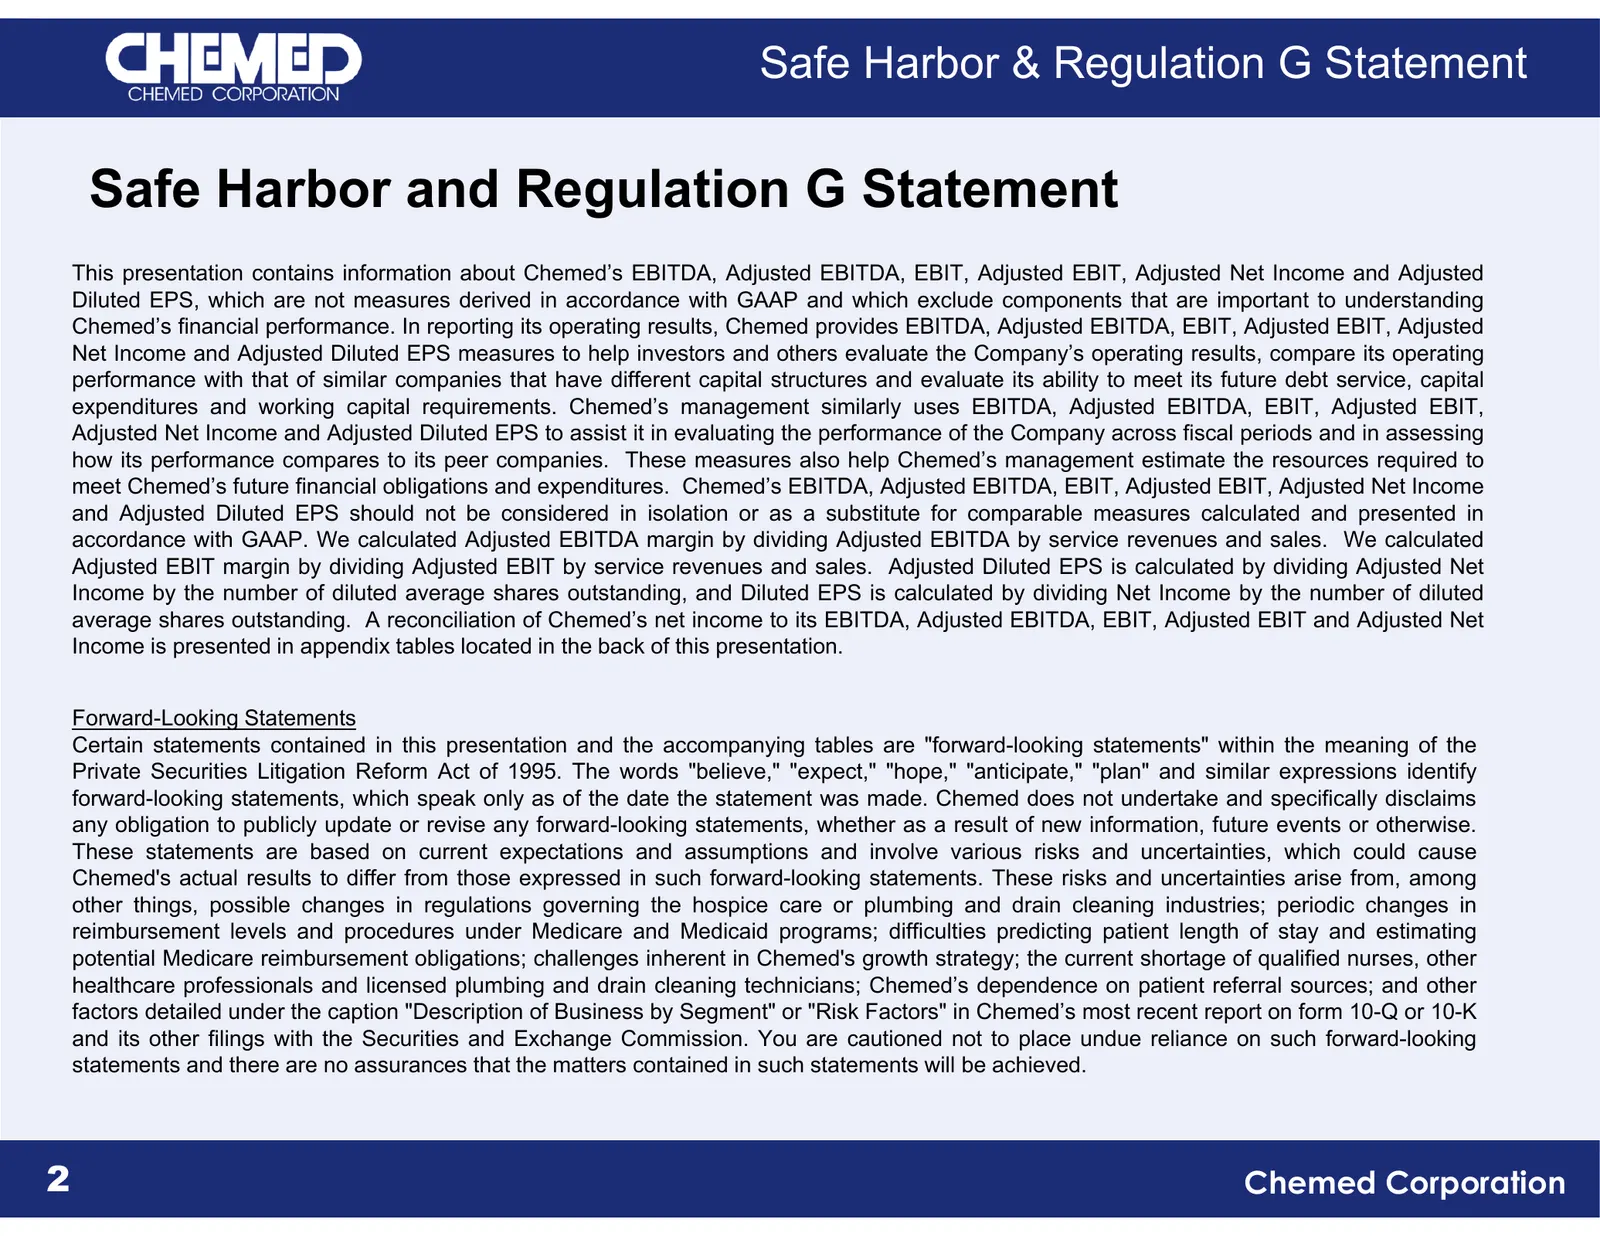
Slide 2: Safe Harbor and Regulation G Statement
Safe Harbor & Regulation G Statement Safe Harbor and Regulation G Statement This presentation contains information about Chemed’s EBITDA, Adjusted EBITDA, EBIT, Adjusted EBIT, Adjusted Net Income and Adjusted Diluted EPS, which are not measures derived in accordance with GAAP and which exclude compo
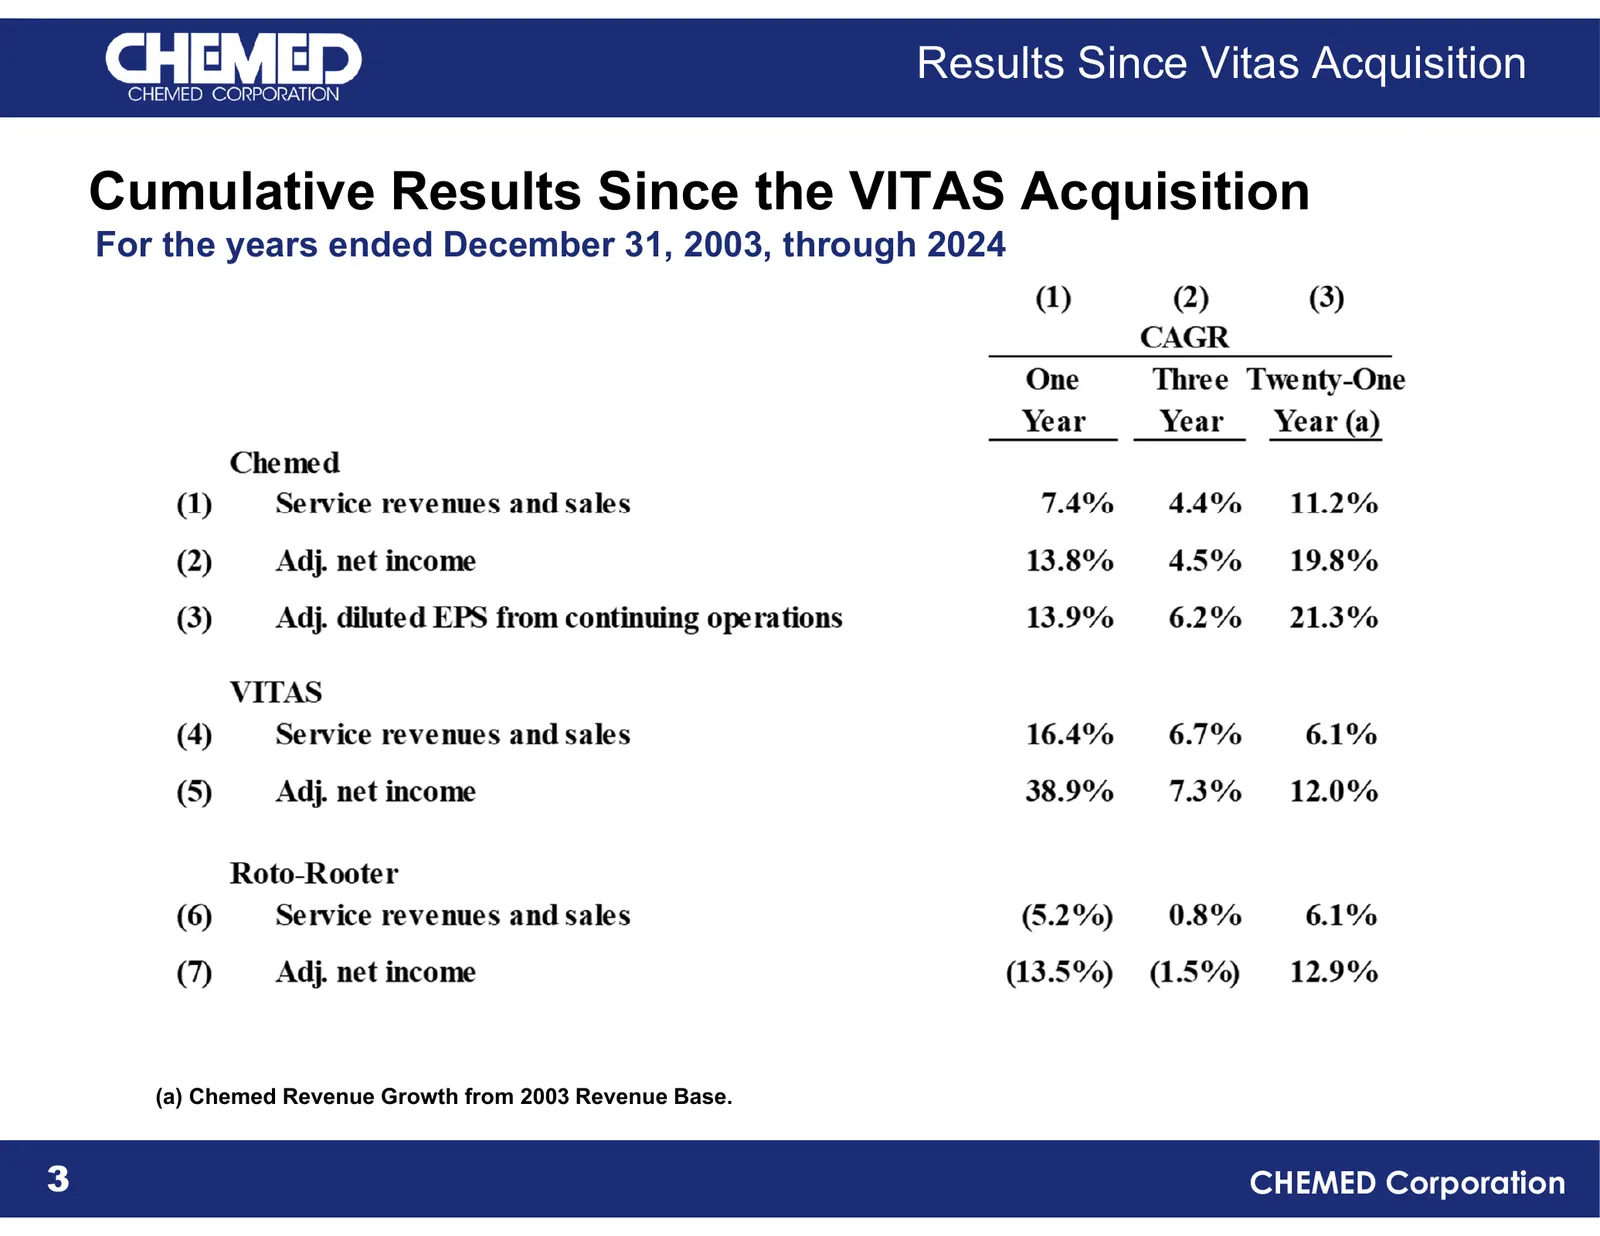
Slide 3: Cumulative Results Since the VITAS Acquisition
Results Since Vitas Acquisition Cumulative Results Since the VITAS Acquisition For the years ended December 31, 2003, through 2024 (a) Chemed Revenue Growth from 2003 Revenue Base. 3 CHEMED Corporation
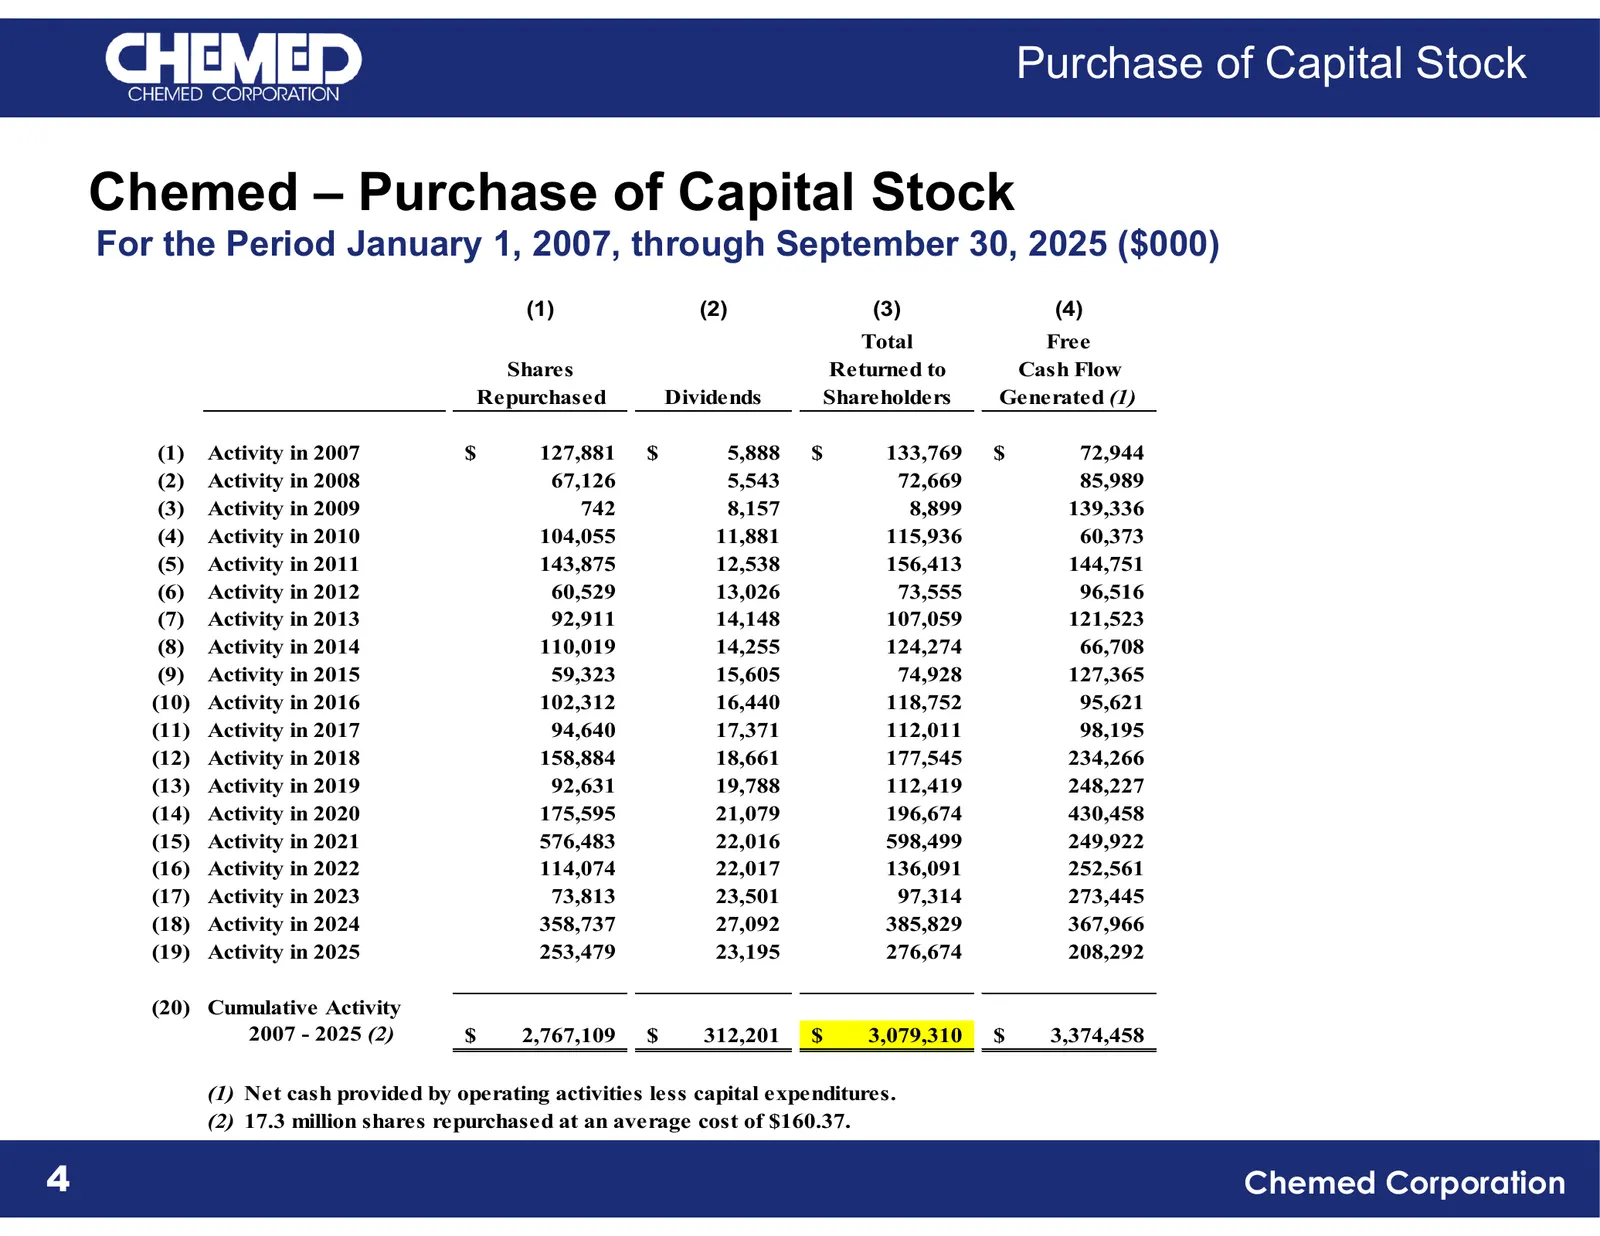
Slide 4: Chemed – Purchase of Capital Stock
Purchase of Capital Stock Chemed – Purchase of Capital Stock For the Period January 1, 2007, through September 30, 2025 ($000) (1) (2) (3) (4) Total Free Shares Returned to Cash Flow Repurchased Dividends Shareholders Generated (1) (1) Activity in 2007 $ 127,881 $ 5,888 $ 133,769 $ 72,944 (2) Activi
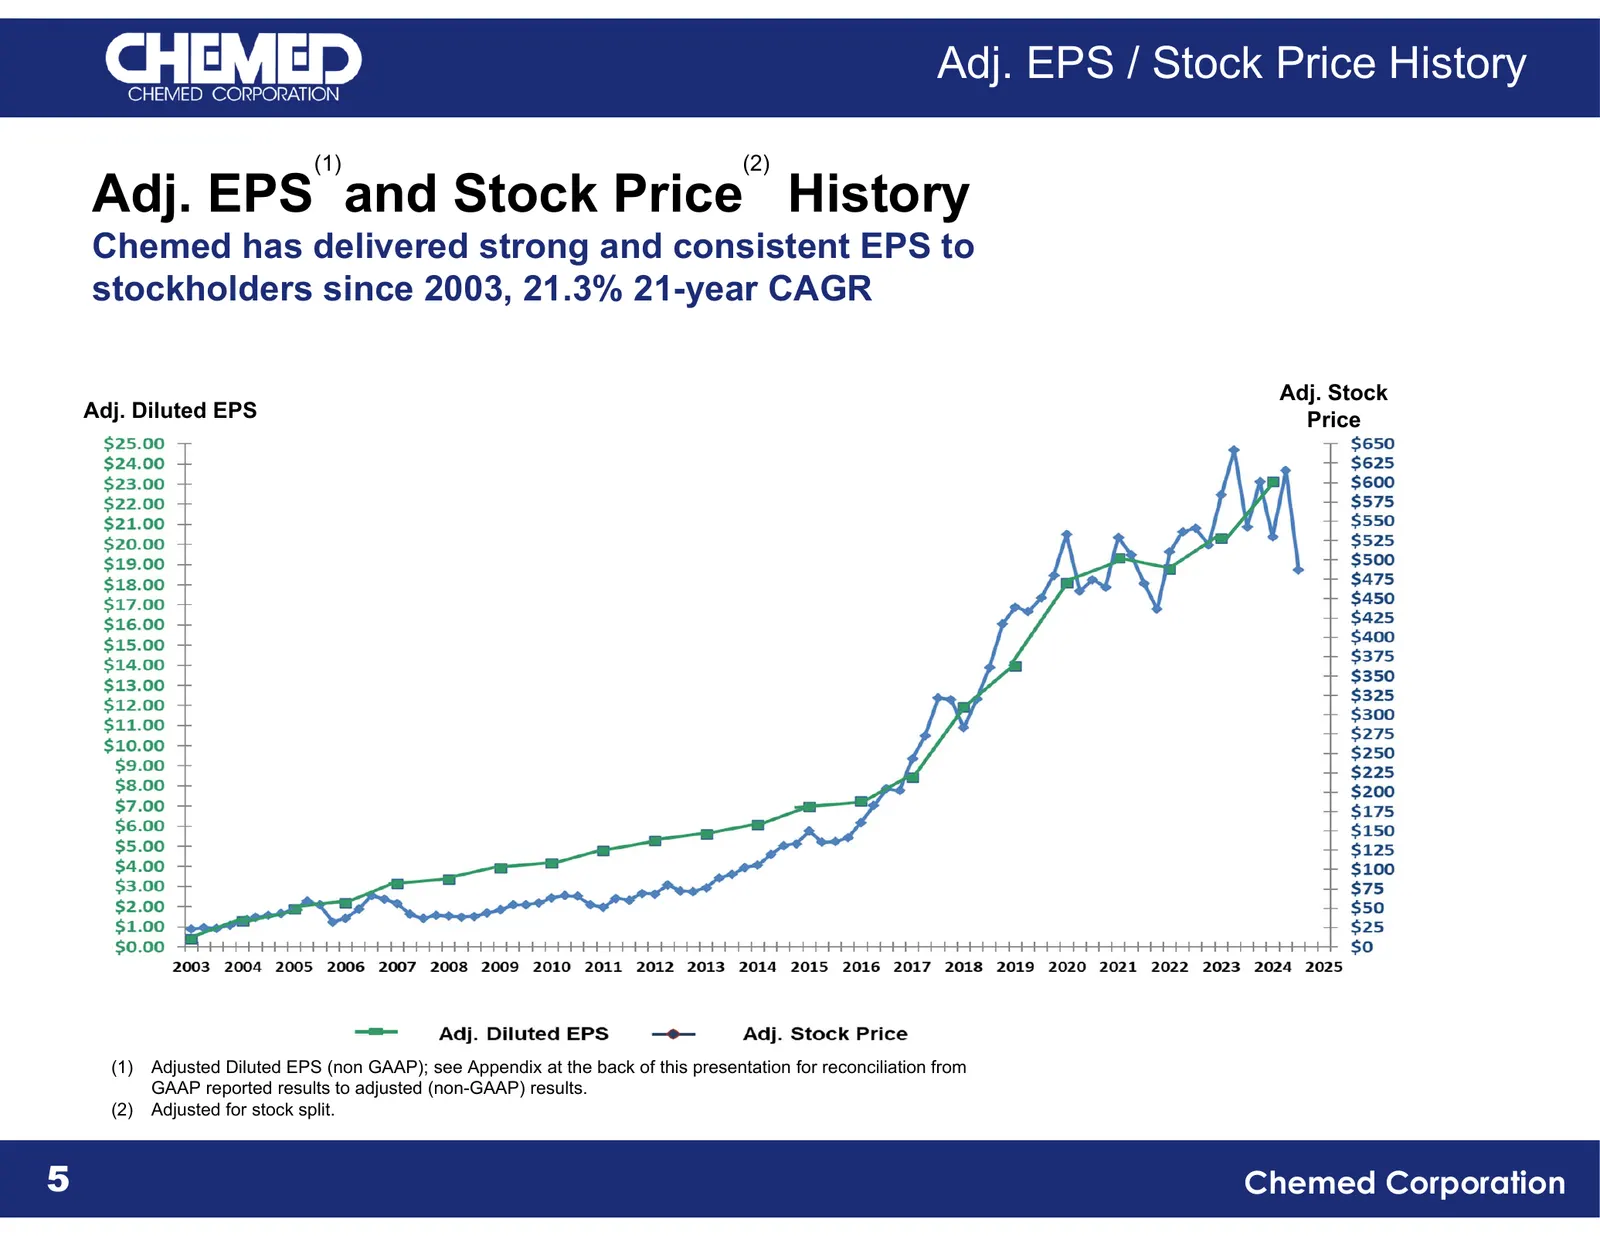
Slide 5: Adj. EPS and Stock Price History
Adj. EPS / Stock Price History (1) (2) Adj. EPS and Stock Price History Chemed has delivered strong and consistent EPS to stockholders since 2003, 21.3% 21-year CAGR Adj. Stock Adj. Diluted EPS Price (1) Adjusted Diluted EPS (non GAAP); see Appendix at the back of this presentation for reconciliatio
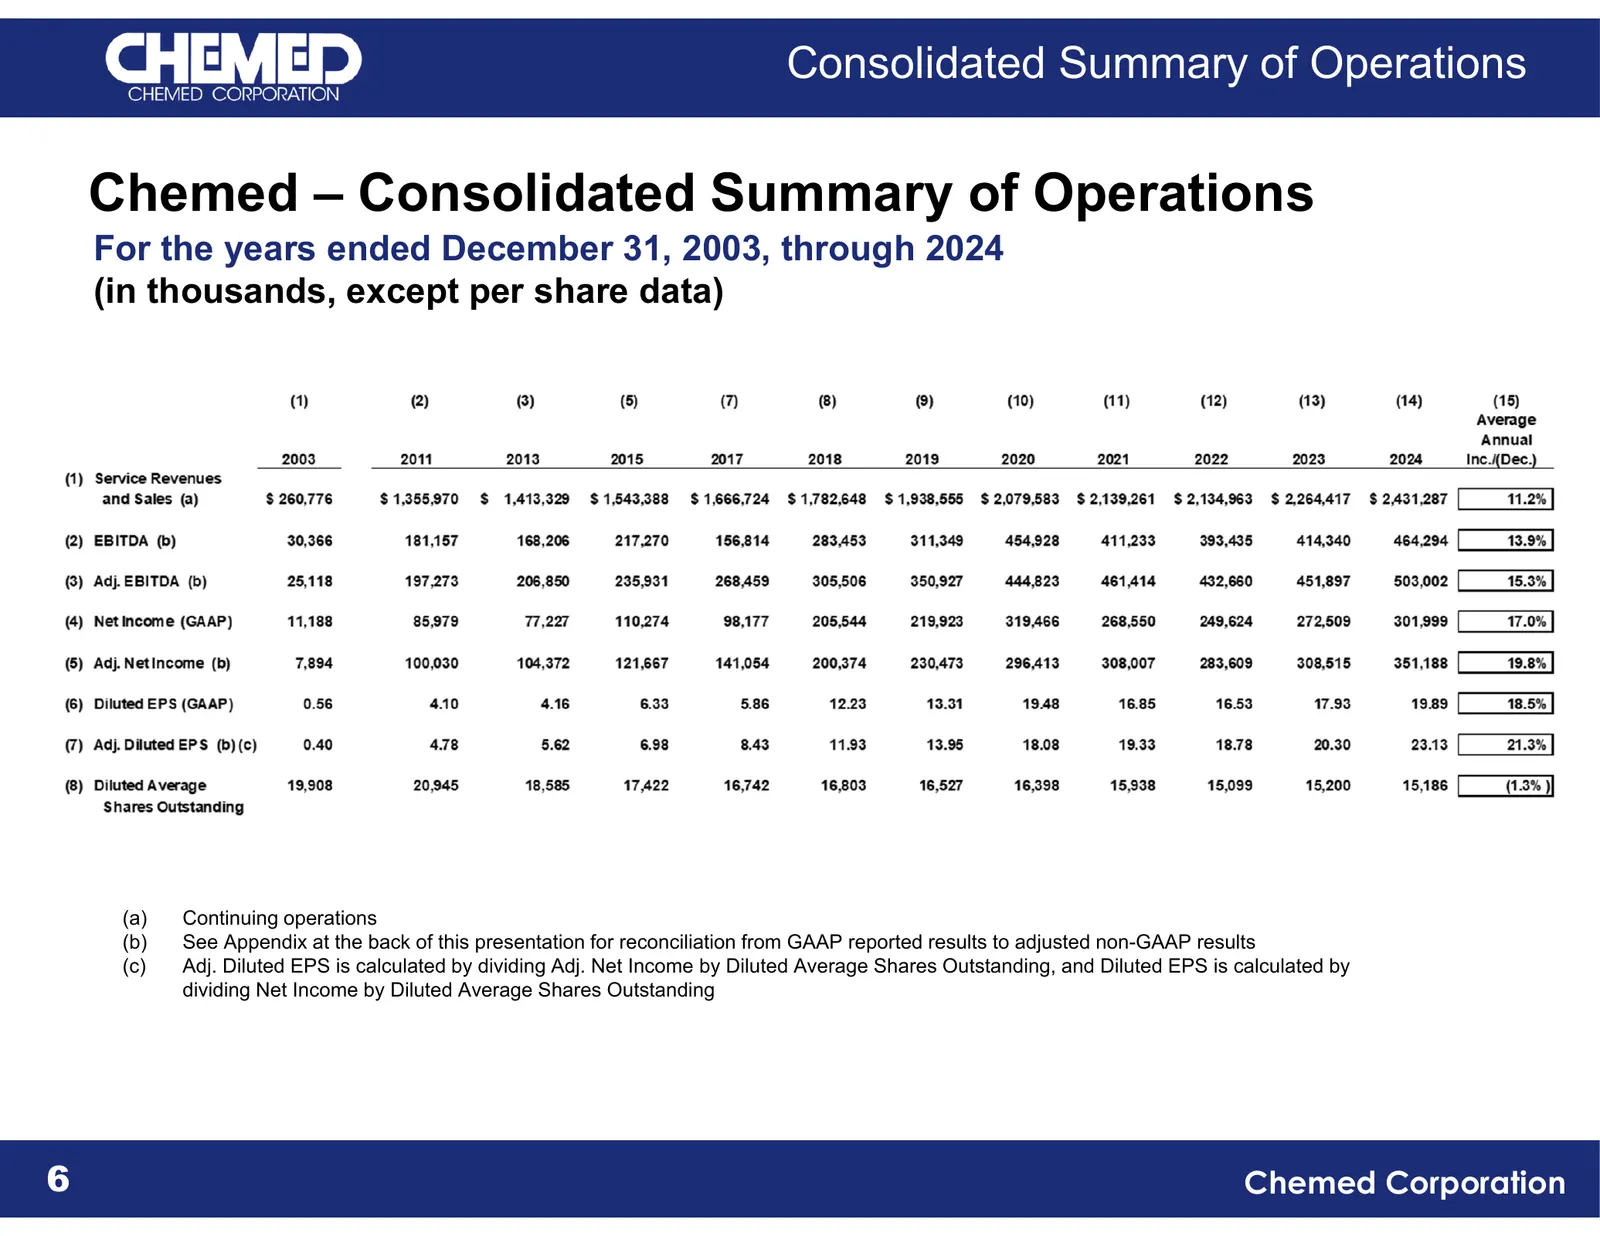
Slide 6: Chemed – Consolidated Summary of Operations
Consolidated Summary of Operations Chemed – Consolidated Summary of Operations For the years ended December 31, 2003, through 2024 (in thousands, except per share data) (a) Continuing operations (b) See Appendix at the back of this presentation for reconciliation from GAAP reported results to adjust
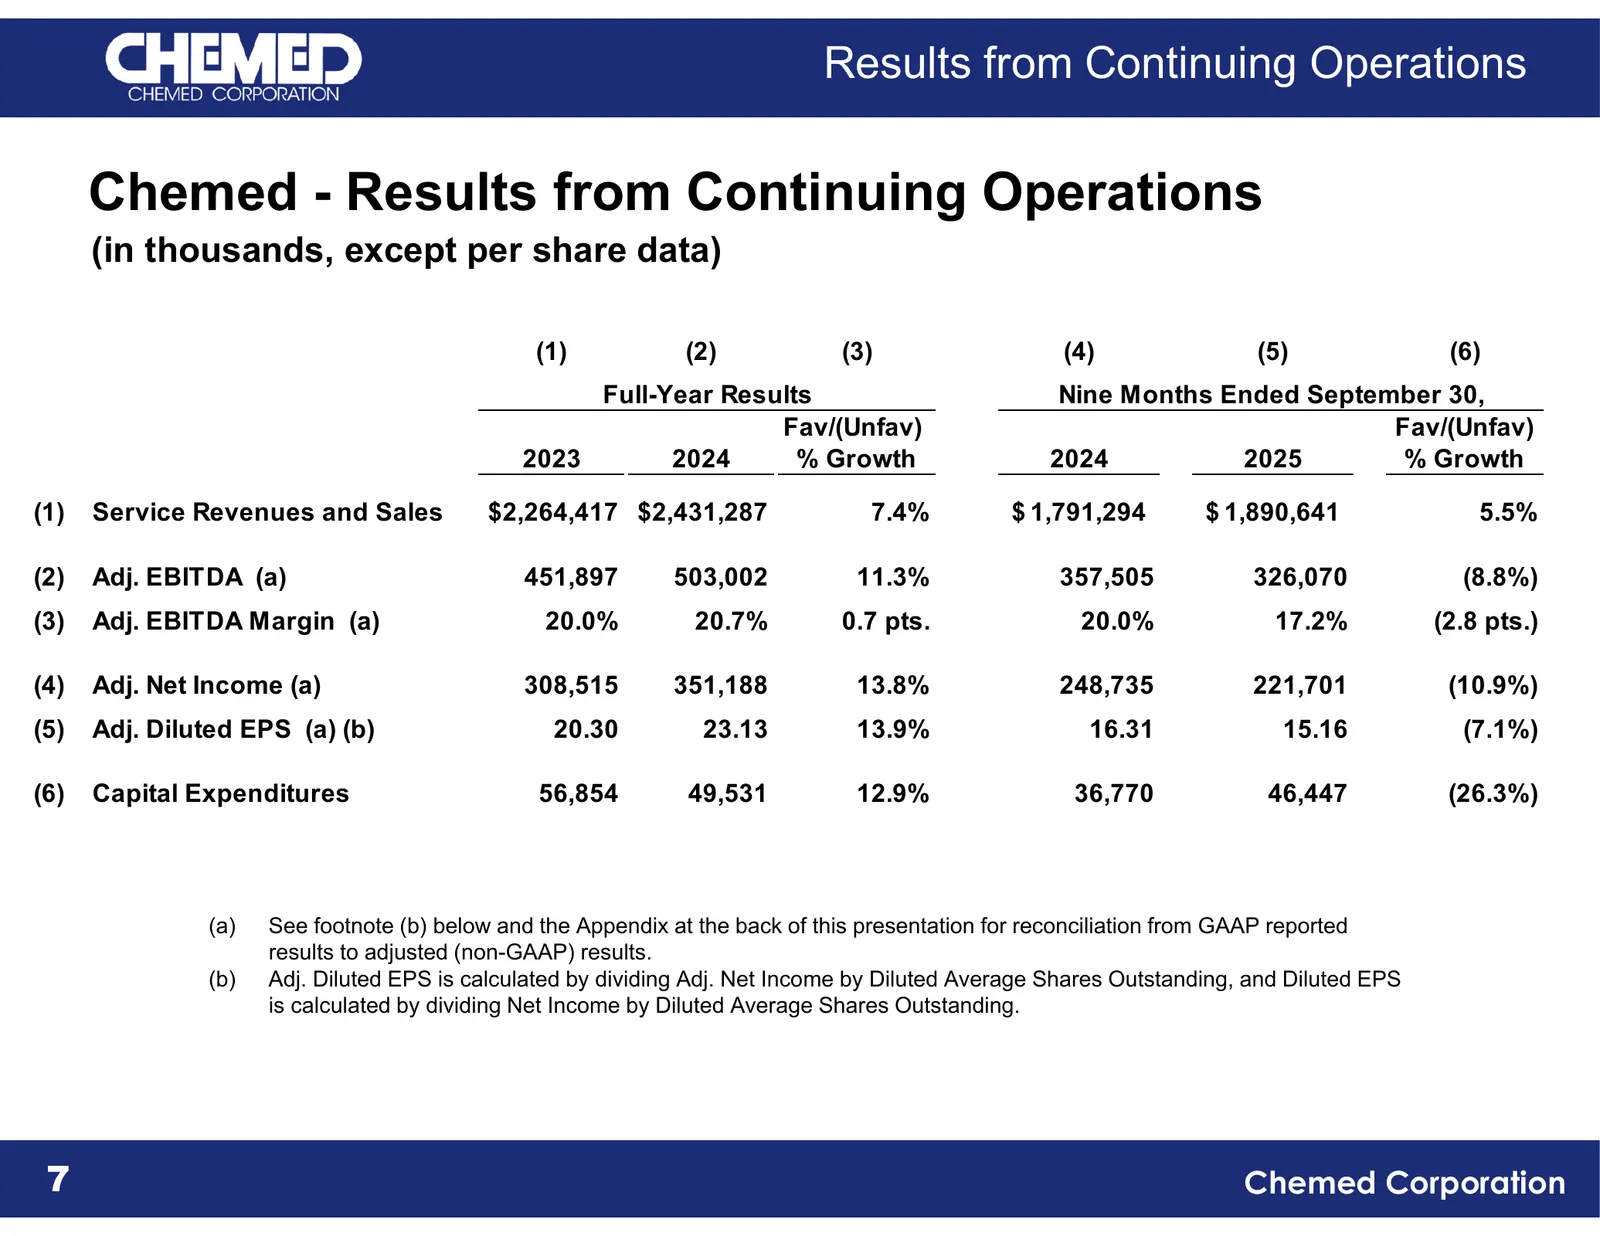
Slide 7: Chemed - Results from Continuing Operations
Results from Continuing Operations Chemed - Results from Continuing Operations (in thousands, except per share data) (1) (2) (3) (4) (5) (6) Full-Year Results Nine Months Ended September 30, Fav/(Unfav) Fav/(Unfav) 2023 2024 % Growth 2024 2025 % Growth (1) Service Revenues and Sales $2,264,417 $2,43
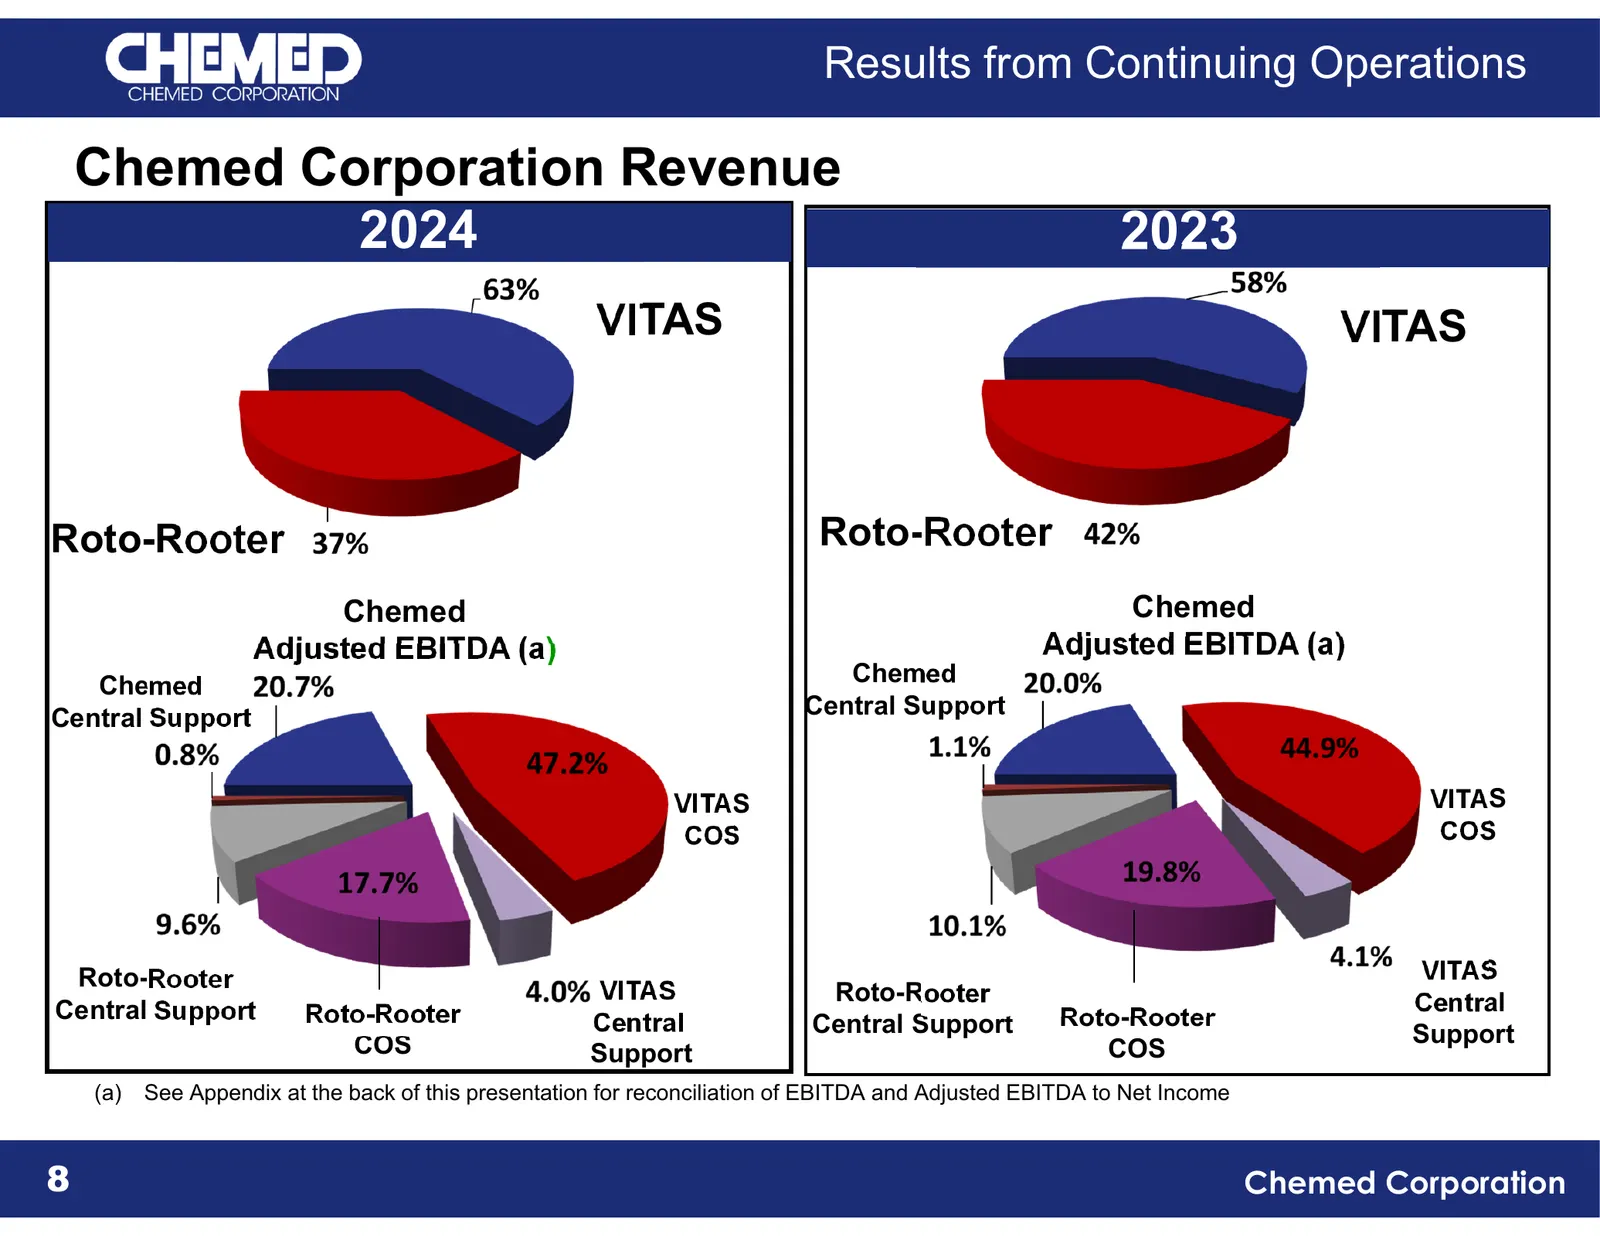
Slide 8: Chemed Corporation Revenue
Results from Continuing Operations Chemed Corporation Revenue 2024 2023 VITAS VITAS Roto-Rooter Roto-Rooter Chemed Chemed Adjusted EBITDA (a) Adjusted EBITDA (a) Chemed Chemed Central Support Central Support VITAS VITAS COS COS Roto-Rooter VITAS VITAS Roto-Rooter Central Central Support Roto-Rooter

Slide 9: Roto-Rooter Company Overview
ROTO- ( ROOTER. Company Overview PLUMBING & WATER CLEANUP
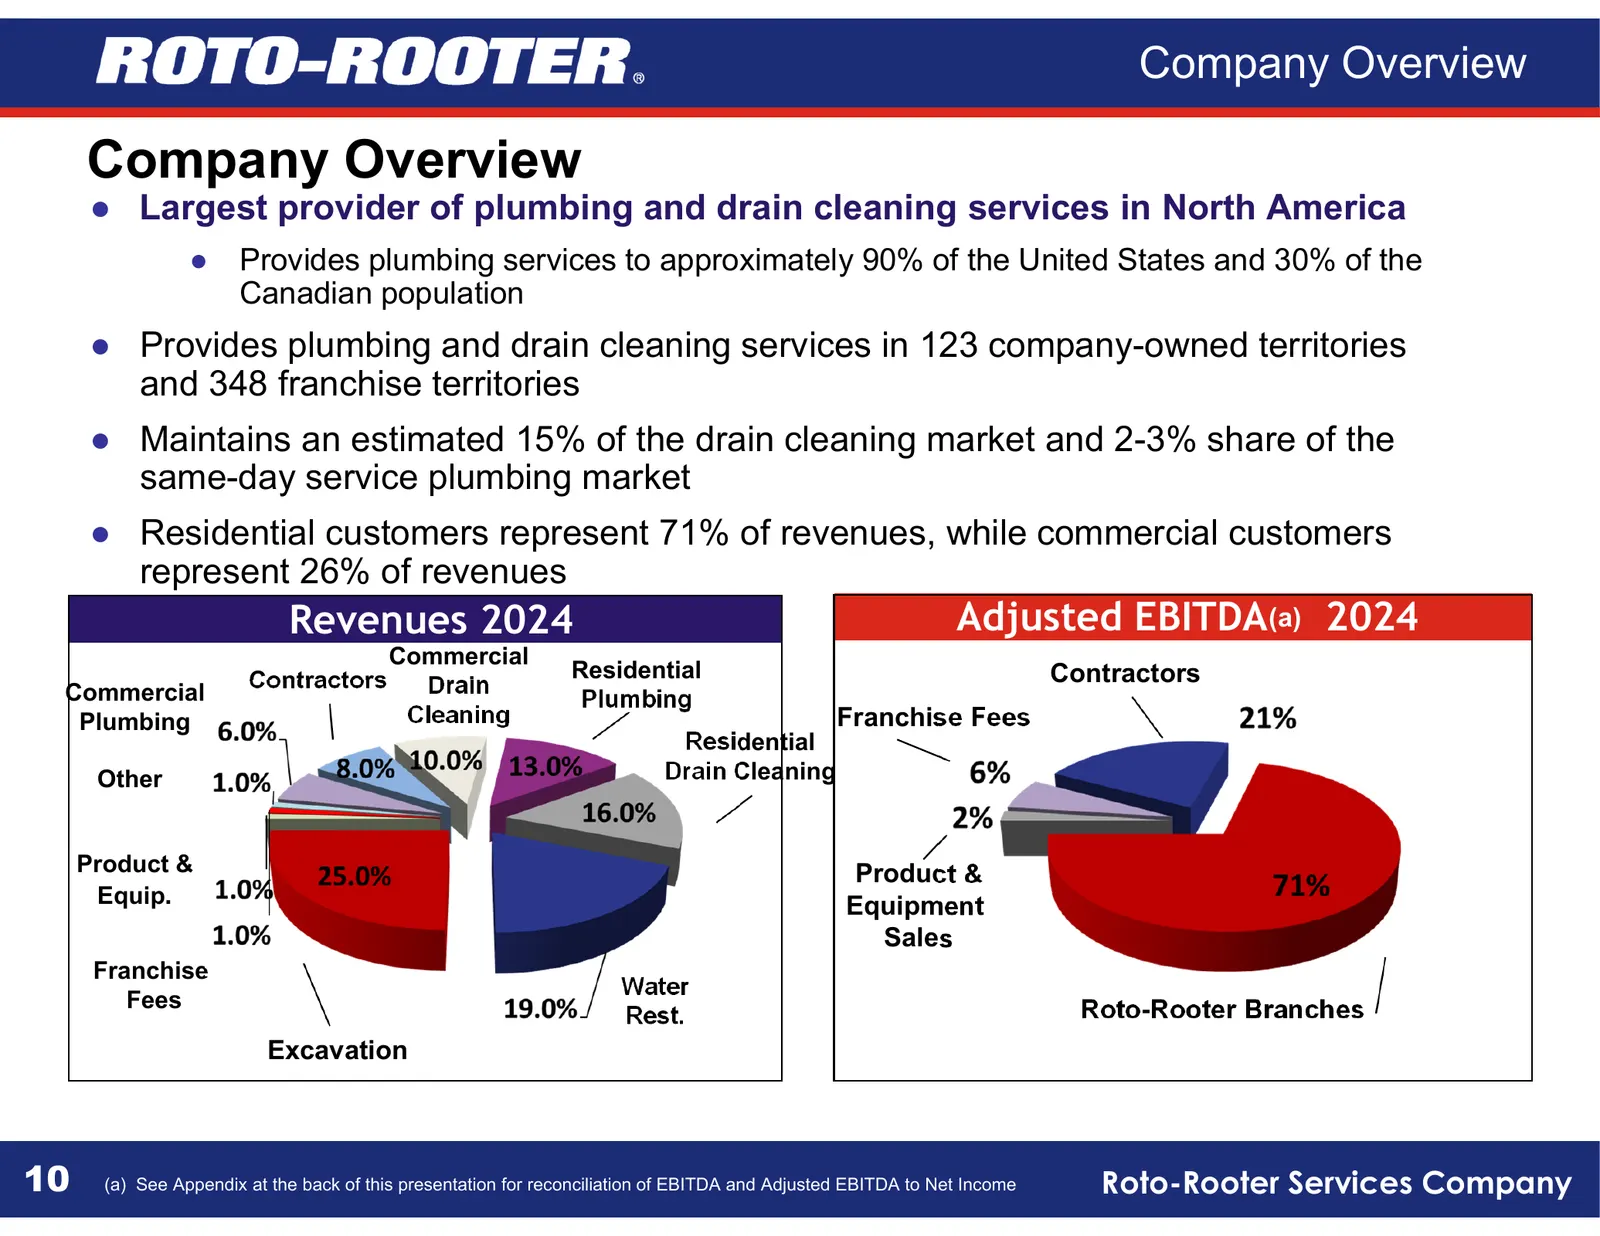
Slide 10: Company Overview
Company Overview Company Overview ● Largest provider of plumbing and drain cleaning services in North America ● Provides plumbing services to approximately 90% of the United States and 30% of the Canadian population ● Provides plumbing and drain cleaning services in 123 company-owned territories and
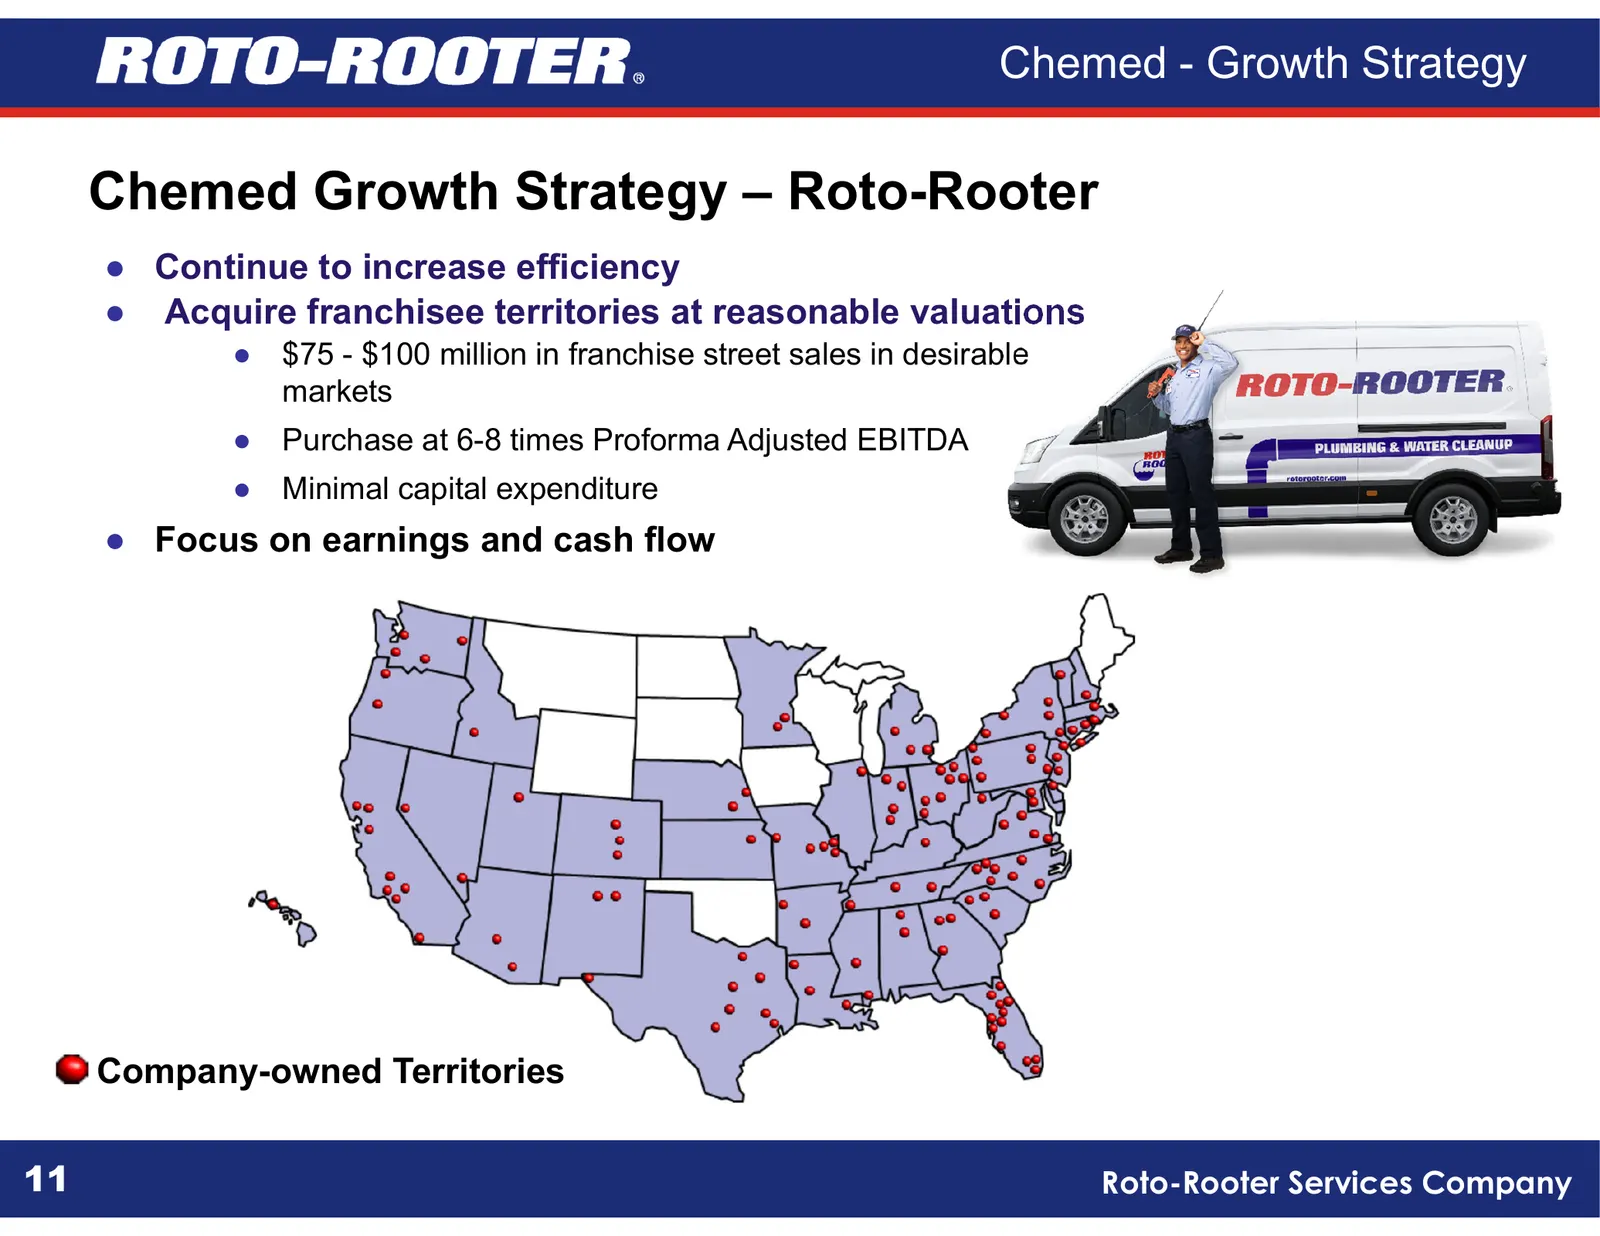
Slide 11: Chemed Growth Strategy – Roto-Rooter
Chemed - Growth Strategy Chemed Growth Strategy – Roto-Rooter ● Continue to increase efficiency ● Acquire franchisee territories at reasonable valuations ● $75 - $100 million in franchise street sales in desirable markets ● Purchase at 6-8 times Proforma Adjusted EBITDA ● Minimal capital expenditure
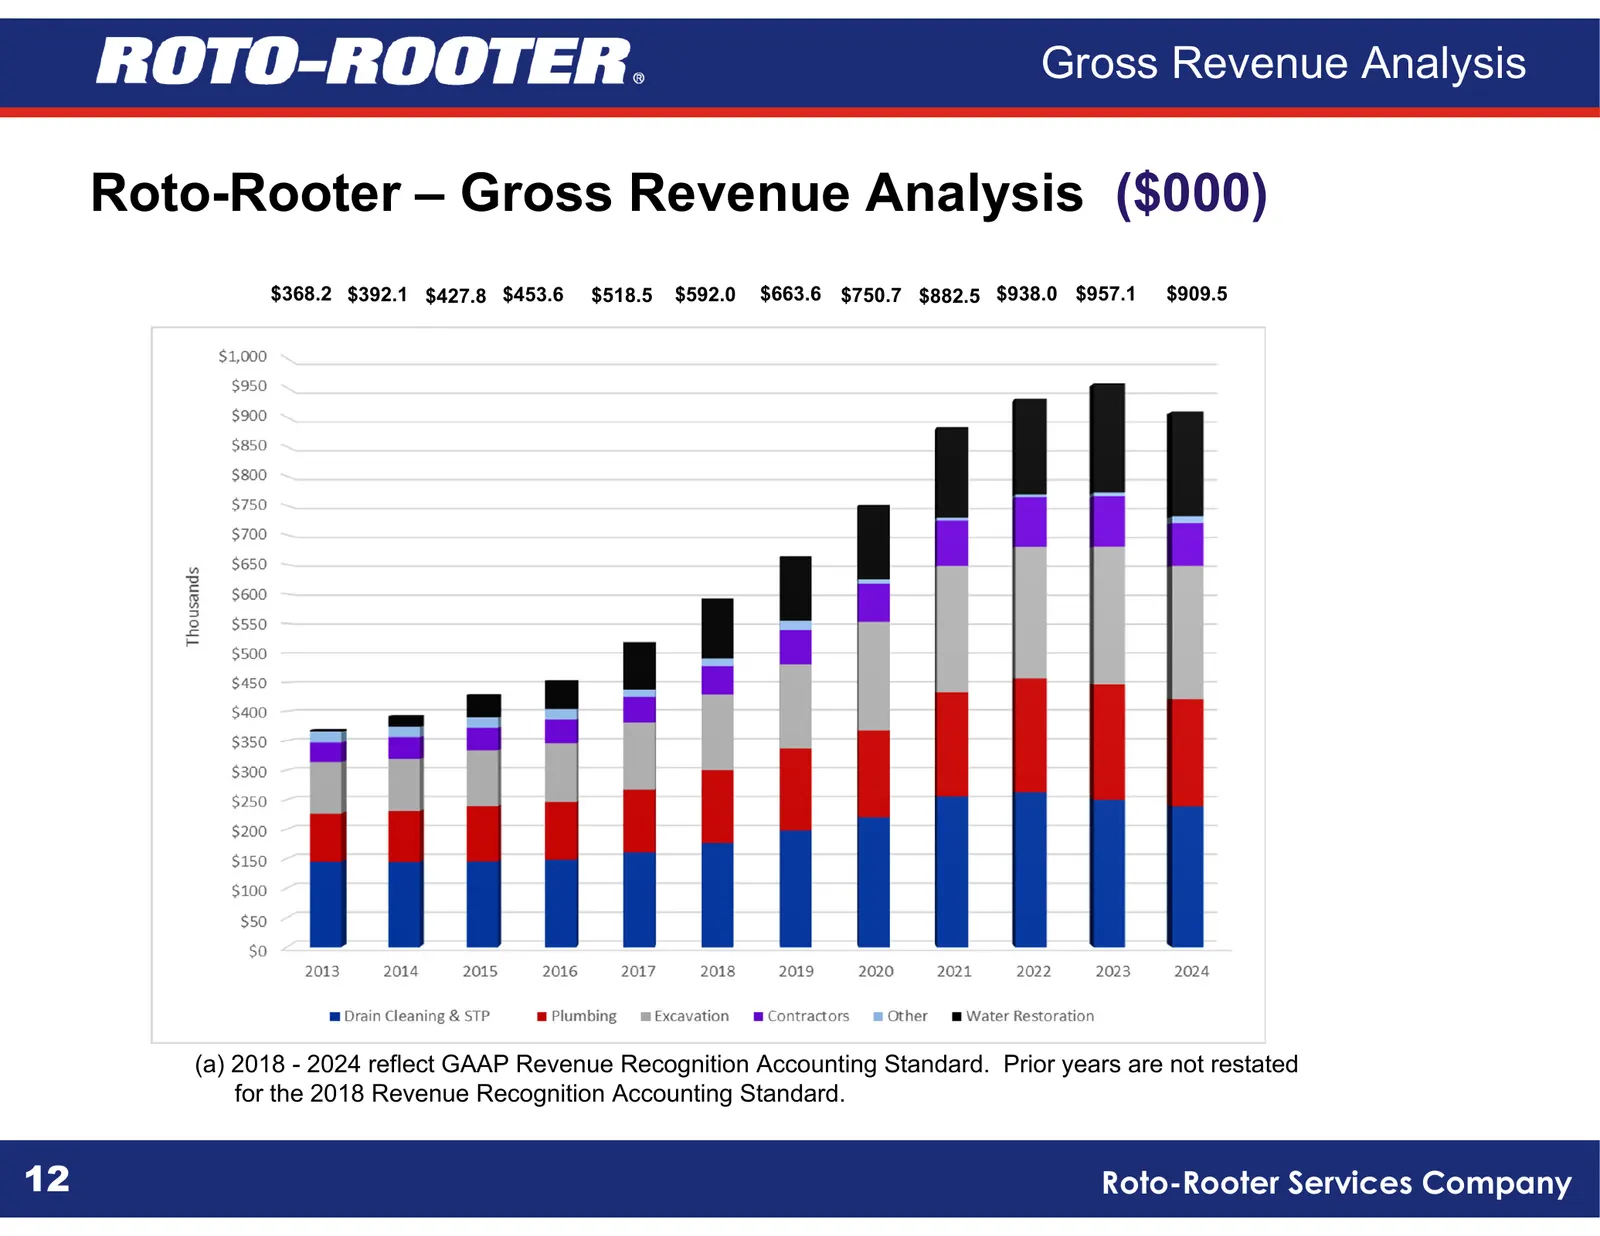
Slide 12: Roto-Rooter – Gross Revenue Analysis ($000)
Gross Revenue Analysis Roto-Rooter – Gross Revenue Analysis ($000) $368.2 $392.1 $427.8 $453.6 $518.5 $592.0 $663.6 $750.7 $882.5 $938.0 $957.1 $909.5 (a) 2018 - 2024 reflect GAAP Revenue Recognition Accounting Standard. Prior years are not restated for the 2018 Revenue Recognition Accounting Standa
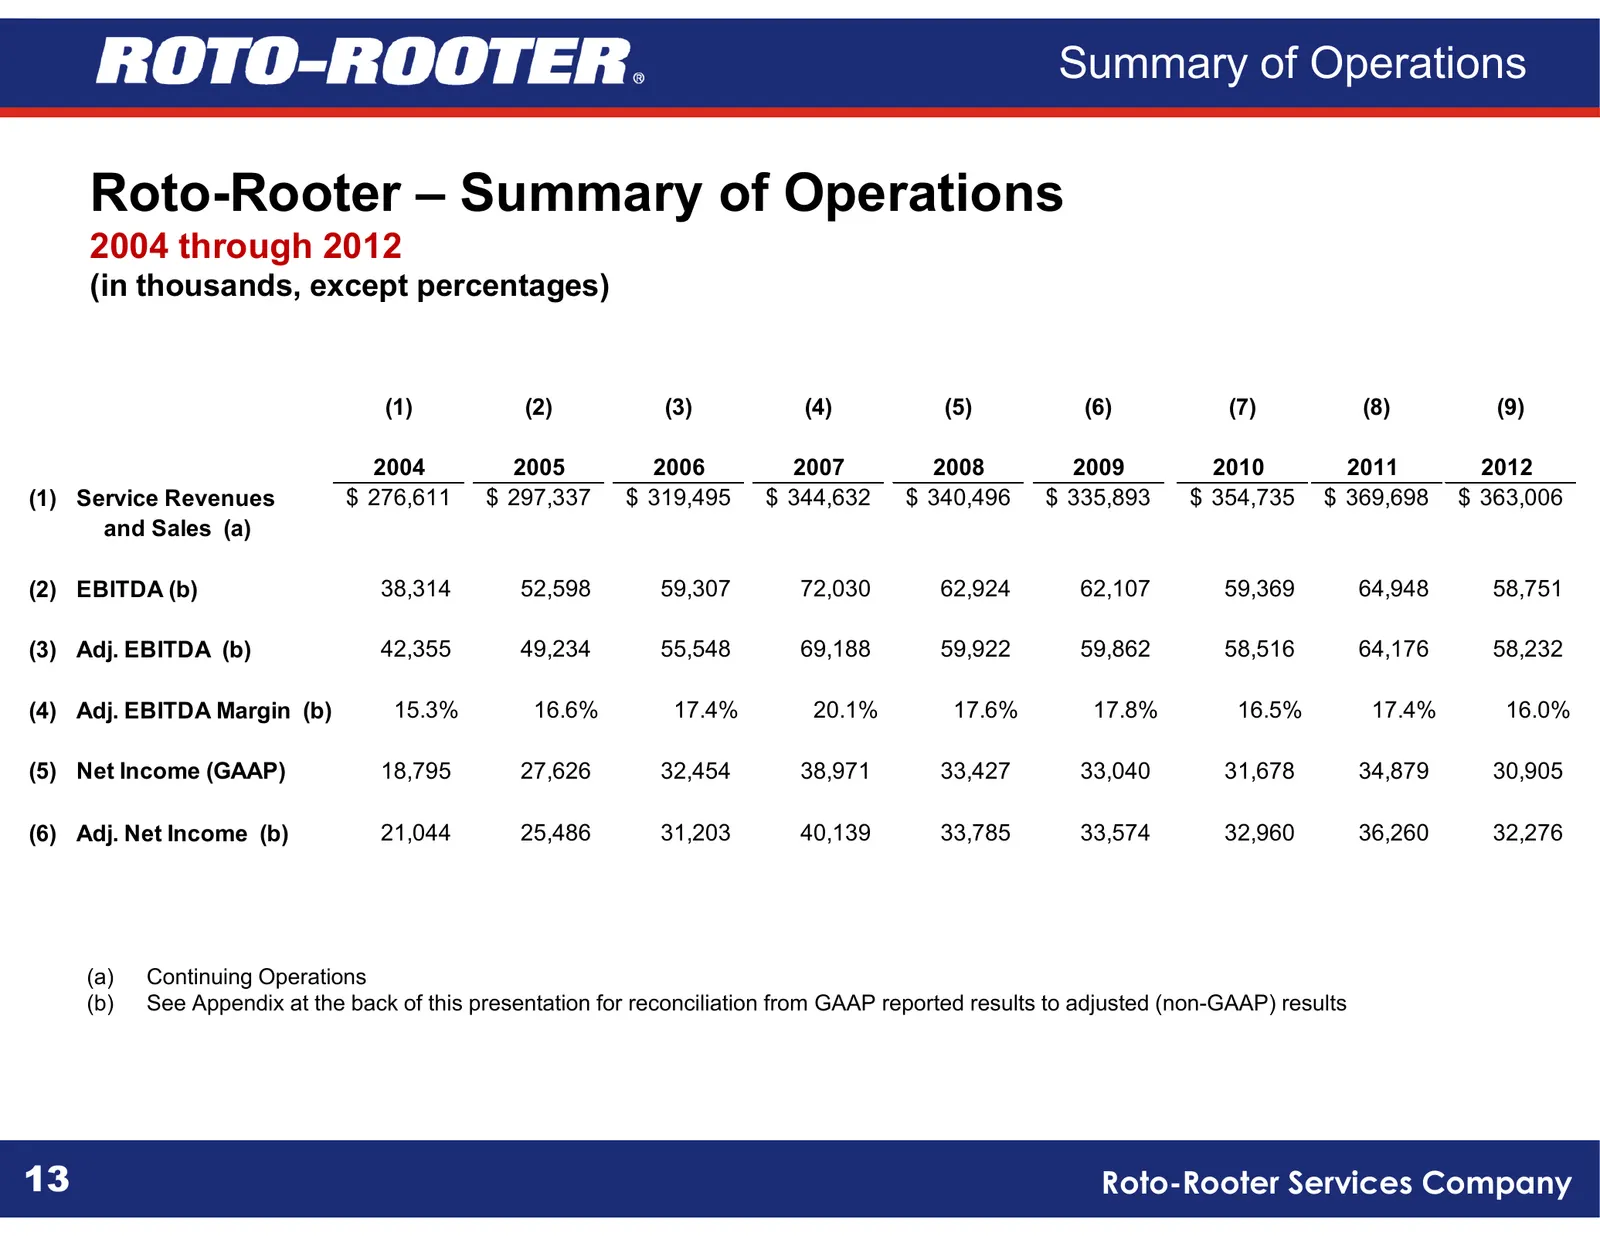
Slide 13: Roto-Rooter – Summary of Operations
Summary of Operations Roto-Rooter – Summary of Operations 2004 through 2012 (in thousands, except percentages) (1) (2) (3) (4) (5) (6) (7) (8) (9) 2004 2005 2006 2007 2008 2009 2010 2011 2012 (1) Service Revenues $ 276,611 $ 297,337 $ 319,495 $ 344,632 $ 340,496 $ 335,893 $ 354,735 $ 369,698 $ 363,0
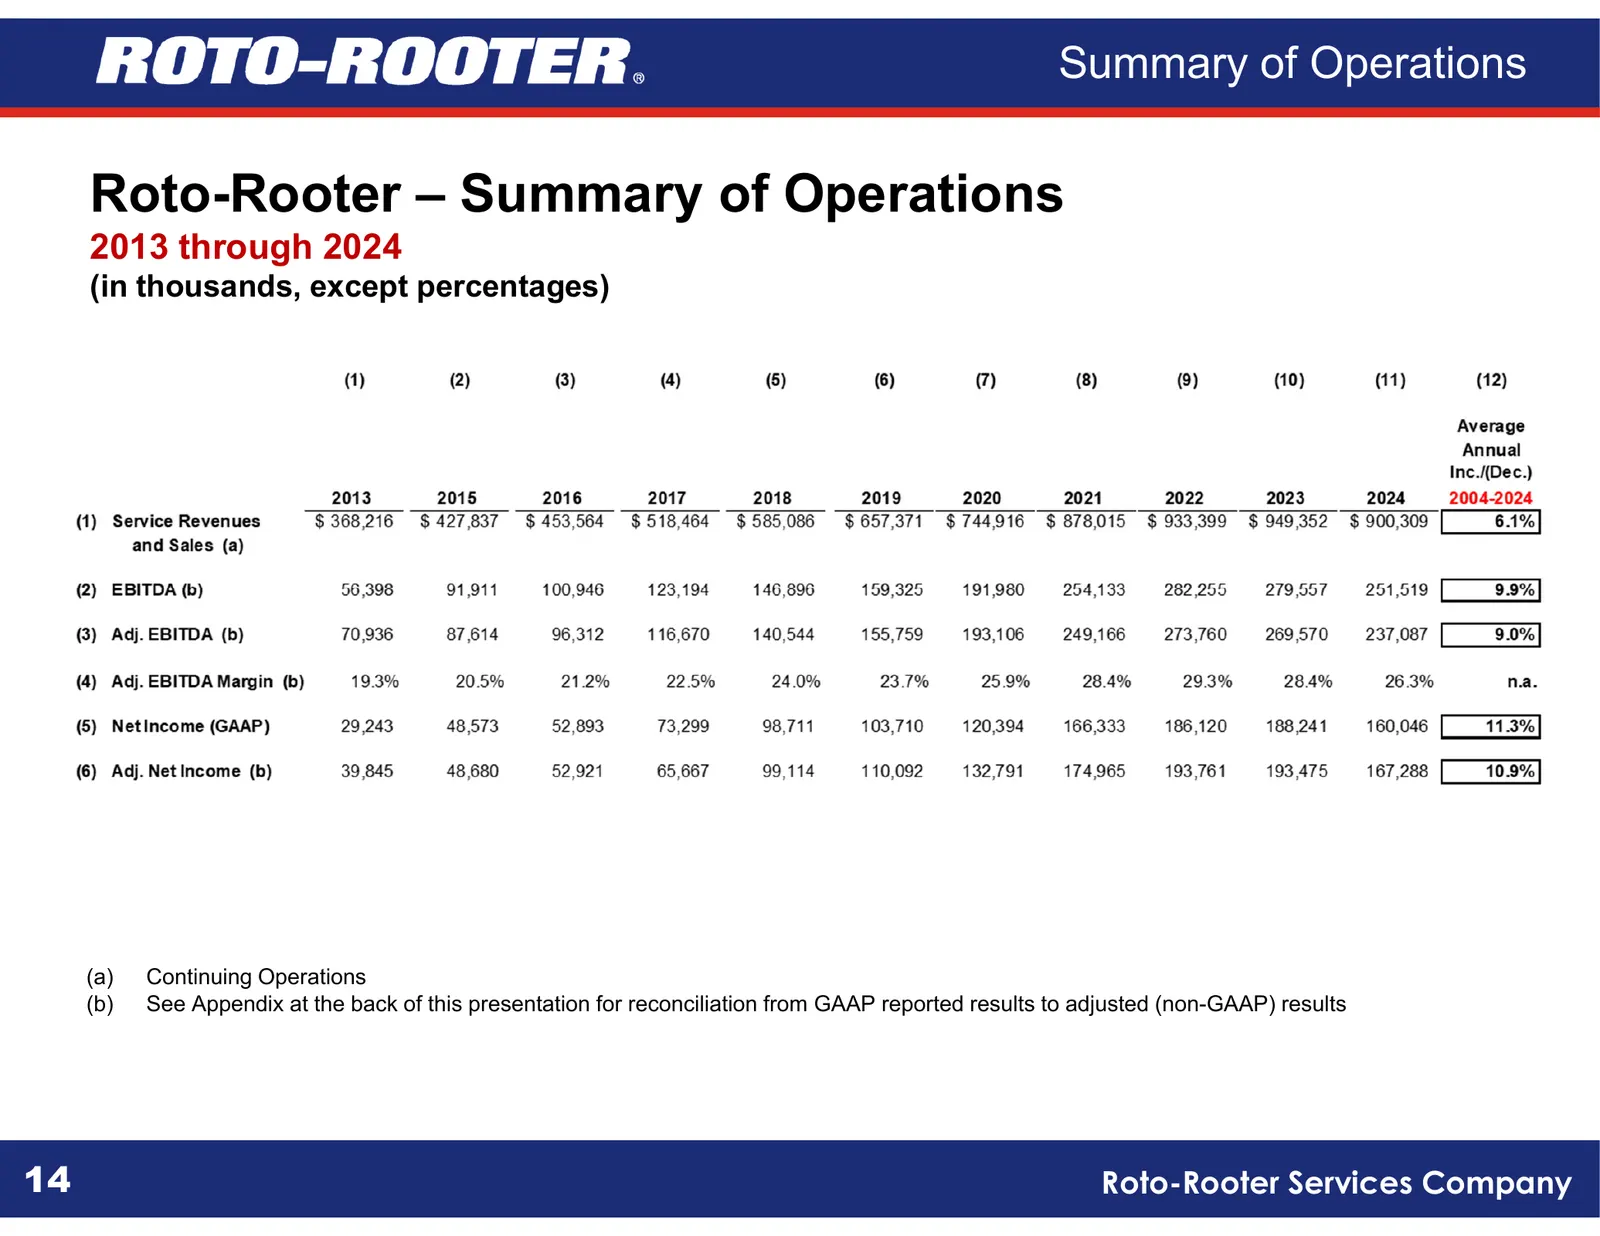
Slide 14: Roto-Rooter – Summary of Operations
Summary of Operations Roto-Rooter – Summary of Operations 2013 through 2024 (in thousands, except percentages) (a) Continuing Operations (b) See Appendix at the back of this presentation for reconciliation from GAAP reported results to adjusted (non-GAAP) results 14 Roto-Rooter Services Company
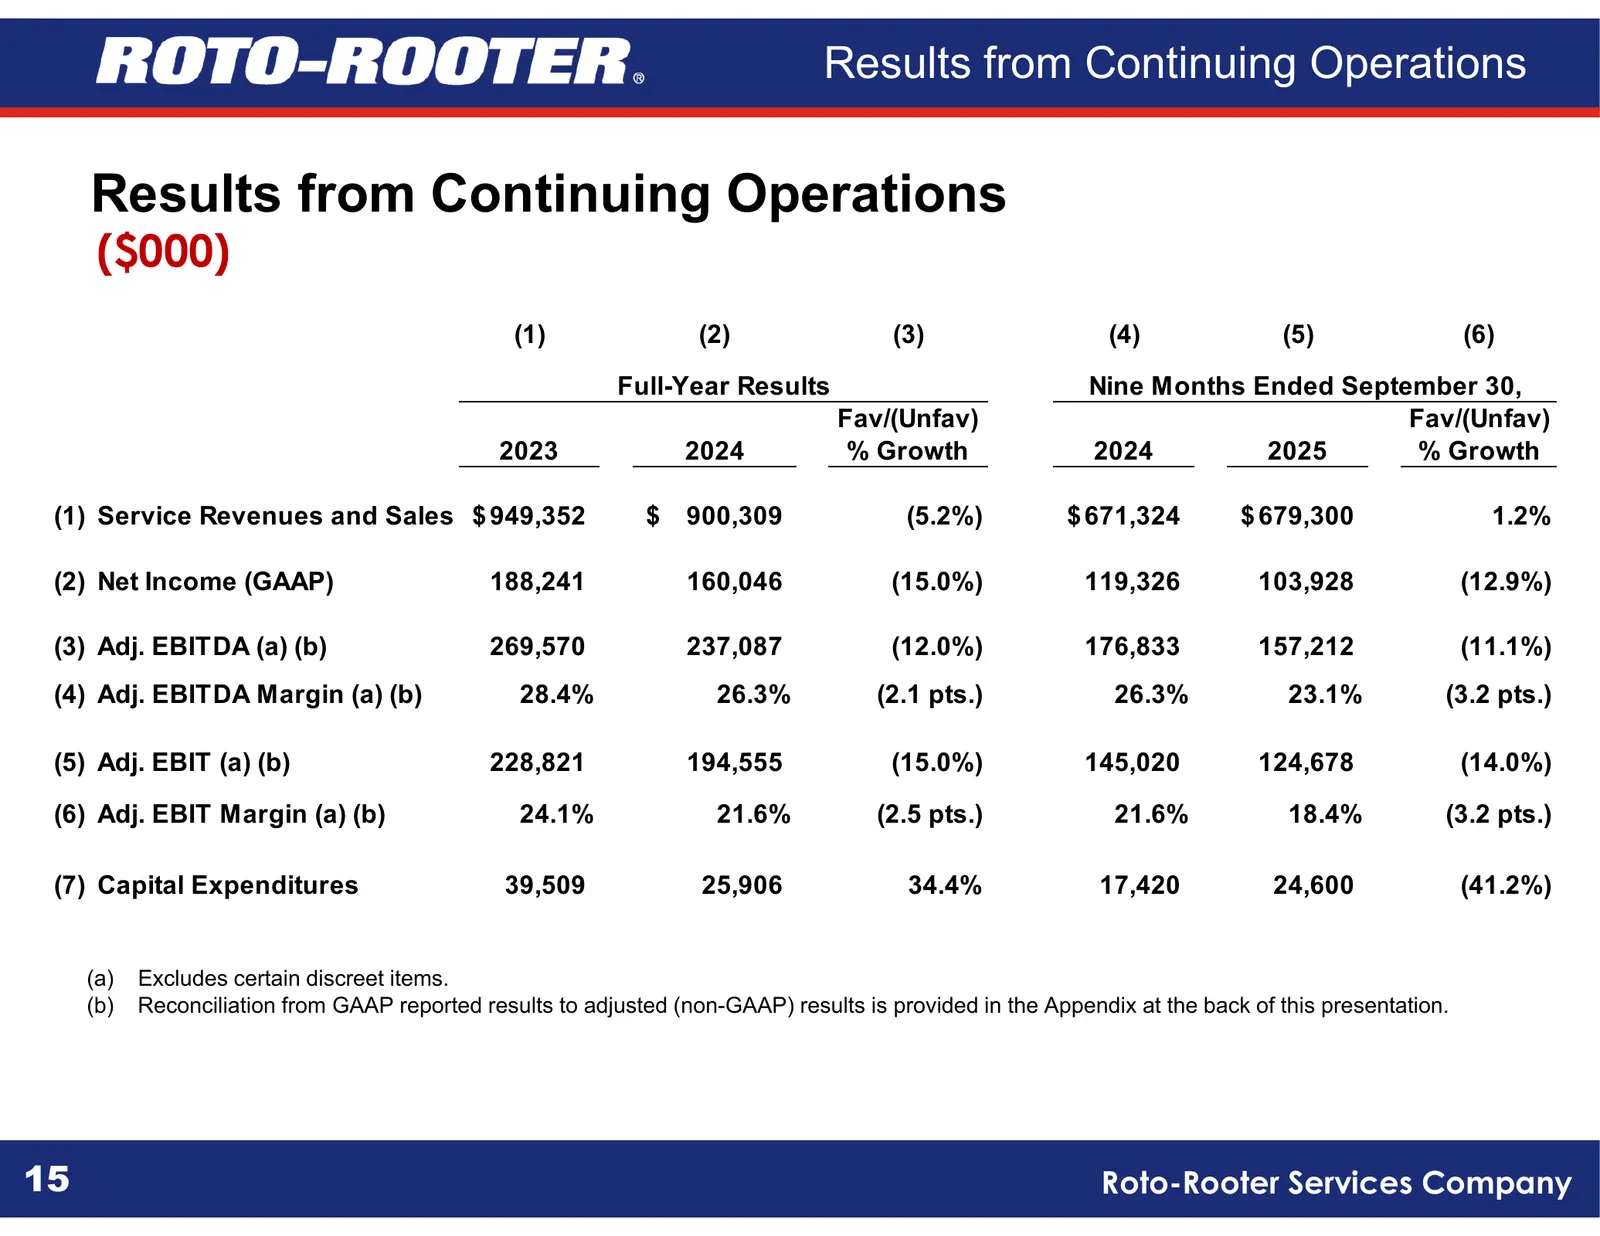
Slide 15: Results from Continuing Operations
Results from Continuing Operations Results from Continuing Operations ($000) (1) (2) (3) (4) (5) (6) Full-Year Results Nine Months Ended September 30, Fav/(Unfav) Fav/(Unfav) 2023 2024 % Growth 2024 2025 % Growth (1) Service Revenues and Sales $ 949,352 $ 900,309 (5.2%) $ 671,324 $ 679,300 1.2% (2)
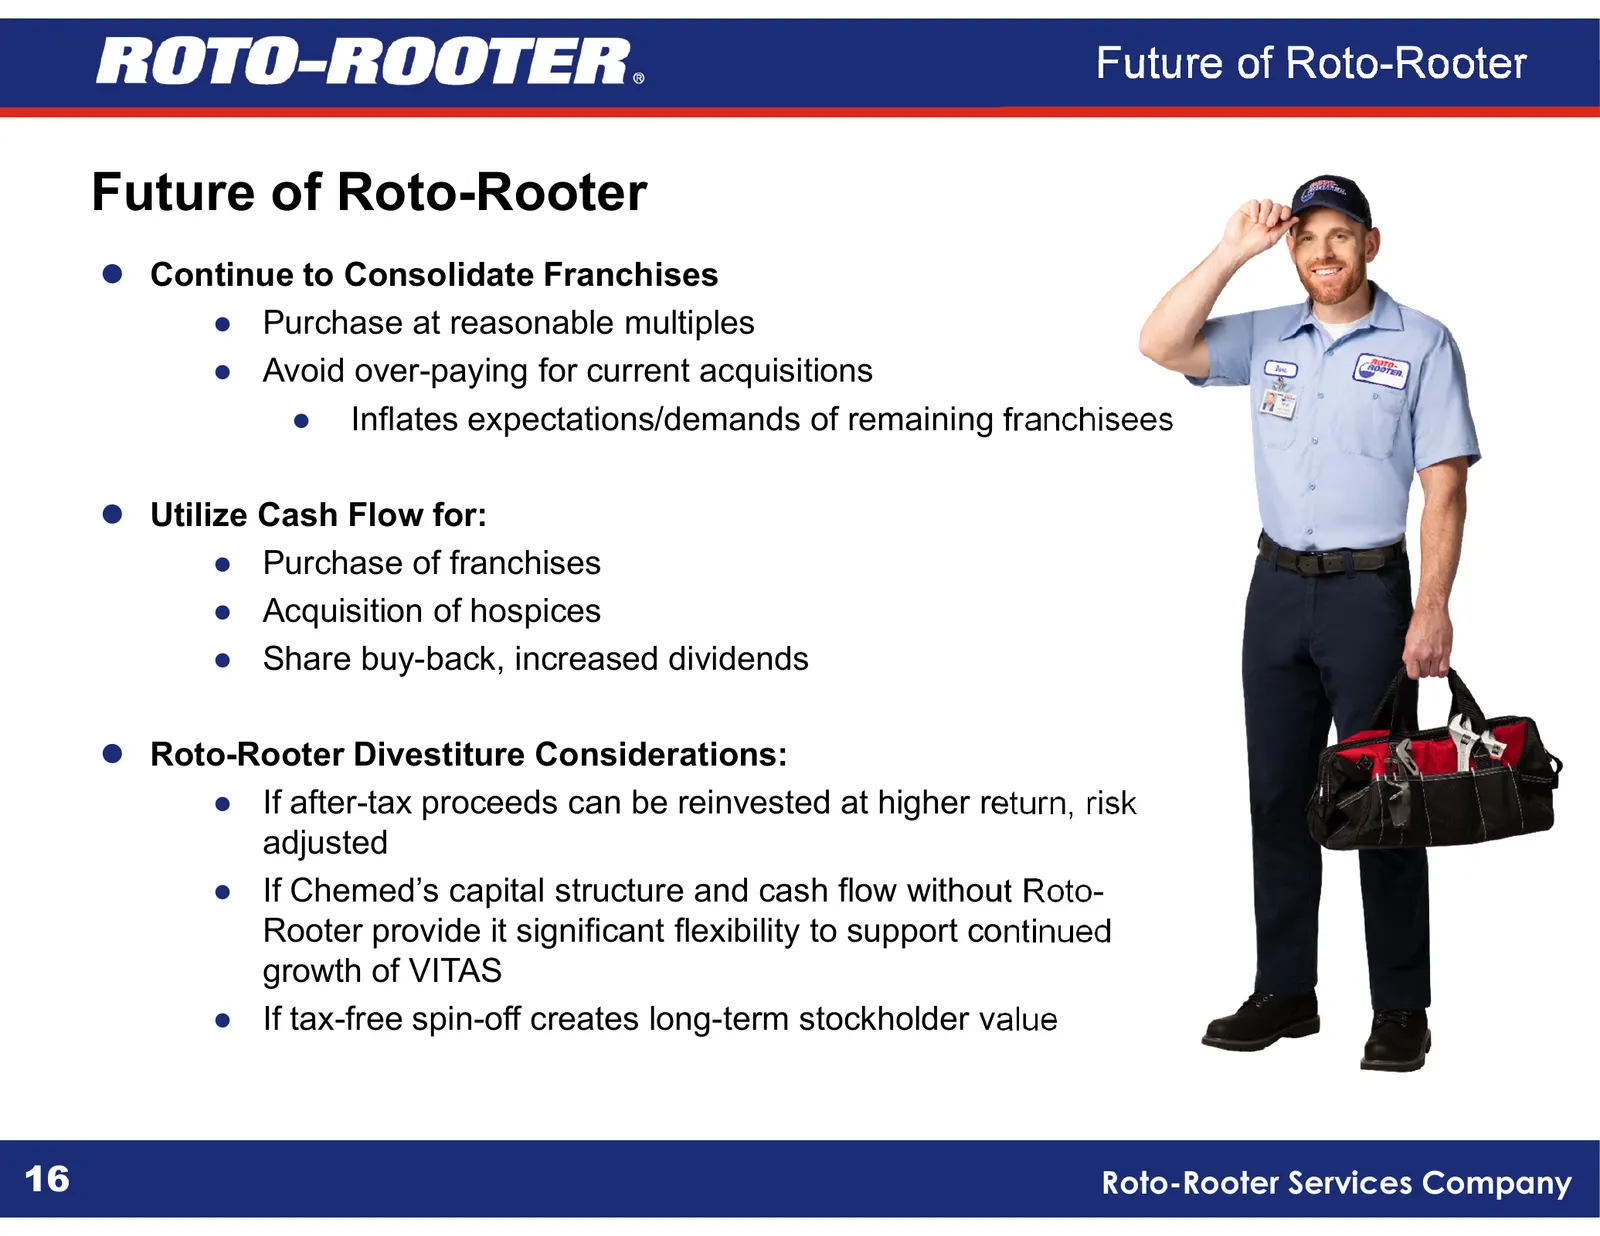
Slide 16: Future of Roto-Rooter
Future of Roto-Rooter Future of Roto-Rooter Continue to Consolidate Franchises ● Purchase at reasonable multiples ● Avoid over-paying for current acquisitions ● Inflates expectations/demands of remaining franchisees Utilize Cash Flow for: ● Purchase of franchises ● Acquisition of hospices ● Shar

Slide 17: VITAS Company Overview
V TA S Company Overview Healthcare
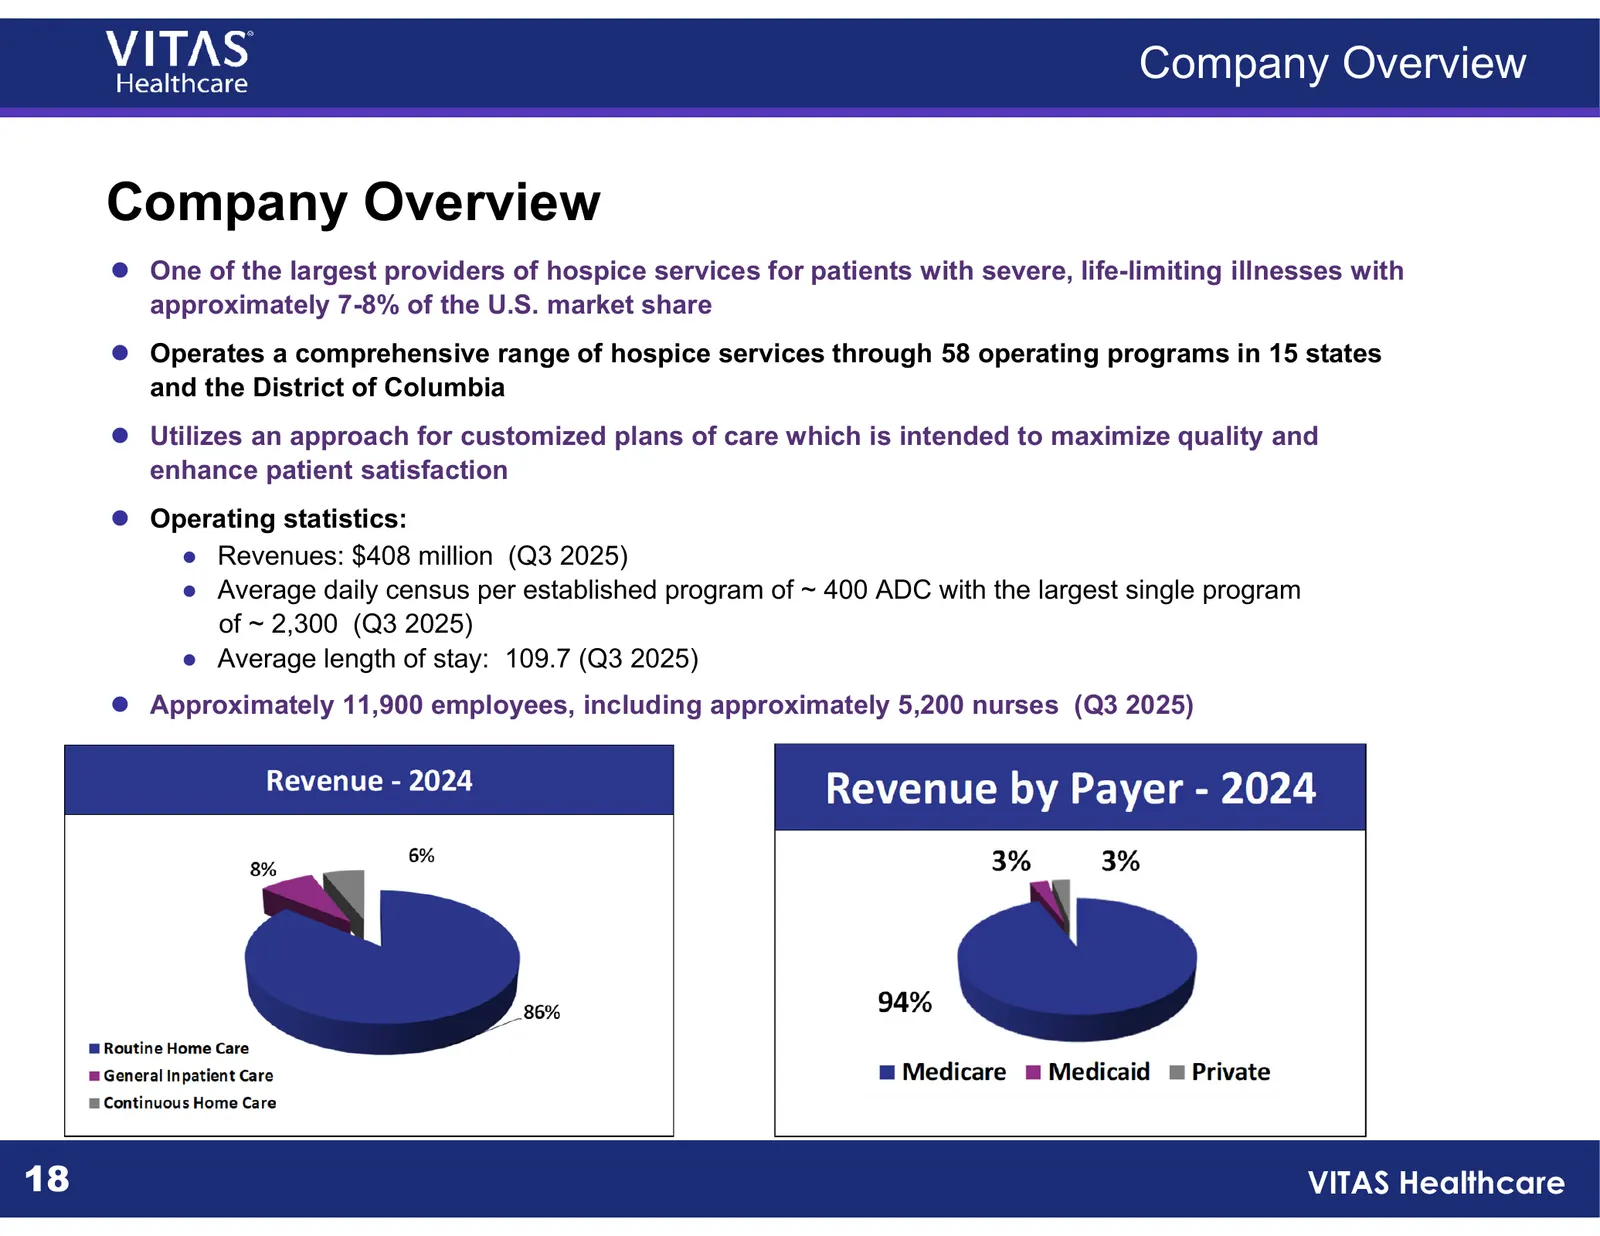
Slide 18: Company Overview
Company Overview Company Overview One of the largest providers of hospice services for patients with severe, life-limiting illnesses with approximately 7-8% of the U.S. market share Operates a comprehensive range of hospice services through 58 operating programs in 15 states and the District of
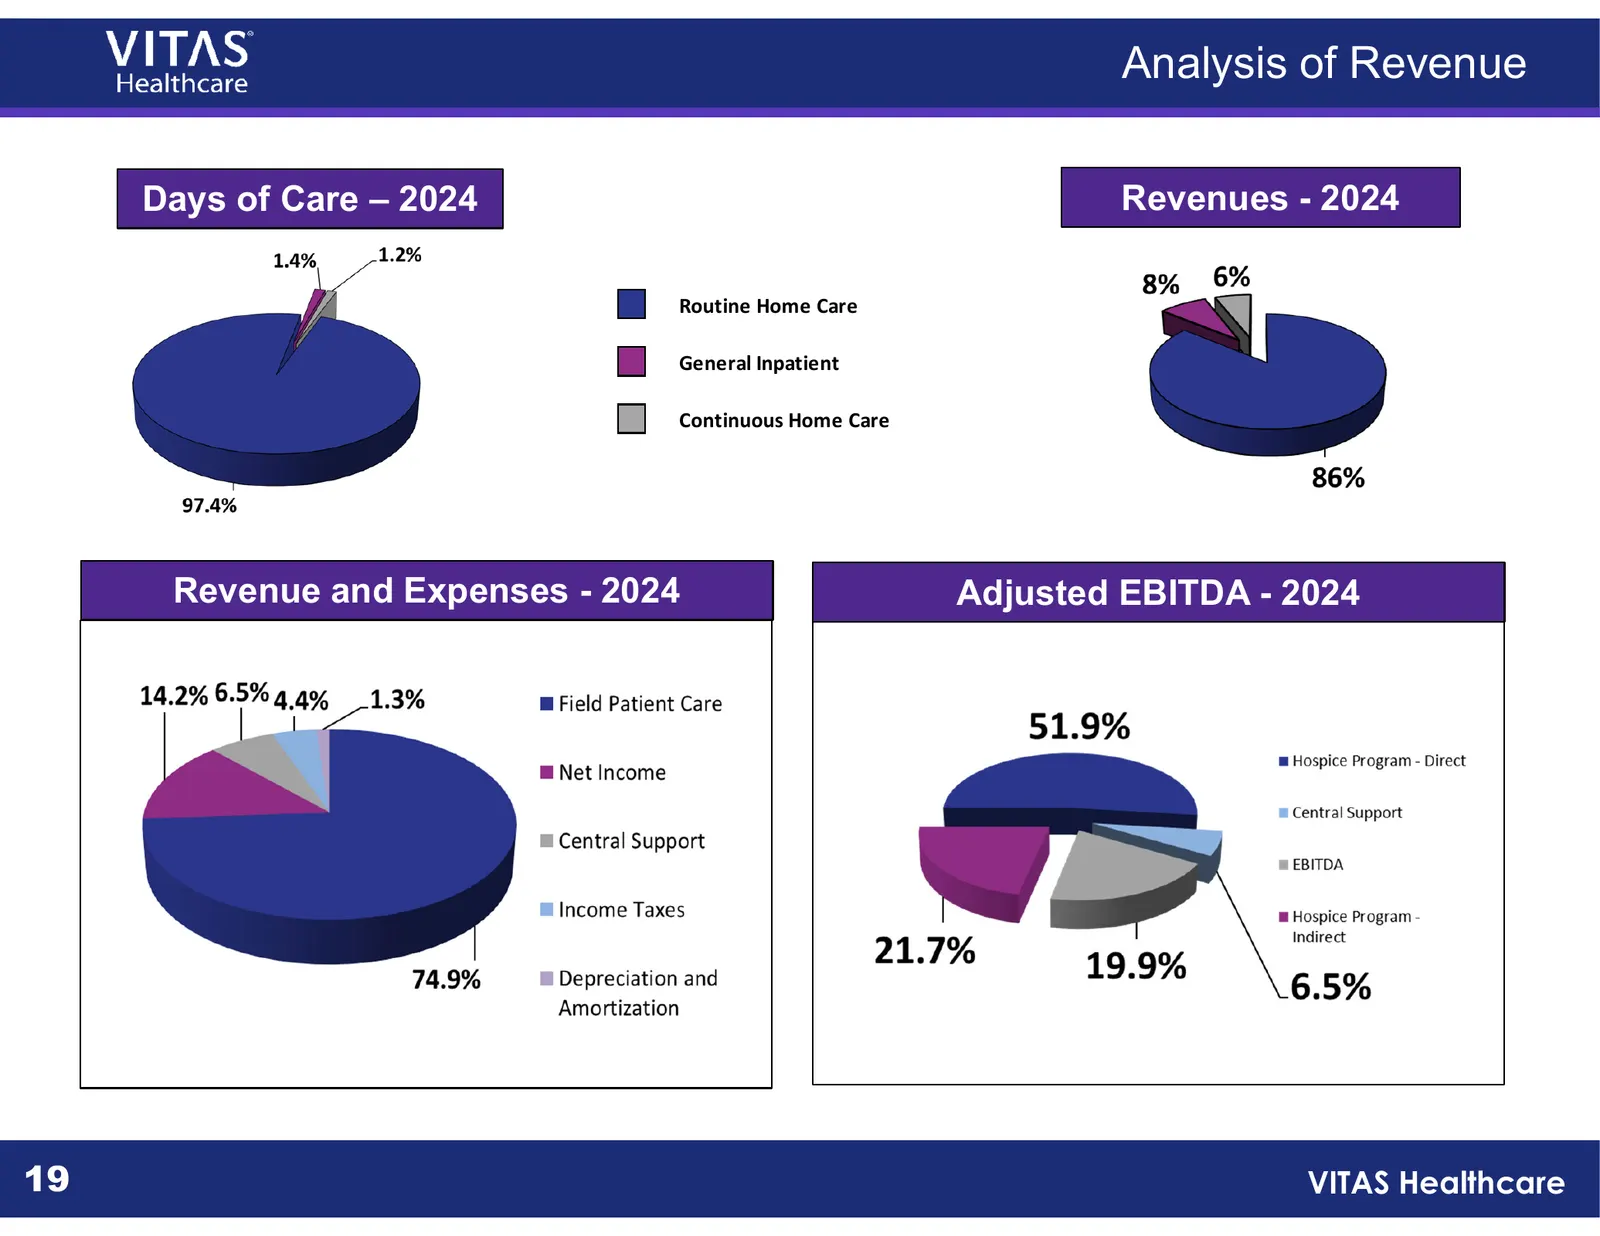
Slide 19: Analysis of Revenue
Analysis of Revenue Days of Care – 2024 Revenues - 2024 Routine Home Care General Inpatient Continuous Home Care Revenue and Expenses - 2024 Adjusted EBITDA - 2024 19 VITAS Healthcare
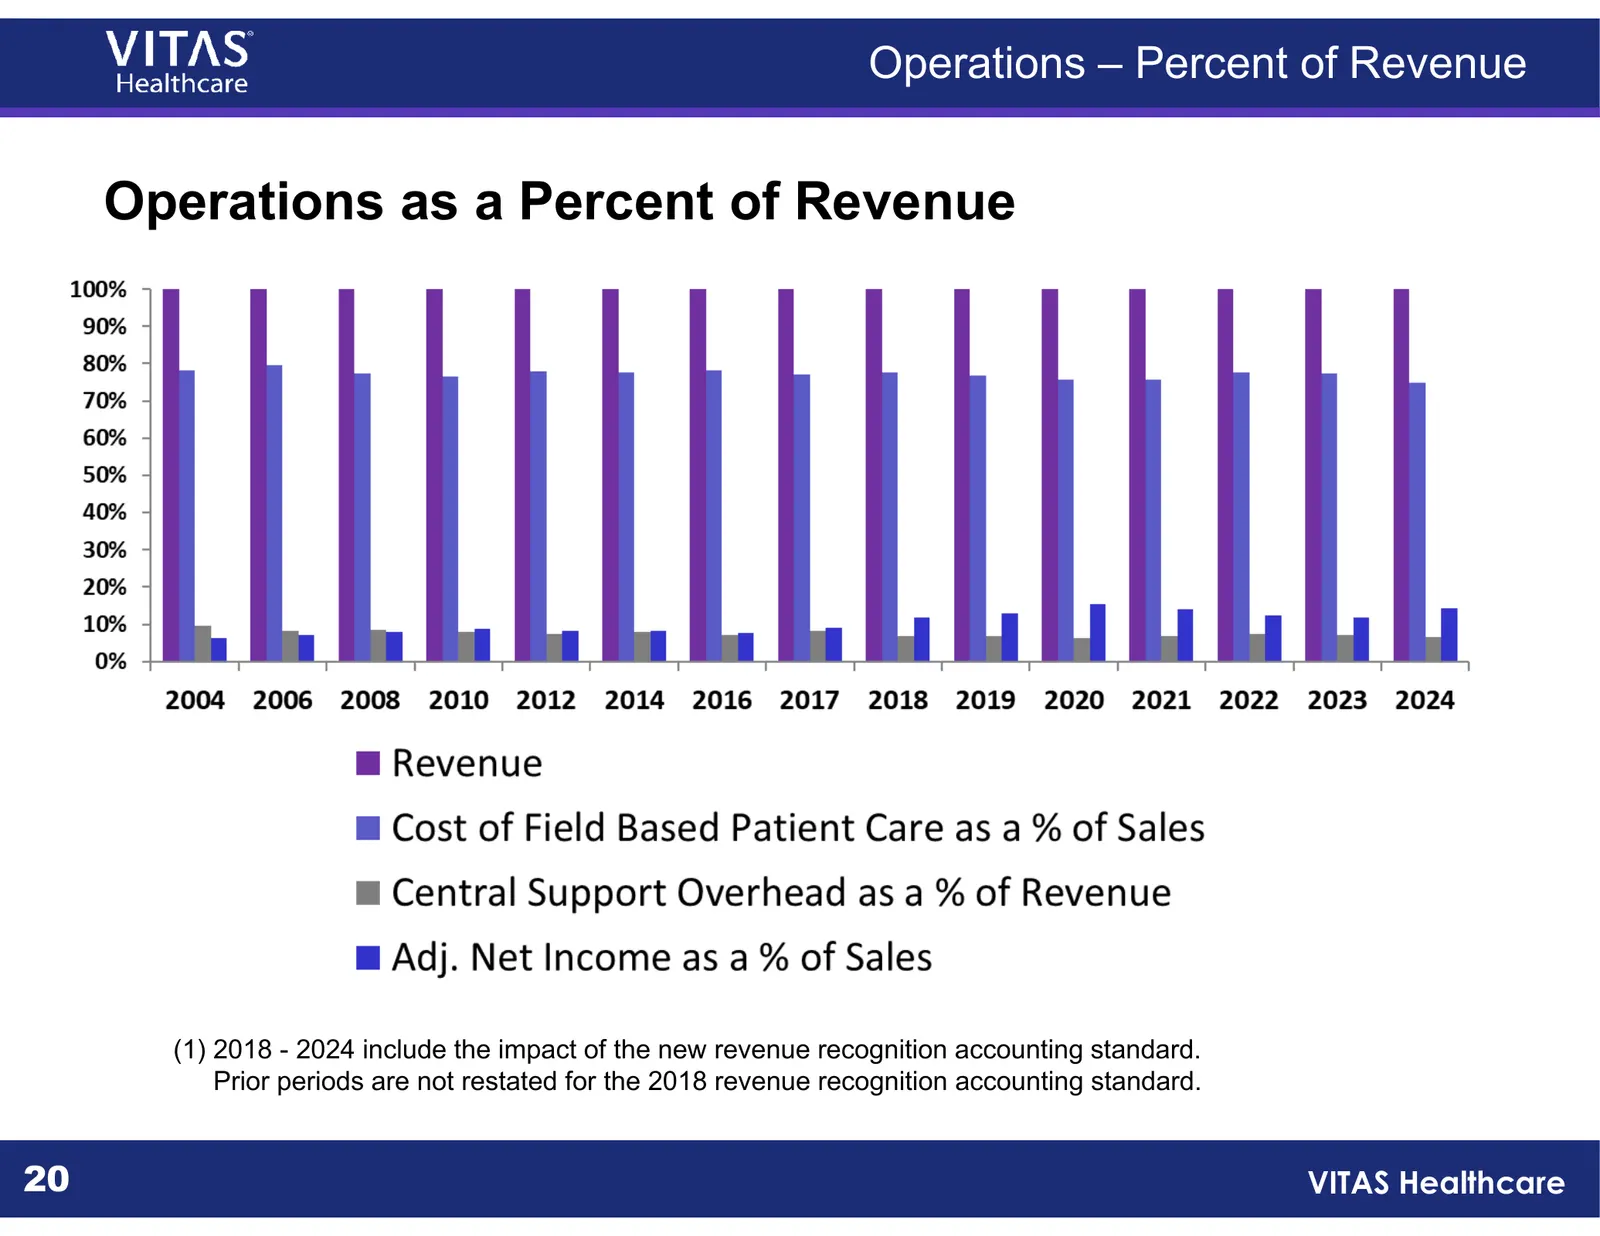
Slide 20: Operations as a Percent of Revenue
Operations – Percent of Revenue Operations as a Percent of Revenue (1) 2018 - 2024 include the impact of the new revenue recognition accounting standard. Prior periods are not restated for the 2018 revenue recognition accounting standard. 20 VITAS Healthcare
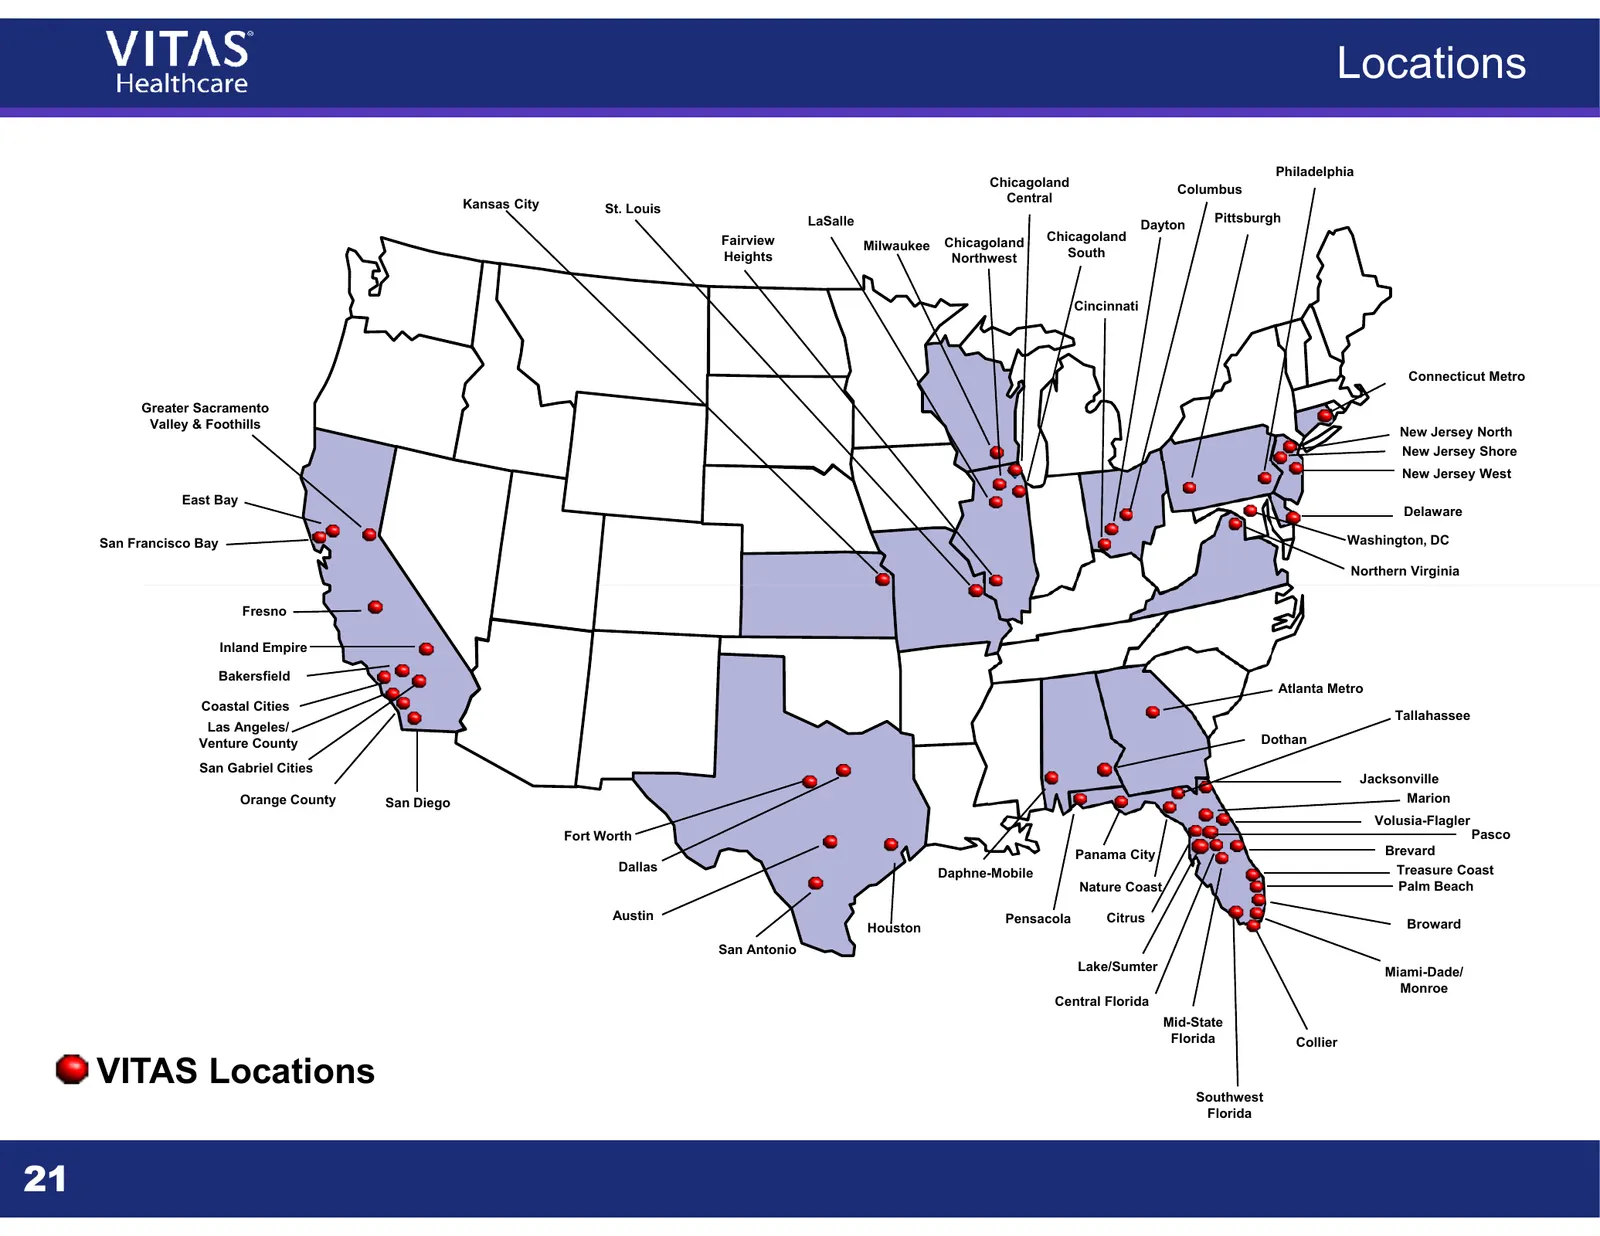
Slide 21: Locations
Locations Philadelphia Chicagoland Columbus Kansas City Central St. Louis LaSalle Pittsburgh Dayton Fairview Chicagoland Chicagoland Milwaukee Heights Northwest South Cincinnati Connecticut Metro Greater Sacramento Valley & Foothills New Jersey North New Jersey Shore New Jersey West East Bay Delawar
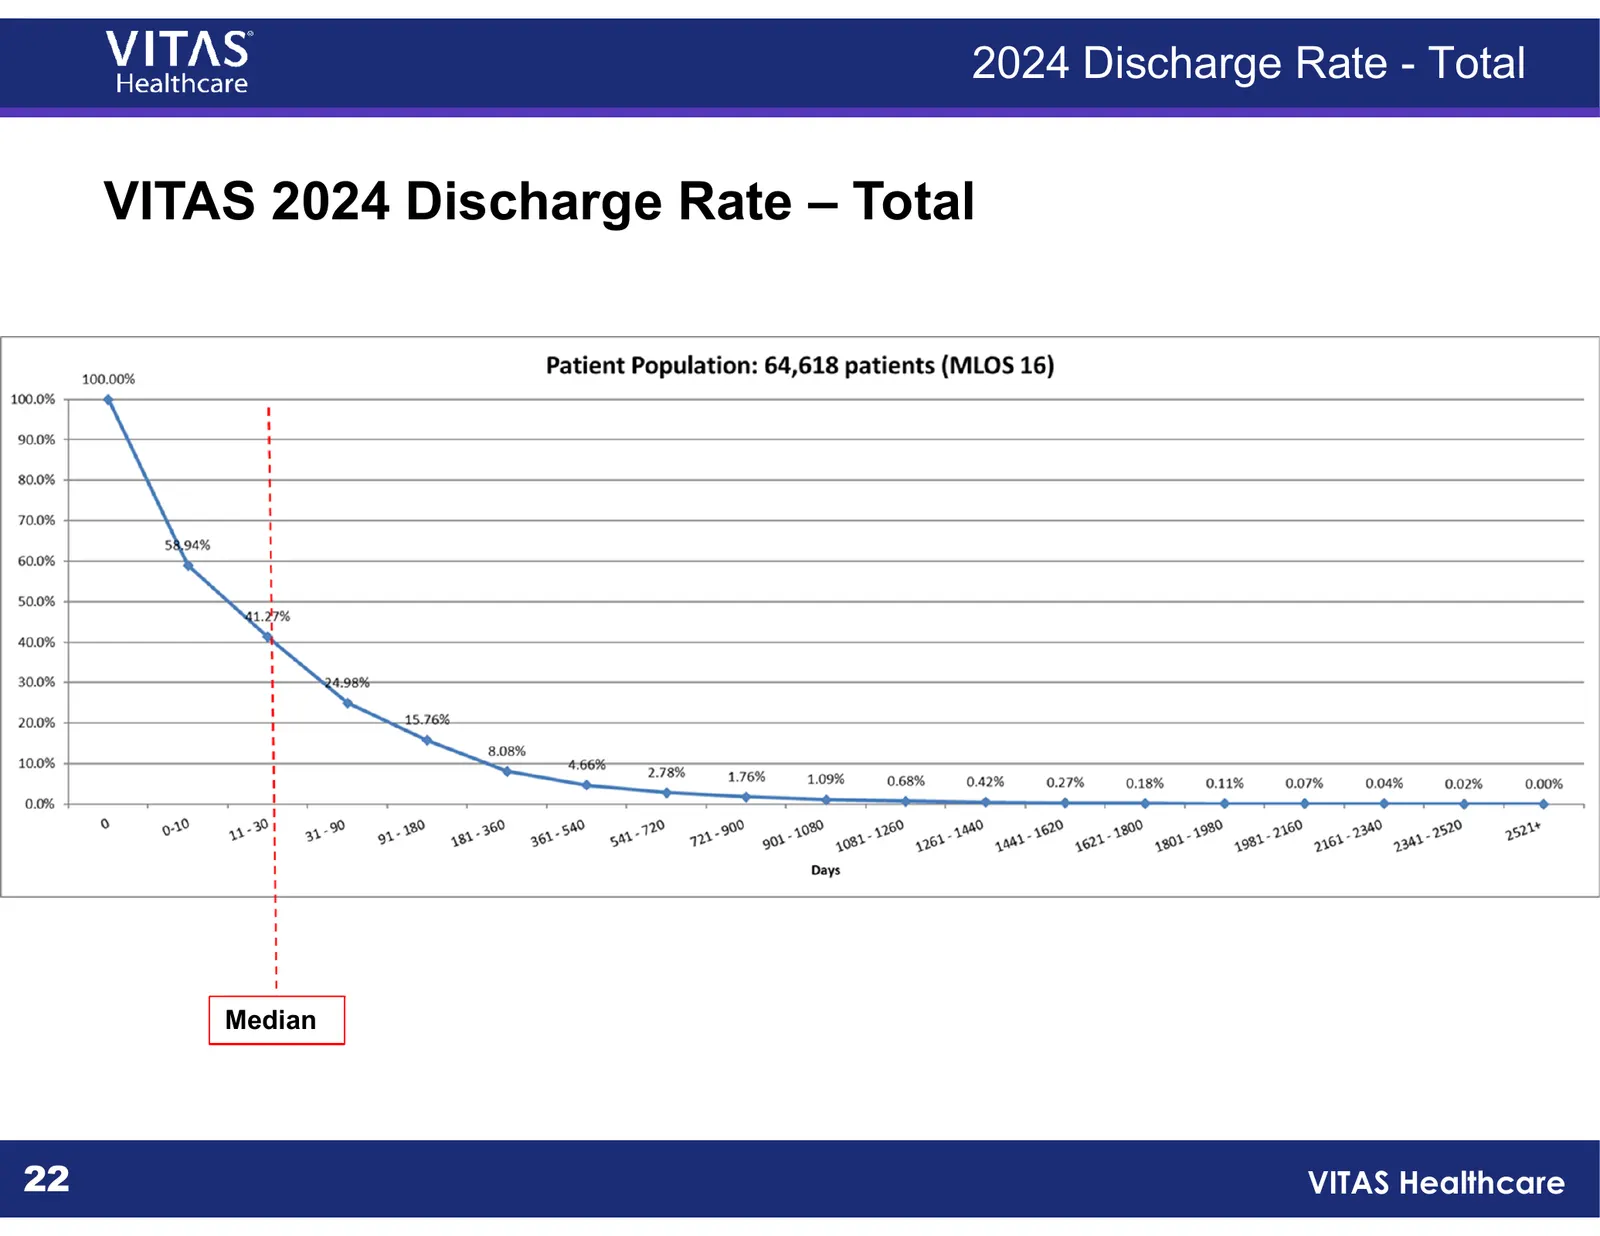
Slide 22: VITAS 2024 Discharge Rate – Total
2024 Discharge Rate - Total VITAS 2024 Discharge Rate – Total Median 22 VITAS Healthcare
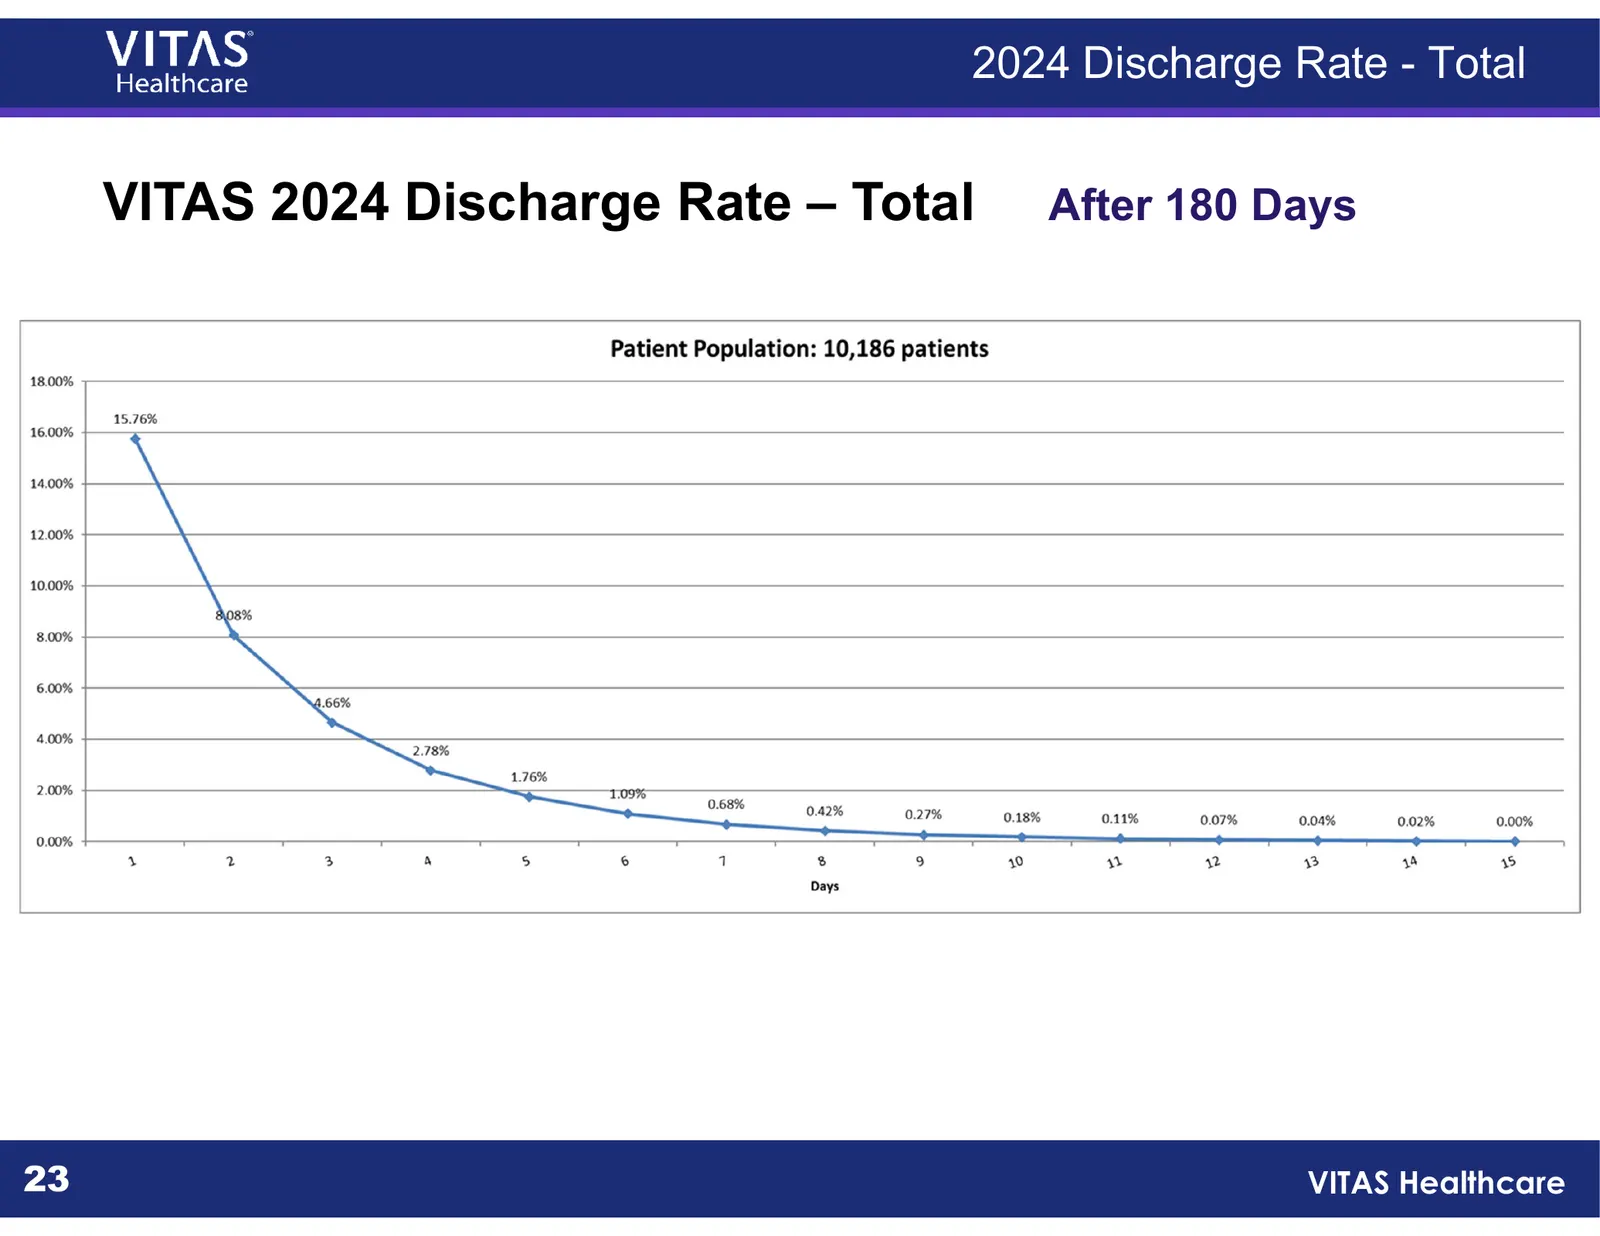
Slide 23: VITAS 2024 Discharge Rate – Total After 180 Days
2024 Discharge Rate - Total VITAS 2024 Discharge Rate – Total After 180 Days 23 VITAS Healthcare
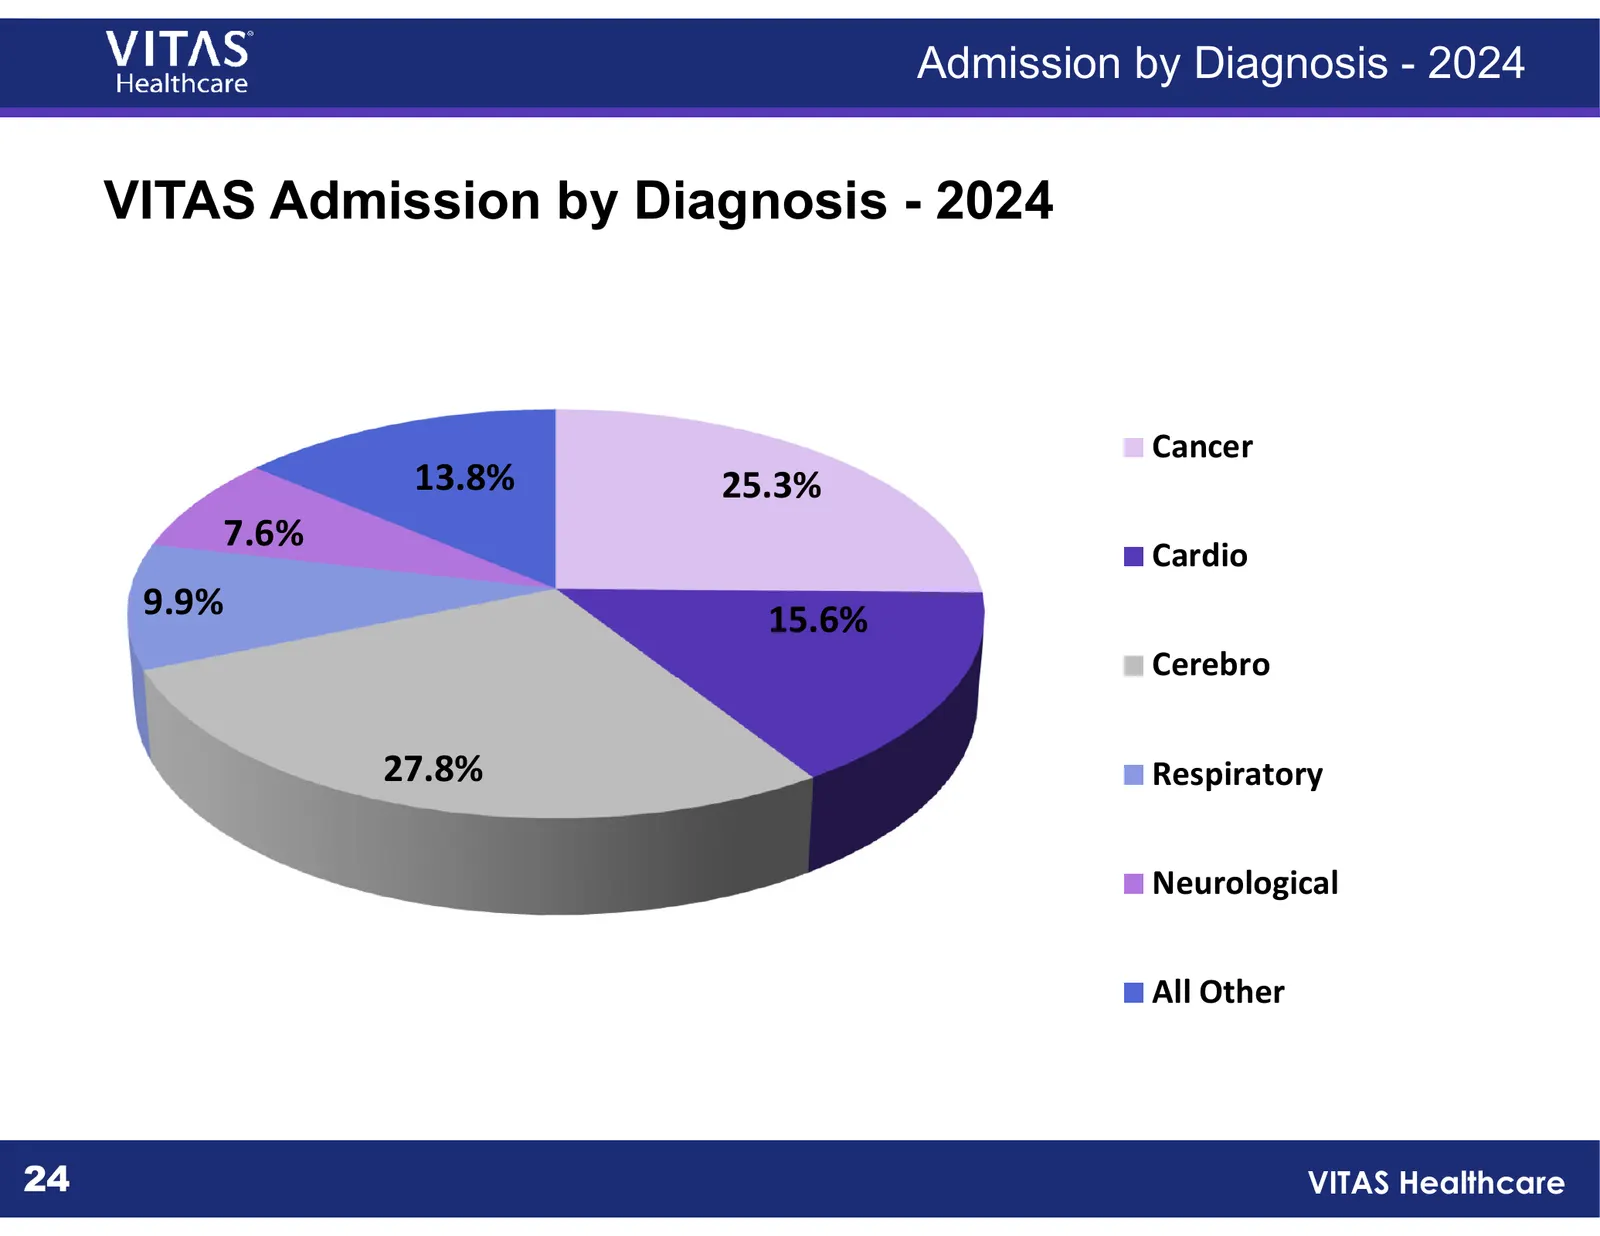
Slide 24: VITAS Admission by Diagnosis - 2024
Admission by Diagnosis - 2024 VITAS Admission by Diagnosis - 2024 Cancer 13.8% 25.3% 7.6% Cardio 9.9% 15.6% Cerebro 27.8% Respiratory Neurological All Other 24 VITAS Healthcare
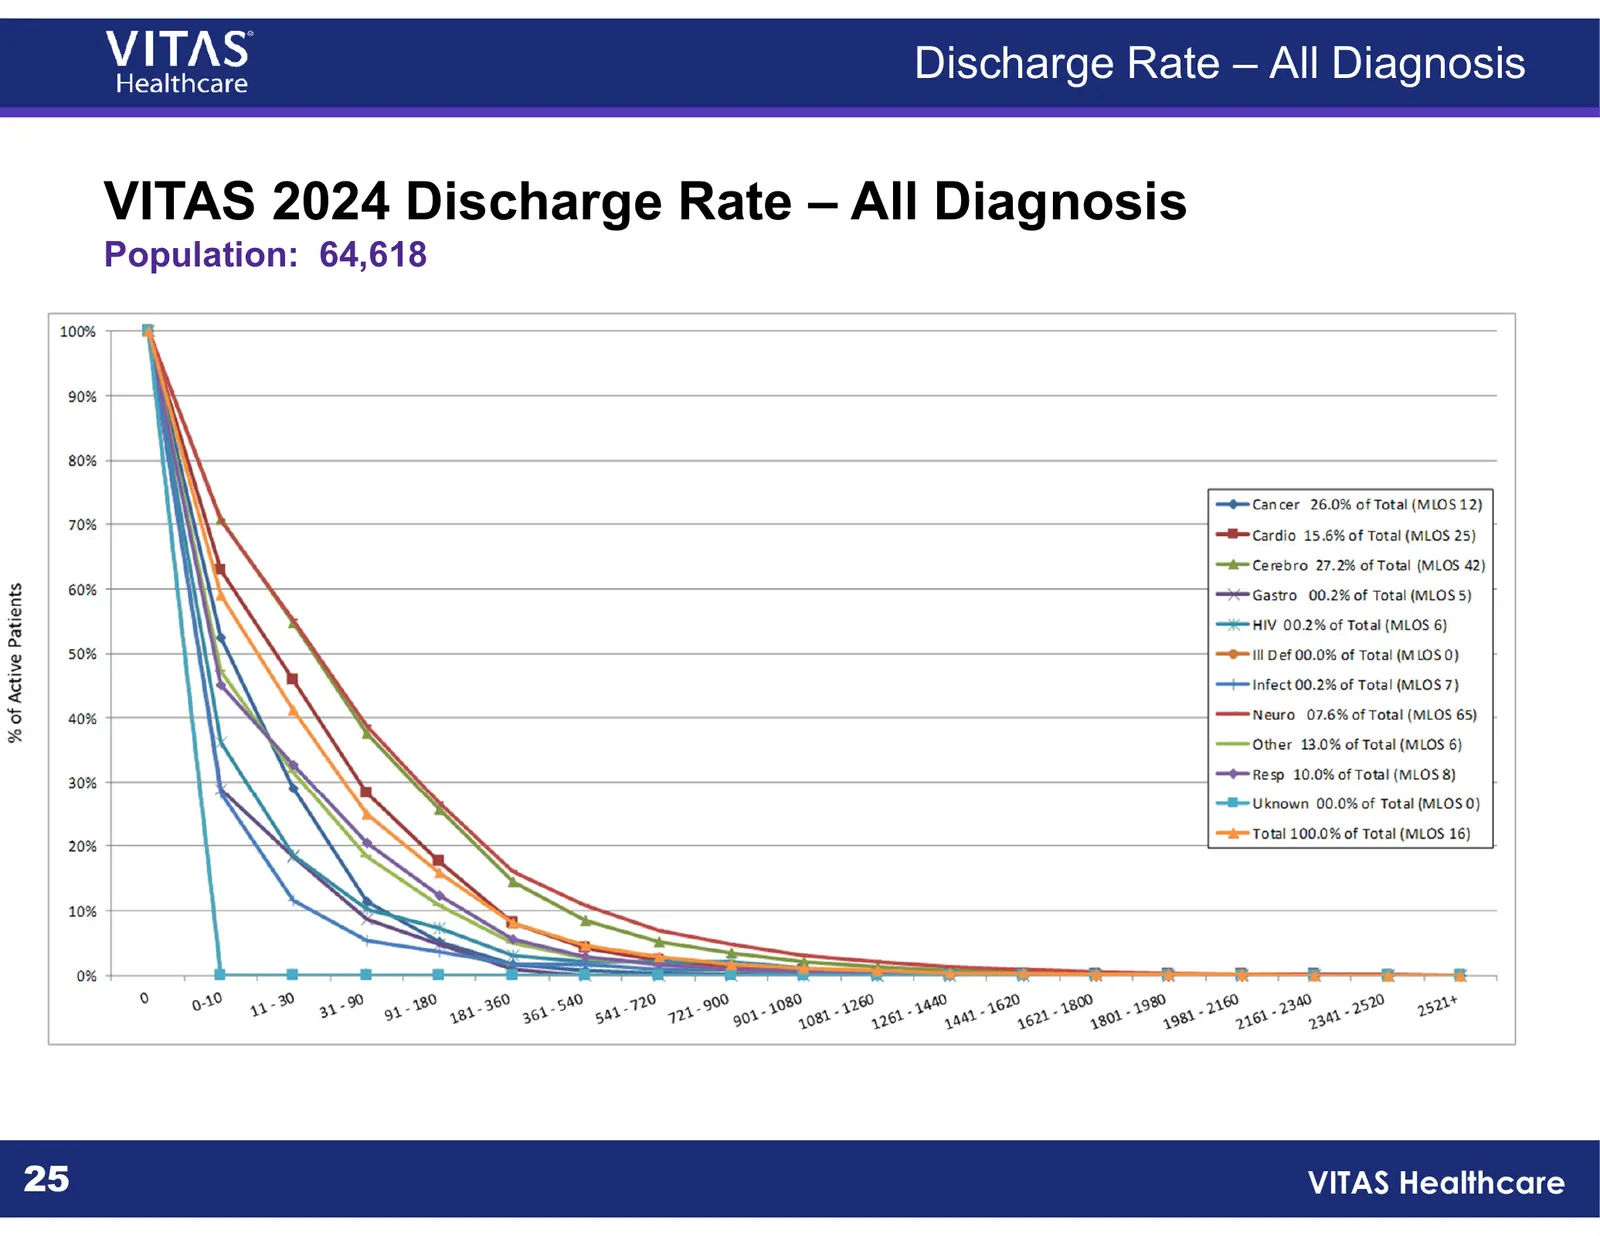
Slide 25: VITAS 2024 Discharge Rate – All Diagnosis
Discharge Rate – All Diagnosis VITAS 2024 Discharge Rate – All Diagnosis Population: 64,618 25 VITAS Healthcare
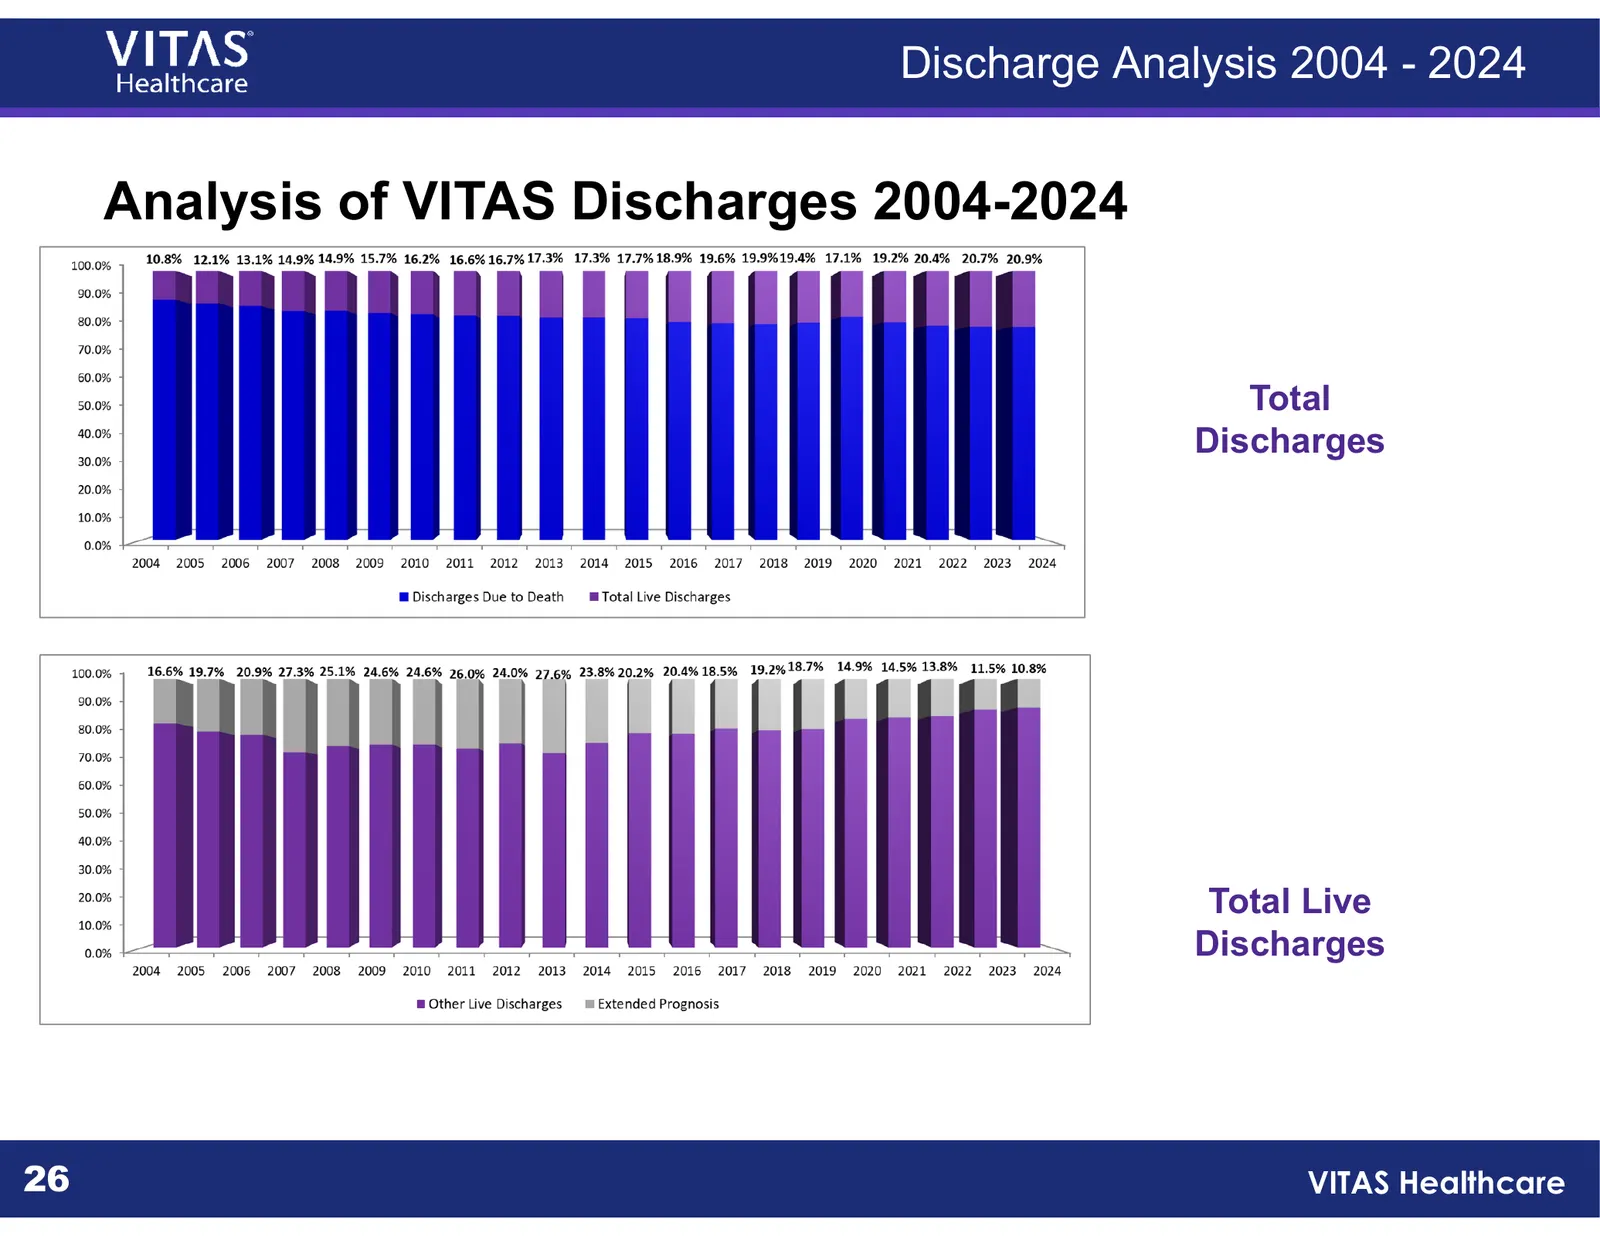
Slide 26: Analysis of VITAS Discharges 2004-2024
Discharge Analysis 2004 - 2024 Analysis of VITAS Discharges 2004-2024 Total Discharges Total Live Discharges 26 VITAS Healthcare
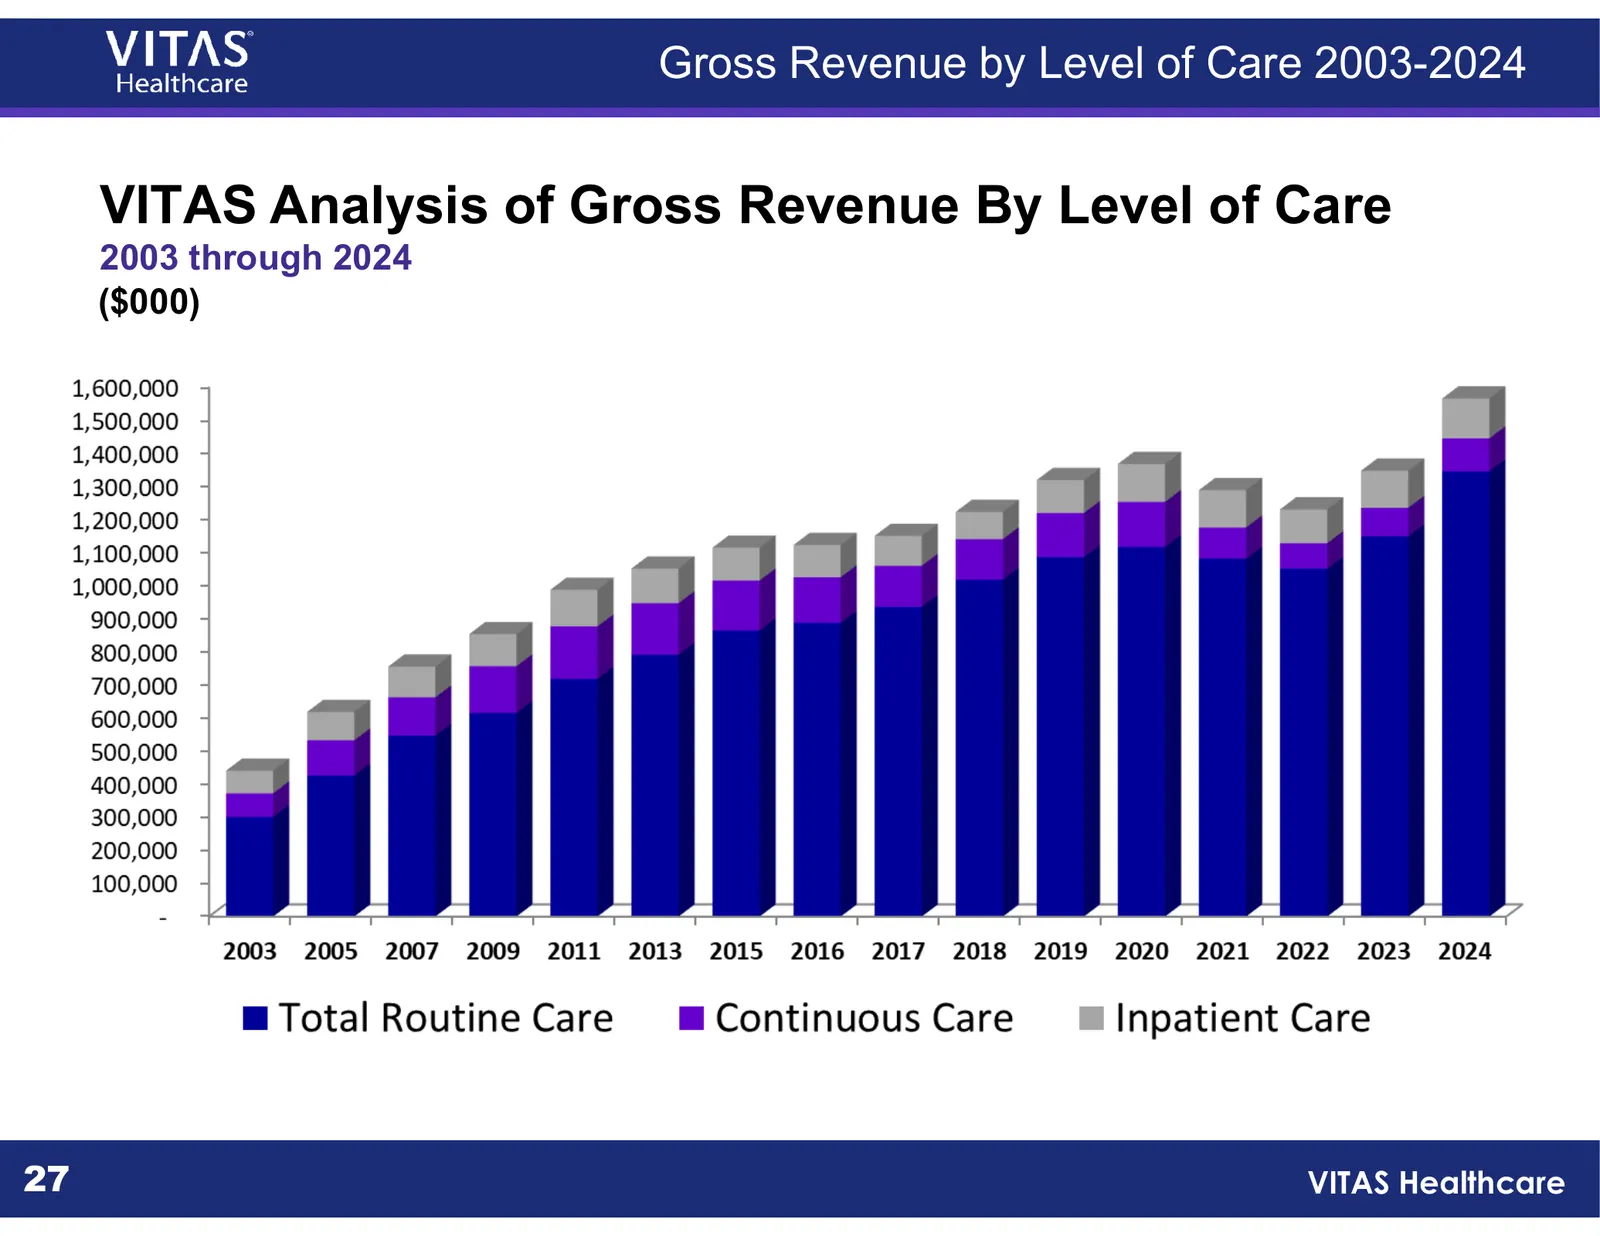
Slide 27: VITAS Analysis of Gross Revenue By Level of Care
Gross Revenue by Level of Care 2003-2024 VITAS Analysis of Gross Revenue By Level of Care 2003 through 2024 ($000) 27 VITAS Healthcare
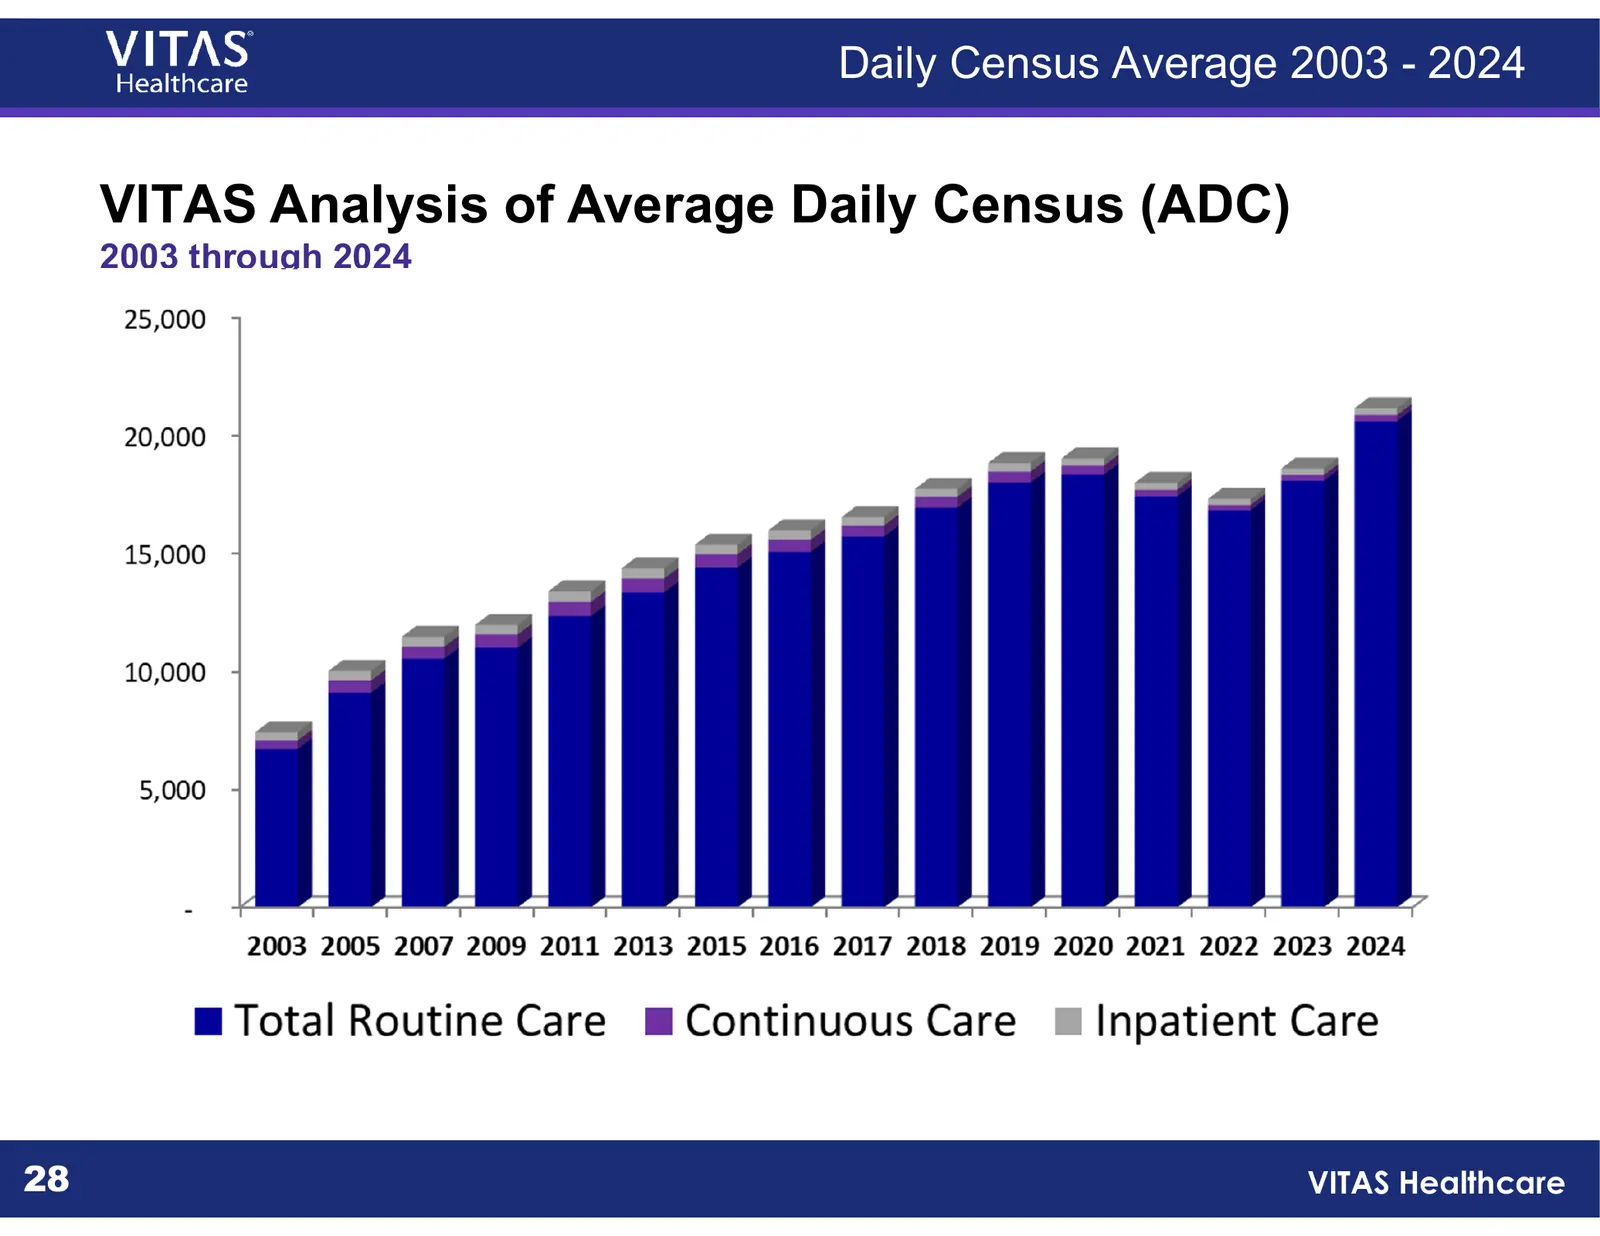
Slide 28: VITAS Analysis of Average Daily Census (ADC)
Daily Census Average 2003 - 2024 VITAS Analysis of Average Daily Census (ADC) 2003 through 2024 20,000 17,742 18,846 19,042 18,613 18,003 16,550 15,992 17,325 18,000 15,385 14,383 16,000 13,406 14,000 11,980 11,477 10,030 12,000 10,000 7,428 8,000 6,000 4,000 2,000 - 2003 2005 2007 2009 2011 2013 20
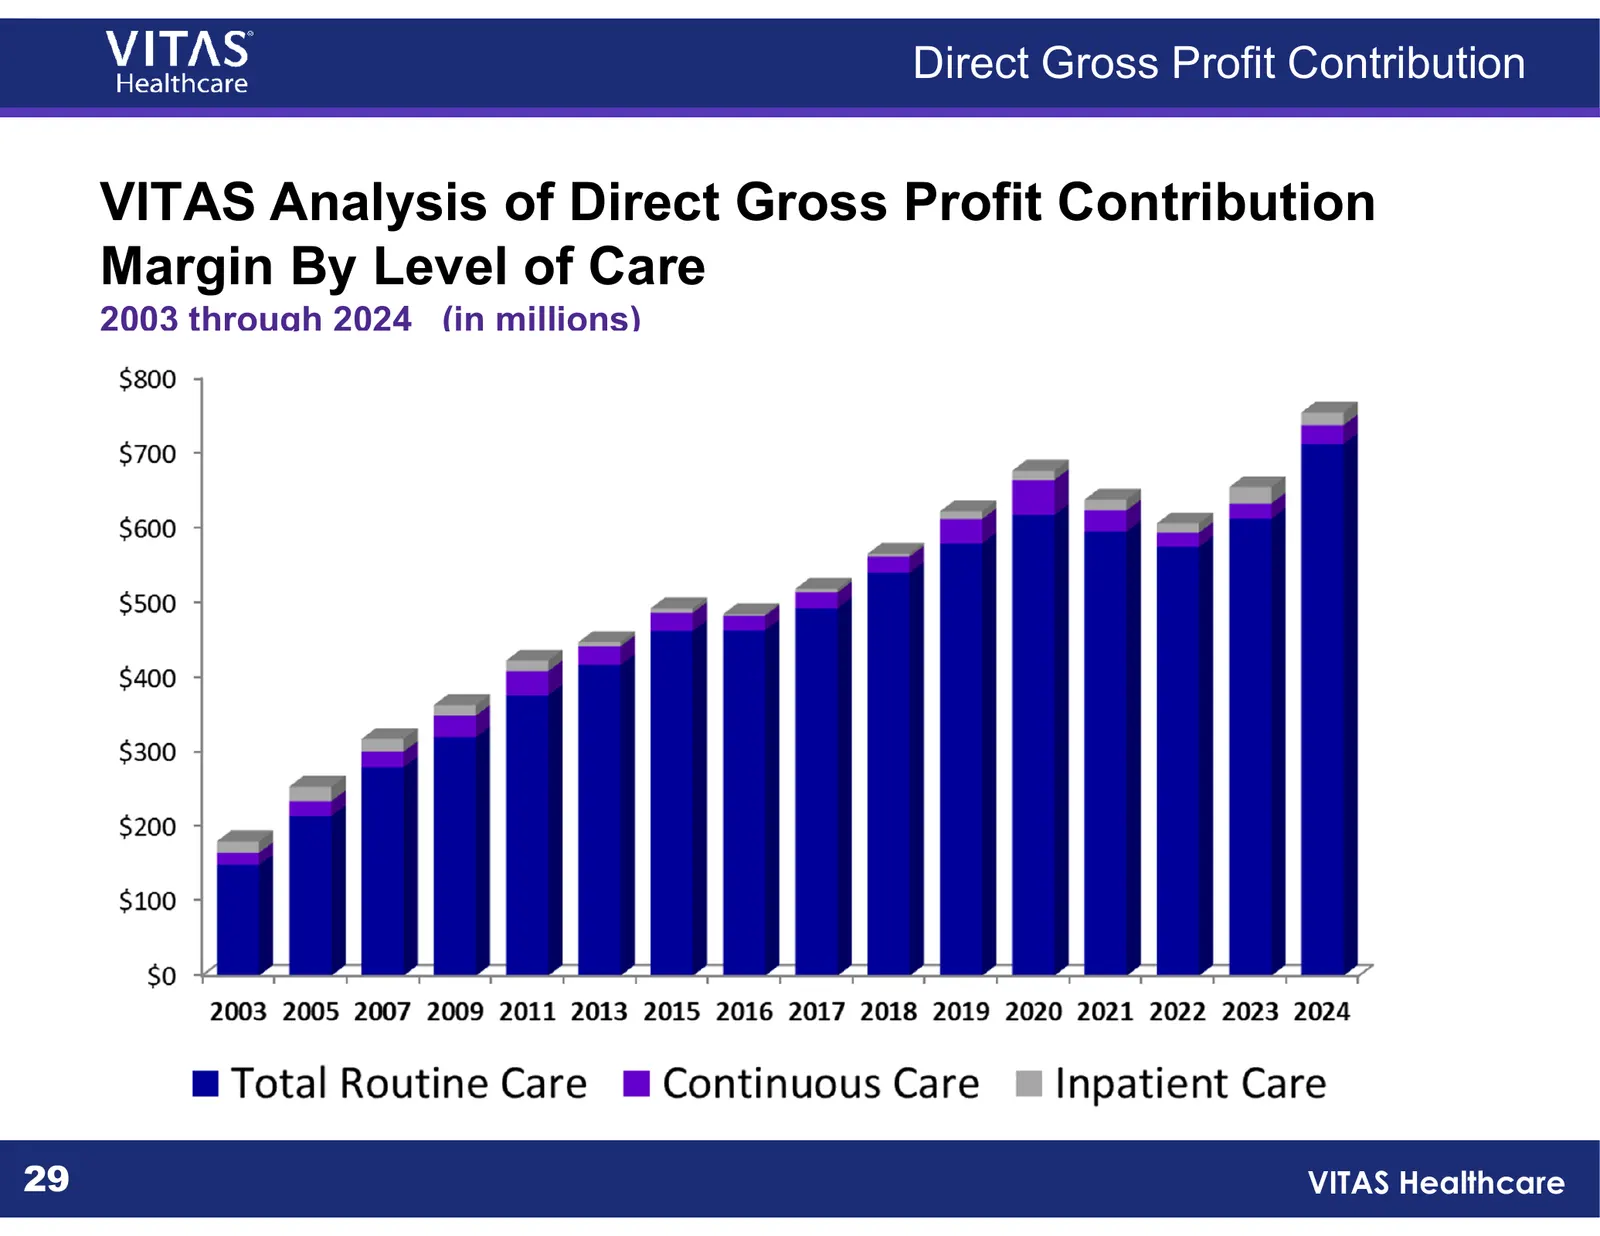
Slide 29: VITAS Analysis of Direct Gross Profit Contribution Margin
Direct Gross Profit Contribution VITAS Analysis of Direct Gross Profit Contribution Margin By Level of Care 2003 through 2024 (in millions) 29 VITAS Healthcare
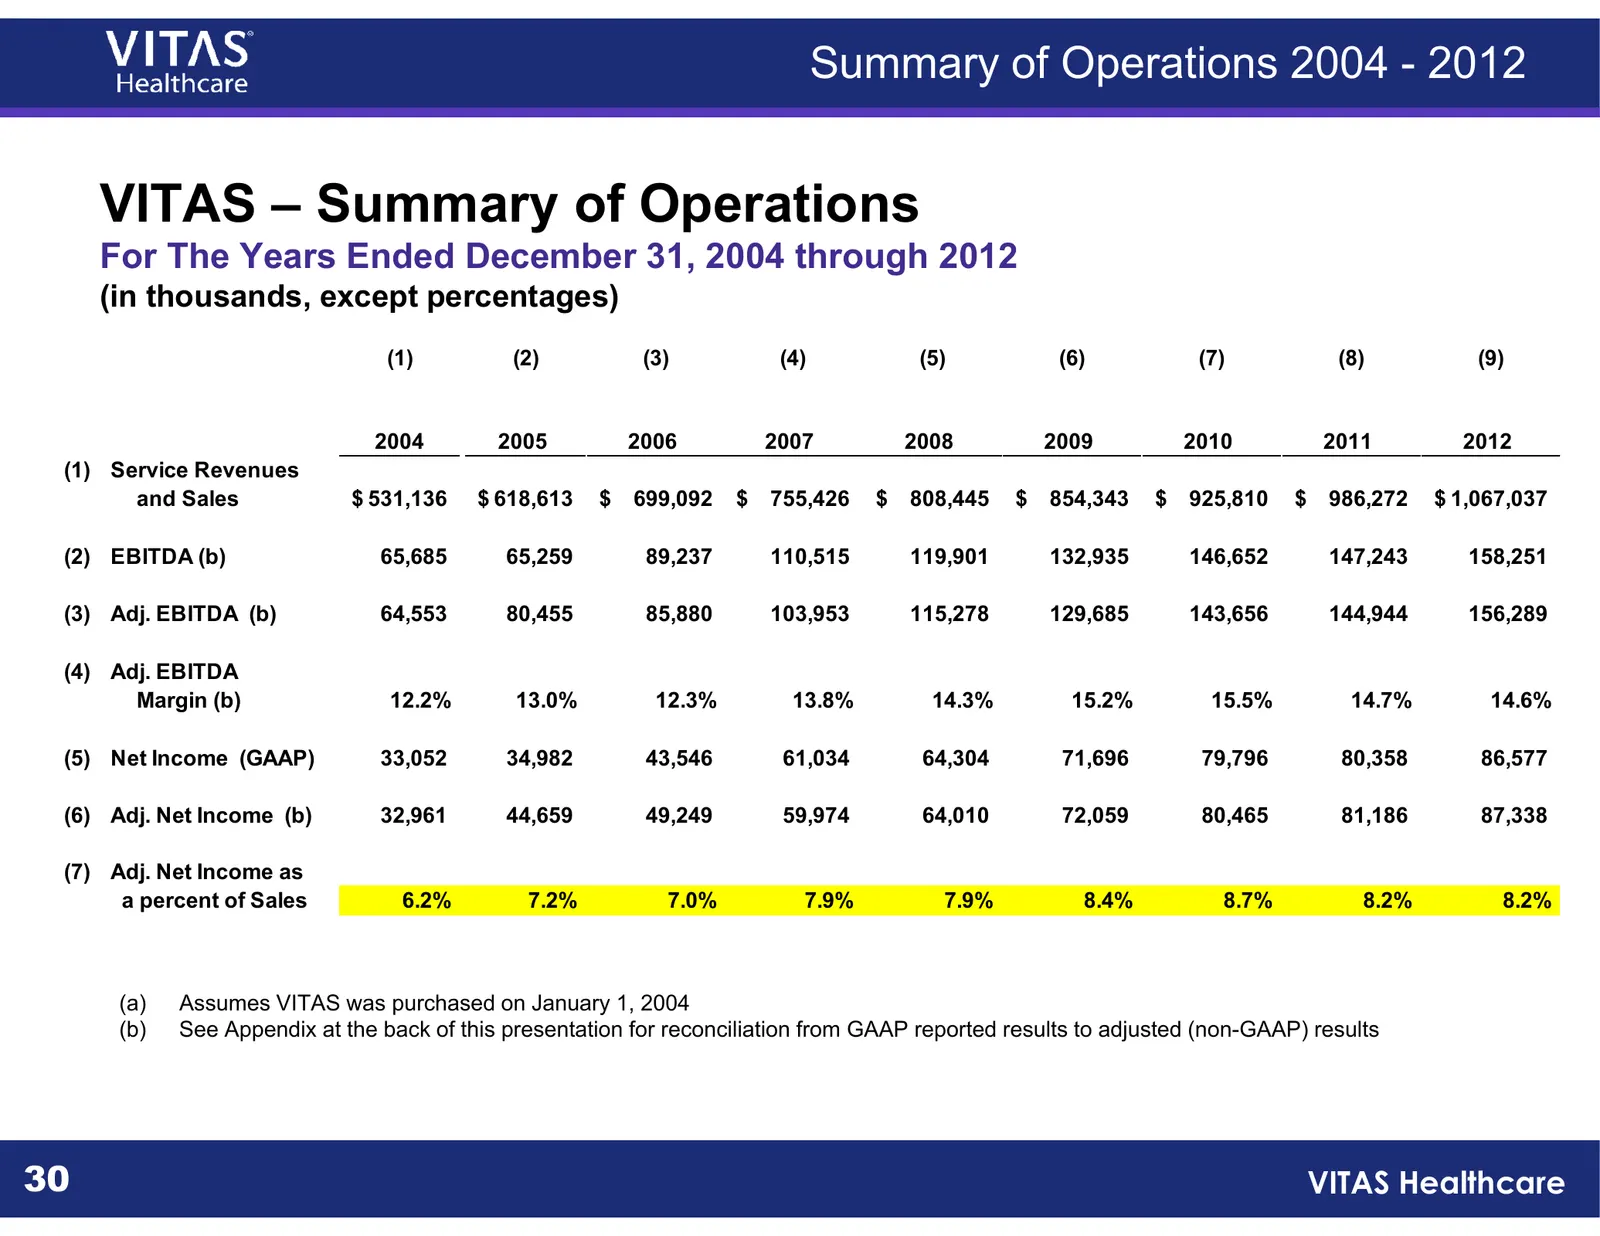
Slide 30: VITAS – Summary of Operations
Summary of Operations 2004 - 2012 VITAS – Summary of Operations For The Years Ended December 31, 2004 through 2012 (in thousands, except percentages) (1) (2) (3) (4) (5) (6) (7) (8) (9) 2004 2005 2006 2007 2008 2009 2010 2011 2012 (1) Service Revenues and Sales $ 531,136 $ 618,613 $ 699,092 $ 755,42
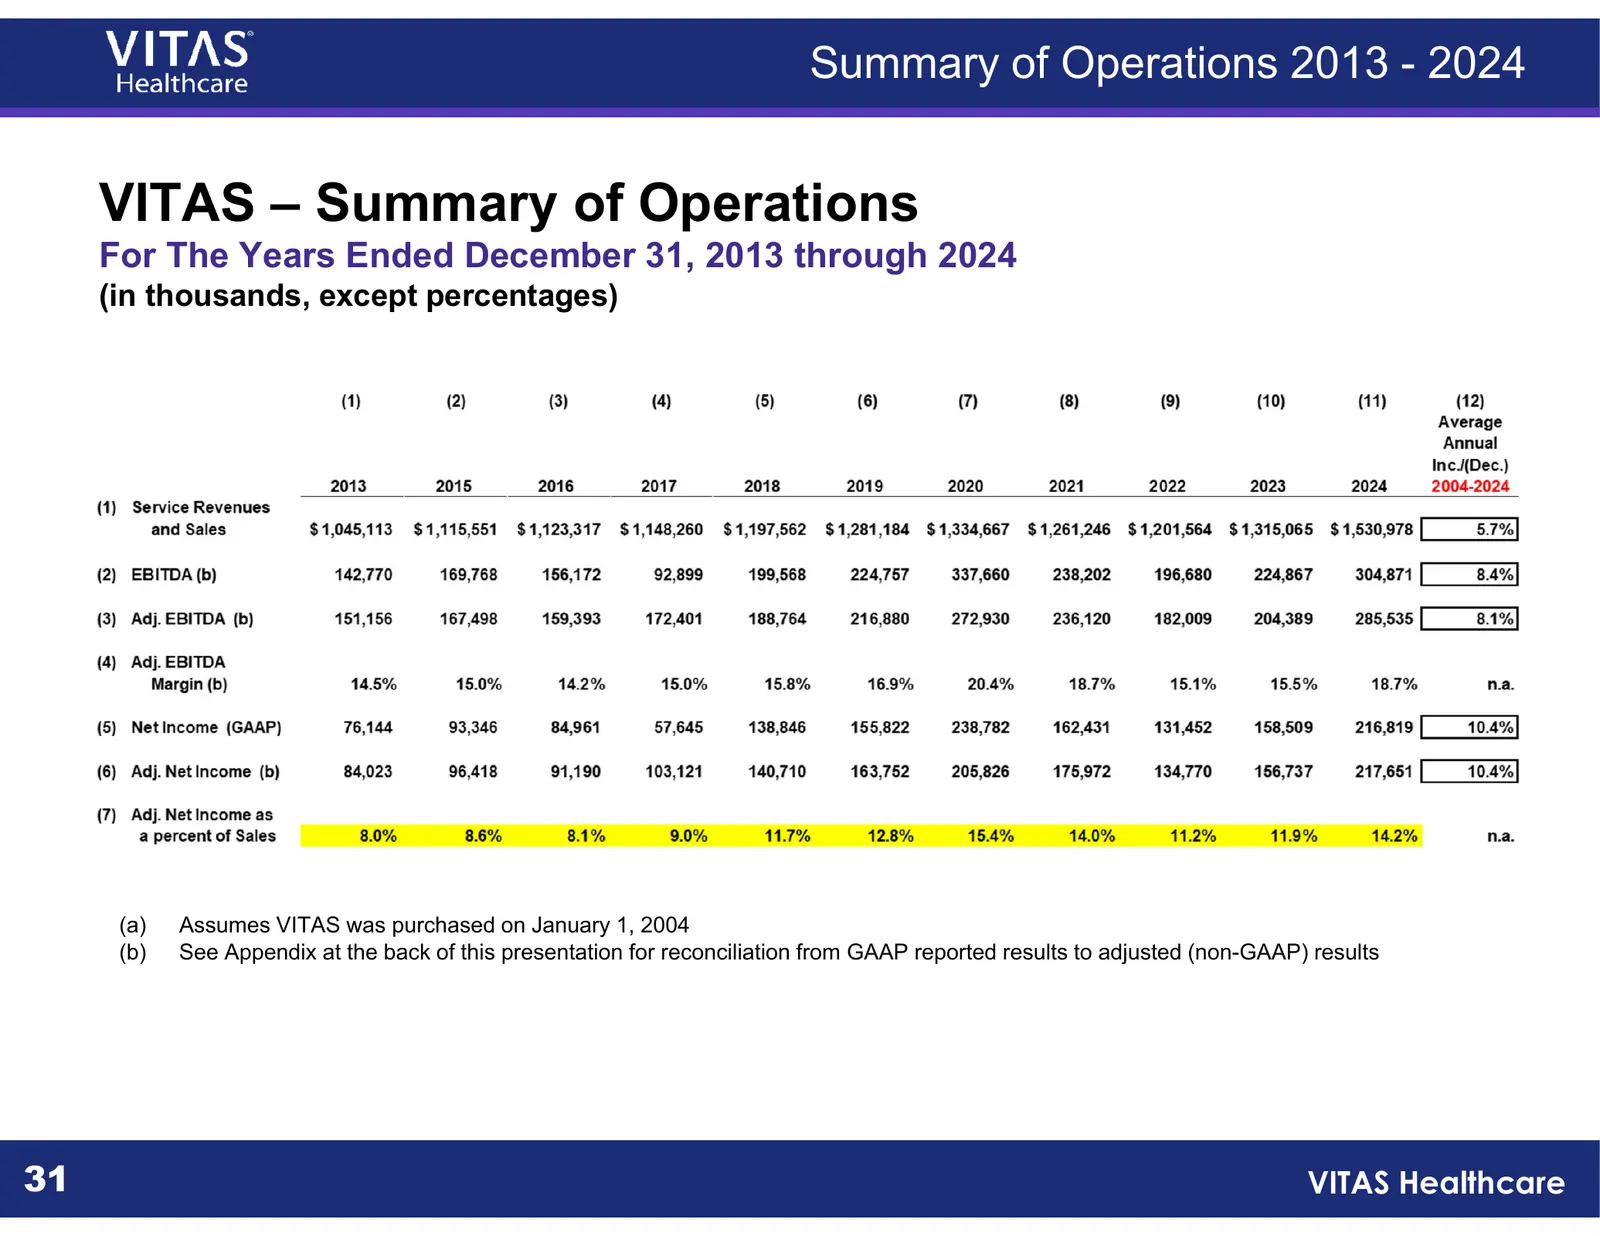
Slide 31: VITAS – Summary of Operations
Summary of Operations 2013 - 2024 VITAS – Summary of Operations For The Years Ended December 31, 2013 through 2024 (in thousands, except percentages) (a) Assumes VITAS was purchased on January 1, 2004 (b) See Appendix at the back of this presentation for reconciliation from GAAP reported results to
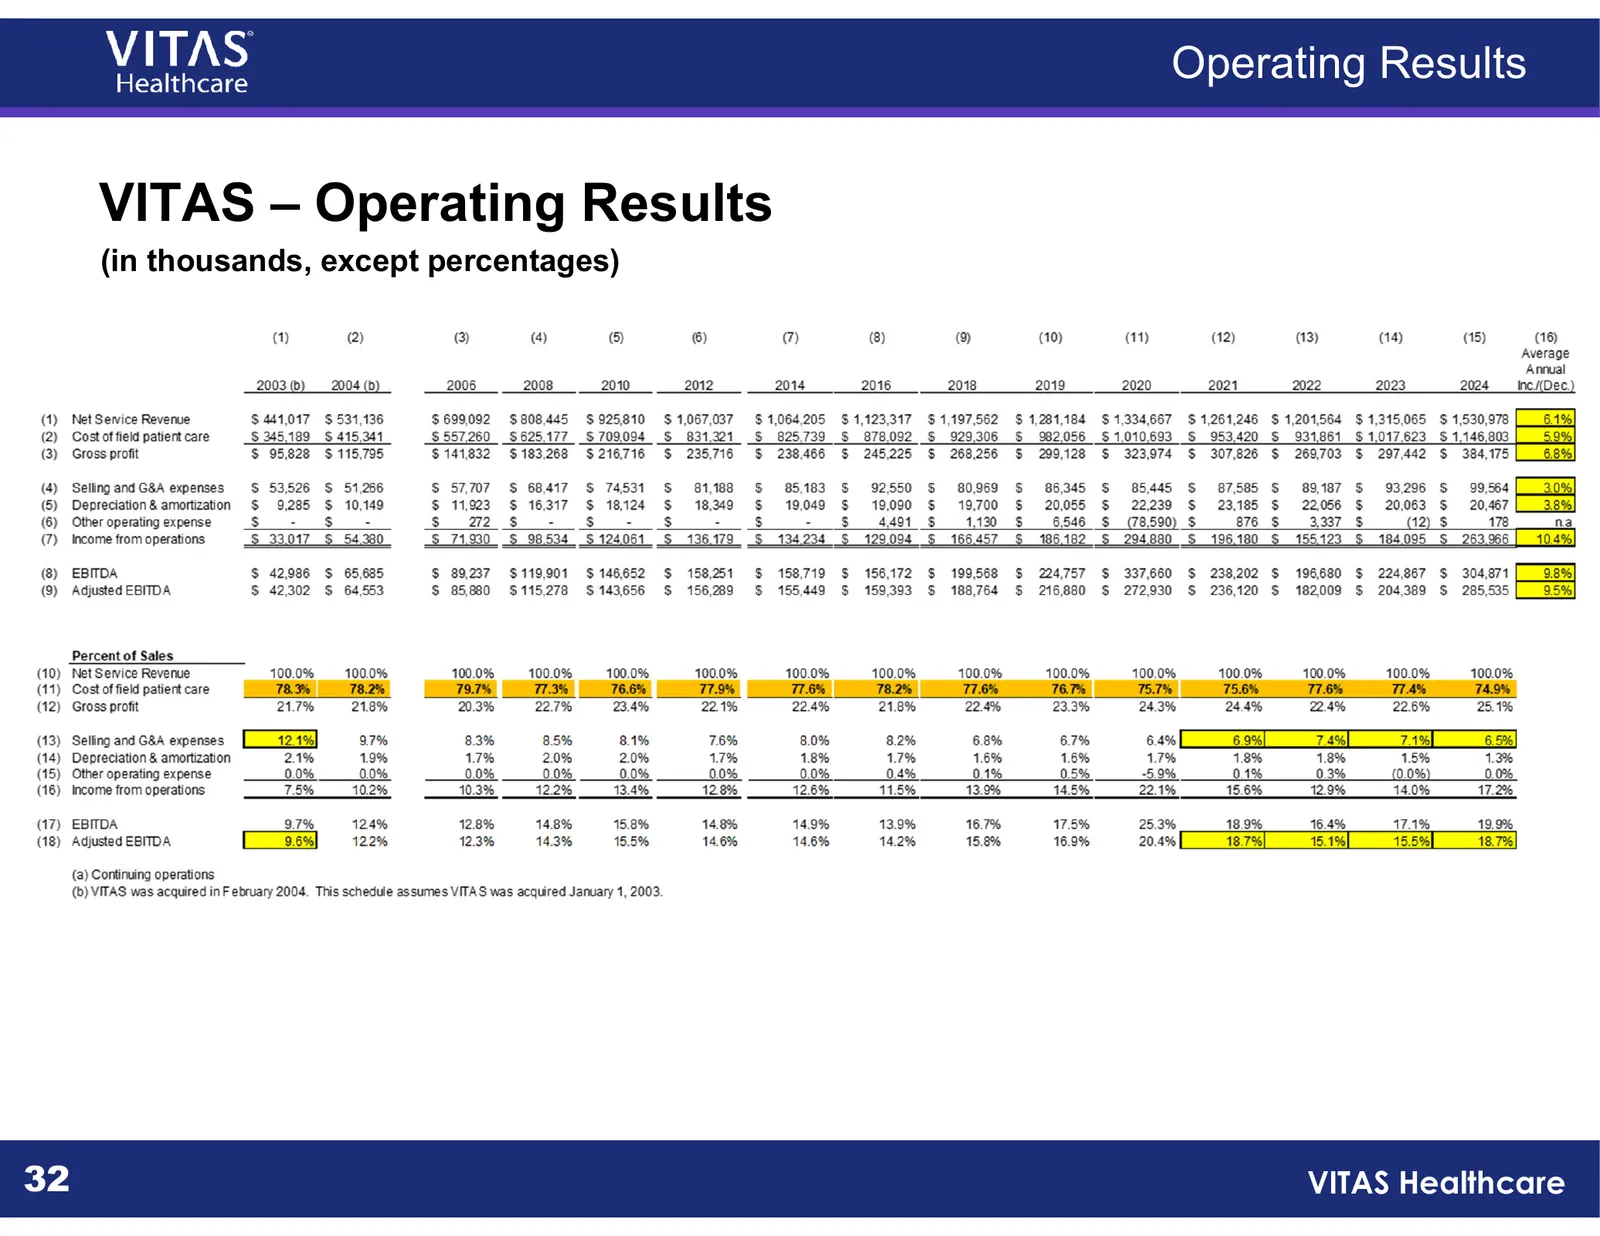
Slide 32: VITAS – Operating Results
Operating Results VITAS – Operating Results (in thousands, except percentages) 32 VITAS Healthcare
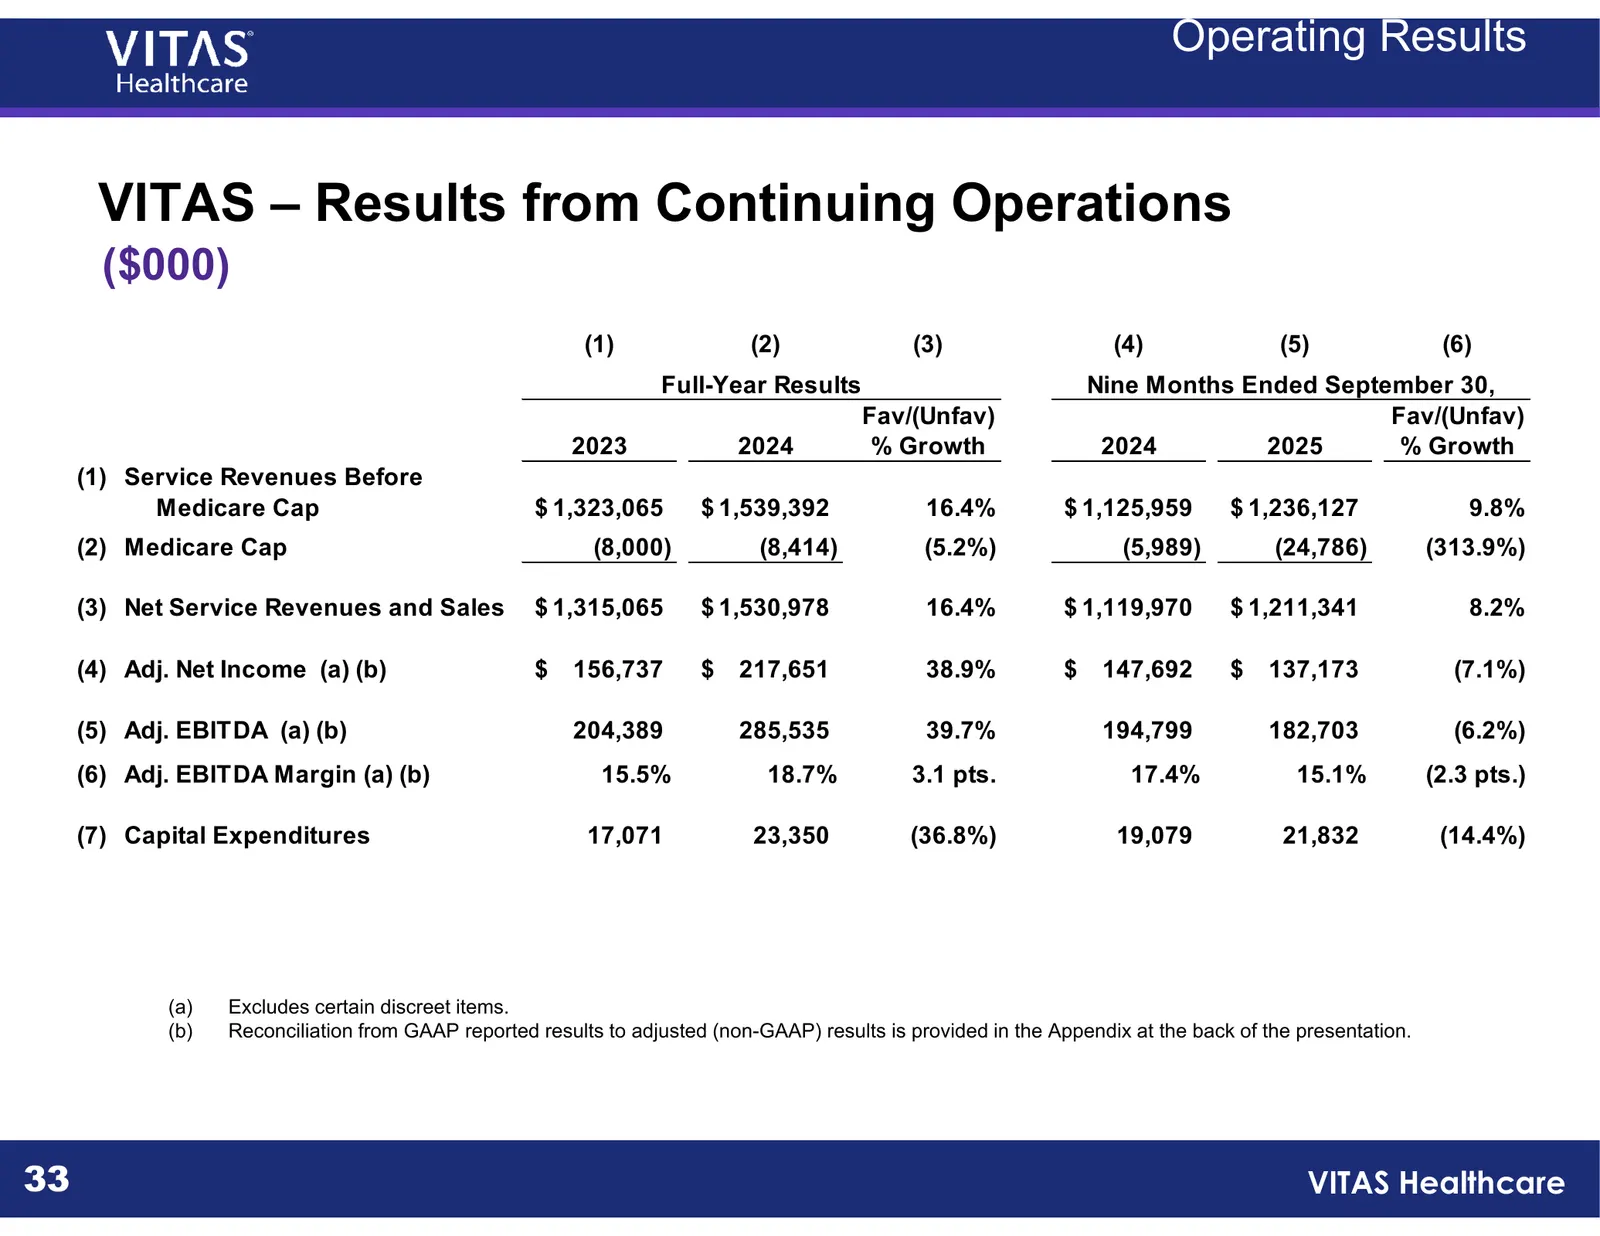
Slide 33: VITAS – Results from Continuing Operations
Operating Results VITAS – Results from Continuing Operations ($000) (1) (2) (3) (4) (5) (6) Full-Year Results Nine Months Ended September 30, Fav/(Unfav) Fav/(Unfav) 2023 2024 % Growth 2024 2025 % Growth (1) Service Revenues Before Medicare Cap $ 1,323,065 $ 1,539,392 16.4% $ 1,125,959 $ 1,236,127 9
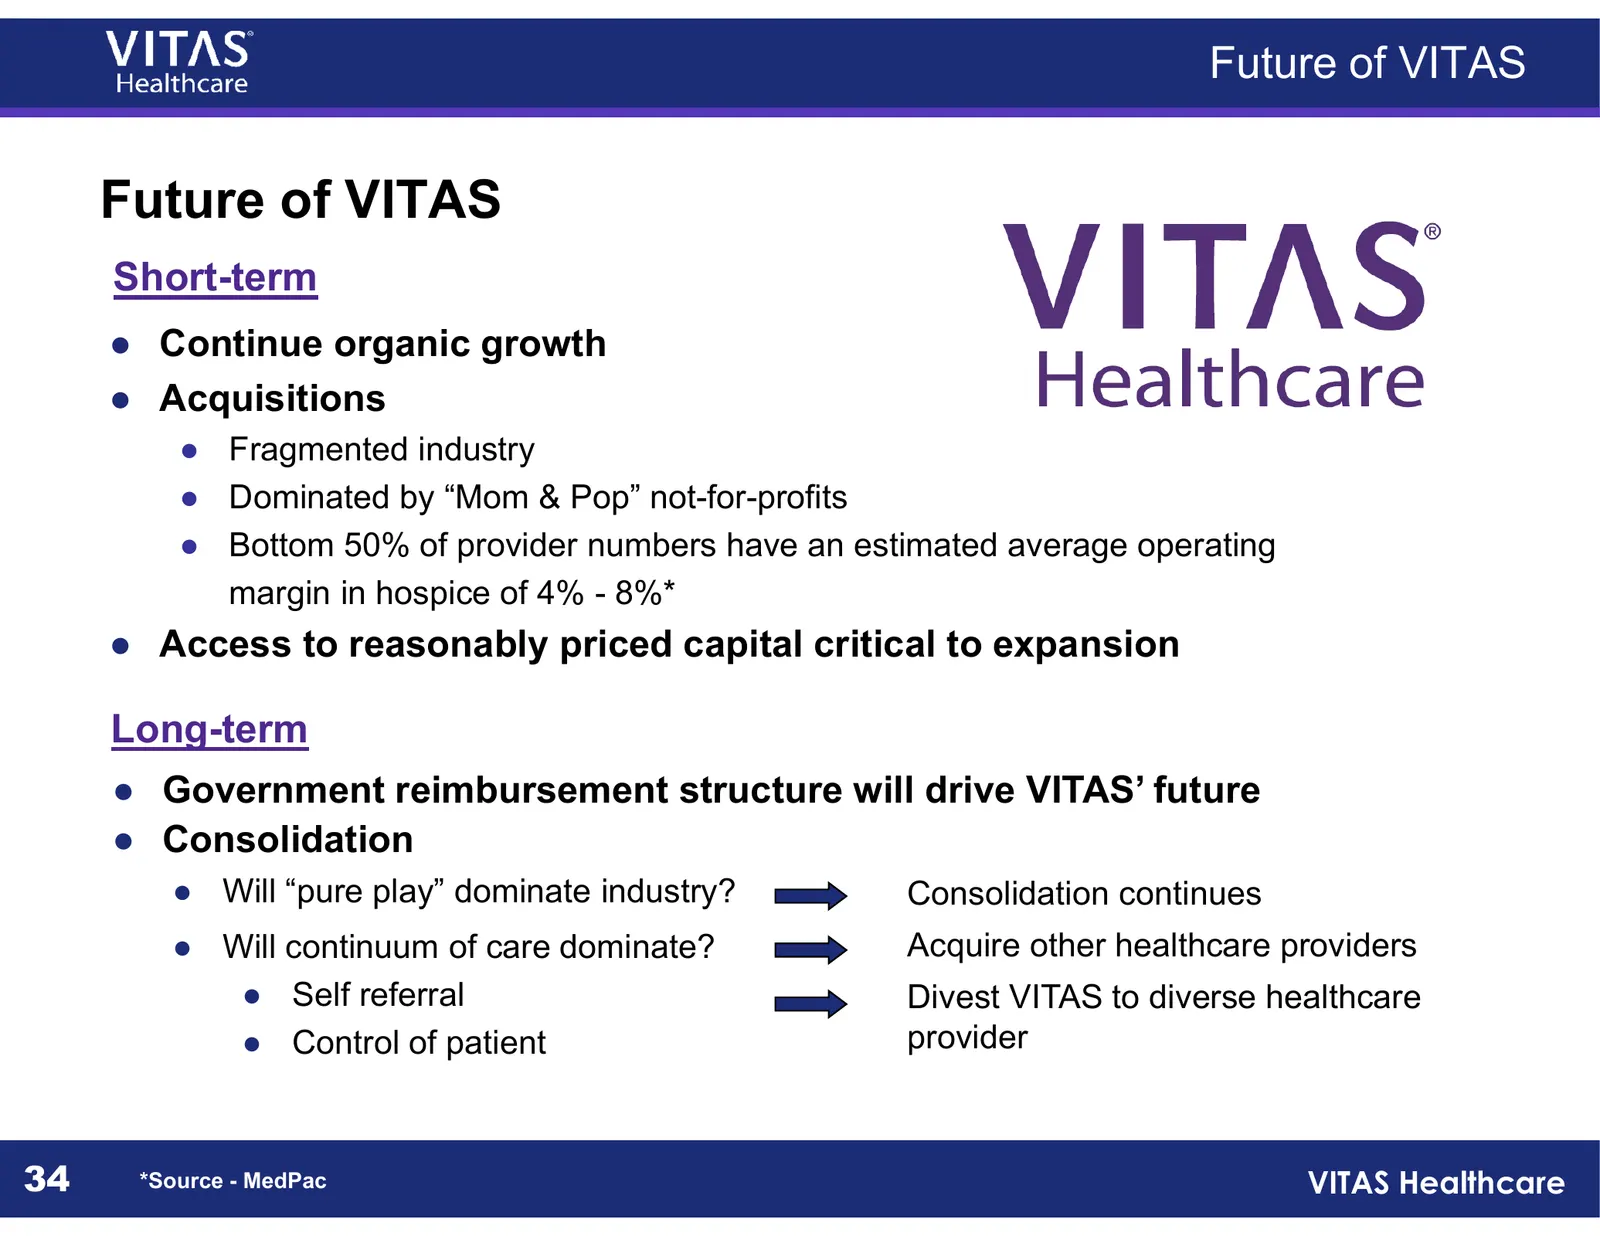
Slide 34: Future of VITAS
Future of VITAS Future of VITAS Short-term ● Continue organic growth ● Acquisitions ● Fragmented industry ● Dominated by “Mom & Pop” not-for-profits ● Bottom 50% of provider numbers have an estimated average operating margin in hospice of 4% - 8%* ● Access to reasonably priced capital critical to ex
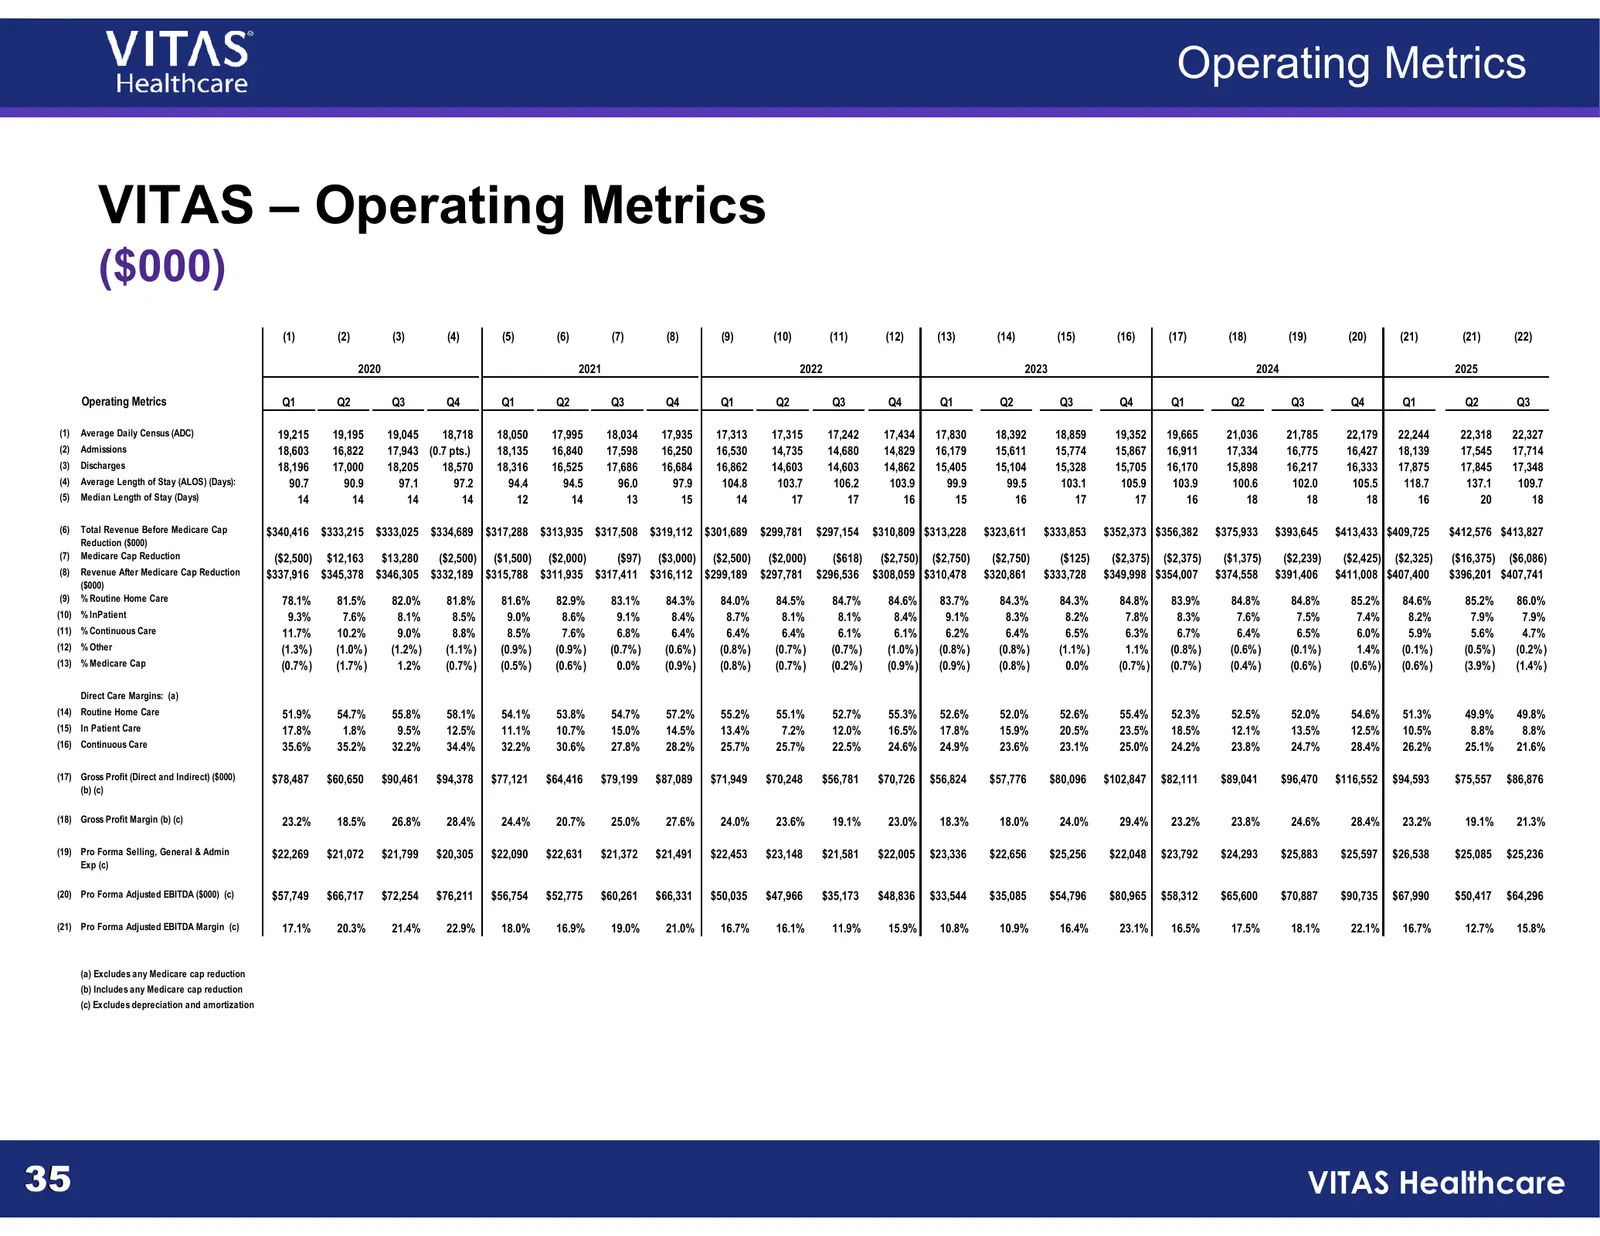
Slide 35: VITAS – Operating Metrics
Operating Metrics VITAS – Operating Metrics ($000) (1) (2) (3) (4) (5) (6) (7) (8) (9) (10) (11) (12) (13) (14) (15) (16) (17) (18) (19) (20) (21) (21) (22) 2020 2021 2022 2023 2024 2025 Operating Metrics Q1 Q2 Q3 Q4 Q1 Q2 Q3 Q4 Q1 Q2 Q3 Q4 Q1 Q2 Q3 Q4 Q1 Q2 Q3 Q4 Q1 Q2 Q3 (1) Average Daily Census (

Slide 36: APPENDIX
CHEMEI) CHEMED CORPORATION APPENDIX
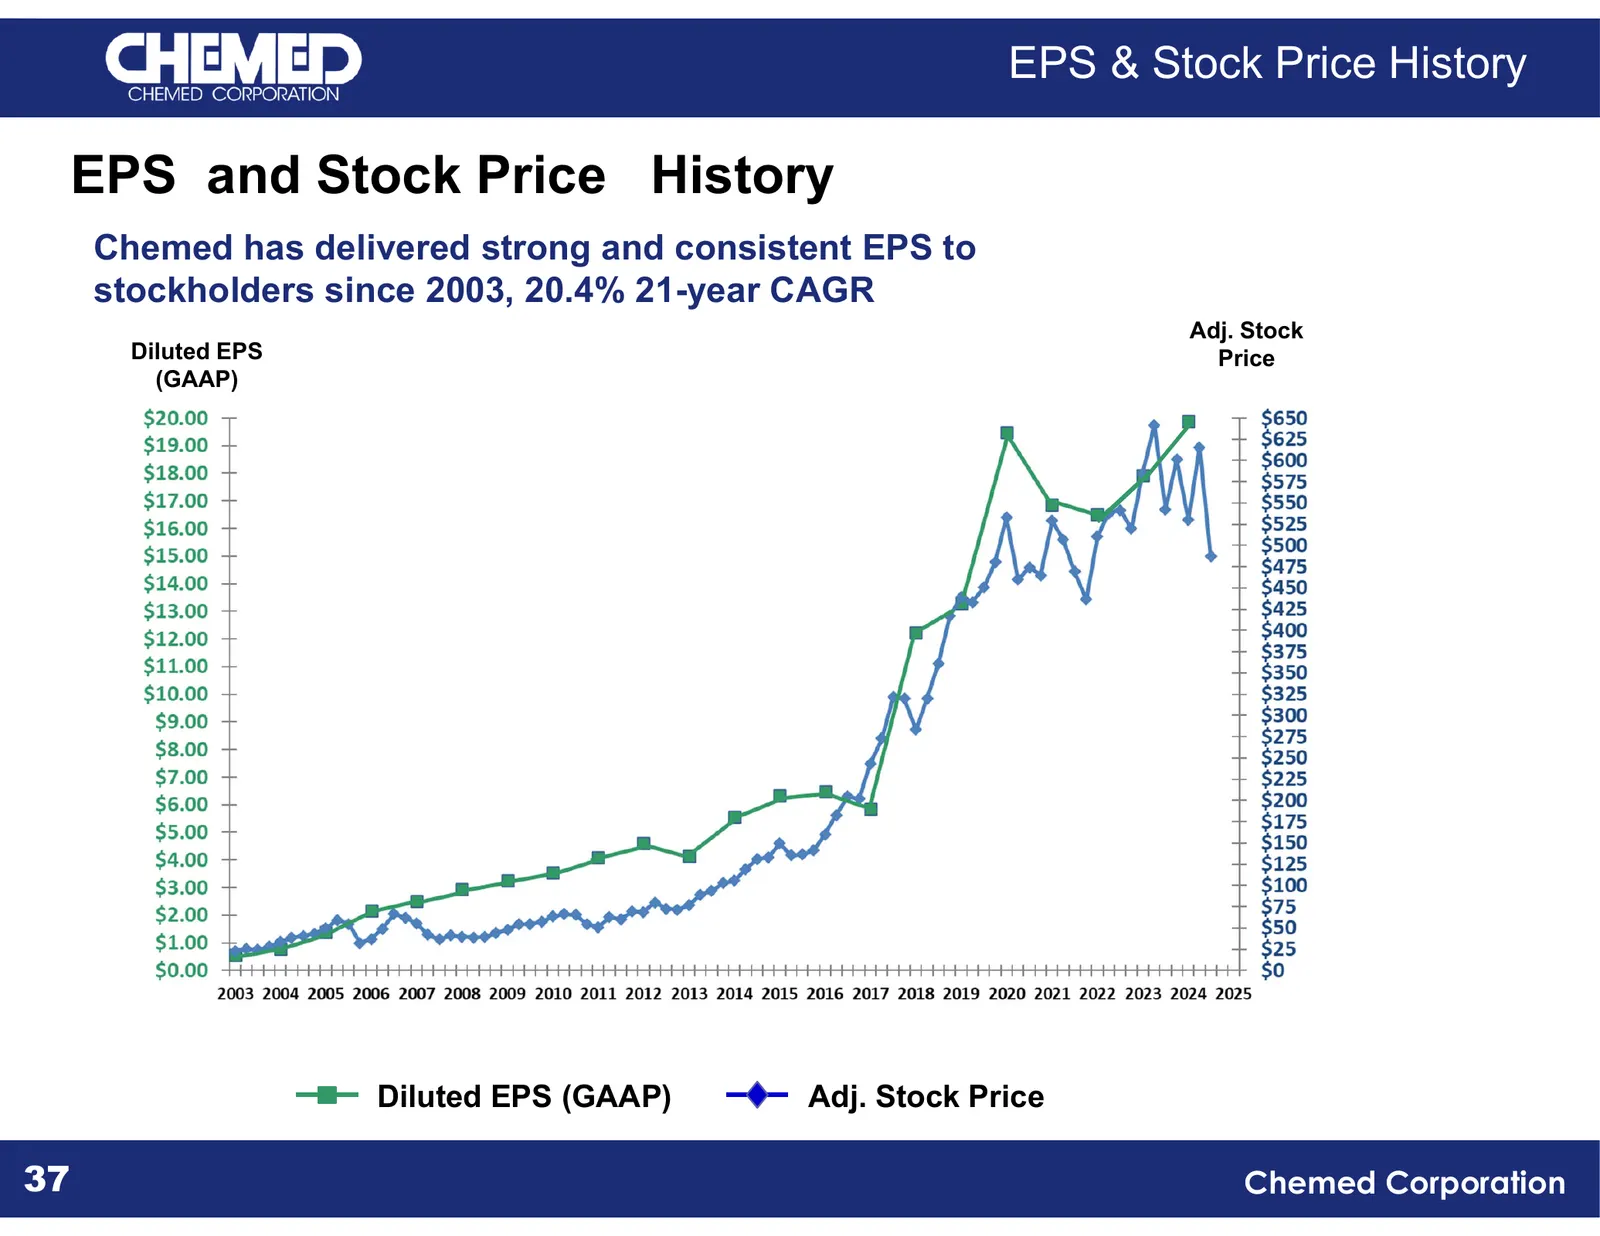
Slide 37: EPS and Stock Price History
EPS & Stock Price History EPS and Stock Price History Chemed has delivered strong and consistent EPS to stockholders since 2003, 20.4% 21-year CAGR Adj. Stock Diluted EPS Price (GAAP) Diluted EPS (GAAP) Adj. Stock Price (1) Diluted EPS from continuing operations (GAAP) 37 (2) Adjusted for stock spli
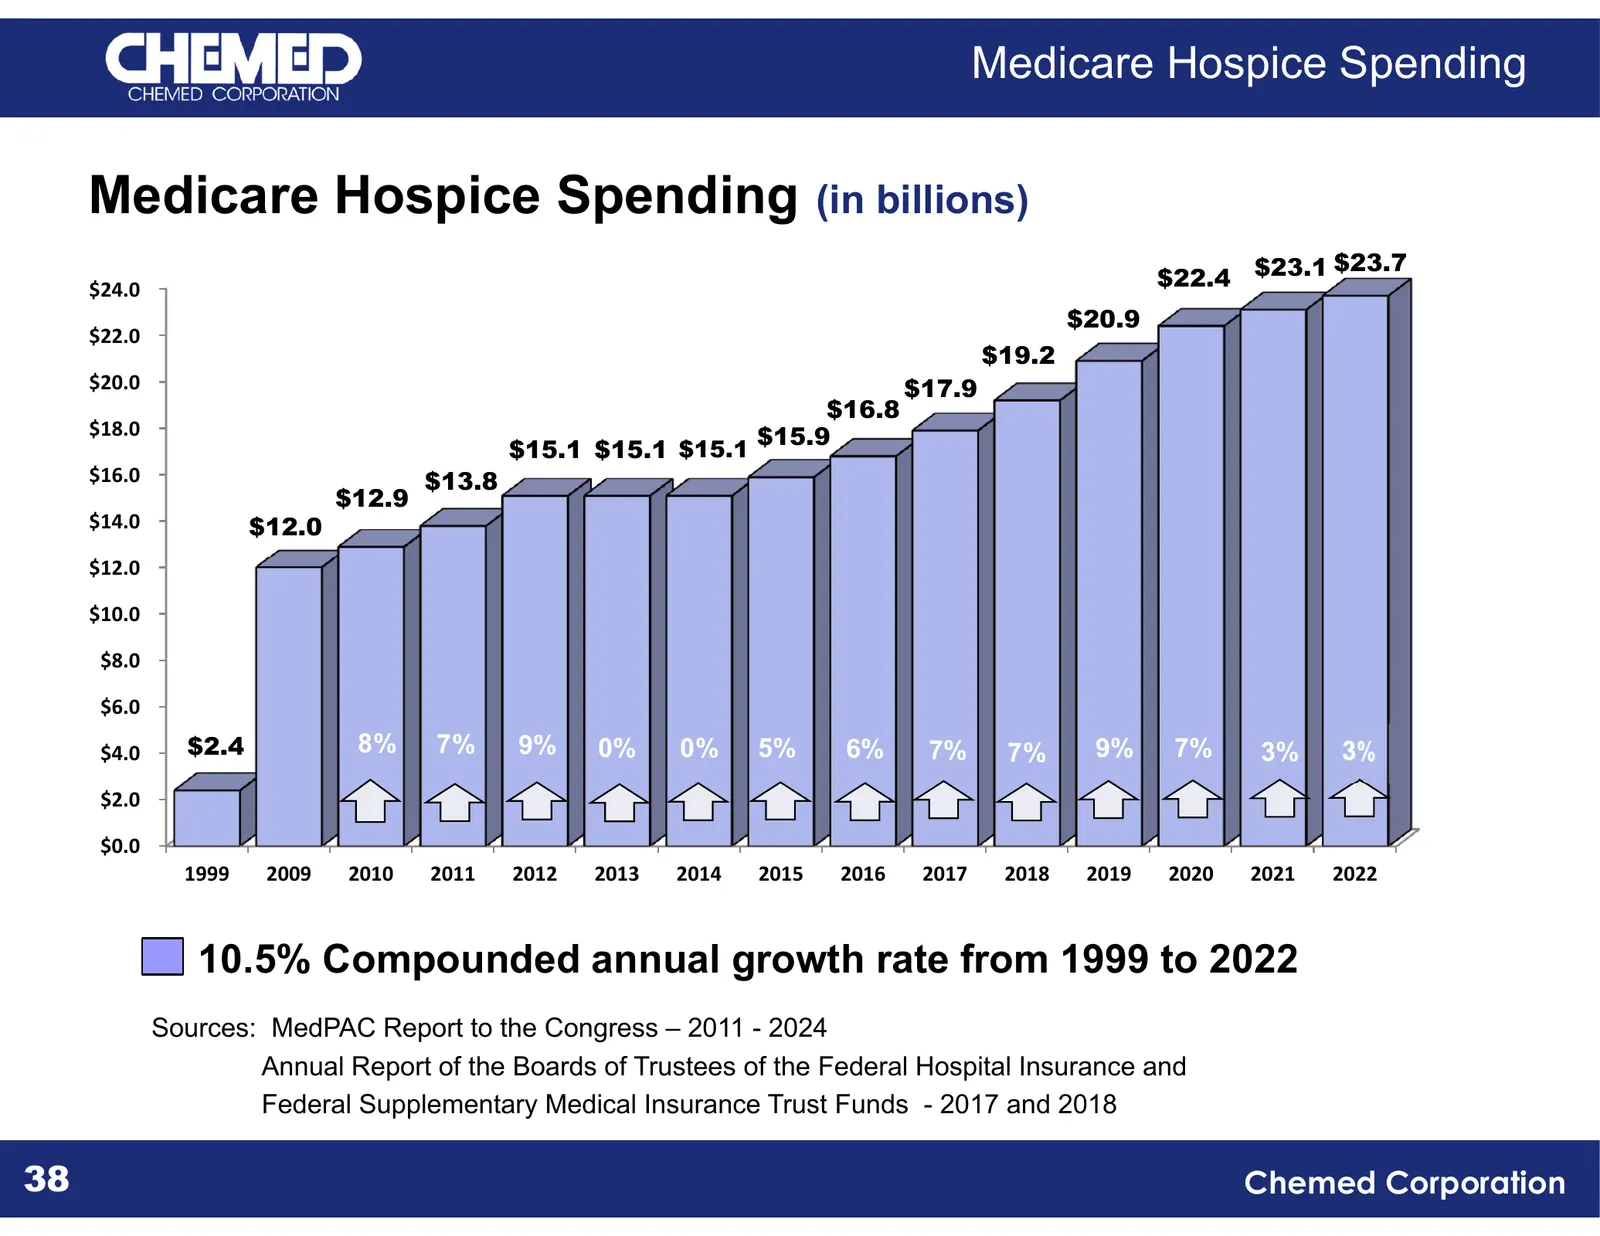
Slide 38: Medicare Hospice Spending (in billions)
Medicare Hospice Spending Medicare Hospice Spending (in billions) $23.7 $24.0 $22.4 $23.1 $20.9 $22.0 $19.2 $20.0 $17.9 $16.8 $18.0 $15.9 $15.1 $15.1 $15.1 $16.0 $13.8 $12.9 $14.0 $12.0 $12.0 $10.0 $8.0 $6.0 $4.0 $2.4 8% 7% 9% 0% 0% 5% 6% 7% 7% 9% 7% 3% $2.0 $0.0 1999 2009 2010 2011 2012 2013 2014 2
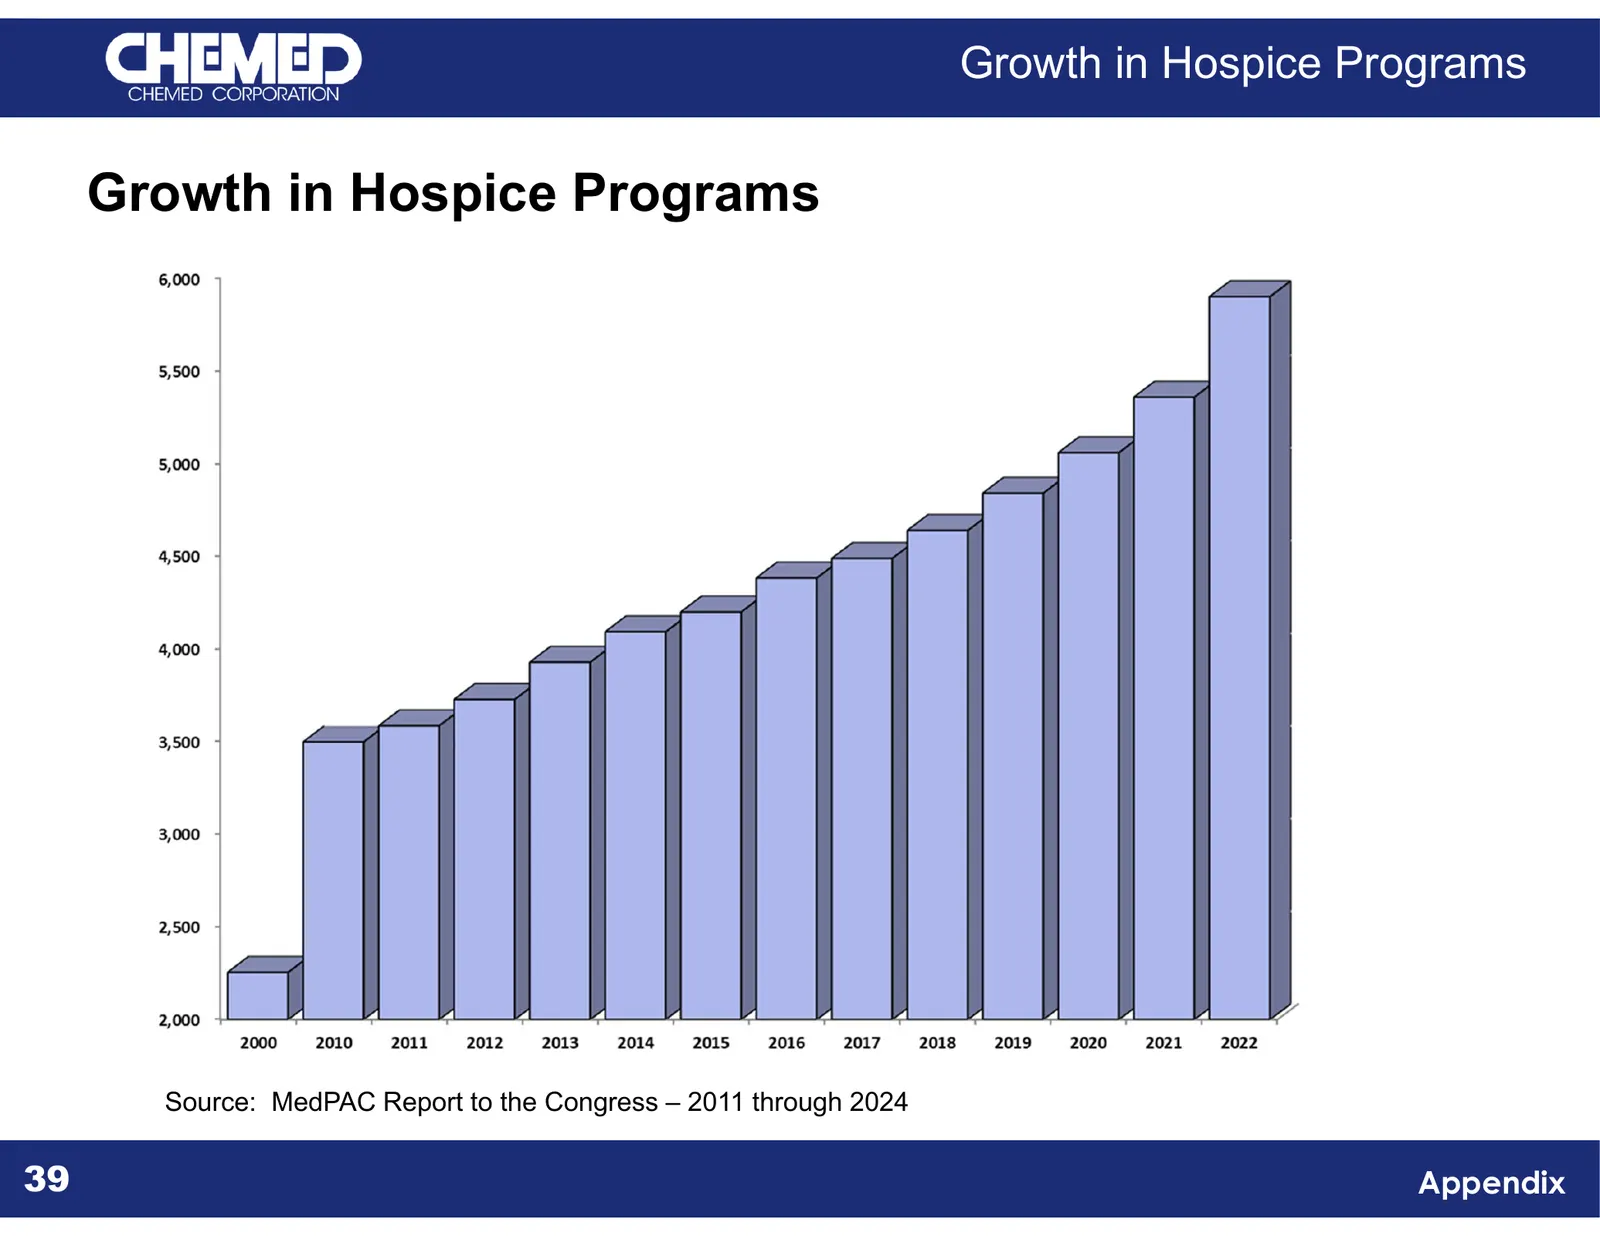
Slide 39: Growth in Hospice Programs
Growth in Hospice Programs Growth in Hospice Programs Source: MedPAC Report to the Congress – 2011 through 2024 39 Appendix
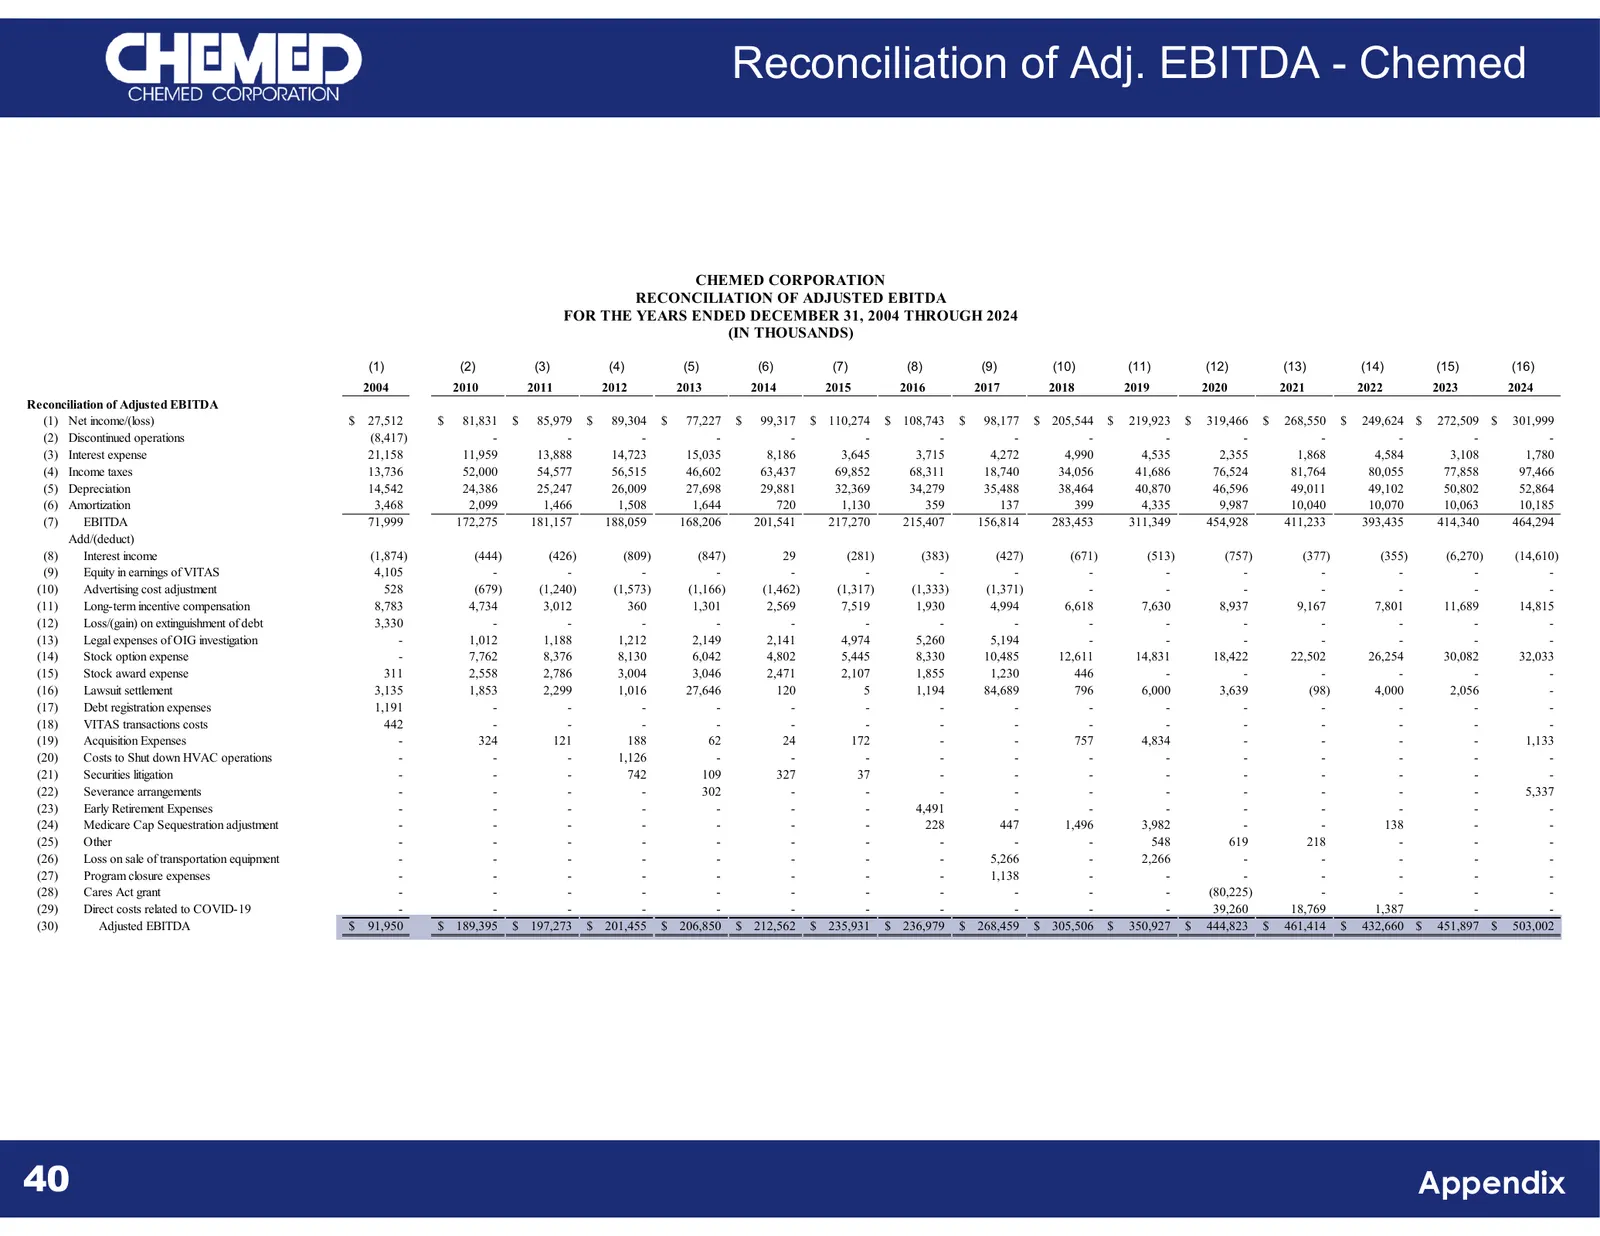
Slide 40: Reconciliation of Adj. EBITDA - Chemed
Reconciliation of Adj. EBITDA - Chemed CHEMED CORPORATION RECONCILIATION OF ADJUSTED EBITDA FOR THE YEARS ENDED DECEMBER 31, 2004 THROUGH 2024 (IN THOUSANDS) (1) (2) (3) (4) (5) (6) (7) (8) (9) (10) (11) (12) (13) (14) (15) (16) 2004 2010 2011 2012 2013 2014 2015 2016 2017 2018 2019 2020 2021 2022 2
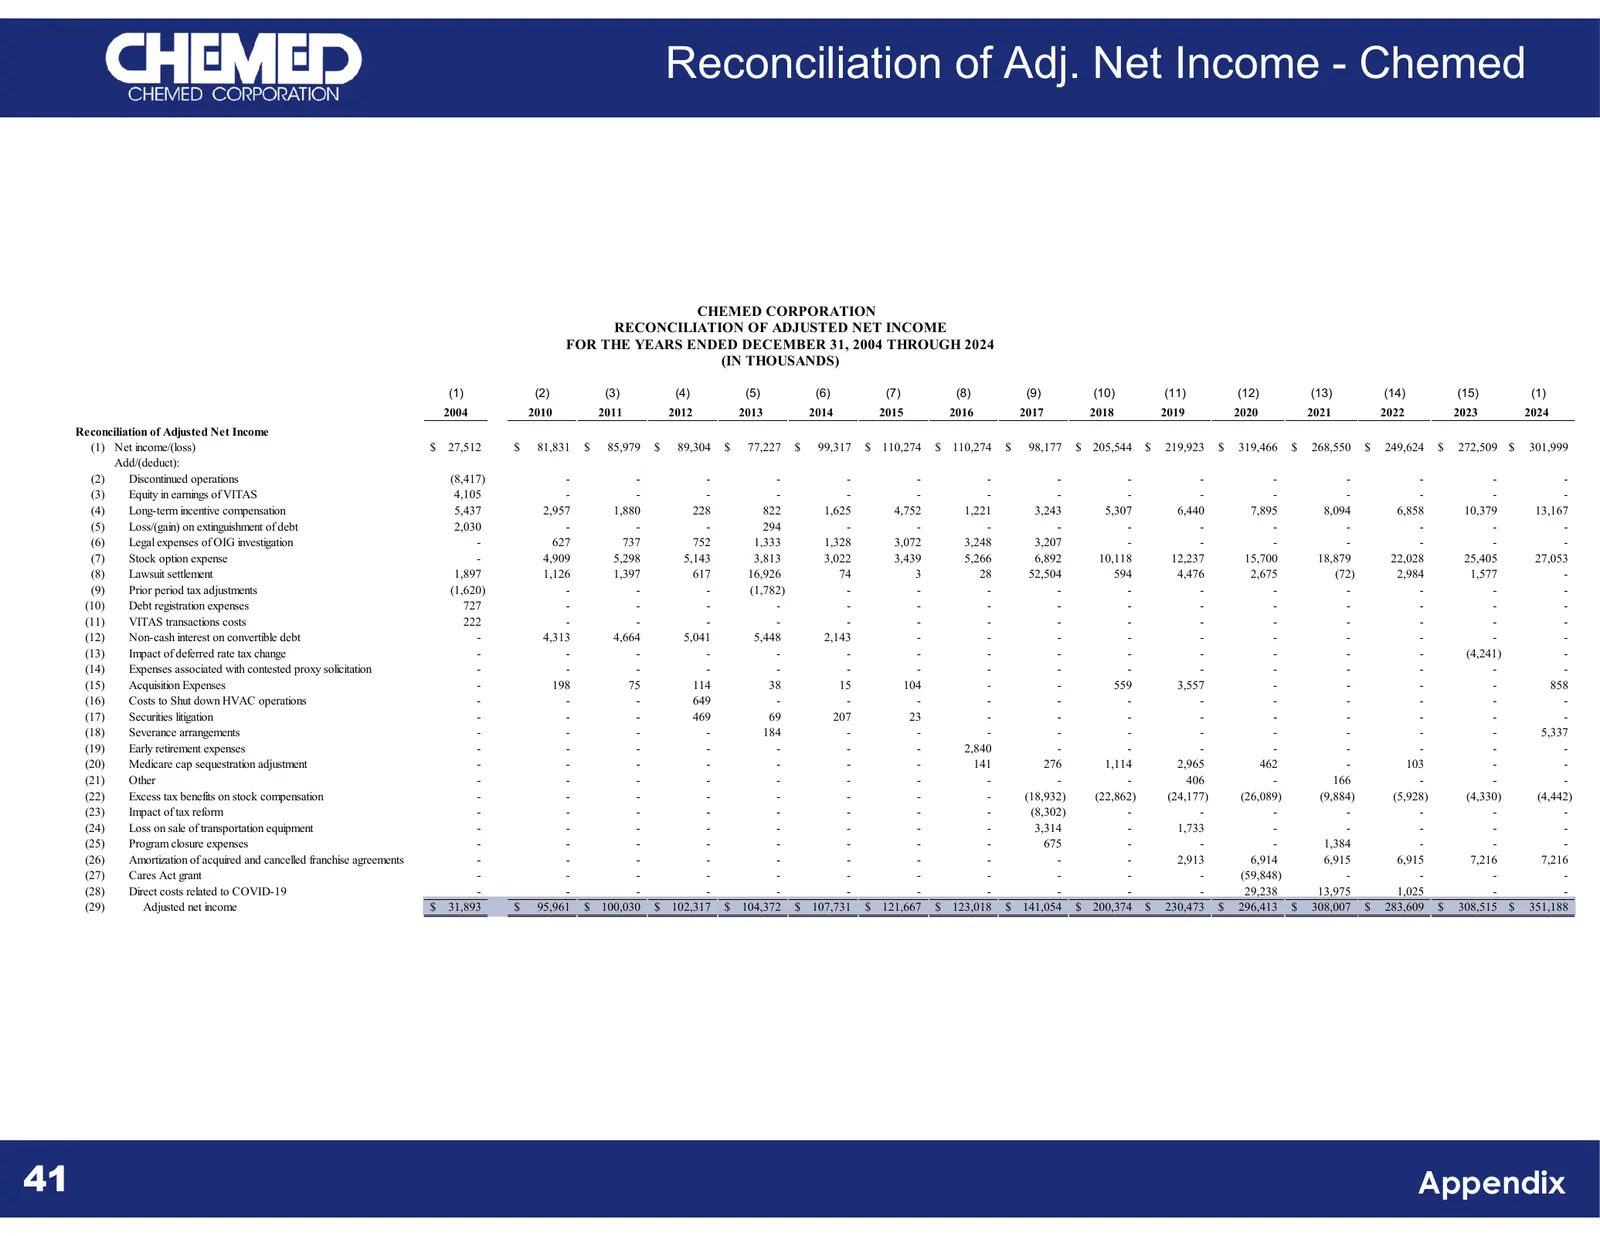
Slide 41: Reconciliation of Adj. Net Income - Chemed
Reconciliation of Adj. Net Income - Chemed CHEMED CORPORATION RECONCILIATION OF ADJUSTED NET INCOME FOR THE YEARS ENDED DECEMBER 31, 2004 THROUGH 2024 (IN THOUSANDS) (1) (2) (3) (4) (5) (6) (7) (8) (9) (10) (11) (12) (13) (14) (15) (1) 2004 2010 2011 2012 2013 2014 2015 2016 2017 2018 2019 2020 2021
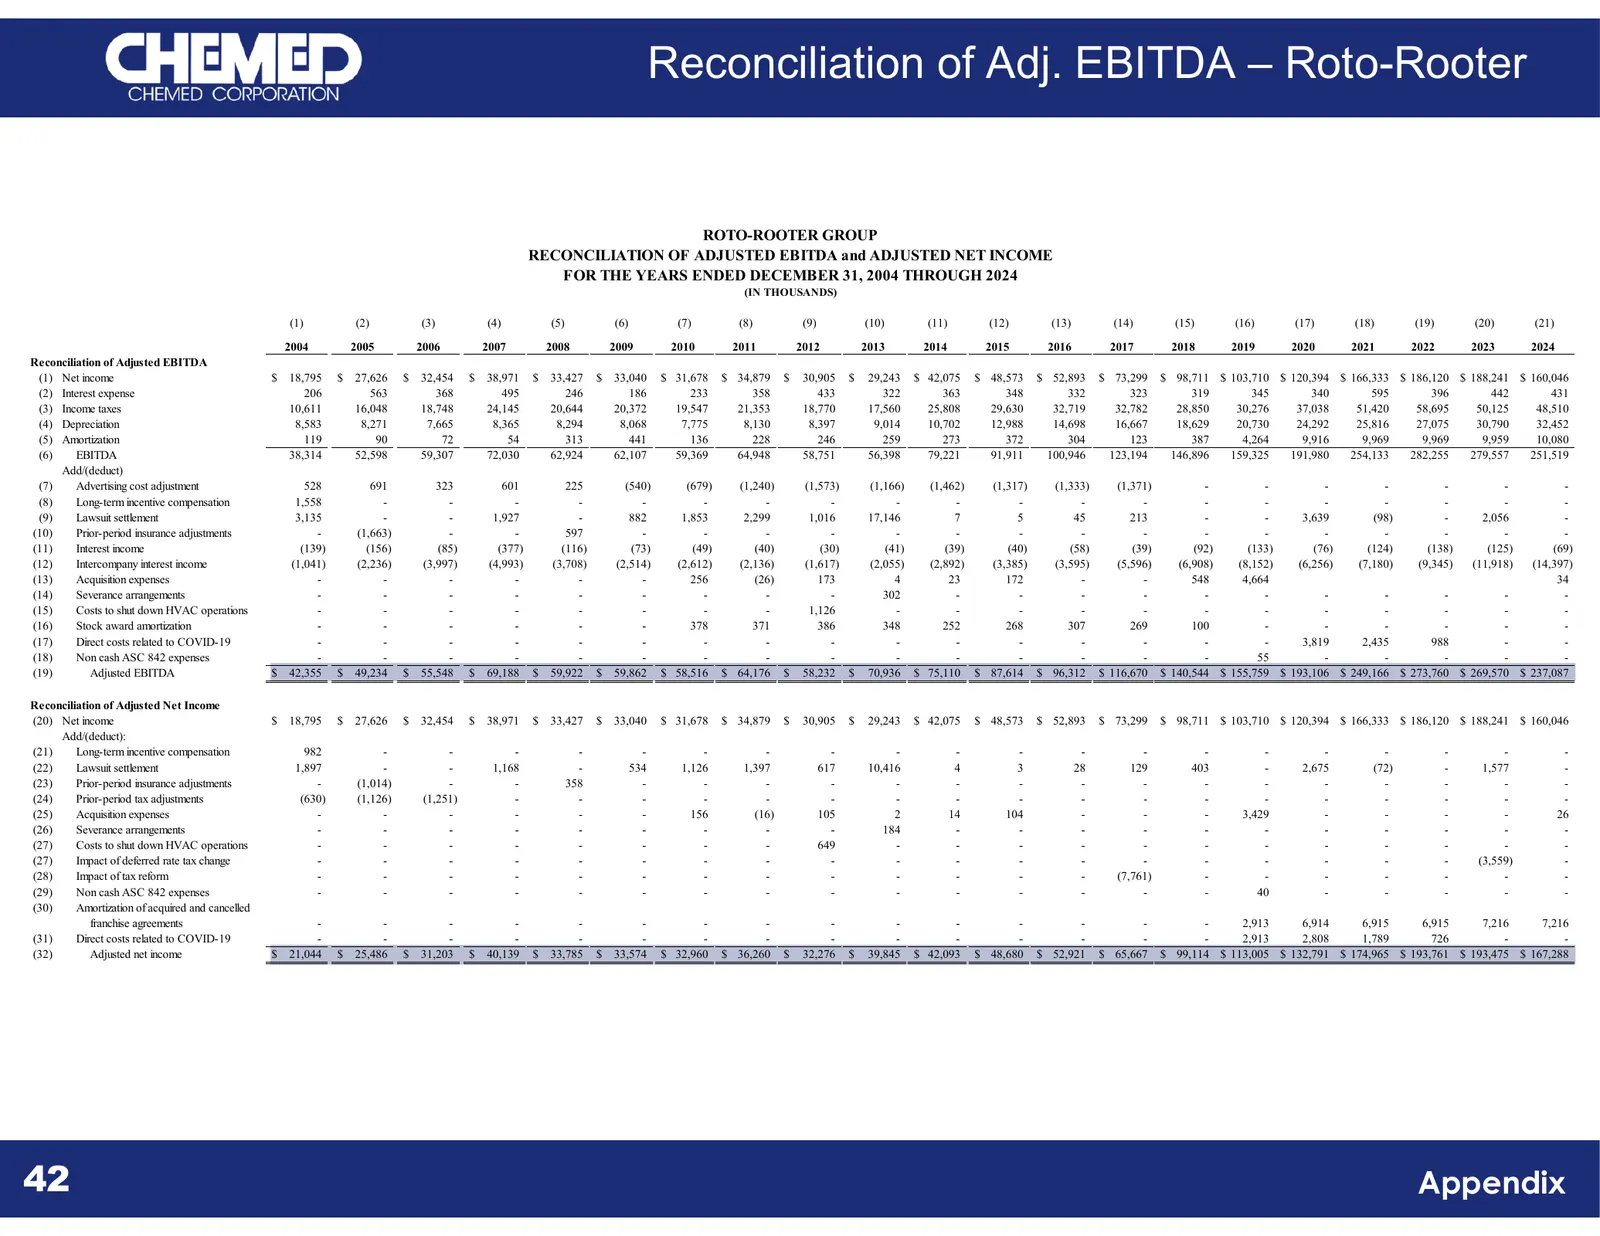
Slide 42: Reconciliation of Adj. EBITDA – Roto-Rooter
Reconciliation of Adj. EBITDA – Roto-Rooter ROTO-ROOTER GROUP RECONCILIATION OF ADJUSTED EBITDA and ADJUSTED NET INCOME FOR THE YEARS ENDED DECEMBER 31, 2004 THROUGH 2024 (IN THOUSANDS) (1) (2) (3) (4) (5) (6) (7) (8) (9) (10) (11) (12) (13) (14) (15) (16) (17) (18) (19) (20) (21) 2004 2005 2006 200
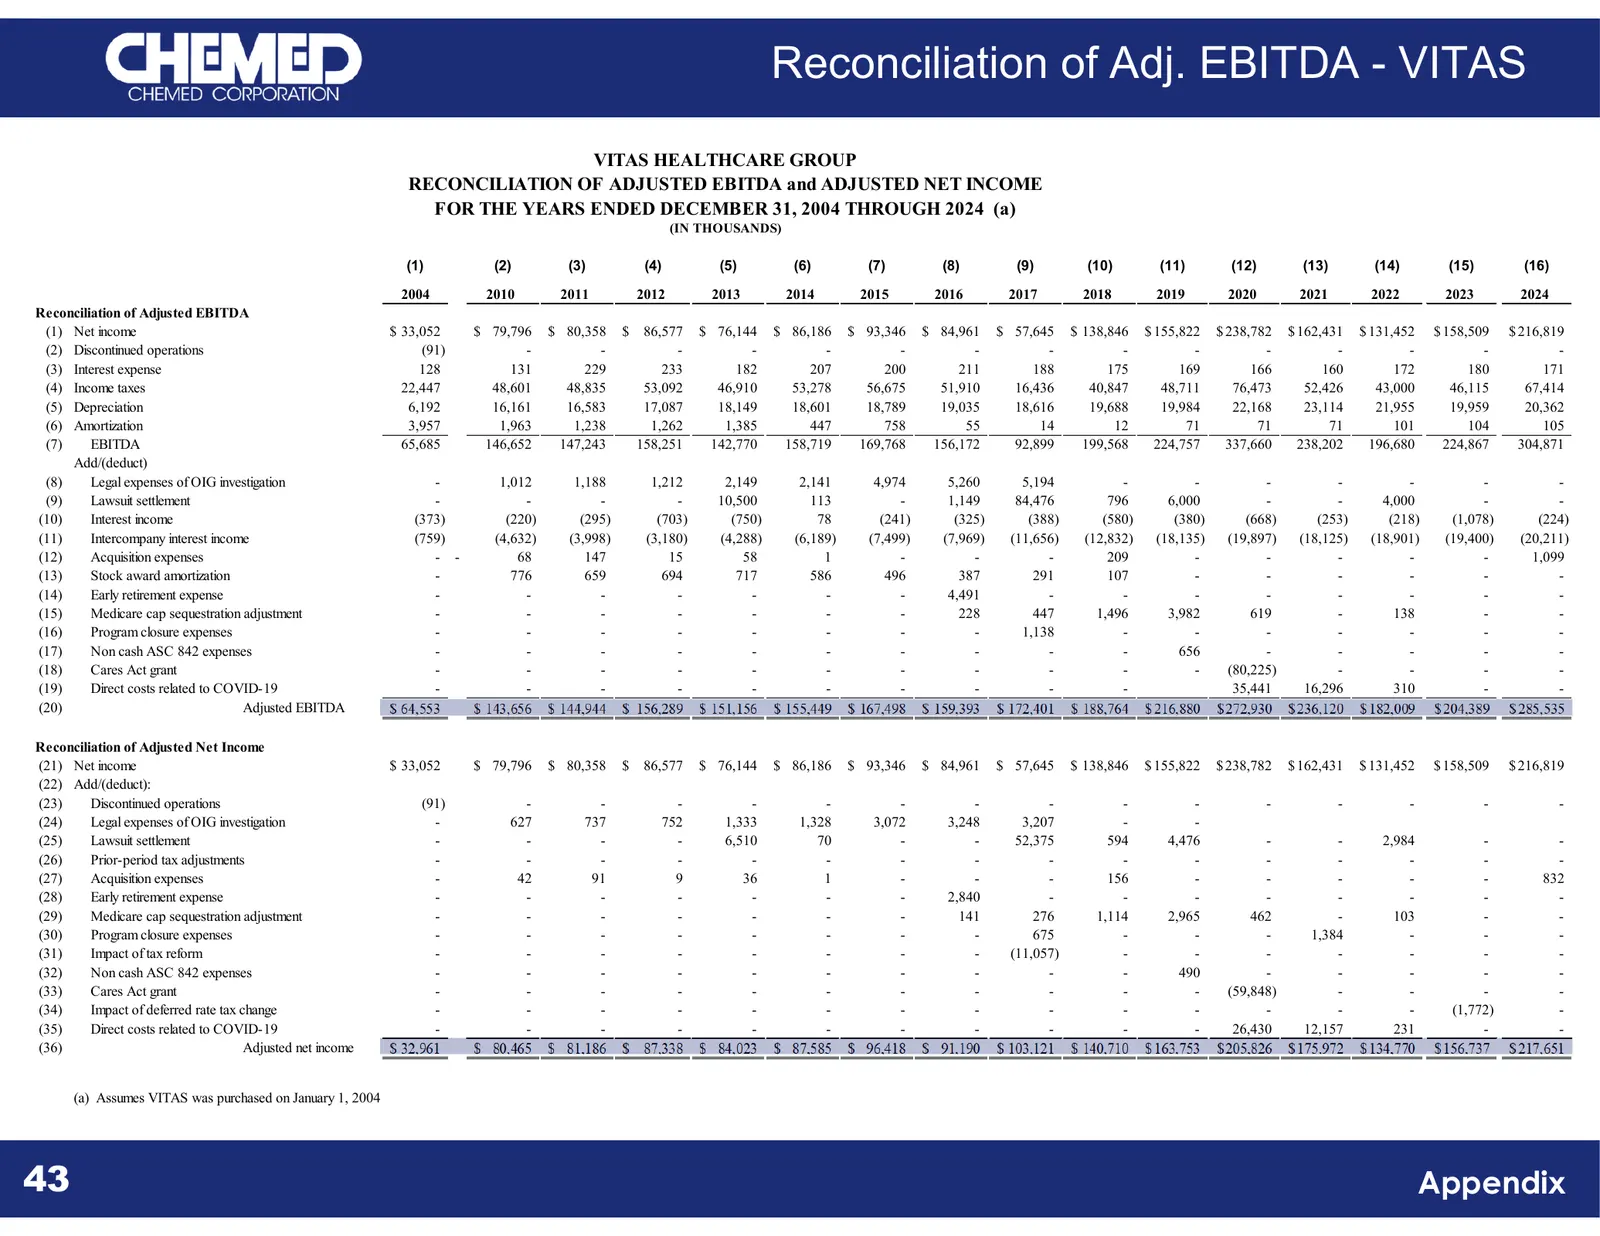
Slide 43: Reconciliation of Adj. EBITDA - VITAS
Reconciliation of Adj. EBITDA - VITAS VITAS HEALTHCARE GROUP RECONCILIATION OF ADJUSTED EBITDA and ADJUSTED NET INCOME FOR THE YEARS ENDED DECEMBER 31, 2004 THROUGH 2024 (a) (IN THOUSANDS) (1) (2) (3) (4) (5) (6) (7) (8) (9) (10) (11) (12) (13) (14) (15) (16) 2004 2010 2011 2012 2013 2014 2015 2016
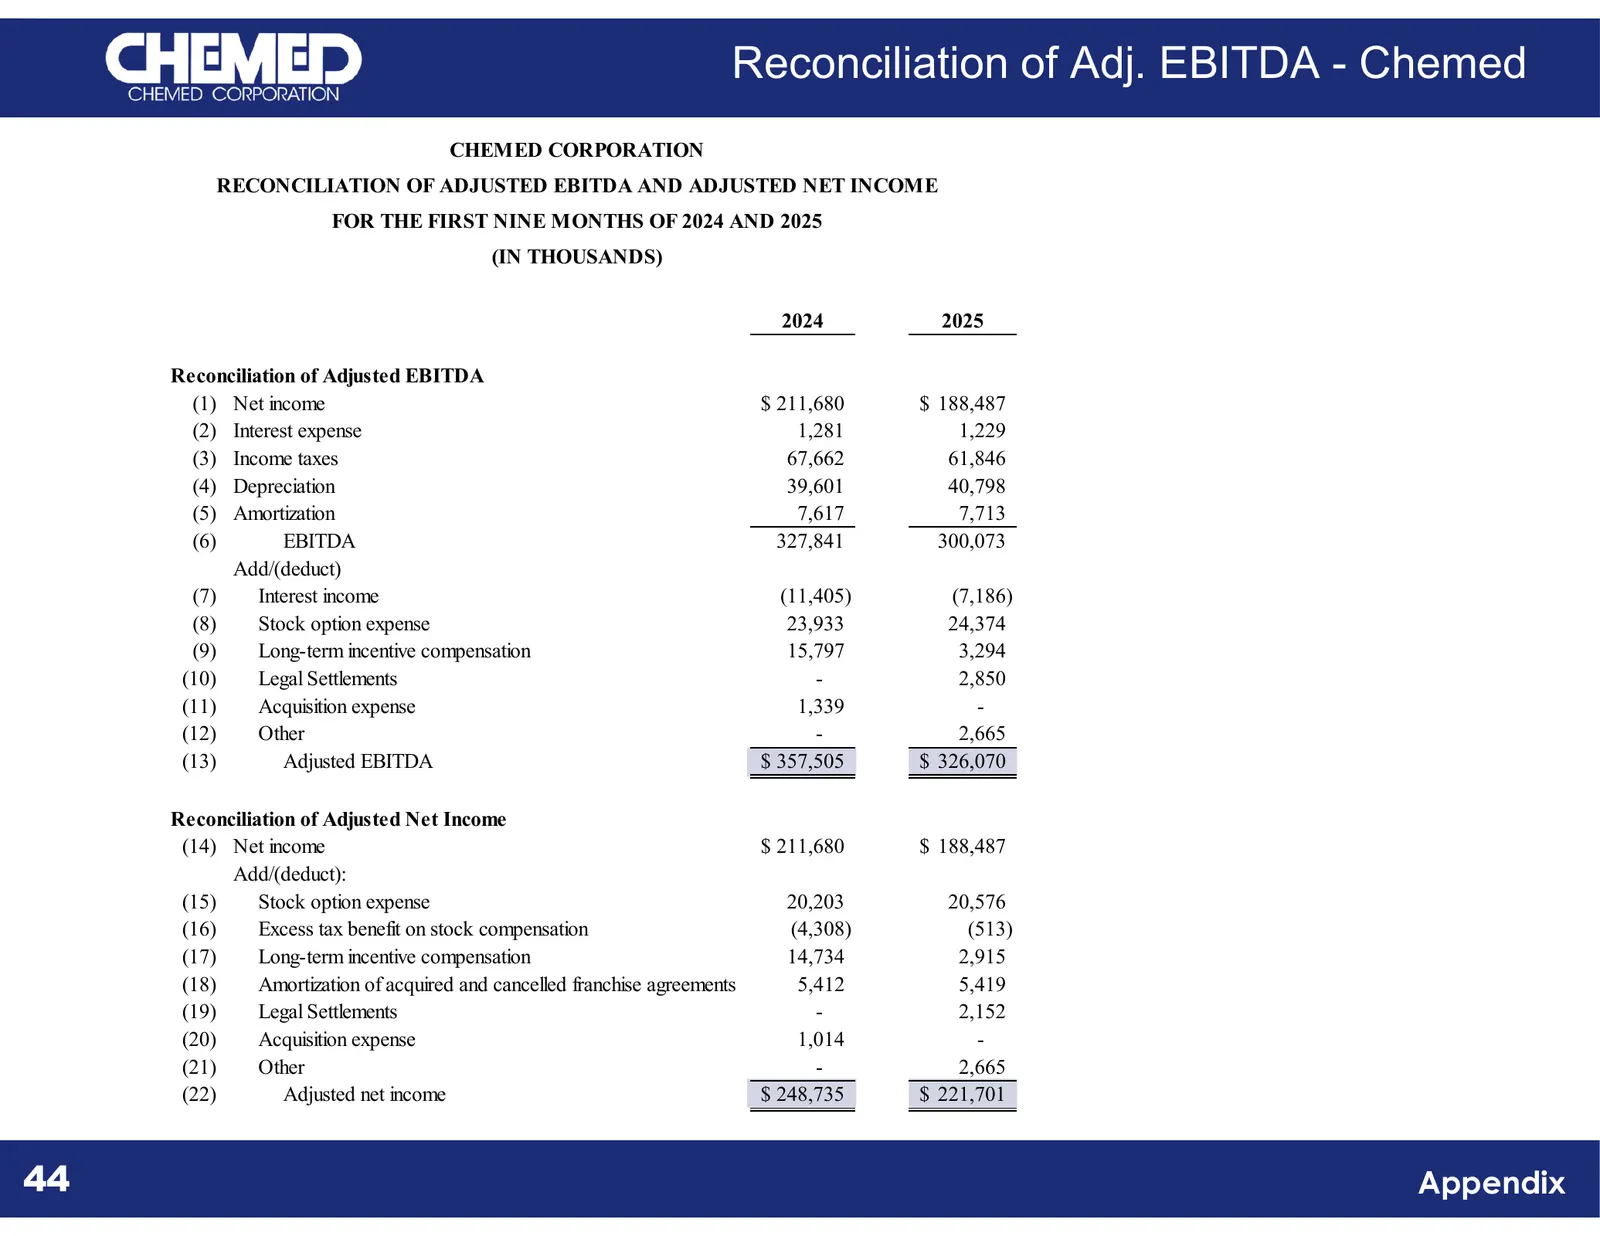
Slide 44: Reconciliation of Adj. EBITDA - Chemed
Reconciliation of Adj. EBITDA - Chemed CHEMED CORPORATION RECONCILIATION OF ADJUSTED EBITDA AND ADJUSTED NET INCOME FOR THE FIRST NINE MONTHS OF 2024 AND 2025 (IN THOUSANDS) 2024 2025 Reconciliation of Adjusted EBITDA (1) Net income $ 211,680 $ 188,487 (2) Interest expense 1,281 1,229 (3) Income tax
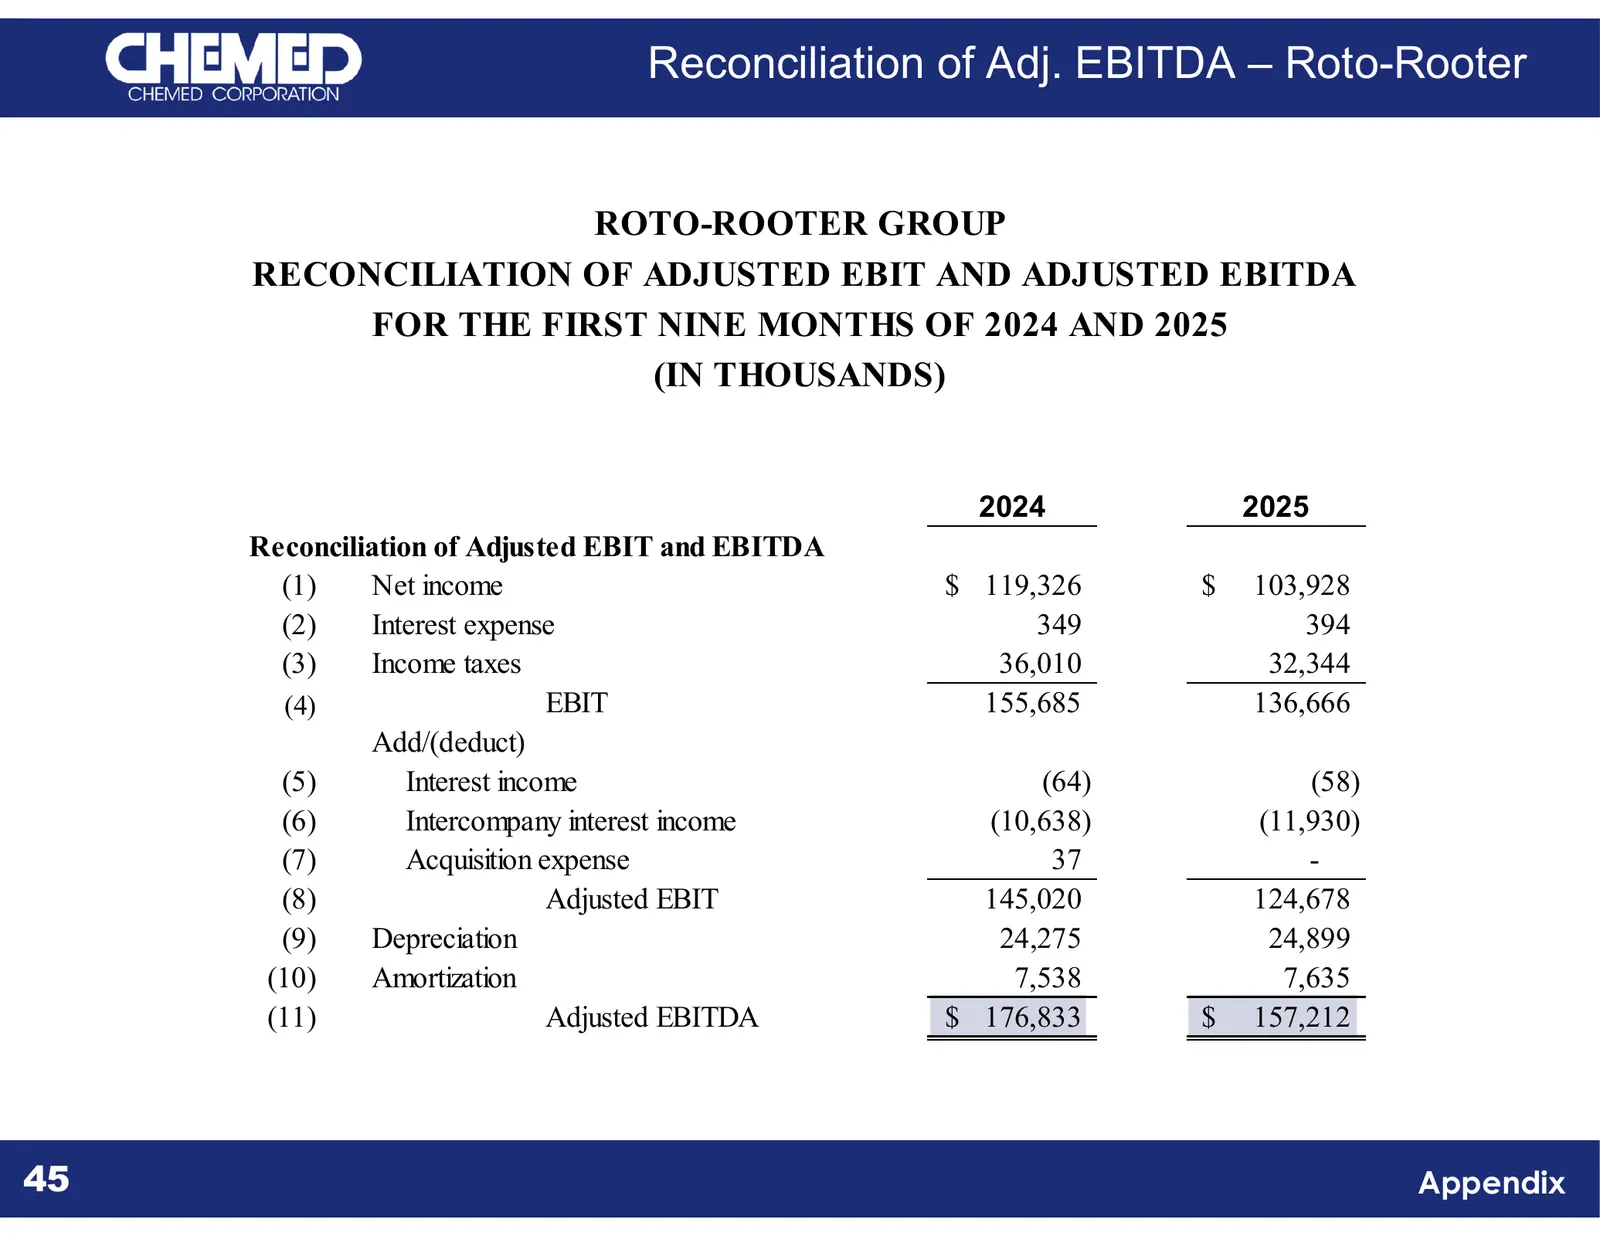
Slide 45: Reconciliation of Adj. EBITDA – Roto-Rooter
Reconciliation of Adj. EBITDA – Roto-Rooter ROTO-ROOTER GROUP RECONCILIATION OF ADJUSTED EBIT AND ADJUSTED EBITDA FOR THE FIRST NINE MONTHS OF 2024 AND 2025 (IN THOUSANDS) 2024 2025 Reconciliation of Adjusted EBIT and EBITDA (1) Net income $ 119,326 $ 103,928 (2) Interest expense 349 394 (3) Income
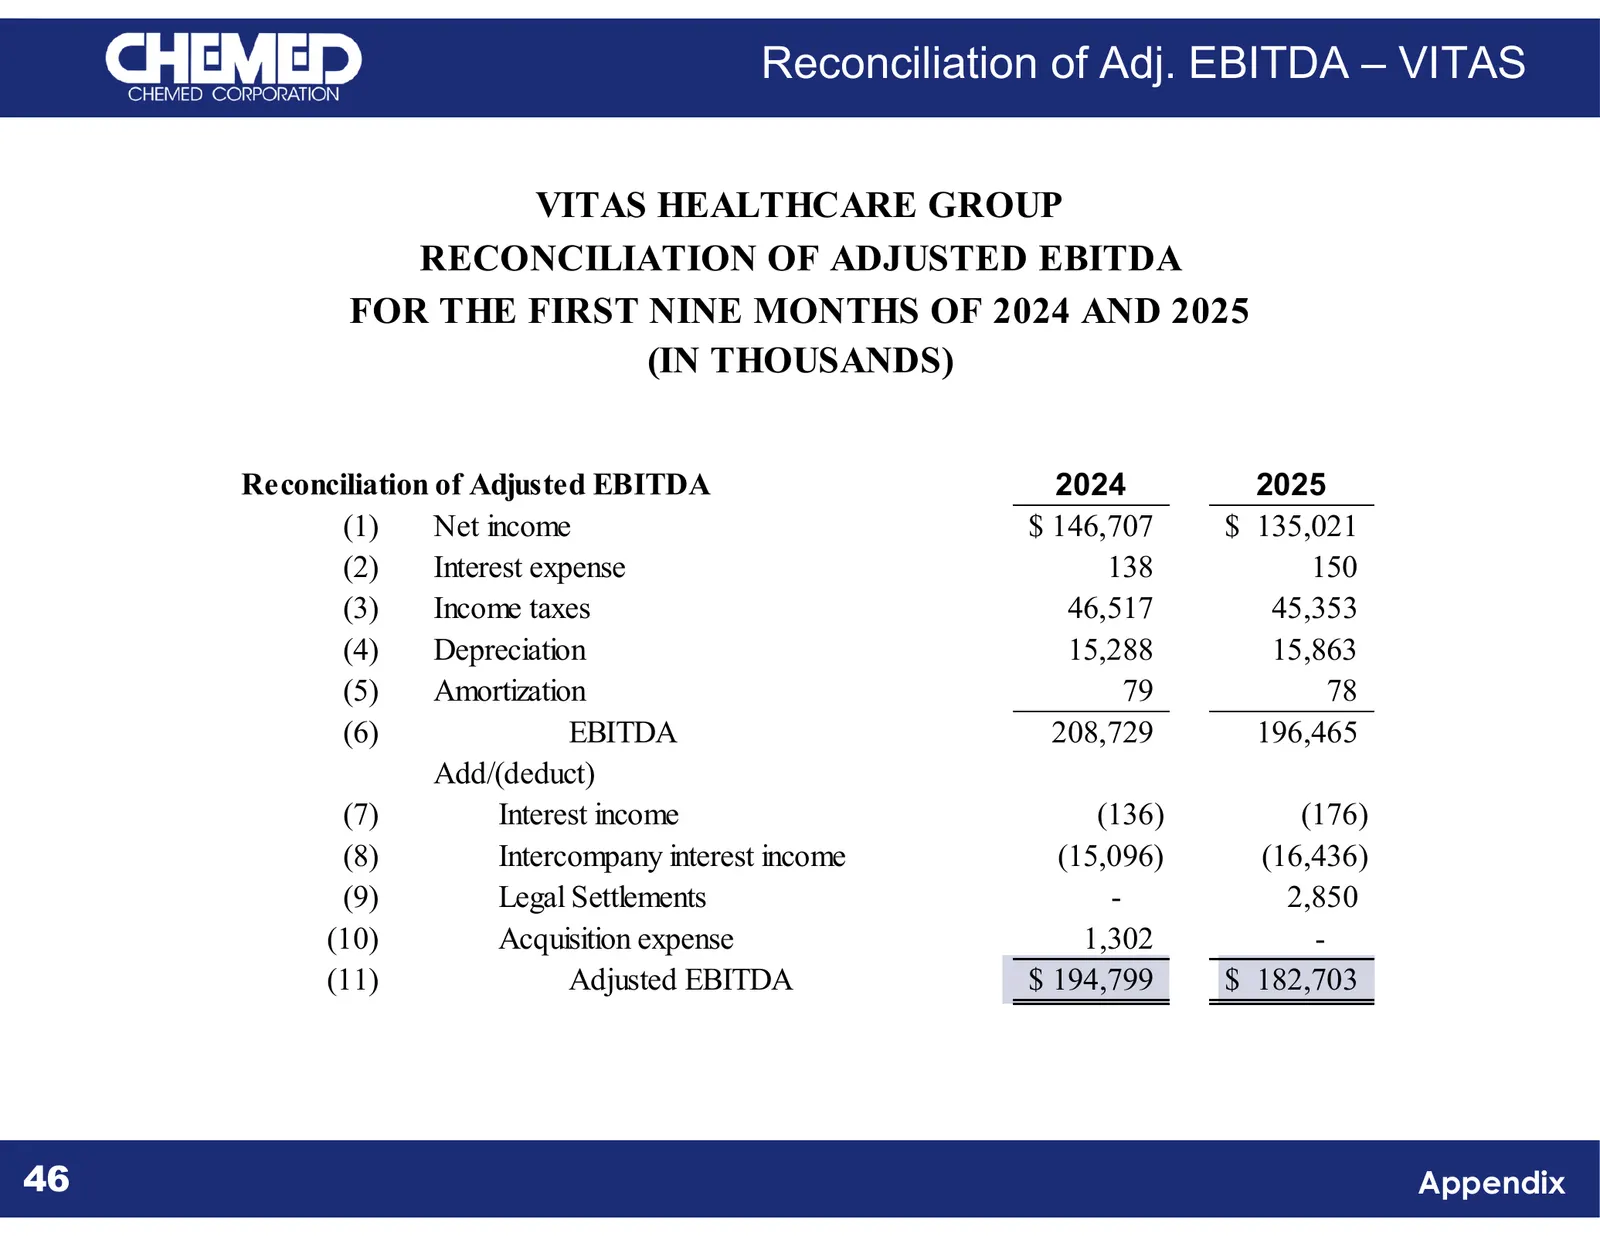
Slide 46: Reconciliation of Adj. EBITDA – VITAS
Reconciliation of Adj. EBITDA – VITAS VITAS HEALTHCARE GROUP RECONCILIATION OF ADJUSTED EBITDA FOR THE FIRST NINE MONTHS OF 2024 AND 2025 (IN THOUSANDS) Reconciliation of Adjusted EBITDA 2024 2025 (1) Net income $ 146,707 $ 135,021 (2) Interest expense 138 150 (3) Income taxes 46,517 45,353 (4) Depr
Slide 47: Chemed Corporation Contact Information
255 East 5th Street Kevin J. McNamara Suite 2600 President and CEO kevin.mcnamara@chemed.com Cincinnati, OH 45202 Michael D. Witzeman EVP, CFO and Controller (513) 762-6690 Phone michael.witzeman@chemed.com (513) 762-6919 Fax www.chemed.com Rev. 02/2025 Chemed Corporation
Source: company website
More decks from Chemed Corp
 Q2 2026 Earnings Presentation48 slides · Jul 29, 2026
 Q1 2026 Earnings Presentation48 slides · Apr 24, 2026
 Q4 2025 Earnings Presentation48 slides · Feb 26, 2026
 Q1 2025 Earnings Presentation47 slides · Apr 24, 2025
 Q4 2024 Earnings Presentation47 slides · Feb 27, 2025
 Investor Presentation (2025)47 slides · 2025