Aryzta AG · SIX:ARYN
Aryzta — FY2012 Earnings Presentation
58 slides from Aryzta's earnings presentation, Sep 24, 2012
Slide 1: FY 2012 Results
ARYZTA AG FY 2012 Results 24 September 2012
Slide 2: Forward Looking Statement
Forward Looking Statement This document contains forward looking statements which reflect management’s current views and estimates. The forward looking statements involve certain risks and uncertainties that could cause actual results to differ materially from those contained in the forward looking
Slide 3: Agenda
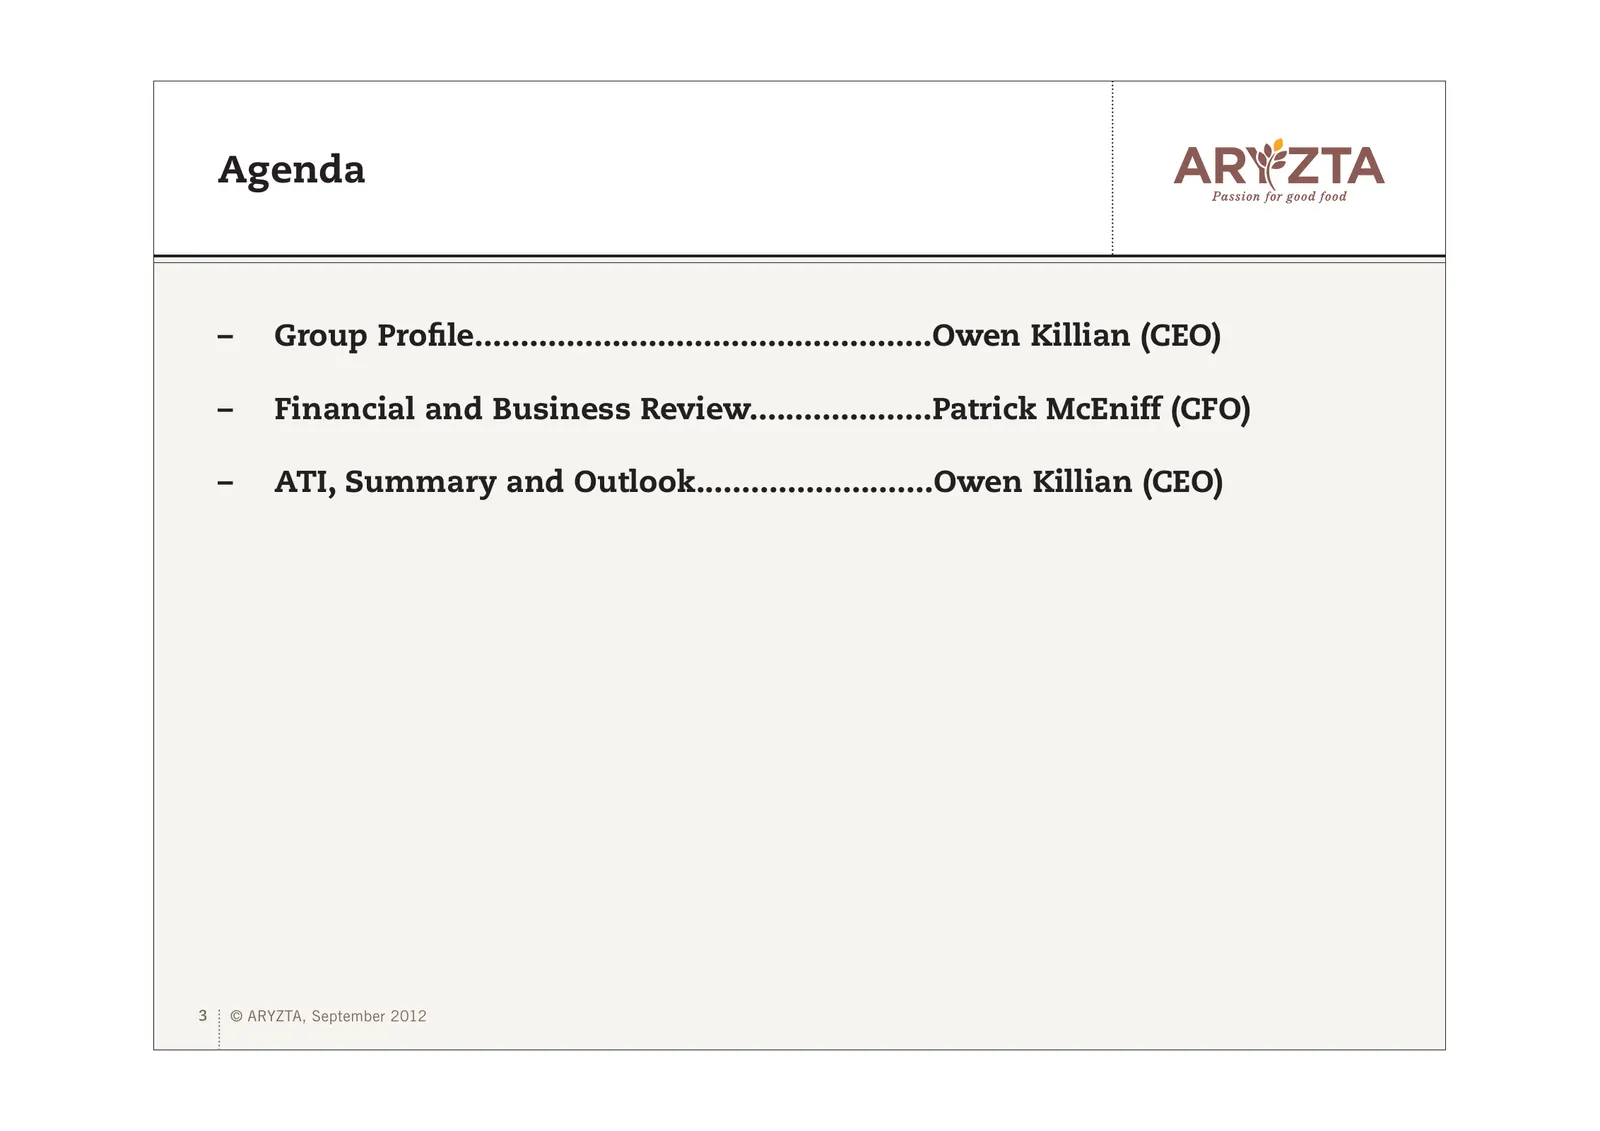
Agenda – Group Profile..................................................Owen Killian (CEO) – Financial and Business Review....................Patrick McEniff (CFO) – ATI, Summary and Outlook..........................Owen Killian (CEO) 3 © ARYZTA, September 2012
Slide 4: ARYZTA Today
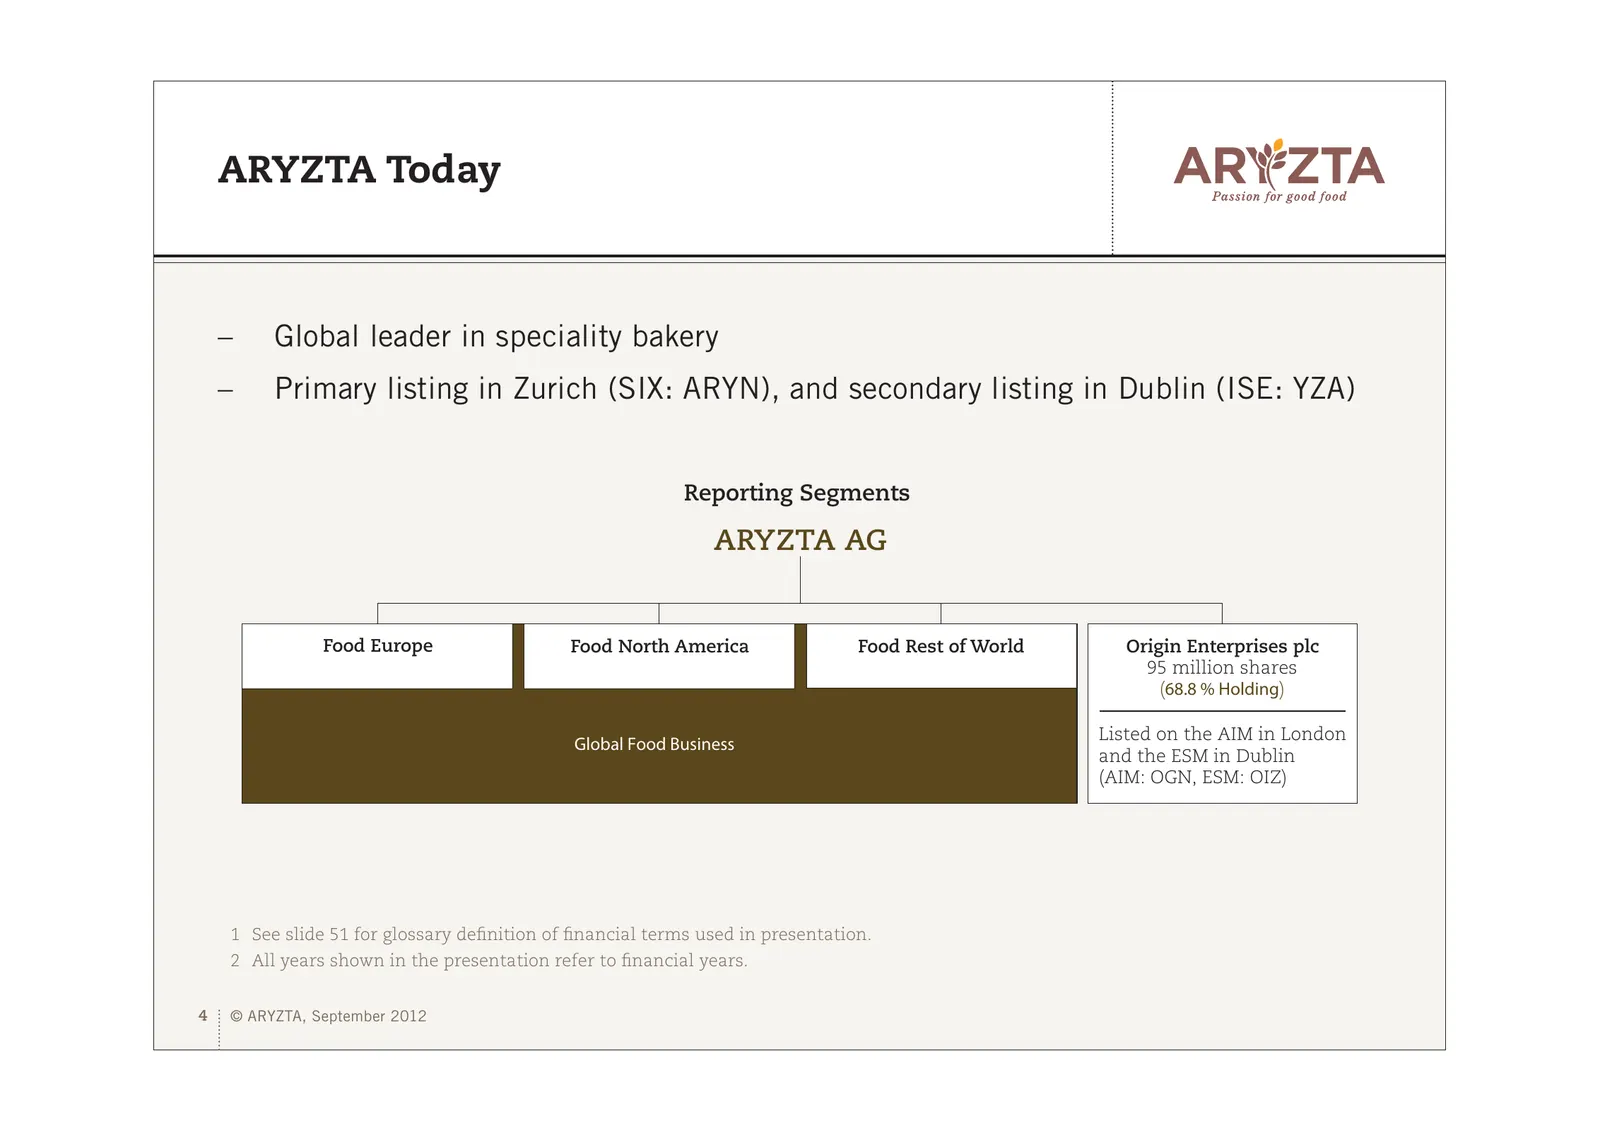
ARYZTA Today – Global leader in speciality bakery – Primary listing in Zurich (SIX: ARYN), and secondary listing in Dublin (ISE: YZA) Reporting Segments ARYZTA AG Food Europe Food North America Food Rest of World Origin Enterprises plc 95 million shares (68.8 % Holding) Listed on the AIM in London G
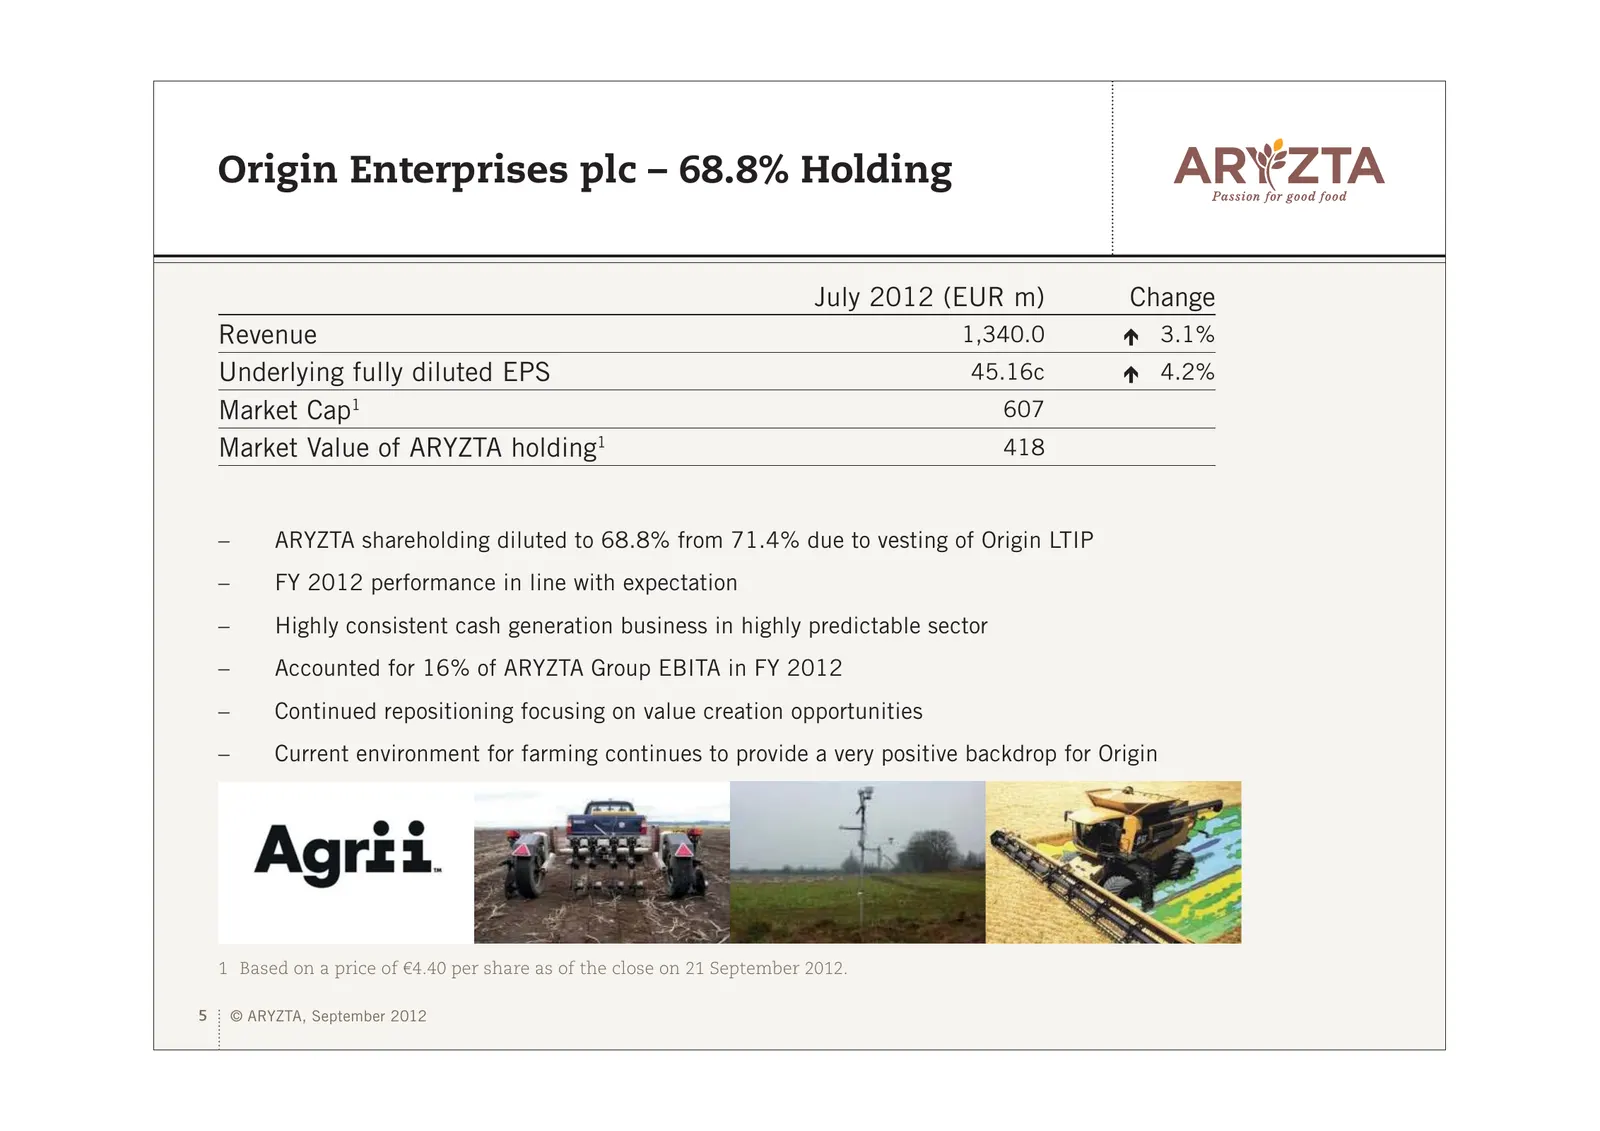
Slide 5: Origin Enterprises plc – 68.8% Holding
Origin Enterprises plc – 68.8% Holding July 2012 (EUR m) Change Revenue 1,340.0 Ï 3.1% Underlying fully diluted EPS 45.16c Ï 4.2% Market Cap1 607 Market Value of ARYZTA holding1 418 – ARYZTA shareholding diluted to 68.8% from 71.4% due to vesting of Origin LTIP – FY 2012 performance in line with exp
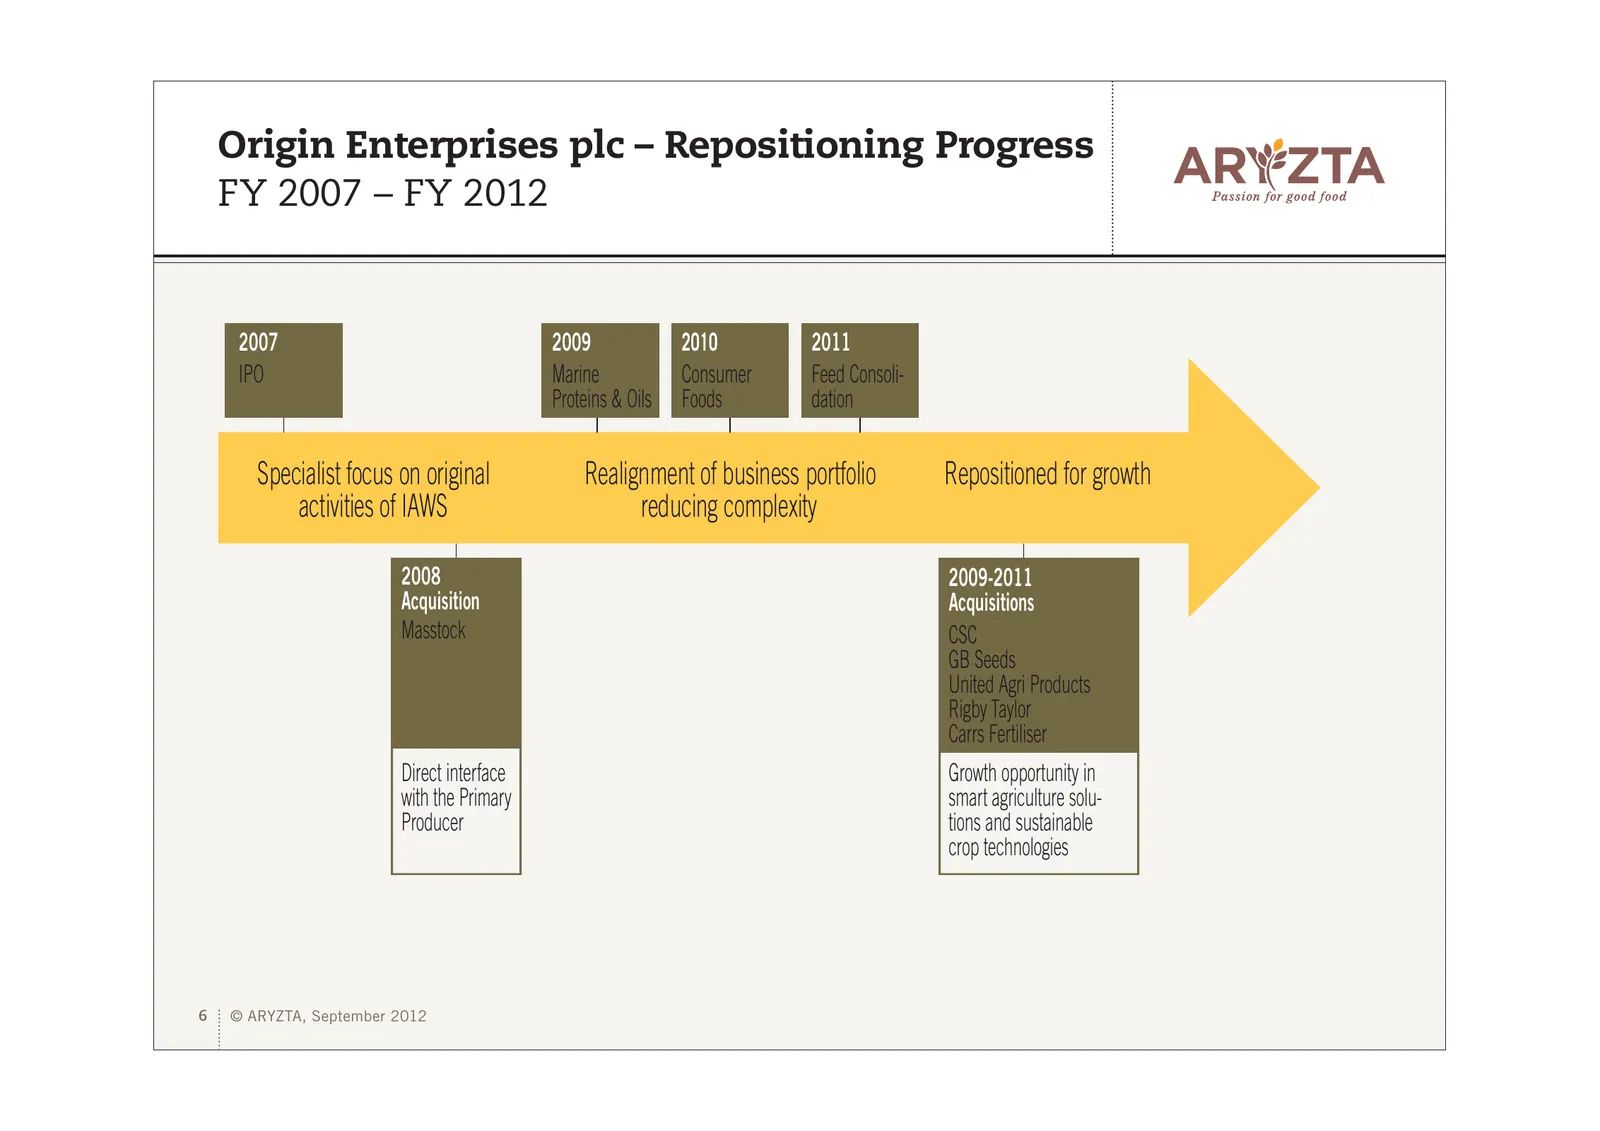
Slide 6: Origin Enterprises plc – Repositioning Progress FY 2007 – FY 2012
Origin Enterprises plc – Repositioning Progress FY 2007 – FY 2012 2007 2009 2010 2011 IPO Marine Consumer Feed Consoli- Proteins & Oils Foods dation Specialist focus on original Realignment of business portfolio Repositioned for growth activities of IAWS reducing complexity 2008 2009-2011 Acquisitio
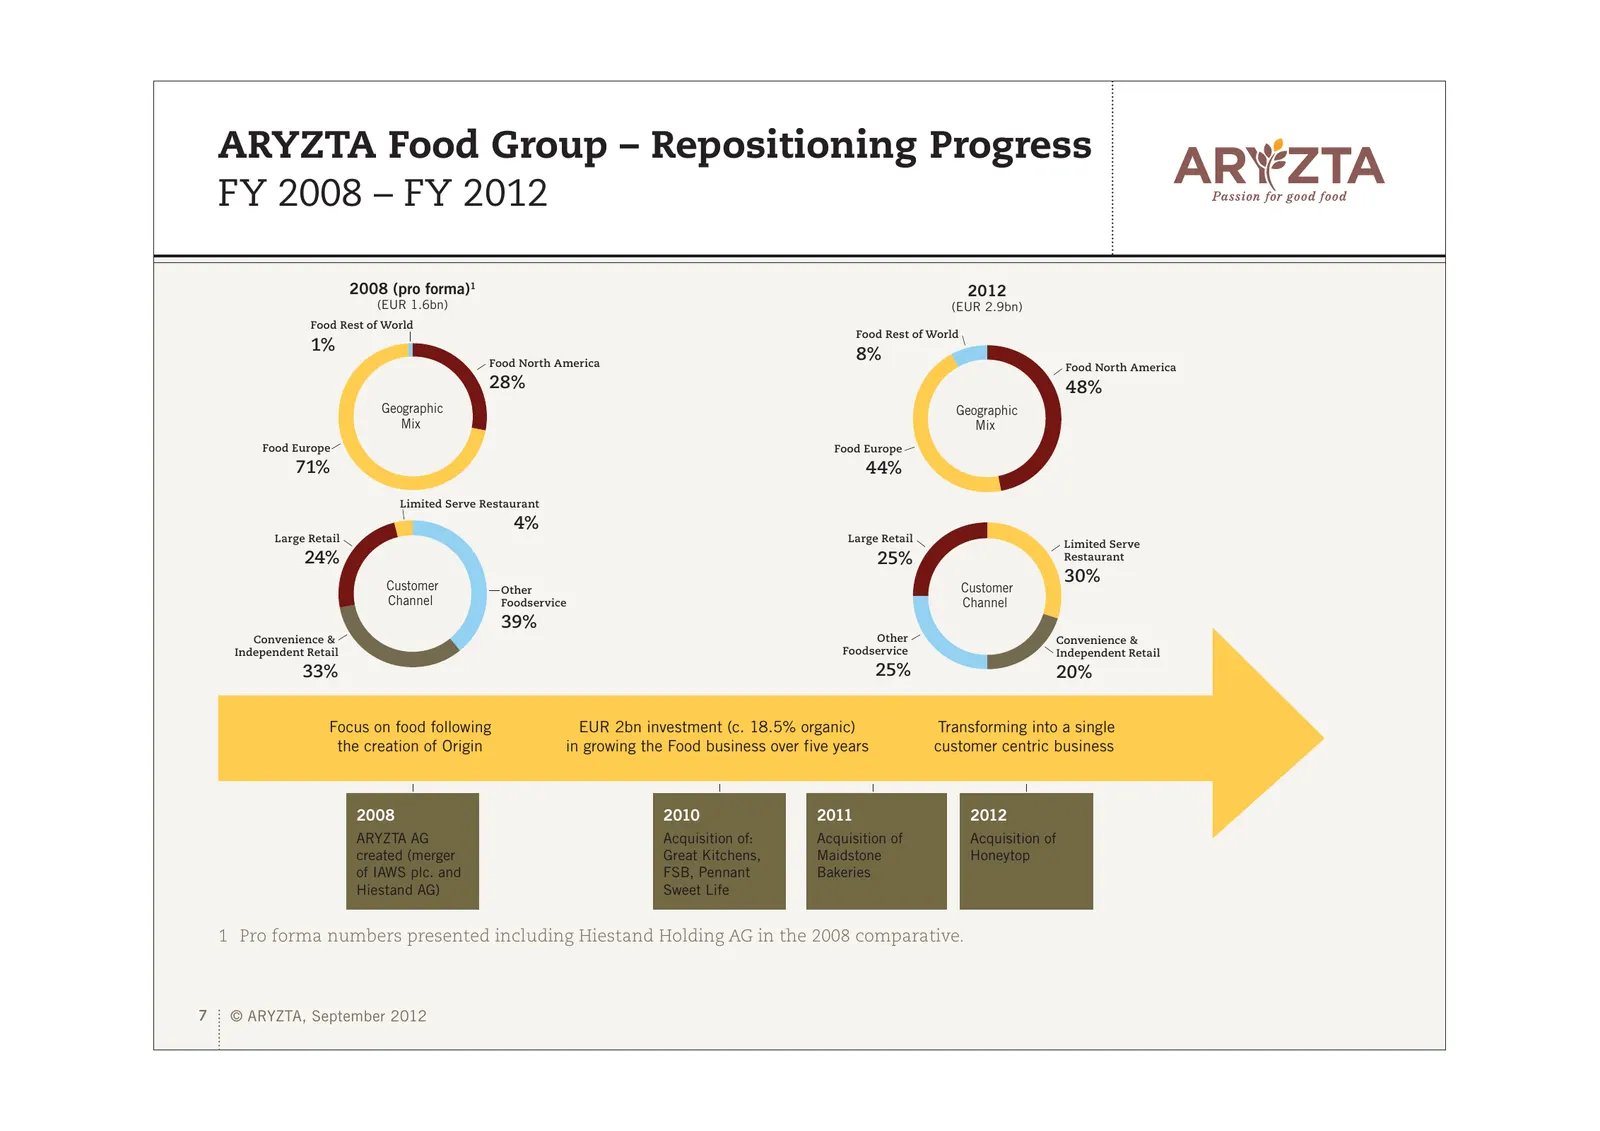
Slide 7: ARYZTA Food Group – Repositioning Progress FY 2008 – FY 2012
ARYZTA Food Group – Repositioning Progress FY 2008 – FY 2012 2008 (pro forma)1 2012 (EUR 1.6bn) (EUR 2.9bn) Food Rest of World Food Rest of World 1% Food North America 8% Food North America 28% 48% Geographic Geographic Mix Mix Food Europe Food Europe 71% 44% Limited Serve Restaurant 4% Large Retail
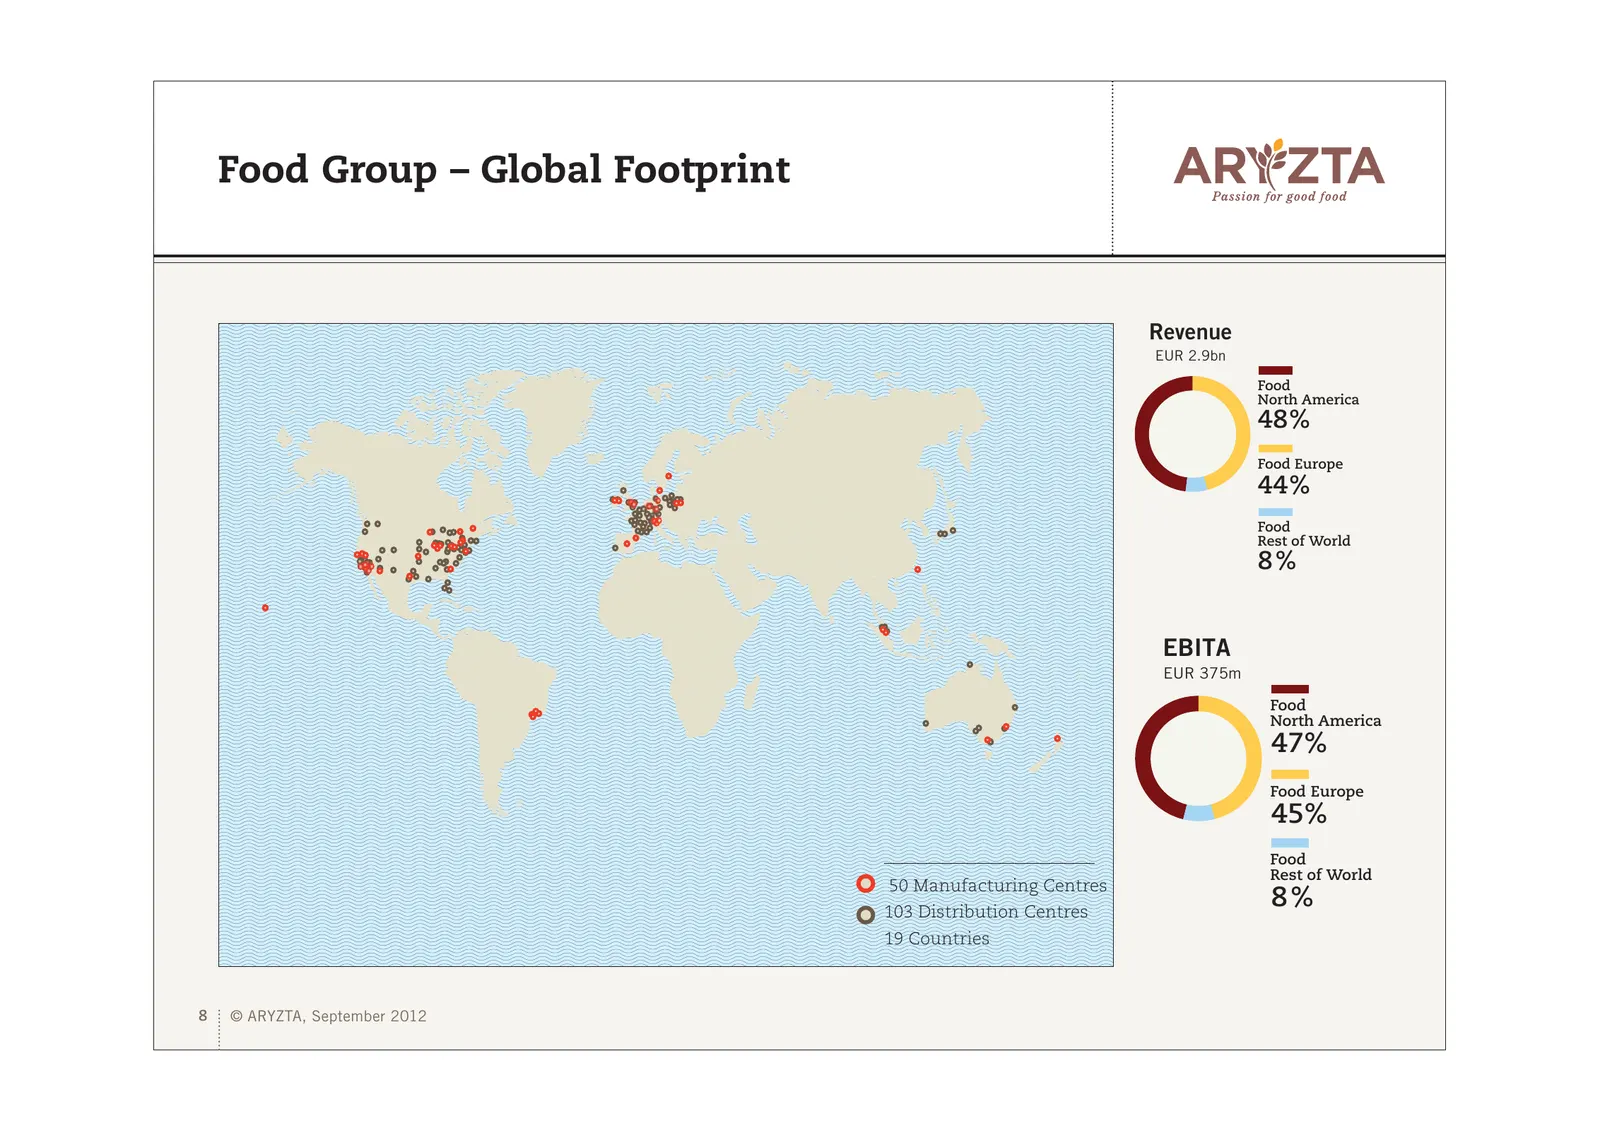
Slide 8: Food Group – Global Footprint
Food Group – Global Footprint Revenue EUR 2.9bn Food North America 48% Food Europe 44% Food Rest of World 8% EBITA EUR 375m Food North America 47% Food Europe 45% Food Rest of World 50 Manufacturing Centres 103 Distribution Centres 8% 19 Countries 8 © ARYZTA, September 2012
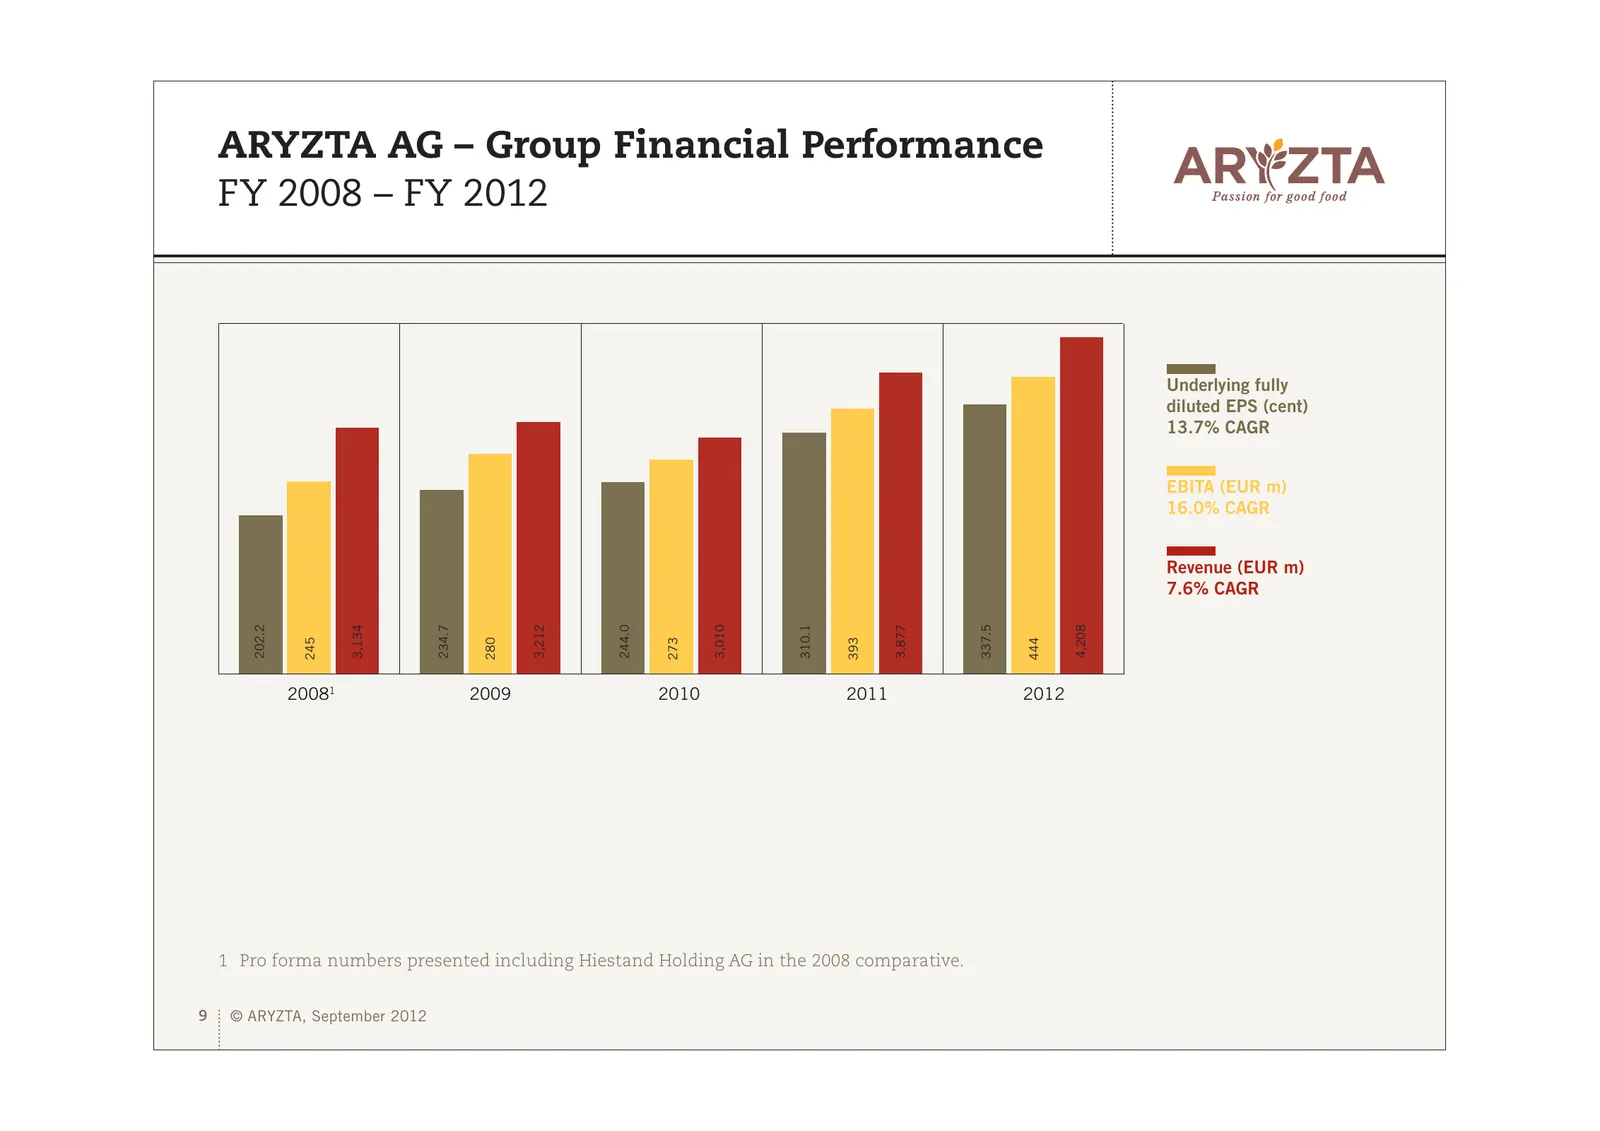
Slide 9: ARYZTA AG – Group Financial Performance FY 2008 – FY 2012
ARYZTA AG – Group Financial Performance FY 2008 – FY 2012 Underlying fully diluted EPS (cent) 13.7% CAGR EBITA (EUR m) 16.0% CAGR Revenue (EUR m) 7.6% CAGR 4,208 202.2 3,134 234.7 3,212 244.0 3,010 310.1 337.5 3,877 245 280 273 393 444 20081 2009 2010 2011 2012 1 Pro forma numbers presented includin
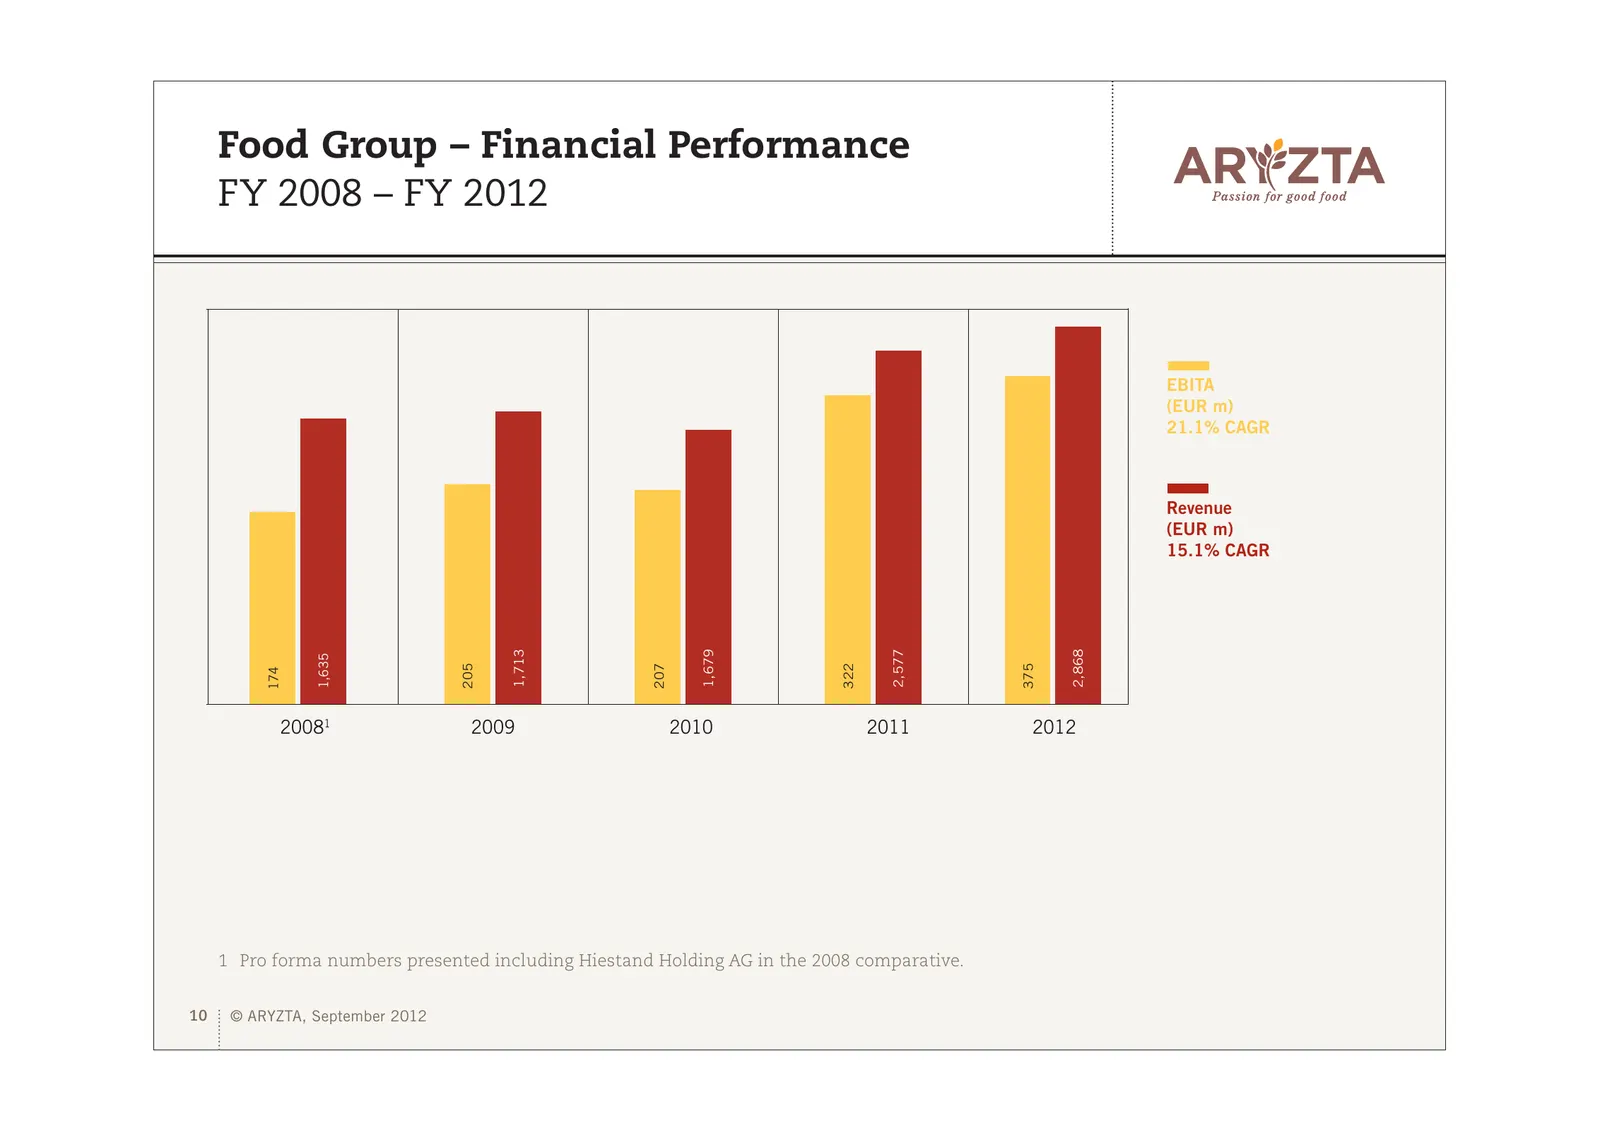
Slide 10: Food Group – Financial Performance FY 2008 – FY 2012
Food Group – Financial Performance FY 2008 – FY 2012 EBITA (EUR m) 21.1% CAGR Revenue (EUR m) 15.1% CAGR 1,713 1,679 2,577 2,868 1,635 205 207 322 375 174 20081 2009 2010 2011 2012 1 Pro forma numbers presented including Hiestand Holding AG in the 2008 comparative. 10 © ARYZTA, September 2012
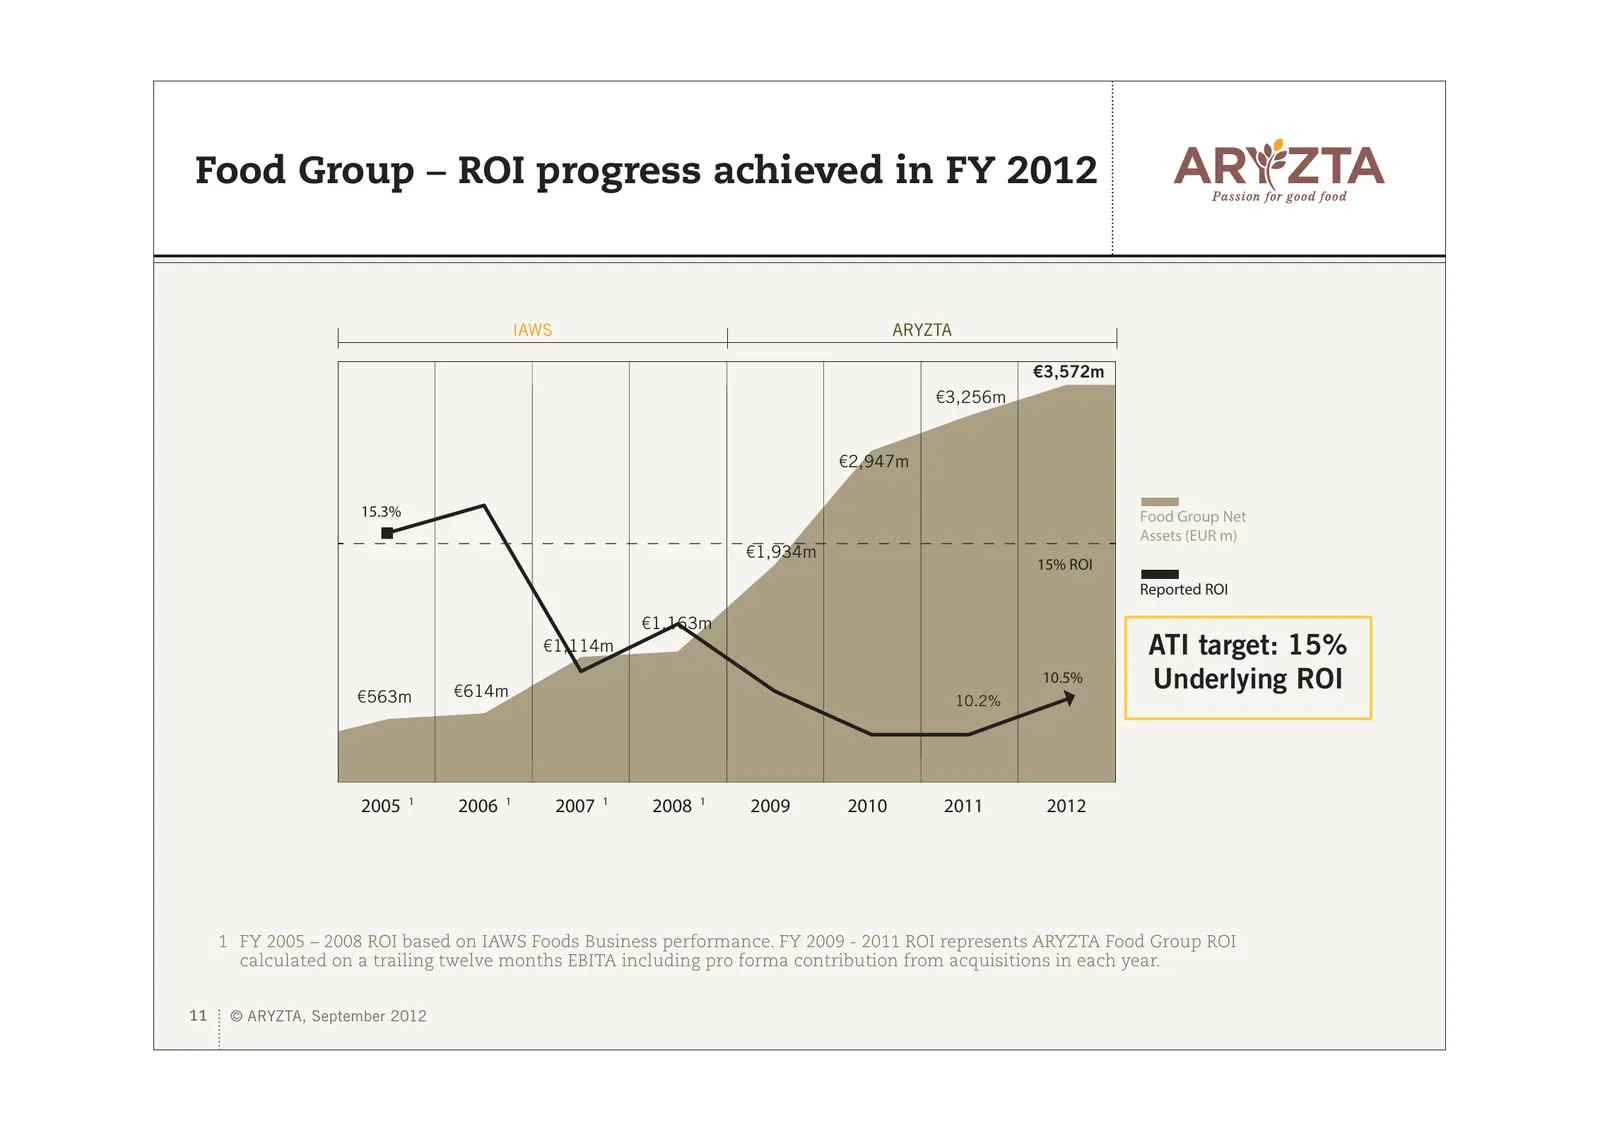
Slide 11: Food Group – ROI progress achieved in FY 2012
Food Group – ROI progress achieved in FY 2012 IAWS ARYZTA €3,572m €3,256m €2,947m 15.3% Food Group Net Assets (EUR m) €1,934m 15% ROI Reported ROI €1,163m €1,114m ATI target: 15% €563m €614m 10.5% Underlying ROI 10.2% 2005 1 2006 1 2007 1 2008 1 2009 2010 2011 2012 1 FY 2005 – 2008 ROI based on IAWS
Slide 12: ARYZTA AG Financial and Business Review
ARYZTA AG Financial and Business Review 12 © ARYZTA, September 2012
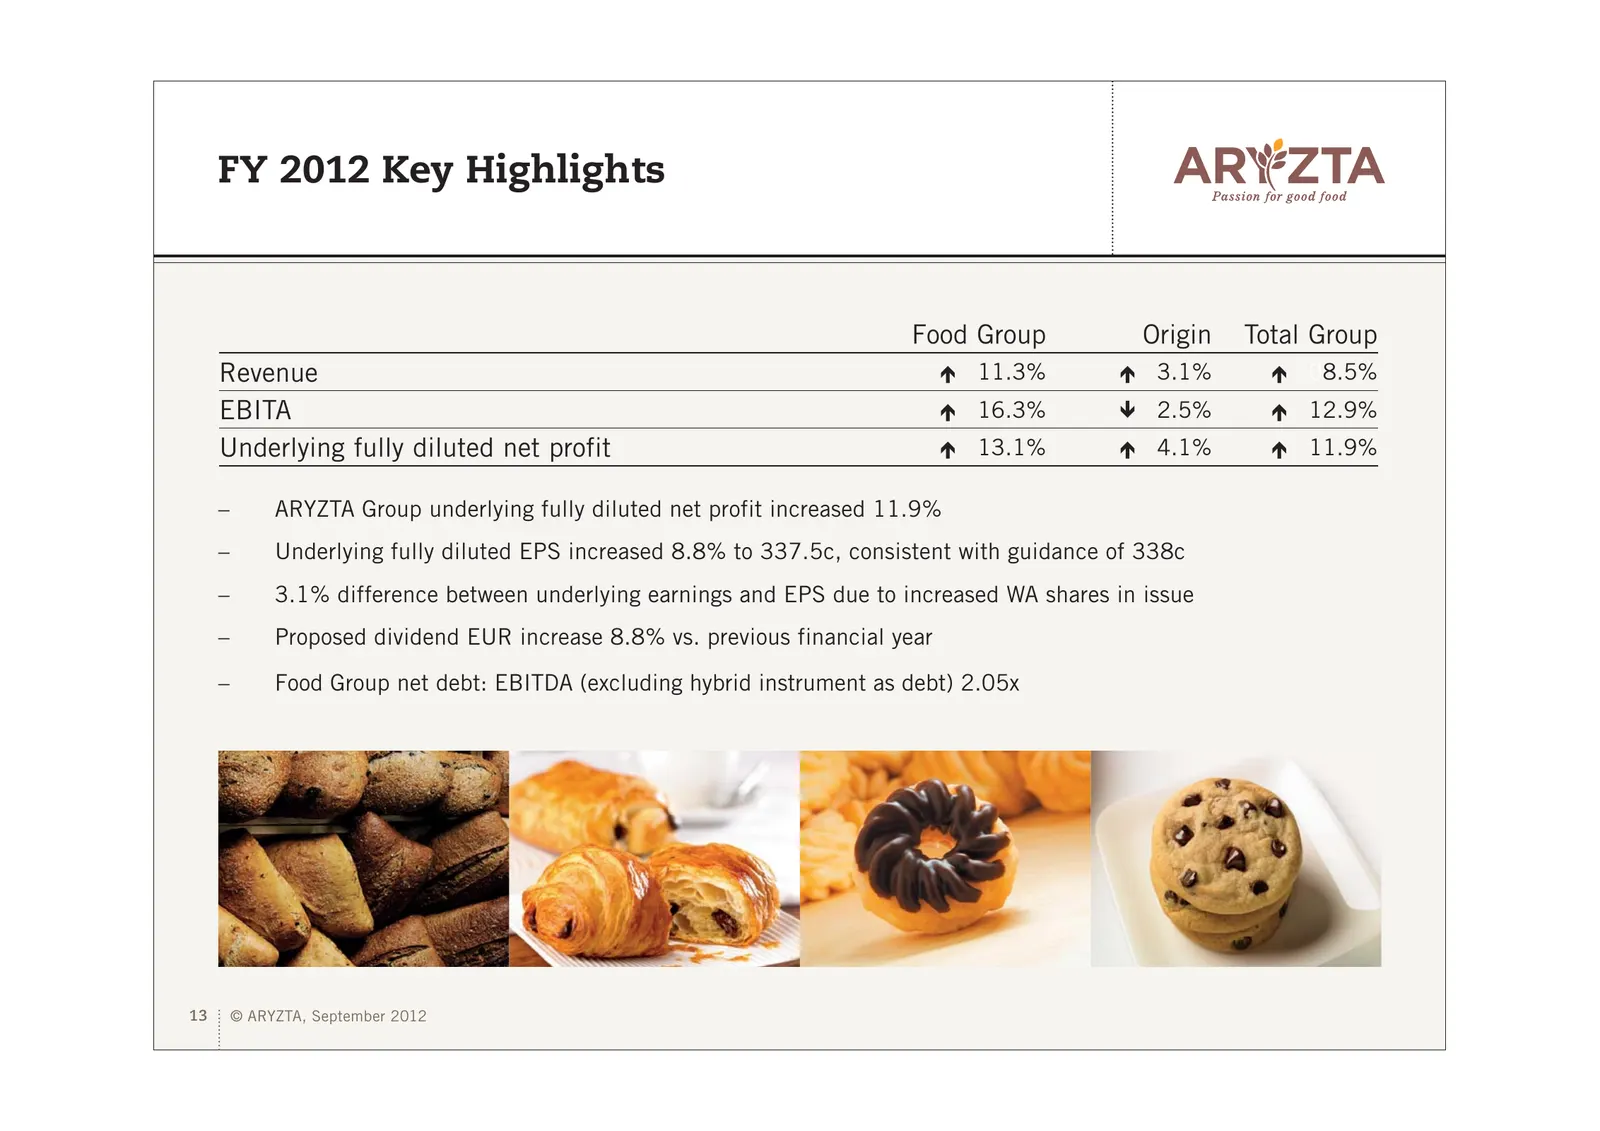
Slide 13: FY 2012 Key Highlights
FY 2012 Key Highlights Food Group Origin Total Group Revenue Ï 11.3% Ï 3.1% Ï 08.5% EBITA Ï 16.3% Ð 2.5% Ï 12.9% Underlying fully diluted net profit Ï 13.1% Ï 4.1% Ï 11.9% – ARYZTA Group underlying fully diluted net profit increased 11.9% – Underlying fully diluted EPS increased 8.8% to 337.5c, cons
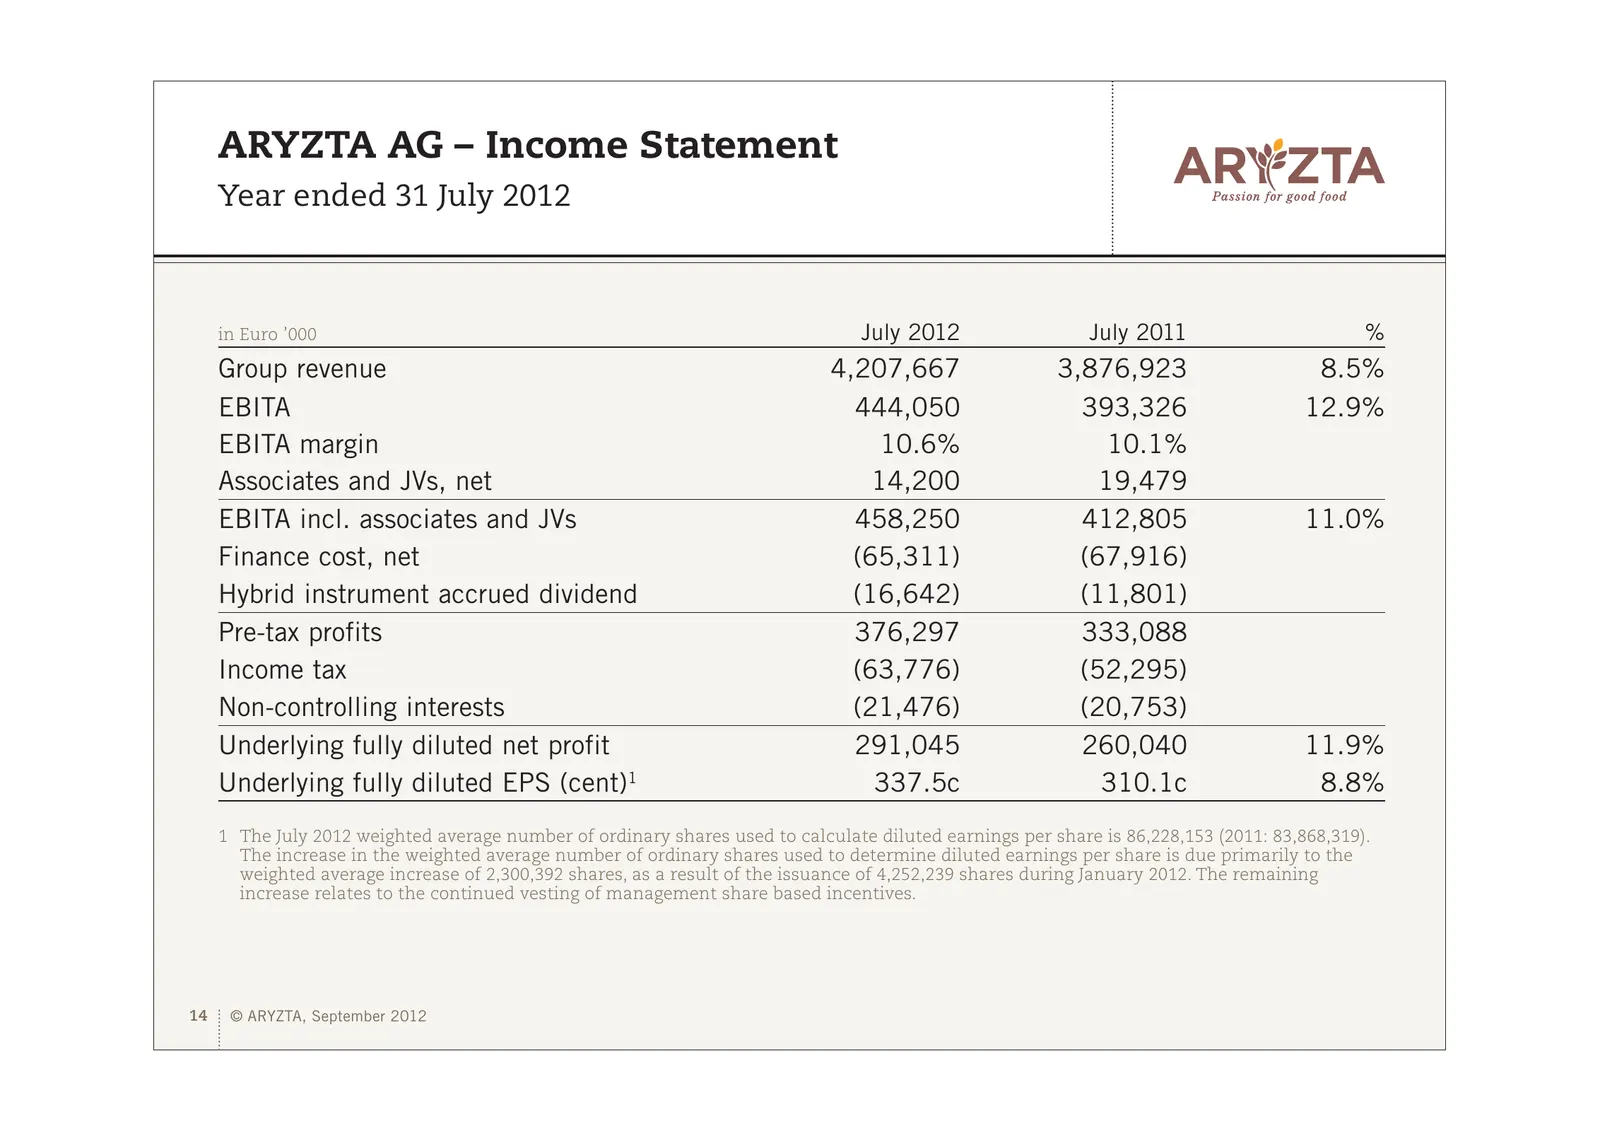
Slide 14: ARYZTA AG – Income Statement
ARYZTA AG – Income Statement Year ended 31 July 2012 in Euro ’000 July 2012 July 2011 % Group revenue 4,207,667 3,876,923 8.5% EBITA 444,050 393,326 12.9% EBITA margin 10.6% 10.1% Associates and JVs, net 14,200 19,479 EBITA incl. associates and JVs 458,250 412,805 11.0% Finance cost, net (65,311) (6
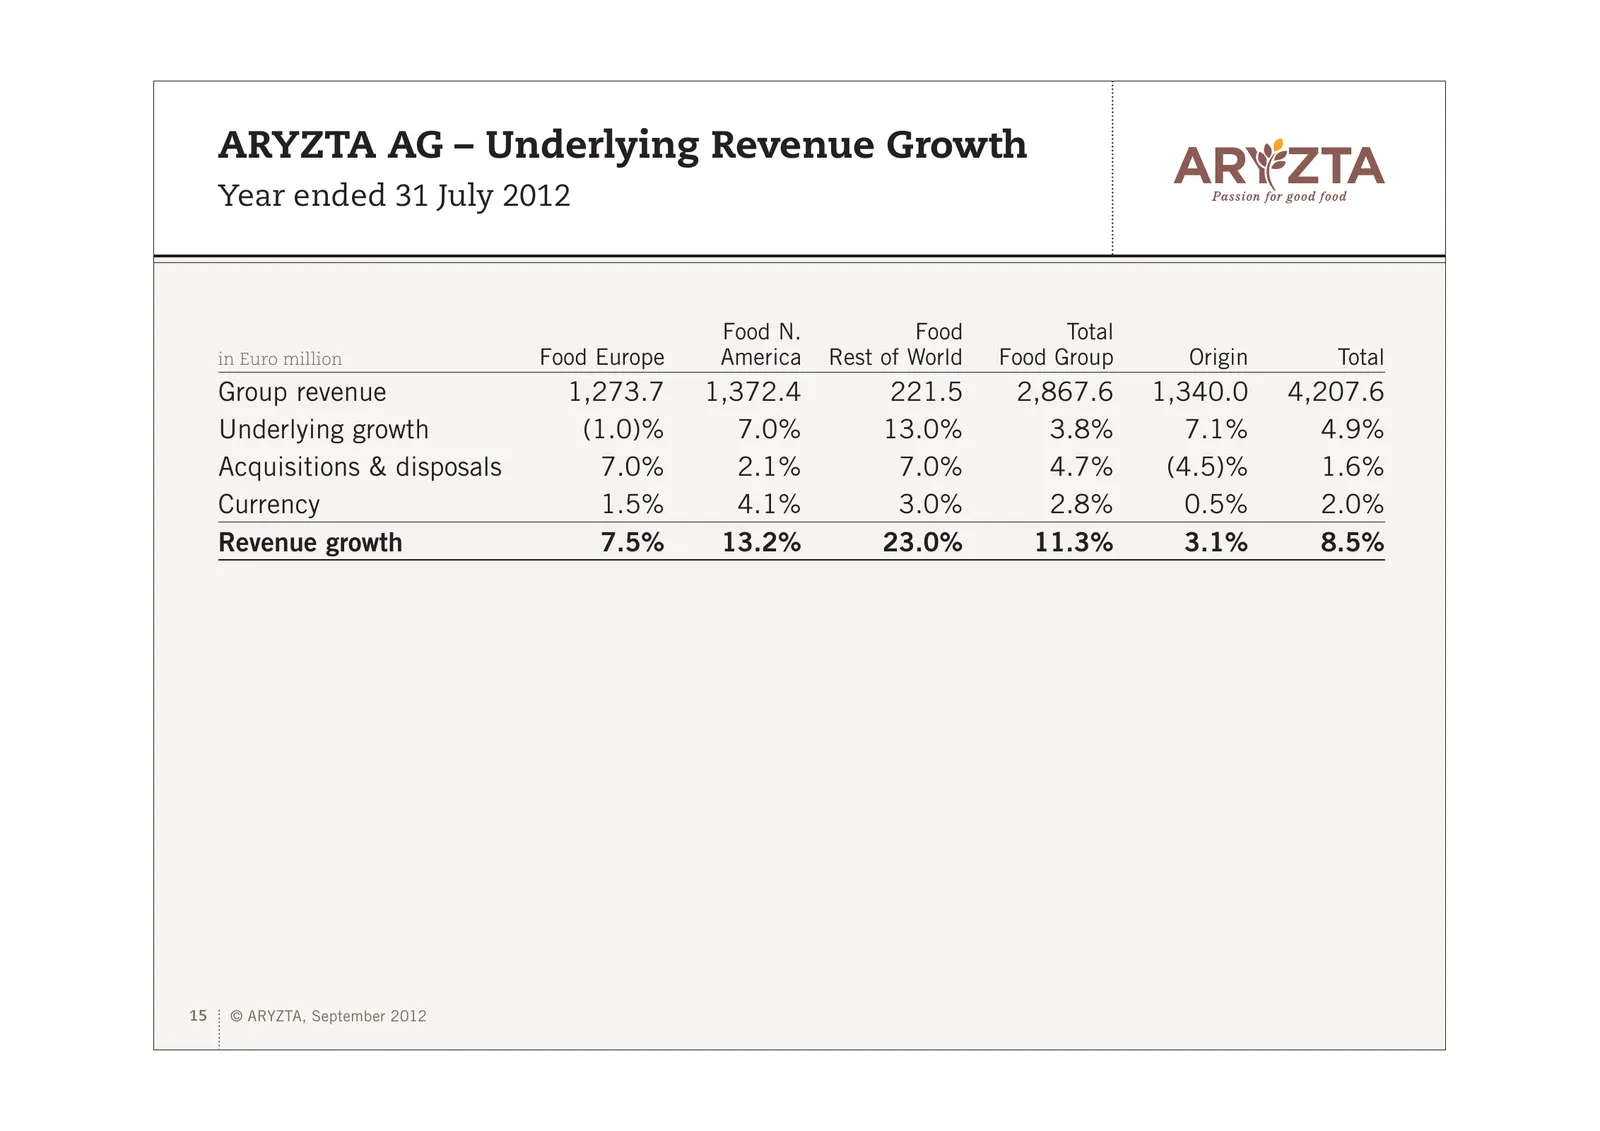
Slide 15: ARYZTA AG – Underlying Revenue Growth
ARYZTA AG – Underlying Revenue Growth Year ended 31 July 2012 Food N. Food Total in Euro million Food Europe America Rest of World Food Group Origin Total Group revenue 1,273.7 1,372.4 221.5 2,867.6 1,340.0 4,207.6 Underlying growth (1.0)% 7.0% 13.0% 3.8% 7.1% 4.9% Acquisitions & disposals 7.0% 2.1%
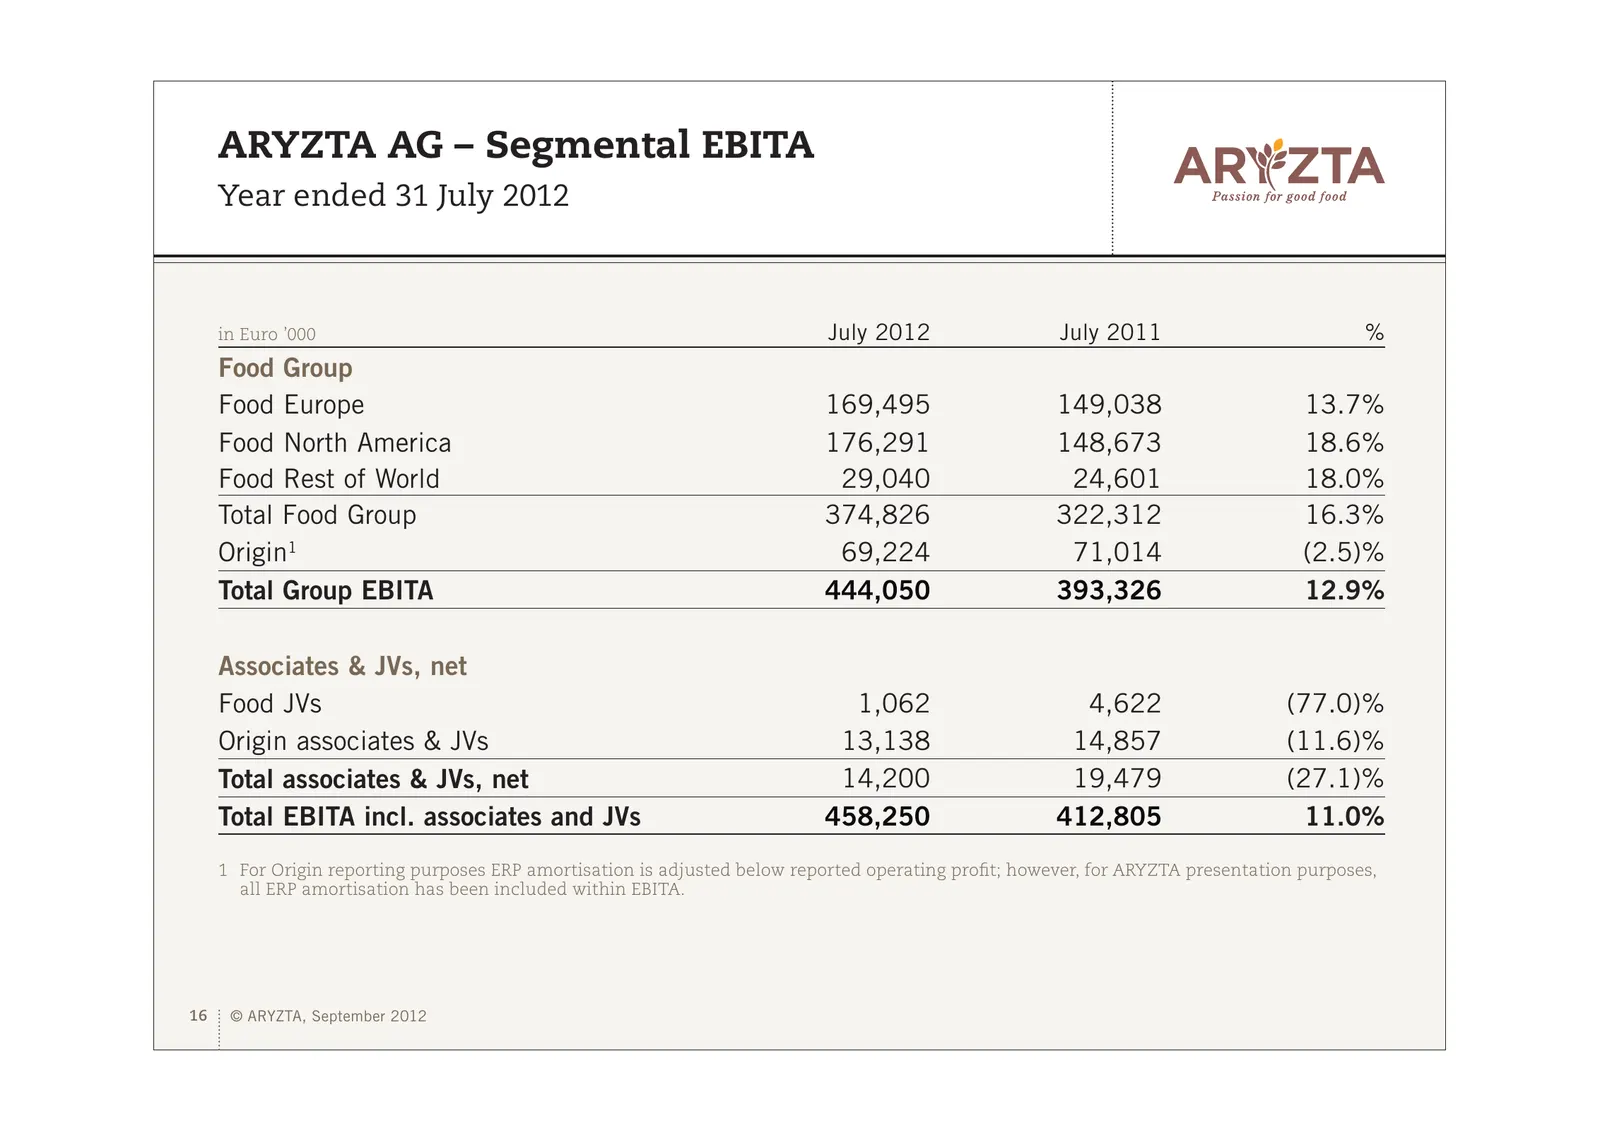
Slide 16: ARYZTA AG – Segmental EBITA
ARYZTA AG – Segmental EBITA Year ended 31 July 2012 in Euro ’000 July 2012 July 2011 % Food Group Food Europe 169,495 149,038 13.7% Food North America 176,291 148,673 18.6% Food Rest of World 29,040 24,601 18.0% Total Food Group 374,826 322,312 16.3% Origin1 69,224 71,014 (2.5)% Total Group EBITA 44
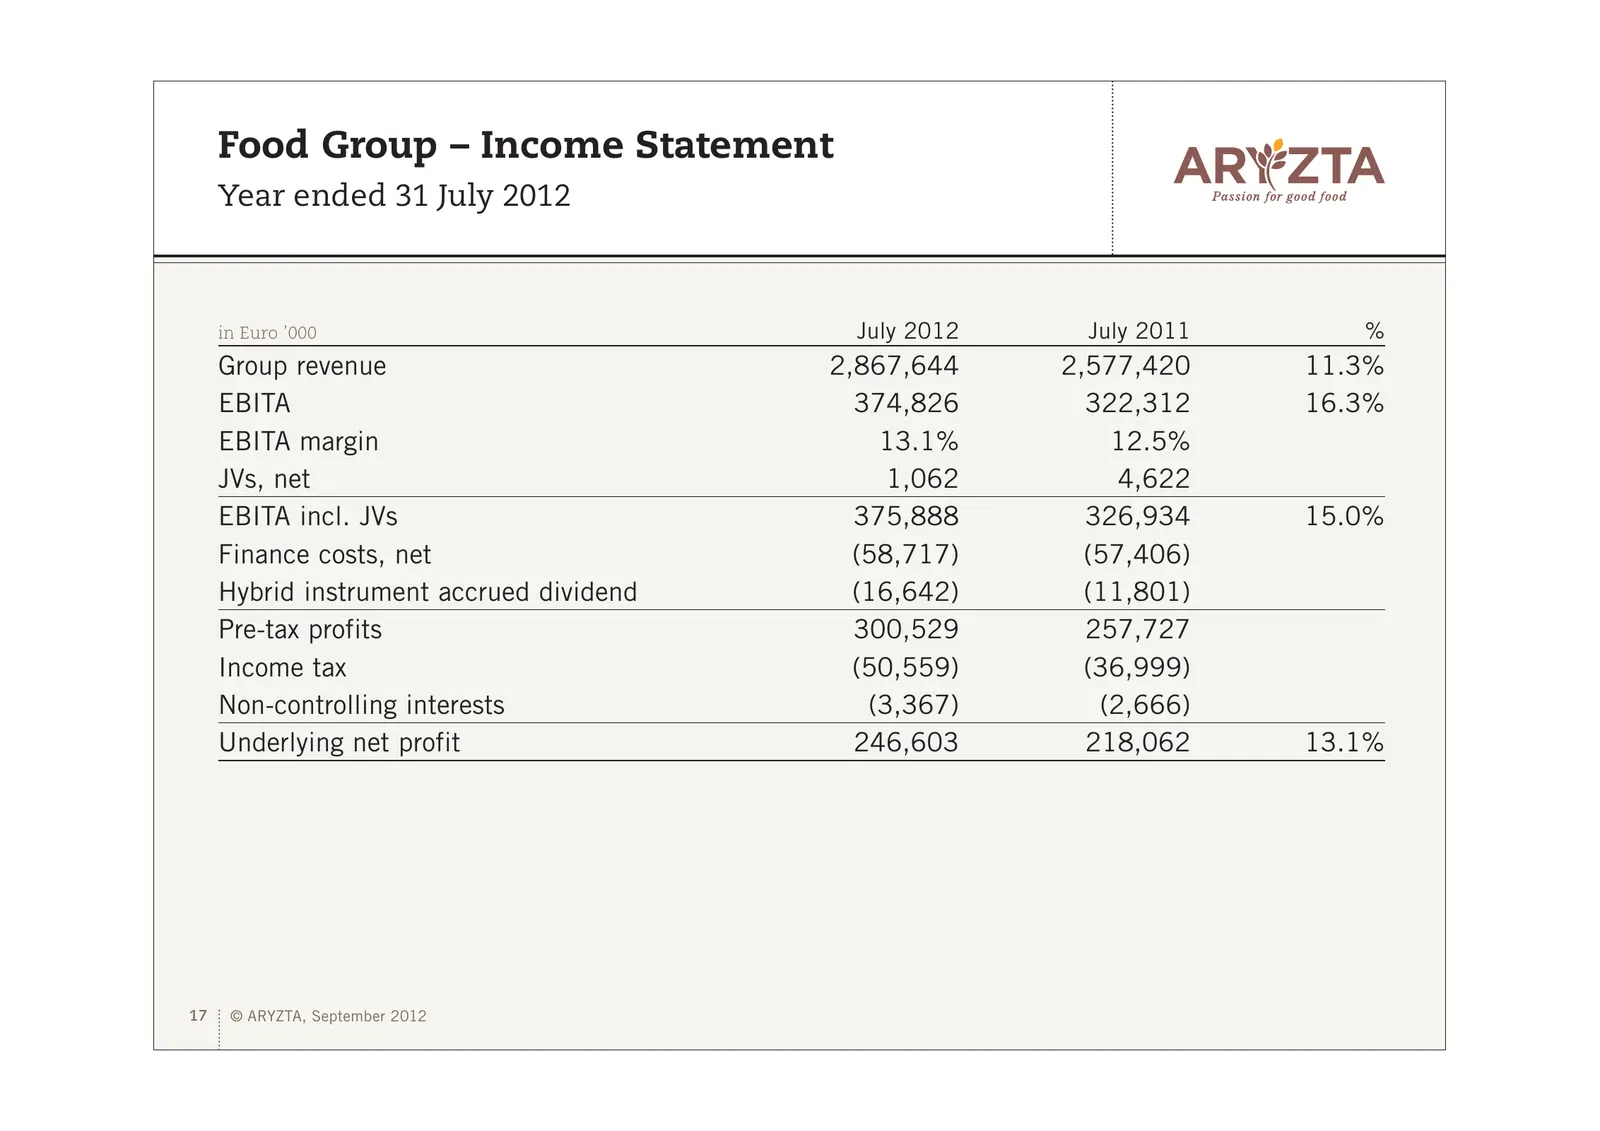
Slide 17: Food Group – Income Statement
Food Group – Income Statement Year ended 31 July 2012 in Euro ’000 July 2012 July 2011 % Group revenue 2,867,644 2,577,420 11.3% EBITA 374,826 322,312 16.3% EBITA margin 13.1% 12.5% JVs, net 1,062 4,622 EBITA incl. JVs 375,888 326,934 15.0% Finance costs, net (58,717) (57,406) Hybrid instrument accr
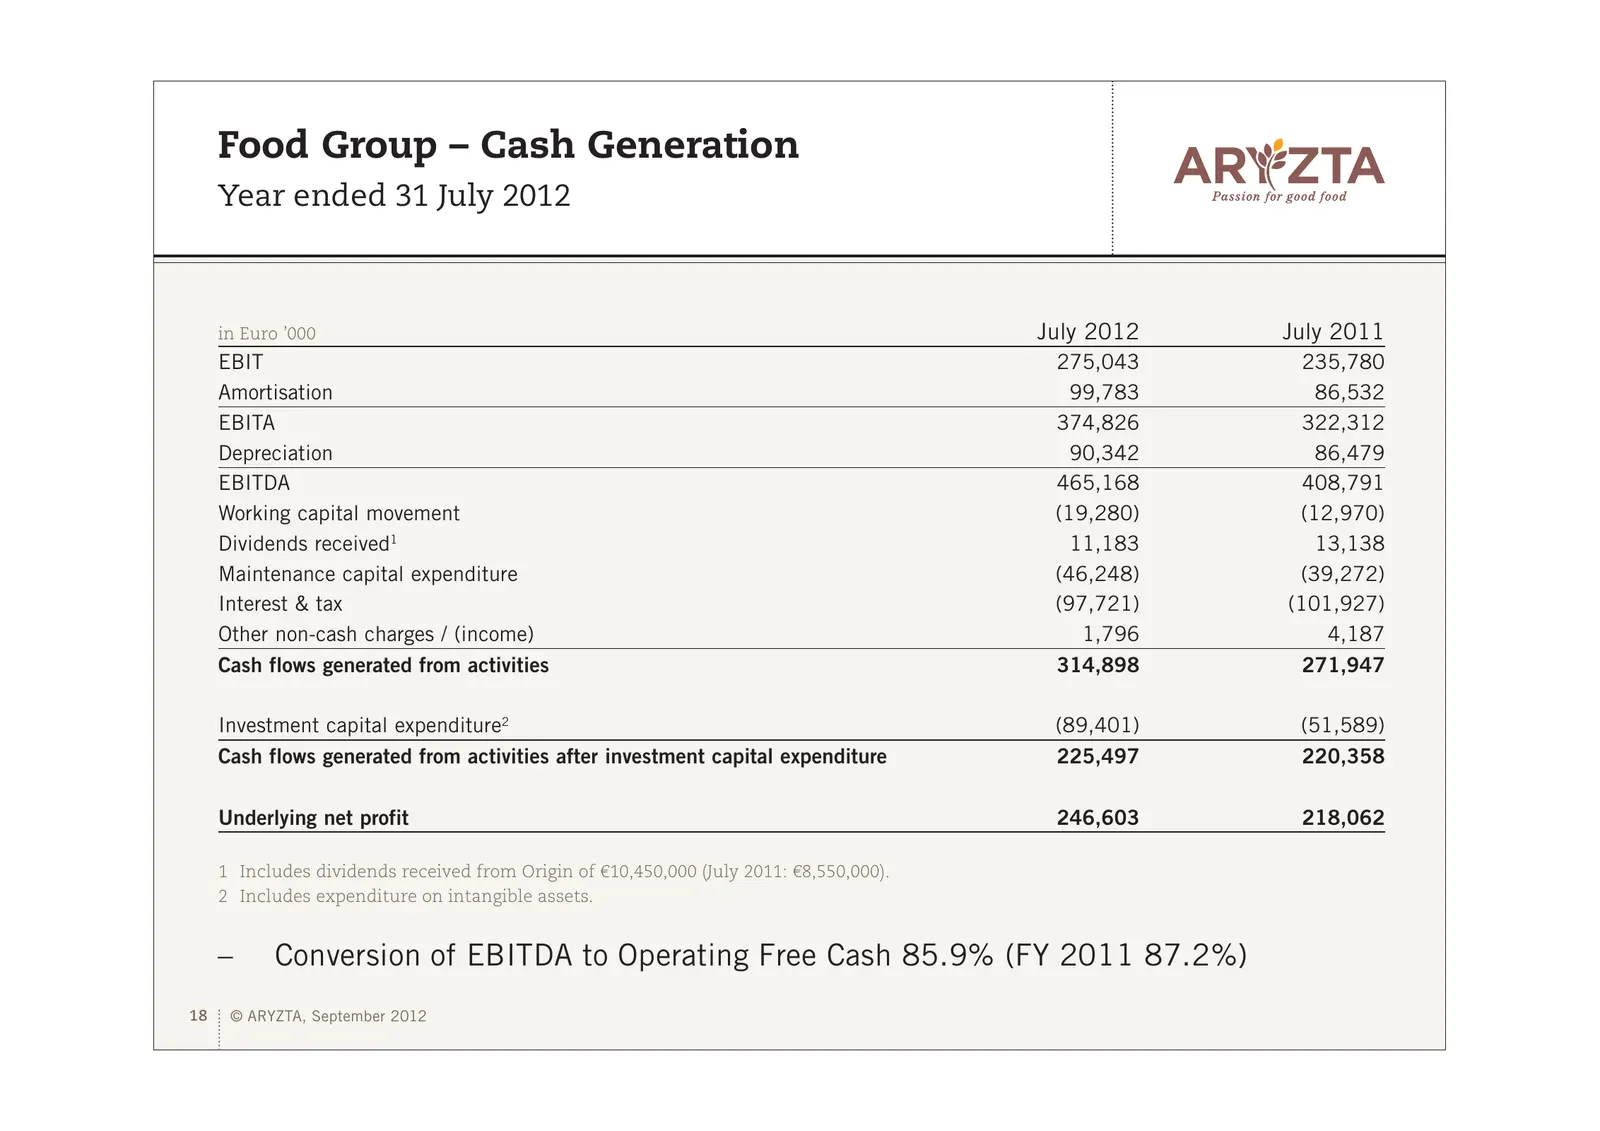
Slide 18: Food Group – Cash Generation
Food Group – Cash Generation Year ended 31 July 2012 in Euro ’000 July 2012 July 2011 EBIT 275,043 235,780 Amortisation 99,783 86,532 EBITA 374,826 322,312 Depreciation 90,342 86,479 EBITDA 465,168 408,791 Working capital movement (19,280) (12,970) Dividends received1 11,183 13,138 Maintenance capit
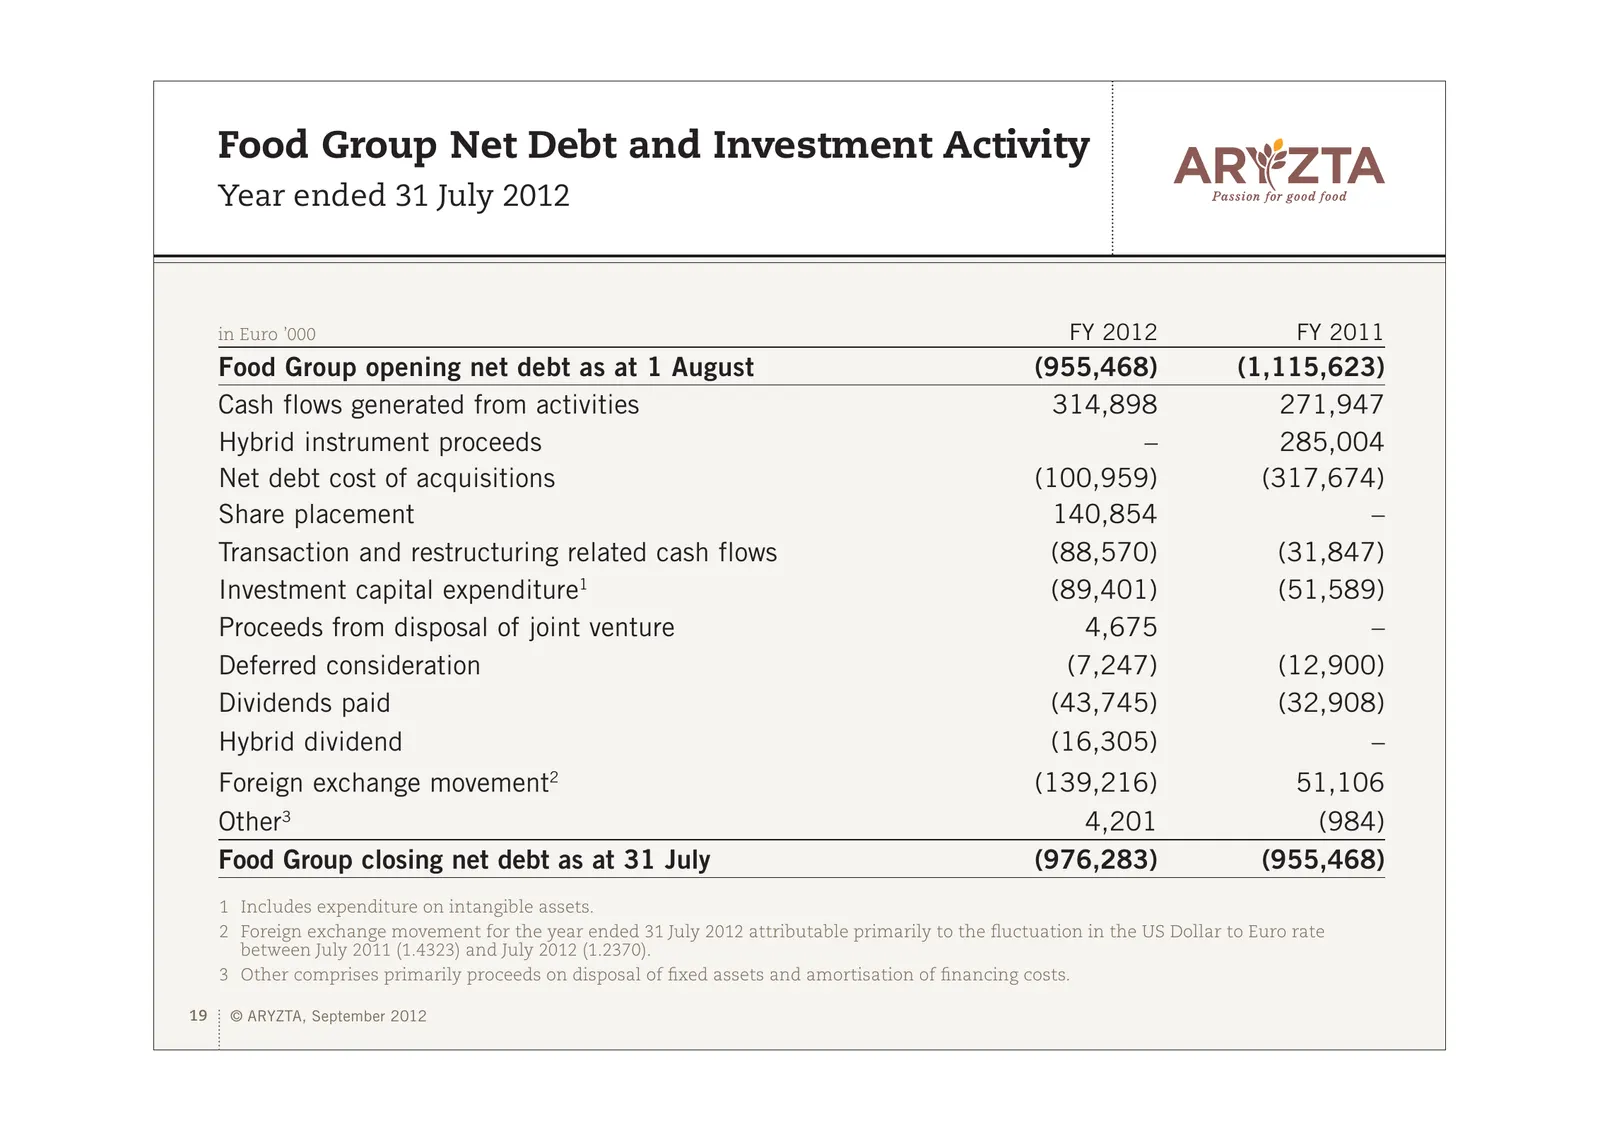
Slide 19: Food Group Net Debt and Investment Activity
Food Group Net Debt and Investment Activity Year ended 31 July 2012 in Euro ’000 FY 2012 FY 2011 Food Group opening net debt as at 1 August (955,468) (1,115,623) Cash flows generated from activities 314,898 271,947 Hybrid instrument proceeds – 285,004 Net debt cost of acquisitions (100,959) (317,674
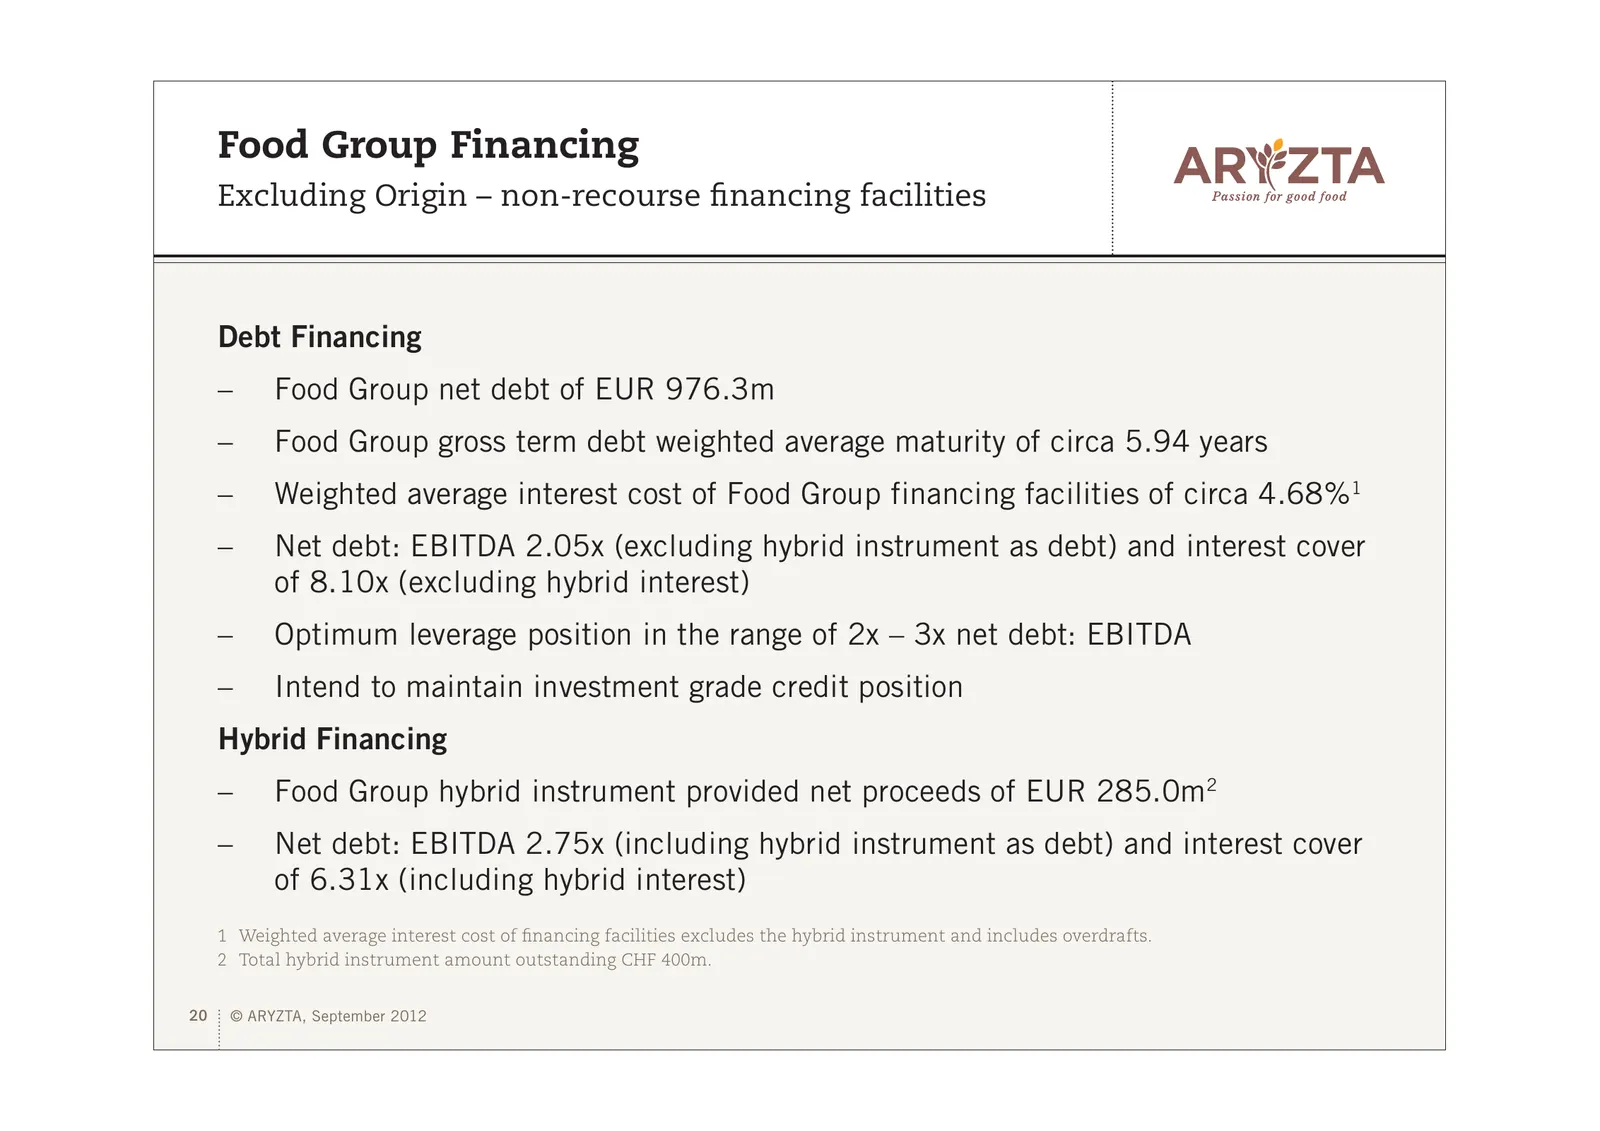
Slide 20: Food Group Financing
Food Group Financing Excluding Origin – non-recourse financing facilities Debt Financing – Food Group net debt of EUR 976.3m – Food Group gross term debt weighted average maturity of circa 5.94 years – Weighted average interest cost of Food Group financing facilities of circa 4.68%1 – Net debt: EBIT
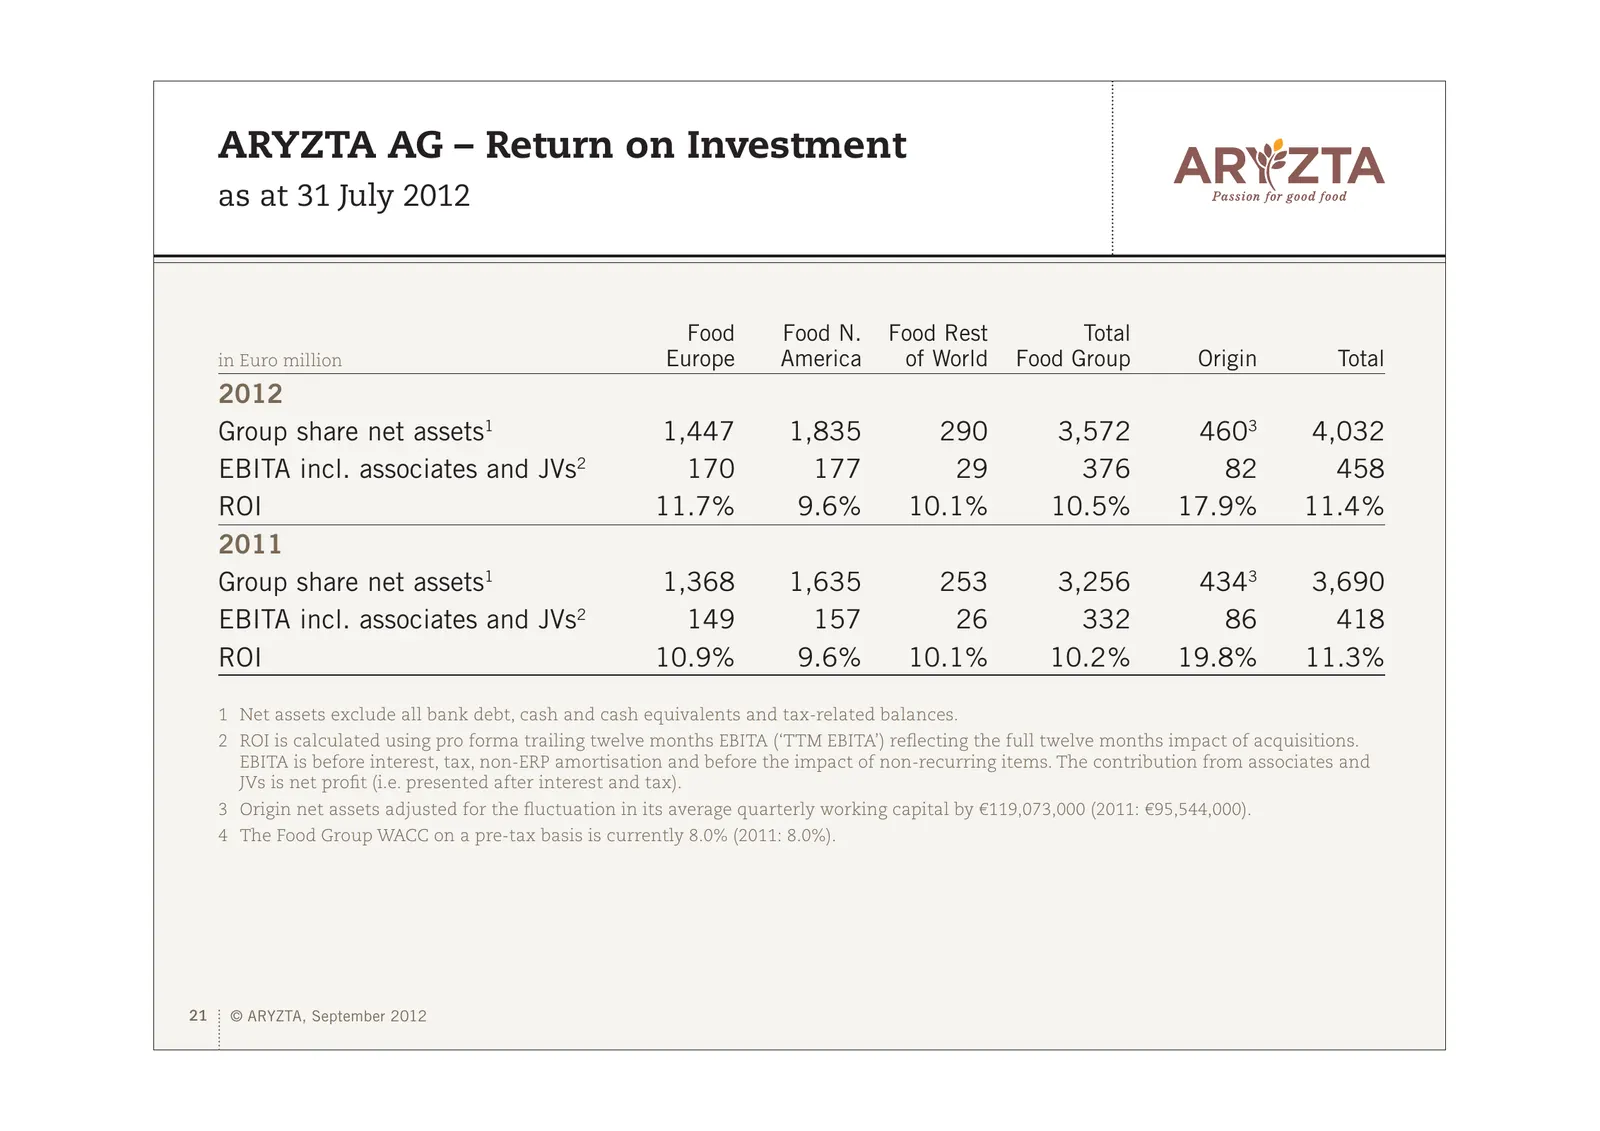
Slide 21: ARYZTA AG – Return on Investment
ARYZTA AG – Return on Investment as at 31 July 2012 Food Food N. Food Rest Total in Euro million Europe America of World Food Group Origin Total 2012 Group share net assets1 1,447 1,835 290 3,572 4603 4,032 EBITA incl. associates and JVs2 170 177 29 376 82 458 ROI 11.7% 9.6% 10.1% 10.5% 17.9% 11.4 %
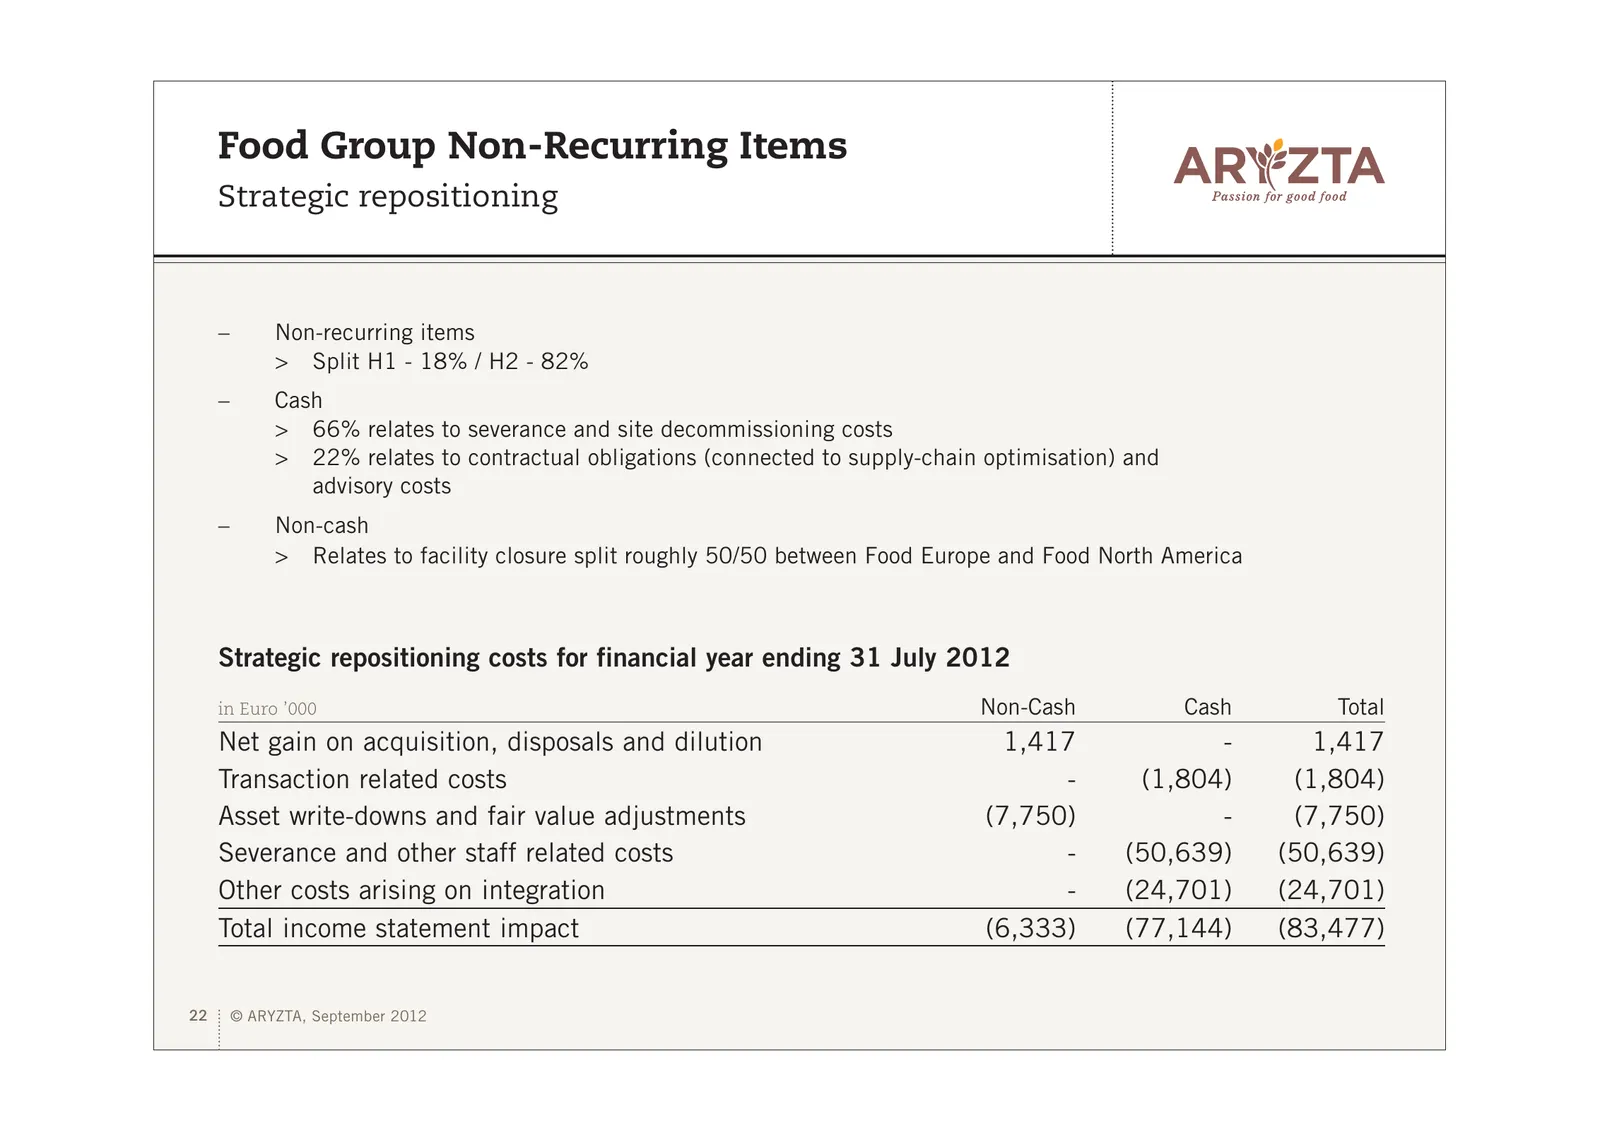
Slide 22: Food Group Non-Recurring Items
Food Group Non-Recurring Items Strategic repositioning – Non-recurring items > Split H1 - 18% / H2 - 82% – Cash > 66% relates to severance and site decommissioning costs > 22% relates to contractual obligations (connected to supply-chain optimisation) and advisory costs – Non-cash > Relates to facil
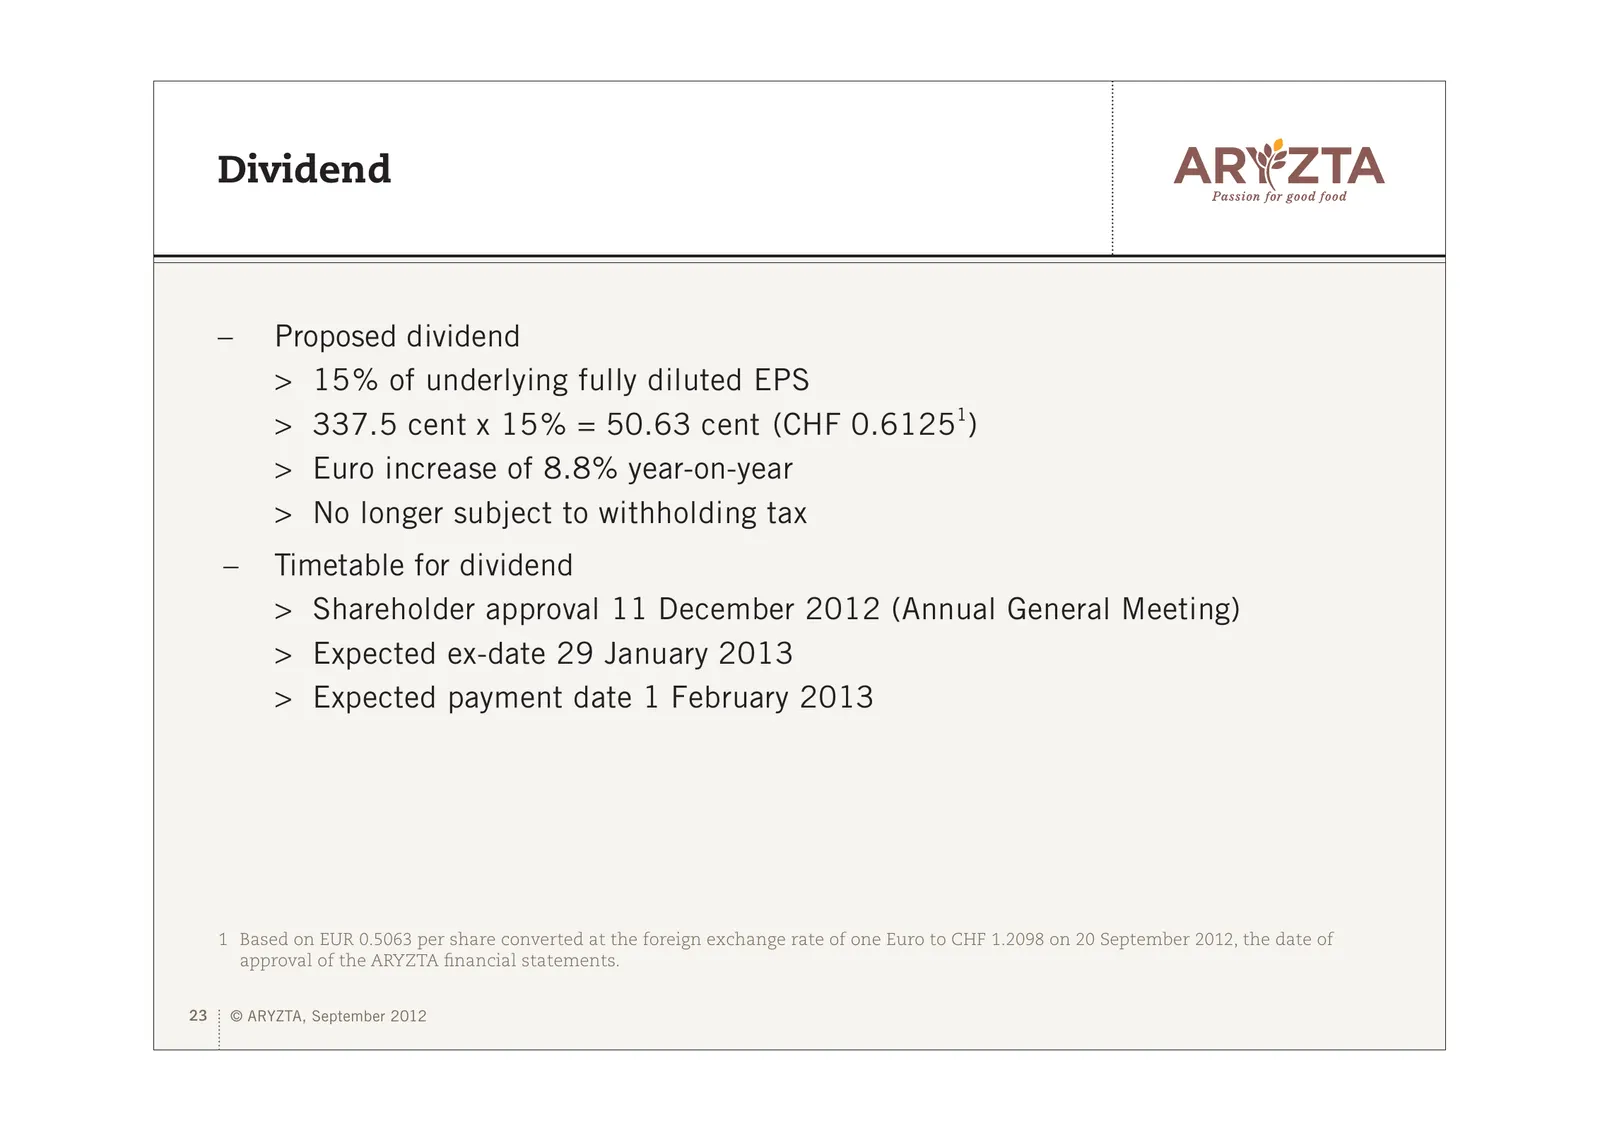
Slide 23: Dividend
Dividend – Proposed dividend > 15 % of underlying fully diluted EPS > 337.5 cent x 15 % = 50.63 cent (CHF 0.61251) > Euro increase of 8.8% year-on-year > No longer subject to withholding tax – Timetable for dividend > Shareholder approval 11 December 2012 (Annual General Meeting) > Expected ex-date
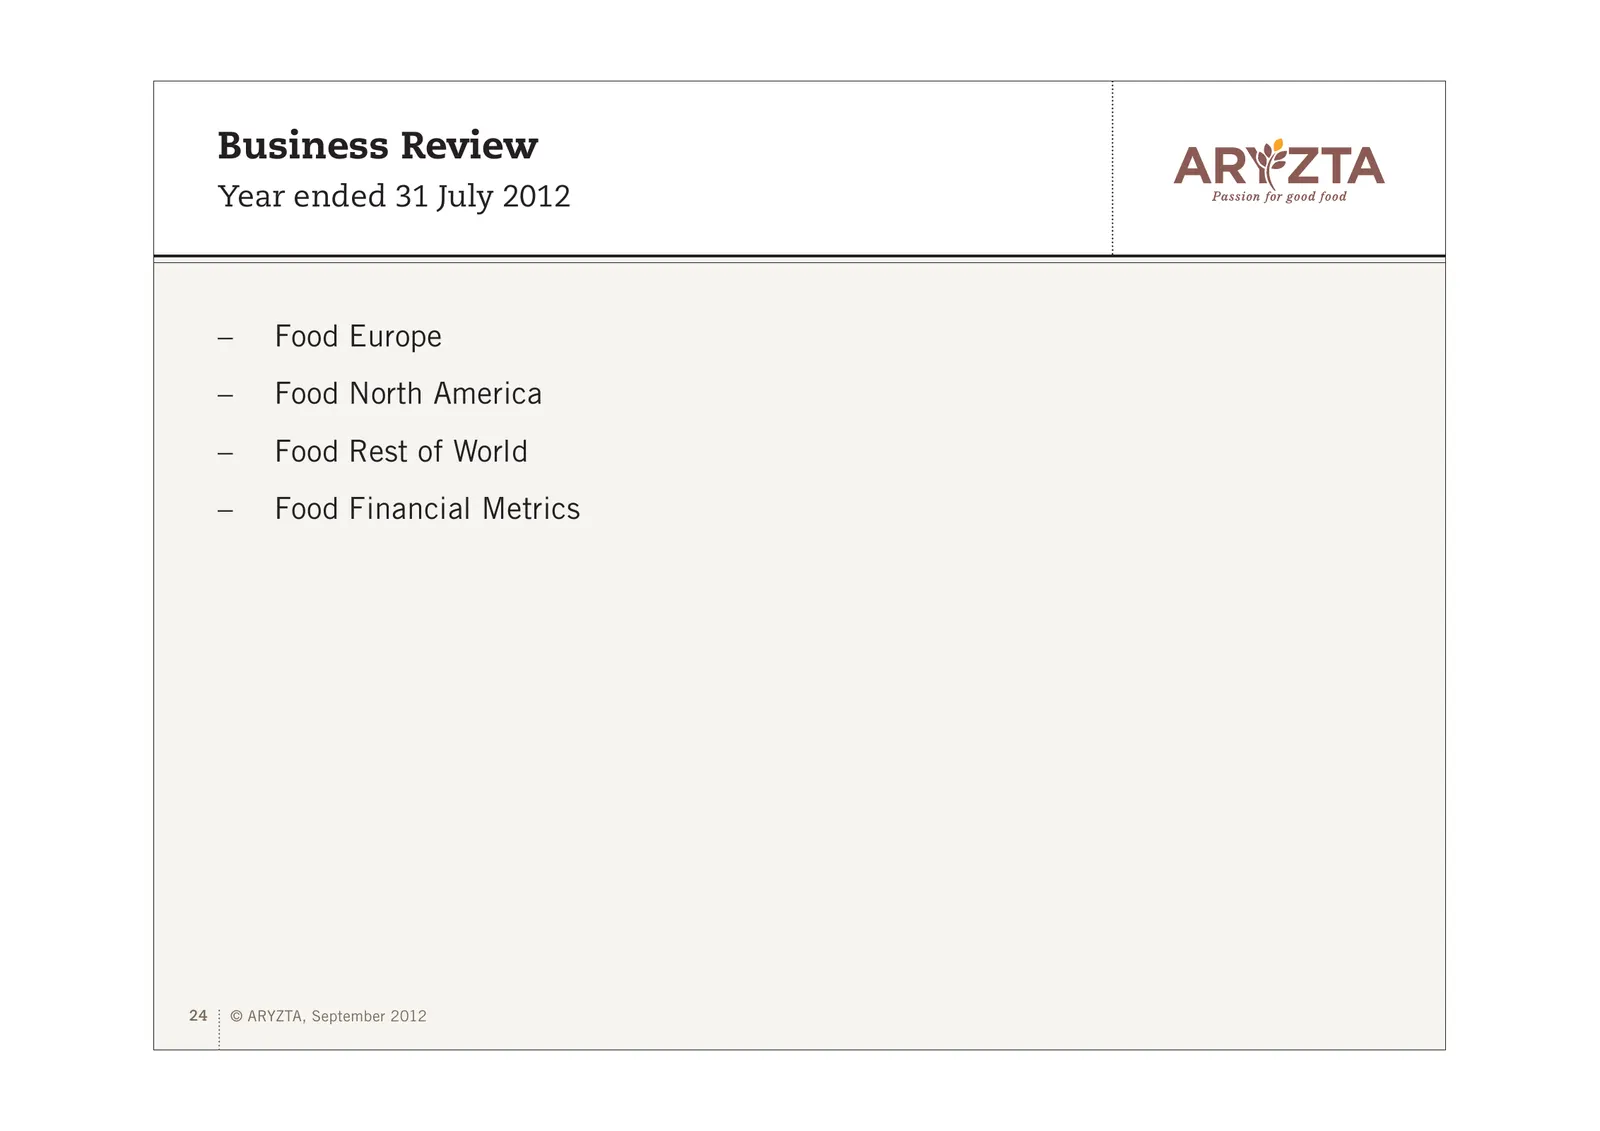
Slide 24: Business Review
Business Review Year ended 31 July 2012 – Food Europe – Food North America – Food Rest of World – Food Financial Metrics 24 © ARYZTA, September 2012
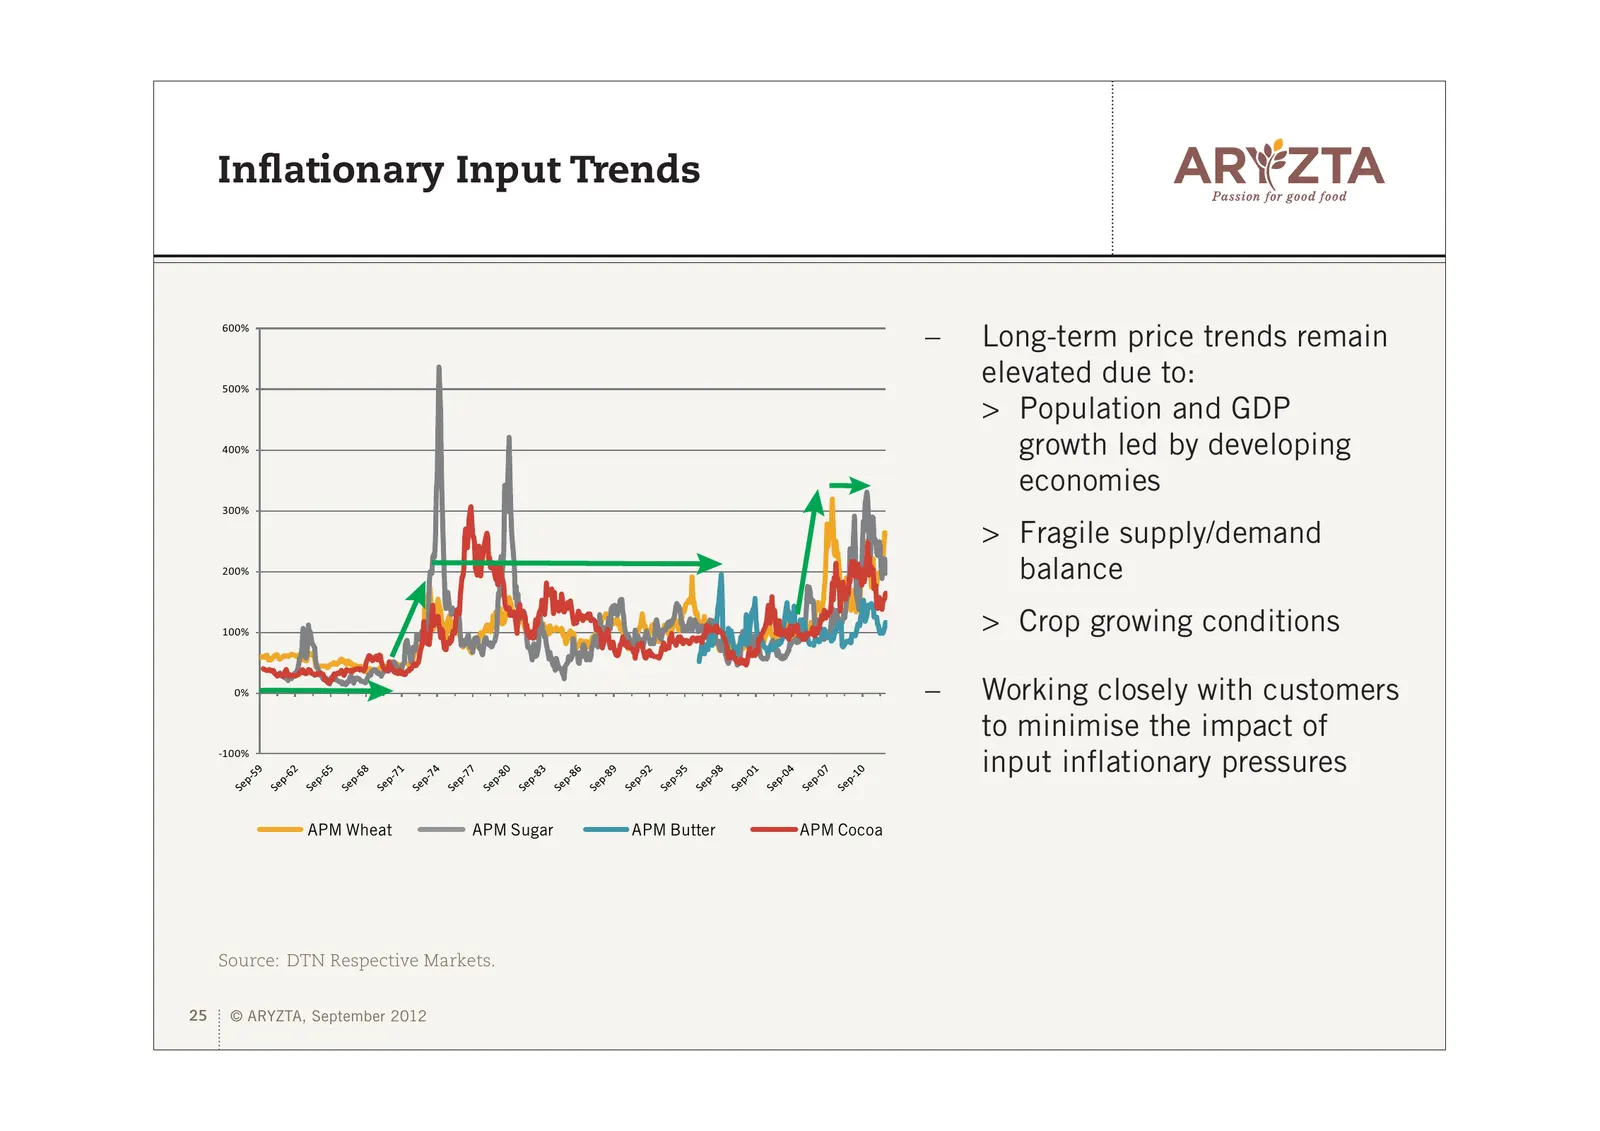
Slide 25: Inflationary Input Trends
Inflationary Input Trends 600% – Long-term price trends remain 500% elevated due to: > Population and GDP 400% growth led by developing economies 300% > Fragile supply/demand 200% balance 100% > Crop growing conditions 0% – Working closely with customers to minimise the impact of -100% input inflati
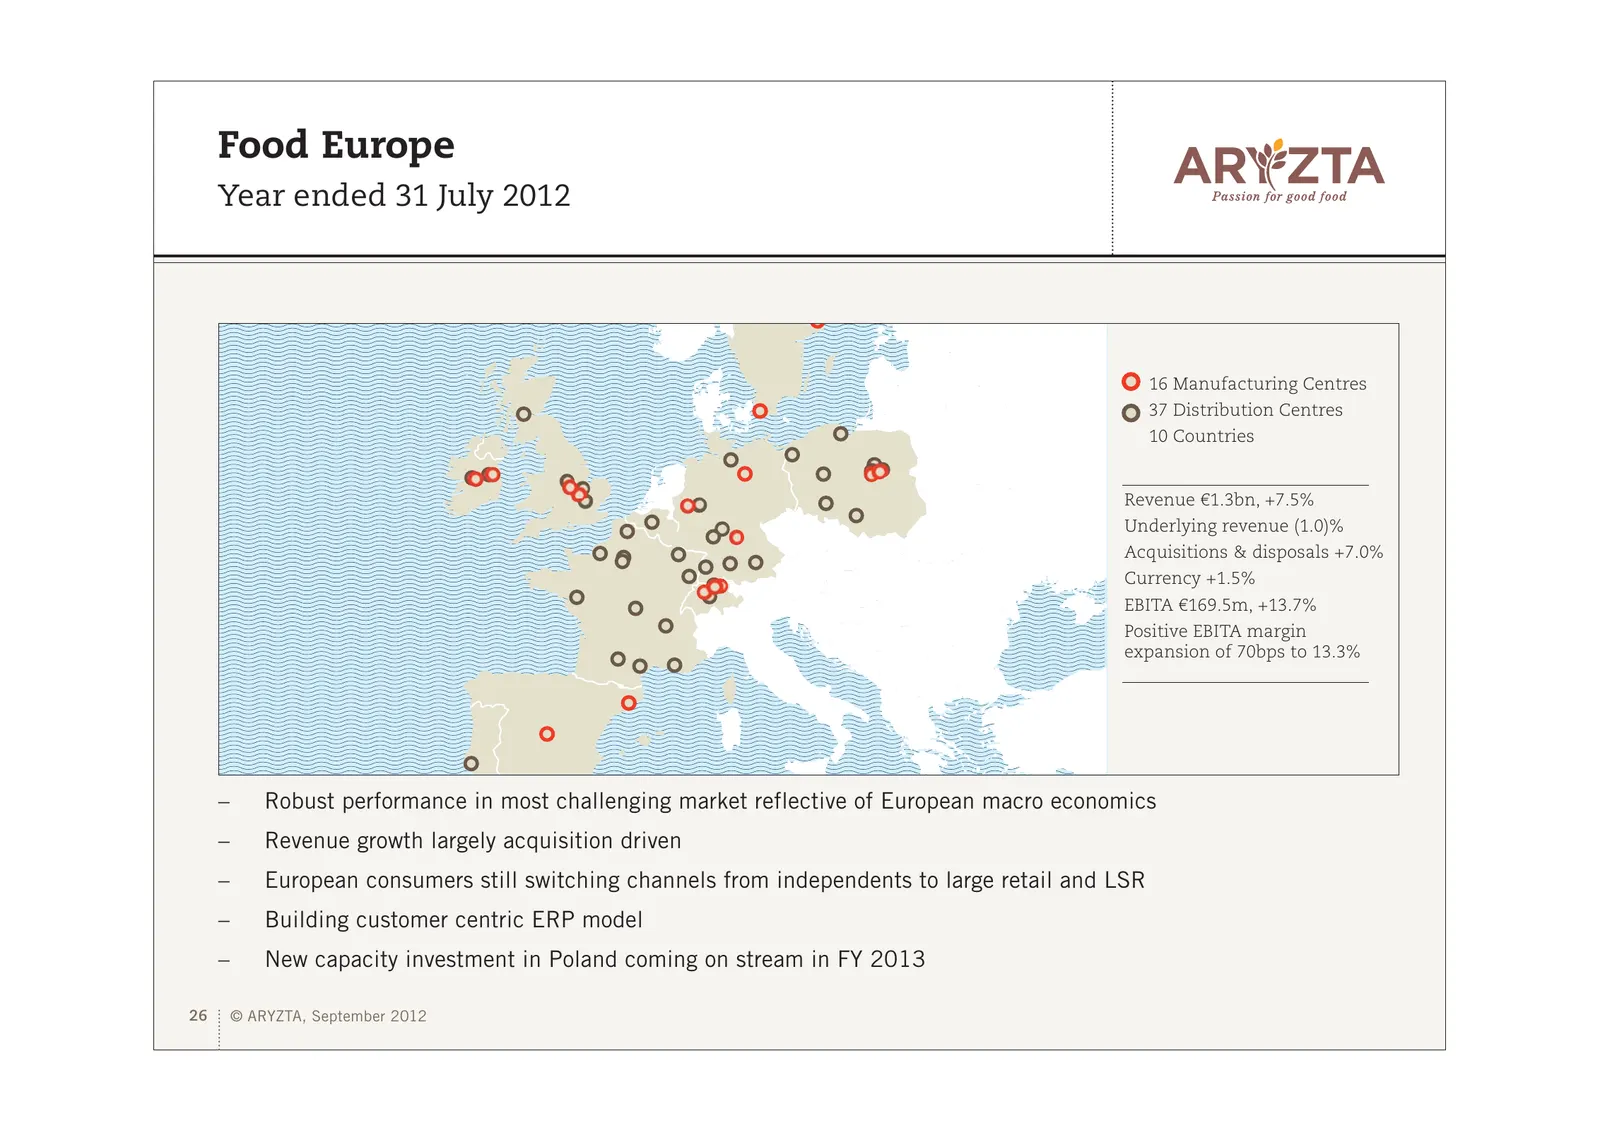
Slide 26: Food Europe
Food Europe Year ended 31 July 2012 16 Manufacturing Centres 37 Distribution Centres 10 Countries Revenue €1.3bn, +7.5% Underlying revenue (1.0)% Acquisitions & disposals +7.0% Currency +1.5% EBITA €169.5m, +13.7% Positive EBITA margin expansion of 70bps to 13.3% – Robust performance in most challen
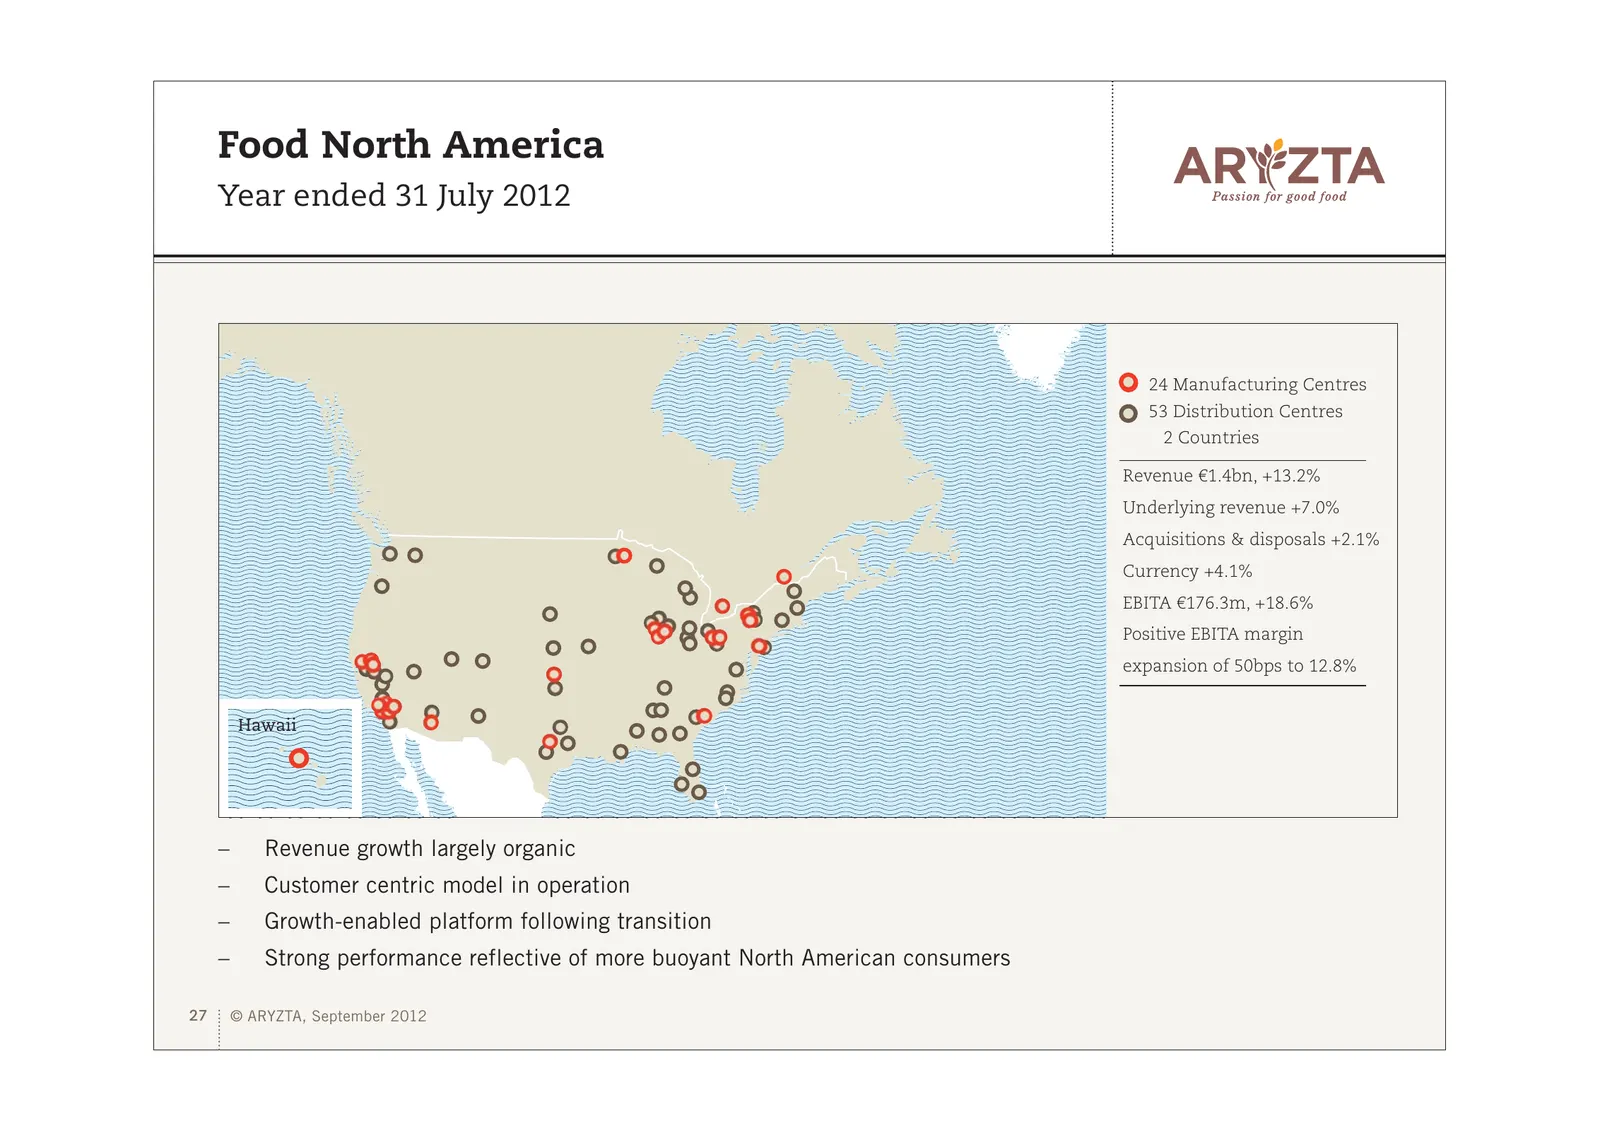
Slide 27: Food North America
Food North America Year ended 31 July 2012 24 Manufacturing Centres 53 Distribution Centres 2 Countries Revenue €1.4bn, +13.2% Underlying revenue +7.0% Acquisitions & disposals +2.1% Currency +4.1% EBITA €176.3m, +18.6% Positive EBITA margin expansion of 50bps to 12.8% Hawaii – Revenue growth largel
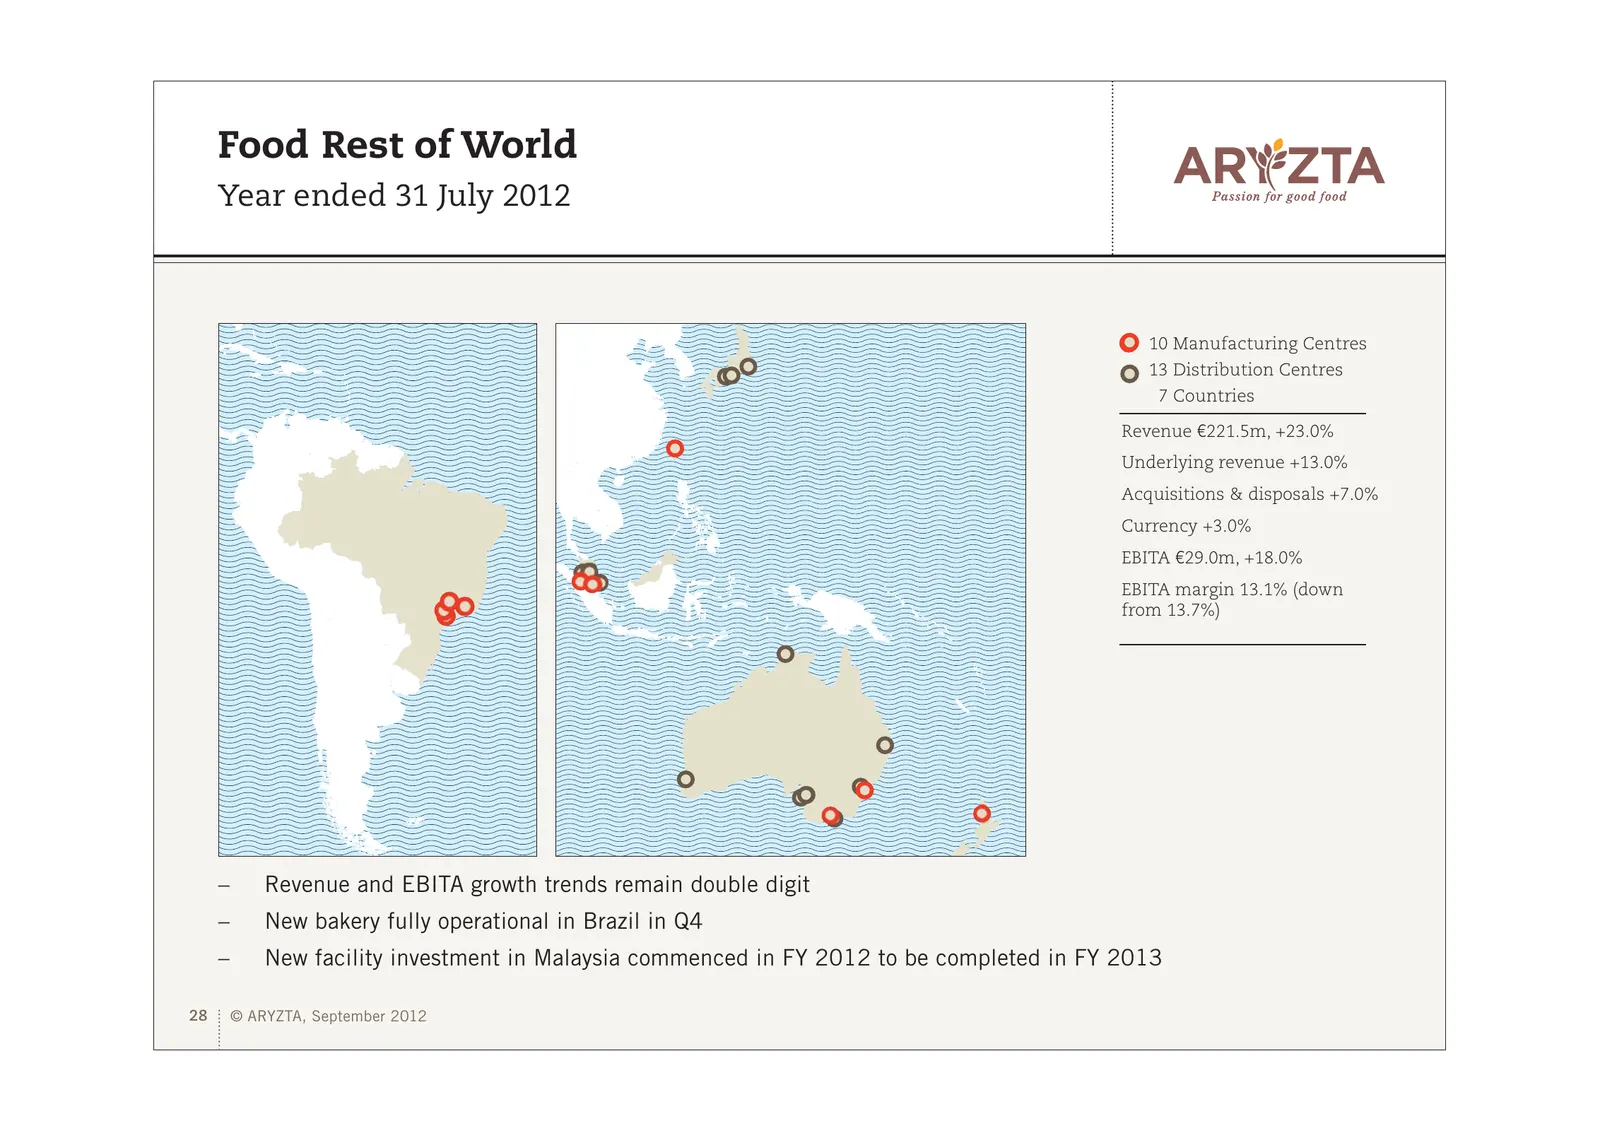
Slide 28: Food Rest of World
Food Rest of World Year ended 31 July 2012 10 Manufacturing Centres 13 Distribution Centres 7 Countries Revenue €221.5m, +23.0% Underlying revenue +13.0% Acquisitions & disposals +7.0% Currency +3.0% EBITA €29.0m, +18.0% EBITA margin 13.1% (down from 13.7%) – Revenue and EBITA growth trends remain d
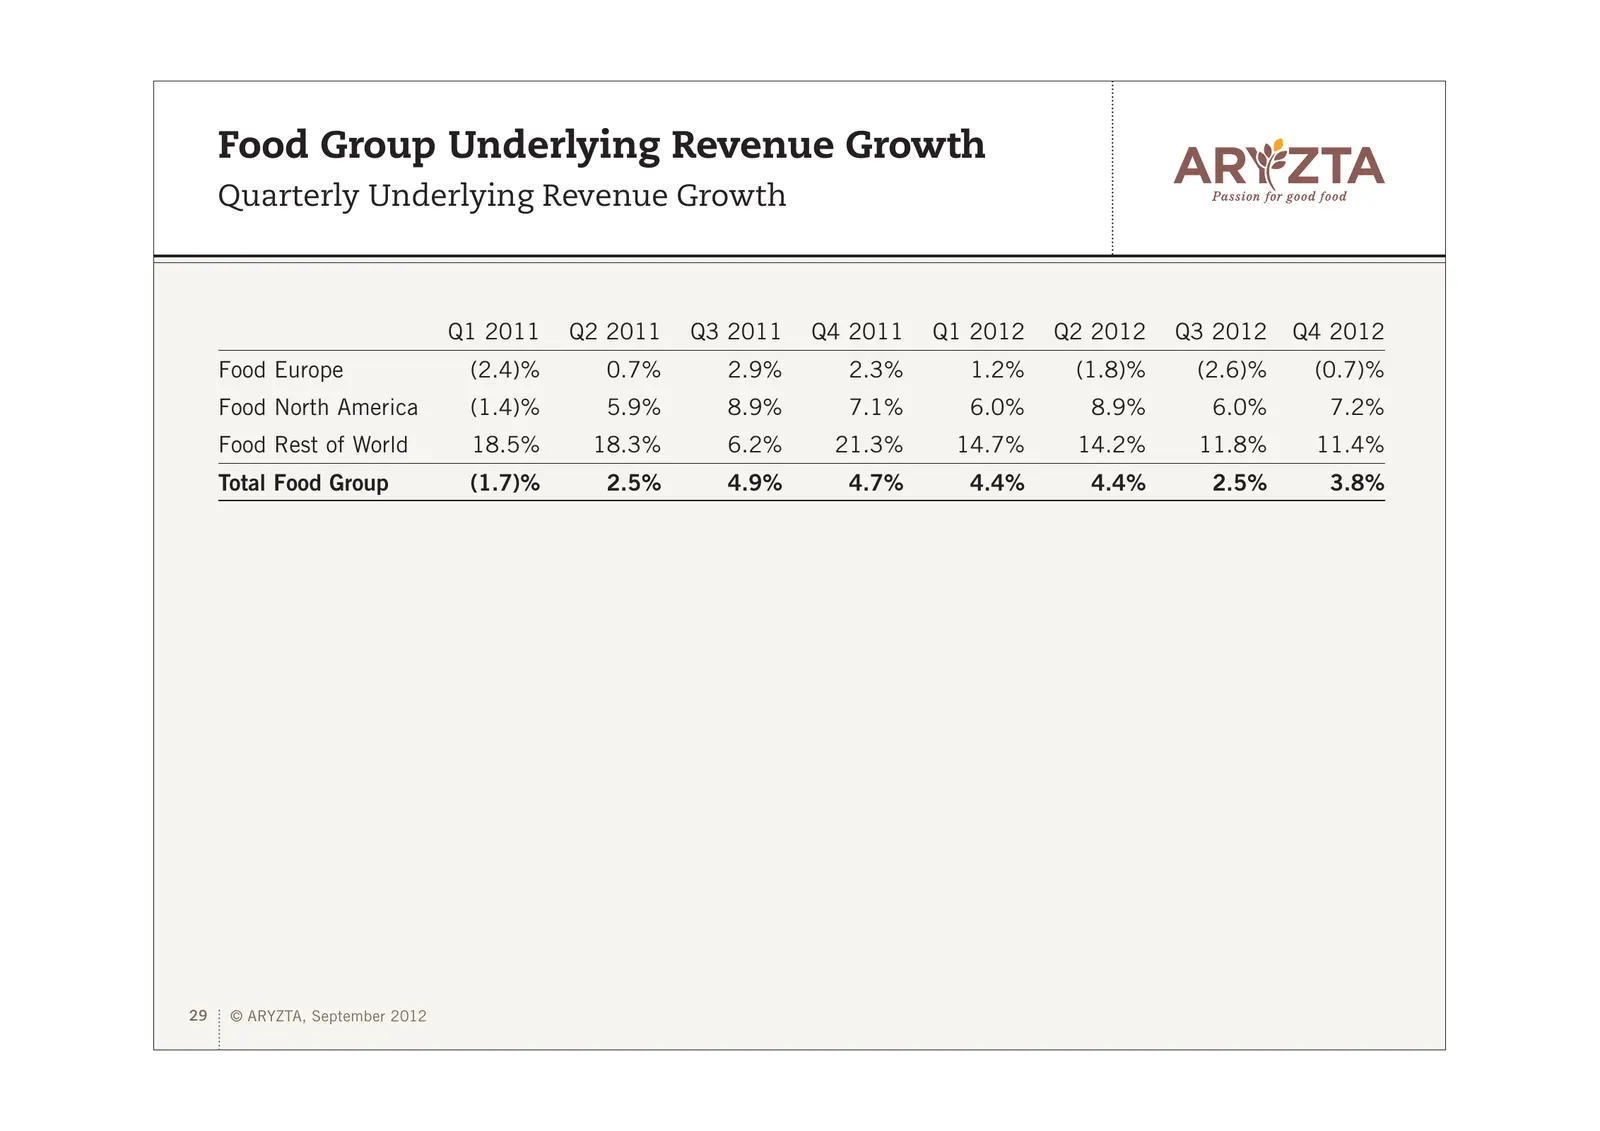
Slide 29: Food Group Underlying Revenue Growth
Food Group Underlying Revenue Growth Quarterly Underlying Revenue Growth Q1 2011 Q2 2011 Q3 2011 Q4 2011 Q1 2012 Q2 2012 Q3 2012 Q4 2012 Food Europe (2.4)% 0.7% 2.9% 2.3% 1.2% (1.8)% (2.6)% (0.7)% Food North America (1.4)% 5.9% 8.9% 7.1% 6.0% 8.9% 6.0% 7.2% Food Rest of World 18.5% 18.3% 6.2% 21.3%
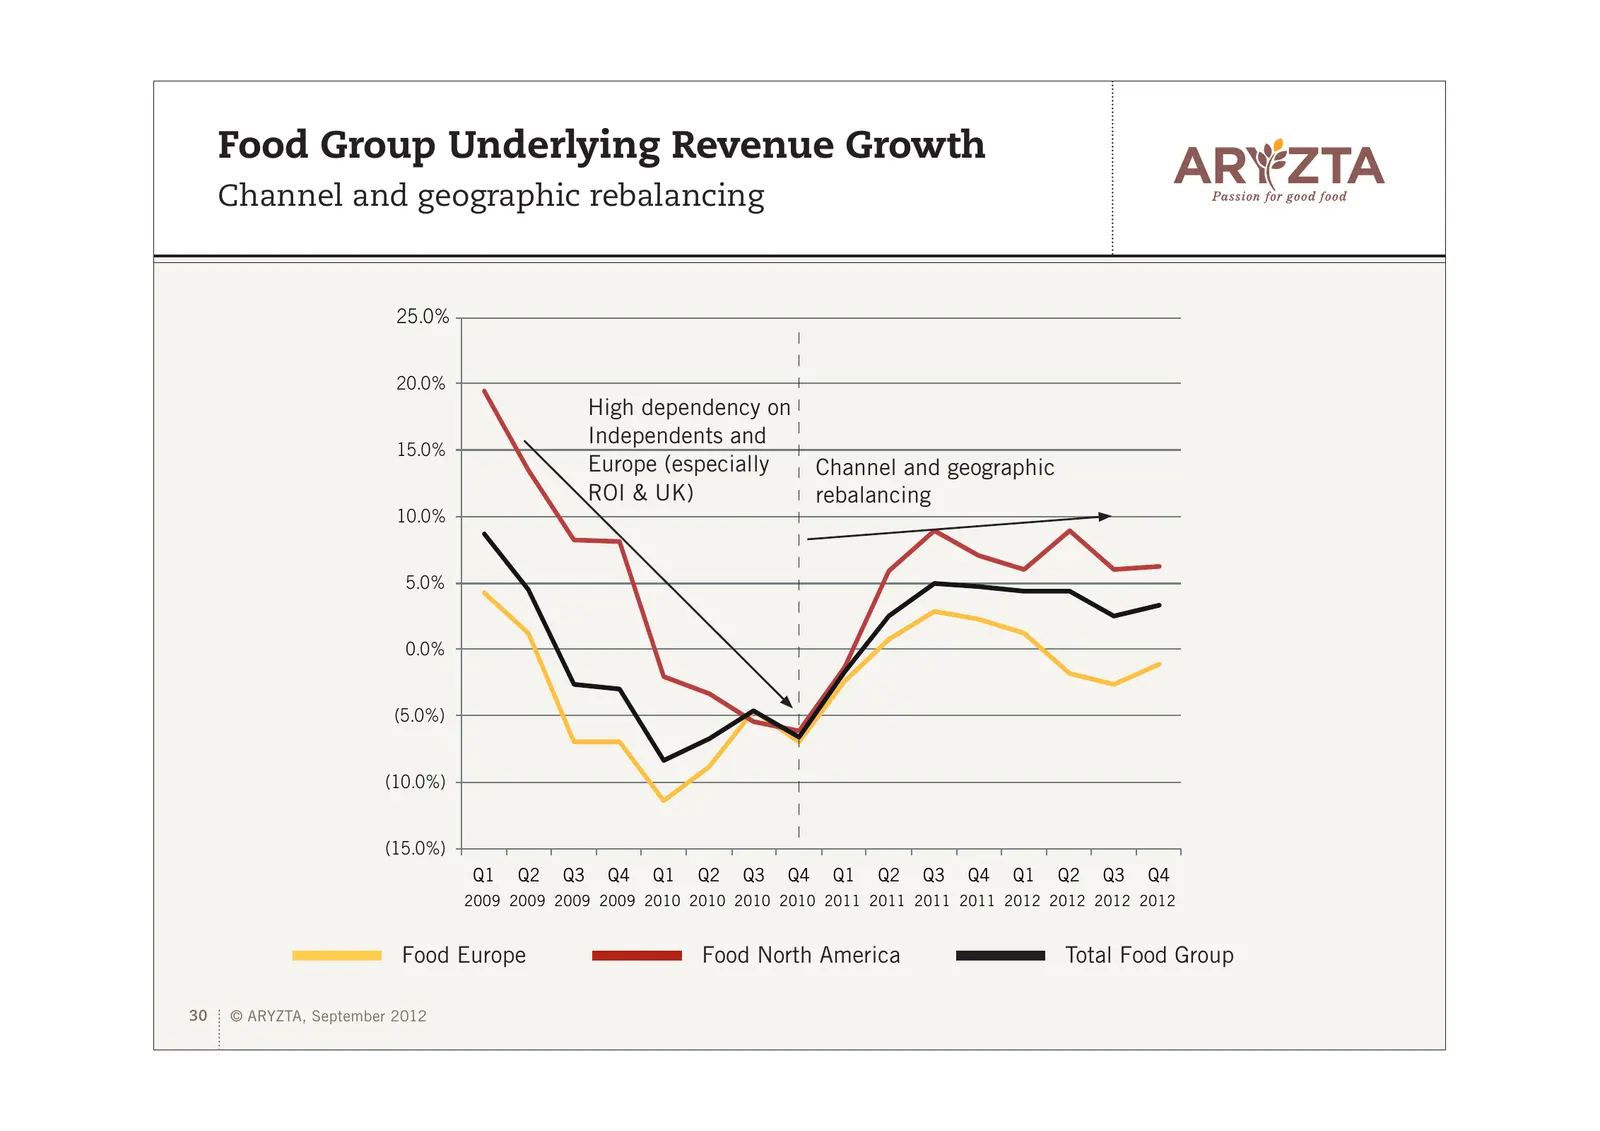
Slide 30: Food Group Underlying Revenue Growth
Food Group Underlying Revenue Growth Channel and geographic rebalancing 25.0% 20.0% High dependency on Independents and 15.0% Europe (especially Channel and geographic ROI & UK) rebalancing 10.0% 5.0% 0.0% (5.0%) (10.0%) (15.0%) Q1 Q2 Q3 Q4 Q1 Q2 Q3 Q4 Q1 Q2 Q3 Q4 Q1 Q2 Q3 Q4 2009 2009 2009 2009 201
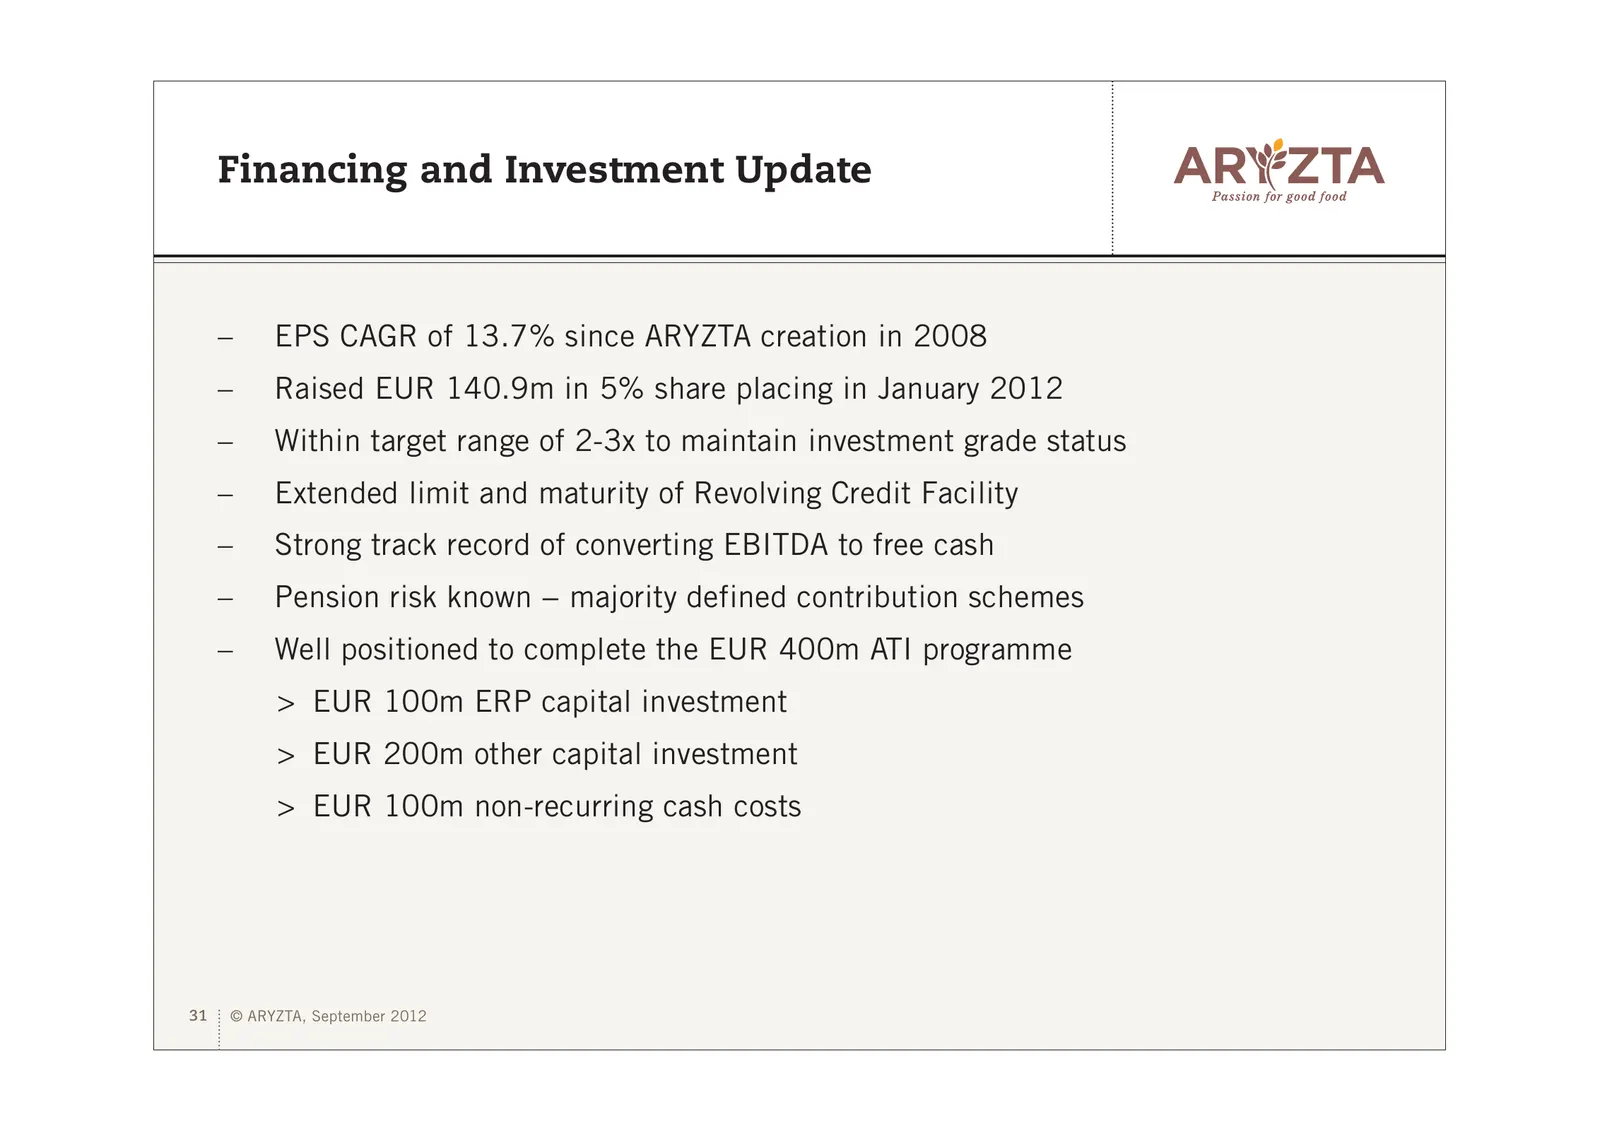
Slide 31: Financing and Investment Update
Financing and Investment Update – EPS CAGR of 13.7% since ARYZTA creation in 2008 – Raised EUR 140.9m in 5% share placing in January 2012 – Within target range of 2-3x to maintain investment grade status – Extended limit and maturity of Revolving Credit Facility – Strong track record of converting E
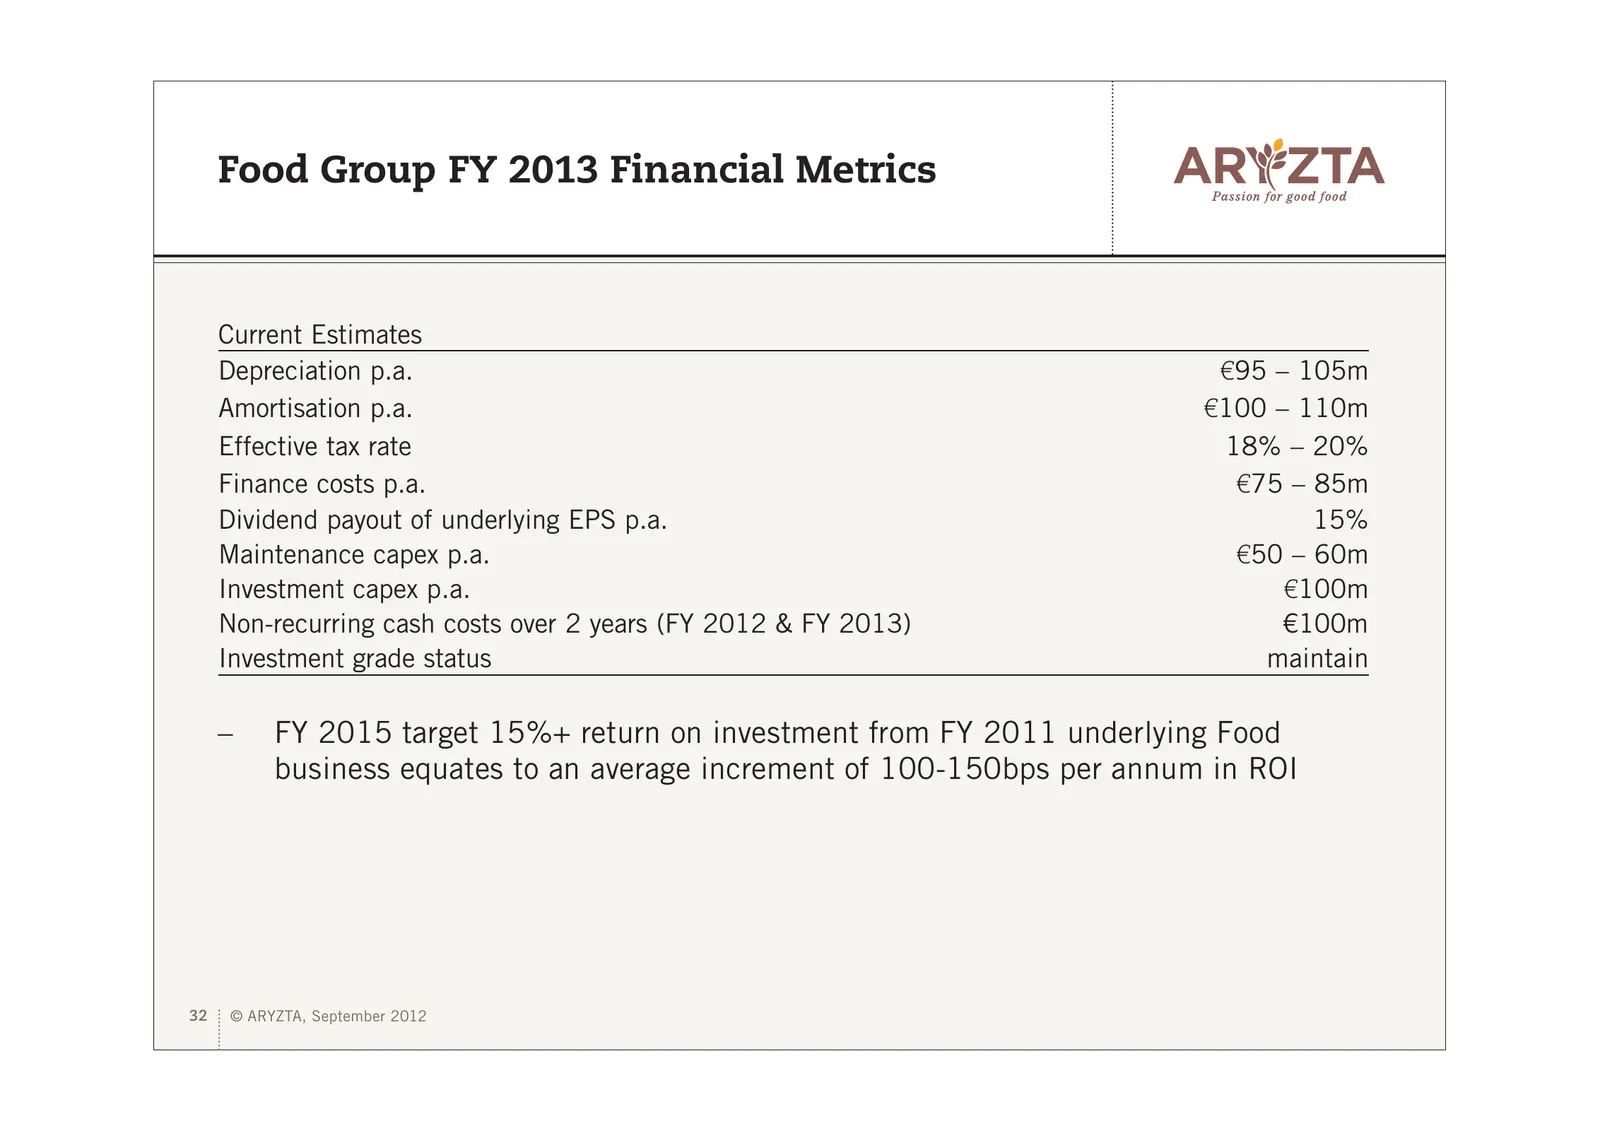
Slide 32: Food Group FY 2013 Financial Metrics
Food Group FY 2013 Financial Metrics Current Estimates Depreciation p.a. €95 – 105m Amortisation p.a. €100 – 110m Effective tax rate 18% – 20% Finance costs p.a. €75 – 85m Dividend payout of underlying EPS p.a. 15% Maintenance capex p.a. €50 – 60m Investment capex p.a. €100m Non-recurring cash costs
Slide 33: Food Group Strategic Roadmap
Food Group Strategic Roadmap 33 © ARYZTA, September 2012
Slide 34: Global Macro-Economic Conditions to Moderately Improve at a Slow Pace at Best
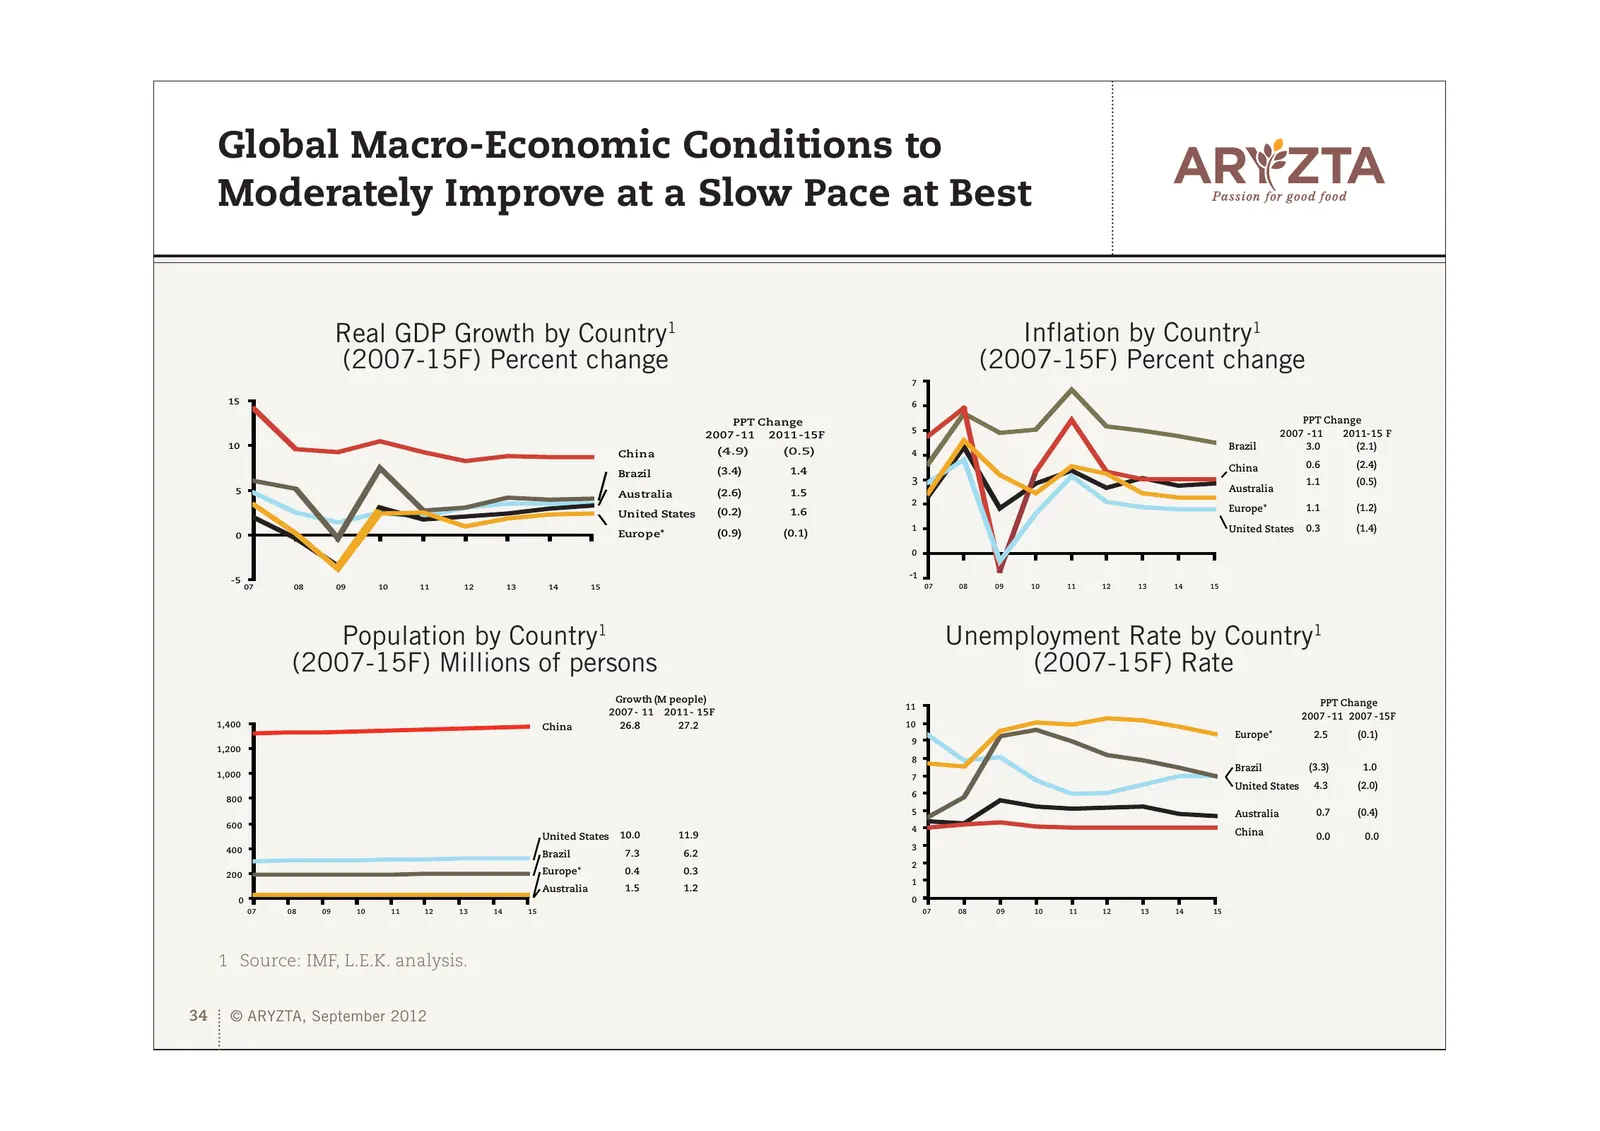
Global Macro-Economic Conditions to Moderately Improve at a Slow Pace at Best Real GDP Growth by Country1 Inflation by Country1 (2007-15F) Percent change (2007-15F) Percent change 7 15 6 PPT Change PPT Change 5 2007 -11 2011-15 F 2007 -11 2011 -15F 10 Brazil 3.0 (2.1) China (4.9) (0.5) 4 China 0.6 (
Slide 35: Prominent Food Consumption Trends
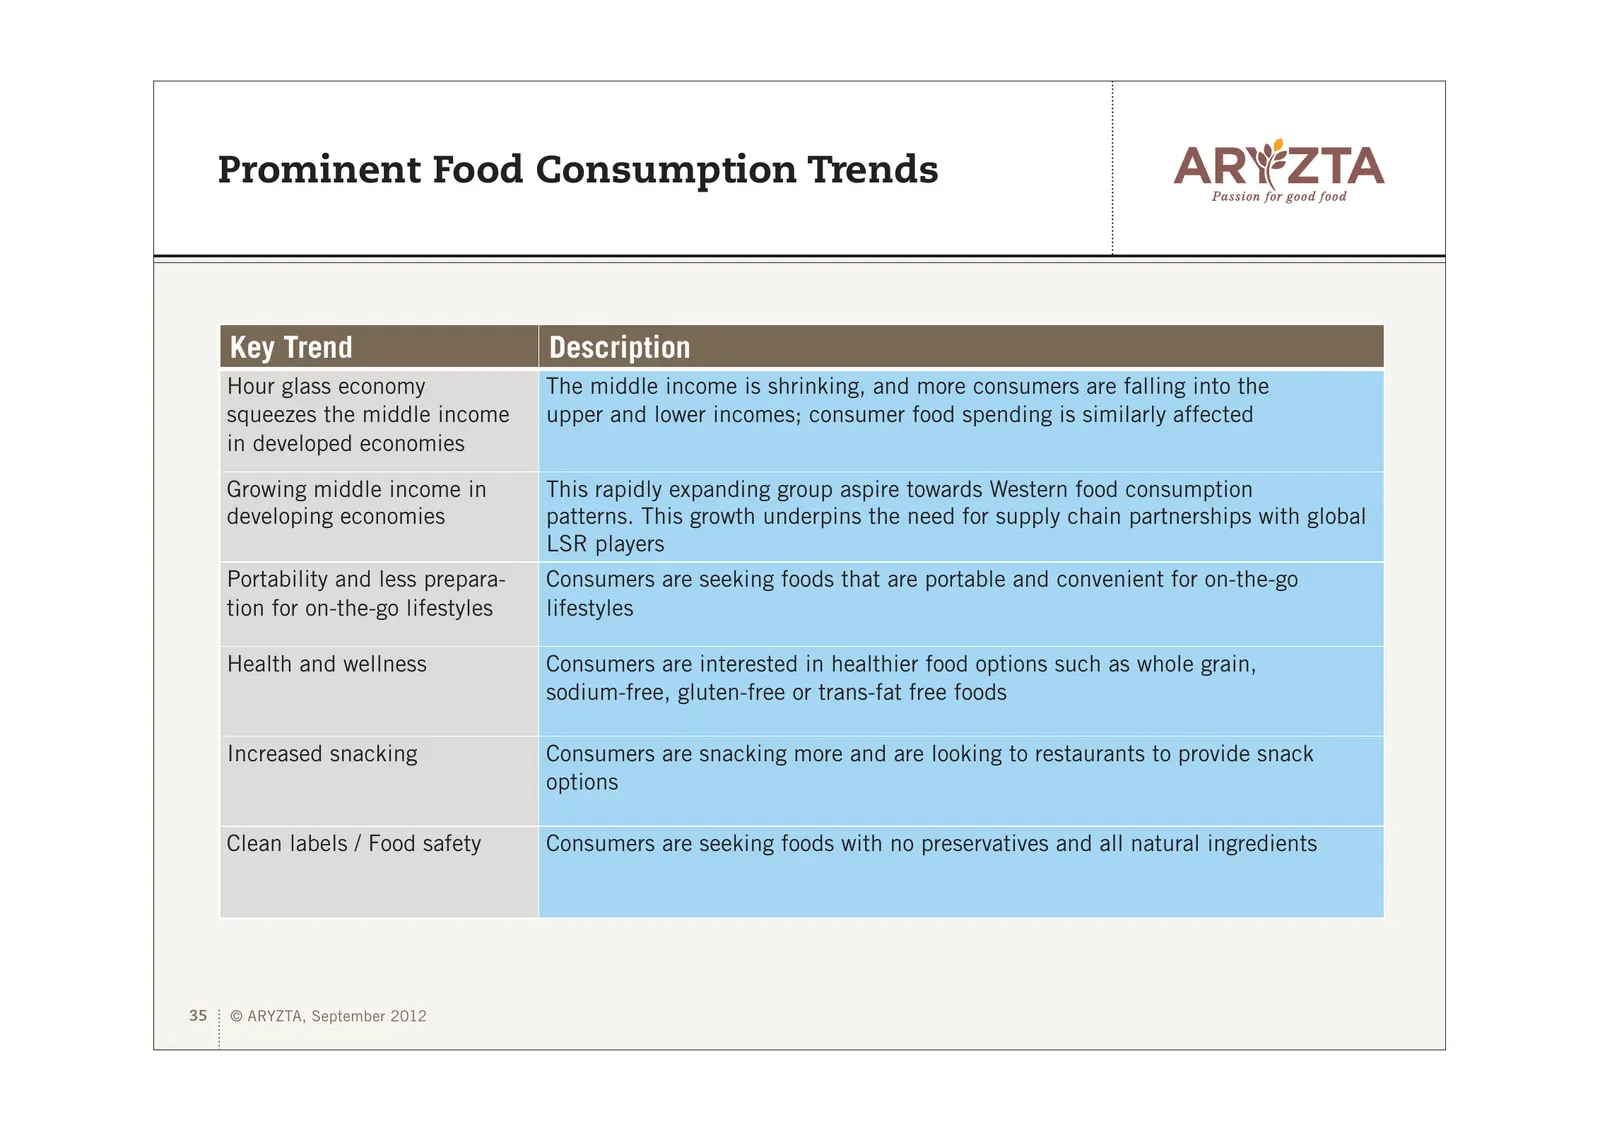
Prominent Food Consumption Trends Key Trend Description Hour glass economy The middle income is shrinking, and more consumers are falling into the squeezes the middle income upper and lower incomes; consumer food spending is similarly affected in developed economies Growing middle income in This rap
Slide 36: ARYZTA Transformation Initiative - Strategy
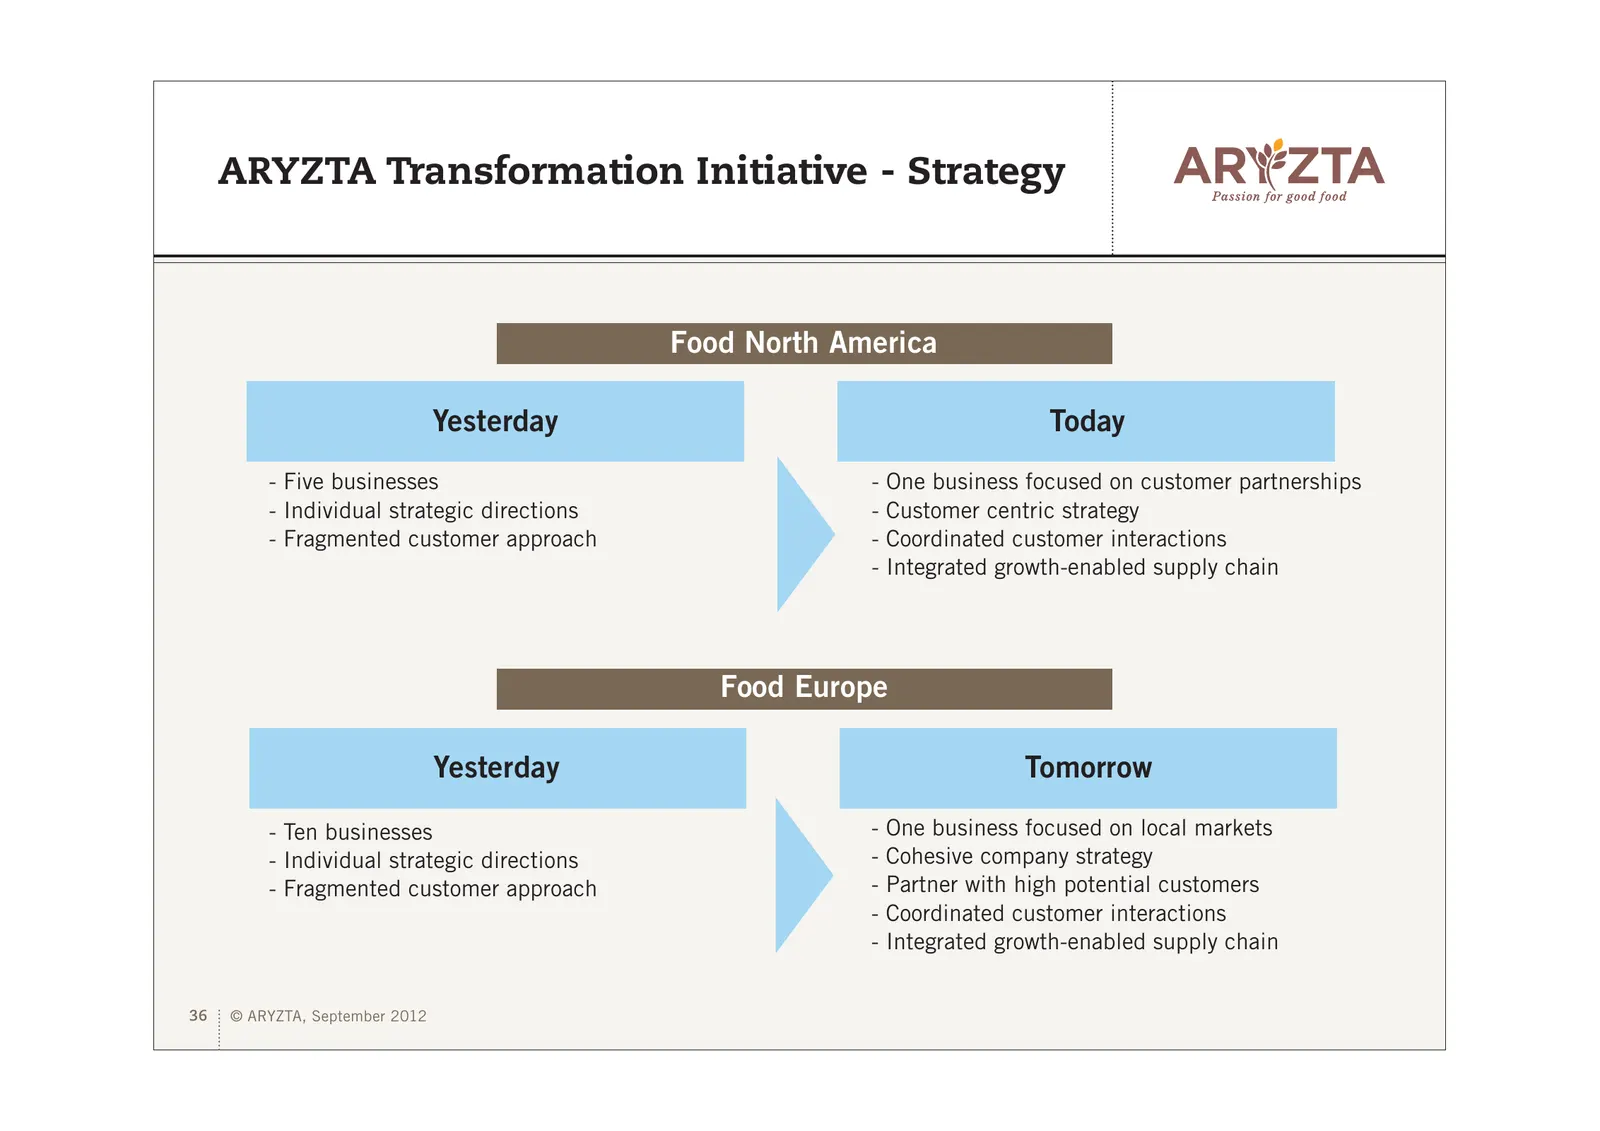
ARYZTA Transformation Initiative - Strategy Food North America Yesterday Today - Five businesses - One business focused on customer partnerships - Individual strategic directions - Customer centric strategy - Fragmented customer approach - Coordinated customer interactions - Integrated growth-enable
Slide 37: ARYZTA Transformation Initiative – Revenue Focus
ARYZTA Transformation Initiative – Revenue Focus – Consumer insights drive strategy – Customer centric business model with single point-of-sales contact – Food development plan around key customers – Comprehensive suite of business support functions identified – Cross functional teams unlock ARYZTA
Slide 38: ARYZTA Transformation Initiative – Progress Update
ARYZTA Transformation Initiative – Progress Update – Excellent management engagement especially in North America – Unlocking real talent pool across the business – Positive engagement with customers – Single instance ERP performing to expectation – Transformation is work in progress – more than half
Slide 39: Outlook
Outlook – Consumer sentiment is weak, especially in Europe – Food inflation is resurgent – Focus is firmly on completing internal transformation programme – Guidance is to grow fully diluted EPS between 5-10% in FY 2013 – Target to deliver 15% ROI on underlying Food assets by FY 2015 remains valid –
Slide 40: Appendix – Origin Financials
ARYZTA AG Appendix 1 – Origin Financials 40 © ARYZTA, September 2012
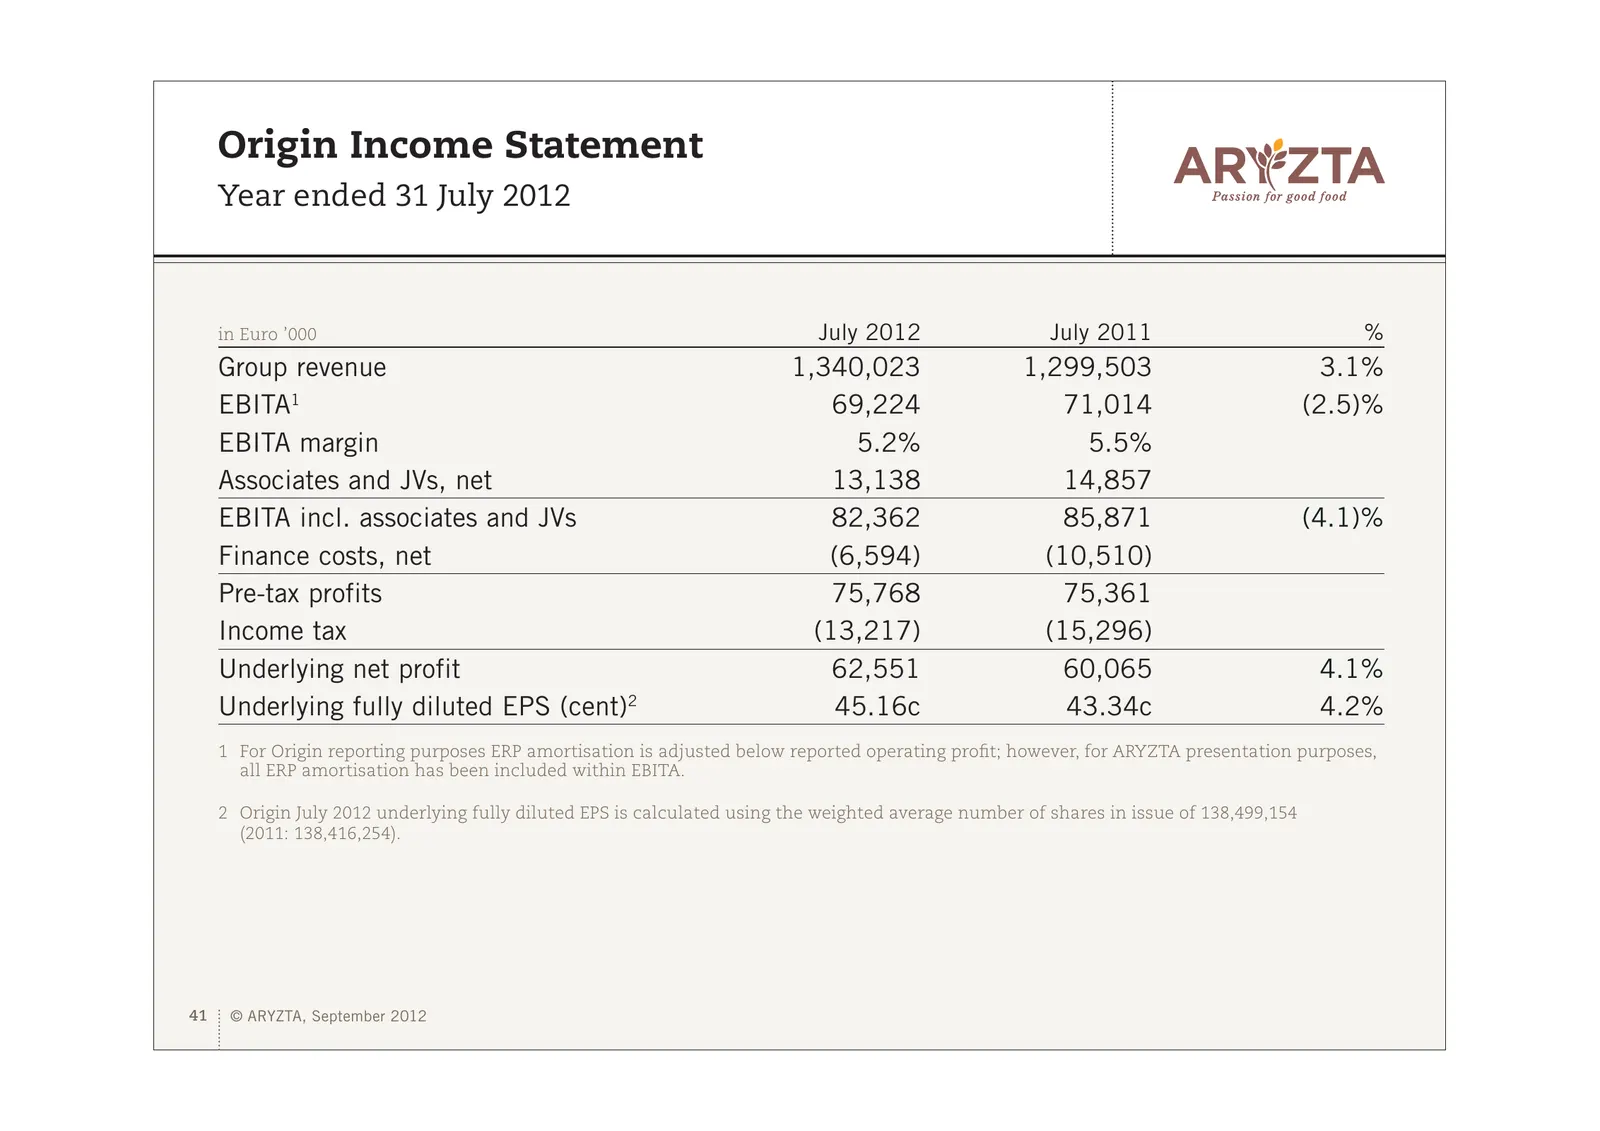
Slide 41: Origin Income Statement
Origin Income Statement Year ended 31 July 2012 in Euro ’000 July 2012 July 2011 % Group revenue 1,340,023 1,299,503 3.1% EBITA1 69,224 71,014 (2.5)% EBITA margin 5.2% 5.5% Associates and JVs, net 13,138 14,857 EBITA incl. associates and JVs 82,362 85,871 (4.1)% Finance costs, net (6,594) (10,510) P
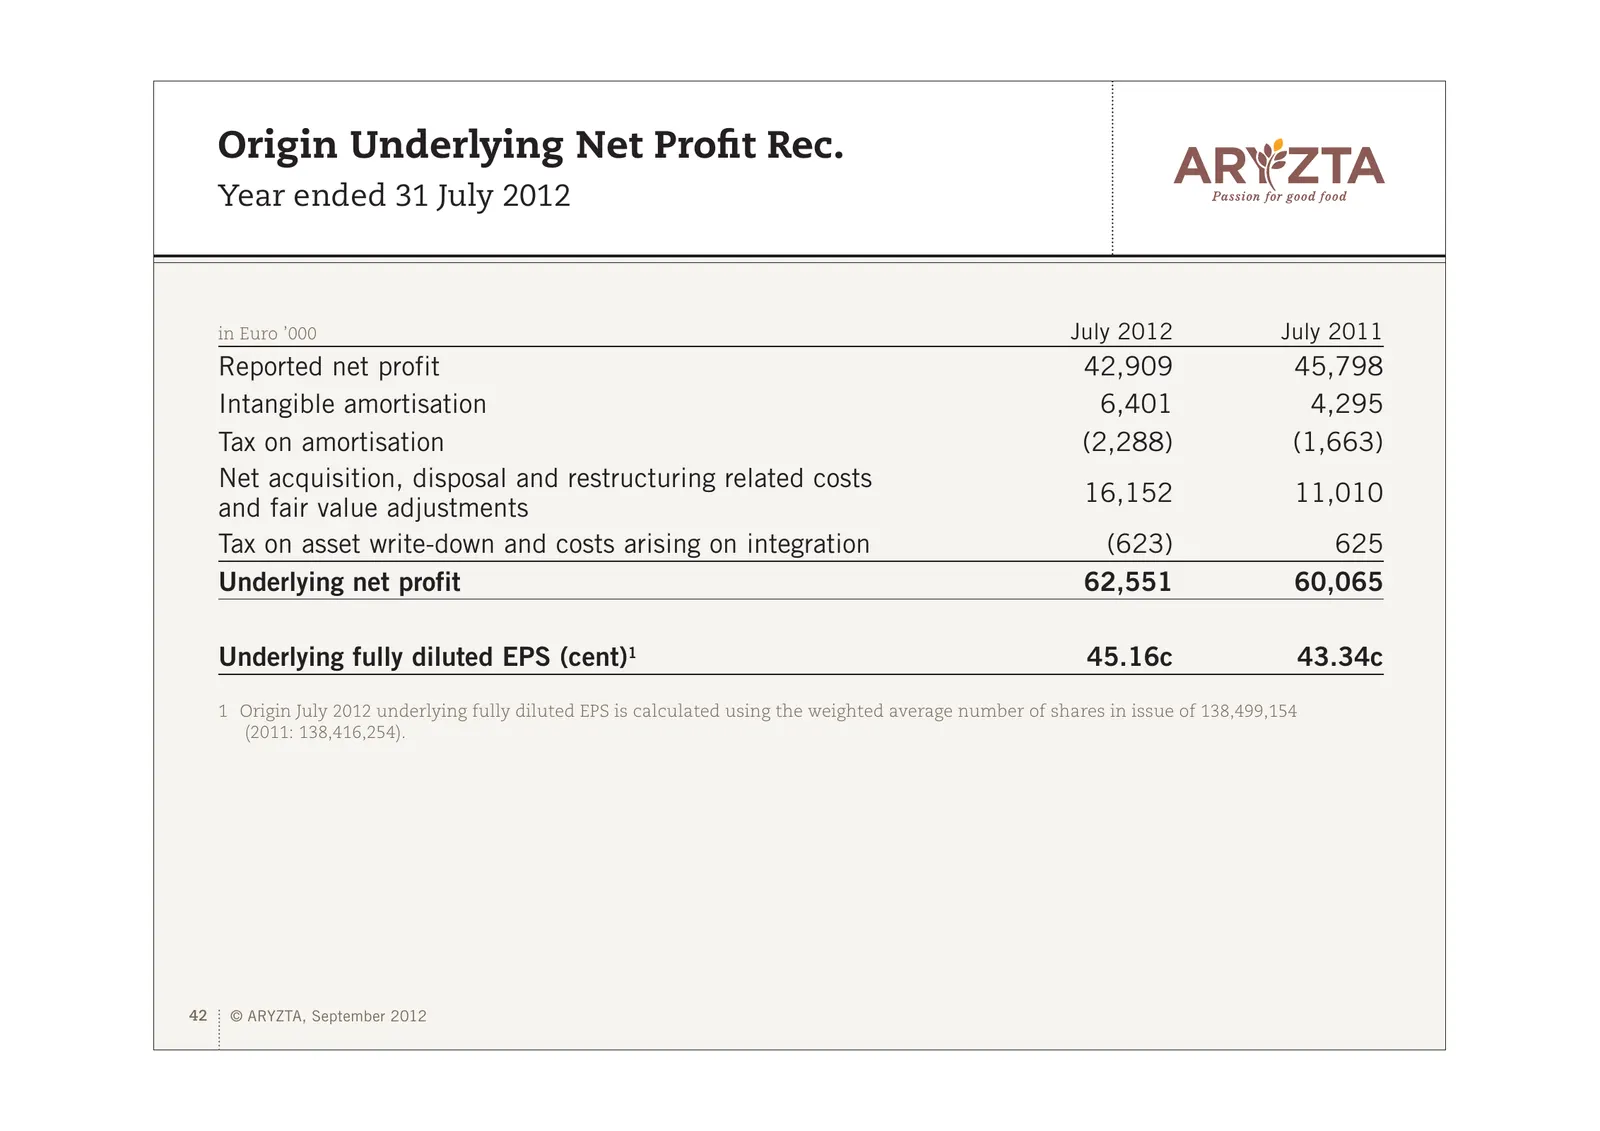
Slide 42: Origin Underlying Net Profit Rec.
Origin Underlying Net Profit Rec. Year ended 31 July 2012 in Euro ’000 July 2012 July 2011 Reported net profit 42,909 45,798 Intangible amortisation 6,401 4,295 Tax on amortisation (2,288) (1,663) Net acquisition, disposal and restructuring related costs 16,152 11,010 and fair value adjustments Tax
Slide 43: Appendix – Other Financial Information and Presentation Glossary
ARYZTA AG Appendix 2 – Other Financial Information and Presentation Glossary 43 © ARYZTA, September 2012
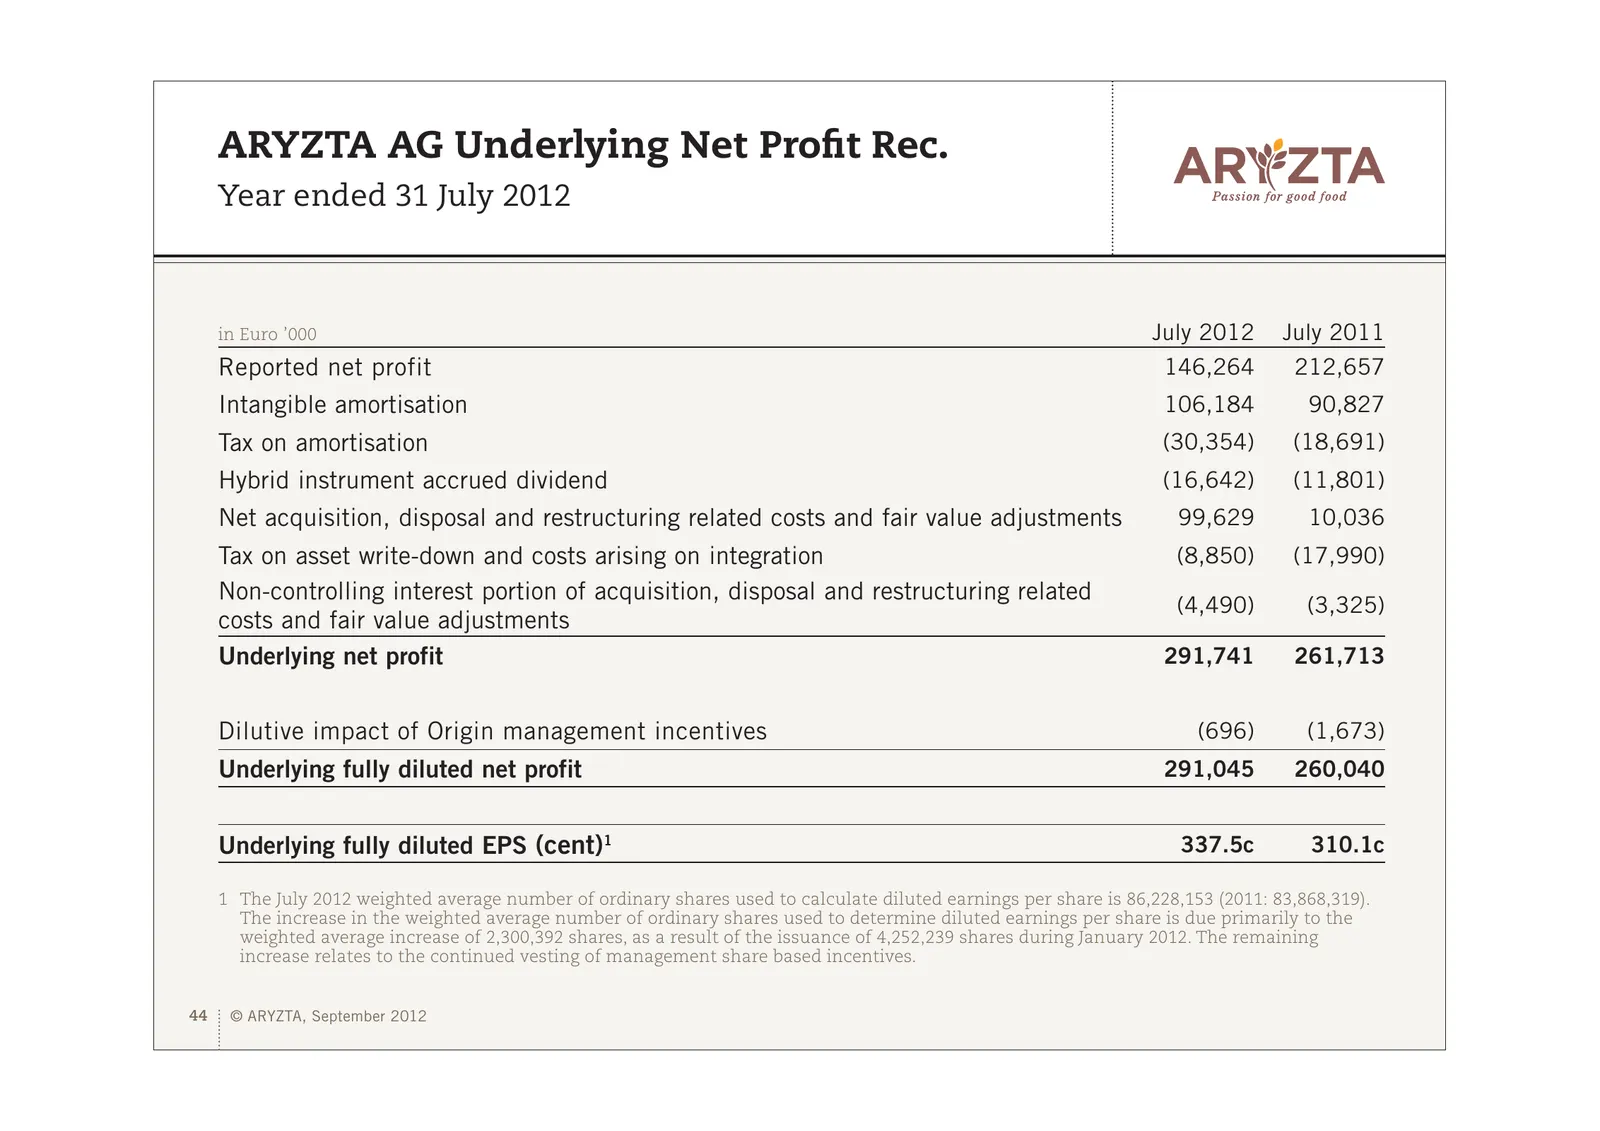
Slide 44: ARYZTA AG Underlying Net Profit Rec.
ARYZTA AG Underlying Net Profit Rec. Year ended 31 July 2012 in Euro ’000 July 2012 July 2011 Reported net profit 146,264 212,657 Intangible amortisation 106,184 90,827 Tax on amortisation (30,354) (18,691) Hybrid instrument accrued dividend (16,642) (11,801) Net acquisition, disposal and restructur
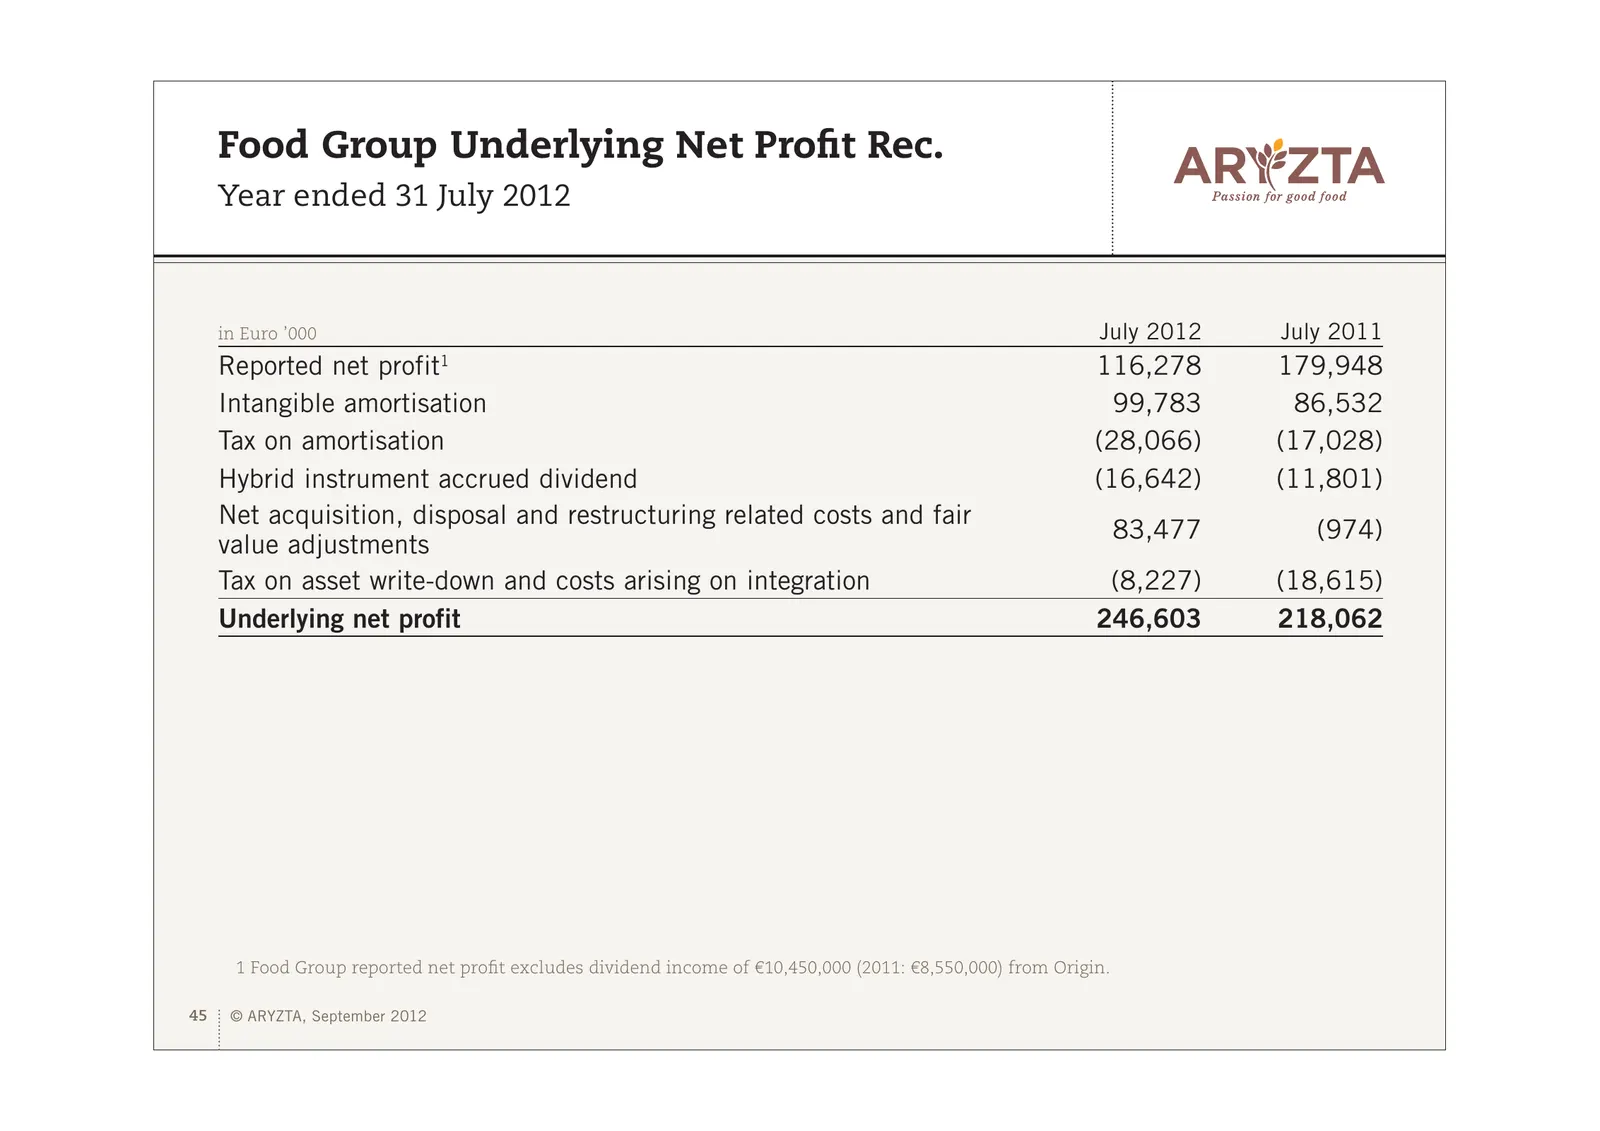
Slide 45: Food Group Underlying Net Profit Rec.
Food Group Underlying Net Profit Rec. Year ended 31 July 2012 in Euro ’000 July 2012 July 2011 Reported net profit1 116,278 179,948 Intangible amortisation 99,783 86,532 Tax on amortisation (28,066) (17,028) Hybrid instrument accrued dividend (16,642) (11,801) Net acquisition, disposal and restructu
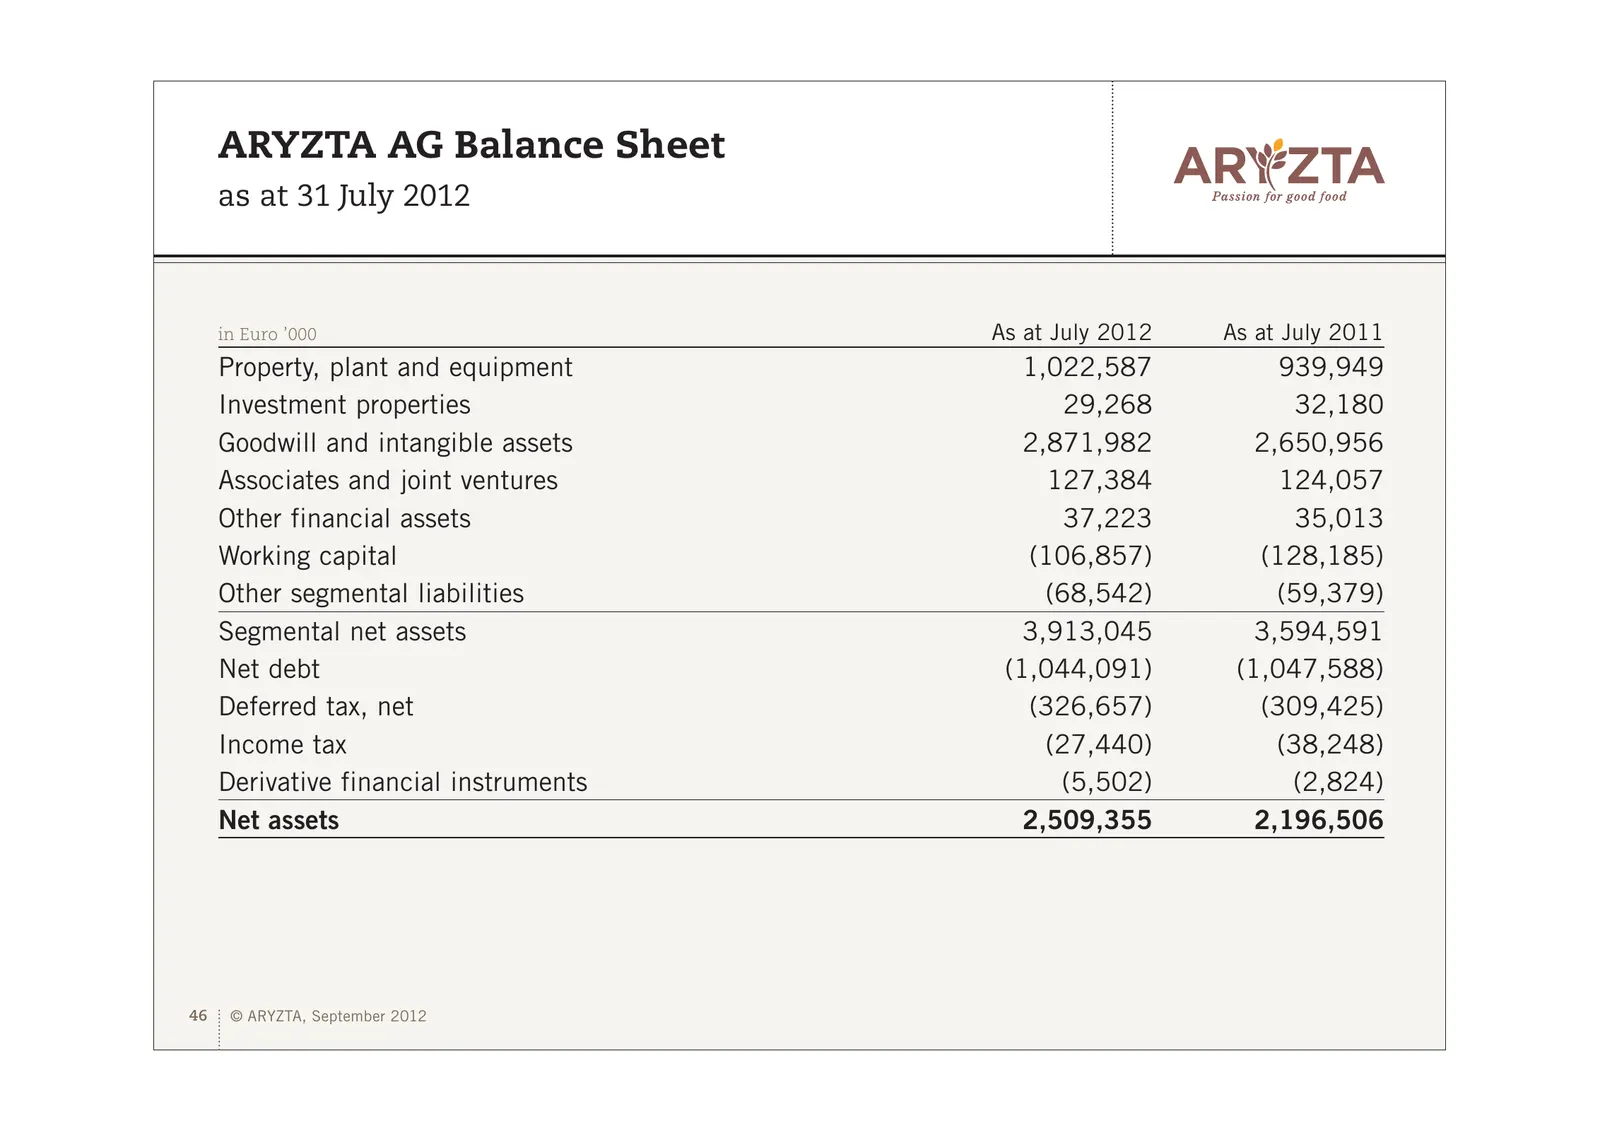
Slide 46: ARYZTA AG Balance Sheet
ARYZTA AG Balance Sheet as at 31 July 2012 in Euro ’000 As at July 2012 As at July 2011 Property, plant and equipment 1,022,587 939,949 Investment properties 29,268 32,180 Goodwill and intangible assets 2,871,982 2,650,956 Associates and joint ventures 127,384 124,057 Other financial assets 37,223 3
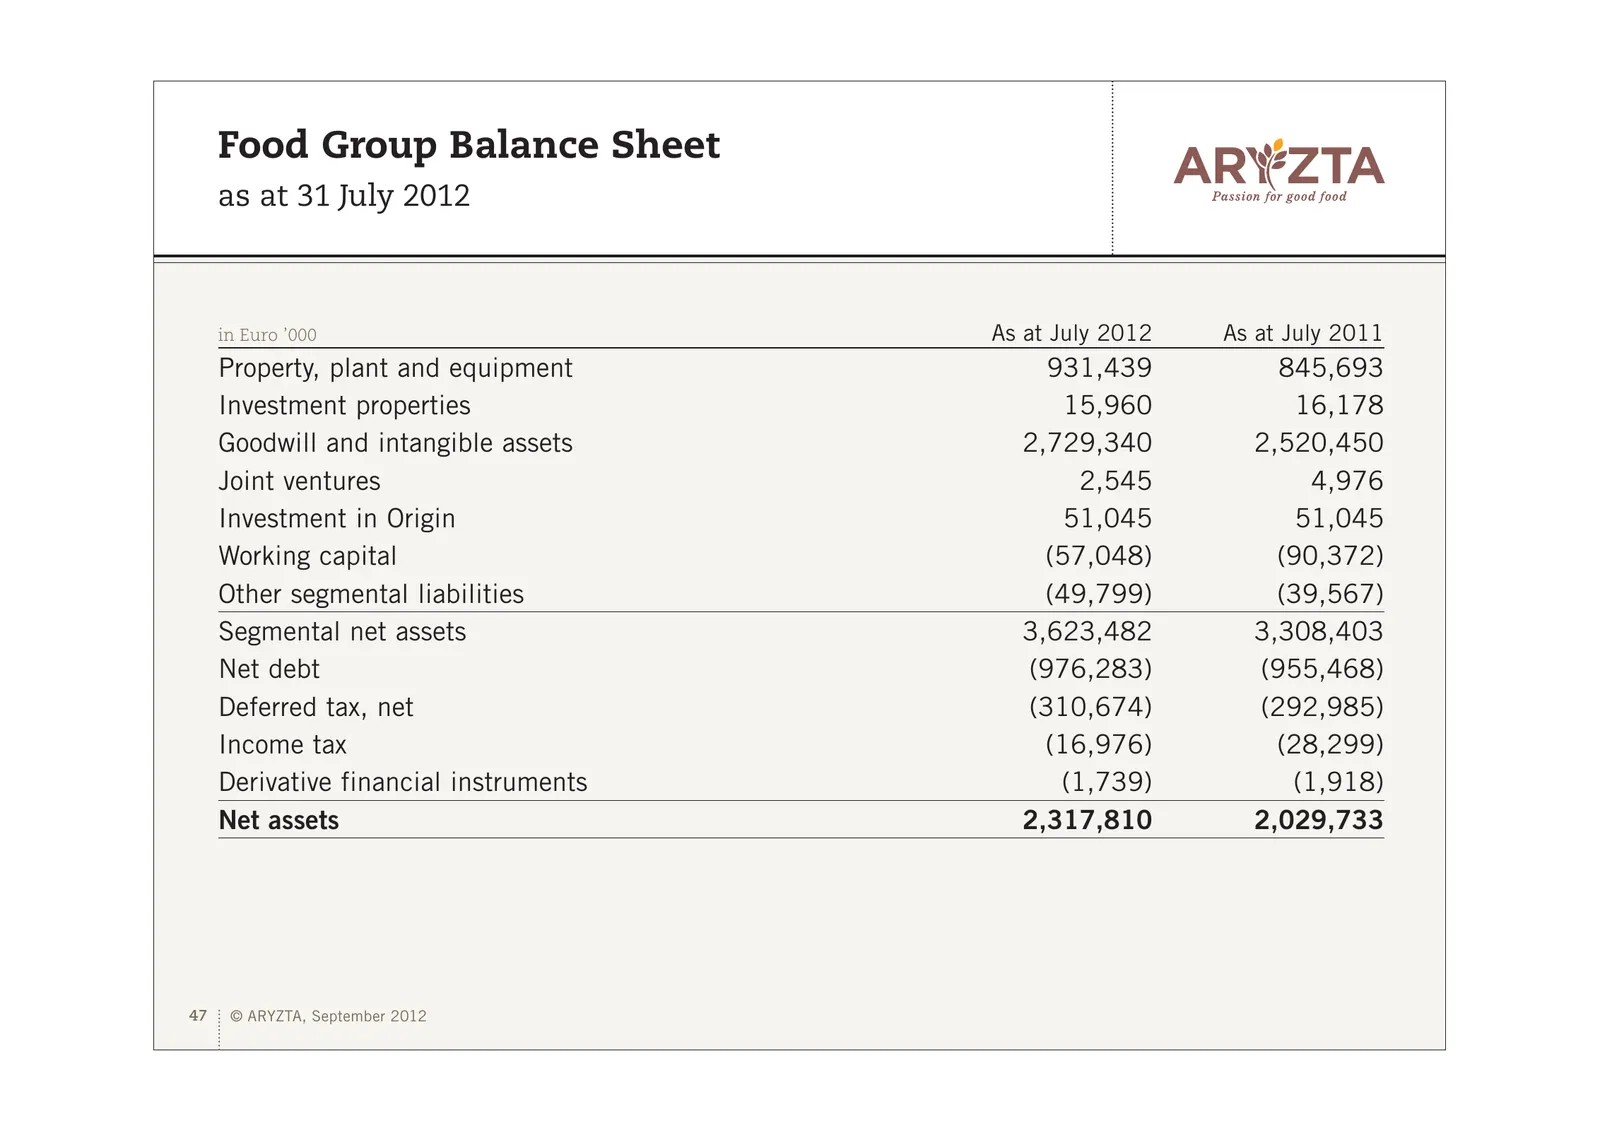
Slide 47: Food Group Balance Sheet
Food Group Balance Sheet as at 31 July 2012 in Euro ’000 As at July 2012 As at July 2011 Property, plant and equipment 931,439 845,693 Investment properties 15,960 16,178 Goodwill and intangible assets 2,729,340 2,520,450 Joint ventures 2,545 4,976 Investment in Origin 51,045 51,045 Working capital
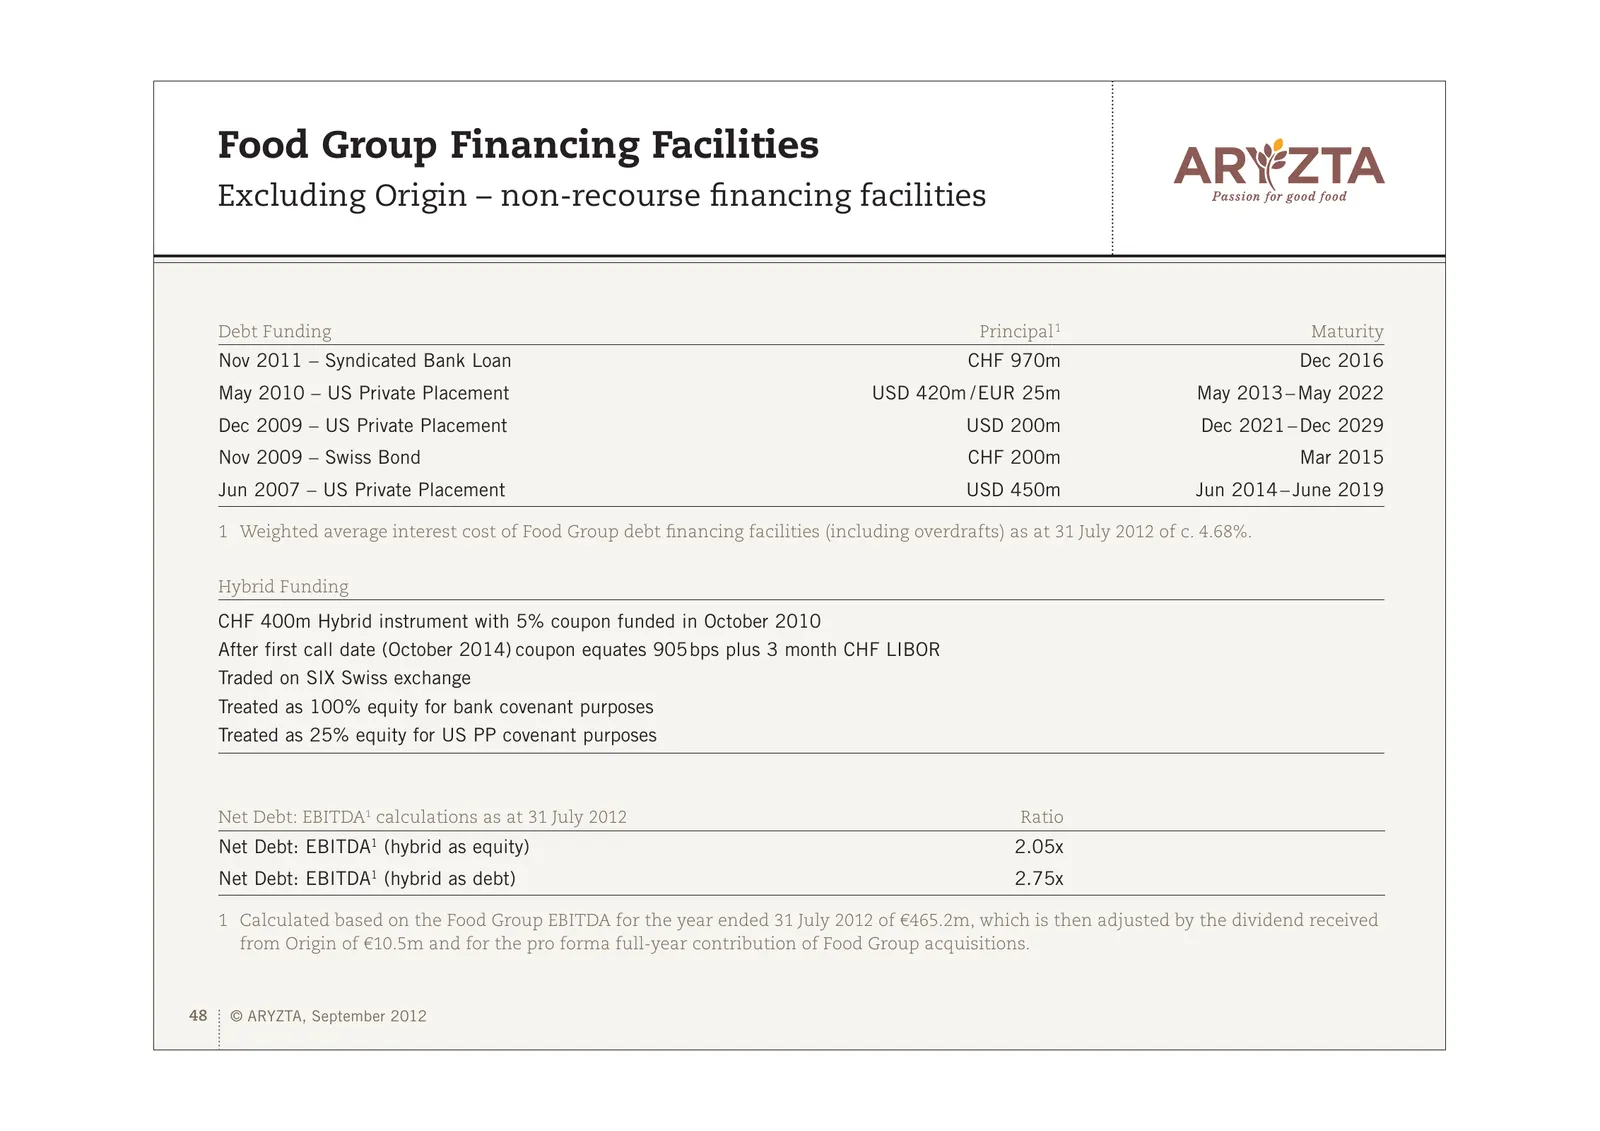
Slide 48: Food Group Financing Facilities
Food Group Financing Facilities Excluding Origin – non-recourse financing facilities Debt Funding Principal 1 Maturity Nov 2011 – Syndicated Bank Loan CHF 970m Dec 2016 May 2010 – US Private Placement USD 420m /EUR 25m May 2013 – May 2022 Dec 2009 – US Private Placement USD 200m Dec 2021 – Dec 2029
Slide 49: Food Group Gross Term Debt Maturity Profile
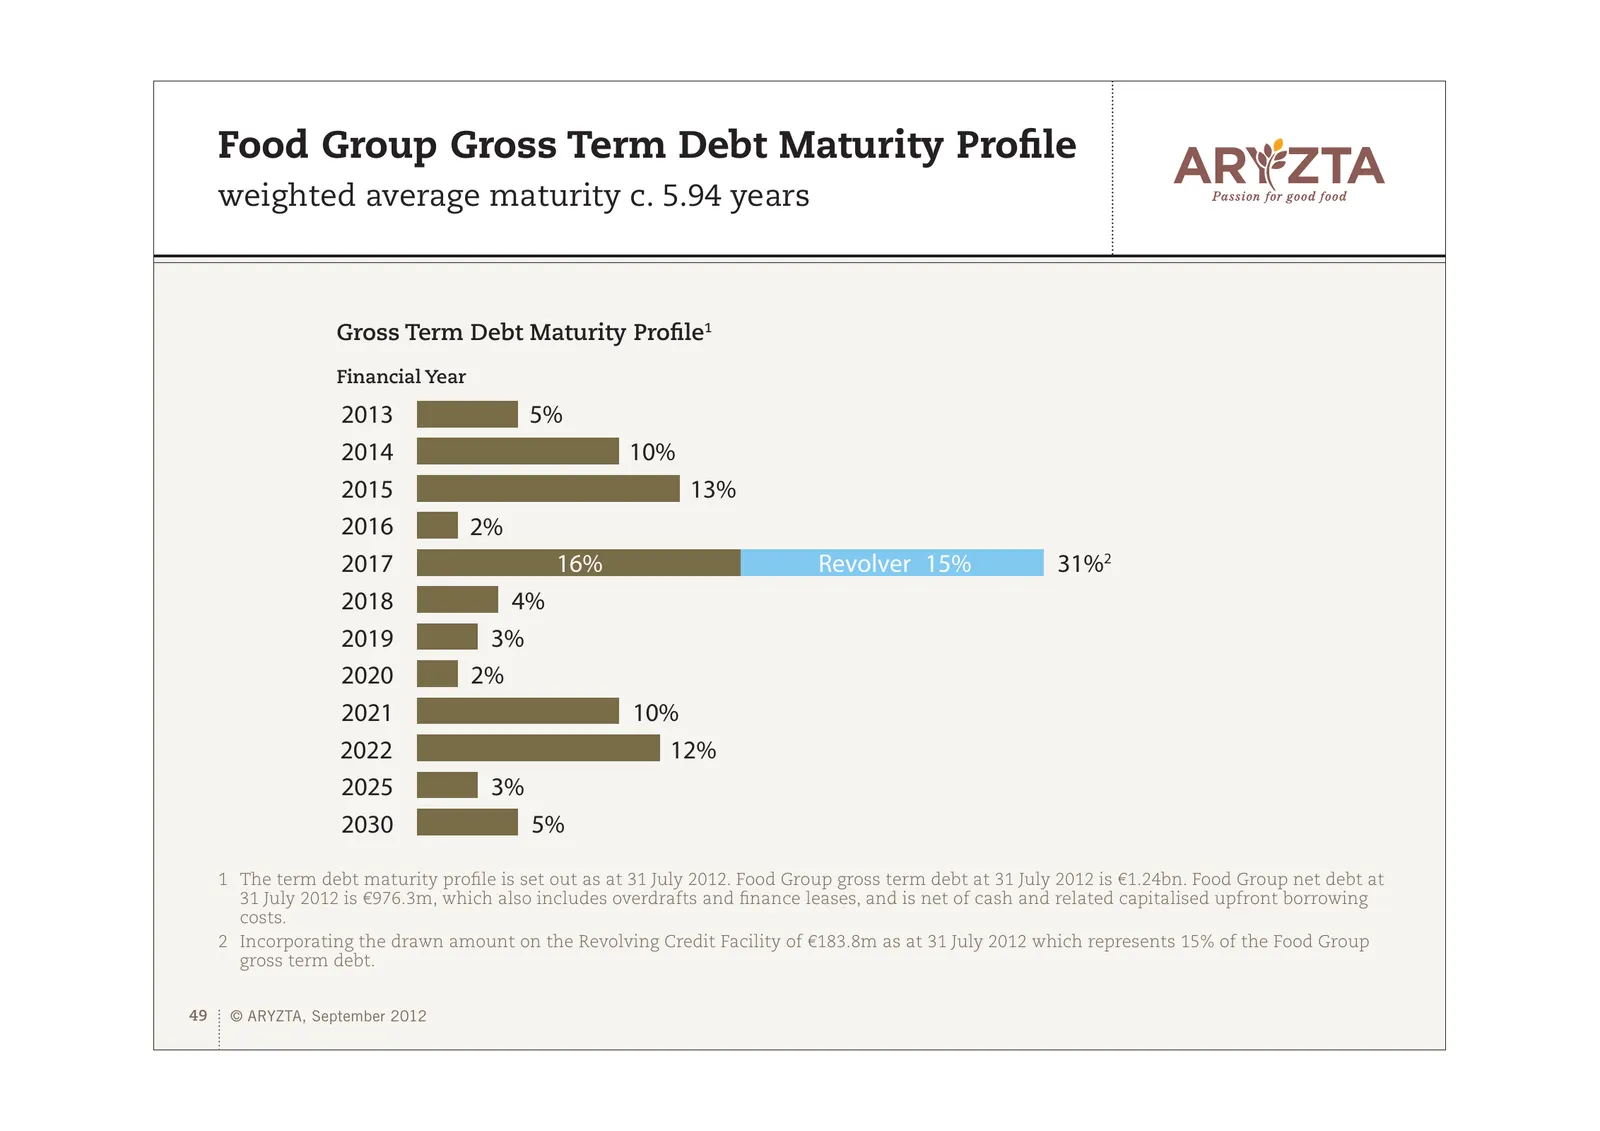
Food Group Gross Term Debt Maturity Profile weighted average maturity c. 5.94 years Gross Term Debt Maturity Profile1 Financial Year 2013 5% 2014 10% 2015 13% 2016 2% 2017 16% Revolver 15% 31%2 2018 4% 2019 3% 2020 2% 2021 10% 2022 12% 2025 3% 2030 5% 1 The term debt maturity profile is set out as a
Slide 50: Currency Strategy
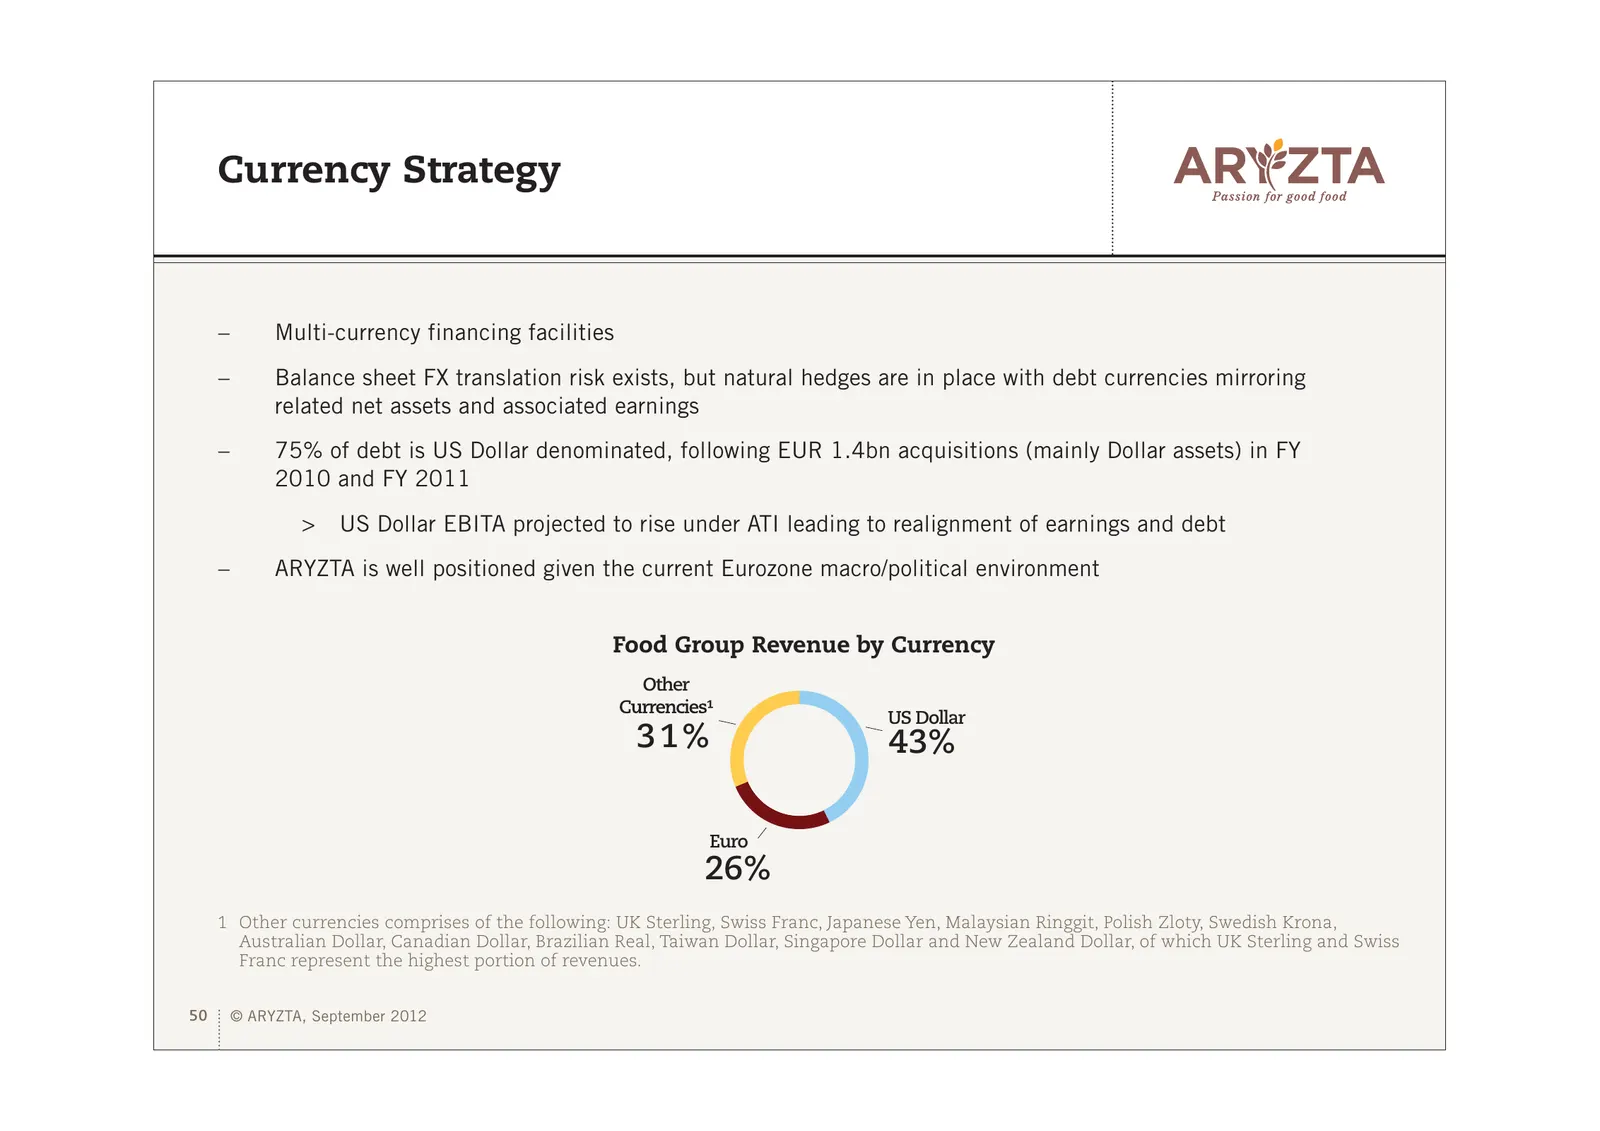
Currency Strategy – Multi-currency financing facilities – Balance sheet FX translation risk exists, but natural hedges are in place with debt currencies mirroring related net assets and associated earnings – 75% of debt is US Dollar denominated, following EUR 1.4bn acquisitions (mainly Dollar assets
Slide 51: Presentation Glossary
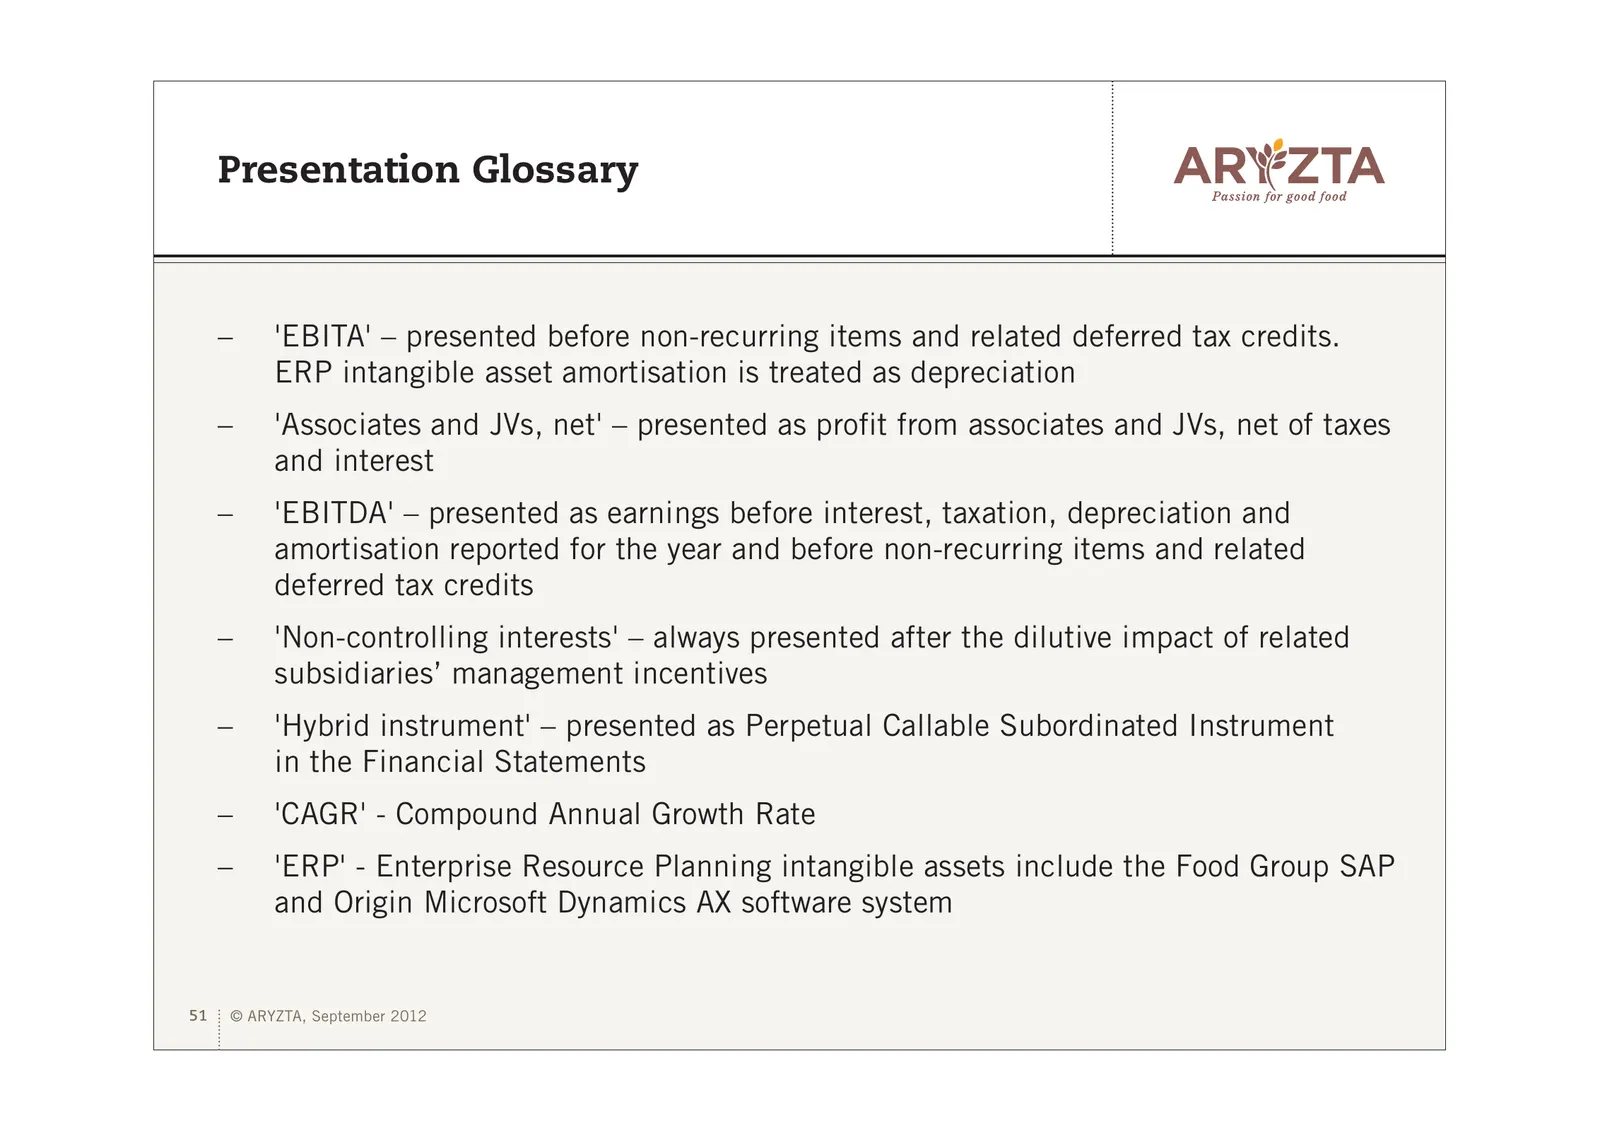
Presentation Glossary – 'EBITA' – presented before non-recurring items and related deferred tax credits. ERP intangible asset amortisation is treated as depreciation – 'Associates and JVs, net' – presented as profit from associates and JVs, net of taxes and interest – 'EBITDA' – presented as earning
Slide 52: Appendix – FX Analysis, Shareholder information & Consensus Estimates
ARYZTA AG Appendix 3 – FX Analysis, Shareholder information & Consensus Estimates 52 © ARYZTA, September 2012
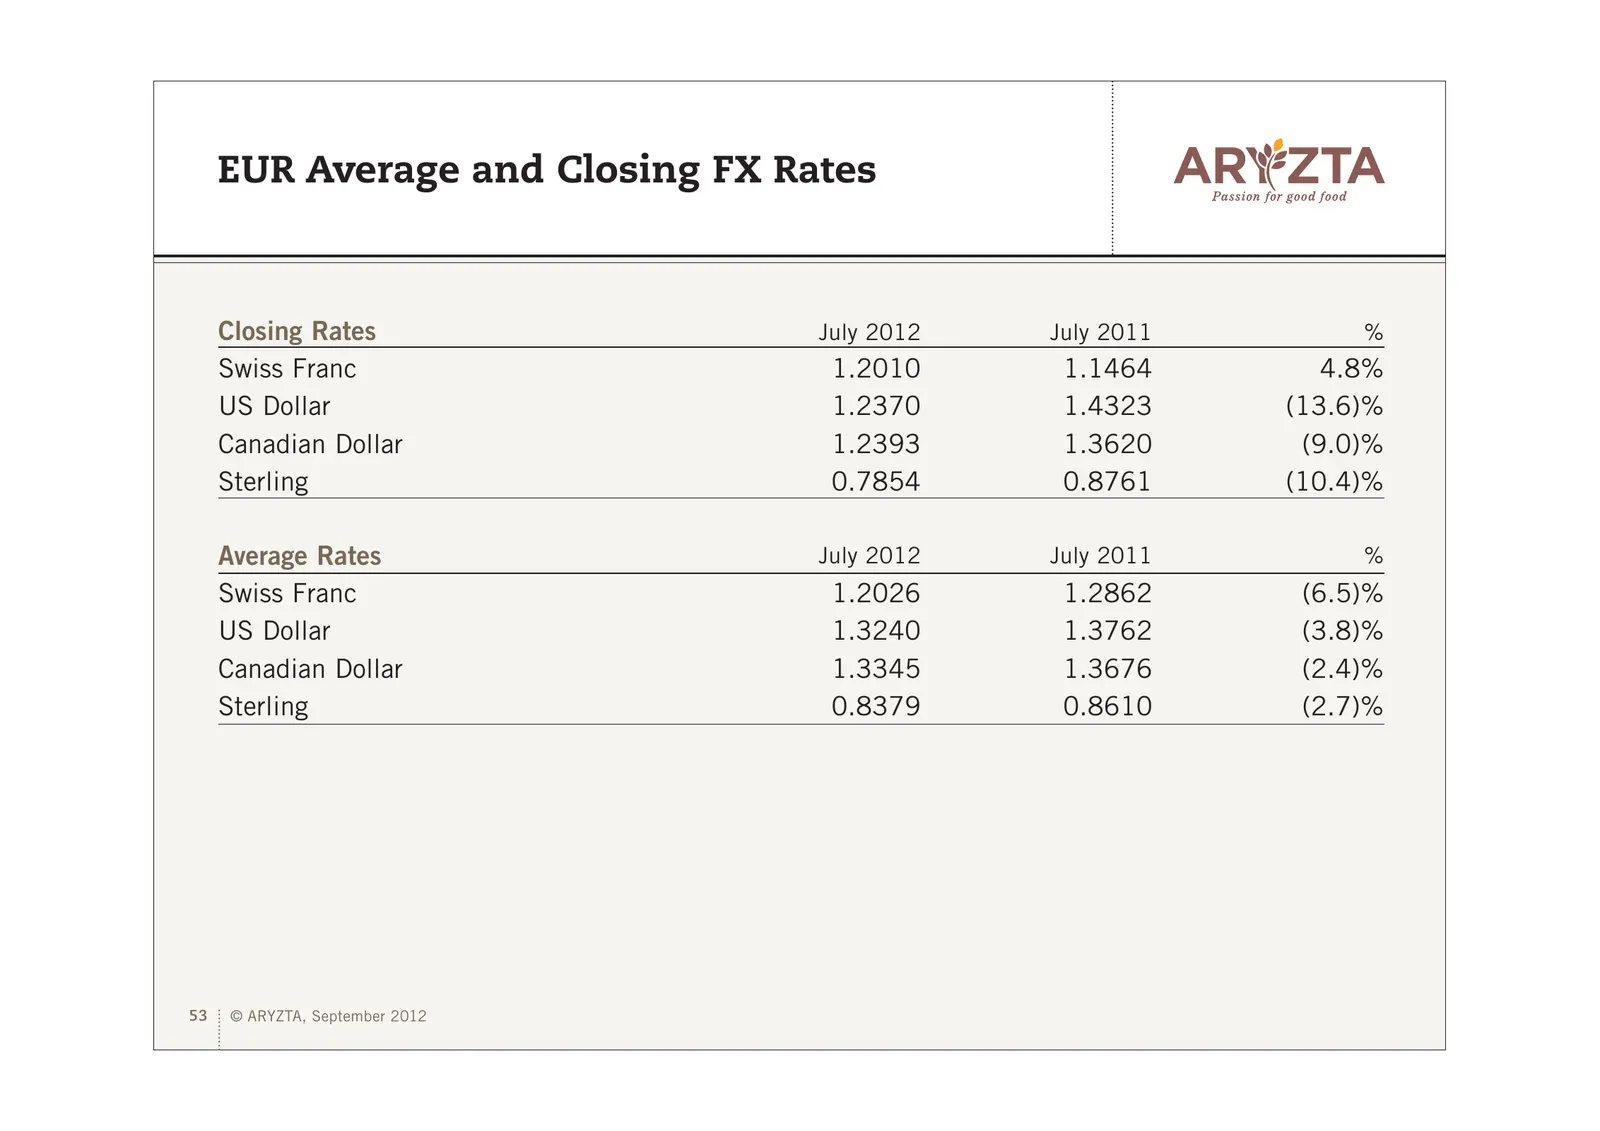
Slide 53: EUR Average and Closing FX Rates
EUR Average and Closing FX Rates Closing Rates July 2012 July 2011 % Swiss Franc 1.2010 1.1464 4.8% US Dollar 1.2370 1.4323 (13.6)% Canadian Dollar 1.2393 1.3620 (9.0)% Sterling 0.7854 0.8761 (10.4)% Average Rates July 2012 July 2011 % Swiss Franc 1.2026 1.2862 (6.5)% US Dollar 1.3240 1.3762 (3.8)%
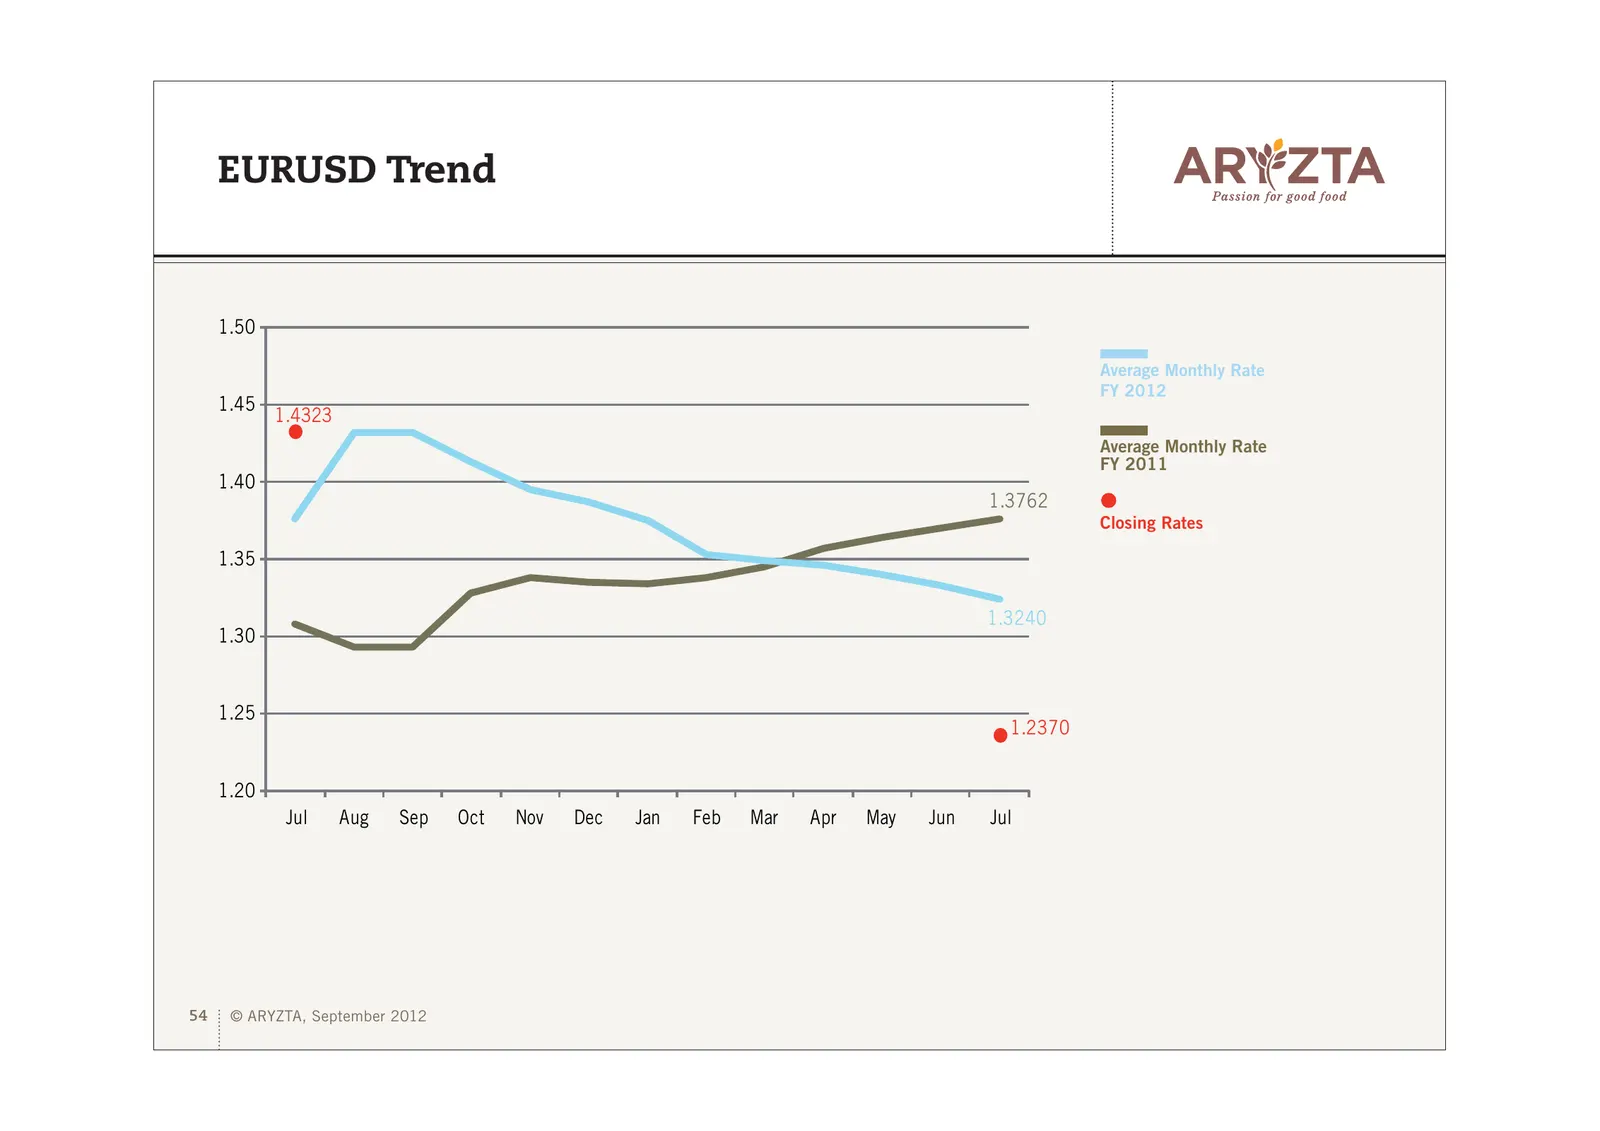
Slide 54: EURUSD Trend
EURUSD Trend 1.50 Average Monthly Rate FY 2012 1.45 1.4323 Average Monthly Rate FY 2011 1.40 1.3762 Closing Rates 1.35 1.3240 1.30 1.25 1.2370 1.20 Jul Aug Sep Oct Nov Dec Jan Feb Mar Apr May Jun Jul 54 © ARYZTA, September 2012
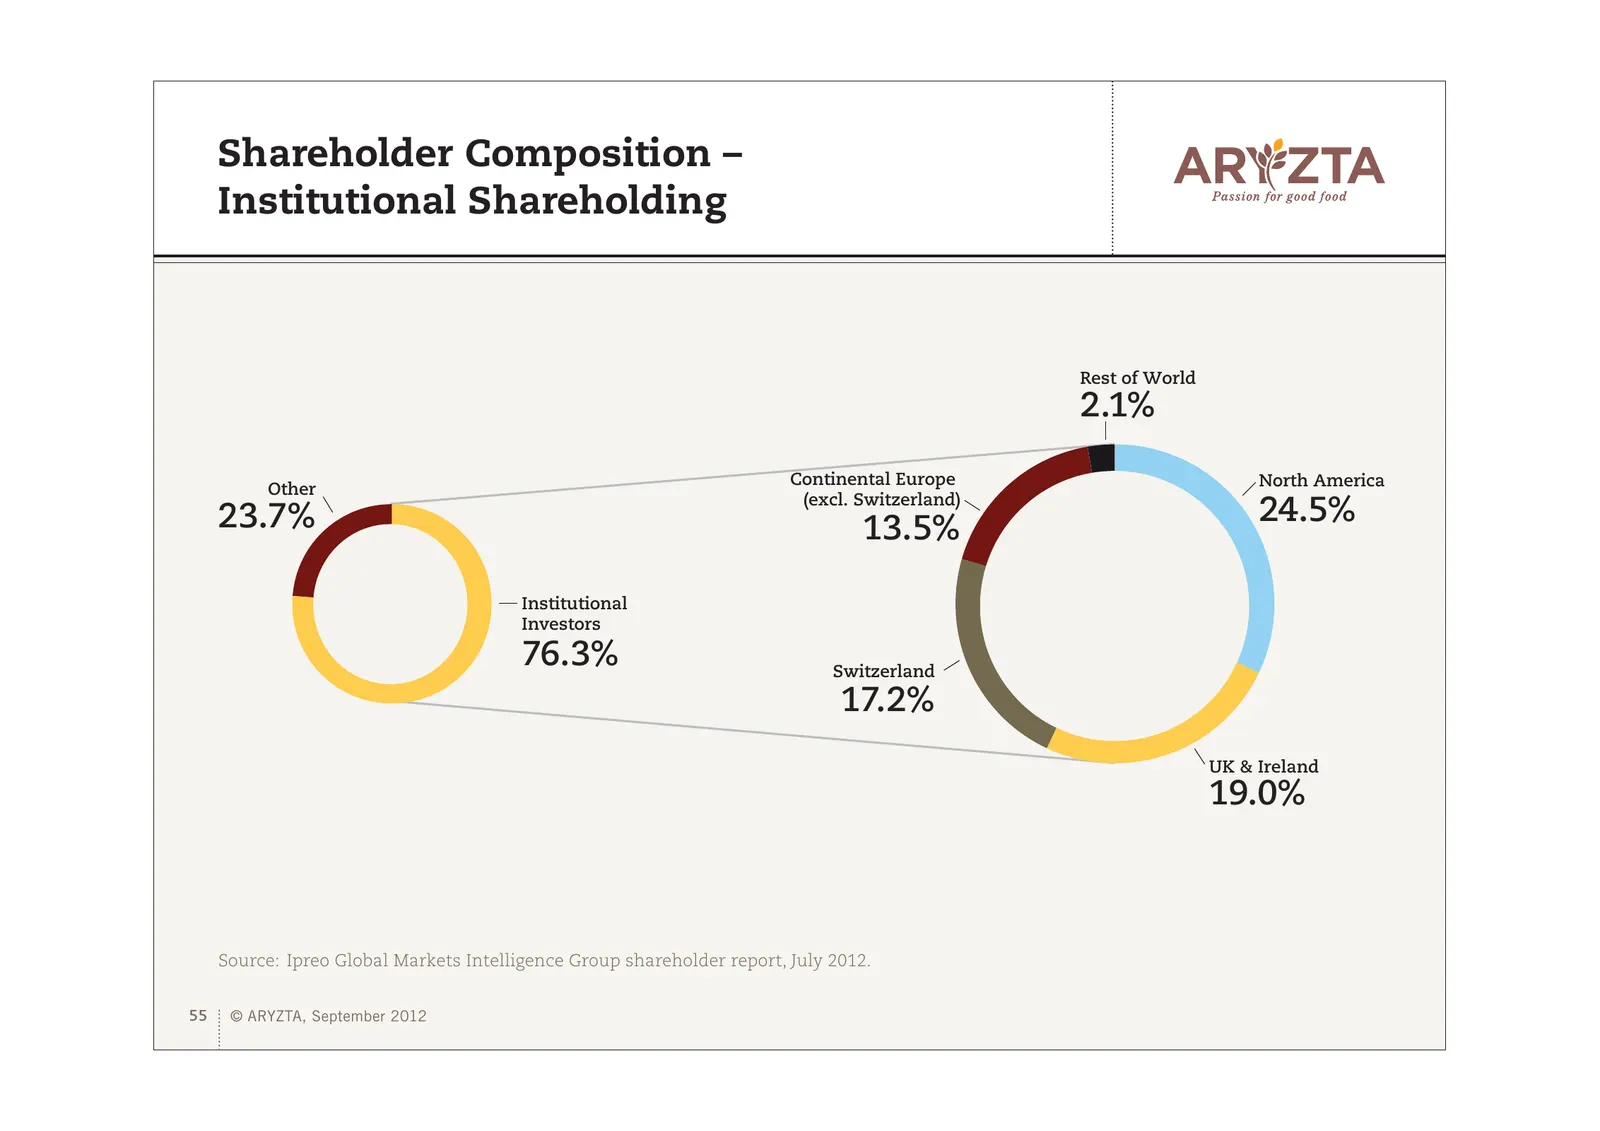
Slide 55: Shareholder Composition – Institutional Shareholding
Shareholder Composition – Institutional Shareholding Rest of World 2.1% Continental Europe North America Other (excl. Switzerland) 23.7% 24.5% 13.5% Institutional Investors 76.3% Switzerland 17.2% UK & Ireland 19.0% Source: Ipreo Global Markets Intelligence Group shareholder report, July 2012. 55 ©
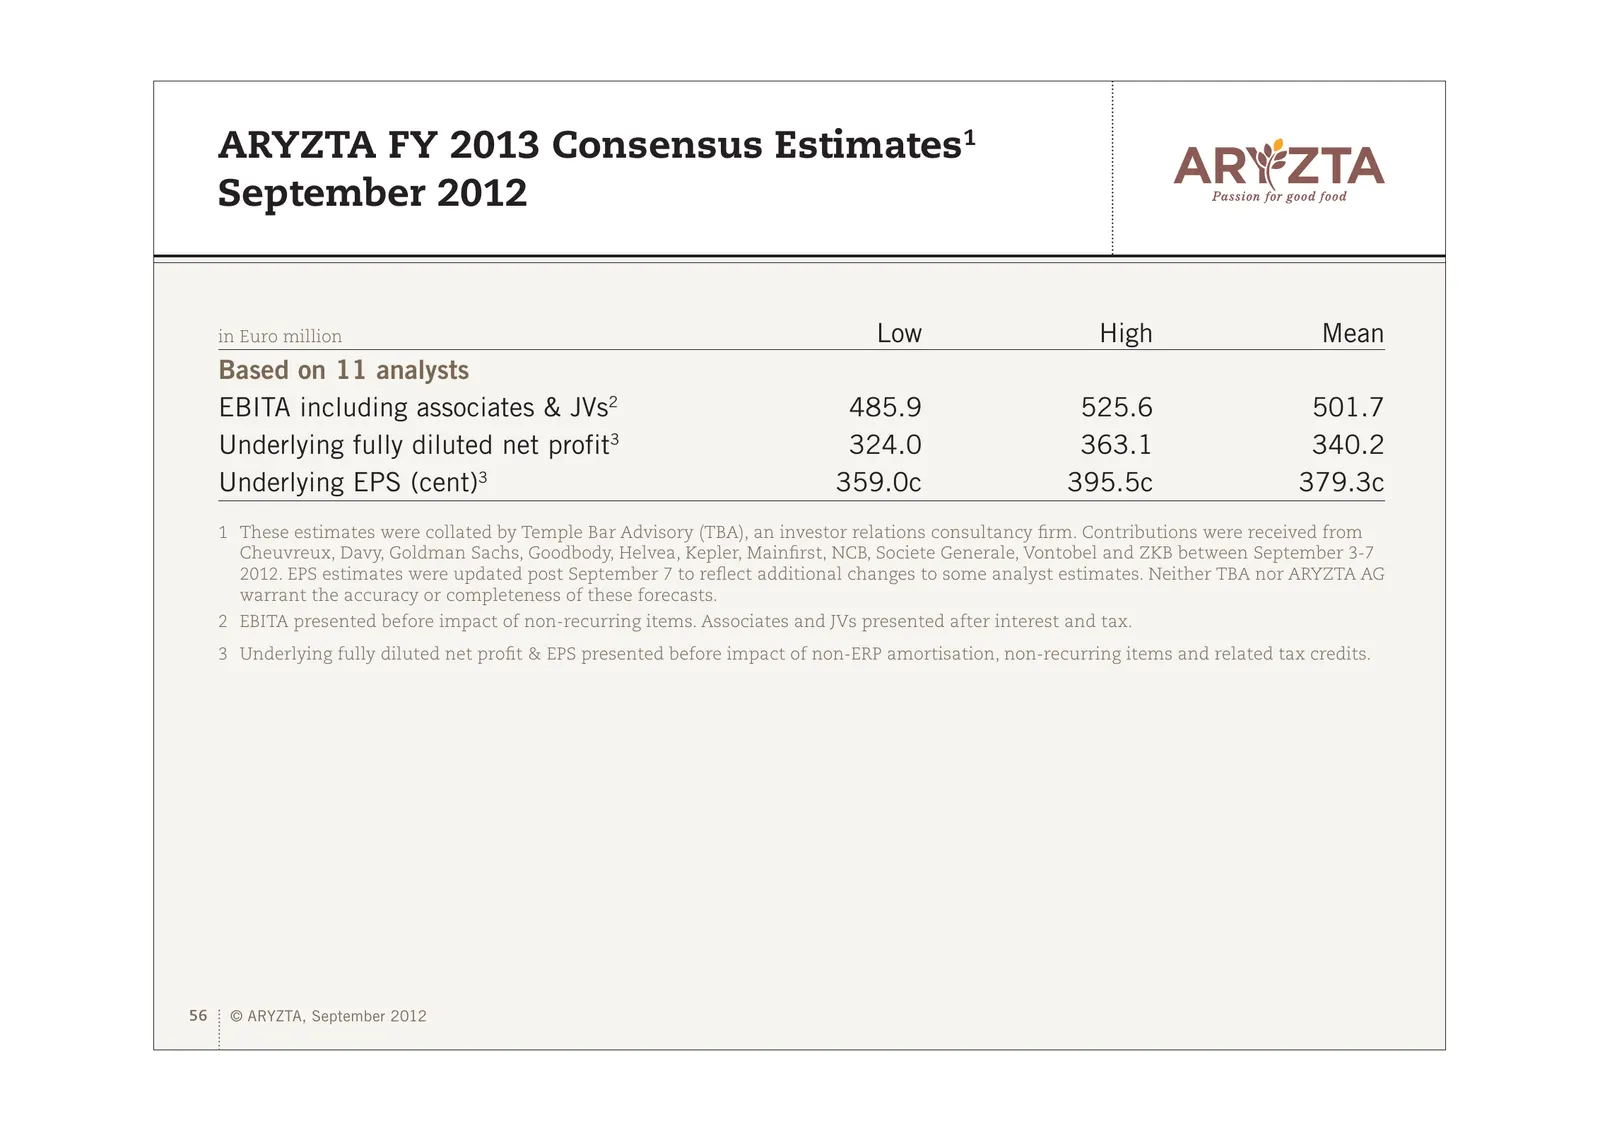
Slide 56: ARYZTA FY 2013 Consensus Estimates
ARYZTA FY 2013 Consensus Estimates1 September 2012 in Euro million Low High Mean Based on 11 analysts EBITA including associates & JVs2 485.9 525.6 501.7 Underlying fully diluted net profit3 324.0 363.1 340.2 Underlying EPS (cent)3 359.0c 395.5c 379.3c 1 These estimates were collated by Temple Bar A
Slide 57: ARYZTA AG Thank you!
ARYZTA AG Thank you! 57 © ARYZTA, September 2012
Slide 58: Investor Information
Investor Information Company Contact Paul Meade Communications Officer ARYZTA AG Talacker 41 8001 Zurich Switzerland Tel: +41 (0) 44 583 42 00 Fax: +41 (0) 44 583 42 49 info@aryzta.com www.aryzta.com 58 © ARYZTA, September 2012
Source: Internet Archive copy of aryzta.com
More decks from Aryzta AG
 H1 2026 Earnings Presentation32 slides · Aug 10, 2026
 FY2025 Earnings Presentation7 slides · Jan 22, 2026
 Q3 2025 Earnings Presentation15 slides · Oct 20, 2025
 H1 2025 Earnings Presentation34 slides · Aug 11, 2025
 Investor Day (May 2025)48 slides · May 7, 2025
 Q1 2025 Earnings Presentation35 slides · Mar 2, 2025