PLS Group Limited · ASX:PLS
PLS — Pilbara Minerals — Melbourne Mining Club (February 2023)
20 slides from PLS's conference presentation, Feb 9, 2023
Slide 1: The Australian Lithium Industry – Just Getting Started
The Australian Lithium Industry – Just Getting Started Melbourne Mining Club Thursday, 9 February 2023 Dale Henderson MANAGING DIRECTOR / CHIEF EXECUTIVE OFFICER
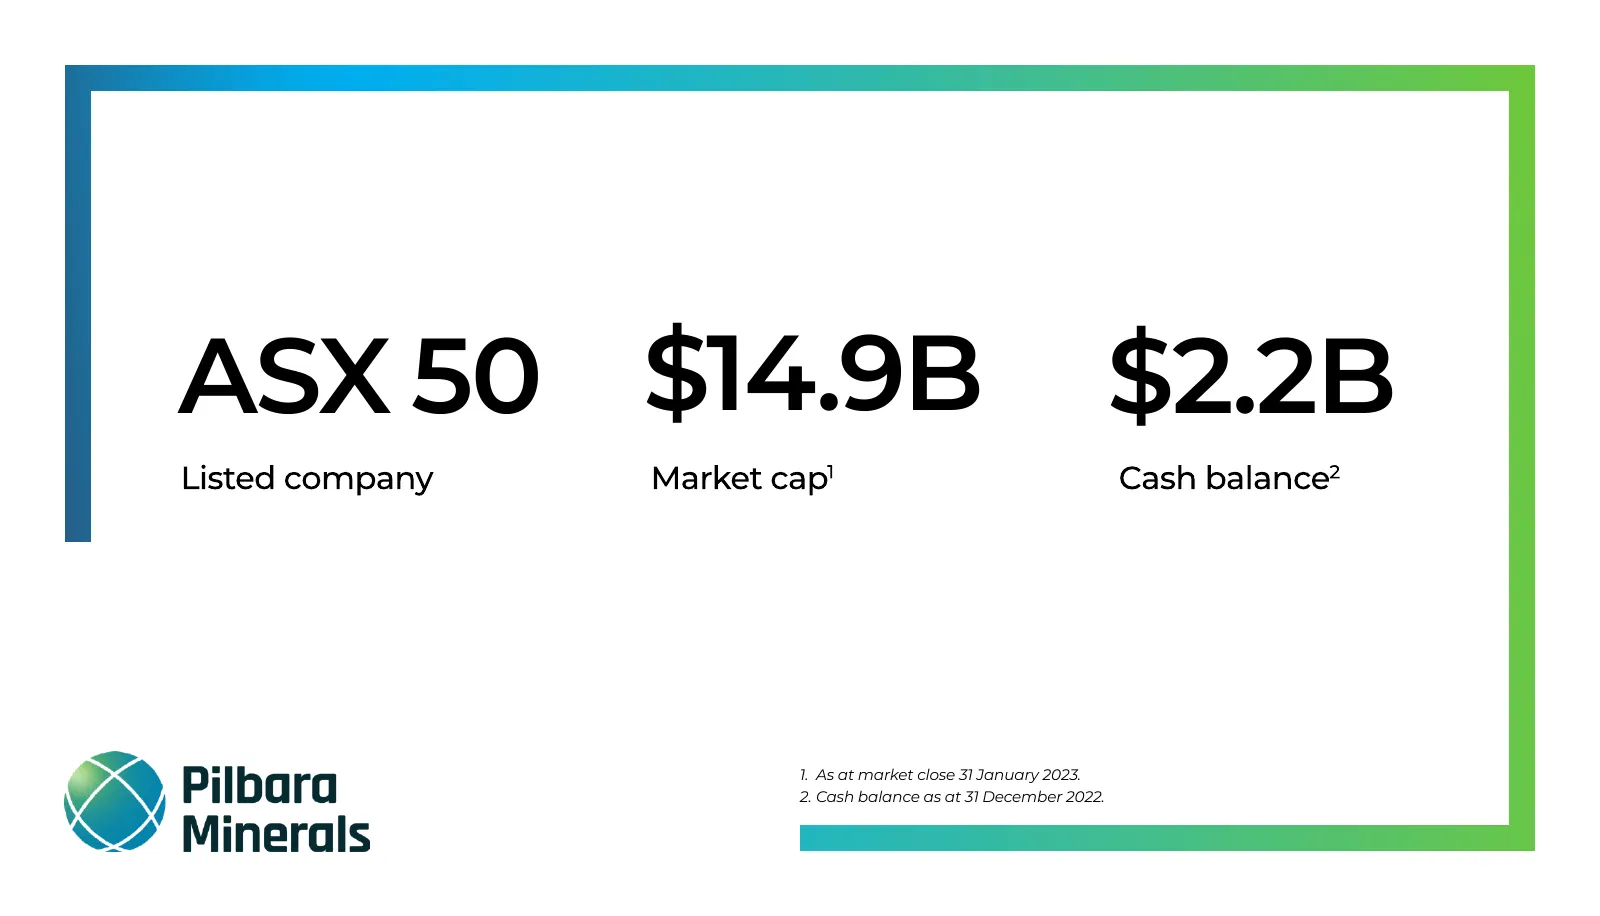
Slide 2: ASX 50, $14.9B market cap, $2.2B cash
ASX 50 $14.9B $2.2B 1. As at market close 31 January 2023. 2. Cash balance as at 31 December 2022.
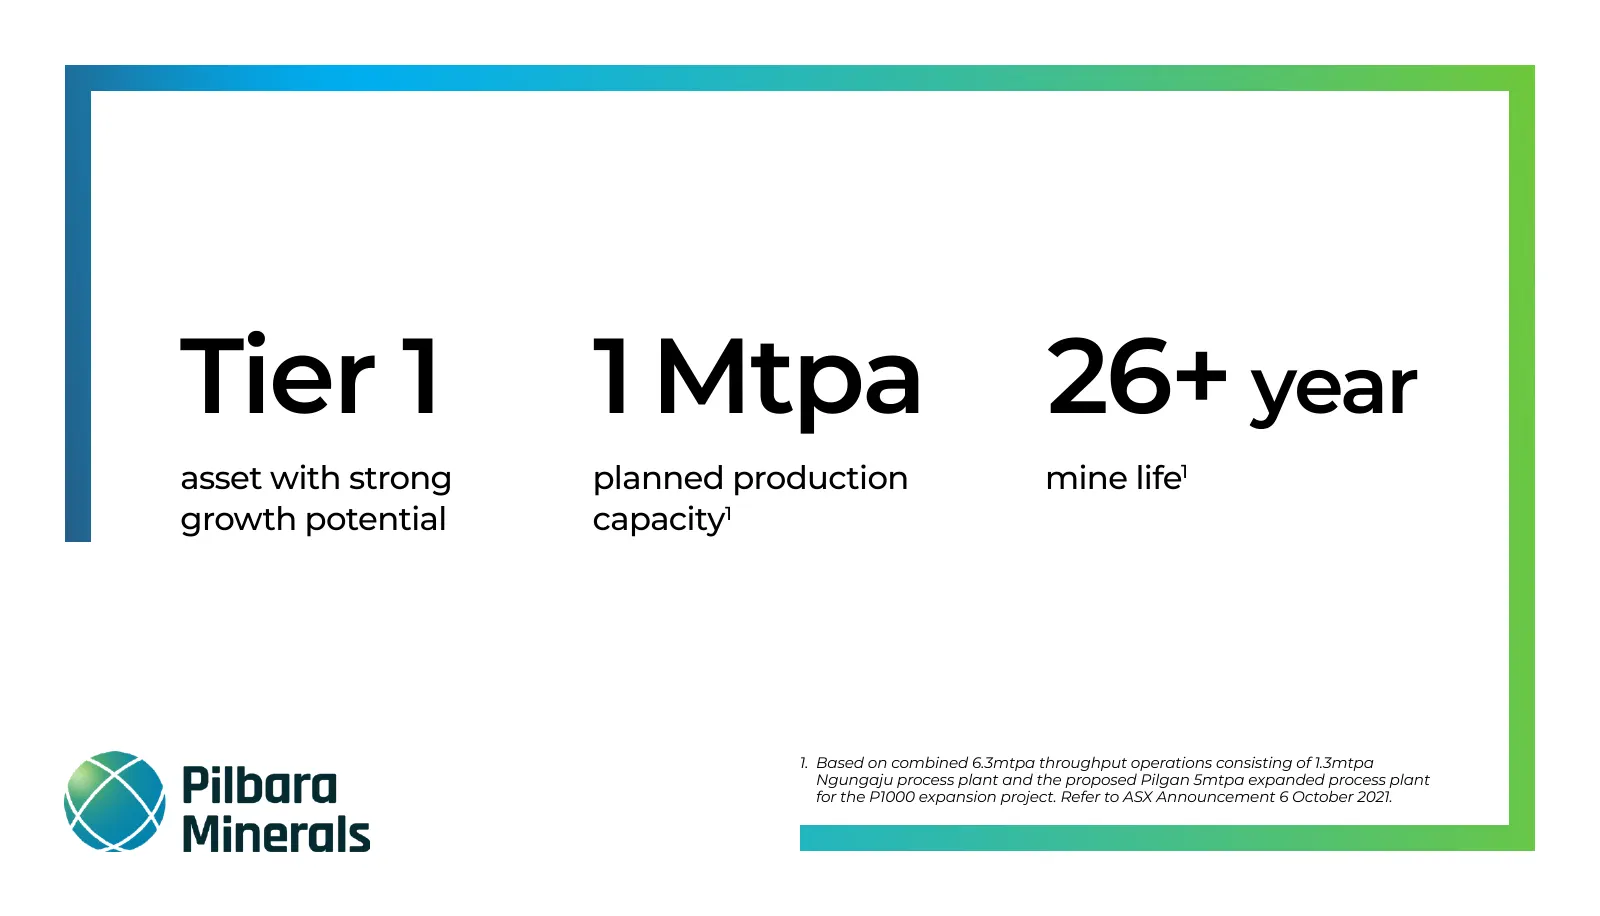
Slide 3: Tier 1 asset with strong growth potential
Tier 1 1 Mtpa 26+ year asset with strong planned production mine life1 growth potential capacity1 1. Based on combined 6.3mtpa throughput operations consisting of 1.3mtpa Ngungaju process plant and the proposed Pilgan 5mtpa expanded process plant for the P1000 expansion project. Refer to ASX Announc
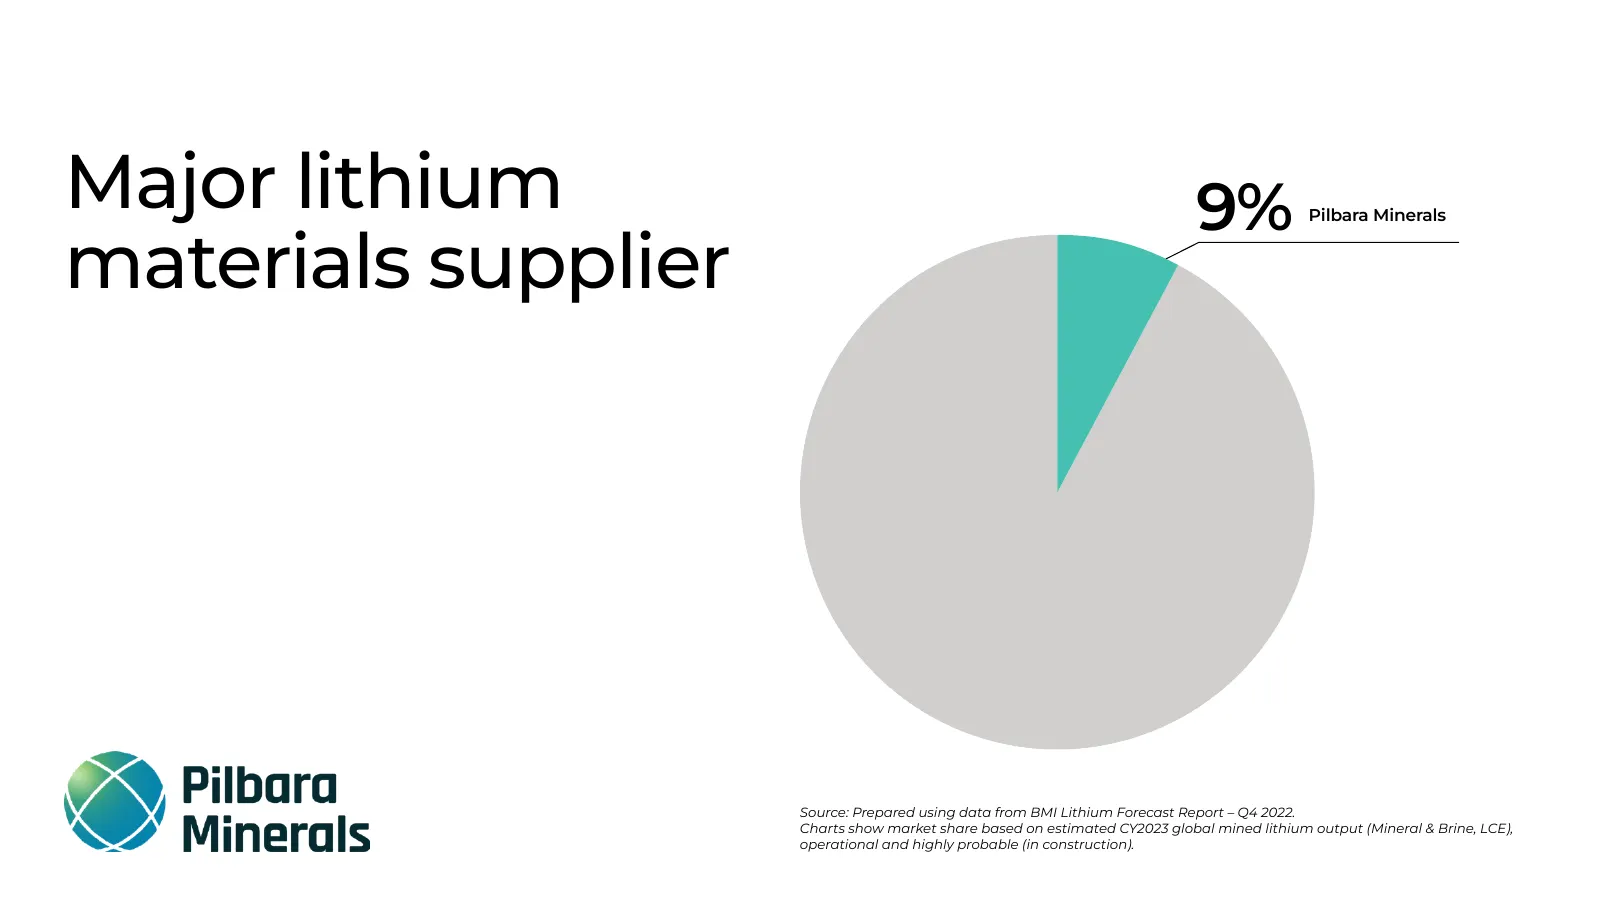
Slide 4: Major lithium materials supplier
Major lithium 9% Pilbara Minerals materials supplier Source: Prepared using data from BMI Lithium Forecast Report – Q4 2022. Charts show market share based on estimated CY2023 global mined lithium output (Mineral & Brine, LCE), operational and highly probable (in construction).
Slide 5: The energy transition – a seismic shift
The energy transition – a seismic shift
Slide 6: Energy transition – leap in investment
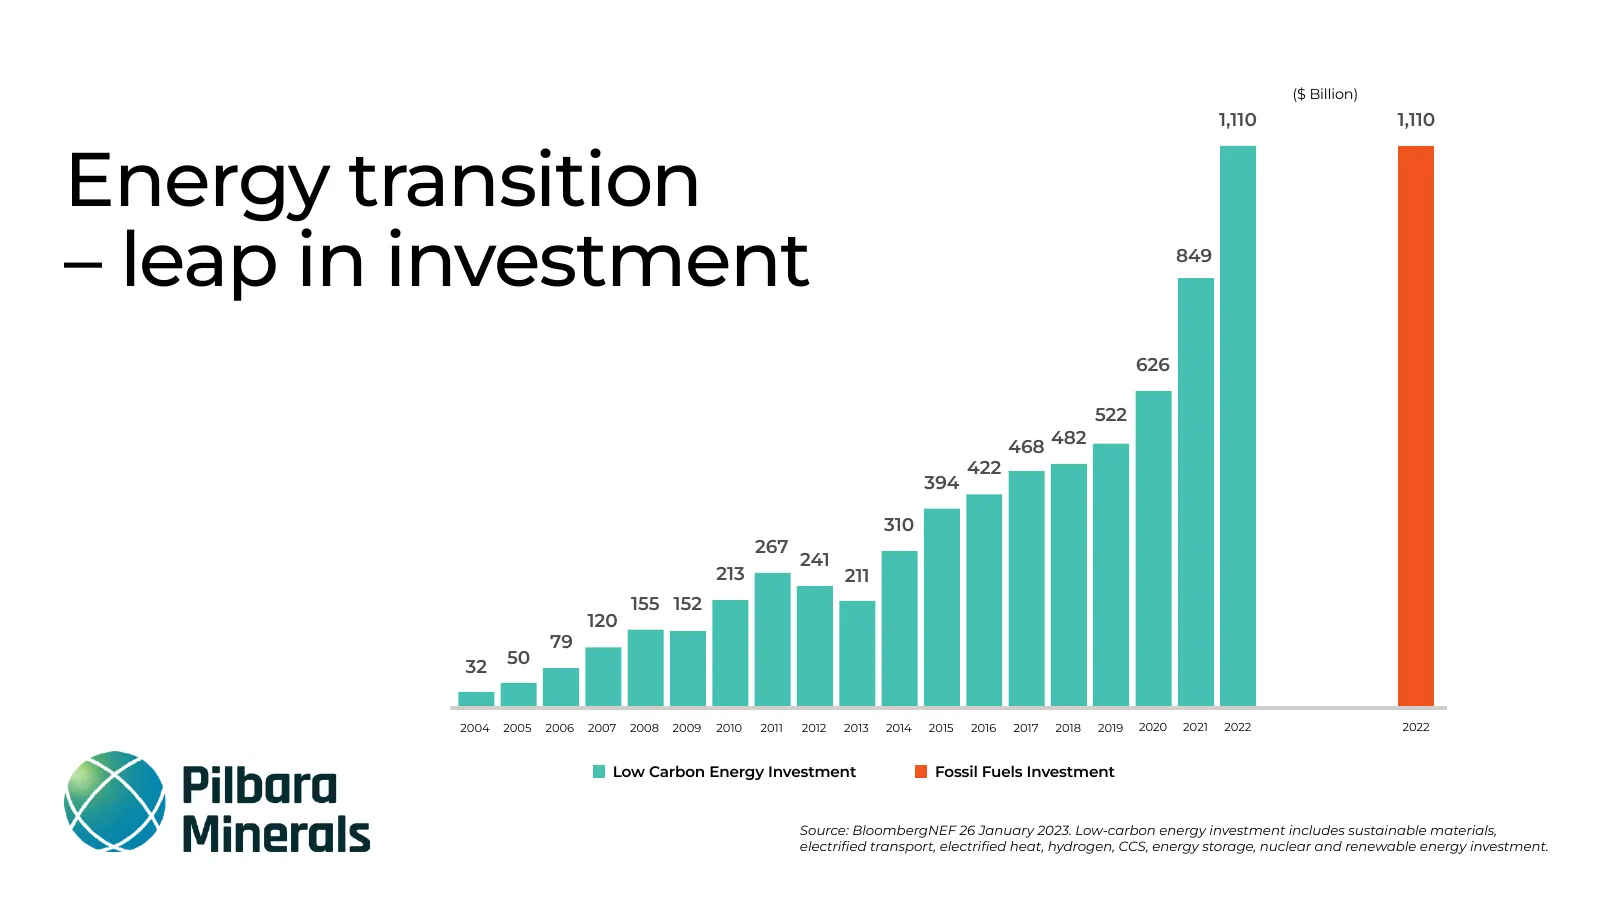
($ Billion) 1,110 1,110 Energy transition – leap in investment 849 626 522 468 482 422 394 310 267 241 213 211 155 152 120 79 32 50 2004 2005 2006 2007 2008 2009 2010 2011 2012 2013 2014 2015 2016 2017 2018 2019 2020 2021 2022 2022 Low Carbon Energy Investment Fossil Fuels Investment Source: Bloombe
Slide 7: The lithium-ion battery
The lithium-ion battery So Pilbara Minerals
Slide 8: Projected global electric vehicle sales
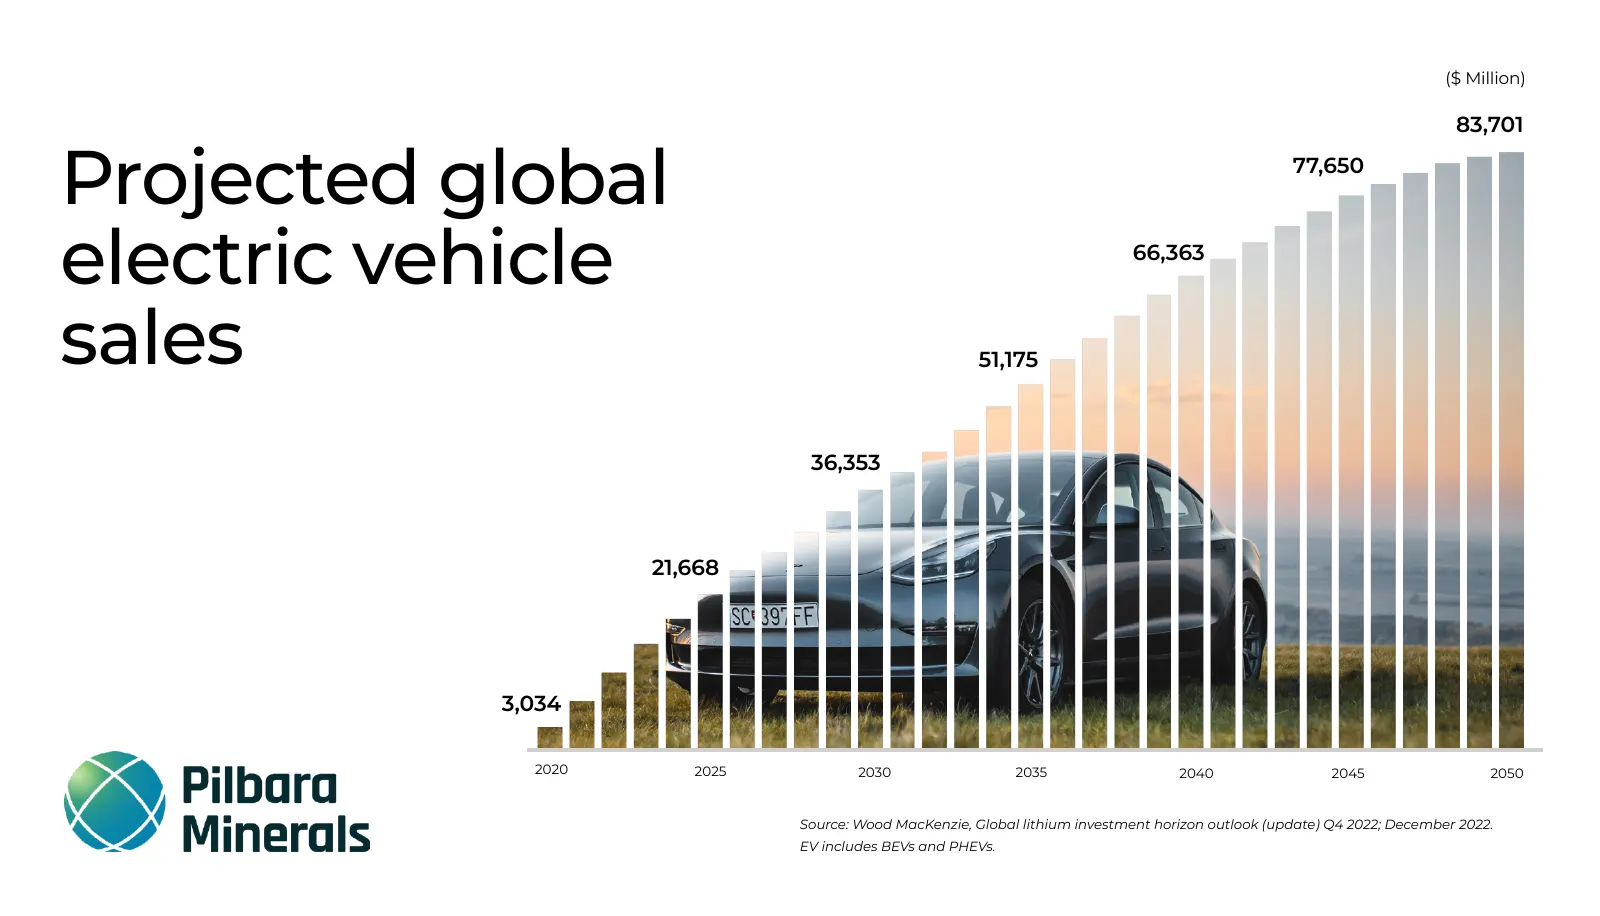
($ Million) 83,701 Projected global 77,650 electric vehicle 66,363 sales 51,175 36,353 21,668 3,034 2020 2025 2030 2035 2040 2045 2050 Source: Wood MacKenzie, Global lithium investment horizon outlook (update) Q4 2022; December 2022. EV includes BEVs and PHEVs.
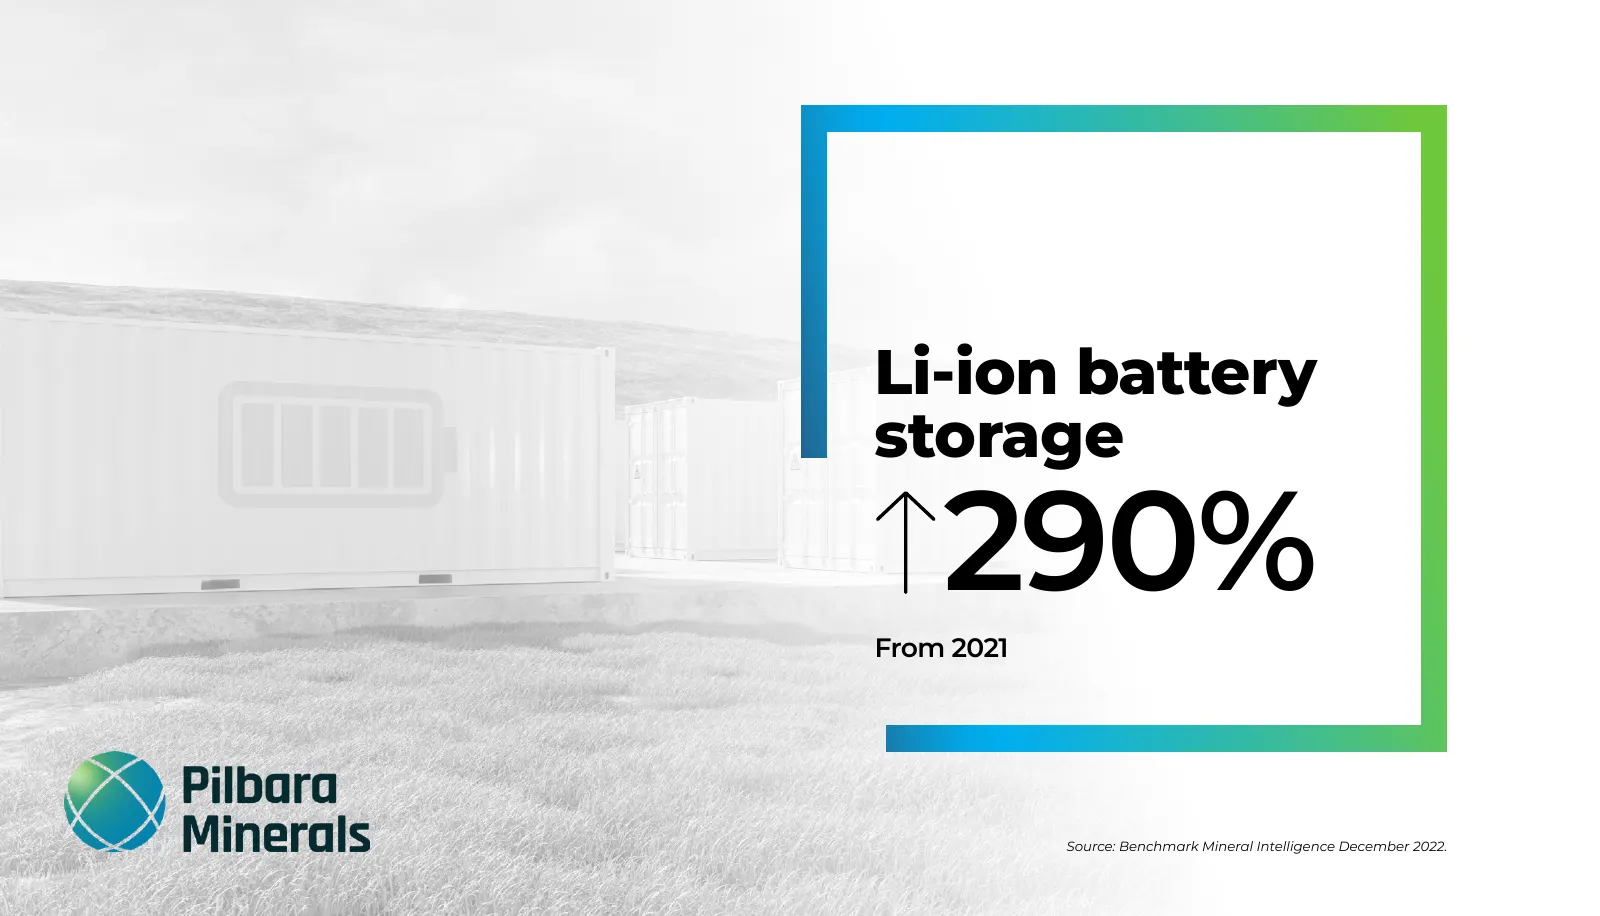
Slide 9: Li-ion battery storage
Li-ion battery storage 290% From 2021 Source: Benchmark Mineral Intelligence December 2022.
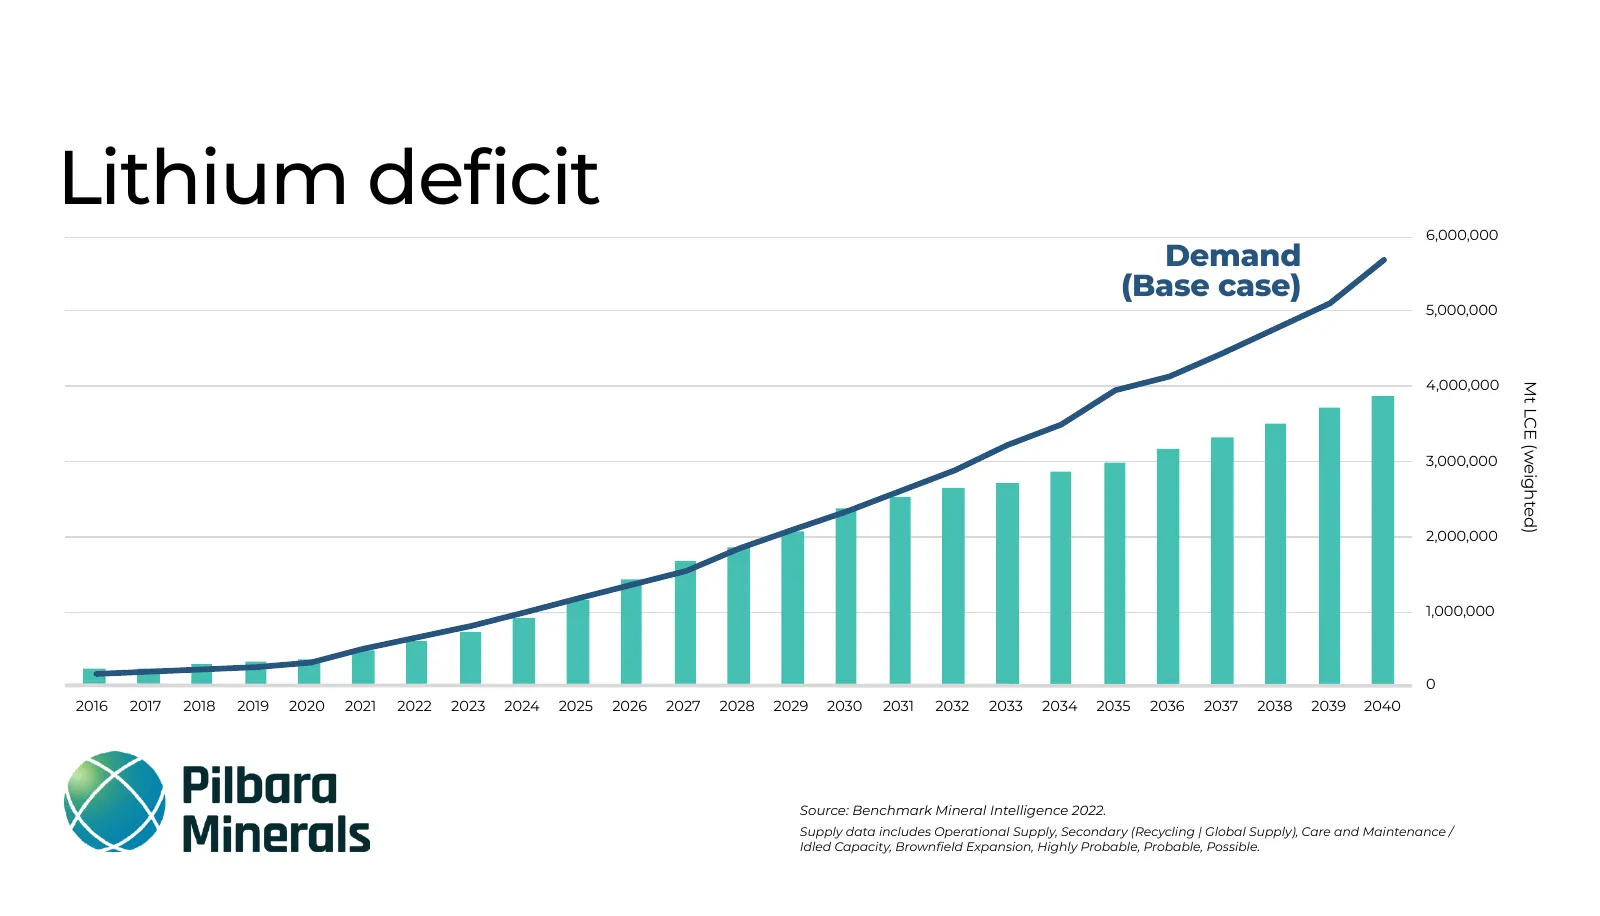
Slide 10: Lithium deficit
Lithium deficit 6,000,000 Demand (Base case) 5,000,000 4,000,000 Mt LCE (weighted) 3,000,000 2,000,000 1,000,000 0 2016 2017 2018 2019 2020 2021 2022 2023 2024 2025 2026 2027 2028 2029 2030 2031 2032 2033 2034 2035 2036 2037 2038 2039 2040 Source: Benchmark Mineral Intelligence 2022. Supply data inc
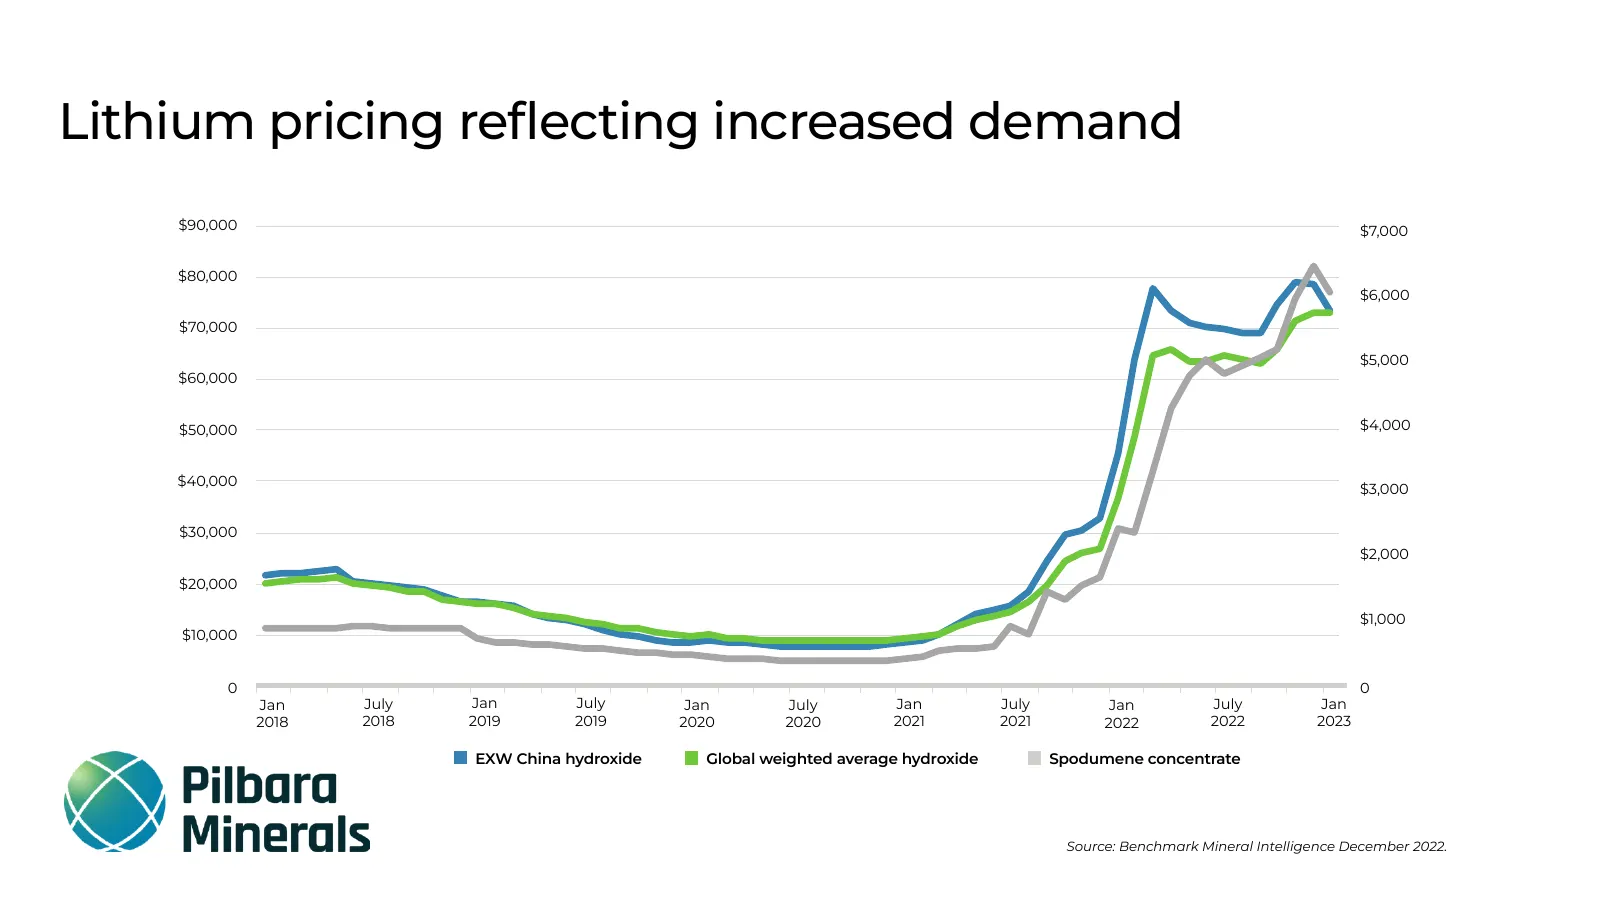
Slide 11: Lithium pricing reflecting increased demand
Lithium pricing reflecting increased demand $90,000 $7,000 $80,000 $6,000 $70,000 $5,000 $60,000 $50,000 $4,000 $40,000 $3,000 $30,000 $2,000 $20,000 $1,000 $10,000 0 0 Jan July Jan July Jan July Jan July Jan July Jan 2018 2018 2019 2019 2020 2020 2021 2021 2022 2022 2023 EXW China hydroxide Global

Slide 12: The Pilbara Minerals story
The Pilbara Minerals story So Pilbara Minerals
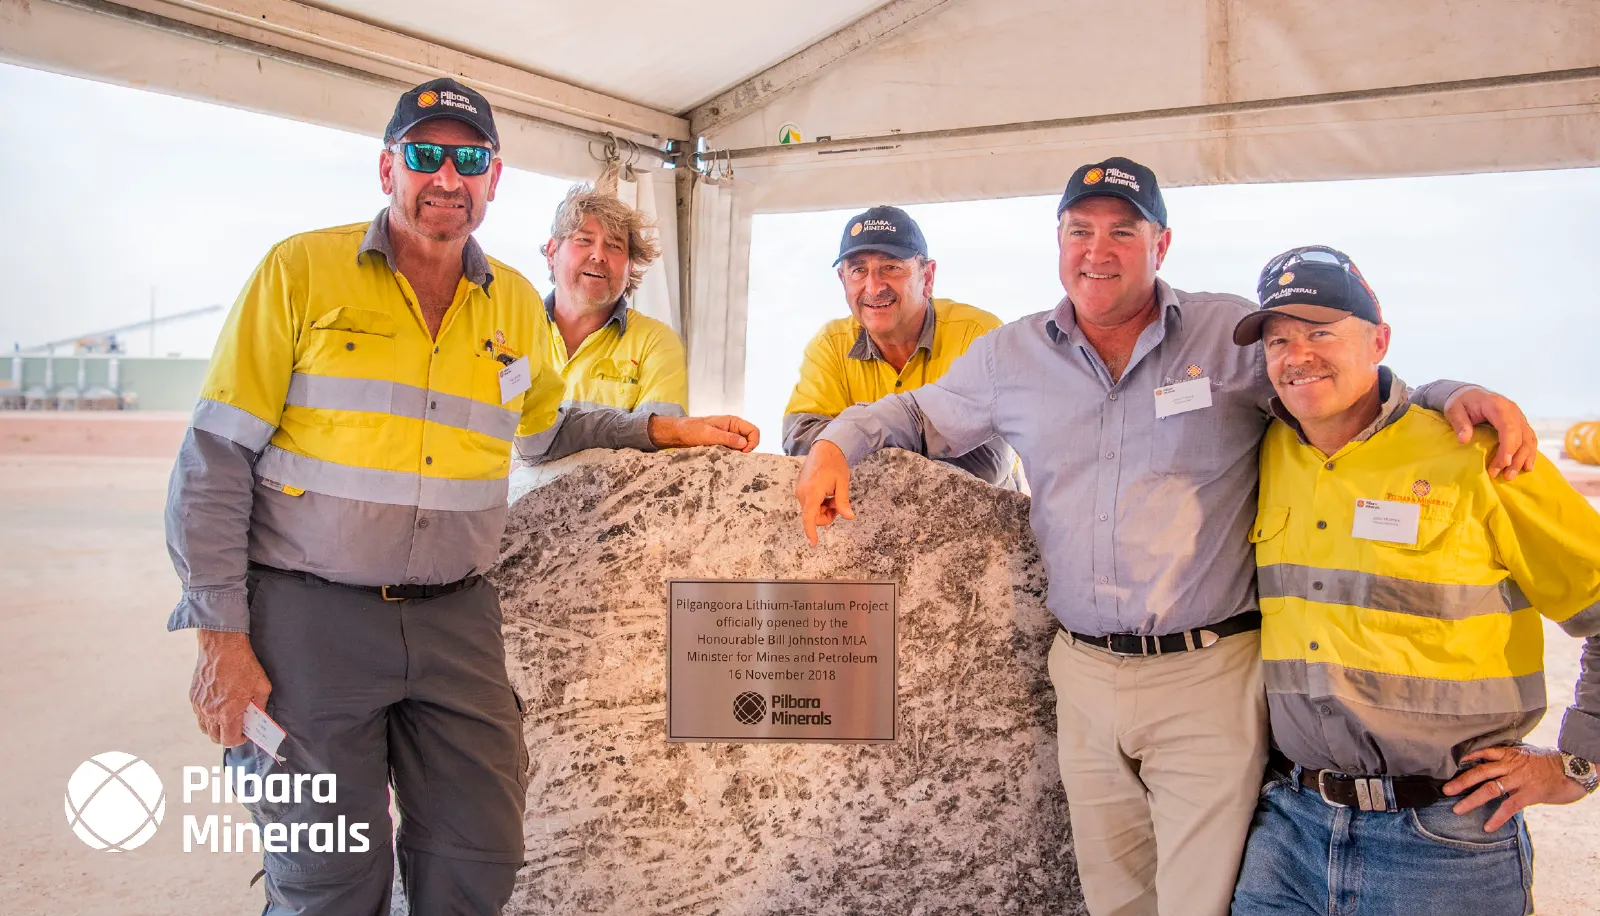
Slide 13
Slide 14: Production
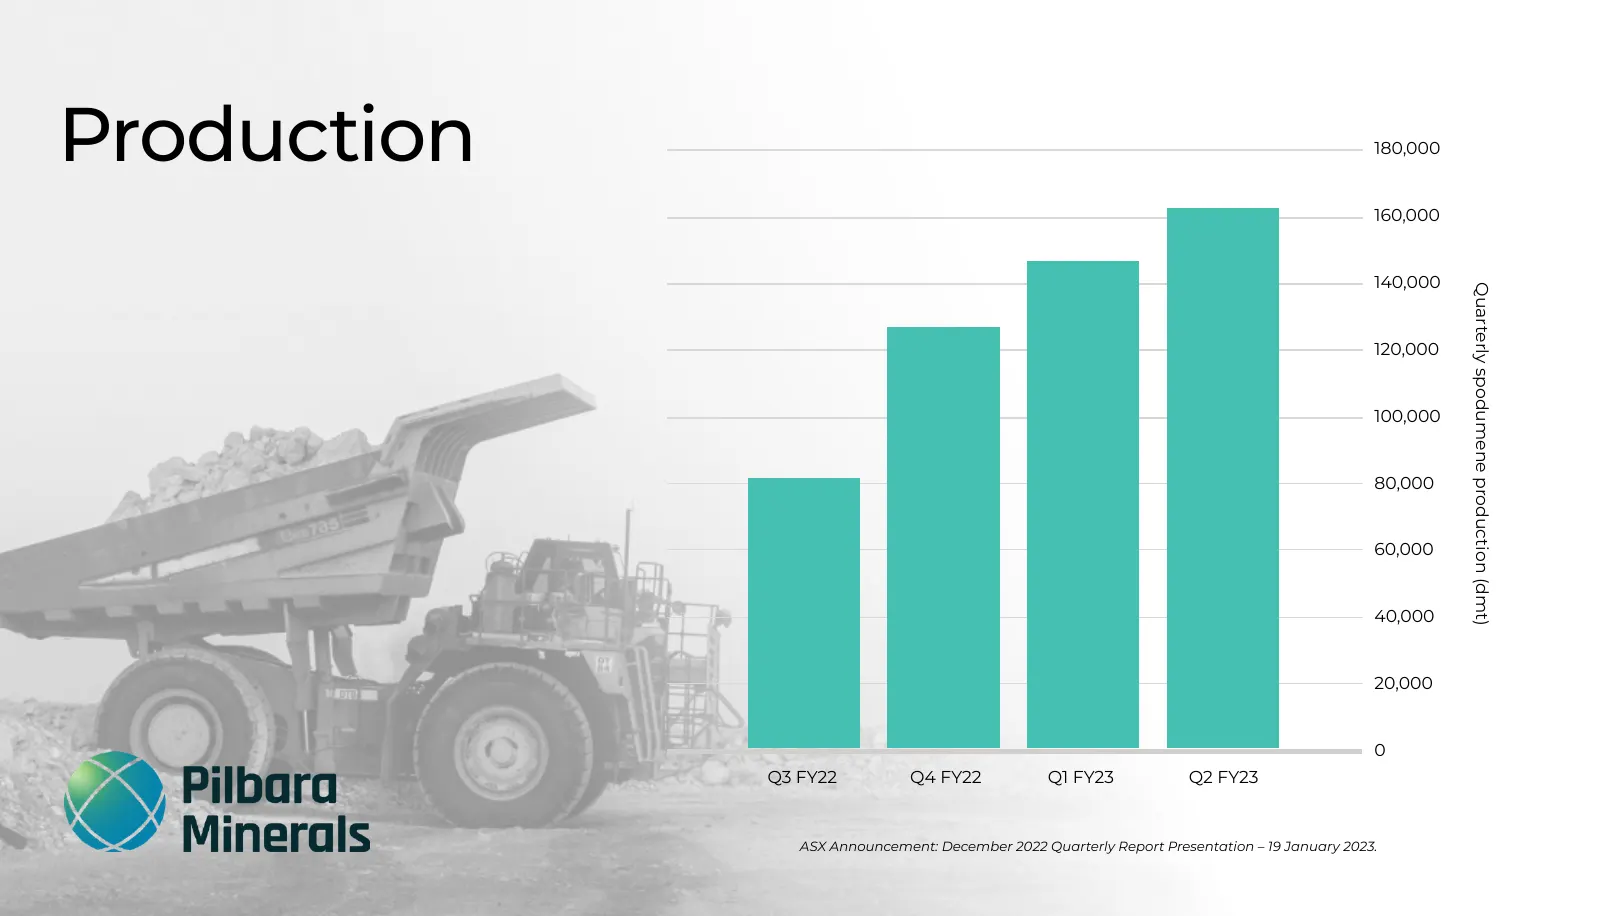
Production 180,000 160,000 140,000 Quarterly spodumene production (dmt) 120,000 100,000 80,000 60,000 40,000 20,000 0 Q3 FY22 Q4 FY22 Q1 FY23 Q2 FY23 ASX Announcement: December 2022 Quarterly Report Presentation – 19 January 2023.
Slide 15: Expansion pathway to 1Mtpa
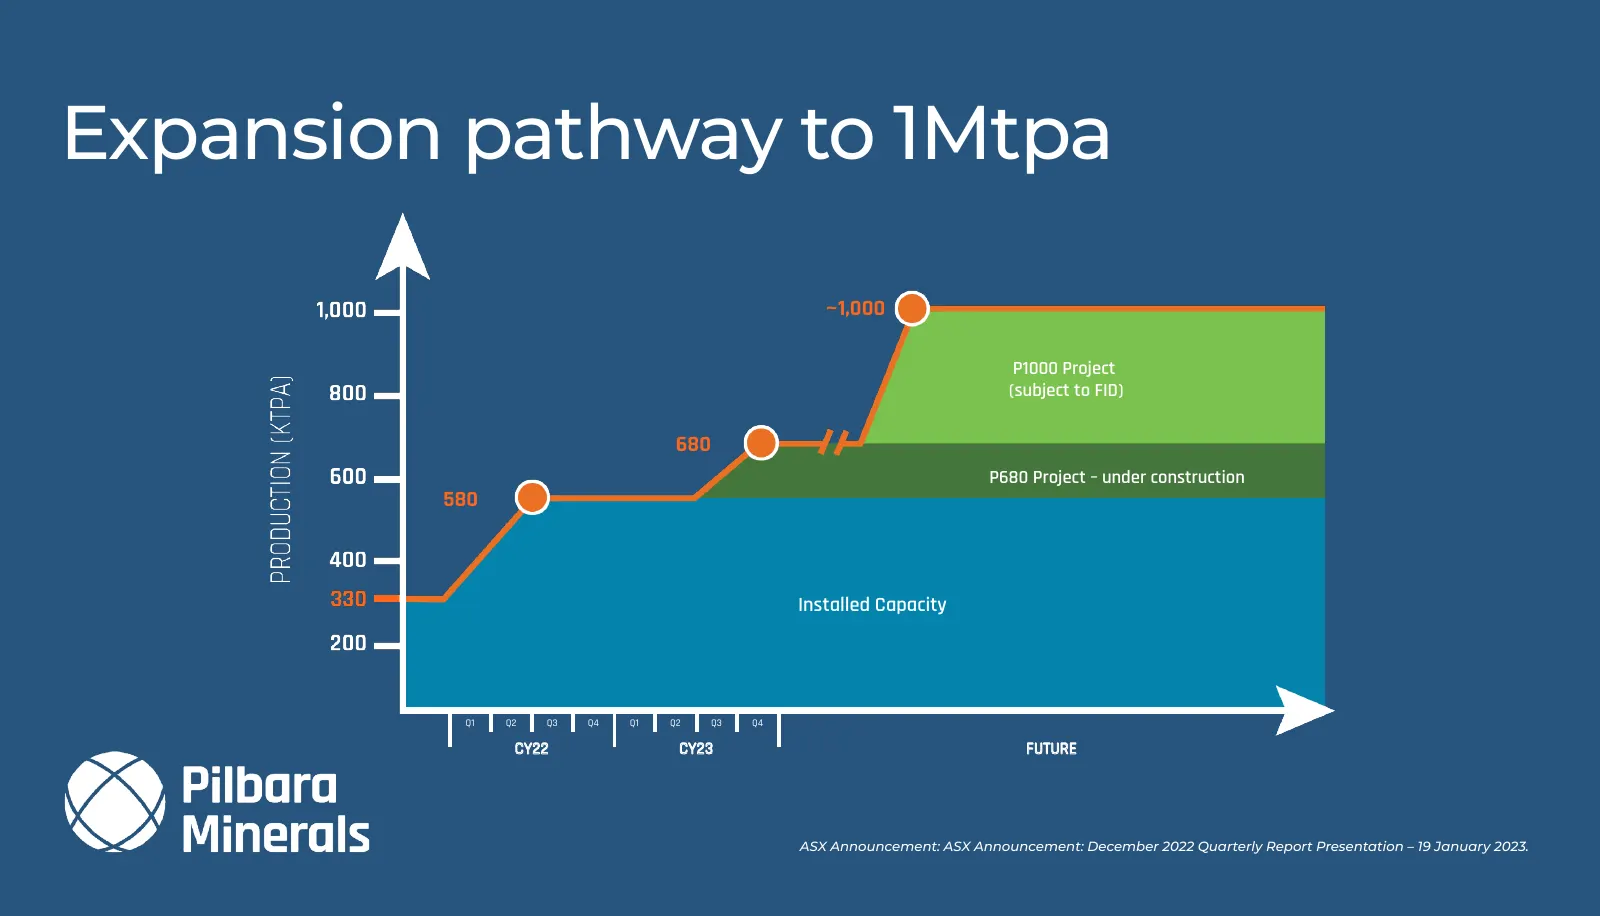
Expansion pathway to 1Mtpa ~1,000 P1000 Project (subject to FID) 680 P680 Project – under construction 580 Installed Capacity Q1 Q2 Q3 Q4 Q1 Q2 Q3 Q4 CY22 CY23 FUTURE ASX Announcement: ASX Announcement: December 2022 Quarterly Report Presentation – 19 January 2023.
Slide 16: Downstream lithium chemicals production
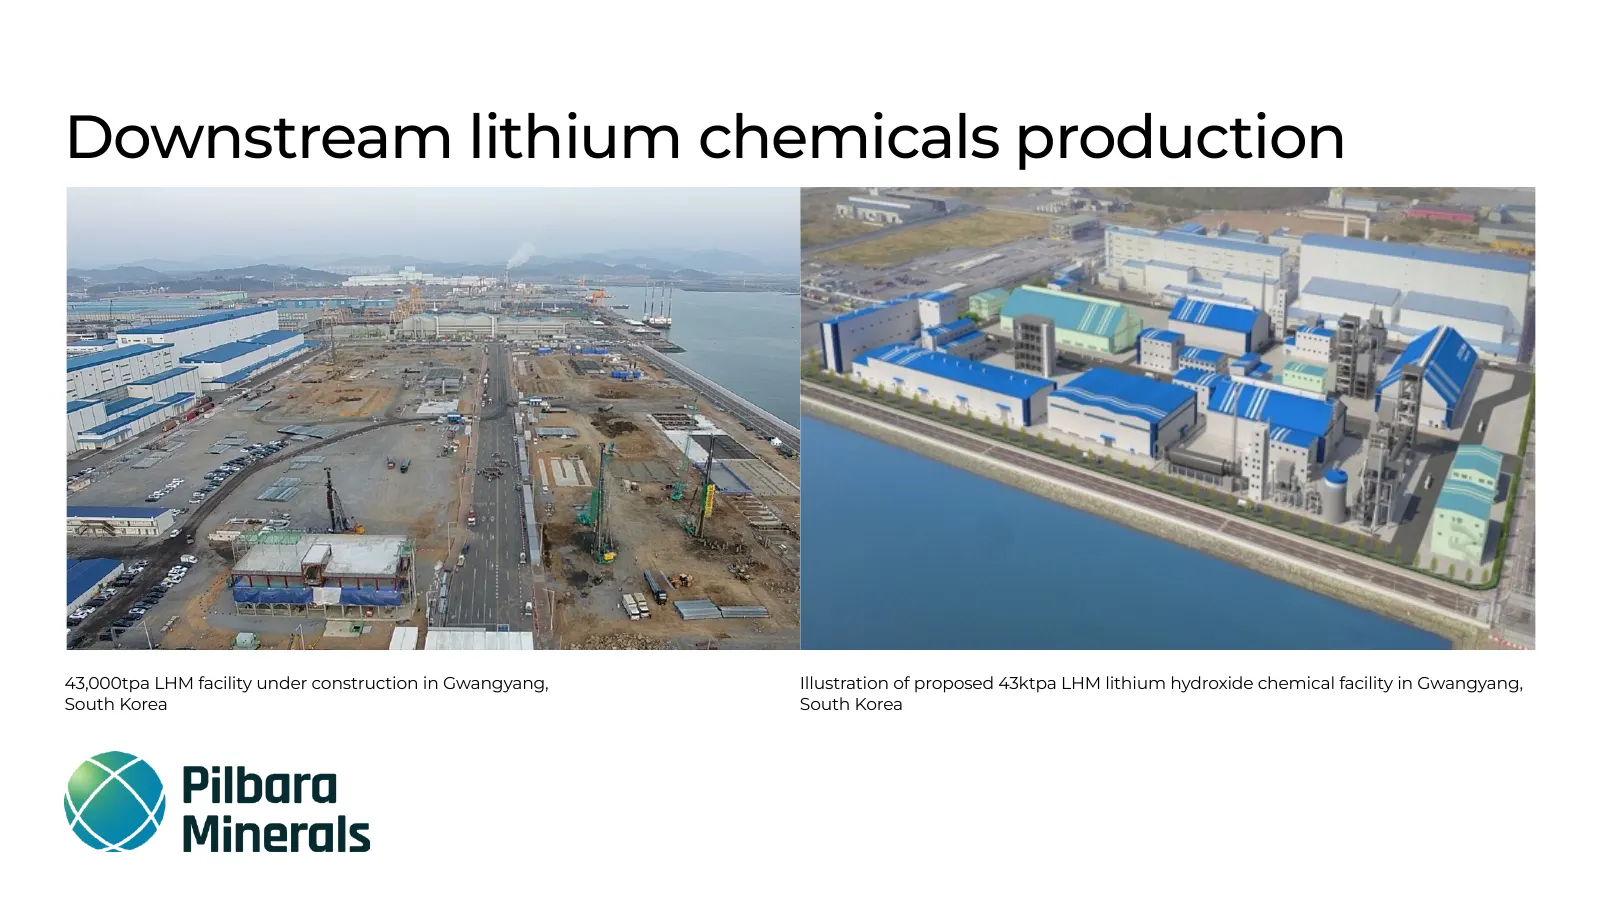
Downstream lithium chemicals production 43,000tpa LHM facility under construction in Gwangyang, Illustration of proposed 43ktpa LHM lithium hydroxide chemical facility in Gwangyang, South Korea South Korea
Slide 17: Midstream lithium chemicals R&D
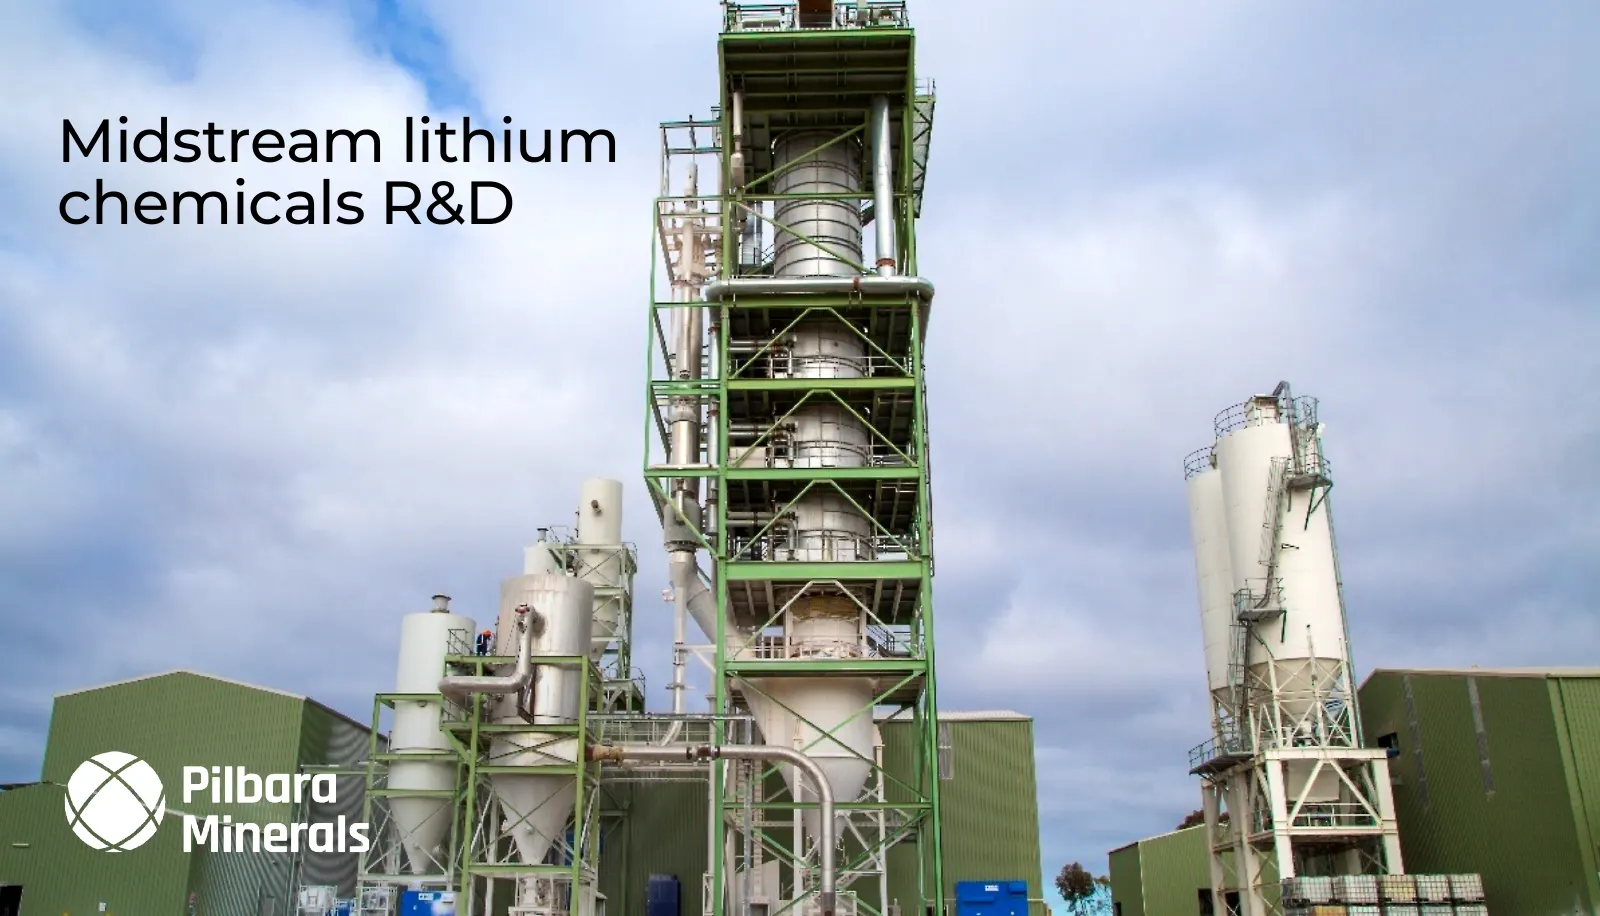
Midstream lithium chemicals R&D
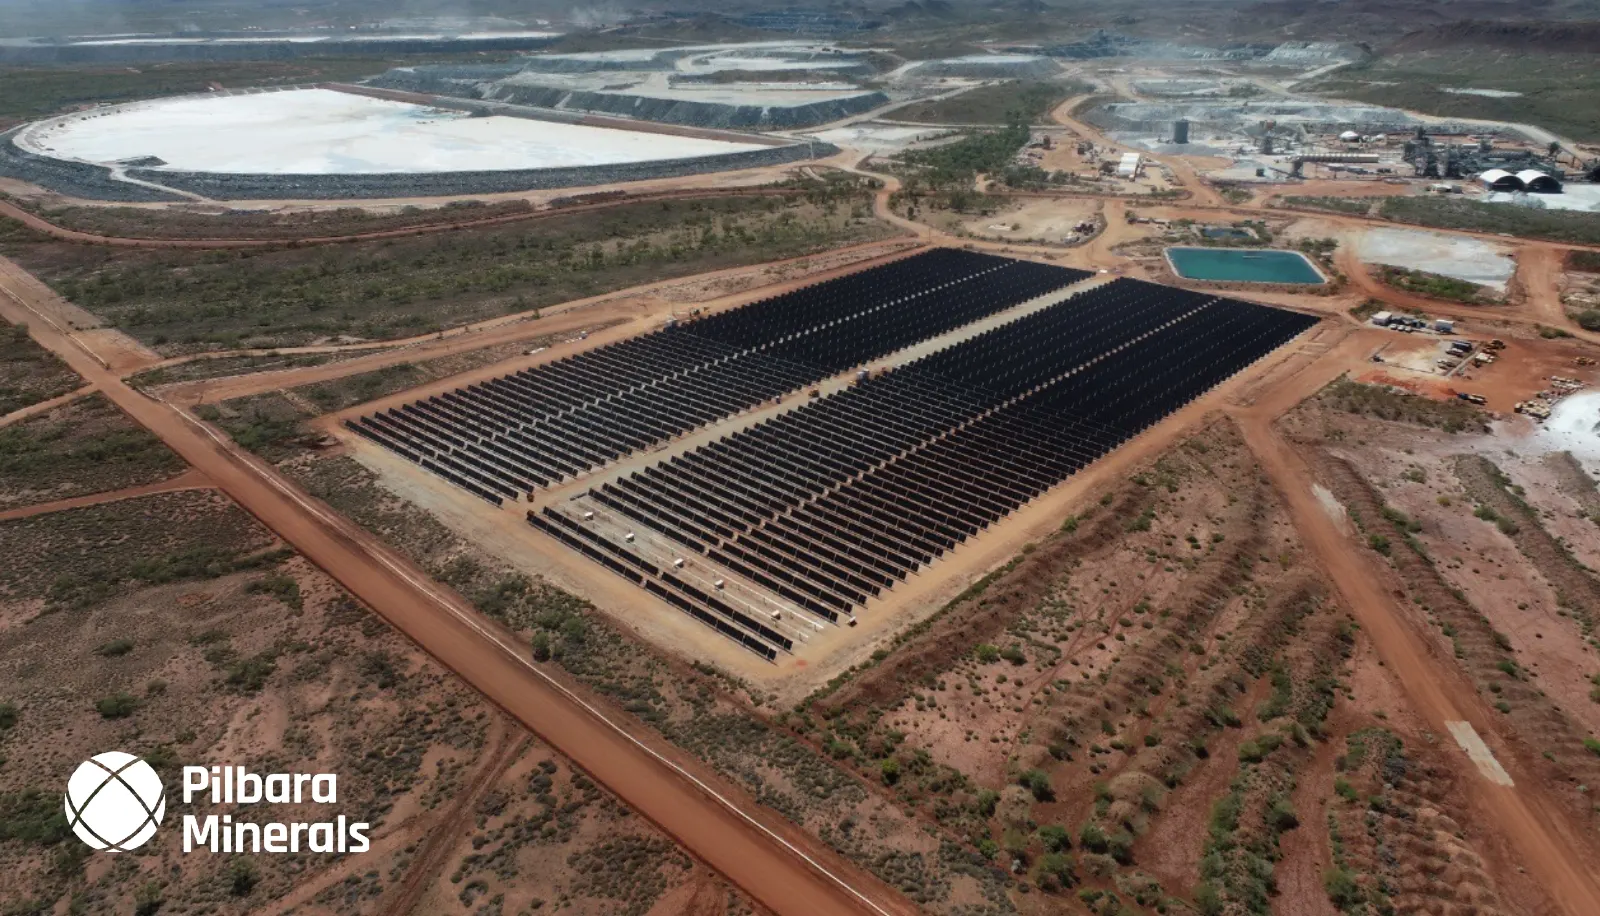
Slide 18: @ bora
@ bora
Slide 19: The opportunity for Australia
The opportunity for Australia
Slide 20: Thank you
Thank you vy Pilbara ~ Minerals
Source: Internet Archive copy of pls.com
More decks from PLS Group Limited
 Q1 FY2027 Earnings Presentation29 slides · Oct 28, 2026
 Investor Presentation (October 2026)45 slides · Oct 16, 2026
 FY2026 Earnings Presentation43 slides · Aug 24, 2026
 Diggers and Dealers 202626 slides · Aug 5, 2026
 Q4 FY2026 Earnings Presentation26 slides · Jul 30, 2026
 Fastmarkets Global Lithium, Battery and Critical Minerals Conference 202614 slides · Jun 23, 2026