Rowan Companies — Credit Suisse Energy Summit 2012
37 slides from Rowan Companies's conference presentation, Feb 6, 2012
Slide 1: Strategic Focus - Credit Suisse Energy Summit
STRATEGIC FOCUS 1 Credit Suisse Energy Summit Matt Ralls, President & CEO February 8, 2012 | Vail, Colorado
Slide 2: Forward-Looking Statements
2 Forward - Looking Statements This report contains forward looking statements within the meaning of the Private Securities Litigation Reform Act of 1995, including, without limitation, statements as to the expectations, beliefs and future expected financial performance of the Company that are based
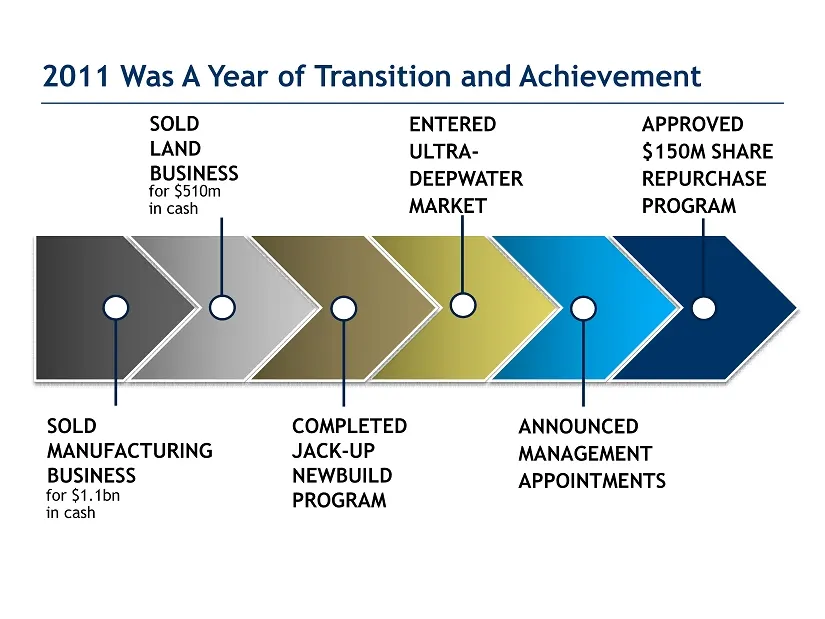
Slide 3: 2011 Was a Year of Transition and Achievement
3 2011 Was A Year of Transition and Achievement for $1.1bn in cash SOLD MANUFACTURING BUSINESS ENTERED ULTRA - DEEPWATER MARKET APPROVED $150M SHARE REPURCHASE PROGRAM ANNOUNCED MANAGEMENT APPOINTMENTS for $510m in cash SOLD LAND BUSINESS COMPLETED JACK - UP NEWBUILD PROGRAM
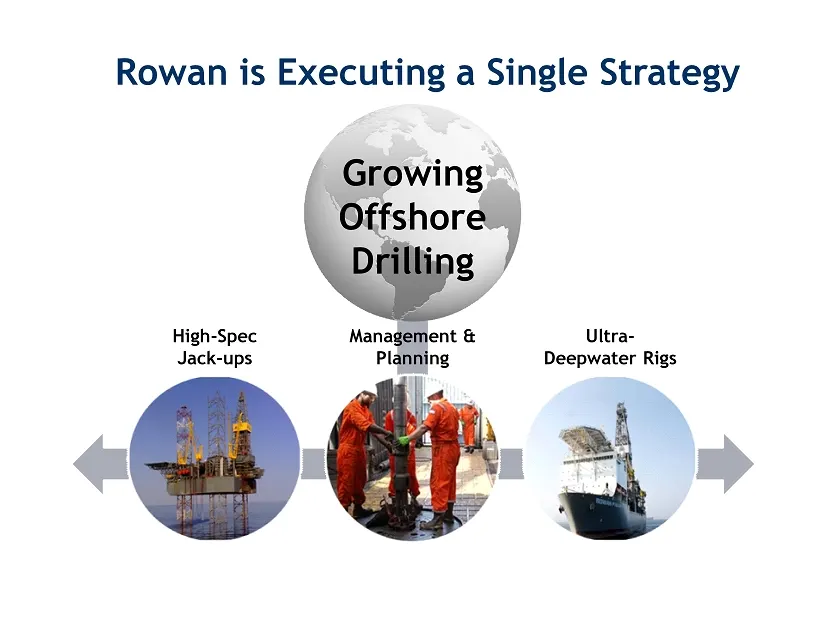
Slide 4: Rowan is Executing a Single Strategy
4 Growing Offshore Drilling Rowan is Executing a Single Strategy High - Spec Jack - ups Management & Planning Ultra - Deepwater Rigs
Slide 5: Rowan Highlights
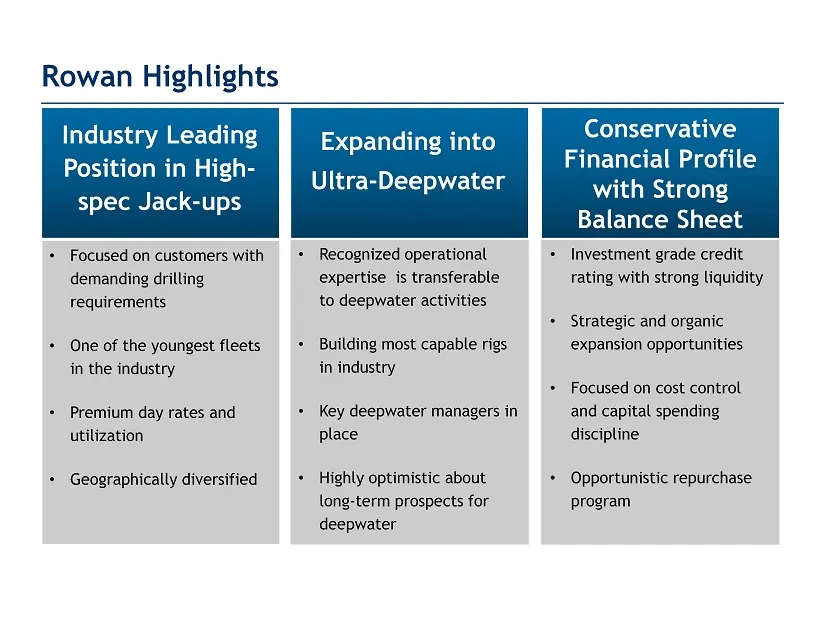
5 Rowan Highlights • Focused on customers with demanding drilling requirements • One of the youngest fleets in the industry • Premium day rates and utilization • Geographically diversified Industry Leading Position in High - spec Jack - ups Expanding into Ultra - Deepwater • Recognized operational e
Slide 6: Rowan has an Industry Leading Position in High-spec Jack-ups
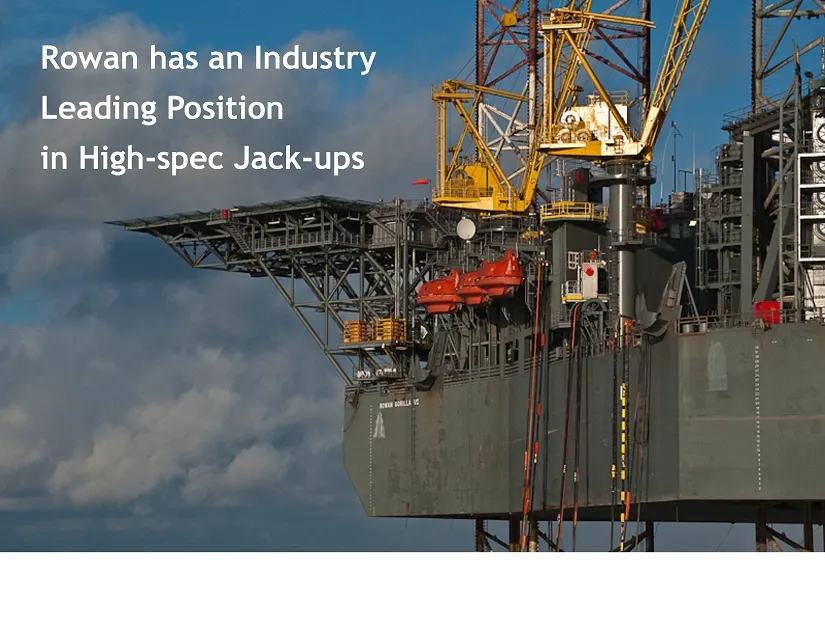
6 Rowan has an Industry Leading Position in High - spec Jack - ups
Slide 7: Rowan has Dramatically Expanded its Offshore Fleet
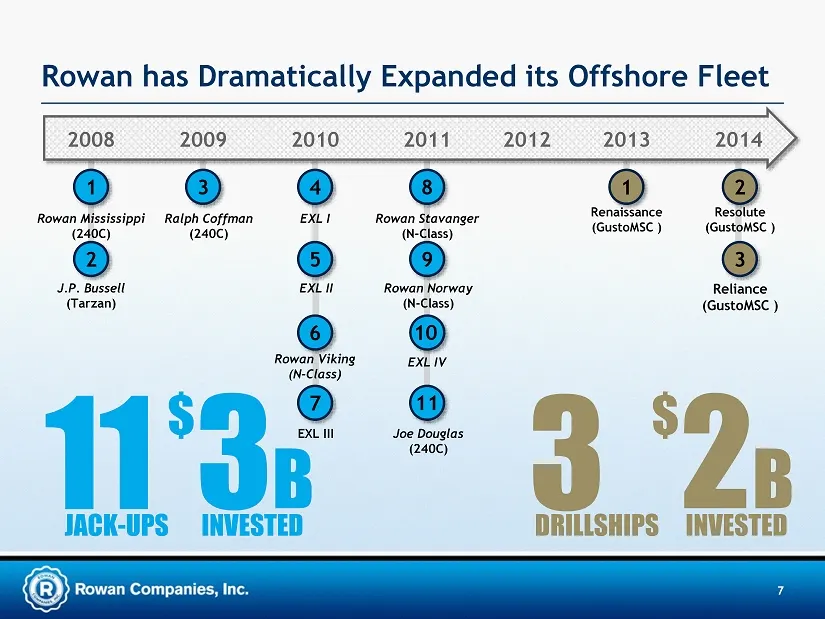
7 Rowan has Dramatically Expanded its Offshore Fleet 2012 2013 2014 2008 1 2 2009 3 2010 5 4 7 6 2011 9 8 10 11 11 JACK - UPS 3 B INVESTED $ 1 3 2 Rowan Mississippi (240C) J.P. Bussell (Tarzan) Ralph Coffman (240C) EXL I EXL II Rowan Viking (N - Class) EXL III Rowan Stavanger (N - Class) Rowan Norwa
Slide 8: Rowan's Offshore Fleet Focuses on Demanding Drilling
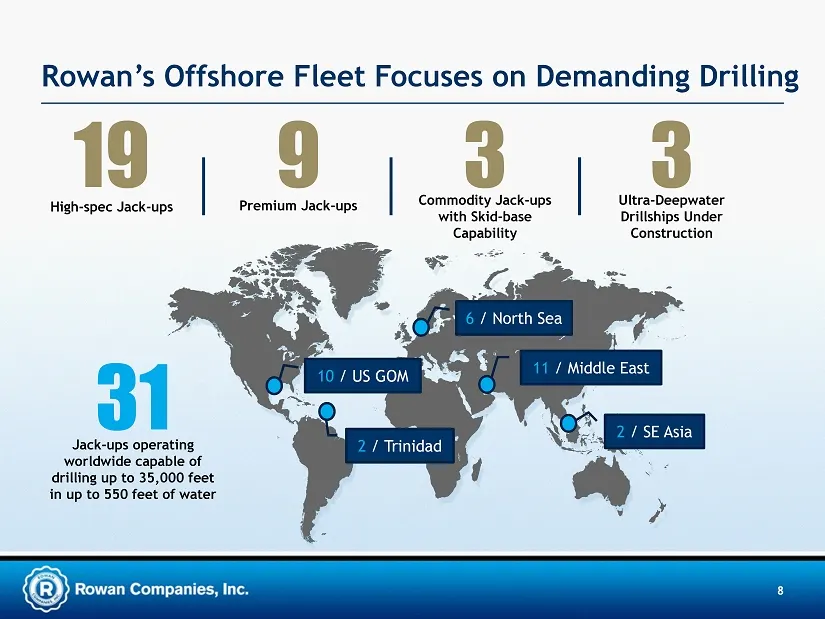
Rowan’s Offshore Fleet Focuses on Demanding Drilling 8 6 / North Sea 11 / Middle East 2 / SE Asia 19 High - spec Jack - ups 9 Premium Jack - ups 3 Commodity Jack - ups with Skid - base Capability 31 Jack - ups operating worldwide capable of drilling up to 35,000 feet in up to 550 feet of water 10 /
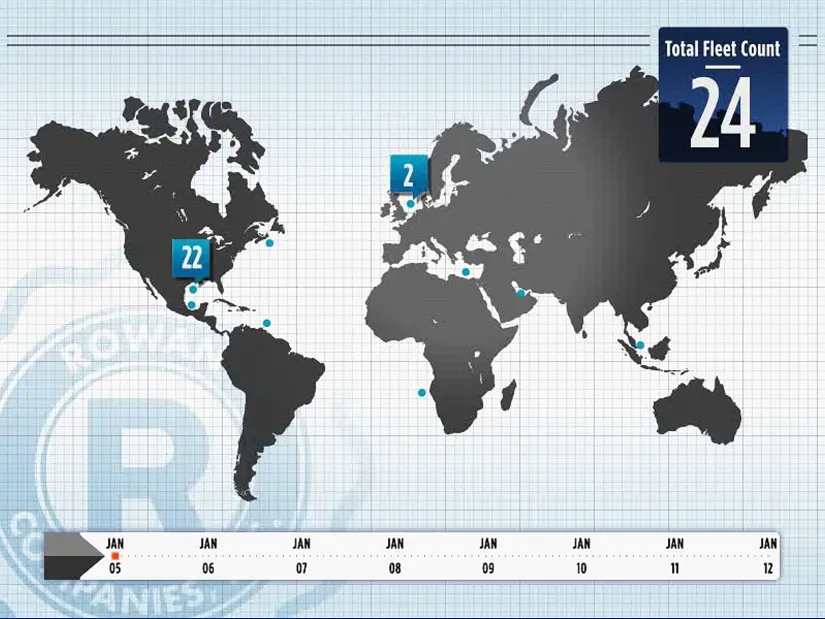
Slide 9: Total Fleet Count
Total Fleet Count 24
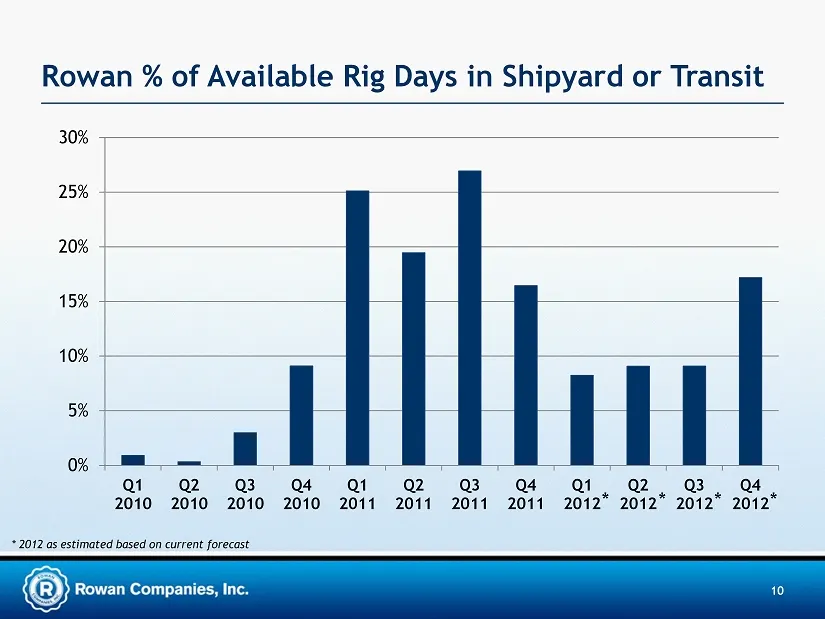
Slide 10: Rowan % of Available Rig Days in Shipyard or Transit
10 Rowan % of Available Rig Days in Shipyard or Transit 0% 5% 10% 15% 20% 25% 30% Q1 2010 Q2 2010 Q3 2010 Q4 2010 Q1 2011 Q2 2011 Q3 2011 Q4 2011 Q1 2012 Q2 2012 Q3 2012 Q4 2012 * 2012 as estimated based on current forecast * * * *
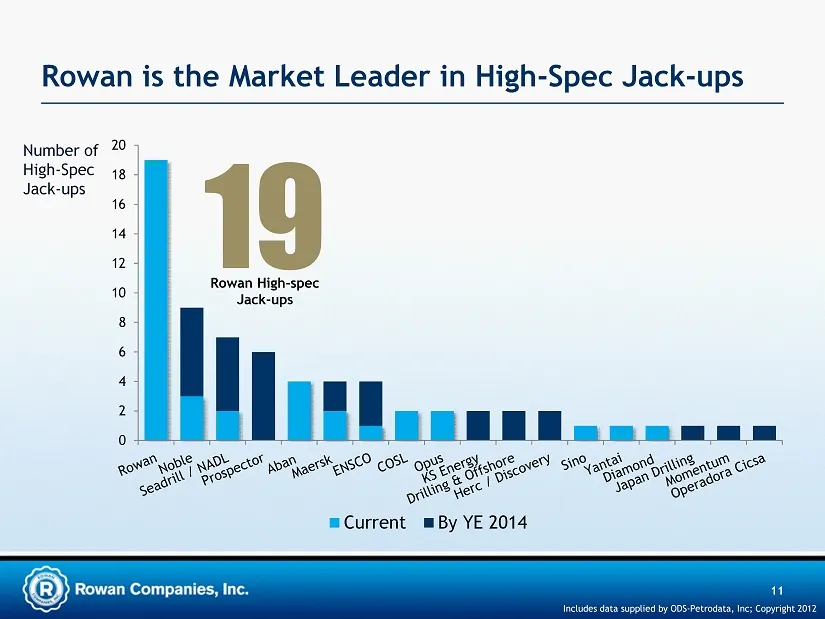
Slide 11: Rowan is the Market Leader in High-Spec Jack-ups
11 Rowan is the Market Leader in High - Spec Jack - ups Number of High - Spec Jack - ups 0 2 4 6 8 10 12 14 16 18 20 Current By YE 2014 Includes data supplied by ODS - Petrodata , Inc; Copyright 2012 19 Rowan High - spec Jack - ups
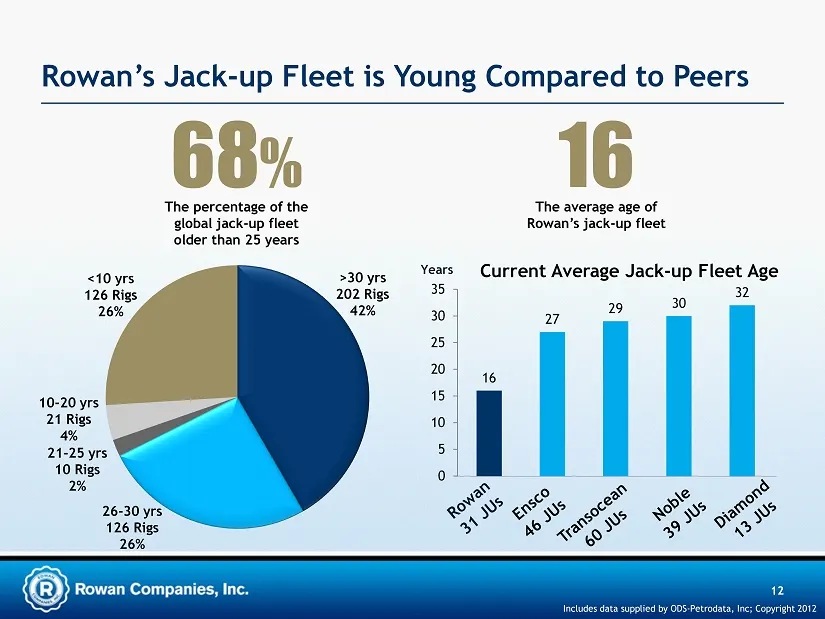
Slide 12: Rowan's Jack-up Fleet is Young Compared to Peers
Years Current Average Jack - up Fleet Age Rowan’s Jack - up Fleet is Young Compared to Peers Includes data supplied by ODS - Petrodata , Inc; Copyright 2012 12 >30 yrs 202 Rigs 42% 26 - 30 yrs 126 Rigs 26% 21 - 25 yrs 10 Rigs 2 % 10 - 20 yrs 21 Rigs 4% <10 yrs 126 Rigs 26% 16 27 29 30 32 0 5 10 15 2
Slide 13: Rowan Consistently Leads in Rates and Utilization
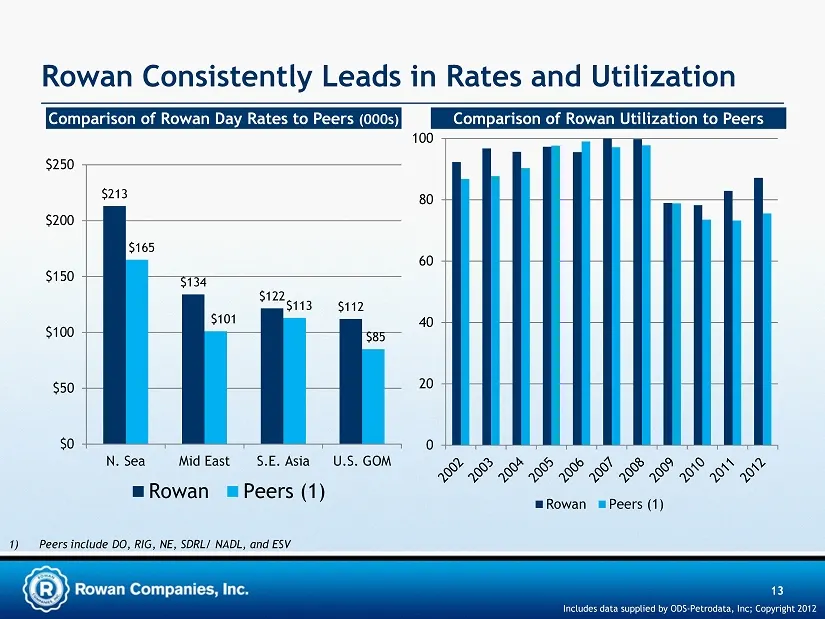
13 Rowan Consistently Leads in Rates and Utilization Comparison of Rowan Day Rates to Peers (000s) Comparison of Rowan Utilization to Peers 0 20 40 60 80 100 Rowan Peers (1) 1) Peers include DO, RIG, NE, SDRL/ NADL, and ESV $213 $134 $122 $112 $165 $101 $113 $85 $0 $50 $100 $150 $200 $250 N. Sea Mid
Slide 14: Worldwide Jack-up Utilization by Region
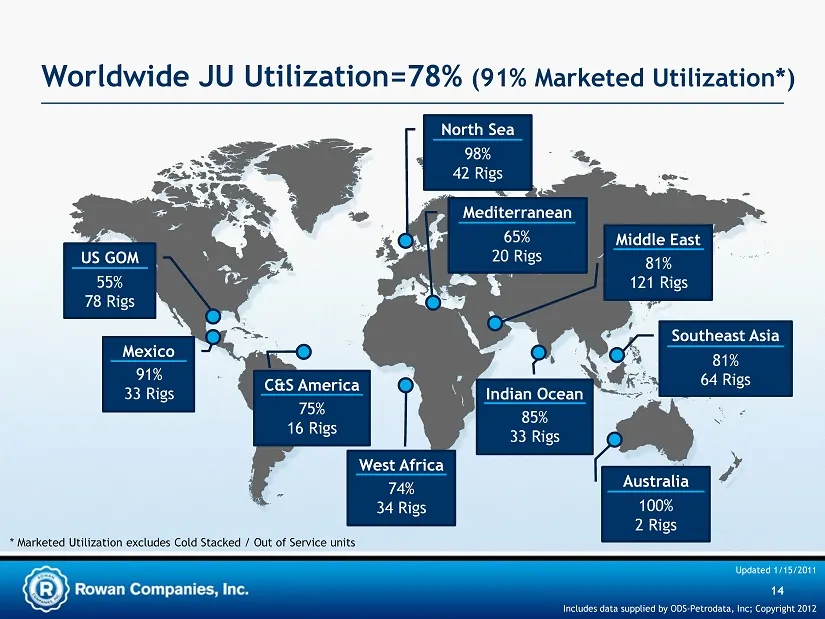
14 Worldwide JU Utilization=78% (91% Marketed Utilization*) US GOM Indian Ocean North Sea Mediterranean Middle East Southeast Asia Mexico C&S America West Africa Australia 55% 78 Rigs 91% 33 Rigs 75% 16 Rigs 74% 34 Rigs 85% 33 Rigs 100% 2 Rigs 81% 64 Rigs 81% 121 Rigs 65% 20 Rigs 98% 42 Rigs * Marke
Slide 15: Increasing Demand for High-End Jack-ups
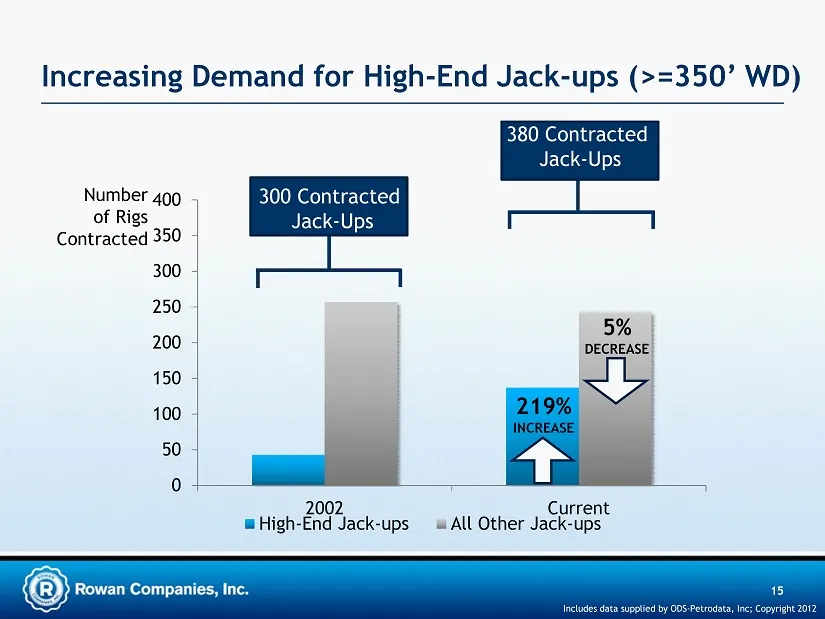
0 50 100 150 200 250 300 350 400 2002 Current High-End Jack-ups All Other Jack-ups 15 Increasing Demand for High - End Jack - ups (>=350’ WD) Number of Rigs Contracted 300 Contracted Jack - Ups 380 Contracted Jack - Ups 219% INCREASE 5% DECREASE Includes data supplied by ODS - Petrodata , Inc; Copyr
Slide 16: What's Driving Demand for Higher-Spec Rigs?
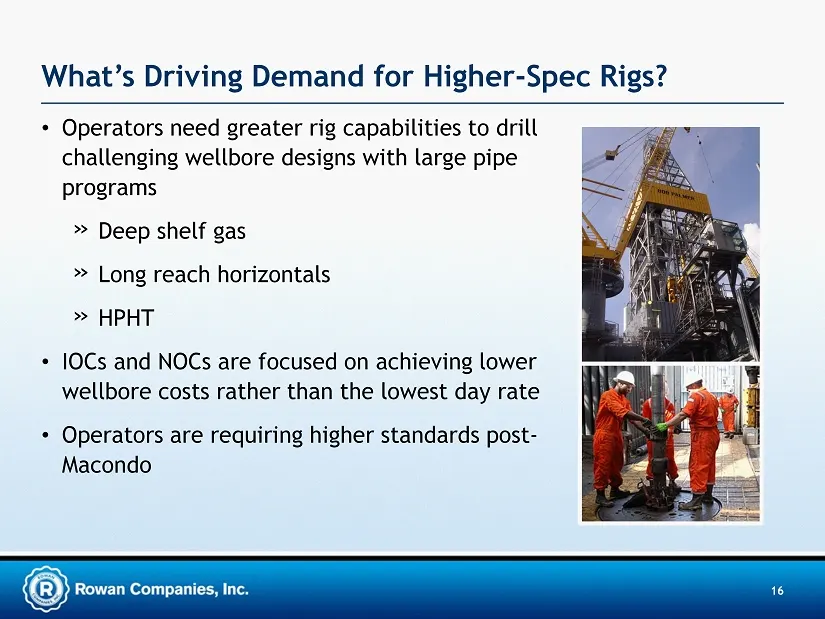
16 What’s Driving Demand for Higher - Spec Rigs? • Operators need greater rig capabilities to drill challenging wellbore designs with large pipe programs » Deep shelf gas » Long reach horizontals » HPHT • IOCs and NOCs are focused on achieving lower wellbore costs rather than the lowest day rate • O
Slide 17: Utilization at ~95% for Highest Capability Jack-ups
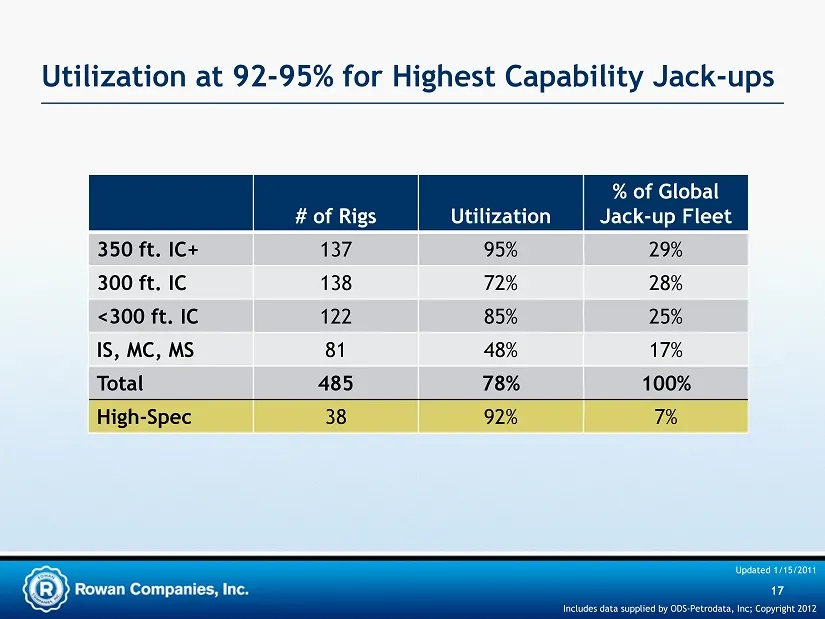
17 Utilization at 92 - 95% for Highest Capability Jack - ups # of Rigs Utilization % of Global Jack - up Fleet 350 ft. IC+ 137 95% 29% 300 ft. IC 138 72% 28% <300 ft. IC 122 85% 25% IS, MC, MS 81 48% 17% Total 485 78% 100% High - Spec 38 92% 7% Updated 1/15/2011 Includes data supplied by ODS - Petro
Slide 18: Jack-up Market has Bifurcated
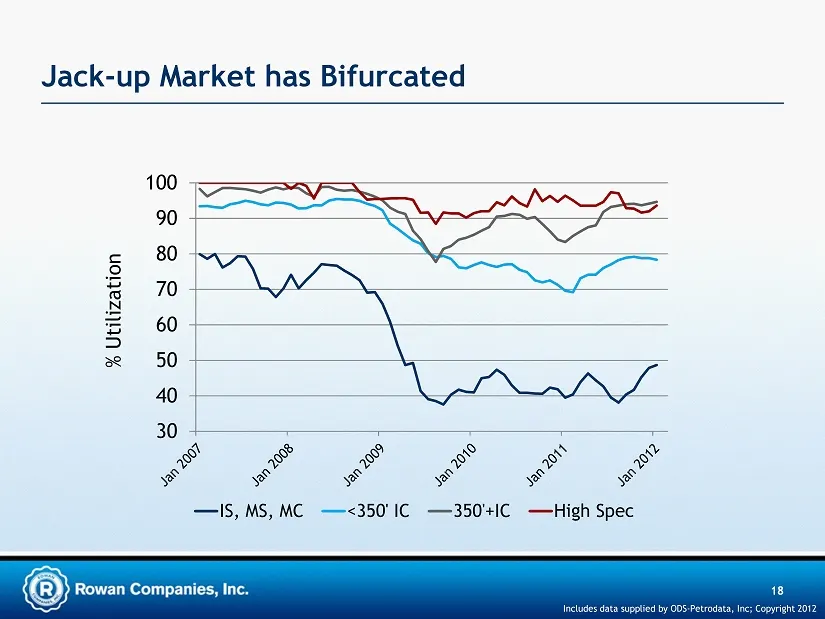
18 Jack - up Market has Bifurcated % Utilization 30 40 50 60 70 80 90 100 IS, MS, MC <350' IC 350'+IC High Spec Includes data supplied by ODS - Petrodata , Inc; Copyright 2012
Slide 19: More Capable Jack-ups Command Higher Rates
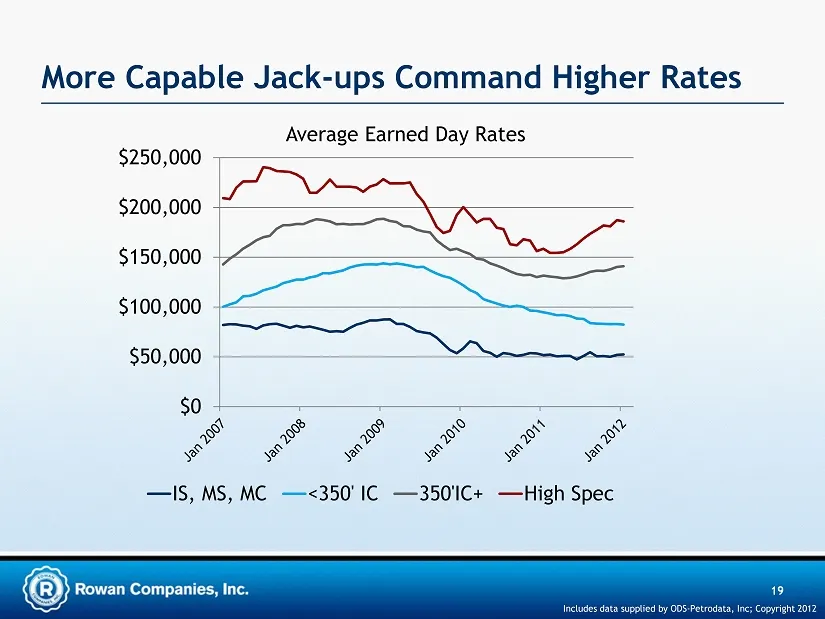
19 More Capable Jack - ups Command Higher Rates $0 $50,000 $100,000 $150,000 $200,000 $250,000 IS, MS, MC <350' IC 350'IC+ High Spec Average Earned Day Rates Includes data supplied by ODS - Petrodata , Inc; Copyright 2012
Slide 20: International Tender and Inquiry Activity for Rowan Rigs
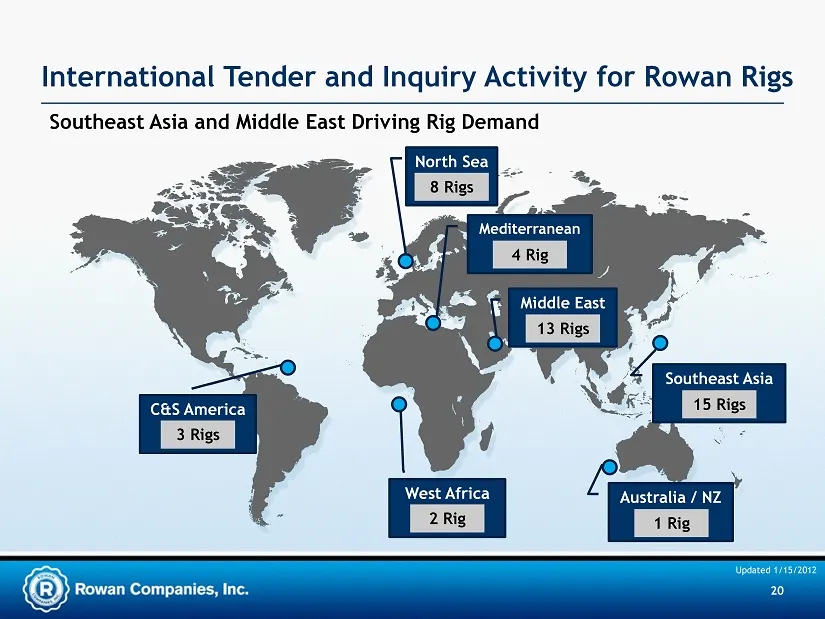
International Tender and Inquiry Activity for Rowan Rigs C&S America North Sea Mediterranean 8 Rigs Middle East Southeast Asia 3 Rigs 13 Rigs 15 Rigs 4 Rig Australia / NZ 1 Rig West Africa 2 Rig Southeast Asia and Middle East Driving Rig Demand 20 Updated 1/15/2012
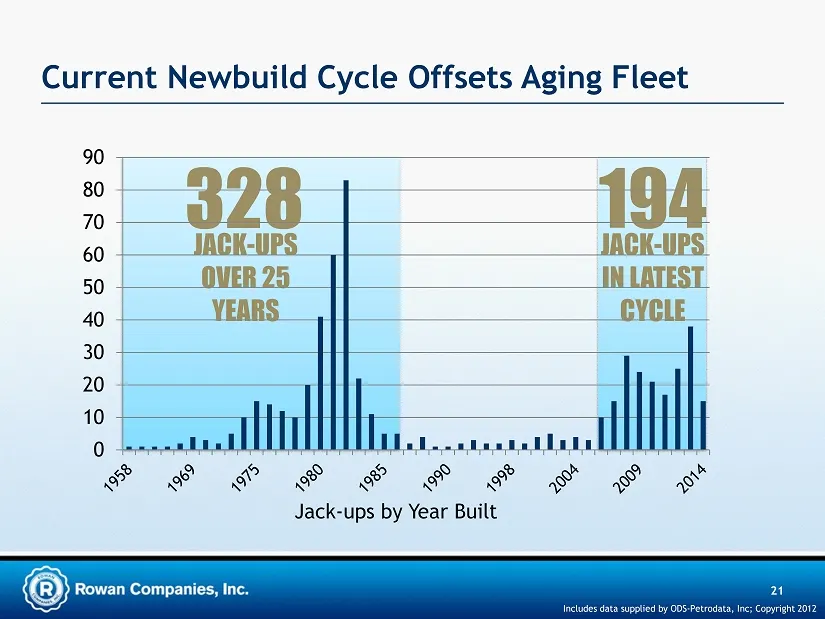
Slide 21: Current Newbuild Cycle Offsets Aging Fleet
328 JACK - UPS OVER 25 YEARS 194 JACK - UPS IN LATEST CYCLE Current Newbuild Cycle Offsets Aging Fleet Jack - ups by Year Built 21 Includes data supplied by ODS - Petrodata , Inc; Copyright 2012 0 10 20 30 40 50 60 70 80 90
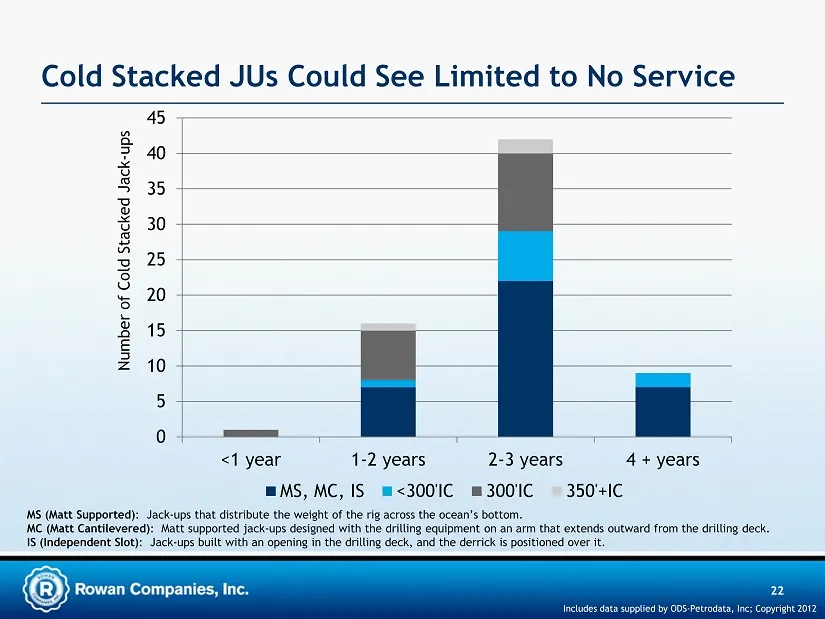
Slide 22: Cold Stacked Jack-ups Could See Limited to No Service
22 Cold Stacked JUs Could See Limited to No Service 0 5 10 15 20 25 30 35 40 45 <1 year 1-2 years 2-3 years 4 + years MS, MC, IS <300'IC 300'IC 350'+IC Number of Cold Stacked Jack - ups MS (Matt Supported) : Jack - ups that distribute the weight of the rig across the ocean’s bottom. MC (Matt Cantile
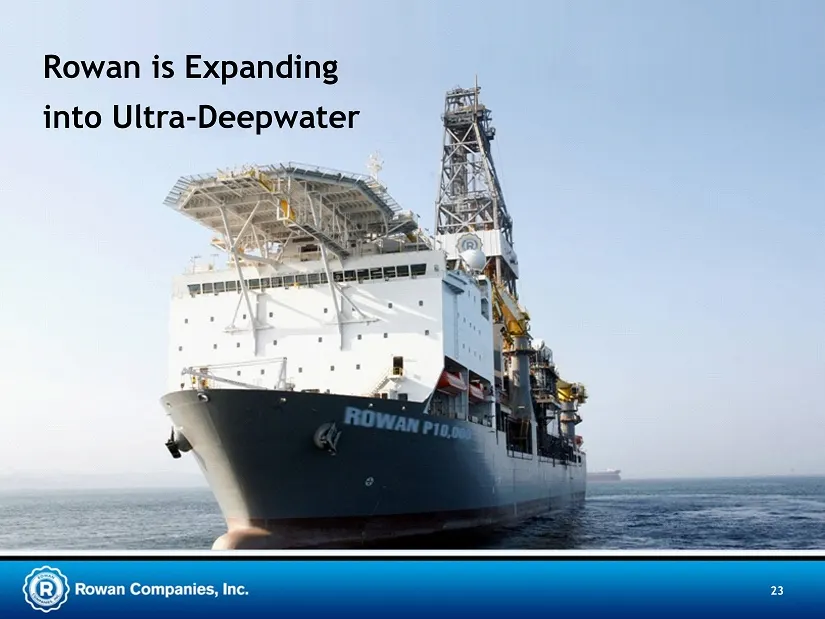
Slide 23: Rowan is Expanding into Ultra-Deepwater
23 Rowan is Expanding into Ultra - Deepwater
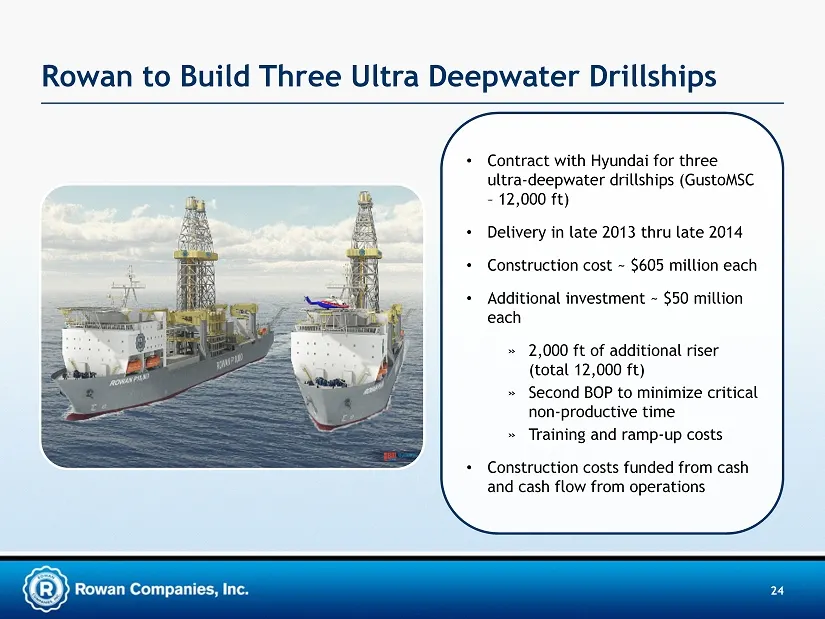
Slide 24: Rowan to Build Three Ultra Deepwater Drillships
24 Rowan to Build Three Ultra Deepwater Drillships • Contract with Hyundai for three ultra - deepwater drillships ( GustoMSC – 12,000 ft) • Delivery in late 2013 thru late 2014 • Construction cost ~ $605 million each • Additional investment ~ $50 million each » 2,000 ft of additional riser (total 12
Slide 25: Rowan UDW Design Provides a Competitive Advantage
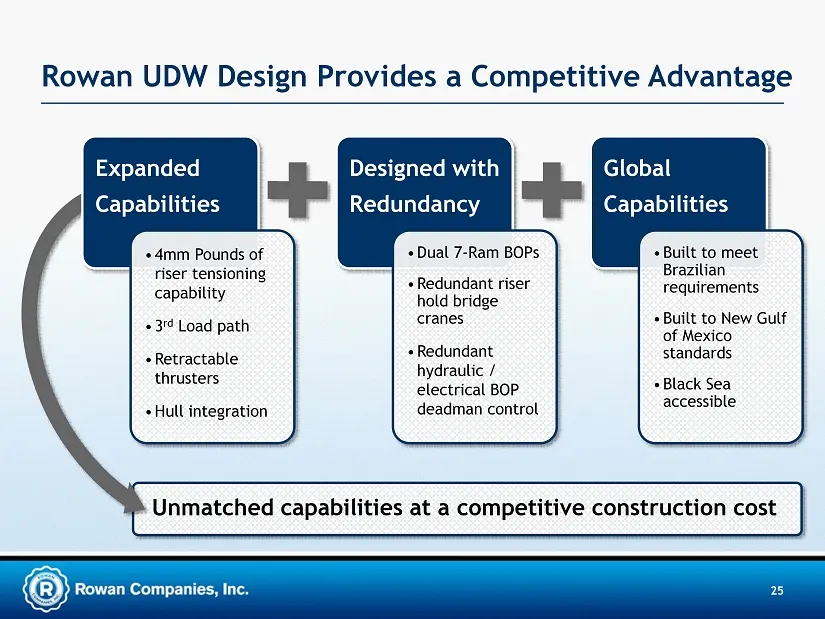
Unmatched capabilities at a competitive construction cost 25 Rowan UDW Design Provides a Competitive Advantage Expanded Capabilities Designed with Redundancy Global Capabilities • 4mm Pounds of riser tensioning capability • 3 rd Load path • Retractable thrusters • Hull integration • Dual 7 - Ram BOP
Slide 26: Rowan Drillship - Highest Capabilities
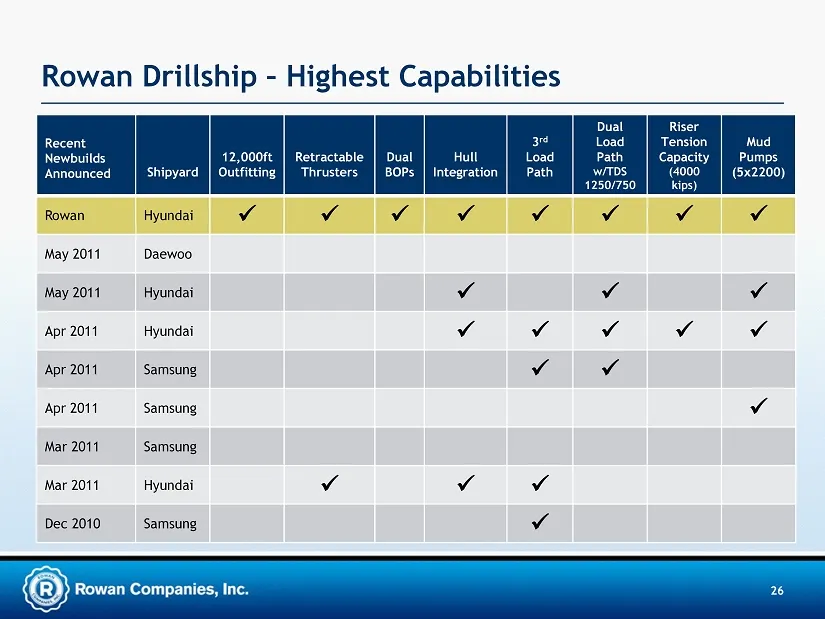
26 Rowan Drillship – Highest Capabilities Recent Newbuilds Announced Shipyard 12,000ft Outfitting Retractable Thrusters Dual BOPs Hull Integration 3 rd Load Path Dual Load Path w/TDS 1250/750 Riser Tension Capacity (4000 kips) Mud Pumps (5x2200) Rowan Hyundai x x x x x x x x May 2011 Daewoo May 2011
Slide 27: Rowan has Advantages in Entering UDW Market
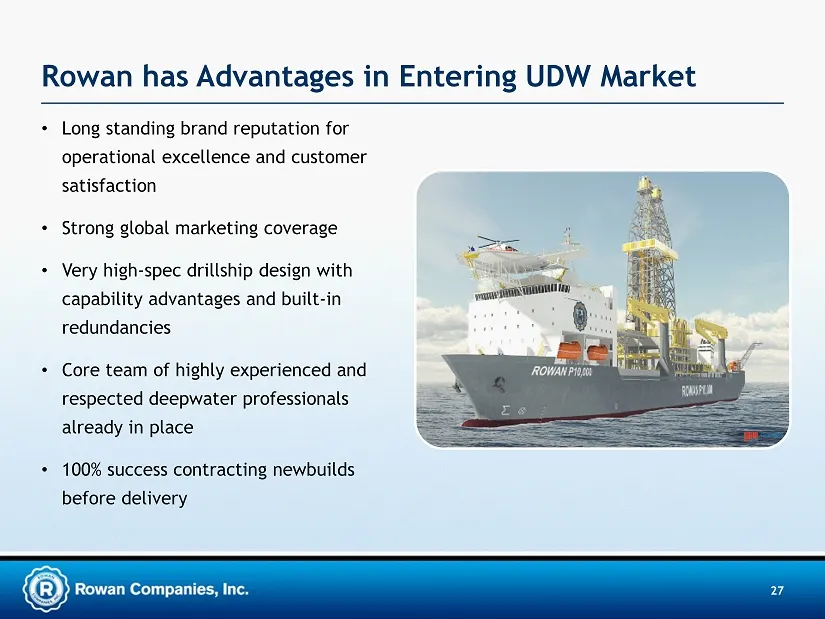
27 Rowan has Advantages in Entering UDW Market • Long standing brand reputation for operational excellence and customer satisfaction • Strong global marketing coverage • Very high - spec drillship design with capability advantages and built - in redundancies • Core team of highly experienced and res
Slide 28: Recent 10,000 ft Drillship Fixtures Yield Favorable Returns
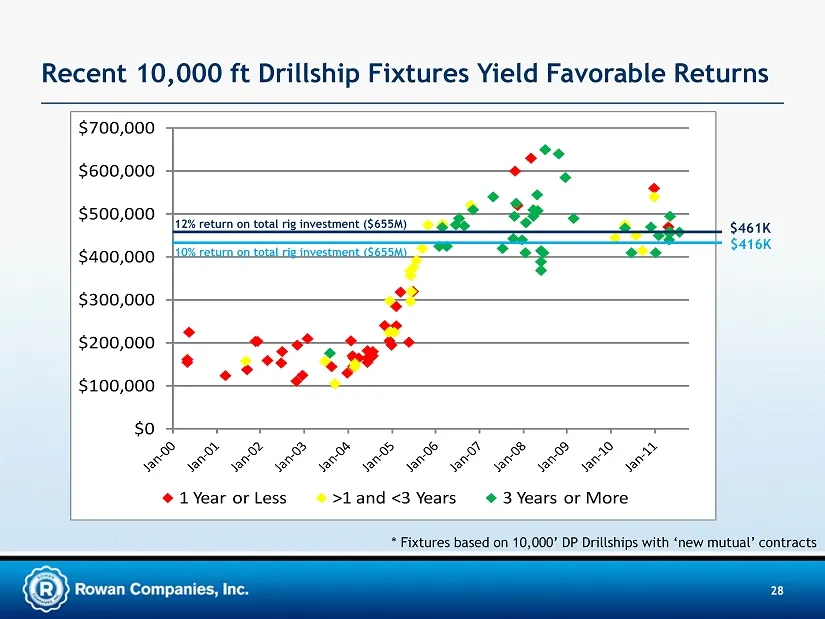
28 Recent 10,000 ft Drillship Fixtures Yield Favorable Returns $0 $100,000 $200,000 $300,000 $400,000 $500,000 $600,000 $700,000 1 Year or Less >1 and <3 Years 3 Years or More * Fixtures based on 10,000’ DP Drillships with ‘new mutual’ contracts 12% return on total rig investment ($655M) 10% return
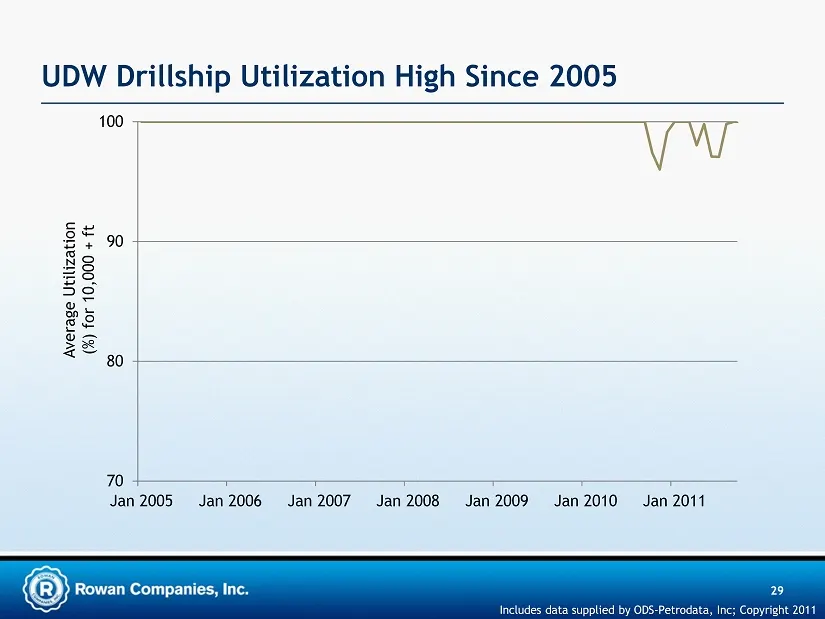
Slide 29: UDW Drillship Utilization High Since 2005
Average Utilization (%) for 10,000 + ft Includes data supplied by ODS - Petrodata , Inc; Copyright 2011 UDW Drillship Utilization High Since 2005 29 70 80 90 100 Jan 2005 Jan 2006 Jan 2007 Jan 2008 Jan 2009 Jan 2010 Jan 2011
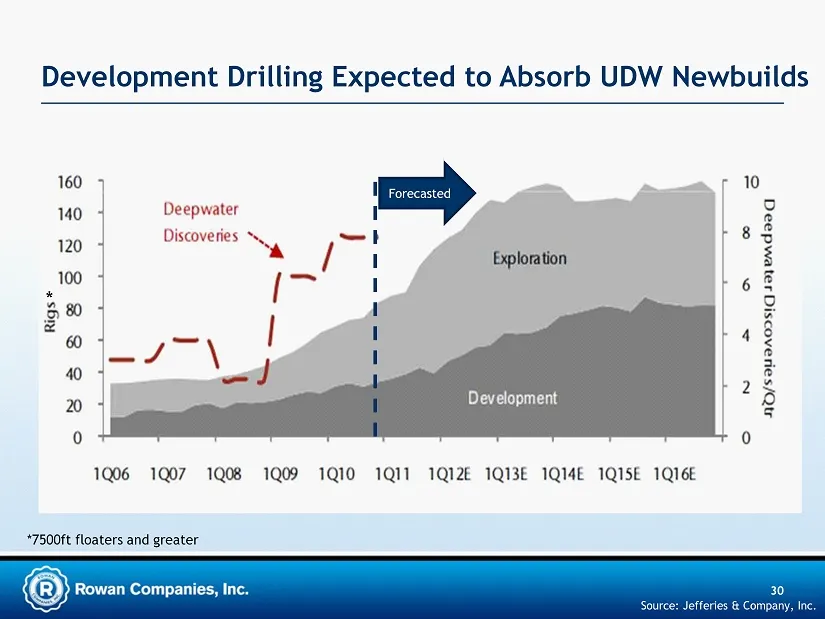
Slide 30: Development Drilling Expected to Absorb UDW Newbuilds
30 Development Drilling Expected to Absorb UDW Newbuilds Source: Jefferies & Company, Inc. *7500ft floaters and greater * Forecasted
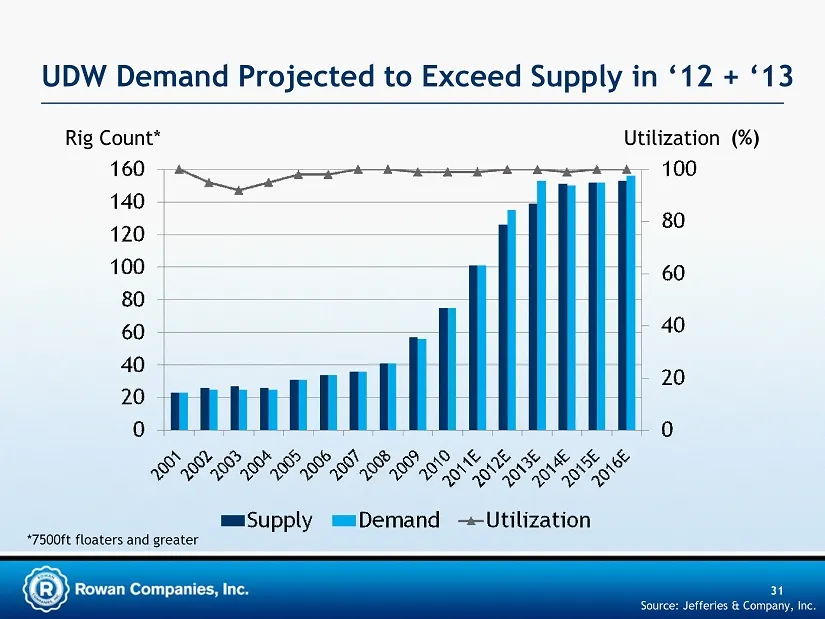
Slide 31: UDW Demand Projected to Exceed Supply in '12 + '13
31 UDW Demand Projected to Exceed Supply in ‘12 + ‘13 Source: Jefferies & Company, Inc. Rig Count* Utilization (%) *7500ft floaters and greater
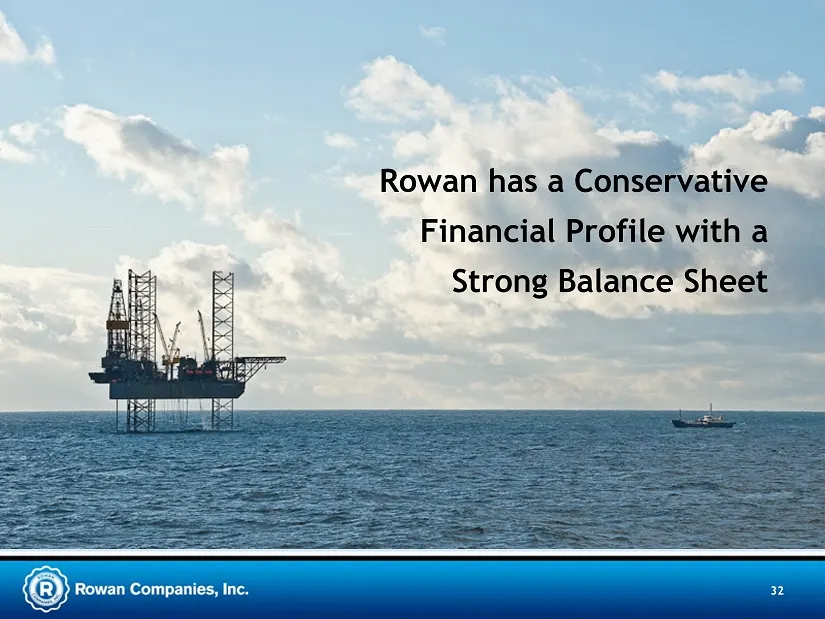
Slide 32: Rowan has a Conservative Financial Profile with a Strong Balance Sheet
32 Rowan has a Conservative Financial Profile with a Strong Balance Sheet
Slide 33: Investment Grade Balance Sheet
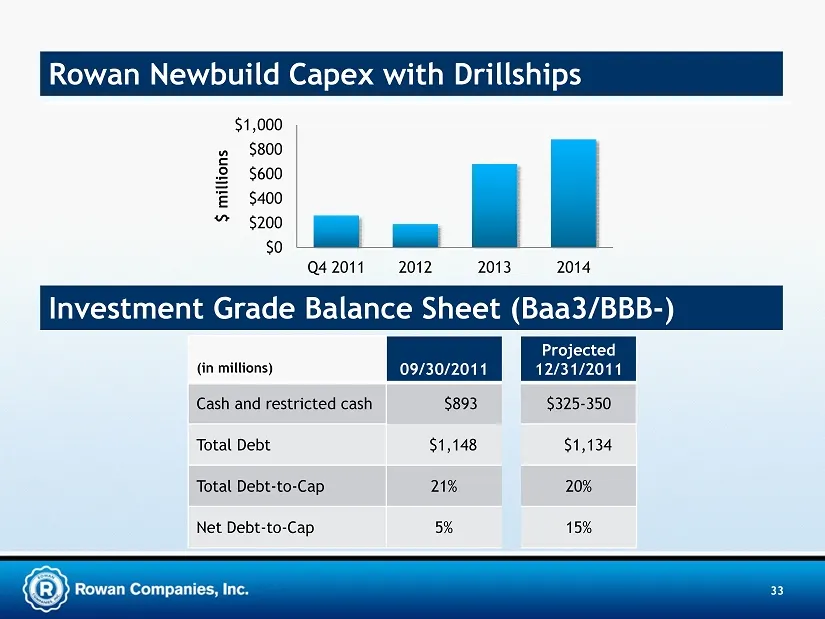
33 (in millions) 09/30/2011 Projected 12/31/2011 Cash and restricted cash $893 $325 - 350 Total Debt $1,148 $1,134 Total Debt - to - Cap 21% 20% Net Debt - to - Cap 5% 15% $0 $200 $400 $600 $800 $1,000 Q4 2011 2012 2013 2014 $ millions Investment Grade Balance Sheet (Baa3/BBB - ) Rowan Newbuild Cape
Slide 34: Financial Flexibility Creates Strategic Options
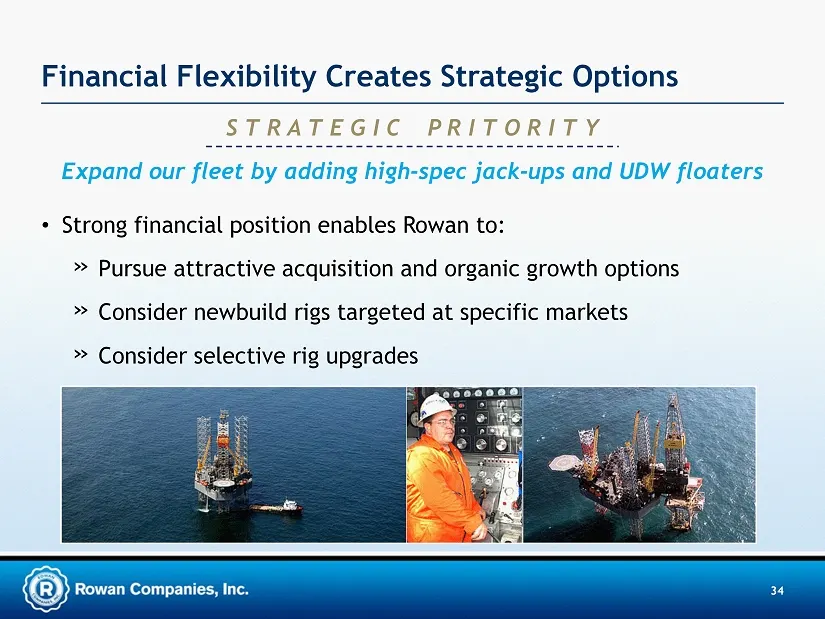
34 Financial Flexibility Creates Strategic Options S T R A T E G I C P R I T O R I T Y Expand our fleet by adding high - spec jack - ups and UDW floaters • Strong financial position enables Rowan to: » Pursue attractive acquisition and organic growth options » Consider newbuild rigs targeted at spec
Slide 35: Effective Tax Rate is Declining
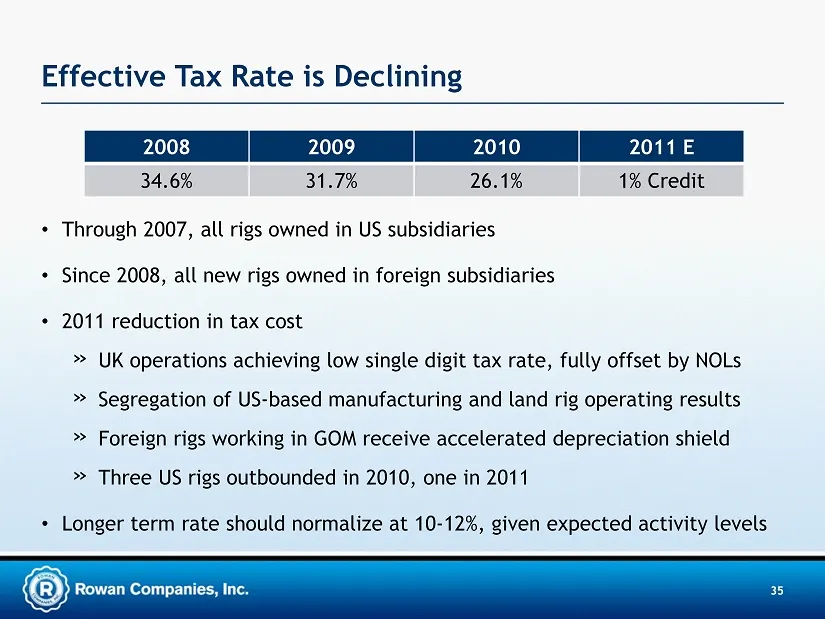
35 Effective Tax Rate is Declining • Through 2007, all rigs owned in US subsidiaries • Since 2008, all new rigs owned in foreign subsidiaries • 2011 reduction in tax cost » UK operations achieving low single digit tax rate, fully offset by NOLs » Segregation of US - based manufacturing and land rig
Slide 36: Strategic Focus
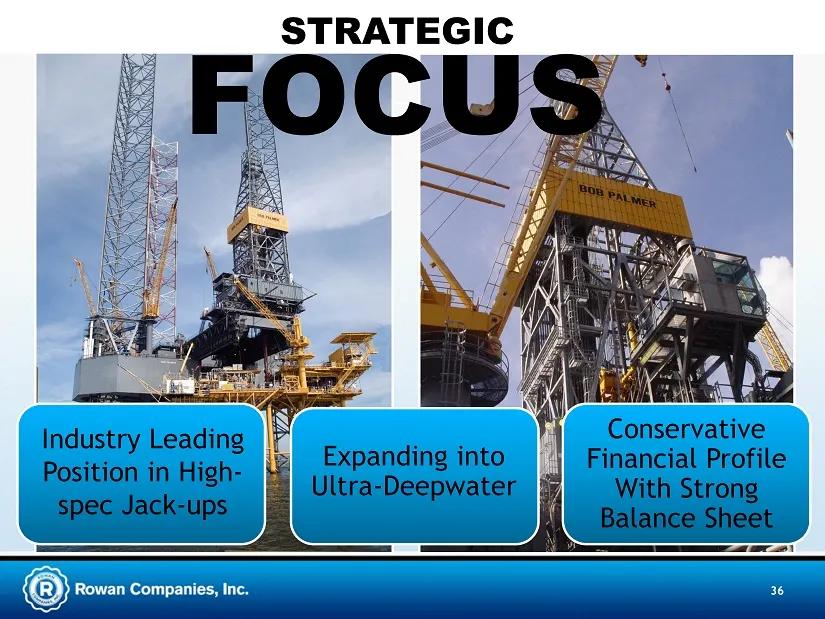
36 Industry Leading Position in High - spec Jack - ups Expanding into Ultra - Deepwater Conservative Financial Profile With Strong Balance Sheet STRATEGIC FOCUS
Slide 37: Investor Contact
Investor Contact: Suzanne M. Spera Director, Investor Relations sspera@rowancompanies.com 37 2800 Post Oak Blvd. Suite 5450 Houston, TX 77056 713.621.7800 www.rowancompanies.com Rowan Companies, Inc.
Source: SEC EDGAR · 8-K filed Feb 6, 2012
More decks from Rowan Companies plc
 Merger or Acquisition (October 2018)27 slides · Oct 9, 2018
 Merger or Acquisition (November 2016)12 slides · Nov 21, 2016
 Investor Presentation (March 2016)36 slides · Mar 29, 2016
 Investor Presentation (March 2015)43 slides · Mar 23, 2015
 Barclays CEO Energy - Power Conference 201443 slides · Sep 2, 2014
 Investor Presentation (May 2014)39 slides · May 19, 2014