Gemfields Group Limited · JSE:GML
Gemfields — Corporate Update (October 2009)
15 slides from Gemfields's corporate update, Oct 27, 2009
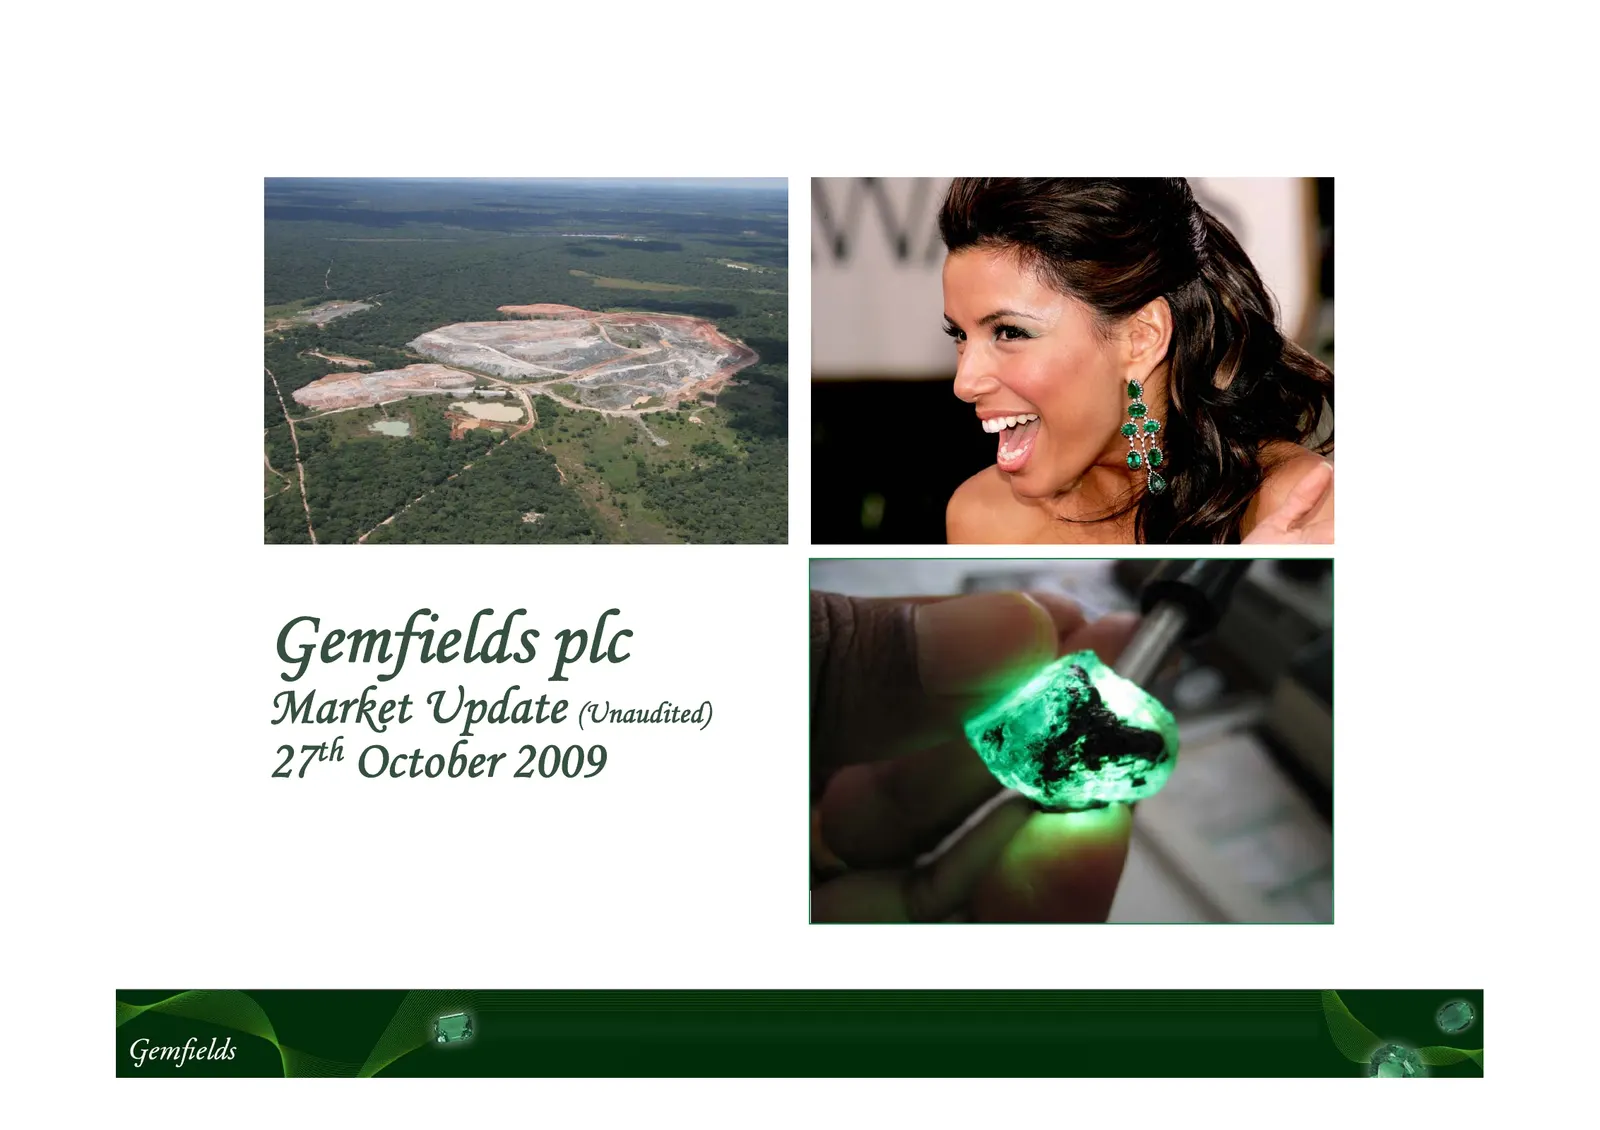
Slide 1: Market Update (Unaudited)
Gemfields plc Market Update (Unaudited) 27th October 2009
Slide 2: Legal Disclaimer
Legal Disclaimer This document, which has been issued by Gemfields Plc (the “Company”), comprises the written materials/slides for a presentation concerning the Company, including it business, results of operations and prospects. This document does not constitute or form part of any offer or invitat
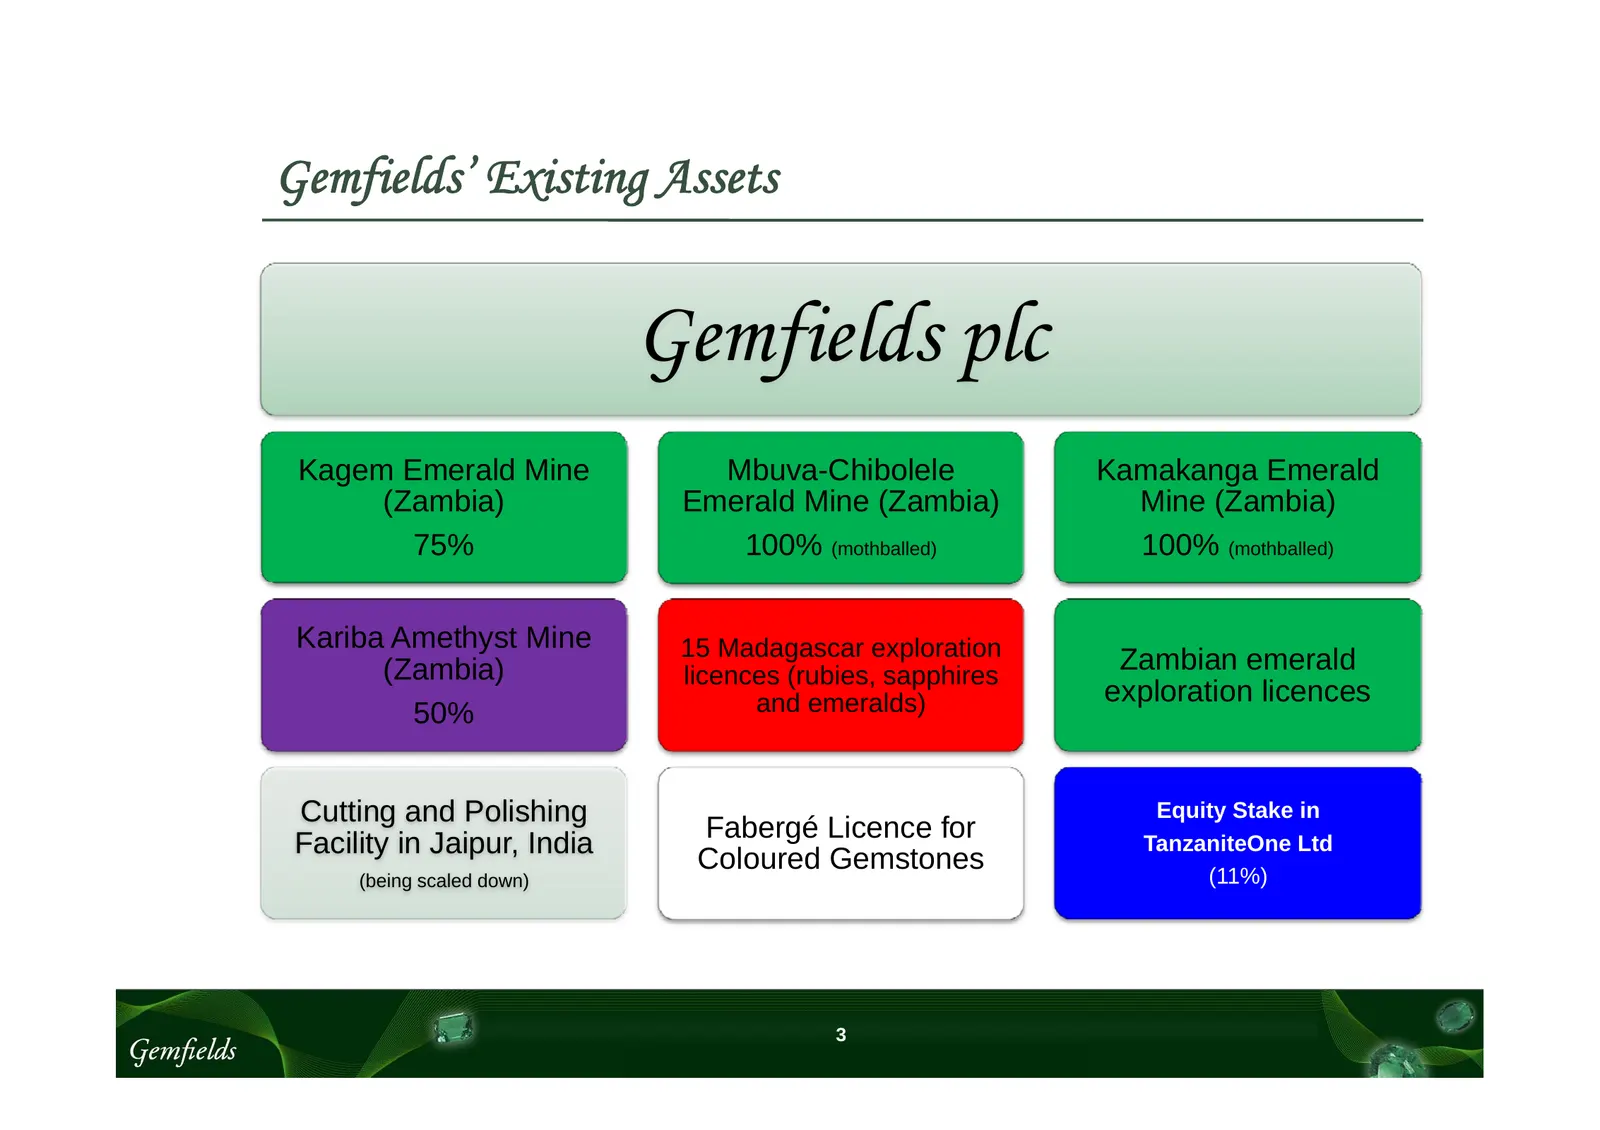
Slide 3: Gemfields' Existing Assets
Gemfields’ Existing Assets Gemfields plc Kagem Emerald Mine Mbuva-Chibolele Kamakanga Emerald (Zambia) Emerald Mine (Zambia) Mine (Zambia) 75% 100% (mothballed) 100% (mothballed) Kariba Amethyst Mine 15 Madagascar exploration (Zambia) licences (rubies, sapphires Zambian emerald and emeralds) explora
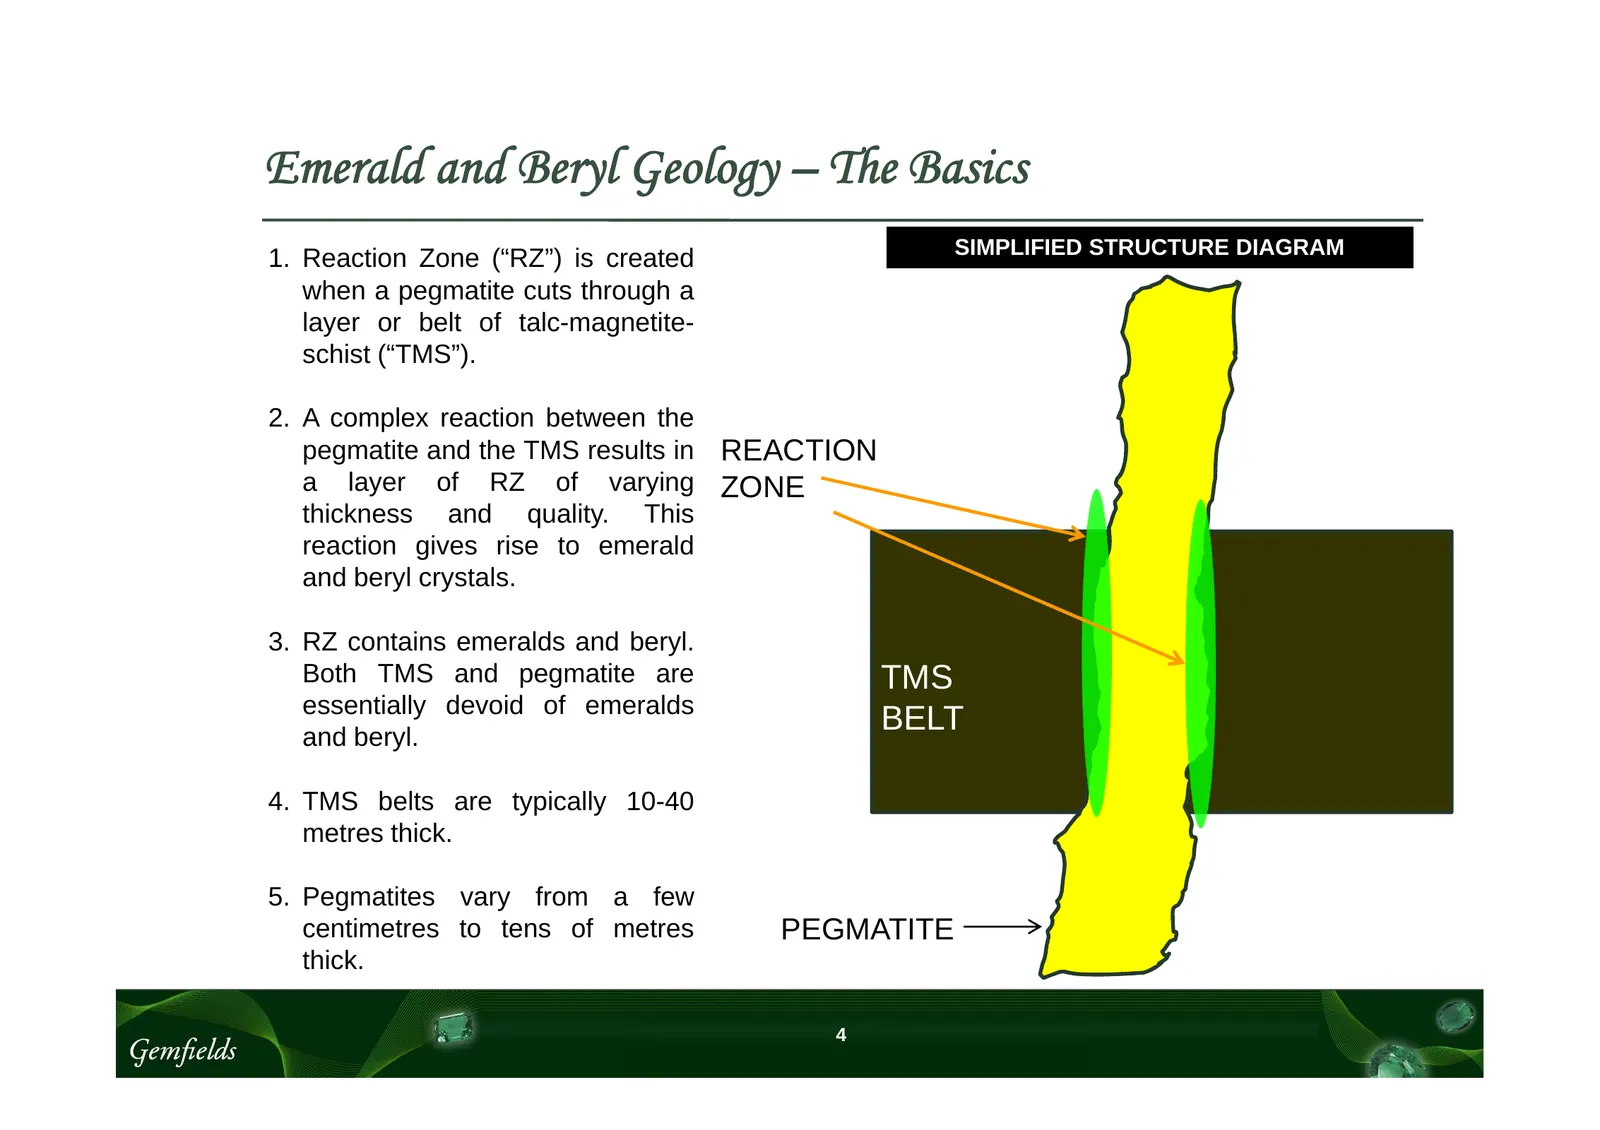
Slide 4: Emerald and Beryl Geology – The Basics
Emerald and Beryl Geology – The Basics SIMPLIFIED STRUCTURE DIAGRAM 1. Reaction Zone (“RZ”) is created when a pegmatite cuts through a layer or belt of talc-magnetite- schist (“TMS”). 2. A complex reaction between the pegmatite and the TMS results in REACTION a layer of RZ of varying ZONE thickness
Slide 5: Kagem Quarterly Production to 30 September 2009
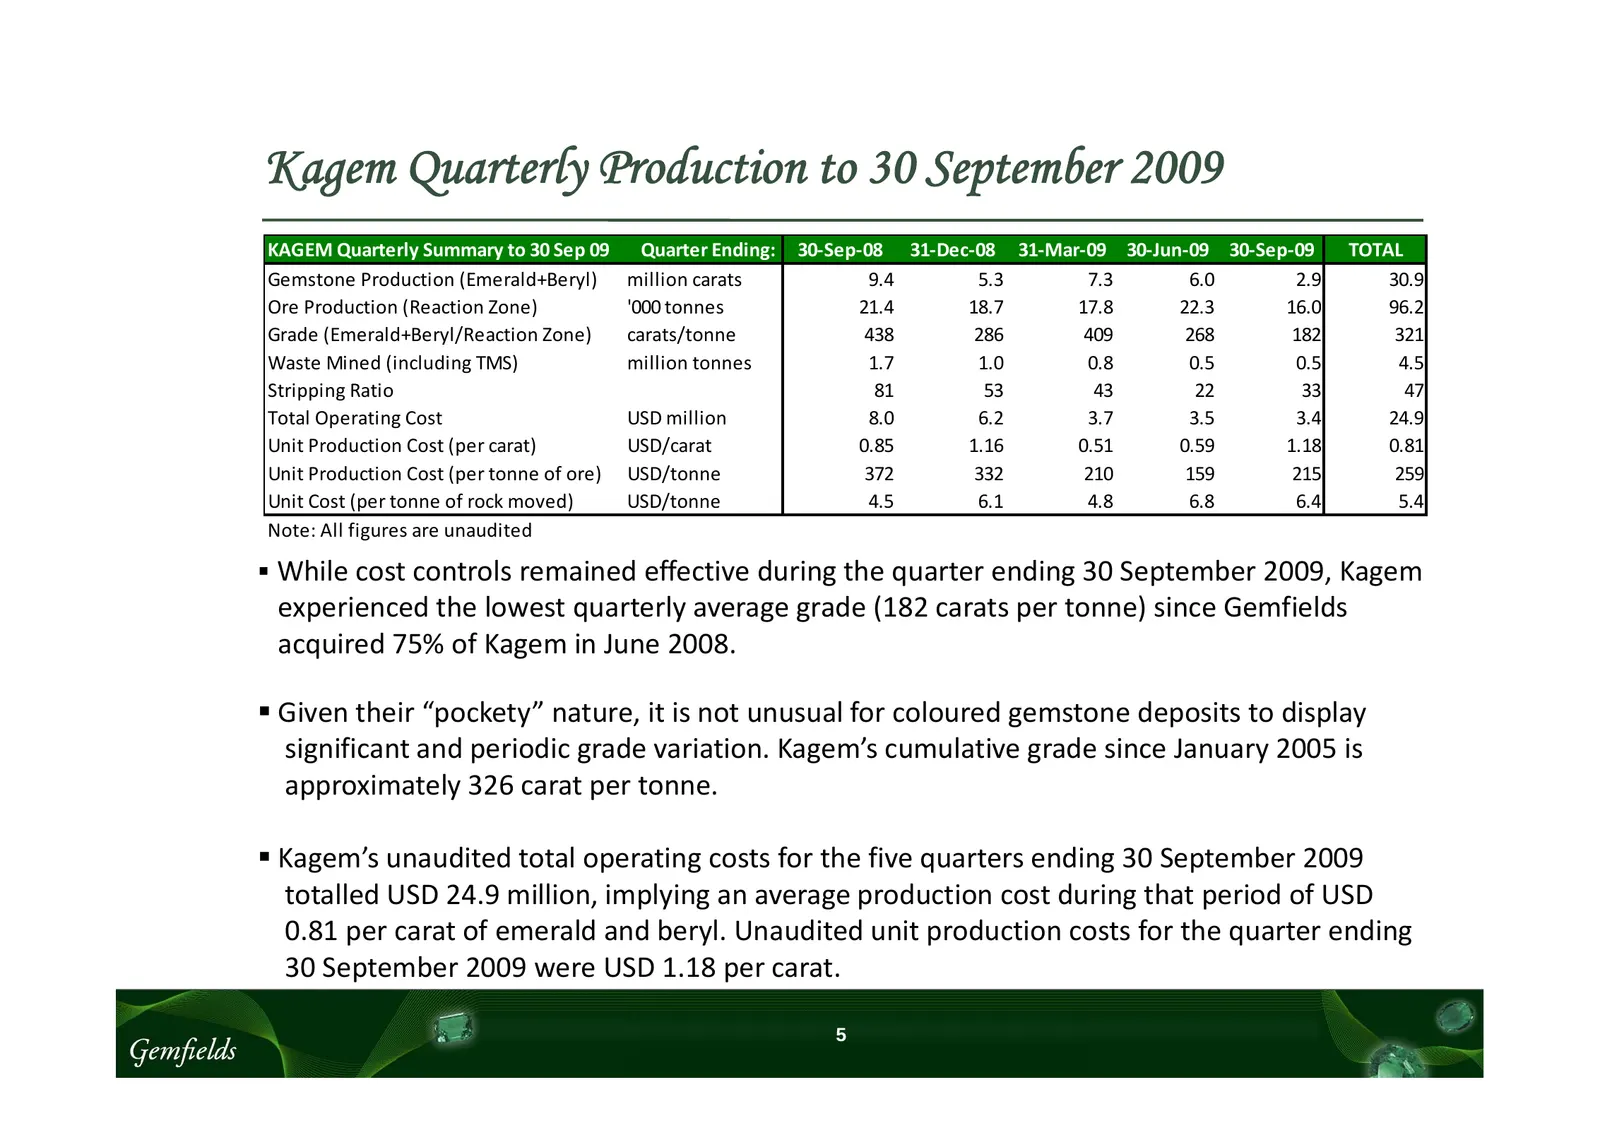
Kagem Quarterly Production to 30 September 2009 KAGEM Quarterly Summary to 30 Sep 09 Quarter Ending: 30‐Sep‐08 31‐Dec‐08 31‐Mar‐09 30‐Jun‐09 30‐Sep‐09 TOTAL Gemstone Production (Emerald+Beryl) million carats 9.4 5.3 7.3 6.0 2.9 30.9 Ore Production (Reaction Zone) '000 tonnes 21.4 18.7 17.8 22.3 16.0
Slide 6: Kagem Annual Summary
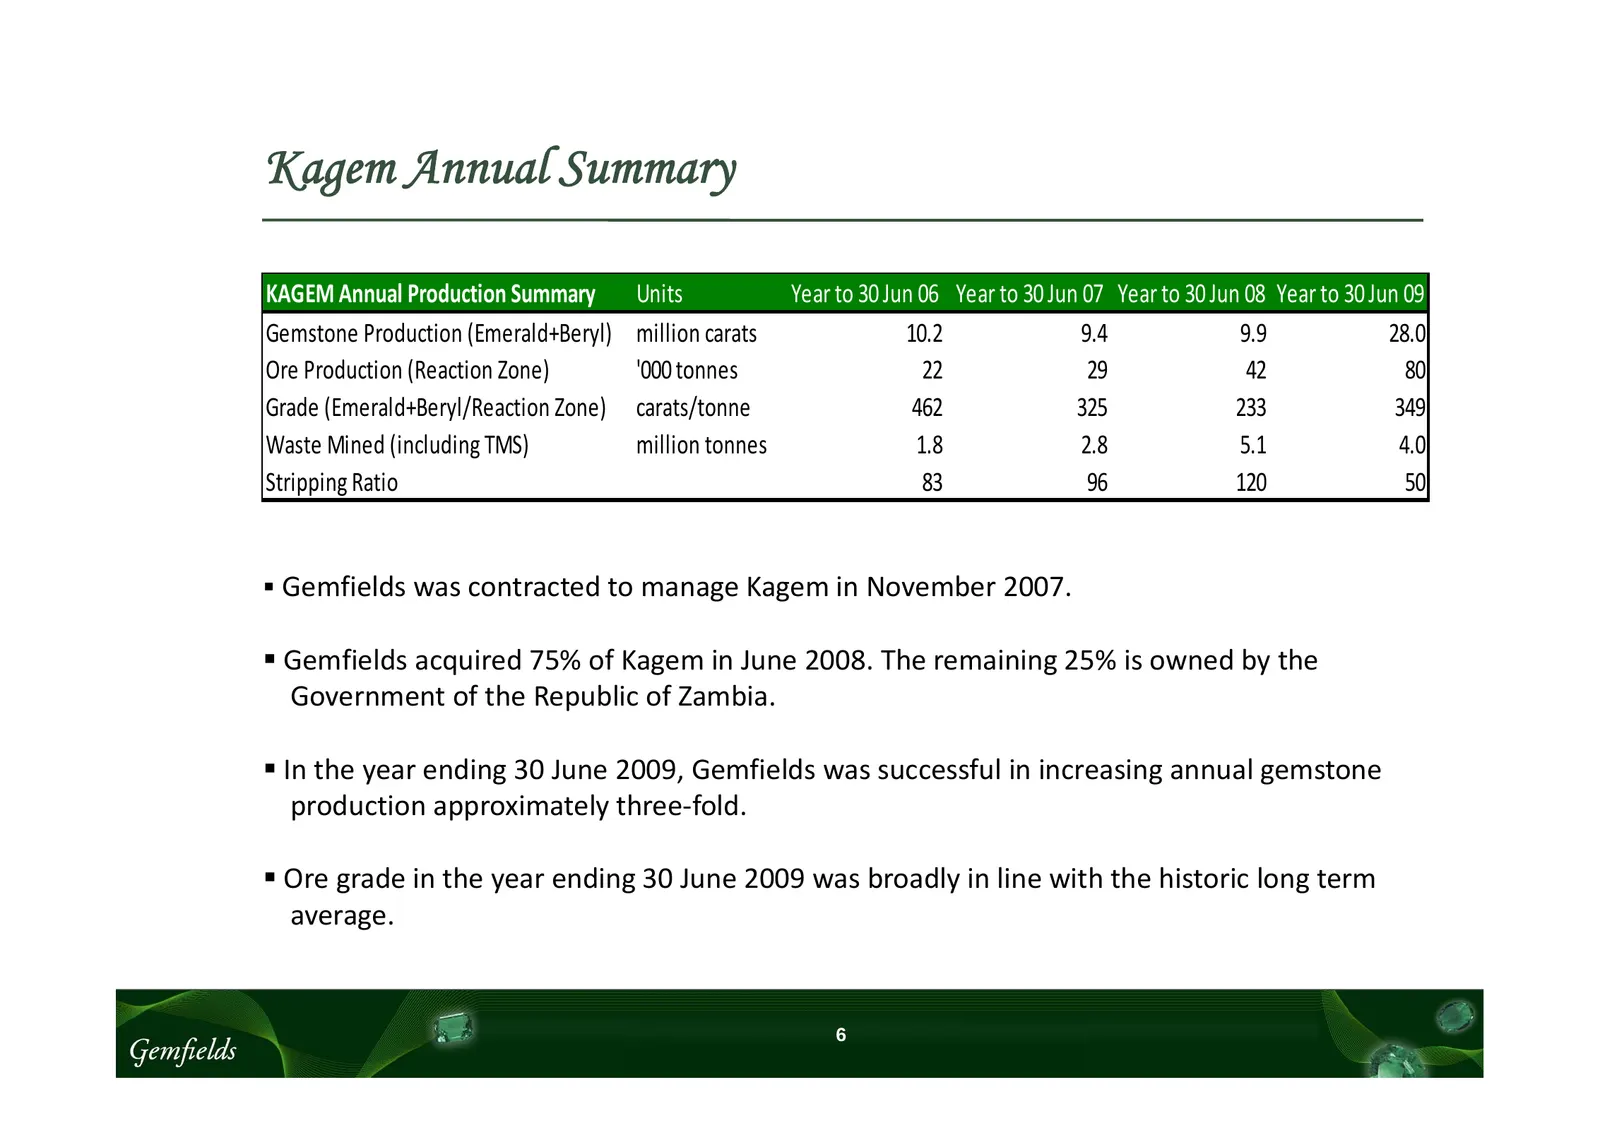
Kagem Annual Summary KAGEM Annual Production Summary Units Year to 30 Jun 06 Year to 30 Jun 07 Year to 30 Jun 08 Year to 30 Jun 09 Gemstone Production (Emerald+Beryl) million carats 10.2 9.4 9.9 28.0 Ore Production (Reaction Zone) '000 tonnes 22 29 42 80 Grade (Emerald+Beryl/Reaction Zone) carats/to
Slide 7: Monthly Gemstone Production
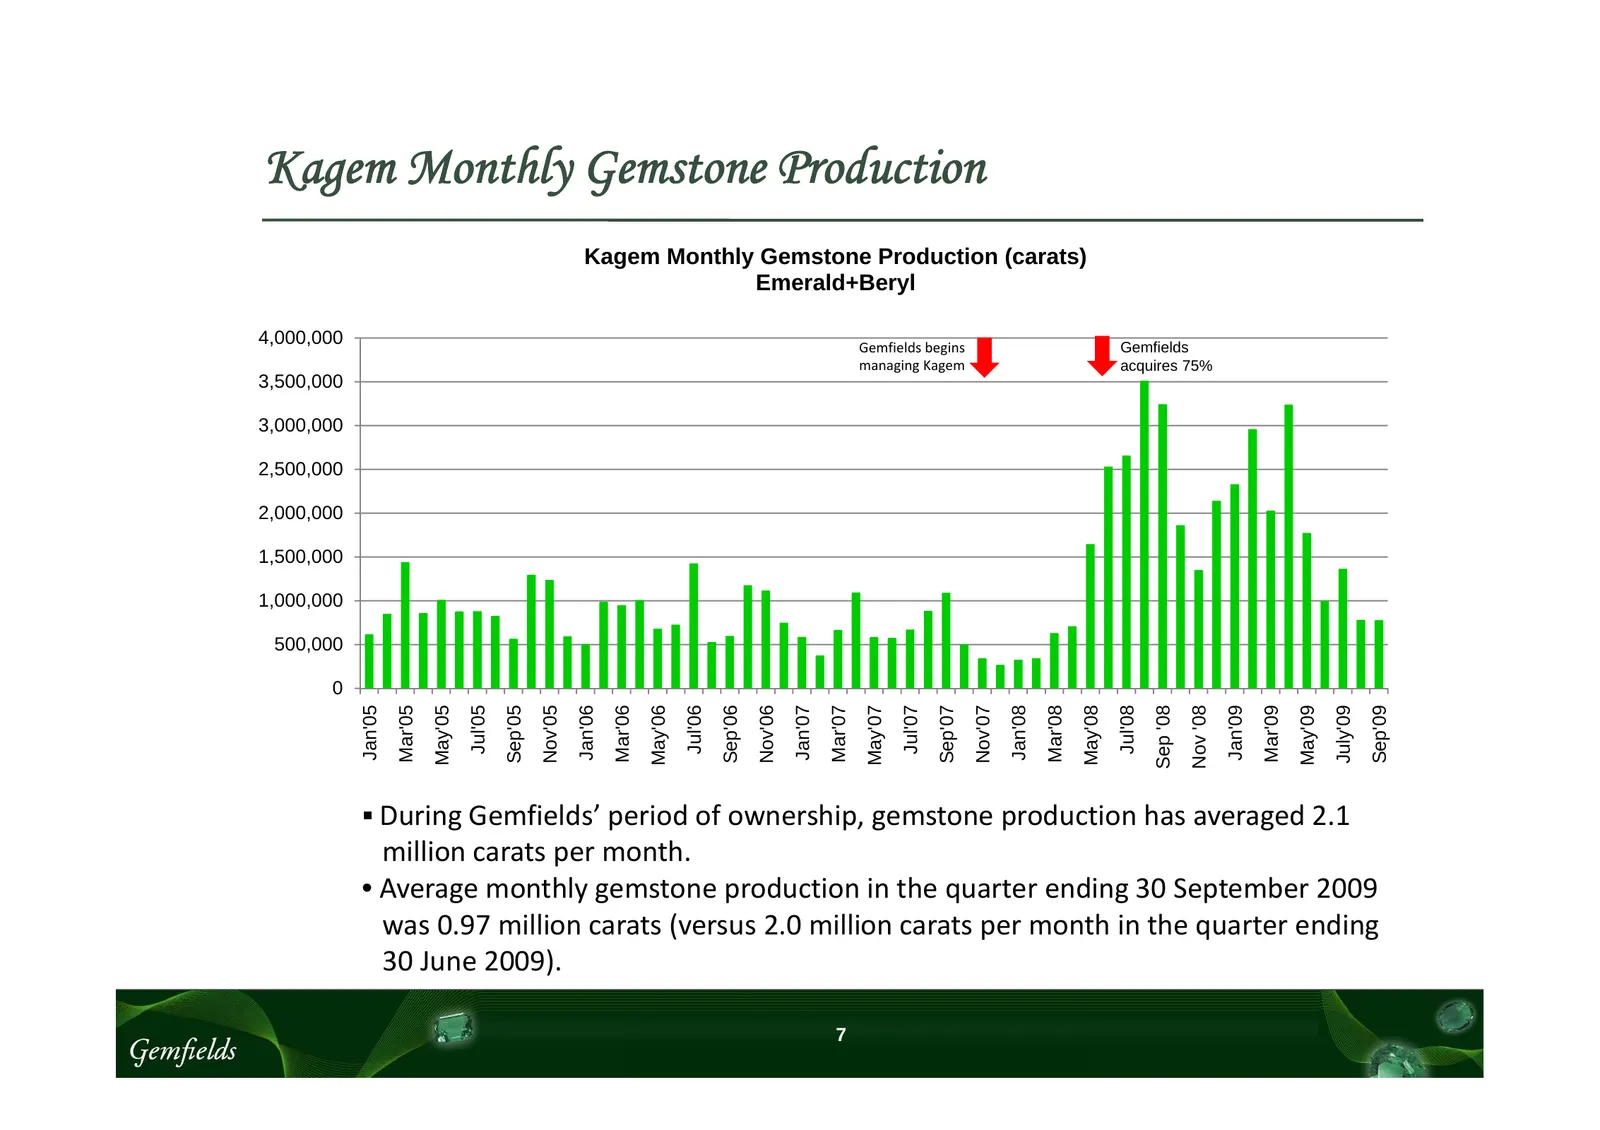
Kagem Monthly Gemstone Production Kagem Monthly Gemstone Production (carats) Emerald+Beryl 4,000,000 Gemfields begins Gemfields managing Kagem acquires 75% 3,500,000 3,000,000 2,500,000 2,000,000 1,500,000 1,000,000 500,000 0 Jan'05 Mar'05 Jul'05 Jan'06 Mar'06 Jul'06 Jan'07 Mar'07 Jul'07 Jan'08 Mar'
Slide 8: Monthly Ore Mining
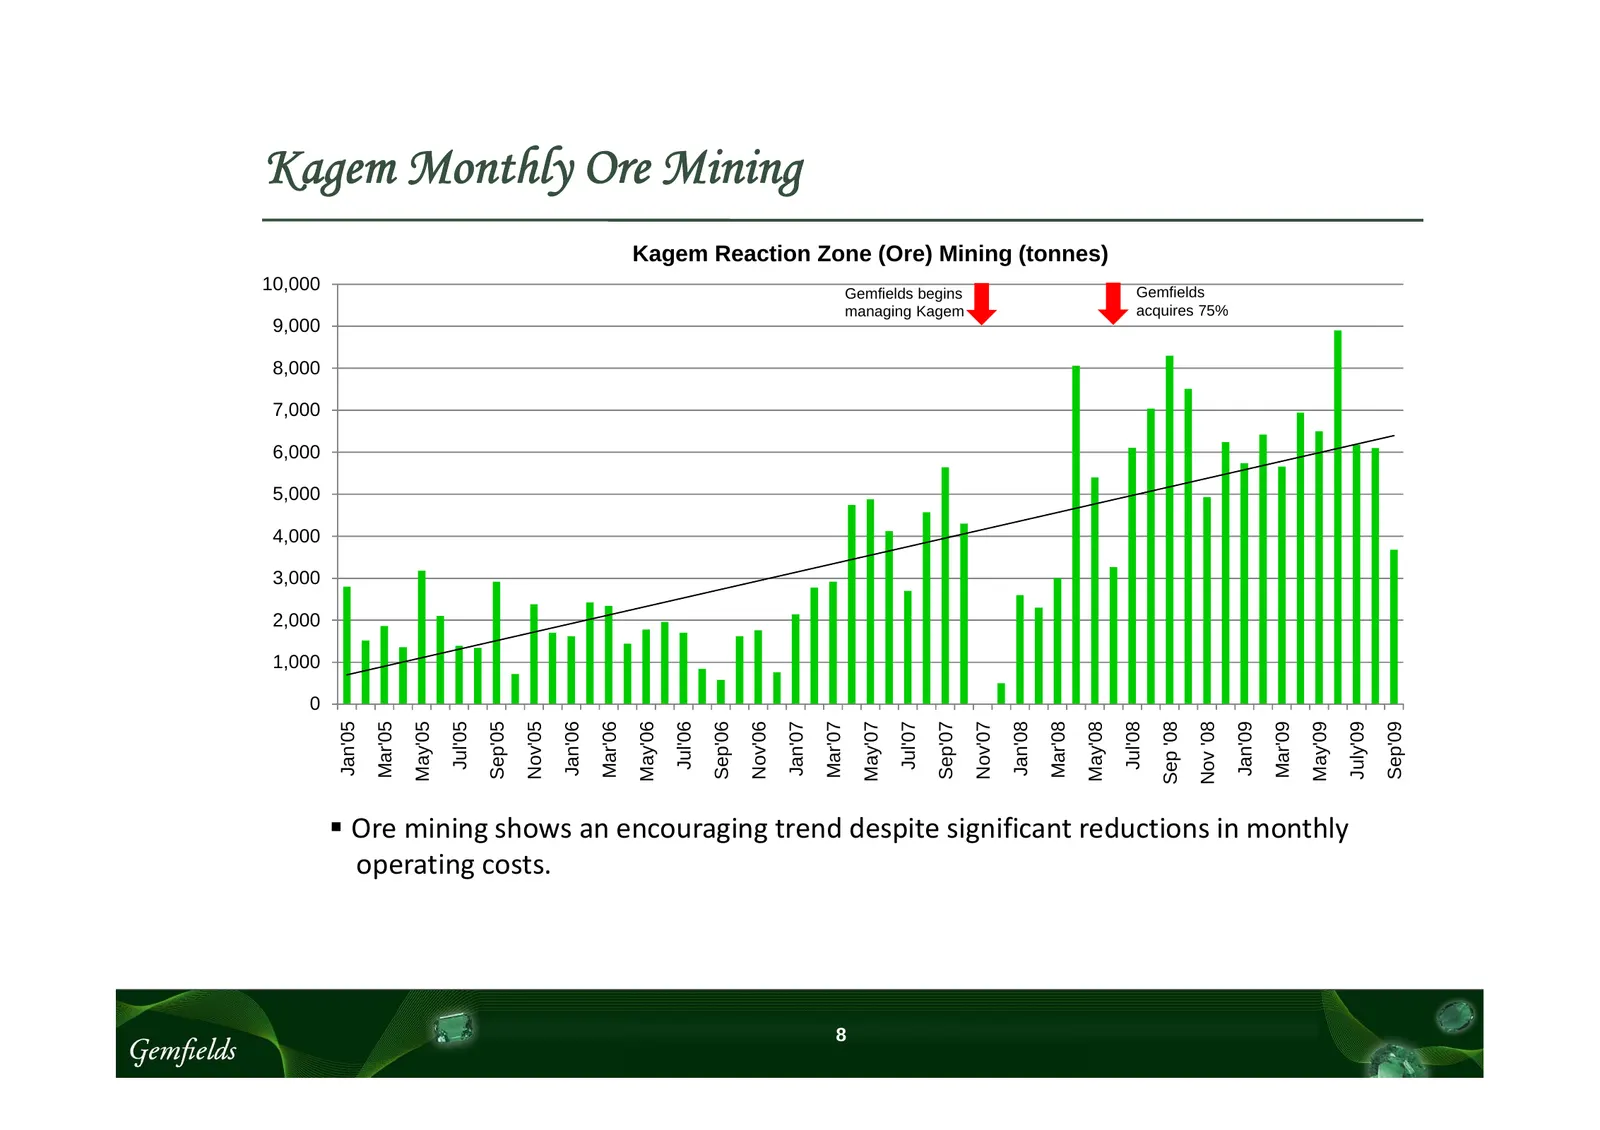
Kagem Monthly Ore Mining Kagem Reaction Zone (Ore) Mining (tonnes) 10,000 Gemfields begins Gemfields managing Kagem acquires 75% 9,000 8,000 7,000 6,000 5,000 4,000 3,000 2,000 1,000 0 Jan'05 Mar'05 Jul'05 Jan'06 Mar'06 Jul'06 Jan'07 Mar'07 Jul'07 Jan'08 Mar'08 Jul'08 Jan'09 Mar'09 Sep '08 May'05 Se
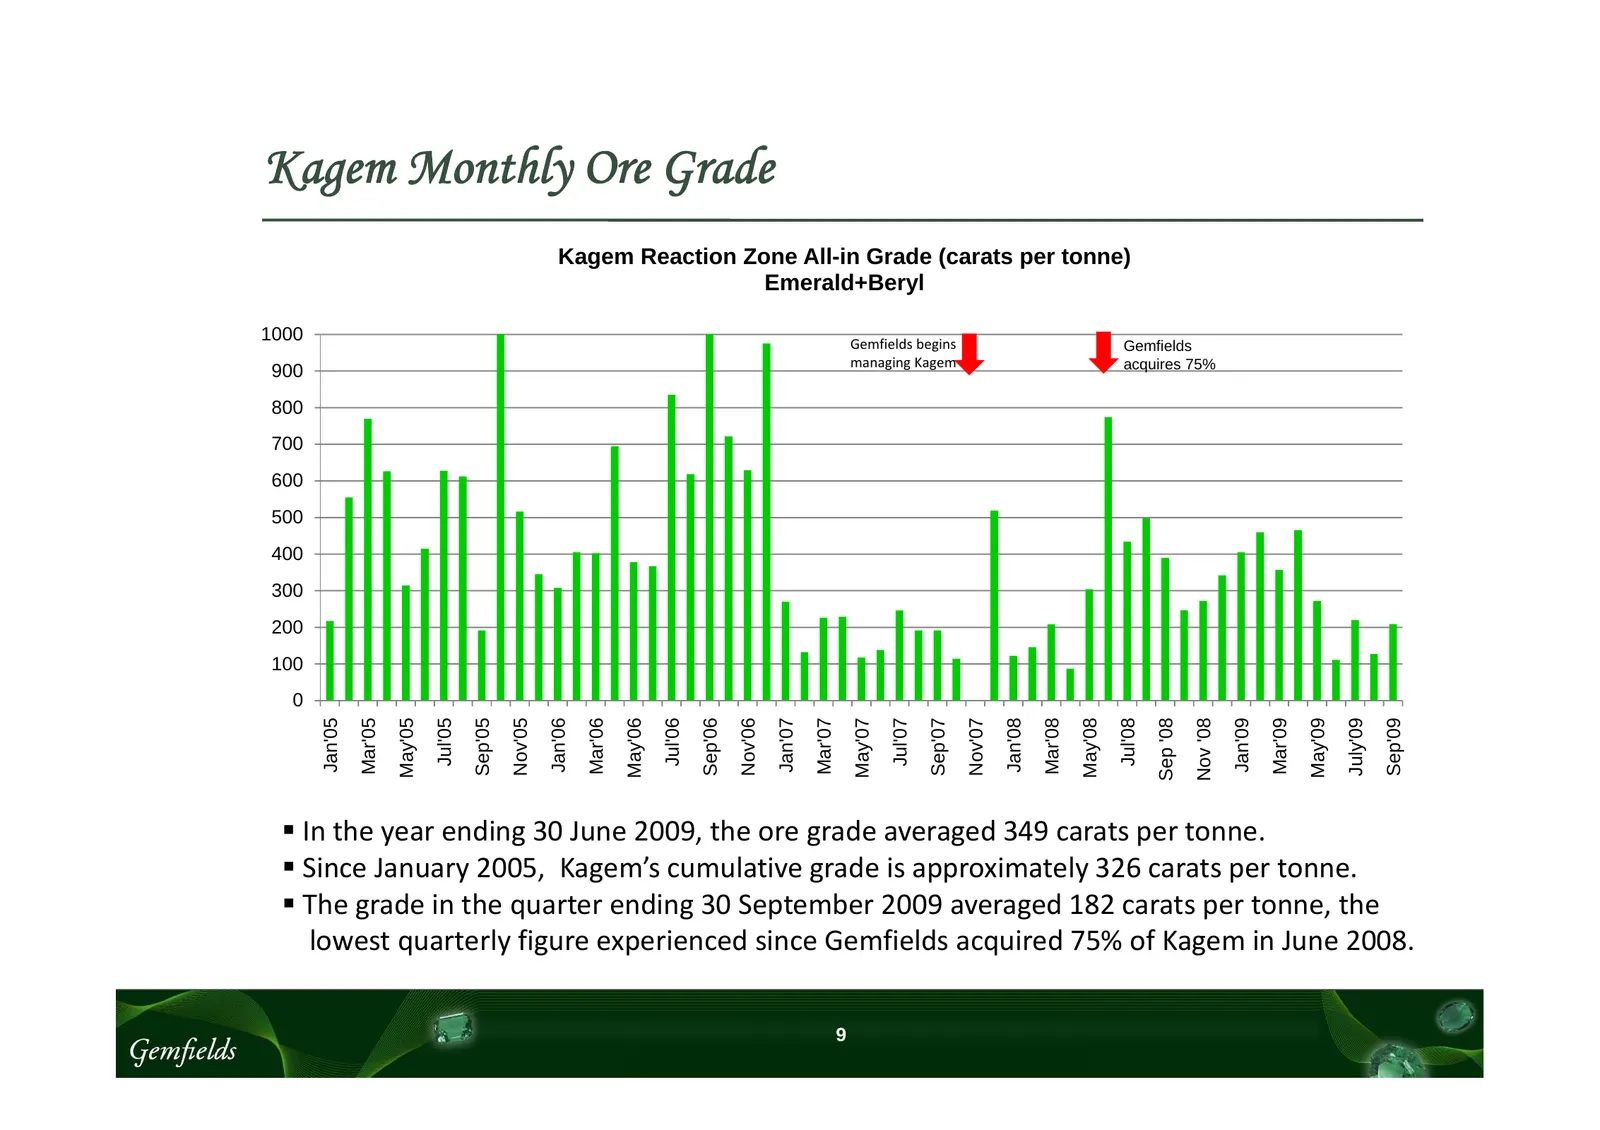
Slide 9: Monthly Ore Grade
Kagem Monthly Ore Grade Kagem Reaction Zone All-in Grade (carats per tonne) Emerald+Beryl 1000 Gemfields begins Gemfields managing Kagem acquires 75% 900 800 700 600 500 400 300 200 100 0 Jan'05 Mar'05 Jul'05 Jan'06 Mar'06 Jul'06 Jan'07 Mar'07 Jul'07 Jan'08 Mar'08 Jul'08 Jan'09 Mar'09 Sep '08 May'05
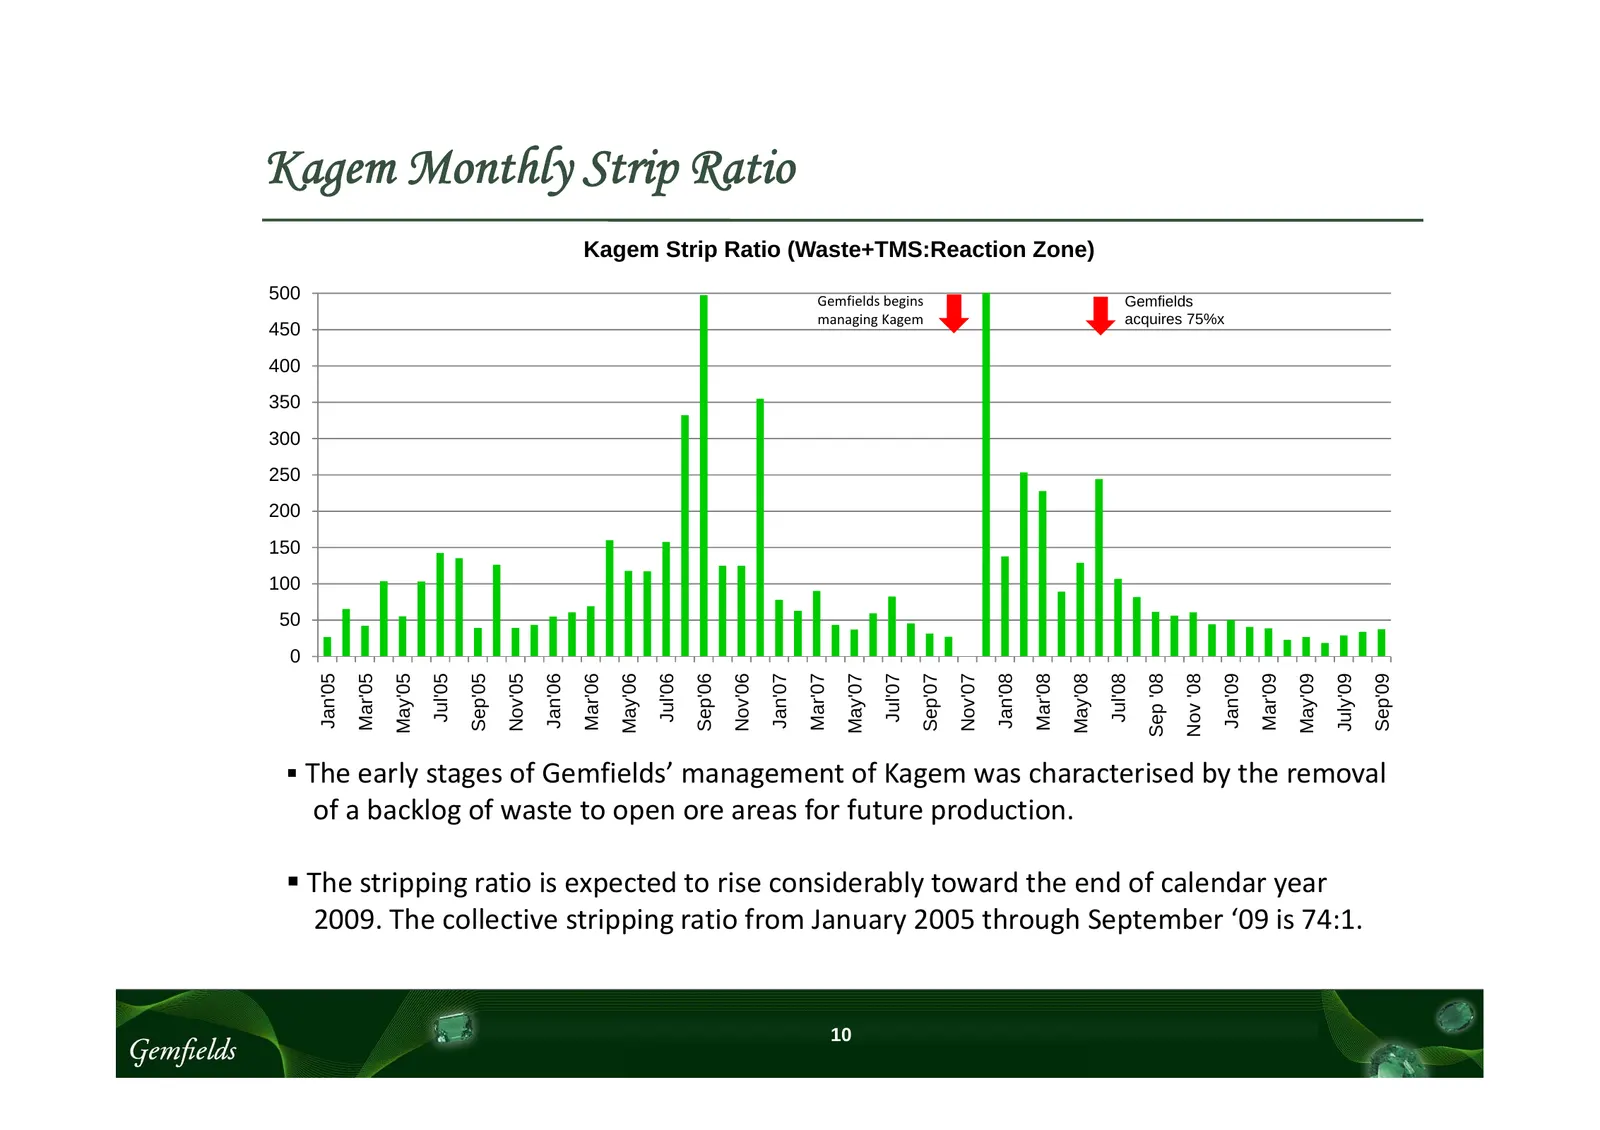
Slide 10: Monthly Strip Ratio
Kagem Monthly Strip Ratio Kagem Strip Ratio (Waste+TMS:Reaction Zone) 500 Gemfields begins Gemfields managing Kagem acquires 75%x 450 400 350 300 250 200 150 100 50 0 Jan'05 May'05 Sep'05 Nov'05 Jan'06 May'06 Sep'06 Nov'06 Jan'07 May'07 Sep'07 Nov'07 Jan'08 May'08 Jan'09 May'09 July'09 Sep'09 Sep '0
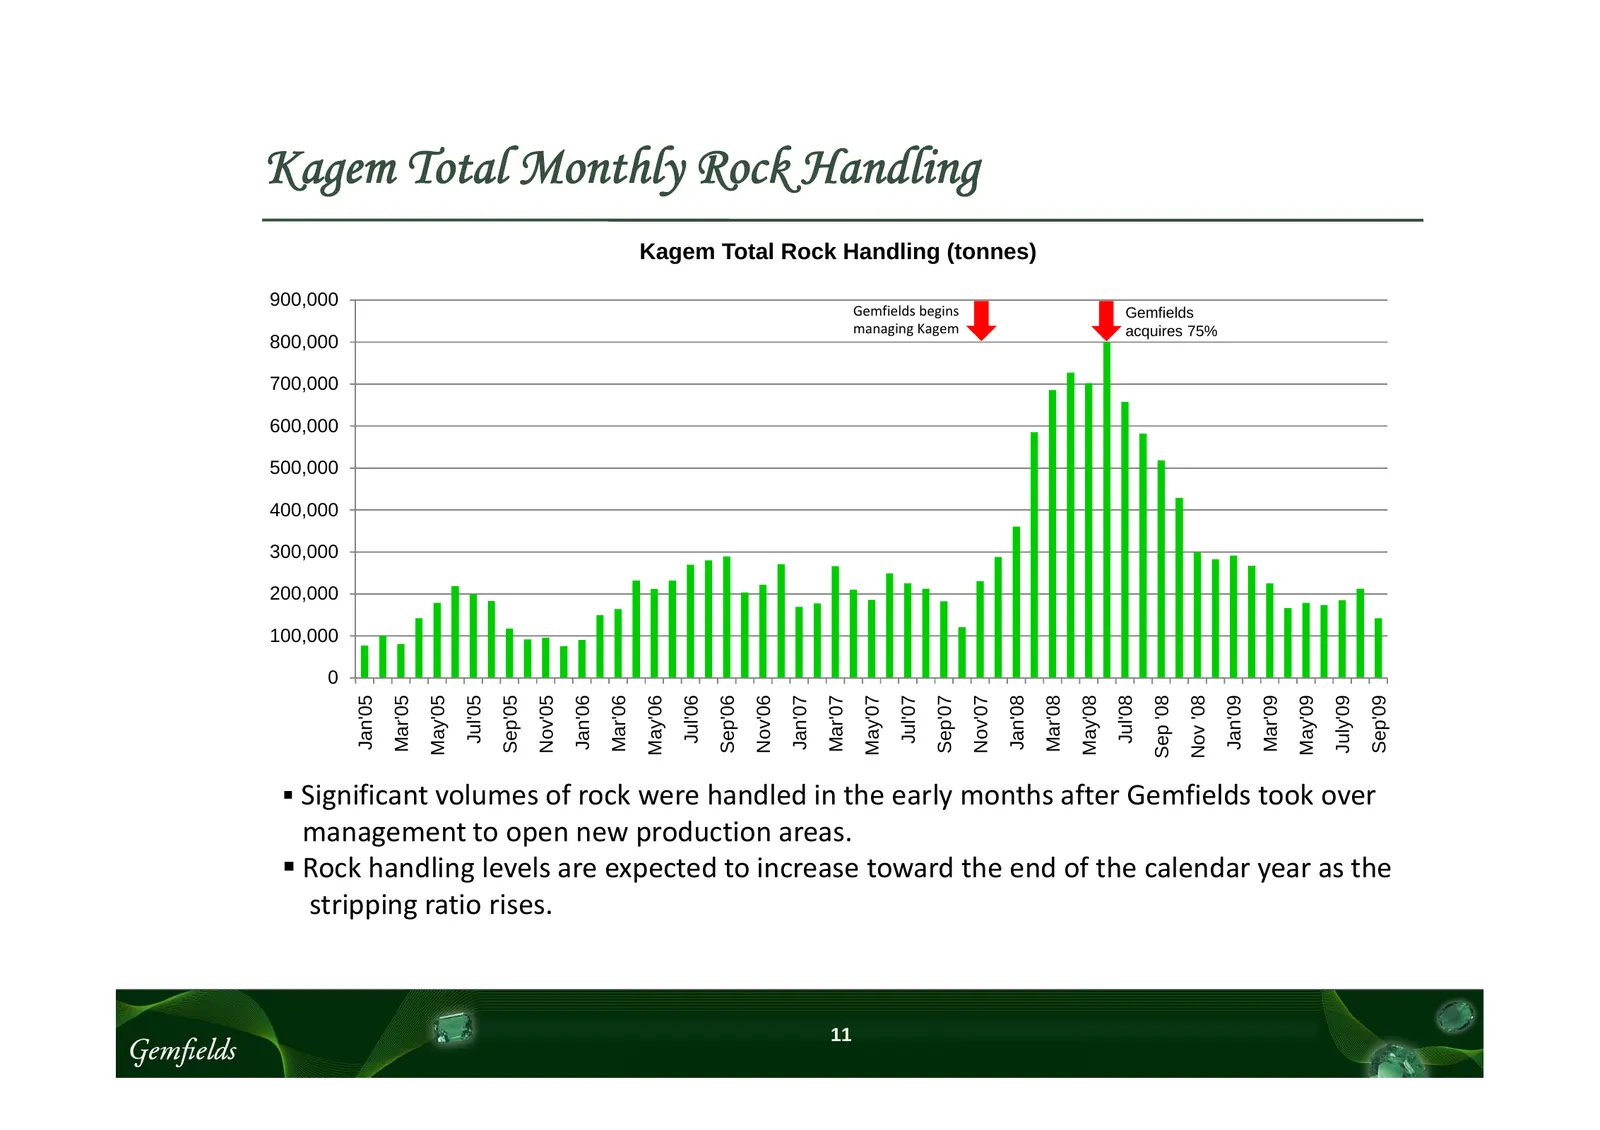
Slide 11: Total Monthly Rock Handling
Kagem Total Monthly Rock Handling Kagem Total Rock Handling (tonnes) 900,000 Gemfields begins Gemfields managing Kagem acquires 75% 800,000 700,000 600,000 500,000 400,000 300,000 200,000 100,000 0 Jan'05 Mar'05 May'05 Jul'05 Sep'05 Nov'05 Jan'06 Mar'06 May'06 Jul'06 Sep'06 Nov'06 Jan'07 Mar'07 May'
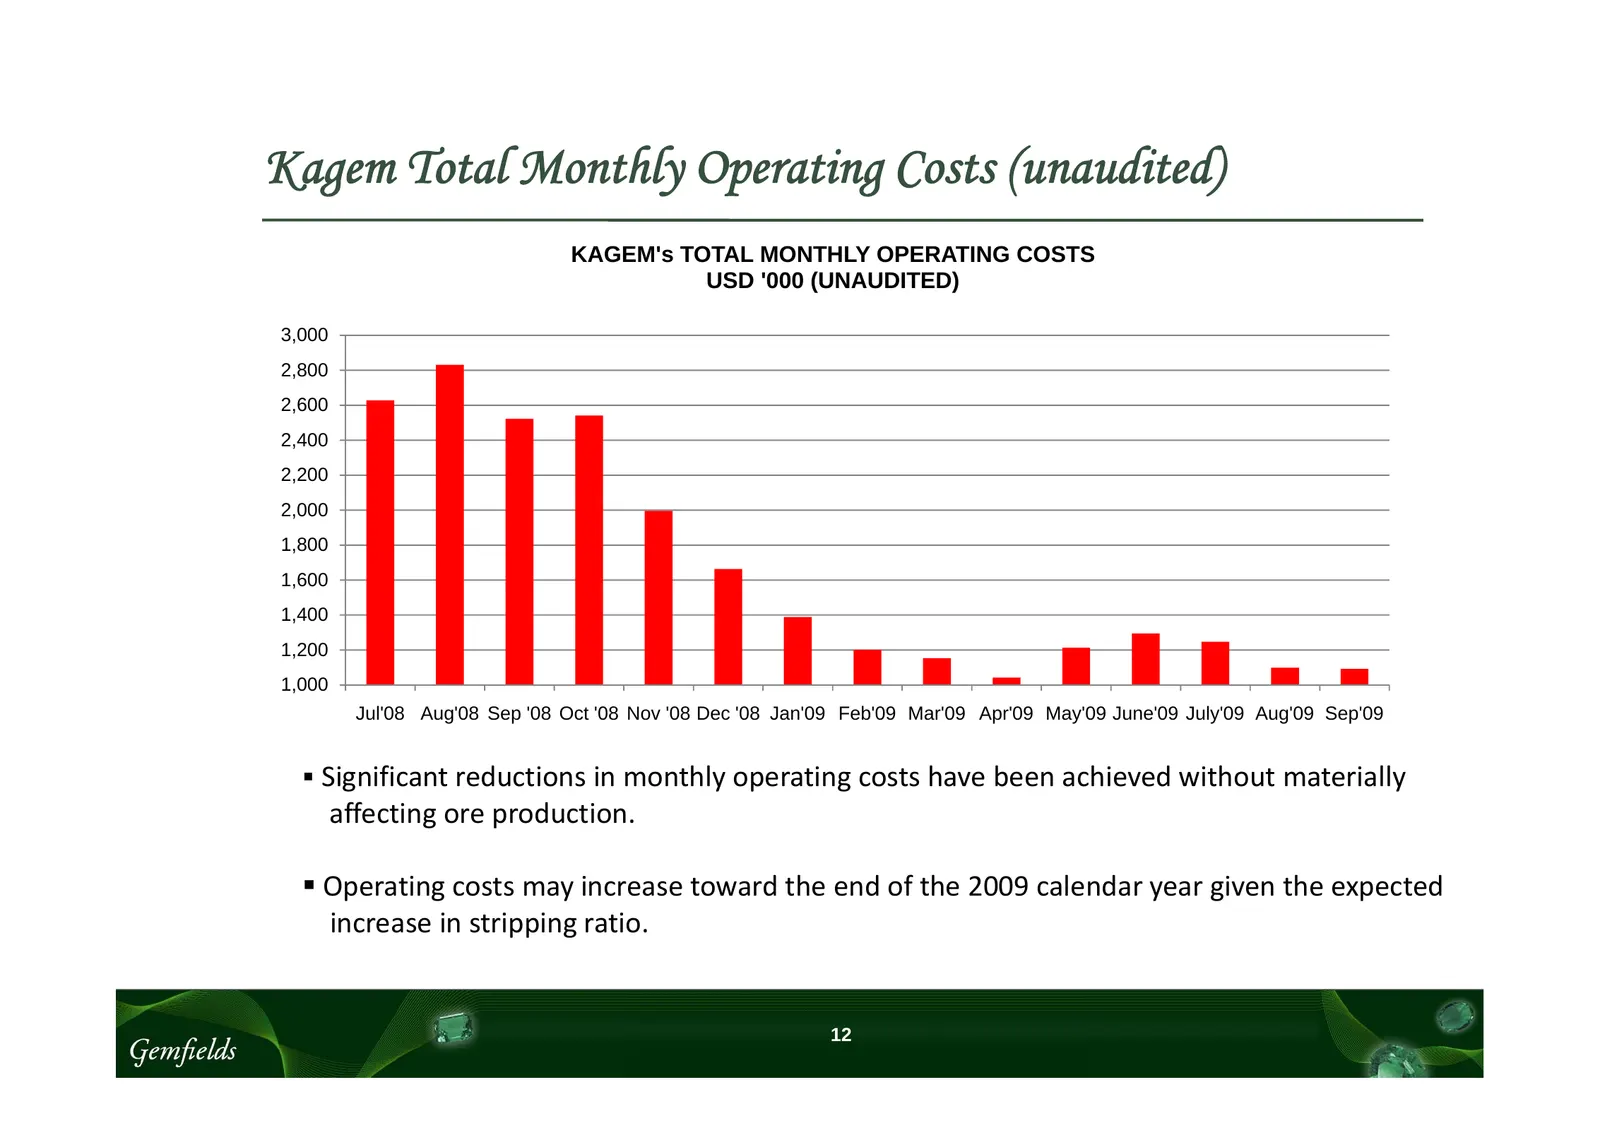
Slide 12: Total Monthly Operating Costs (unaudited)
Kagem Total Monthly Operating Costs (unaudited) KAGEM's TOTAL MONTHLY OPERATING COSTS USD '000 (UNAUDITED) 3,000 2,800 2,600 2,400 2,200 2,000 1,800 1,600 1,400 1,200 1,000 Jul'08 Aug'08 Sep '08 Oct '08 Nov '08 Dec '08 Jan'09 Feb'09 Mar'09 Apr'09 May'09 June'09 July'09 Aug'09 Sep'09 Significant re
Slide 13: Unit Operating Costs (unaudited)
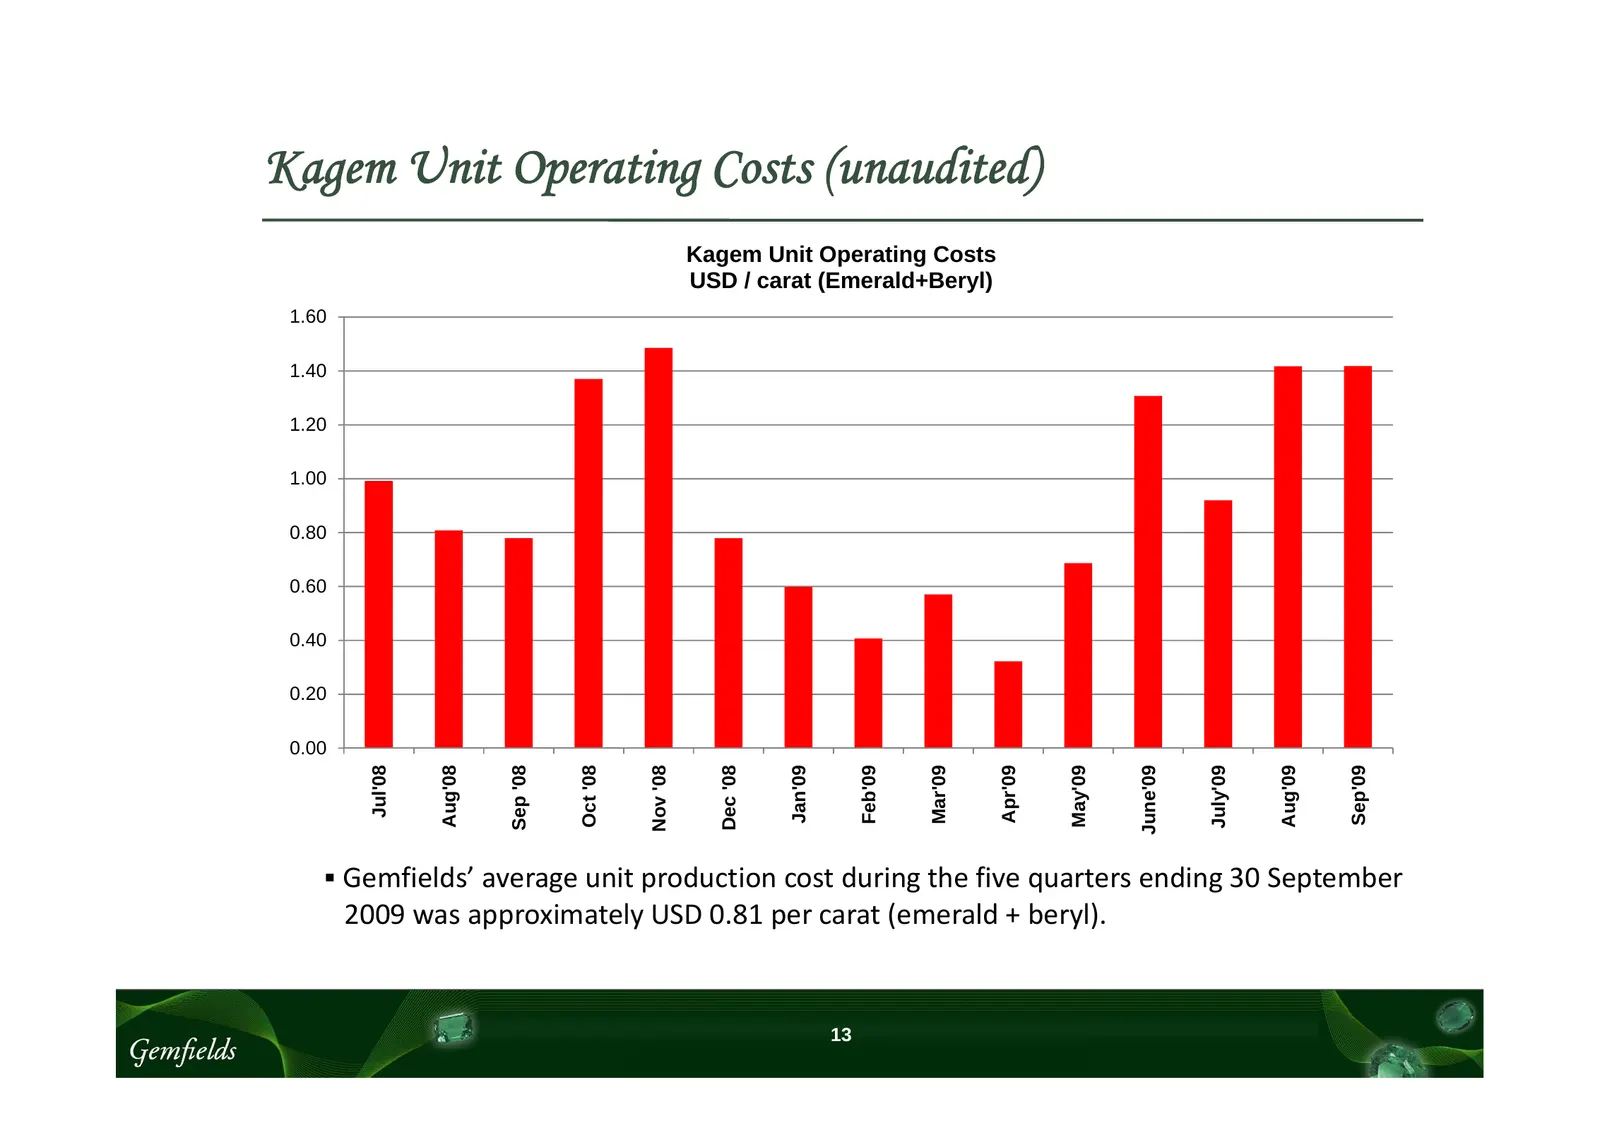
Kagem Unit Operating Costs (unaudited) Kagem Unit Operating Costs USD / carat (Emerald+Beryl) 1.60 1.40 1.20 1.00 0.80 0.60 0.40 0.20 0.00 Aug'08 Aug'09 Jul'08 Oct '08 Sep '08 Dec '08 Feb'09 Jan'09 Mar'09 Apr'09 June'09 Sep'09 Nov '08 May'09 July'09 Gemfields’ average unit production cost during t
Slide 14: Historic Unit Revenue (unaudited)
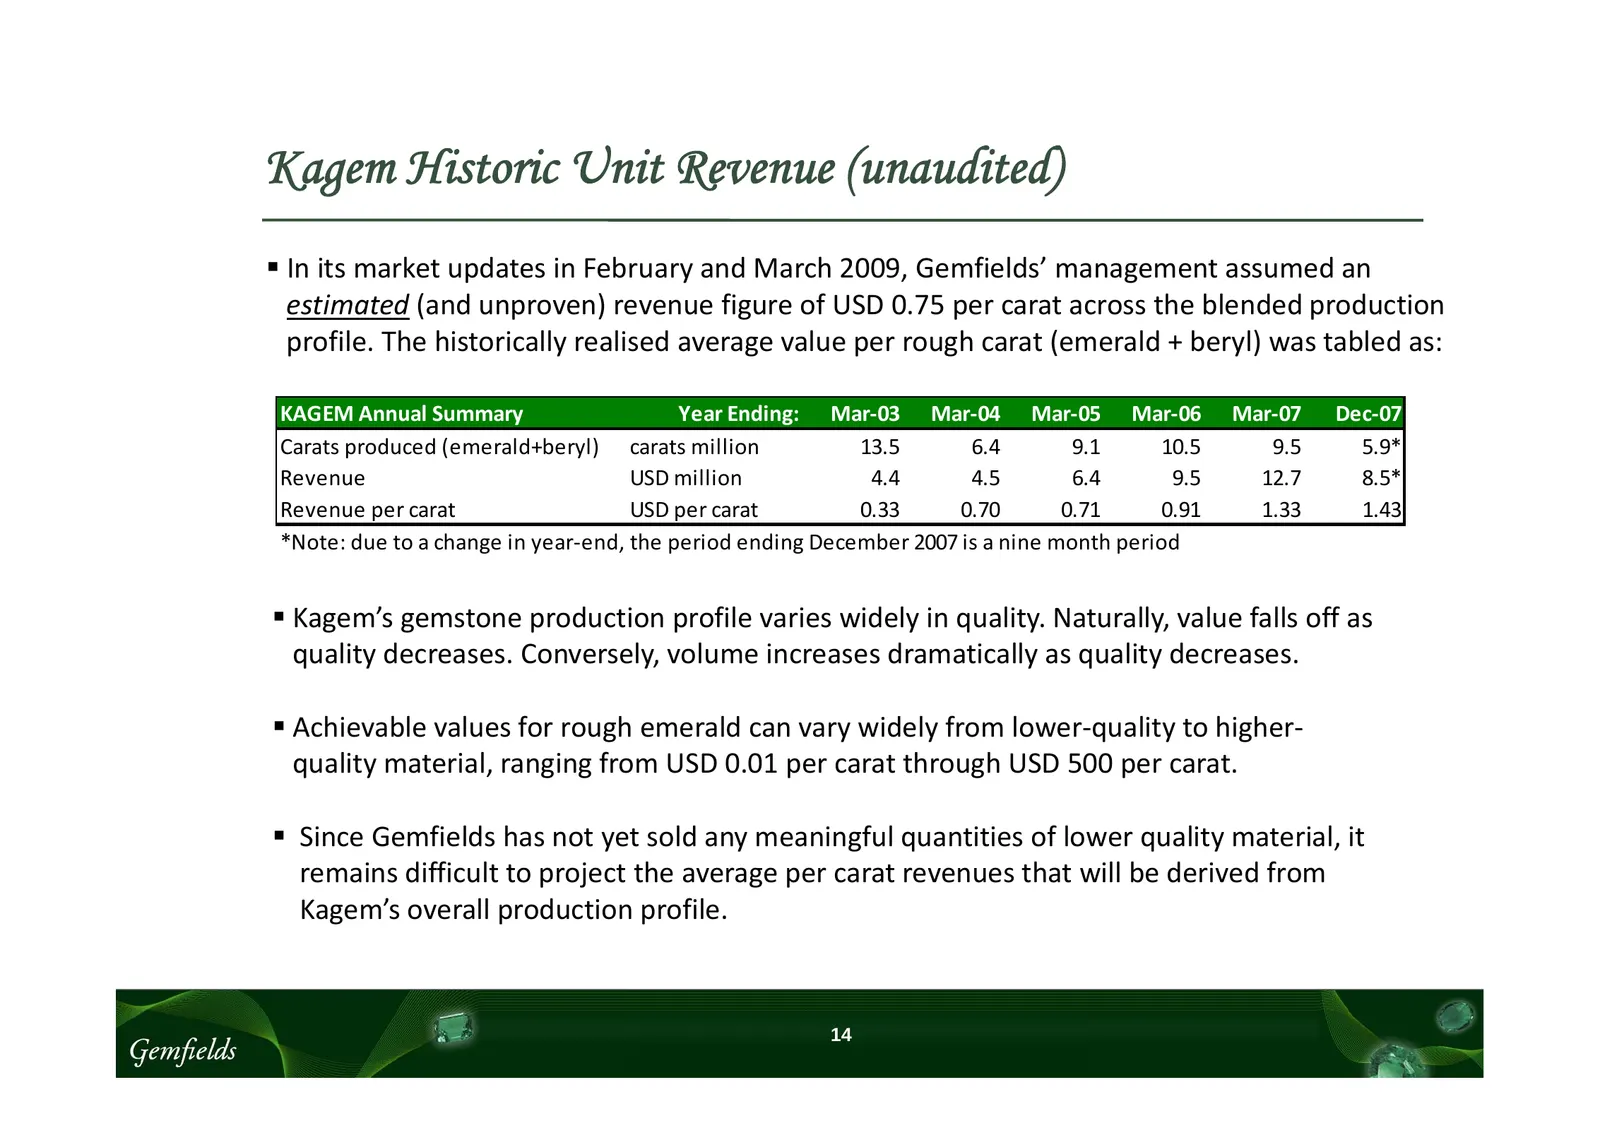
Kagem Historic Unit Revenue (unaudited) In its market updates in February and March 2009, Gemfields’ management assumed an estimated (and unproven) revenue figure of USD 0.75 per carat across the blended production profile. The historically realised average value per rough carat (emerald + beryl)
Slide 15: End
End Gemfields
Source: Internet Archive copy of gemfieldsgroup.com
More decks from Gemfields Group Limited
 FY2025 Earnings Presentation26 slides · Mar 26, 2026
 H1 2025 Earnings Presentation74 slides · Sep 26, 2025
 FY2024 Earnings Presentation30 slides · Apr 11, 2025
 Investor Presentation (November 2024)39 slides · November 2024
 FY2023 Earnings Presentation37 slides · Mar 25, 2024
 FY2022 Earnings Presentation71 slides · Mar 24, 2023