Wachovia Corp New
Wachovia Corp New — Q2 2008 Earnings Presentation
56 slides from Wachovia Corp New's earnings presentation, Jul 22, 2008
Slide 1: Wachovia Corporation 2Q08 Financial Highlights
Exhibit (99)(b) Wachovia Corporation 2Q08 Financial Highlights July 22, 2008
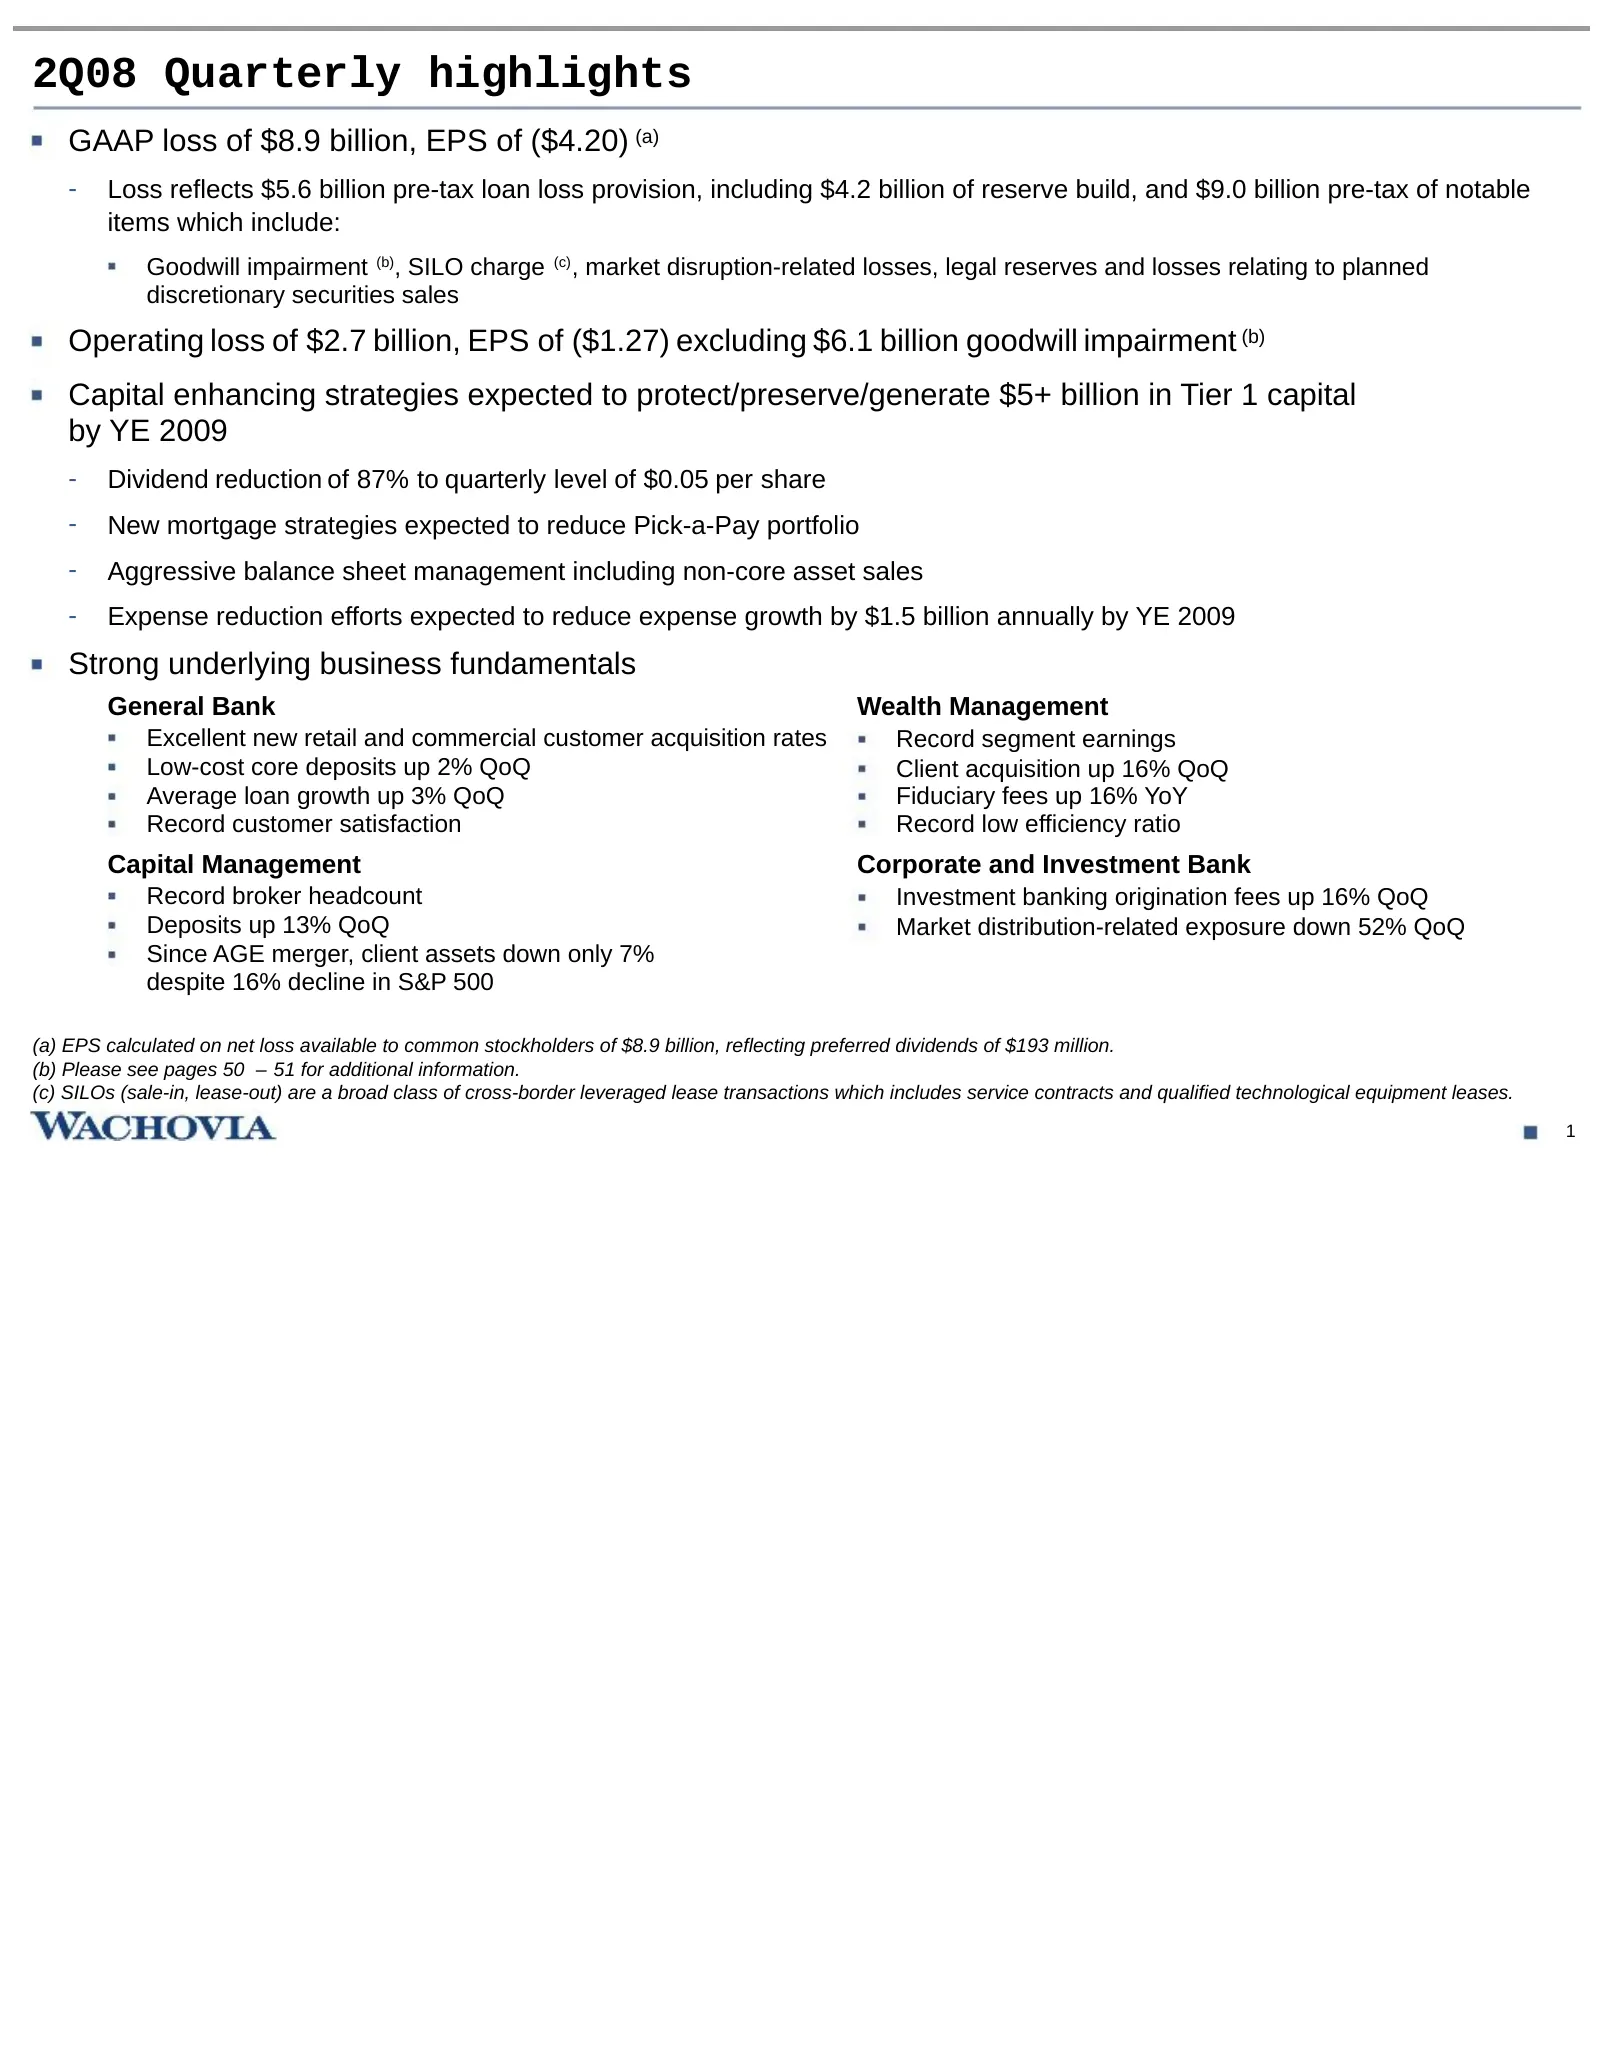
Slide 2: 2Q08 Quarterly highlights
2Q08 Quarterly highlights GAAP loss of $8.9 billion, EPS of ($4.20) (a) - Loss reflects $5.6 billion pre-tax loan loss provision, including $4.2 billion of reserve build, and $9.0 billion pre-tax of notable items which include: Goodwill impairment (b), SILO charge (c) , market disruption-related los
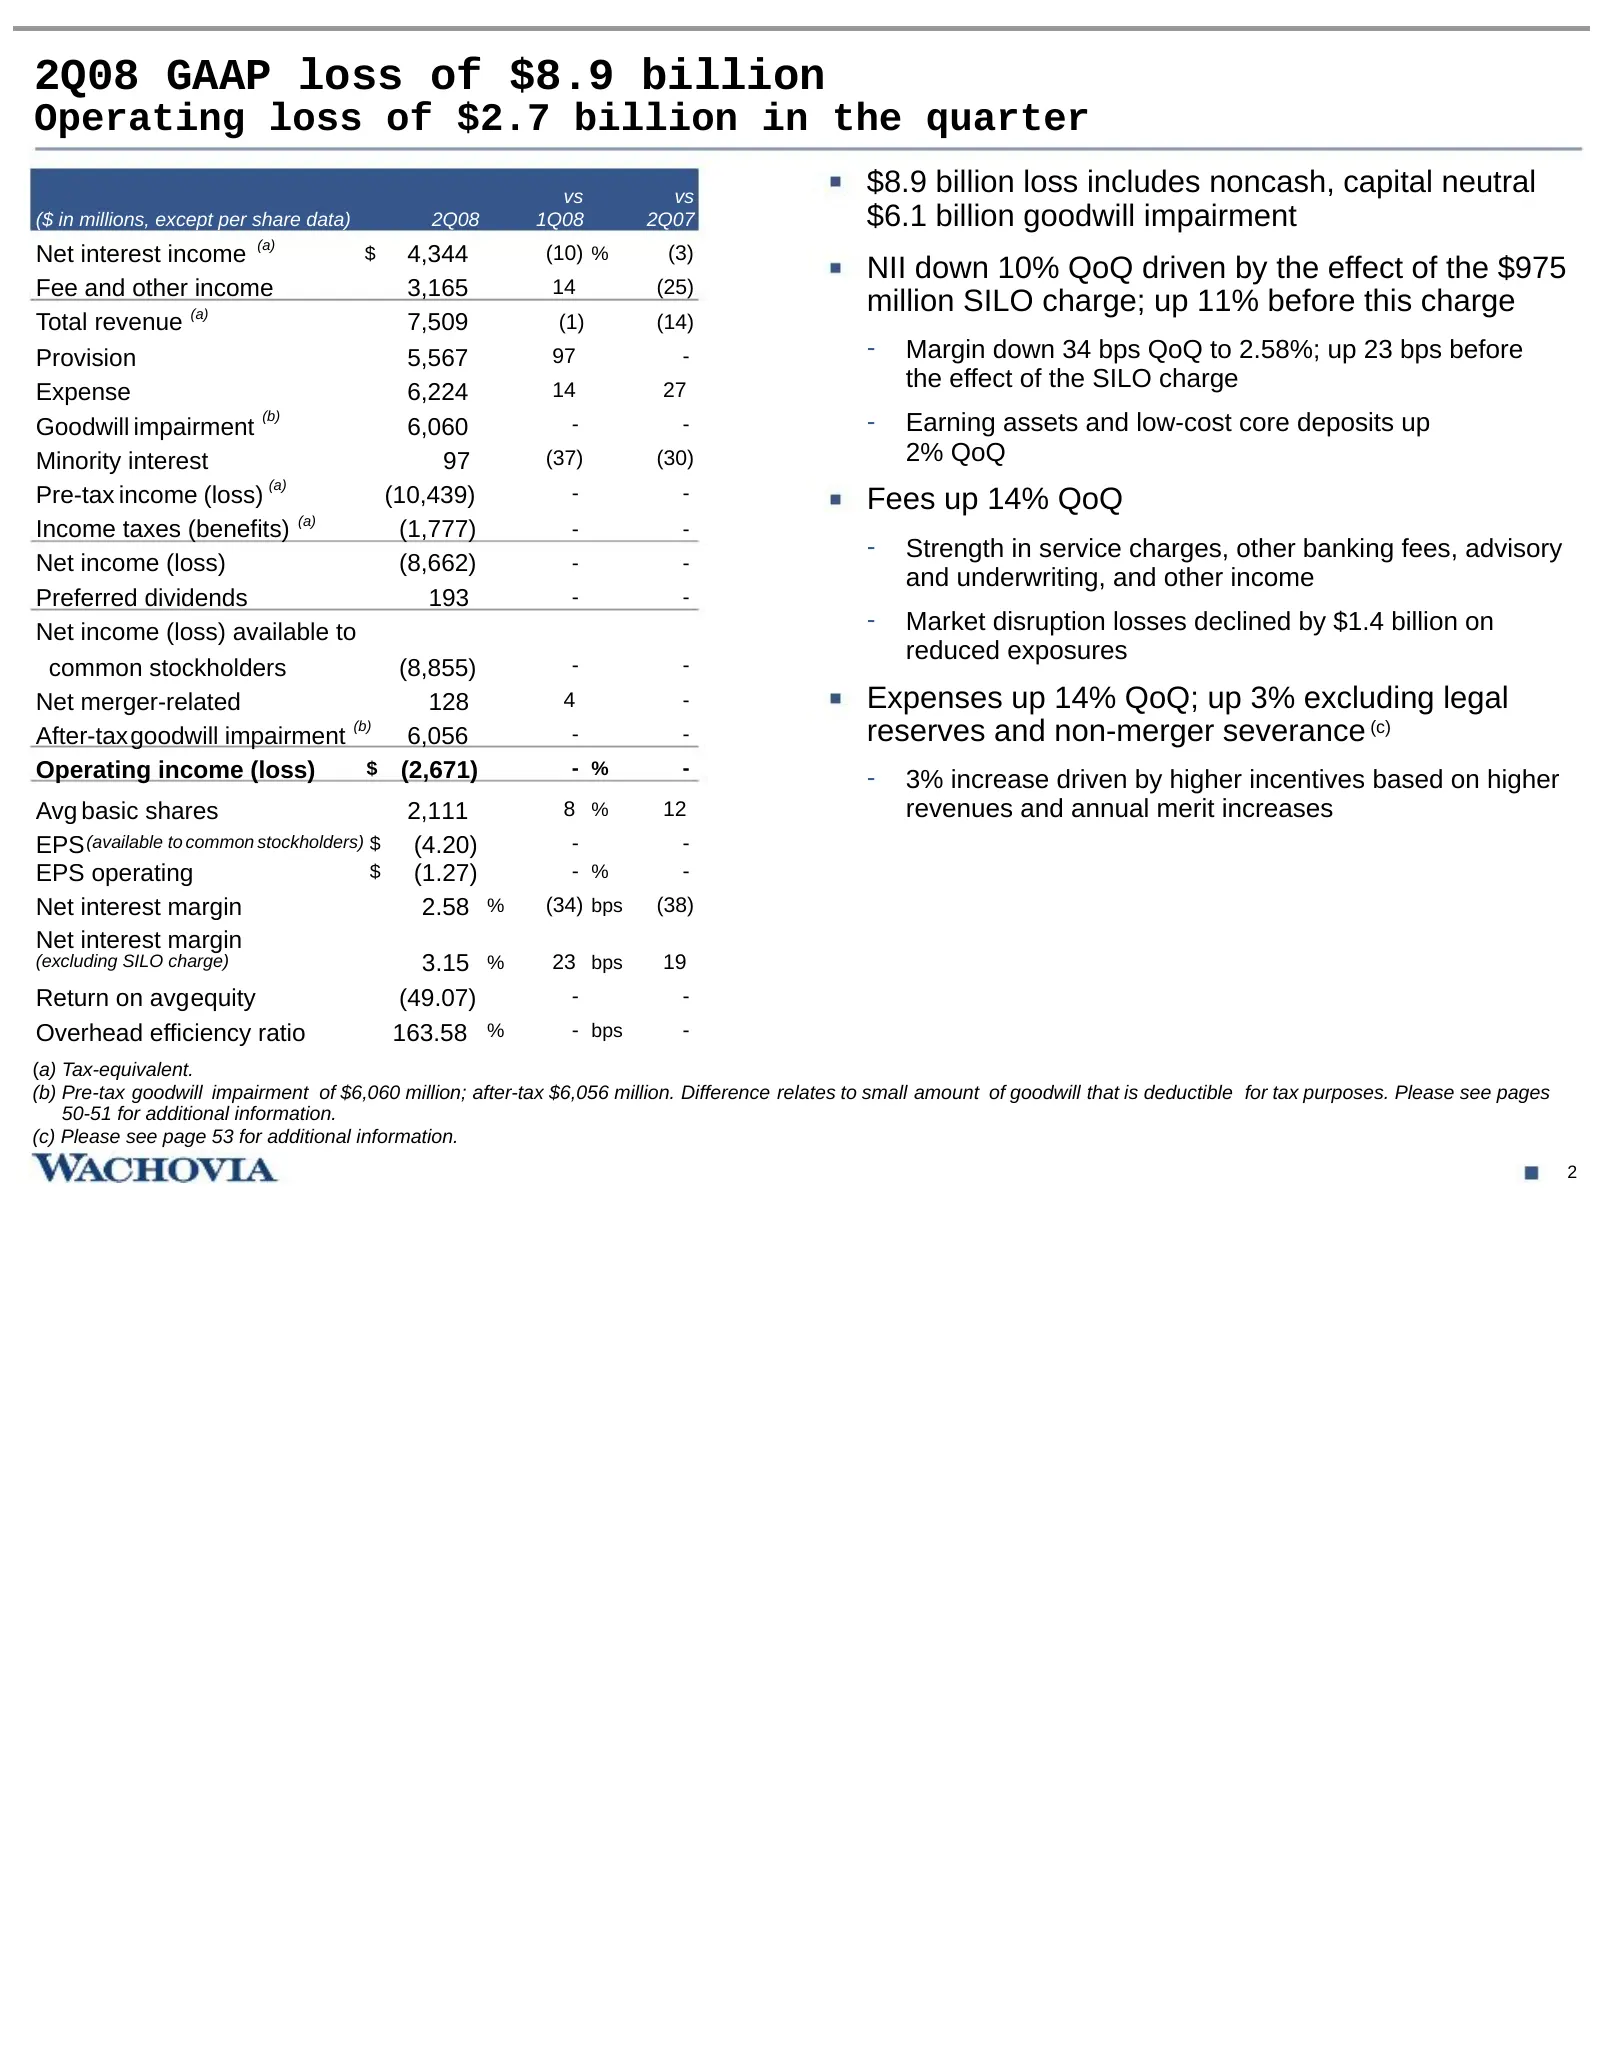
Slide 3: 2Q08 GAAP loss of $8.9 billion
2Q08 GAAP loss of $8.9 billion Operating loss of $2.7 billion in the quarter vs vs $8.9 billion loss includes noncash, capital neutral ($ in millions, except per share data) 2Q08 1Q08 2Q07 $6.1 billion goodwill impairment Net interest income (a) $ 4,344 (10) % (3) NII down 10% QoQ driven by the effe
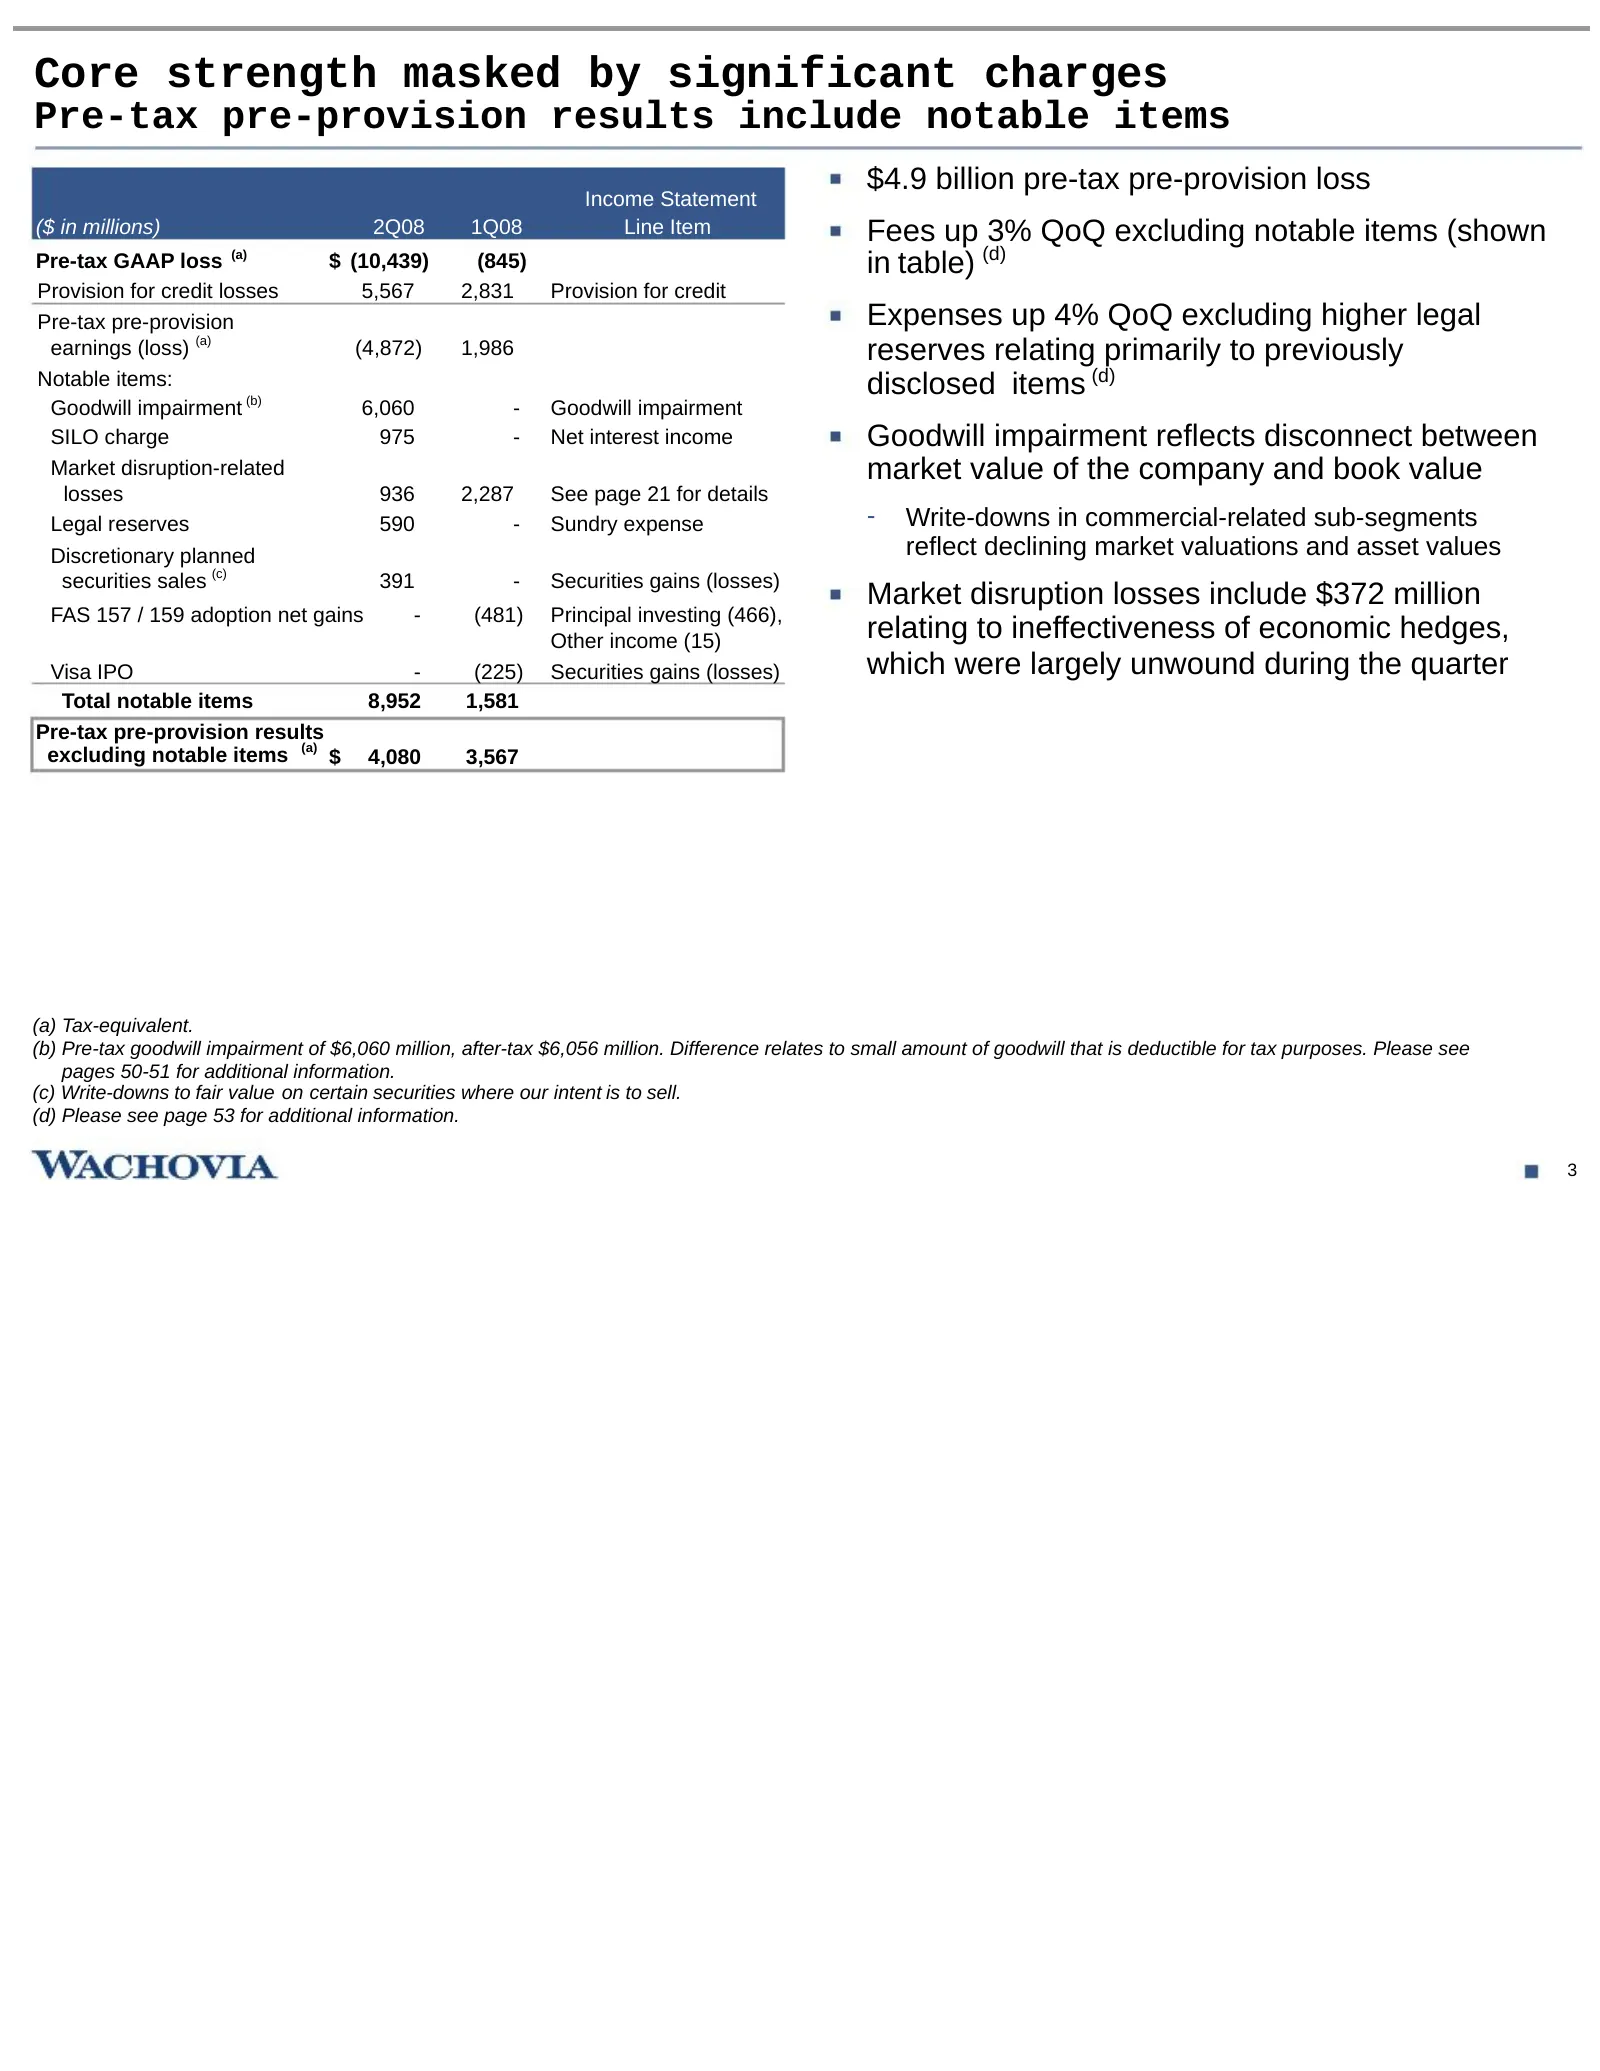
Slide 4: Core strength masked by significant charges
Core strength masked by significant charges Pre-tax pre-provision results include notable items $4.9 billion pre-tax pre-provision loss Income Statement ($ in millions) 2Q08 1Q08 Line Item Fees up 3% QoQ excluding notable items (shown Pre-tax GAAP loss (a) $ (10,439) (845) in table) (d) Provision fo
Slide 5: NII driven by modest loan growth
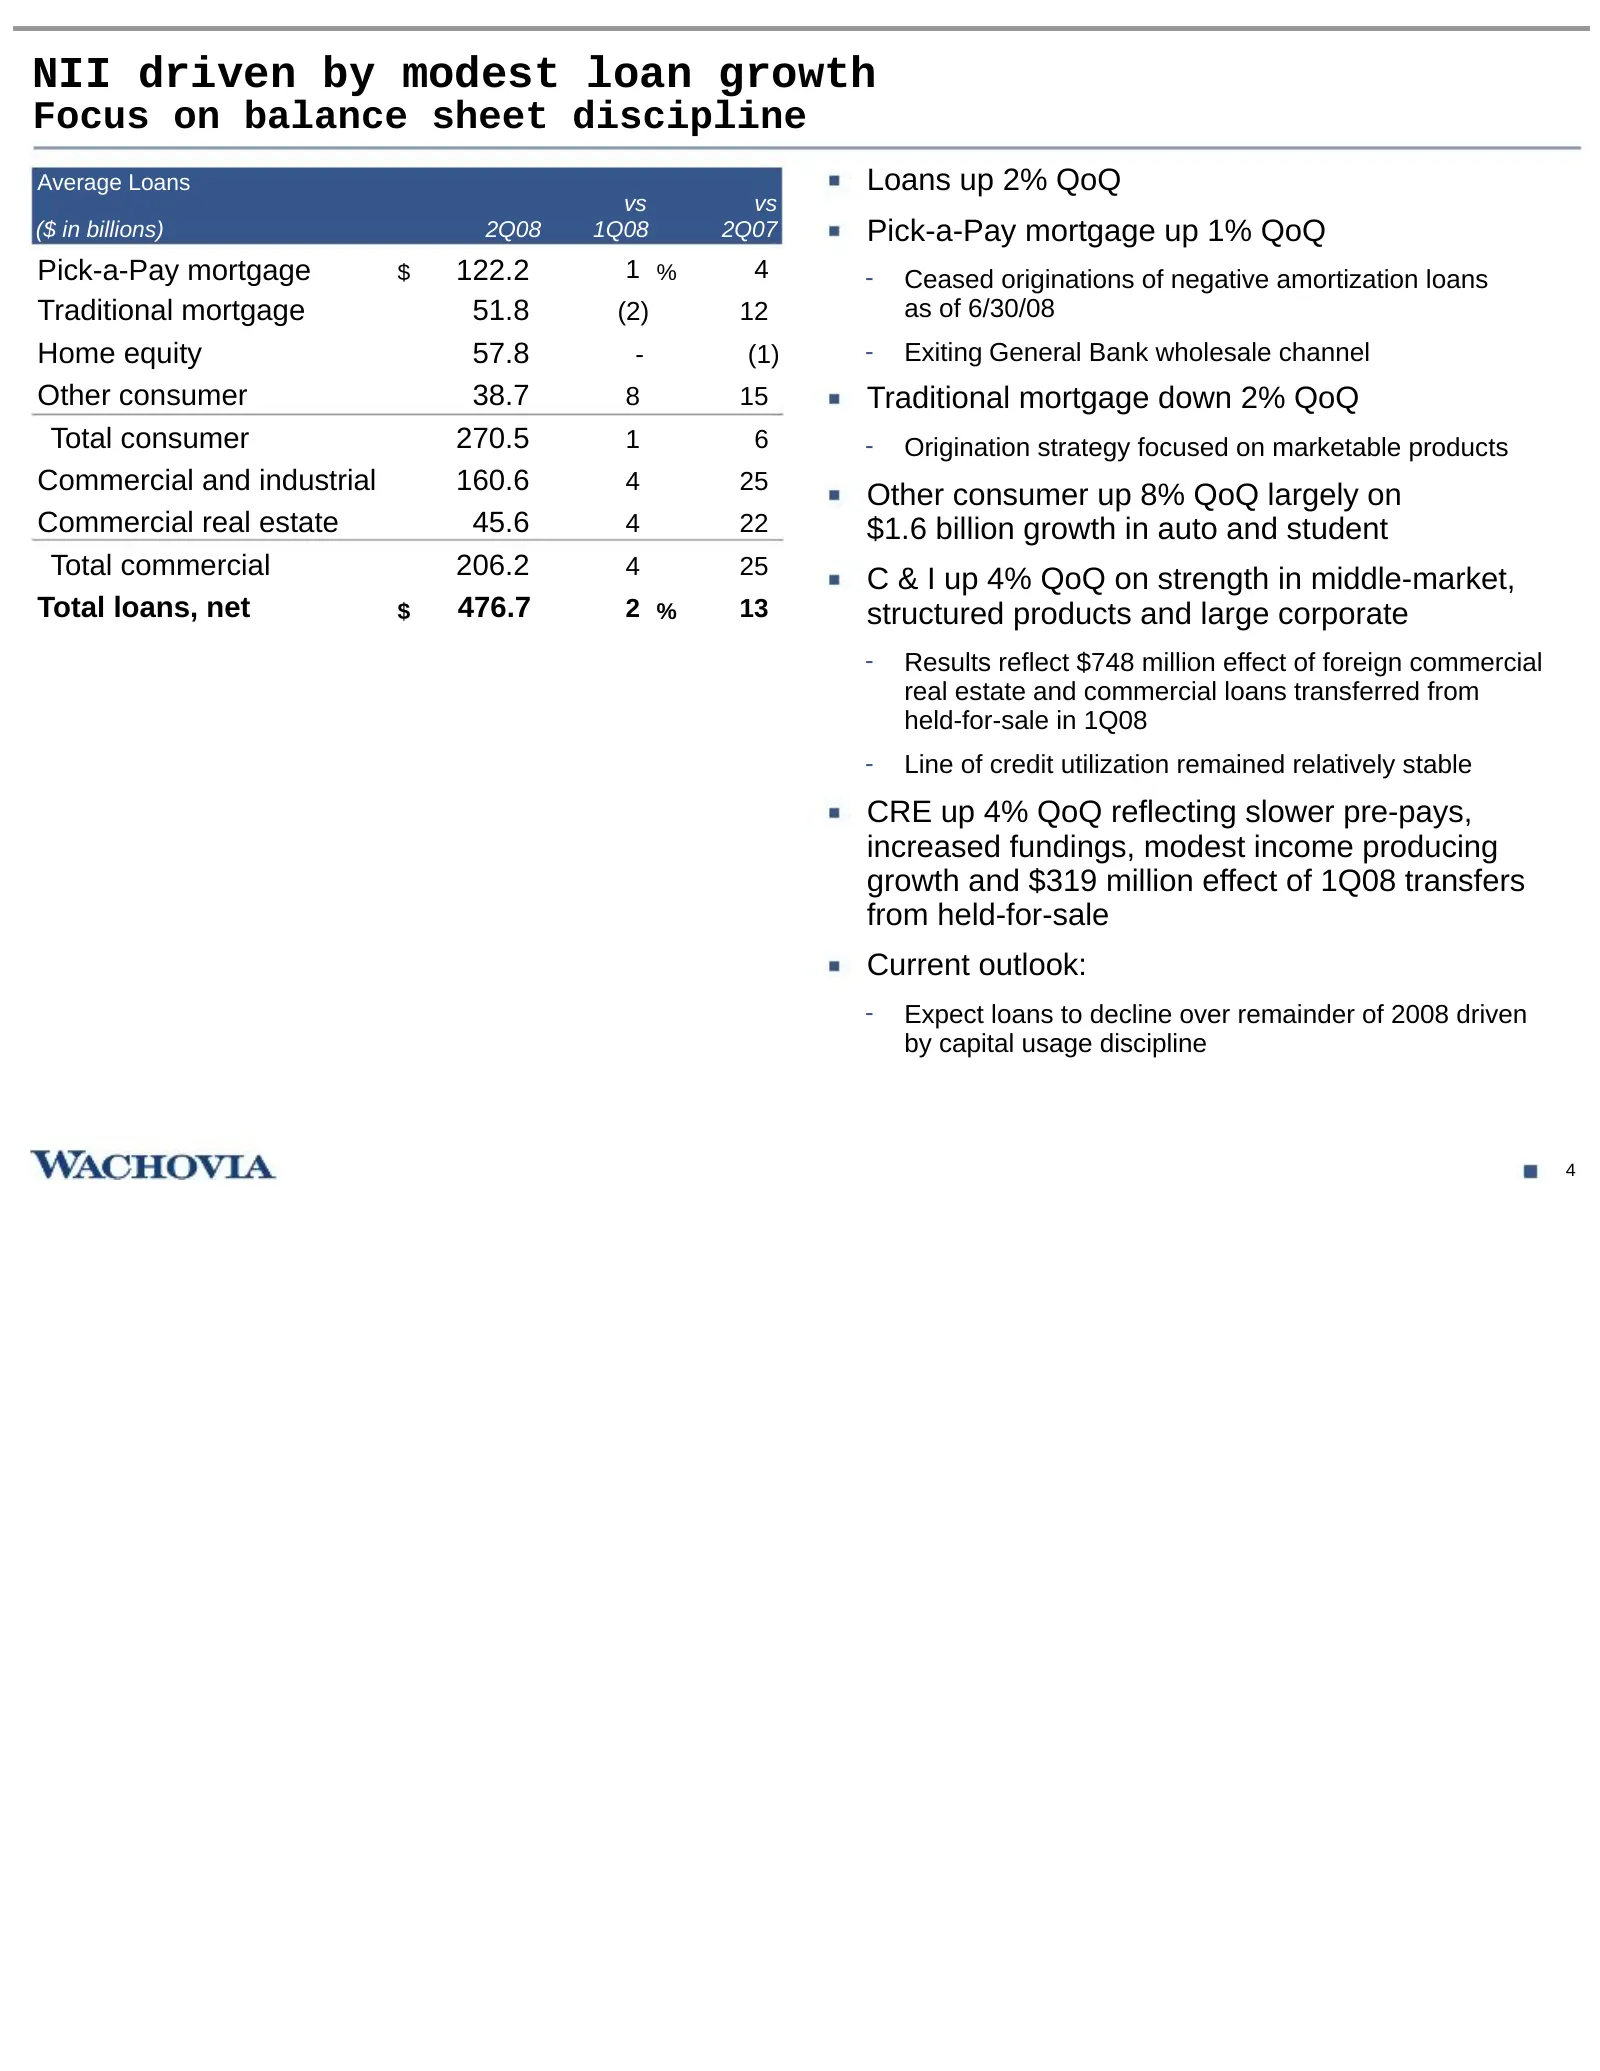
NII driven by modest loan growth Focus on balance sheet discipline Average Loans Loans up 2% QoQ vs vs ($ in billions) 2Q08 1Q08 2Q07 Pick-a-Pay mortgage up 1% QoQ Pick-a-Pay mortgage $ 122.2 1 % 4 - Ceased originations of negative amortization loans Traditional mortgage 51.8 (2) 12 as of 6/30/08 Ho
Slide 6: NII driven by strong low-cost core deposit growth and improved spreads
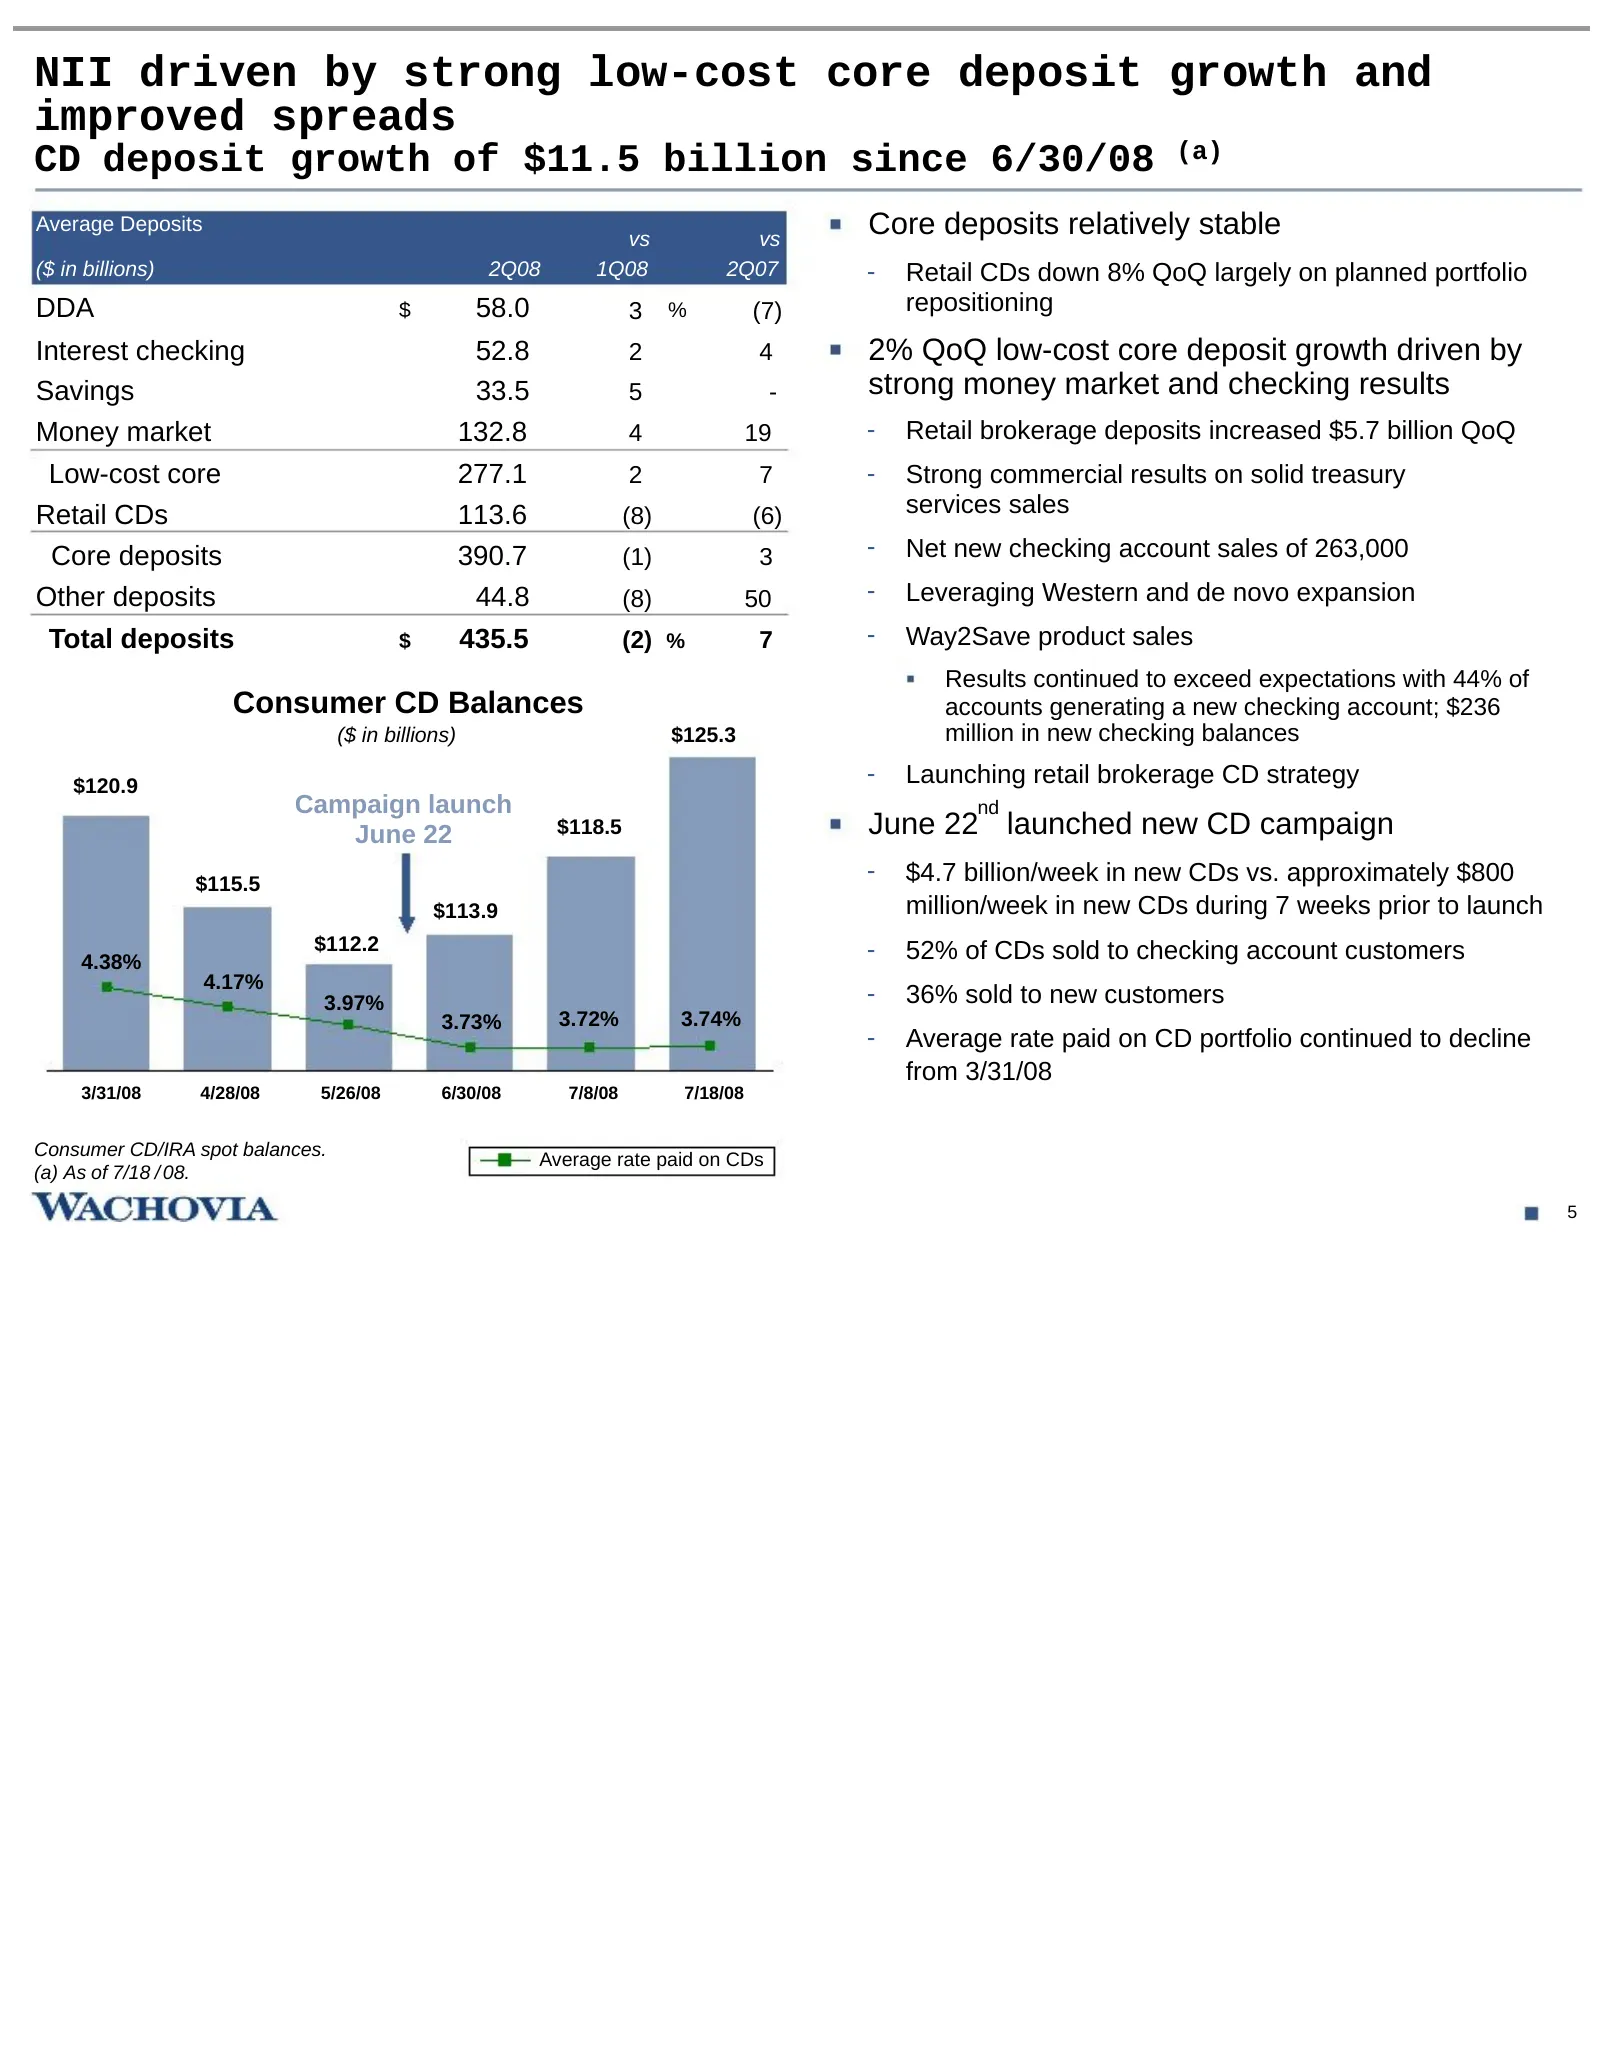
NII driven by strong low-cost core deposit growth and improved spreads CD deposit growth of $11.5 billion since 6/30/08 (a) Average Deposits vs vs Core deposits relatively stable ($ in billions) 2Q08 1Q08 2Q07 - Retail CDs down 8% QoQ largely on planned portfolio DDA $ 58.0 3 % (7) repositioning Int
Slide 7: 2Q08 segment highlights
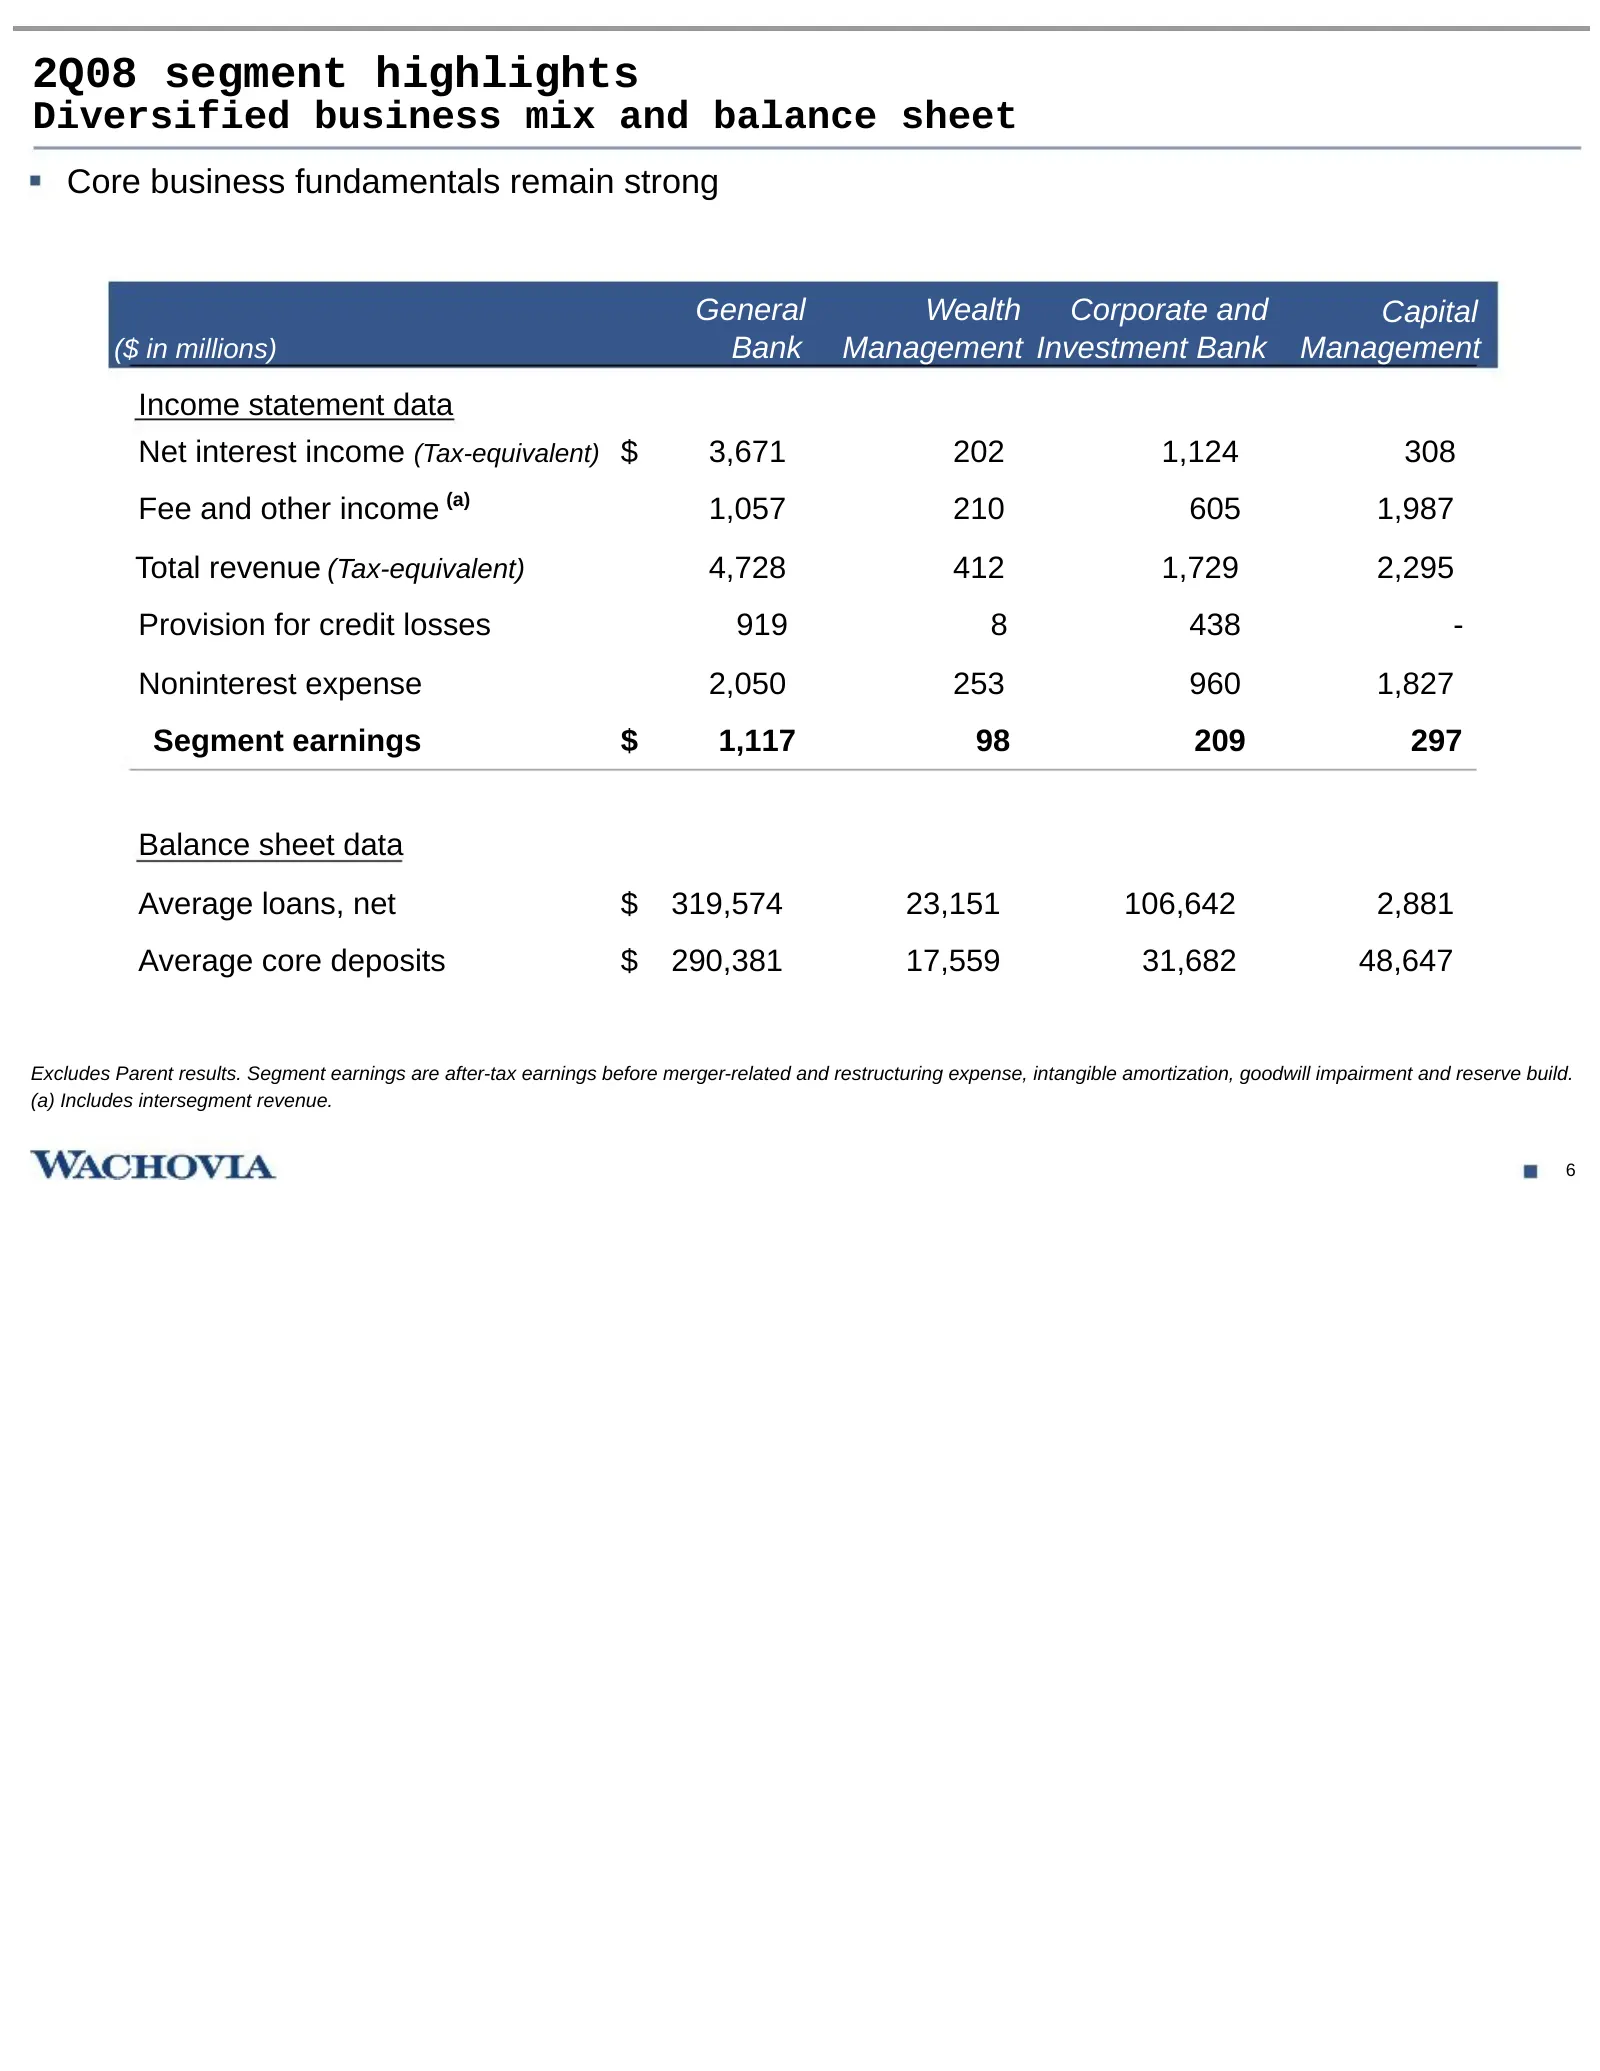
2Q08 segment highlights Diversified business mix and balance sheet Core business fundamentals remain strong General Wealth Corporate and Capital ($ in millions) Bank Management Investment Bank Management Income statement data Net interest income (Tax-equivalent) $ 3,671 202 1,124 308 Fee and other i
Slide 8: General Bank strength affected by housing market decline
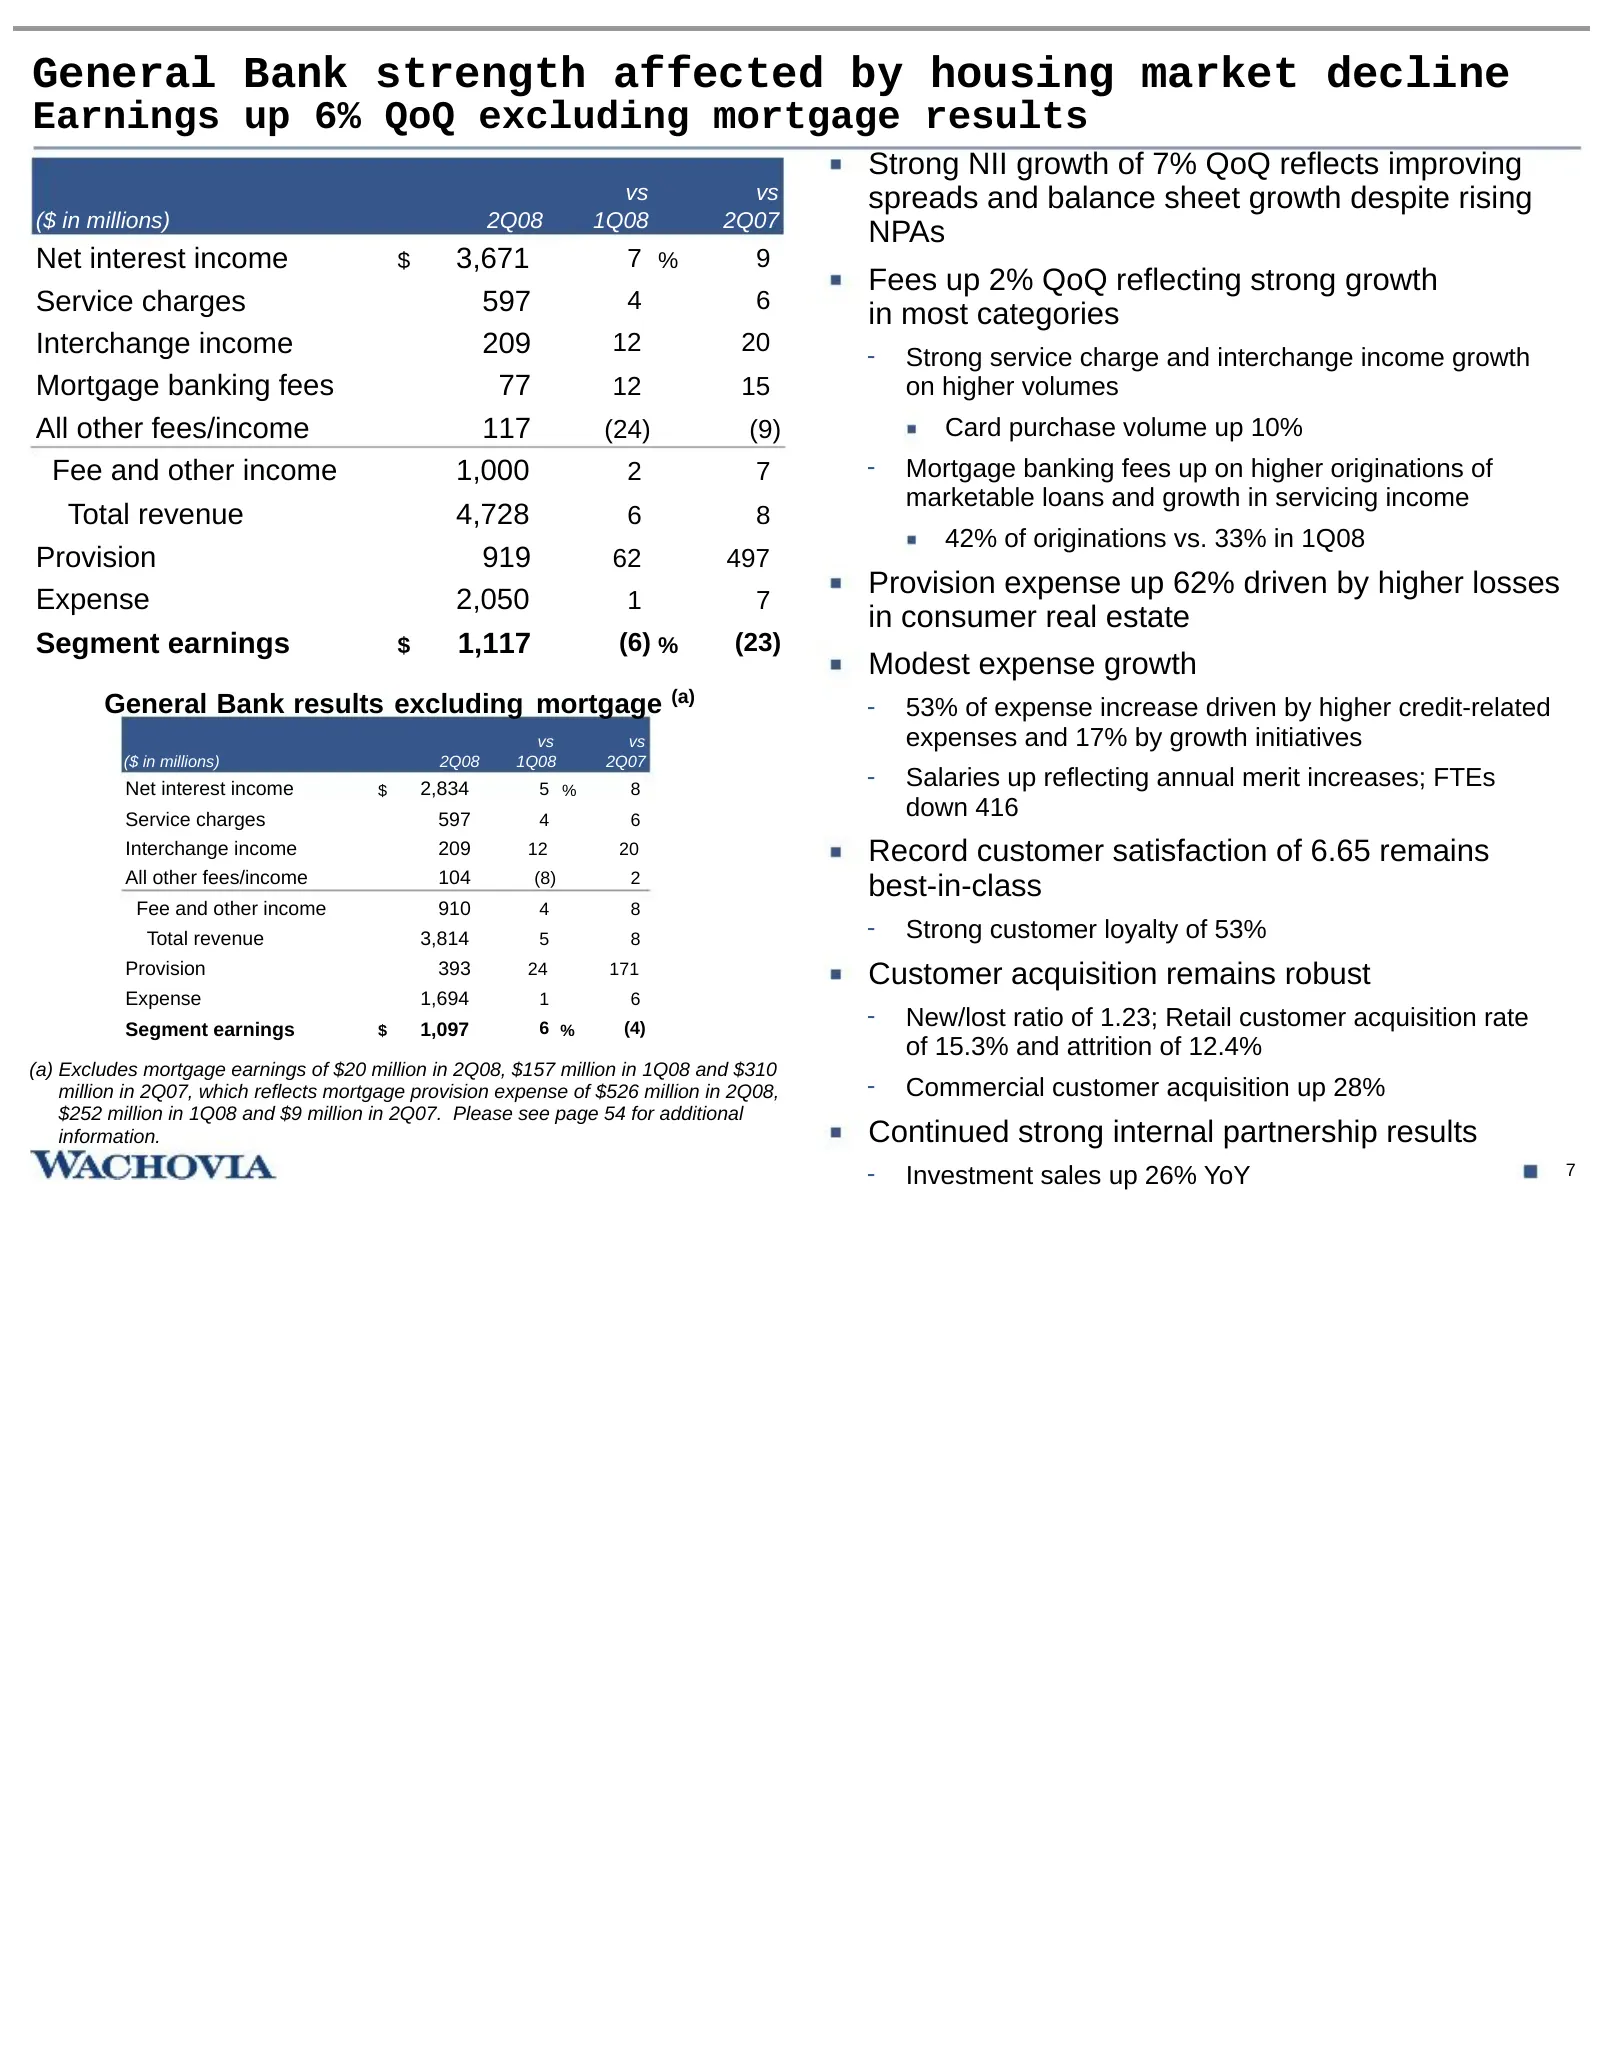
General Bank strength affected by housing market decline Earnings up 6% QoQ excluding mortgage results Strong NII growth of 7% QoQ reflects improving vs vs spreads and balance sheet growth despite rising ($ in millions) 2Q08 1Q08 2Q07 NPAs Net interest income $ 3,671 7 % 9 Fees up 2% QoQ reflecting
Slide 9: Record Wealth Management results, up 7%
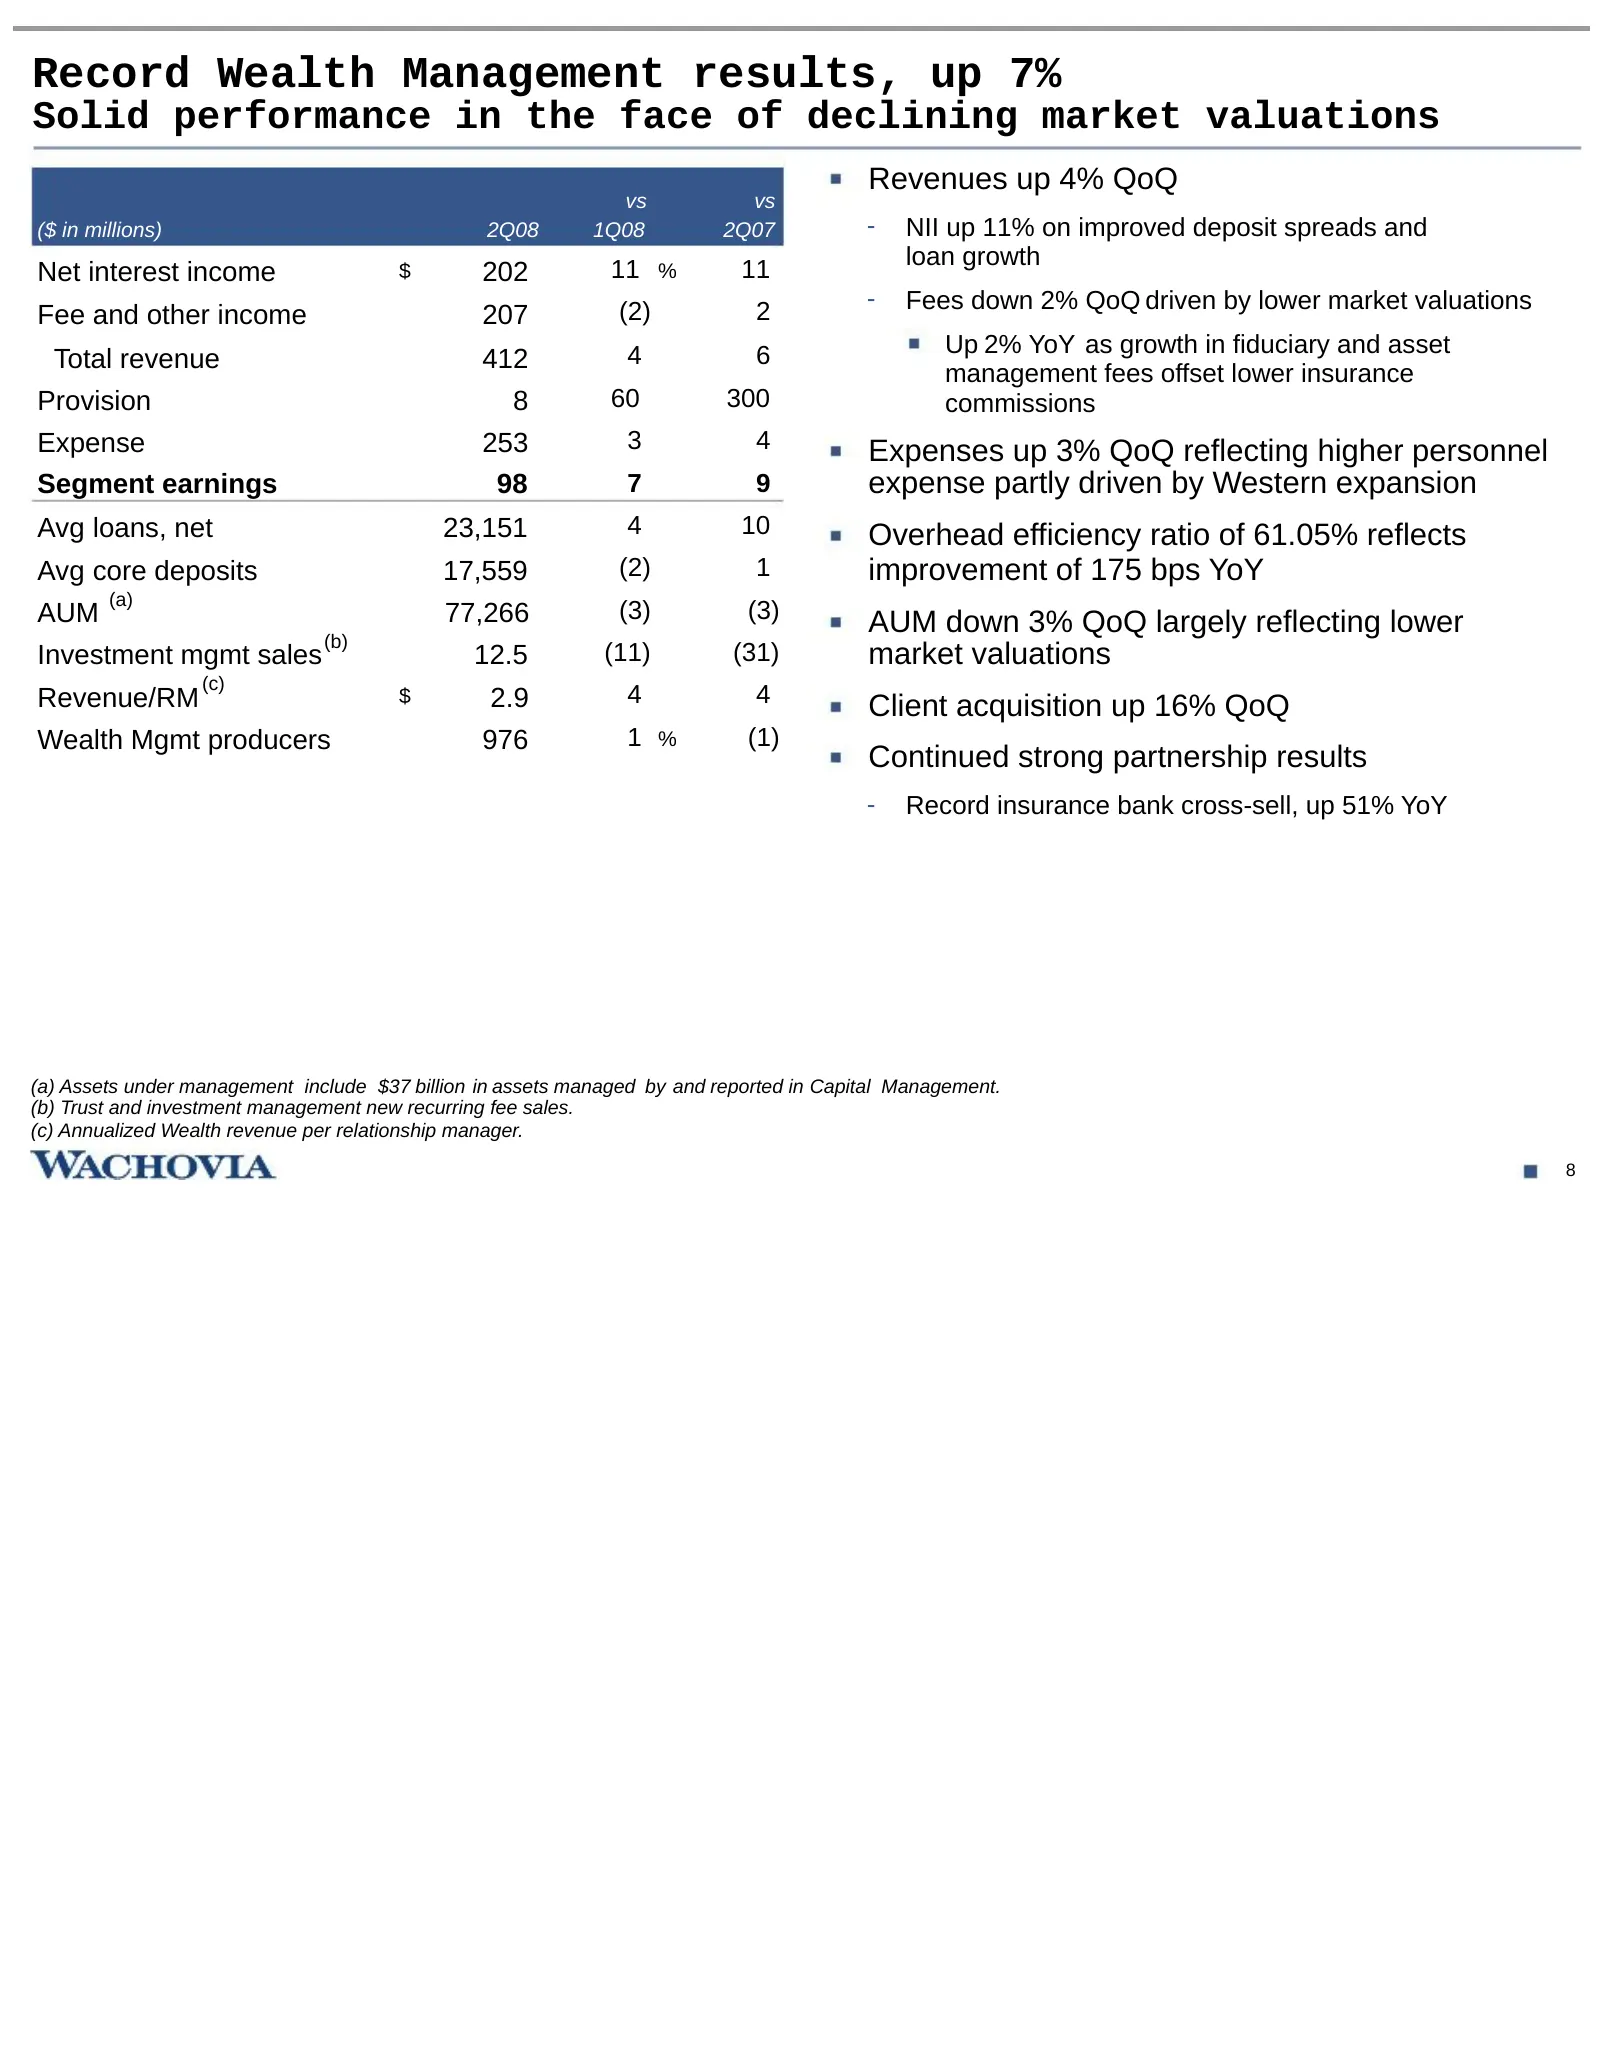
Record Wealth Management results, up 7% Solid performance in the face of declining market valuations Revenues up 4% QoQ vs vs ($ in millions) 2Q08 1Q08 2Q07 - NII up 11% on improved deposit spreads and 11 % 11 loan growth Net interest income $ 202 (2) 2 - Fees down 2% QoQ driven by lower market valu
Slide 10: Corporate and Investment Bank results reflect lower market disruption losses
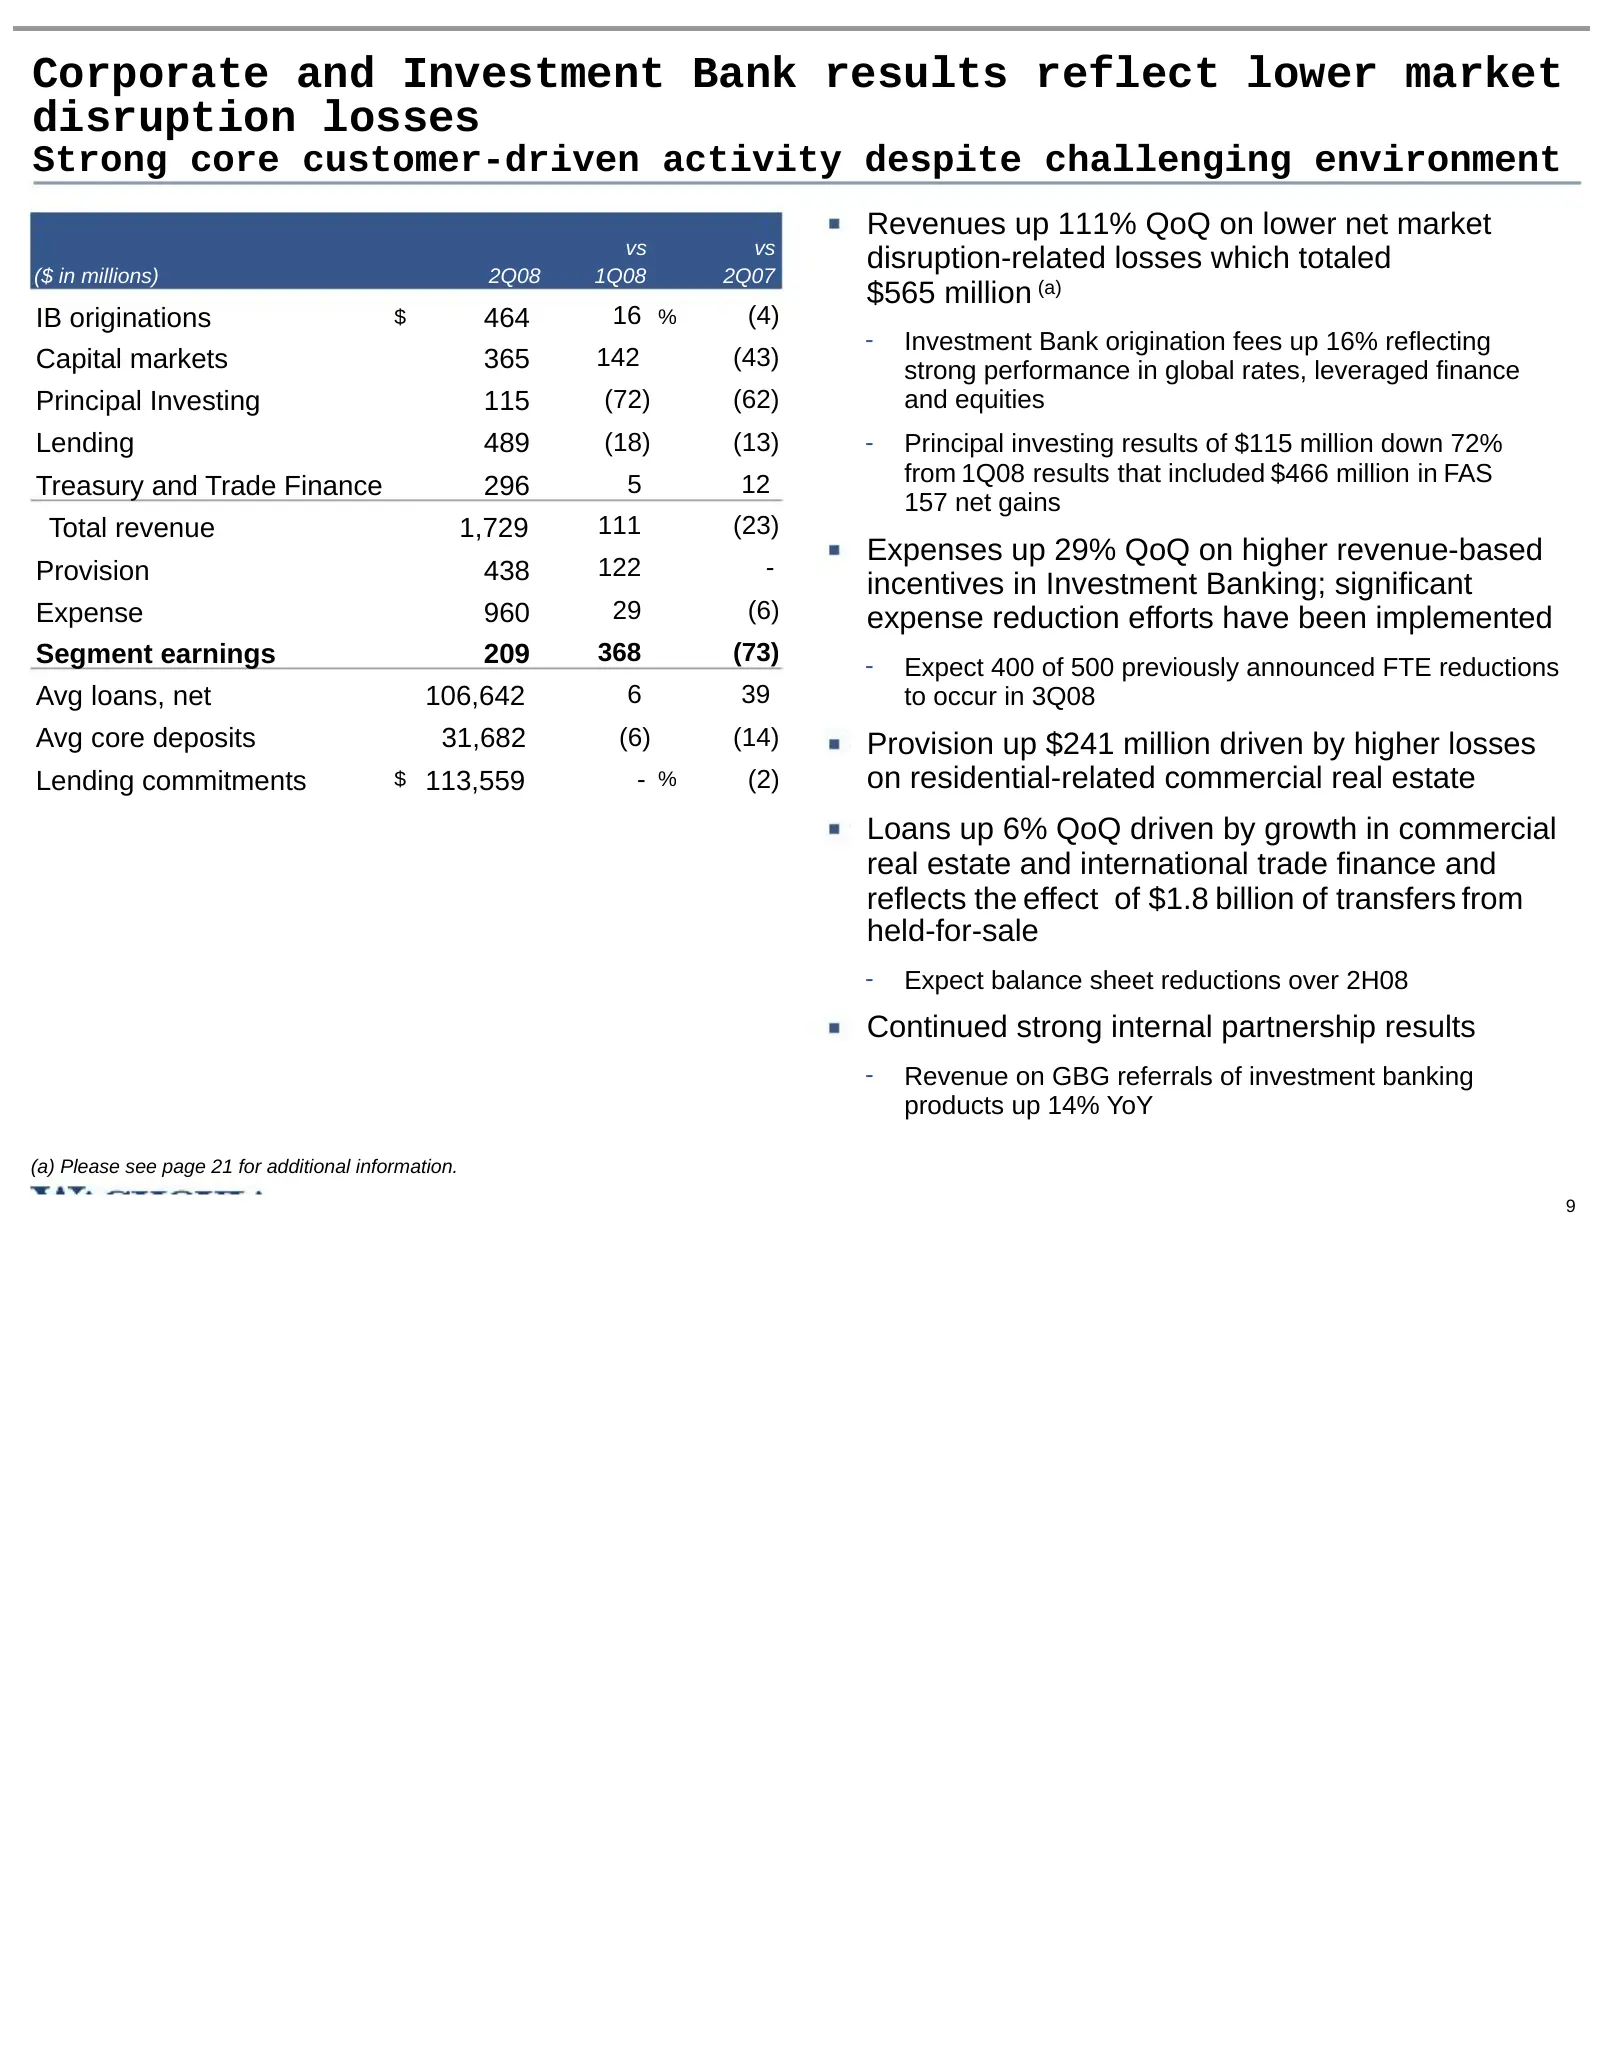
Corporate and Investment Bank results reflect lower market disruption losses Strong core customer-driven activity despite challenging environment Revenues up 111% QoQ on lower net market vs vs ($ in millions) 2Q08 1Q08 2Q07 disruption-related losses which totaled $565 million (a) IB originations $ 4
Slide 11: Capital Management results reflect significant market disruption losses
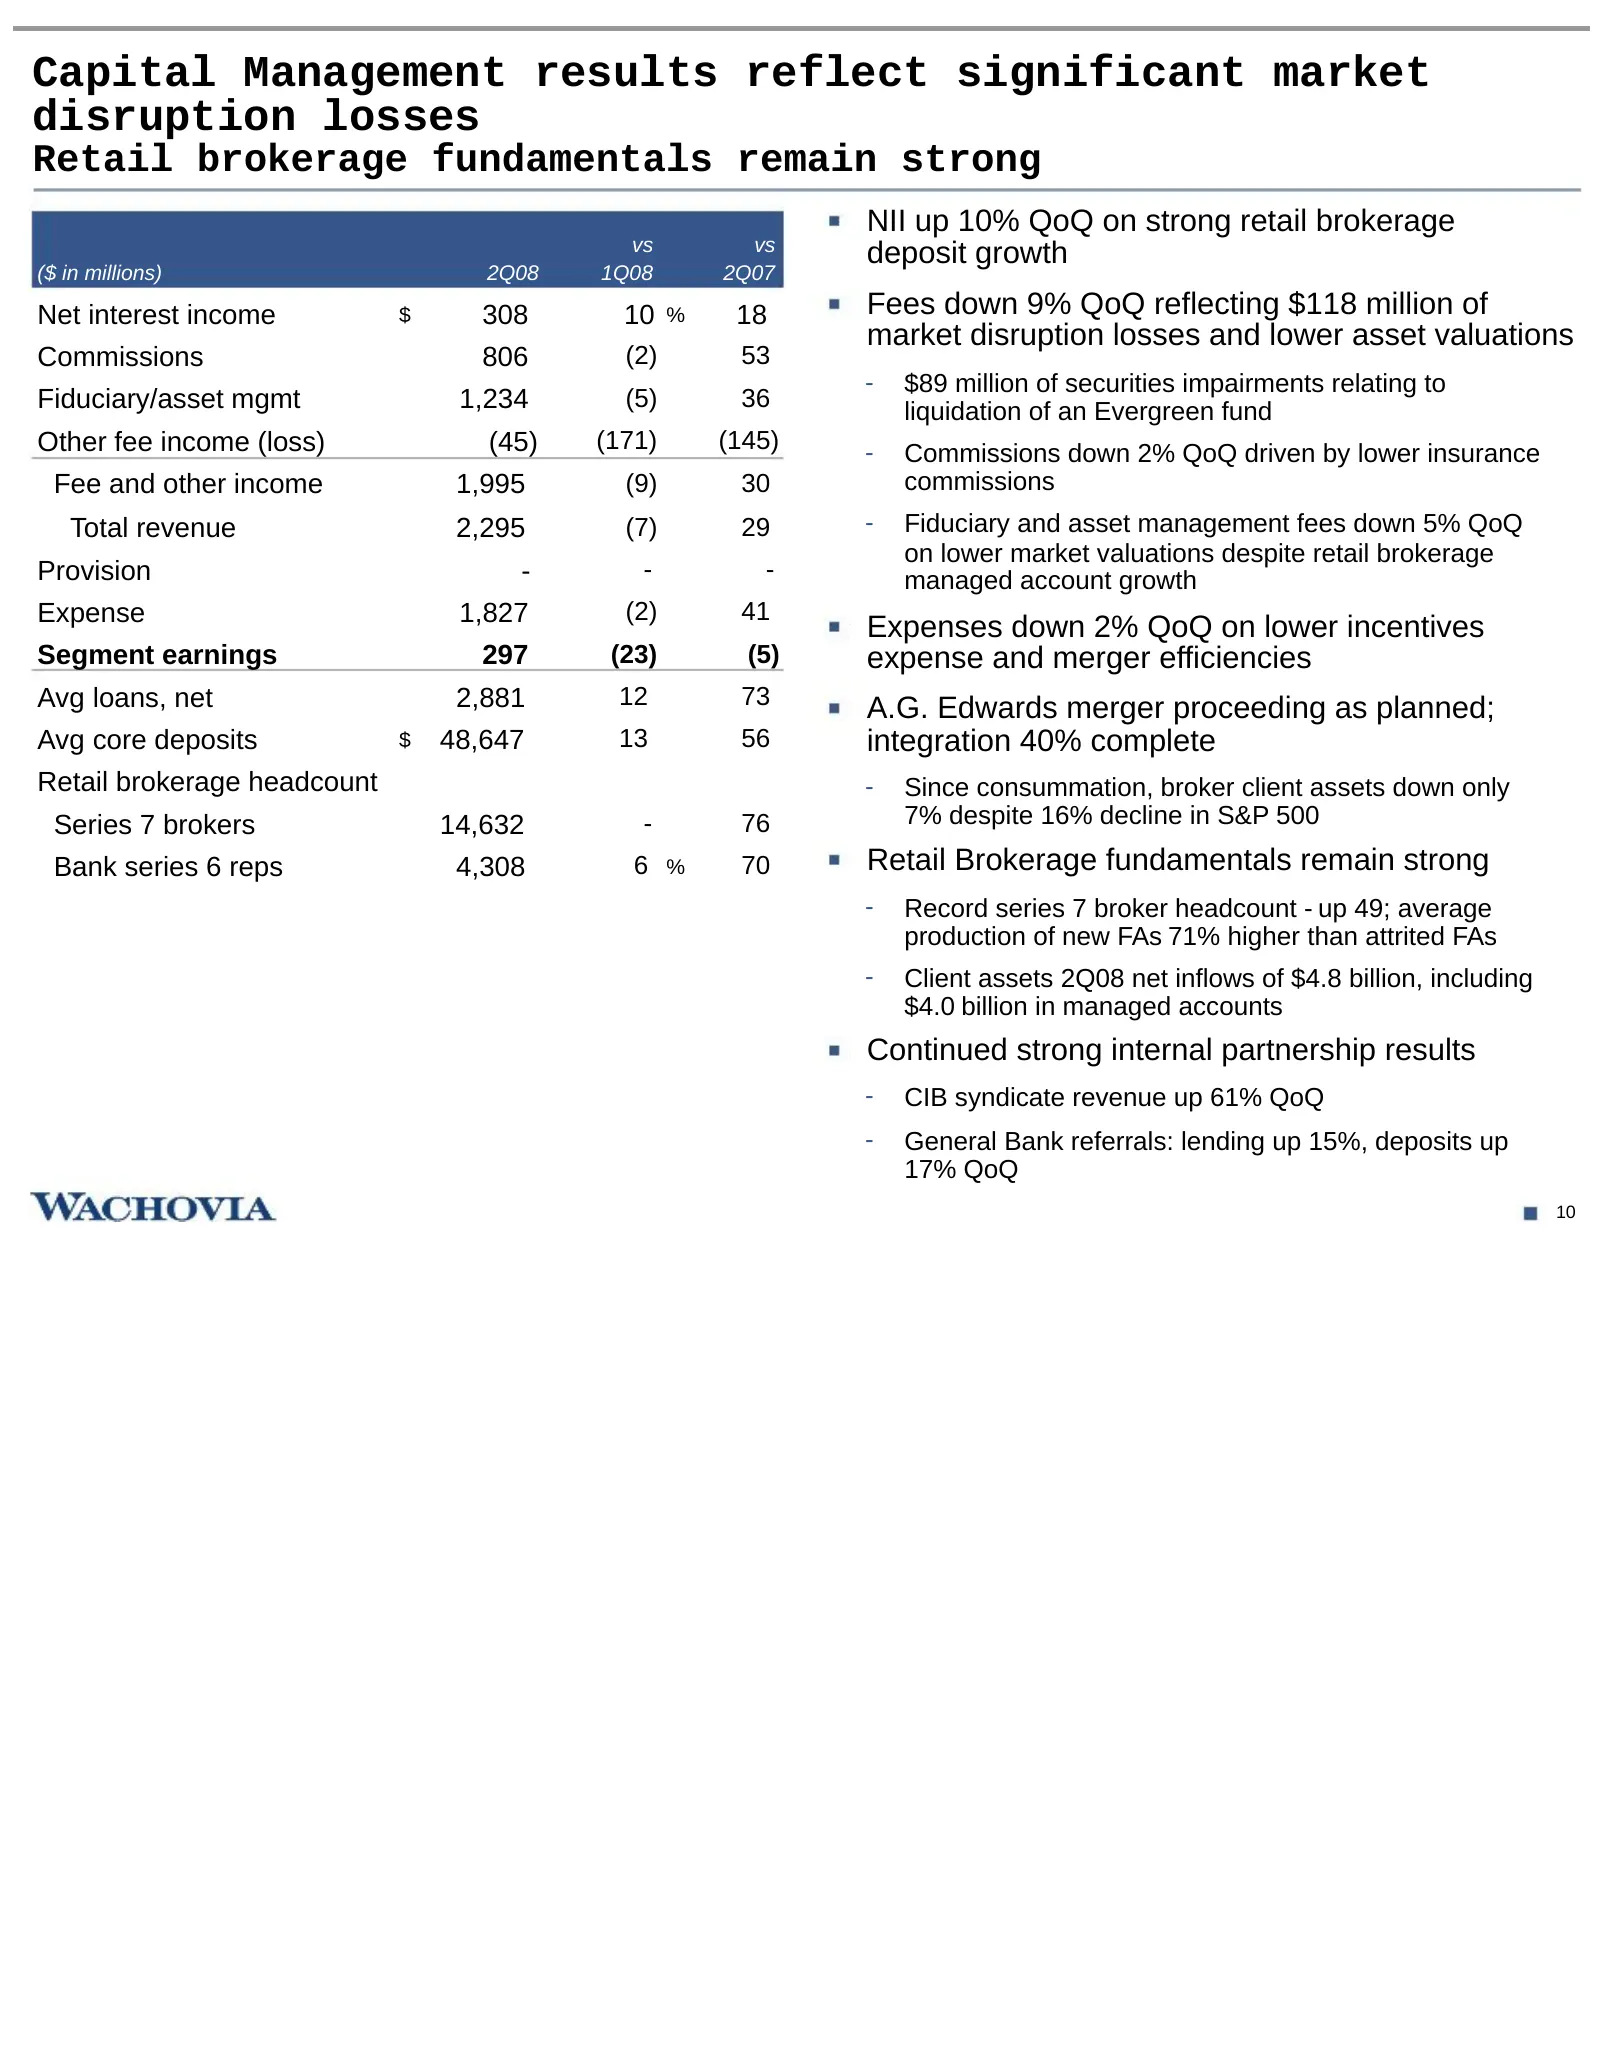
Capital Management results reflect significant market disruption losses Retail brokerage fundamentals remain strong NII up 10% QoQ on strong retail brokerage vs vs deposit growth ($ in millions) 2Q08 1Q08 2Q07 Net interest income $ 308 10 % 18 Fees down 9% QoQ reflecting $118 million of market disru
Slide 12: Continued focus on risk reduction
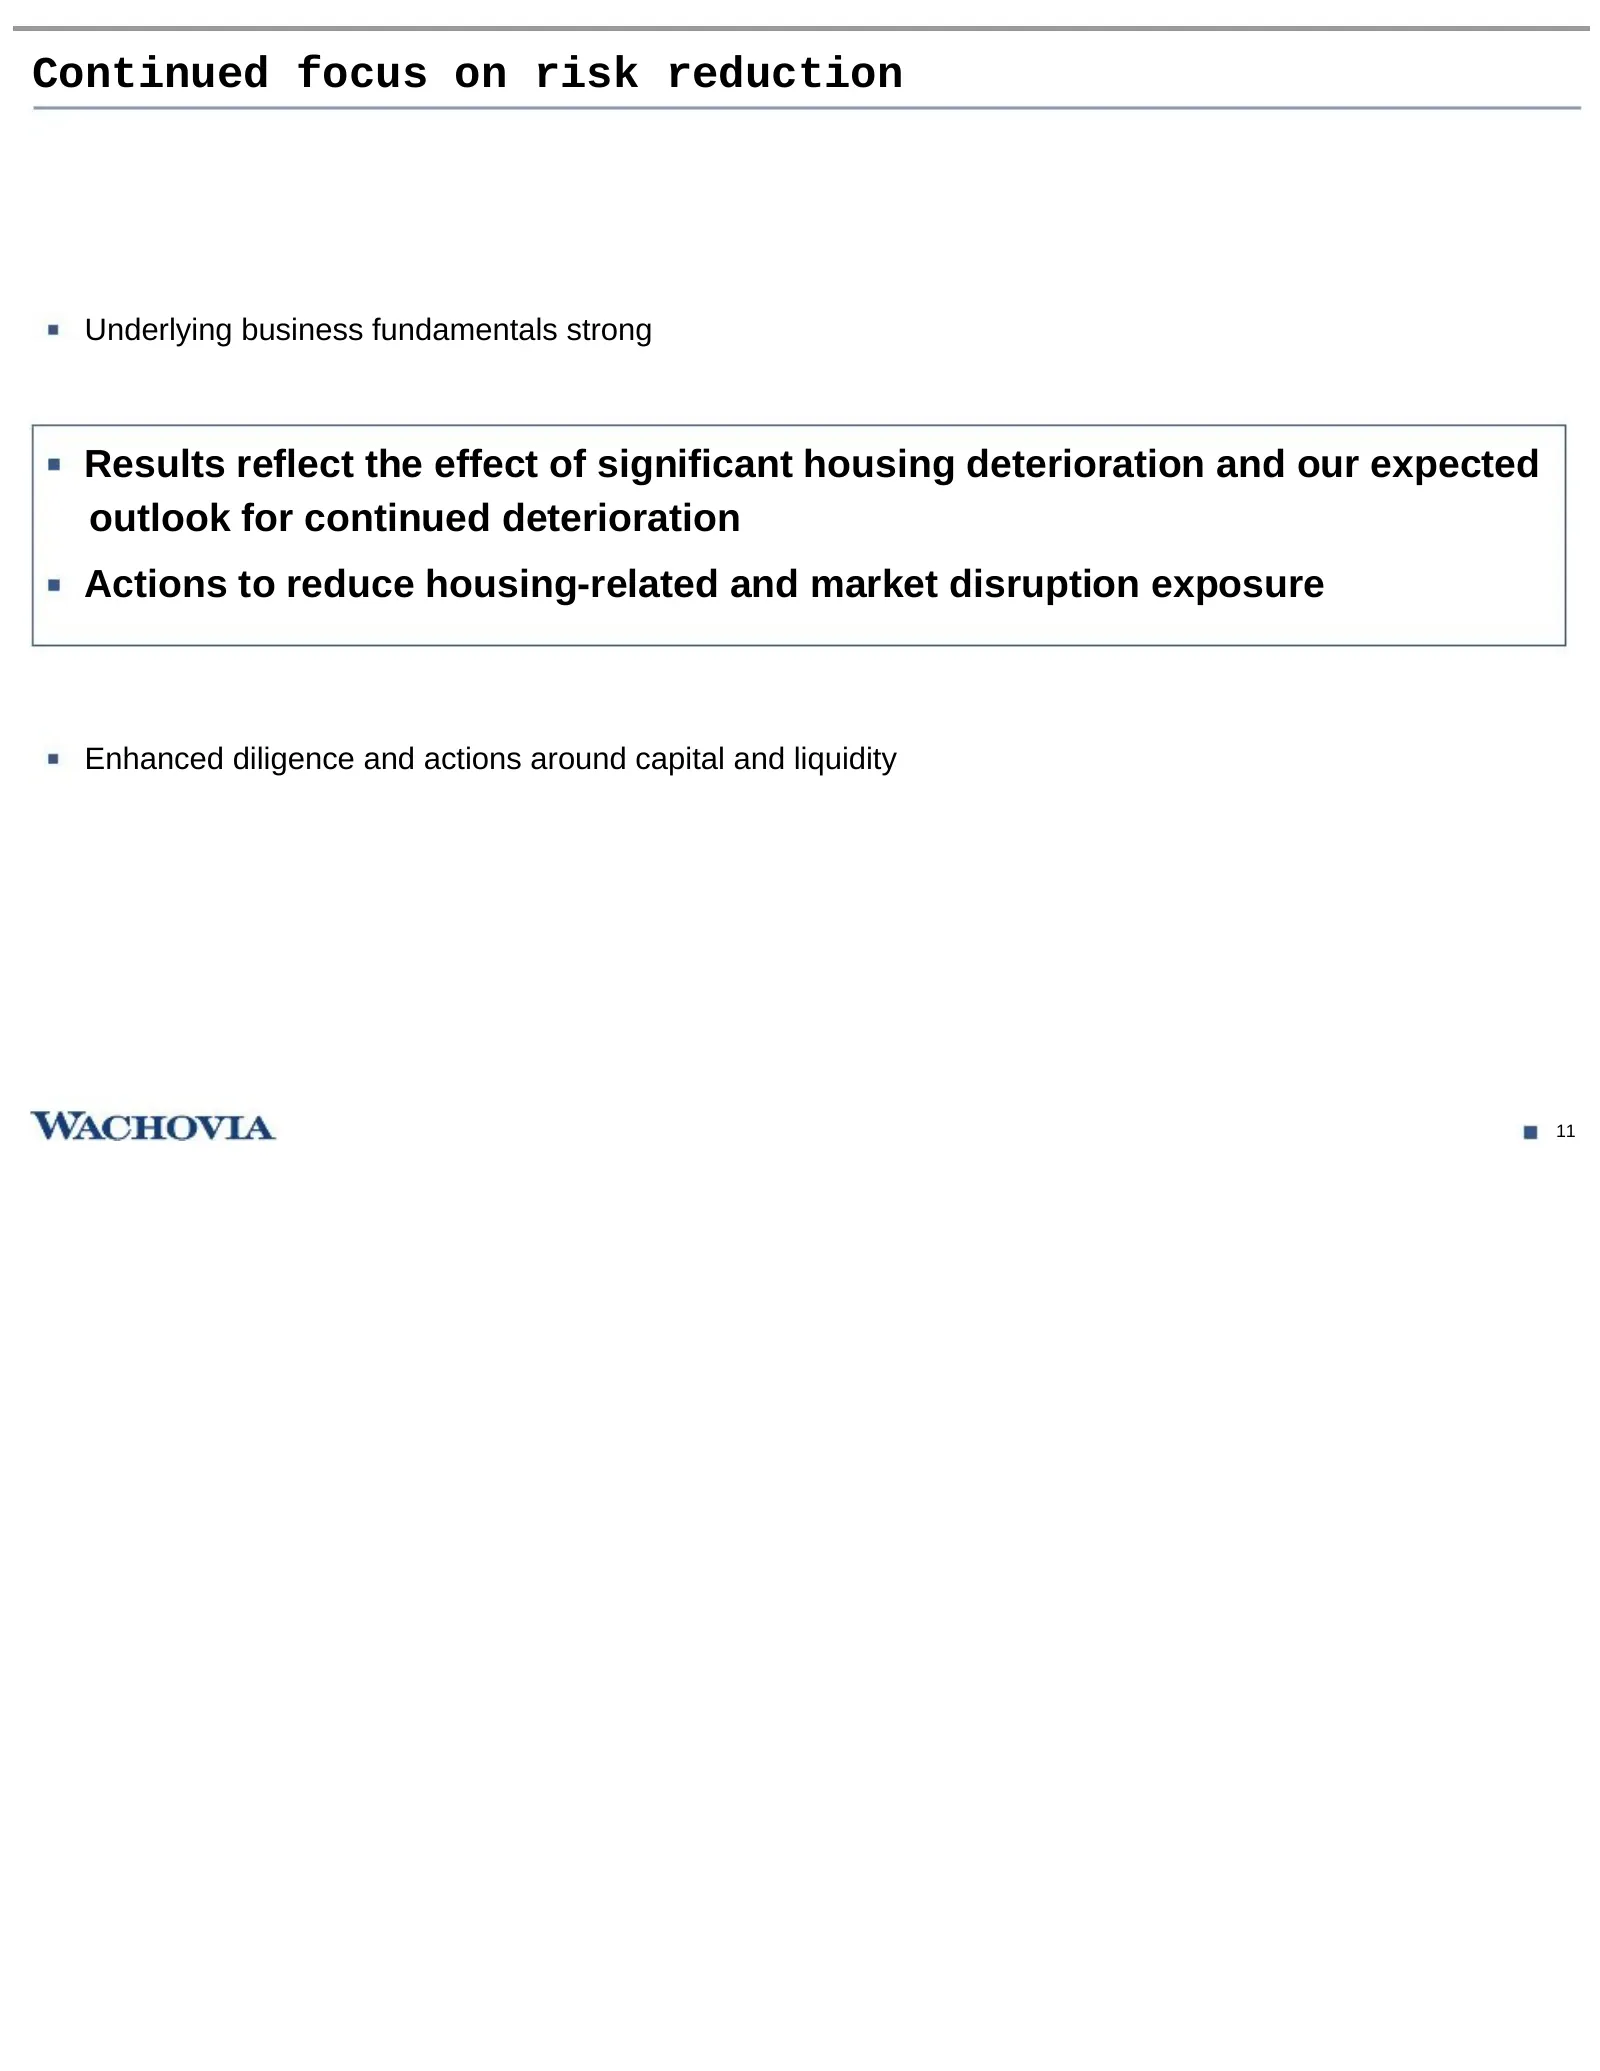
Continued focus on risk reduction Underlying business fundamentals strong Results reflect the effect of significant housing deterioration and our expected outlook for continued deterioration Actions to reduce housing-related and market disruption exposure Enhanced diligence and actions around capita
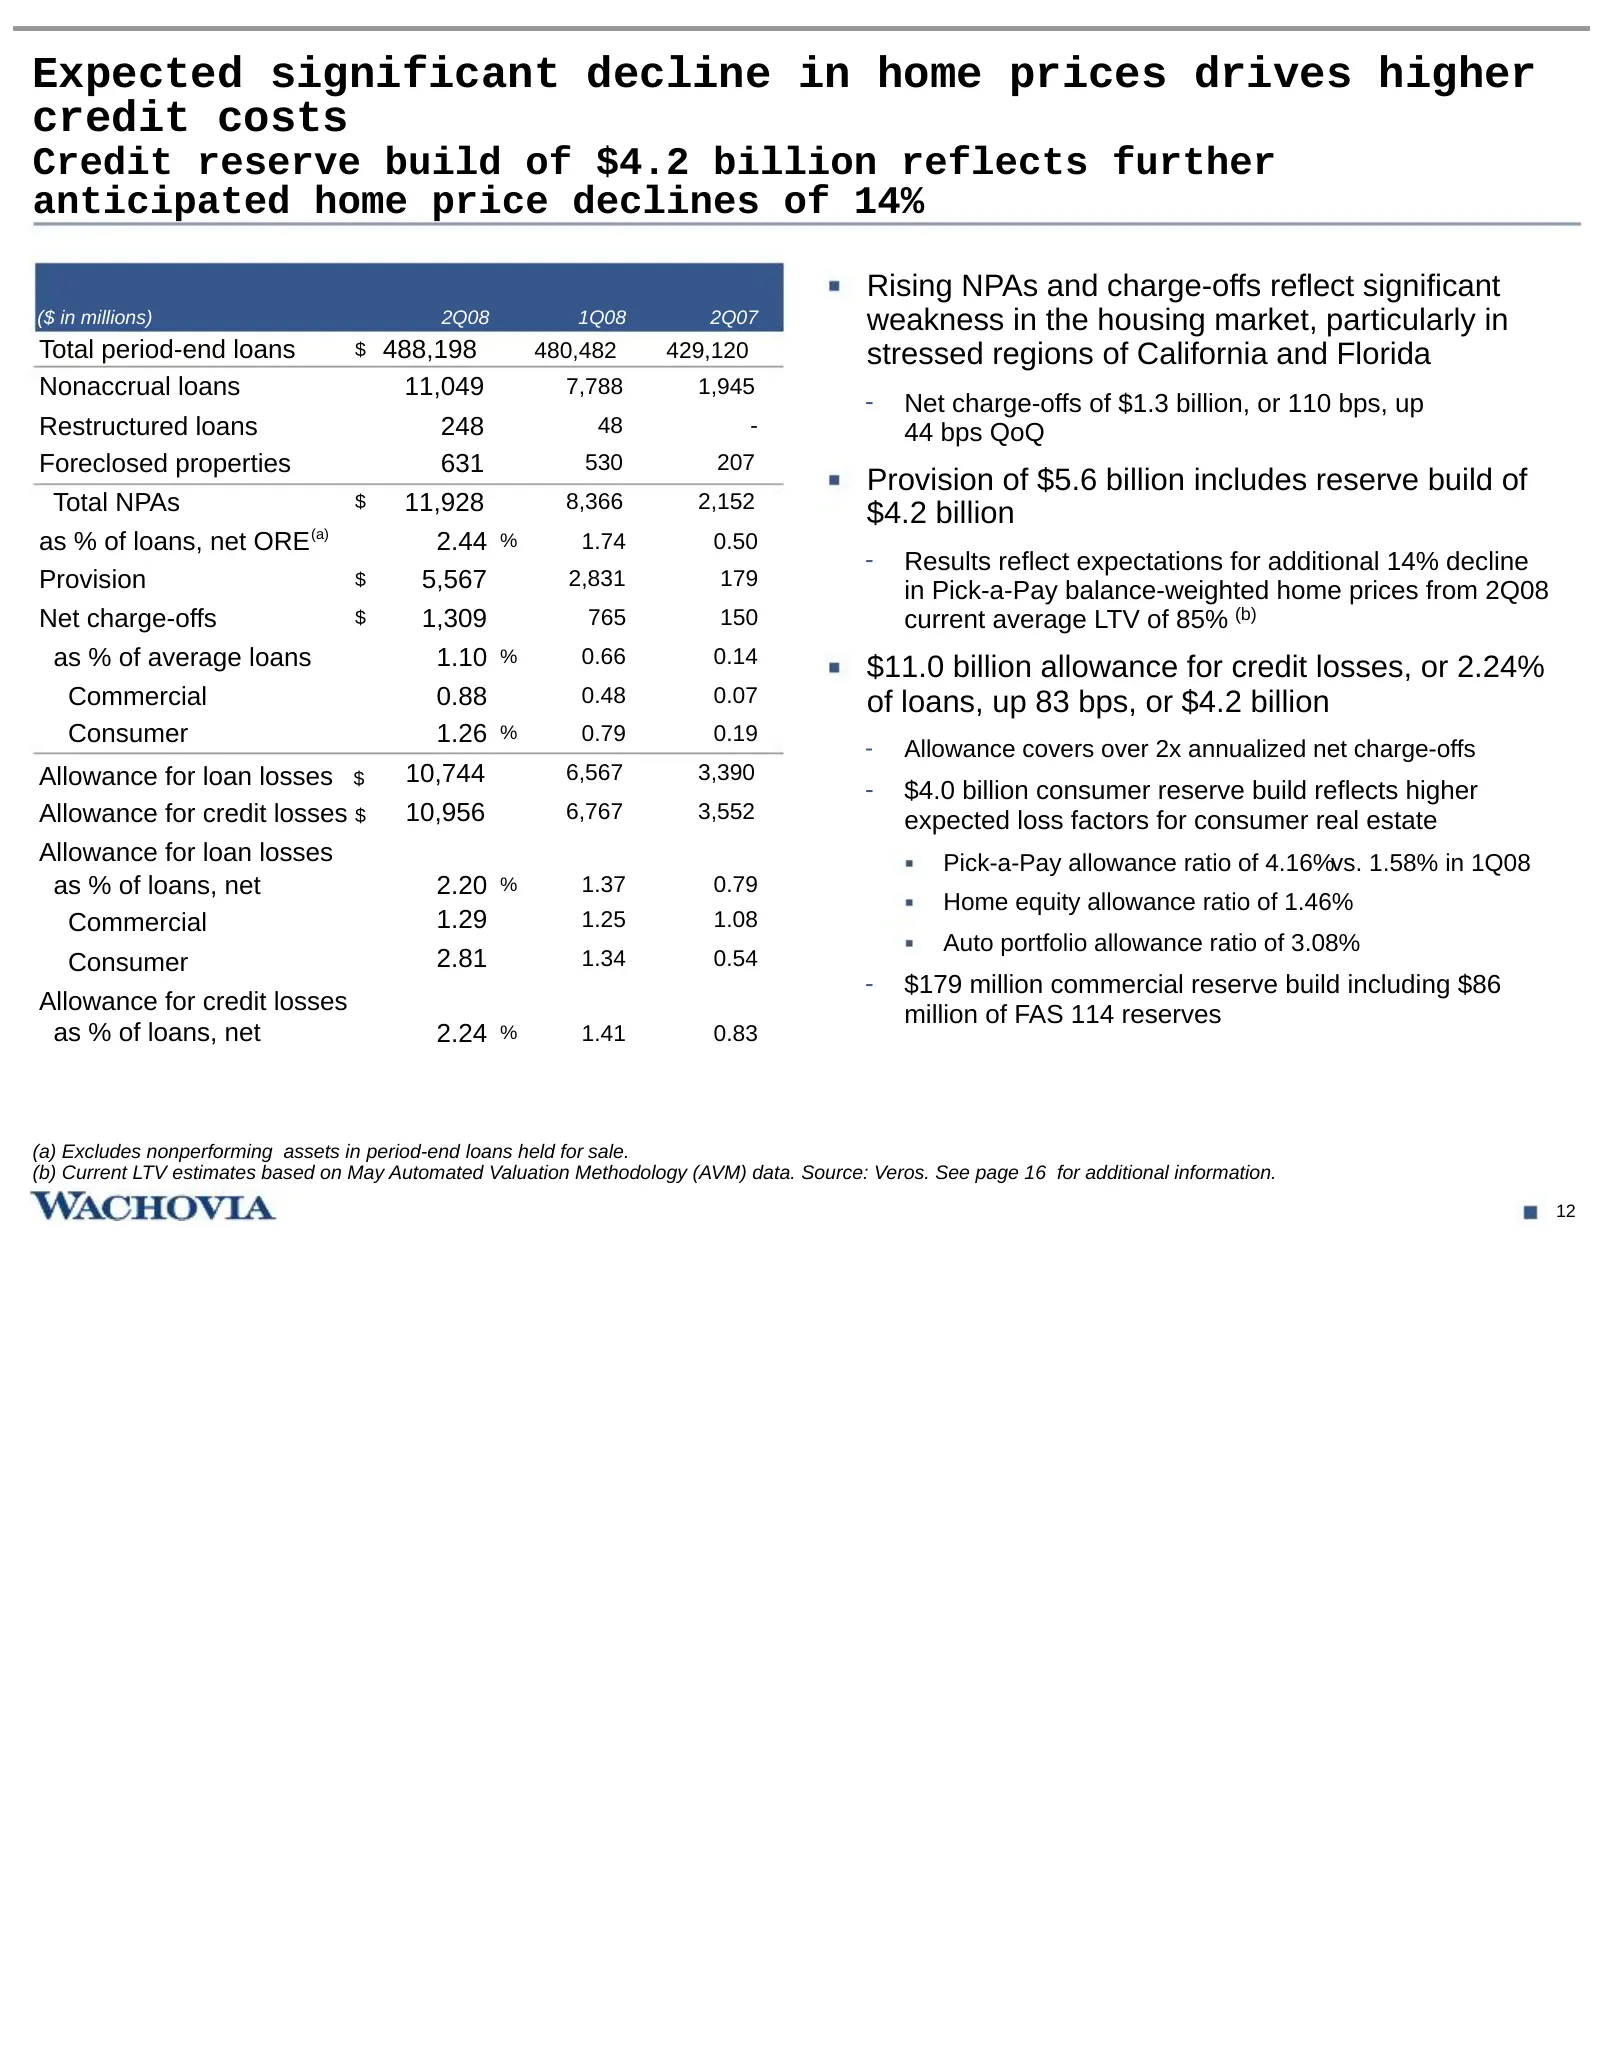
Slide 13: Expected significant decline in home prices drives higher credit costs
Expected significant decline in home prices drives higher credit costs Credit reserve build of $4.2 billion reflects further anticipated home price declines of 14% Rising NPAs and charge-offs reflect significant ($ in millions) 2Q08 1Q08 2Q07 weakness in the housing market, particularly in Total per
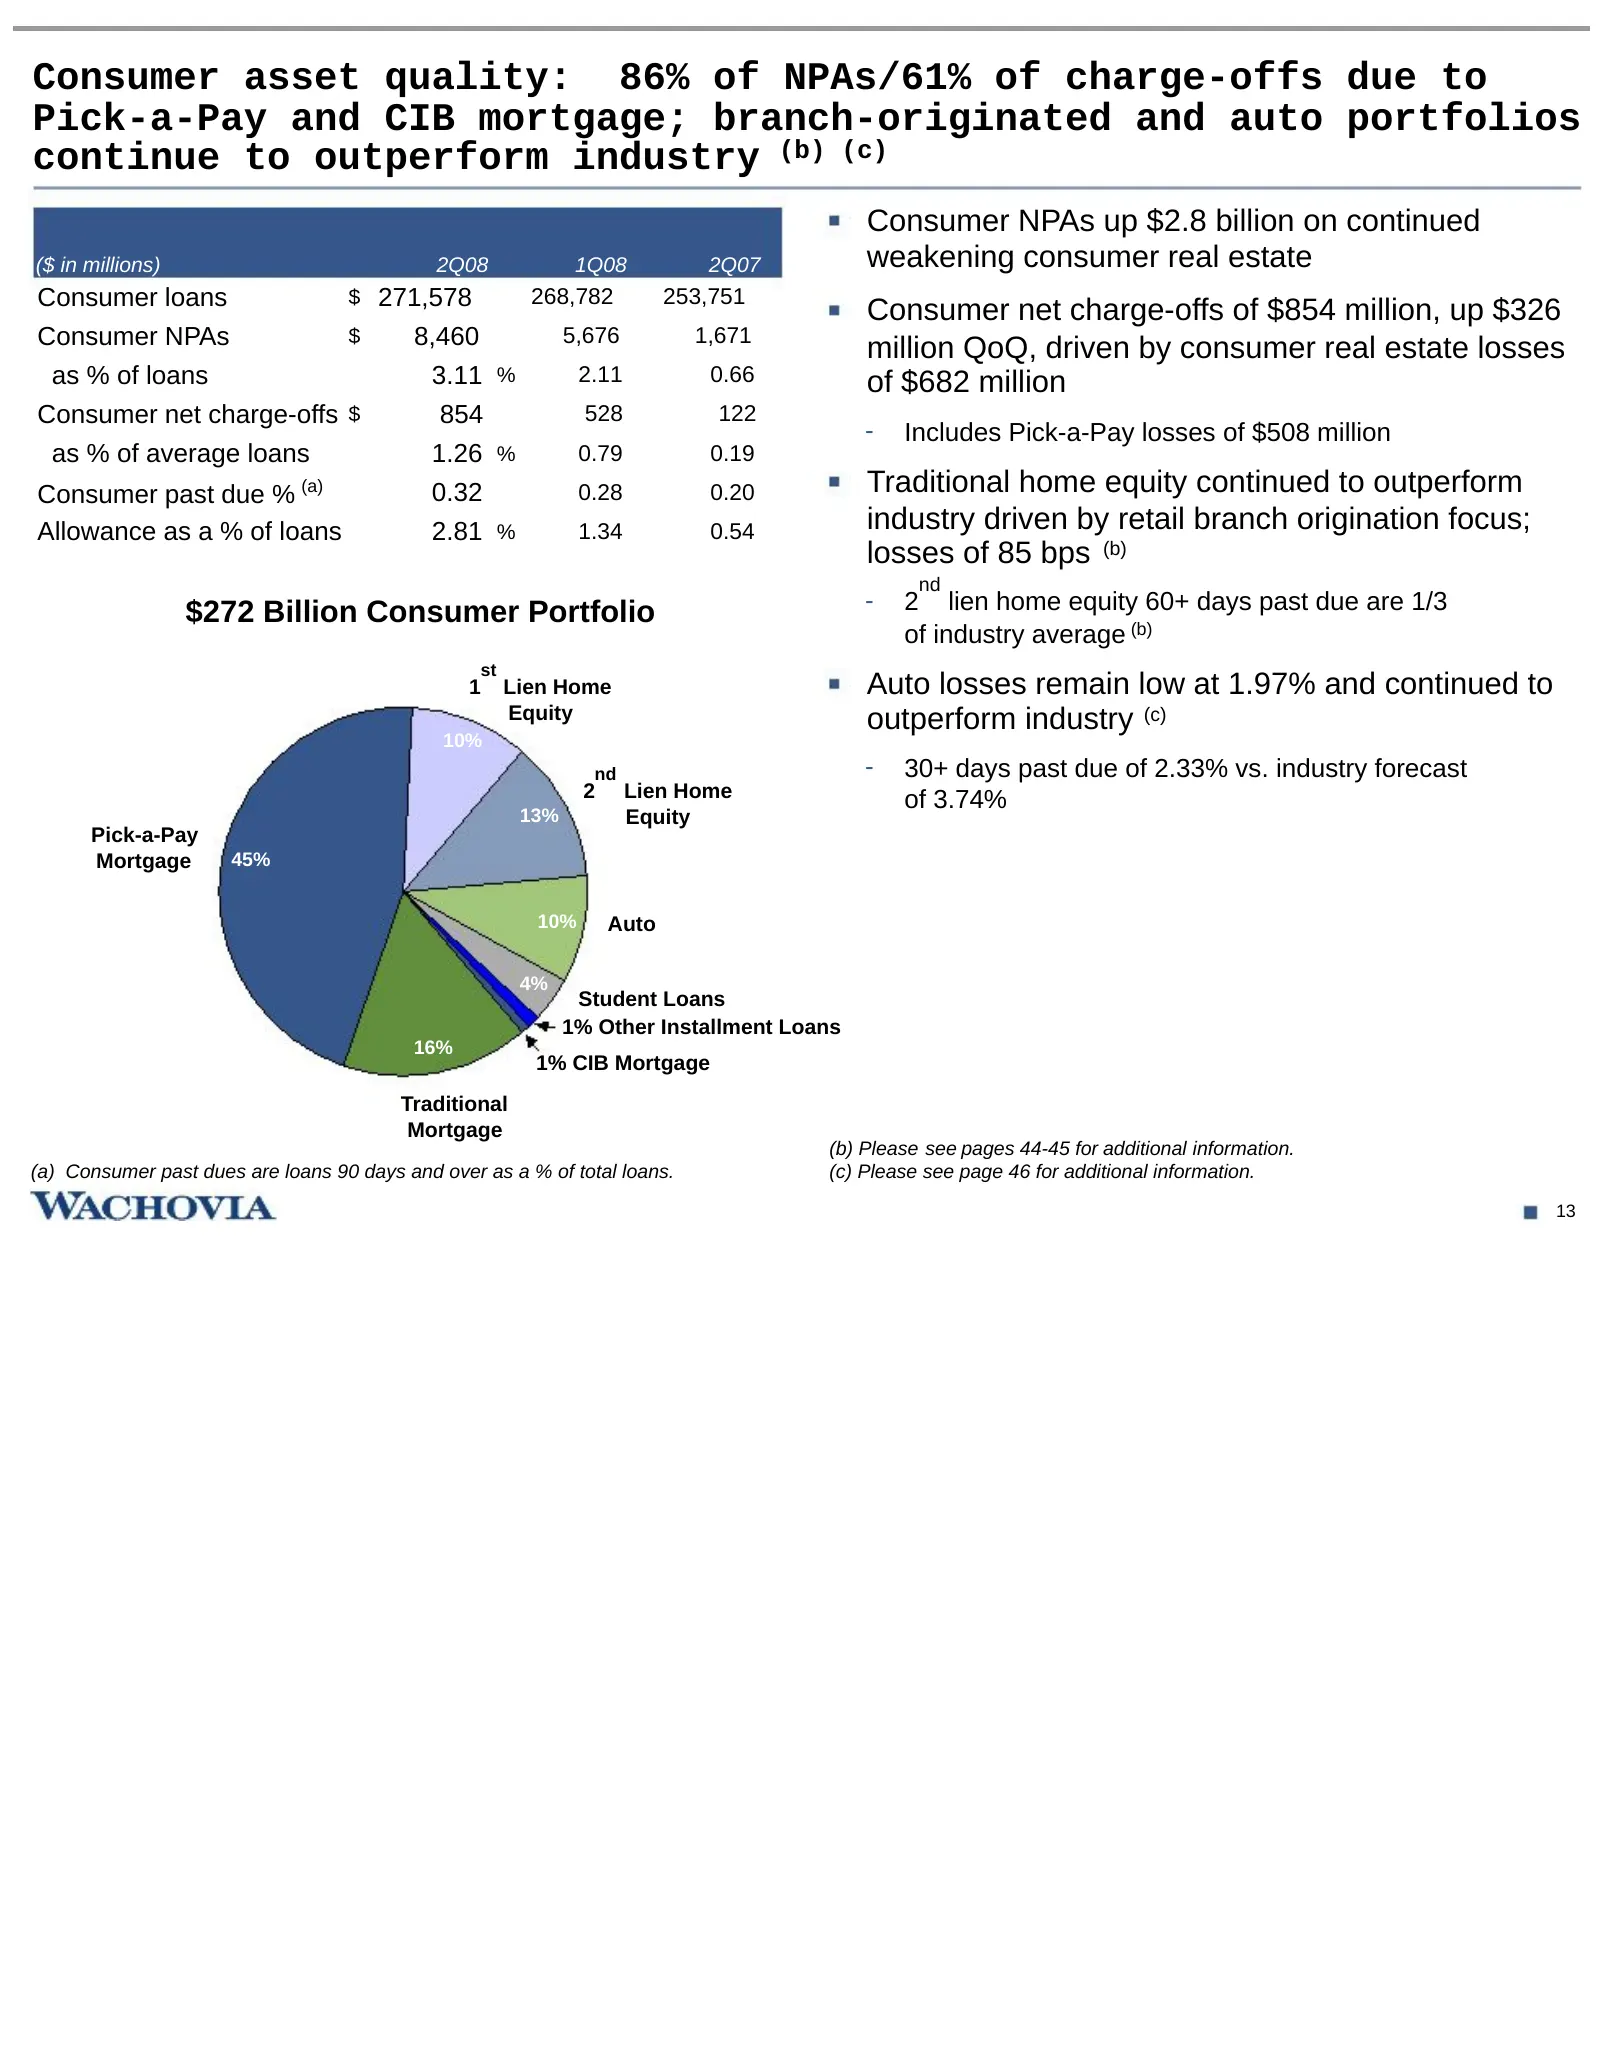
Slide 14: Consumer asset quality: 86% of NPAs/61% of charge-offs due to Pick-a-Pay and CIB mortgage
Consumer asset quality: 86% of NPAs/61% of charge-offs due to Pick-a-Pay and CIB mortgage; branch-originated and auto portfolios continue to outperform industry (b) (c) Consumer NPAs up $2.8 billion on continued ($ in millions) 2Q08 1Q08 2Q07 weakening consumer real estate Consumer loans $ 271,578 2
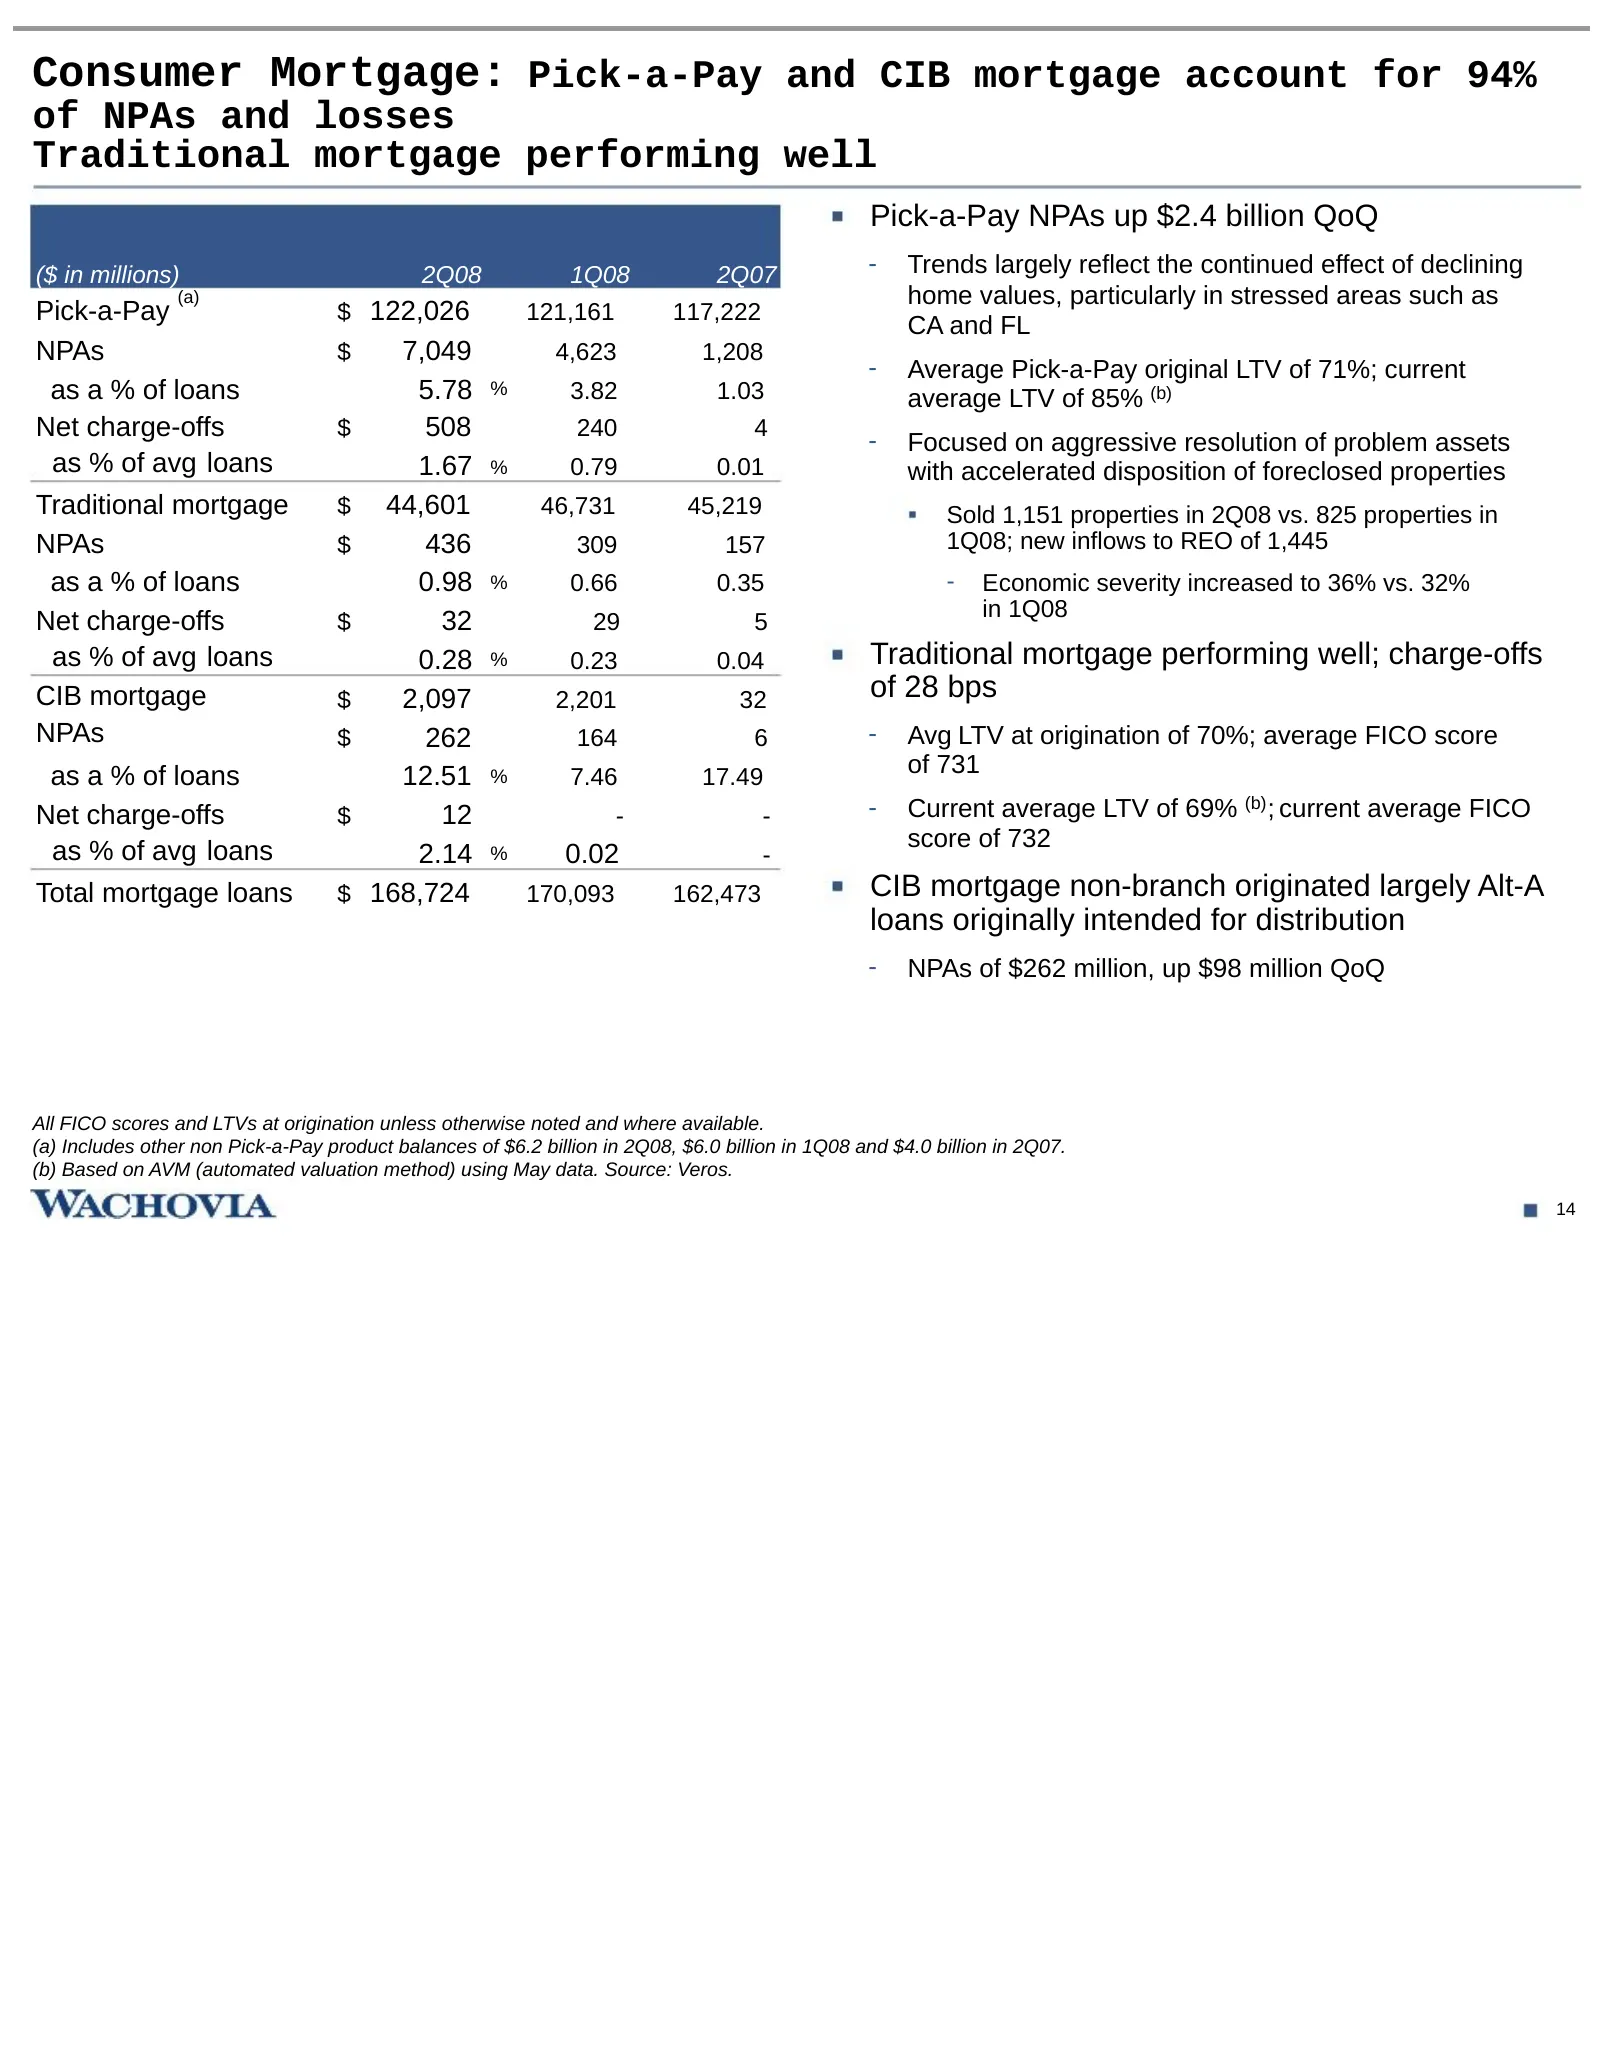
Slide 15: Consumer Mortgage: Pick-a-Pay and CIB mortgage account for 94% of NPAs and losses
Consumer Mortgage: Pick-a-Pay and CIB mortgage account for 94% of NPAs and losses Traditional mortgage performing well Pick-a-Pay NPAs up $2.4 billion QoQ ($ in millions) 2Q08 1Q08 2Q07 - Trends largely reflect the continued effect of declining (a) home values, particularly in stressed areas such as
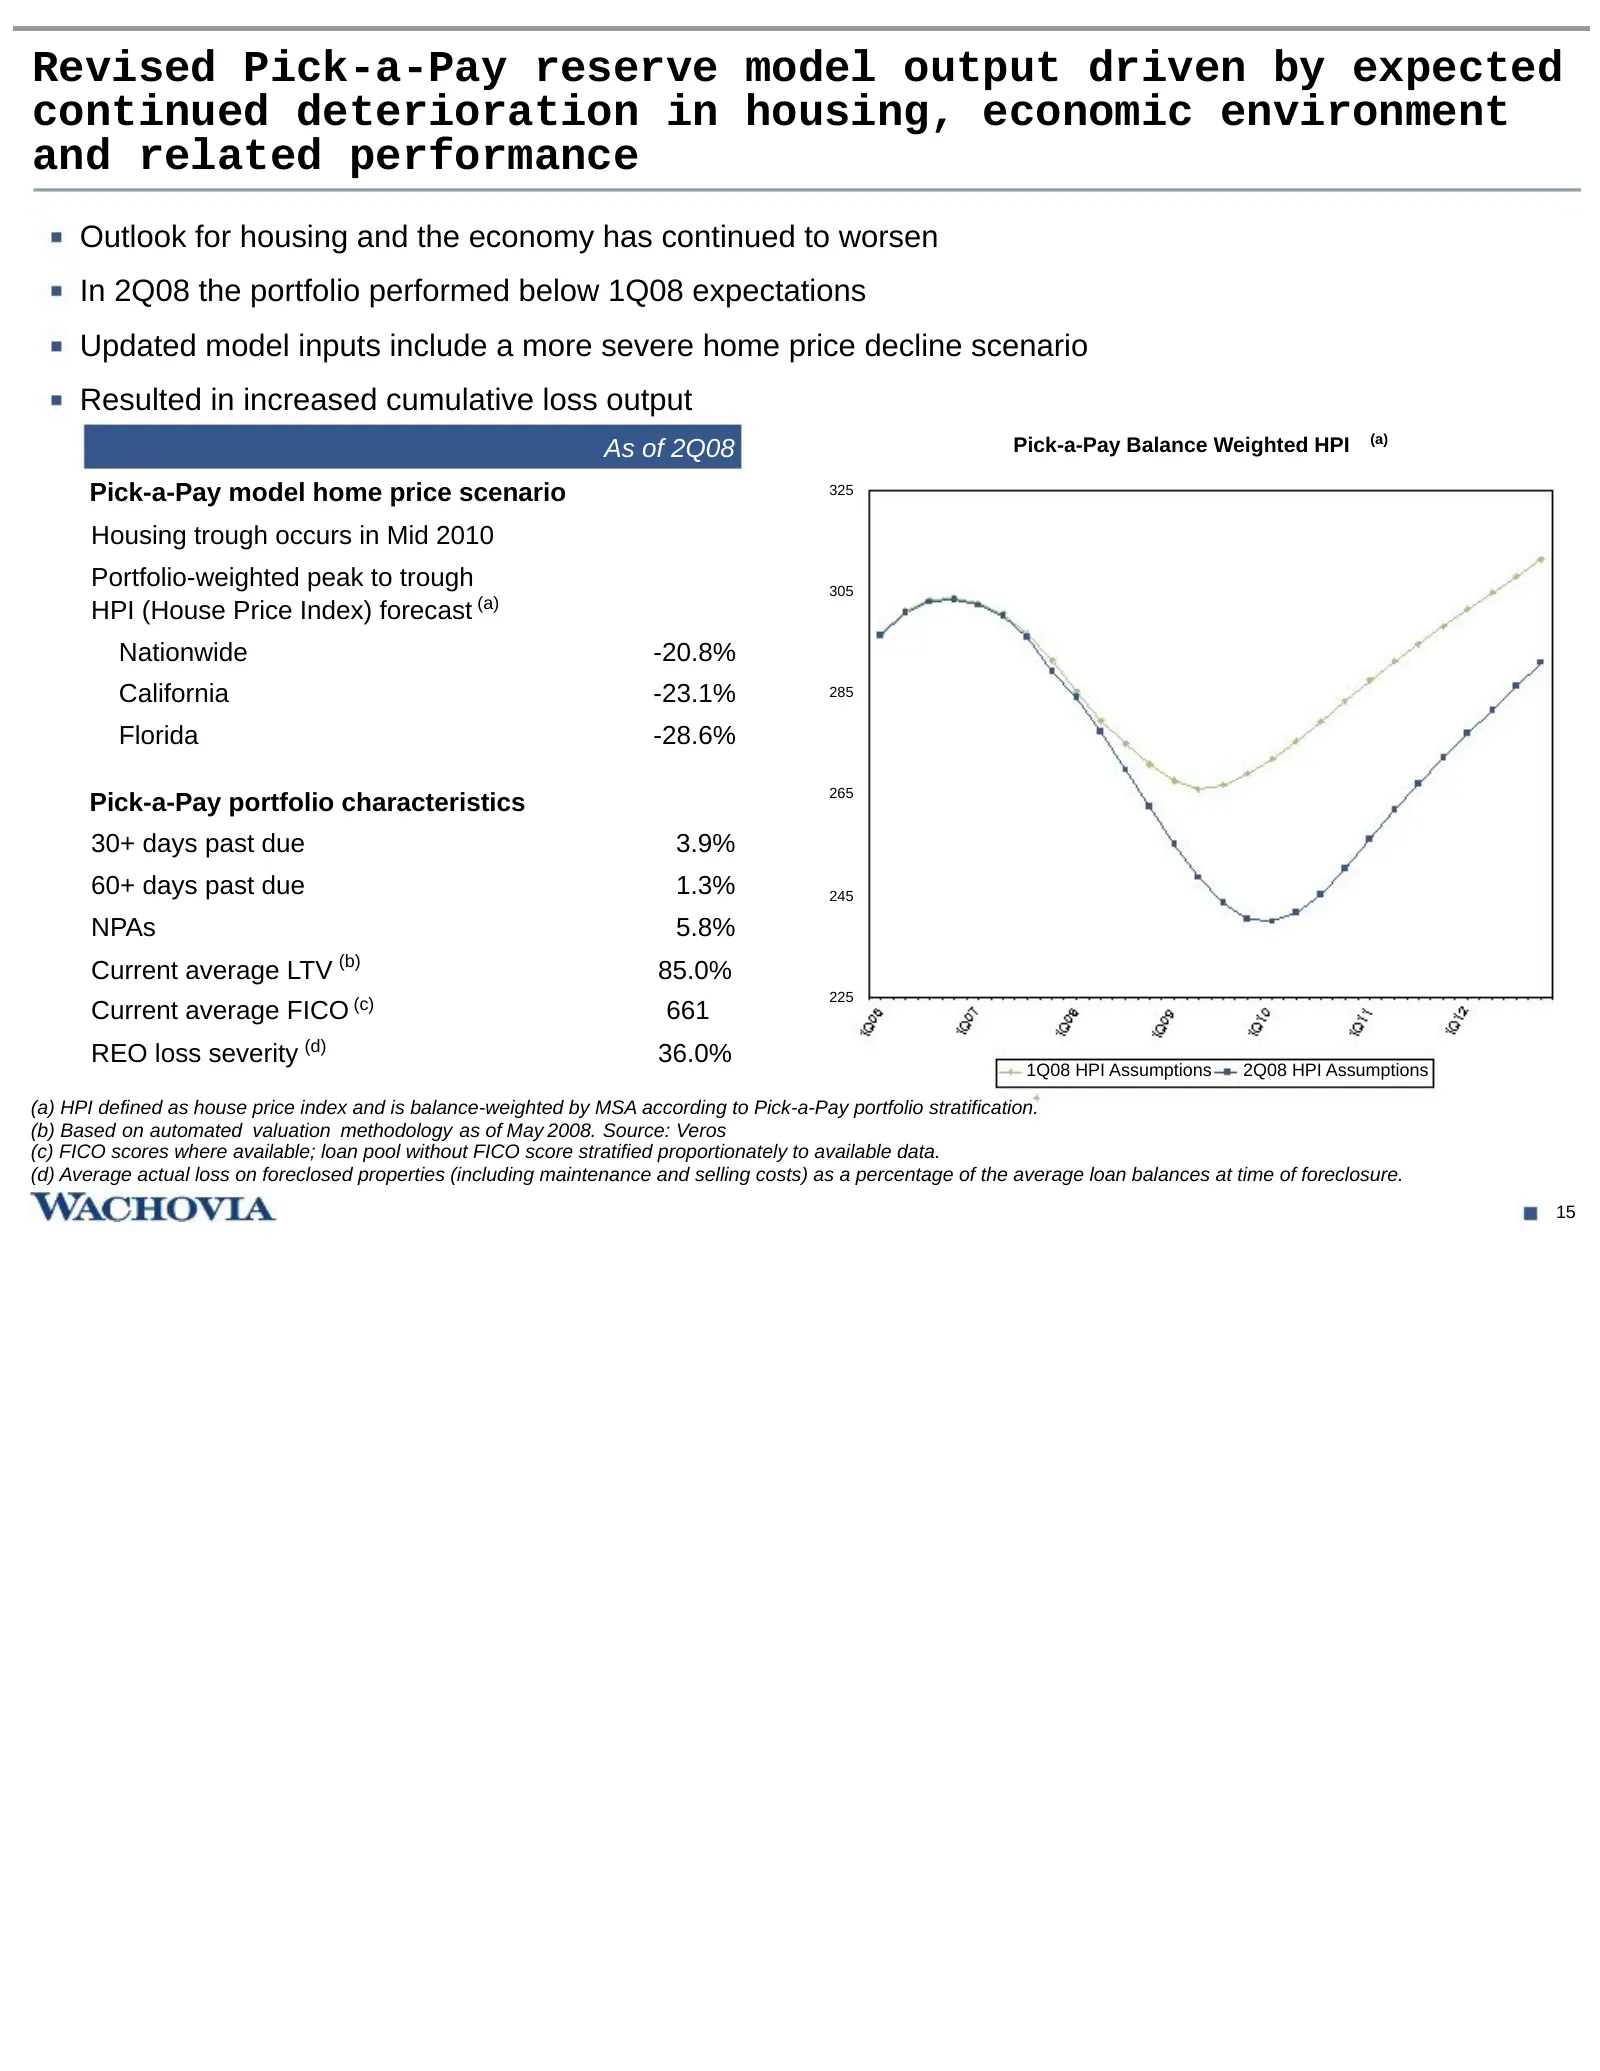
Slide 16: Revised Pick-a-Pay reserve model output driven by expected continued deterioration
Revised Pick-a-Pay reserve model output driven by expected continued deterioration in housing, economic environment and related performance Outlook for housing and the economy has continued to worsen In 2Q08 the portfolio performed below 1Q08 expectations Updated model inputs include a more severe h
Slide 17: Pick-a-Pay portfolio: Concentrations in stressed geographies
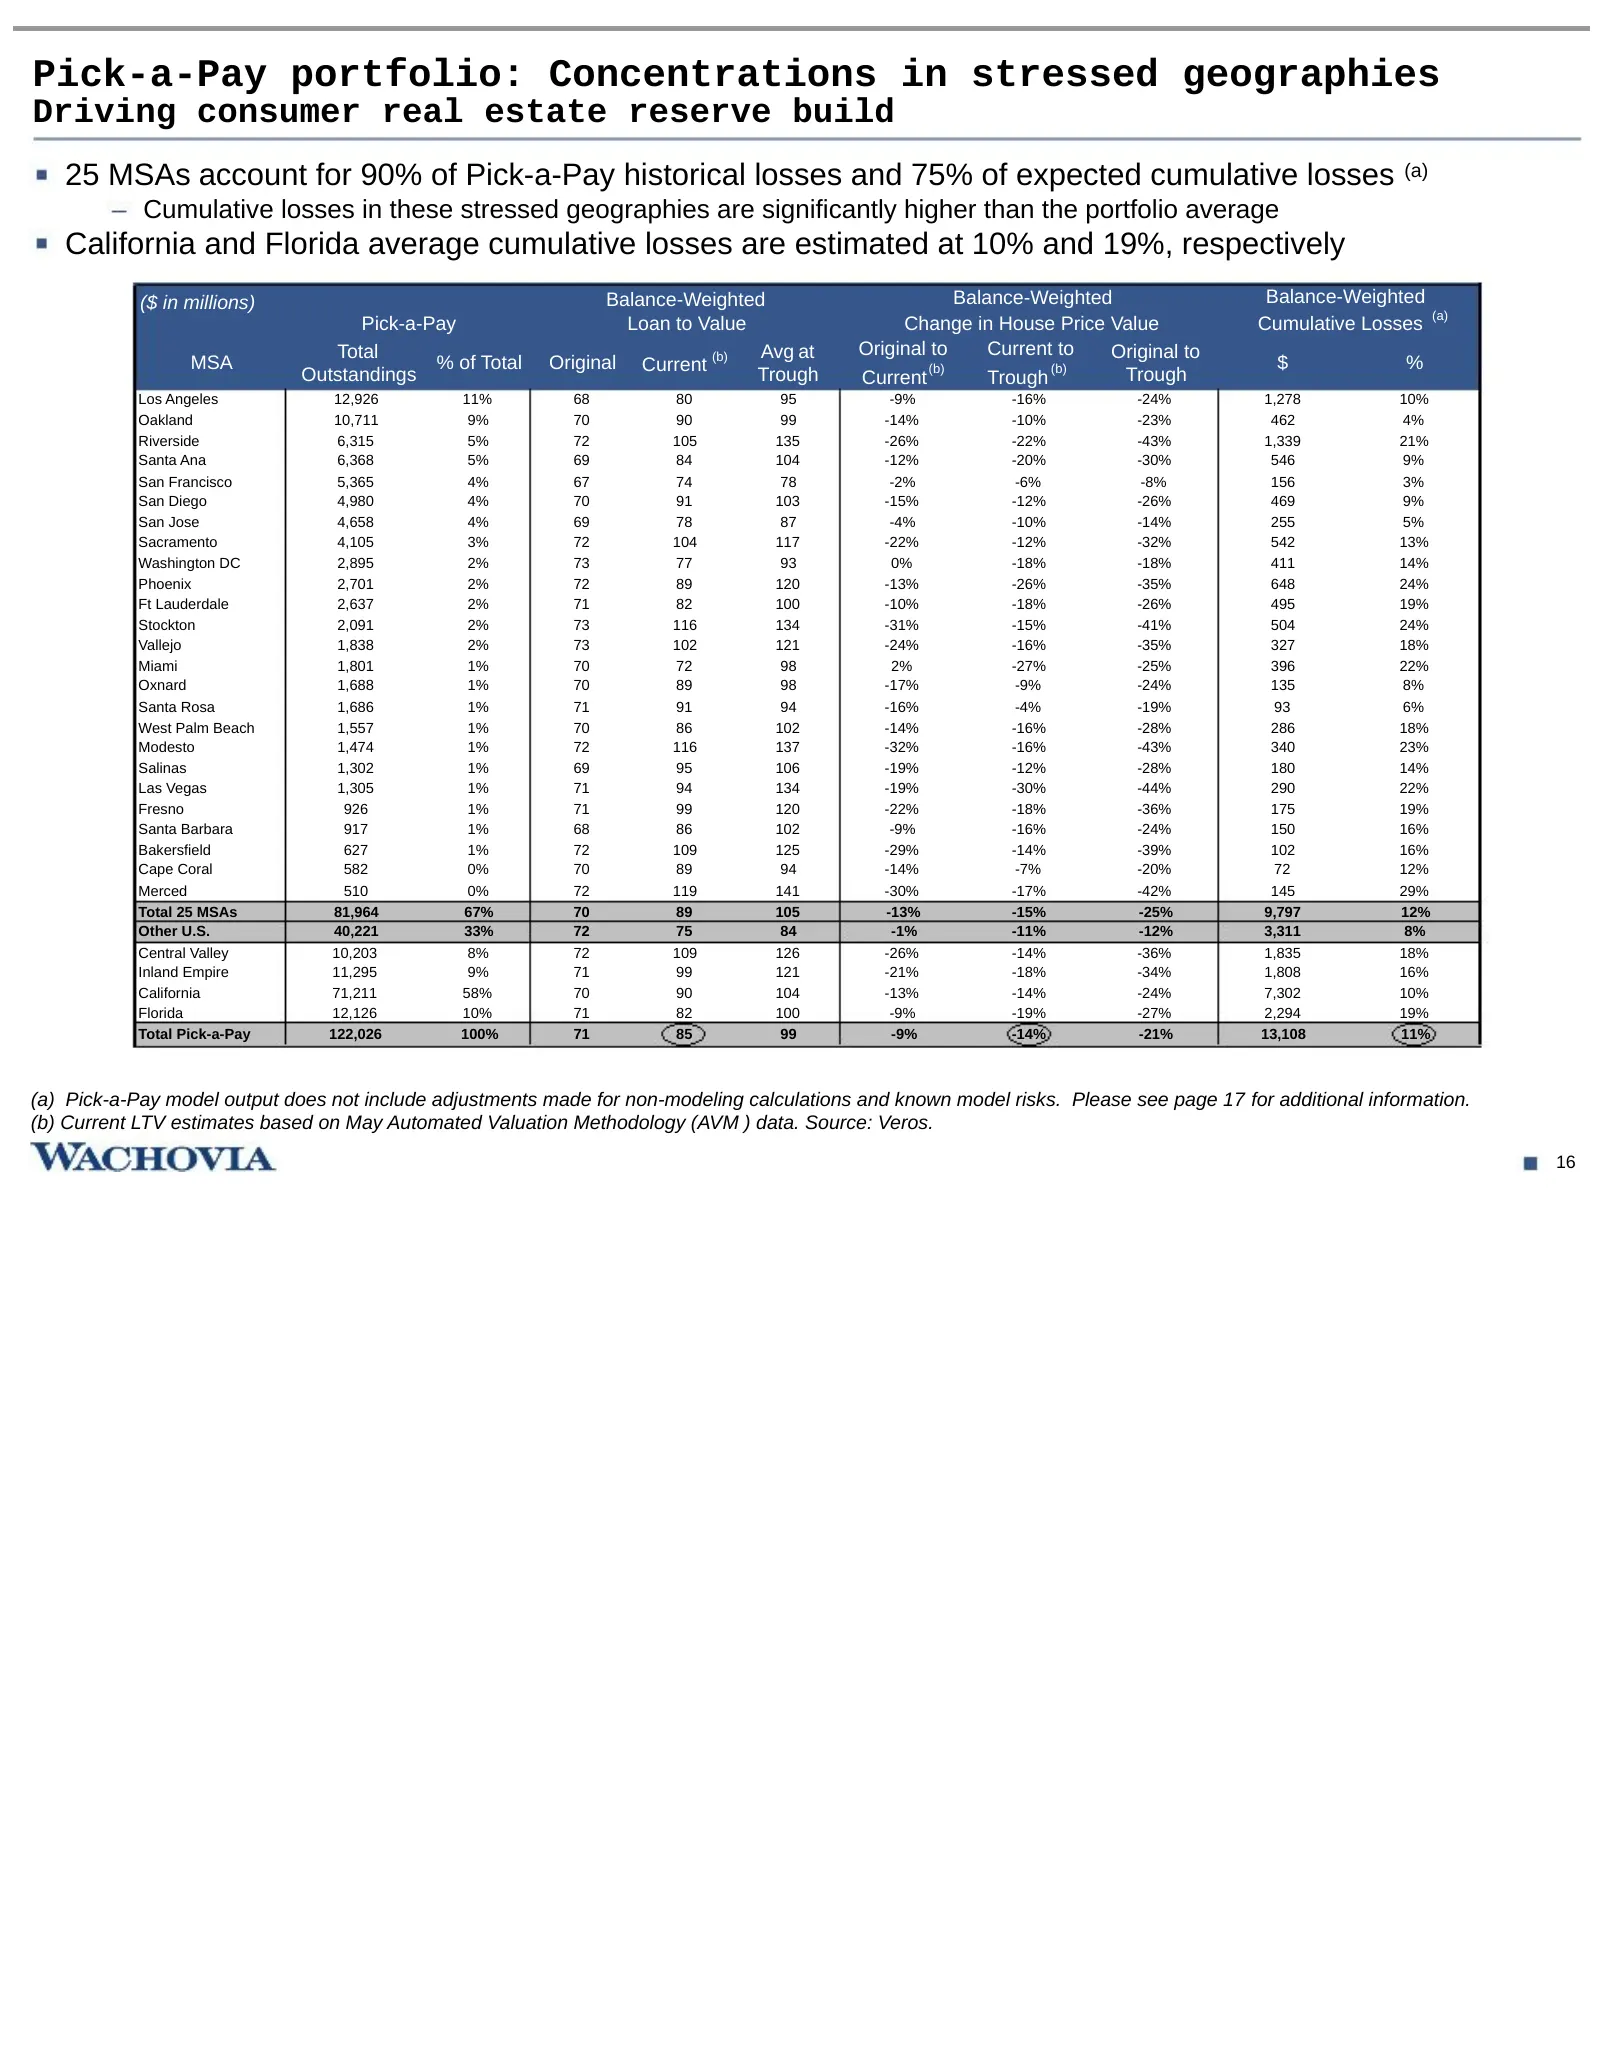
Pick-a-Pay portfolio: Concentrations in stressed geographies Driving consumer real estate reserve build 25 MSAs account for 90% of Pick-a-Pay historical losses and 75% of expected cumulative losses (a) Cumulative losses in these stressed geographies are significantly higher than the portfolio averag
Slide 18: Significantly increasing reserve
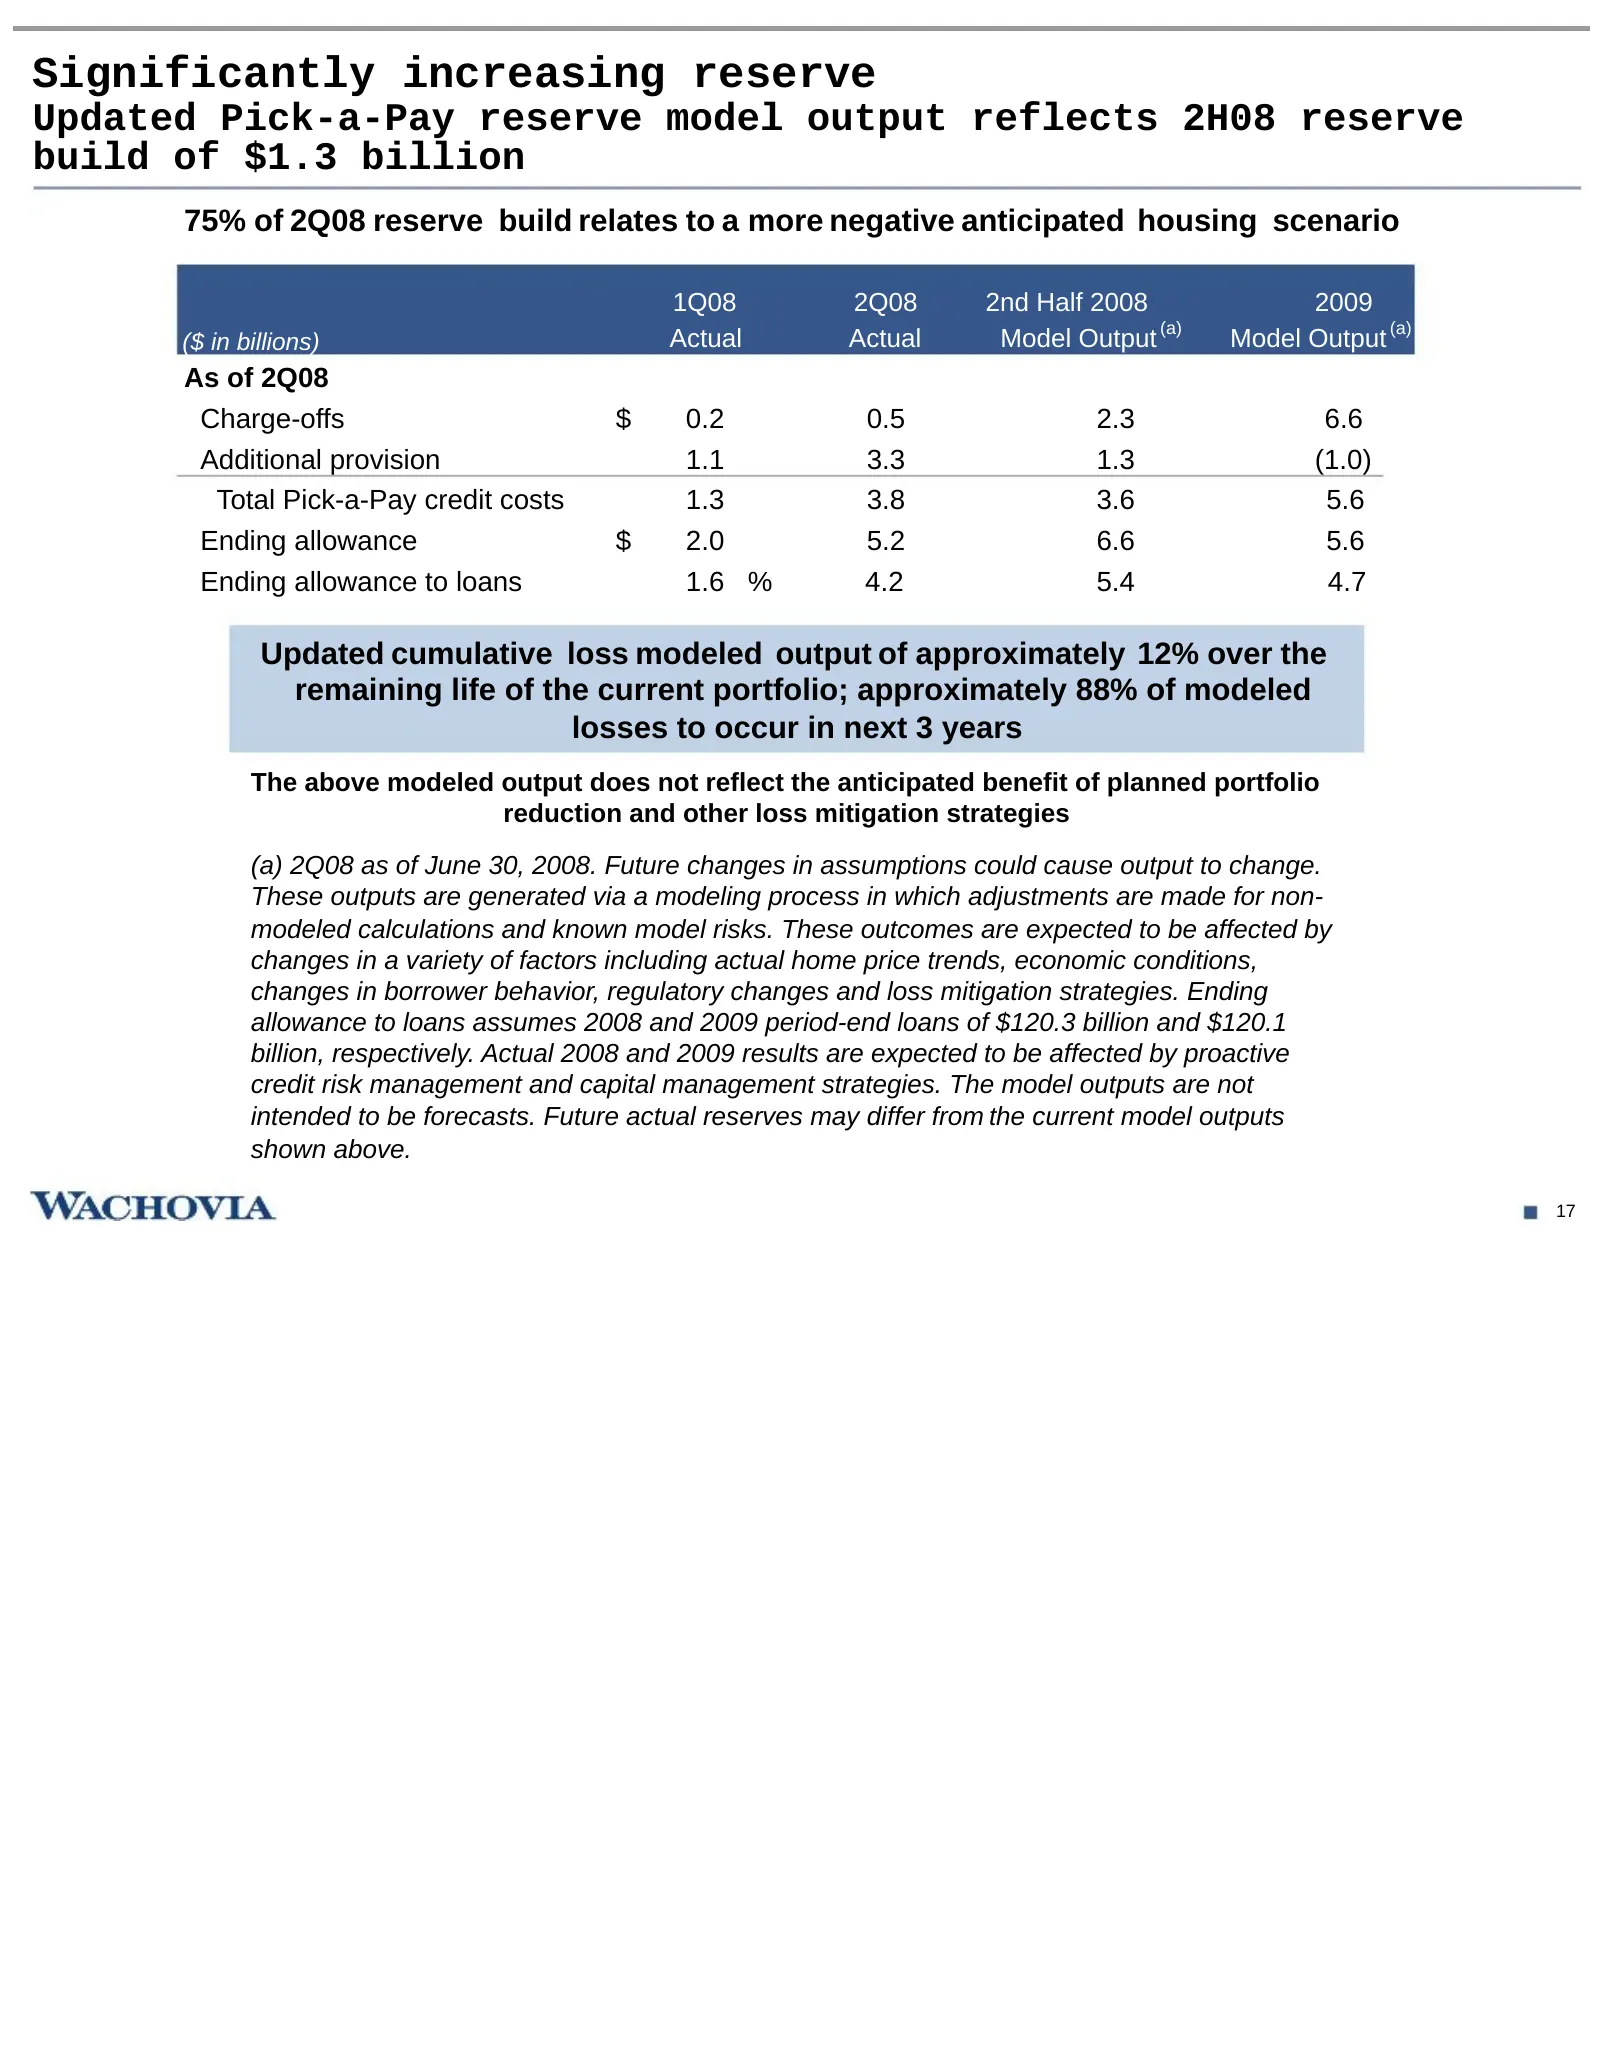
Significantly increasing reserve Updated Pick-a-Pay reserve model output reflects 2H08 reserve build of $1.3 billion 75% of 2Q08 reserve build relates to a more negative anticipated housing scenario 1Q08 2Q08 2nd Half 2008 2009 ($ in billions) Actual Actual Model Output (a) Model Output (a) As of 2Q
Slide 19: Changes to General Bank mortgage strategy and business model
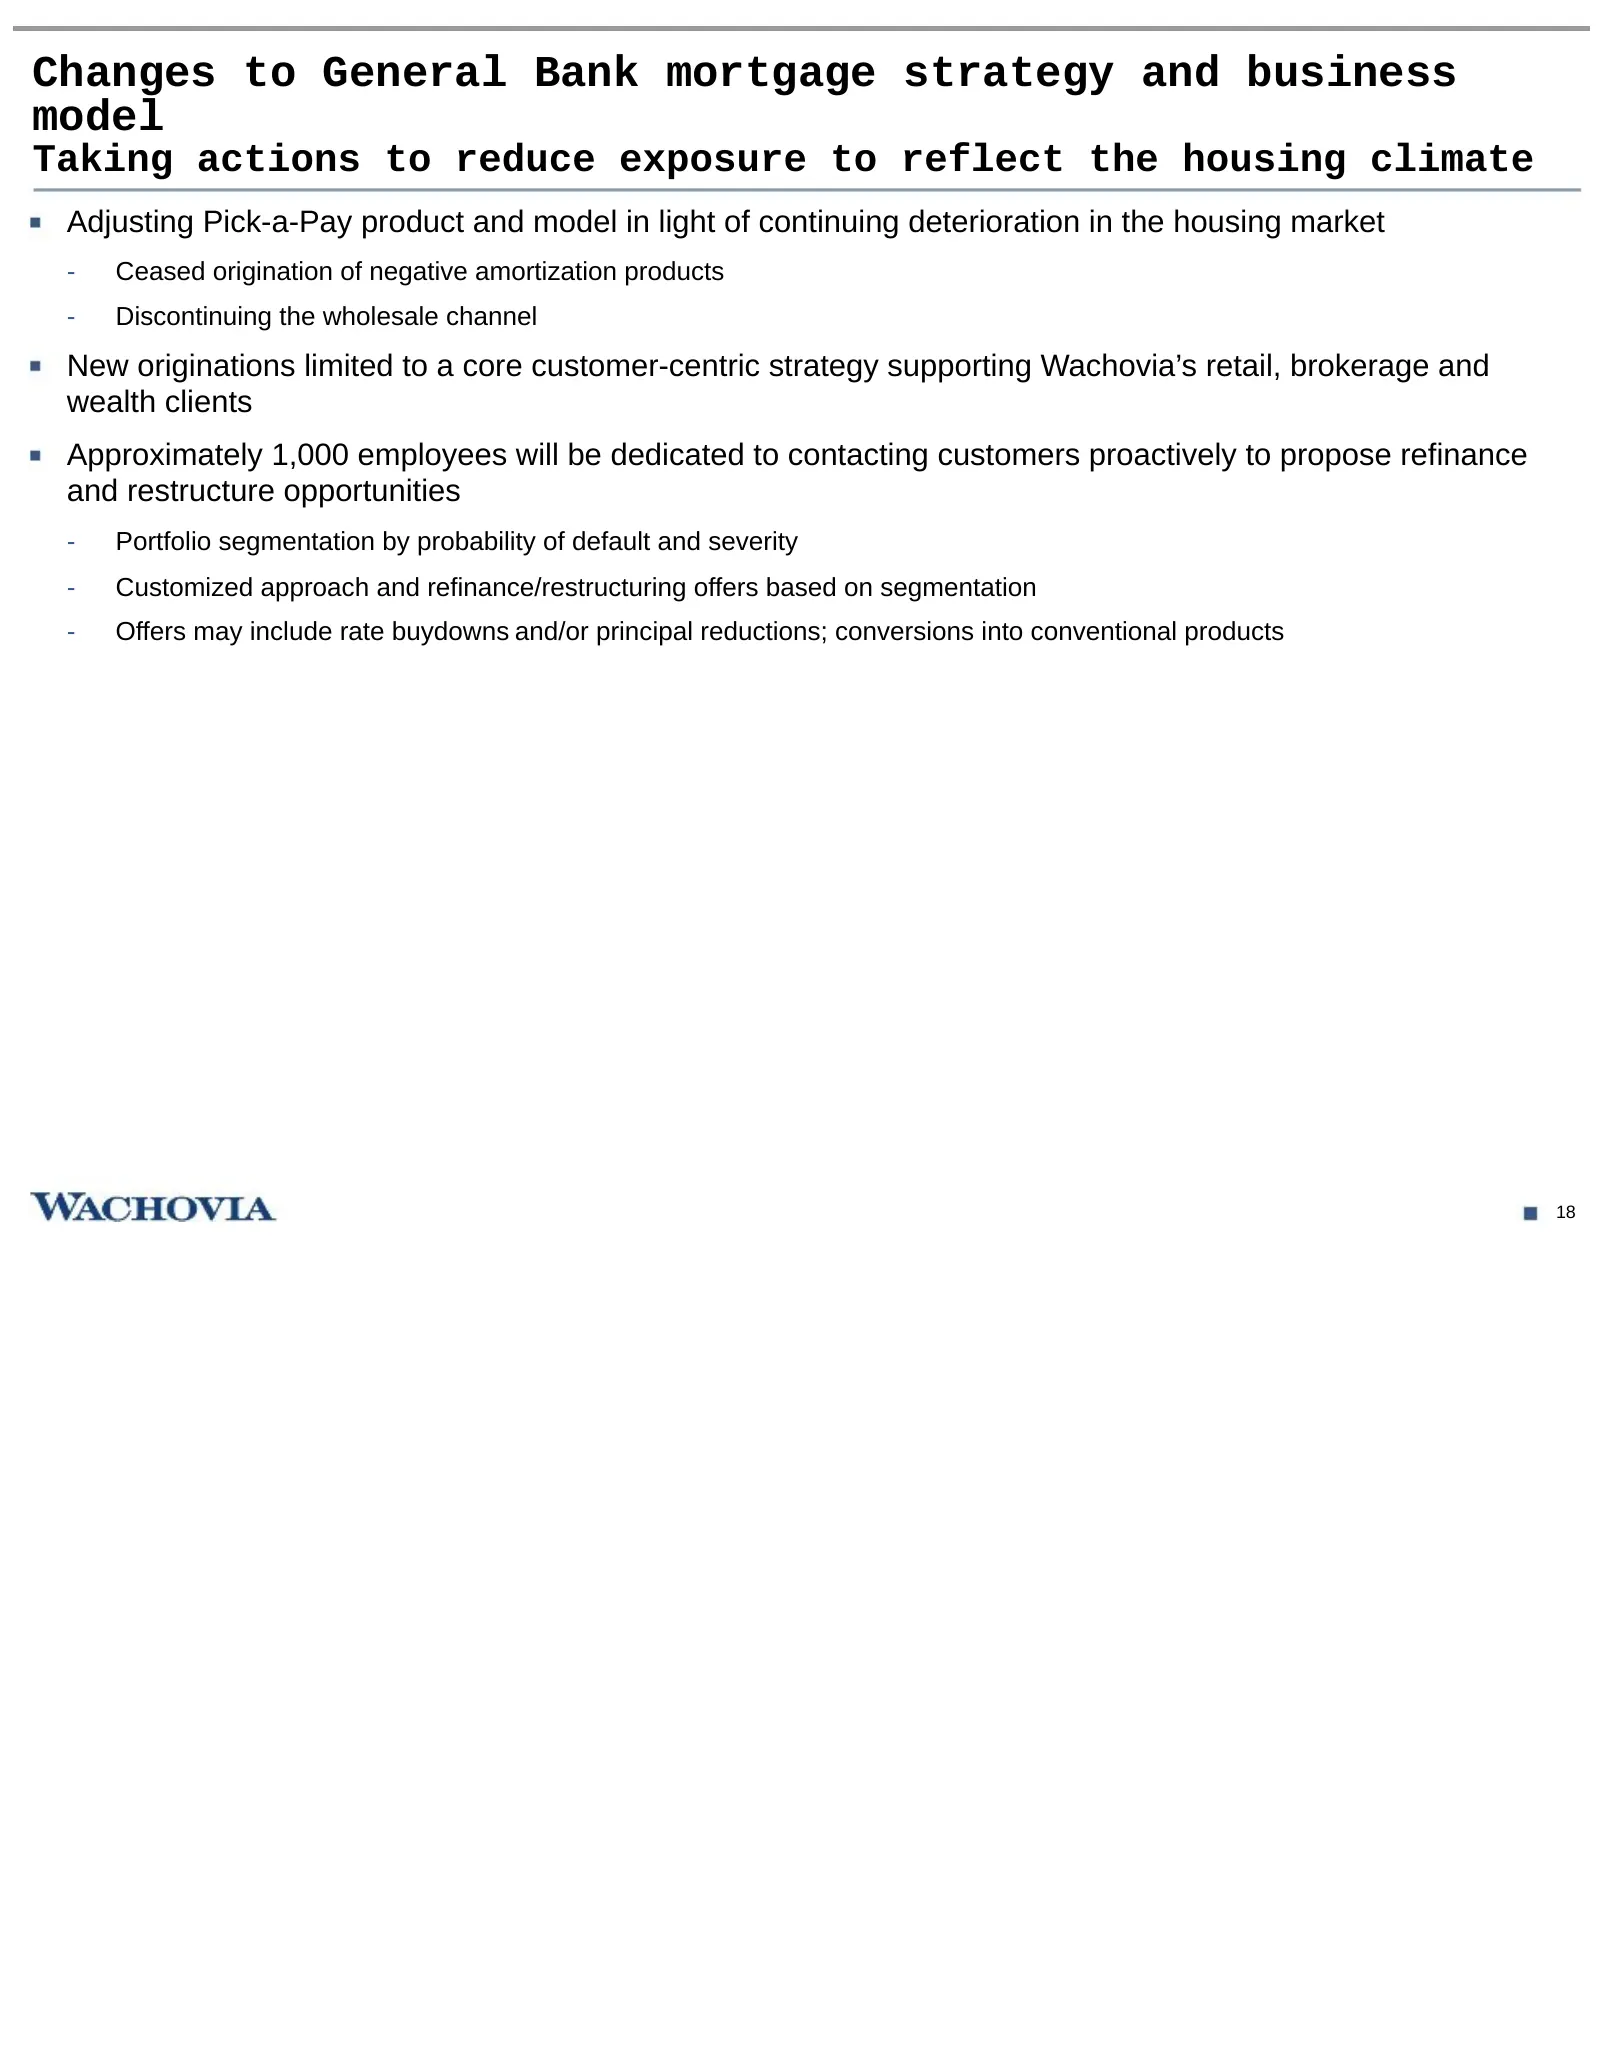
Changes to General Bank mortgage strategy and business model Taking actions to reduce exposure to reflect the housing climate Adjusting Pick-a-Pay product and model in light of continuing deterioration in the housing market - Ceased origination of negative amortization products - Discontinuing the w
Slide 20: General Bank mortgage: Actions taken to address challenges
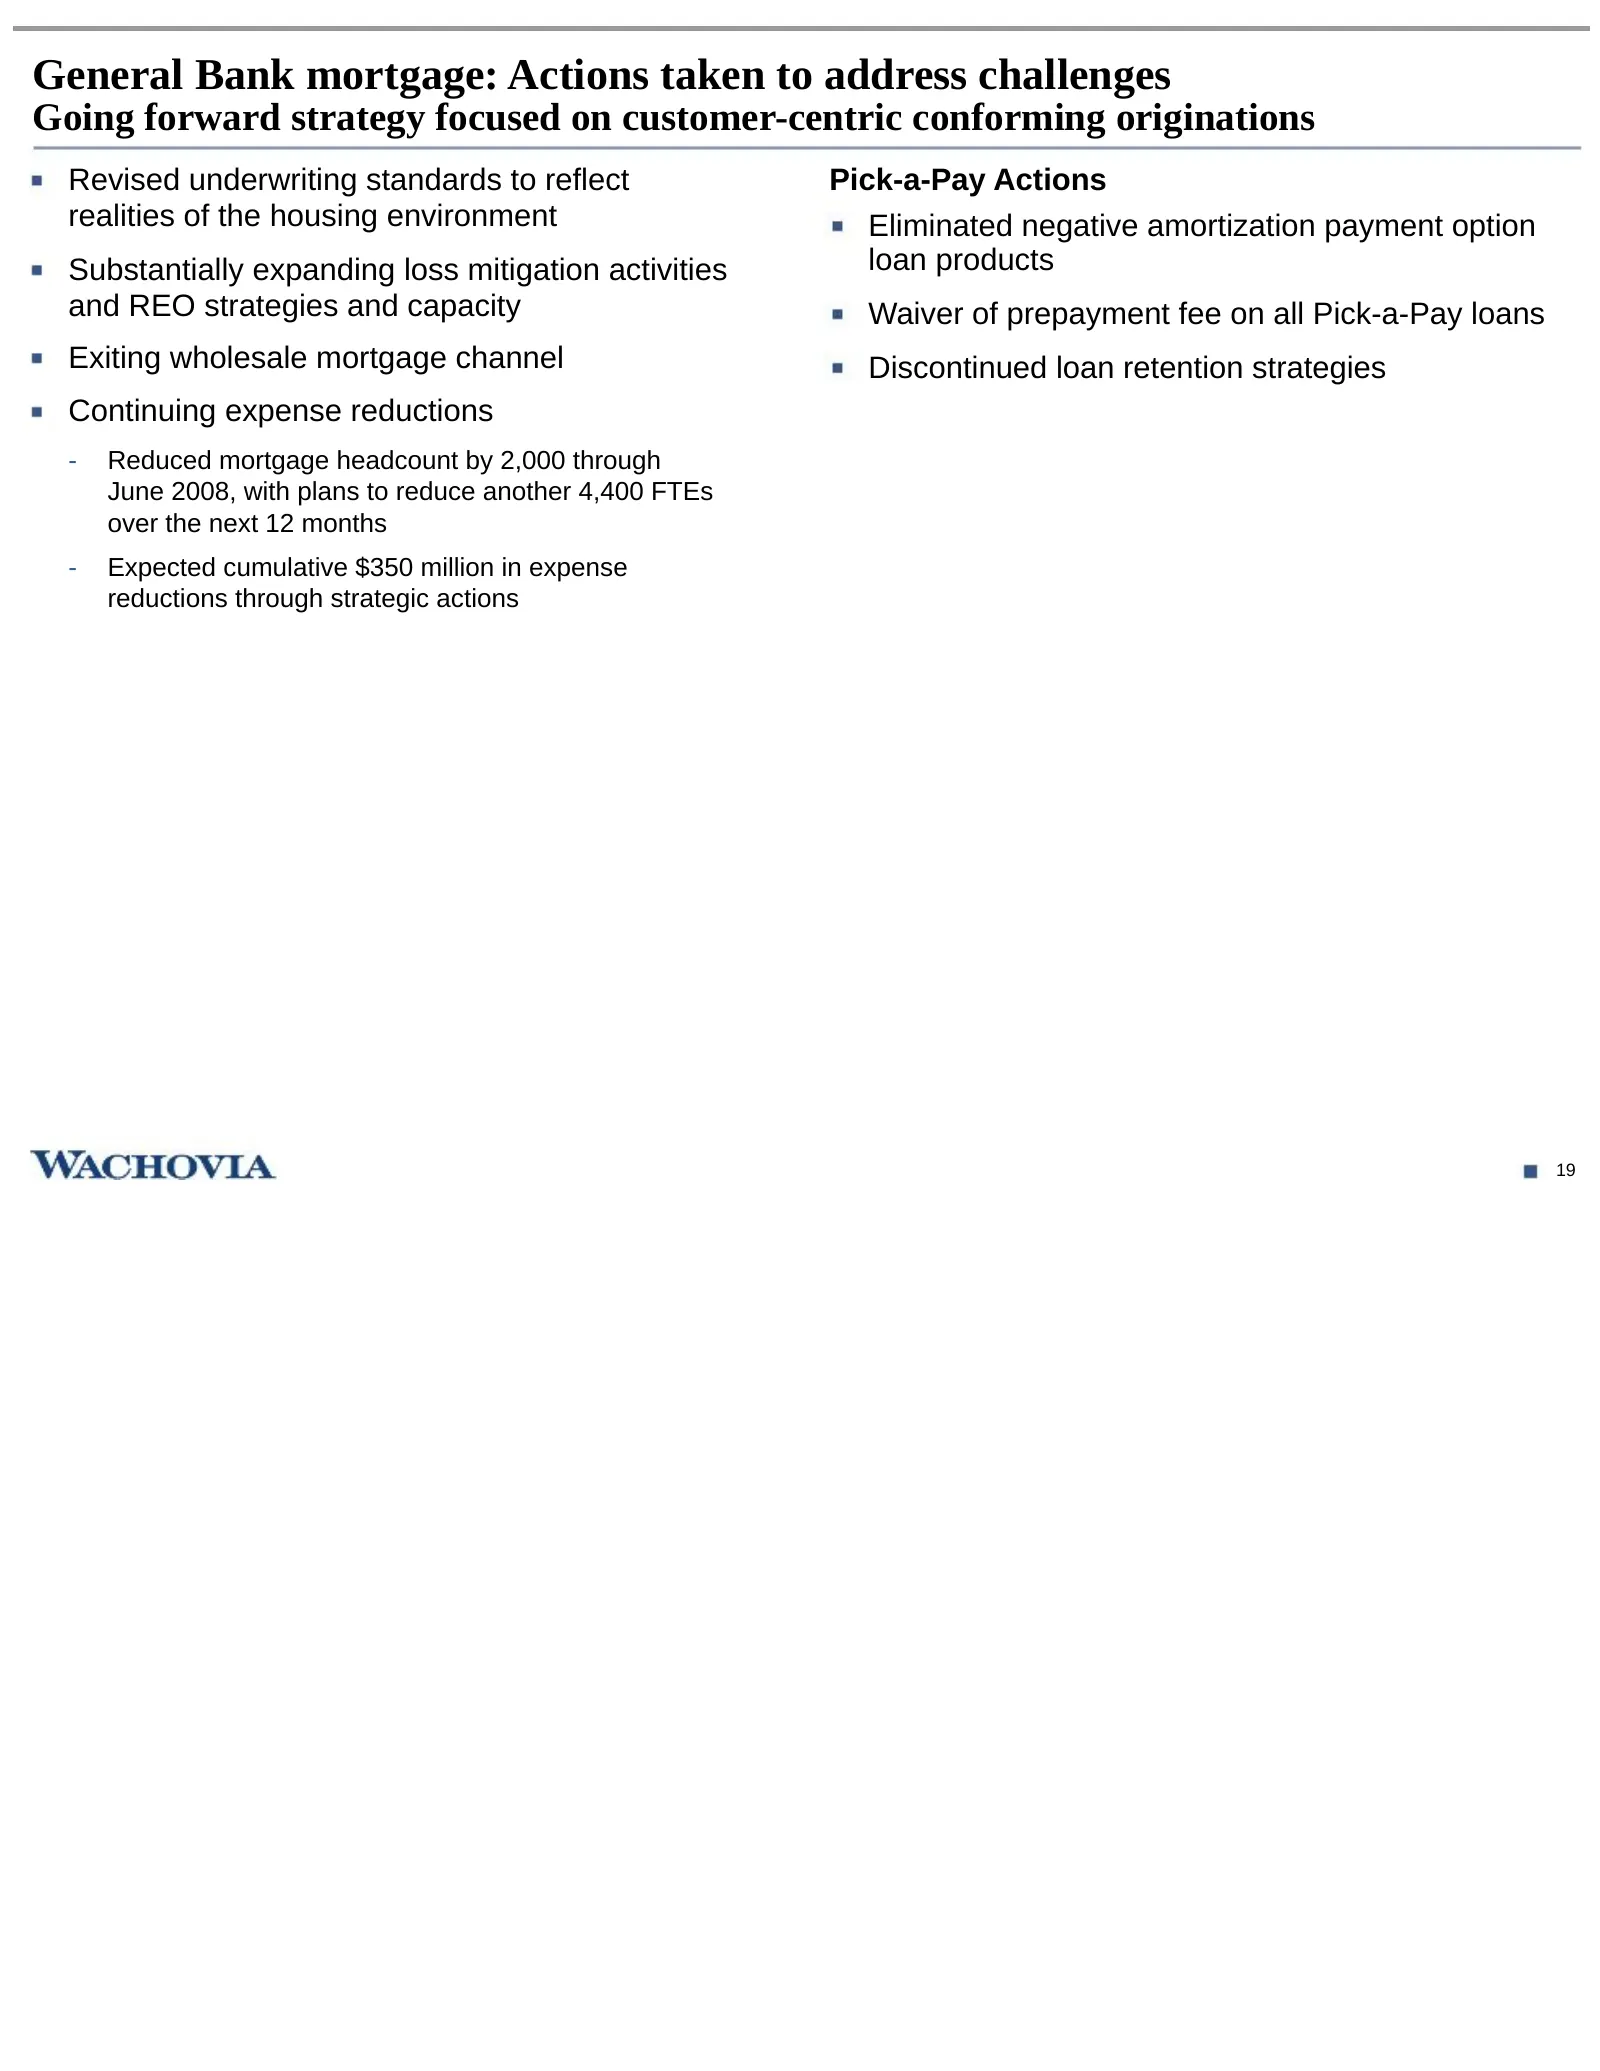
General Bank mortgage: Actions taken to address challenges Going forward strategy focused on customer-centric conforming originations Revised underwriting standards to reflect Pick-a-Pay Actions realities of the housing environment Eliminated negative amortization payment option Substantially expand
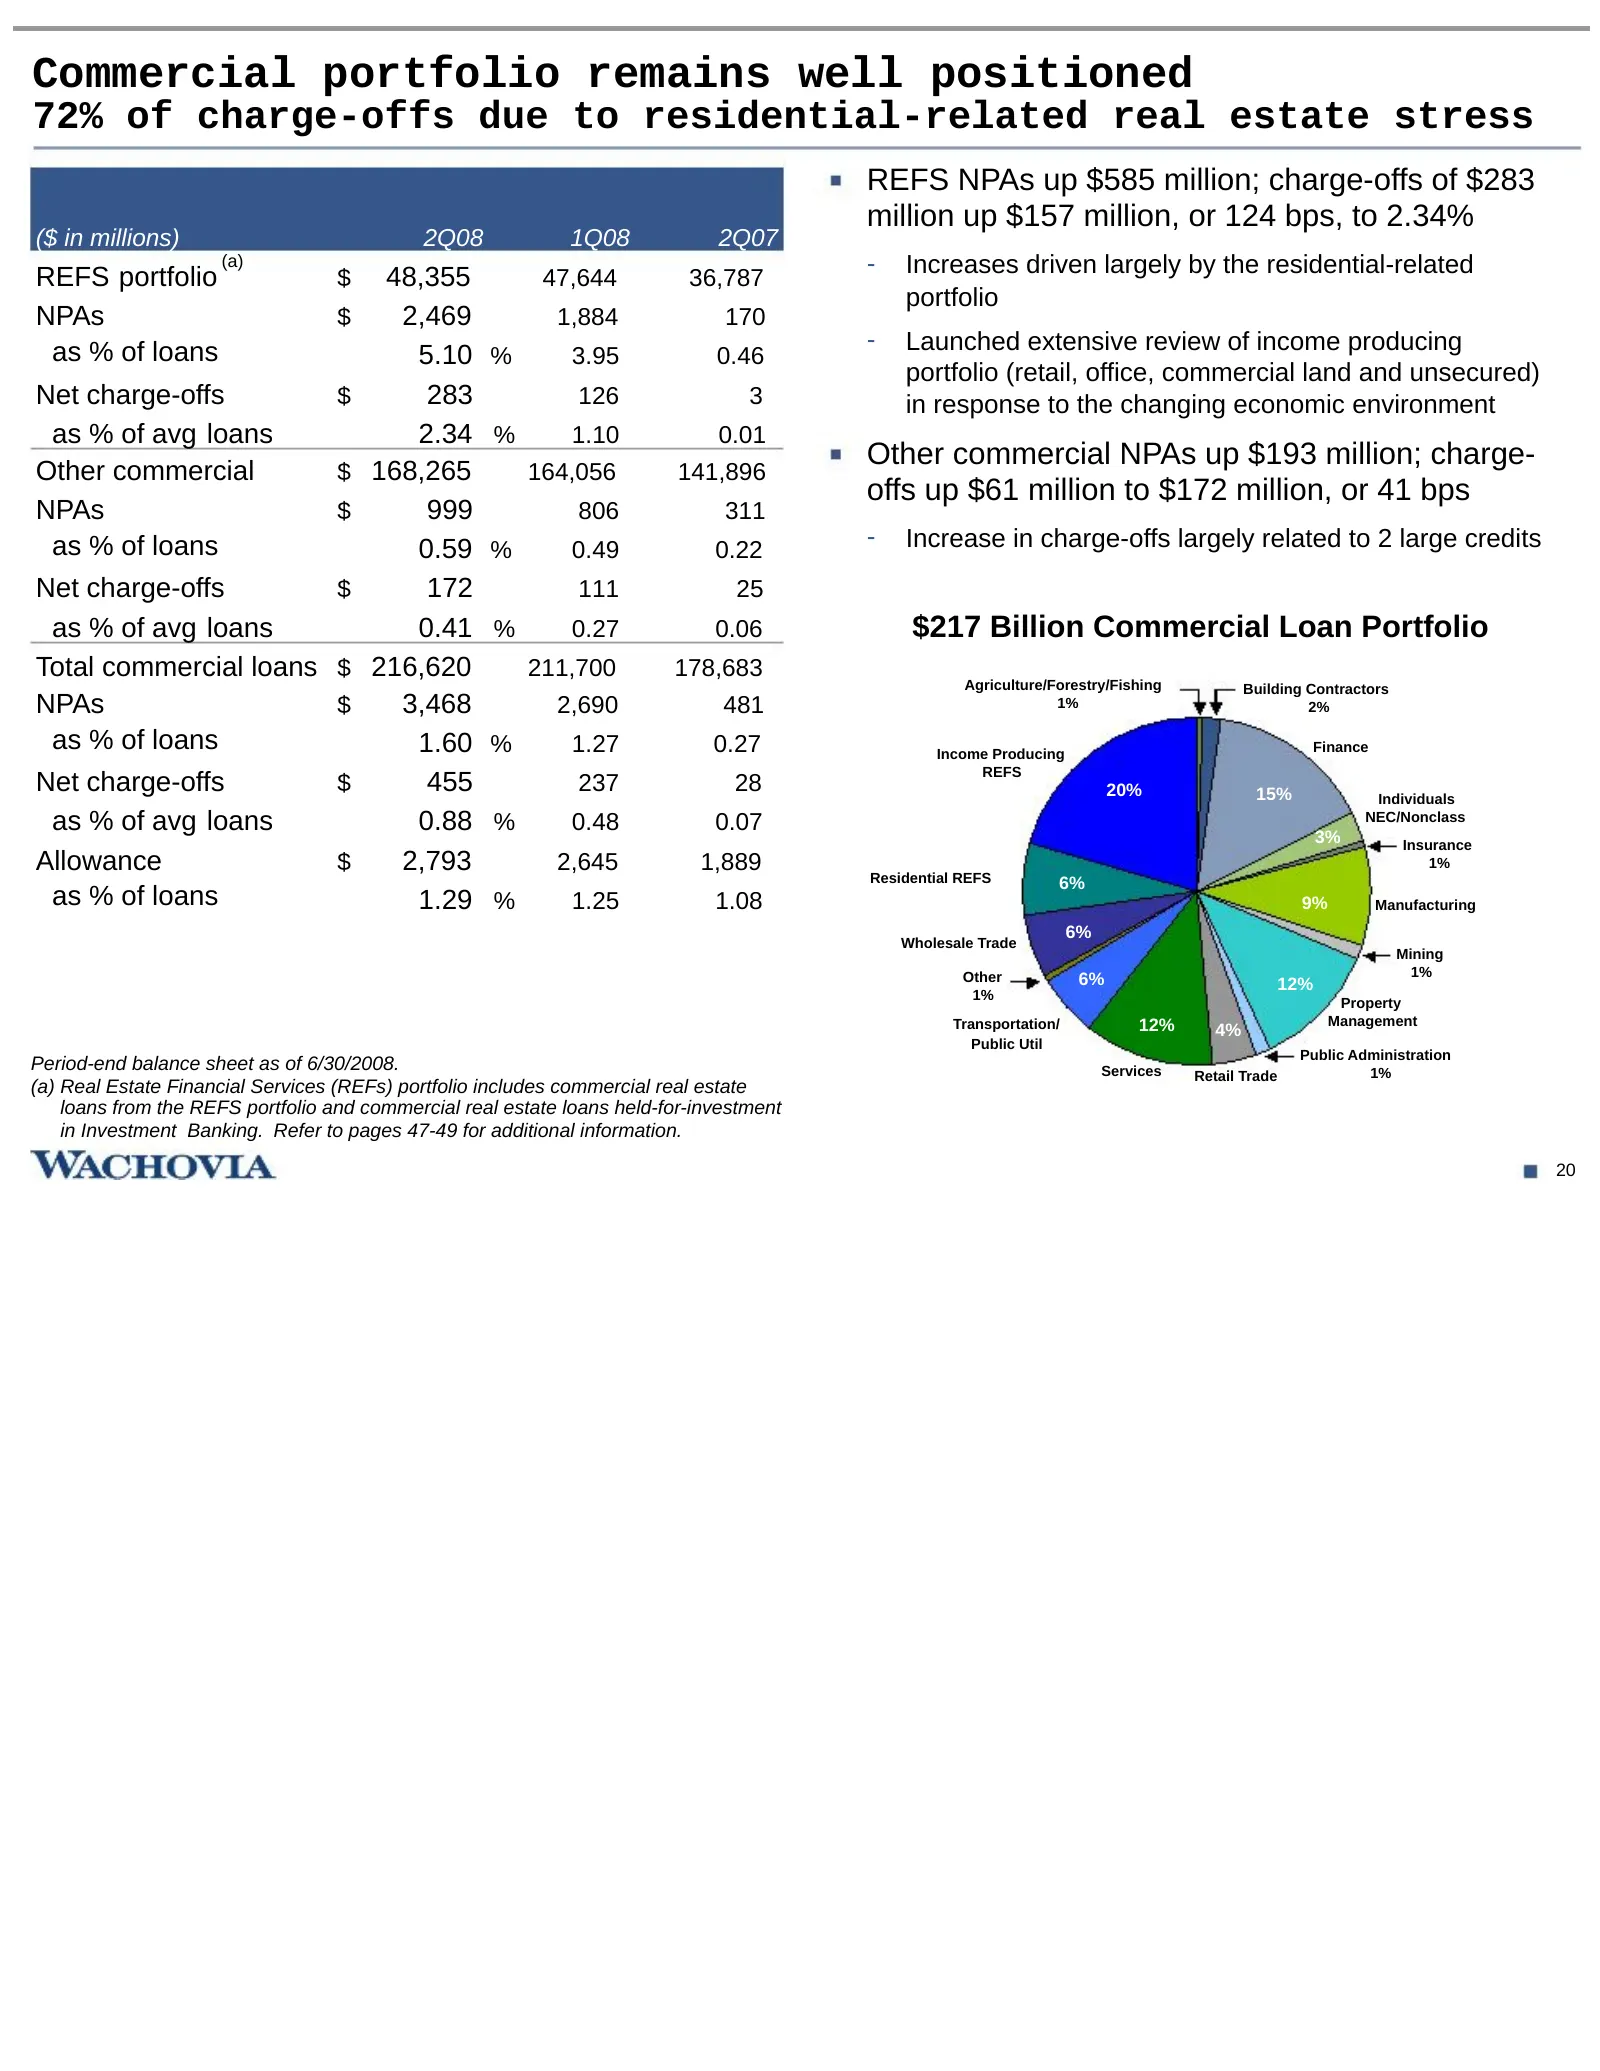
Slide 21: Commercial portfolio remains well positioned
Commercial portfolio remains well positioned 72% of charge-offs due to residential-related real estate stress REFS NPAs up $585 million; charge-offs of $283 million up $157 million, or 124 bps, to 2.34% ($ in millions) 2Q08 1Q08 2Q07 (a) - Increases driven largely by the residential-related REFS por
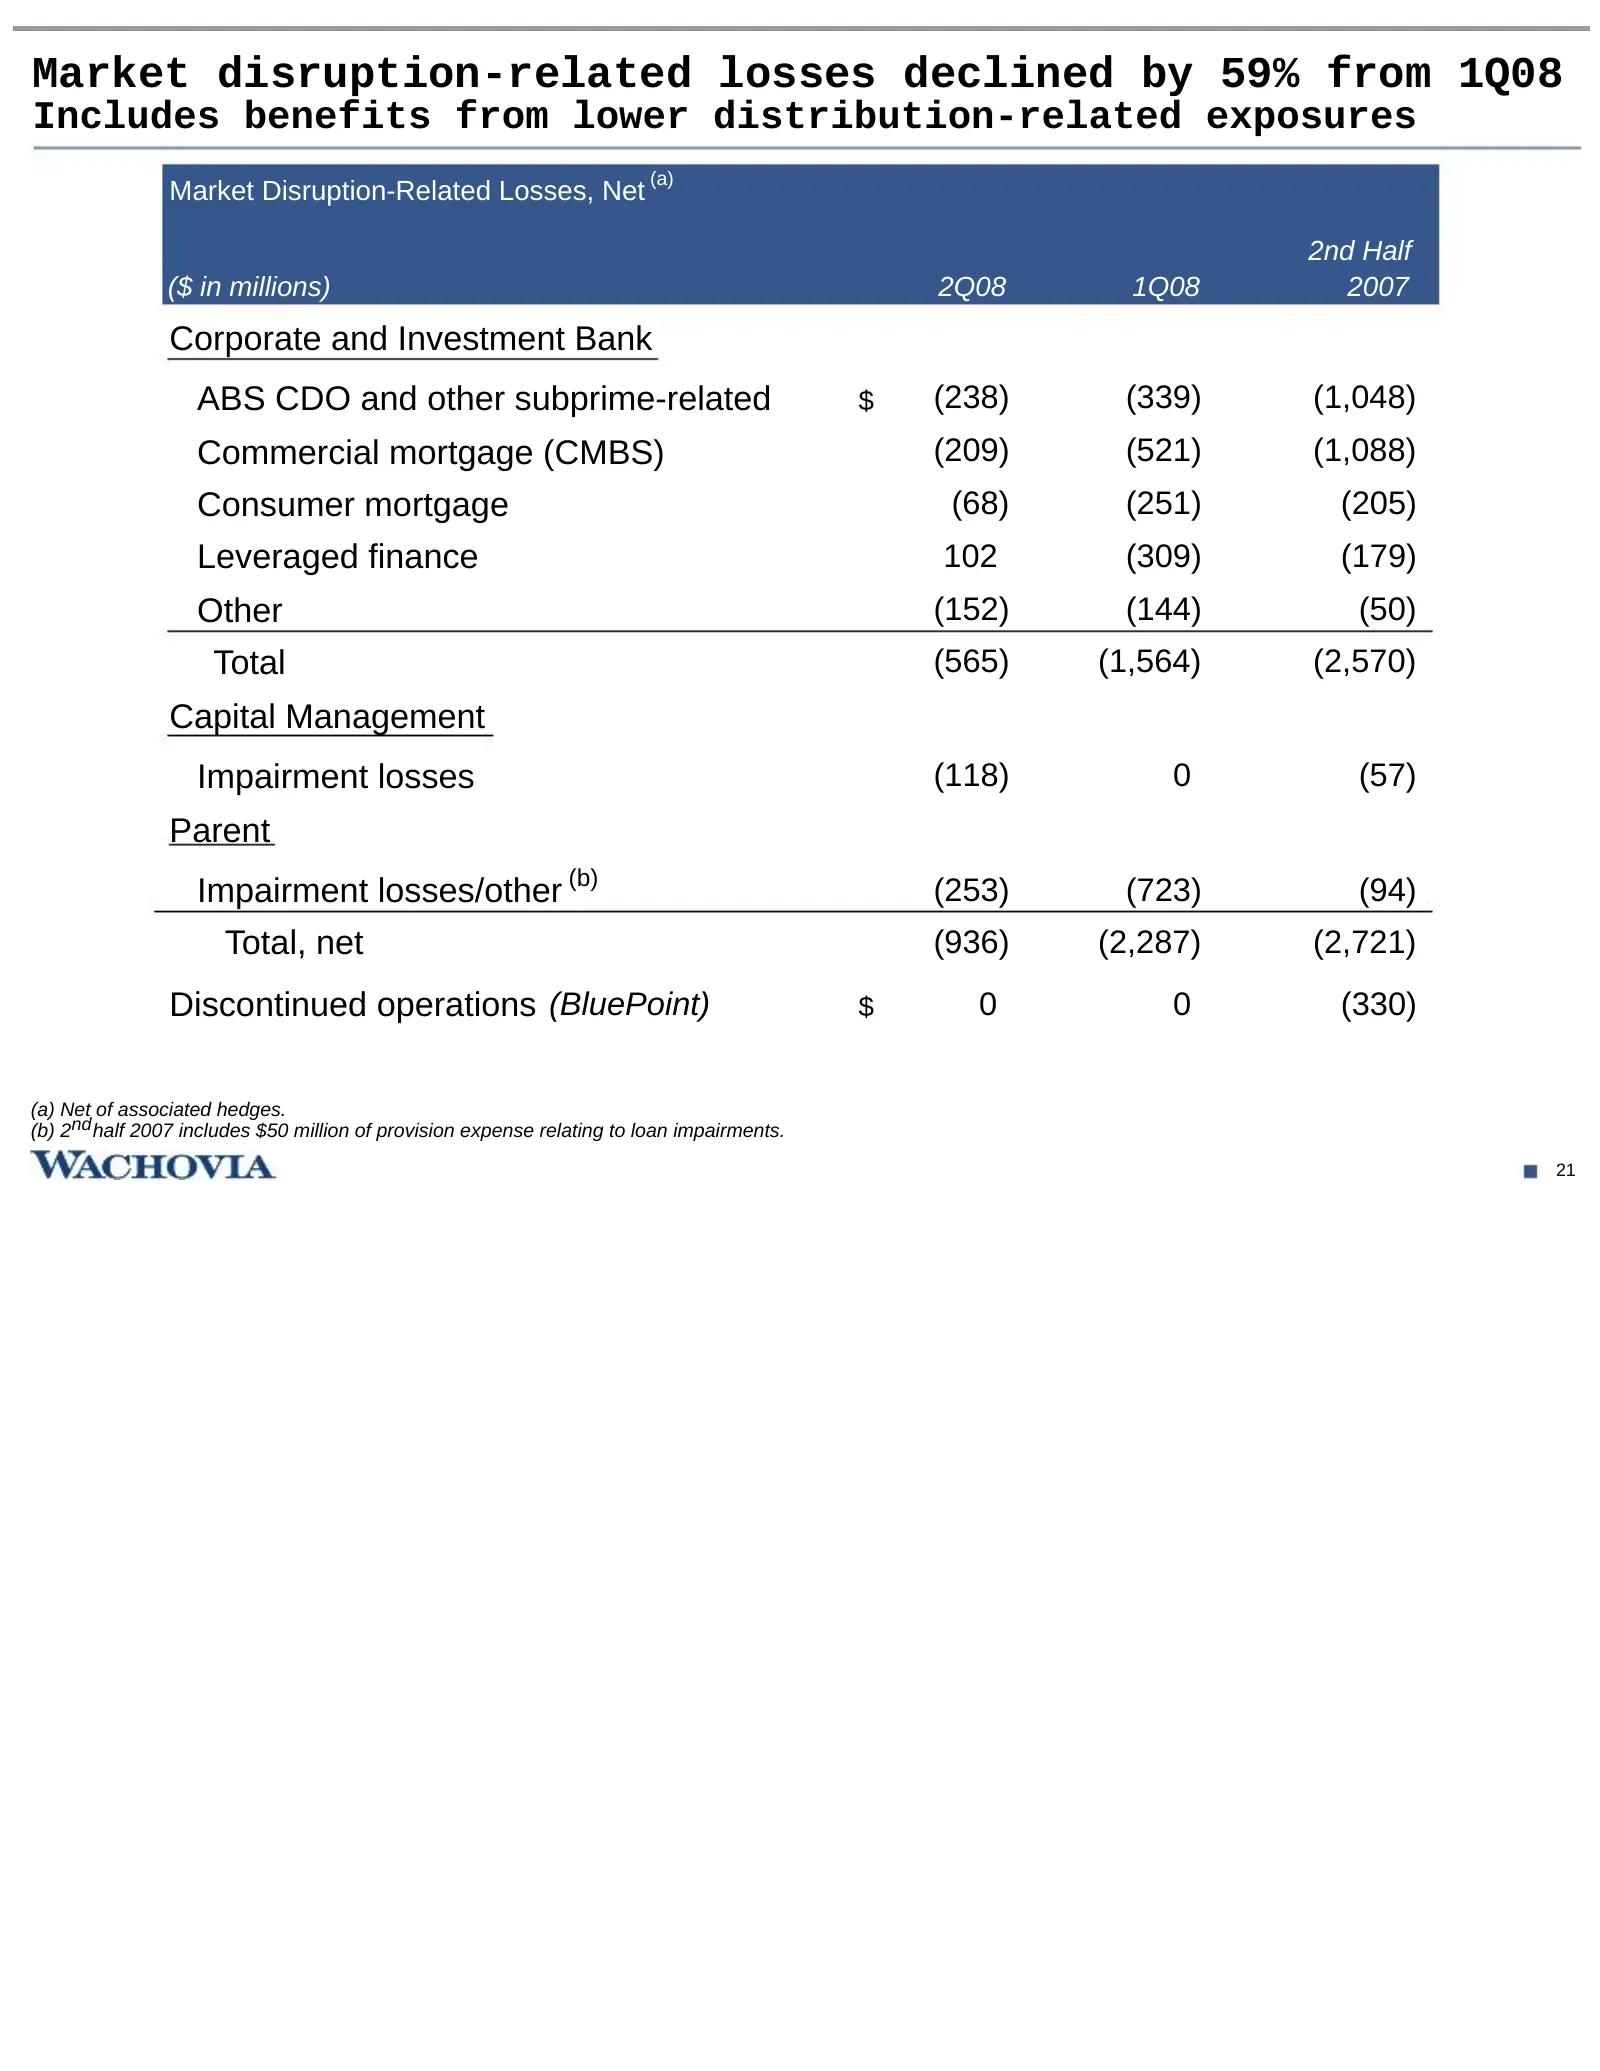
Slide 22: Market disruption-related losses declined by 59% from 1Q08
Market disruption-related losses declined by 59% from 1Q08 Includes benefits from lower distribution-related exposures (a) Market Disruption-Related Losses, Net 2nd Half ($ in millions) 2Q08 1Q08 2007 Corporate and Investment Bank ABS CDO and other subprime-related $ (238) (339) (1,048) Commercial m
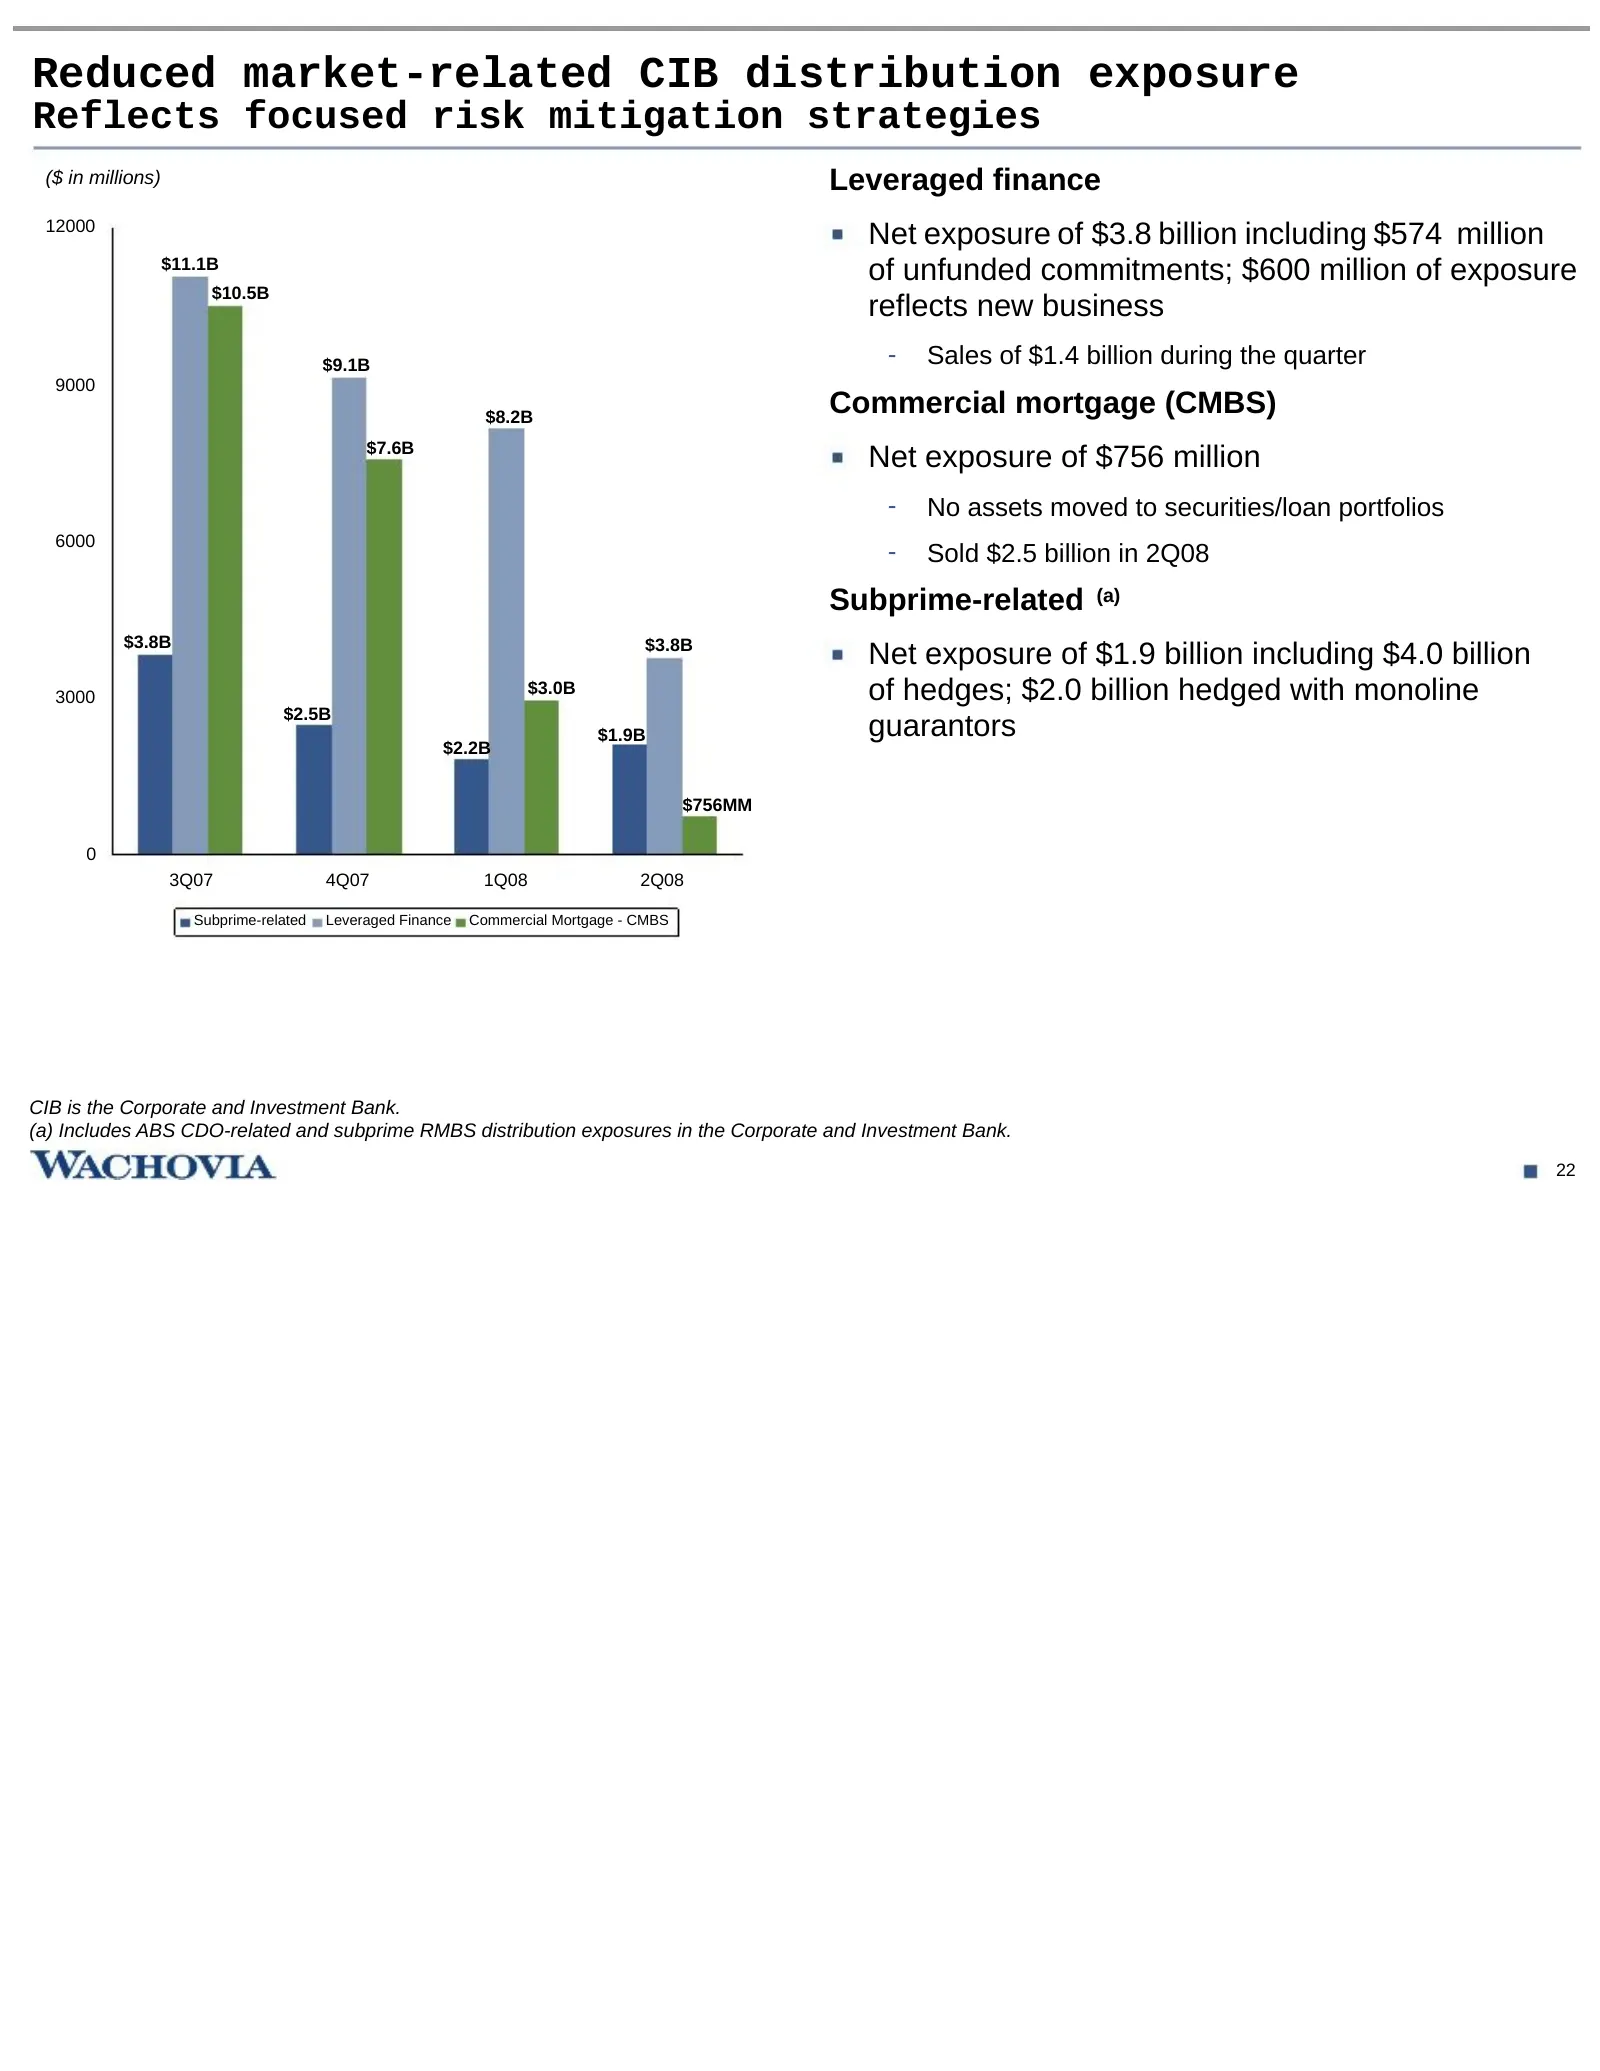
Slide 23: Reduced market-related CIB distribution exposure
Reduced market-related CIB distribution exposure Reflects focused risk mitigation strategies ($ in millions) Leveraged finance 12000 Net exposure of $3.8 billion including $574 million $11.1B of unfunded commitments; $600 million of exposure $10.5B reflects new business $9.1B - Sales of $1.4 billion
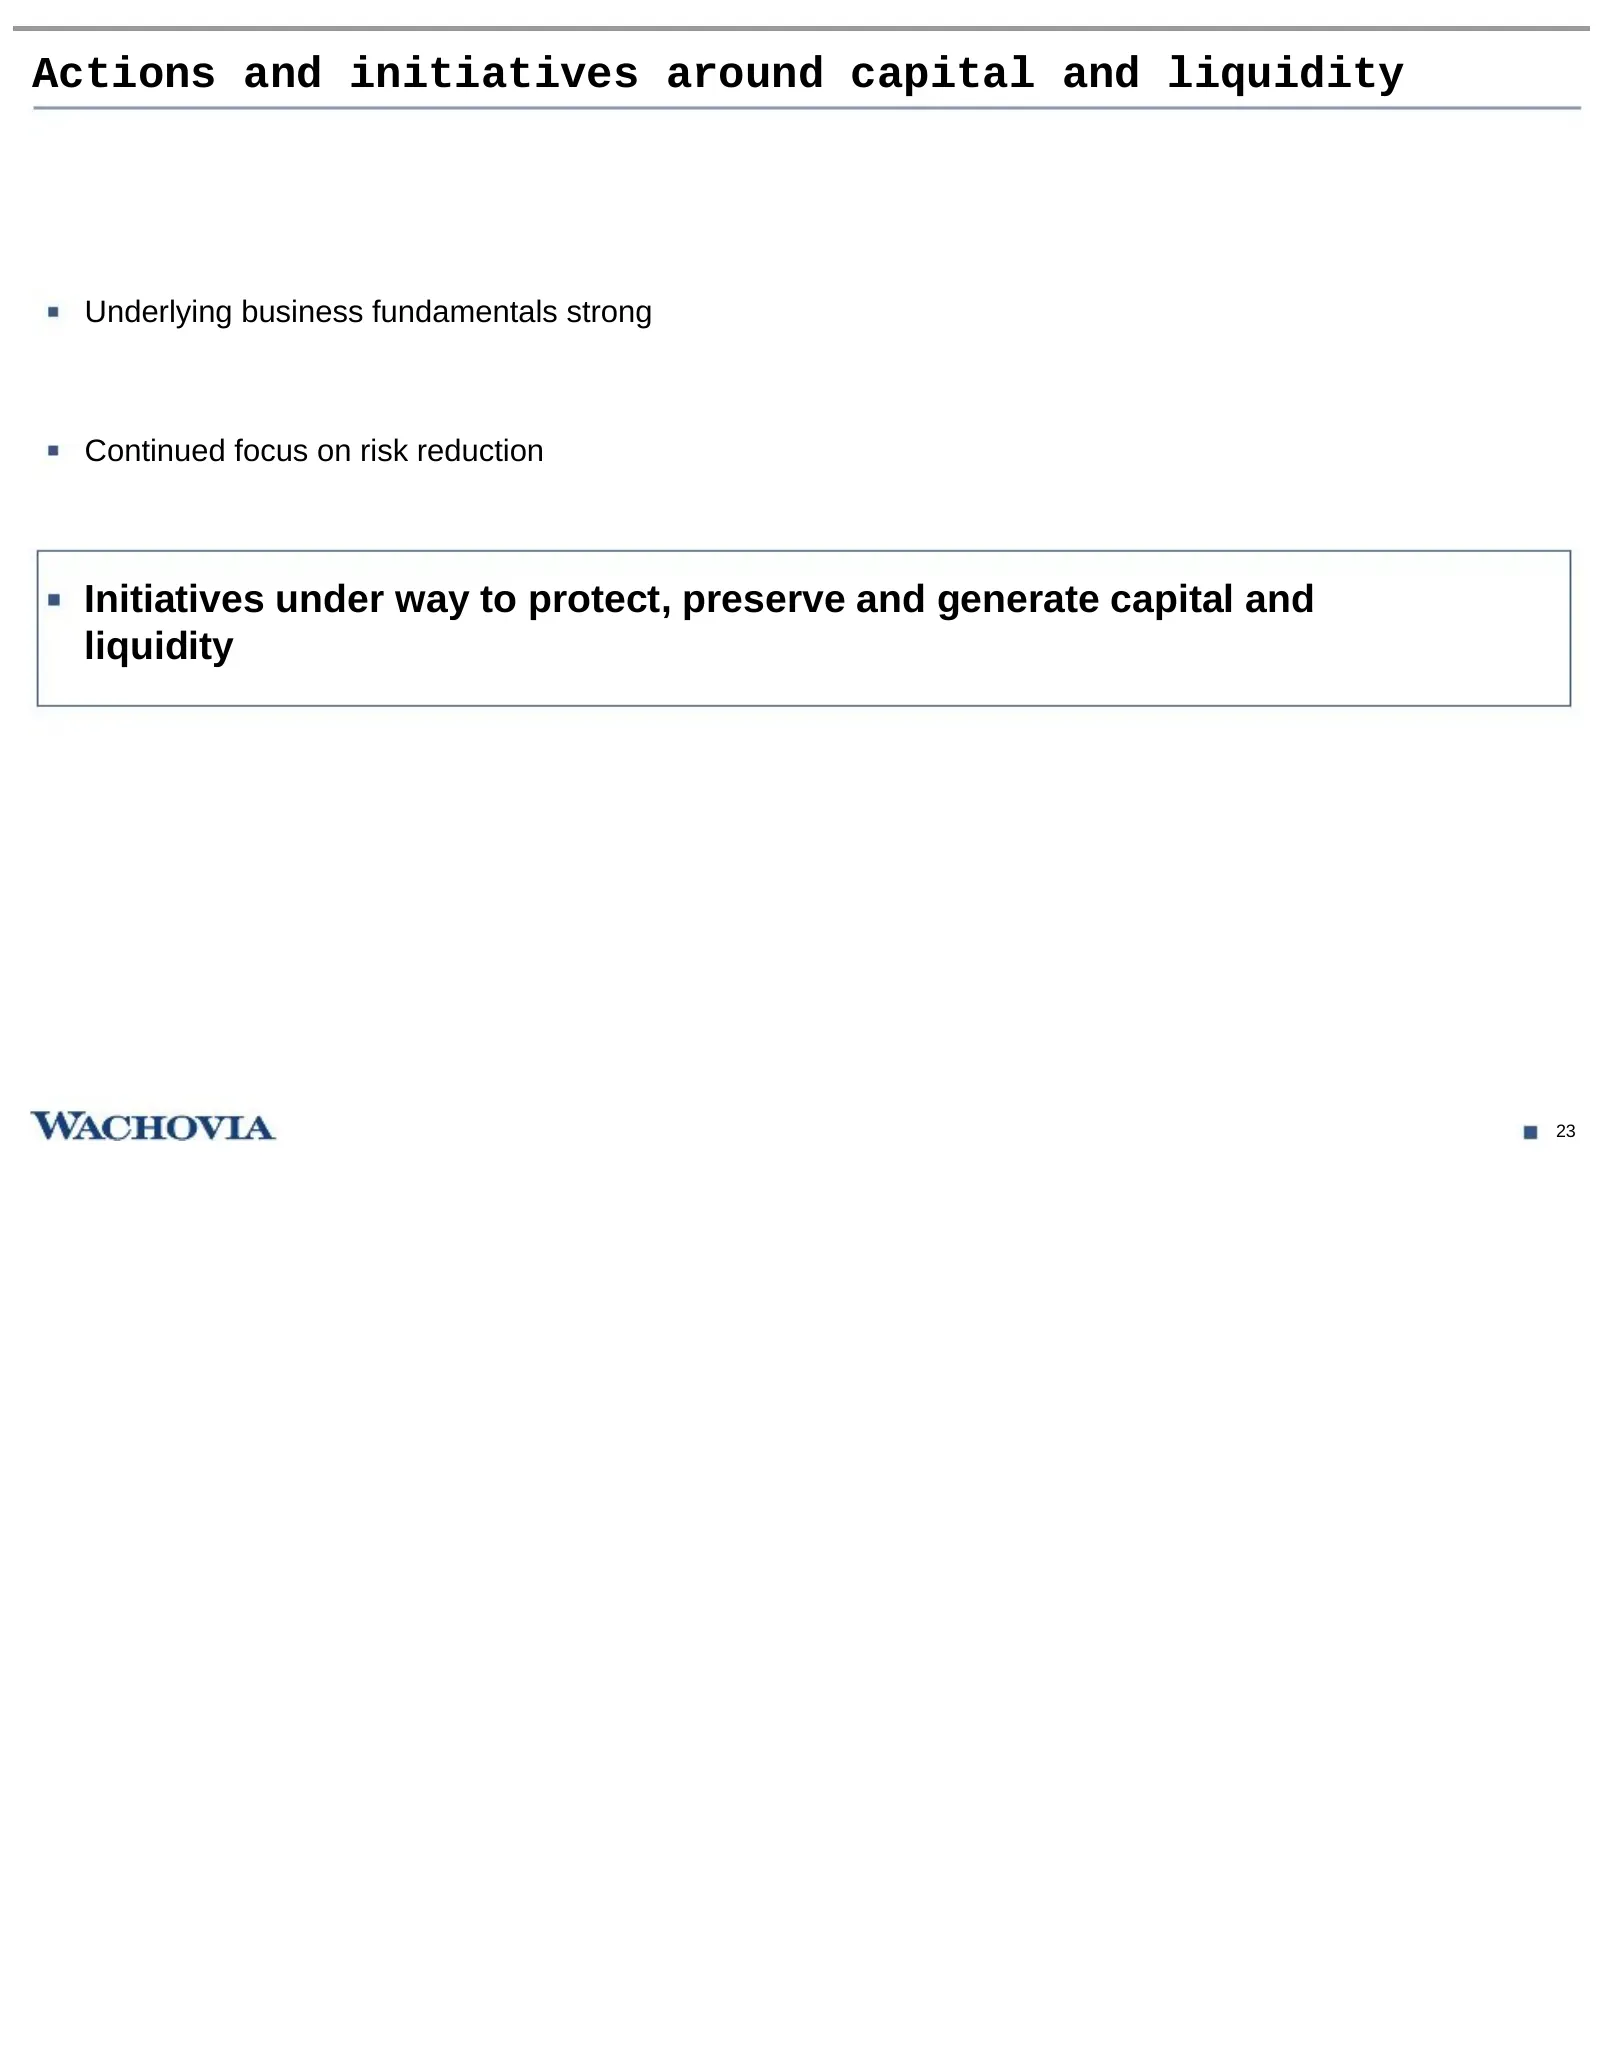
Slide 24: Actions and initiatives around capital and liquidity
Actions and initiatives around capital and liquidity Underlying business fundamentals strong Continued focus on risk reduction Initiatives under way to protect, preserve and generate capital and liquidity 23
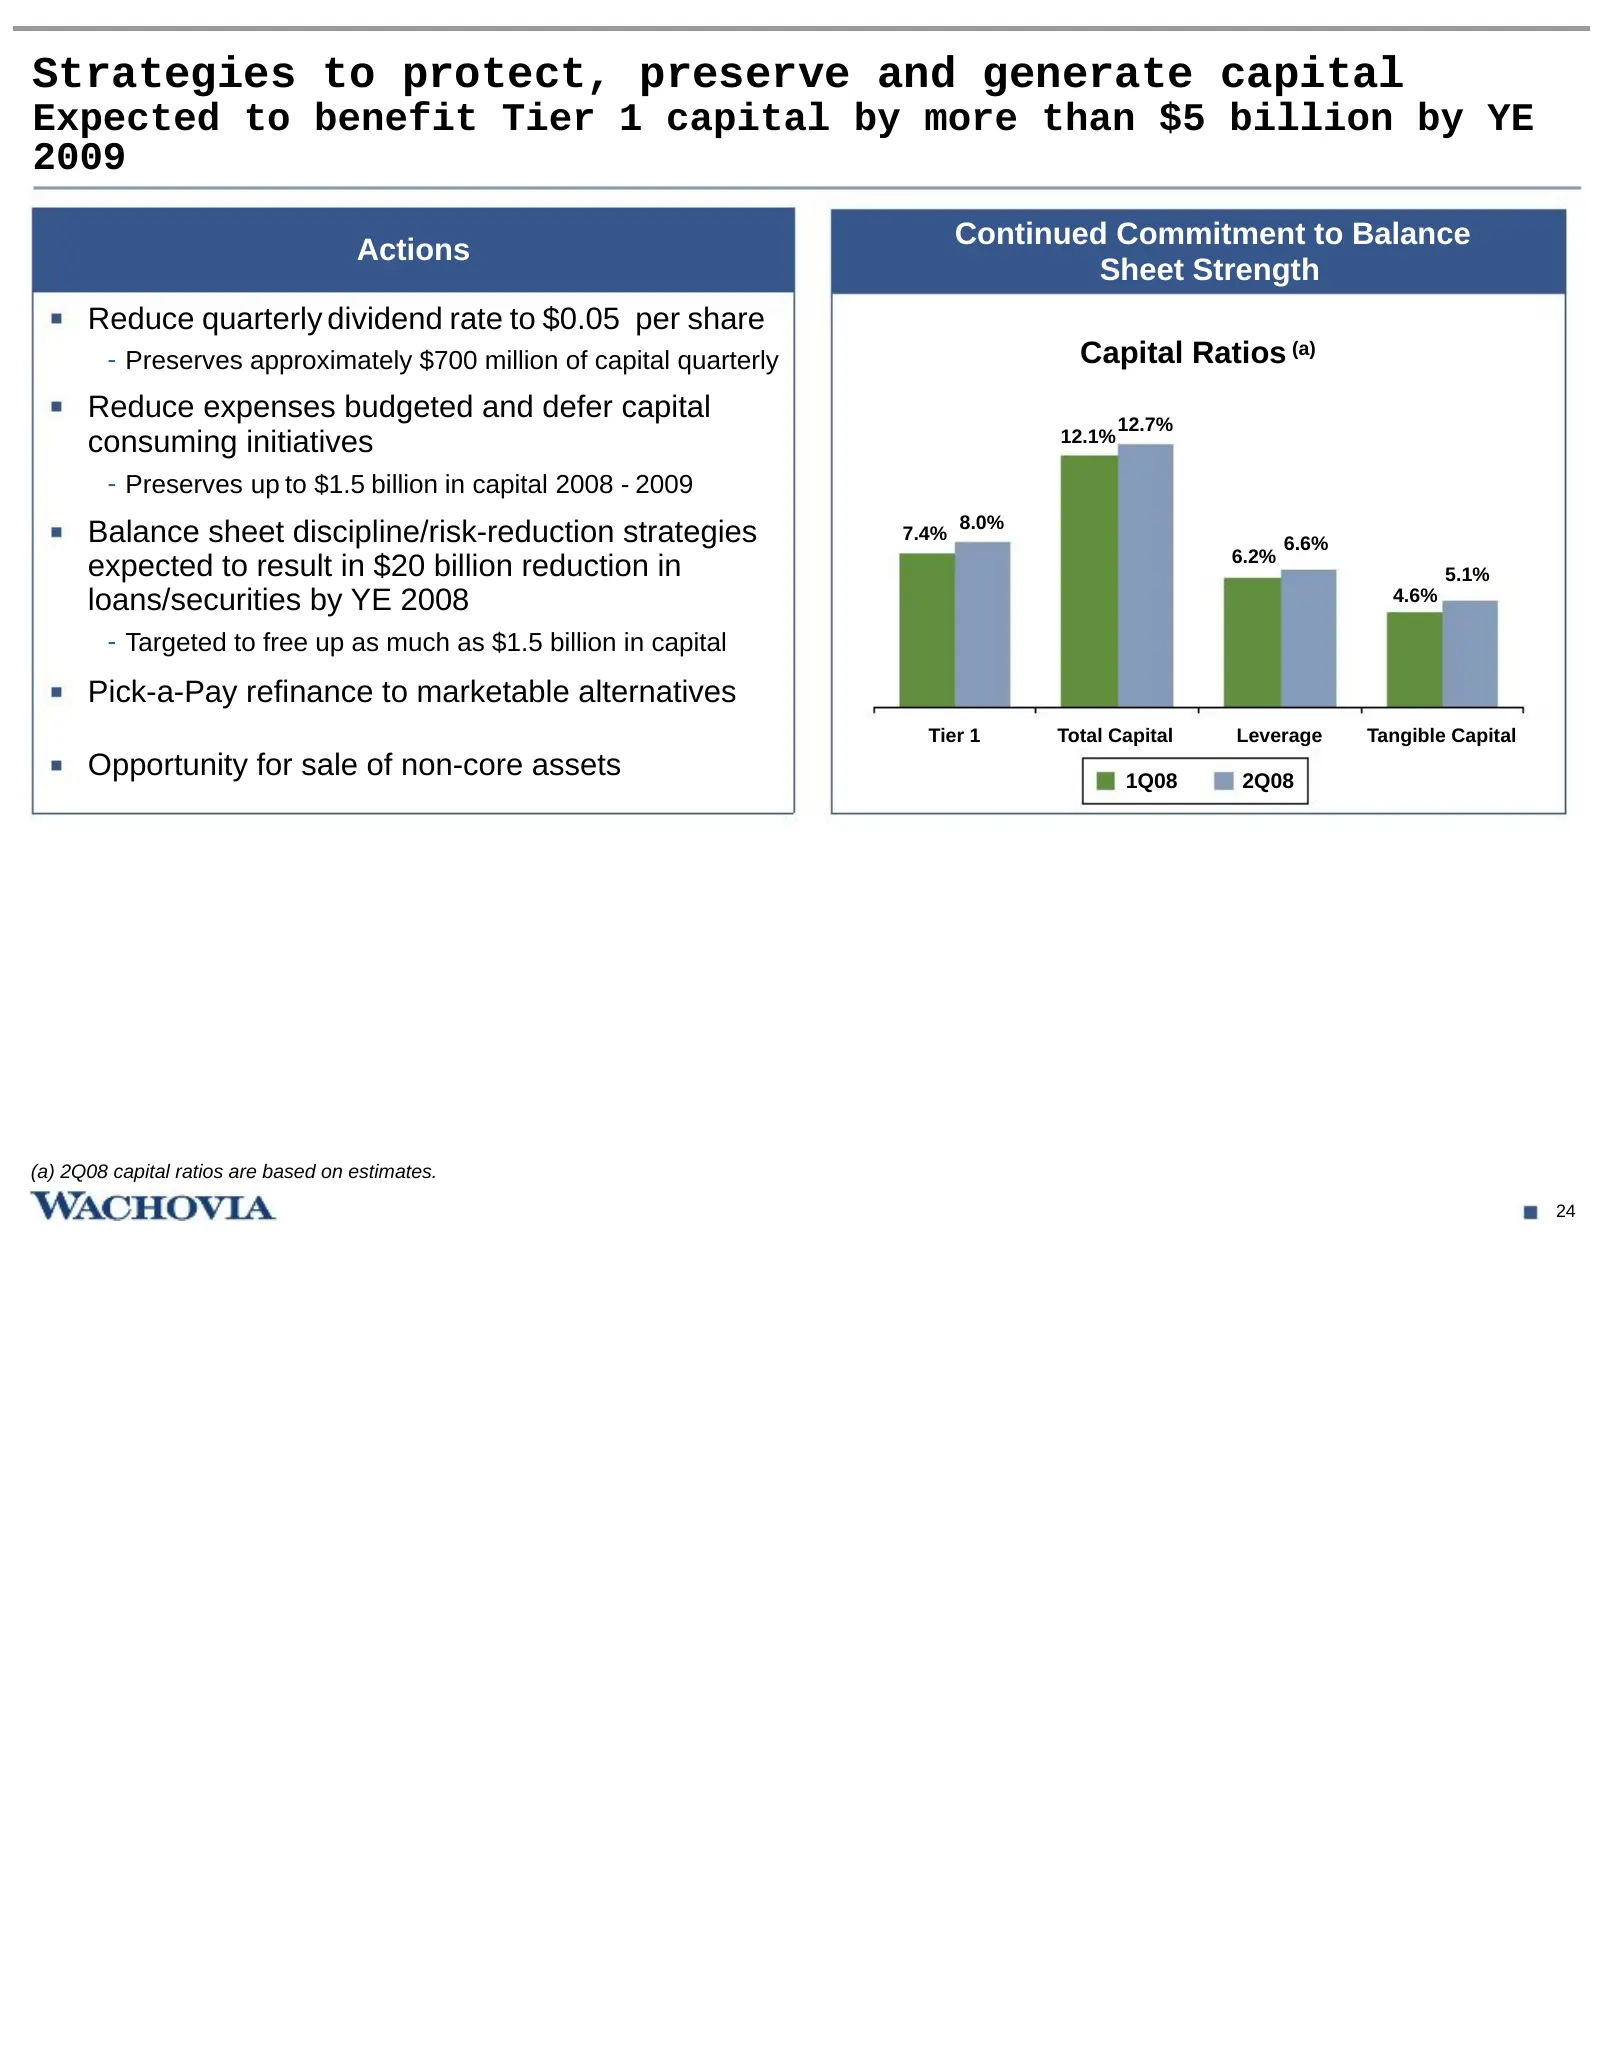
Slide 25: Strategies to protect, preserve and generate capital
Strategies to protect, preserve and generate capital Expected to benefit Tier 1 capital by more than $5 billion by YE 2009 Continued Commitment to Balance Actions Sheet Strength Reduce quarterly dividend rate to $0.05 per share - Preserves approximately $700 million of capital quarterly Capital Rati
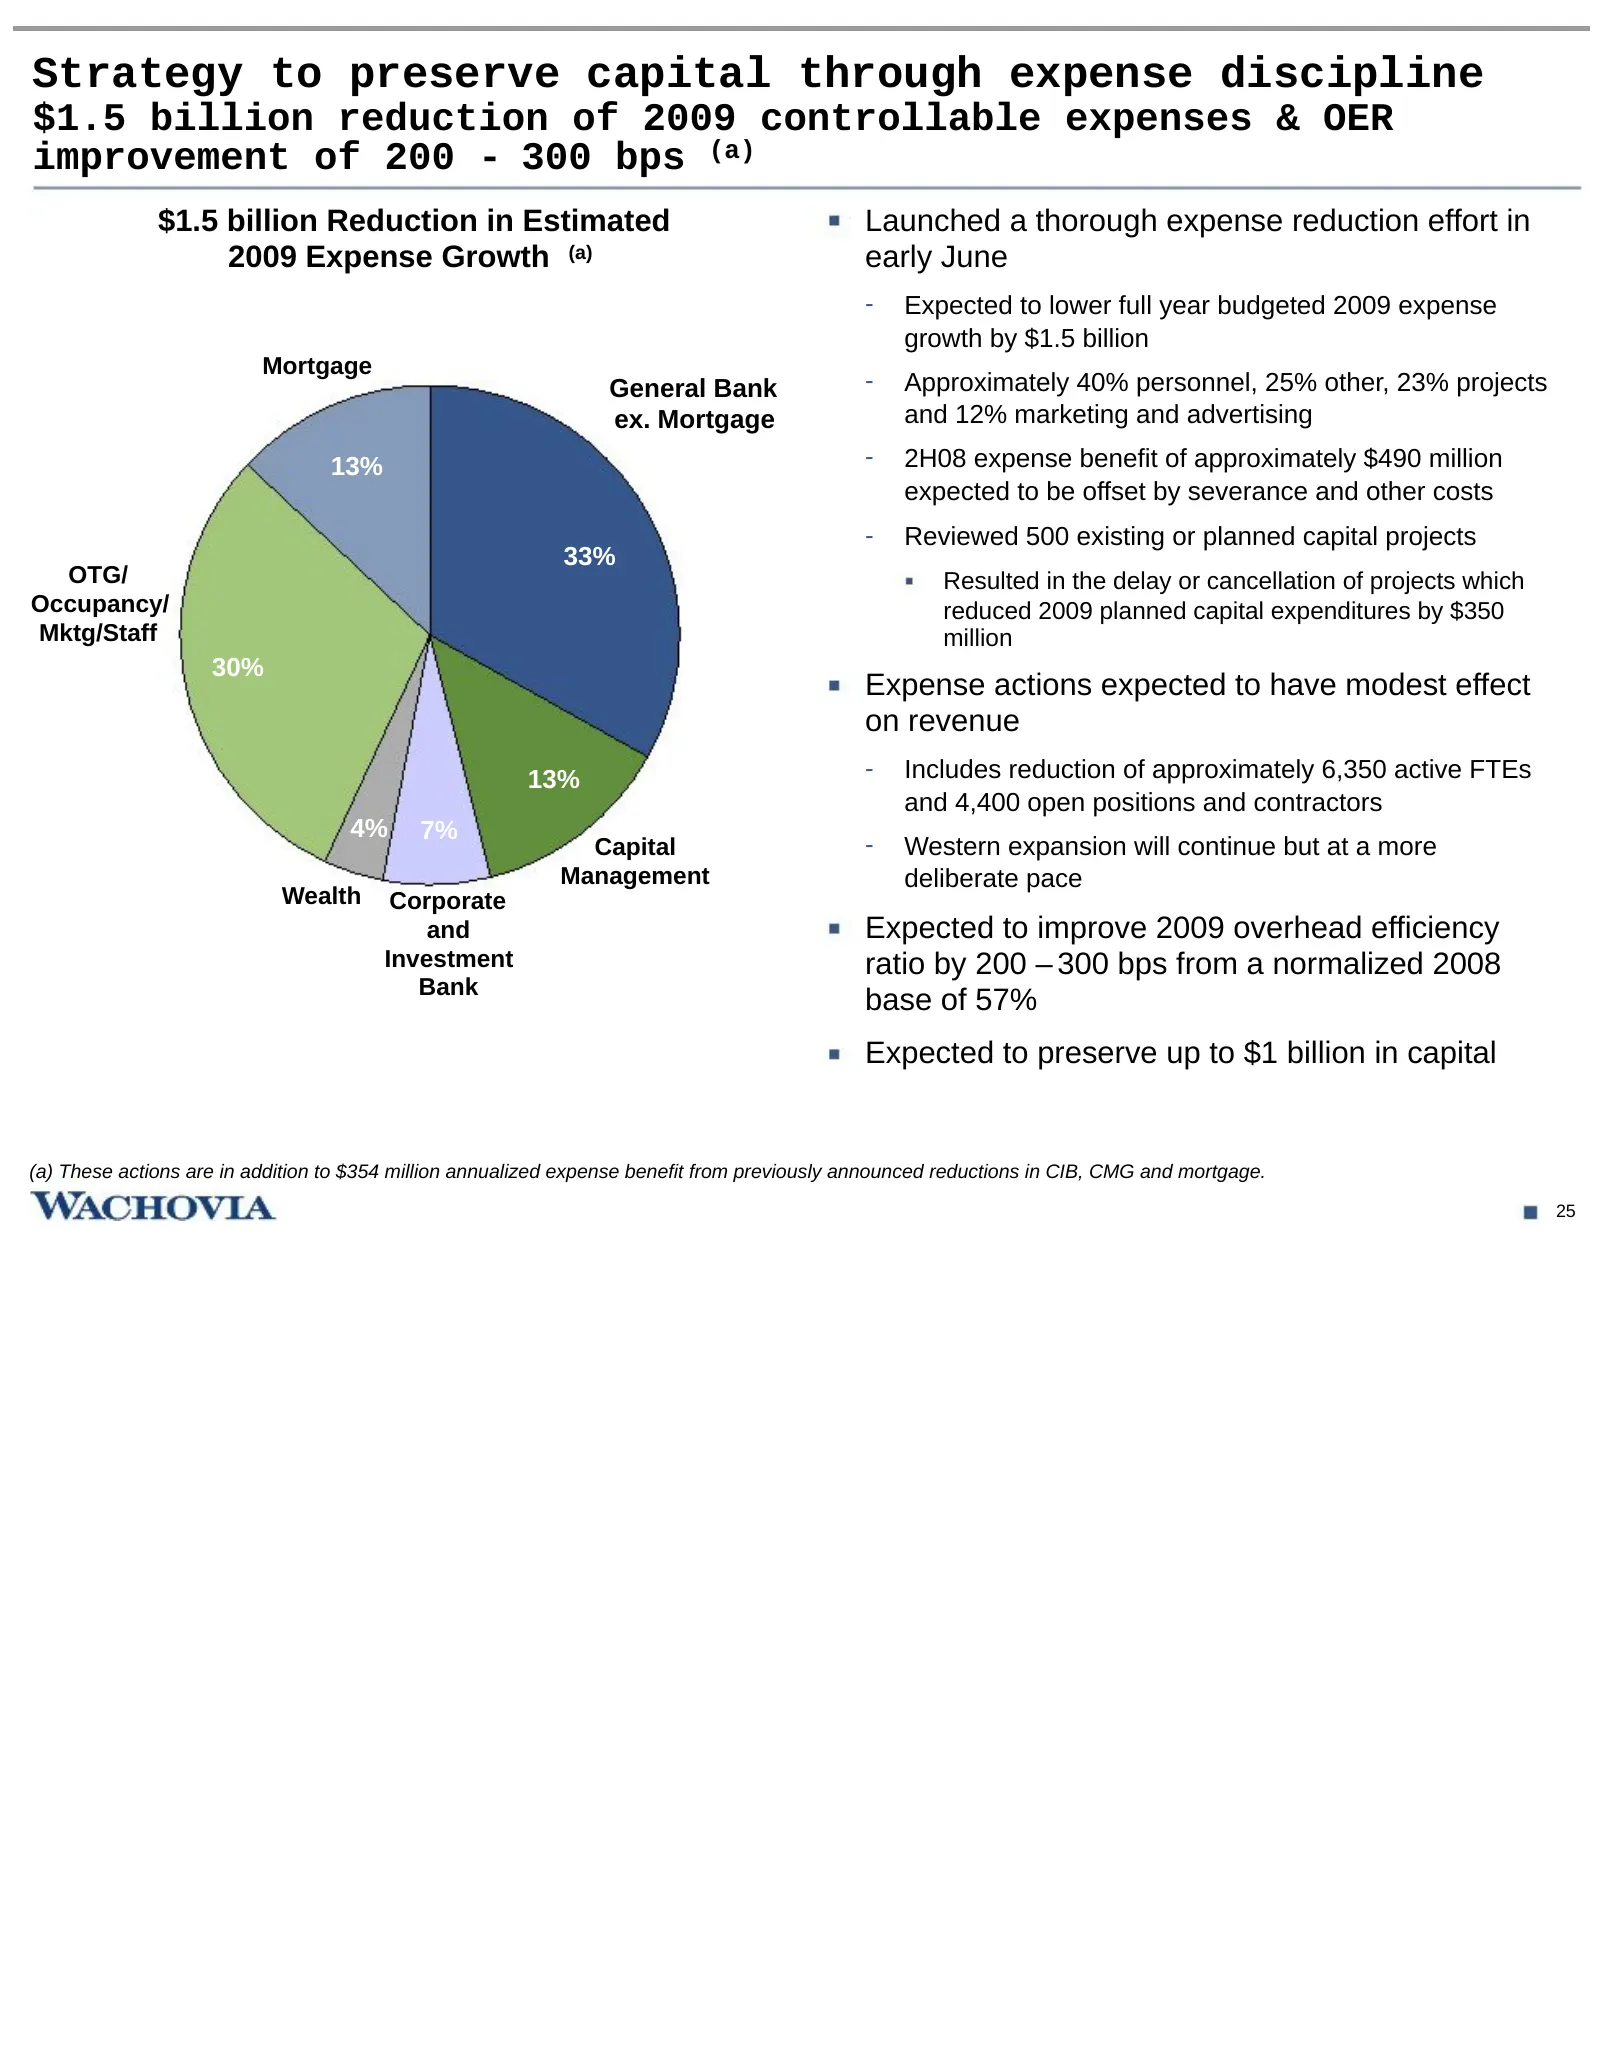
Slide 26: Strategy to preserve capital through expense discipline
Strategy to preserve capital through expense discipline $1.5 billion reduction of 2009 controllable expenses & OER improvement of 200 - 300 bps (a) $1.5 billion Reduction in Estimated Launched a thorough expense reduction effort in 2009 Expense Growth (a) early June - Expected to lower full year bud
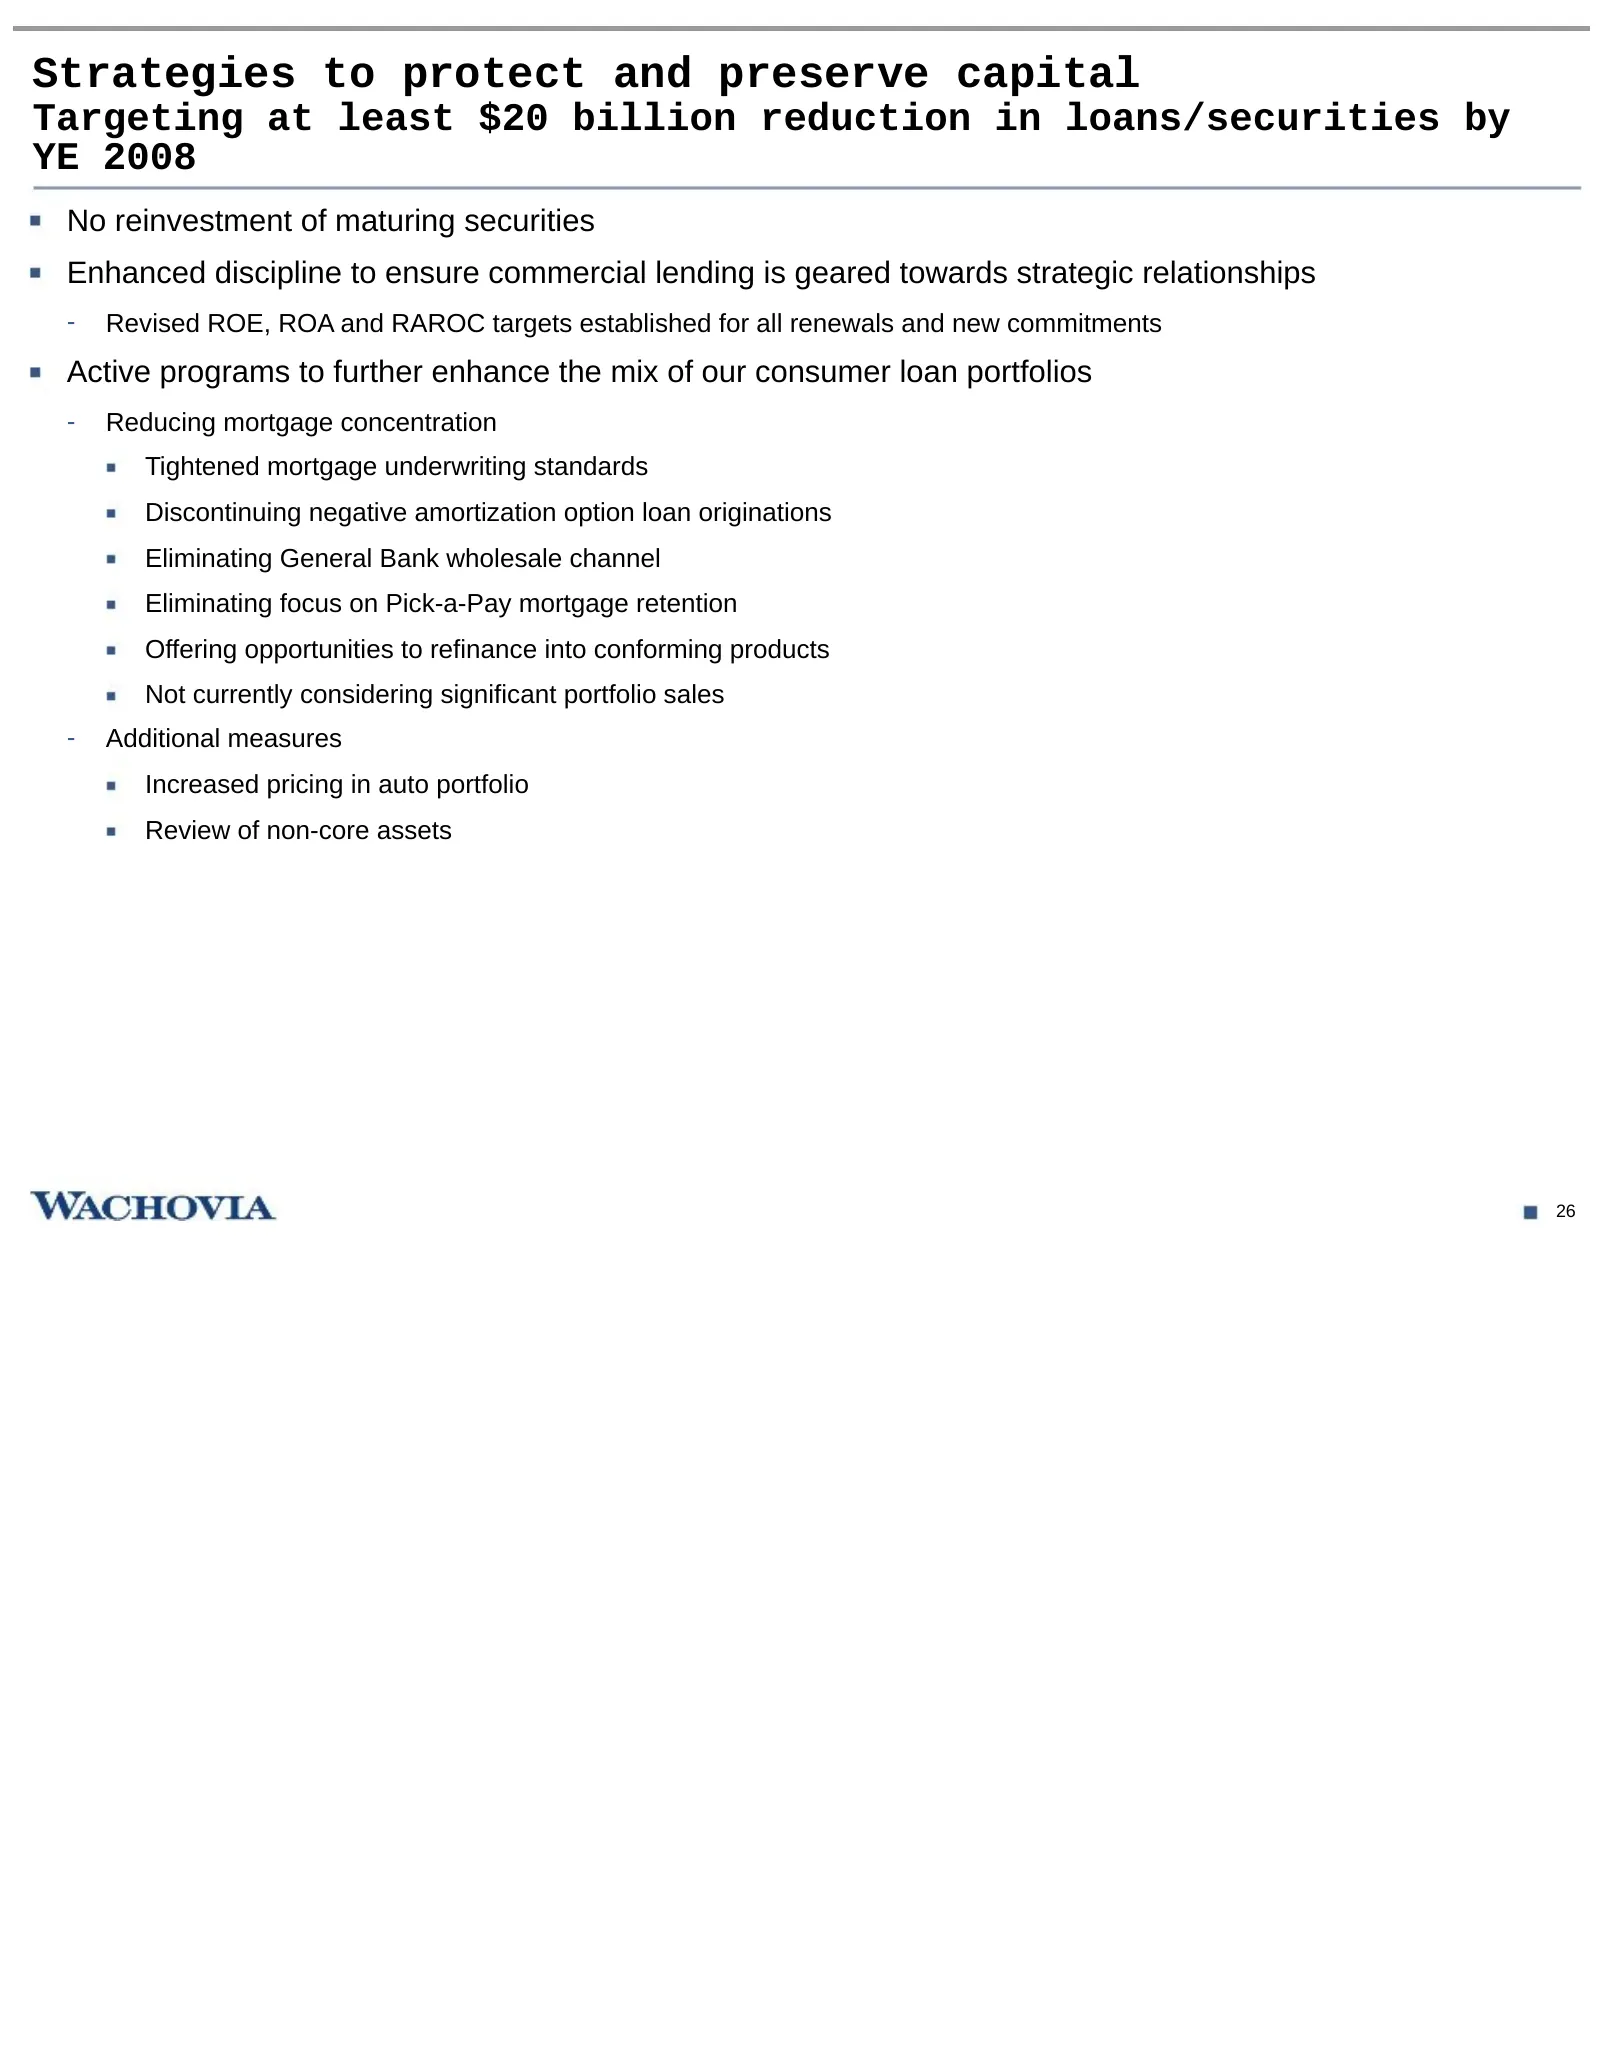
Slide 27: Strategies to protect and preserve capital
Strategies to protect and preserve capital Targeting at least $20 billion reduction in loans/securities by YE 2008 No reinvestment of maturing securities Enhanced discipline to ensure commercial lending is geared towards strategic relationships - Revised ROE, ROA and RAROC targets established for al
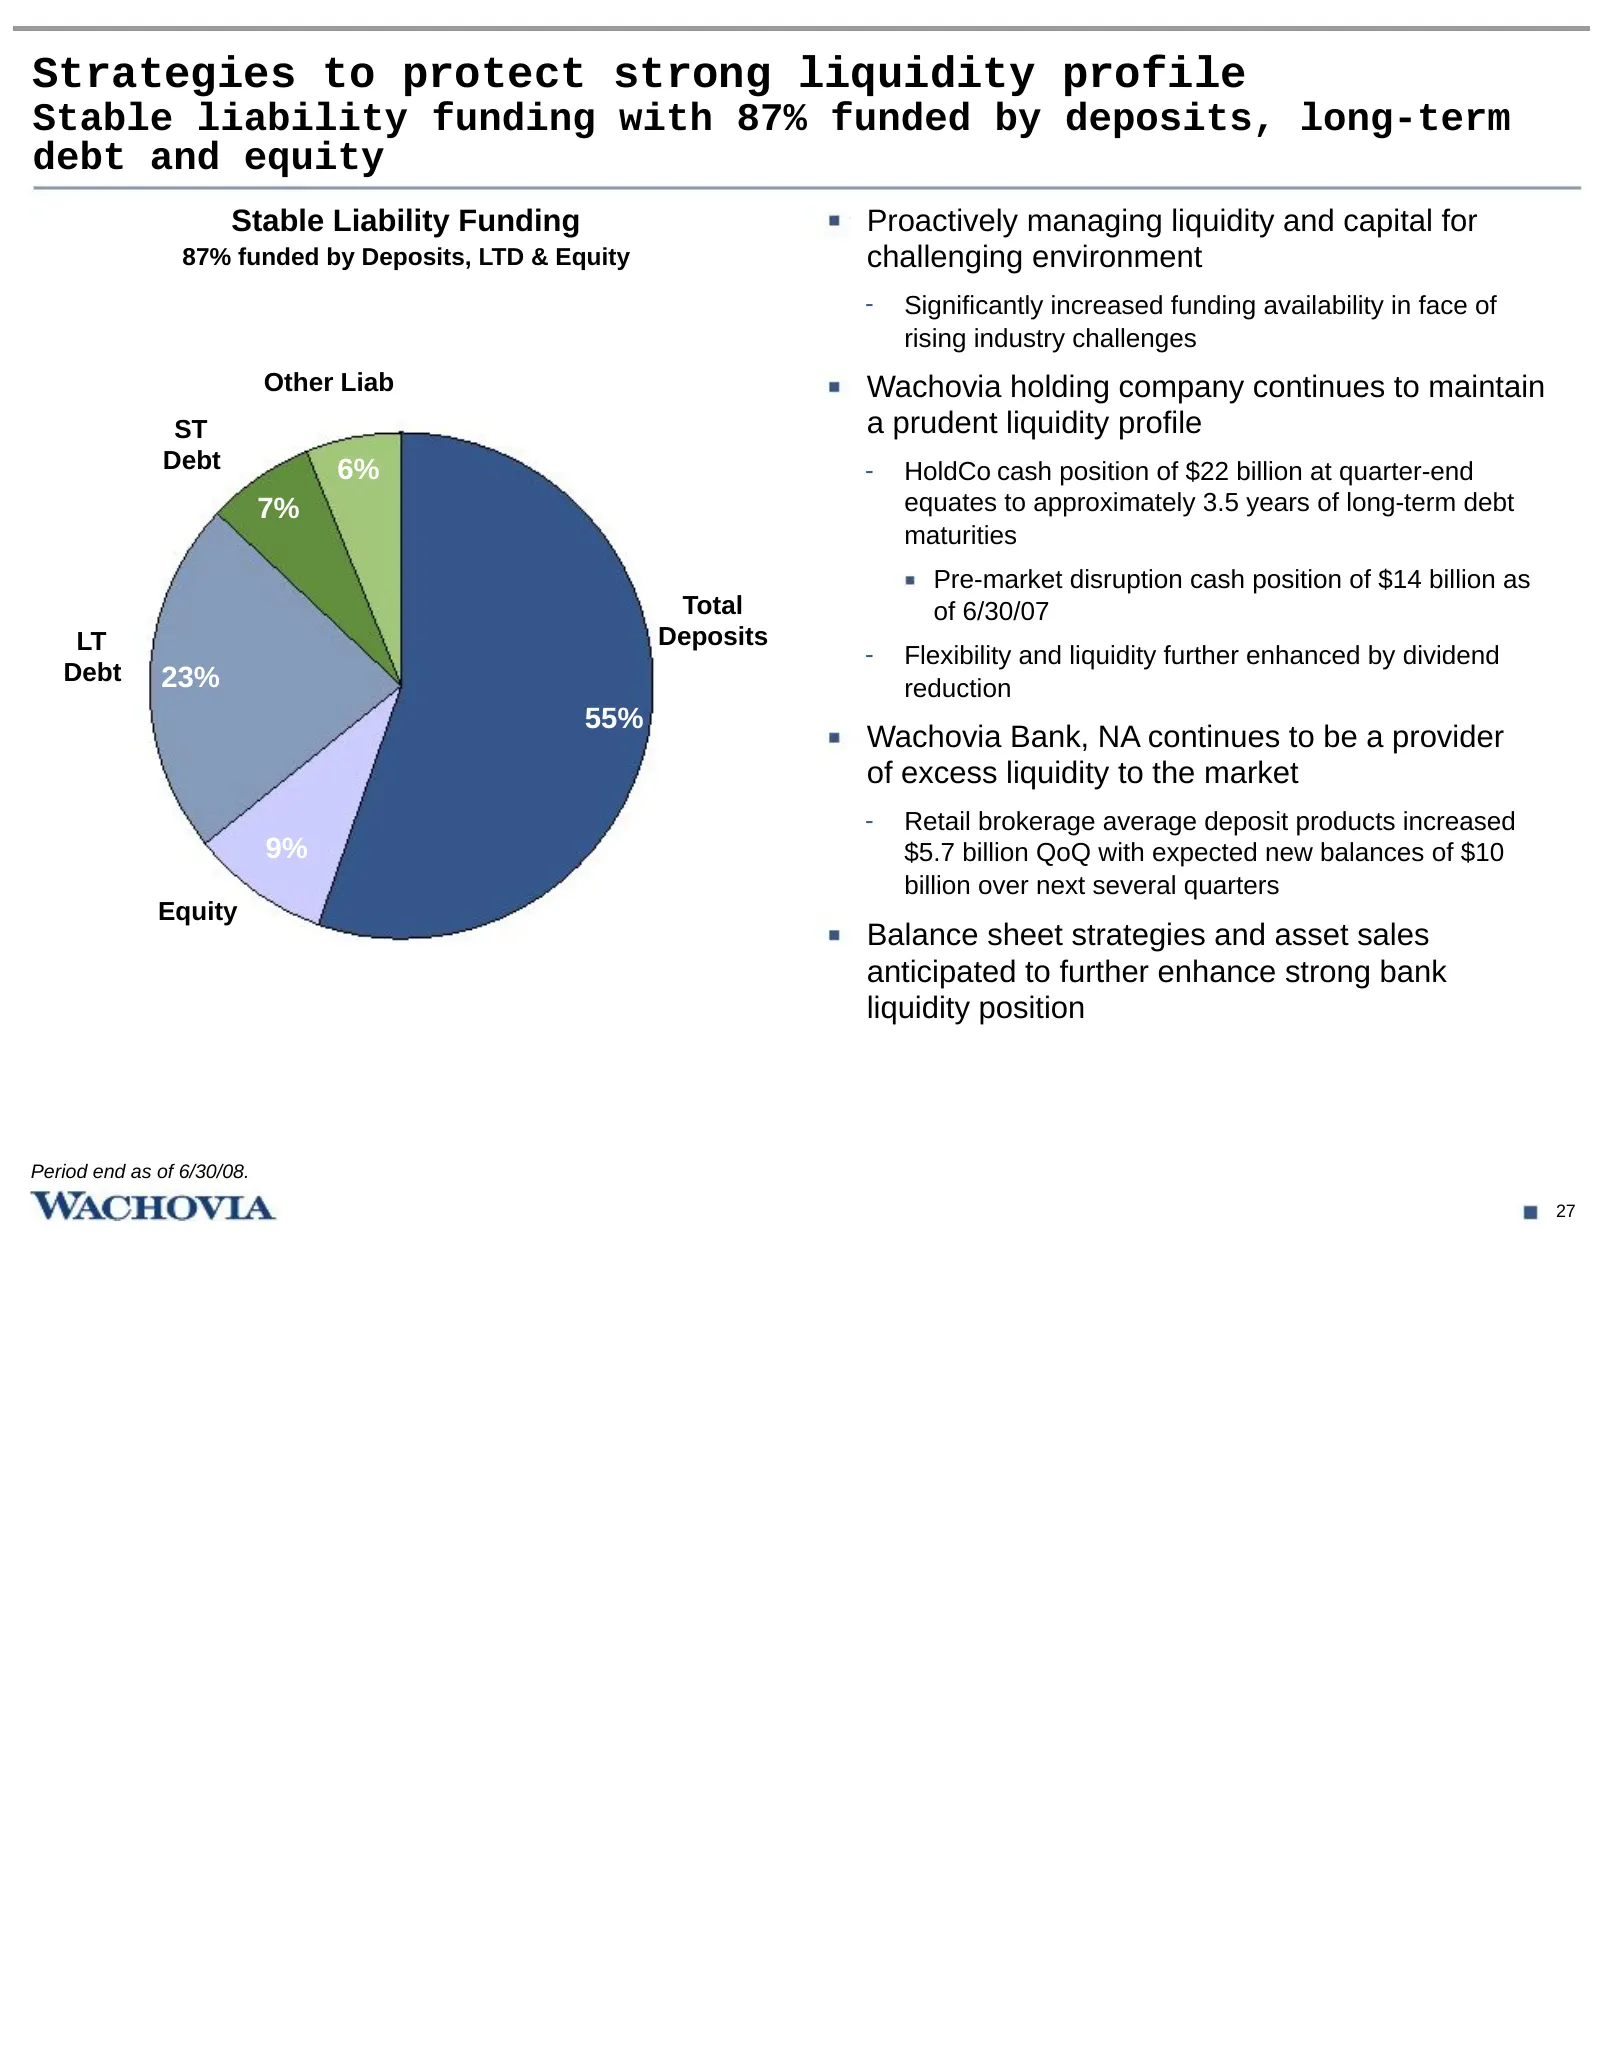
Slide 28: Strategies to protect strong liquidity profile
Strategies to protect strong liquidity profile Stable liability funding with 87% funded by deposits, long-term debt and equity Stable Liability Funding Proactively managing liquidity and capital for 87% funded by Deposits, LTD & Equity challenging environment - Significantly increased funding availa
Slide 29: Summary and Outlook
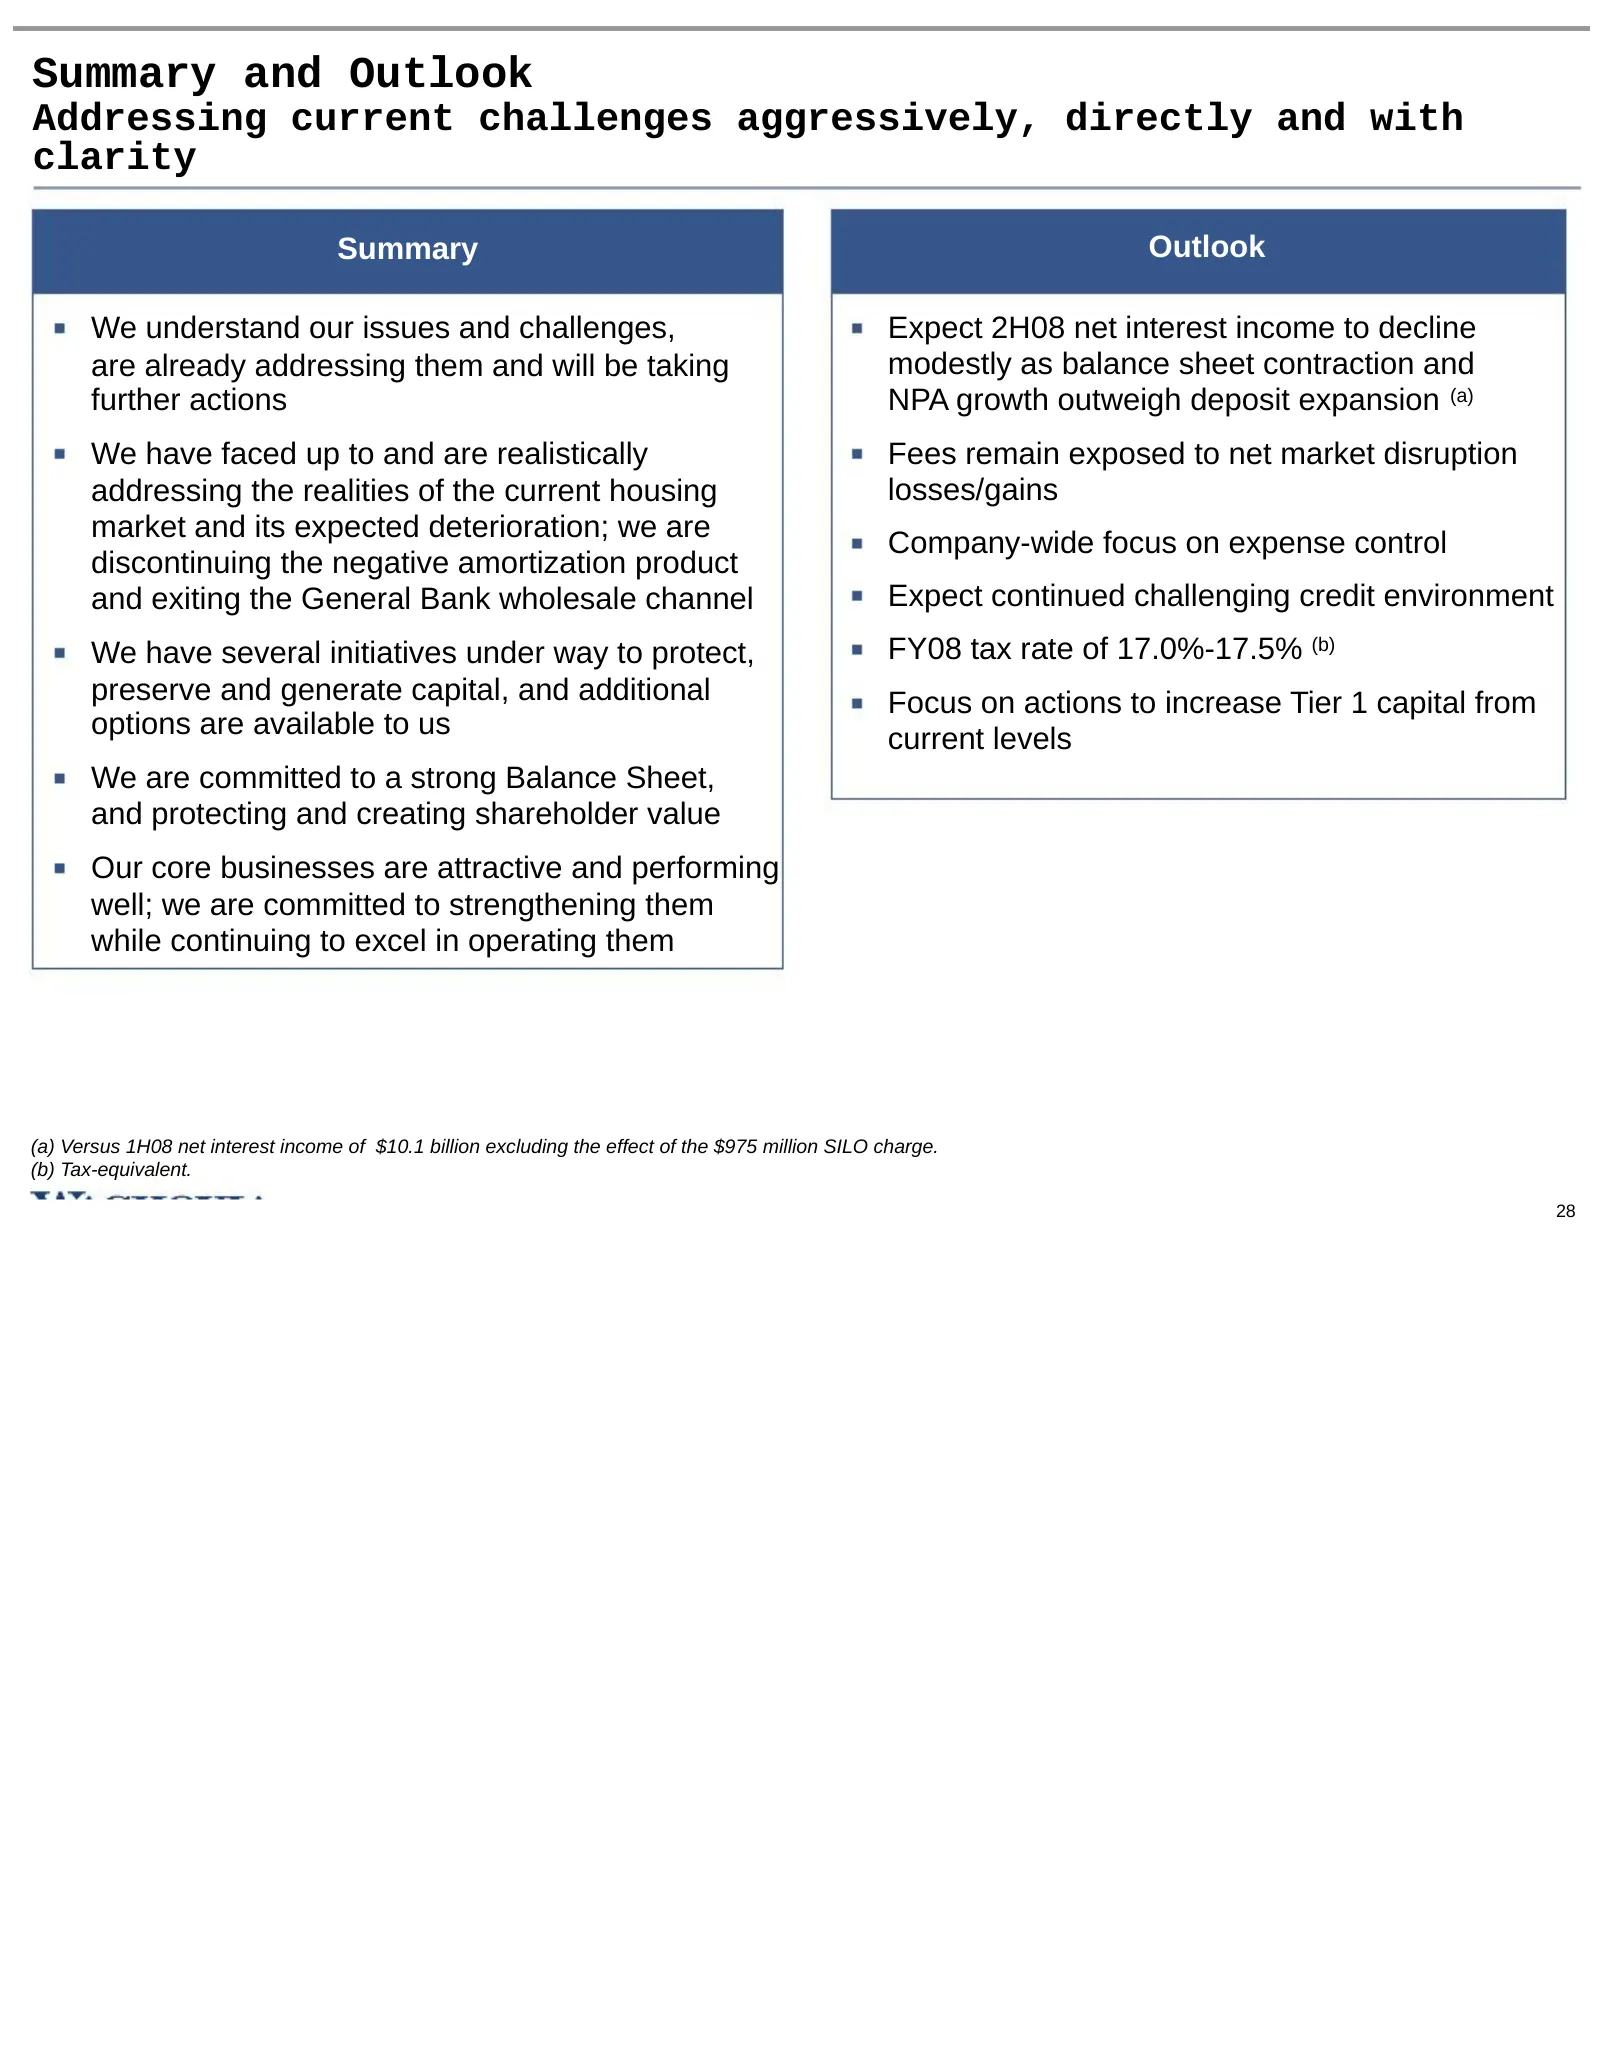
Summary and Outlook Addressing current challenges aggressively, directly and with clarity Summary Outlook We understand our issues and challenges, Expect 2H08 net interest income to decline are already addressing them and will be taking modestly as balance sheet contraction and further actions NPA g
Slide 30: Appendix
Appendix WACHOVIA. 29
Slide 31: Wachovia's fundamental strengths
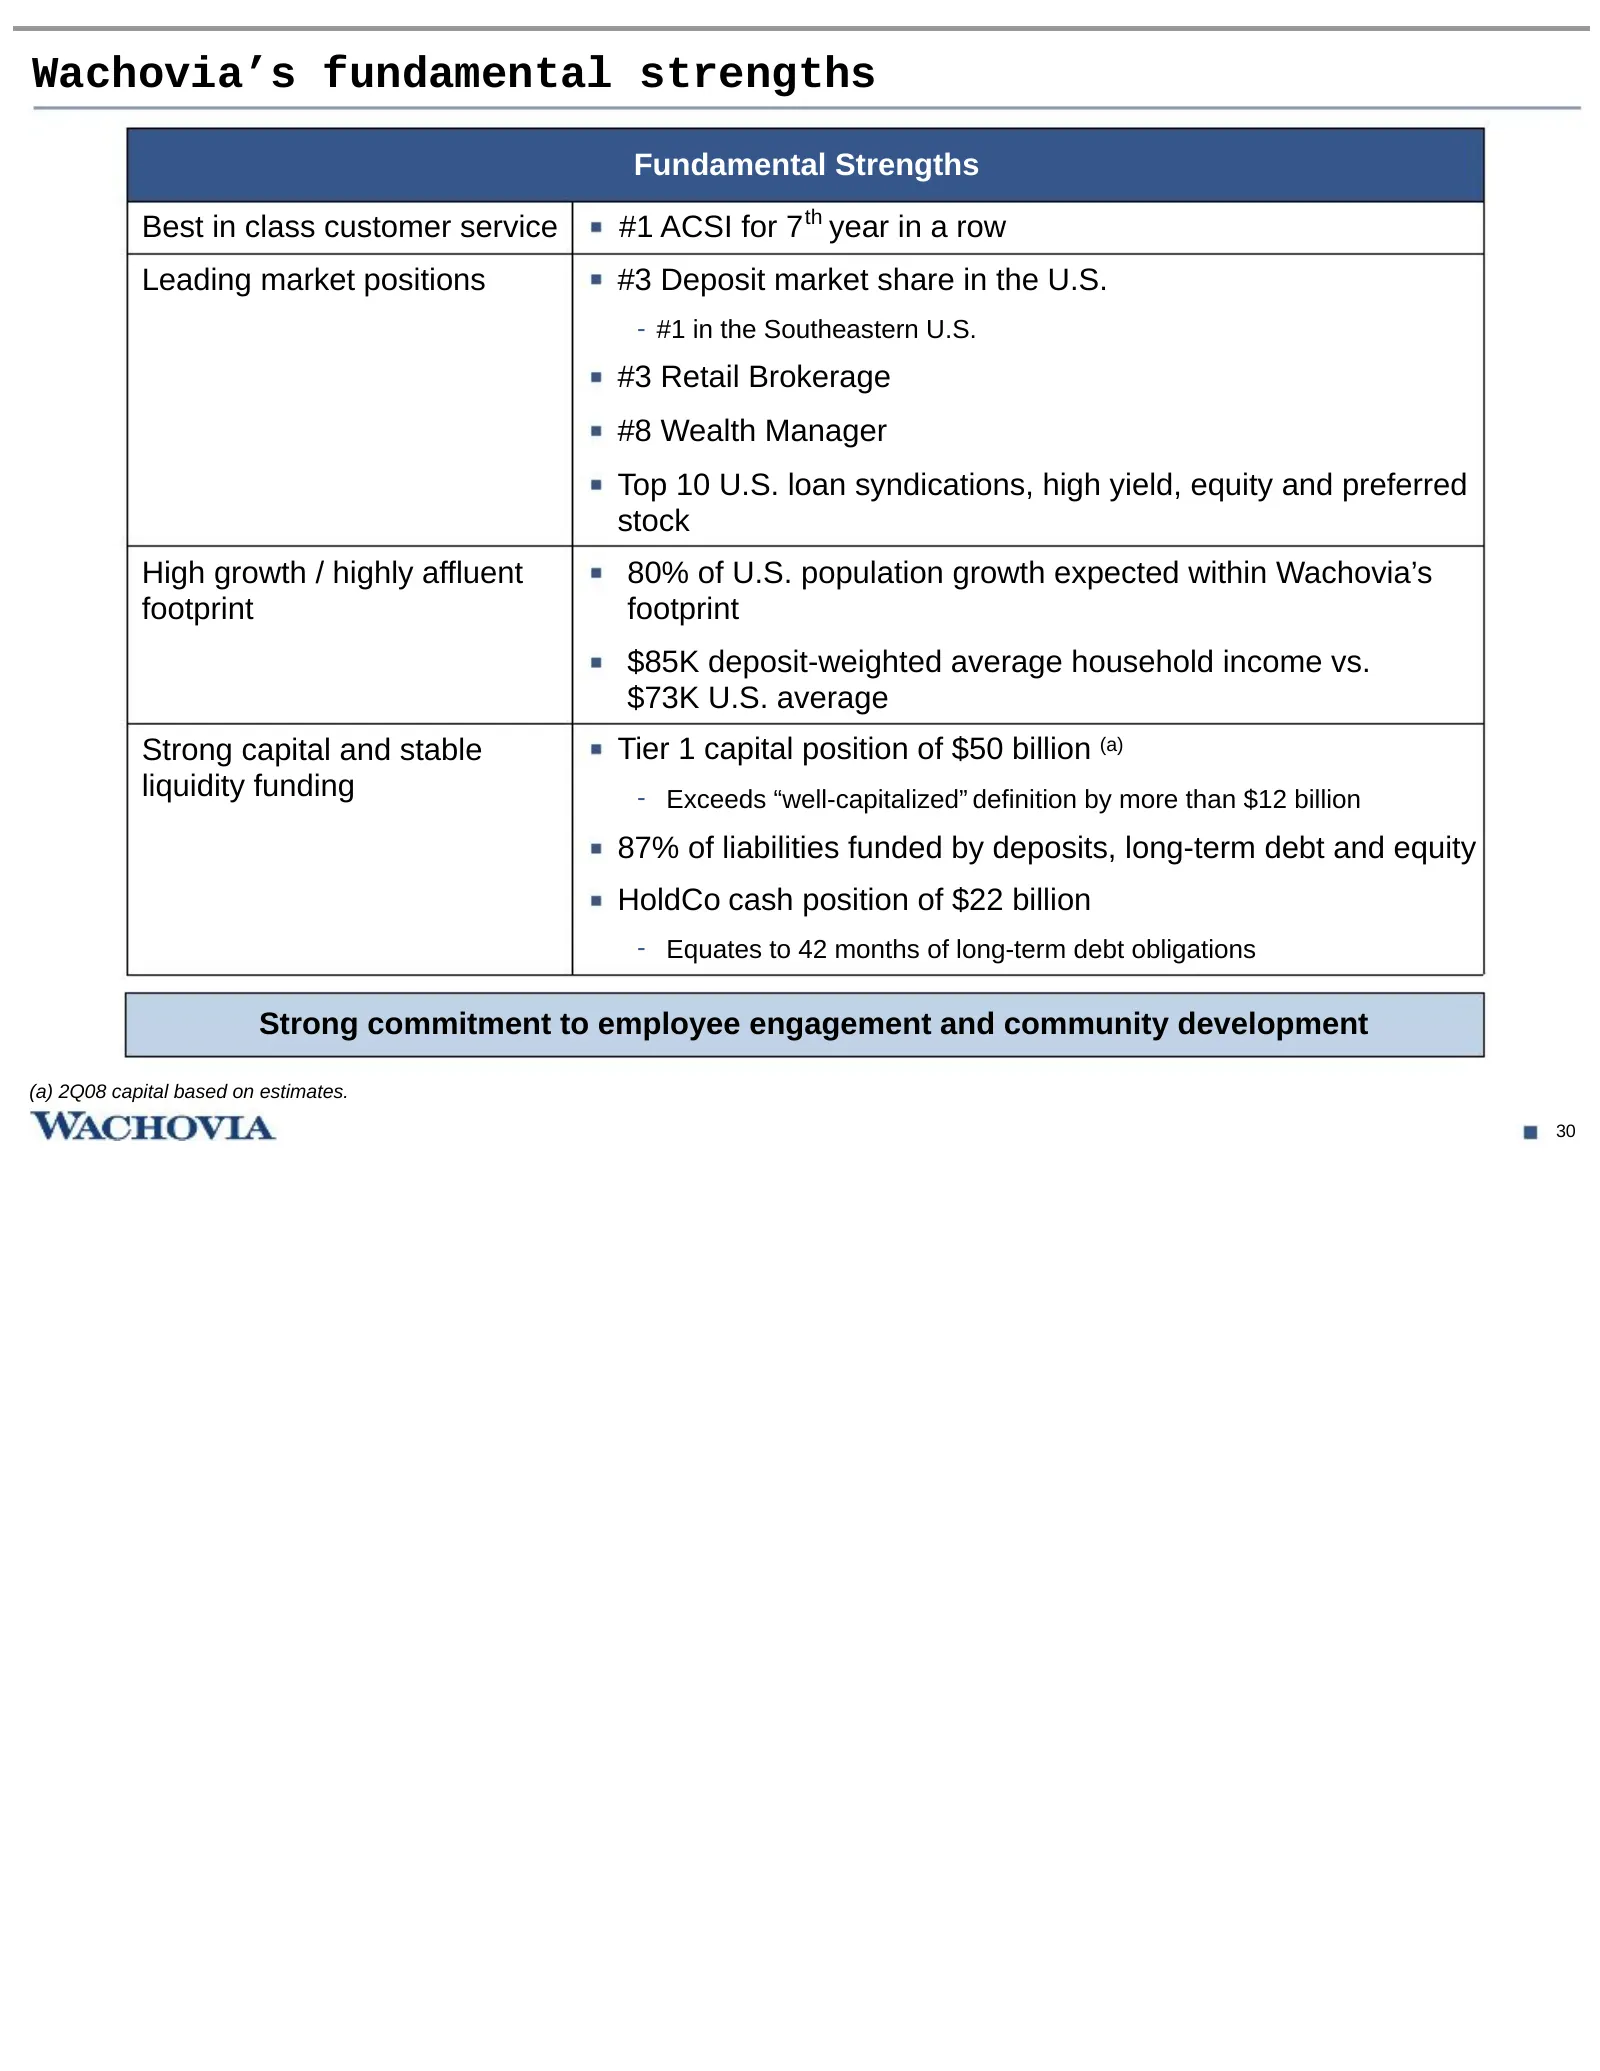
Wachovia’s fundamental strengths Fundamental Strengths Best in class customer service #1 ACSI for 7 th year in a row Leading market positions #3 Deposit market share in the U.S. - #1 in the Southeastern U.S. #3 Retail Brokerage #8 Wealth Manager Top 10 U.S. loan syndications, high yield, equity and
Slide 32: General Bank key metrics
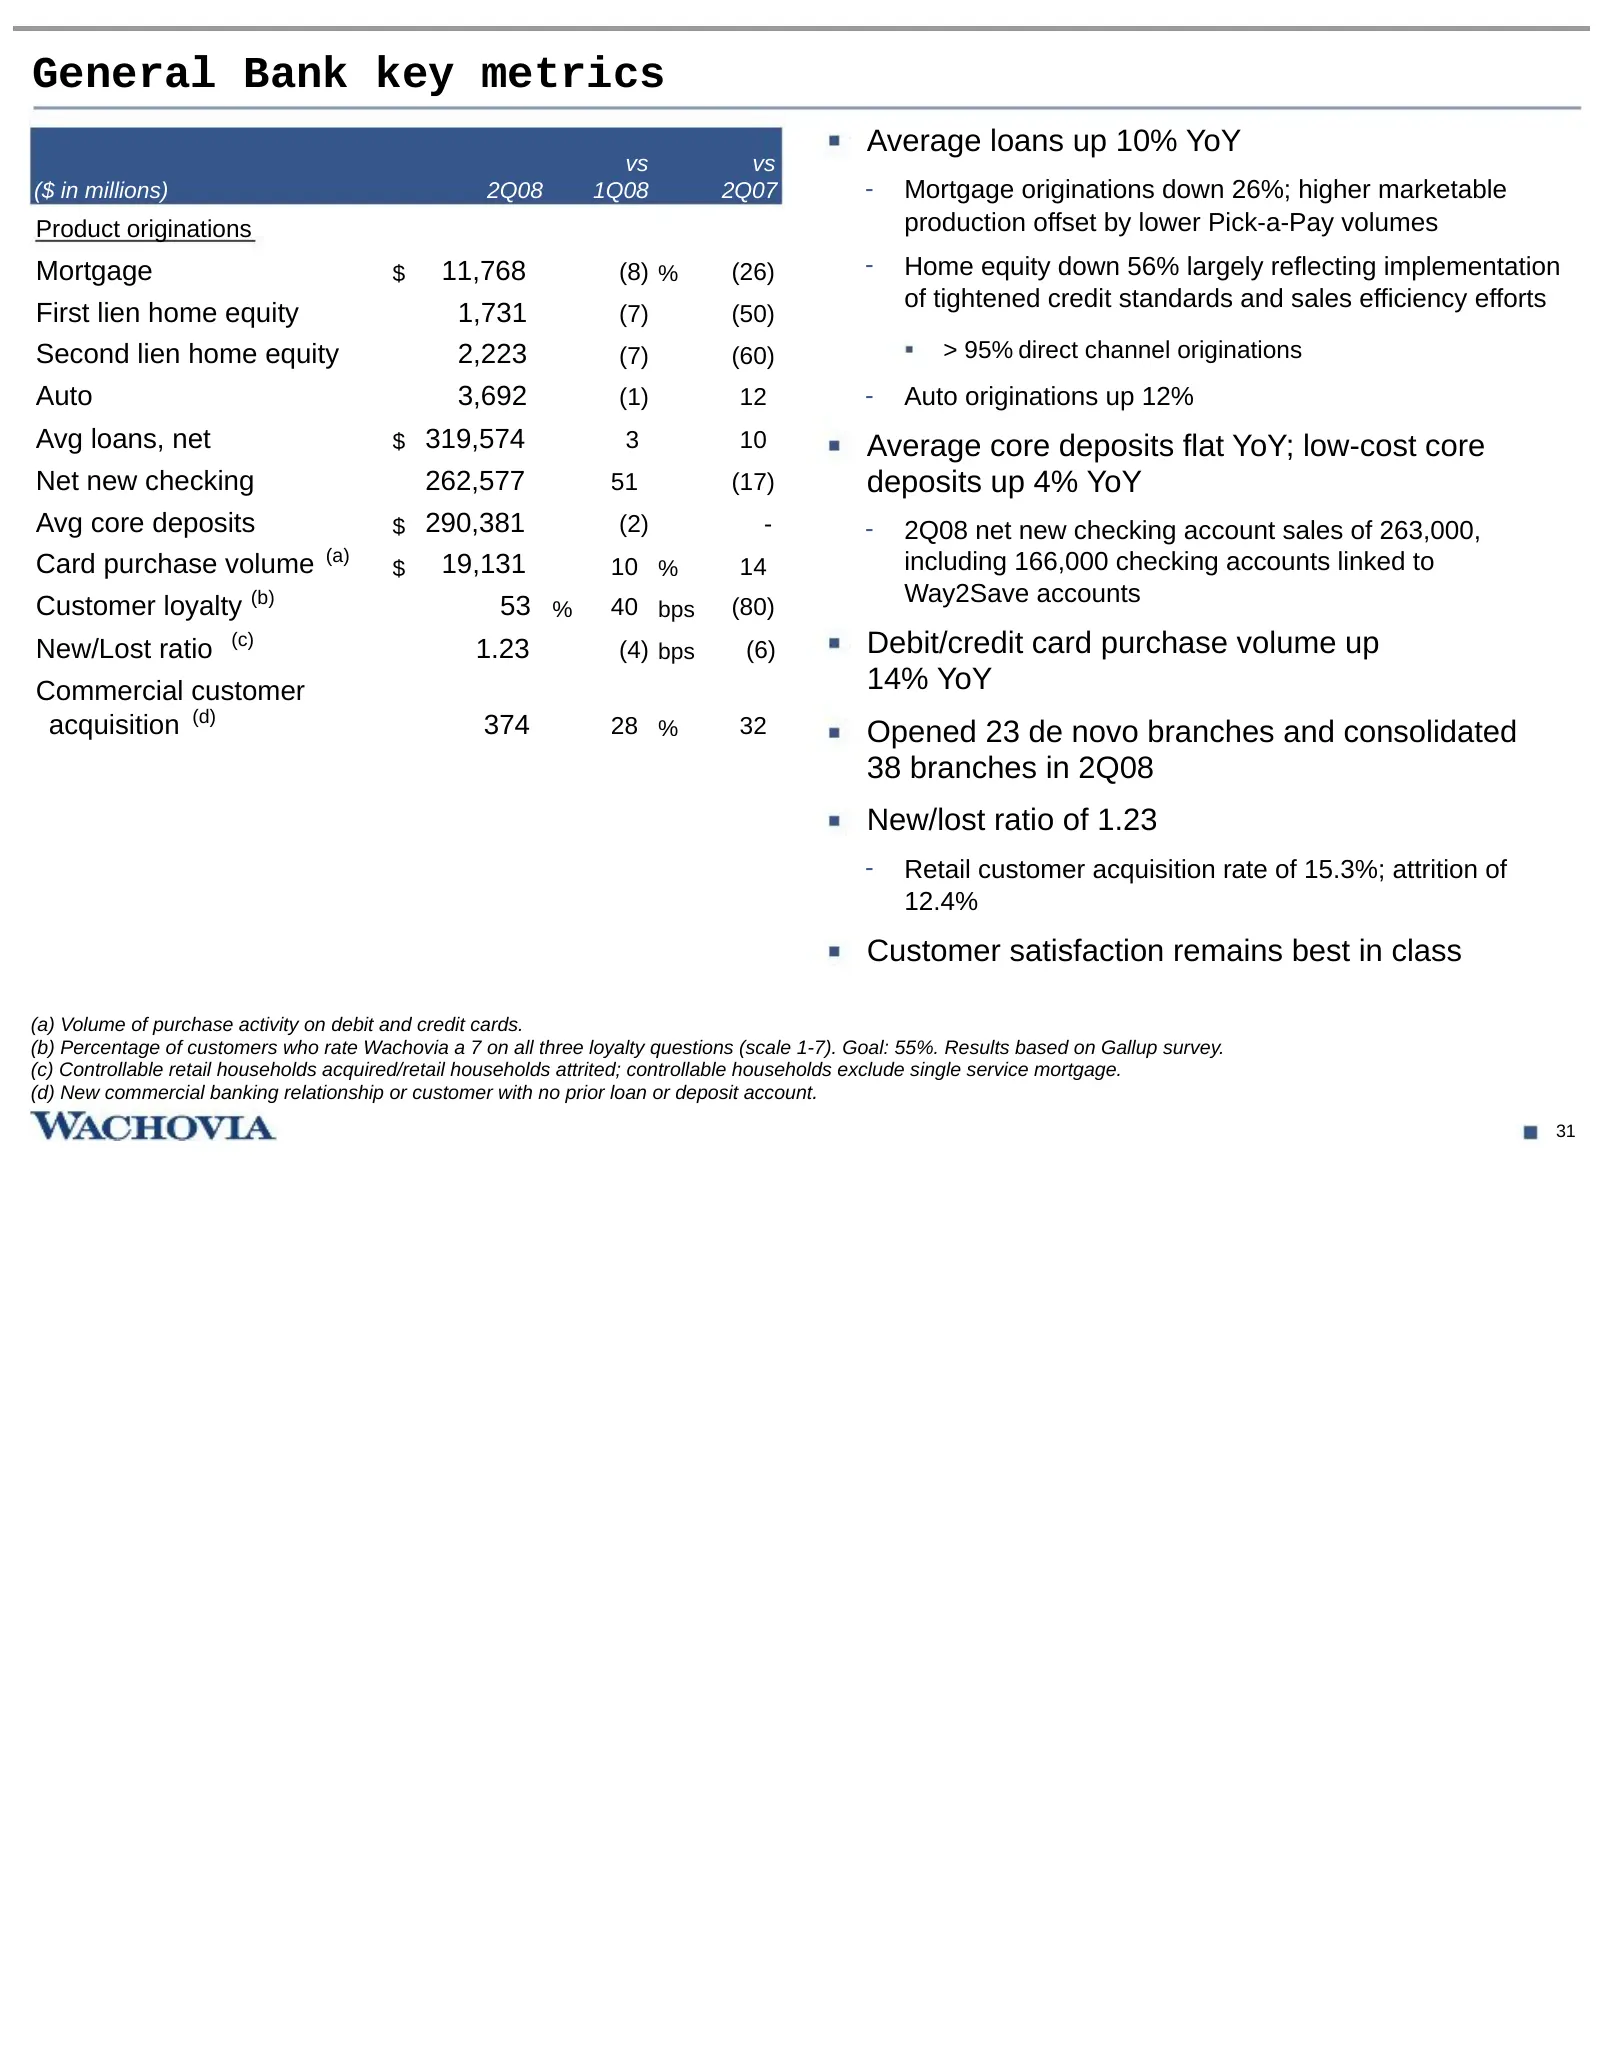
General Bank key metrics Average loans up 10% YoY vs vs ($ in millions) 2Q08 1Q08 2Q07 - Mortgage originations down 26%; higher marketable Product originations production offset by lower Pick-a-Pay volumes Mortgage $ 11,768 (8) % (26) - Home equity down 56% largely reflecting implementation of tight
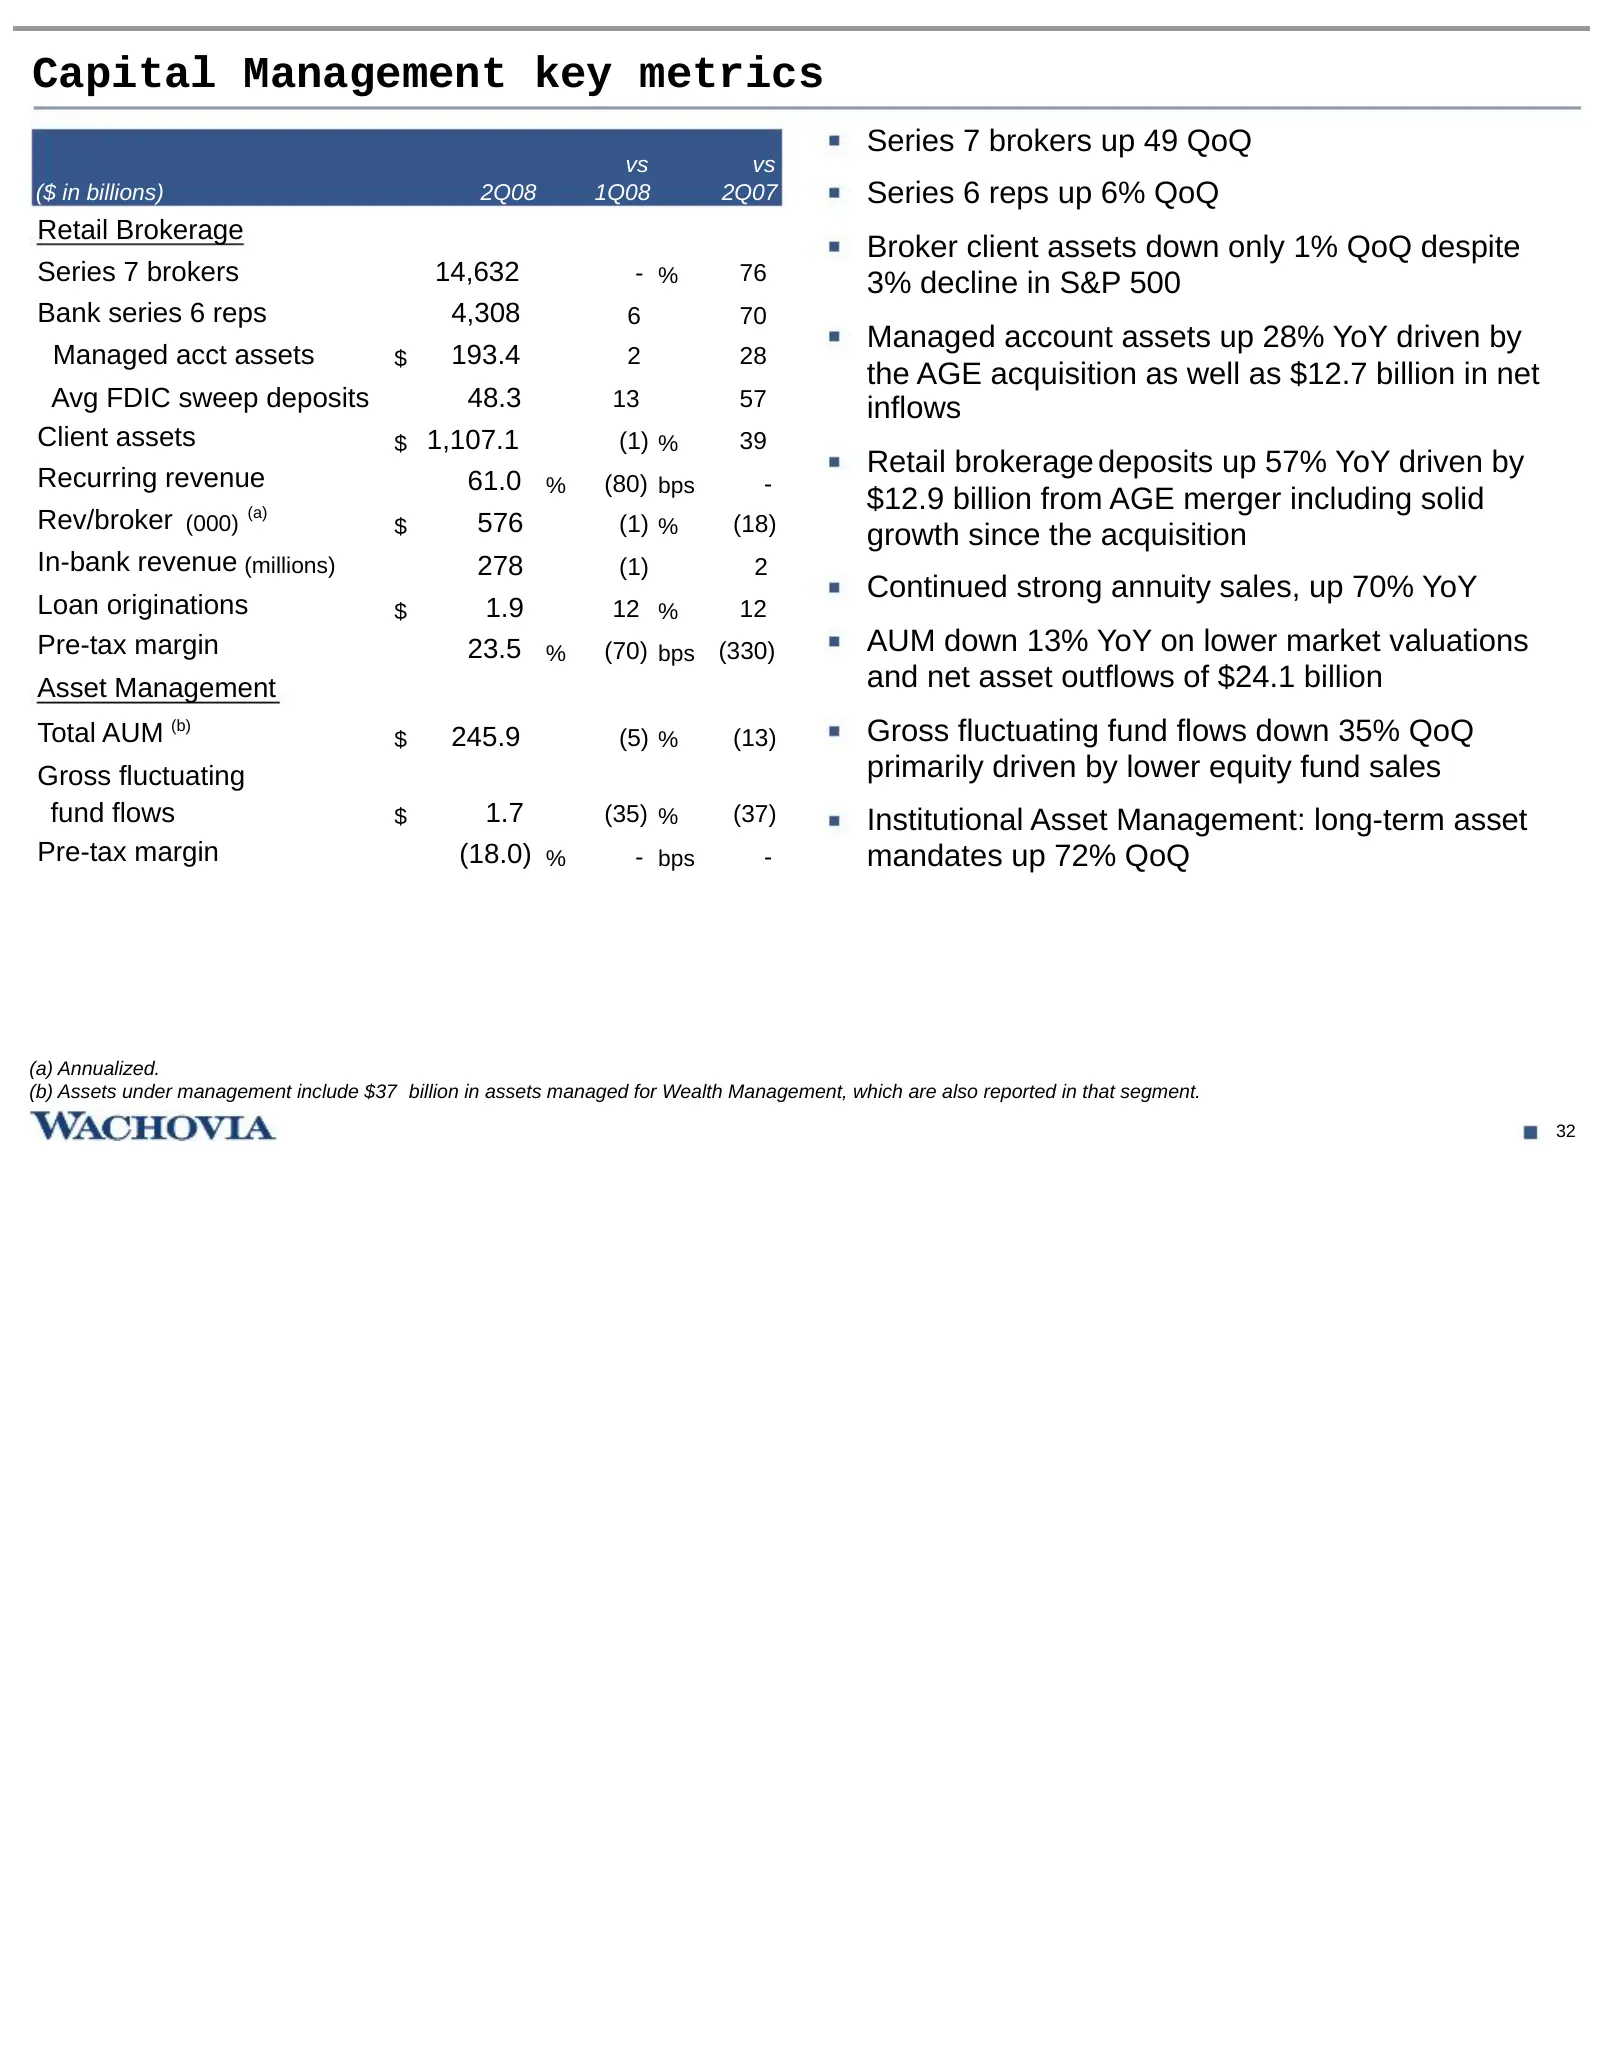
Slide 33: Capital Management key metrics
Capital Management key metrics Series 7 brokers up 49 QoQ vs vs ($ in billions) 2Q08 1Q08 2Q07 Series 6 reps up 6% QoQ Retail Brokerage Broker client assets down only 1% QoQ despite Series 7 brokers 14,632 - % 76 3% decline in S&P 500 Bank series 6 reps 4,308 6 70 Managed account assets up 28% YoY d
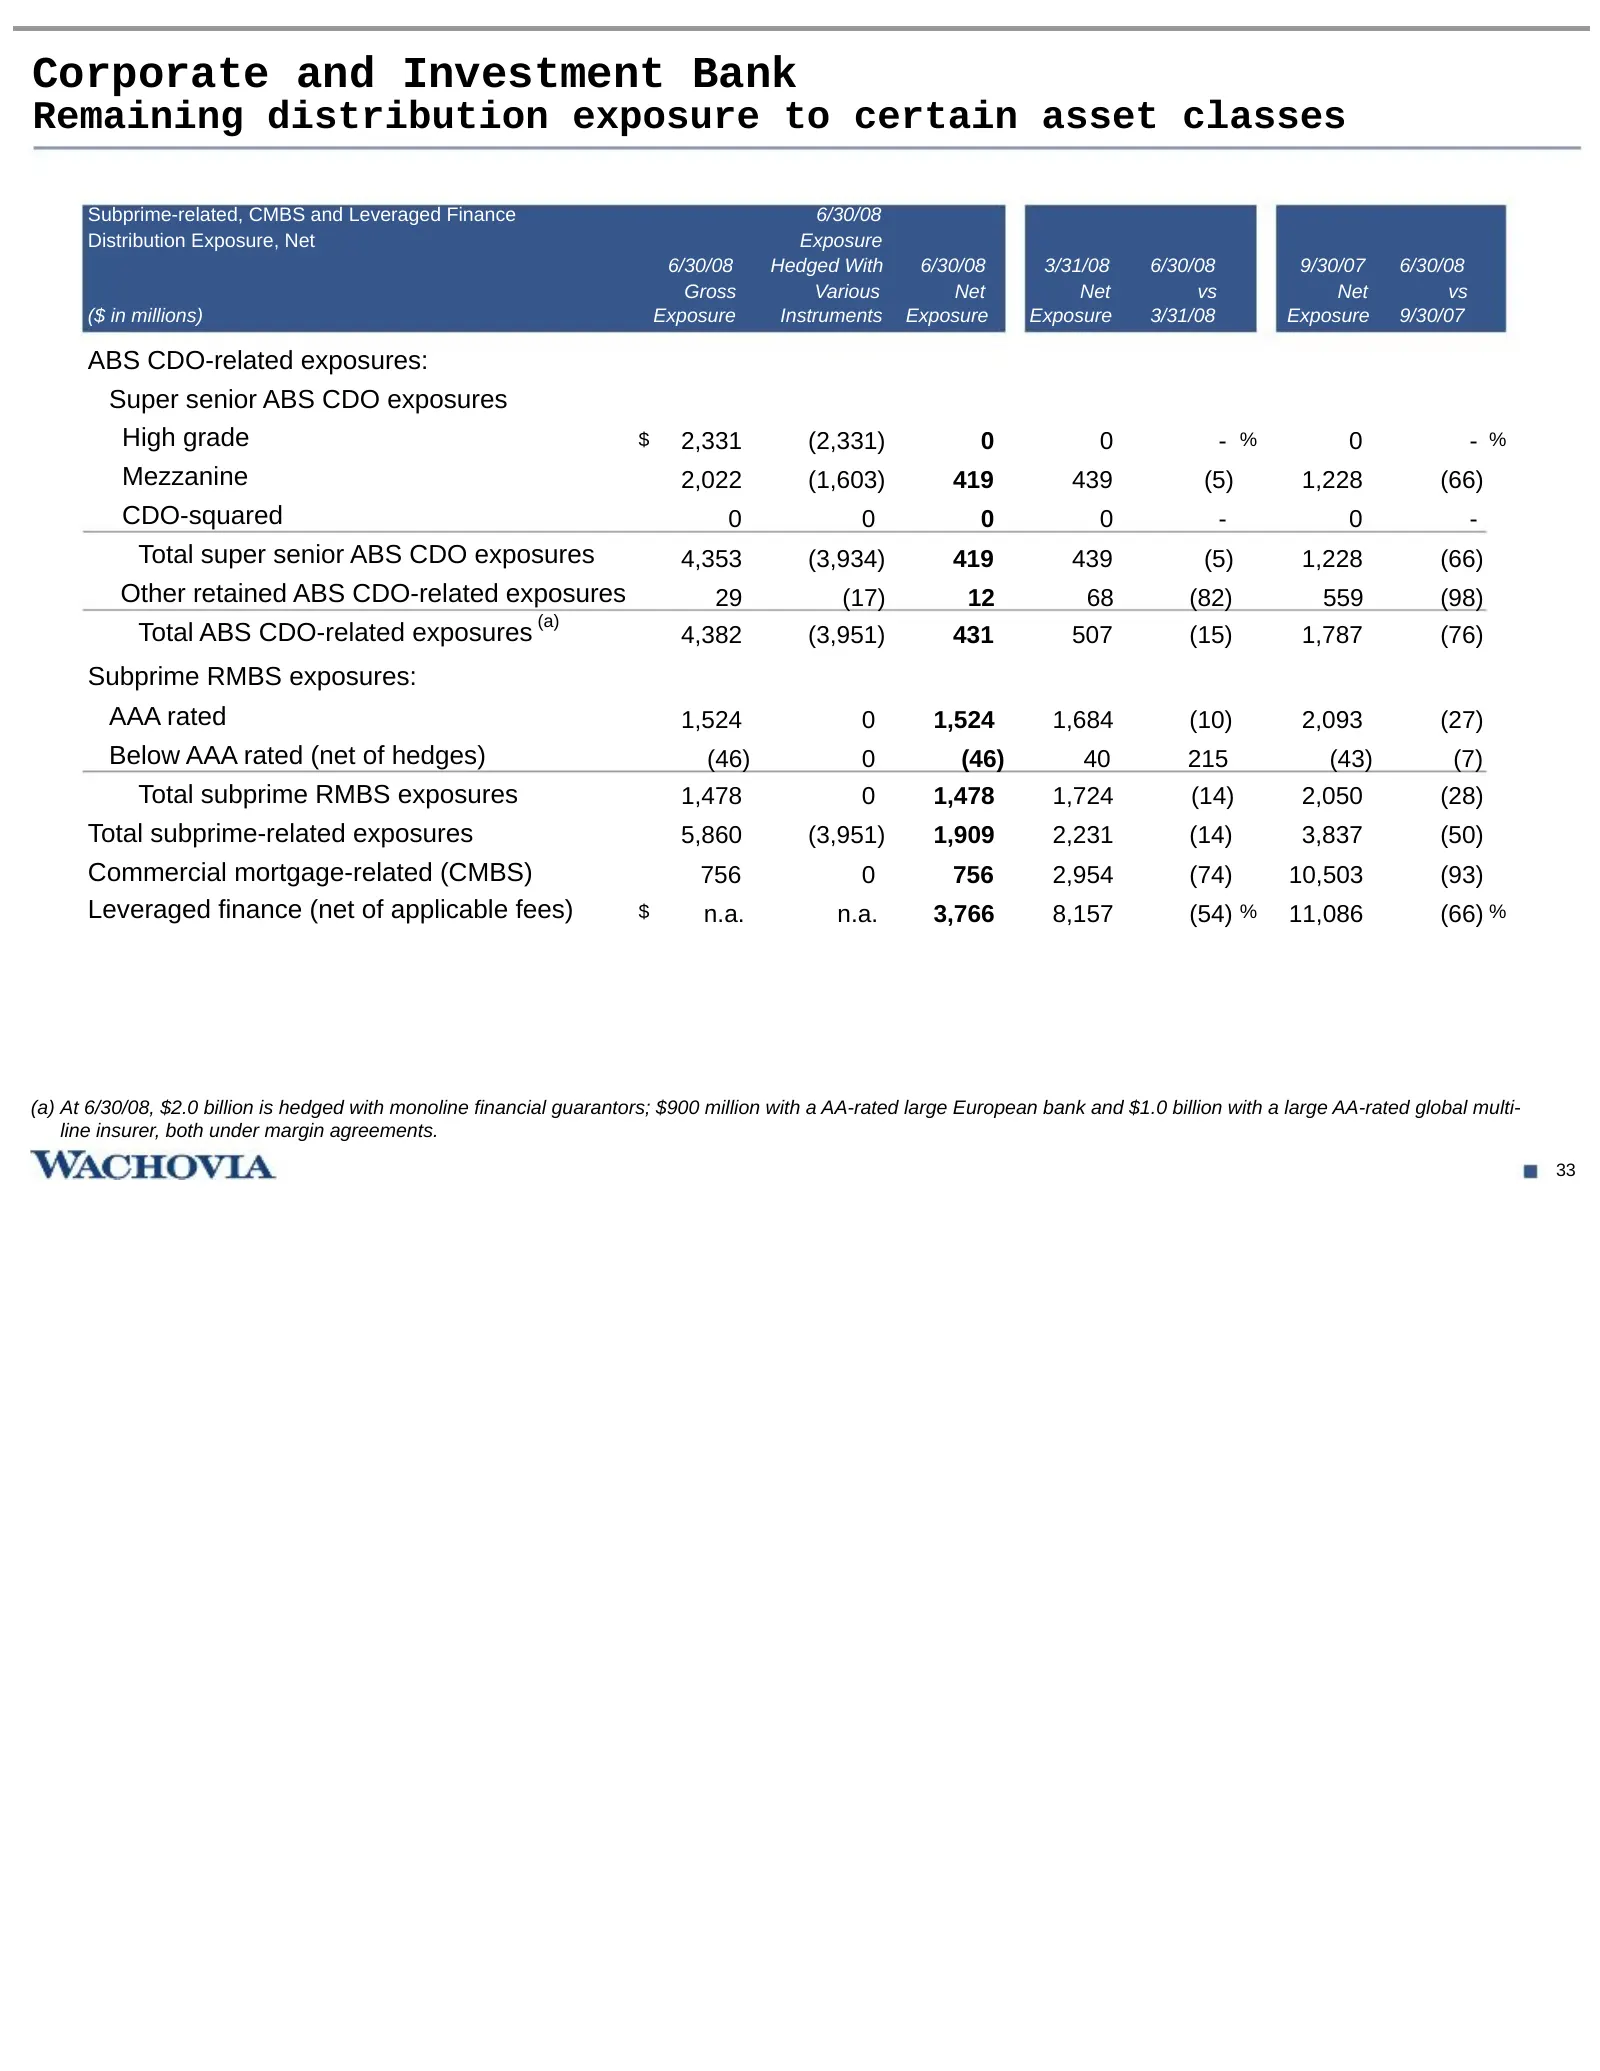
Slide 34: Corporate and Investment Bank
Corporate and Investment Bank Remaining distribution exposure to certain asset classes Subprime-related, CMBS and Leveraged Finance 6/30/08 Distribution Exposure, Net Exposure 6/30/08 Hedged With 6/30/08 3/31/08 6/30/08 9/30/07 6/30/08 Gross Various Net Net vs Net vs ($ in millions) Exposure Instrum
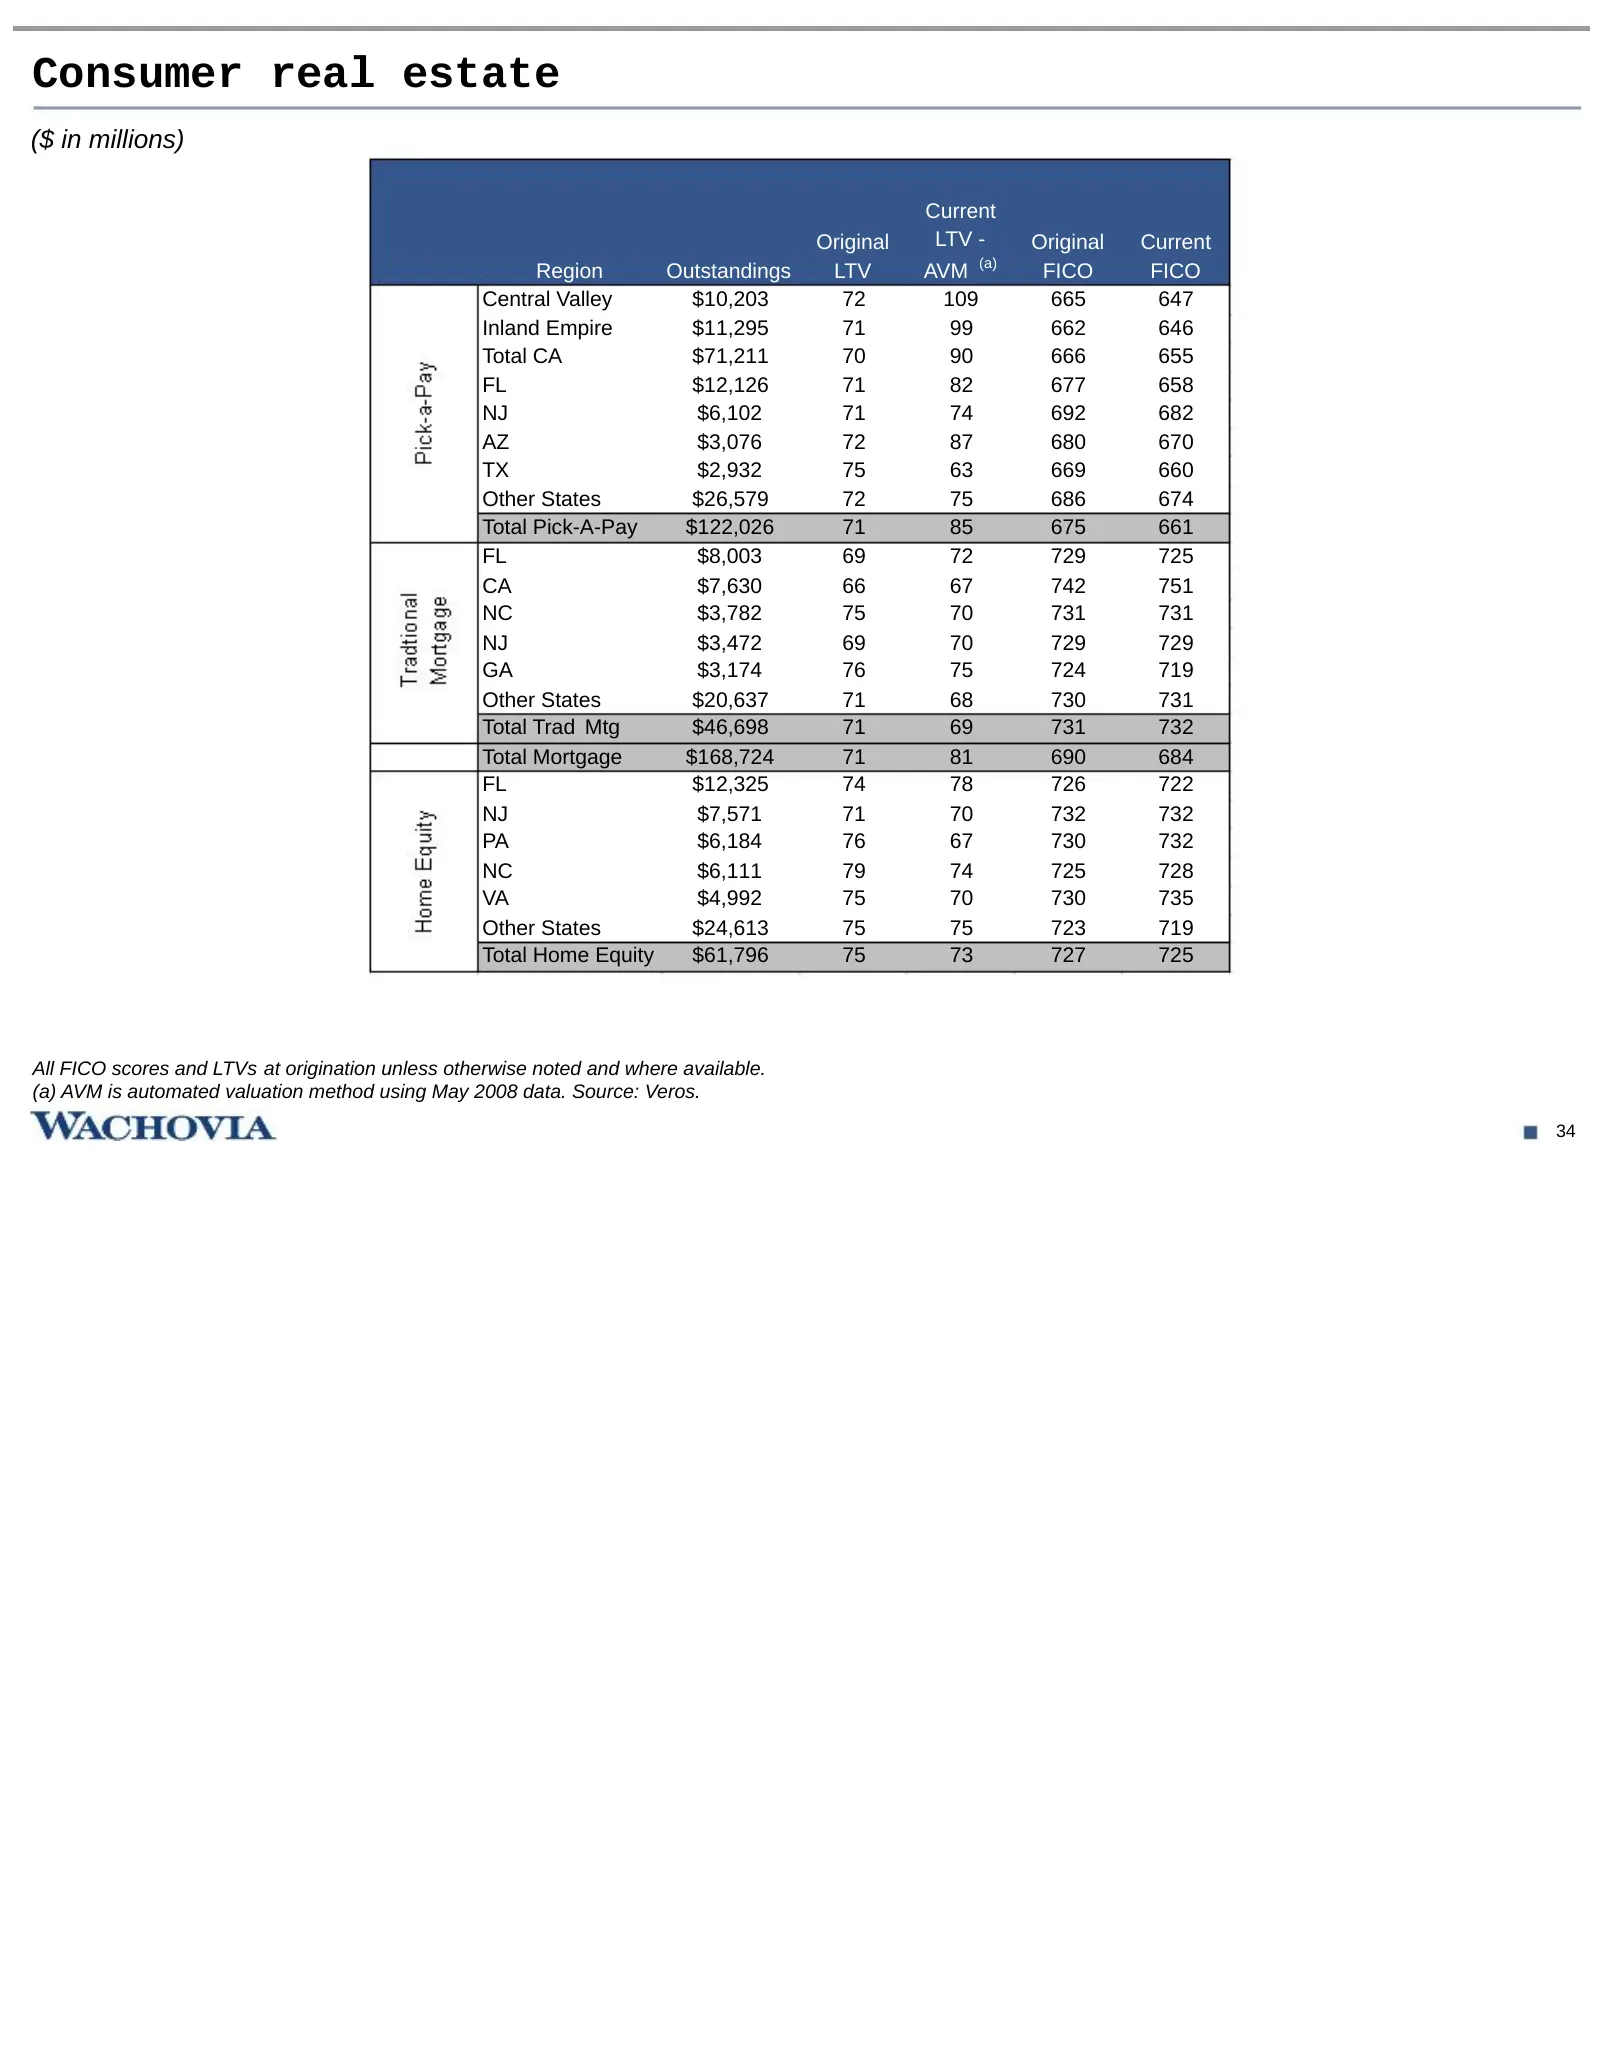
Slide 35: Consumer real estate
Consumer real estate ($ in millions) Current Original LTV - Original Current Region Outstandings LTV AVM (a) FICO FICO Central Valley $10,203 72 109 665 647 Inland Empire $11,295 71 99 662 646 Total CA $71,211 70 90 666 655 FL $12,126 71 82 677 658 NJ $6,102 71 74 692 682 AZ $3,076 72 87 680 670 TX
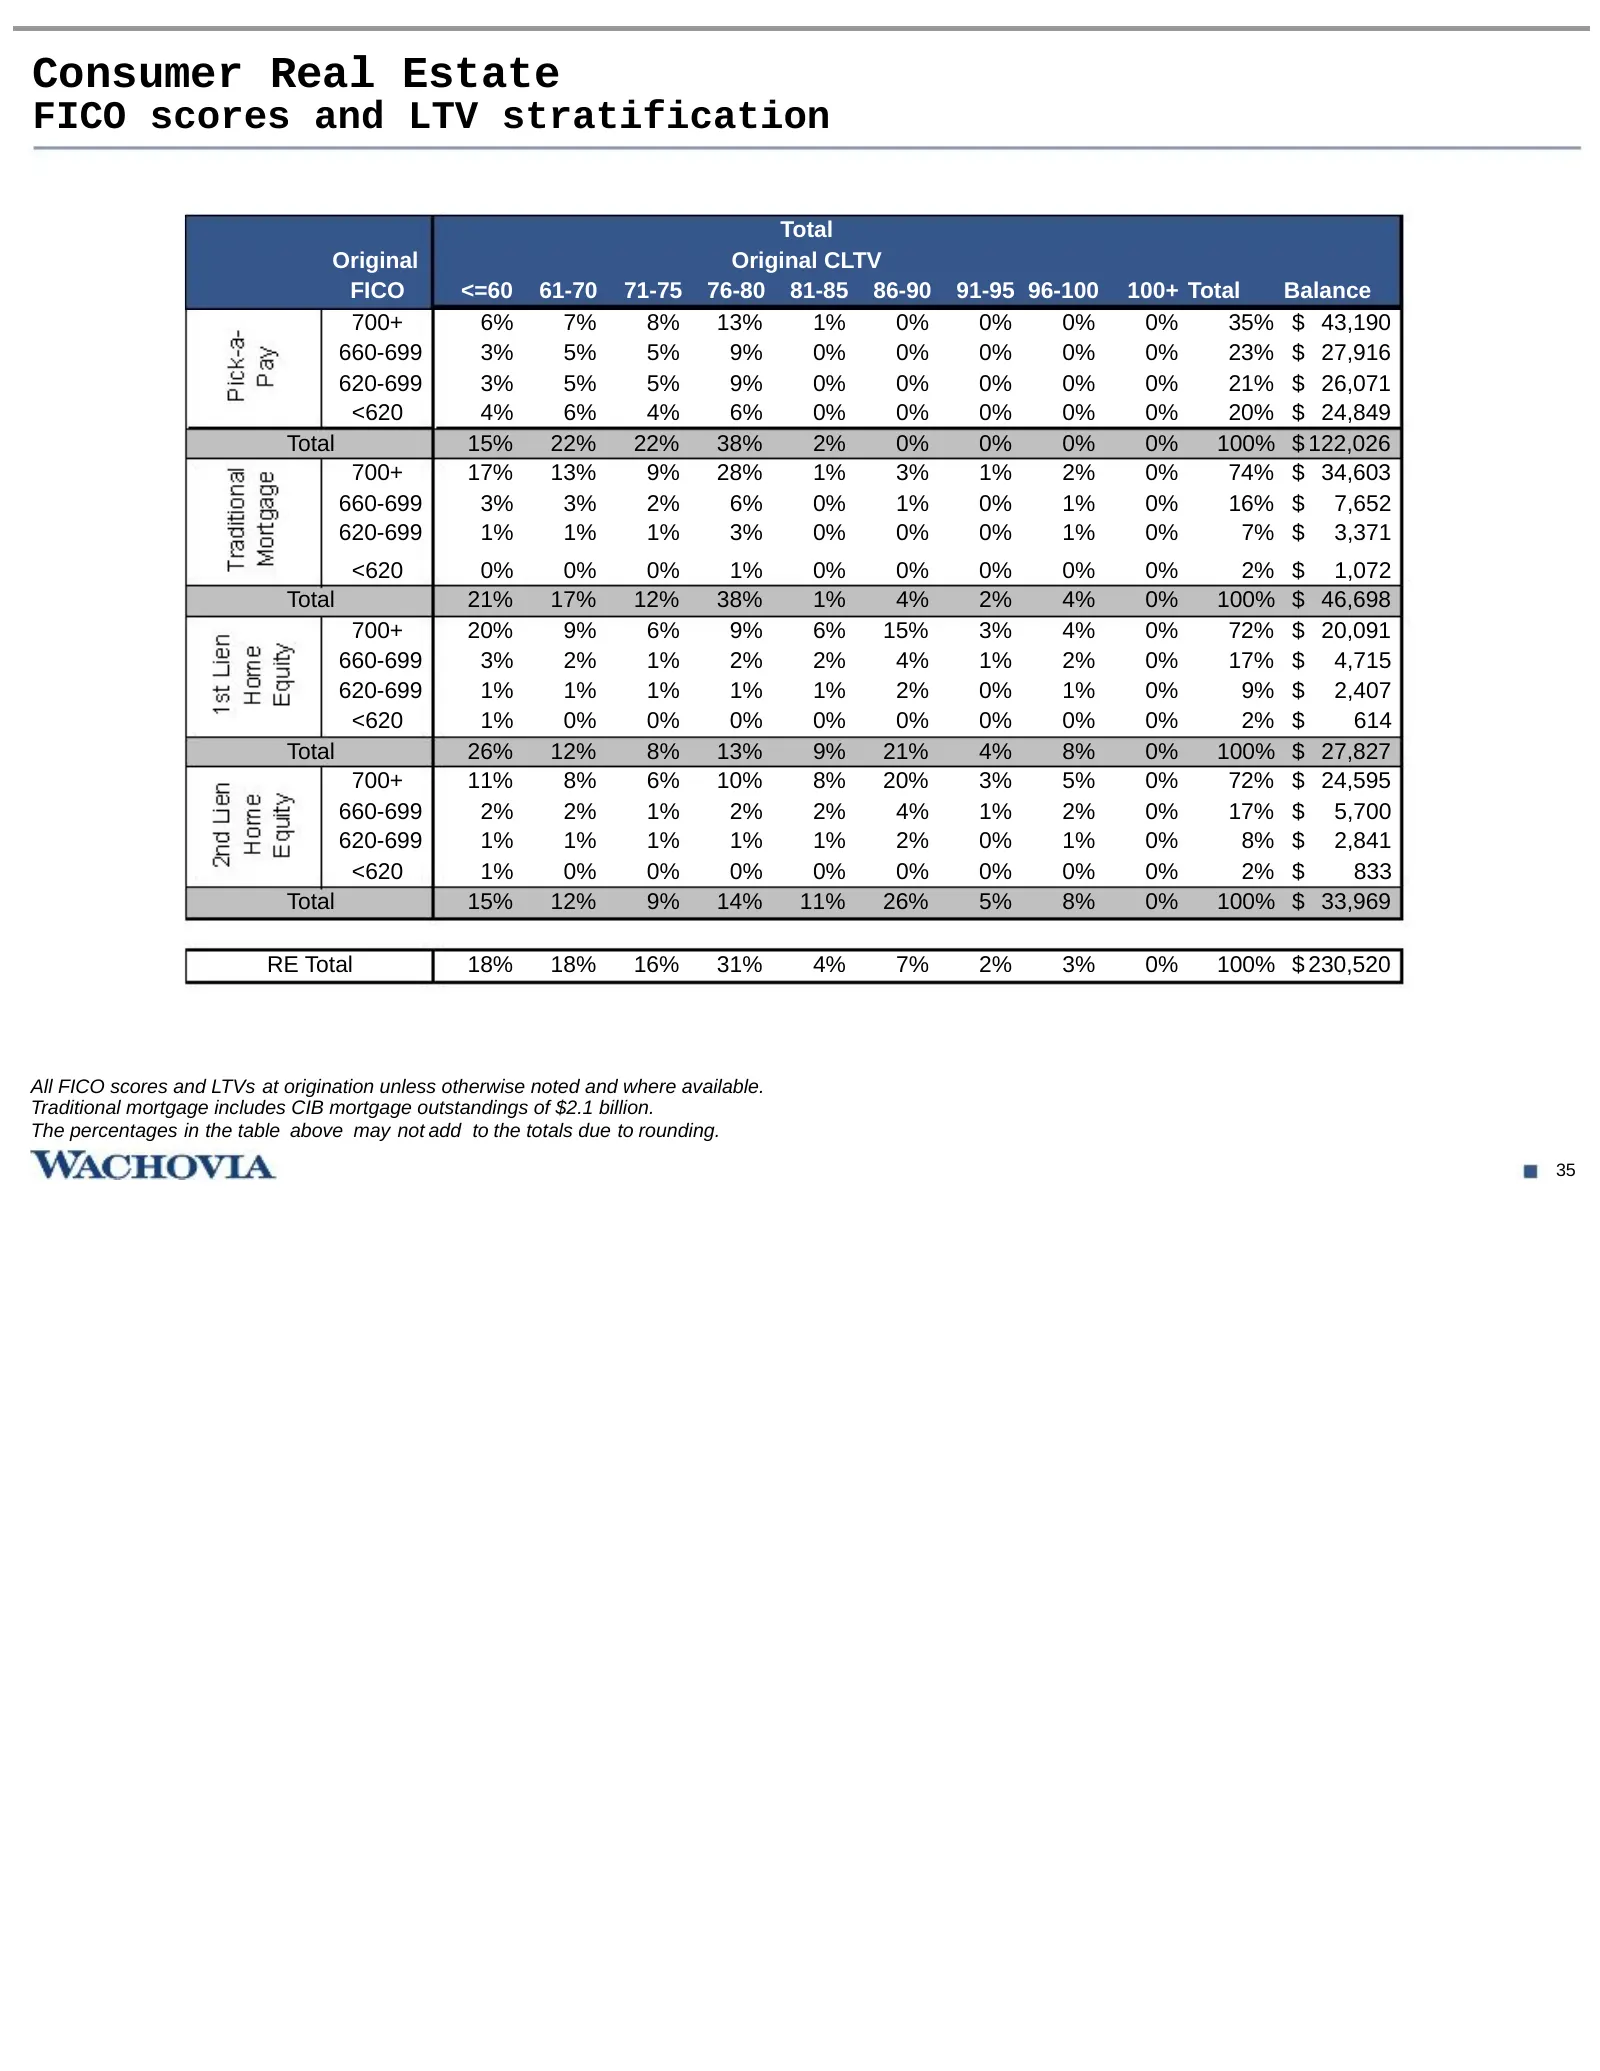
Slide 36: Consumer Real Estate FICO scores and LTV stratification
Consumer Real Estate FICO scores and LTV stratification Total Original Original CLTV FICO <=60 61-70 71-75 76-80 81-85 86-90 91-95 96-100 100+ Total Balance 700+ 6% 7% 8% 13% 1% 0% 0% 0% 0% 35% $ 43,190 660-699 3% 5% 5% 9% 0% 0% 0% 0% 0% 23% $ 27,916 620-699 3% 5% 5% 9% 0% 0% 0% 0% 0% 21% $ 26,071 <
Slide 37: Consumer Real Estate FICO scores and LTV stratification
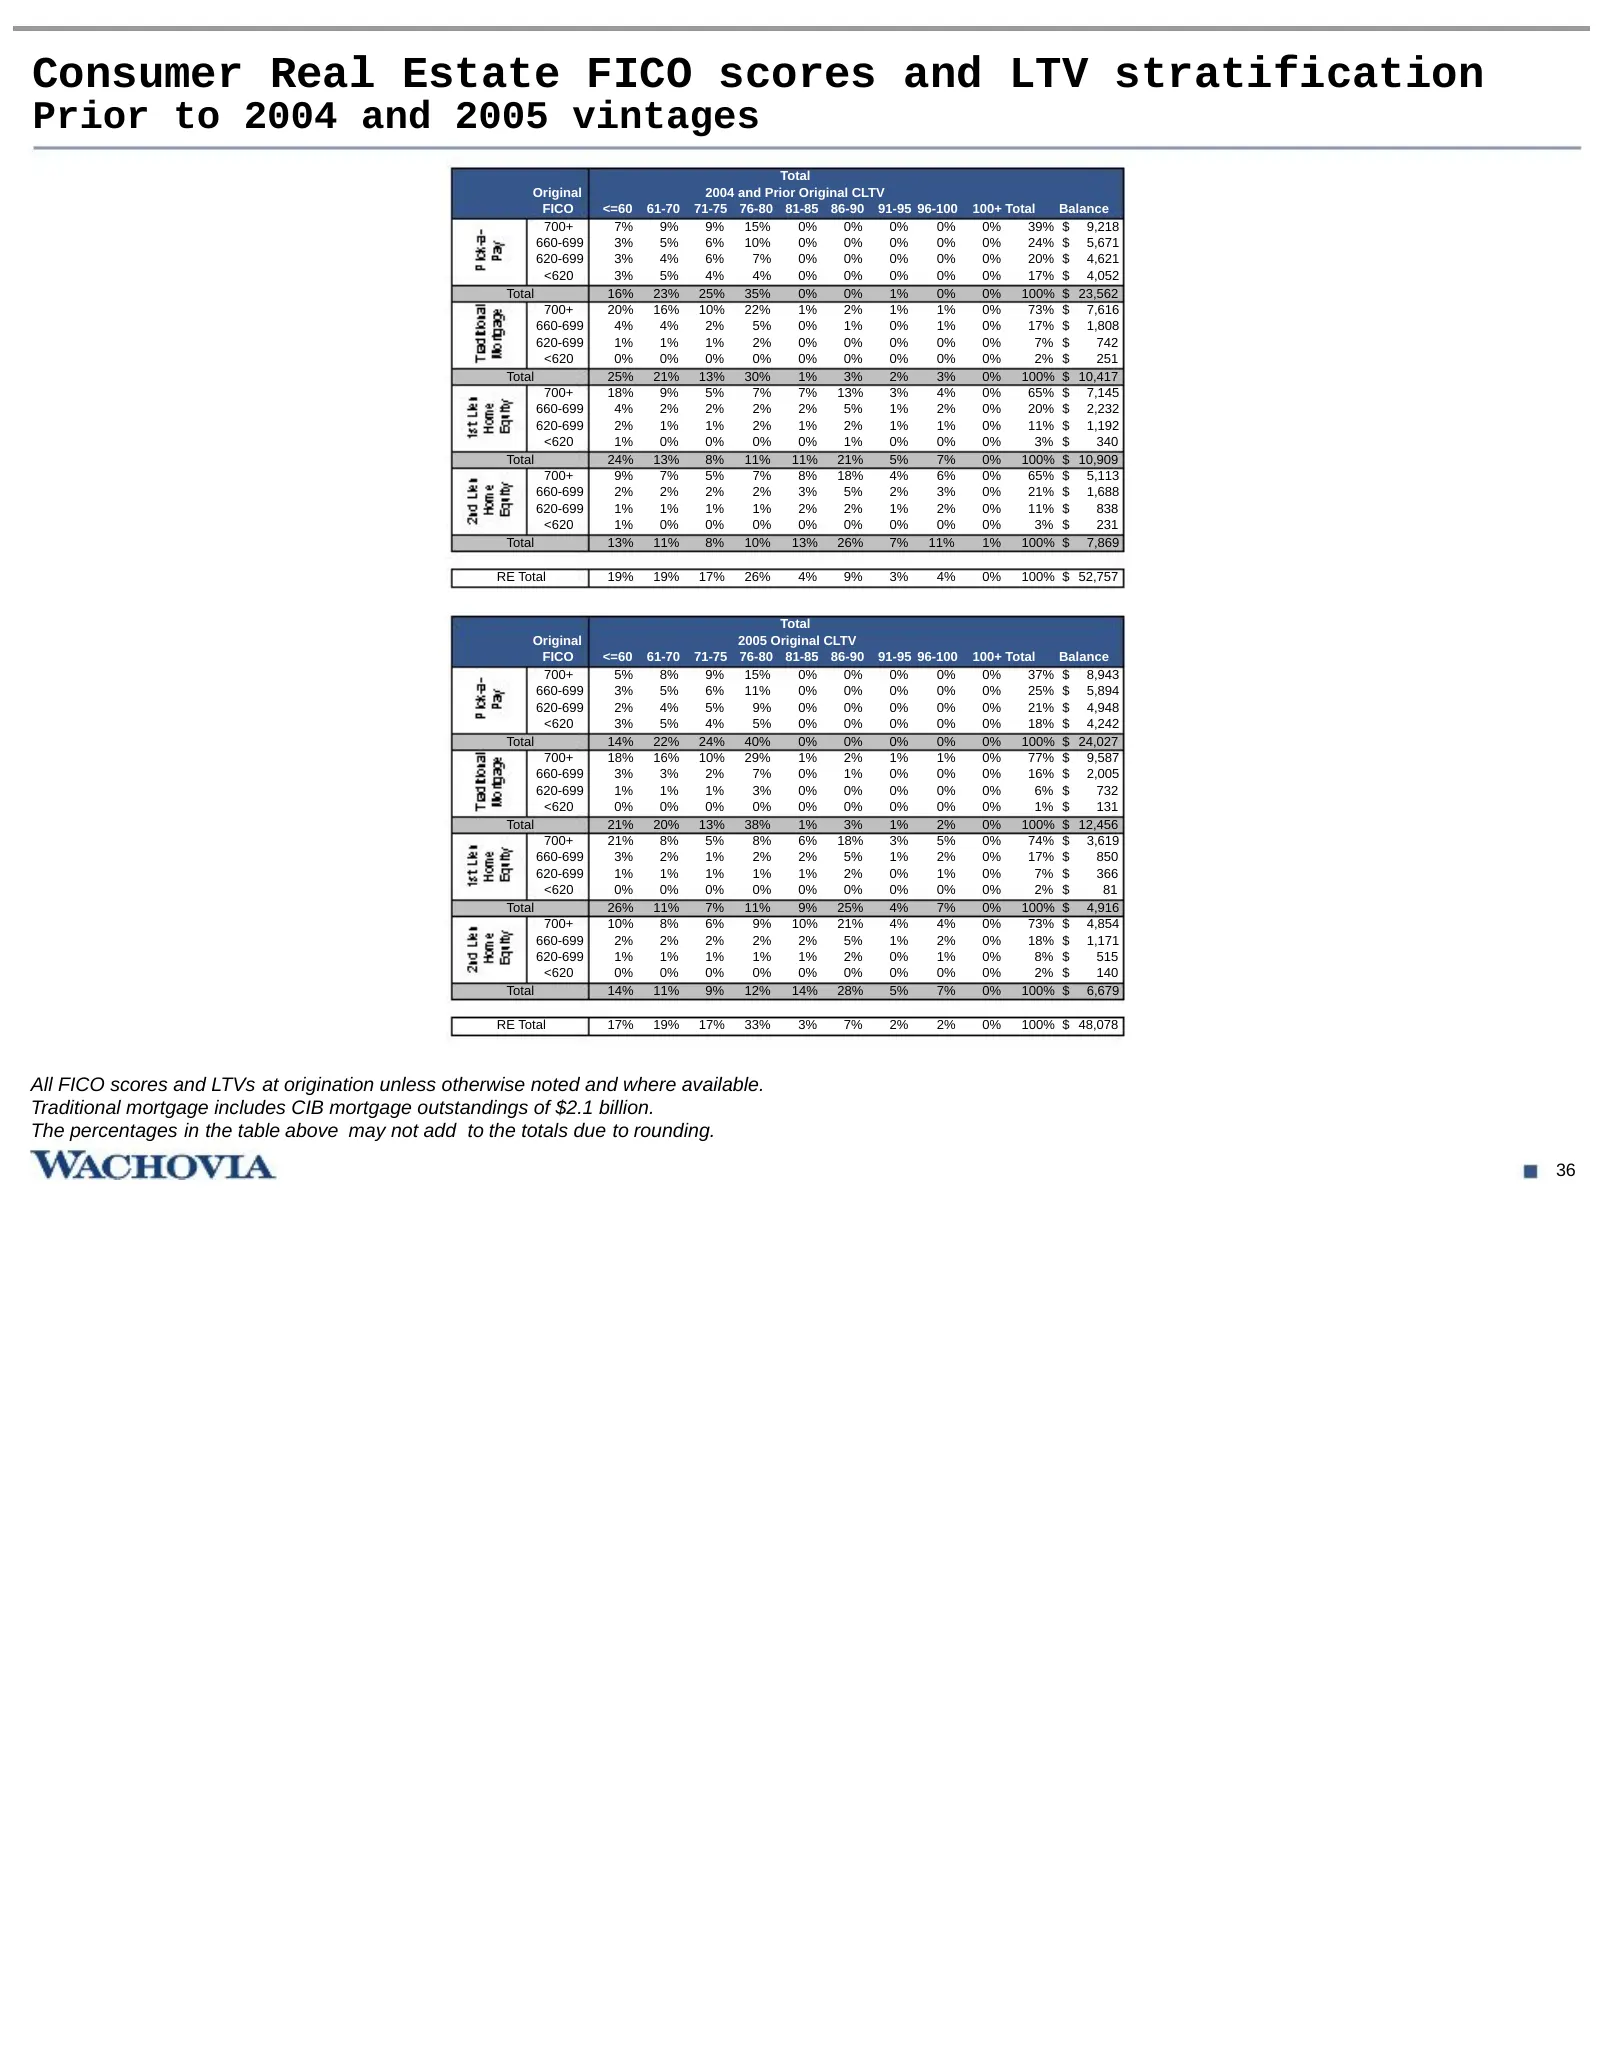
Consumer Real Estate FICO scores and LTV stratification Prior to 2004 and 2005 vintages Total Original 2004 and Prior Original CLTV FICO <=60 61-70 71-75 76-80 81-85 86-90 91-95 96-100 100+ Total Balance 700+ 7% 9% 9% 15% 0% 0% 0% 0% 0% 39% $ 9,218 660-699 3% 5% 6% 10% 0% 0% 0% 0% 0% 24% $ 5,671 620
Slide 38: Consumer Real Estate FICO scores and LTV stratification
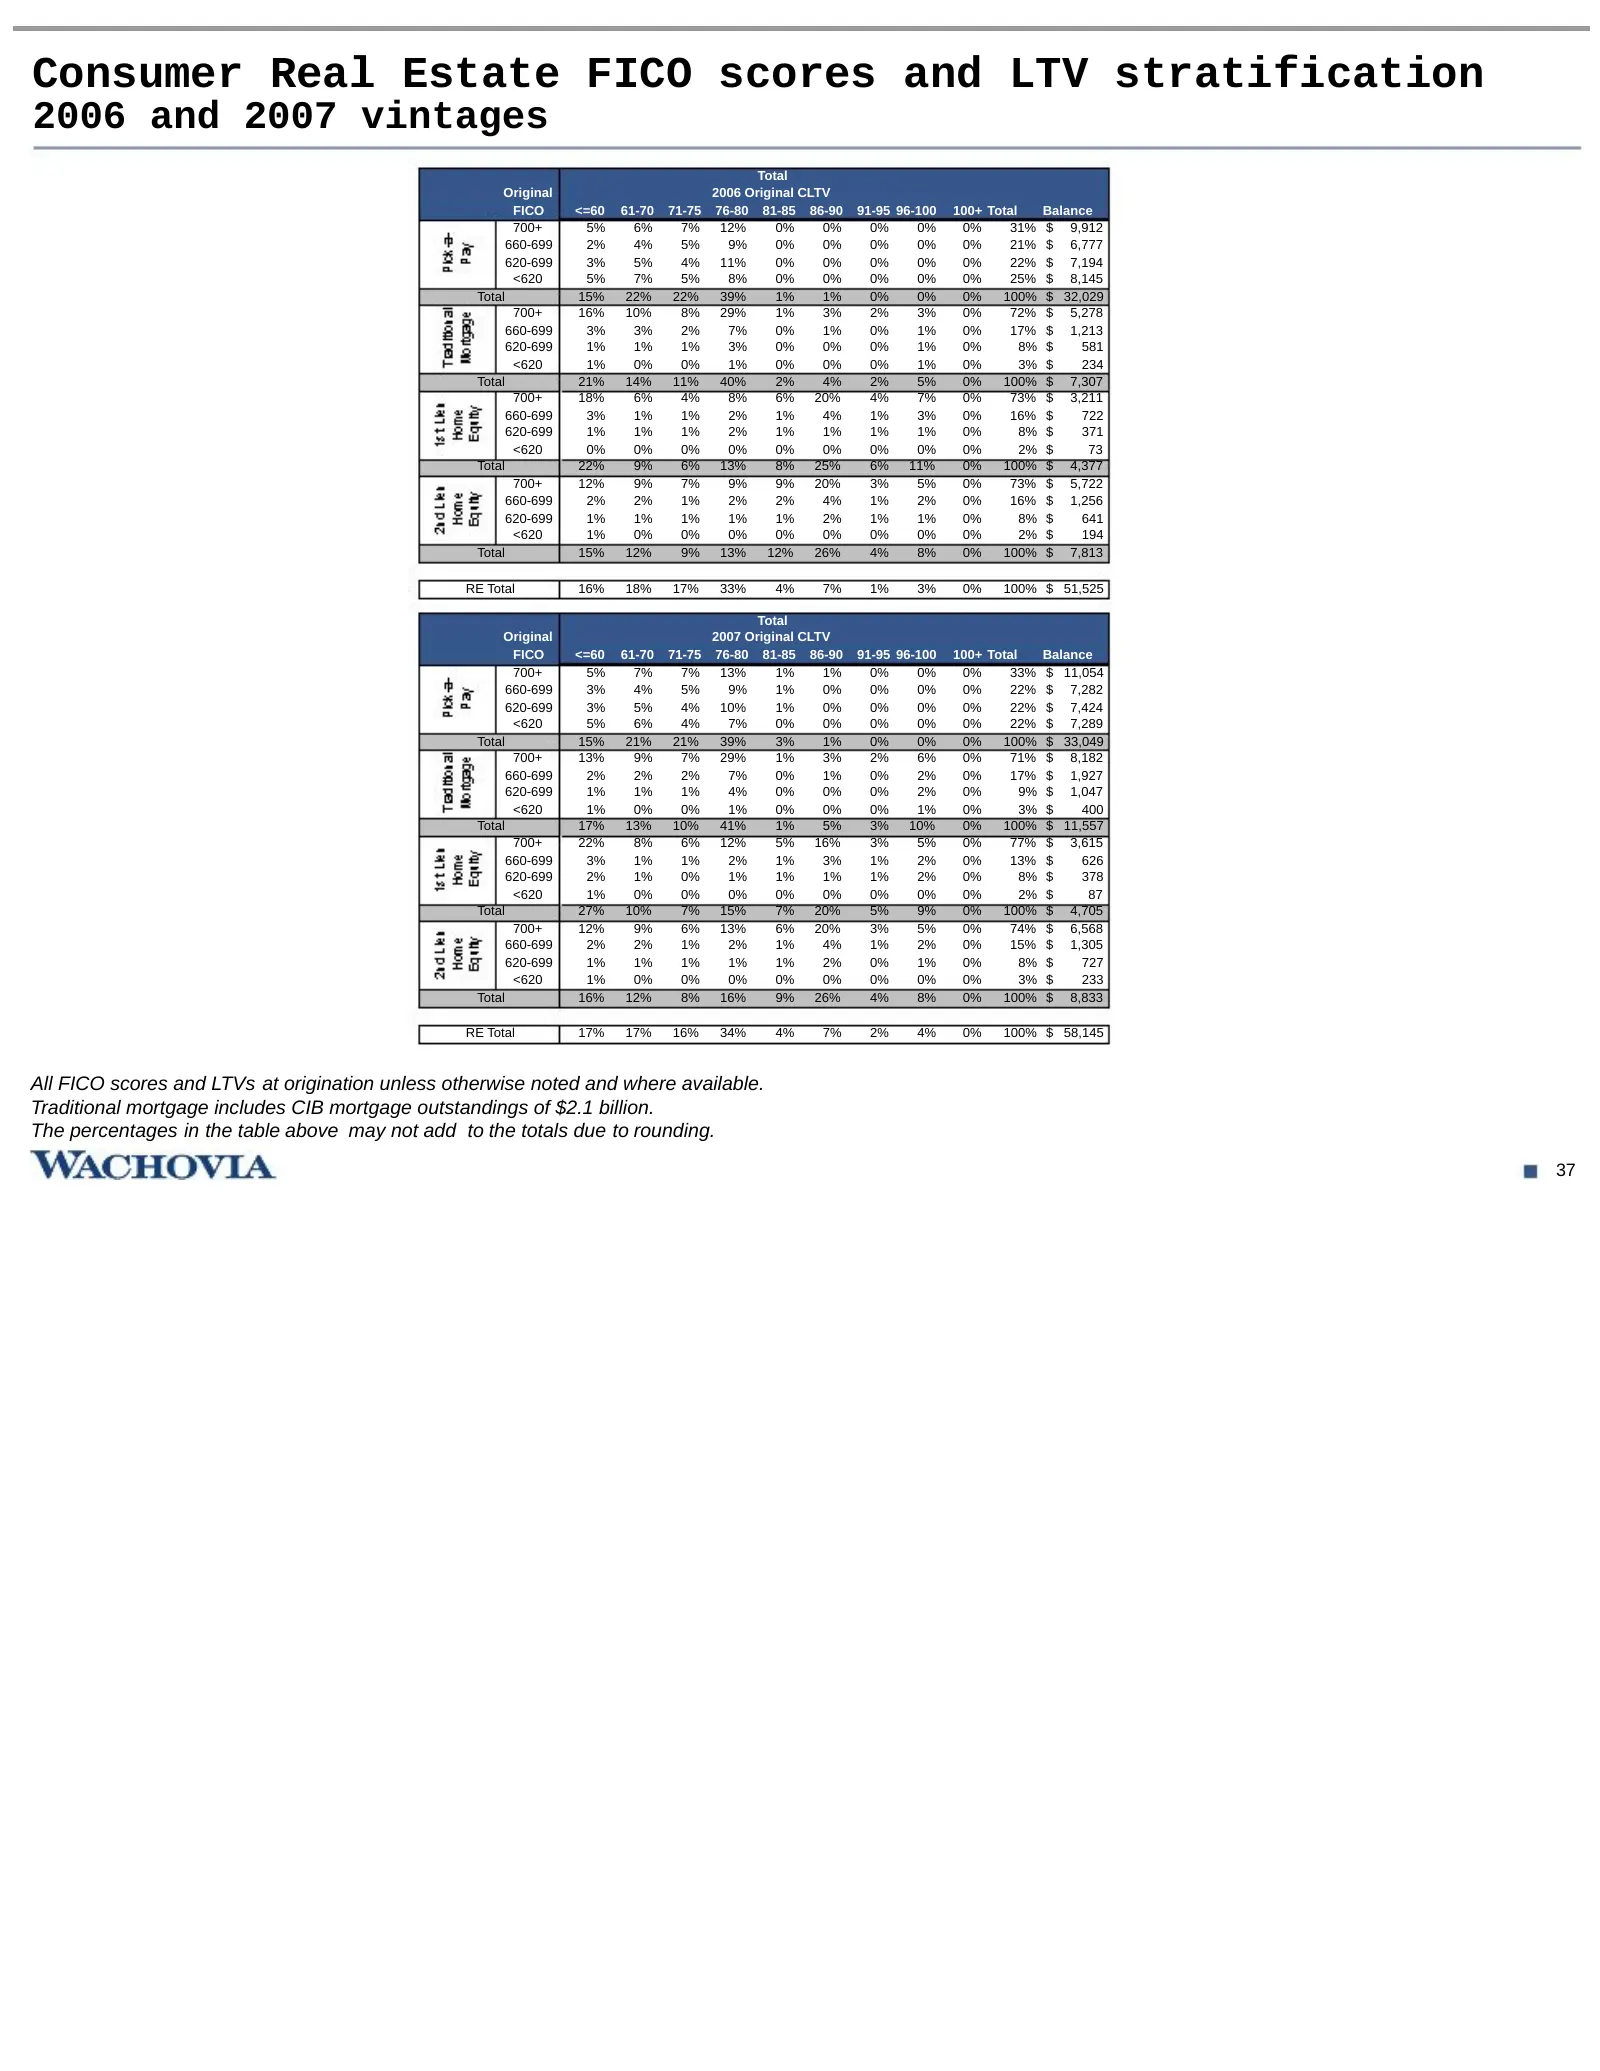
Consumer Real Estate FICO scores and LTV stratification 2006 and 2007 vintages Total Original 2006 Original CLTV FICO <=60 61-70 71-75 76-80 81-85 86-90 91-95 96-100 100+ Total Balance 700+ 5% 6% 7% 12% 0% 0% 0% 0% 0% 31% $ 9,912 660-699 2% 4% 5% 9% 0% 0% 0% 0% 0% 21% $ 6,777 620-699 3% 5% 4% 11% 0%
Slide 39: Consumer Real Estate FICO scores and LTV stratification
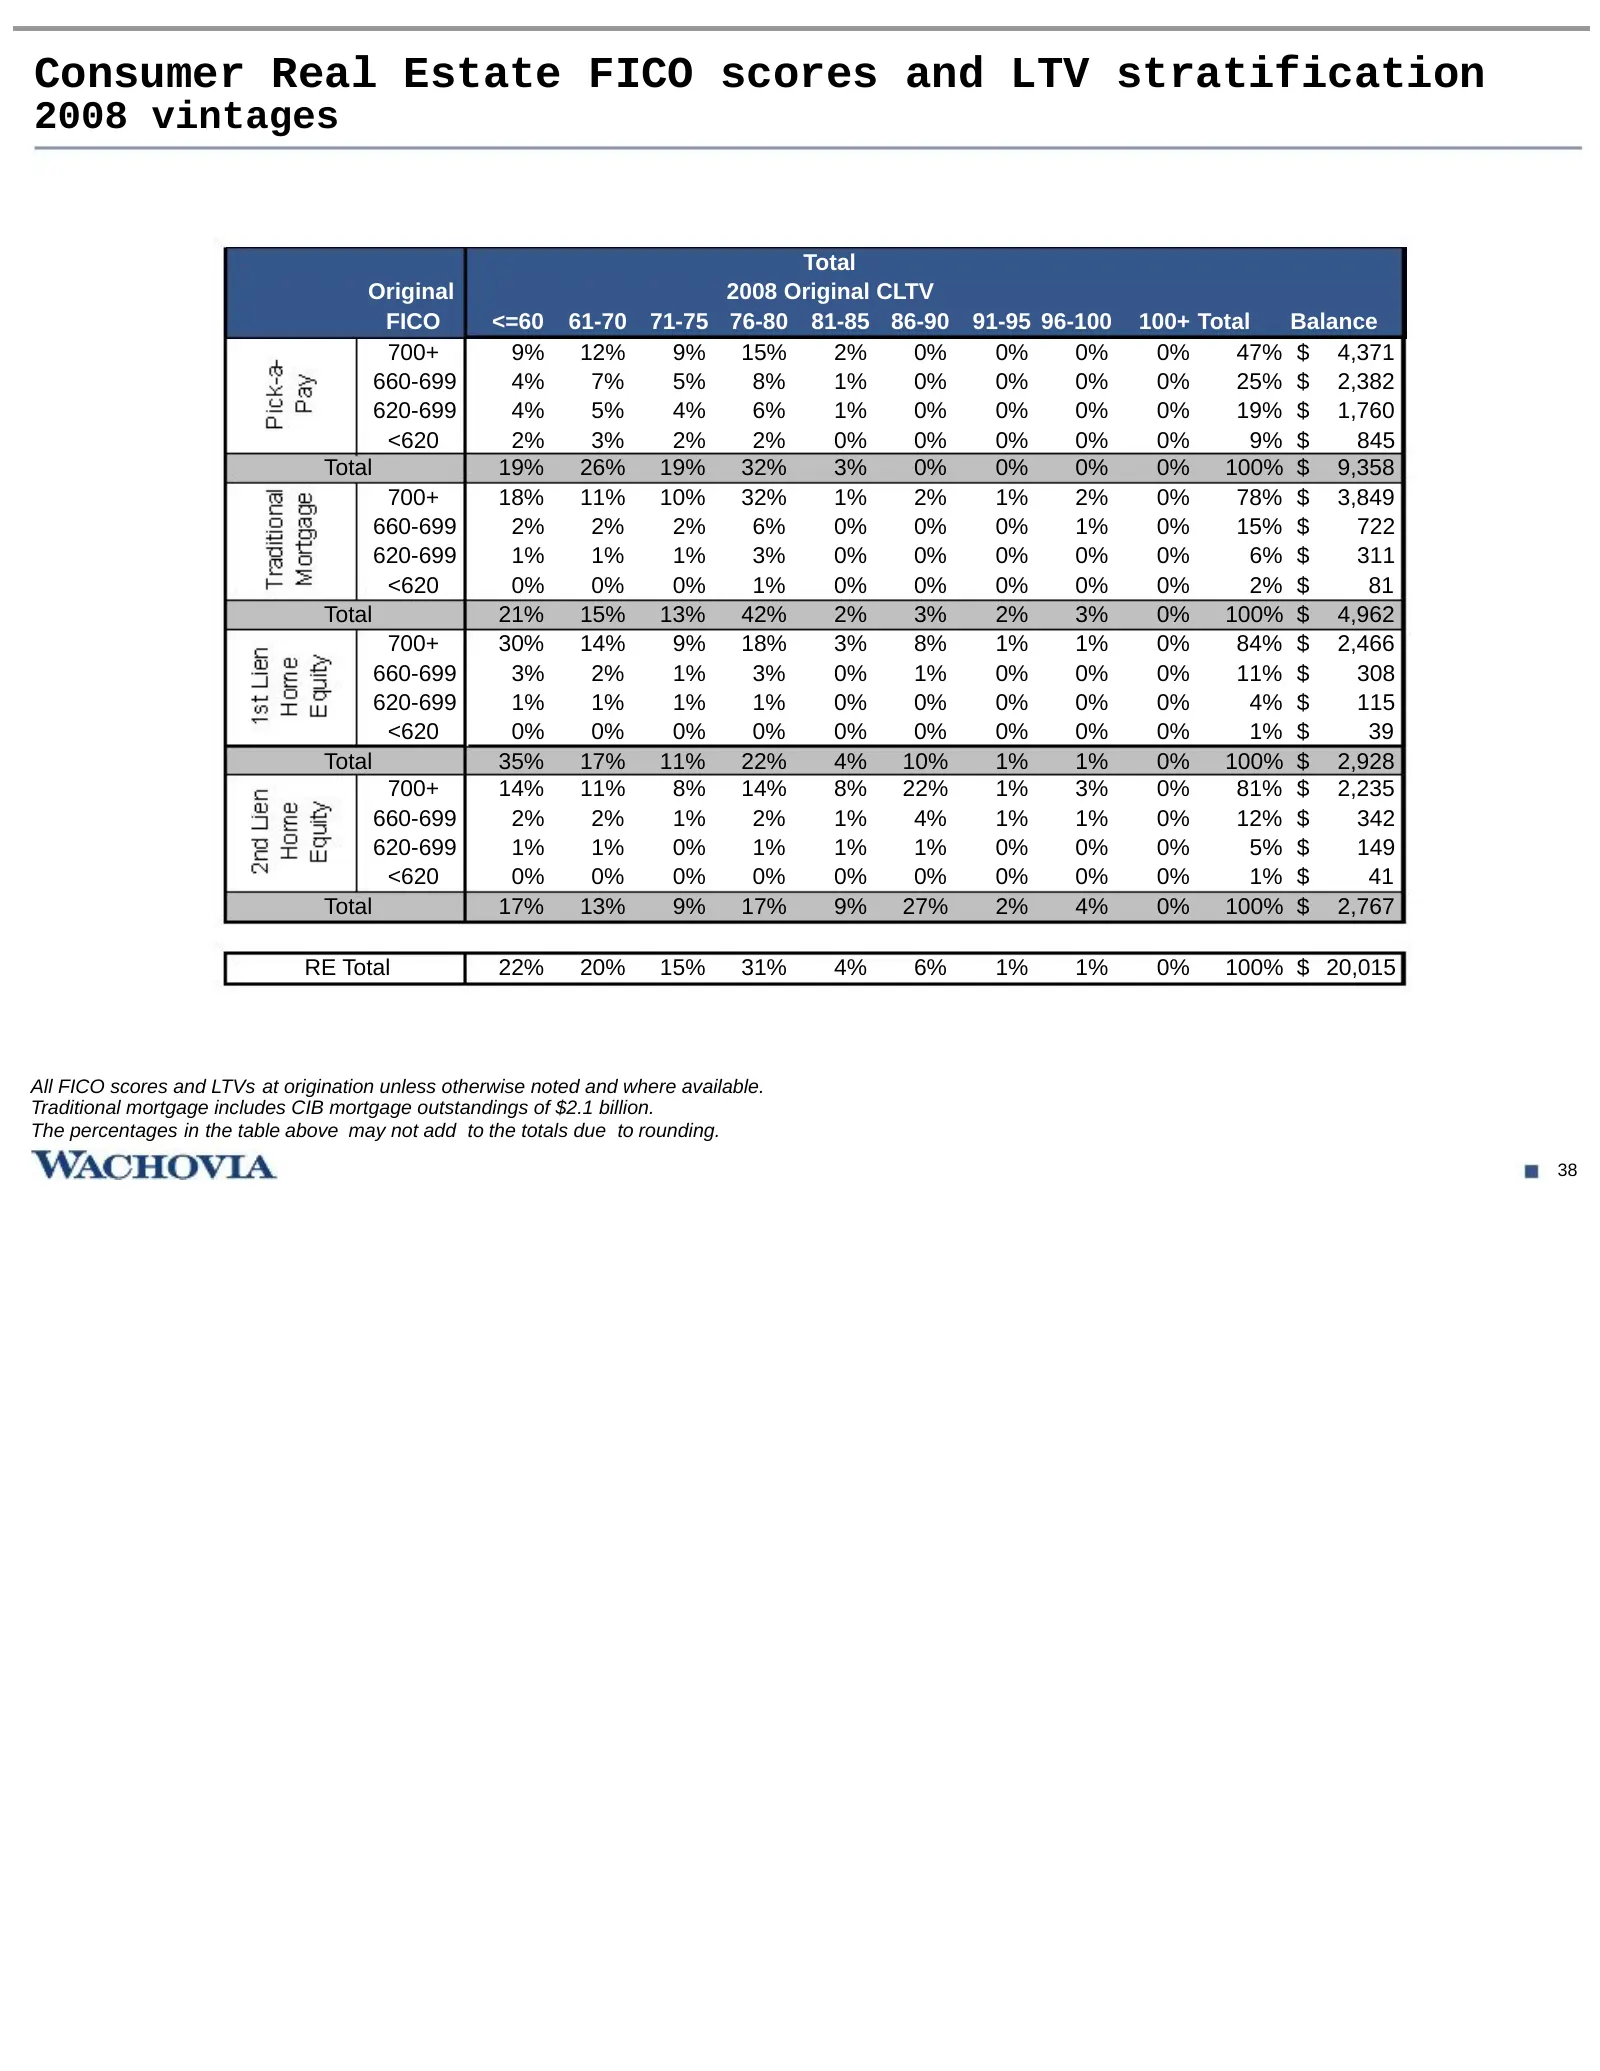
Consumer Real Estate FICO scores and LTV stratification 2008 vintages Total Original 2008 Original CLTV FICO <=60 61-70 71-75 76-80 81-85 86-90 91-95 96-100 100+ Total Balance 700+ 9% 12% 9% 15% 2% 0% 0% 0% 0% 47% $ 4,371 660-699 4% 7% 5% 8% 1% 0% 0% 0% 0% 25% $ 2,382 620-699 4% 5% 4% 6% 1% 0% 0% 0%
Slide 40: Wachovia Mortgage
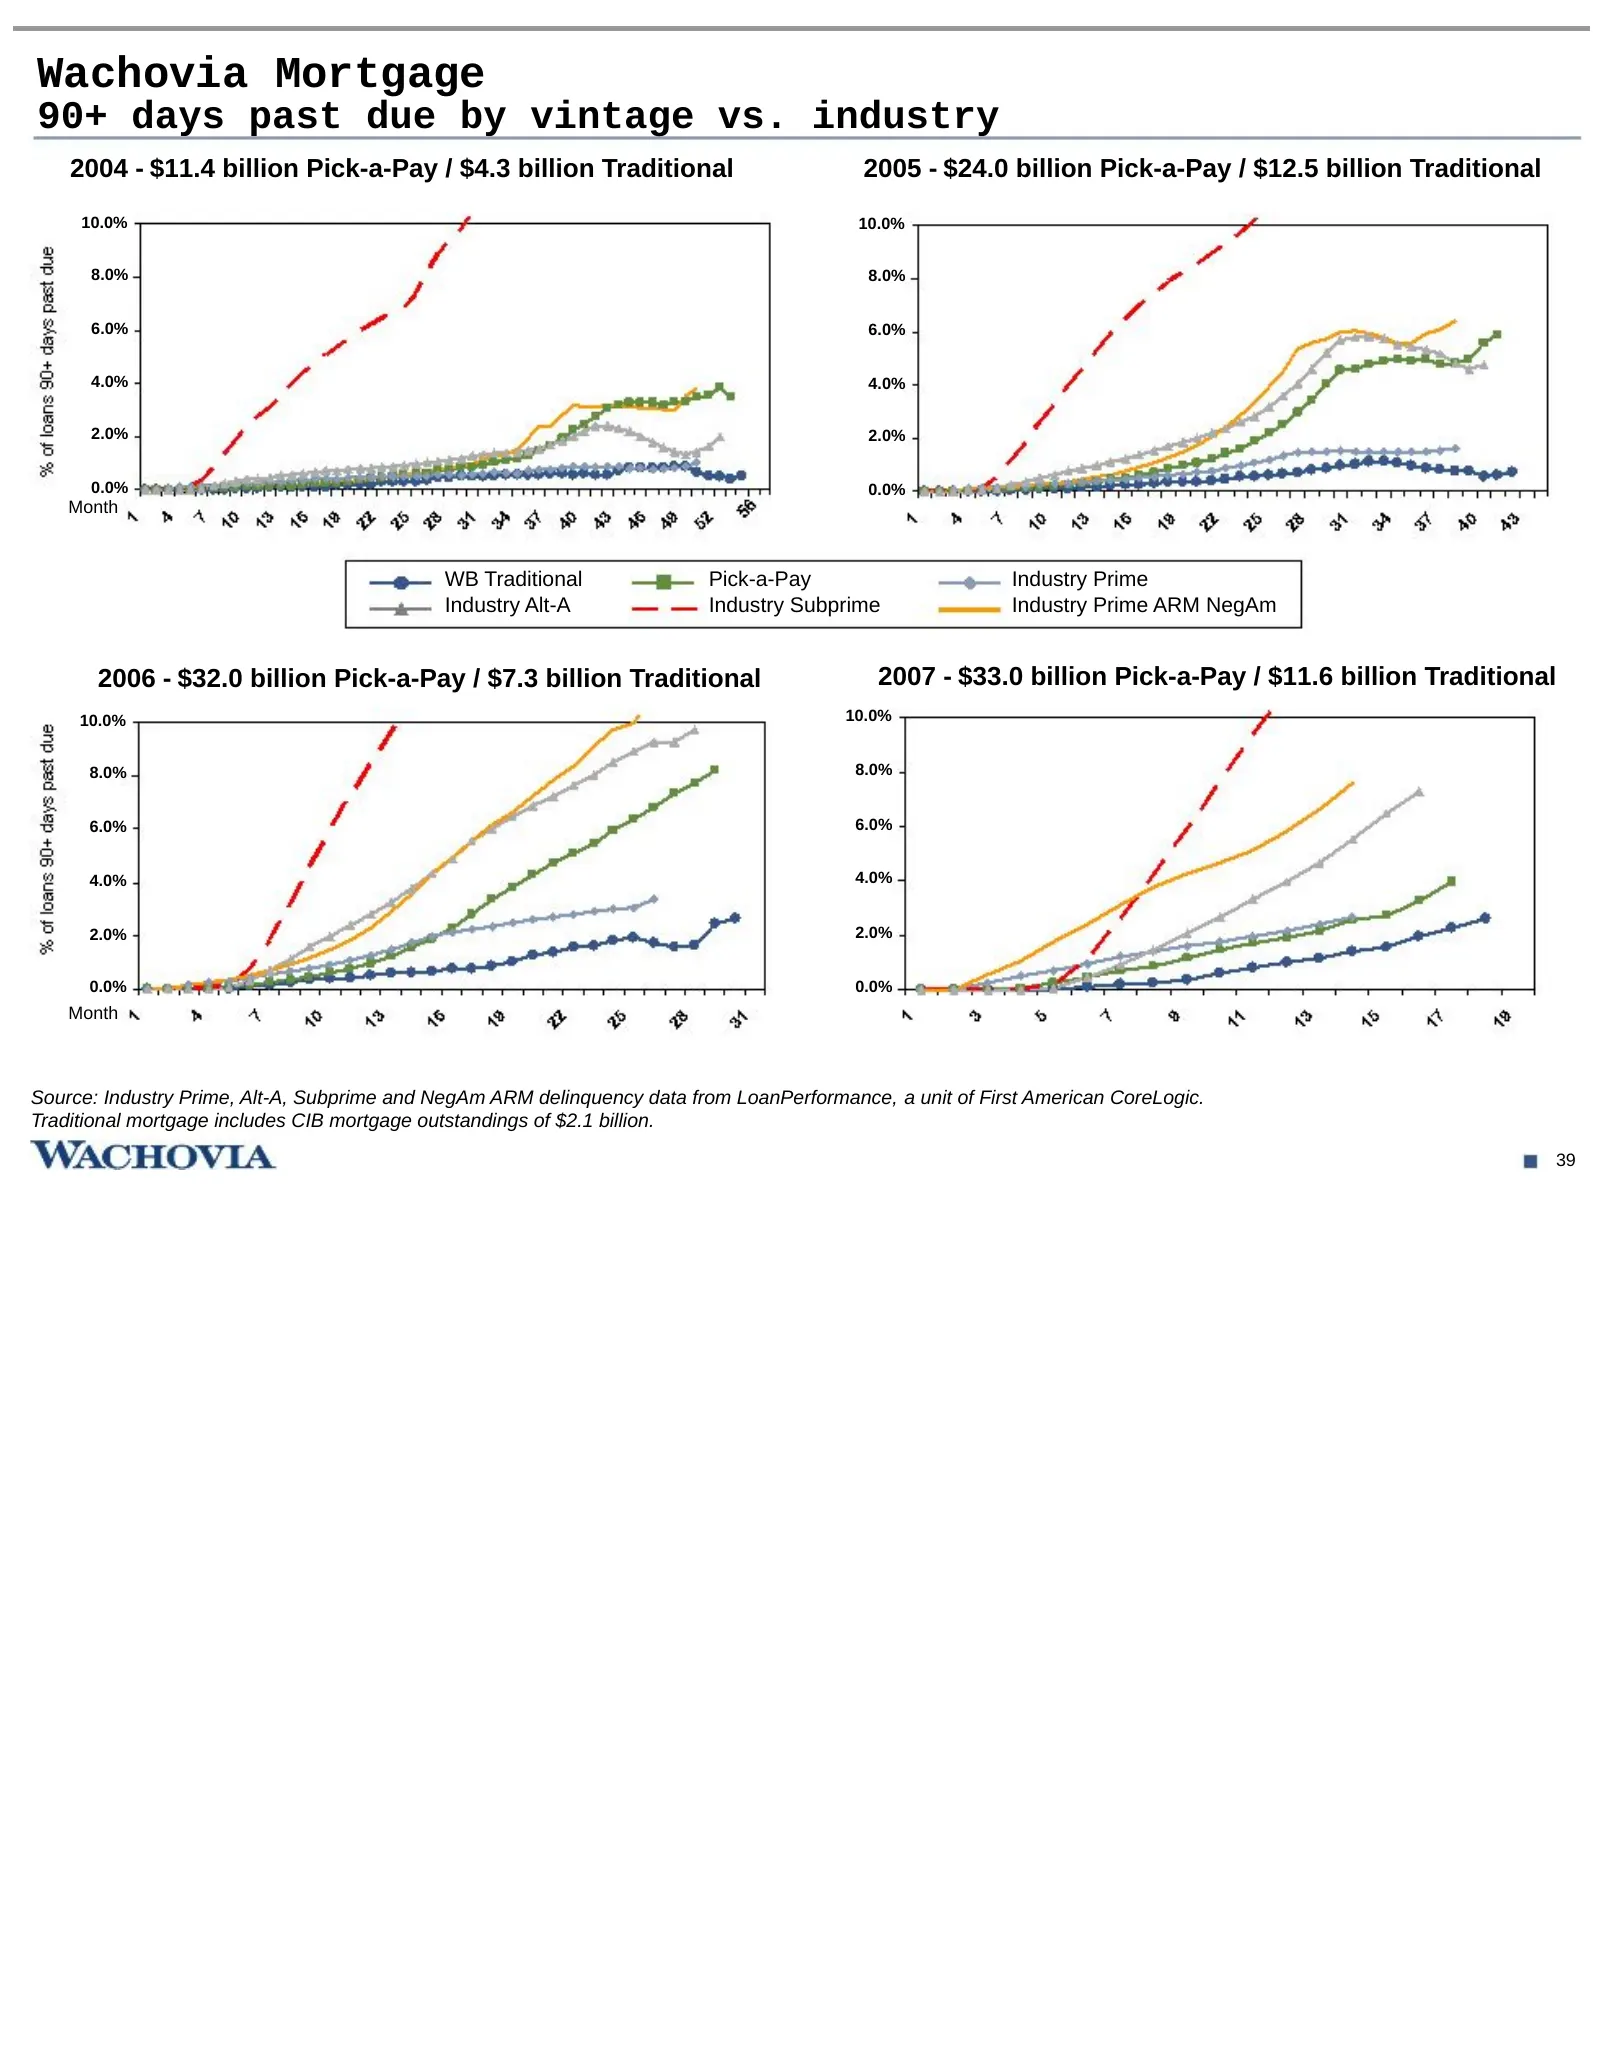
Wachovia Mortgage 90+ days past due by vintage vs. industry 2004 - $11.4 billion Pick-a-Pay / $4.3 billion Traditional 2005 - $24.0 billion Pick-a-Pay / $12.5 billion Traditional 10.0% 10.0% 8.0% 8.0% 6.0% 6.0% 4.0% 4.0% 2.0% 2.0% 0.0% 0.0% Month WB Traditional Pick-a-Pay Industry Prime Industry Alt
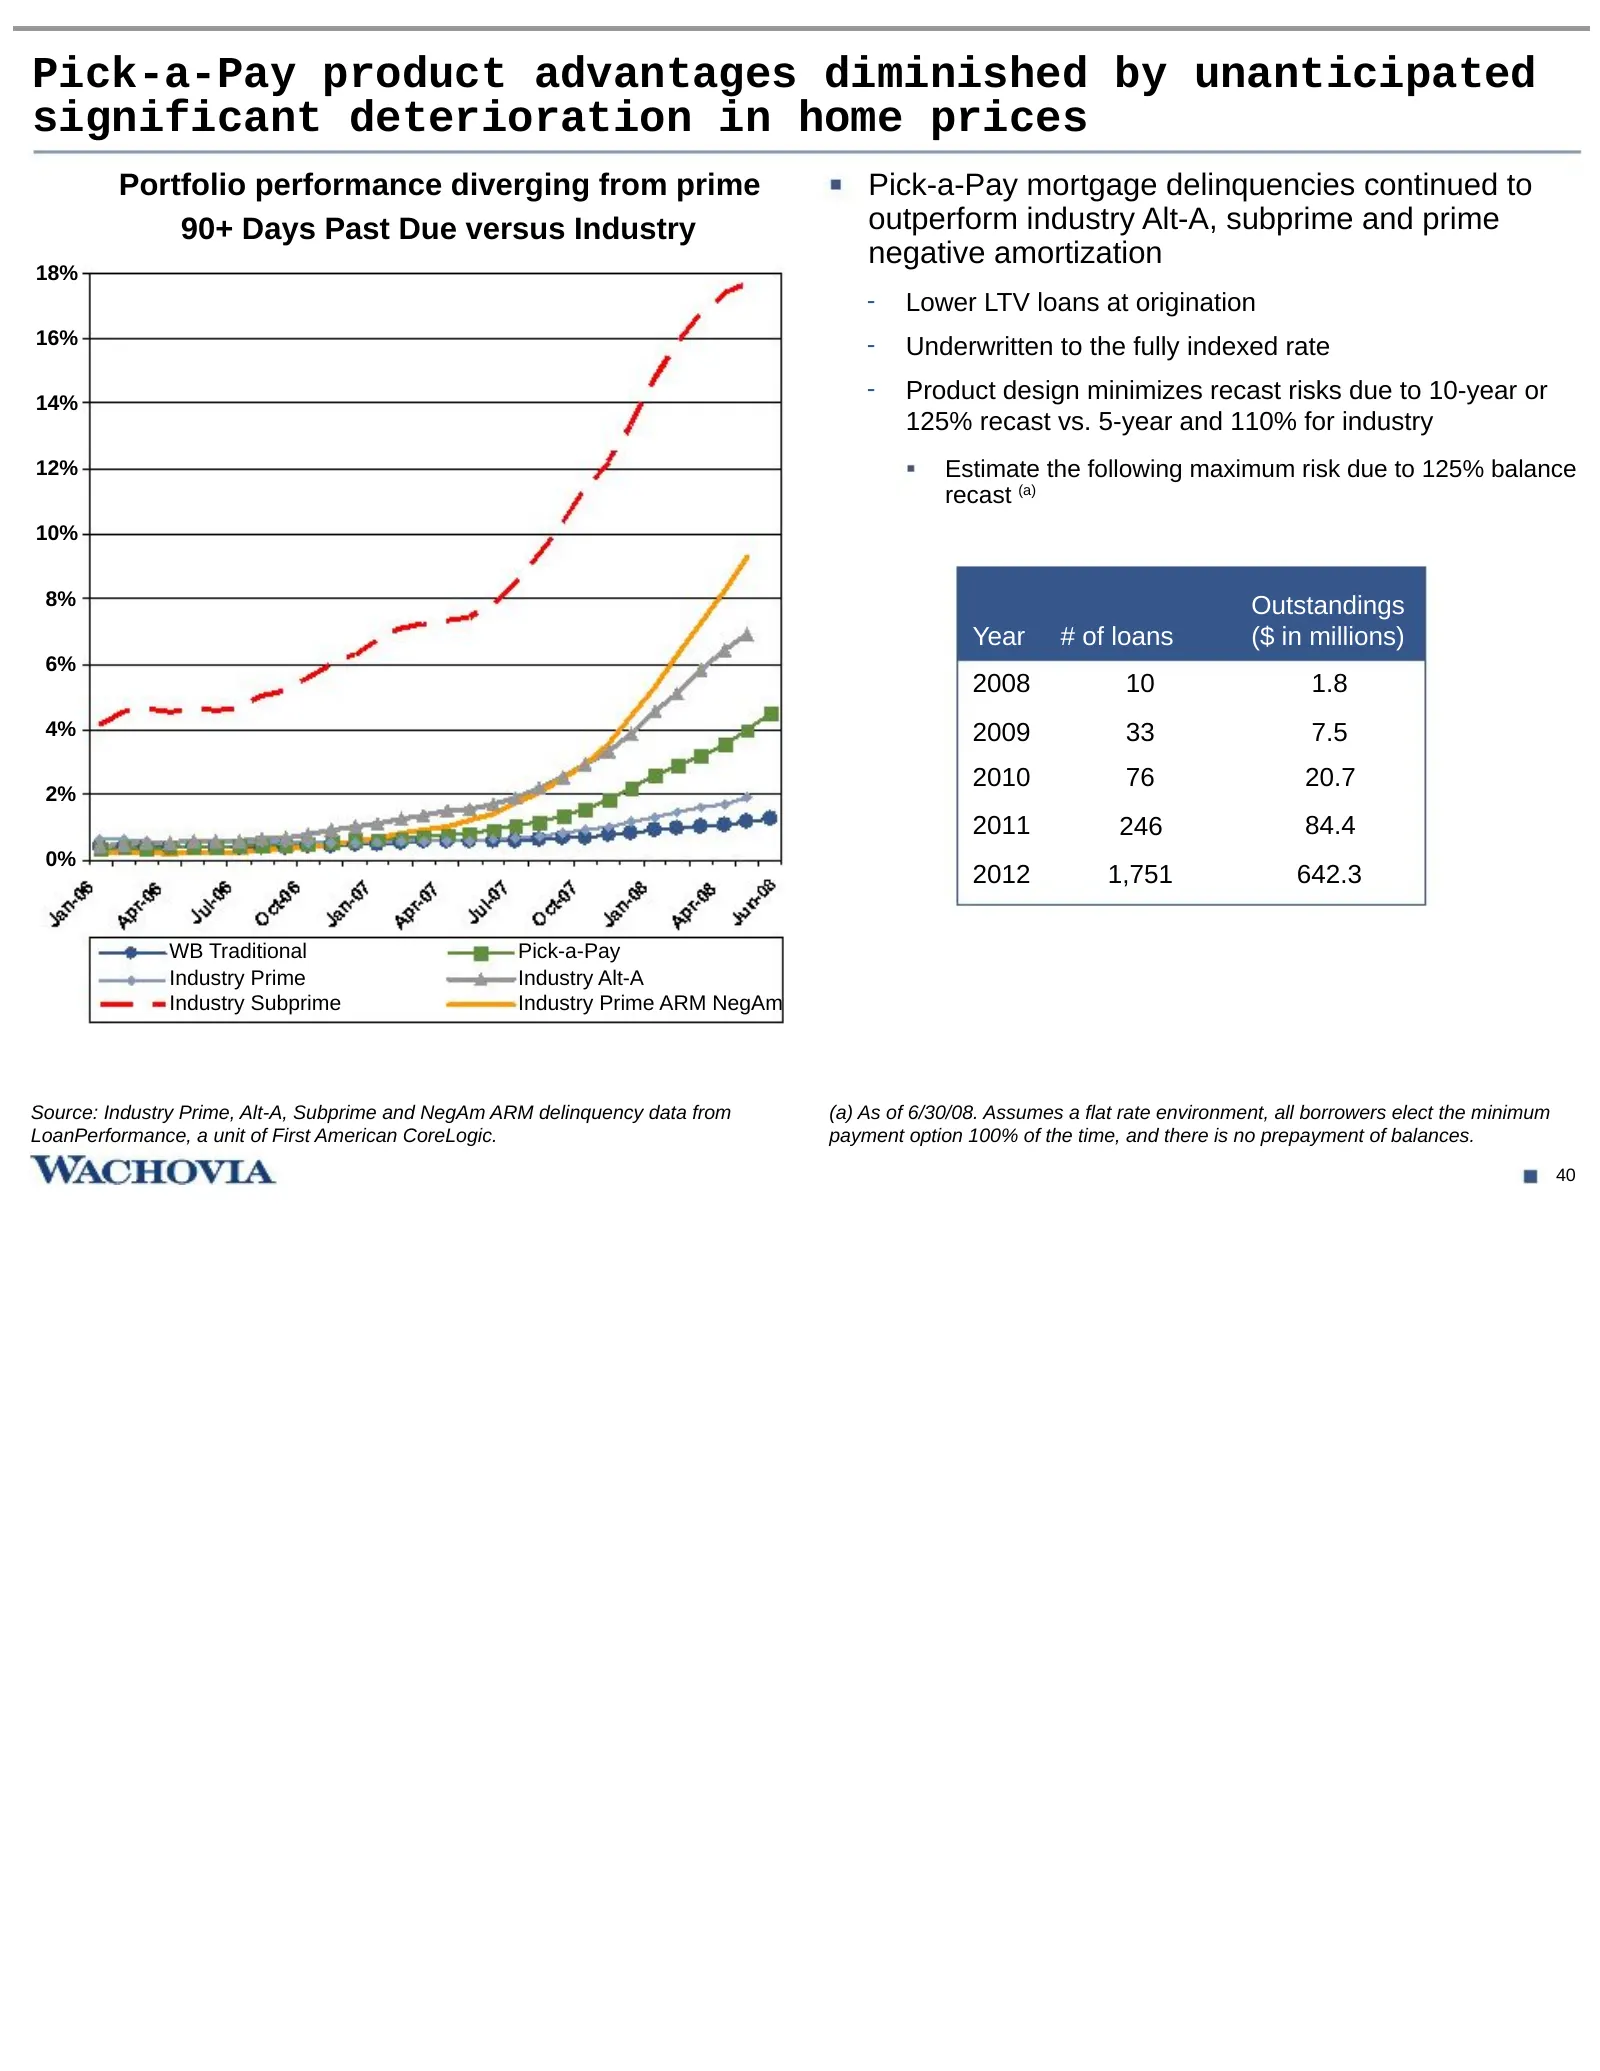
Slide 41: Pick-a-Pay product advantages diminished by unanticipated significant deterioration in home prices
Pick-a-Pay product advantages diminished by unanticipated significant deterioration in home prices Portfolio performance diverging from prime Pick-a-Pay mortgage delinquencies continued to 90+ Days Past Due versus Industry outperform industry Alt-A, subprime and prime negative amortization 18% - Low
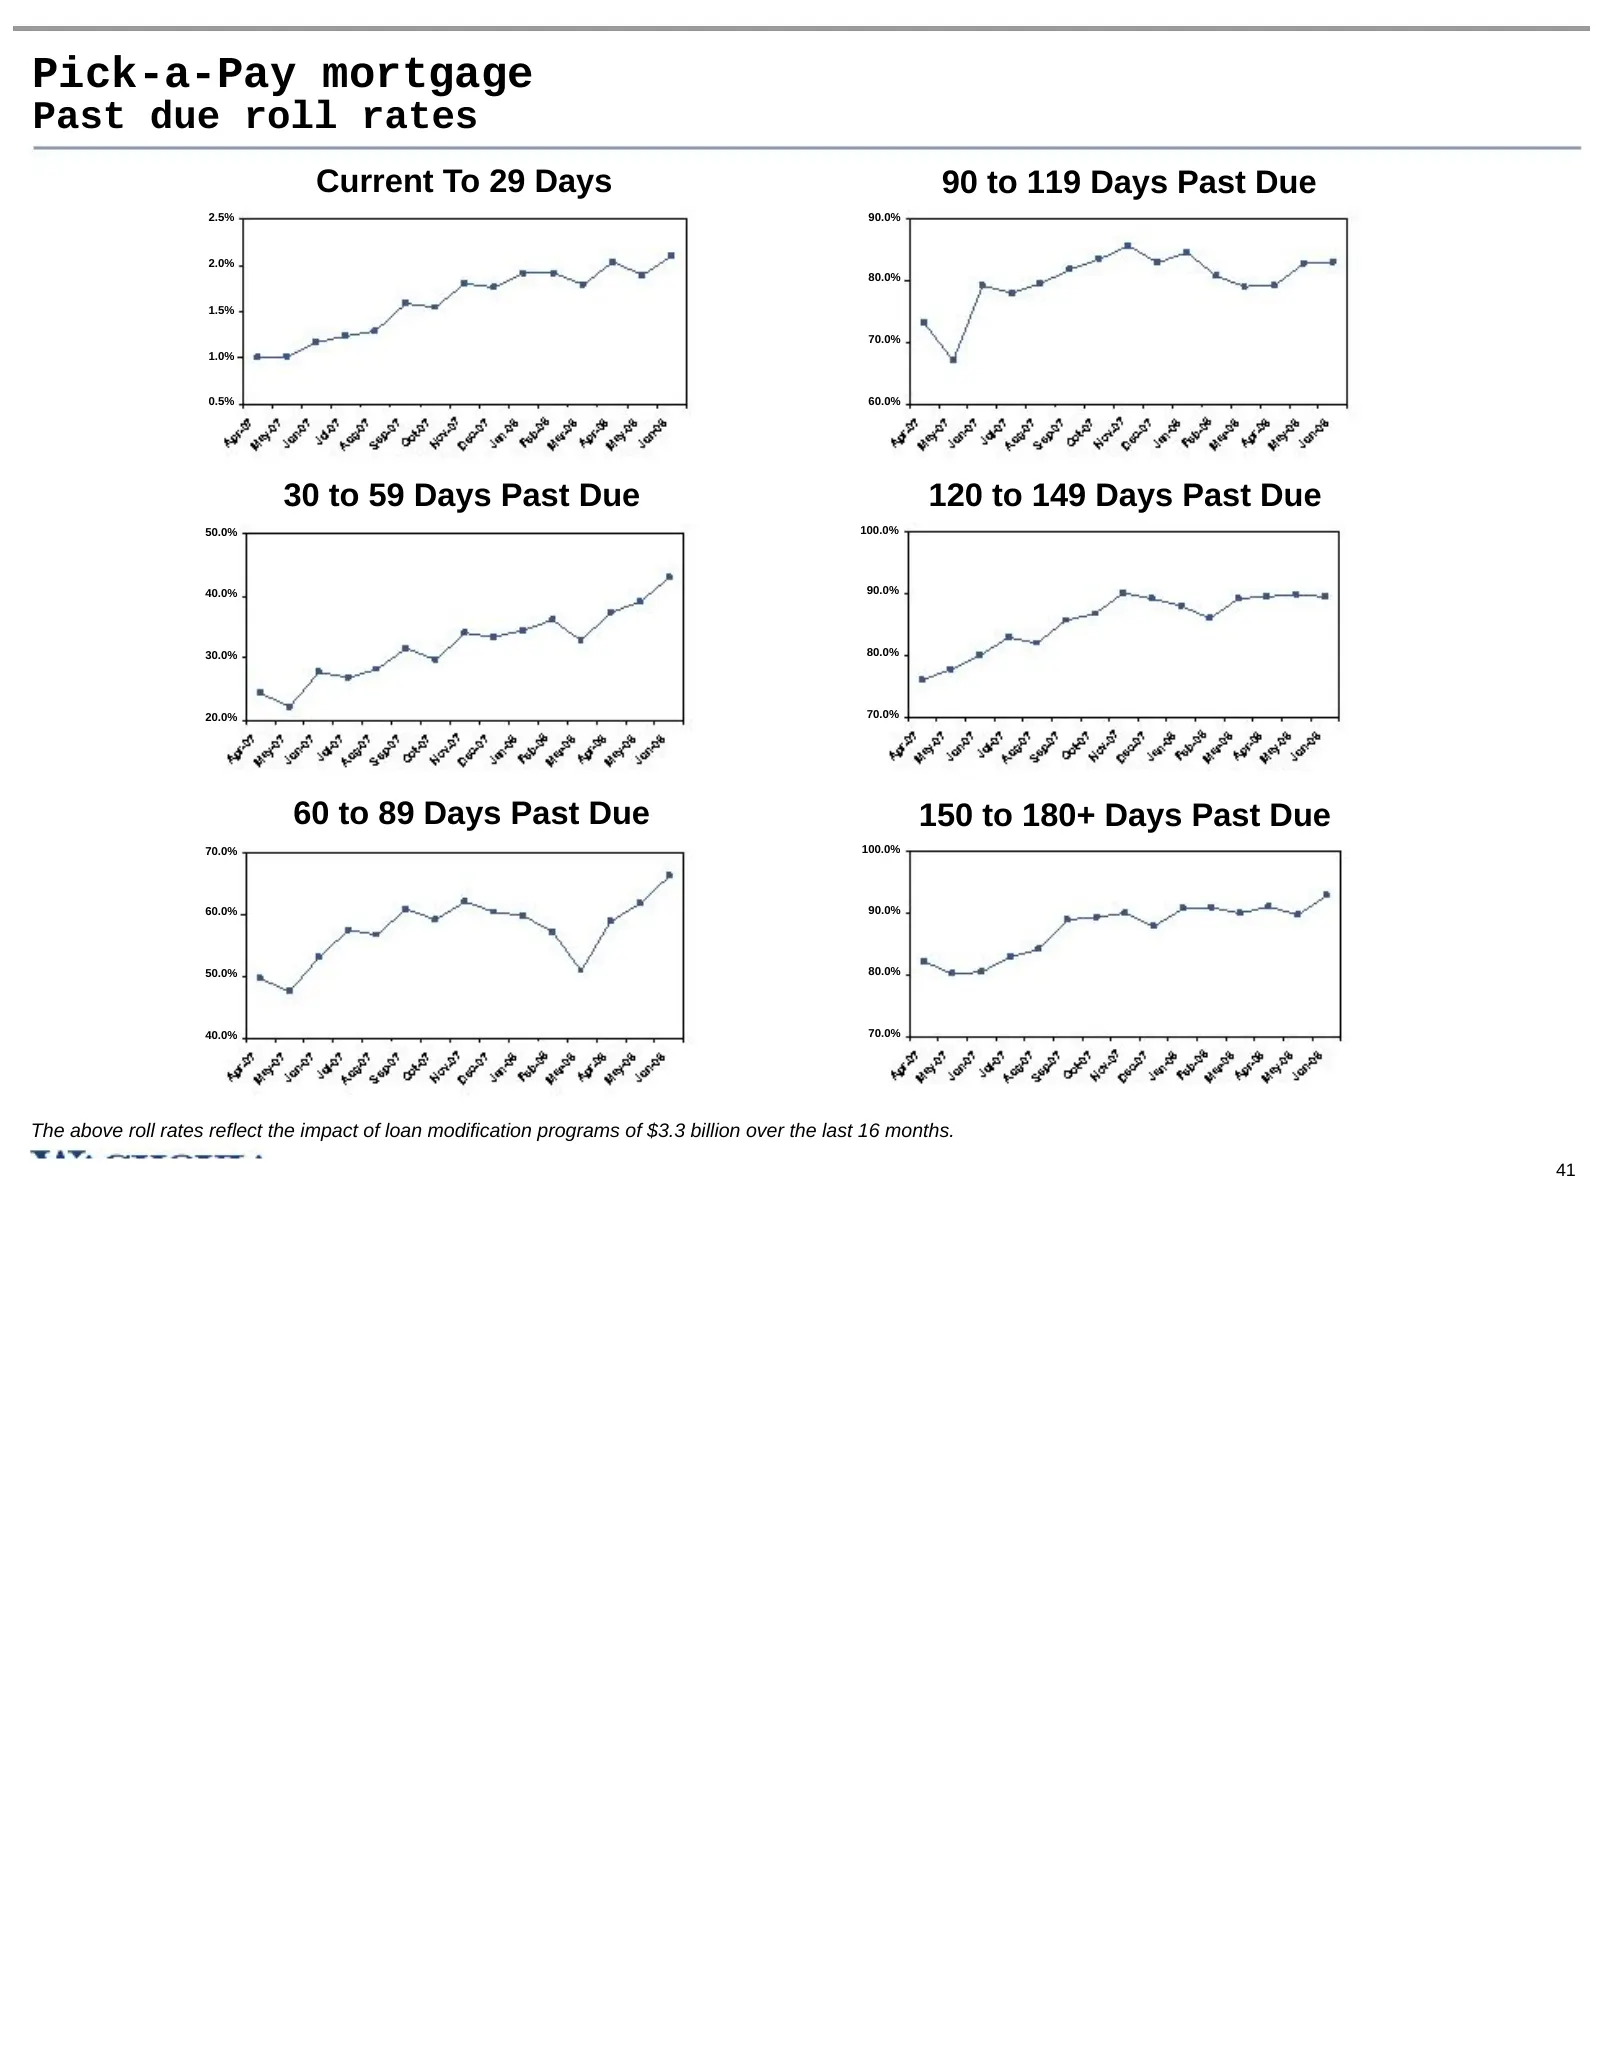
Slide 42: Pick-a-Pay mortgage
Pick-a-Pay mortgage Past due roll rates Current To 29 Days 90 to 119 Days Past Due 2.5% 90.0% 2.0% 80.0% 1.5% 70.0% 1.0% 0.5% 60.0% 30 to 59 Days Past Due 120 to 149 Days Past Due 50.0% 100.0% 40.0% 90.0% 30.0% 80.0% 20.0% 70.0% 60 to 89 Days Past Due 150 to 180+ Days Past Due 70.0% 100.0% 60.0% 90.
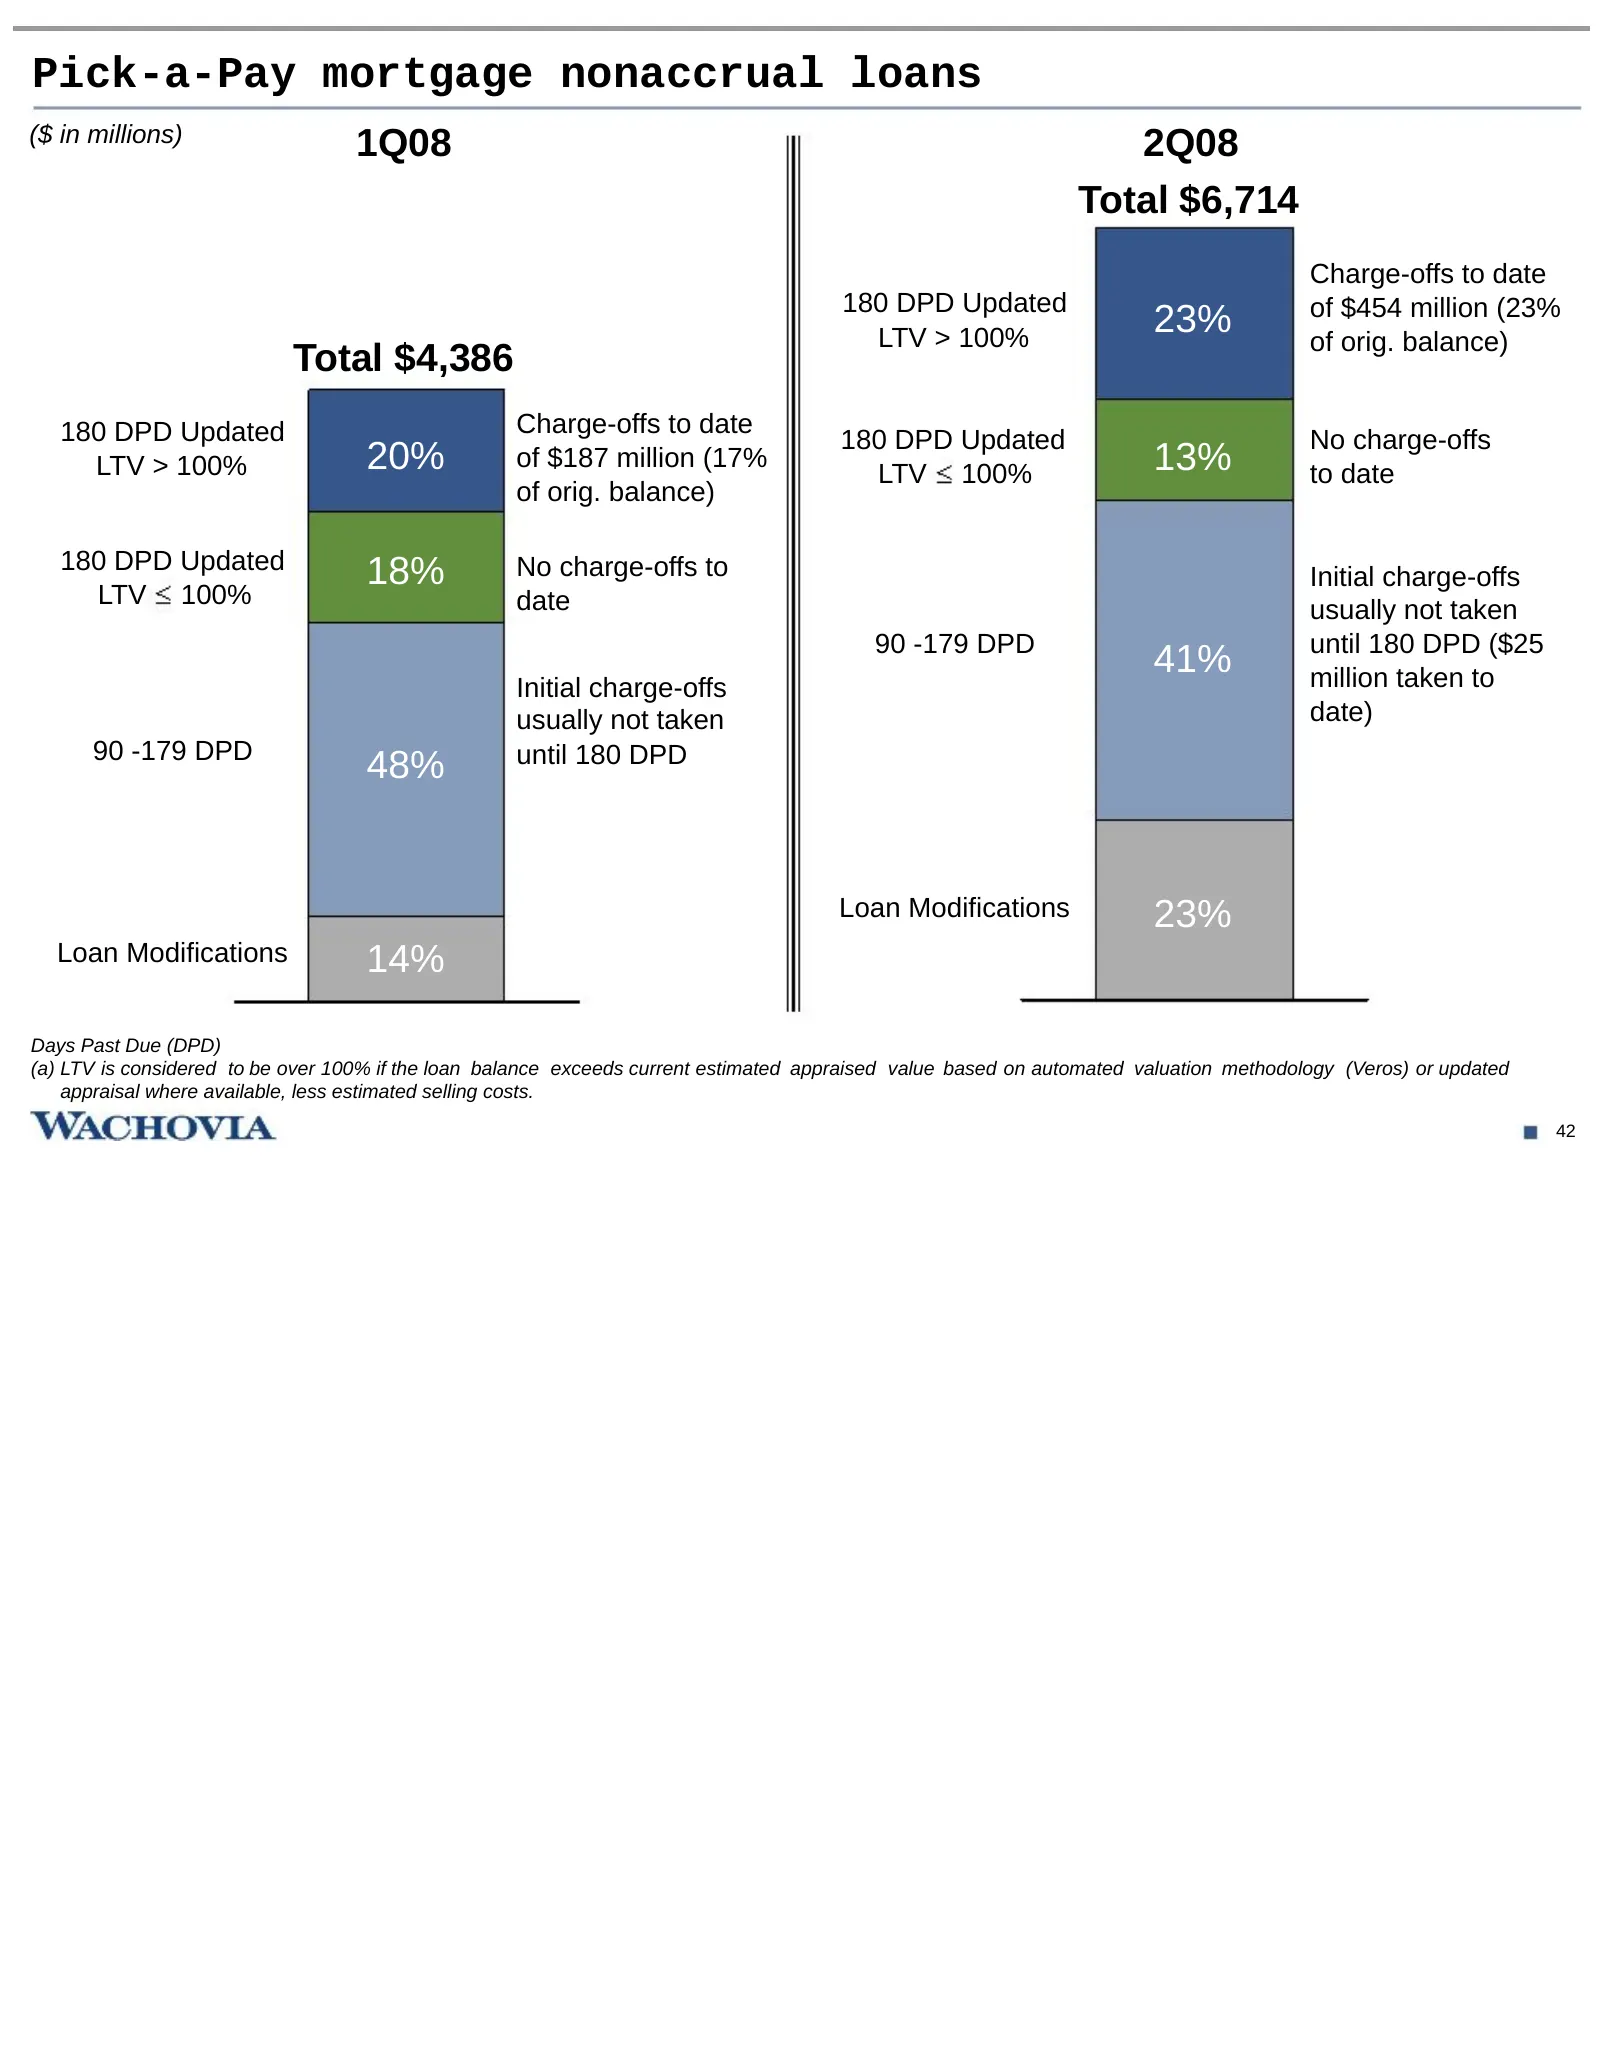
Slide 43: Pick-a-Pay mortgage nonaccrual loans
Pick-a-Pay mortgage nonaccrual loans ($ in millions) 1Q08 2Q08 Total $6,714 Charge-offs to date 180 DPD Updated of $454 million (23% LTV > 100% 23% of orig. balance) Total $4,386 180 DPD Updated Charge-offs to date 180 DPD Updated No charge-offs LTV > 100% 20% of $187 million (17% LTV 100% 13% to da
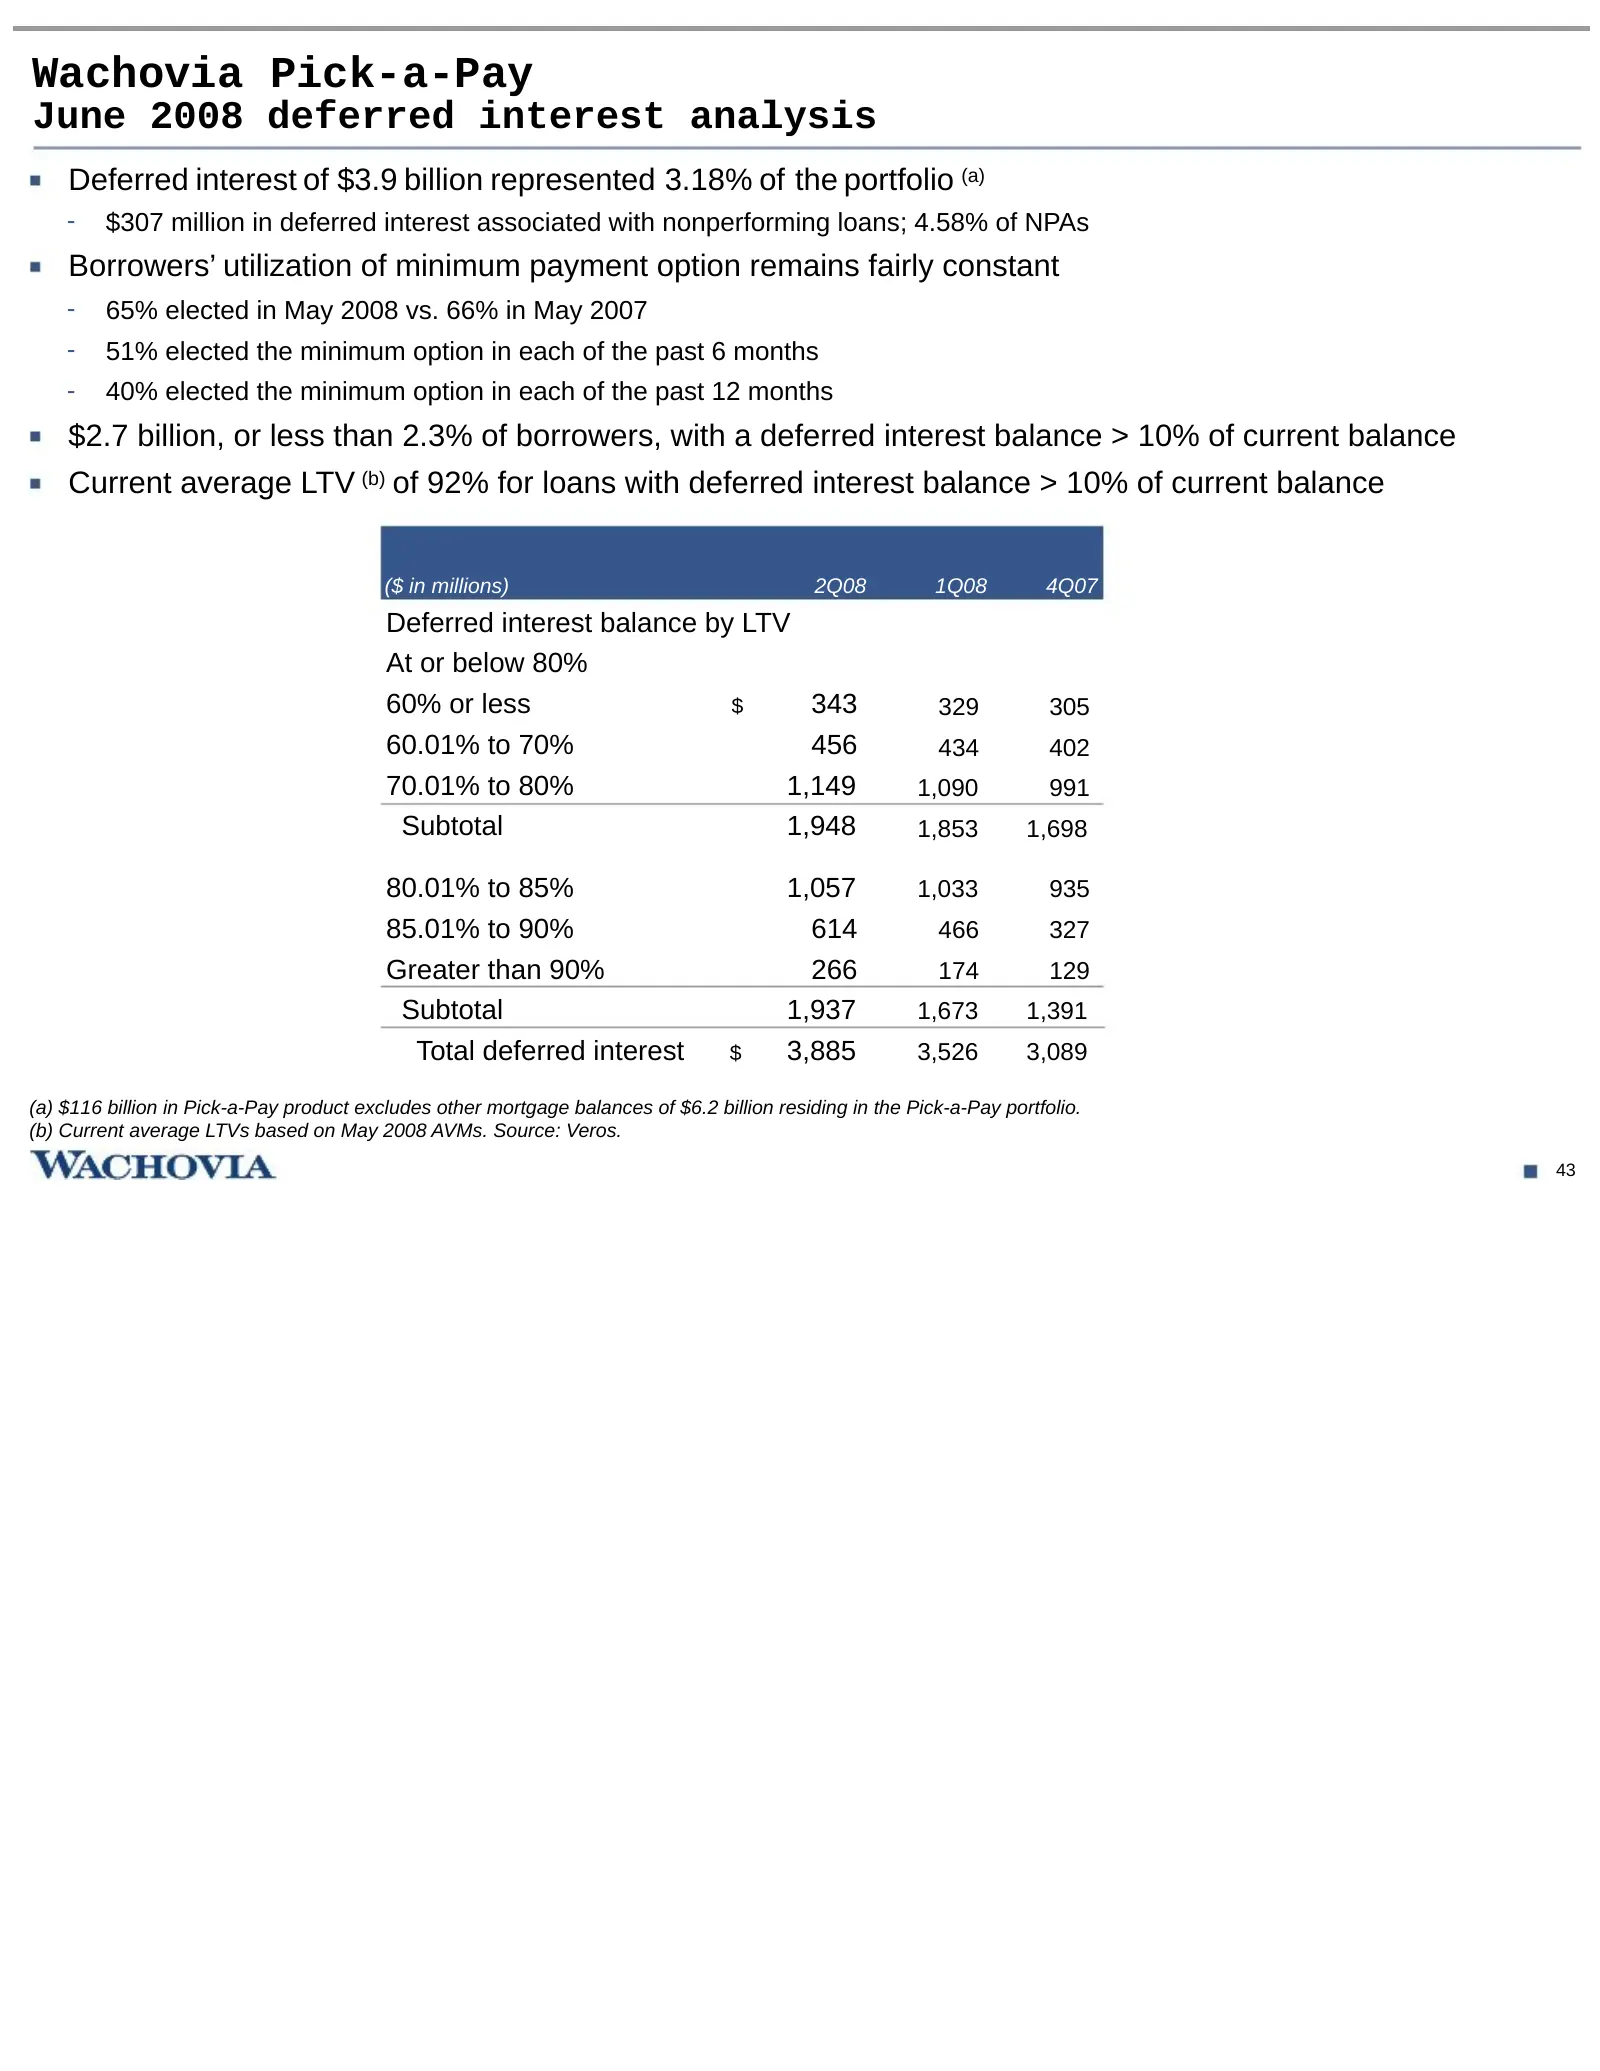
Slide 44: Wachovia Pick-a-Pay
Wachovia Pick-a-Pay June 2008 deferred interest analysis Deferred interest of $3.9 billion represented 3.18% of the portfolio (a) - $307 million in deferred interest associated with nonperforming loans; 4.58% of NPAs Borrowers’ utilization of minimum payment option remains fairly constant - 65% elec
Slide 45: Home equity loans and lines
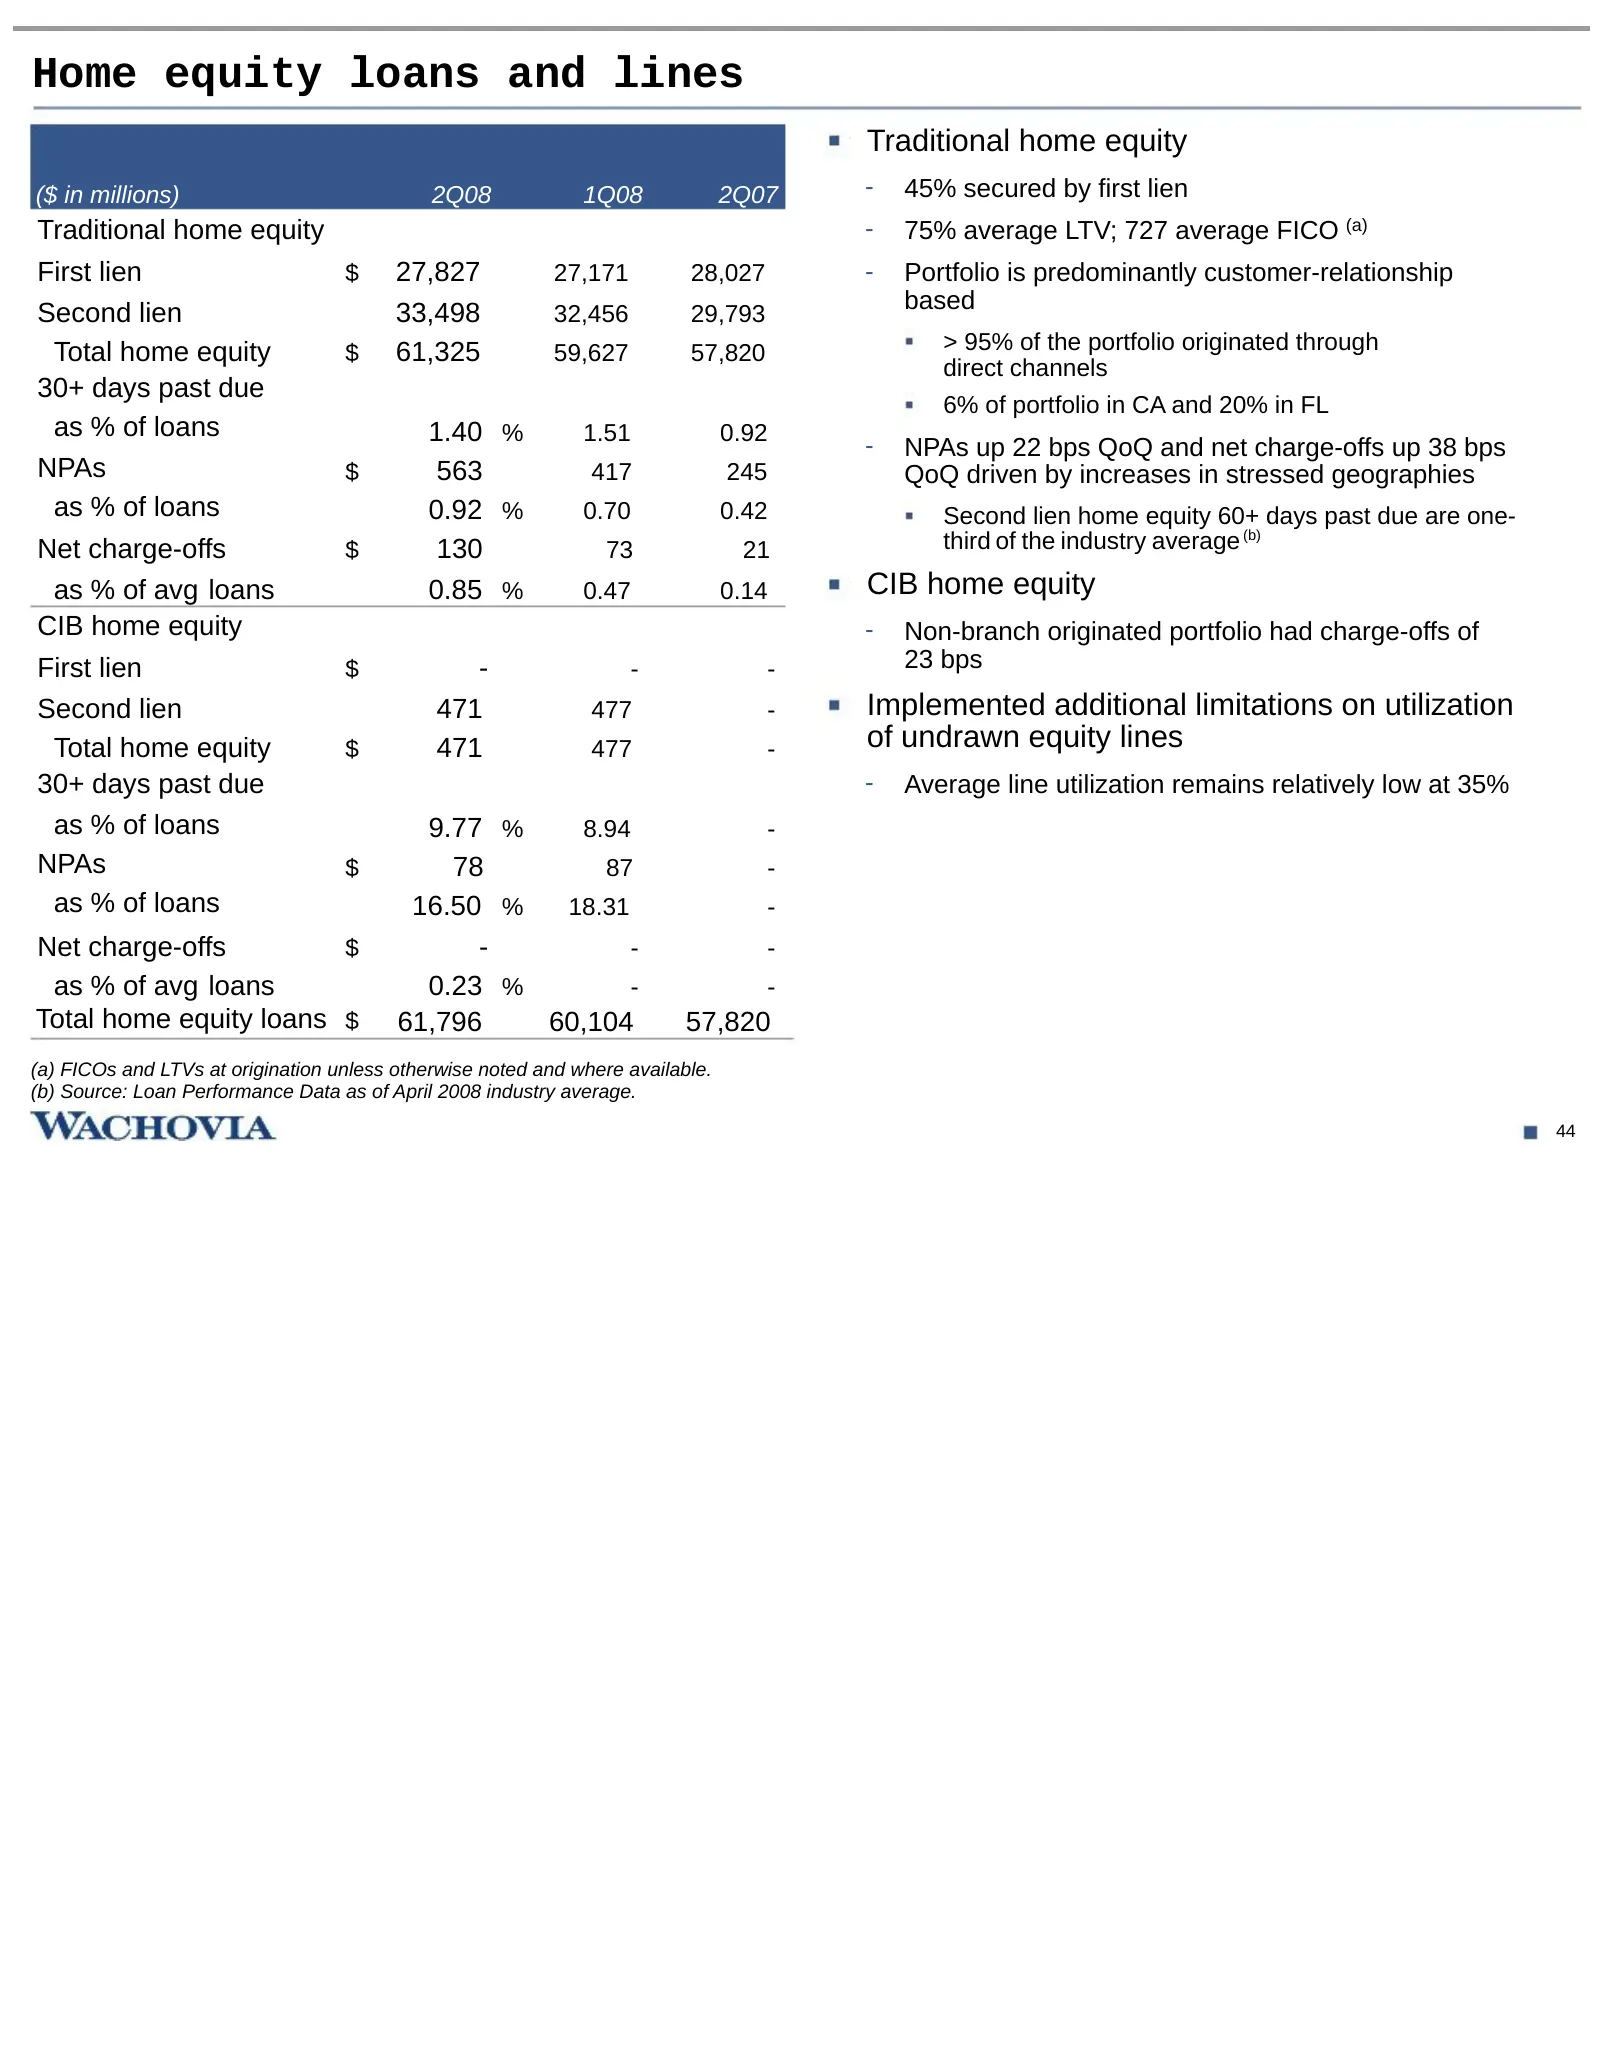
Home equity loans and lines Traditional home equity ($ in millions) 2Q08 1Q08 2Q07 - 45% secured by first lien Traditional home equity - 75% average LTV; 727 average FICO (a) First lien $ 27,827 27,171 28,027 - Portfolio is predominantly customer-relationship Second lien 33,498 32,456 29,793 based T
Slide 46: Wachovia second lien home equity loans and lines
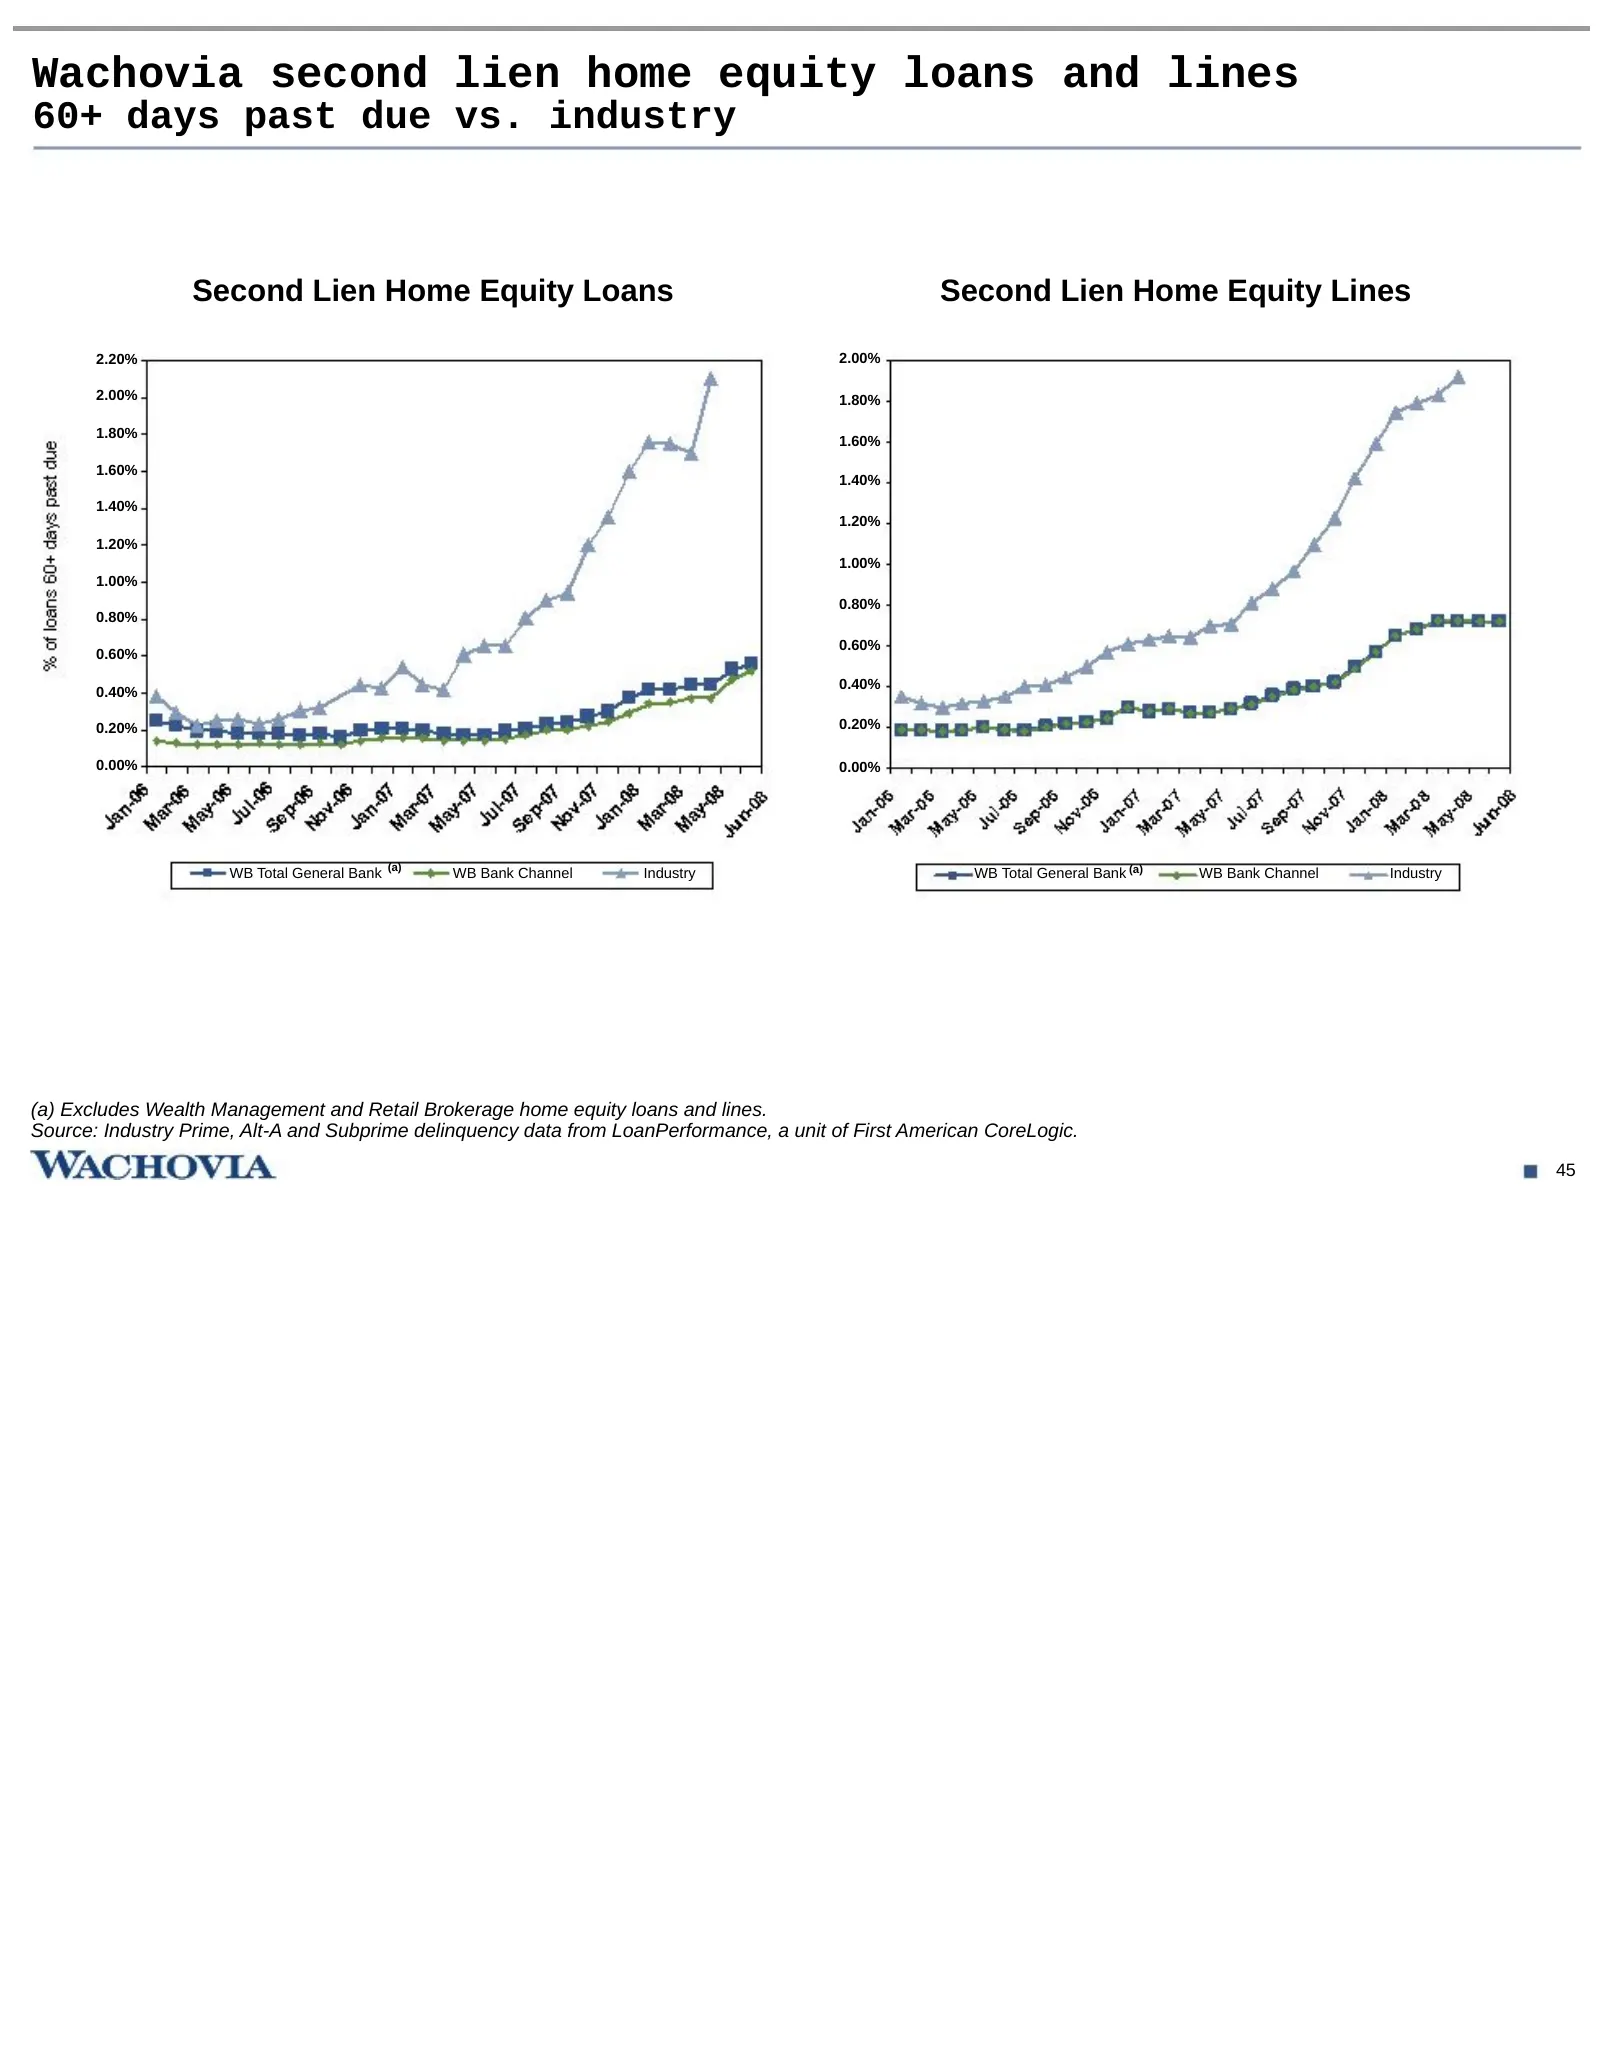
Wachovia second lien home equity loans and lines 60+ days past due vs. industry Second Lien Home Equity Loans Second Lien Home Equity Lines 2.20% 2.00% 2.00% 1.80% 1.80% 1.60% 1.60% 1.40% 1.40% 1.20% 1.20% 1.00% 1.00% 0.80% 0.80% 0.60% 0.60% 0.40% 0.40% 0.20% 0.20% 0.00% 0.00% WB Total General Bank
Slide 47: Managed auto portfolio
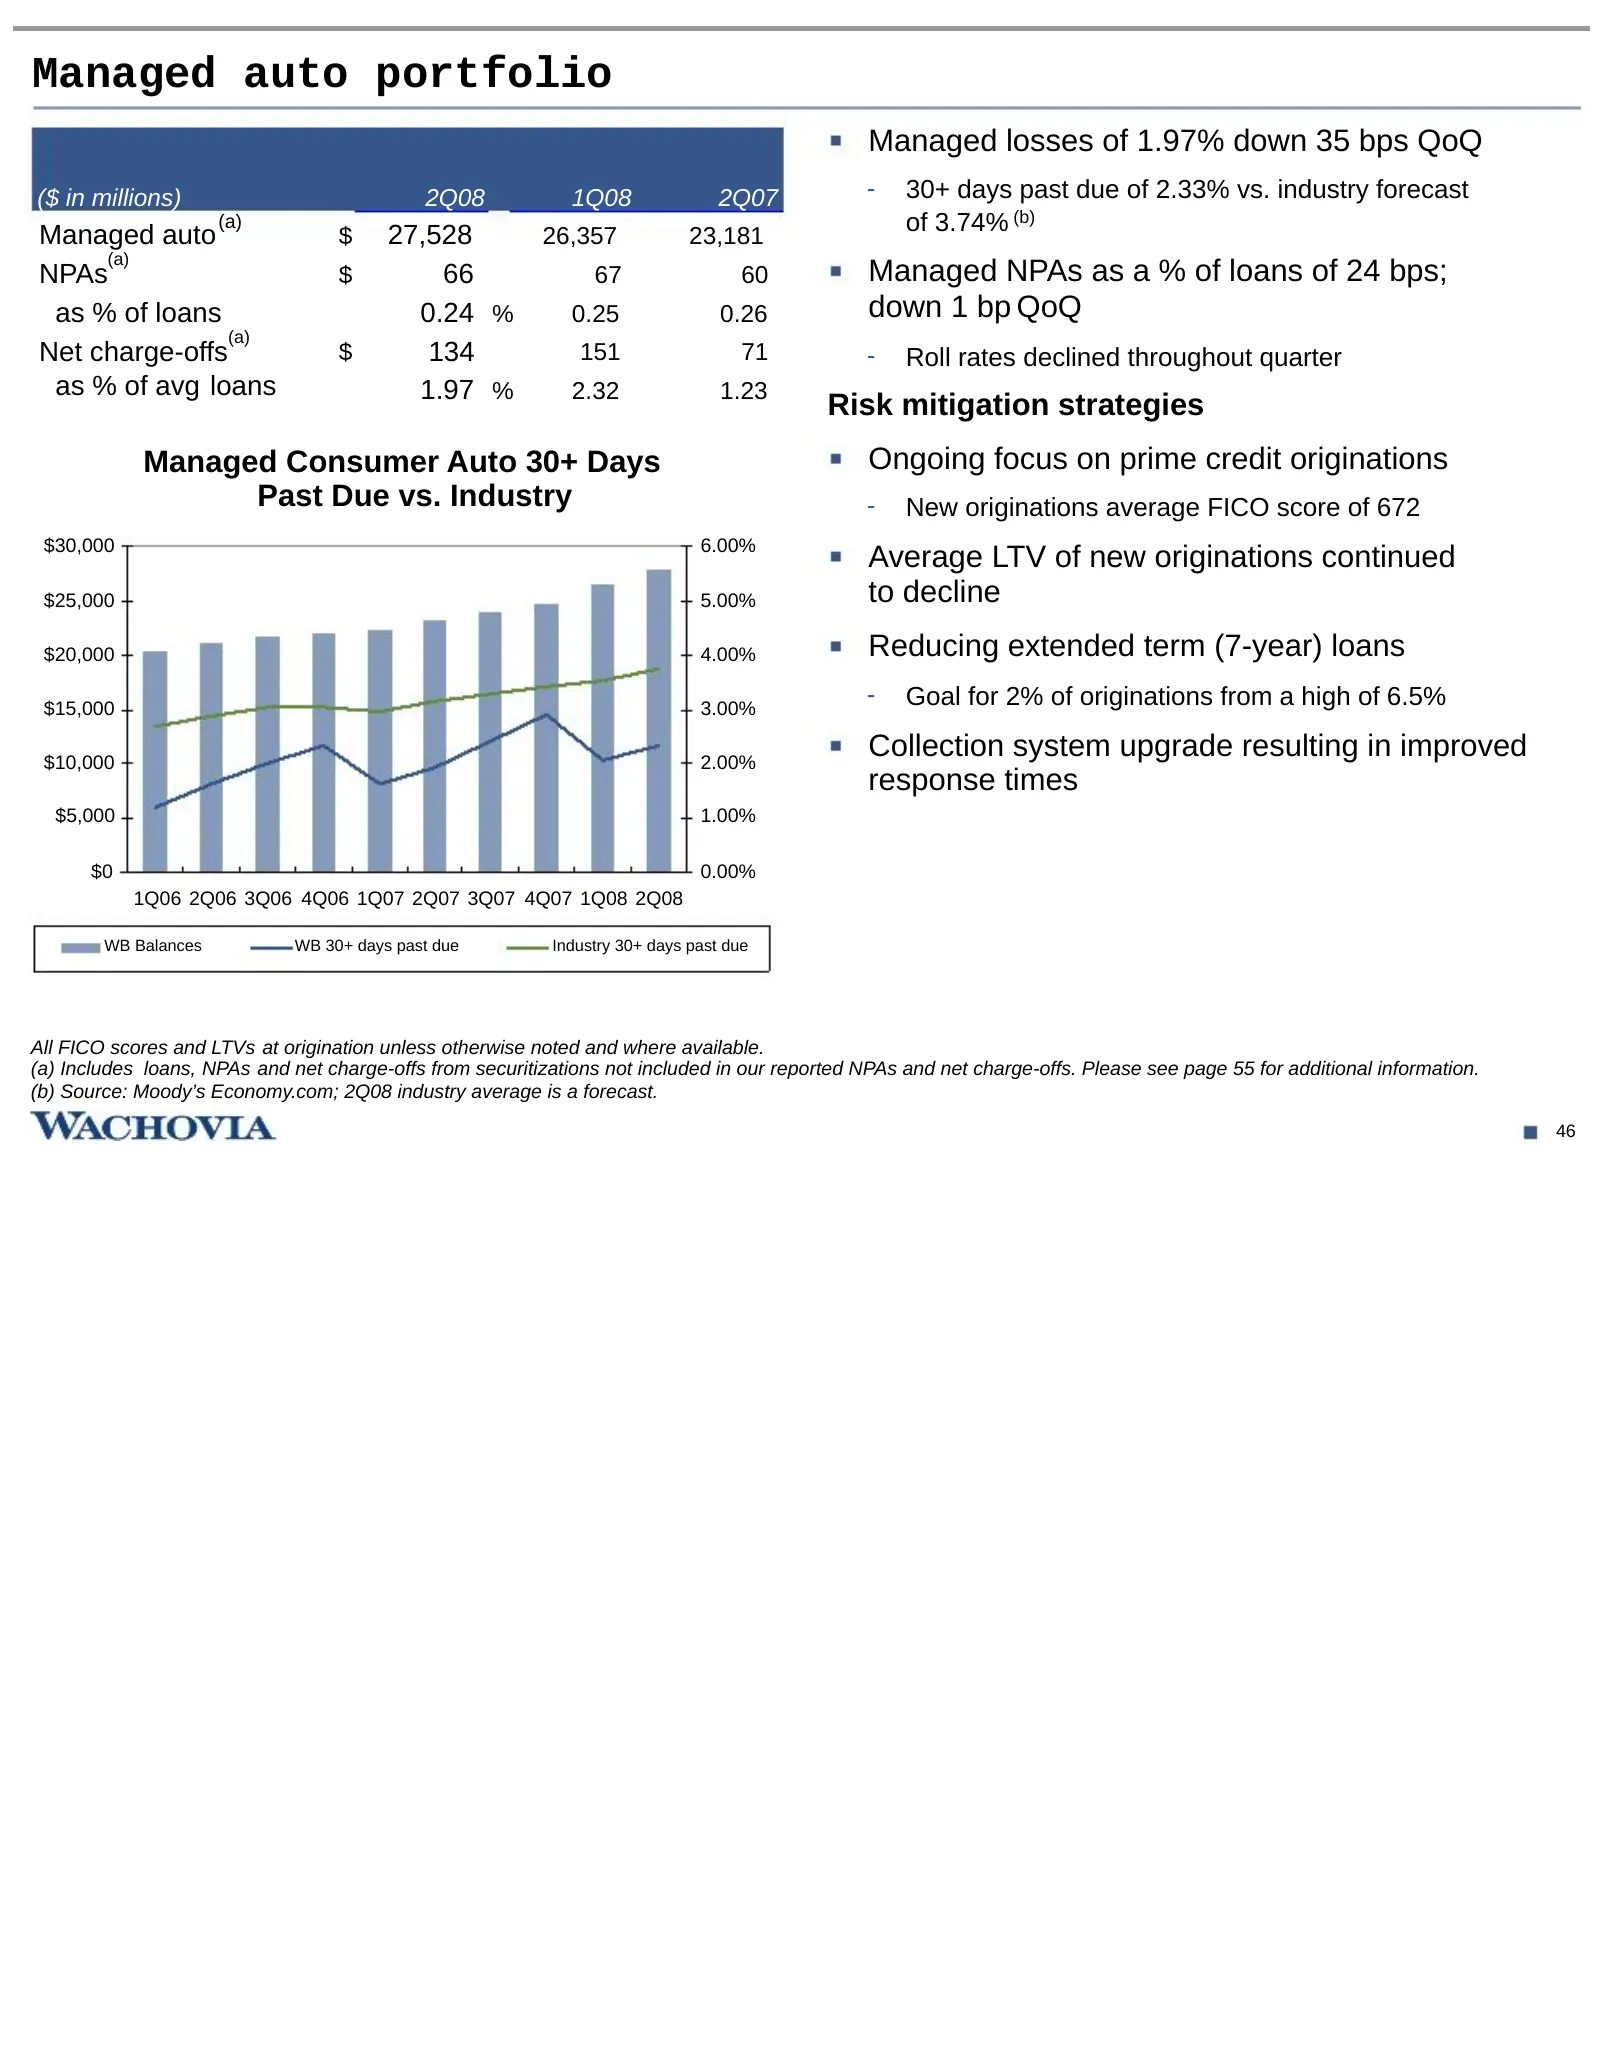
Managed auto portfolio Managed losses of 1.97% down 35 bps QoQ ($ in millions) 2Q08 1Q08 2Q07 - 30+ days past due of 2.33% vs. industry forecast Managed auto (a) $ 27,528 26,357 23,181 of 3.74% (b) (a) NPAs $ 66 67 60 Managed NPAs as a % of loans of 24 bps; as % of loans 0.24 % 0.25 0.26 down 1 bp Q
Slide 48: Commercial Real Estate
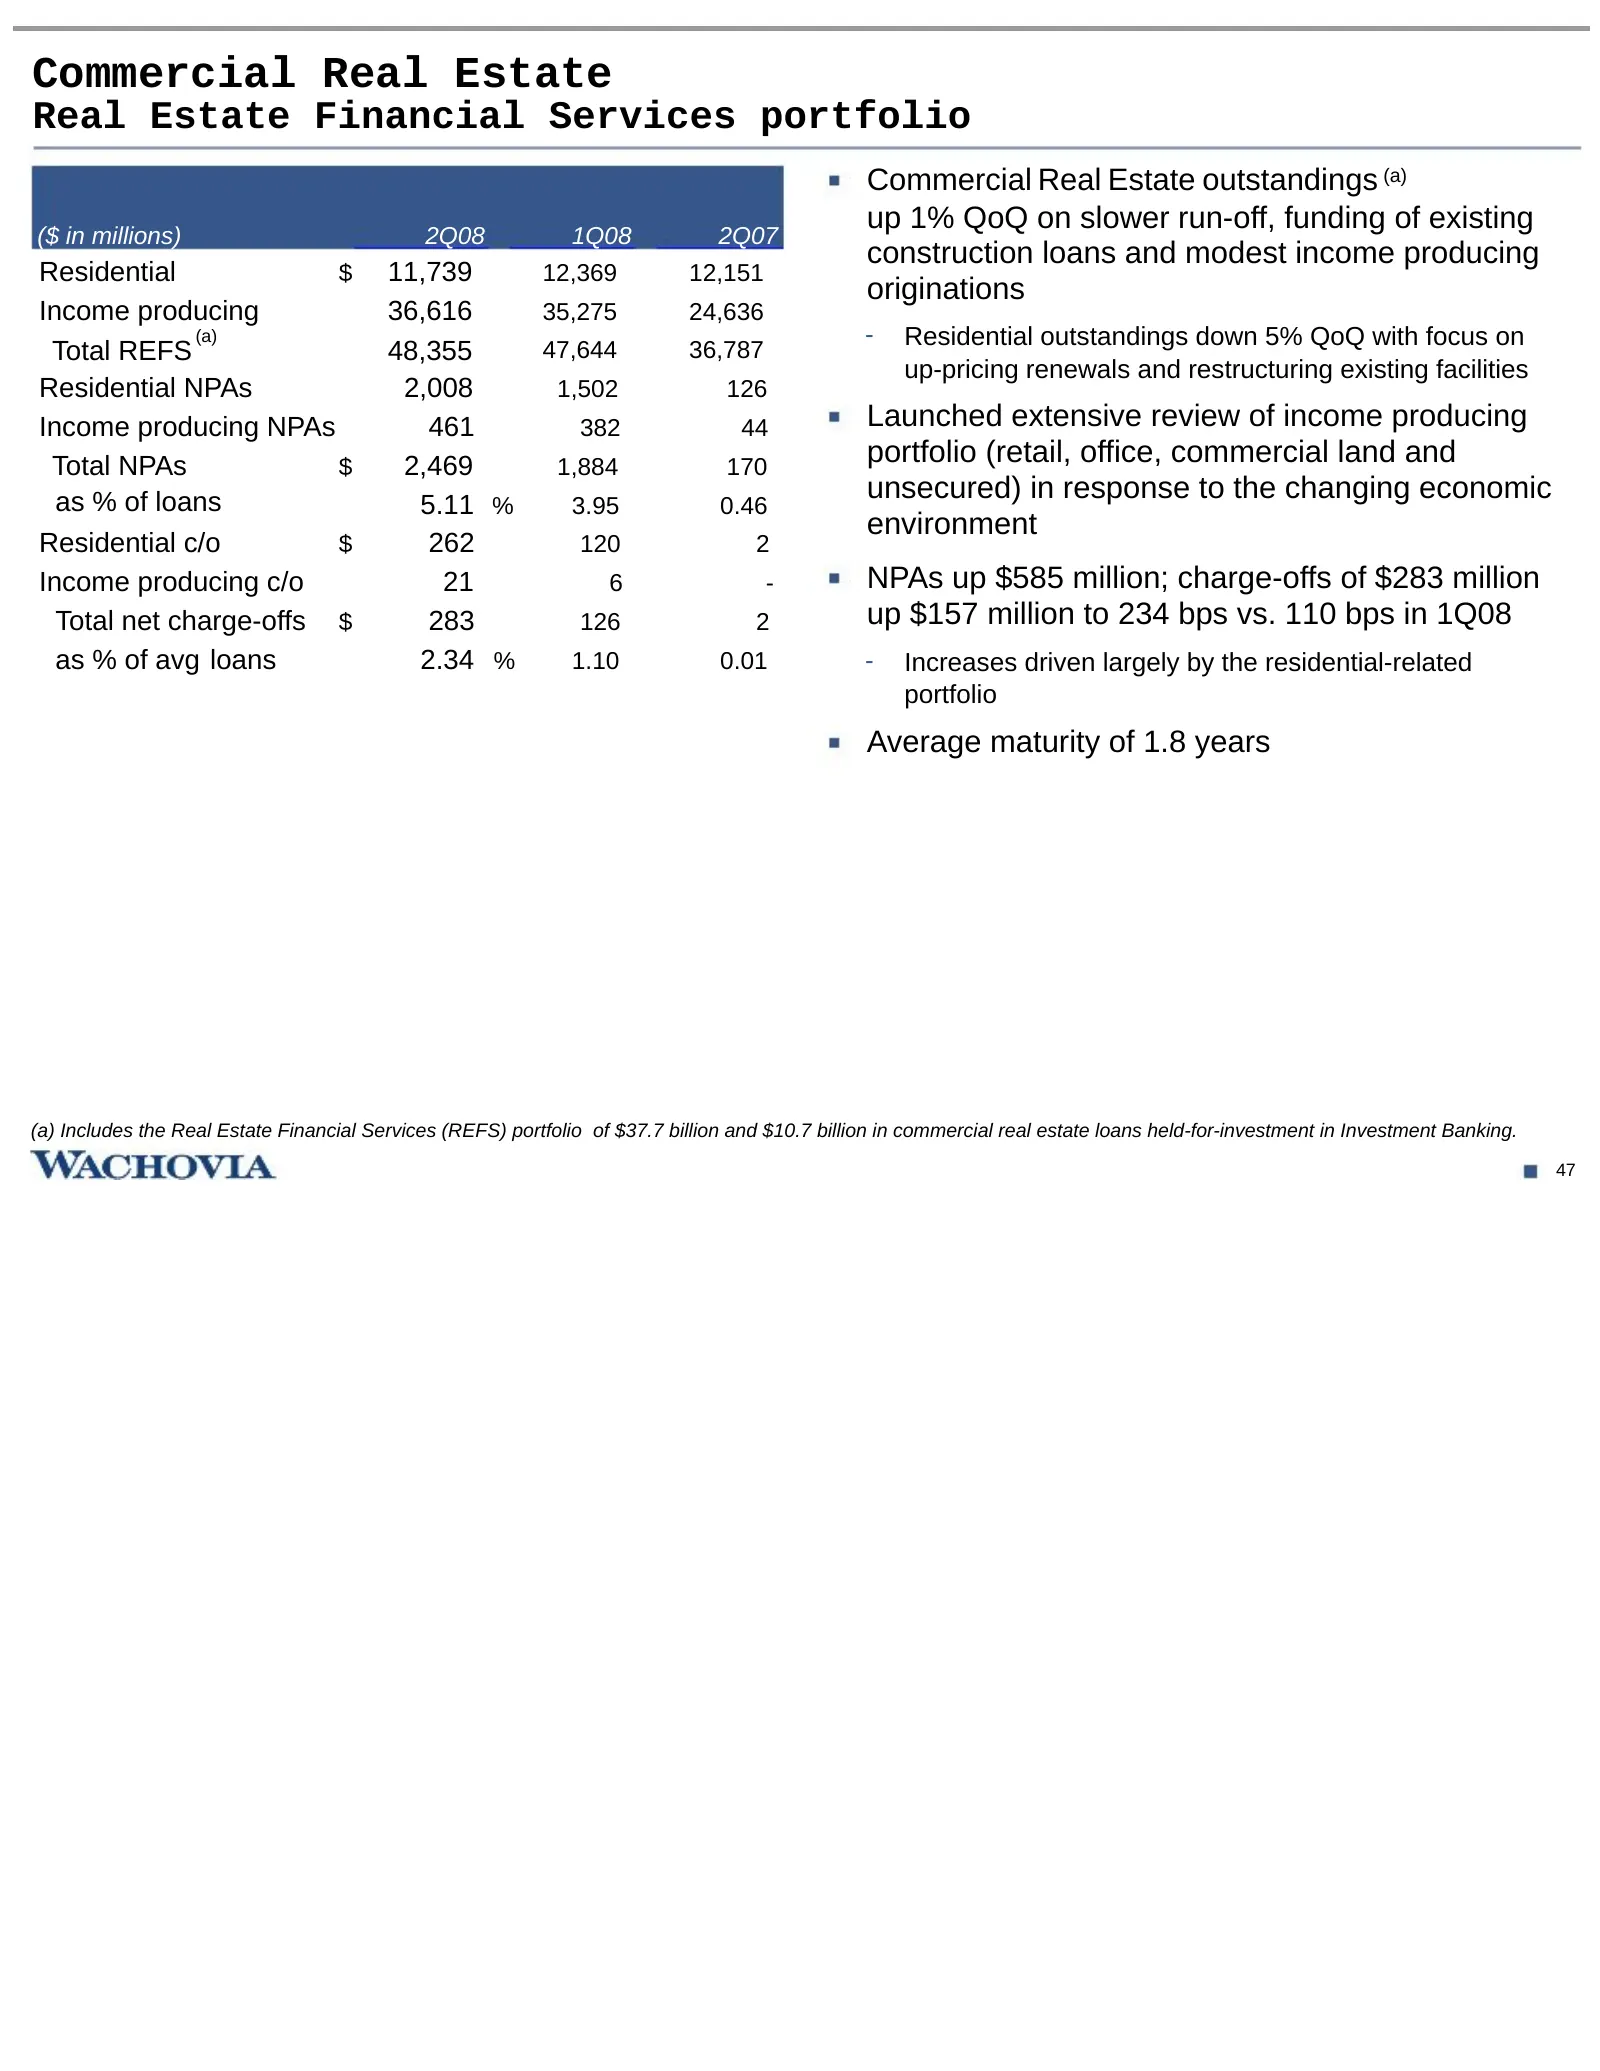
Commercial Real Estate Real Estate Financial Services portfolio Commercial Real Estate outstandings (a) up 1% QoQ on slower run-off, funding of existing ($ in millions) 2Q08 1Q08 2Q07 construction loans and modest income producing Residential $ 11,739 12,369 12,151 originations Income producing 36,6
Slide 49: Real Estate Financial Services
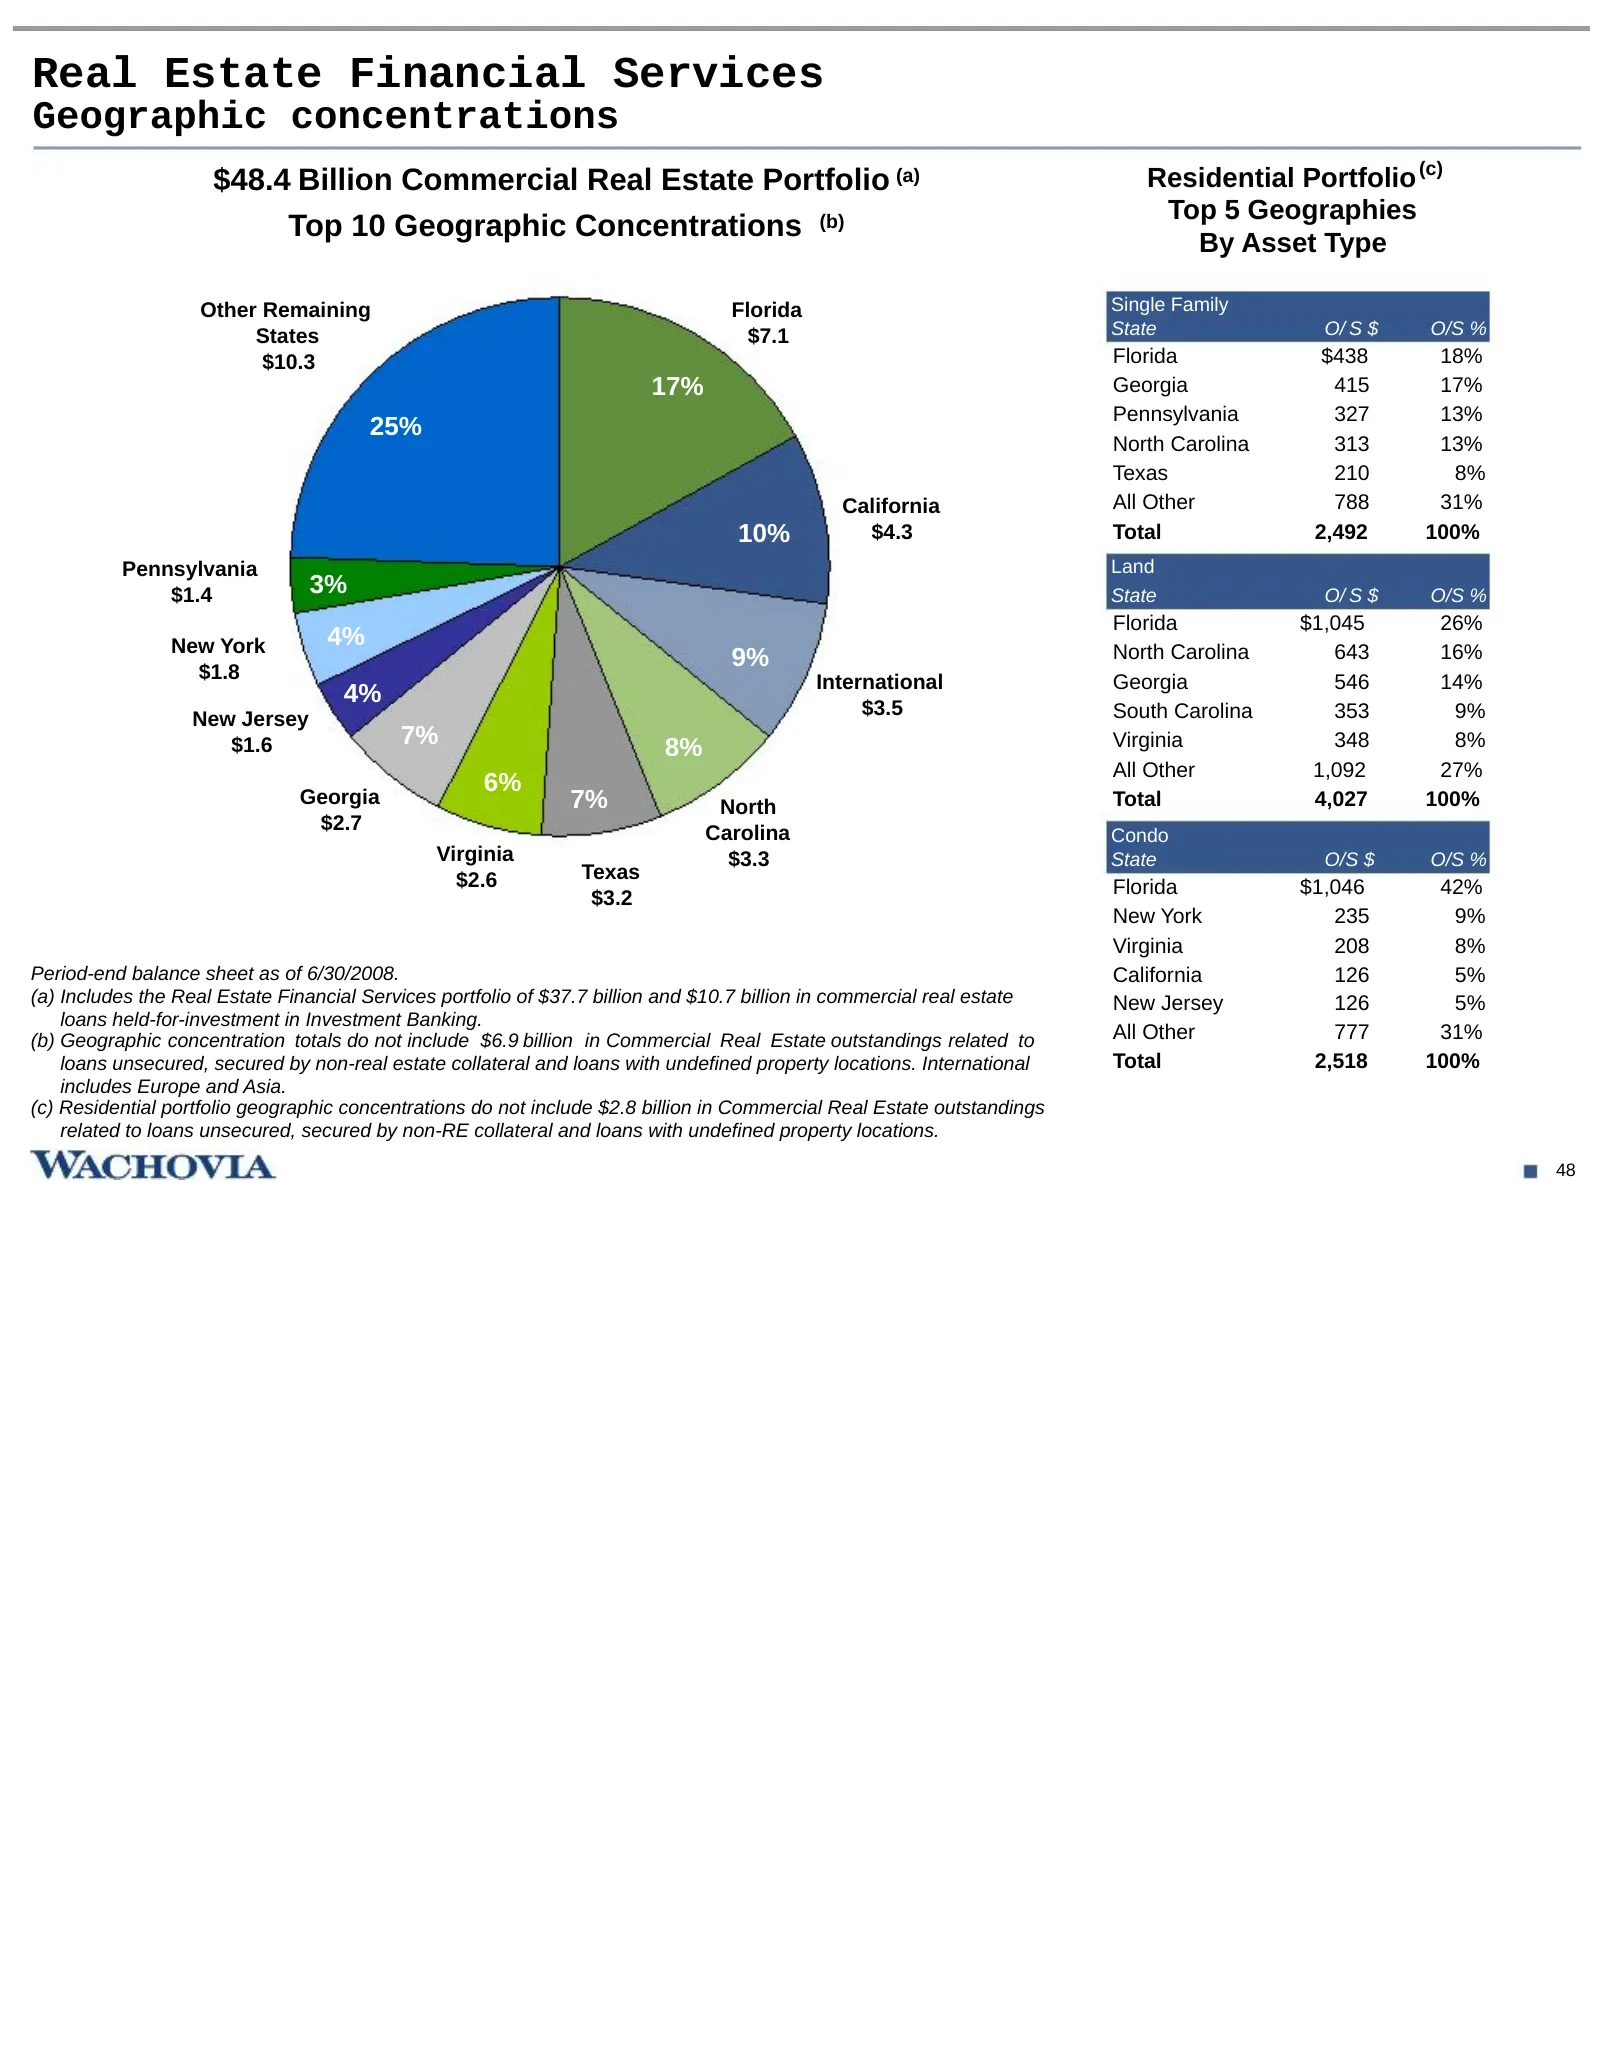
Real Estate Financial Services Geographic concentrations $48.4 Billion Commercial Real Estate Portfolio (a) Residential Portfolio (c) Top 5 Geographies Top 10 Geographic Concentrations (b) By Asset Type Other Remaining Florida Single Family States $7.1 State O/ S $ O/S % $10.3 Florida $438 18% 17% G
Slide 50: Real Estate Financial Services
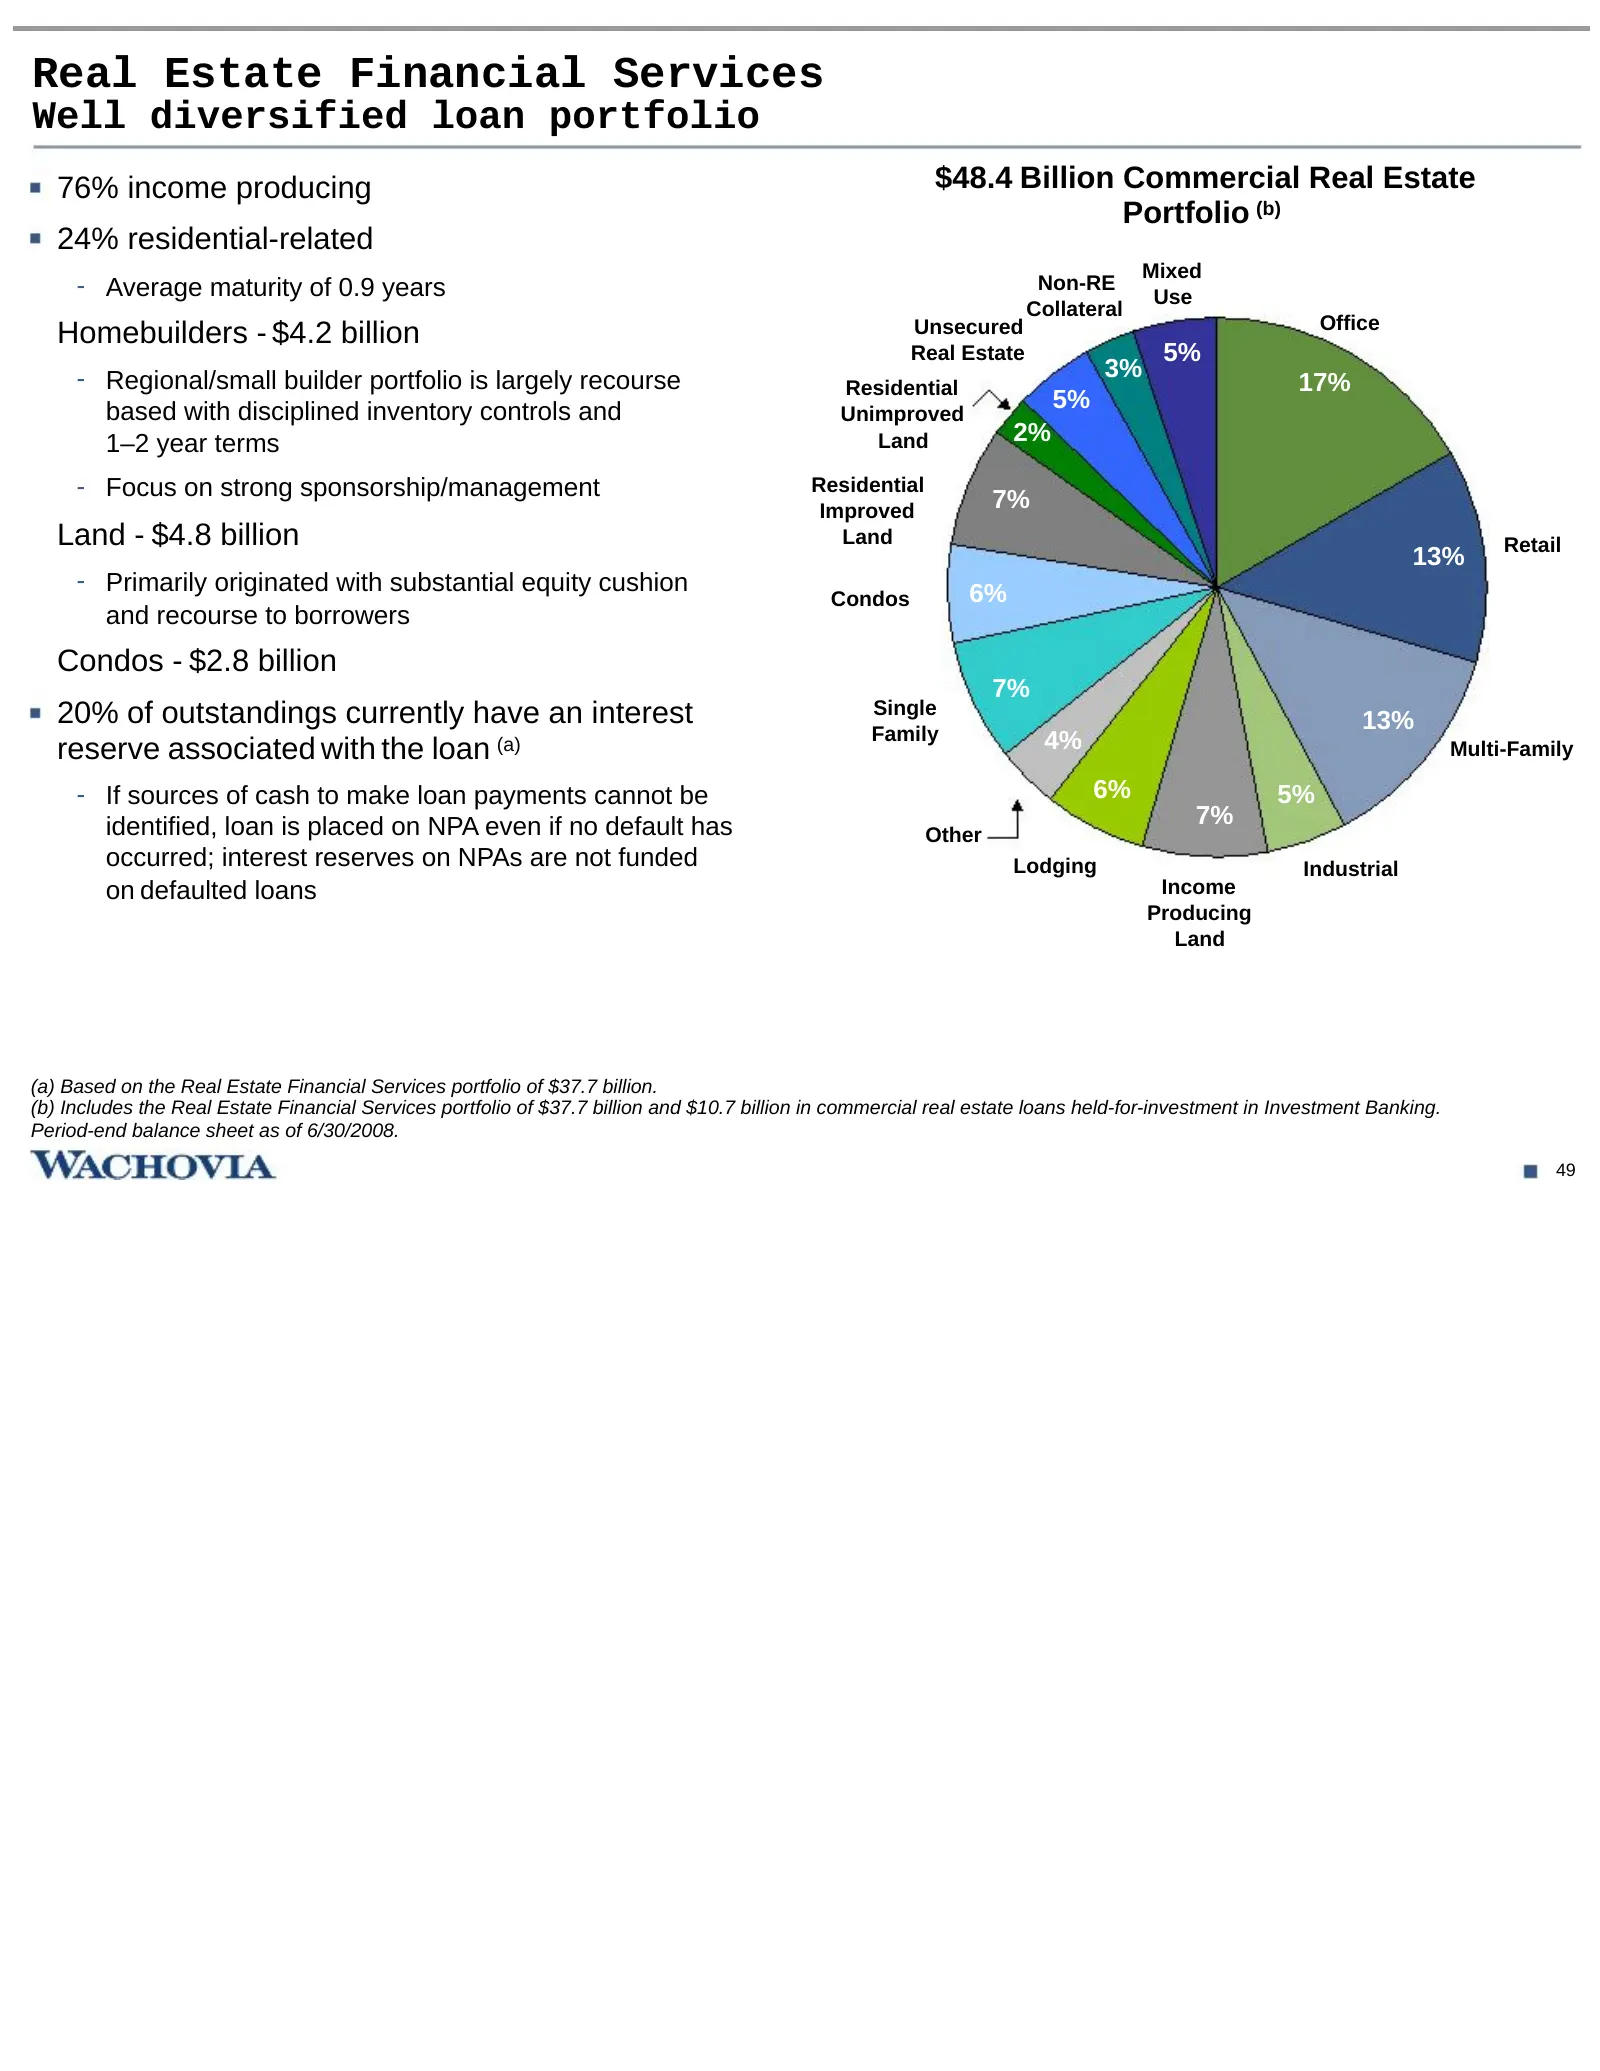
Real Estate Financial Services Well diversified loan portfolio 76% income producing $48.4 Billion Commercial Real Estate Portfolio (b) 24% residential-related Mixed - Average maturity of 0.9 years Non-RE Use Collateral Unsecured Office Homebuilders - $4.2 billion Real Estate 5% - Regional/small buil
Slide 51: Goodwill impairment
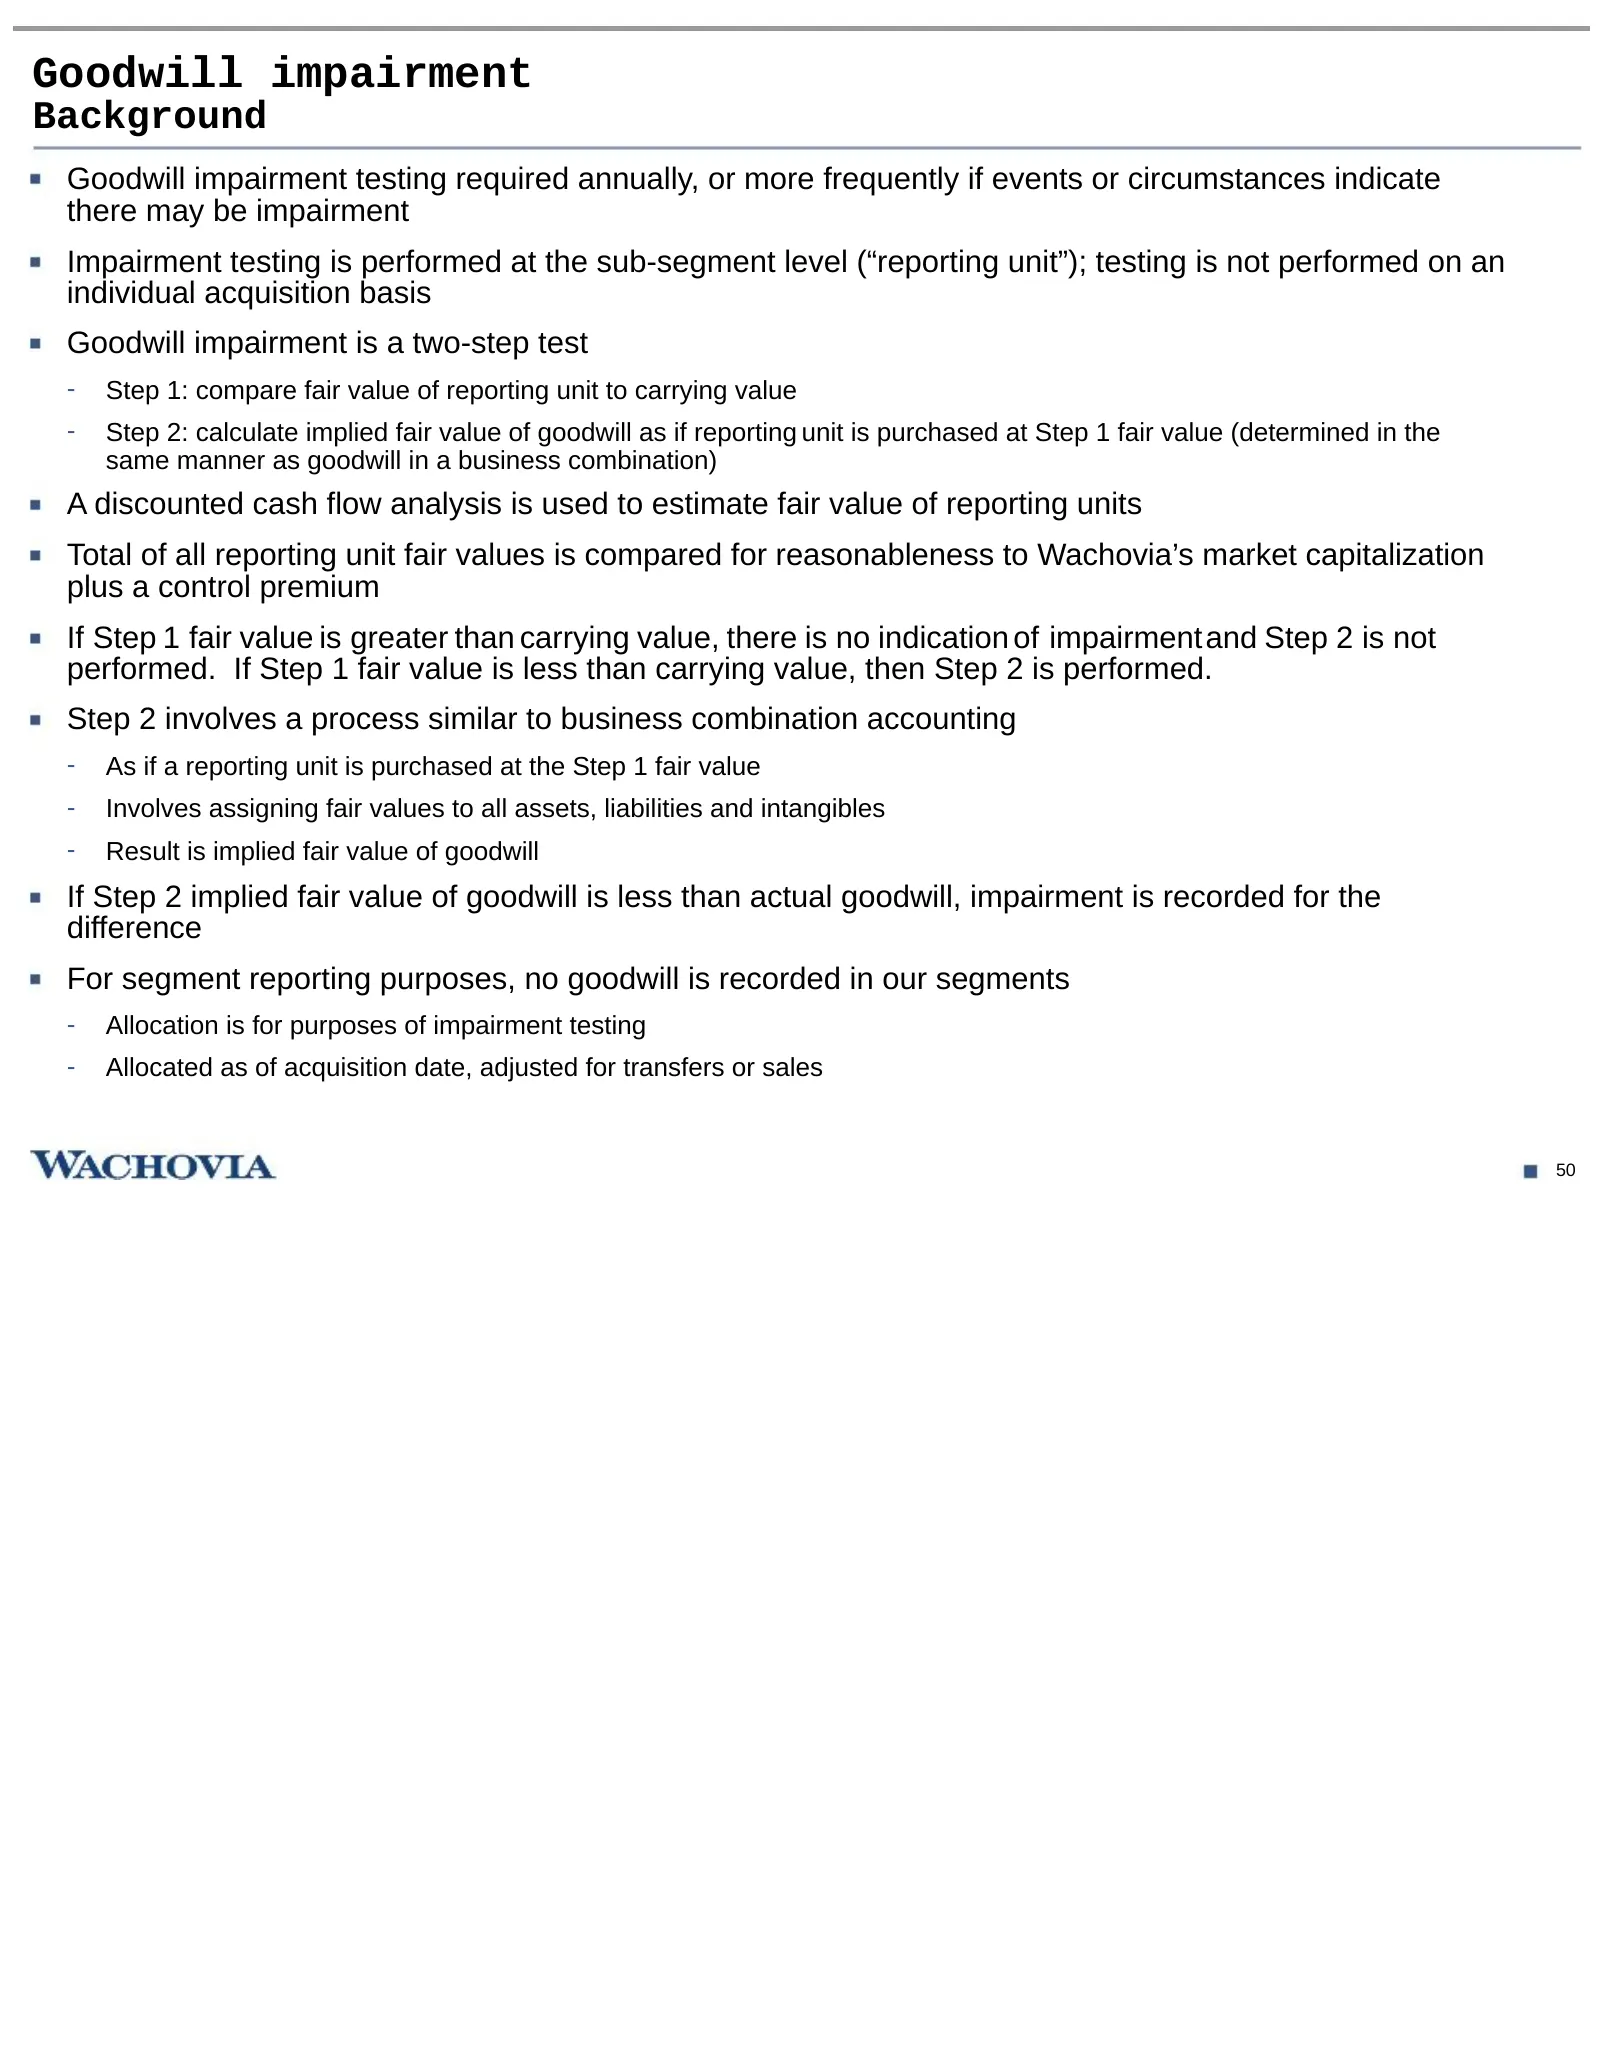
Goodwill impairment Background Goodwill impairment testing required annually, or more frequently if events or circumstances indicate there may be impairment Impairment testing is performed at the sub-segment level (“reporting unit”); testing is not performed on an individual acquisition basis Goodwi
Slide 52: Goodwill impairment
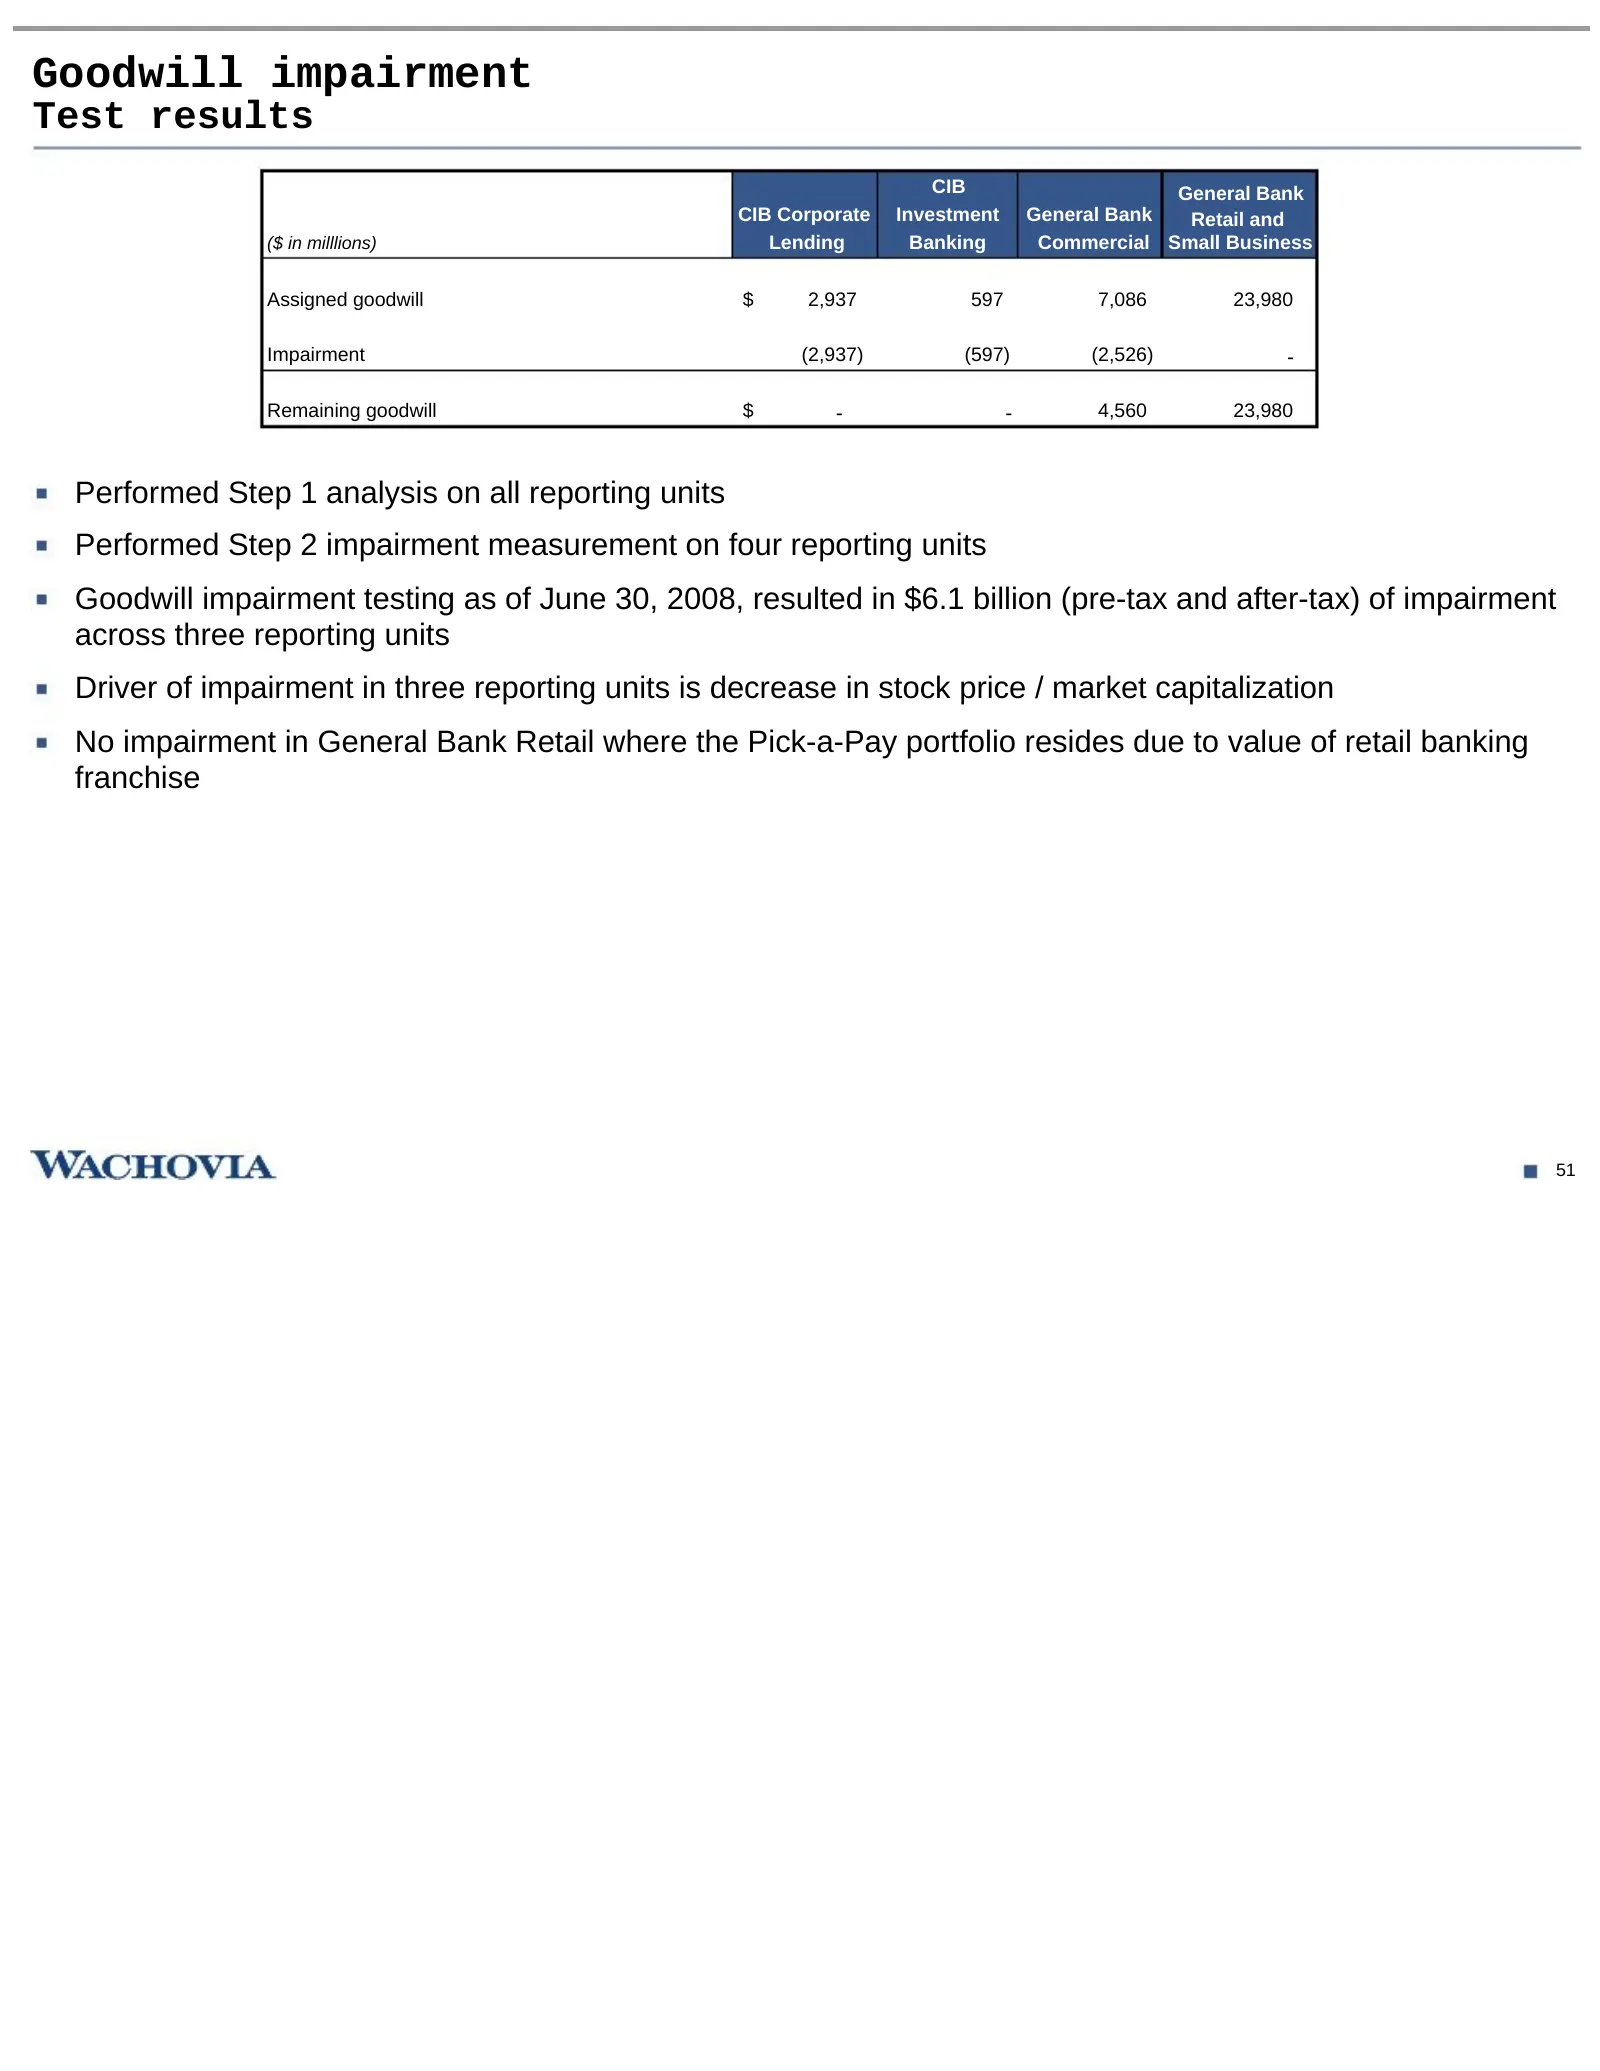
Goodwill impairment Test results CIB General Bank CIB Corporate Investment General Bank Retail and ($ in milllions) Lending Banking Commercial Small Business Assigned goodwill $ 2,937 597 7,086 23,980 Impairment (2,937) (597) (2,526) - Remaining goodwill $ - - 4,560 23,980 Performed Step 1 analysis
Slide 53: Cautionary statement
Cautionary statement The foregoing materials and management’s discussion of them may contain, among other things, certain forward-looking statements with respect to Wachovia, as well as the goals, plans, objectives, intentions, expectations, financial condition, results of operations, future perform
Slide 54: Notes on non-GAAP financial measures
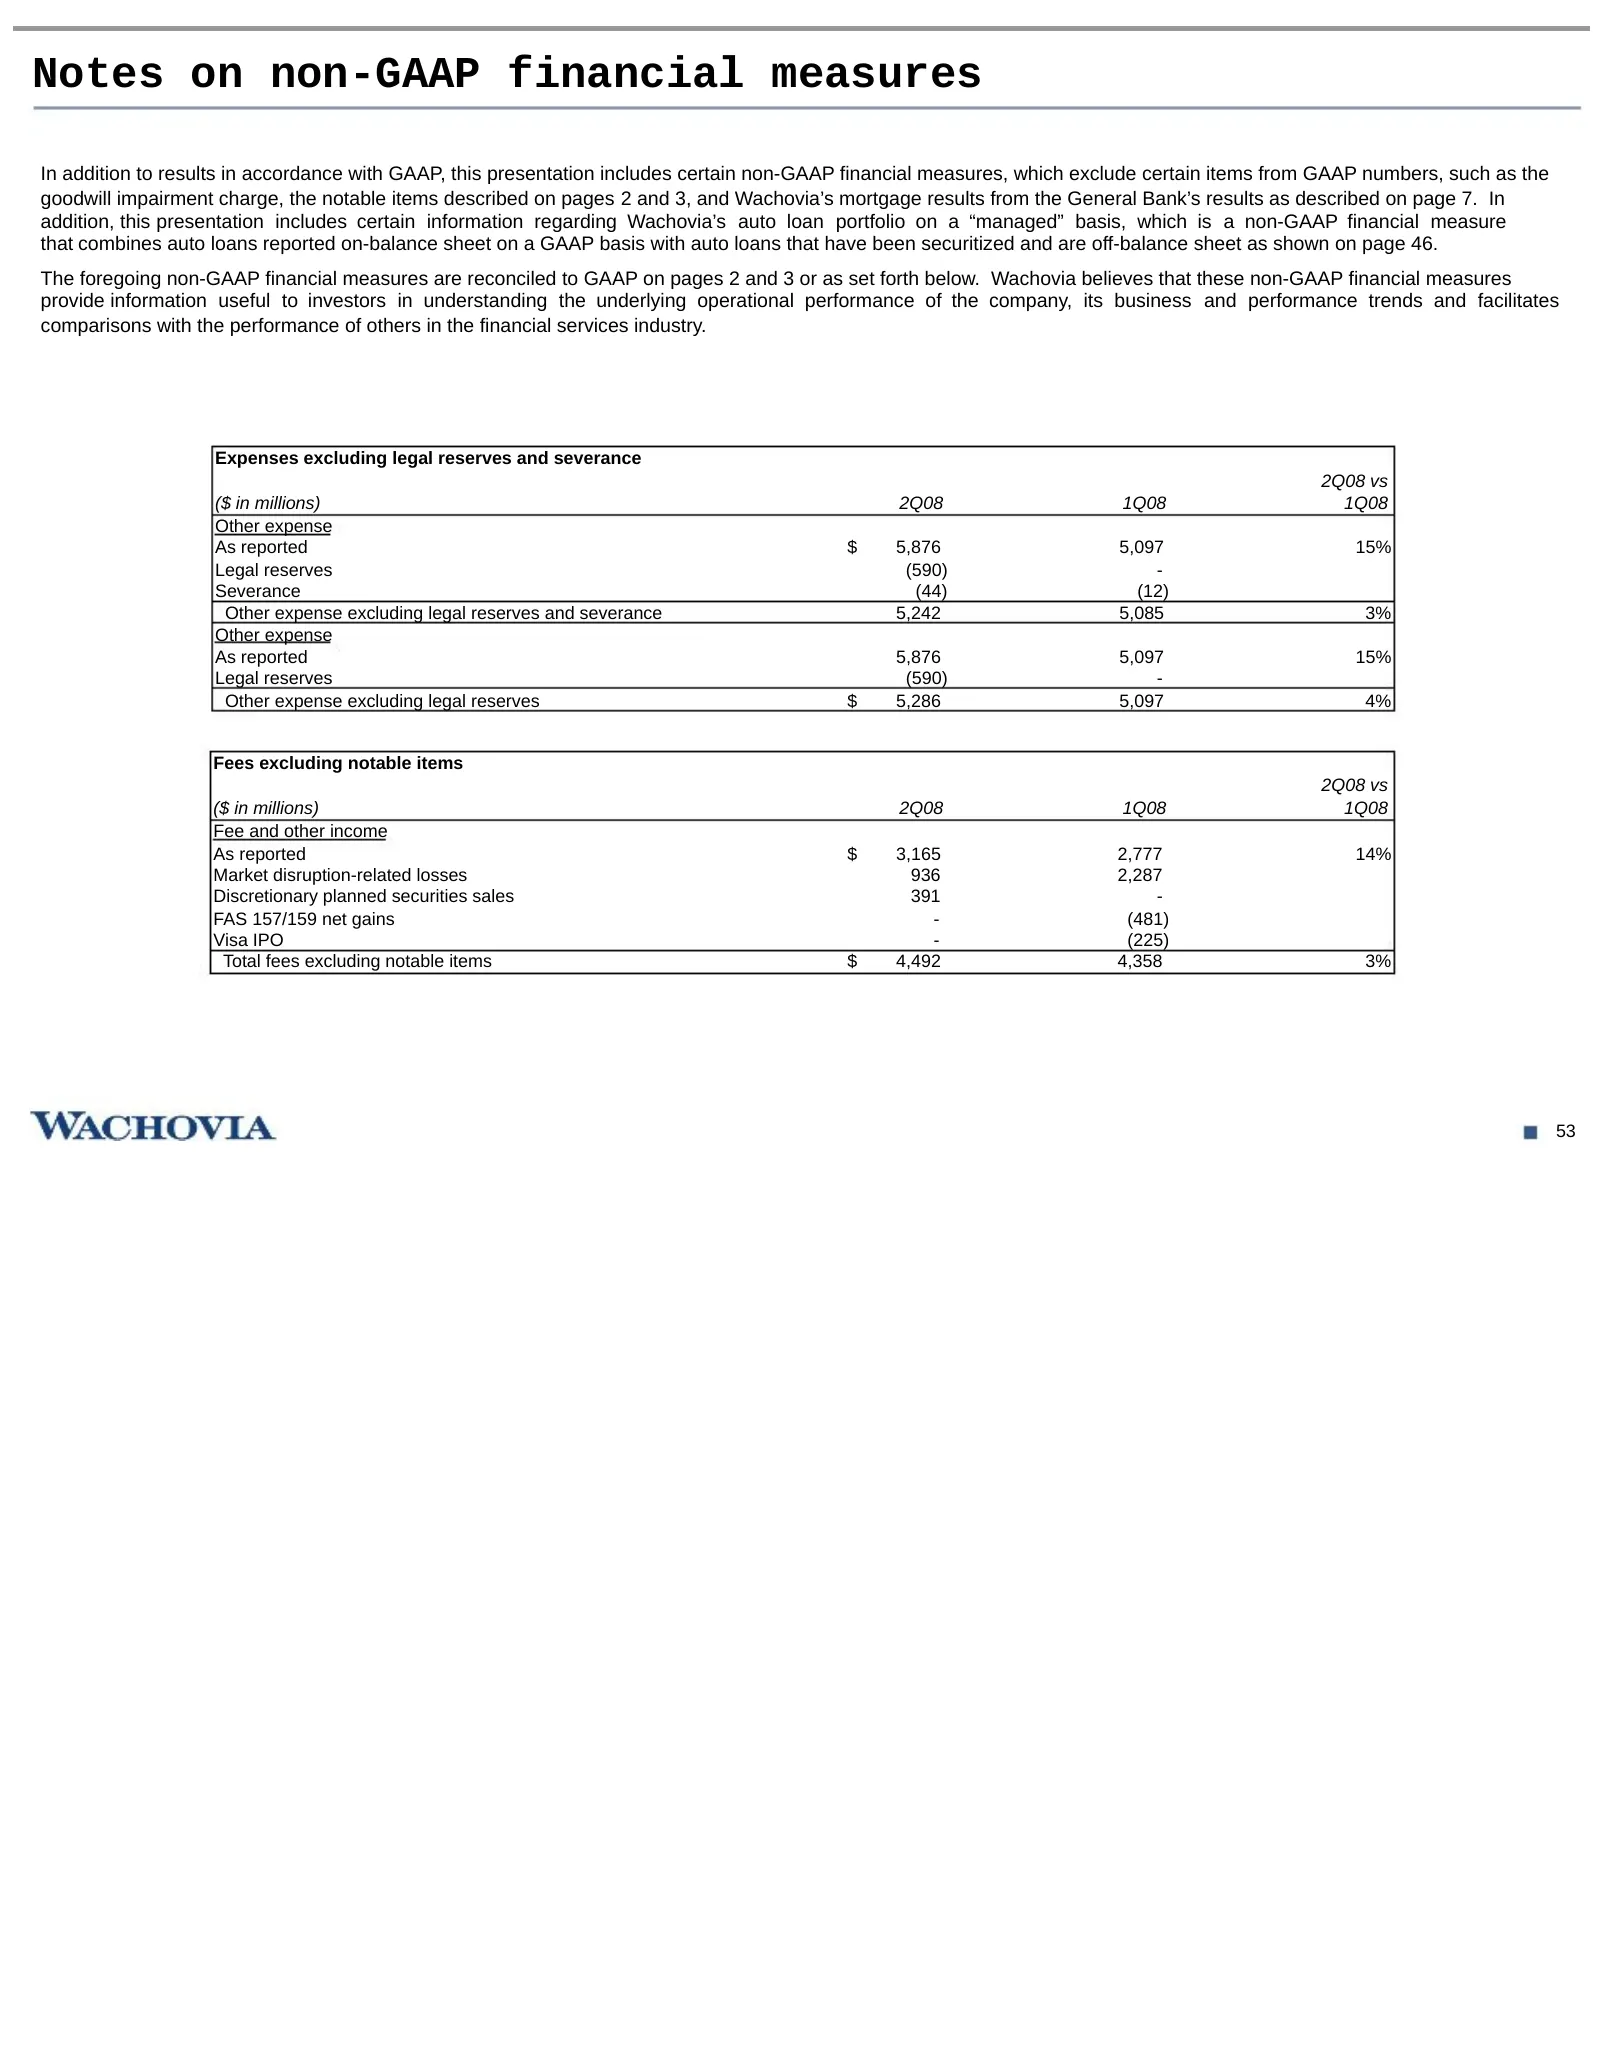
Notes on non-GAAP financial measures In addition to results in accordance with GAAP, this presentation includes certain non-GAAP financial measures, which exclude certain items from GAAP numbers, such as the goodwill impairment charge, the notable items described on pages 2 and 3, and Wachovia’s mor
Slide 55: Notes on non-GAAP financial measures
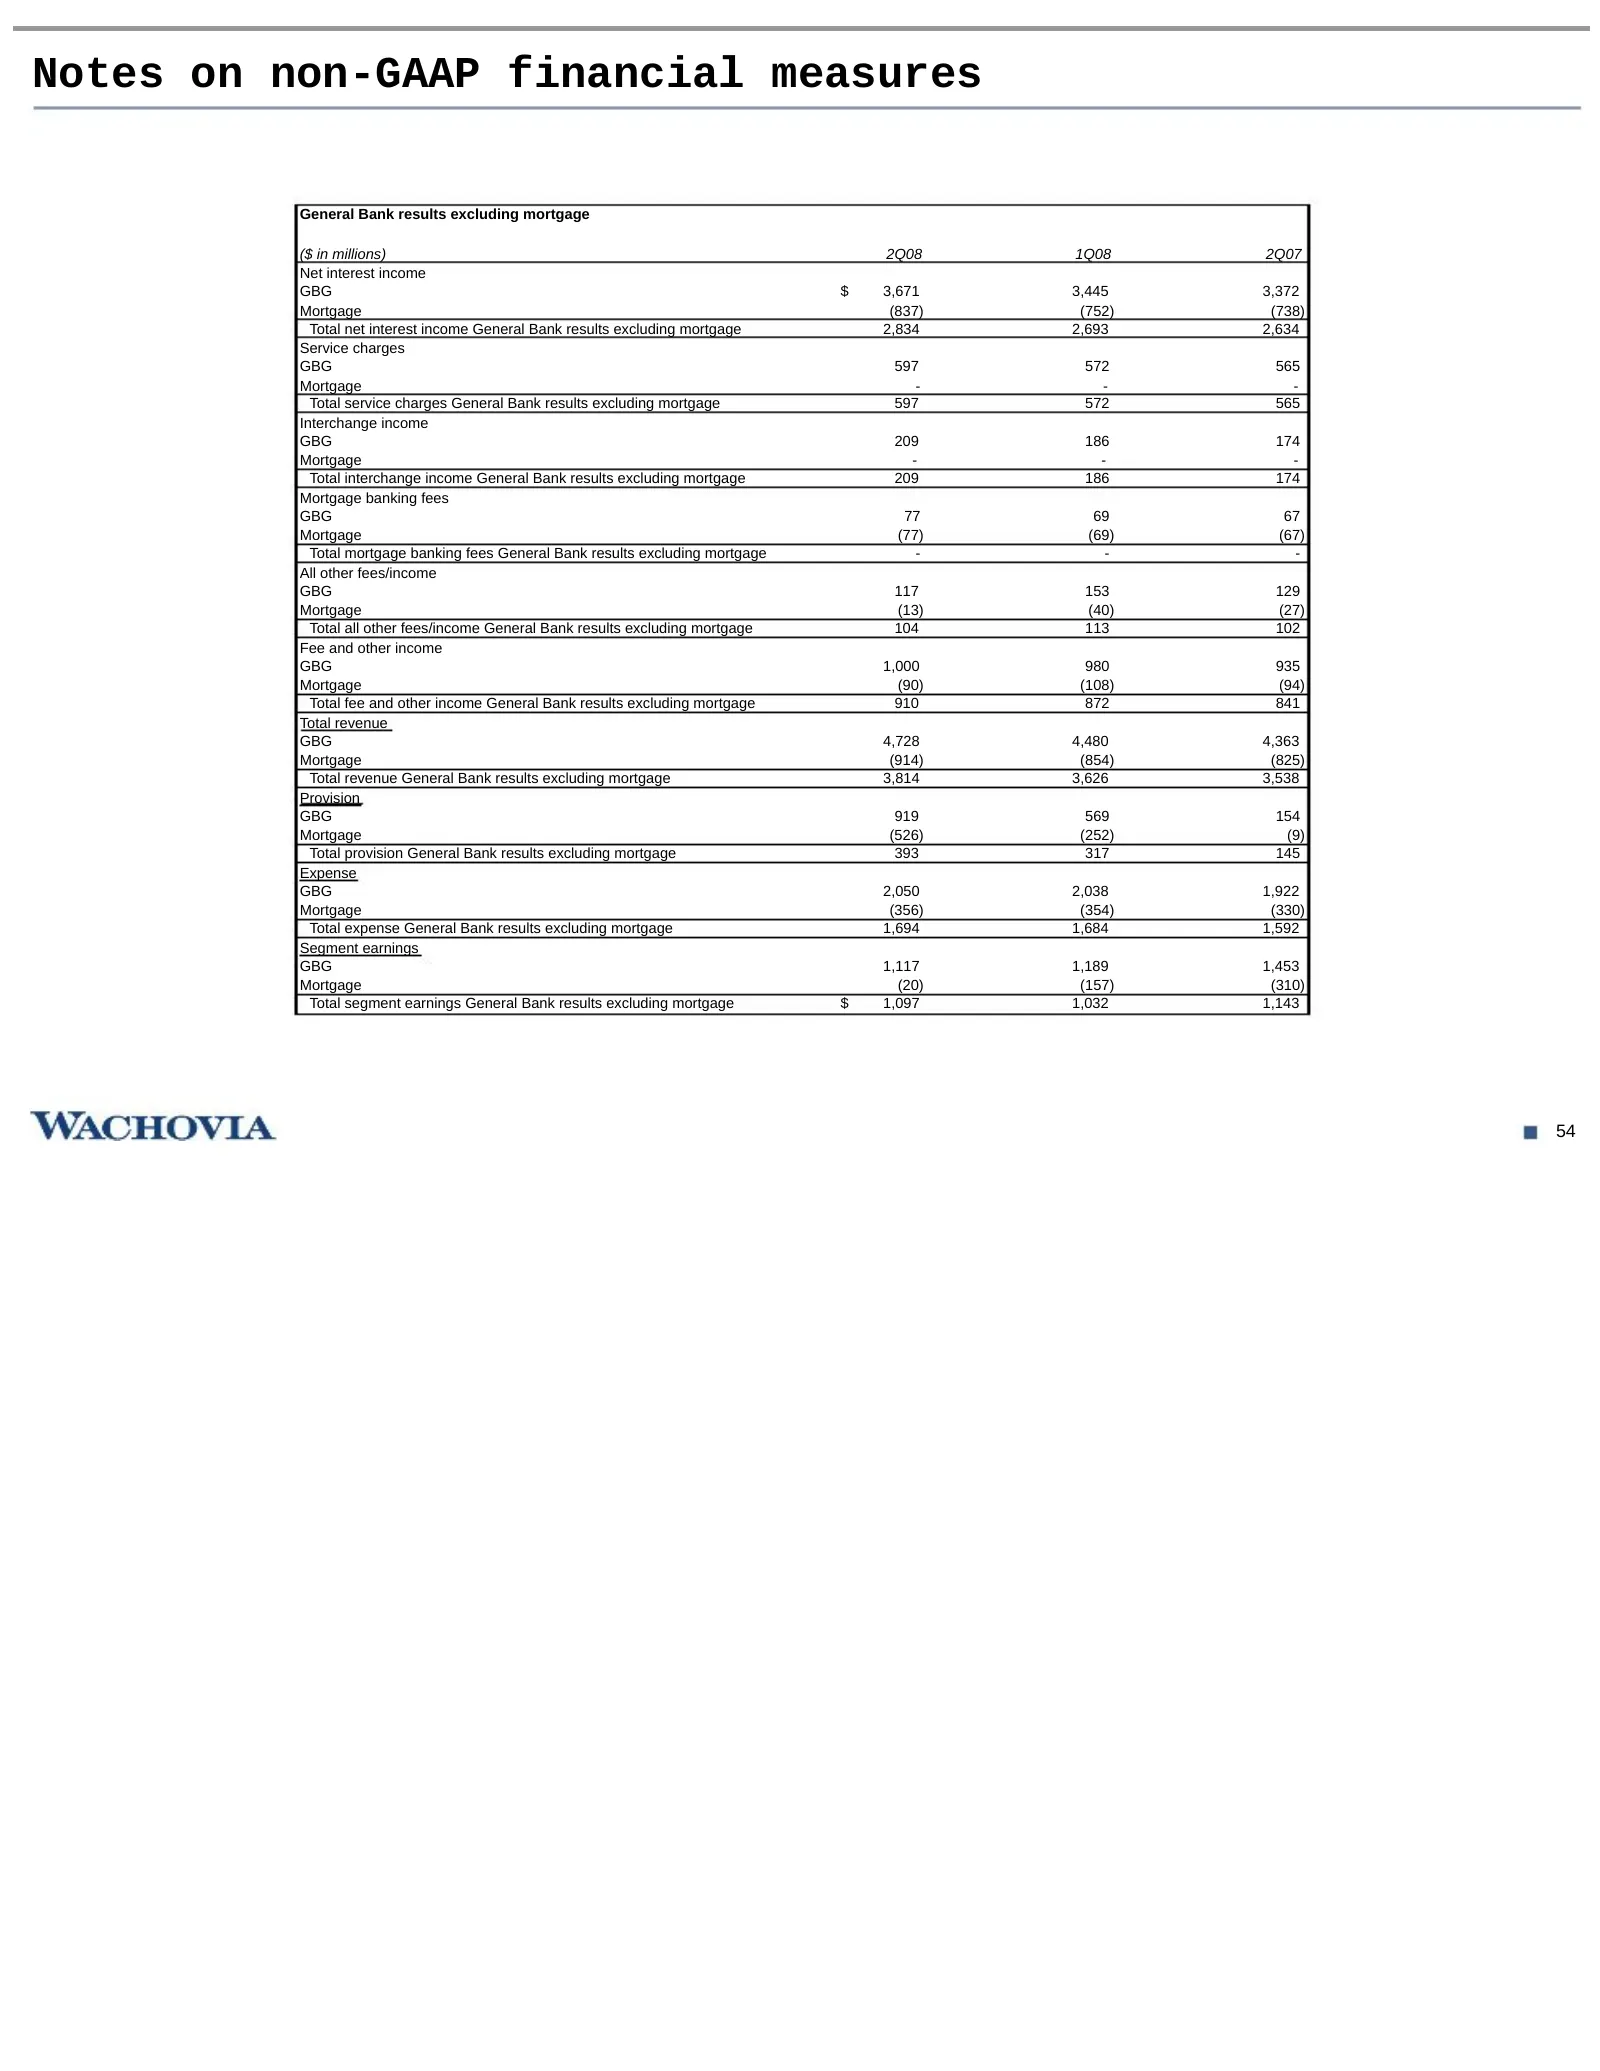
Notes on non-GAAP financial measures General Bank results excluding mortgage ($ in millions) 2Q08 1Q08 2Q07 Net interest income GBG $ 3,671 3,445 3,372 Mortgage (837) (752) (738) Total net interest income General Bank results excluding mortgage 2,834 2,693 2,634 Service charges GBG 597 572 565 Mortg
Slide 56: Notes on non-GAAP financial measures
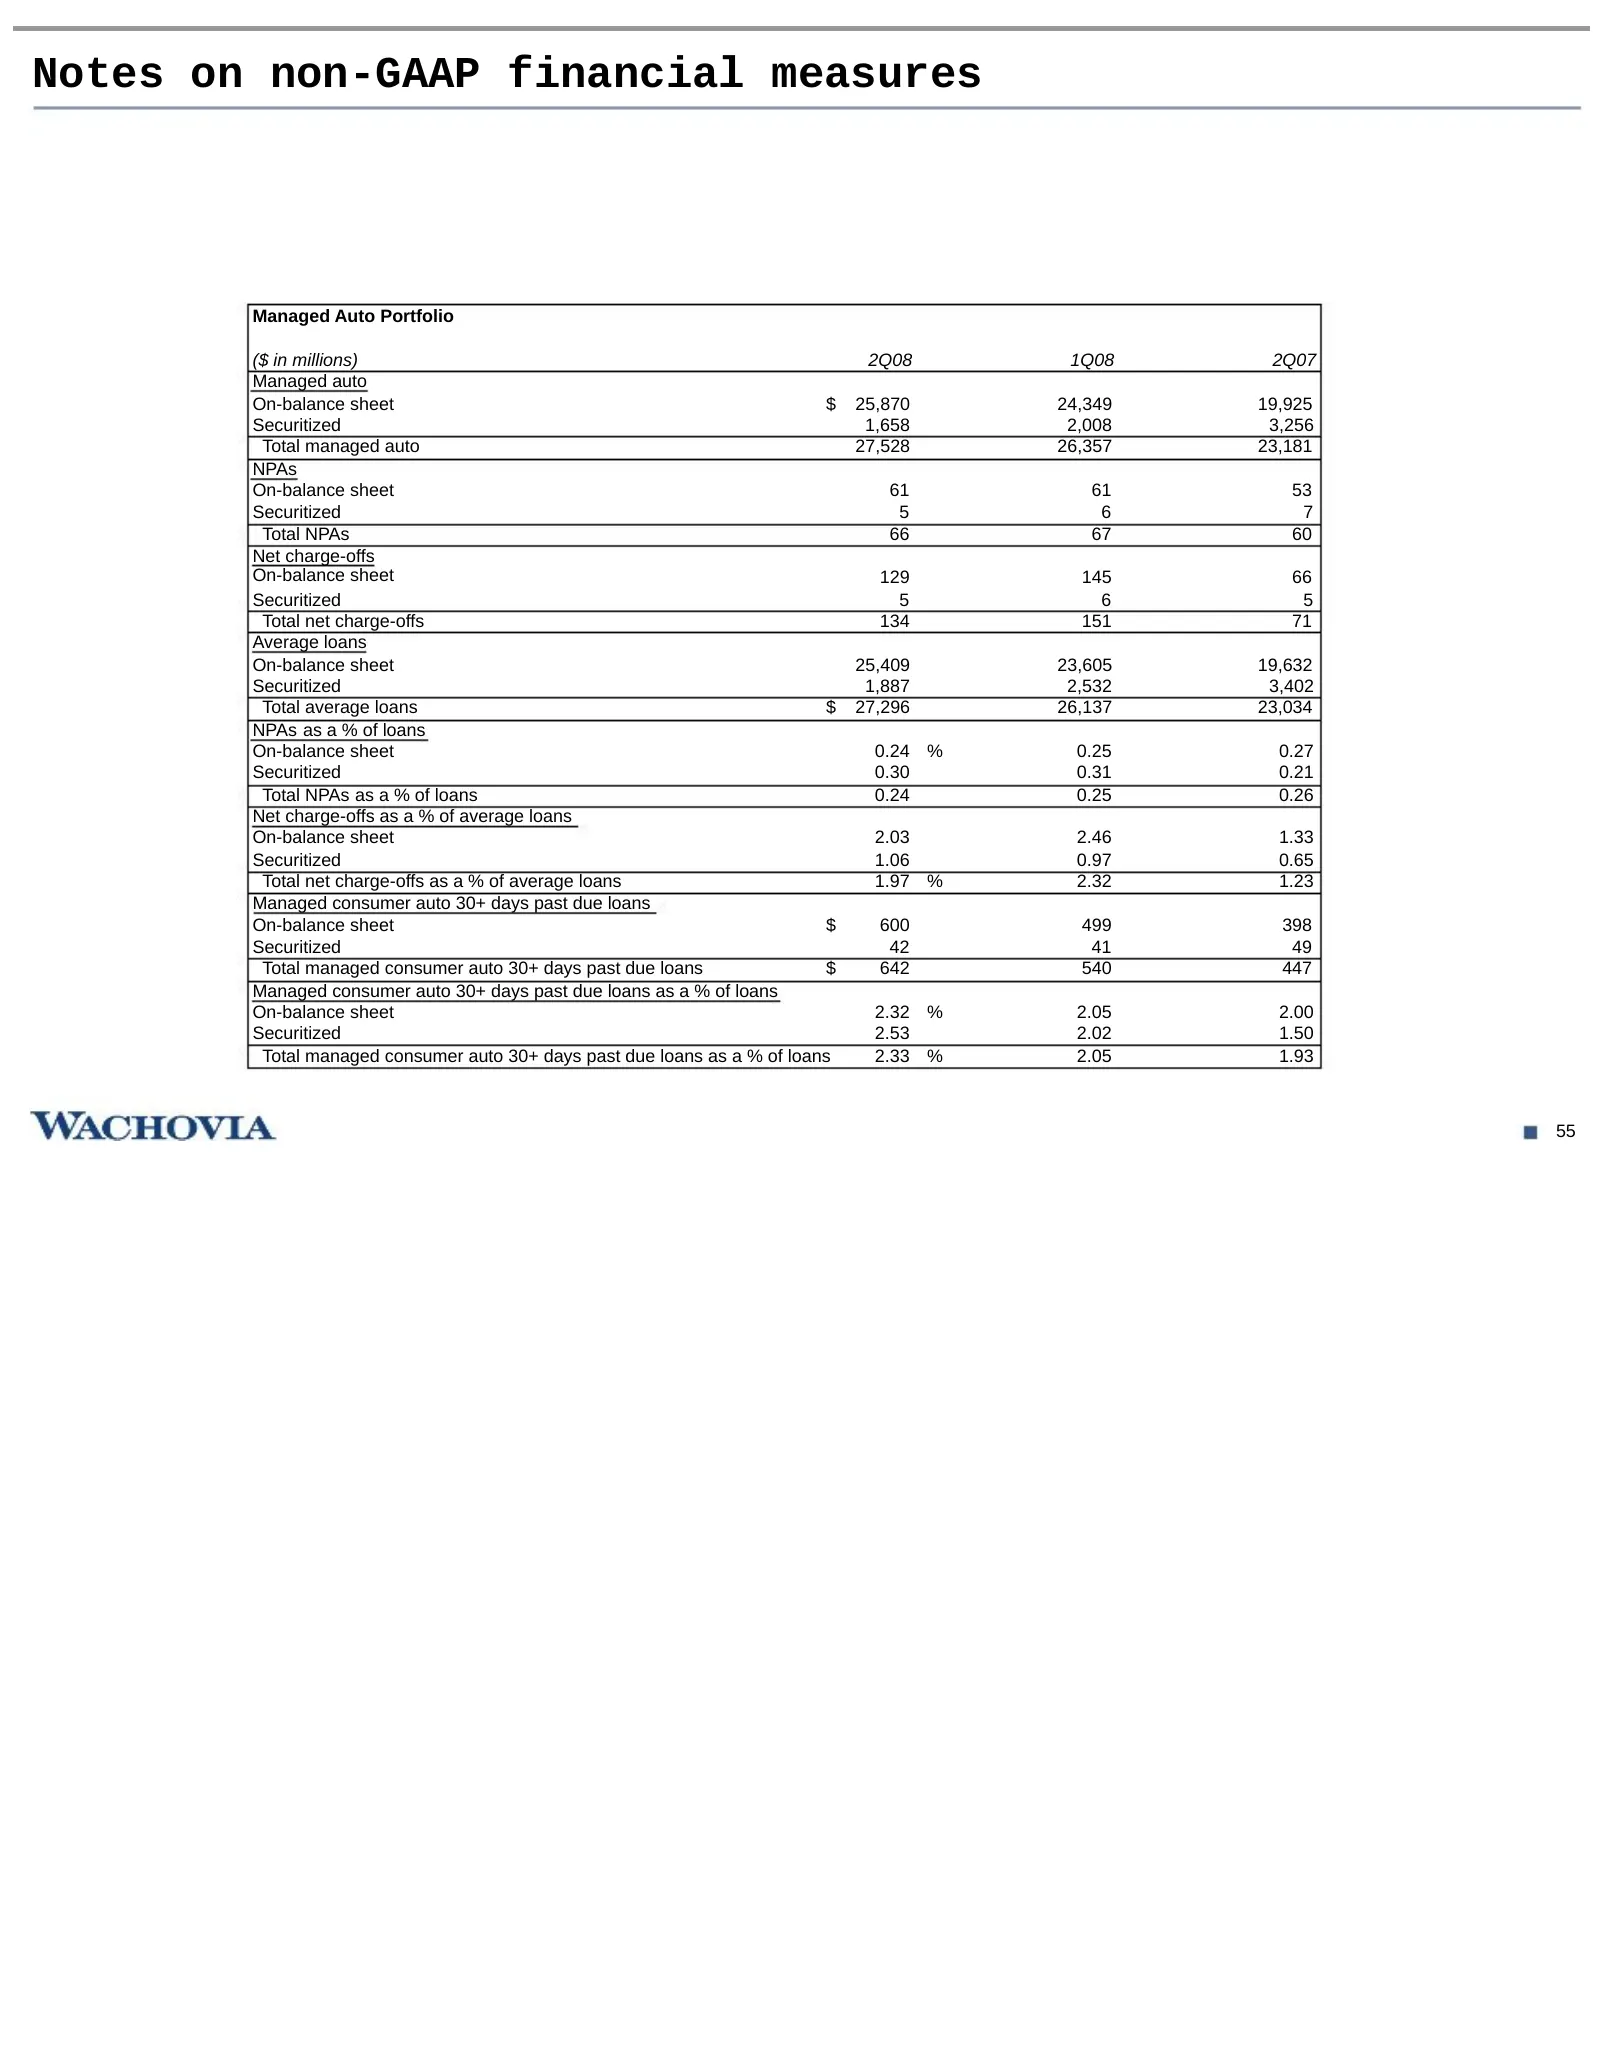
Notes on non-GAAP financial measures Managed Auto Portfolio ($ in millions) 2Q08 1Q08 2Q07 Managed auto On-balance sheet $ 25,870 24,349 19,925 Securitized 1,658 2,008 3,256 Total managed auto 27,528 26,357 23,181 NPAs On-balance sheet 61 61 53 Securitized 5 6 7 Total NPAs 66 67 60 Net charge-offs O
Source: SEC EDGAR · 8-K filed Jul 22, 2008
More decks from Wachovia Corp New
 Q3 2008 Earnings Presentation41 slides · Oct 22, 2008
 Merger or Acquisition (October 2008)15 slides · Oct 3, 2008
 Lehman Brothers Global Financial Services Conference 200828 slides · Sep 9, 2008
 IPO Roadshow (April 2008)104 slides · Apr 14, 2008
 Q1 2008 Earnings Presentation45 slides · Apr 14, 2008
 Q4 2007 Earnings Presentation30 slides · Jan 22, 2008