Wachovia Corp New
Wachovia Corp New — Q4 2007 Earnings Presentation
30 slides from Wachovia Corp New's earnings presentation, Jan 22, 2008
Slide 1: Wachovia Corporation 4Q07 Financial Highlights
Exhibit (99)(b) Wachovia Corporation 4Q07 Financial Highlights January 22, 2008
Slide 2: 4Q07 Earnings highlights
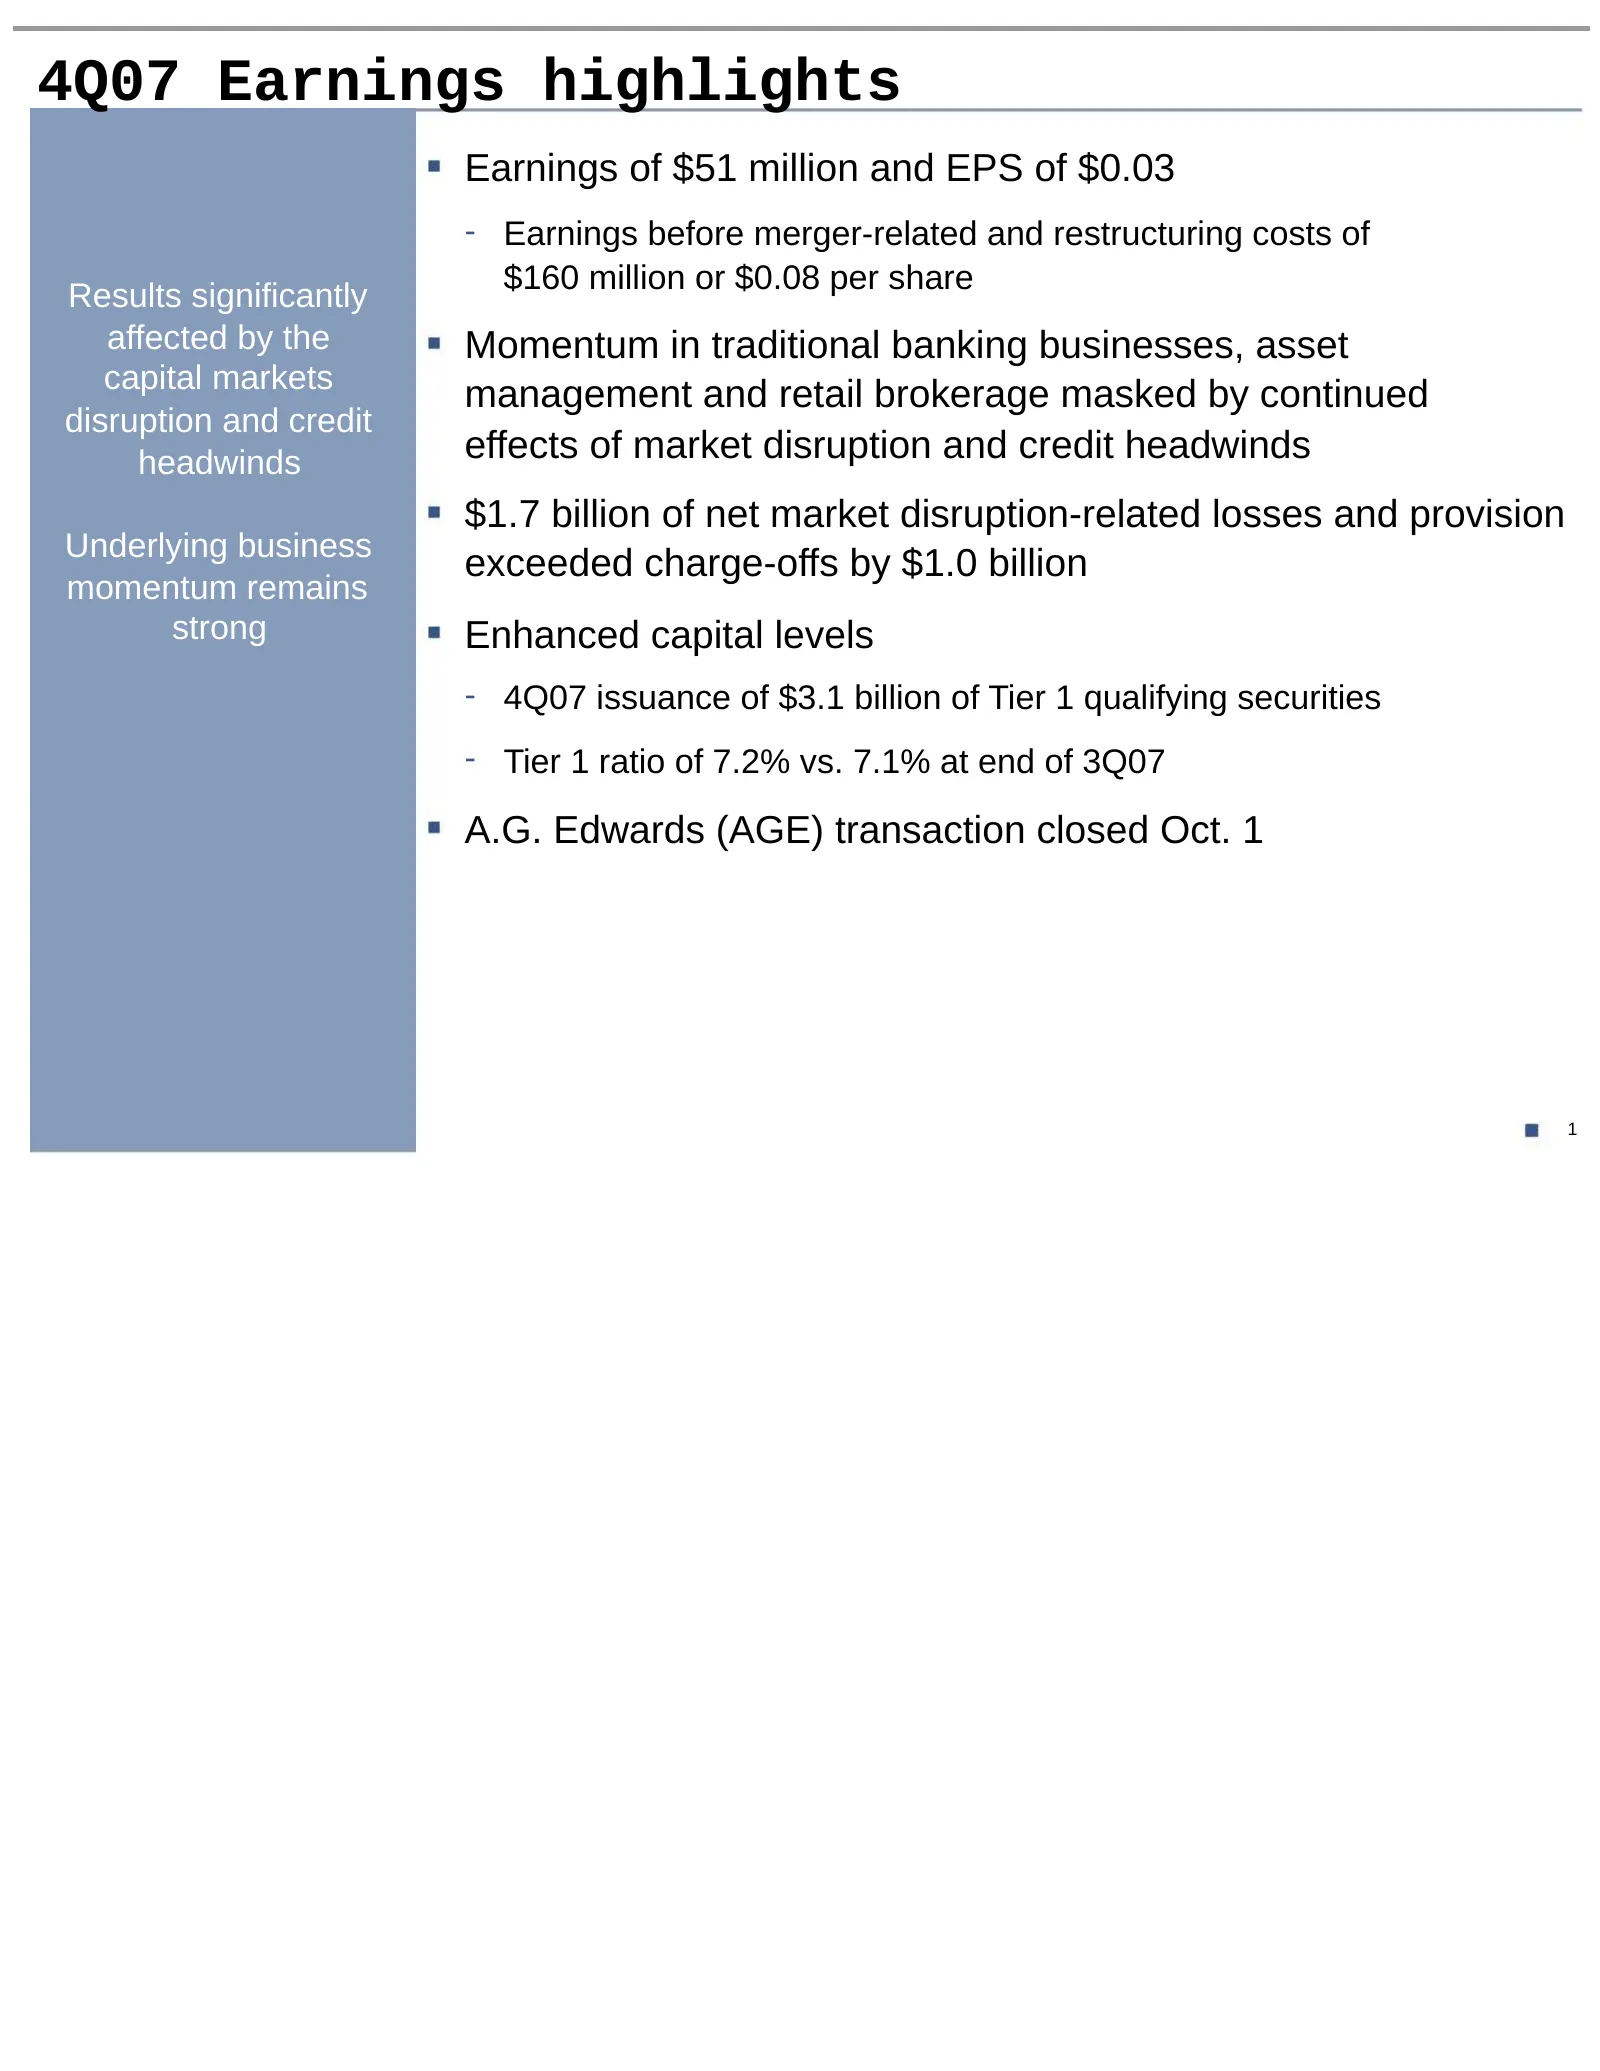
4Q07 Earnings highlights Earnings of $51 million and EPS of $0.03 - Earnings before merger-related and restructuring costs of $160 million or $0.08 per share Results significantly affected by the Momentum in traditional banking businesses, asset capital markets management and retail brokerage masked
Slide 3: Financial highlights
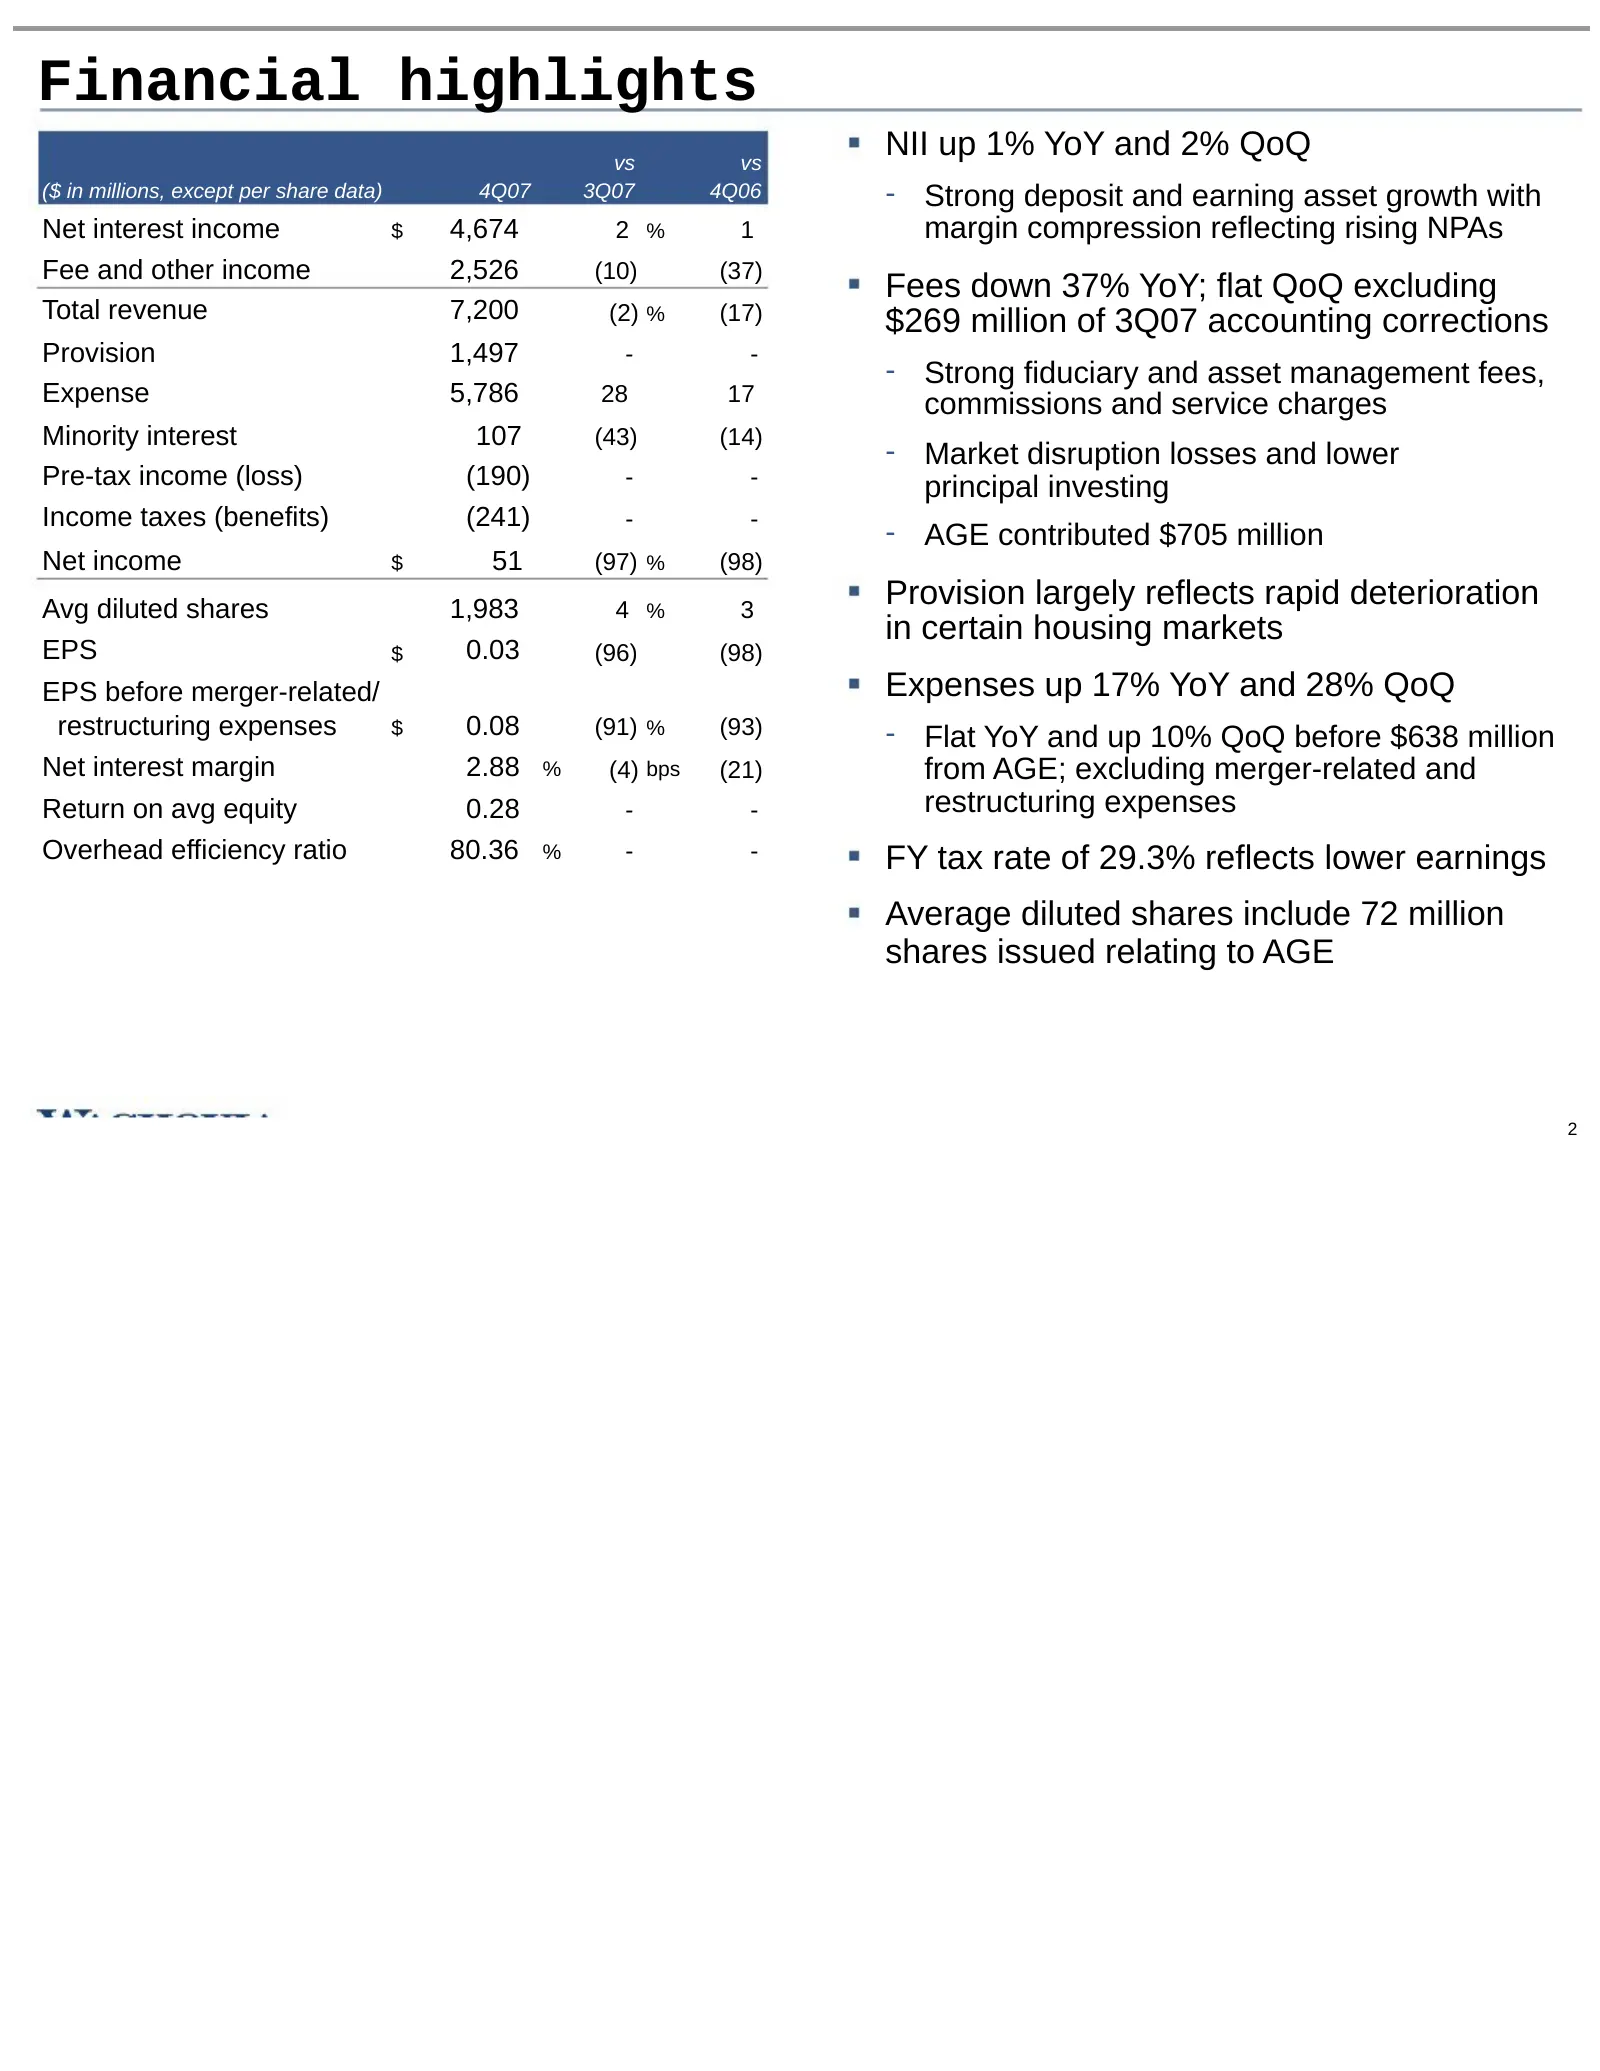
Financial highlights vs vs NII up 1% YoY and 2% QoQ ($ in millions, except per share data) 4Q07 3Q07 4Q06 - Strong deposit and earning asset growth with Net interest income $ 4,674 2 % 1 margin compression reflecting rising NPAs Fee and other income 2,526 (10) (37) Fees down 37% YoY; flat QoQ exclud
Slide 4: Strong liquidity and capital position
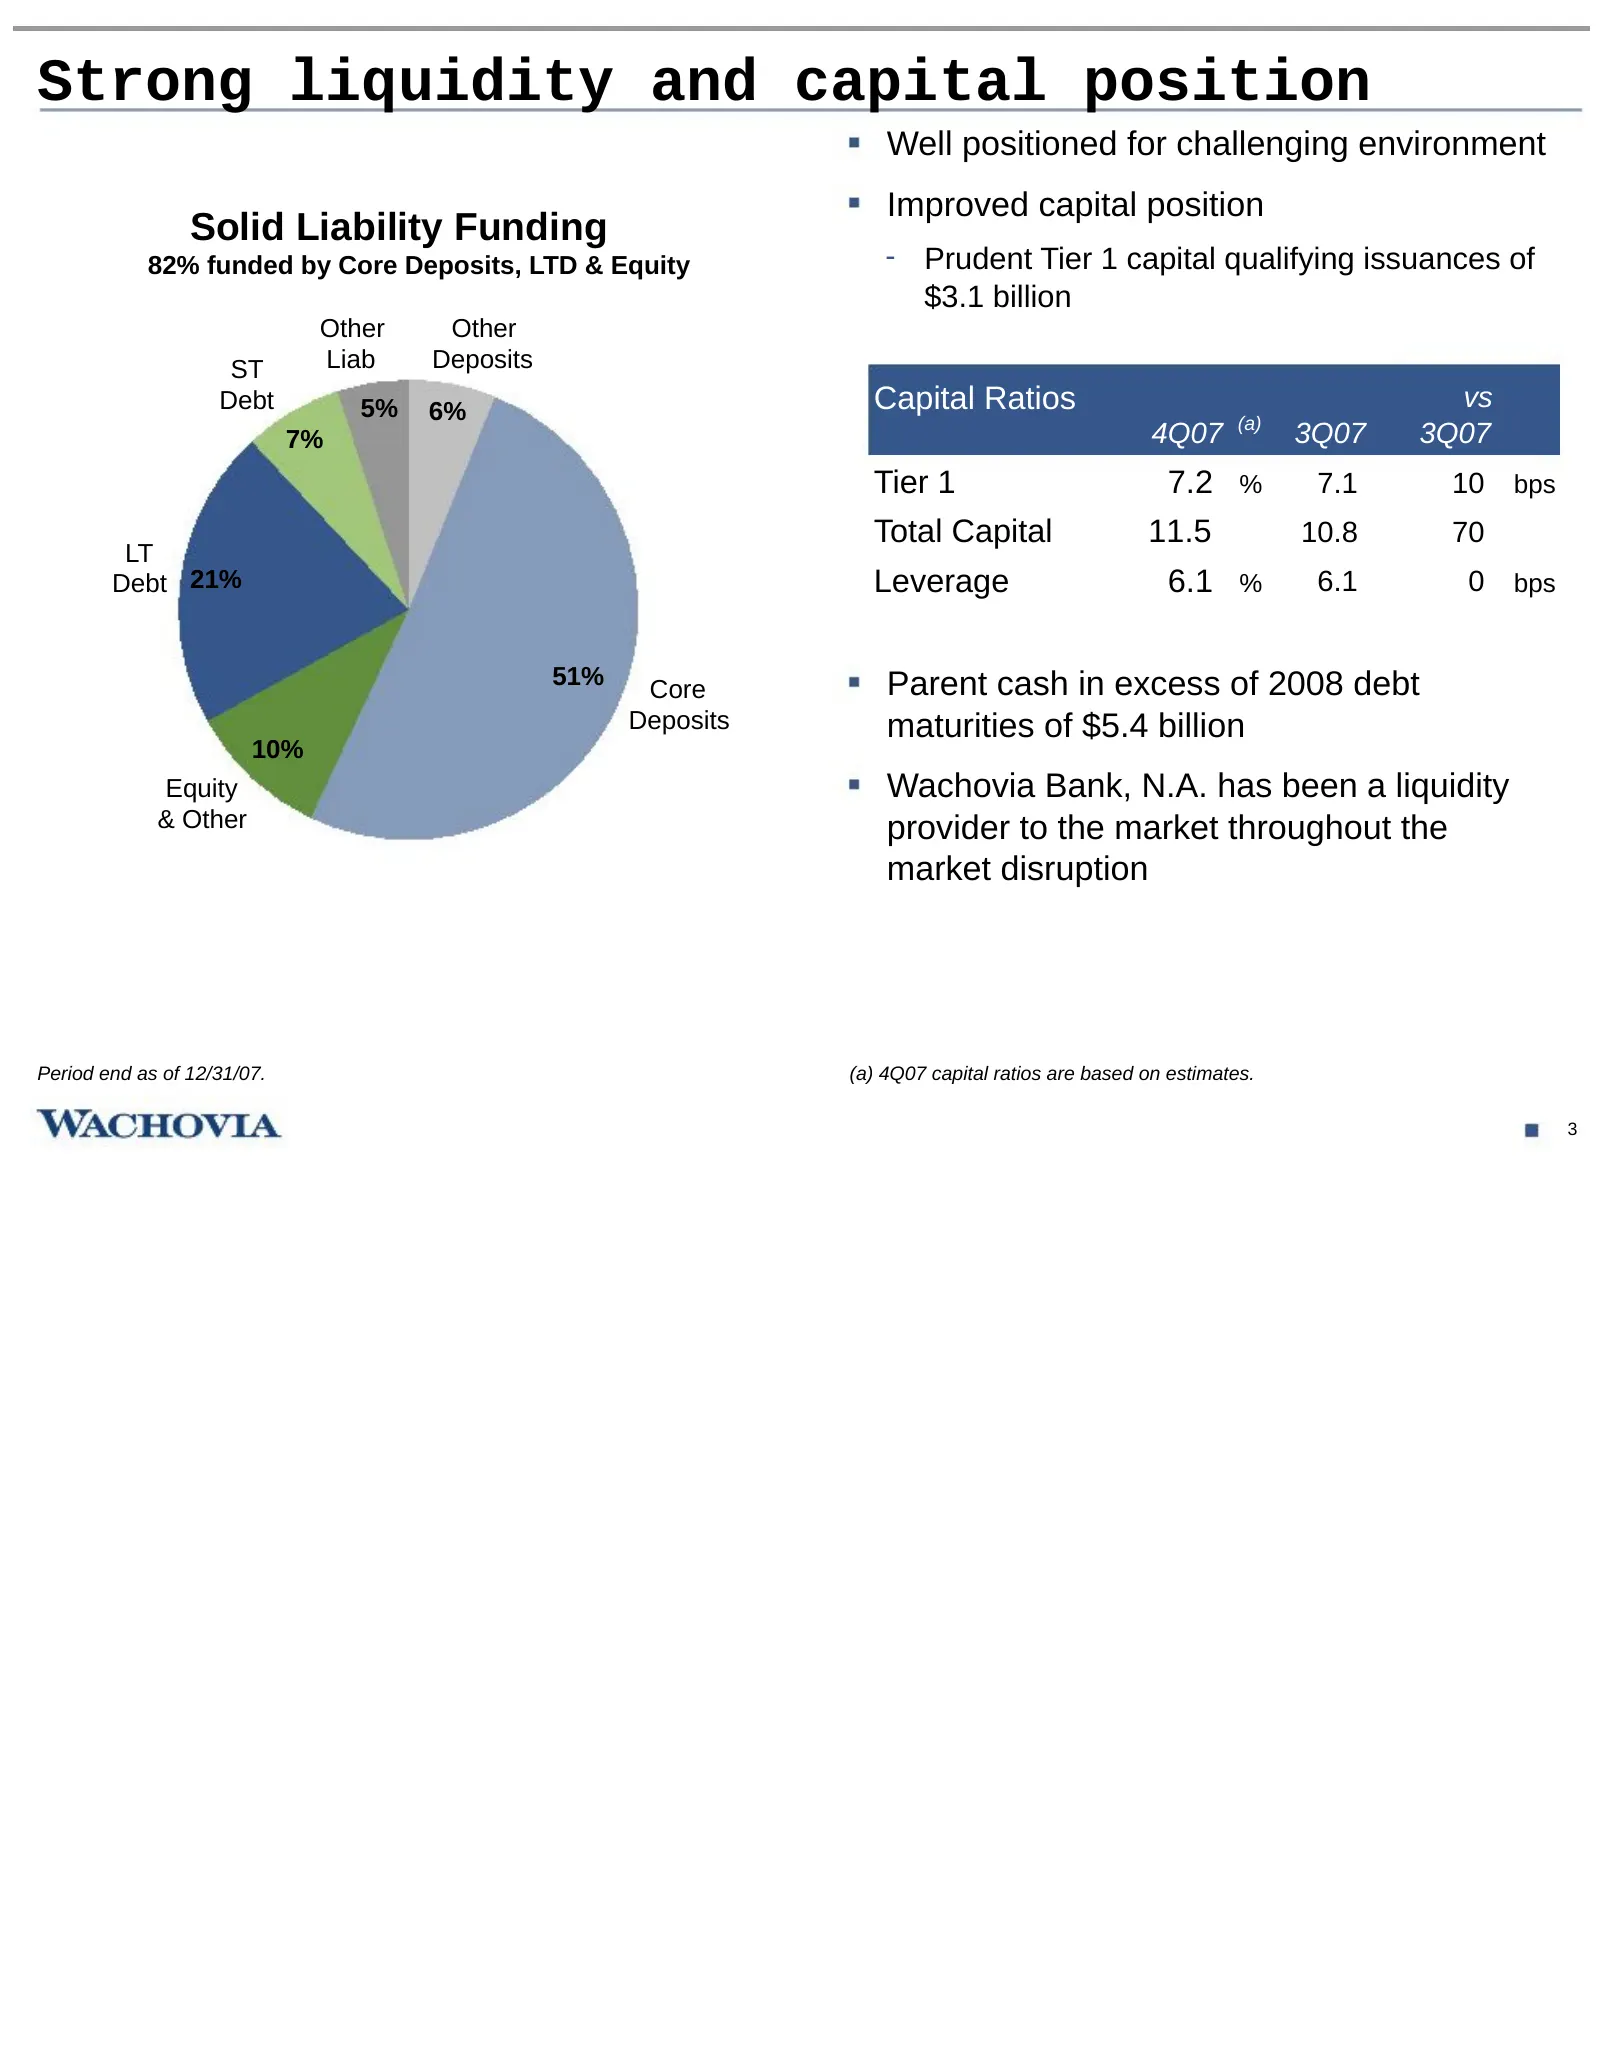
Strong liquidity and capital position Well positioned for challenging environment Improved capital position Solid Liability Funding 82% funded by Core Deposits, LTD & Equity - Prudent Tier 1 capital qualifying issuances of $3.1 billion Other Other ST Liab Deposits Debt 5% 6% Capital Ratios vs (a) 7%
Slide 5: Average deposit growth
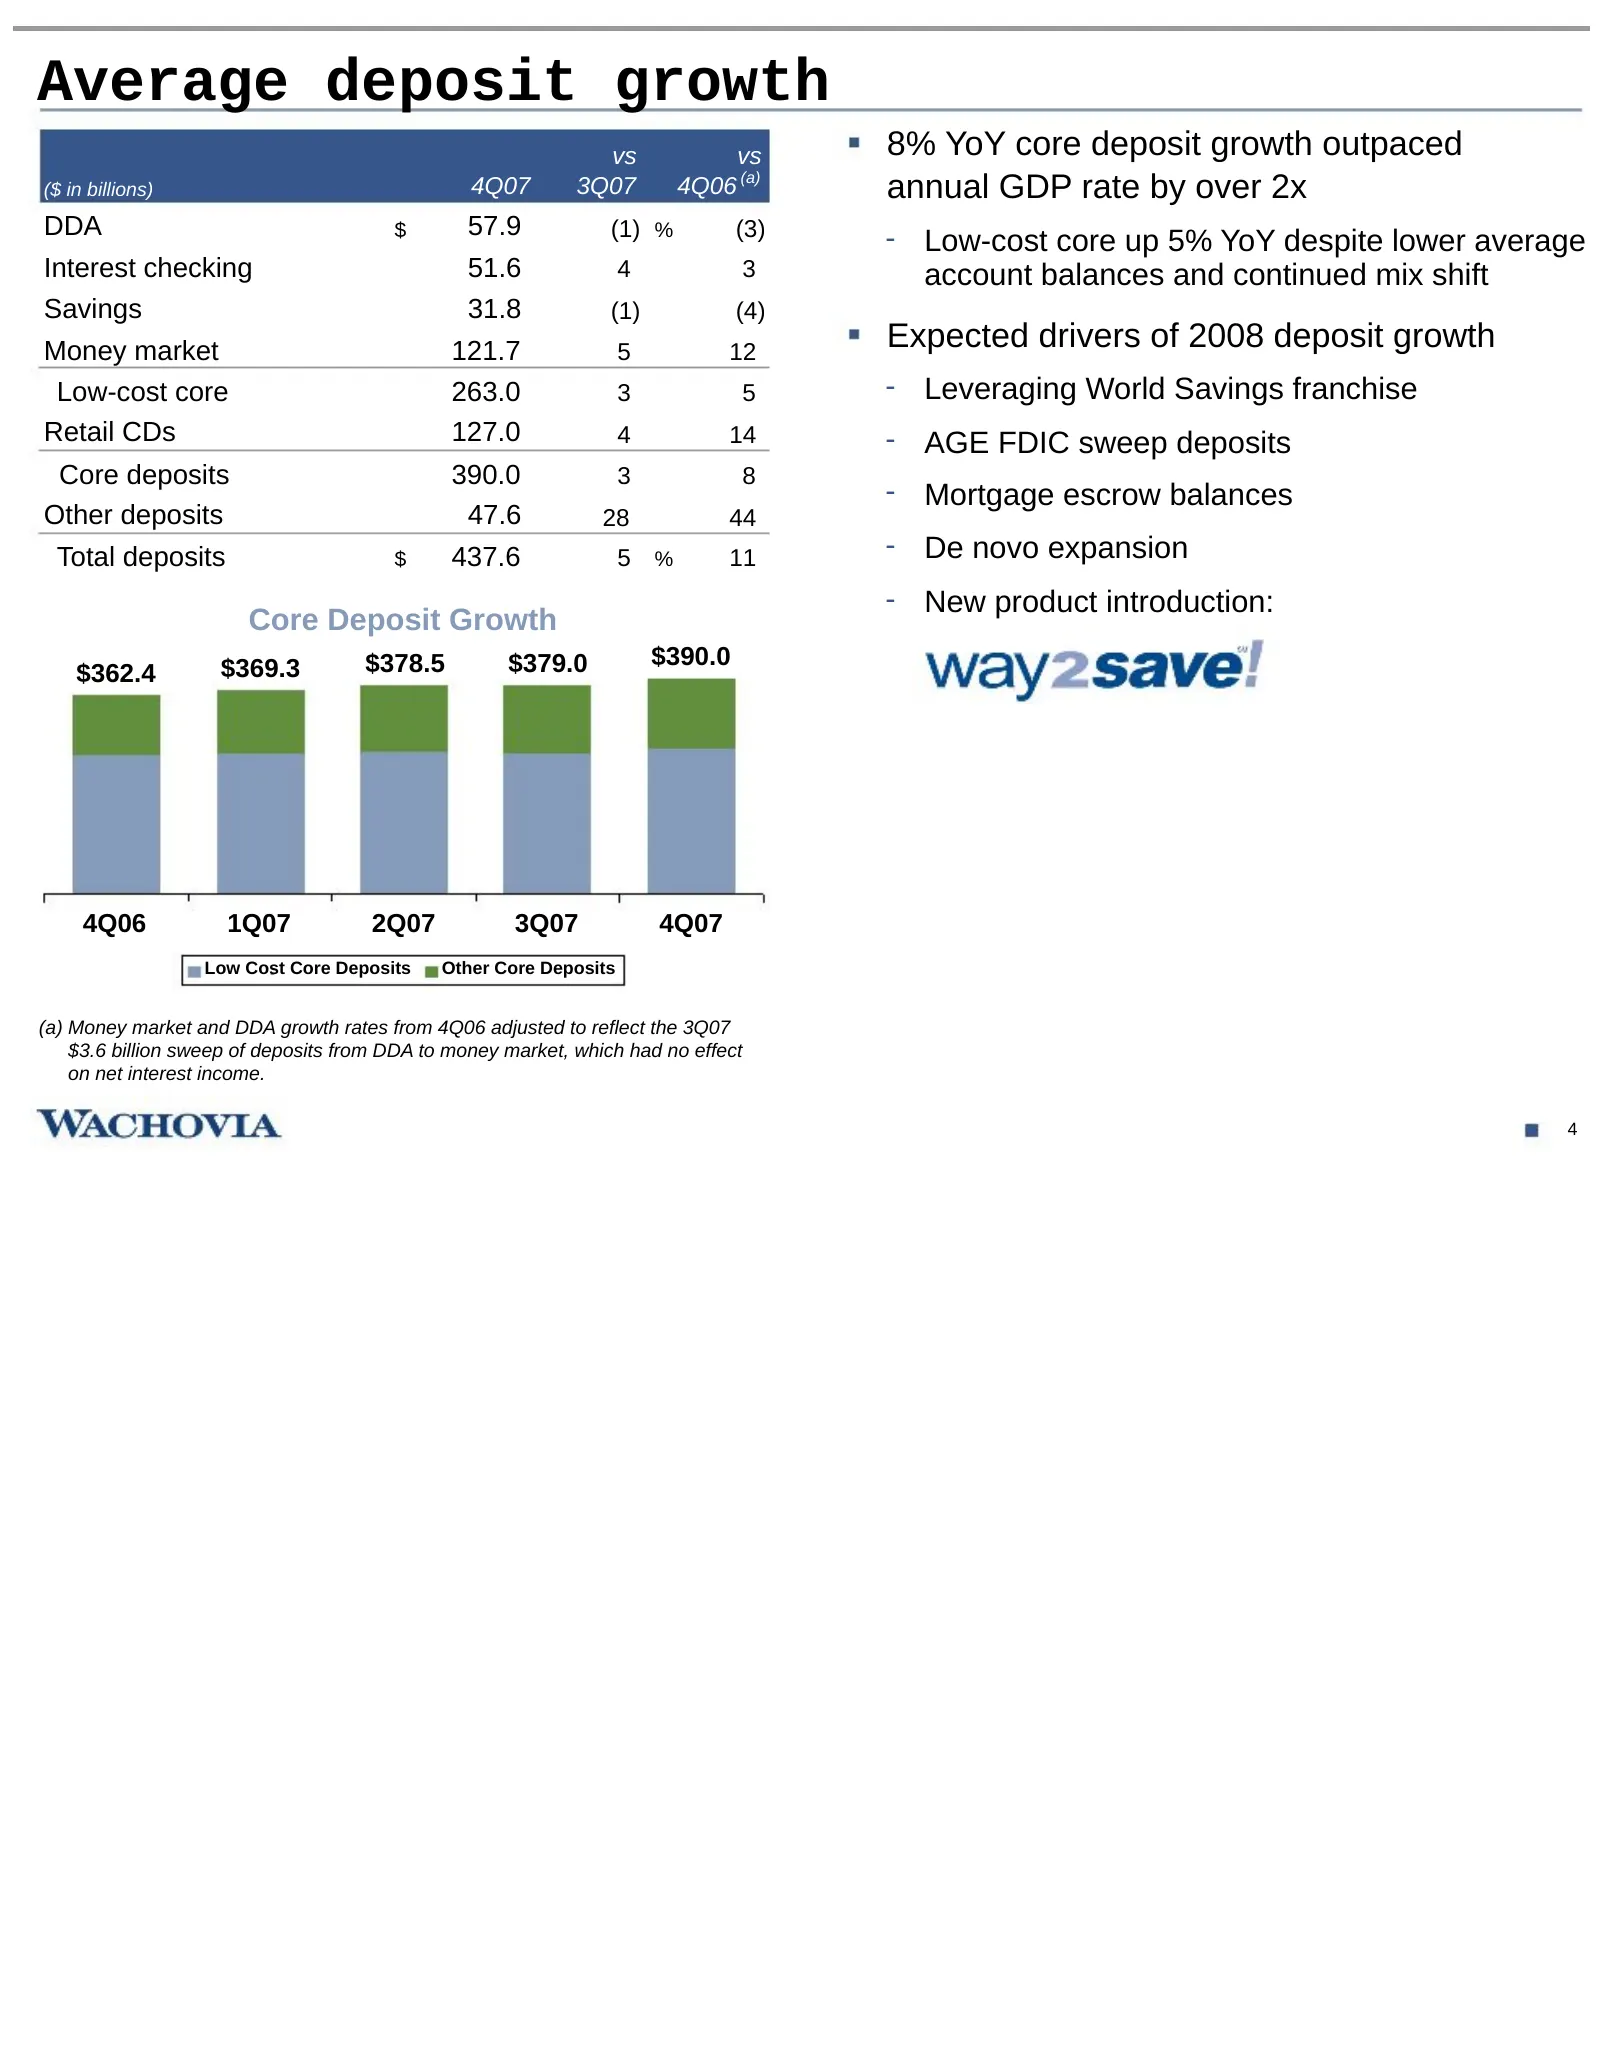
Average deposit growth vs vs 8% YoY core deposit growth outpaced ($ in billions) 4Q07 3Q07 4Q06 (a) annual GDP rate by over 2x DDA $ 57.9 (1) % (3) - Low-cost core up 5% YoY despite lower average Interest checking 51.6 4 3 account balances and continued mix shift Savings 31.8 (1) (4) Money market 12
Slide 6: Average loan growth
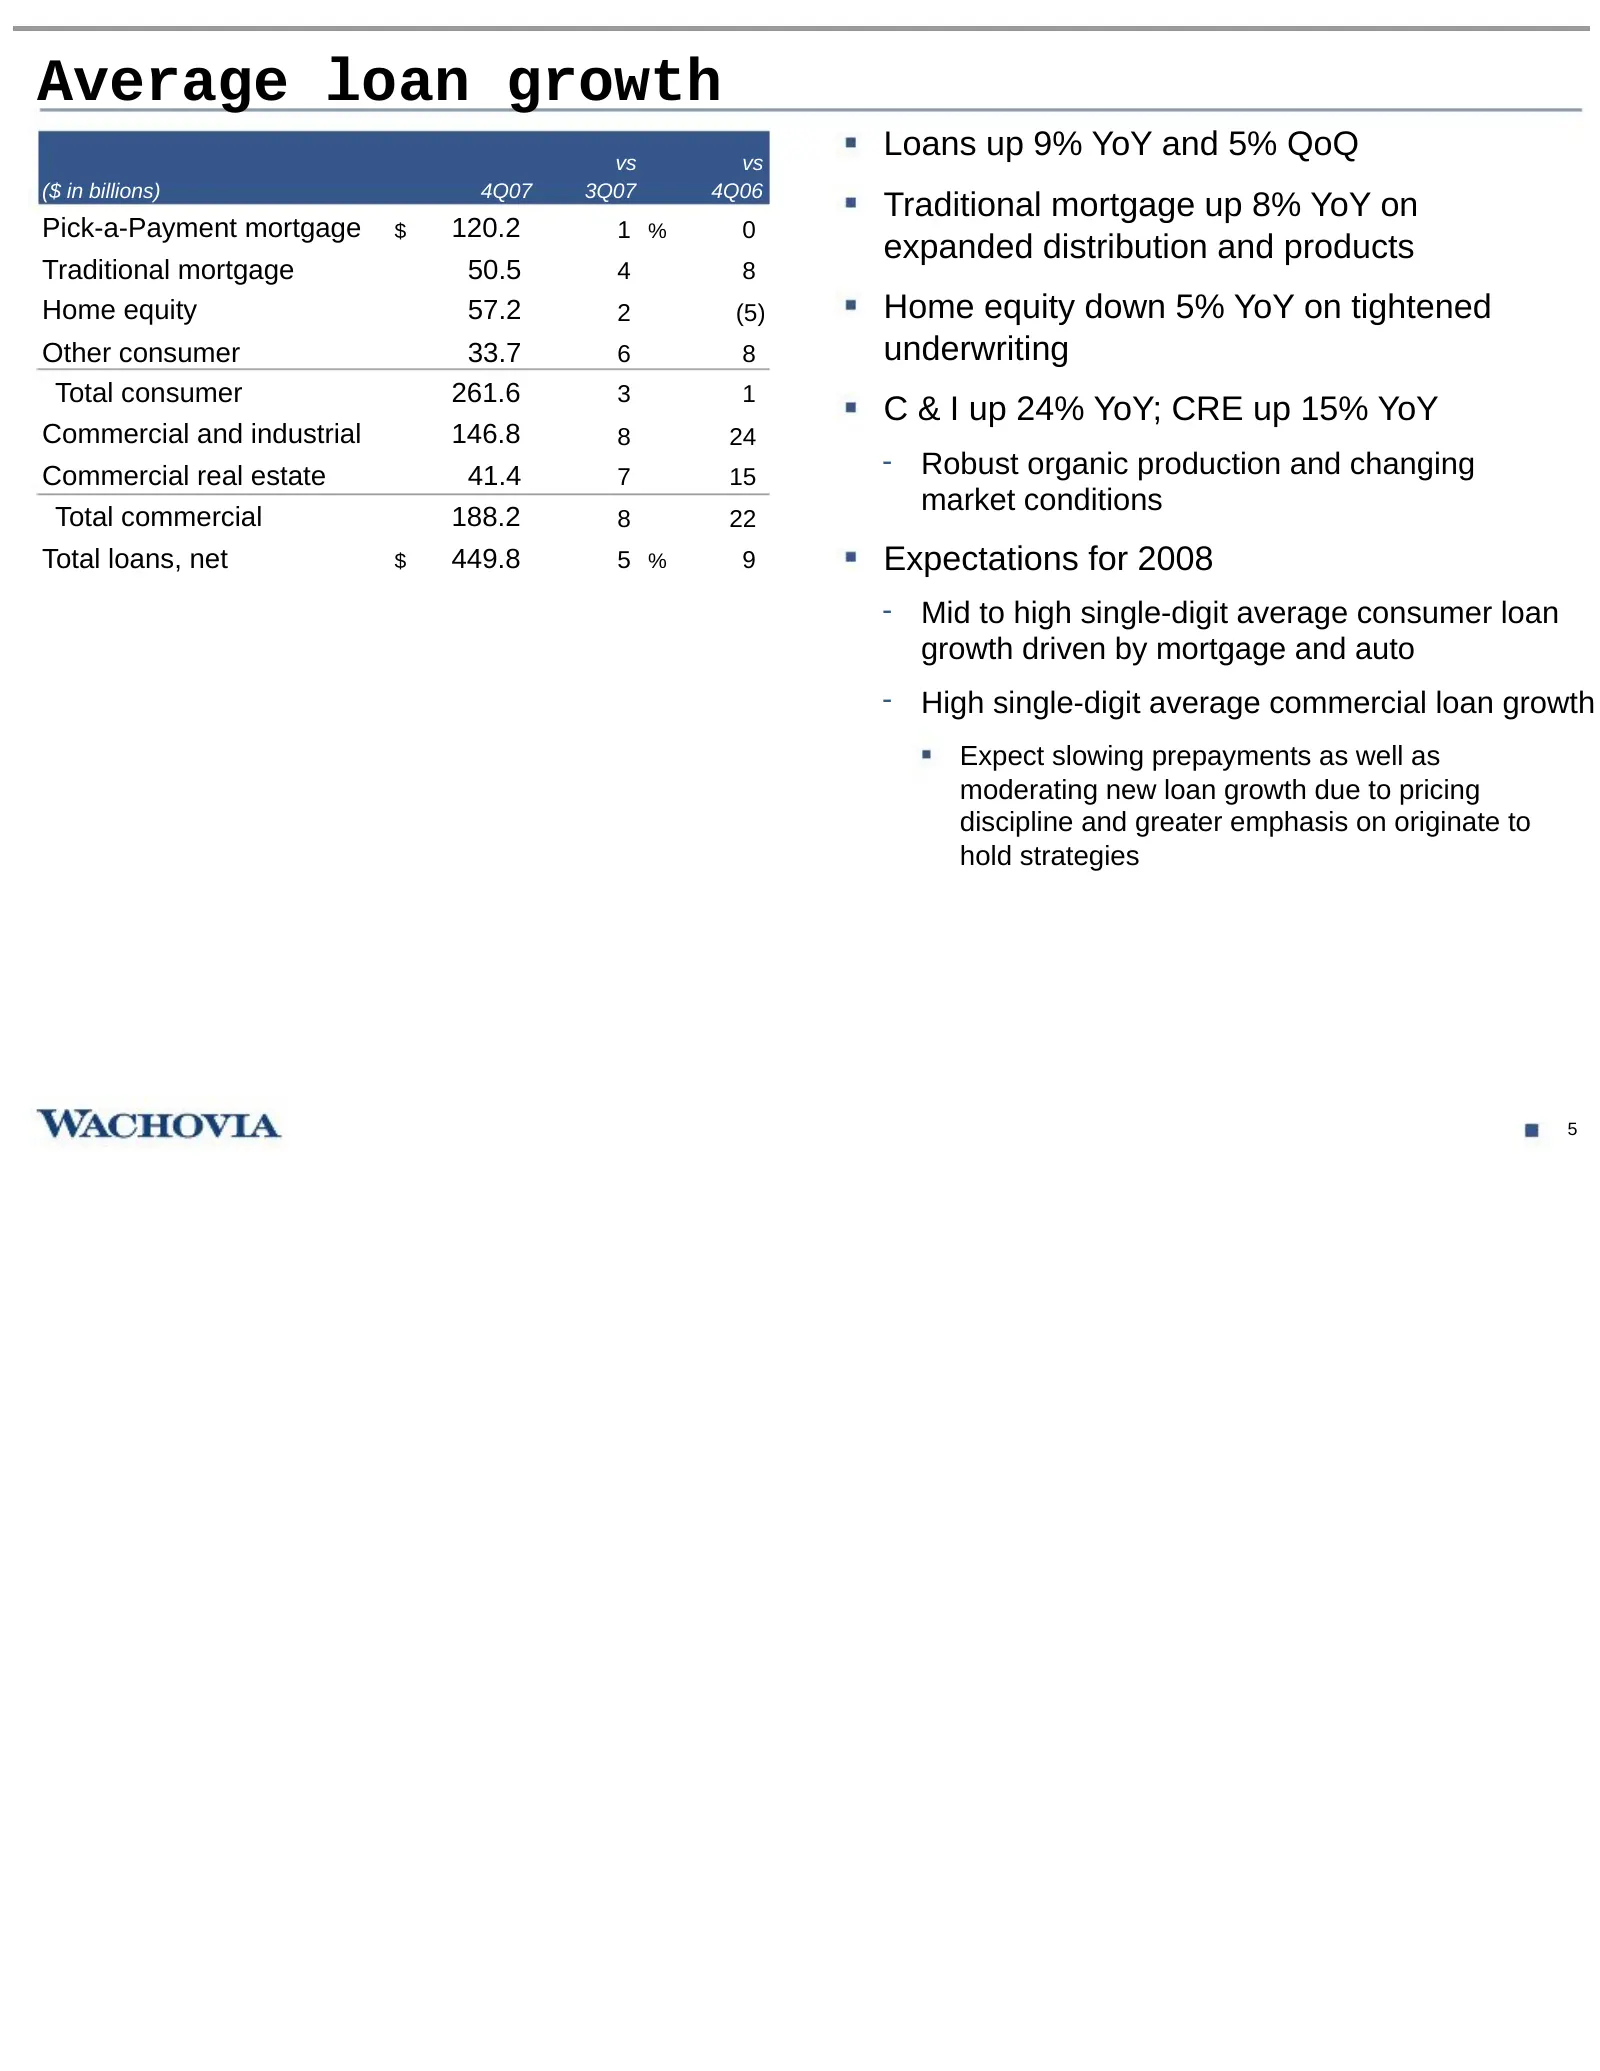
Average loan growth vs vs Loans up 9% YoY and 5% QoQ ($ in billions) 4Q07 3Q07 4Q06 Traditional mortgage up 8% YoY on Pick-a-Payment mortgage $ 120.2 1 % 0 expanded distribution and products Traditional mortgage 50.5 4 8 Home equity 57.2 2 (5) Home equity down 5% YoY on tightened Other consumer 33.7
Slide 7: General Bank key metrics
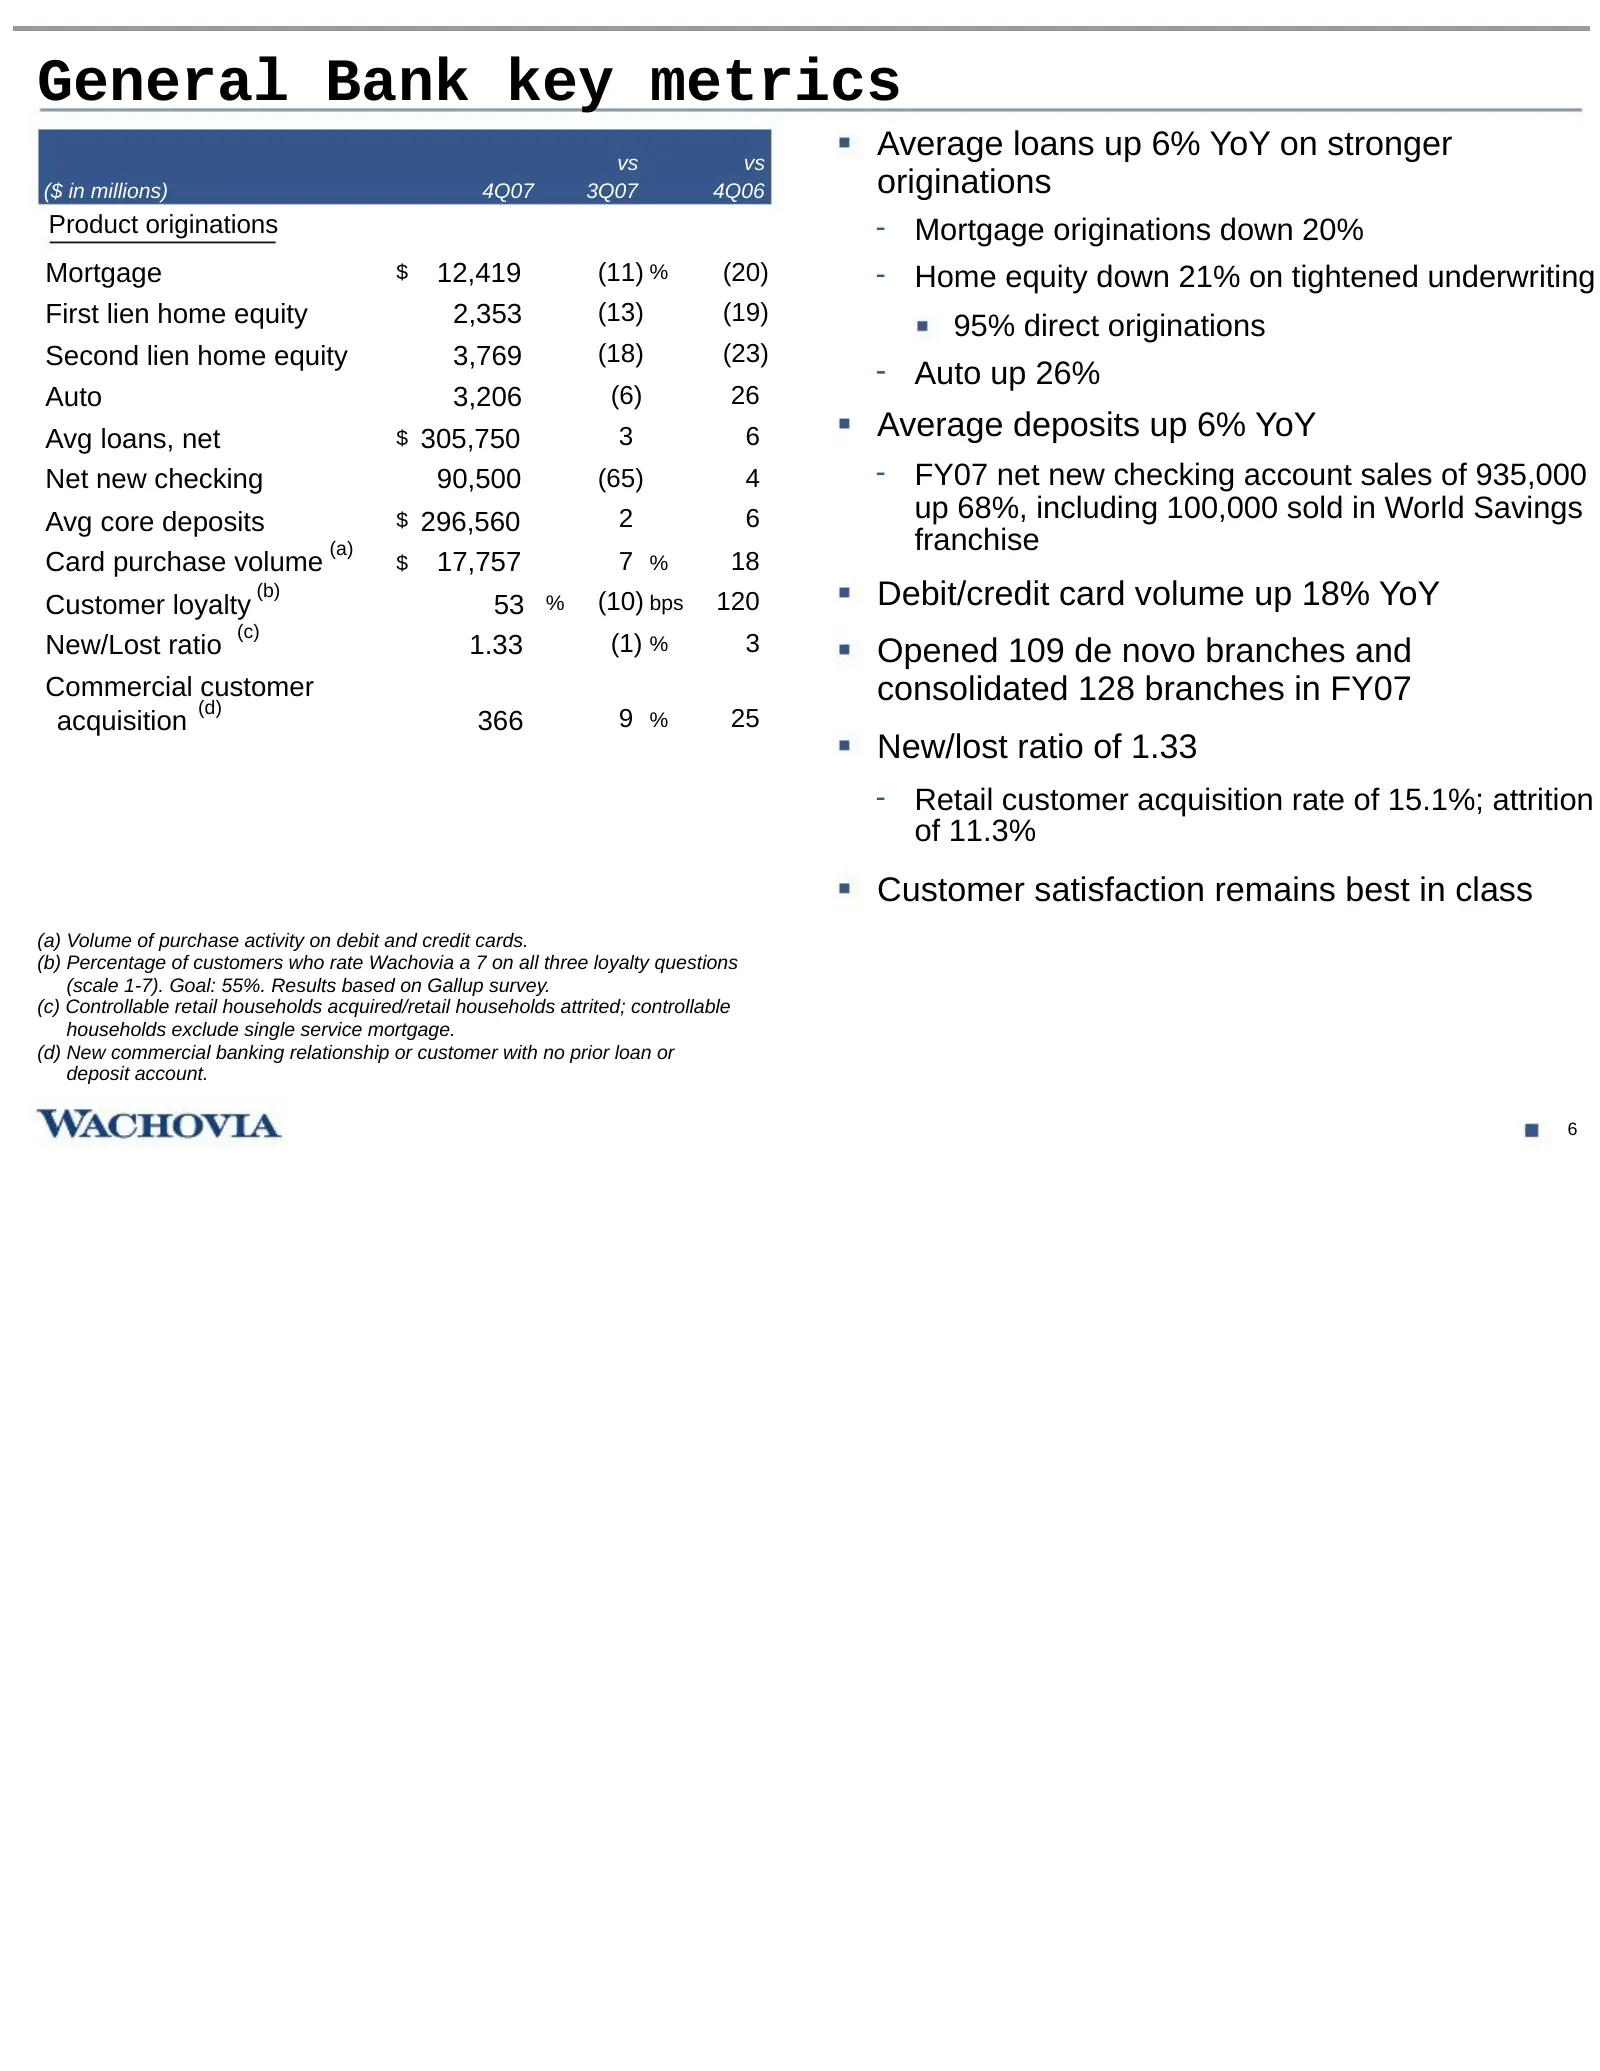
General Bank key metrics vs vs Average loans up 6% YoY on stronger ($ in millions) 4Q07 3Q07 4Q06 originations Product originations - Mortgage originations down 20% Mortgage $ 12,419 (11) % (20) - Home equity down 21% on tightened underwriting First lien home equity 2,353 (13) (19) 95% direct origin
Slide 8: General Bank summary
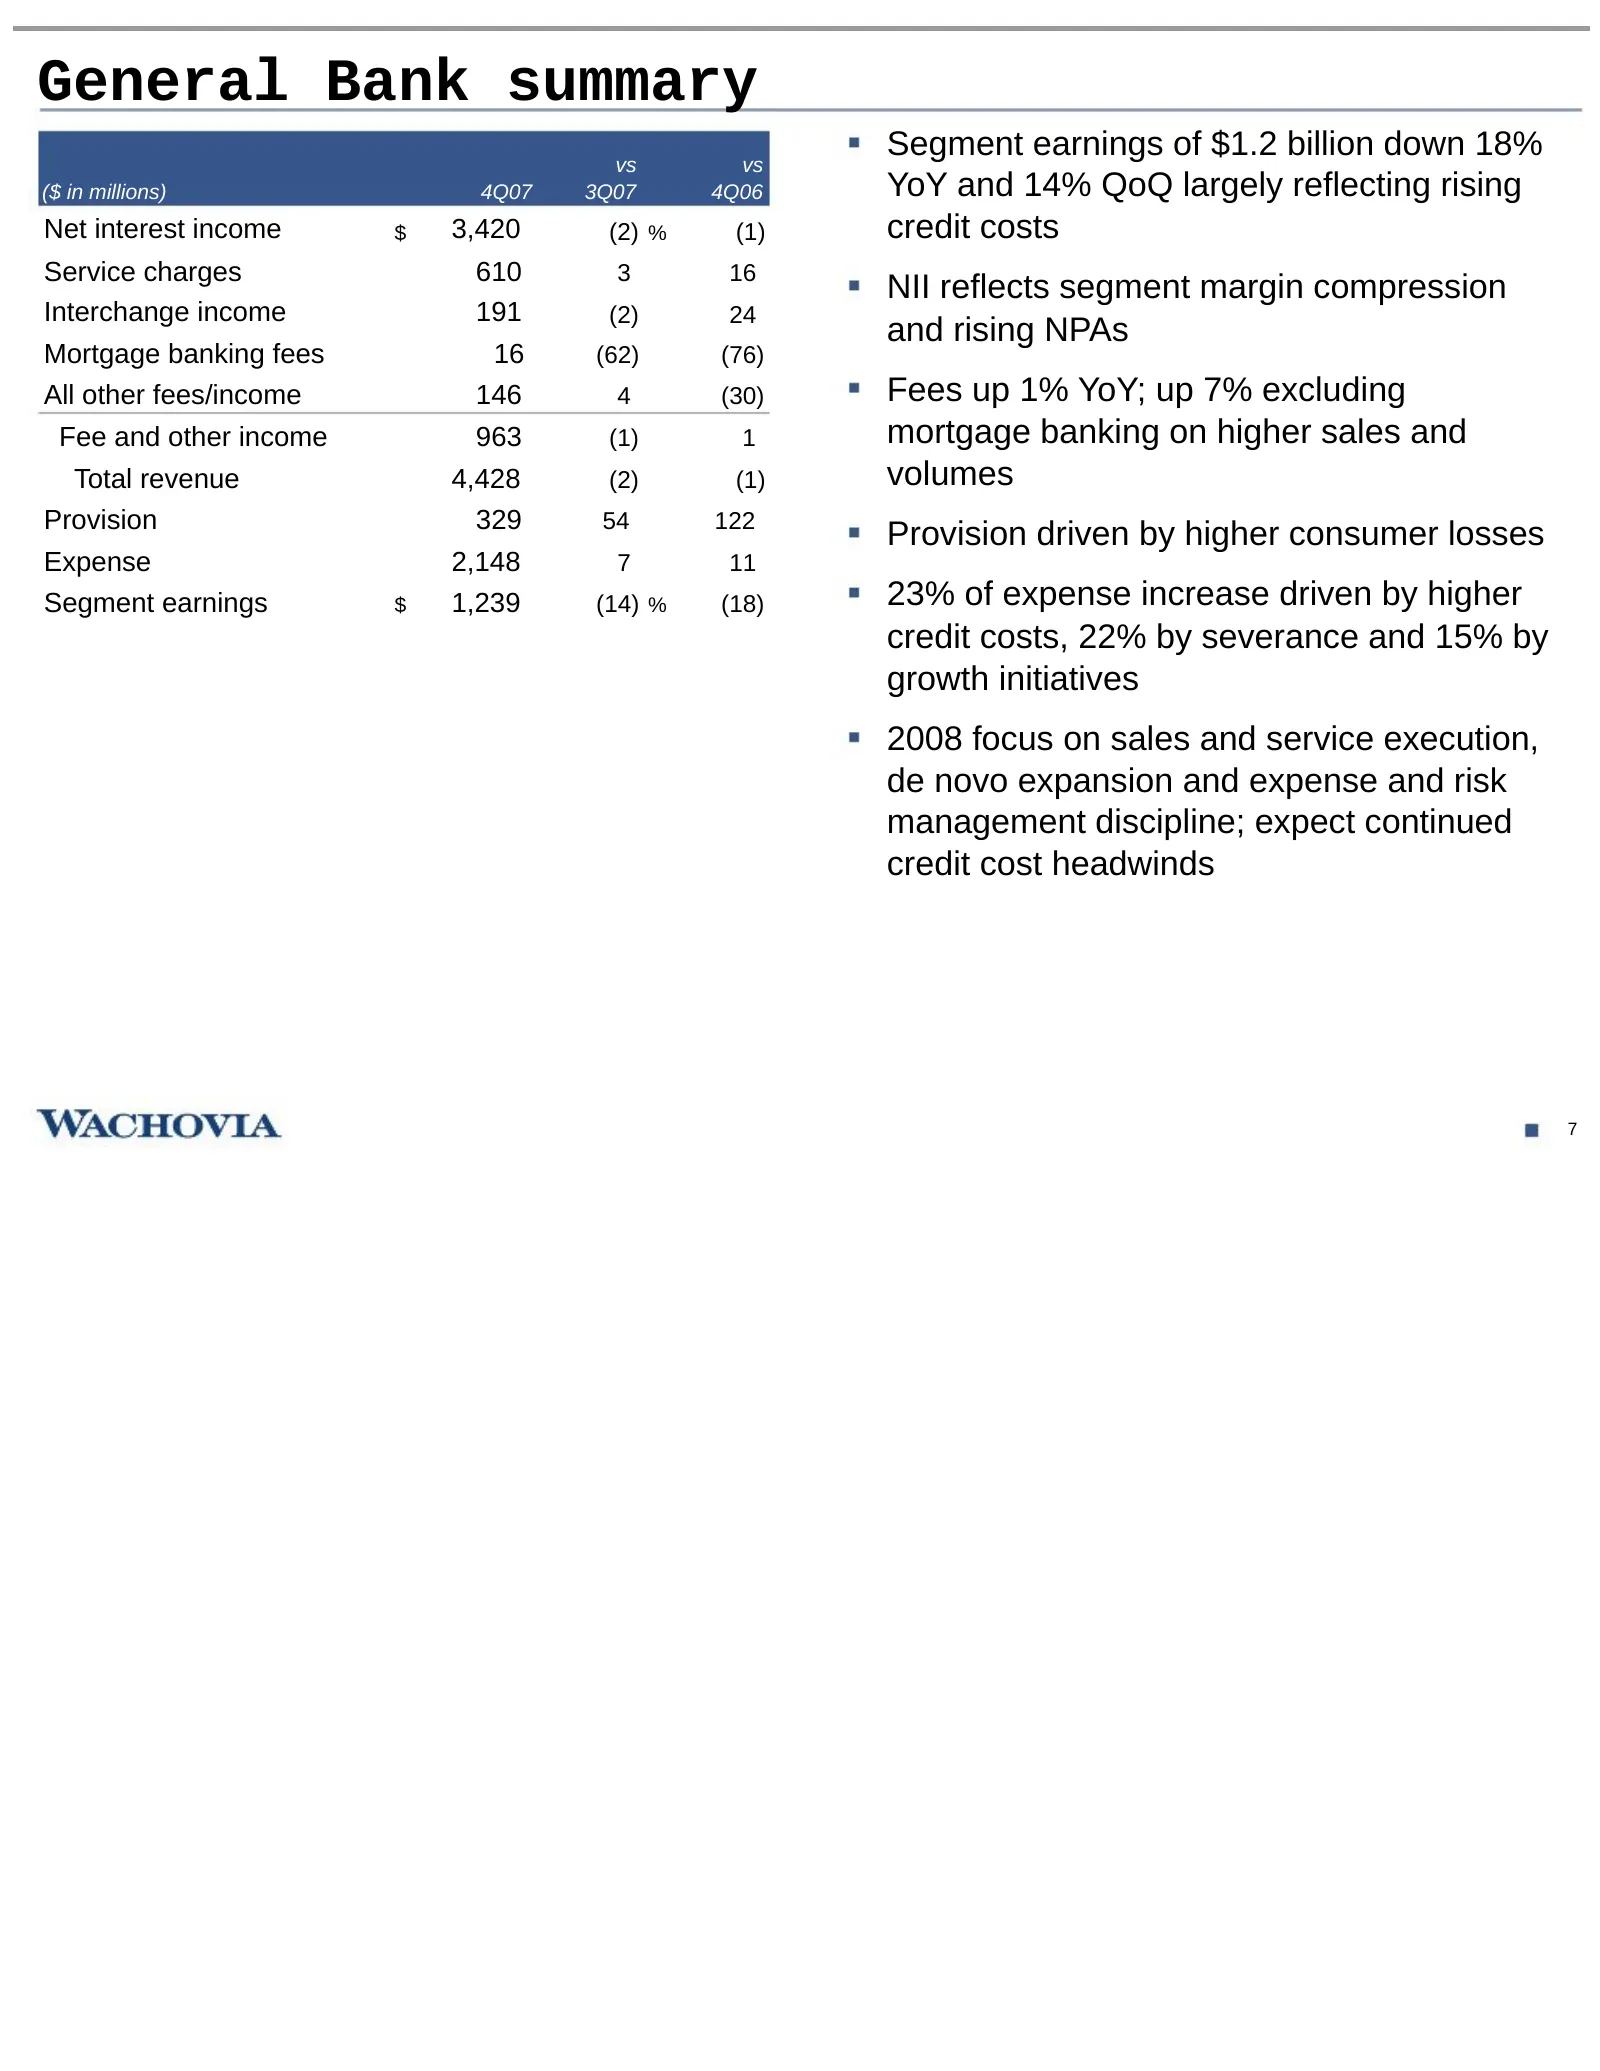
General Bank summary vs vs Segment earnings of $1.2 billion down 18% ($ in millions) 4Q07 3Q07 4Q06 YoY and 14% QoQ largely reflecting rising Net interest income $ 3,420 (2) % (1) credit costs Service charges 610 3 16 NII reflects segment margin compression Interchange income 191 (2) 24 and rising N
Slide 9: Wealth Management summary
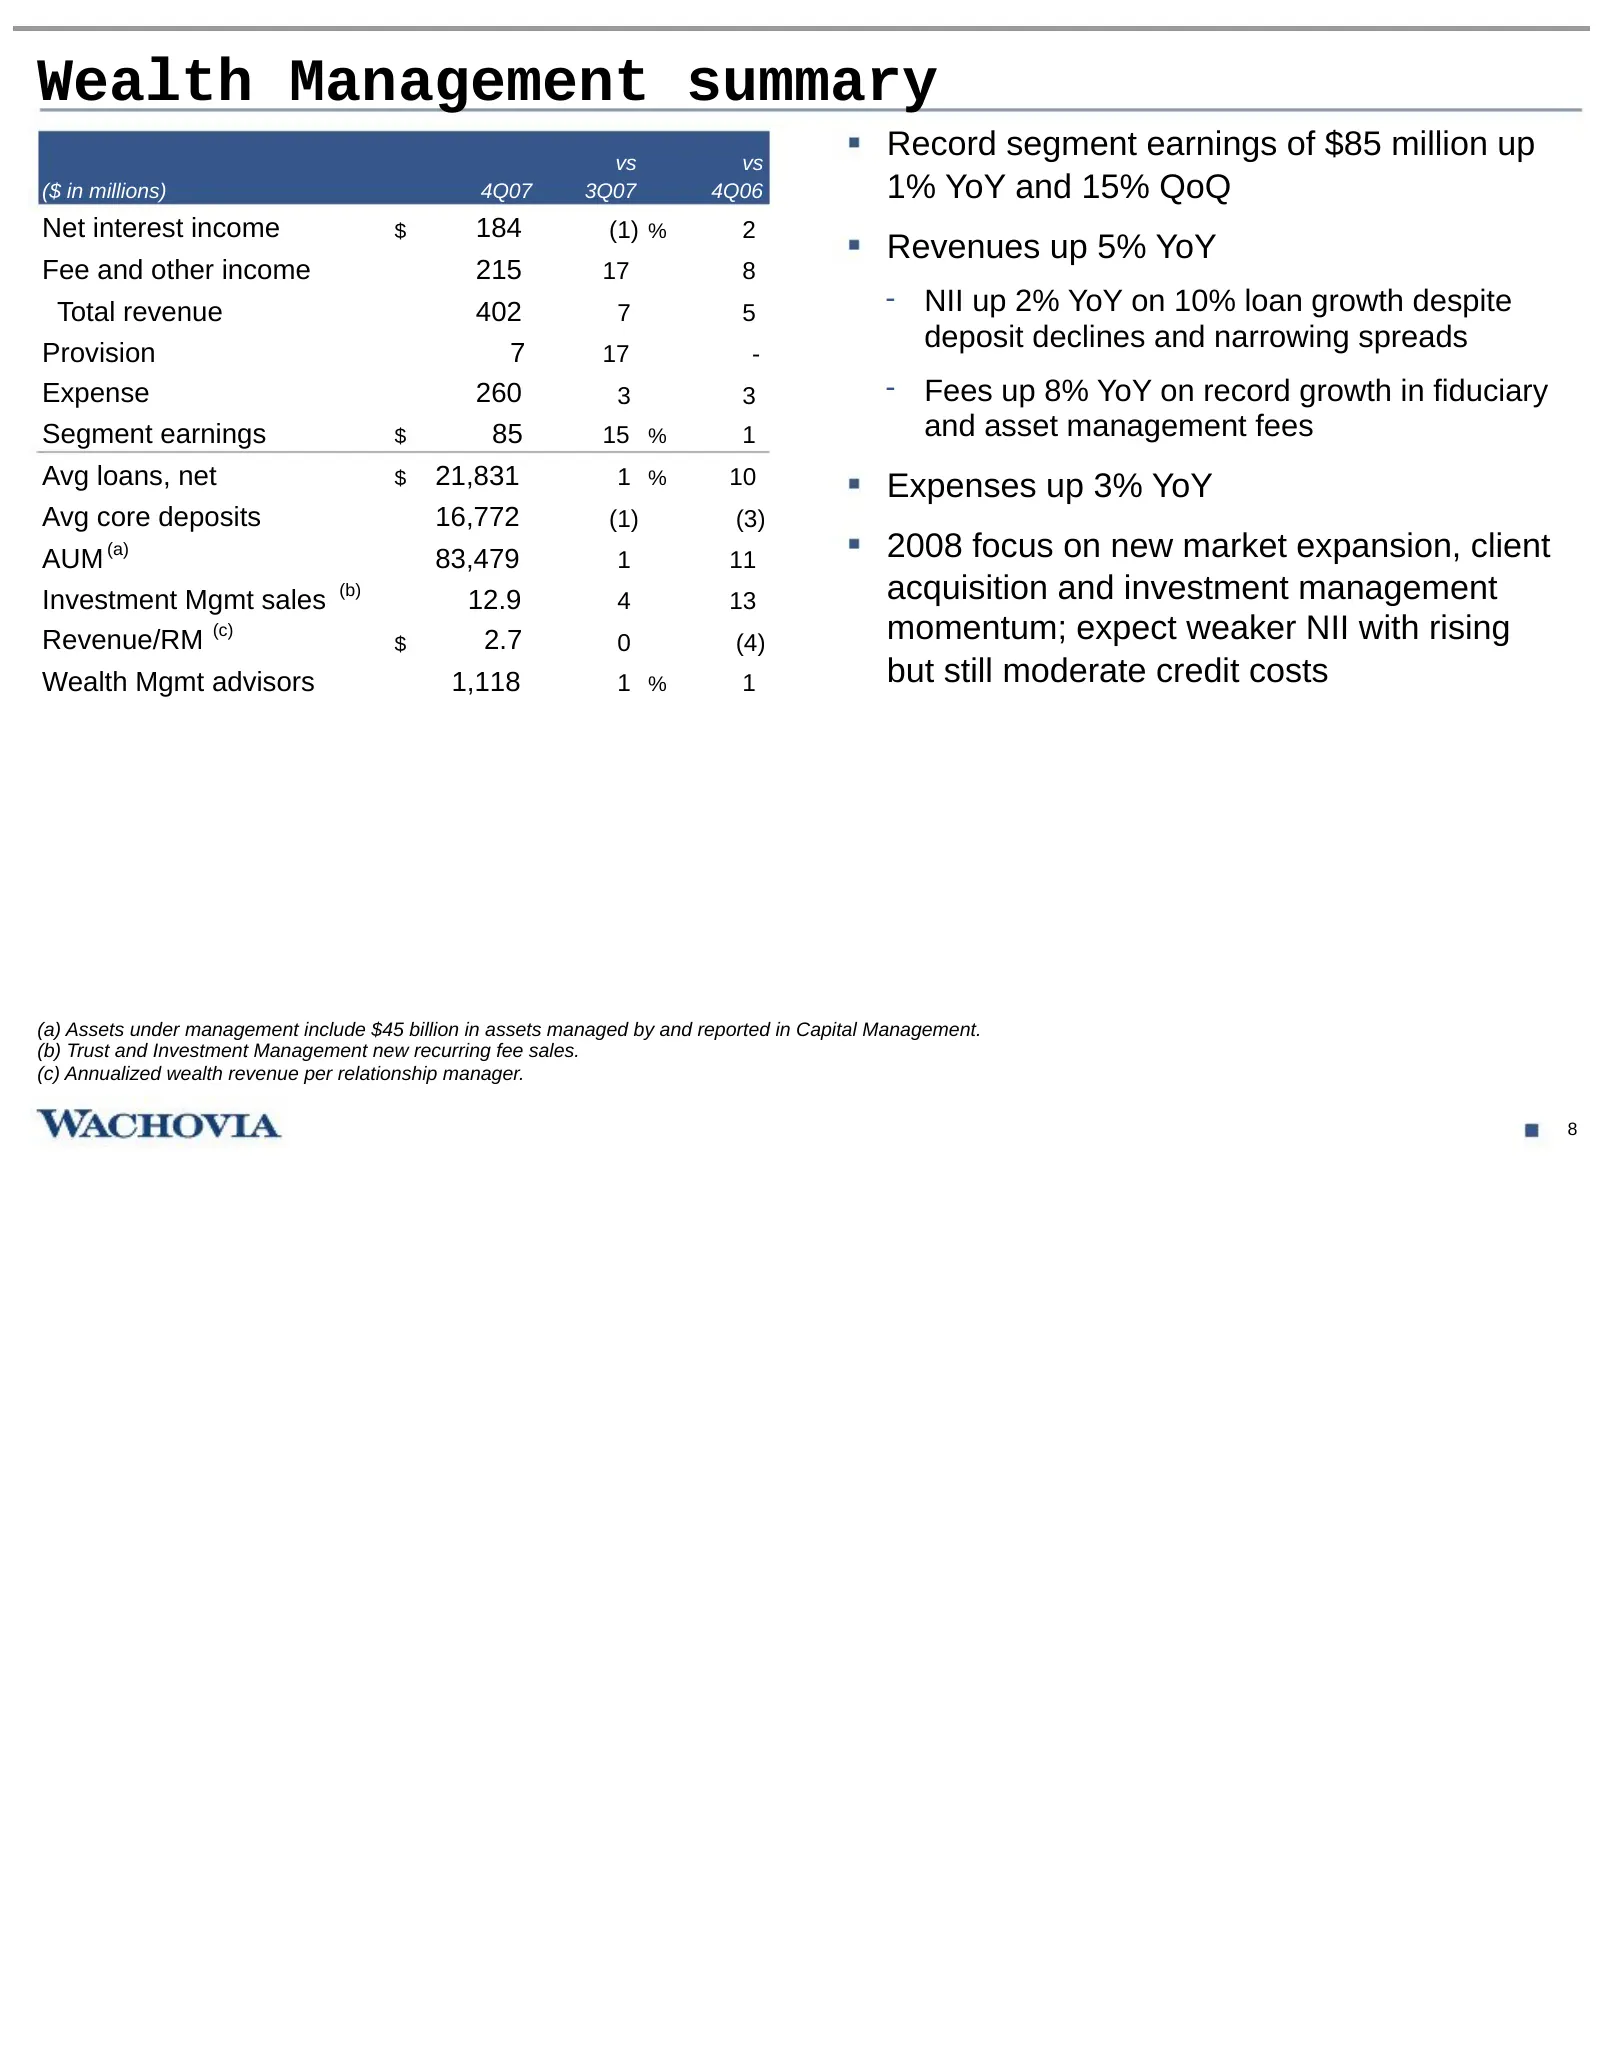
Wealth Management summary vs vs Record segment earnings of $85 million up ($ in millions) 4Q07 3Q07 4Q06 1% YoY and 15% QoQ Net interest income $ 184 (1) % 2 Revenues up 5% YoY Fee and other income 215 17 8 Total revenue 402 7 5 - NII up 2% YoY on 10% loan growth despite Provision 7 17 - deposit dec
Slide 10: Market disruption losses and write-downs
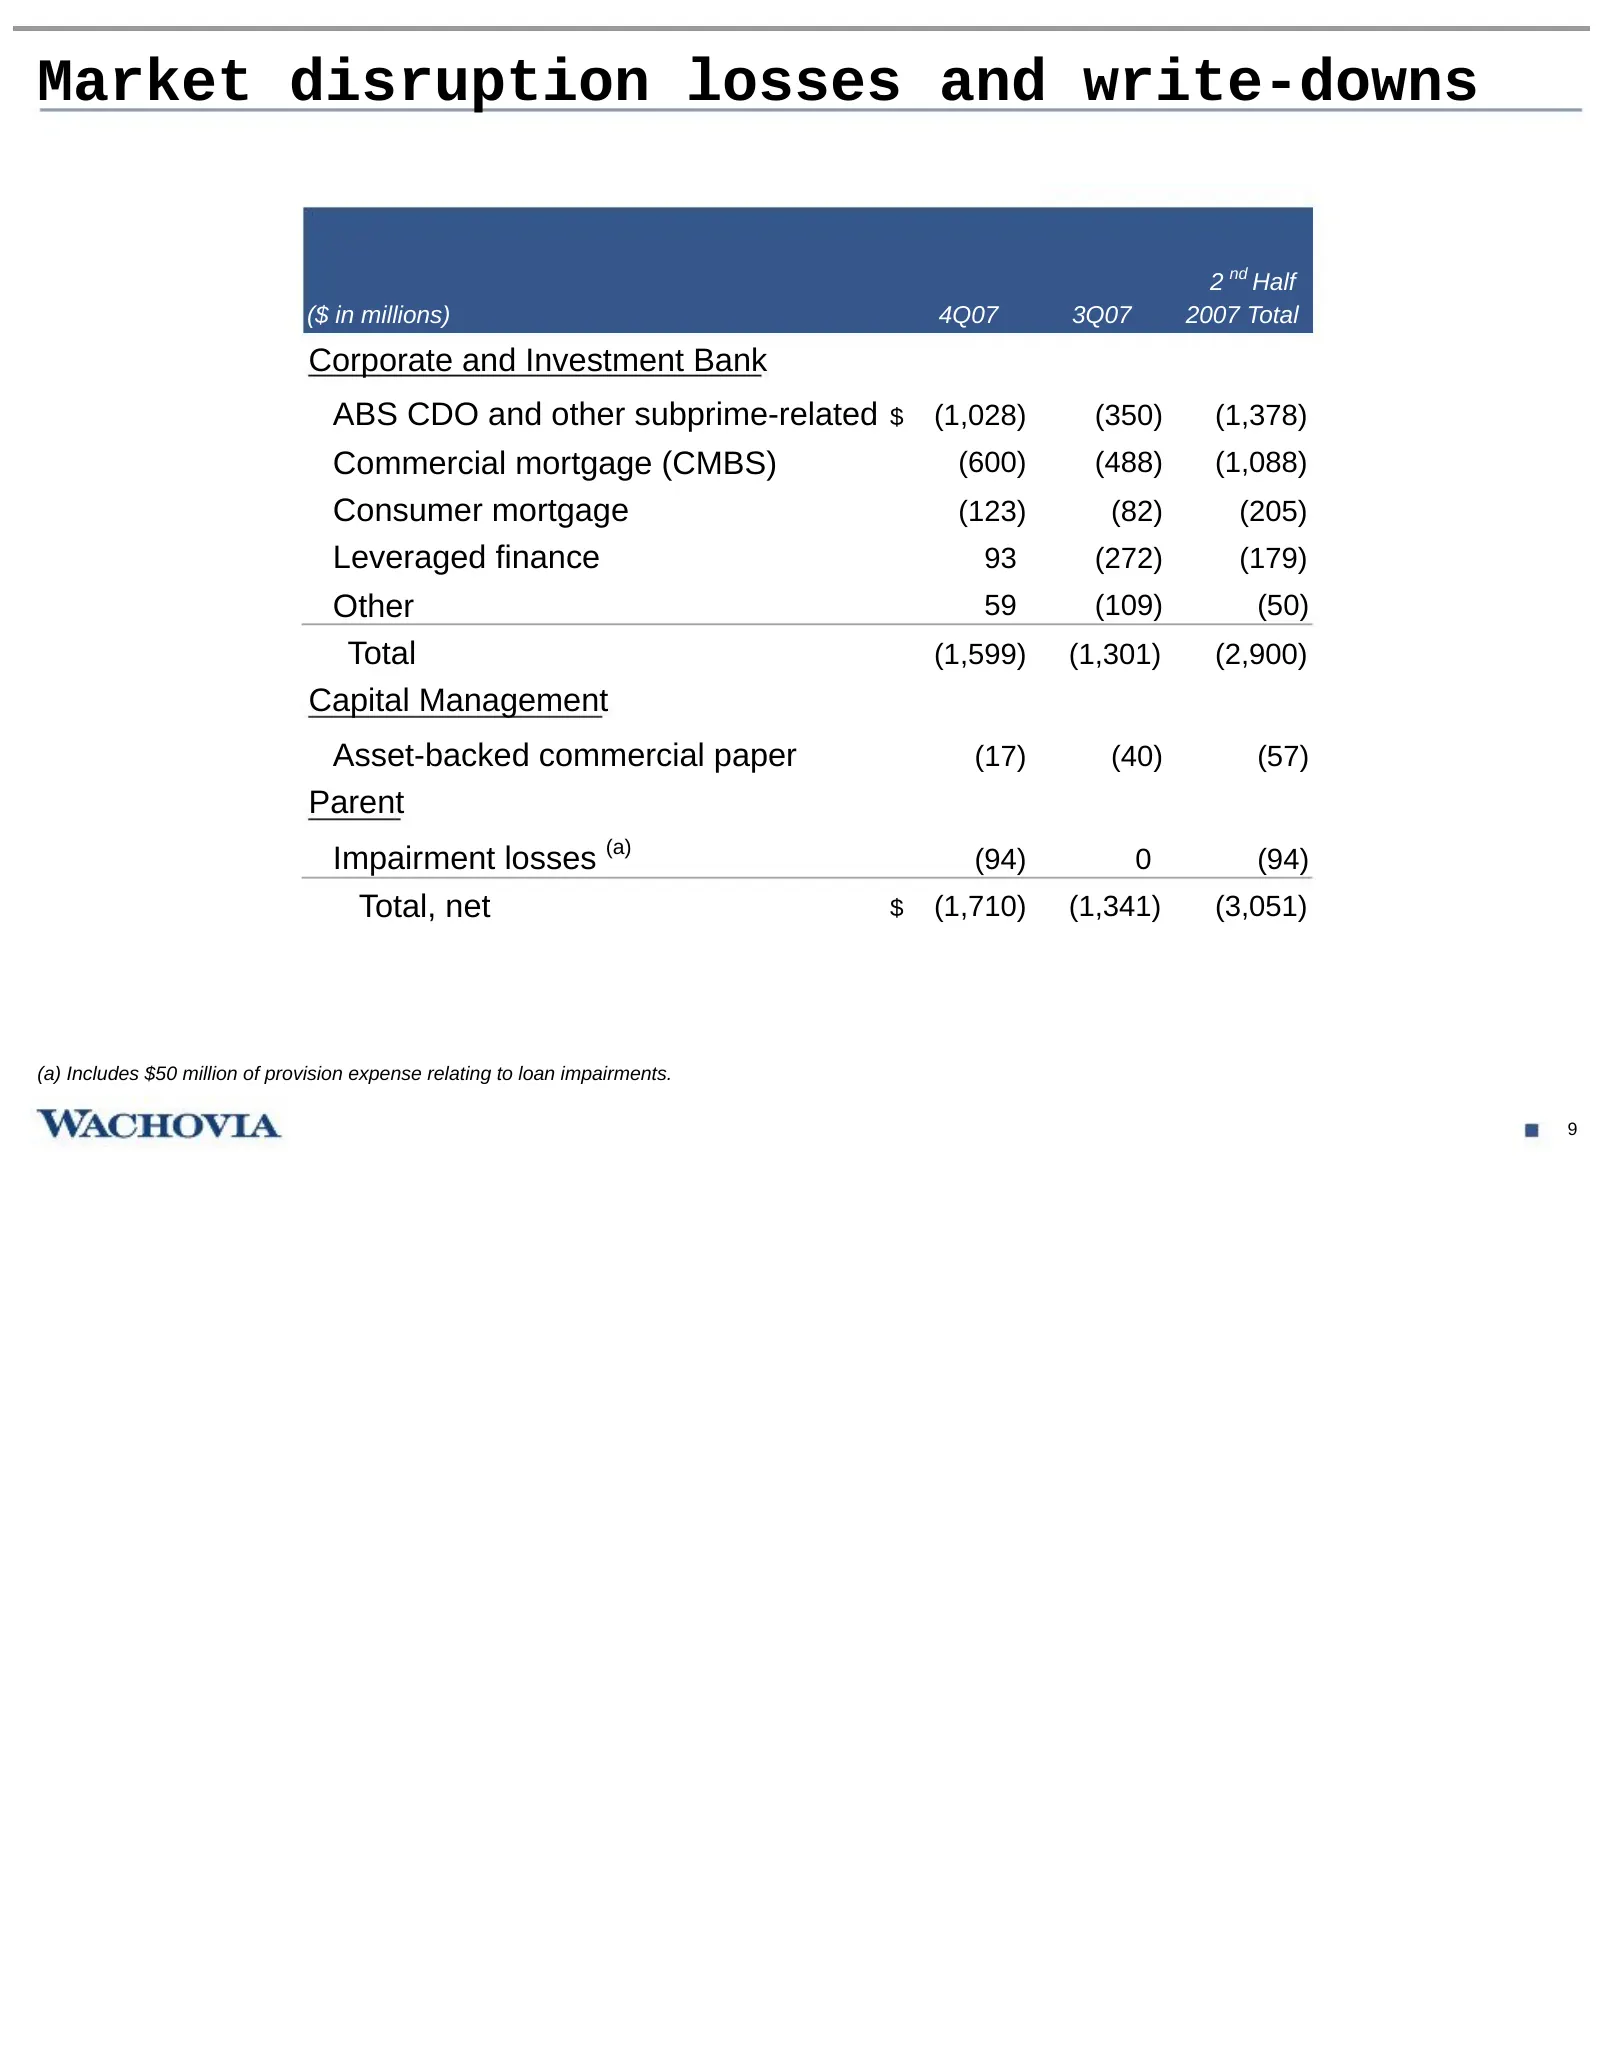
Market disruption losses and write-downs 2 nd Half ($ in millions) 4Q07 3Q07 2007 Total Corporate and Investment Bank ABS CDO and other subprime-related $ (1,028) (350) (1,378) Commercial mortgage (CMBS) (600) (488) (1,088) Consumer mortgage (123) (82) (205) Leveraged finance 93 (272) (179) Other 59
Slide 11: Corporate and Investment Bank summary
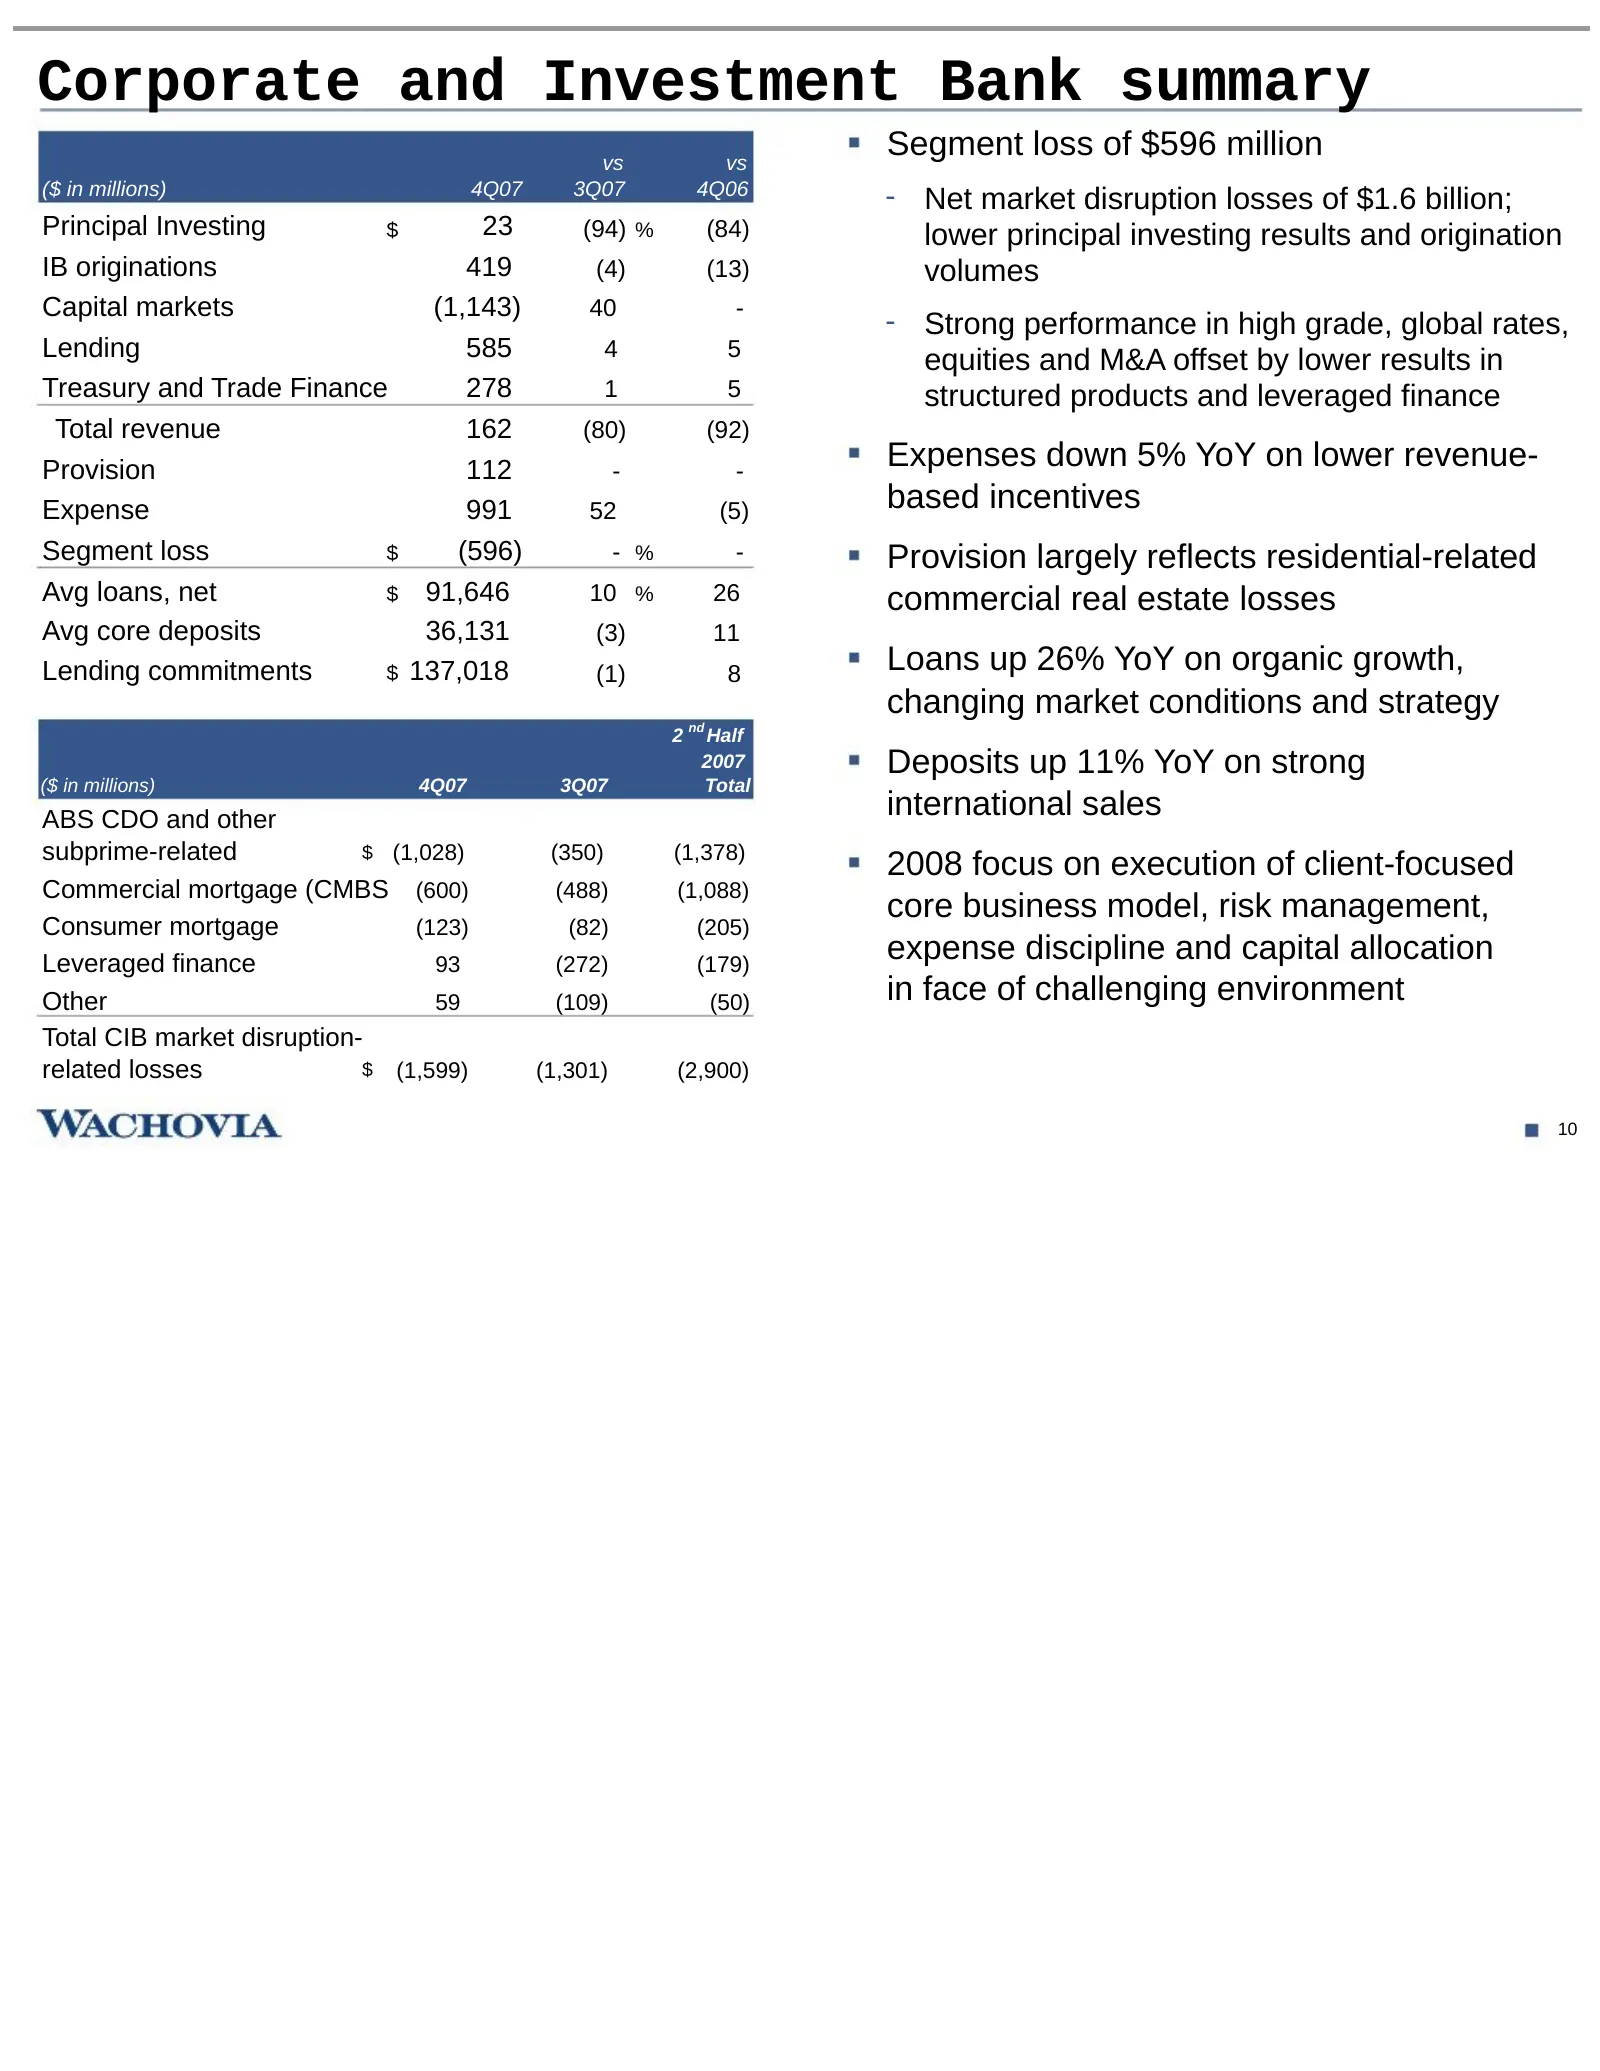
Corporate and Investment Bank summary vs vs Segment loss of $596 million ($ in millions) 4Q07 3Q07 4Q06 - Net market disruption losses of $1.6 billion; Principal Investing $ 23 (94) % (84) lower principal investing results and origination IB originations 419 (4) (13) volumes Capital markets (1,143)
Slide 12: Commercial mortgage and leveraged finance Mark-to-market (MTM) exposure
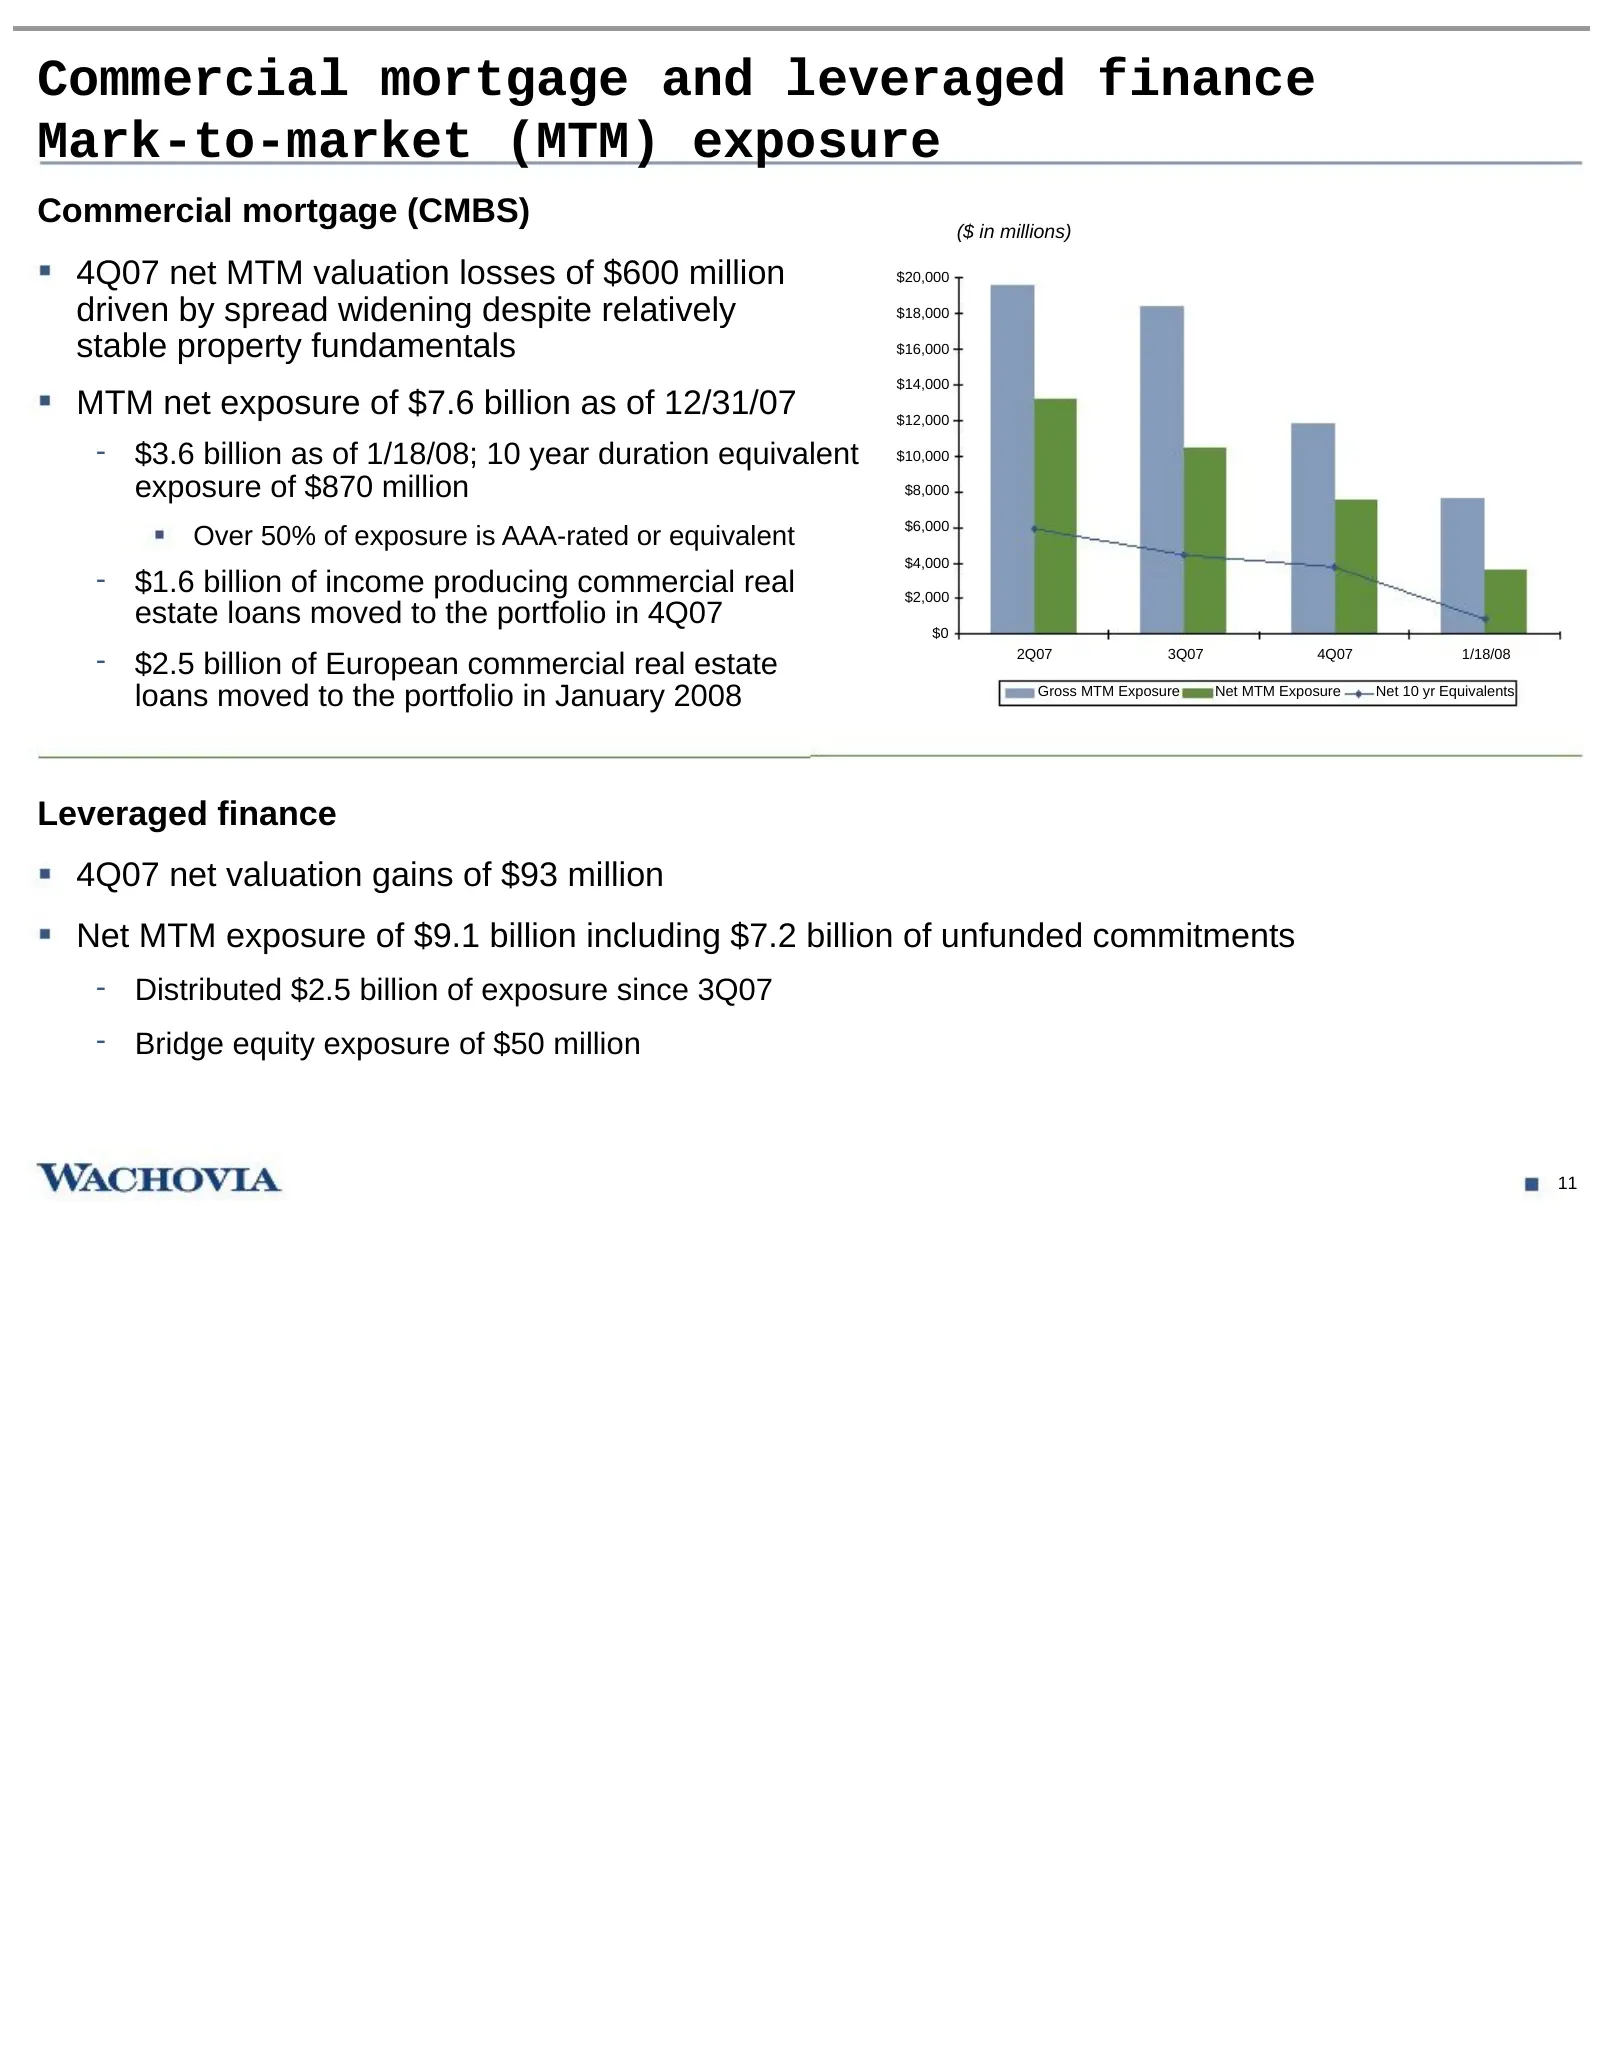
Commercial mortgage and leveraged finance Mark-to-market (MTM) exposure Commercial mortgage (CMBS) ($ in millions) 4Q07 net MTM valuation losses of $600 million $20,000 driven by spread widening despite relatively $18,000 stable property fundamentals $16,000 $14,000 MTM net exposure of $7.6 billion
Slide 13: Corporate and Investment Bank ABS CDO and subprime-related exposure
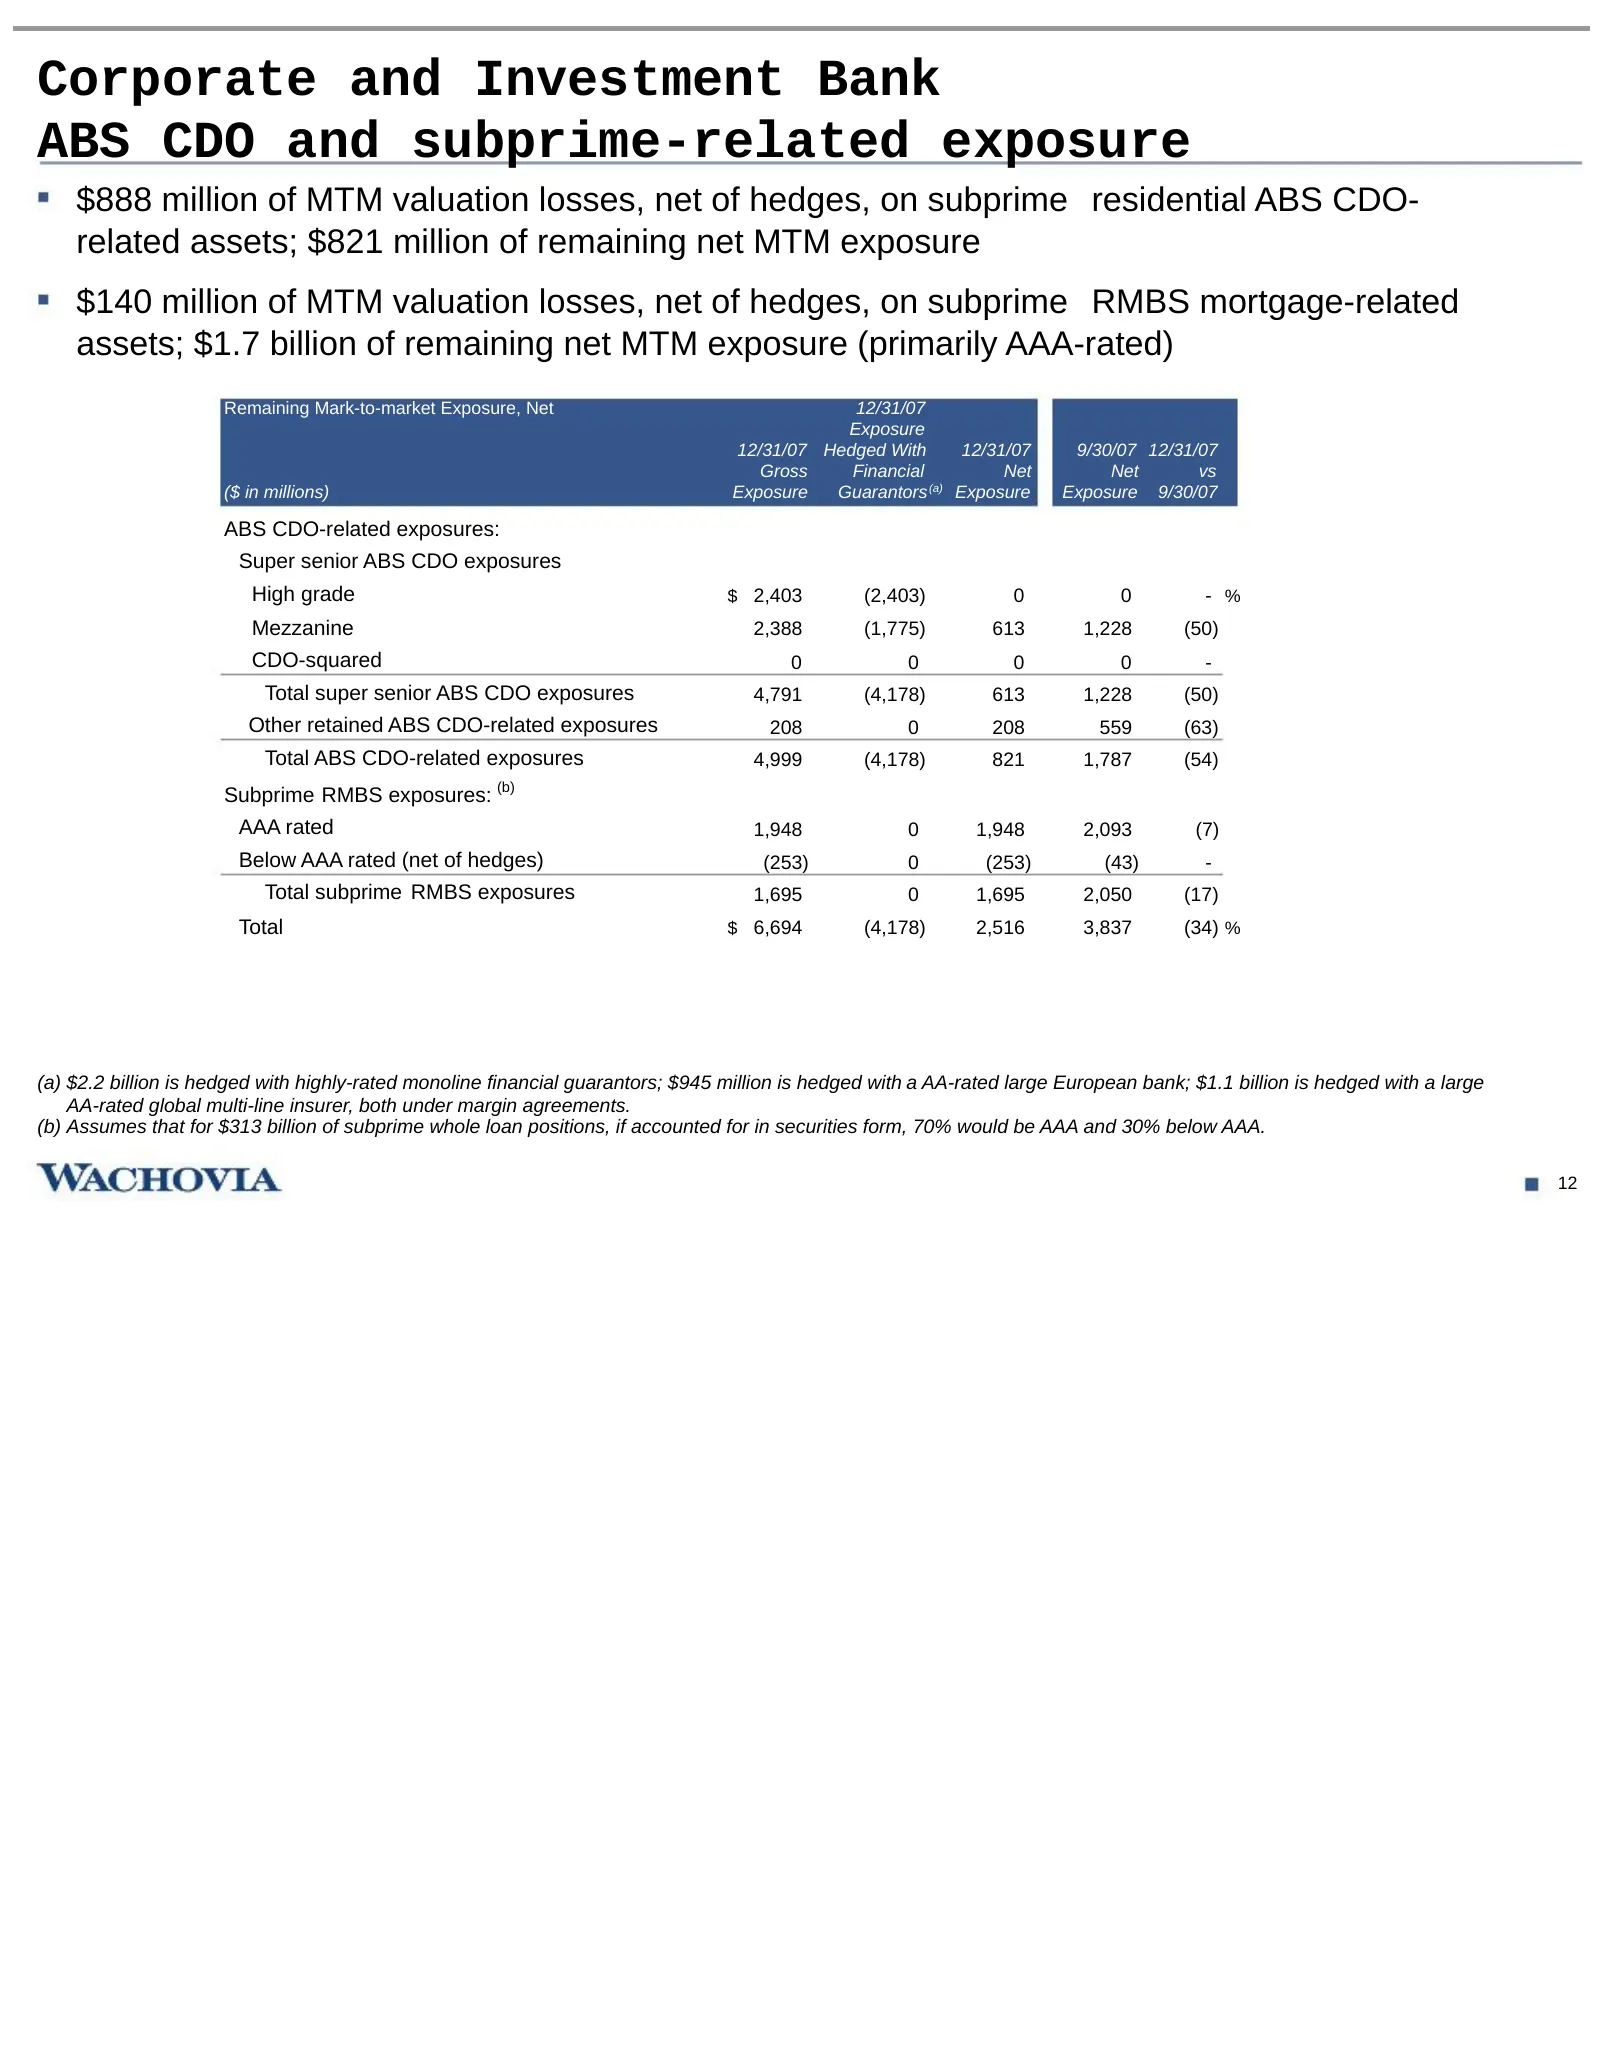
Corporate and Investment Bank ABS CDO and subprime-related exposure $888 million of MTM valuation losses, net of hedges, on subprime residential ABS CDO- related assets; $821 million of remaining net MTM exposure $140 million of MTM valuation losses, net of hedges, on subprime RMBS mortgage-related
Slide 14: Capital Management key metrics
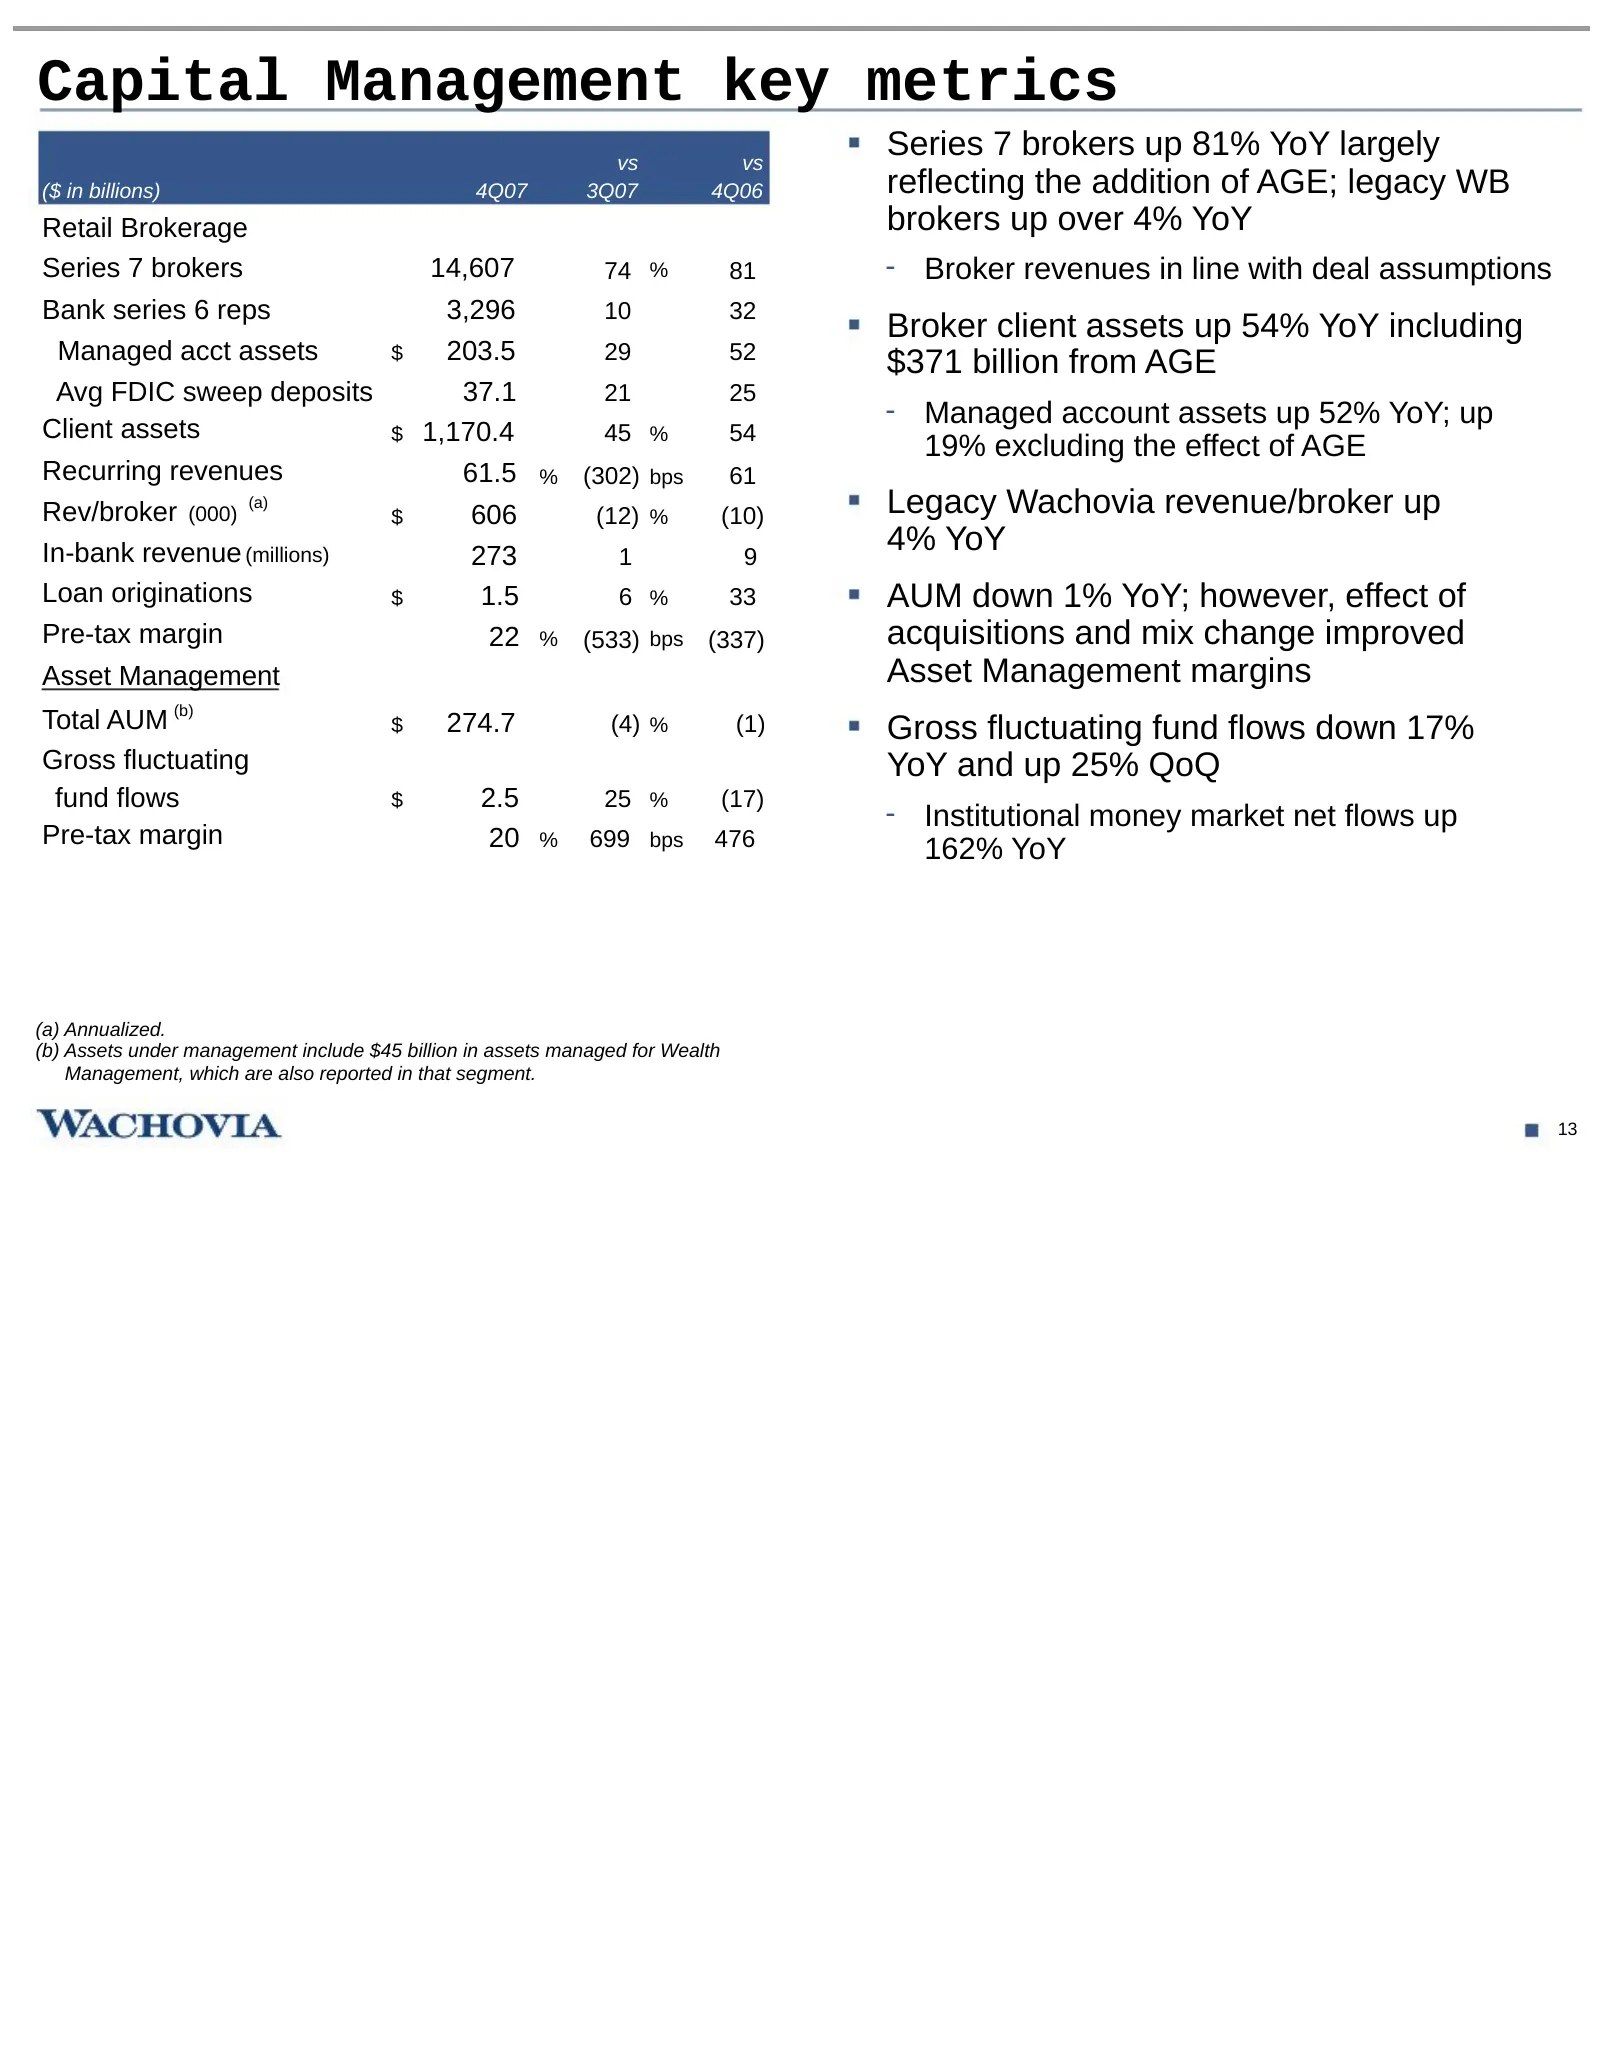
Capital Management key metrics vs vs Series 7 brokers up 81% YoY largely ($ in billions) 4Q07 3Q07 4Q06 reflecting the addition of AGE; legacy WB Retail Brokerage brokers up over 4% YoY Series 7 brokers 14,607 74 % 81 - Broker revenues in line with deal assumptions Bank series 6 reps 3,296 10 32 Bro
Slide 15: Capital Management summary
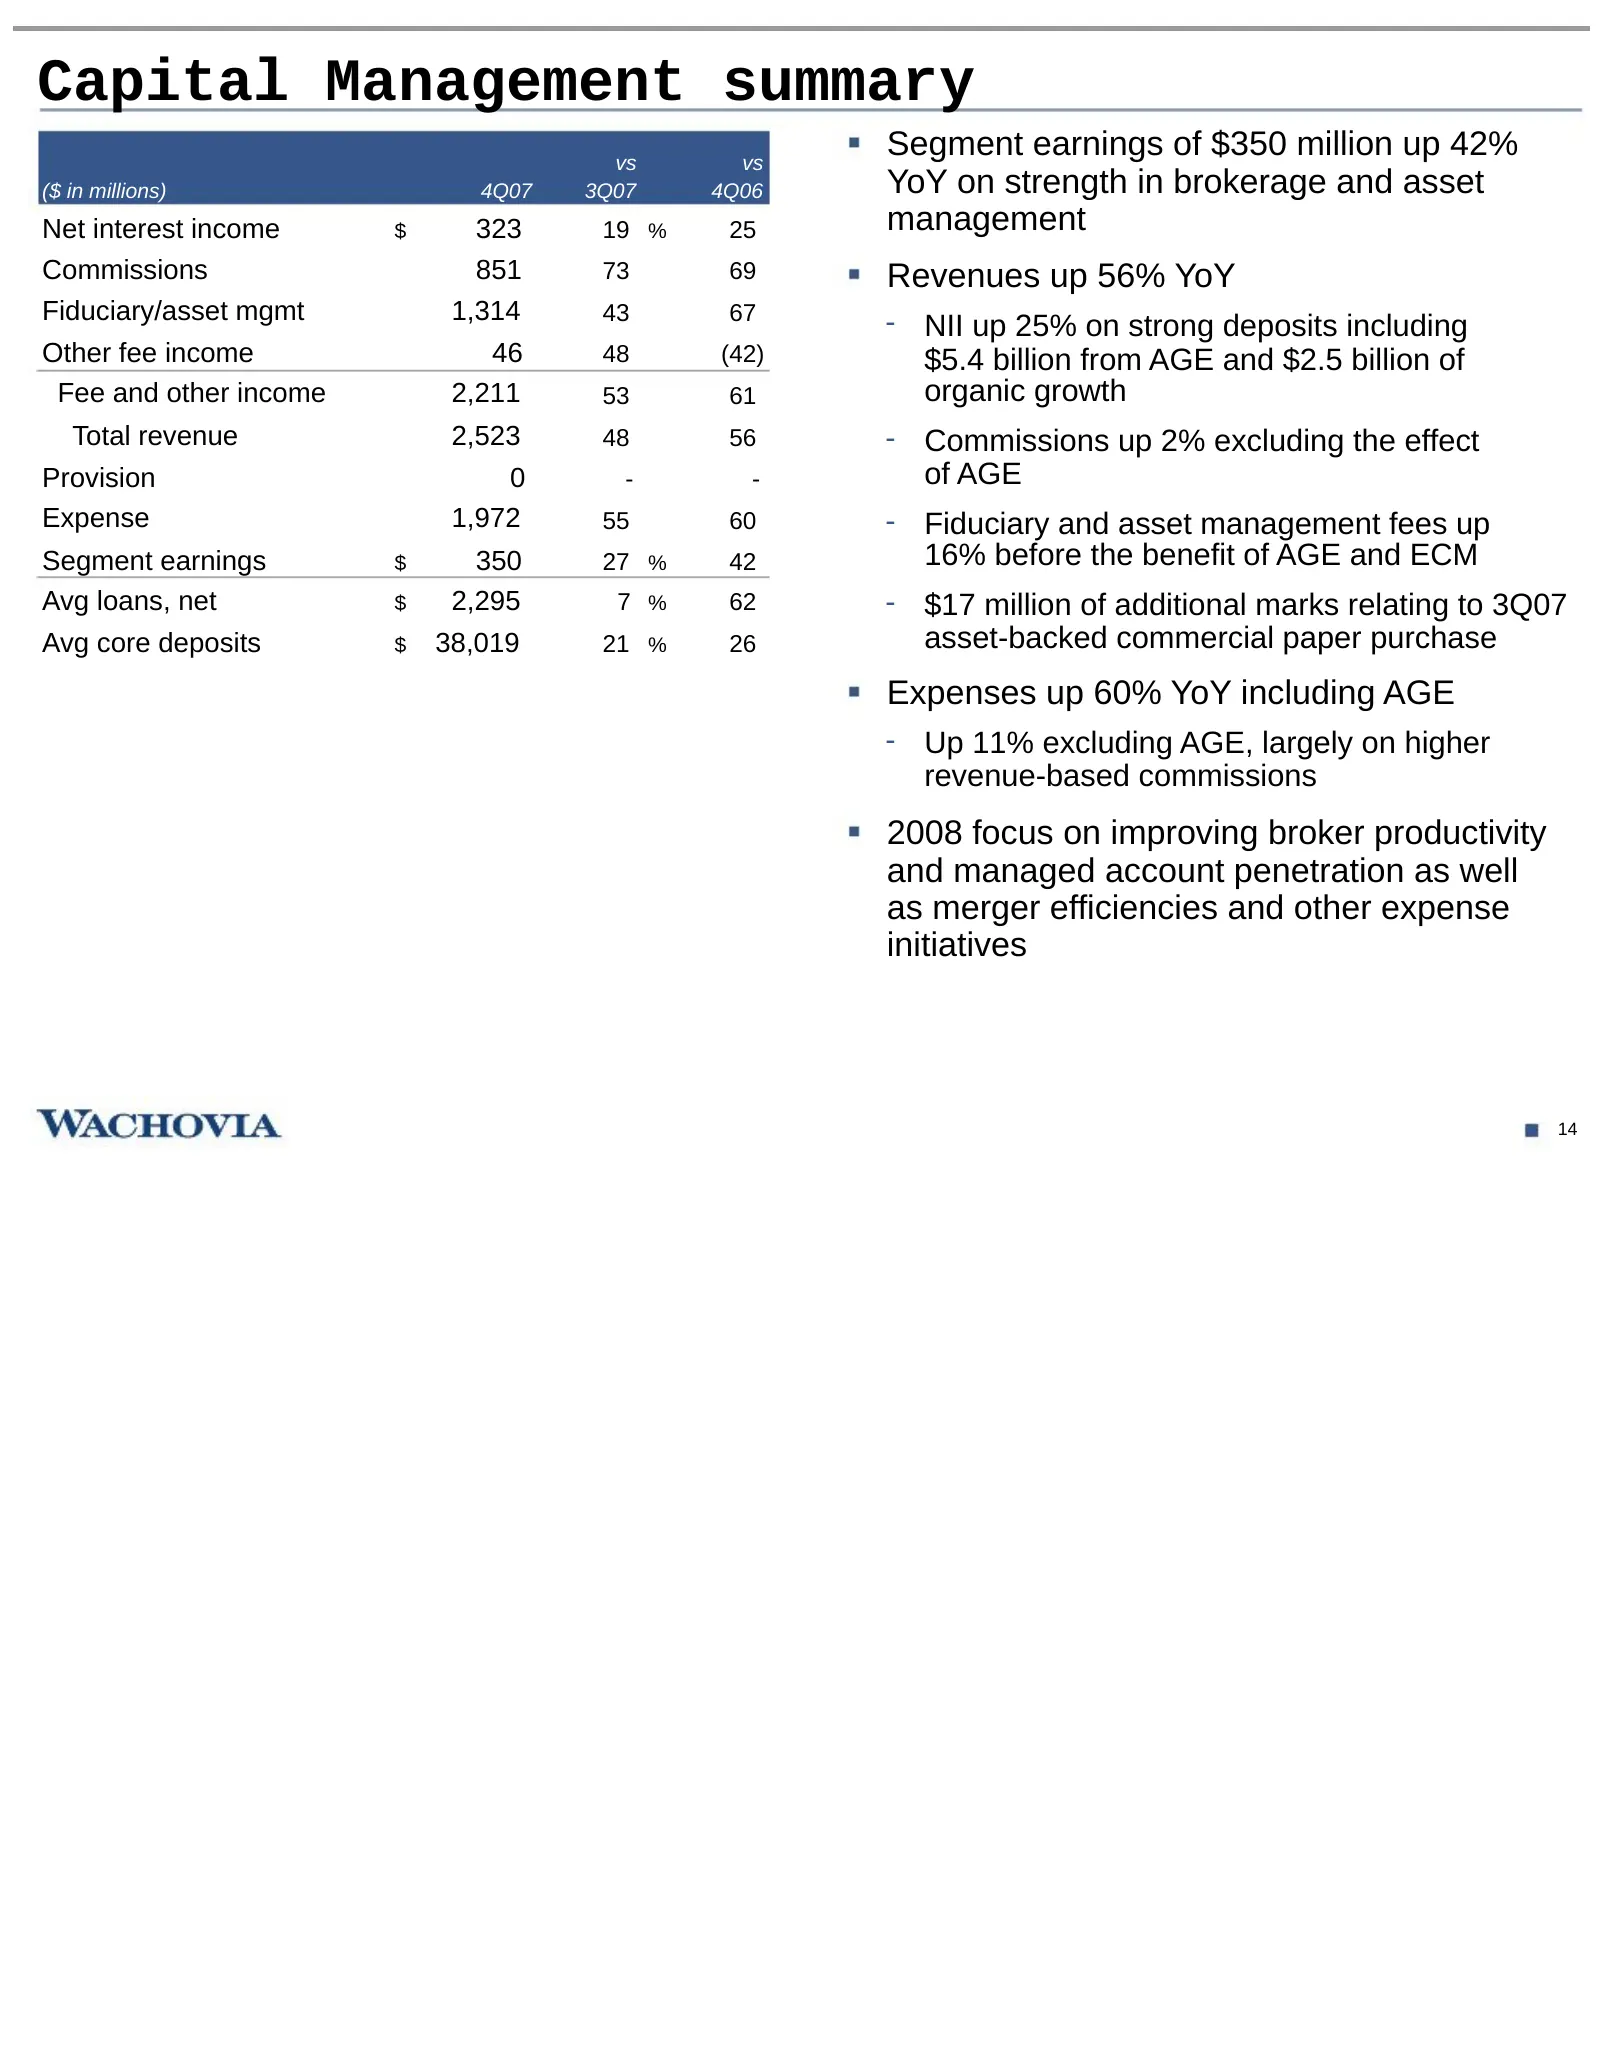
Capital Management summary vs vs Segment earnings of $350 million up 42% ($ in millions) 4Q07 3Q07 4Q06 YoY on strength in brokerage and asset Net interest income $ 323 19 % 25 management Commissions 851 73 69 Revenues up 56% YoY Fiduciary/asset mgmt 1,314 43 67 - NII up 25% on strong deposits inclu
Slide 16: Credit quality
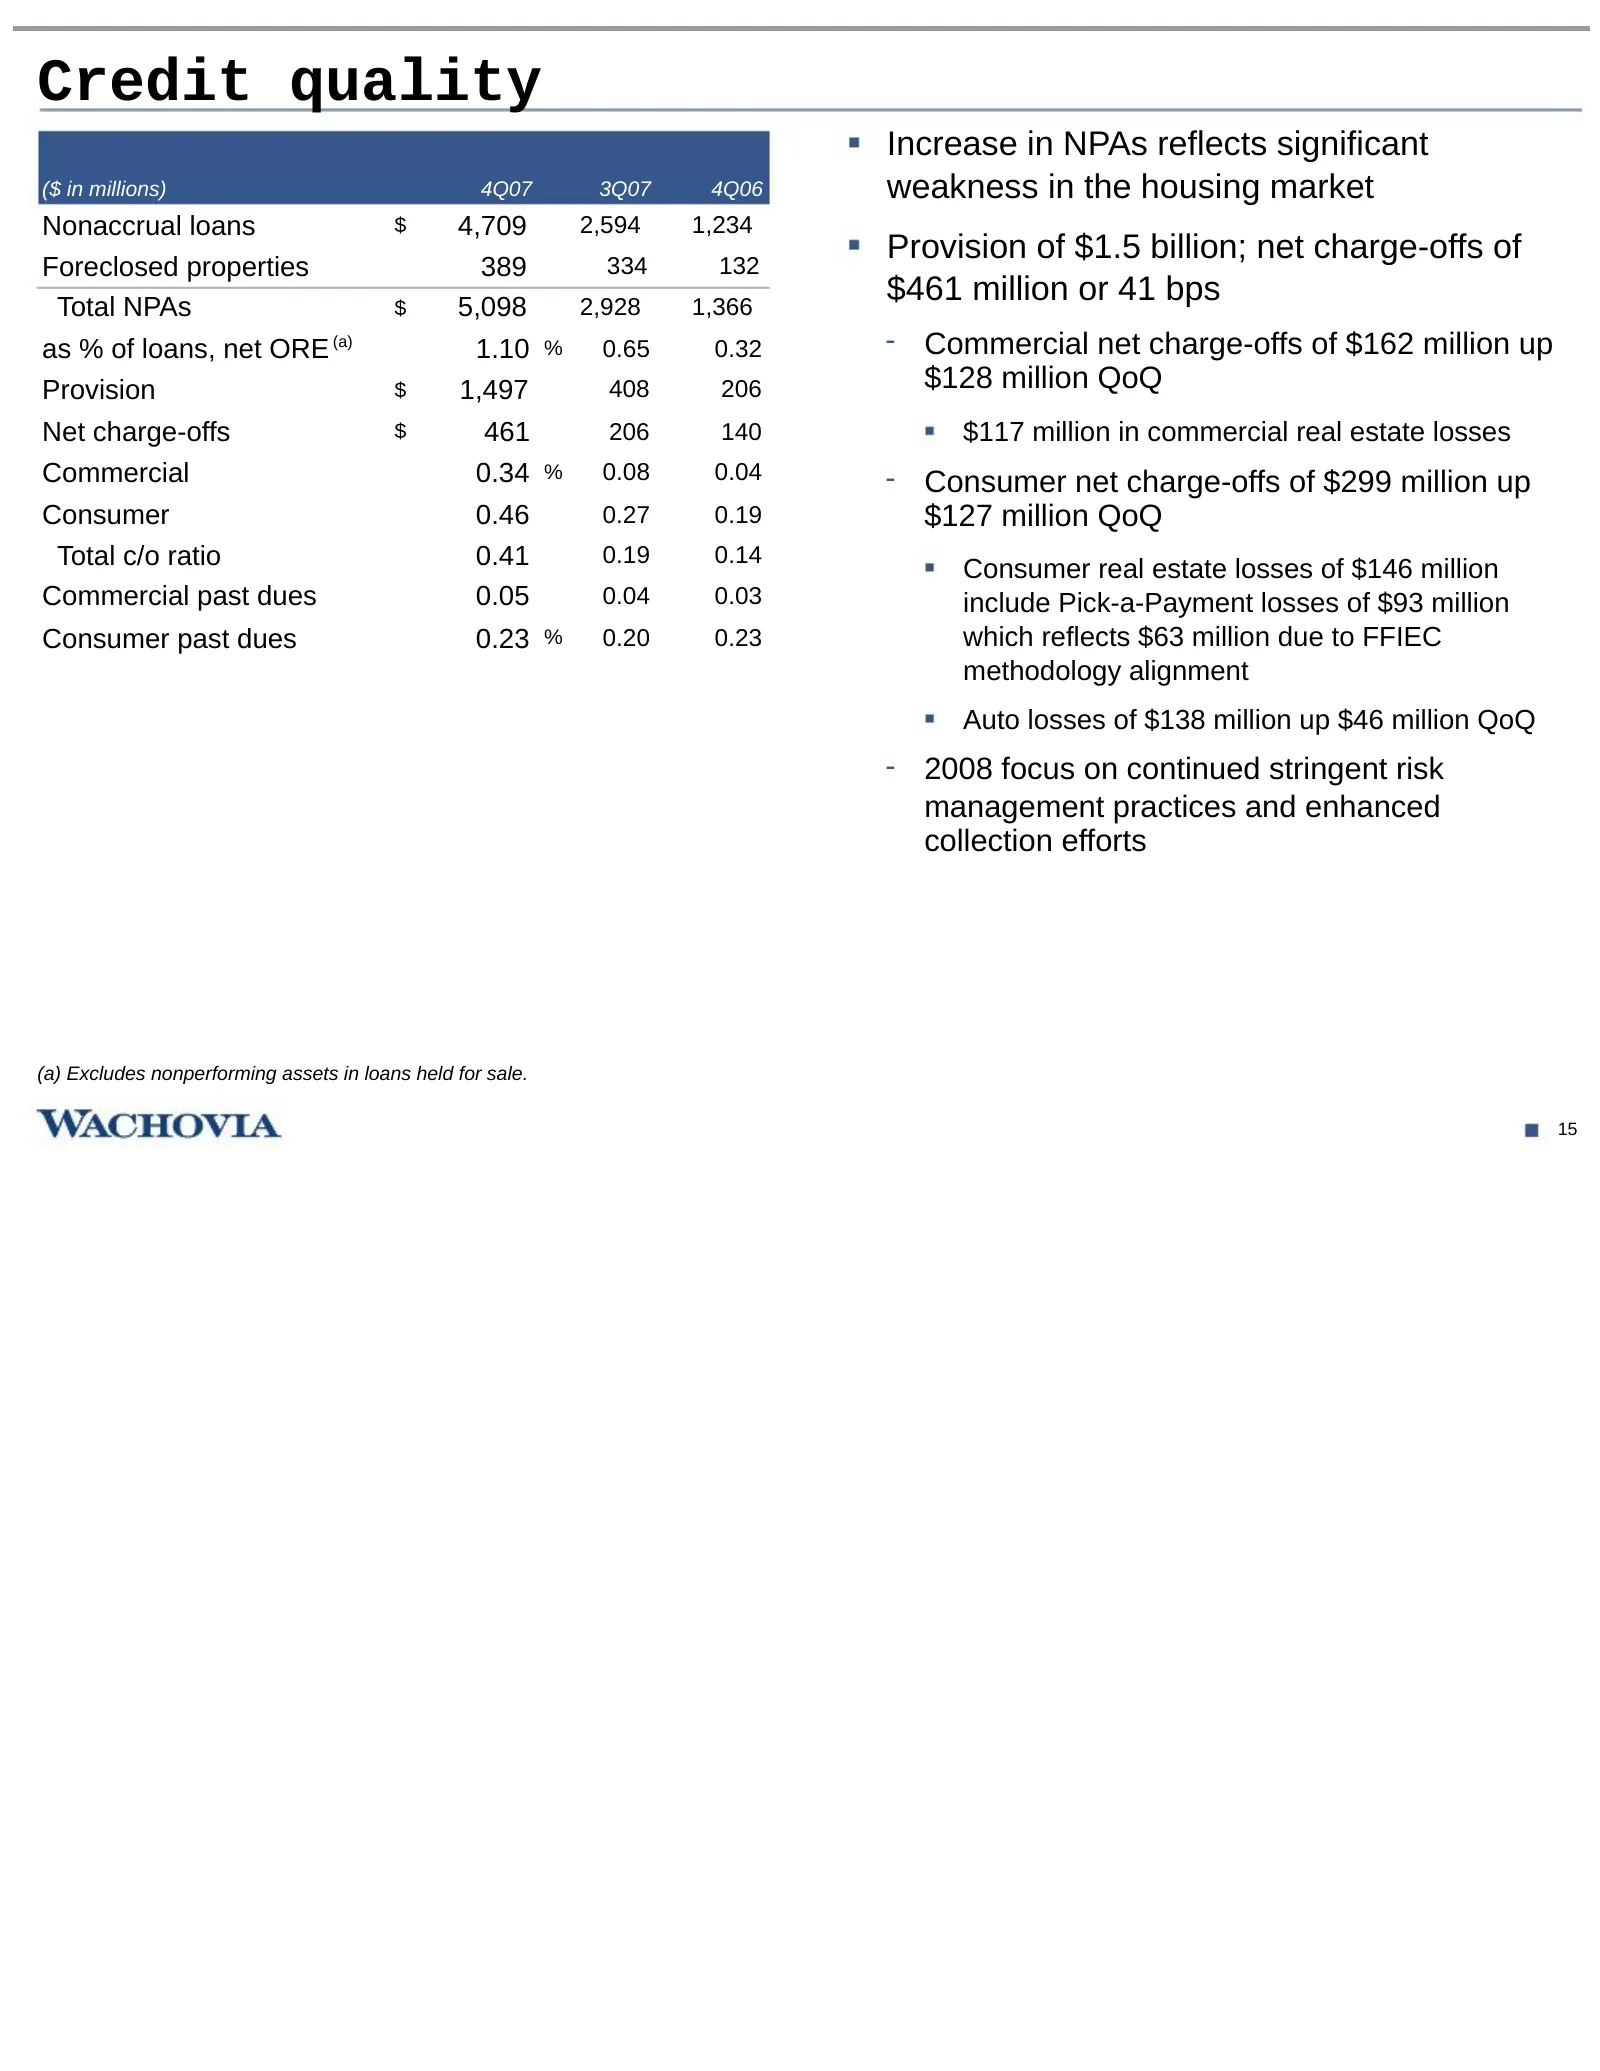
Credit quality Increase in NPAs reflects significant ($ in millions) 4Q07 3Q07 4Q06 weakness in the housing market Nonaccrual loans $ 4,709 2,594 1,234 Provision of $1.5 billion; net charge-offs of Foreclosed properties 389 334 132 Total NPAs $ 5,098 2,928 1,366 $461 million or 41 bps as % of loans,
Slide 17: Allowance for credit losses
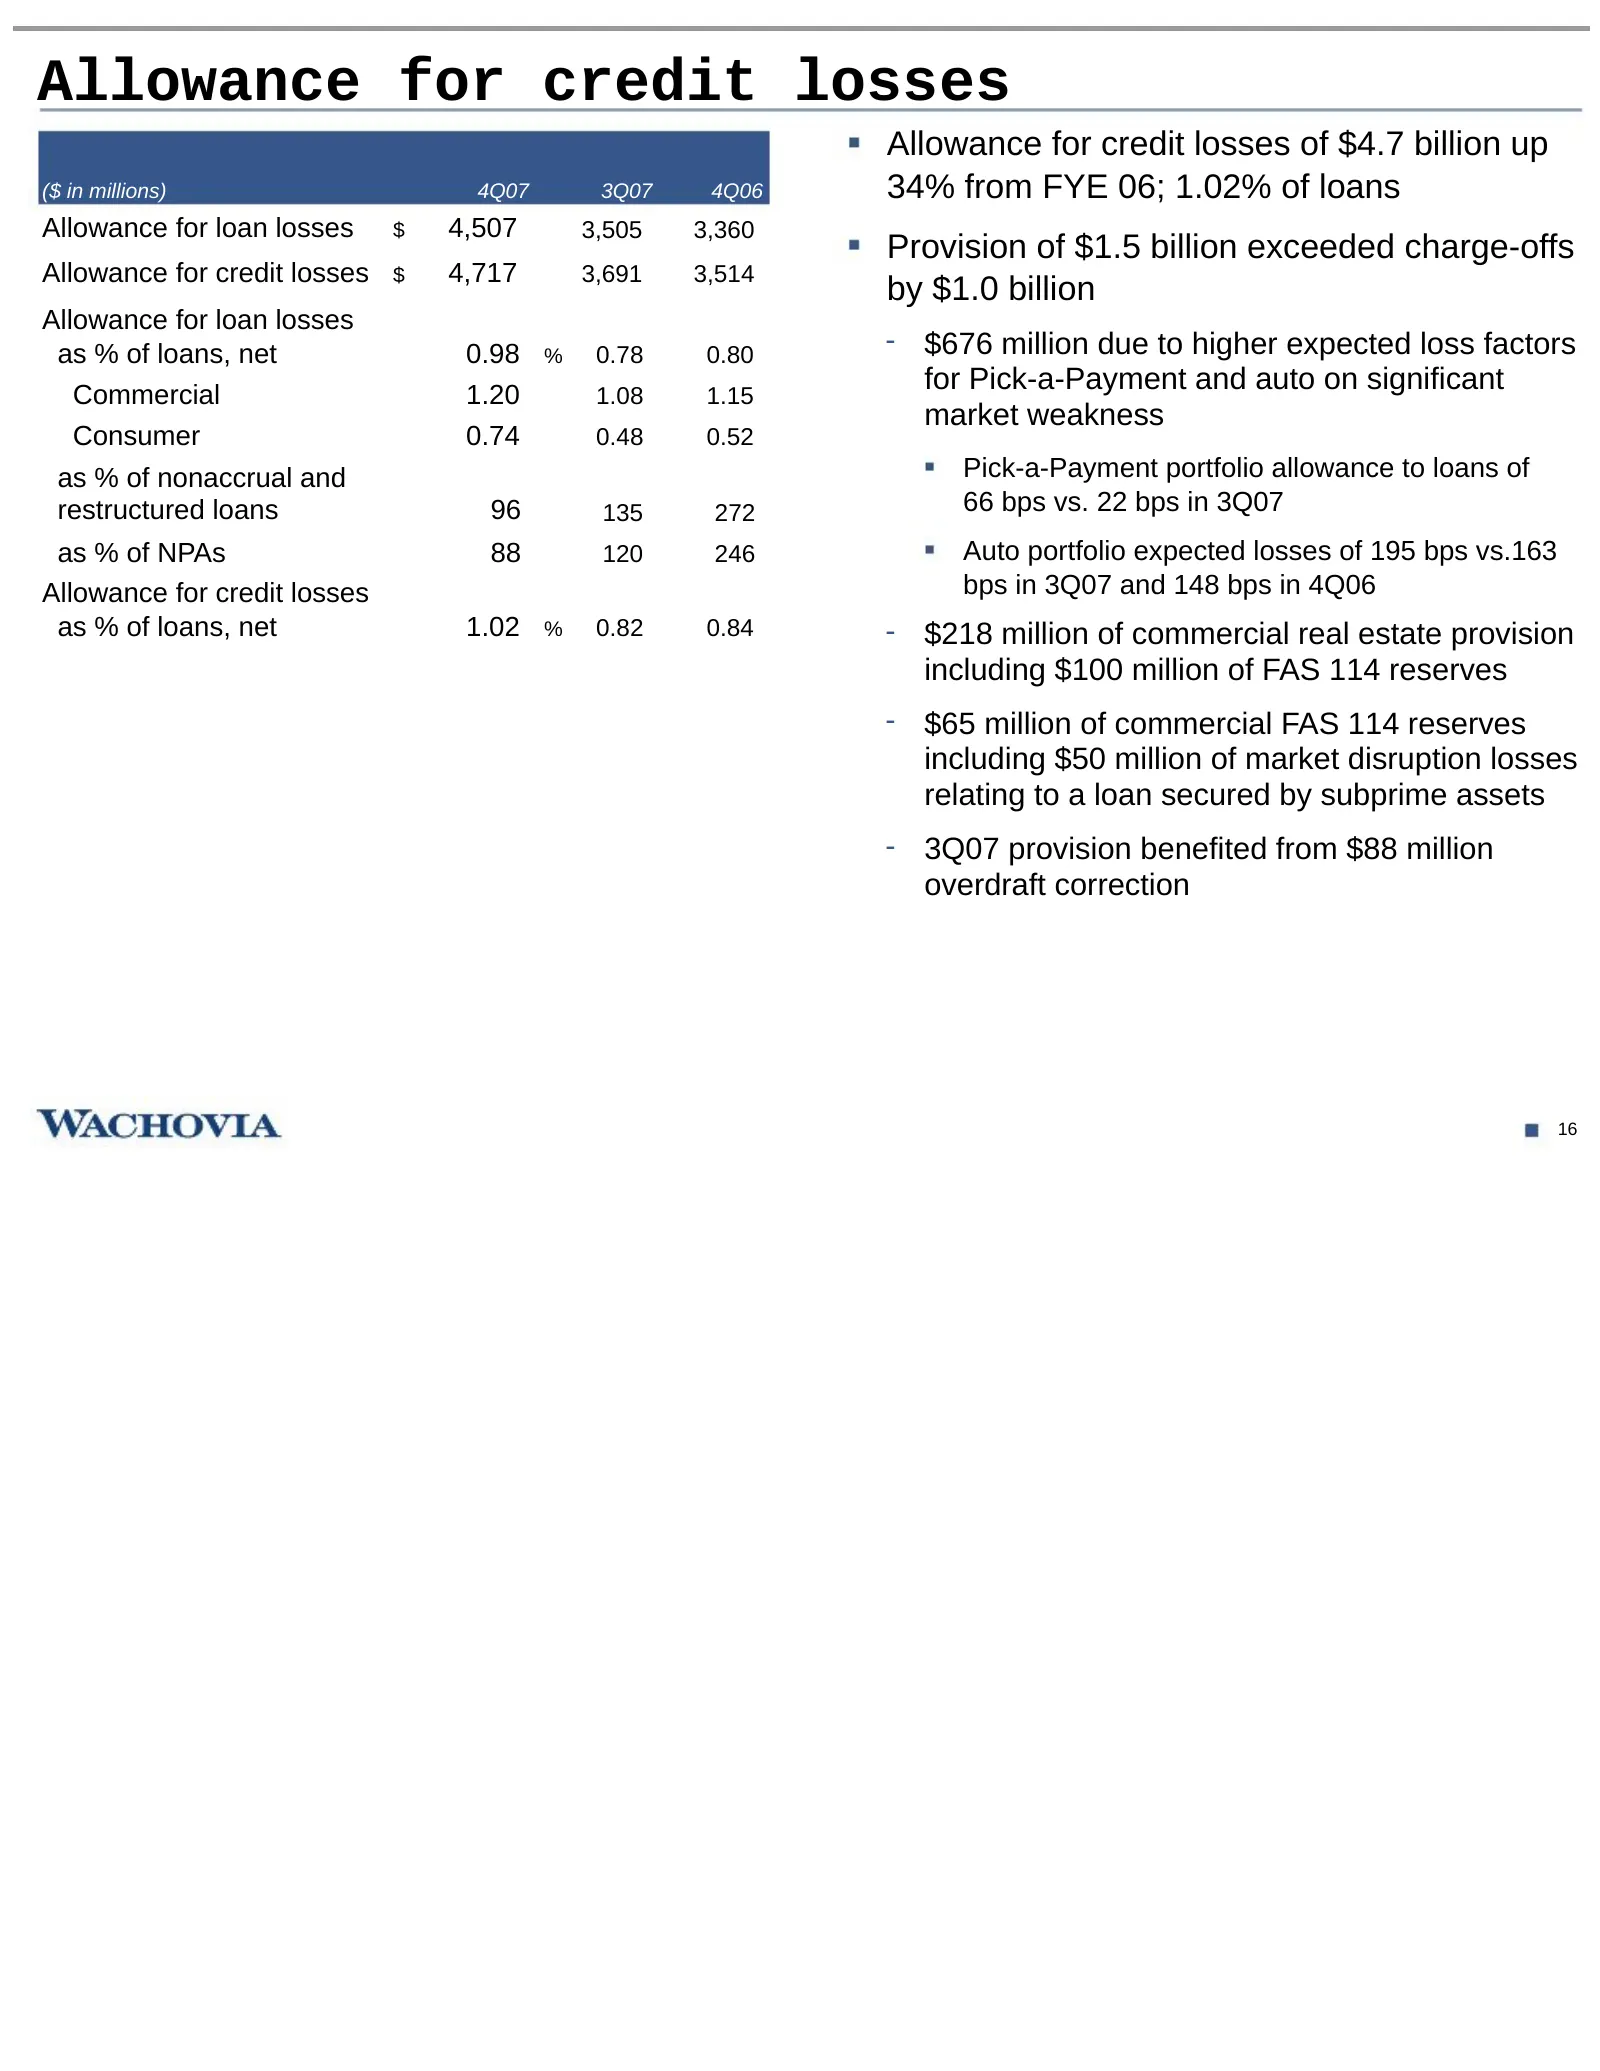
Allowance for credit losses Allowance for credit losses of $4.7 billion up ($ in millions) 4Q07 3Q07 4Q06 34% from FYE 06; 1.02% of loans Allowance for loan losses $ 4,507 3,505 3,360 Provision of $1.5 billion exceeded charge-offs Allowance for credit losses $ 4,717 3,691 3,514 by $1.0 billion Allow
Slide 18: Mortgage portfolio
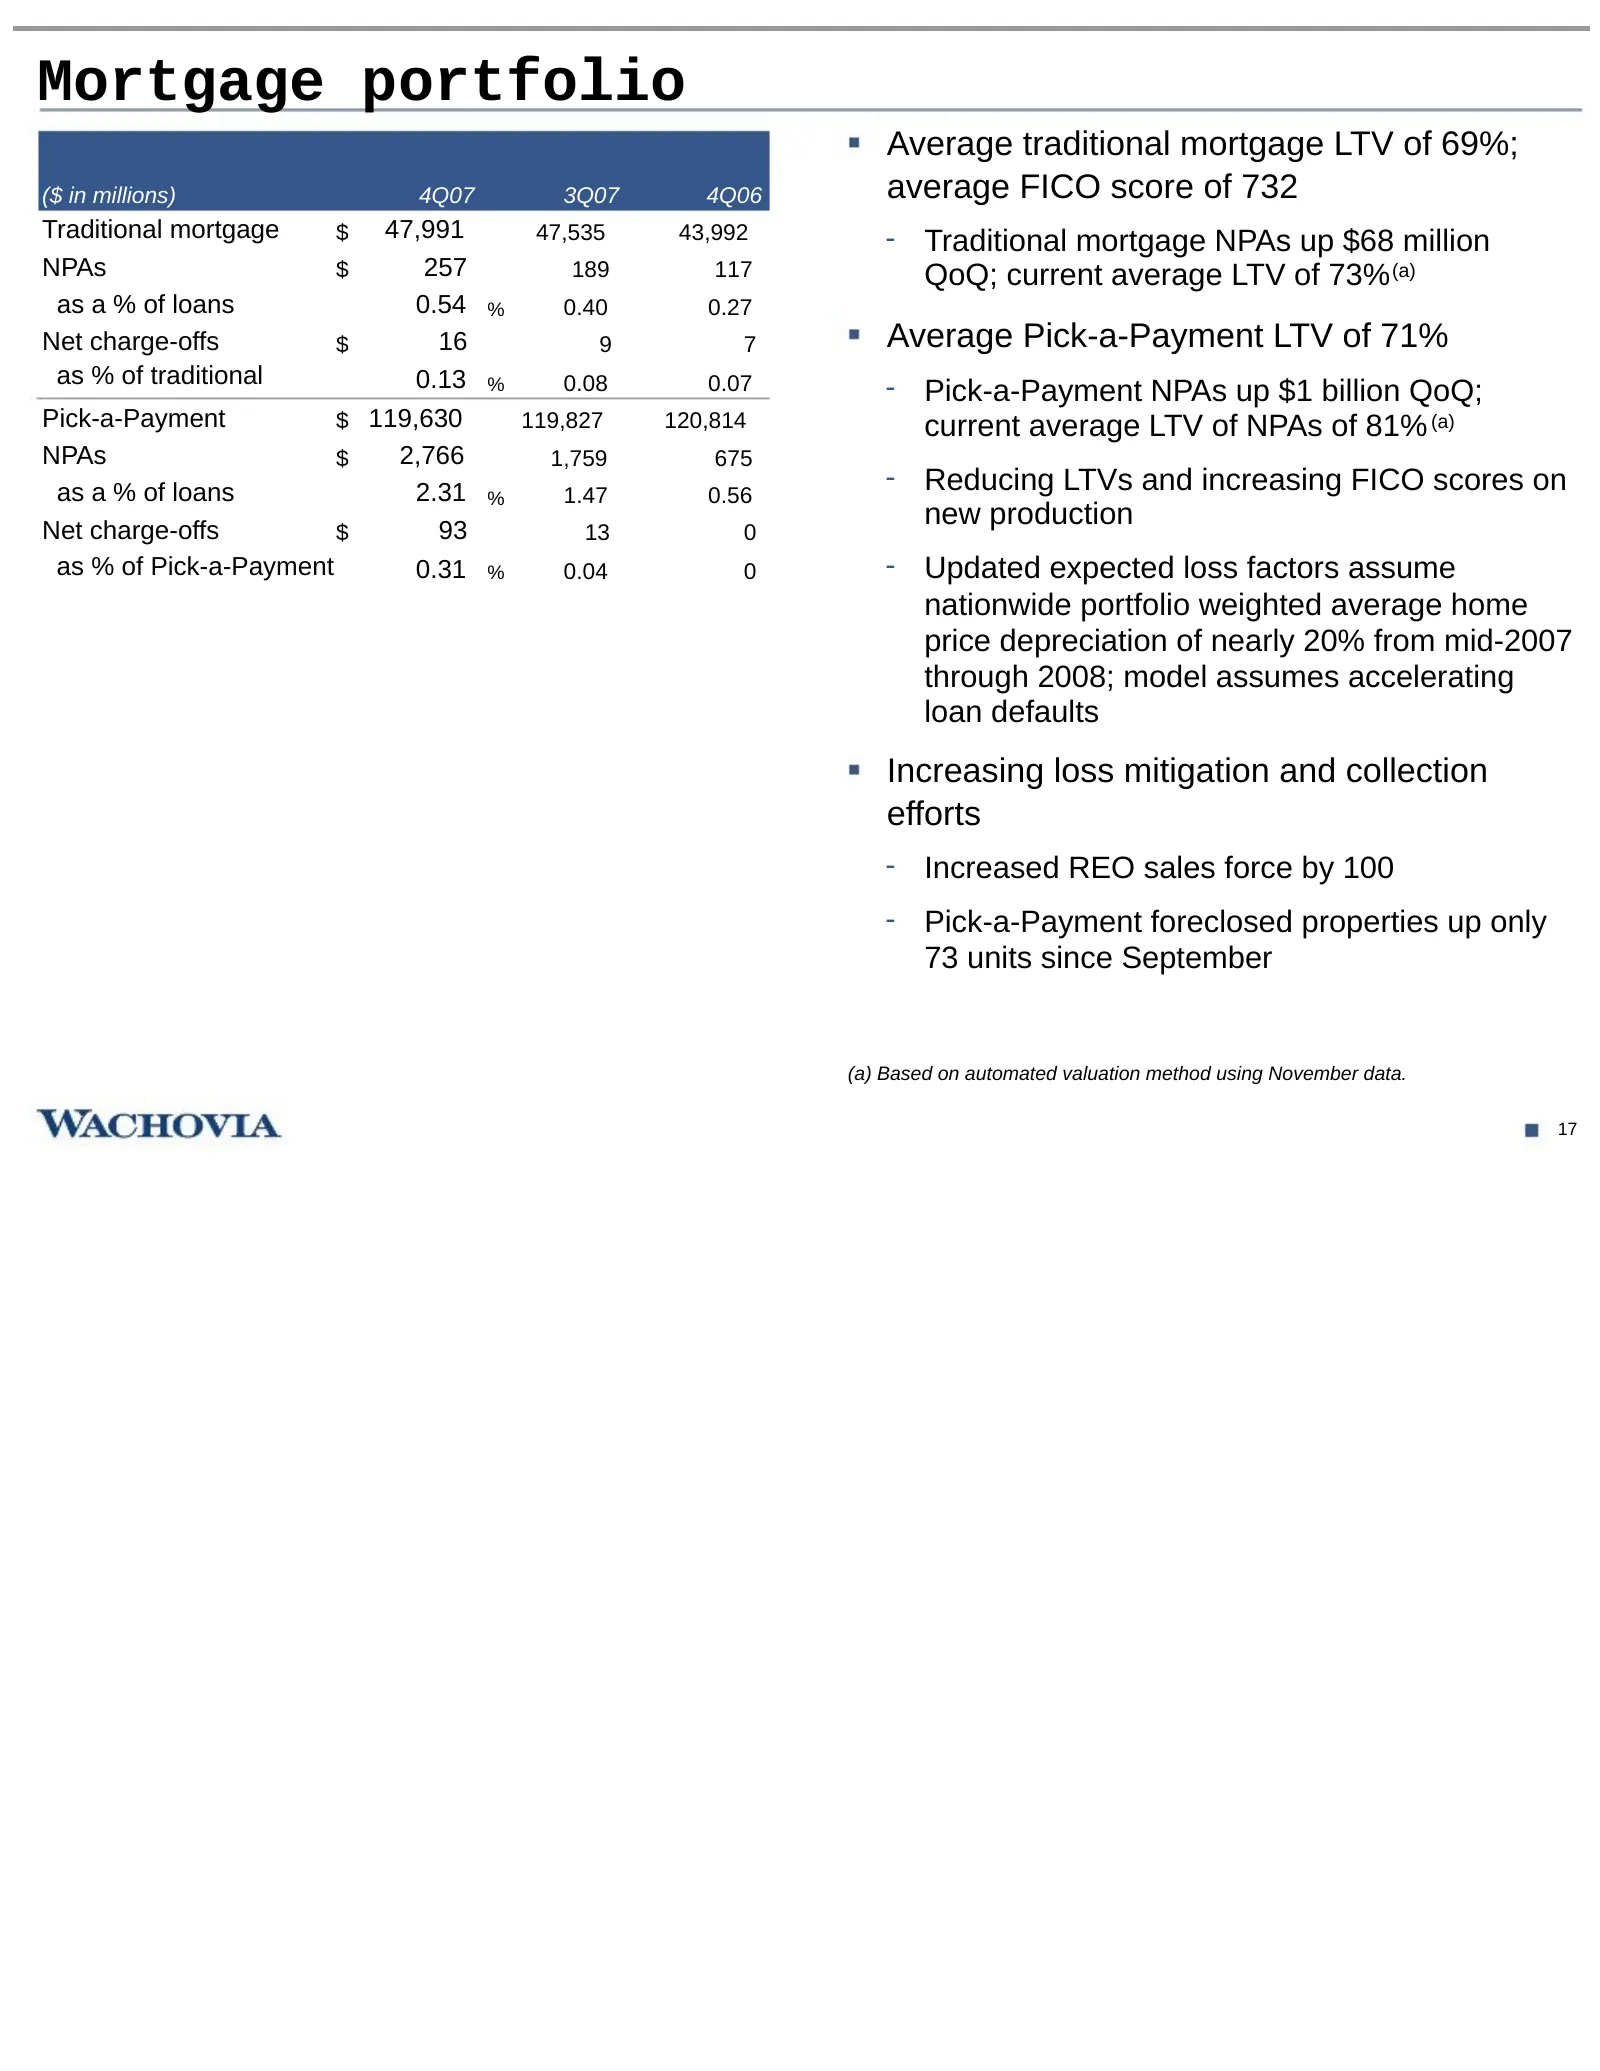
Mortgage portfolio Average traditional mortgage LTV of 69%; ($ in millions) 4Q07 3Q07 4Q06 average FICO score of 732 Traditional mortgage $ 47,991 47,535 43,992 - Traditional mortgage NPAs up $68 million NPAs $ 257 189 117 QoQ; current average LTV of 73% (a) as a % of loans 0.54 % 0.40 0.27 Net char
Slide 19: Wachovia Mortgage 90+ days past due vs. industry
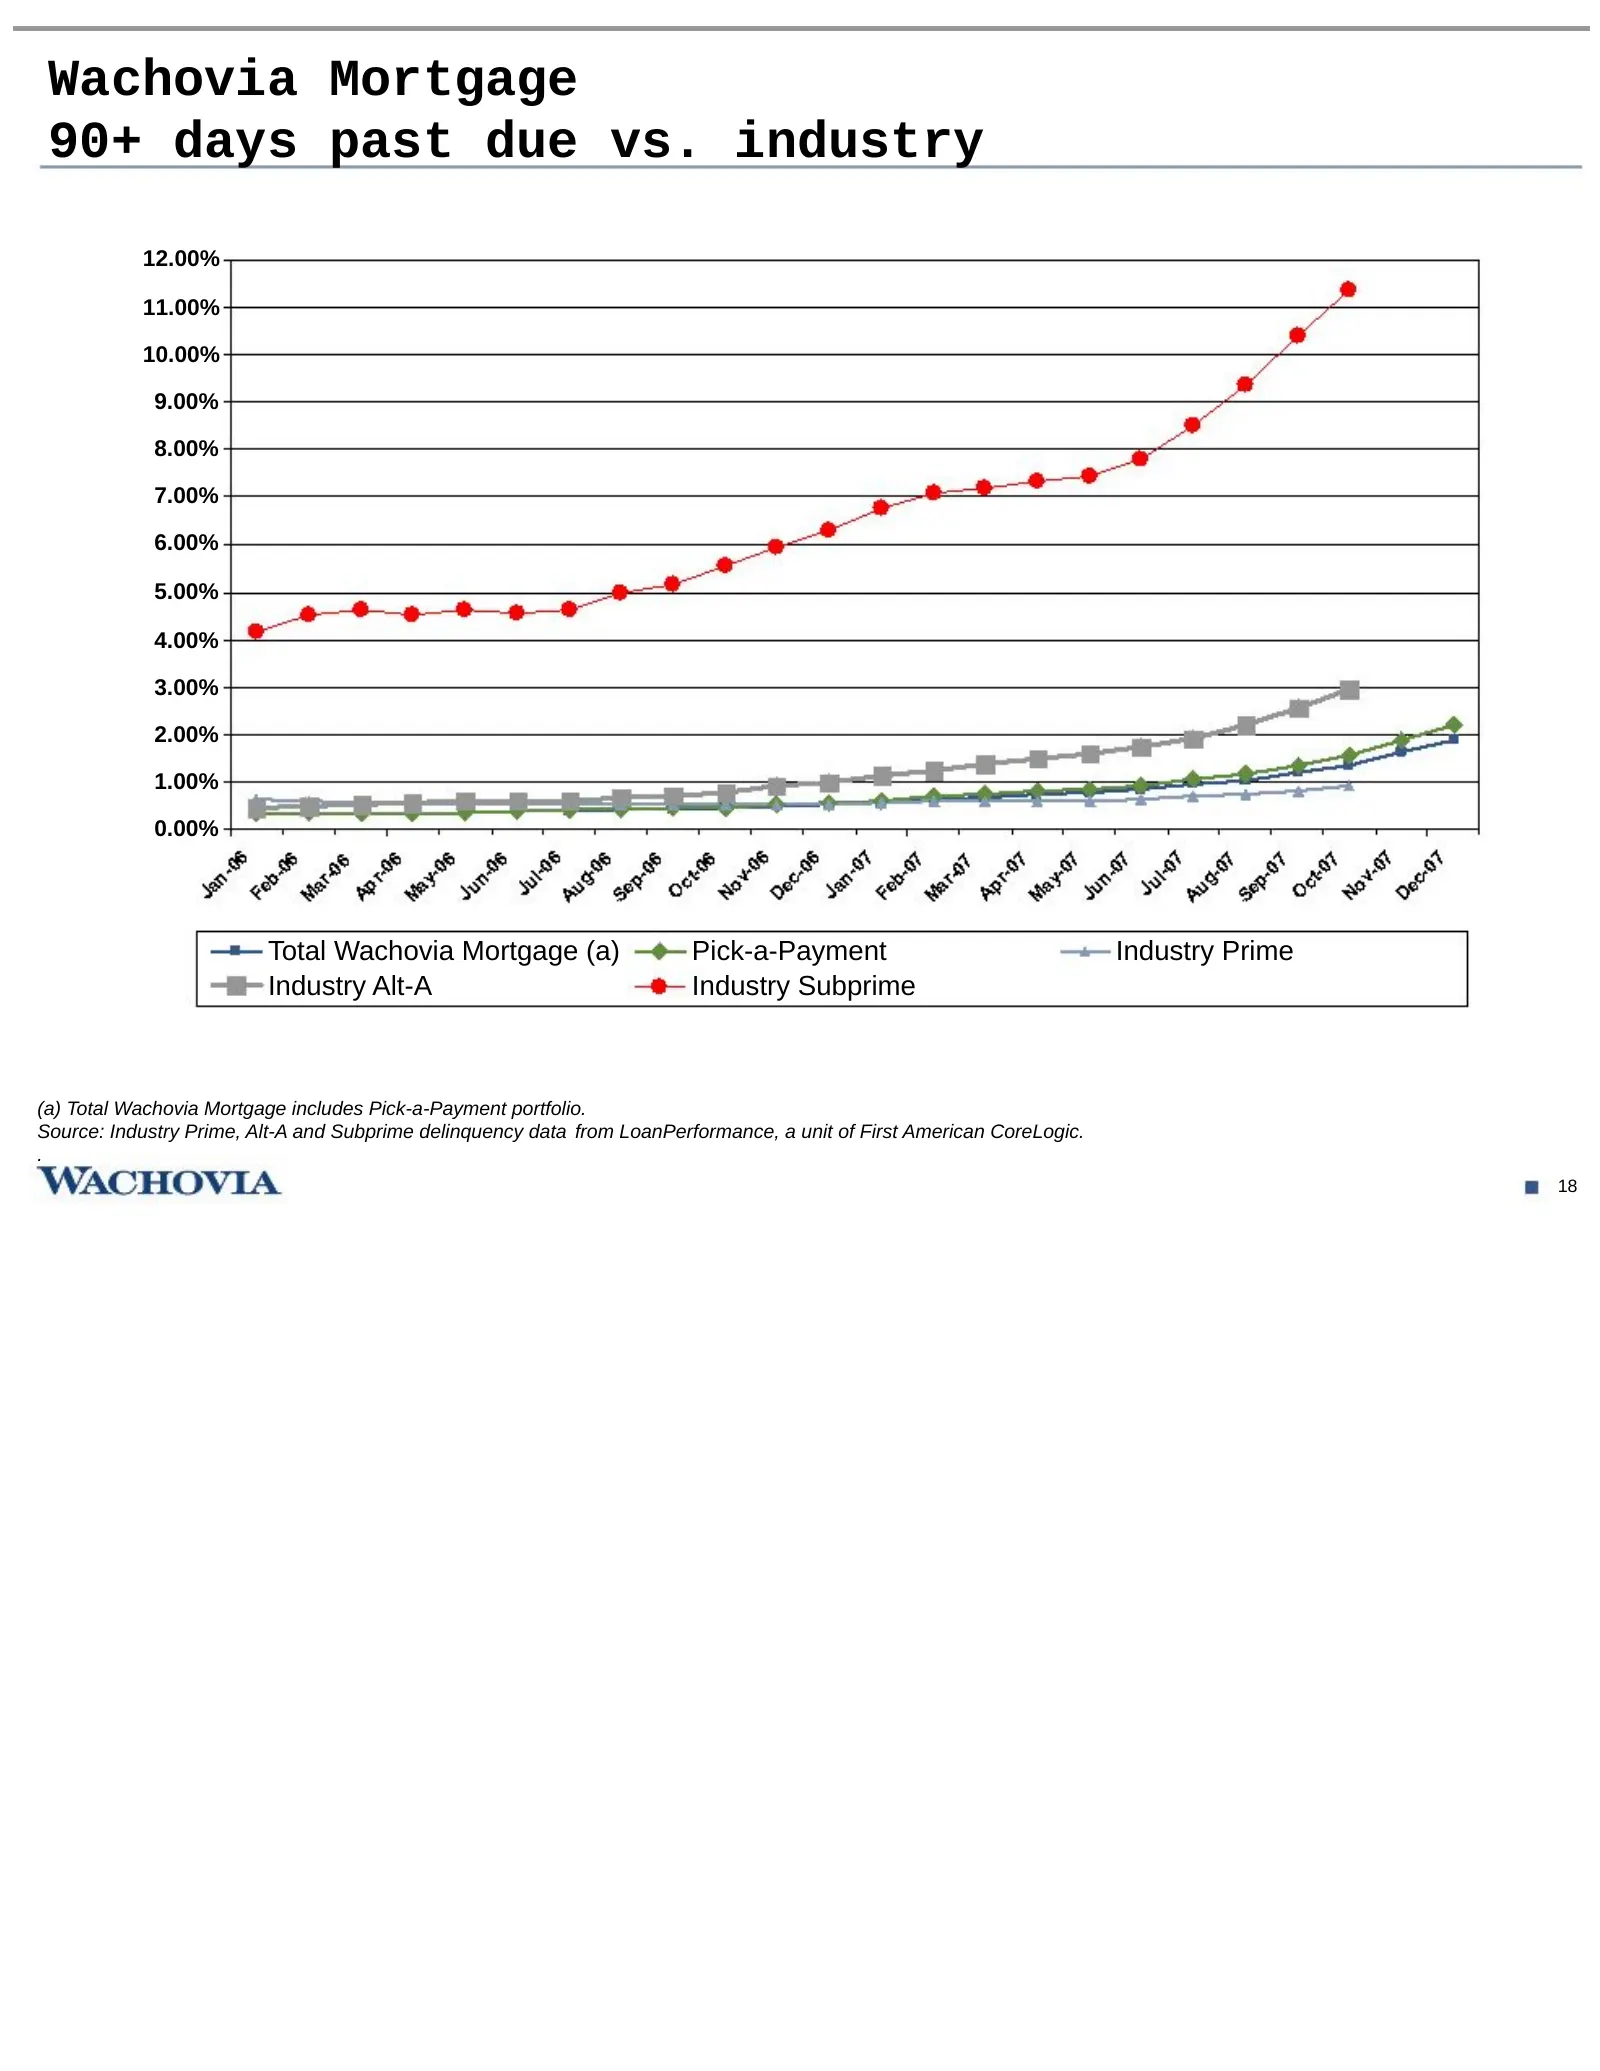
Wachovia Mortgage 90+ days past due vs. industry 12.00% 11.00% 10.00% 9.00% 8.00% 7.00% 6.00% 5.00% 4.00% 3.00% 2.00% 1.00% 0.00% Total Wachovia Mortgage (a) Pick-a-Payment Industry Prime Industry Alt-A Industry Subprime (a) Total Wachovia Mortgage includes Pick-a-Payment portfolio. Source: Industry
Slide 20: Wachovia Mortgage 90+ days past due by vintage vs. industry
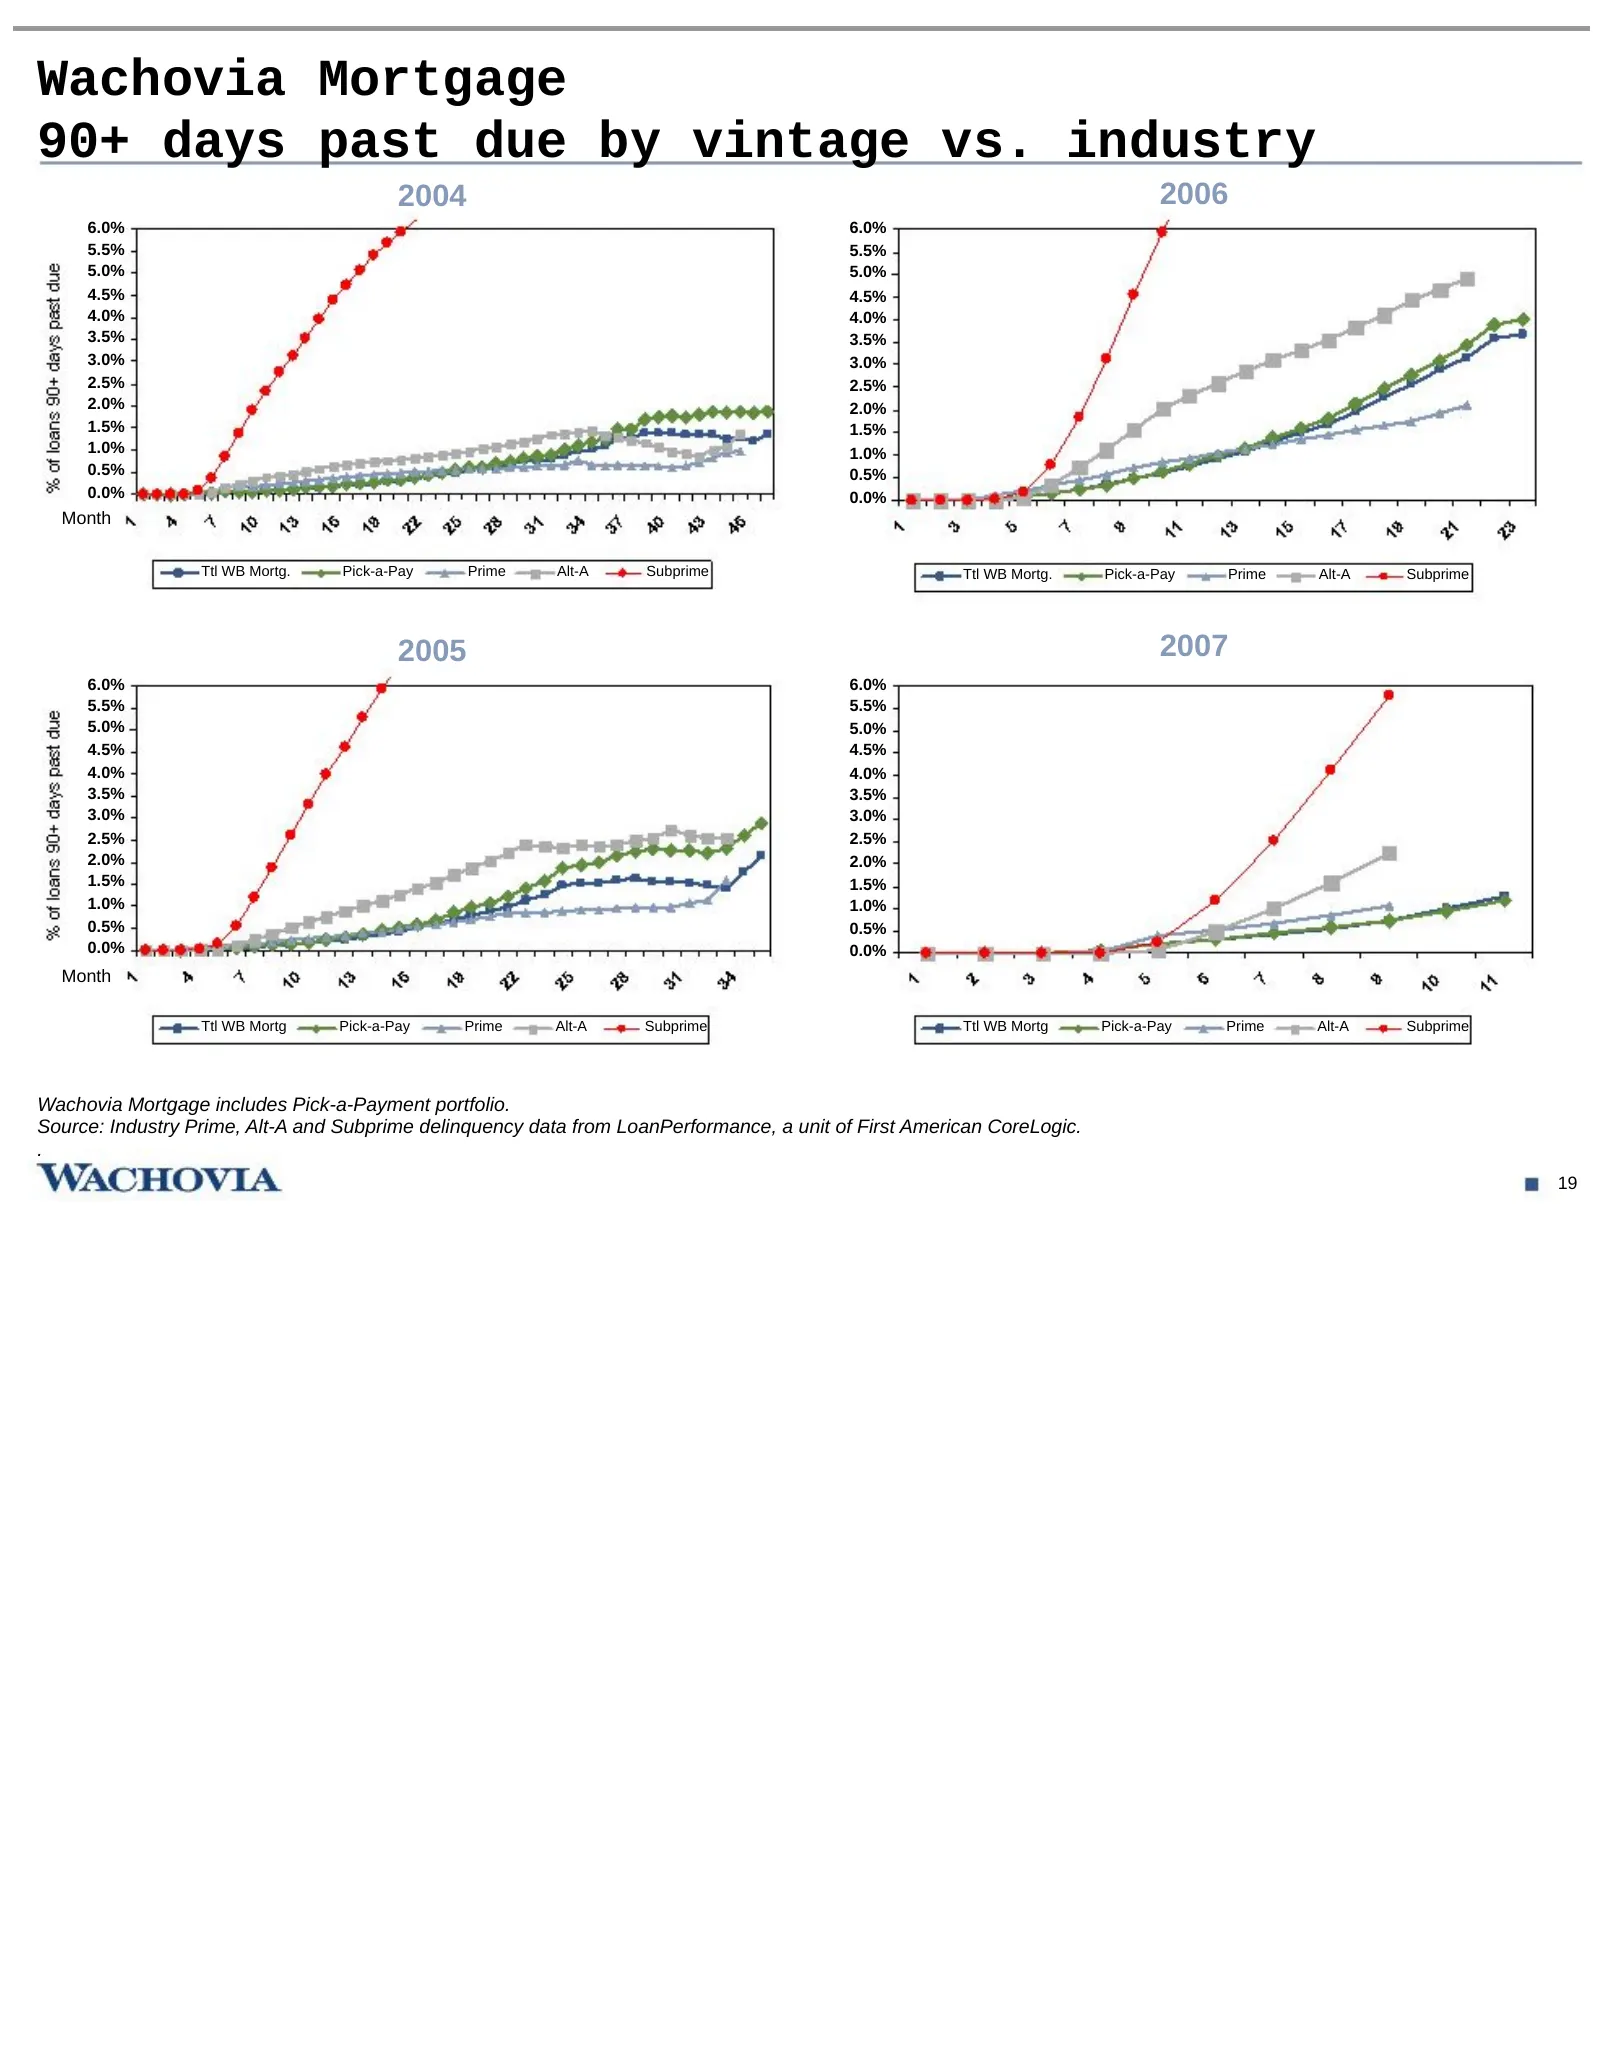
Wachovia Mortgage 90+ days past due by vintage vs. industry 2004 2006 6.0% 6.0% 5.5% 5.5% 5.0% 5.0% 4.5% 4.5% 4.0% 4.0% 3.5% 3.5% 3.0% 3.0% 2.5% 2.5% 2.0% 2.0% 1.5% 1.5% 1.0% 1.0% 0.5% 0.5% 0.0% 0.0% Month Ttl WB Mortg. Pick-a-Pay Prime Alt-A Subprime Ttl WB Mortg. Pick-a-Pay Prime Alt-A Subprime 20
Slide 21: Home equity loans and lines
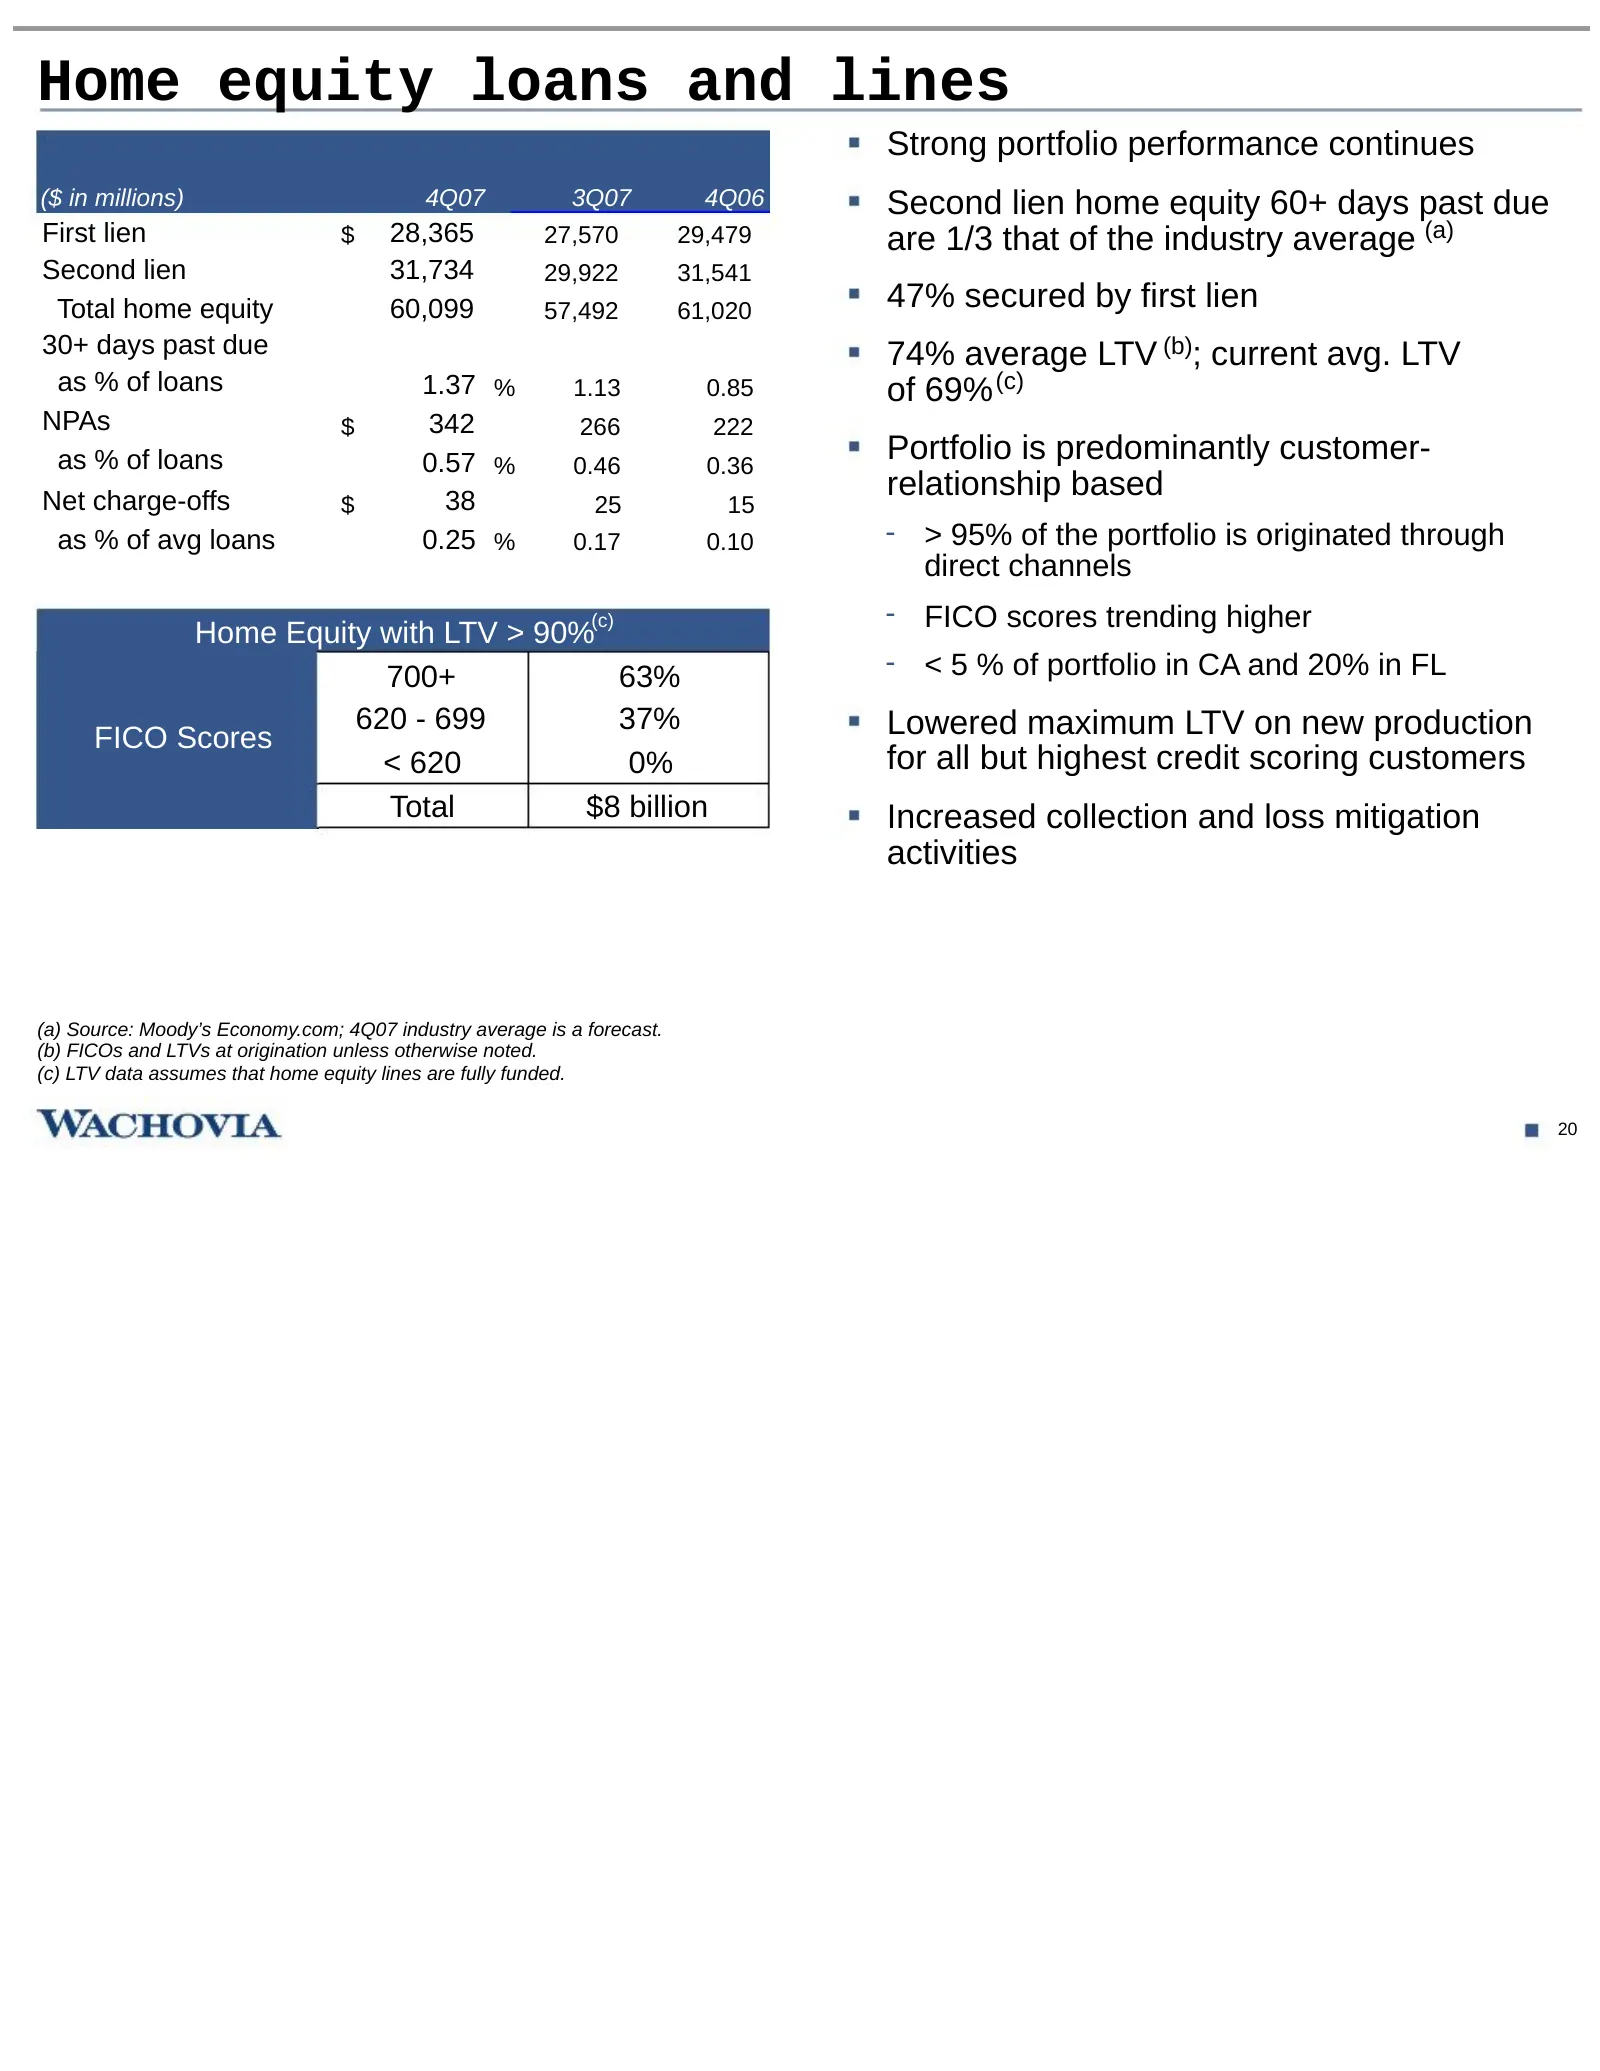
Home equity loans and lines Strong portfolio performance continues ($ in millions) 4Q07 3Q07 4Q06 Second lien home equity 60+ days past due First lien $ 28,365 27,570 29,479 are 1/3 that of the industry average (a) Second lien 31,734 29,922 31,541 Total home equity 60,099 57,492 61,020 47% secured b
Slide 22: Wachovia second lien home equity loans and lines 60+ days past due vs. industry
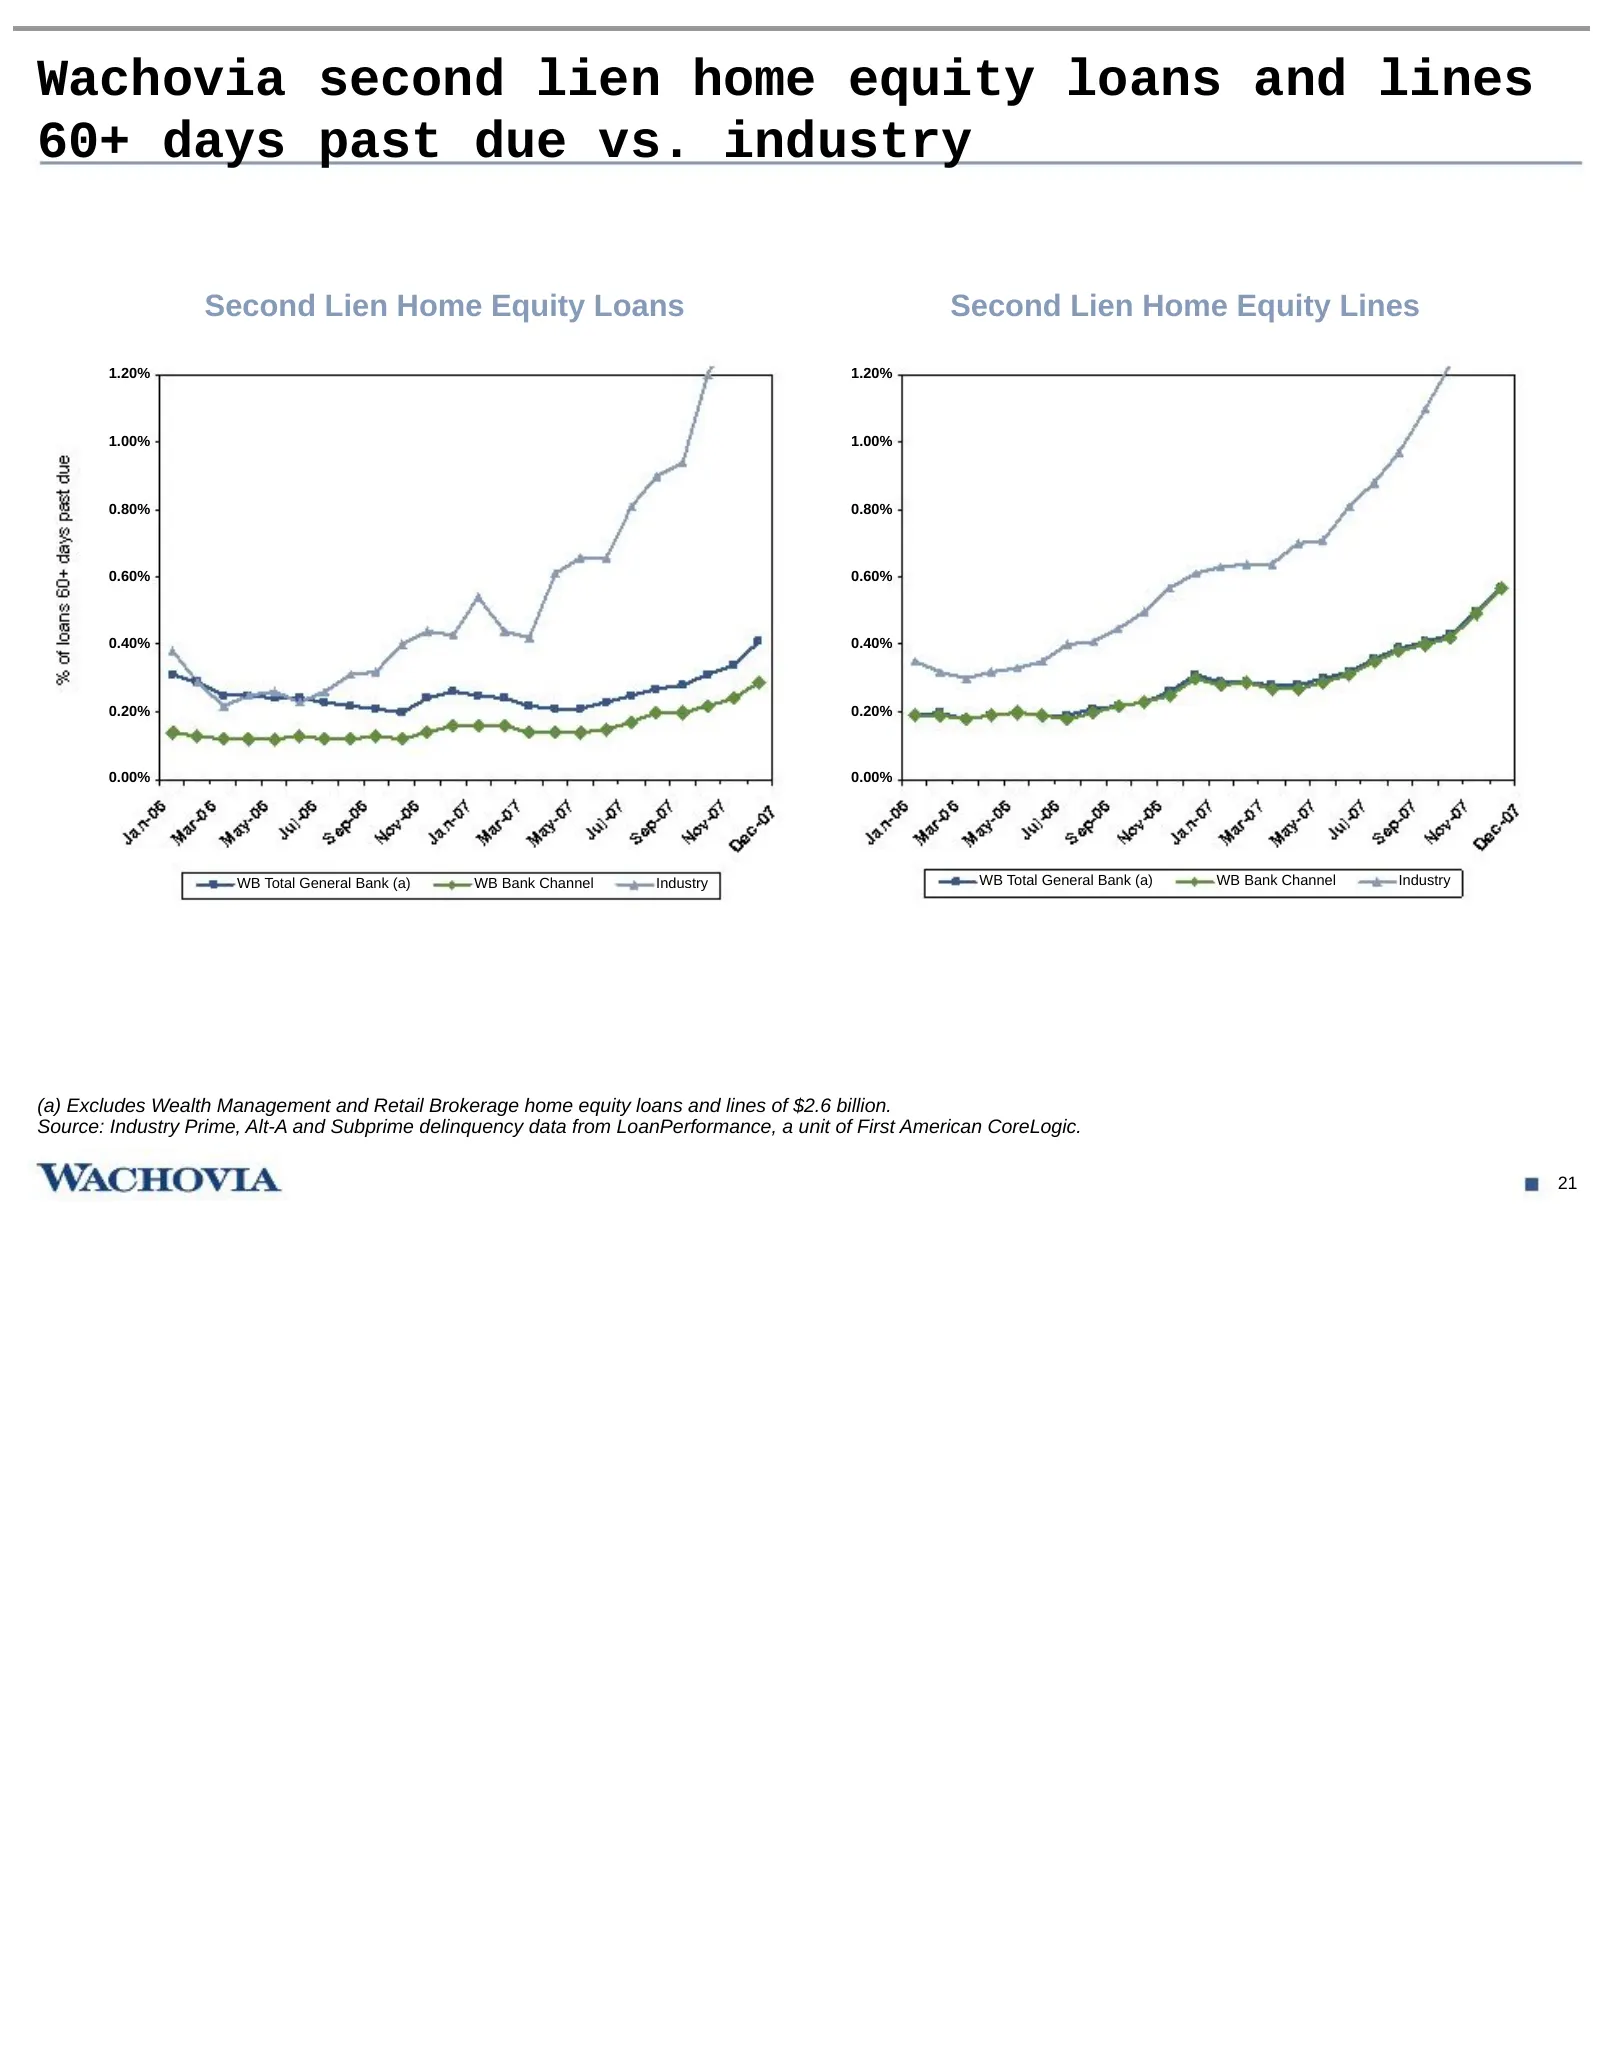
Wachovia second lien home equity loans and lines 60+ days past due vs. industry Second Lien Home Equity Loans Second Lien Home Equity Lines 1.20% 1.20% 1.00% 1.00% 0.80% 0.80% 0.60% 0.60% 0.40% 0.40% 0.20% 0.20% 0.00% 0.00% WB Total General Bank (a) WB Bank Channel Industry WB Total General Bank (a)
Slide 23: Consumer real estate portfolio
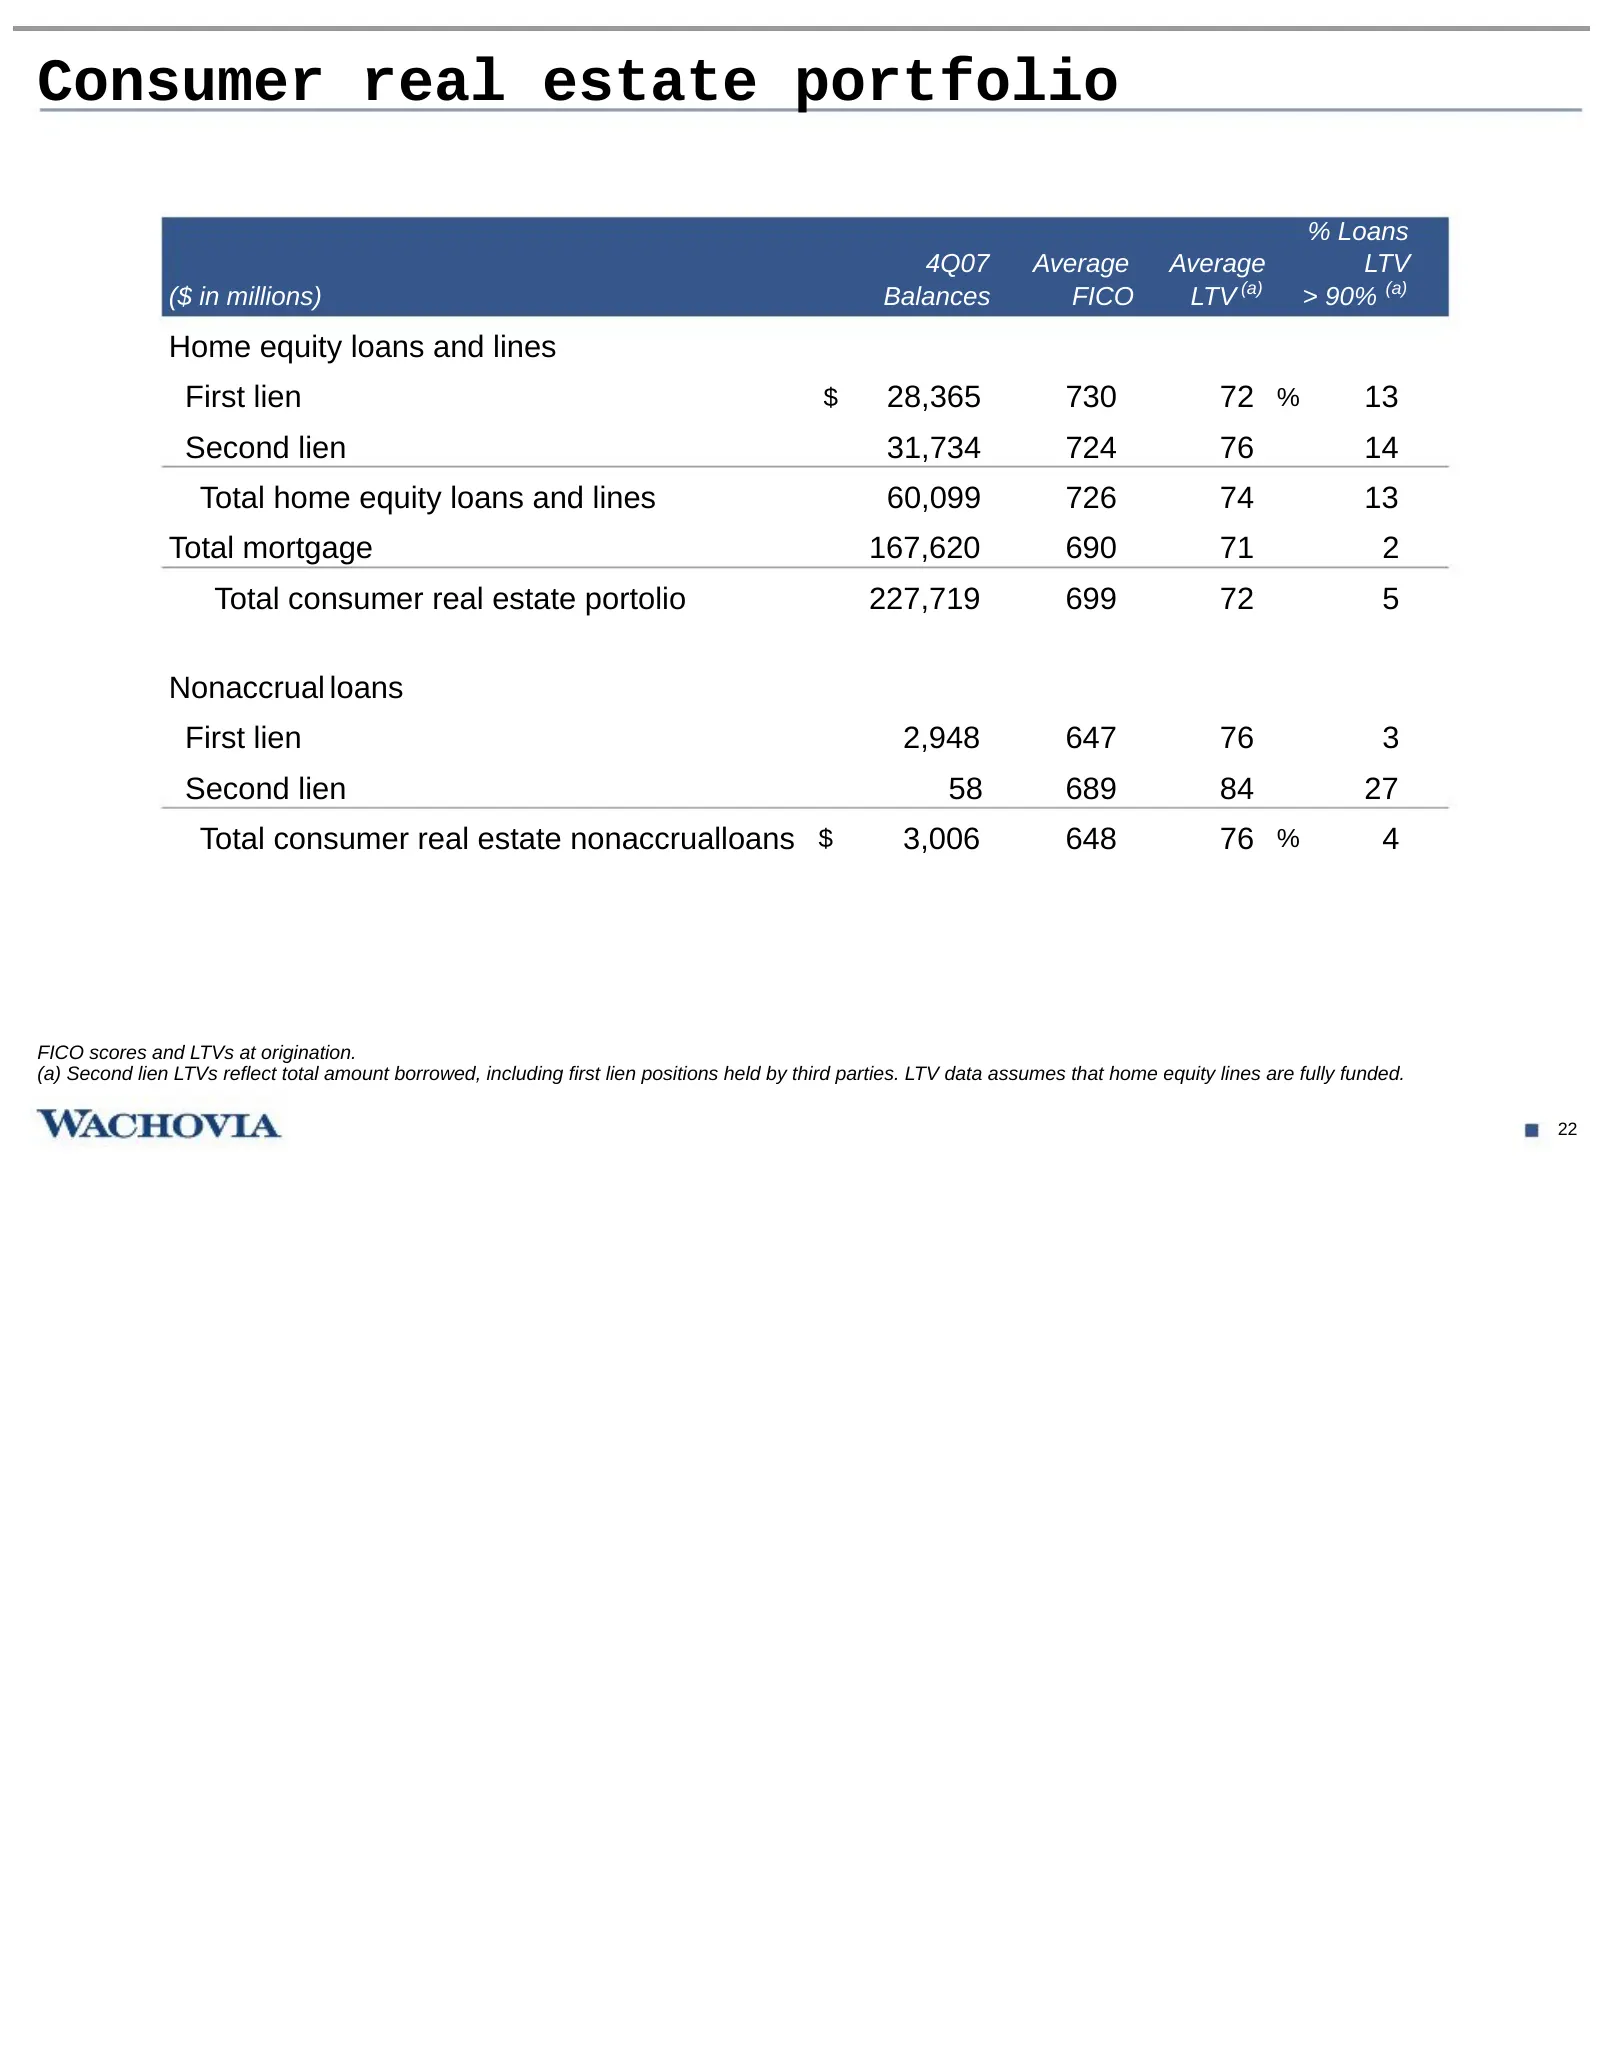
Consumer real estate portfolio % Loans 4Q07 Average Average LTV ($ in millions) Balances FICO LTV (a) > 90% (a) Home equity loans and lines First lien $ 28,365 730 72 % 13 Second lien 31,734 724 76 14 Total home equity loans and lines 60,099 726 74 13 Total mortgage 167,620 690 71 2 Total consumer r
Slide 24: Managed auto portfolio
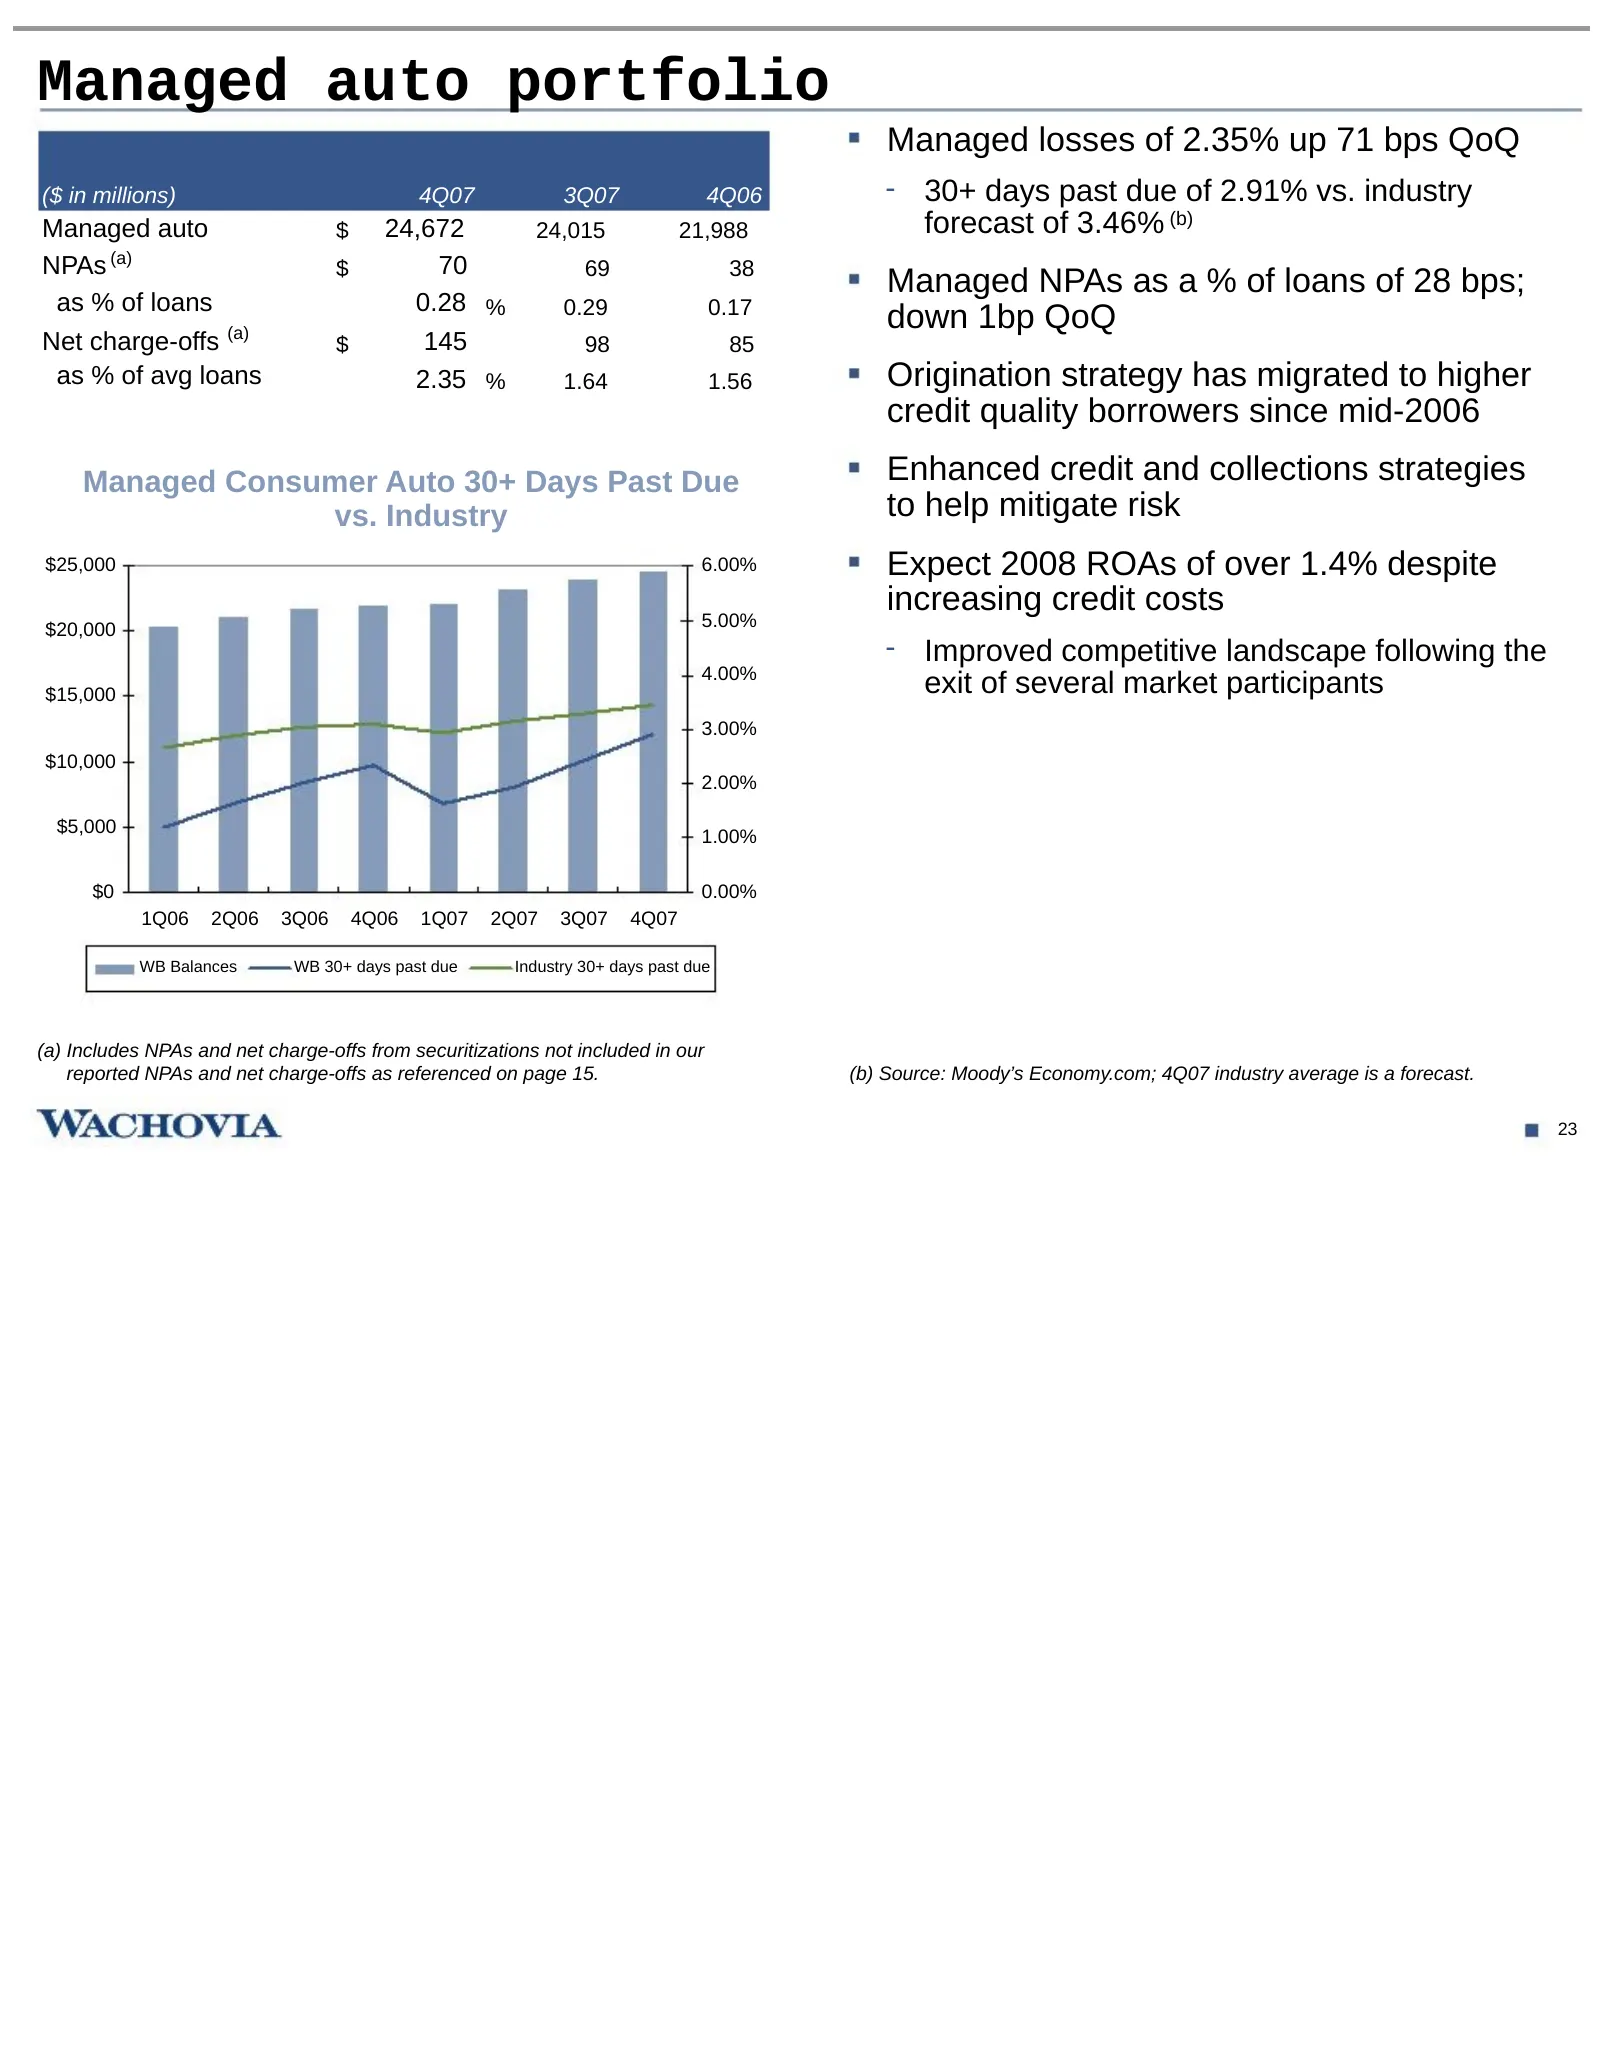
Managed auto portfolio Managed losses of 2.35% up 71 bps QoQ ($ in millions) 4Q07 3Q07 4Q06 - 30+ days past due of 2.91% vs. industry Managed auto $ 24,672 24,015 21,988 forecast of 3.46% (b) NPAs (a) $ 70 69 38 Managed NPAs as a % of loans of 28 bps; as % of loans 0.28 % 0.29 0.17 down 1bp QoQ Net
Slide 25: Real Estate Financial Services portfolio
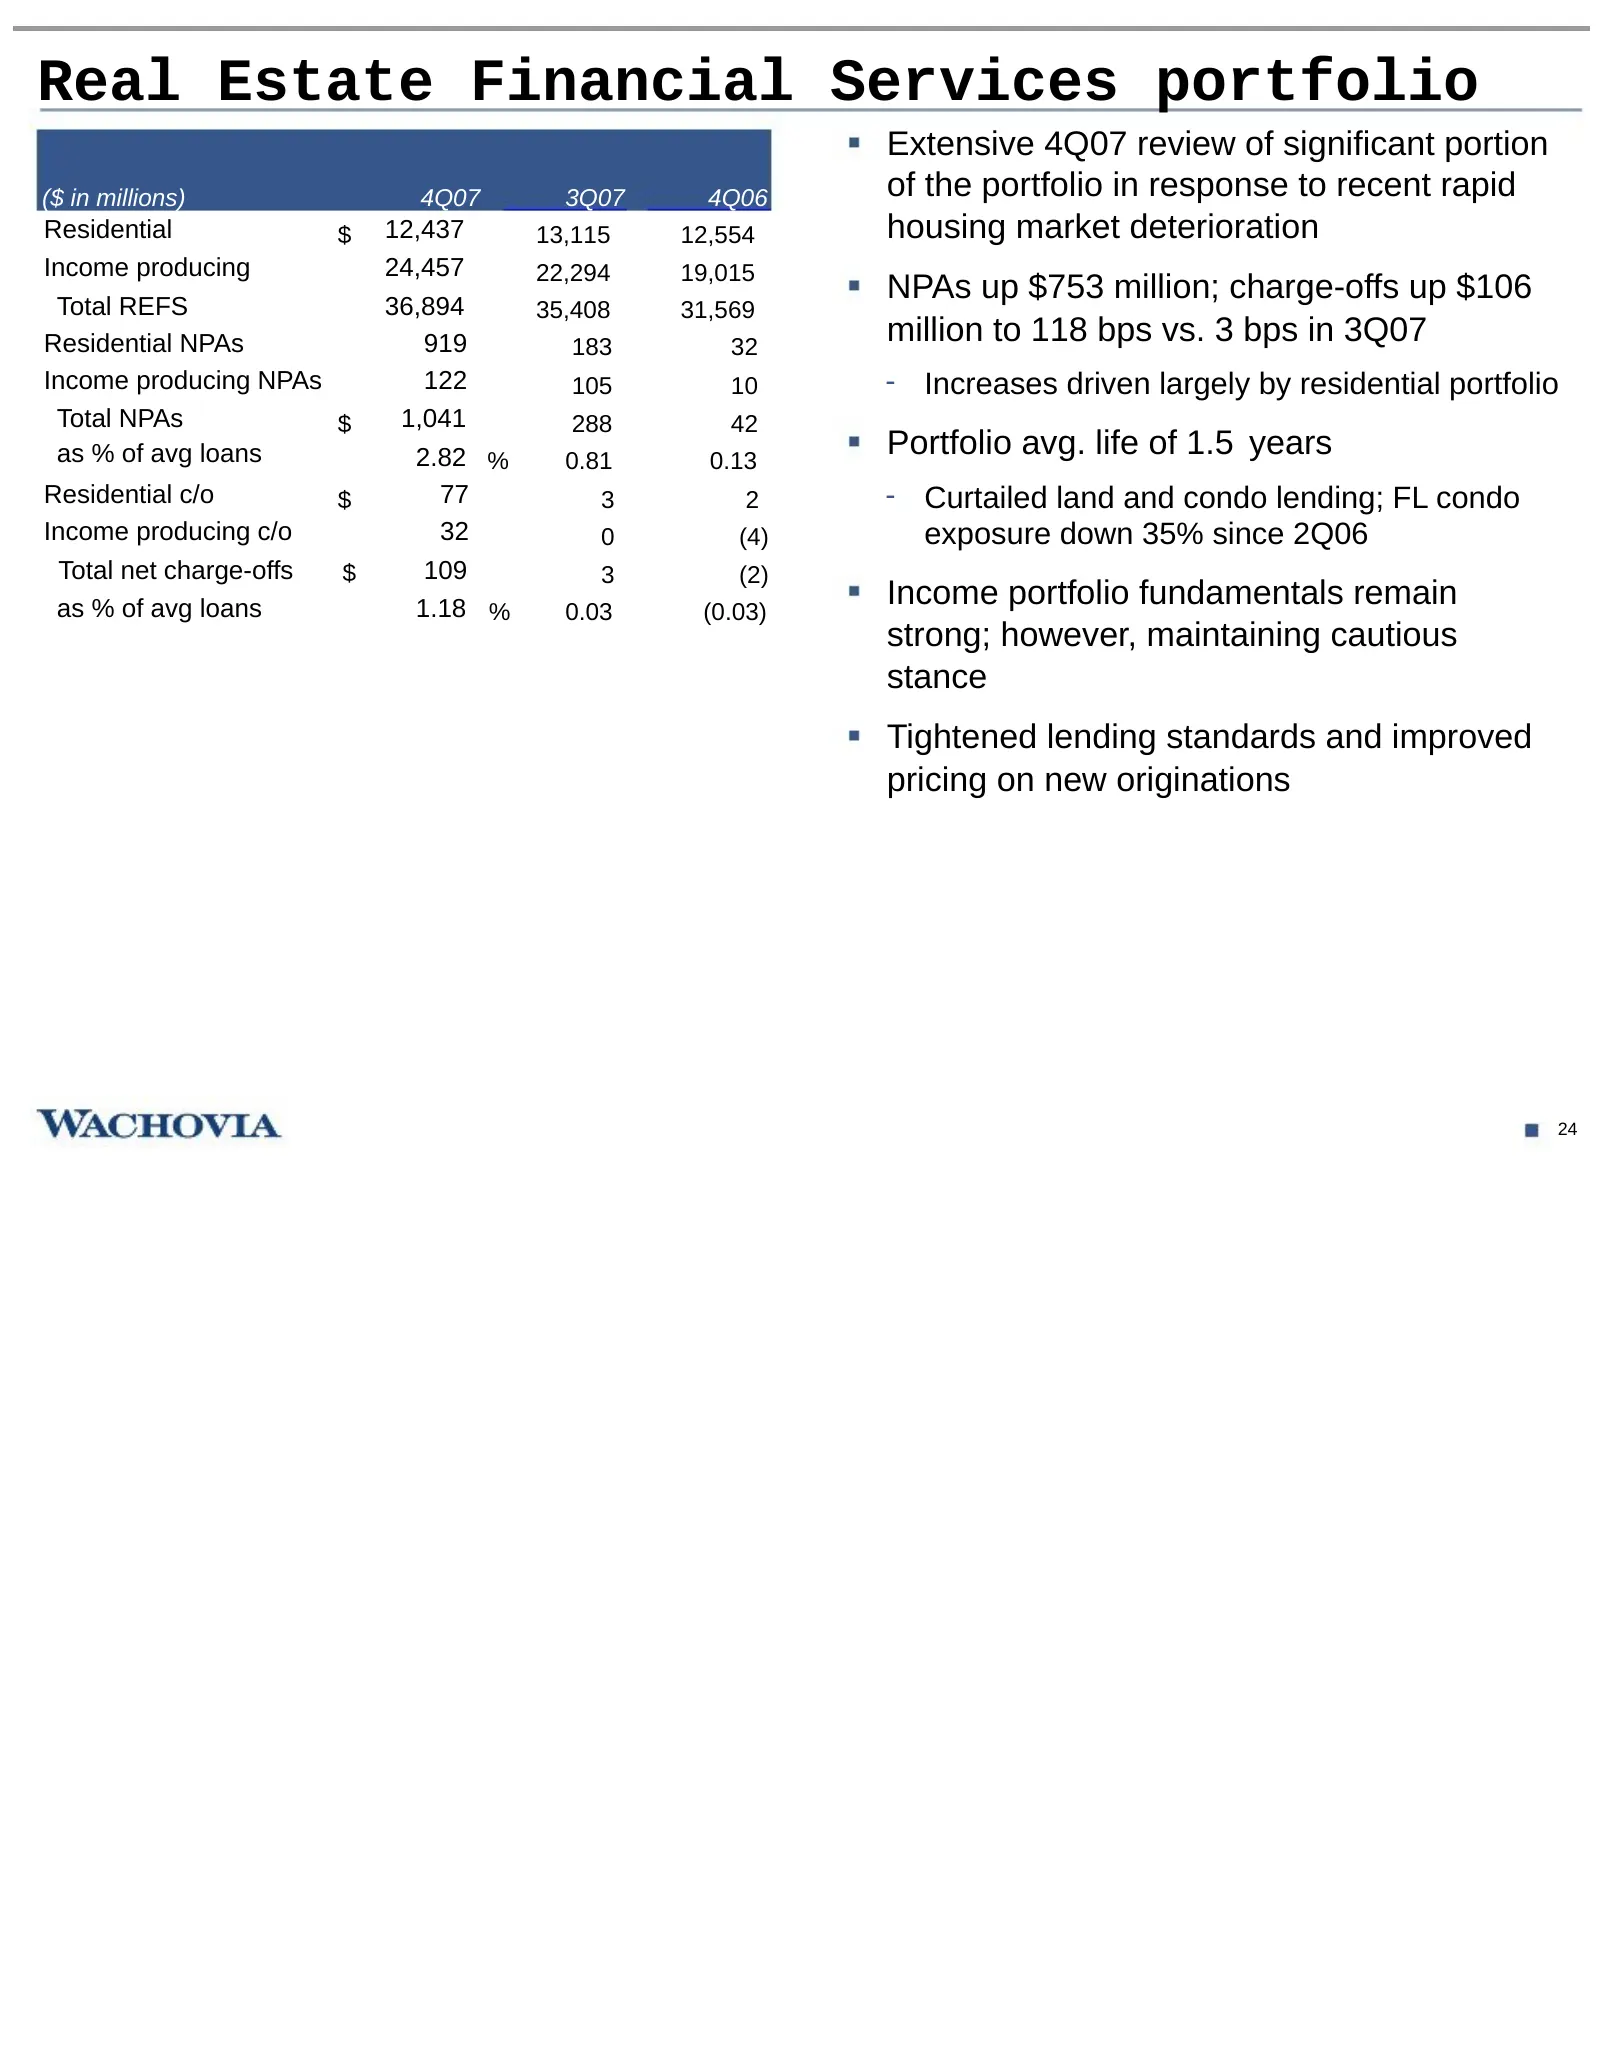
Real Estate Financial Services portfolio Extensive 4Q07 review of significant portion ($ in millions) 4Q07 3Q07 4Q06 of the portfolio in response to recent rapid Residential $ 12,437 13,115 12,554 housing market deterioration Income producing 24,457 22,294 19,015 Total REFS 36,894 NPAs up $753 milli
Slide 26: Summary and Outlook
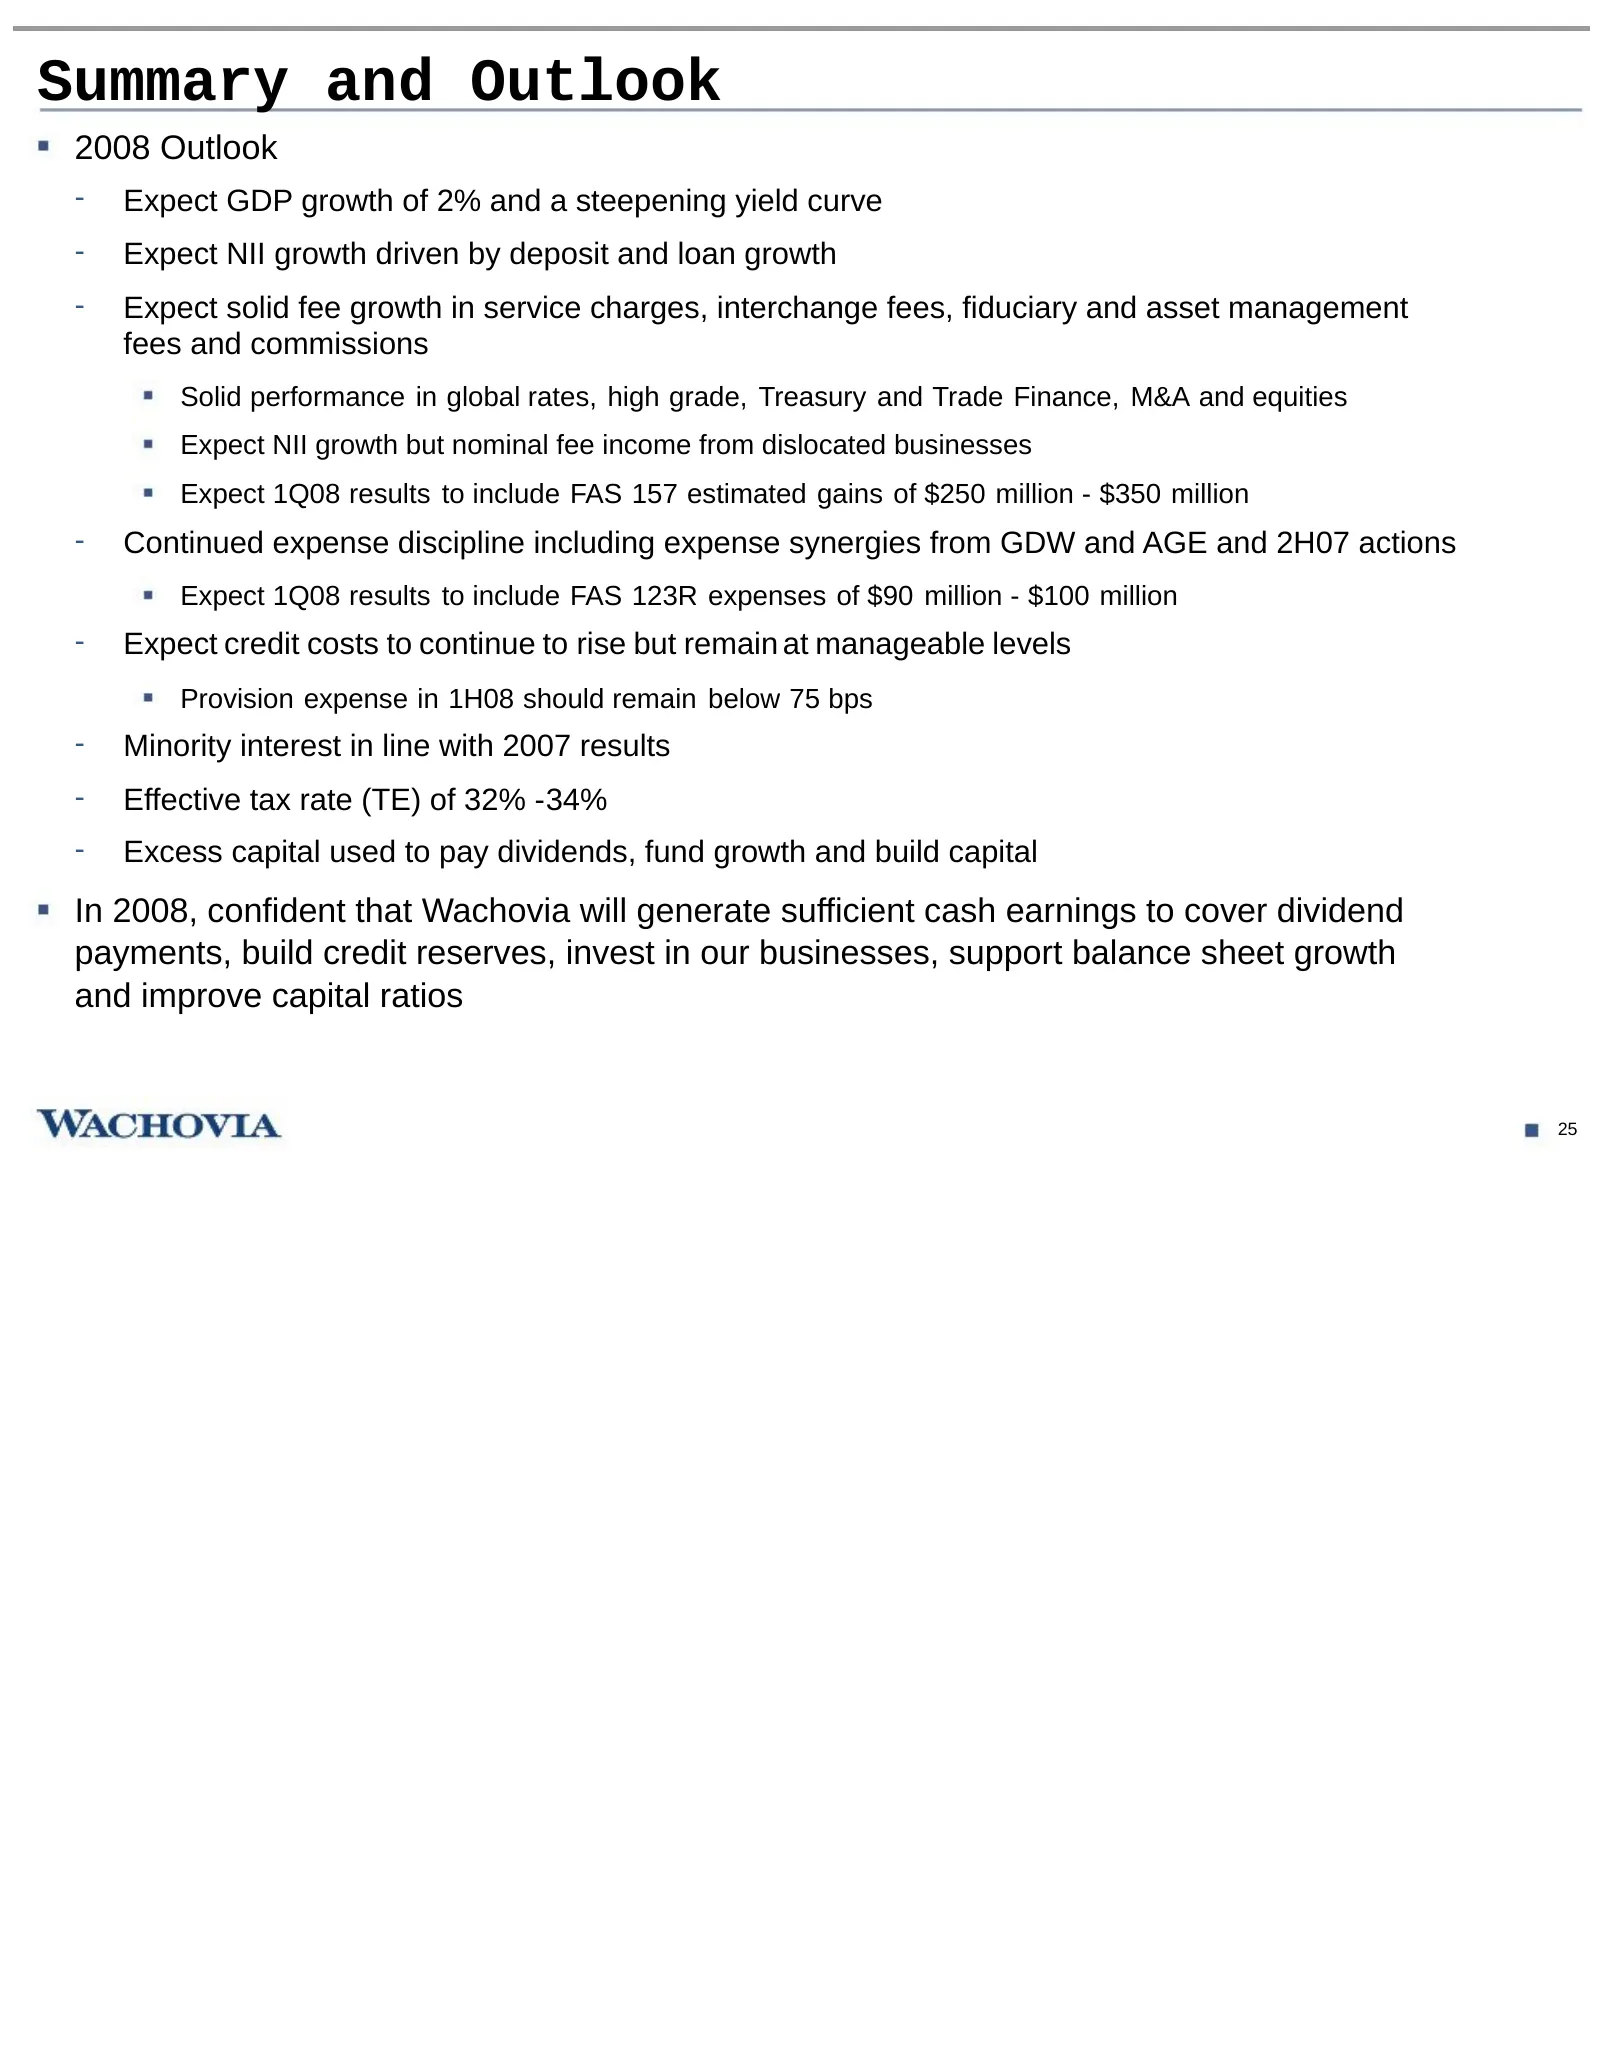
Summary and Outlook 2008 Outlook - Expect GDP growth of 2% and a steepening yield curve - Expect NII growth driven by deposit and loan growth - Expect solid fee growth in service charges, interchange fees, fiduciary and asset management fees and commissions Solid performance in global rates, high gr

Slide 27: Appendix
Appendix WACHOVIA 26
Slide 28: Strong capital position: Debt ratings
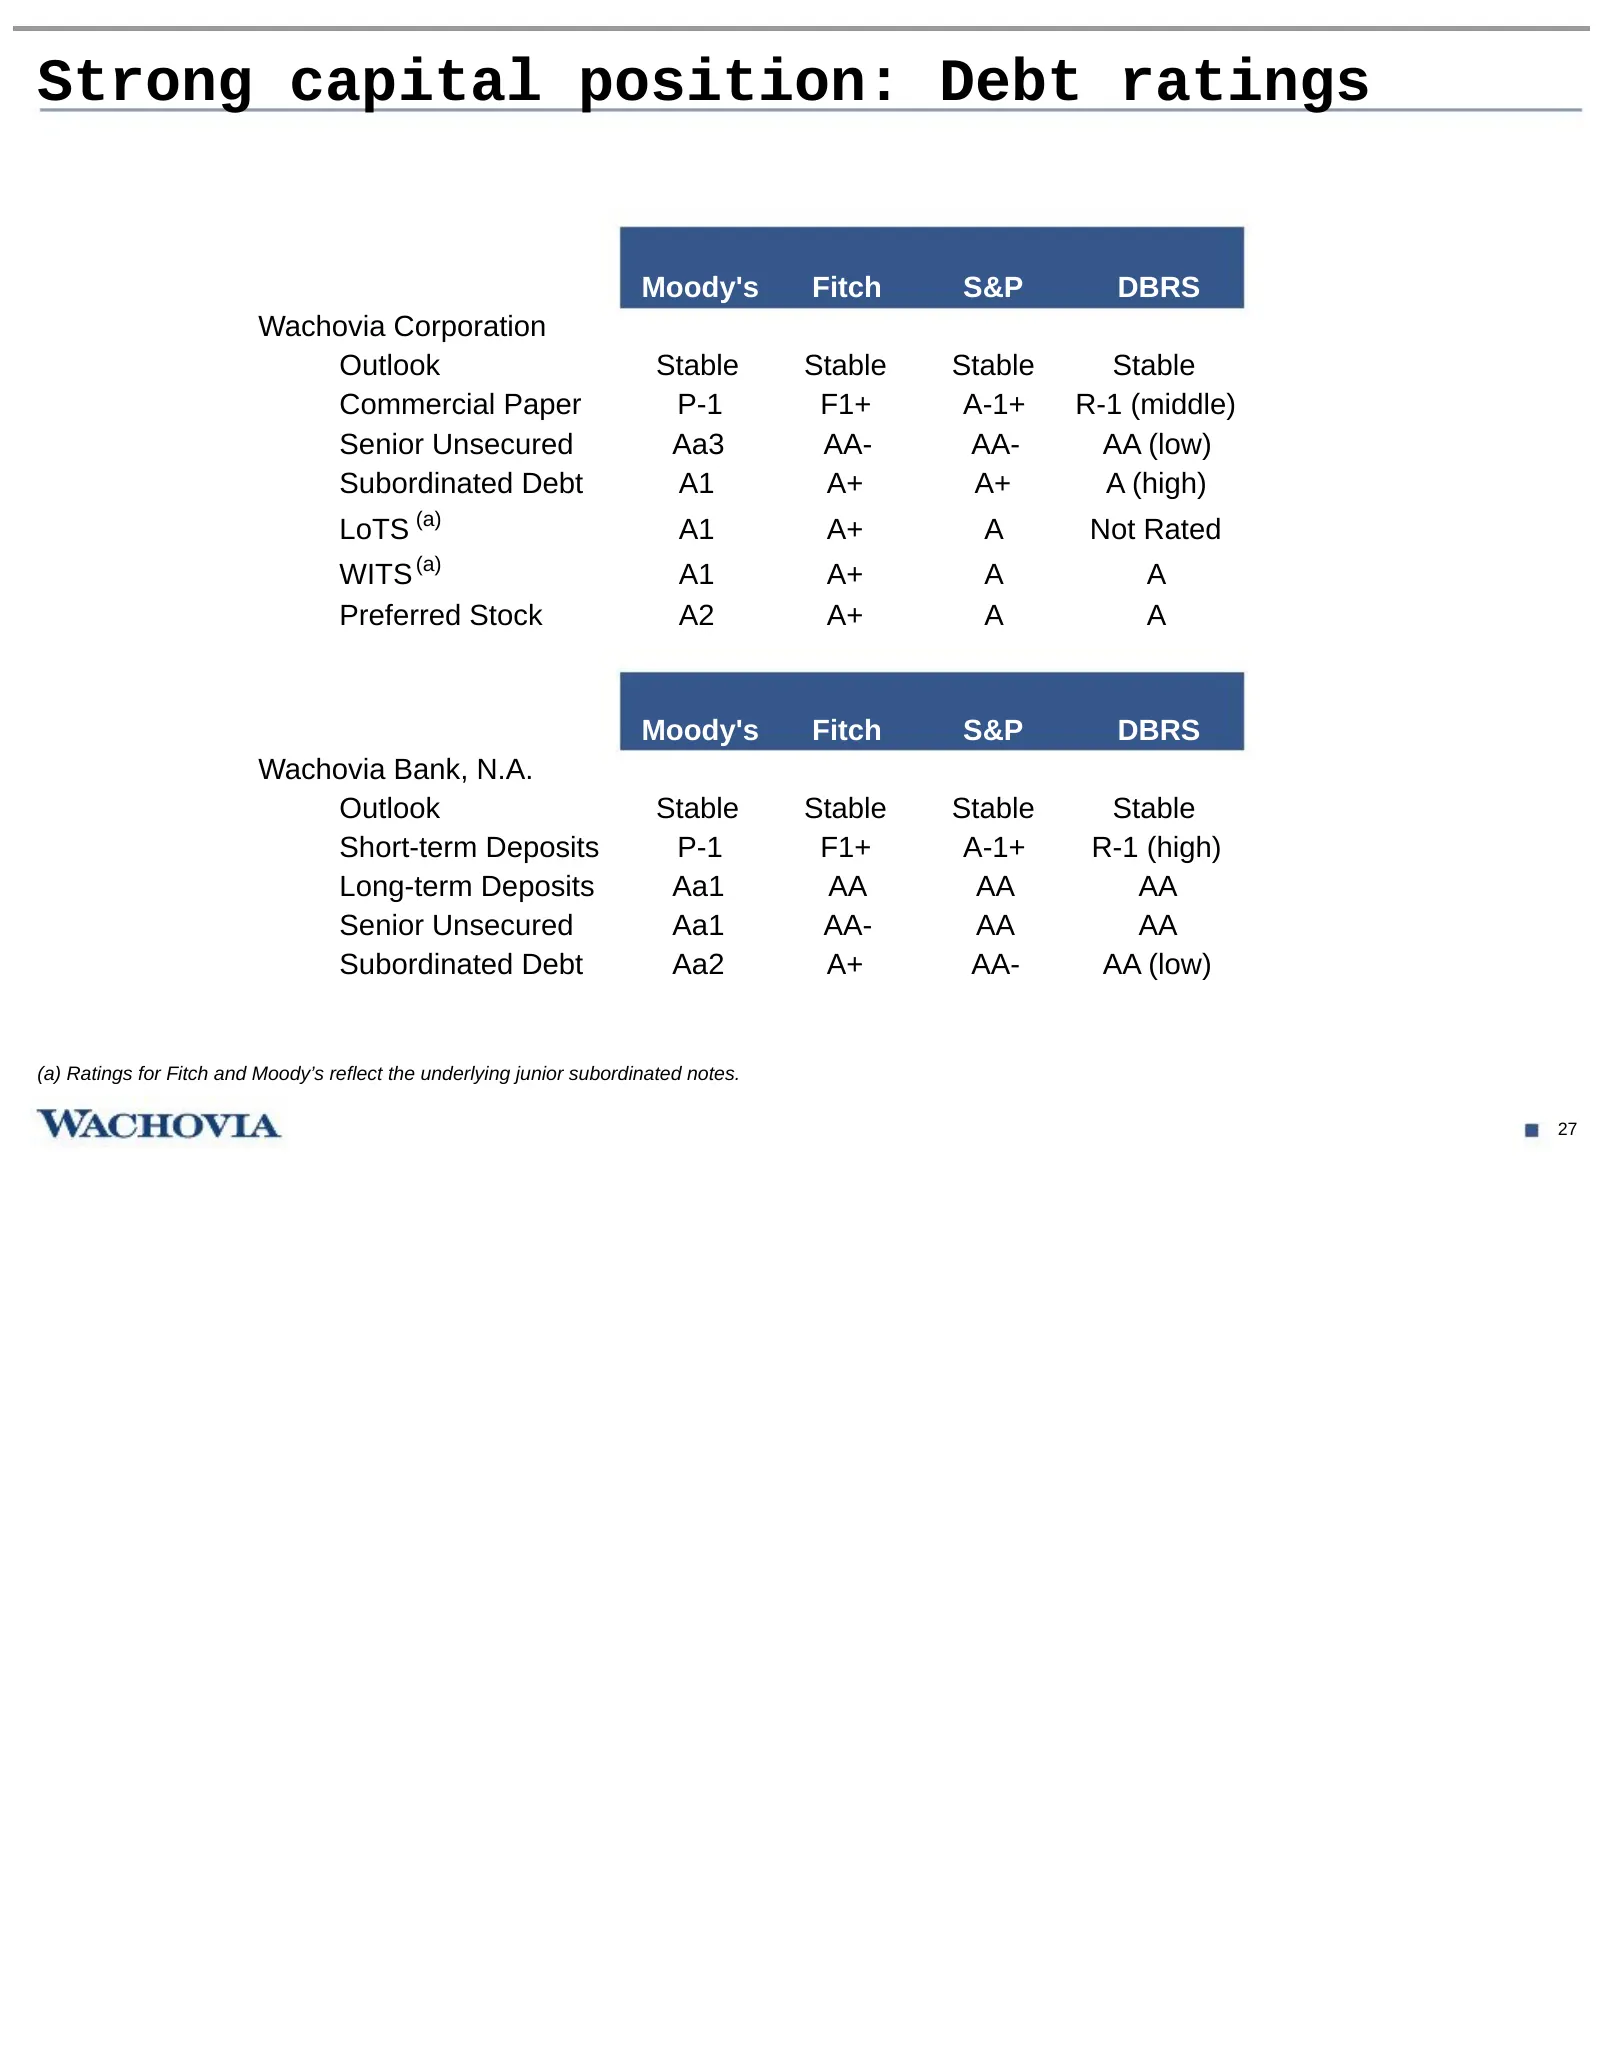
Strong capital position: Debt ratings Moody's Fitch S&P DBRS Wachovia Corporation Outlook Stable Stable Stable Stable Commercial Paper P-1 F1+ A-1+ R-1 (middle) Senior Unsecured Aa3 AA- AA- AA (low) Subordinated Debt A1 A+ A+ A (high) LoTS (a) A1 A+ A Not Rated (a) WITS A1 A+ A A Preferred Stock A2

Slide 29: Cautionary statement
Cautionary statement The foregoing materials and management’s discussion of them may contain, among other things, certain forward-looking statements with respect to Wachovia, as well as the goals, plans, objectives, intentions, expectations, financial condition, results of operations, future perform
Slide 30: Notes on non-GAAP financial measures
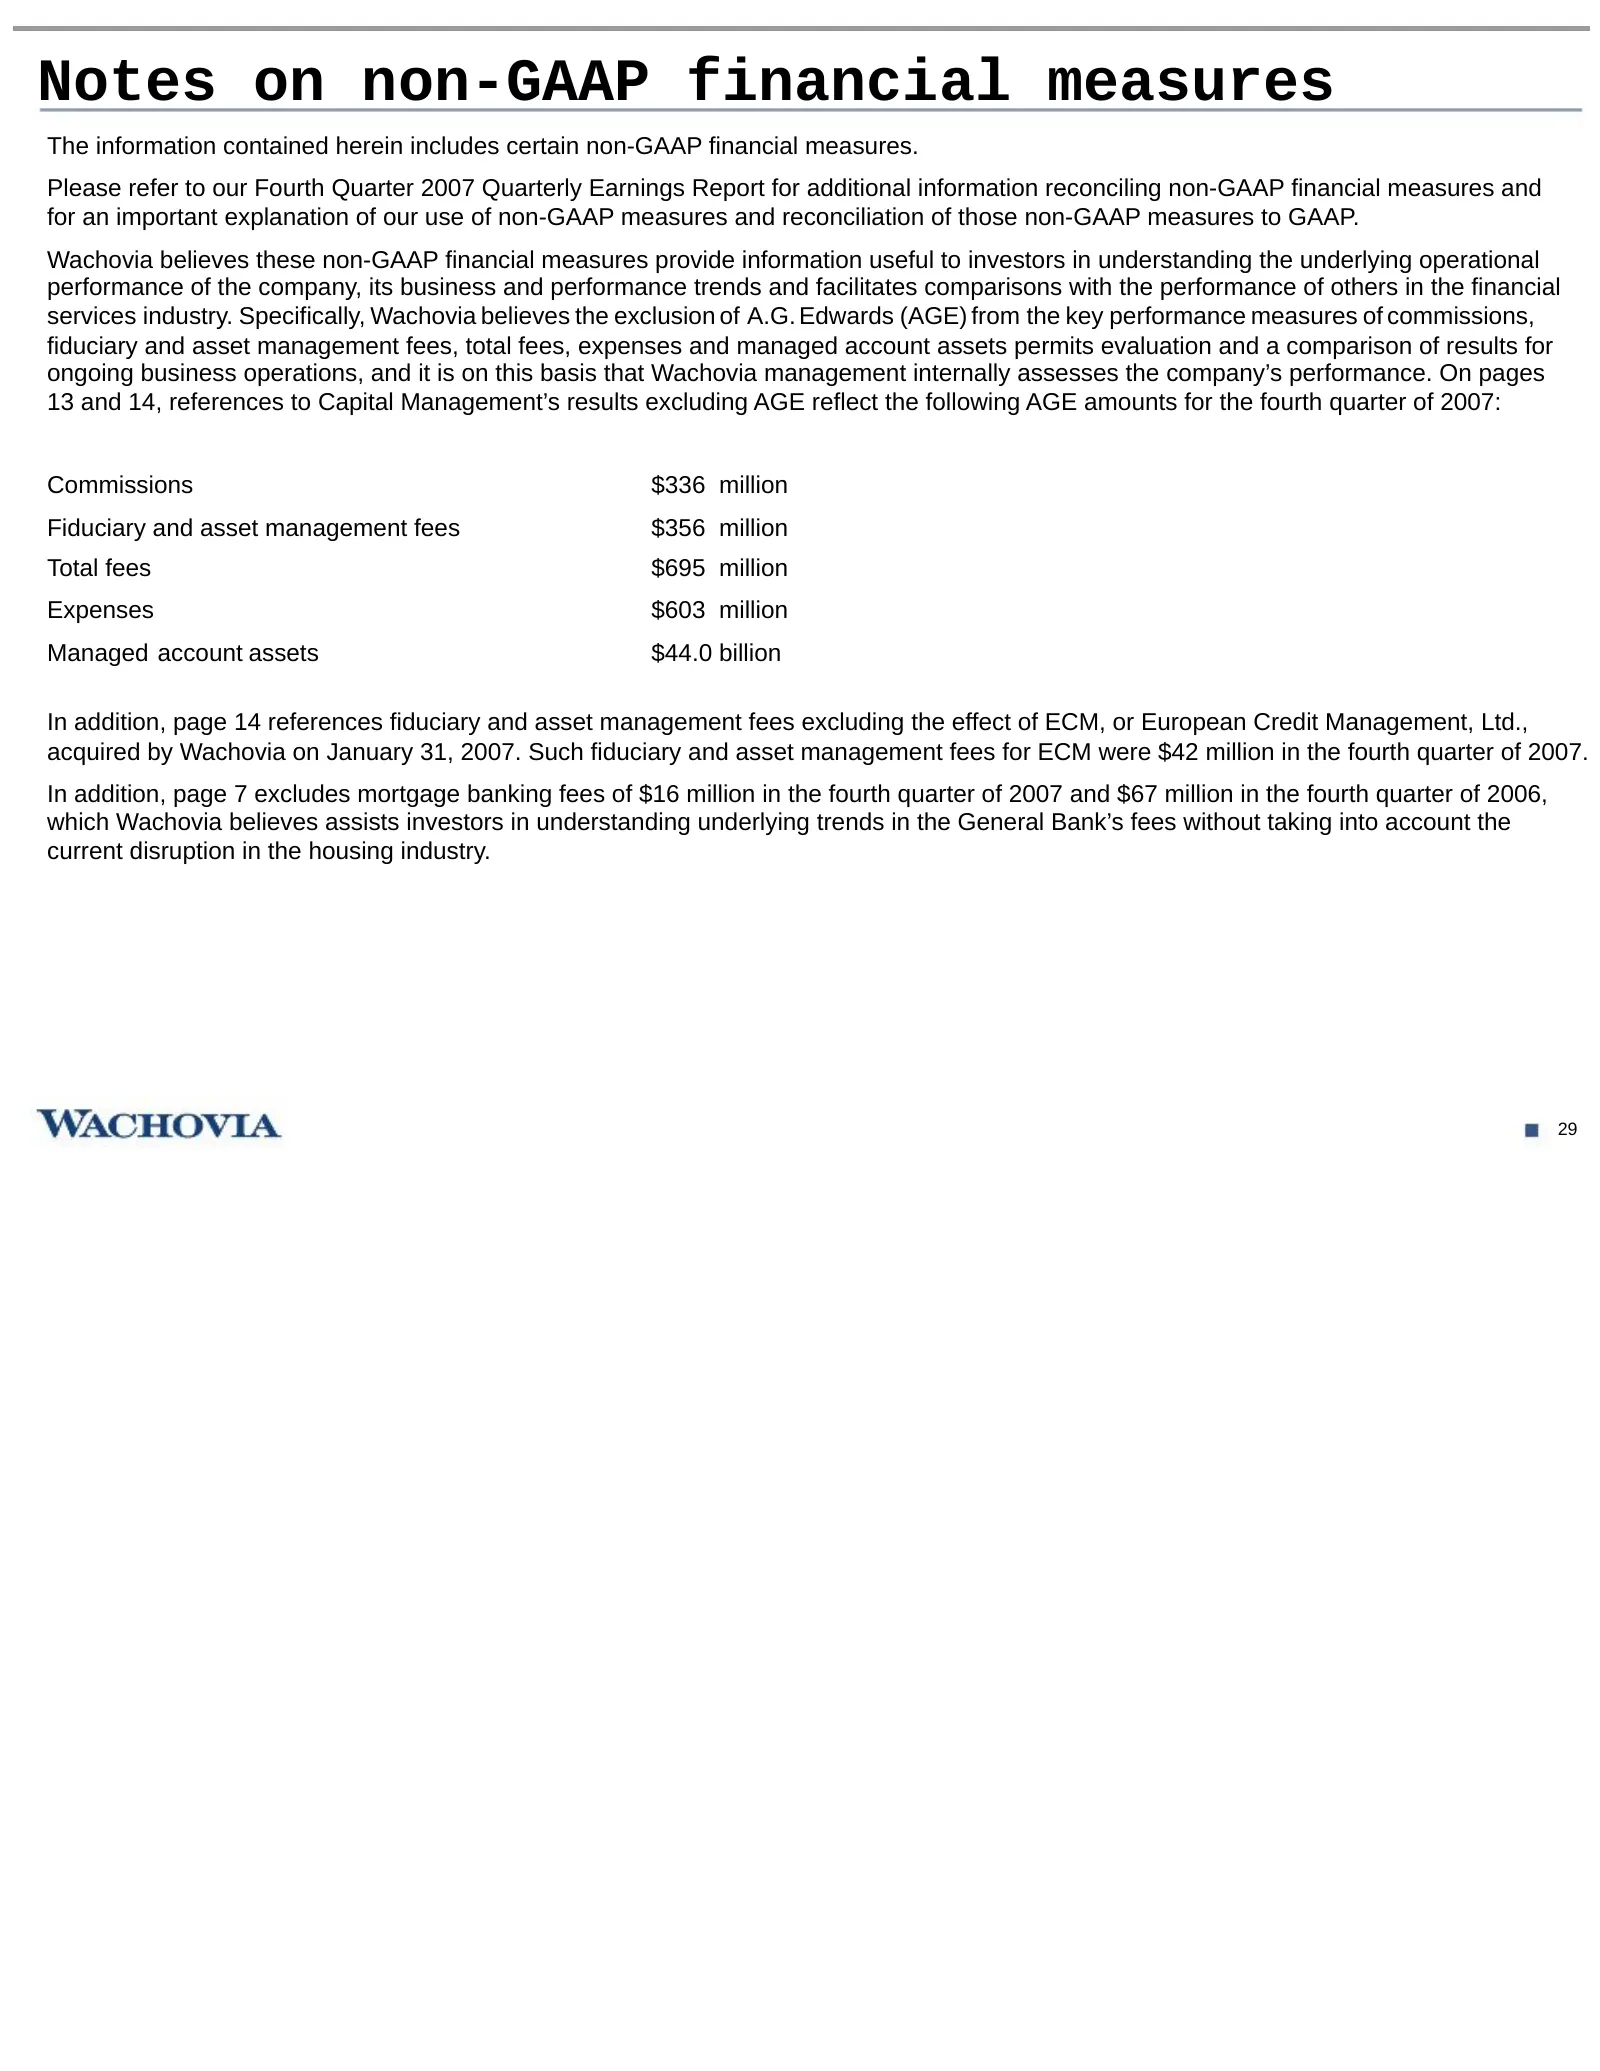
Notes on non-GAAP financial measures The information contained herein includes certain non-GAAP financial measures. Please refer to our Fourth Quarter 2007 Quarterly Earnings Report for additional information reconciling non-GAAP financial measures and for an important explanation of our use of non-
Source: SEC EDGAR · 8-K filed Jan 22, 2008
More decks from Wachovia Corp New
 Q3 2008 Earnings Presentation41 slides · Oct 22, 2008
 Merger or Acquisition (October 2008)15 slides · Oct 3, 2008
 Lehman Brothers Global Financial Services Conference 200828 slides · Sep 9, 2008
 Q2 2008 Earnings Presentation56 slides · Jul 22, 2008
 IPO Roadshow (April 2008)104 slides · Apr 14, 2008
 Q1 2008 Earnings Presentation45 slides · Apr 14, 2008