Synovus Financial — Goldman Sachs US Financial Services Conference 2024
23 slides from Synovus Financial's conference presentation, Dec 10, 2024

Slide 1: Goldman Sachs US Financial Services Conference
Exhibit 99.1 Goldman Sachs US Financial Services Conference December 11,2024 Chairman, President and CEO Kevin Blair EVP and Chief Financial Officer Jamie Gregory SYNOVUS
Slide 2: Forward-Looking Statements
Forward-Looking Statements This slide presentation and cerain of our other filings with the Securities and Exchange Commission contain statements that constiute “forward-looking statements" within the meaning of, and subject to the protections of, Section 27A of the Securities Act of 1933, as amende

Slide 3: Company Profile
Company Profile SYNOVUS
Slide 4: Undergone a Multi-Year Transformation
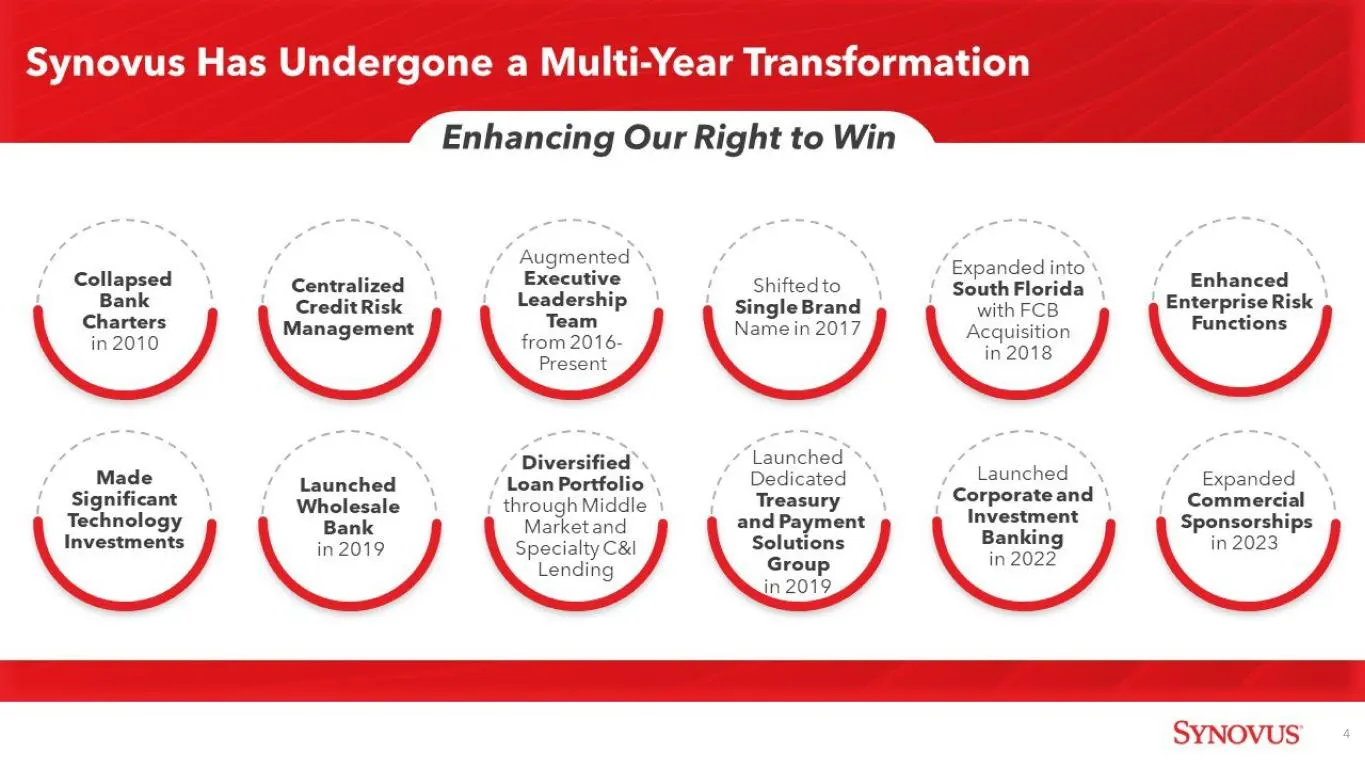
Undergone ulti-Year sform y : Y Enhancing Our Right to Win ‘ Aligmented'y f x ‘Expanded into / Collapsed Corltralized’ Executive | Shiftedto | —_ SeuthFlorida i Enhanced Bank a 9 CreditRisk » , Leadership » 4 SingleBrand » 9 with FCB a g Enterprise Risk » Charters ! \, Management \ Team Ws Namein 20
Slide 5: Building Upon a Strong Corporate Culture
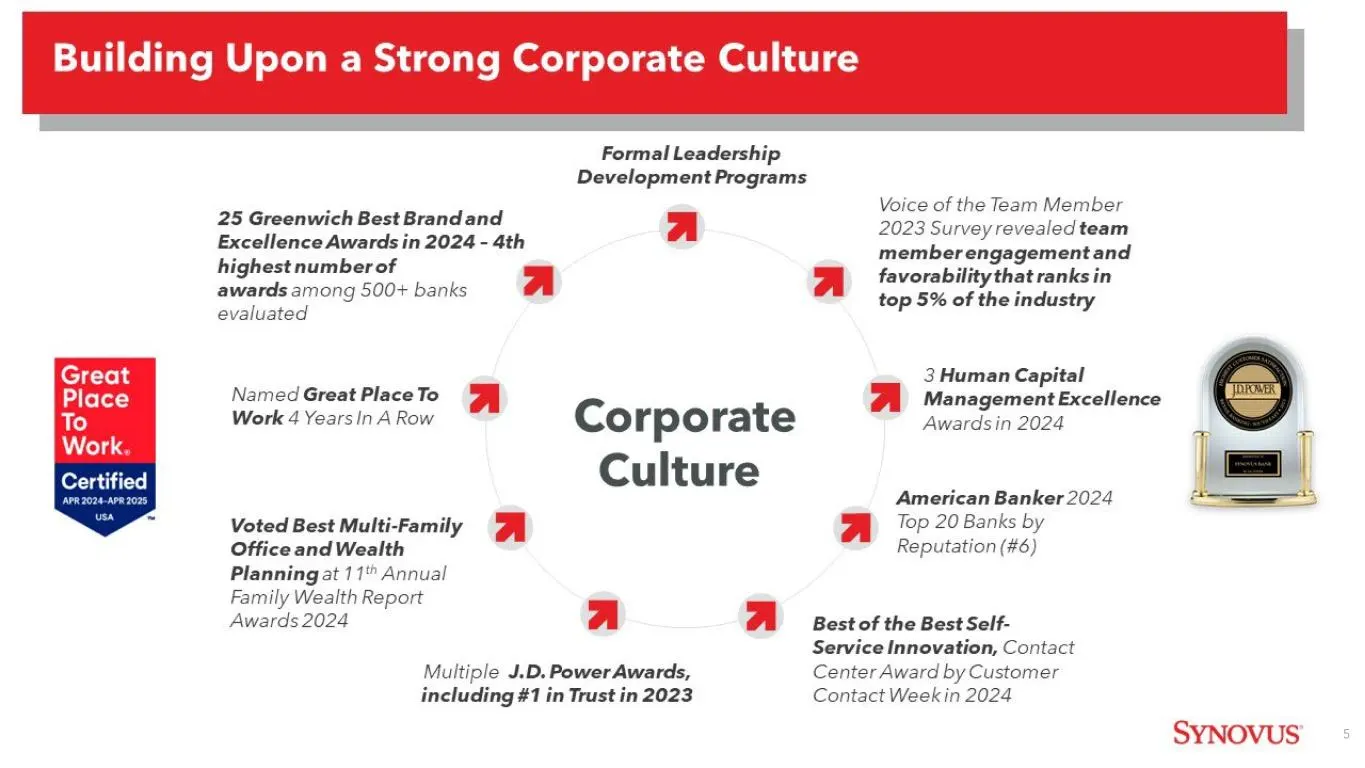
Building Upon a Strong Corporate Culture Formal Leadership Development Programs s Voice of the Team Member Jo Greenwich Best Bread and A 2023 Survey revealed team Excellence Awards in 2024 - 4th memberengagement and highestnumberet r.| A favorability that ranks in awards among 500+ banks top 5% of t
Slide 6: With a Diversified Business Model
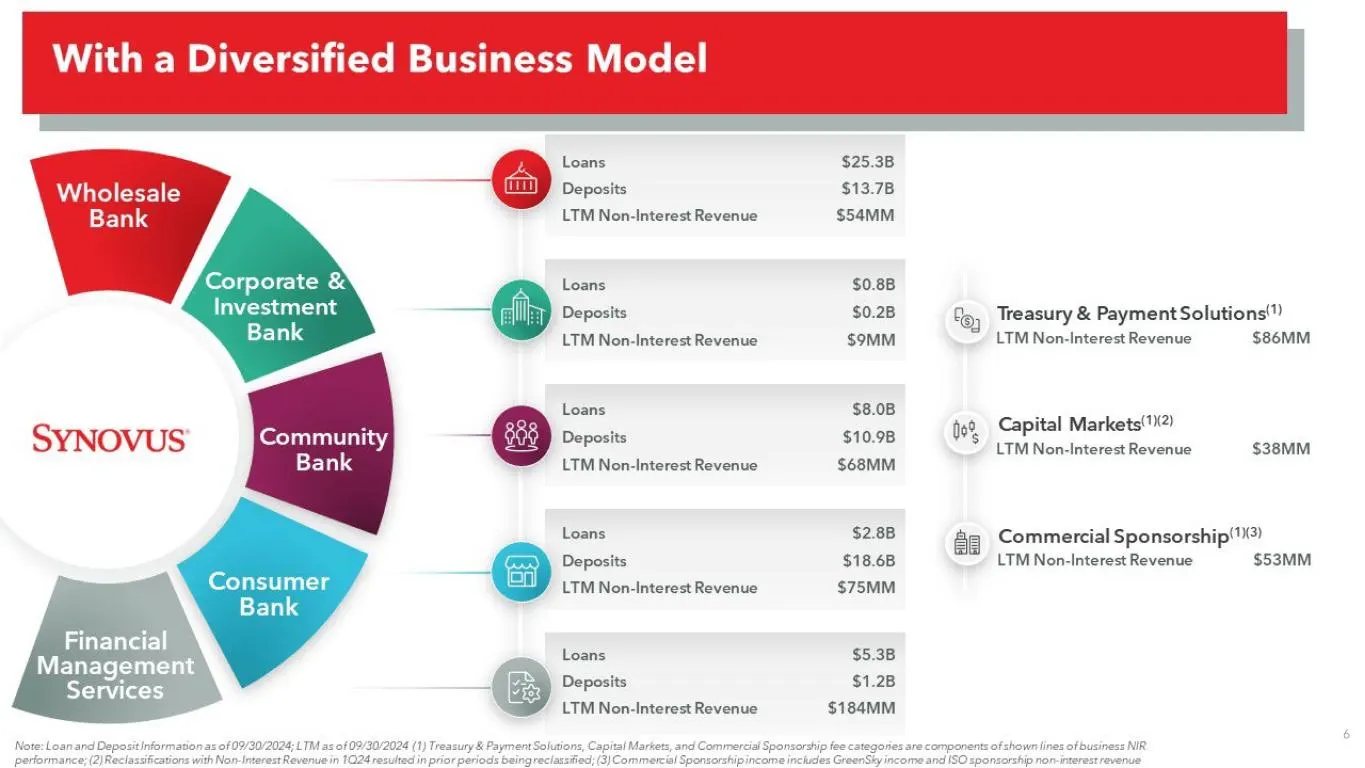
With a Diversified Business Model Loans $25.3B Wholesale Deposits $13.78 Bank LTM Non-Interest Revenue $54MM Corporate & Loans $0.88 Investment Deposits $0.28 fe, Treasury & Payment Solutions'”) Bank LTM Non-Interest Revenue $oMM LTM Non-Interest Revenue $86MM Loans $8.08 Capital Markets(112) . ; to
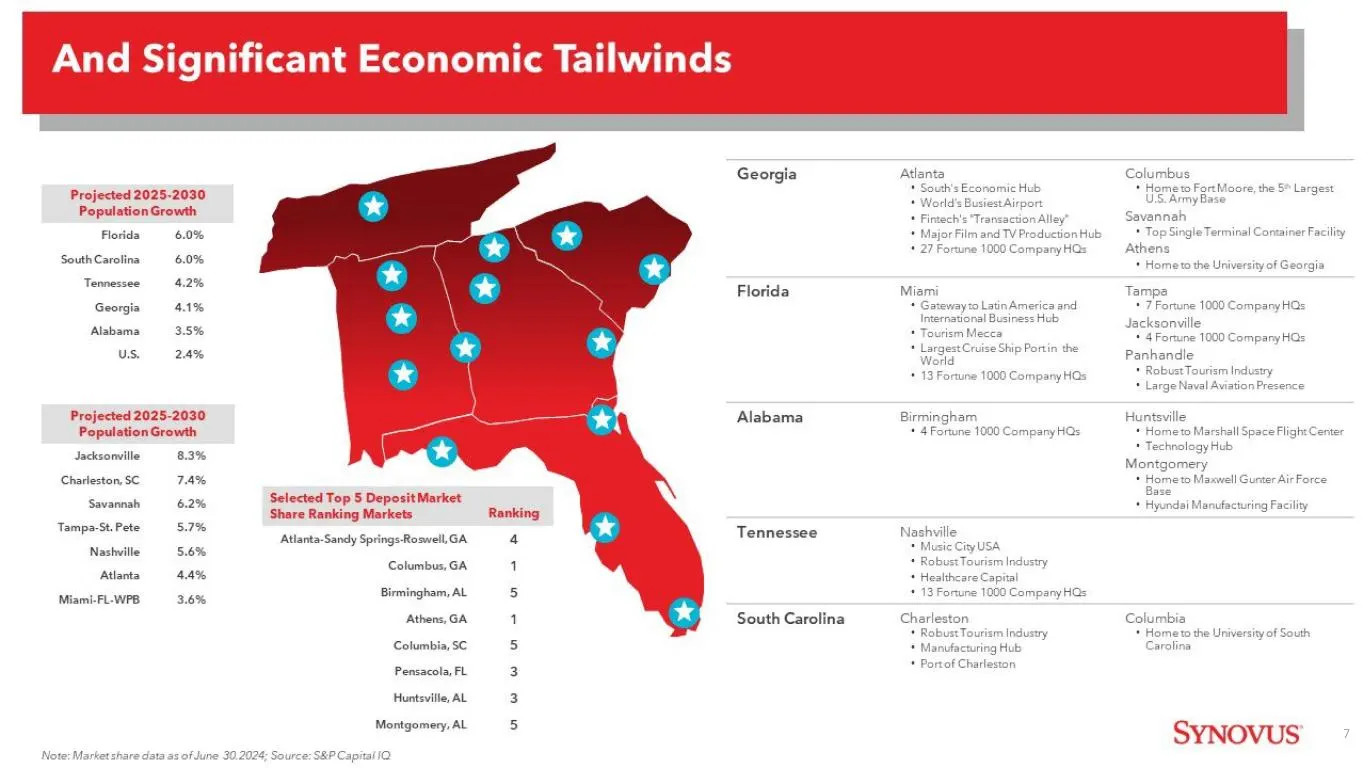
Slide 7: And Significant Economic Tailwinds
And Significant Economic Tailwinds Projected 2025-2030 Population Growth Florida SouthCarolina Tennessee Georgia Alabama us. 6.0% 6.0% 42% 41% 35% 2.4% Projected 2025-2030 PopulationGrowth Jacksonville Charleston, SC Savannah ‘Tampa-St. Pete Nashville Atlanta ‘Miami-FL:-WPB. 83% 74% 6.2% 57% 5.6% 44
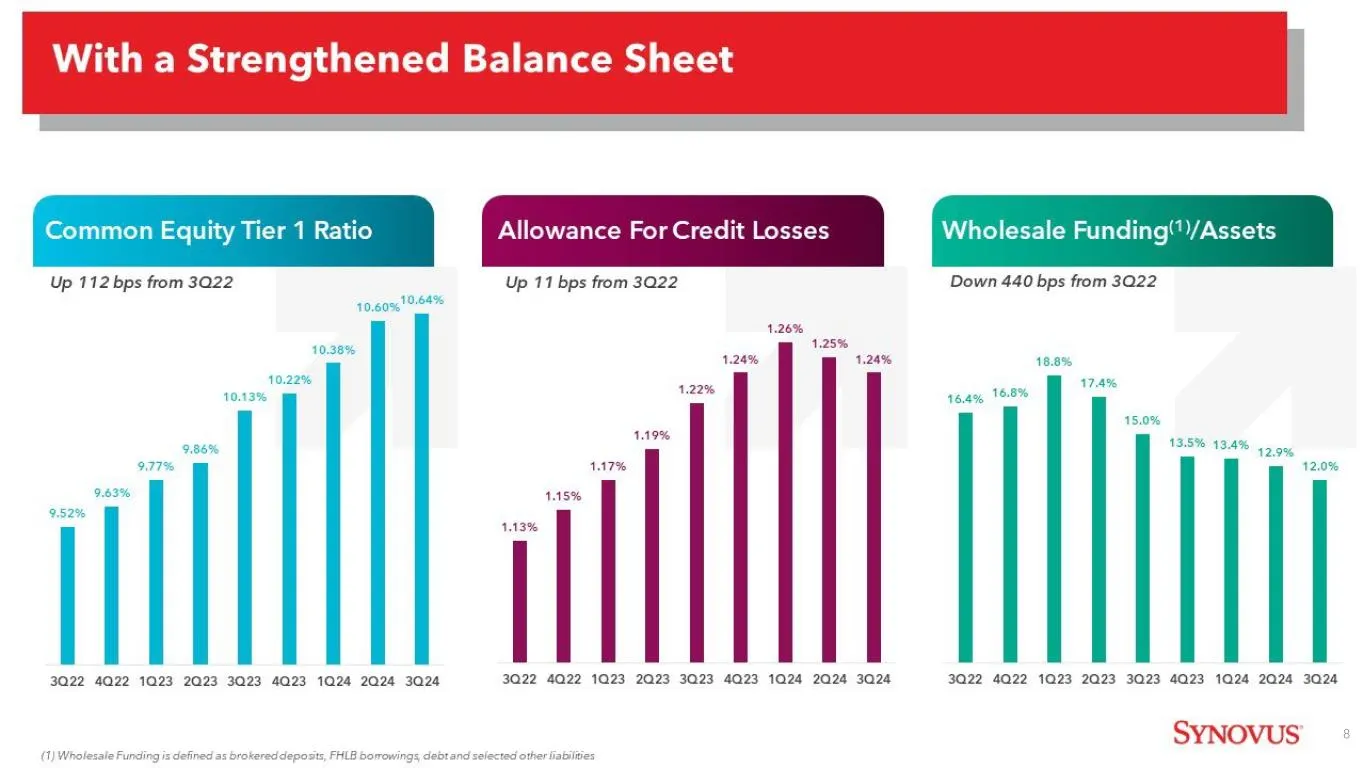
Slide 8: With a Strengthened Balance Sheet
With a Strengthened Balance Sheet Common Equity Tier 1 Ratio Allowance For Credit Losses Wholesale Funding')/Assets Up 112 bps from 3022 Up 11 bps from 3022 Down 440 bps from 3022 10.64% 10.6056 10.38% 10.22% 10.13% 9.86% 9.77% 9.83% 9.52% | 3022 4022 1023 2023 3023 4023 1024 2024 3024 1.26% 125% 1.
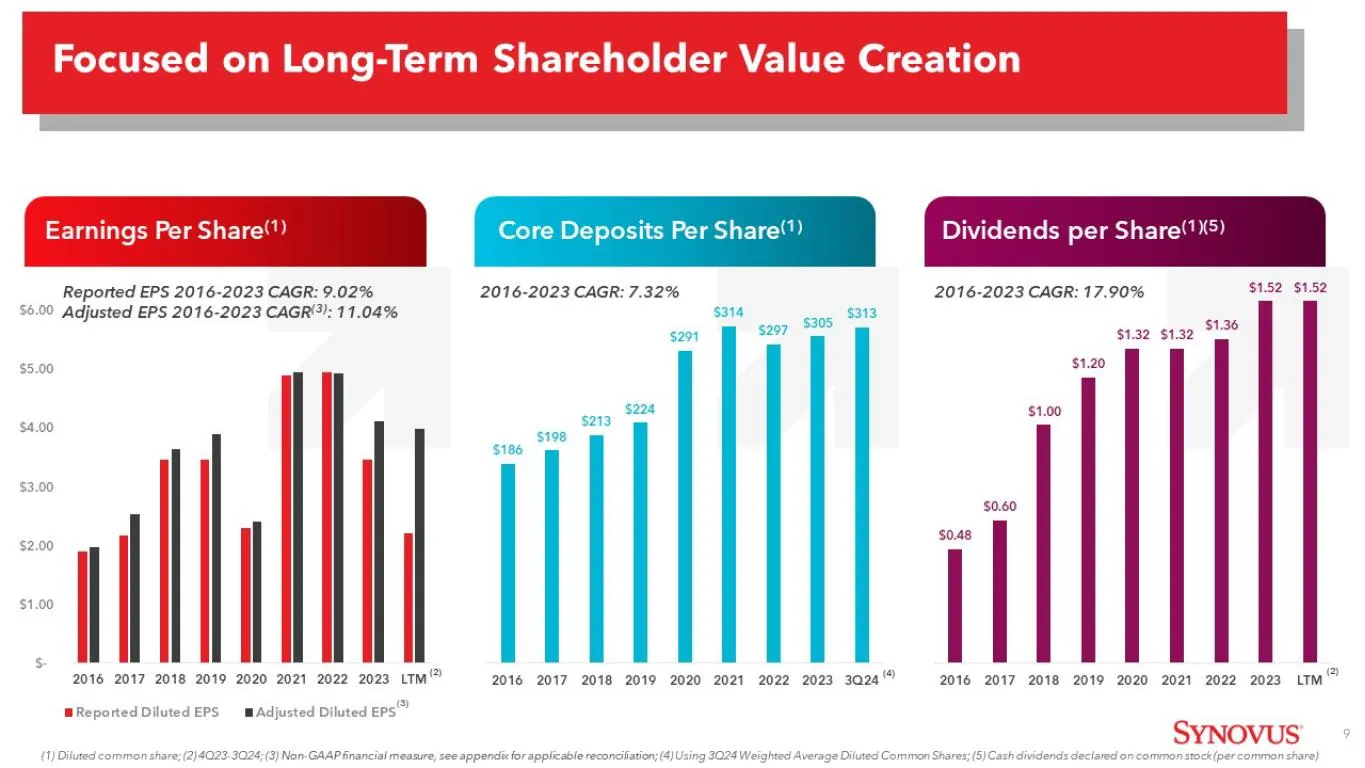
Slide 9: Focused on Long-Term Shareholder Value Creation
Focused on Long-Term Shareholder Value Creation Earnings Per Share") Core Deposits Per Share) Dividends per Share("5) Reported EPS 2016-2023 CAGR: 9.02% 2016-2023 CAGR: 7.32% 2016-2023 CAGR: 17.90% $1.52 $1.52 $6.00 Adjusted EPS 2016-2023 CAGR'): 11.04% $314 $313 $297 $305 $1.36 $291 $1.32 $1.32 5.0
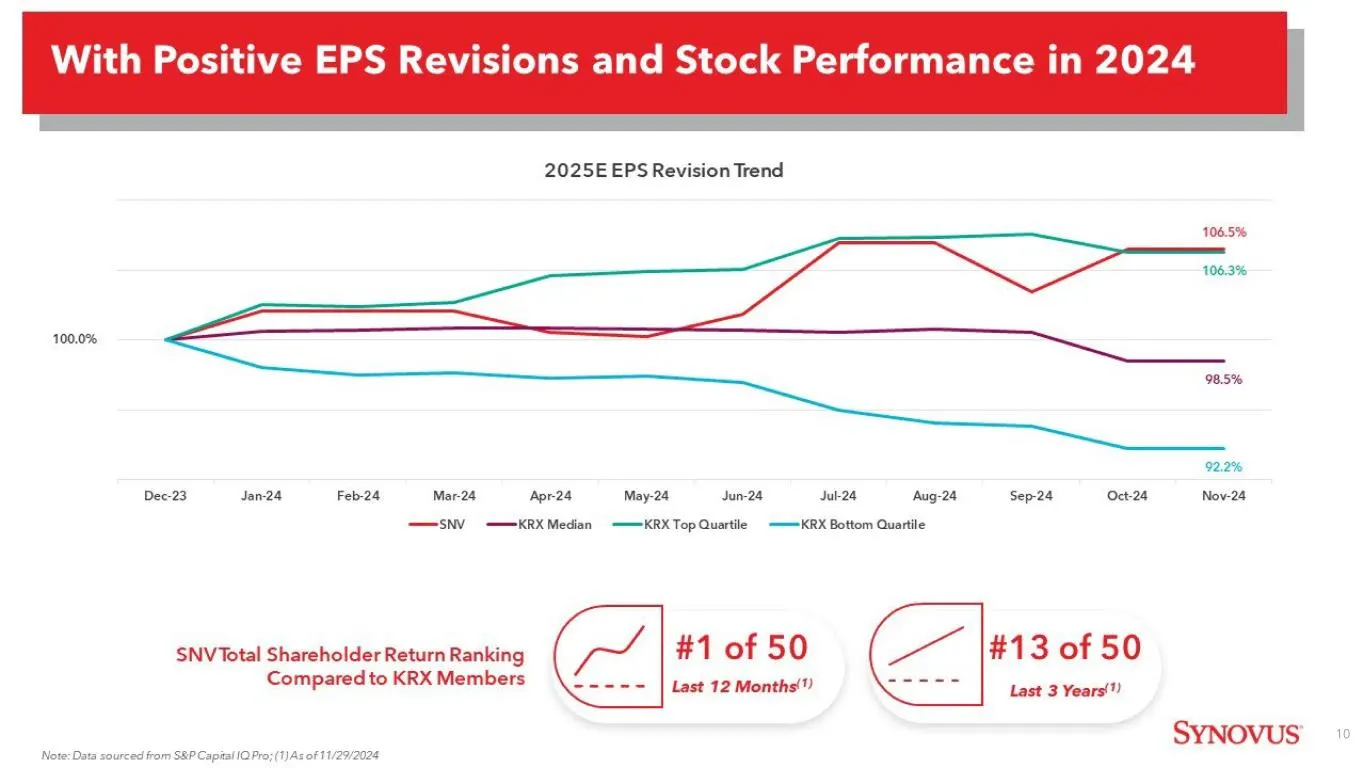
Slide 10: With Positive EPS Revisions and Stock Performance in 2024
With Positive EPS Revisions and Stock Performance in 2024 2025E EPS Revision Trend 106.5% 106.3% 100.0% 98.5% 92.2% Dec-23 Jan-24 Feb-24 Mar-24 Apr2a May-24 Jun-24 Juk2a Aug-24 Sep24 Oct24 Now-24 —SNV ——=KRX Median ——-KRX Top Quartile ~——-KRX Bottom Quartile SNVTotal Shareholder Return Ranking #1 of

Slide 11: Outlook
Outlook SYNOVUS
Slide 12: Capitalizing on Growth Tailwinds
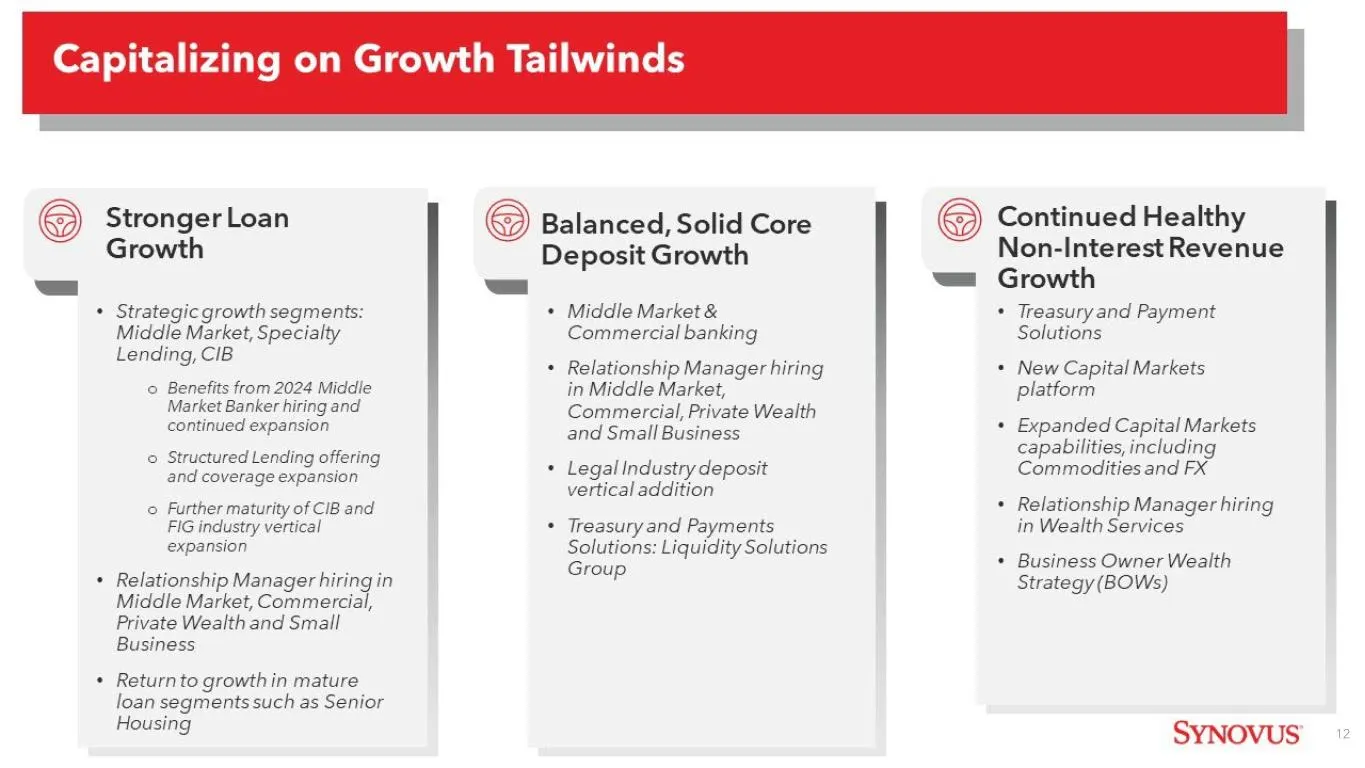
Capitalizing on Growth Tailwinds Stronger Loan Growth * Strategic growth segments: Middle Market, Specialty Lending, CIB © Benefits from 2024 Middle Market Banker hiring and continued expansion © Structured Lending offering and coverage expansion © Further maturity of CIB and FIG industry vertical e
Slide 13: Relationship Manager Expansion Plan
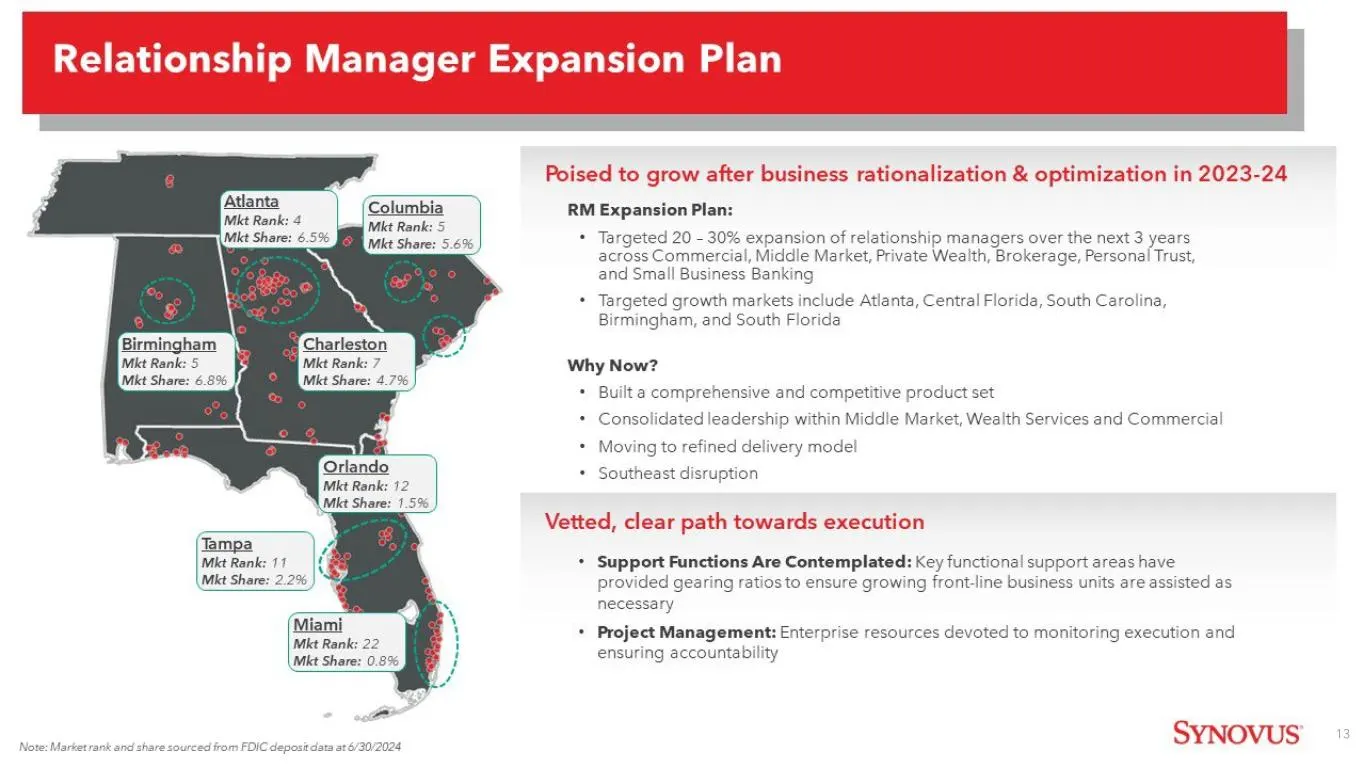
Relationship Manager Expansion Plan Poised to grow after business rationalization & optimization in 2023-24 RM Expansion Plan: + Targeted 20 - 30% expansion of relationship managers over the next 3 years across Commercial, Middle Market, Private Wealth, Brokerage, Personal Trust, and Small Business
Slide 14: Structured Lending and CIB FIG Expansion in 2025
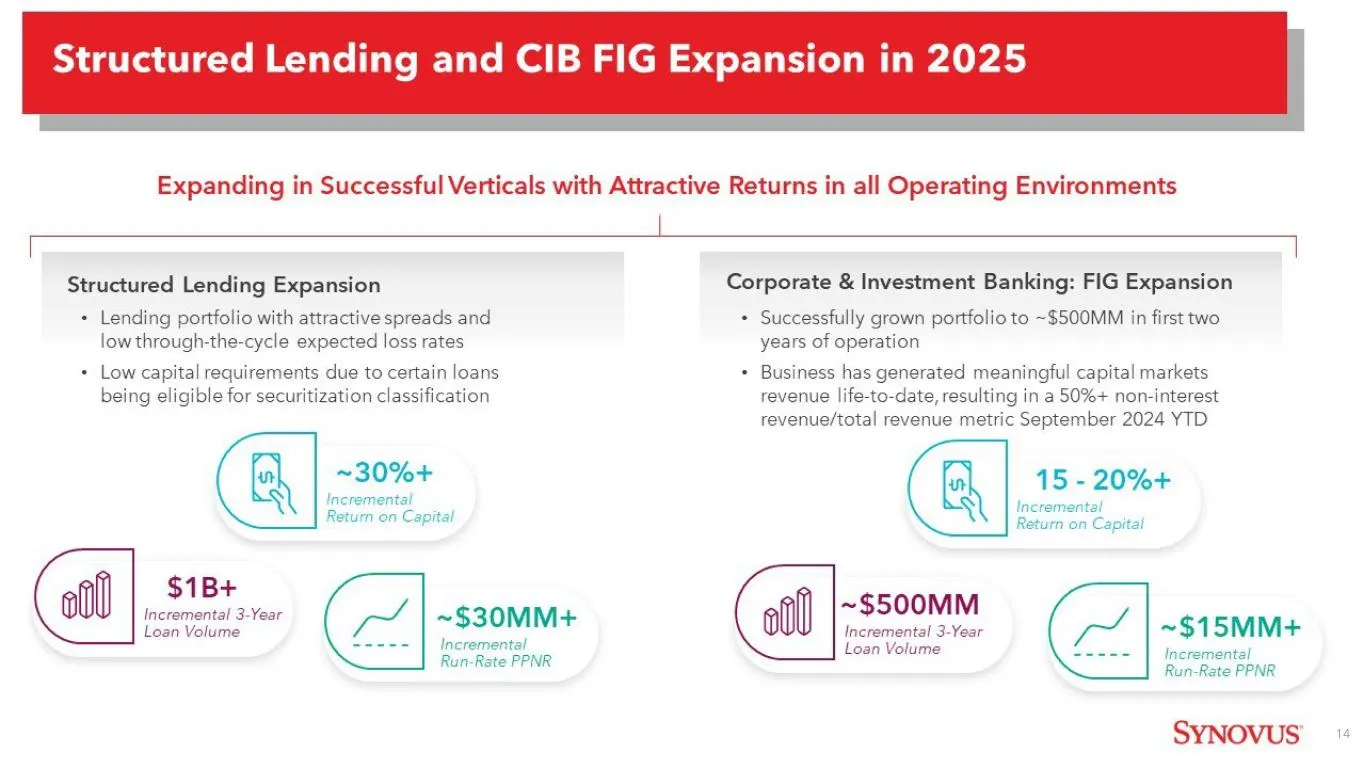
Structured Lending and CIB FIG Expansion in 2025 Expanding in Successful Verticals with Attractive Returns in all Operating Environments Structured Lending Expansion Corporate & Investment Banking: FIG Expansion + Lending portfolio with attractive spreads and + Successfully grown portfolio to ~$500M
Slide 15: 2025E Loan Growth Drivers
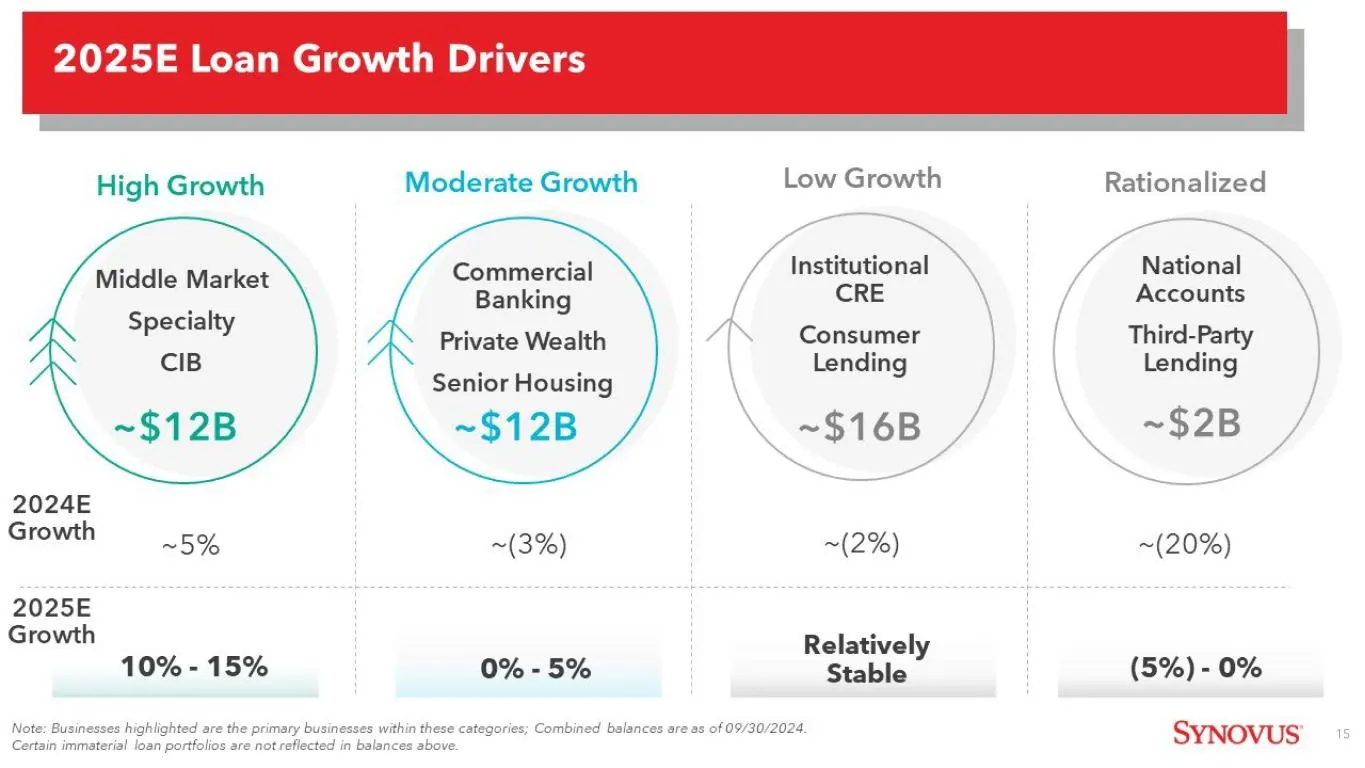
2025E Loan Growth Drivers High Growth Moderate Growth Low Growth Middle Market Commercial Senior Housing ~$12B ~$12B 2024E Growth ~5% ~(3%) 2025E Growth 10% - 15% 0% - 5% Note: Businesses highlighted are the primary businesses within these categories; Combined balances are as of 09/30/2024. Certain
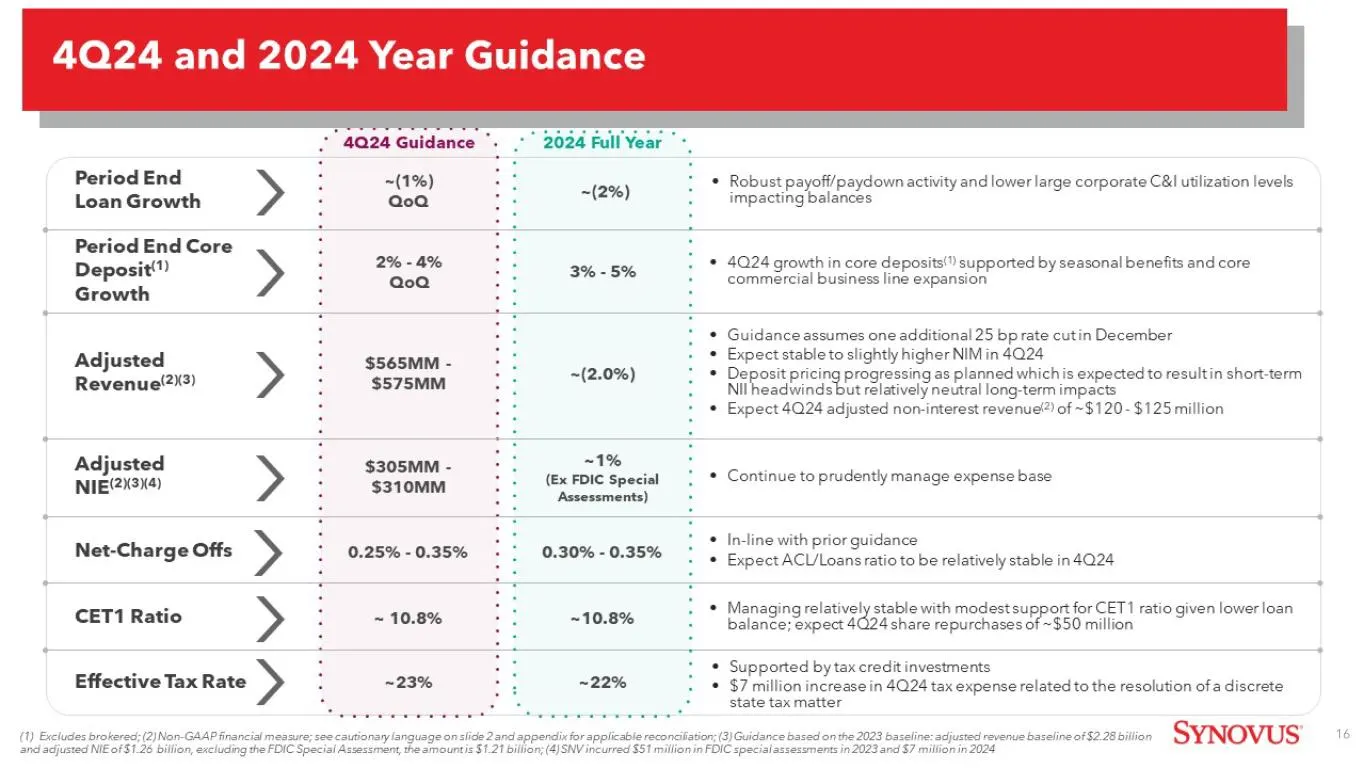
Slide 16: 4Q24 and 2024 Year Guidance
4024 and 2024 Year Guidance 4024 Guidance © Period End Loan Growth 1 © Robust payoff/paydown activity and lower large corporate C&d utilization levels ~(2%) impacting balances Period End Core Deposit) >» : zeae Growth i o00 * 424 growth in core deposits\") supported by seasonal benefits and core com
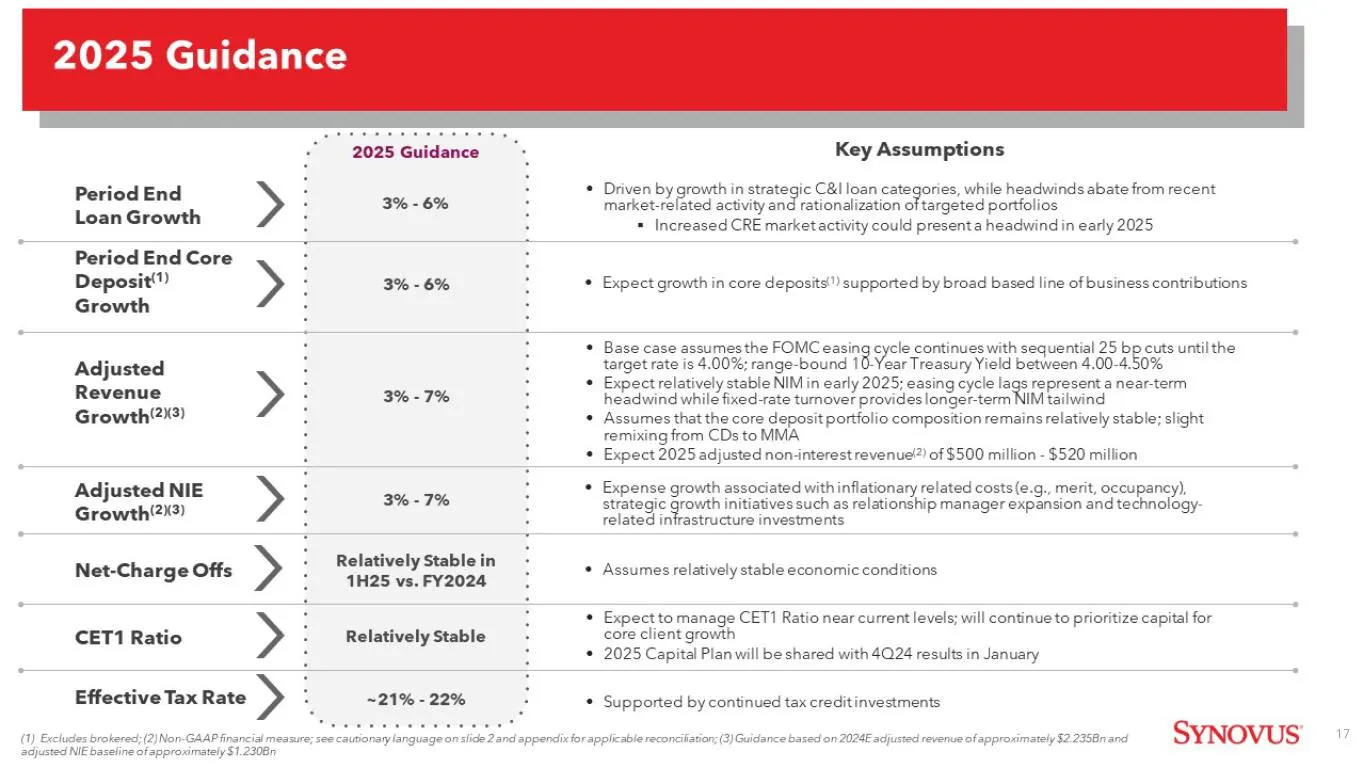
Slide 17: 2025 Guidance
2025 Guidance 2025 Guidance Key Assumptions i E : * Driven by growth in strategic C&l loan categories, while headwinds abate from recent Period End Ki > : 3% - 6% F marketrobted activity and rationalization of targeted portfolios Lose Rrowl ! : + Increased CRE market activity could presenta headwind
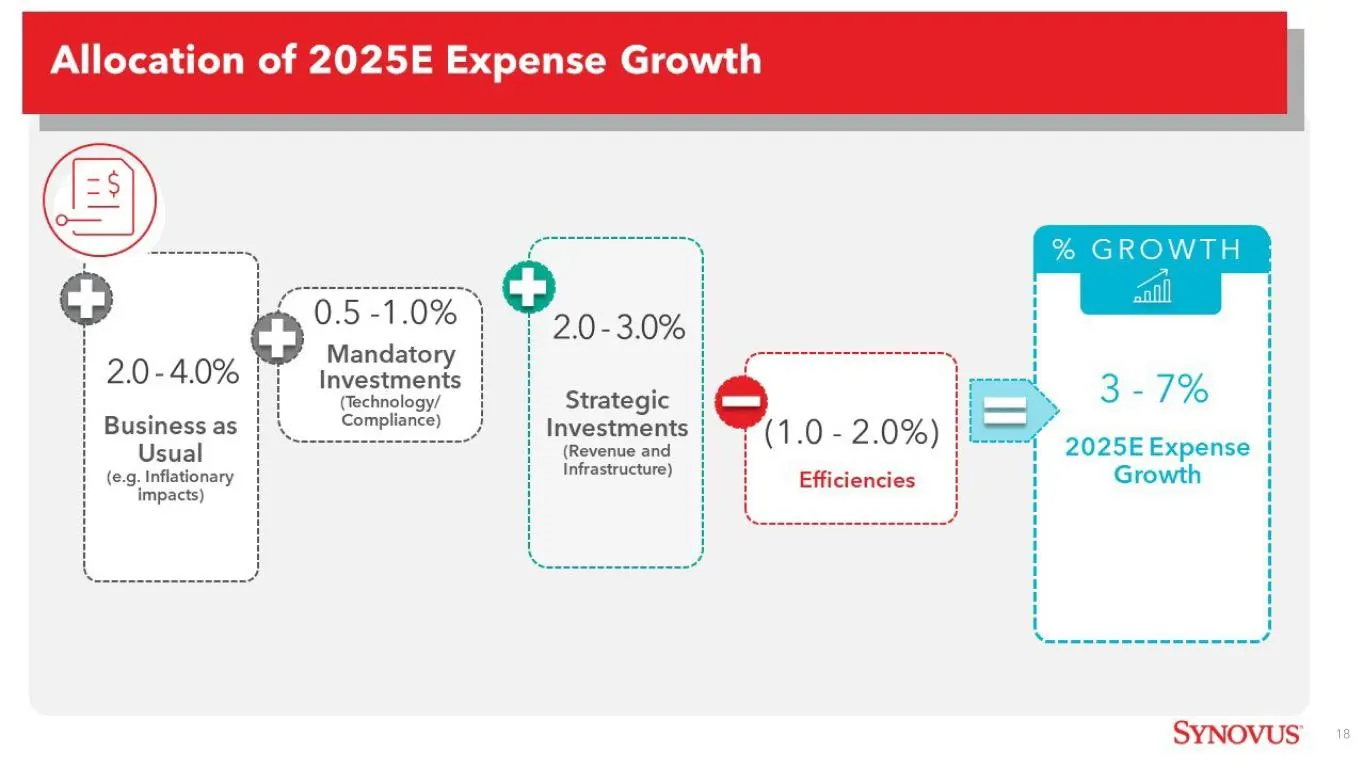
Slide 18: E ° i= 1) 7) un < C7) a x Ww et w N
E ° i= 1) 7) un < C7) a x Ww et w N i=] N e ° < ° .] © *) x) < Growth Efficiencies (1.0 - 2.0%) z (Revenue and Infrastructure) Strategic Investments Mandatory Investments (Technology/ Compliance) > 5S iit Bae woe Sasa bea DHE a s a 0 a a o £& a 3 a
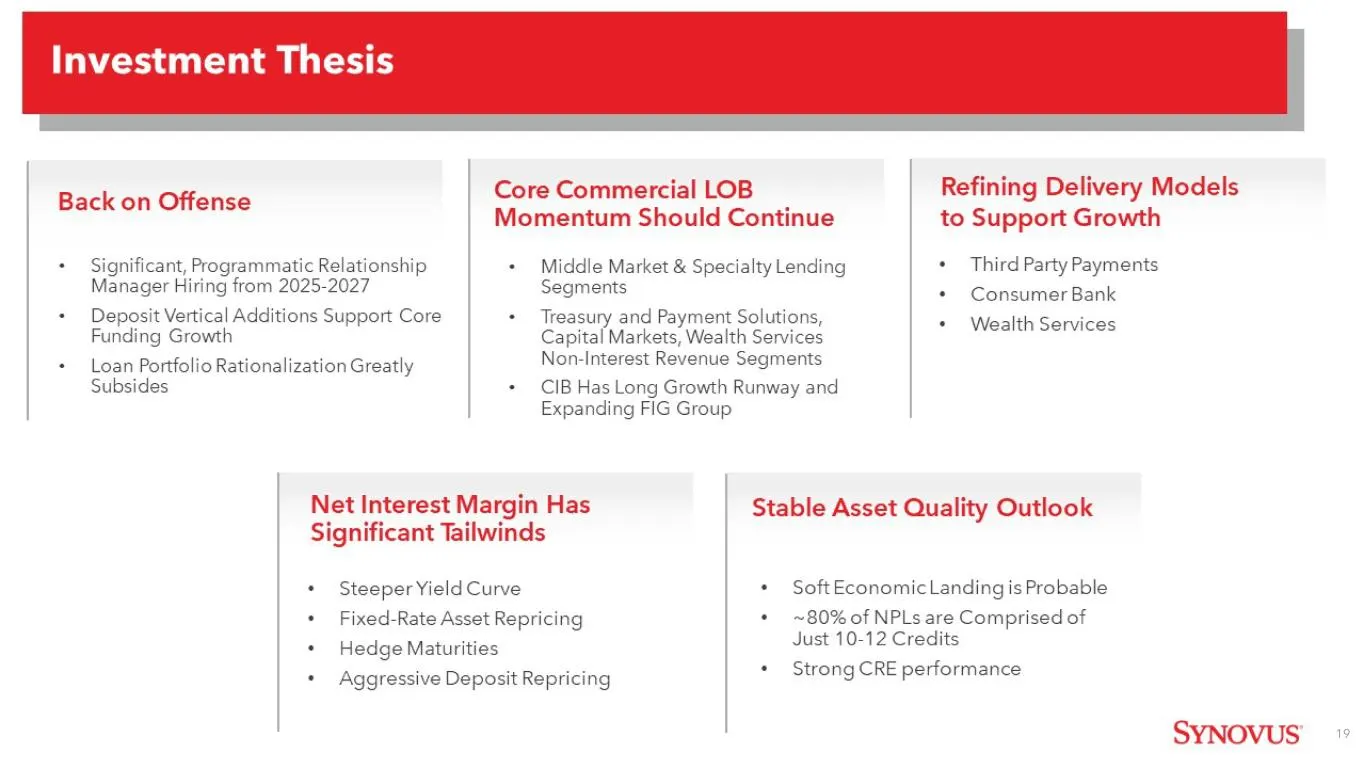
Slide 19: Investment Thesis
Investment Thesis Back on Offense Core Commercial LOB Momentum Should Continue Refining Delivery Models to Support Growth + Significant, Programmatic Relationship + Middle Market & Specialty Lending * Third Party Payments Manager Hiring from 2025-2027 Segments « GonsumerBank + Deposit Vertical Addit

Slide 20: Synovus
SYNOVUS get there

Slide 21: Appendix
Appendix SYNOVUS
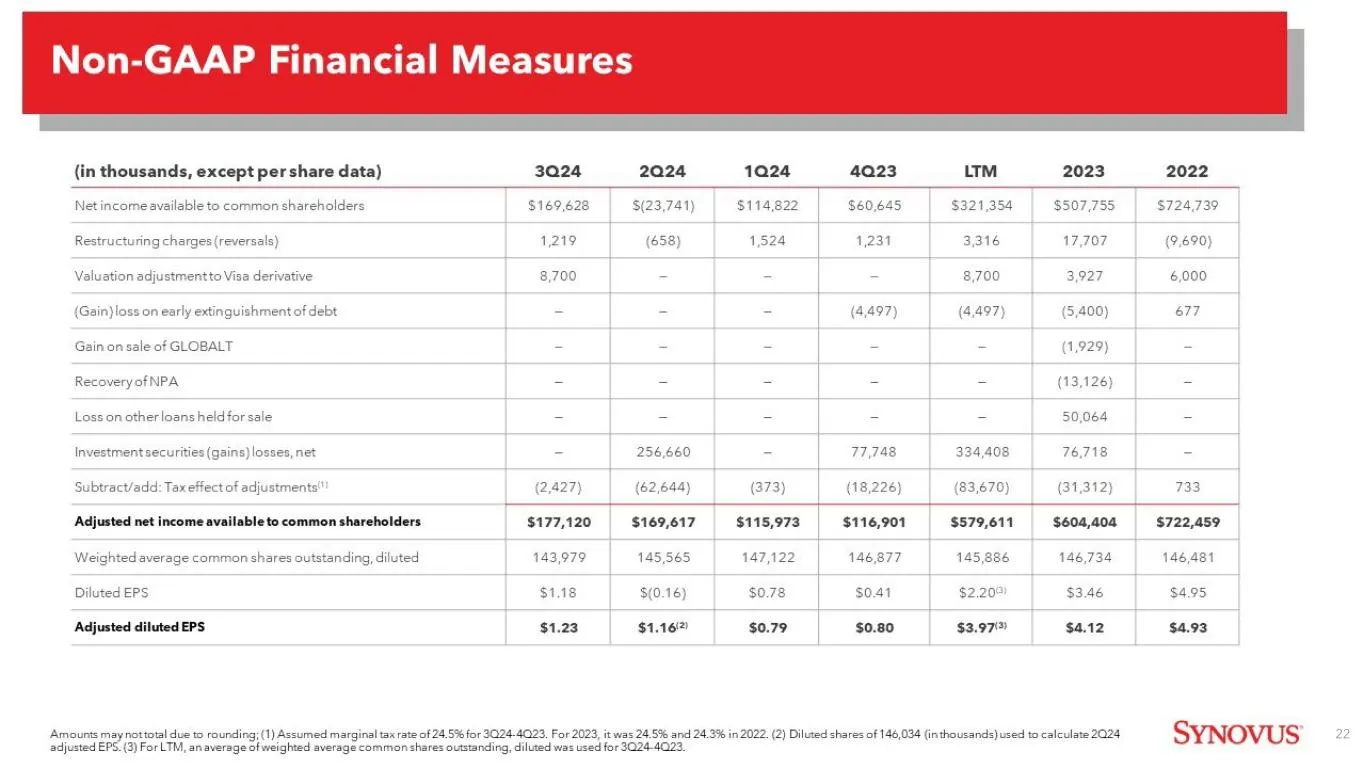
Slide 22: Non-GAAP Financial Measures
Non-GAAP Financial Measures (in thousands, except per share data) 3024 2024 1024 4Q23 LT™ 2023 2022 Net incomeavailable to common shareholders $169,628 $(23,741) $114,822 $60,645 $321,354 | $507,755 | $724,739 Restructuring charges(reversals) 1,219 (658) 1,524 1,231 3.316 17,707 (9,690) Valuation ad
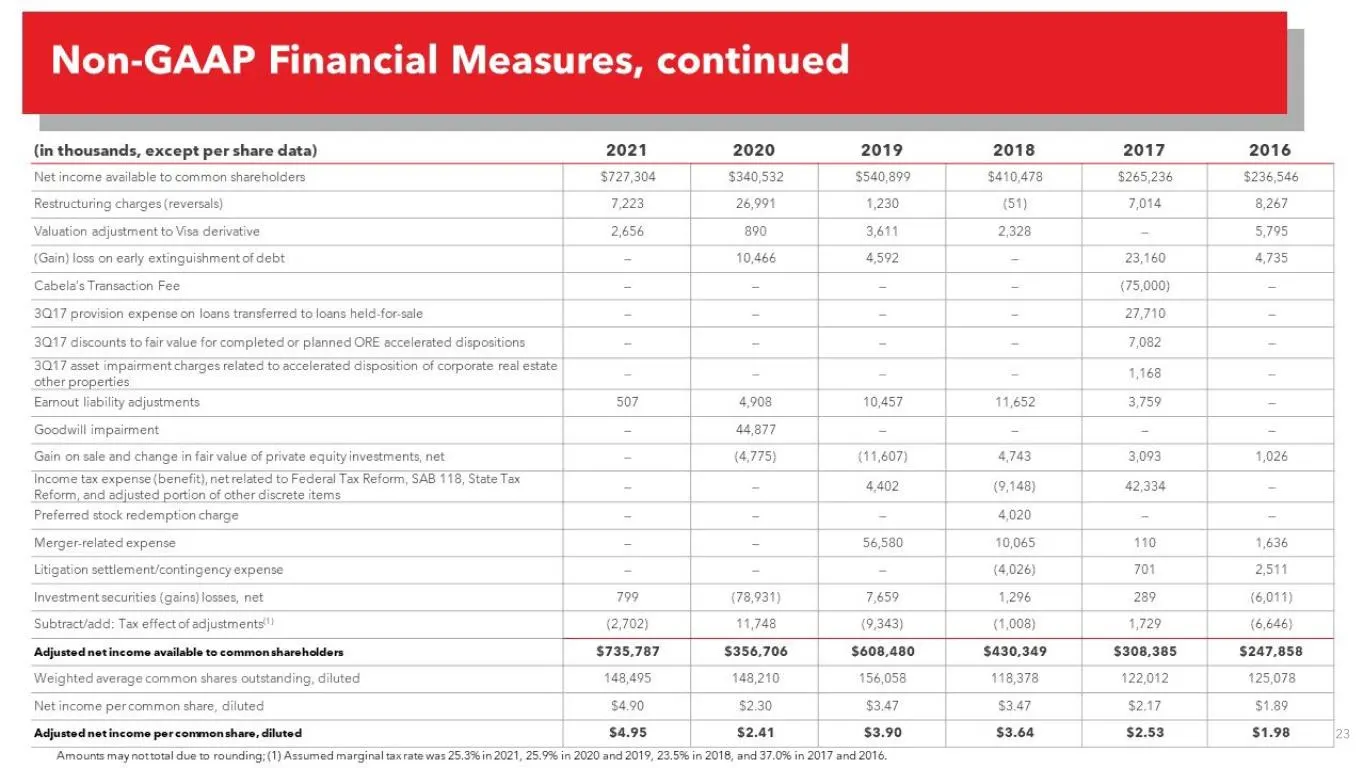
Slide 23: Non-GAAP Financial Measures, continued
Non-GAAP Financial Measures, continued (in thousands, except per share data) 2021 2020 2019 2018 2017 2016 Net income available to common shareholders $727,304 $340,532 $540,899 $410,478 $265,236 $236546 | Restructuring charges (reversals) | 7,223 26,991 4,230 (51) | 7,014 | 8267 | Valuation adjustm
Source: SEC EDGAR · 8-K filed Dec 10, 2024
More decks from Synovus Financial Corp
 Goldman Sachs 2025 Financial Services Conference15 slides · Dec 8, 2025
 Debt Investor Presentation (December 2025)9 slides · Dec 1, 2025
 Merger or Acquisition (November 2025)5 slides · Nov 26, 2025
 Merger or Acquisition (November 2025)6 slides · Nov 6, 2025
 Q3 2025 Earnings Presentation47 slides · Oct 16, 2025
 Merger or Acquisition (August 2025)27 slides · Aug 28, 2025