Soltec Power Holdings SA · BME:SOL
Soltec Power Holdings SA — Investor Day (May 2022)
17 slides from Soltec Power Holdings SA's investor day presentation, May 19, 2022
Slide 1: sate
sate
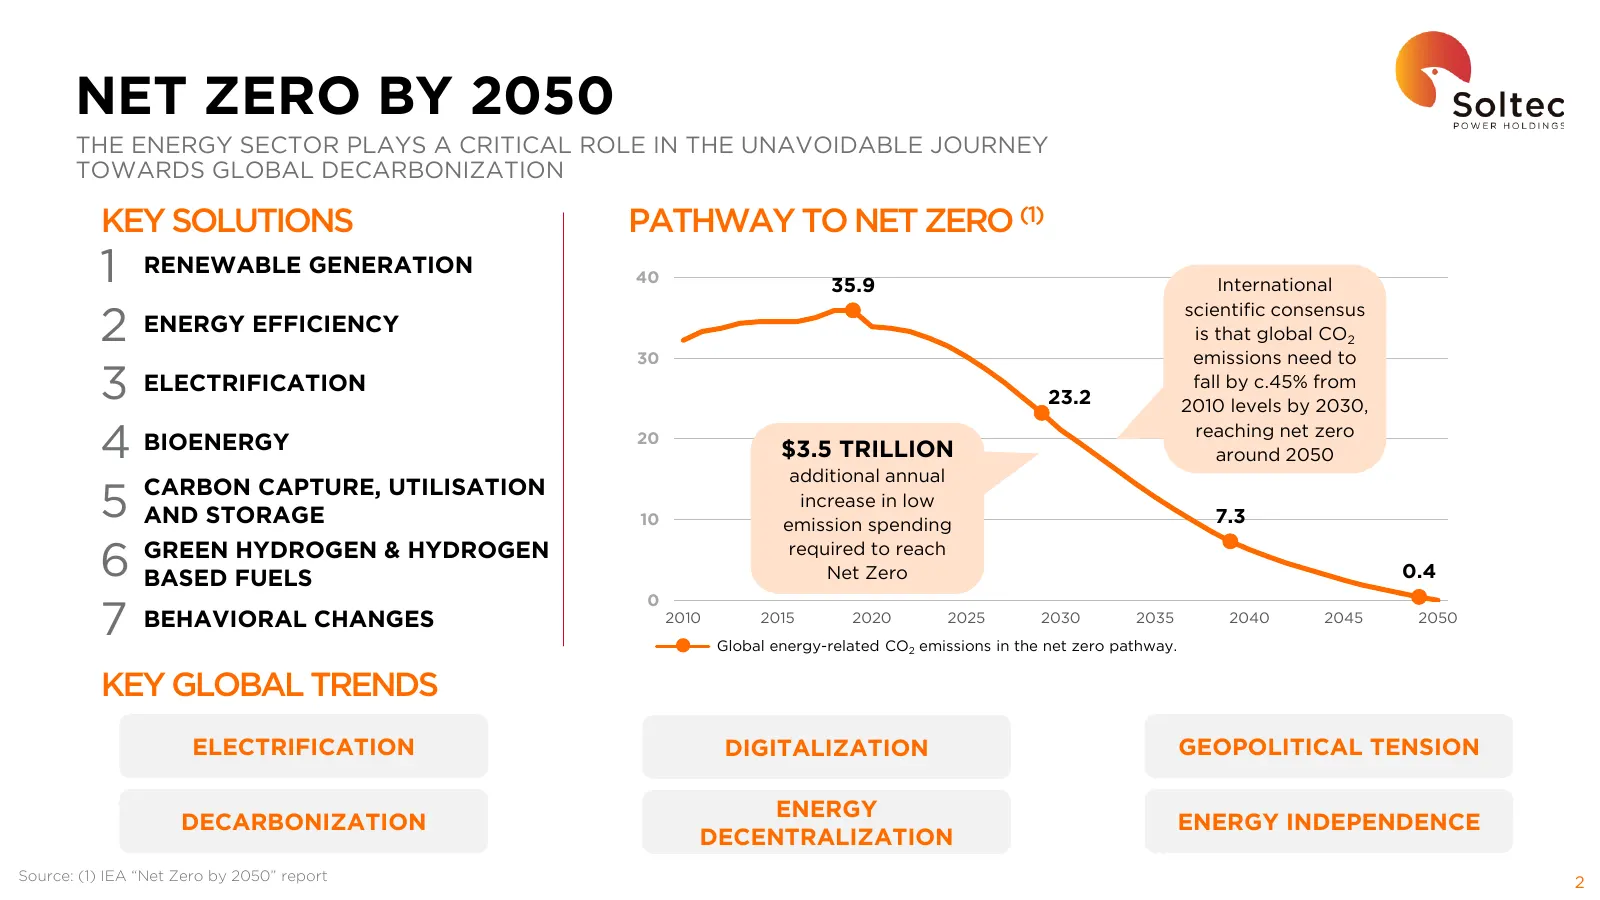
Slide 2: Net Zero by 2050
NET ZERO BY 2050 THE ENERGY SECTOR PLAYS A CRITICAL ROLE IN THE UNAVOIDABLE JOURNEY TOWARDS GLOBAL DECARBONIZATION KEY SOLUTIONS PATHWAY TO NET ZERO (1) 1 RENEWABLE GENERATION 40 35.9 International scientific consensus 2 ENERGY EFFICIENCY is that global CO2 30 emissions need to 3 ELECTRIFICATION 23.
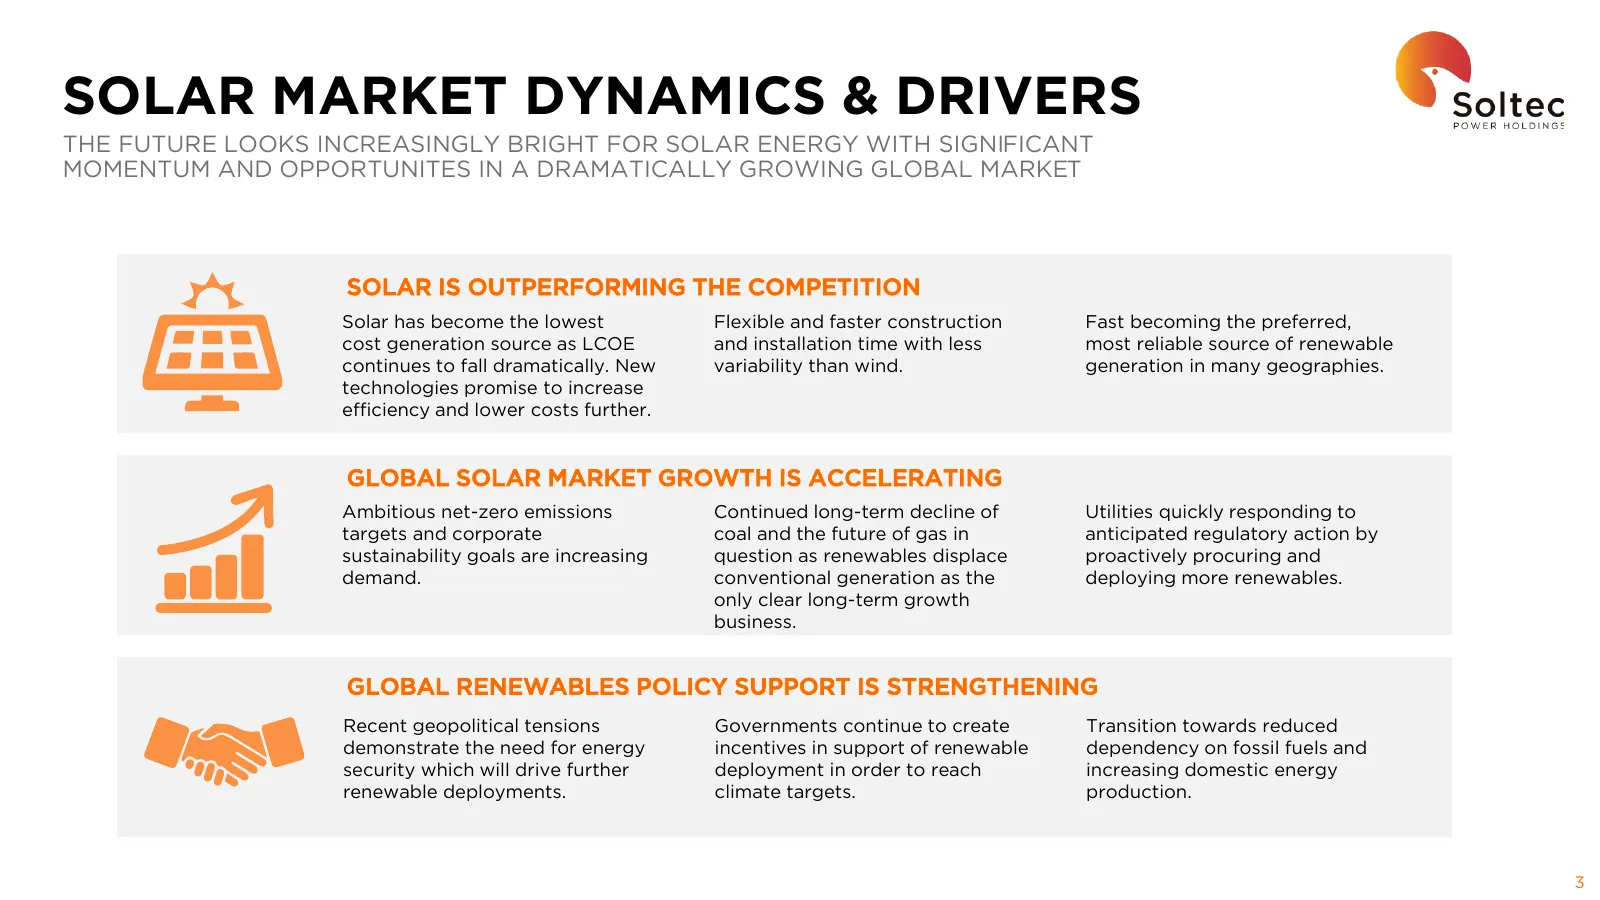
Slide 3: Solar Market Dynamics & Drivers
SOLAR MARKET DYNAMICS & DRIVERS THE FUTURE LOOKS INCREASINGLY BRIGHT FOR SOLAR ENERGY WITH SIGNIFICANT MOMENTUM AND OPPORTUNITES IN A DRAMATICALLY GROWING GLOBAL MARKET SOLAR IS OUTPERFORMING THE COMPETITION Solar has become the lowest Flexible and faster construction Fast becoming the preferred, co
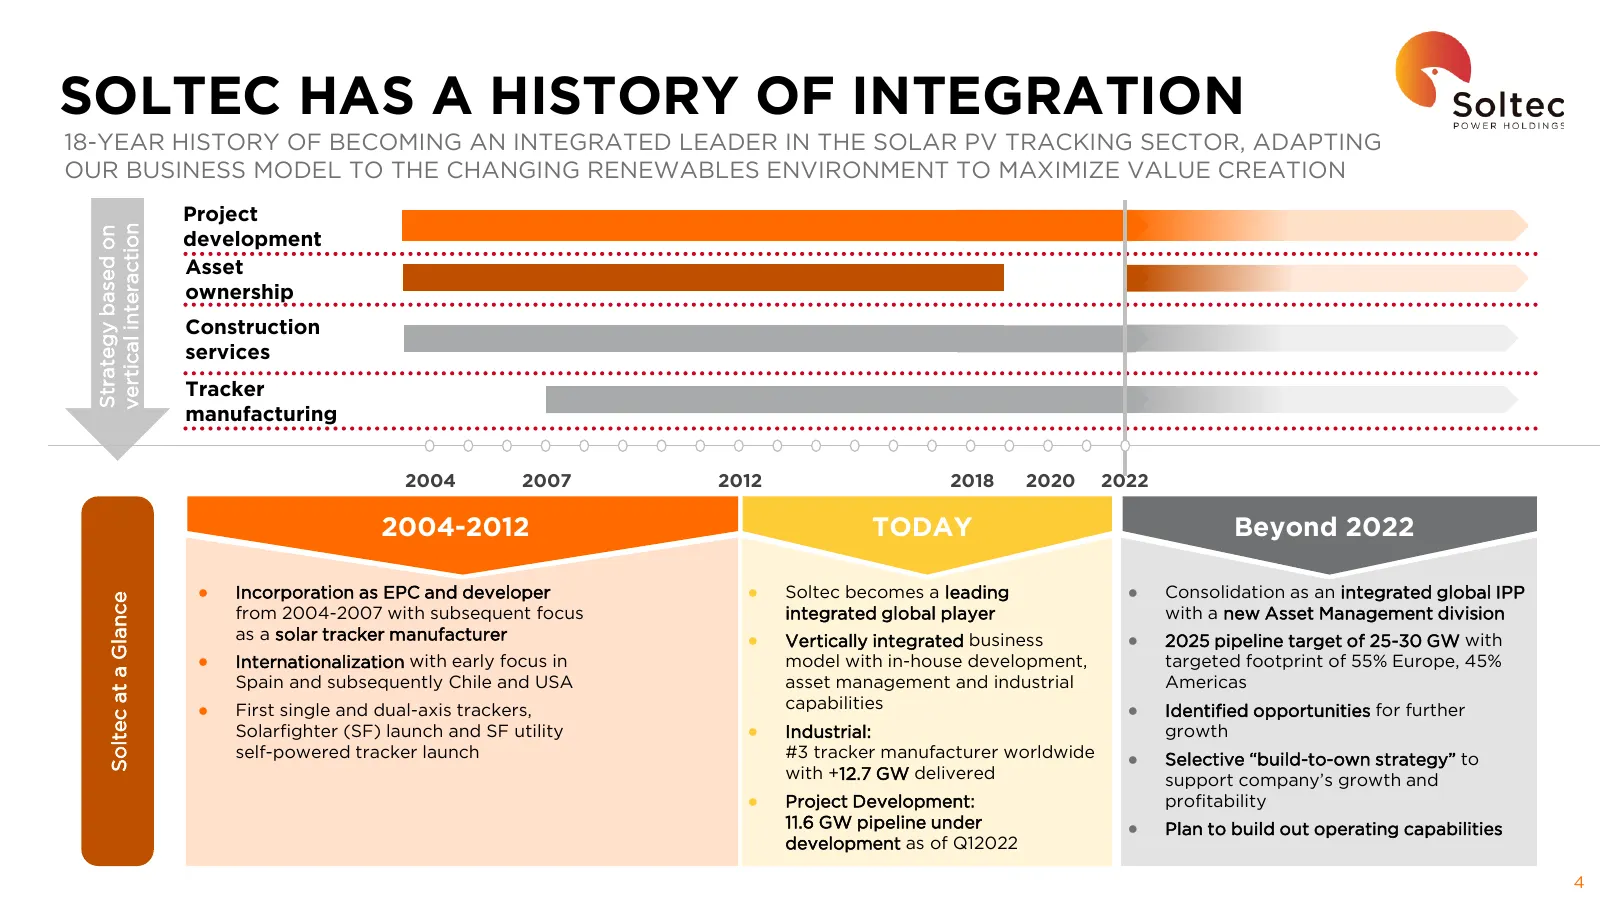
Slide 4: Soltec Has a History of Integration
SOLTEC HAS A HISTORY OF INTEGRATION 18-YEAR HISTORY OF BECOMING AN INTEGRATED LEADER IN THE SOLAR PV TRACKING SECTOR, ADAPTING OUR BUSINESS MODEL TO THE CHANGING RENEWABLES ENVIRONMENT TO MAXIMIZE VALUE CREATION Project vertical interaction Strategy based on development Asset ownership Construction
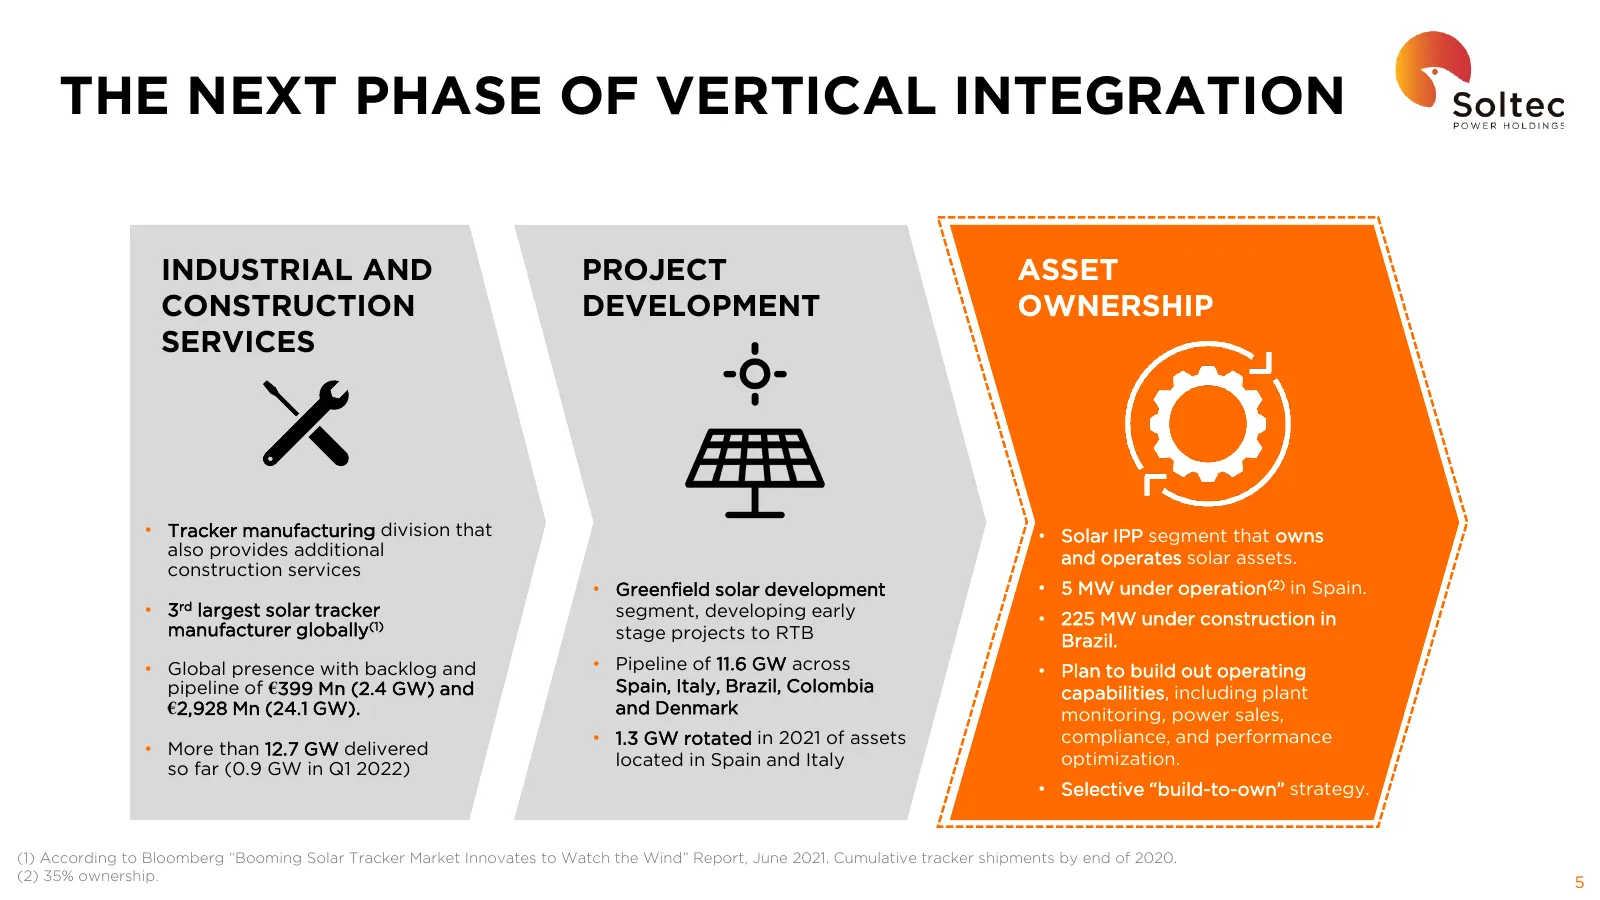
Slide 5: The Next Phase of Vertical Integration
THE NEXT PHASE OF VERTICAL INTEGRATION INDUSTRIAL AND PROJECT ASSET CONSTRUCTION DEVELOPMENT OWNERSHIP SERVICES • Tracker manufacturing division that • Solar IPP segment that owns also provides additional and operates solar assets. construction services • Greenfield solar development • 5 MW under op
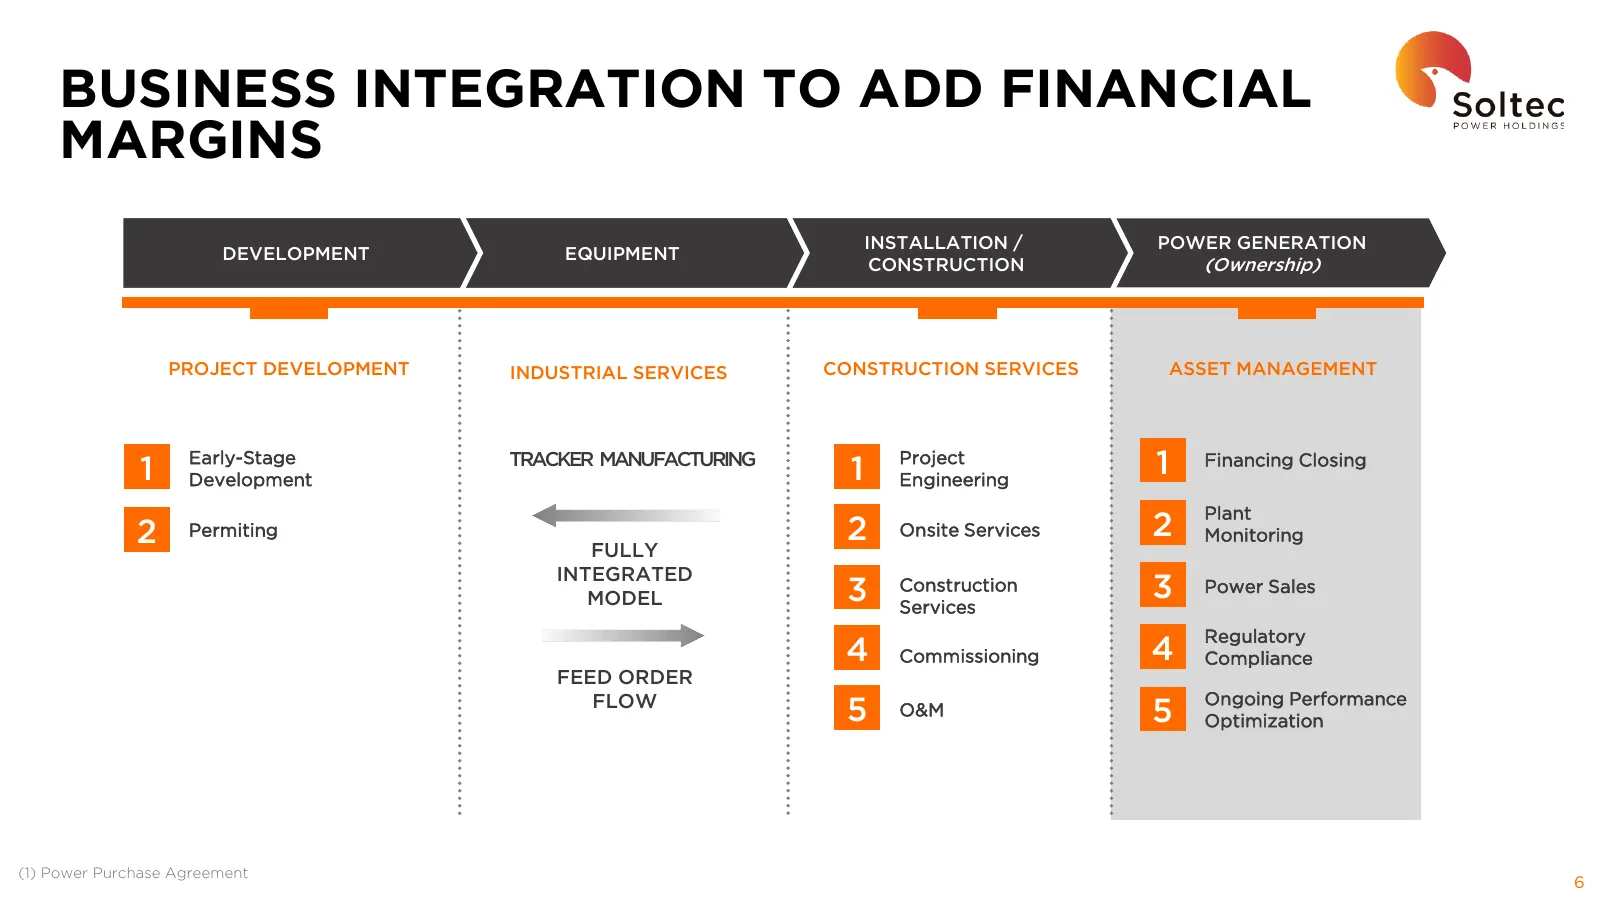
Slide 6: Business Integration to Add Financial Margins
BUSINESS INTEGRATION TO ADD FINANCIAL MARGINS INSTALLATION / POWER GENERATION DEVELOPMENT EQUIPMENT CONSTRUCTION (Ownership) PROJECT DEVELOPMENT INDUSTRIAL SERVICES CONSTRUCTION SERVICES ASSET MANAGEMENT 1 Early-Stage Development TRACKER MANUFACTURING 1 Project Engineering 1 Financing Closing Plant
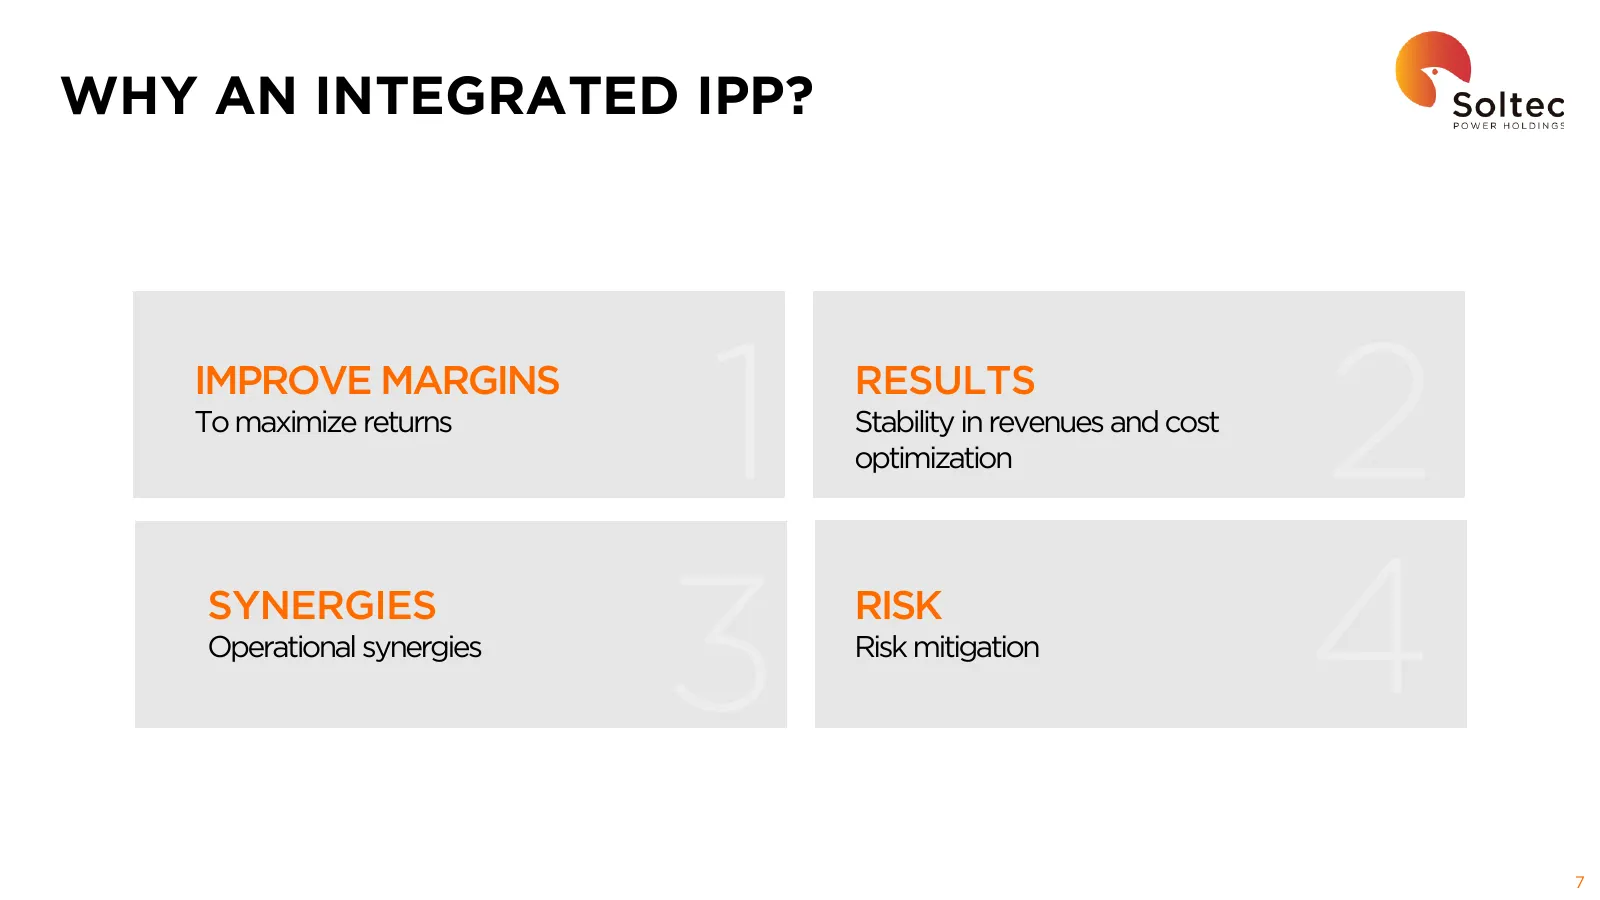
Slide 7: Why an Integrated IPP?
WHY AN INTEGRATED IPP? IMPROVE MARGINS RESULTS To maximize returns Stability in revenues and cost optimization SYNERGIES RISK Operational synergies Risk mitigation 7
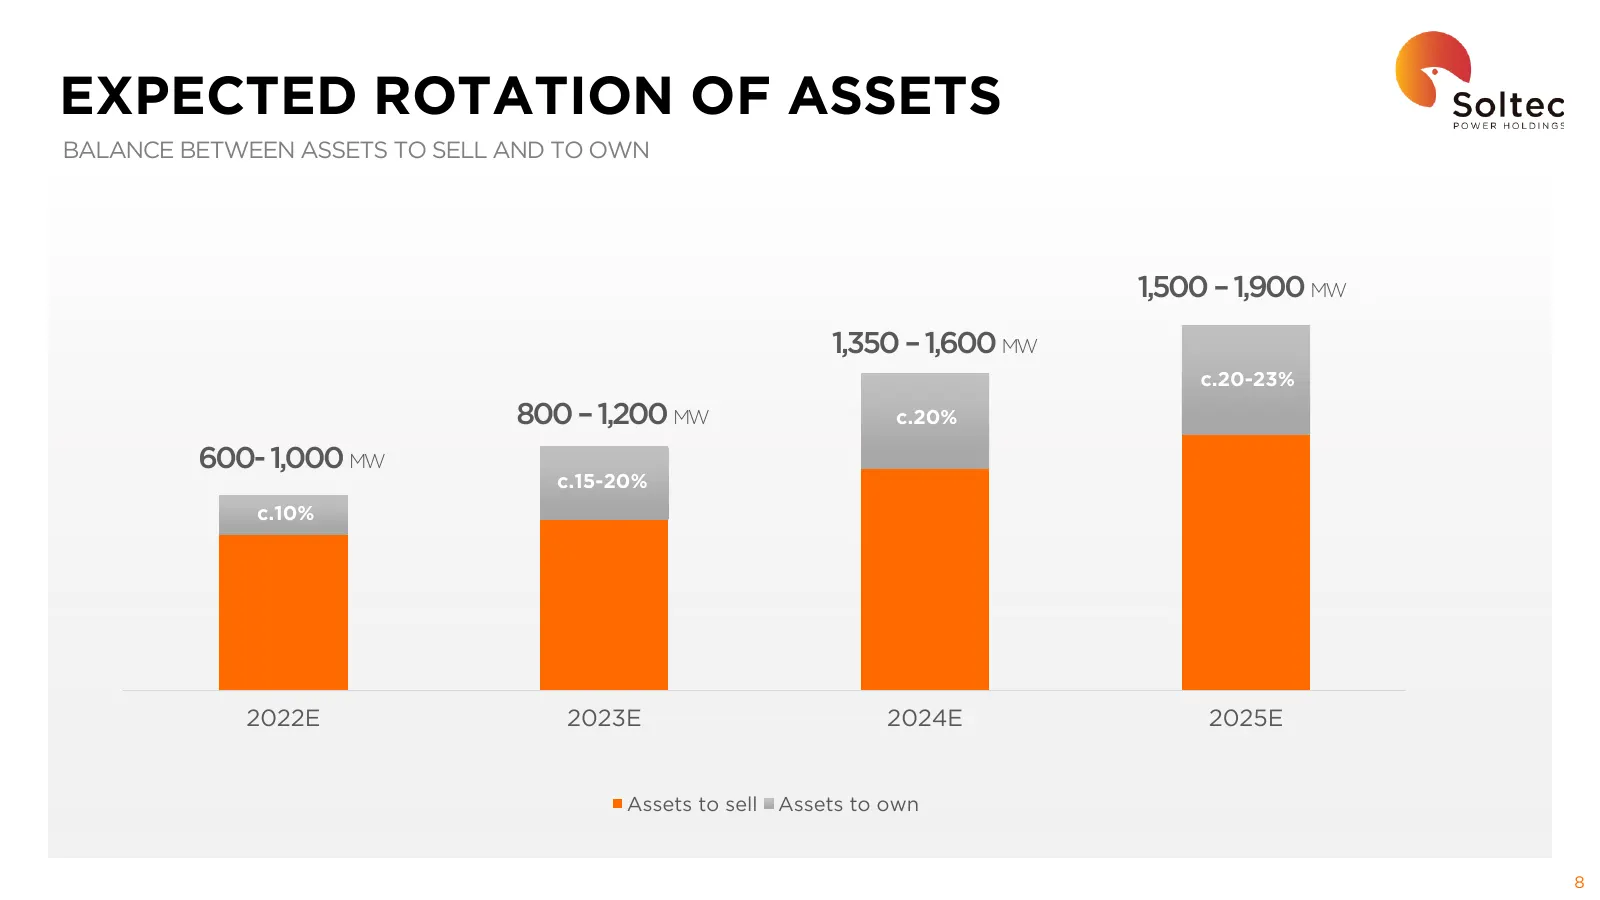
Slide 8: Expected Rotation of Assets
EXPECTED ROTATION OF ASSETS BALANCE BETWEEN ASSETS TO SELL AND TO OWN 1,500 – 1,900 MW 1,350 – 1,600 MW c.20-23% 800 – 1,200 MW c.20% 600- 1,000 MW c.15-20% c.10% 2022E 2023E 2024E 2025E Assets to sell Assets to own 8
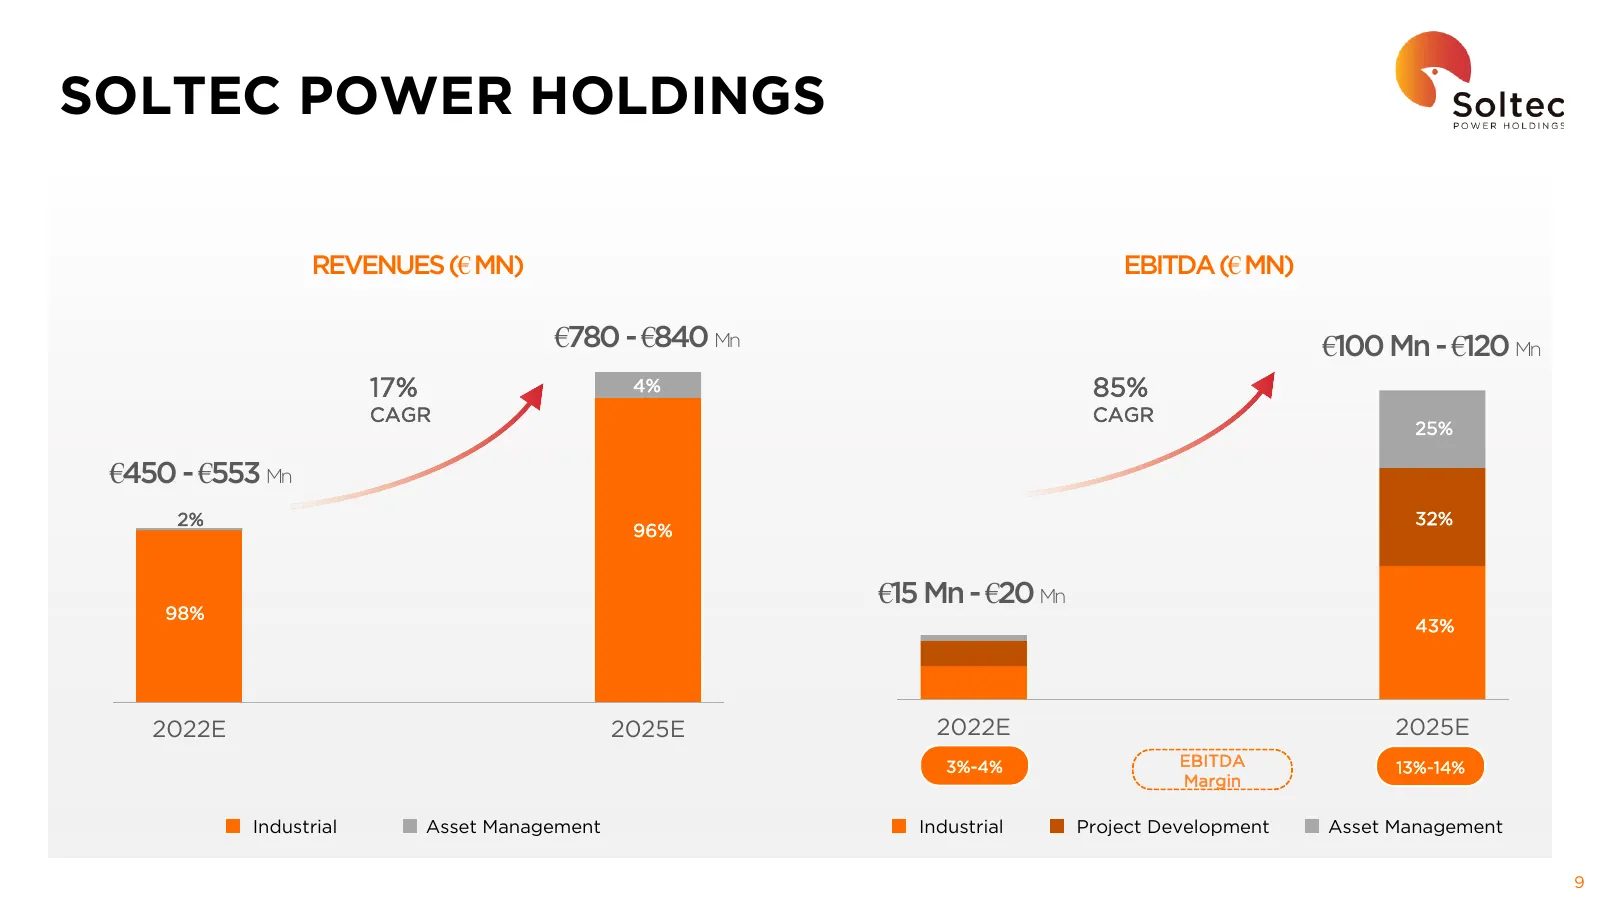
Slide 9: Soltec Power Holdings
SOLTEC POWER HOLDINGS REVENUES (€ MN) EBITDA (€ MN) €780 - €840 Mn €100 Mn - €120 Mn 17% 4% 85% CAGR CAGR 25% €450 - €553 Mn 2% 32% 96% €15 Mn - €20 Mn 98% 43% 2022E 2025E 2022E 2025E 3%-4% EBITDA 13%-14% Margin Industrial Asset Management Industrial Project Development Asset Management 9
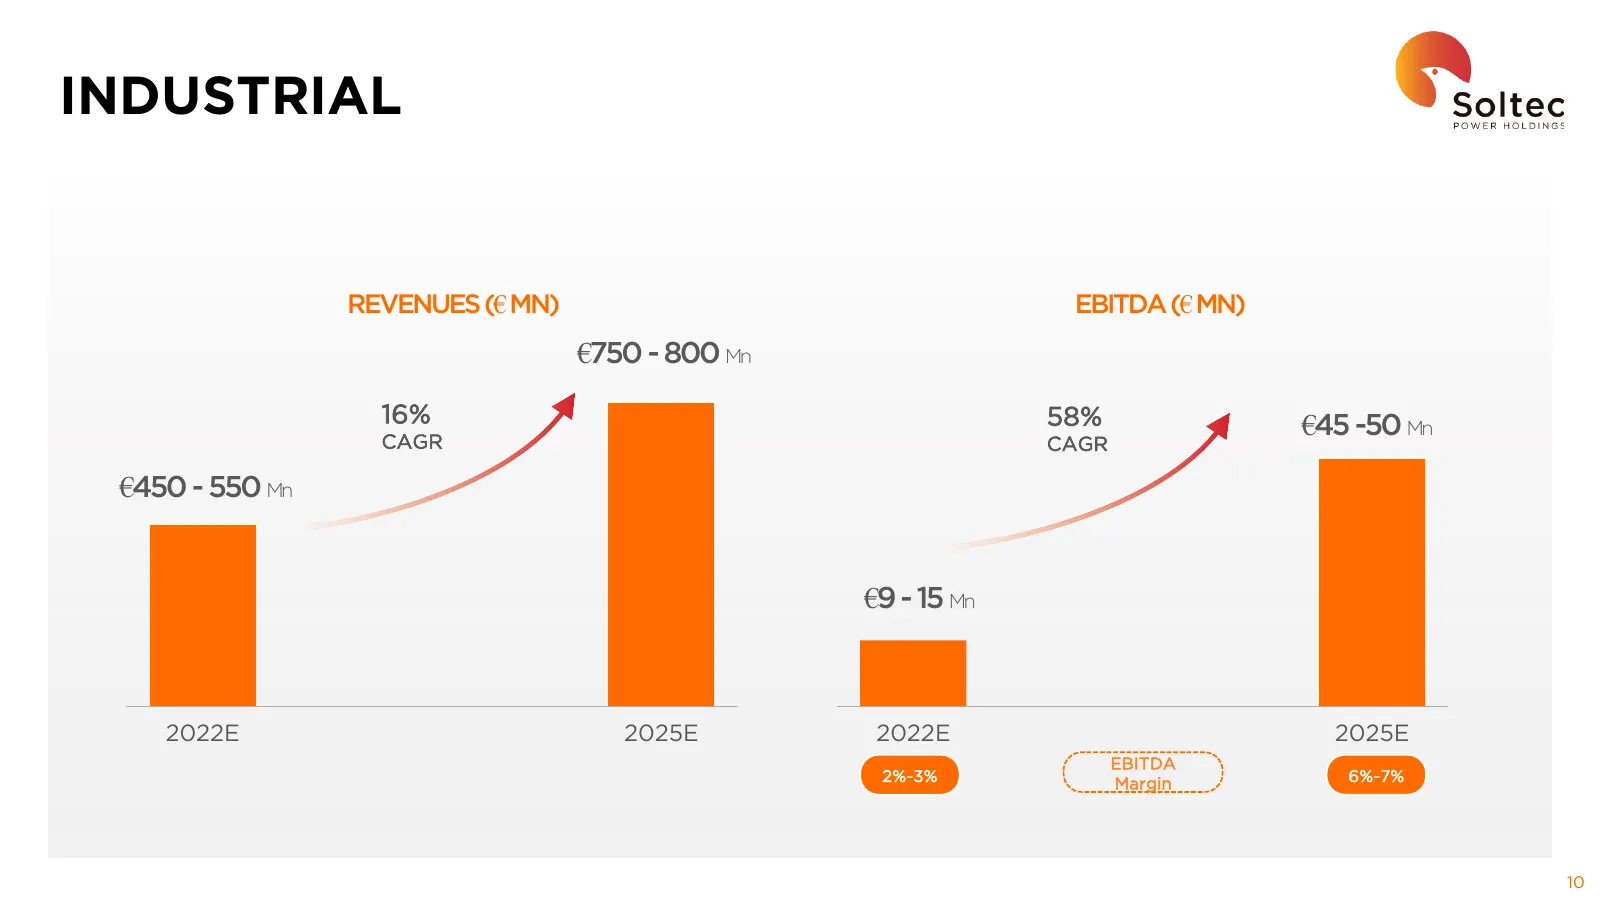
Slide 10: Industrial
INDUSTRIAL REVENUES (€ MN) EBITDA (€ MN) €750 - 800 Mn 16% 58% €45 -50 Mn CAGR CAGR €450 - 550 Mn €9 - 15 Mn 2022E 2025E 2022E 2025E EBITDA 2%-3% Margin 6%-7% 10
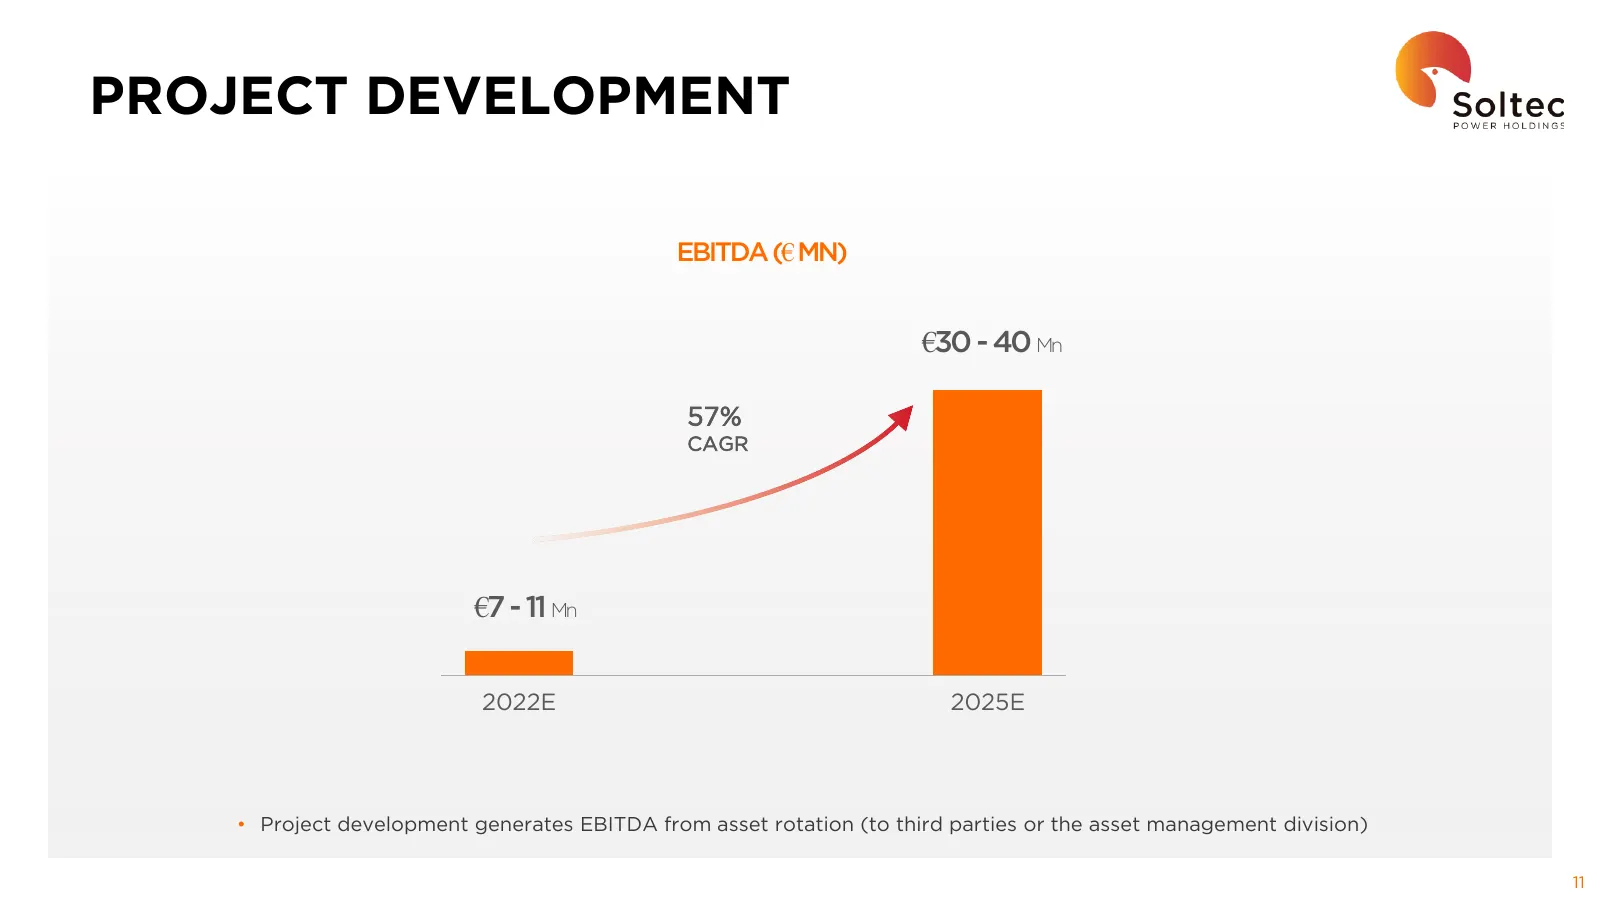
Slide 11: Project Development
PROJECT DEVELOPMENT EBITDA (€ MN) €30 - 40 Mn 57% CAGR €7 - 11 Mn 2022E 2025E • Project development generates EBITDA from asset rotation (to third parties or the asset management division) 11
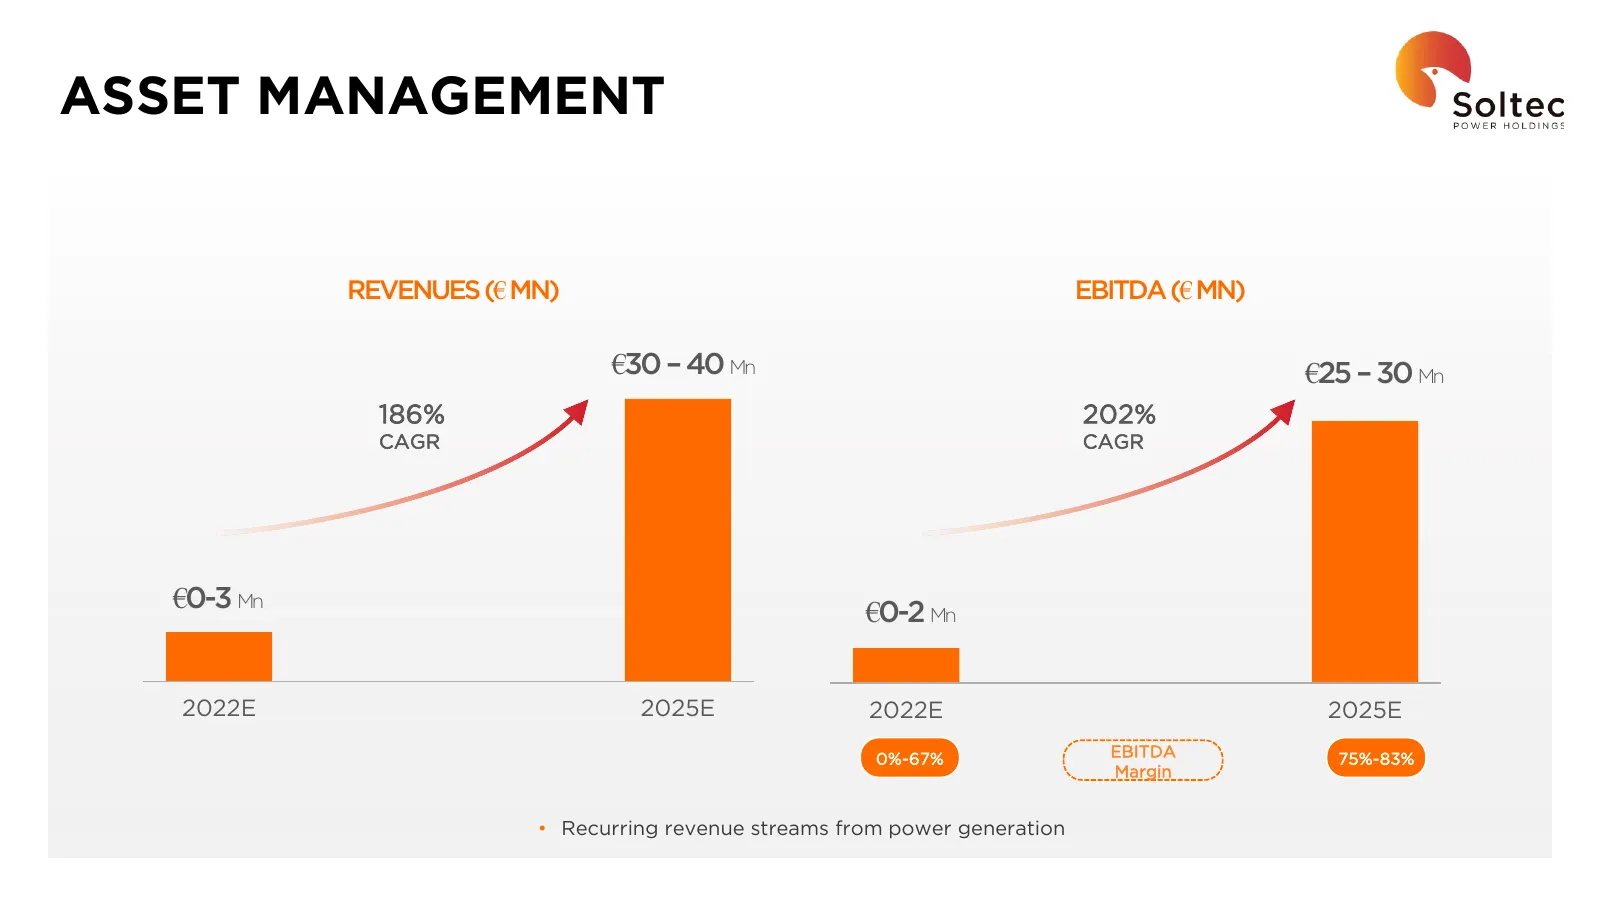
Slide 12: Asset Management
ASSET MANAGEMENT REVENUES (€ MN) EBITDA (€ MN) €30 – 40 Mn €25 – 30 Mn 186% 202% CAGR CAGR €0-3 Mn €0-2 Mn 2022E 2025E 2022E 2025E 0%-67% EBITDA 75%-83% Margin • Recurring revenue streams from power generation
Slide 13: An Organization Focused on Increasing Accountability and Profitability
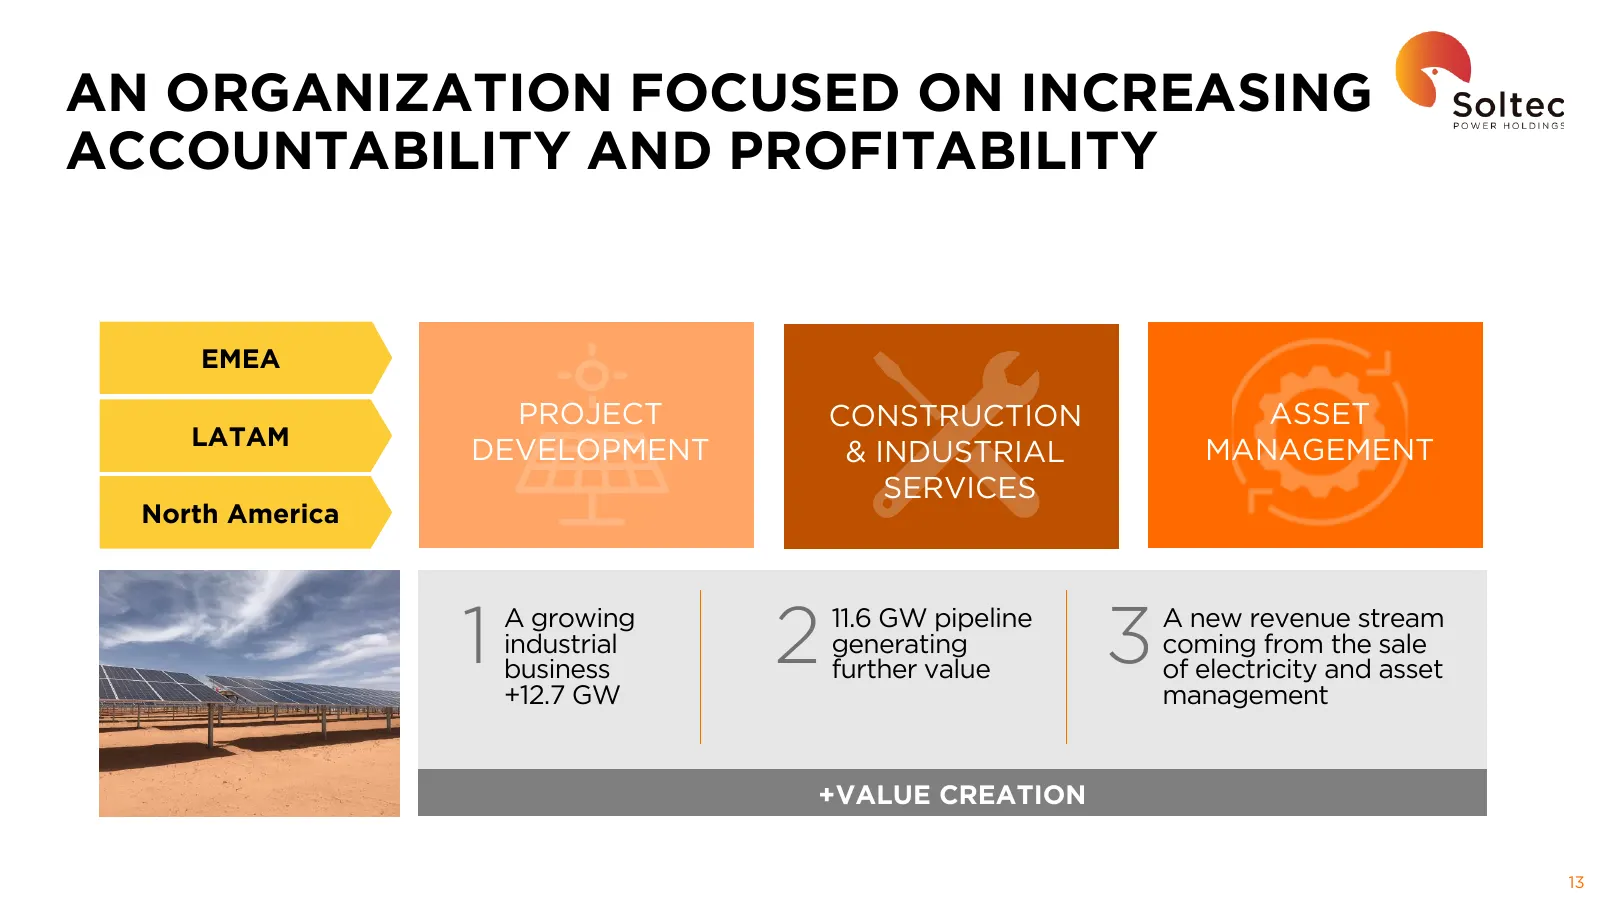
AN ORGANIZATION FOCUSED ON INCREASING ACCOUNTABILITY AND PROFITABILITY EMEA PROJECT CONSTRUCTION ASSET LATAM DEVELOPMENT & INDUSTRIAL MANAGEMENT SERVICES North America 1 A growing industrial business 2 11.6 GW pipeline generating further value 3 A new revenue stream coming from the sale of electrici
Slide 14: Key Takeaways
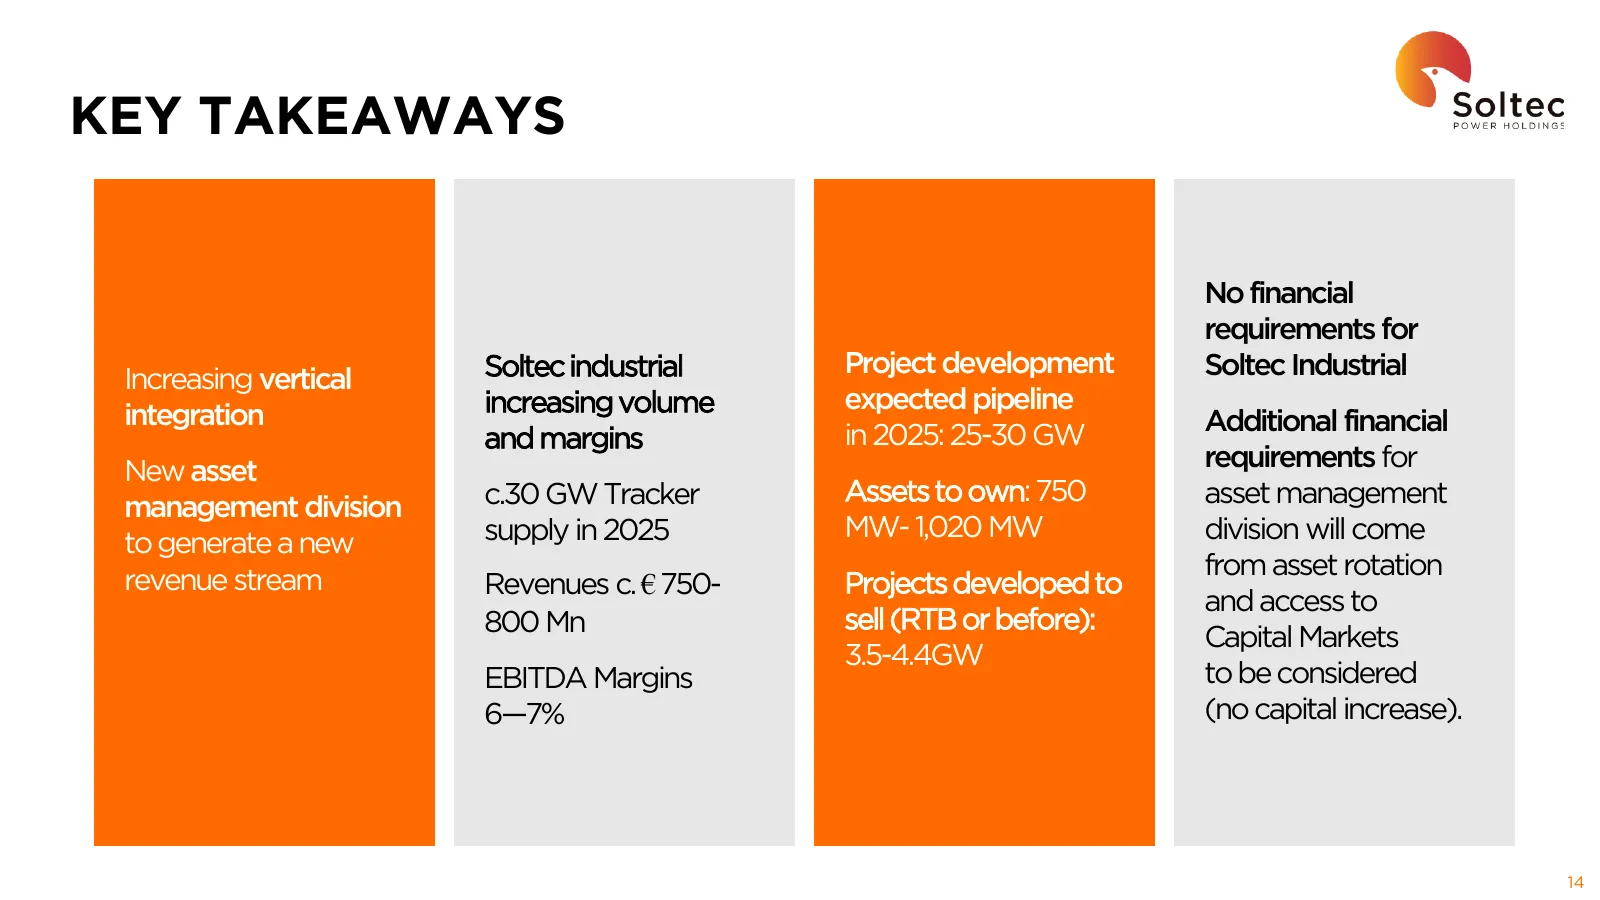
KEY TAKEAWAYS No financial requirements for Soltec industrial Project development Soltec Industrial Increasing vertical increasing volume expected pipeline integration Additional financial and margins in 2025: 25-30 GW New asset requirements for c.30 GW Tracker Assets to own: 750 asset management ma
Slide 15: Disclaimer
DISCLAIMER This document has been prepared by Soltec Power Holdings, S.A. ("Soltec" or the “Company”) exclusively for its use during the presentation of Soltec’s consolidated unaudited financial results for the first quarter presentation and the outlook of its business and strategy in the Capital Ma
Slide 16: Disclaimer
DISCLAIMER The information contained in this Presentation does not purport to be comprehensive and has not been independently verified. None of Soltec nor any of its subsidiaries or affiliates nor any of its directors, officers, employees, advisers or agents, accepts any responsibility or liability
Slide 17: Disclaimer
DISCLAIMER The presentation contains statements that may be considered "forward-looking statements" which are based on current expectations, projections and assumptions about future events. These statements can be identified with terms such as “believe”, “expect”, "foresee", "predict", "anticipate",
Source: Internet Archive copy of soltec.com
More decks from Soltec Power Holdings SA
 H1 2026 Earnings Presentation26 slides · September 2026
 H1 2026 Earnings Presentation26 slides · September 2026
 FY2025 Earnings Presentation37 slides · Mar 26, 2026
 H1 2024 Earnings Presentation54 slides · Feb 27, 2025
 Investor Presentation (April 2024)54 slides · April 2024
 FY2023 Earnings Presentation31 slides · Apr 1, 2024