W. R. Grace & — Investor Day (January 2016)
48 slides from W. R. Grace &'s investor day presentation, Jan 26, 2016
Slide 1: Investor Day Presentation January 26, 2016
Investor Day Presentation January 26, 2016 Innovative. Performance Driven. Focused.
Slide 2: Safe Harbor Statement under the Private Securities Litigation Reform Act of 1995
Safe Harbor Statement under the Private Securities Litigation Reform Act of 1995 This presentation contains forward-looking statements, that is, information related to future, not past, events. Such statements generally include the words “believes,” “plans,” “intends,” “targets,” “will,” “expects,”
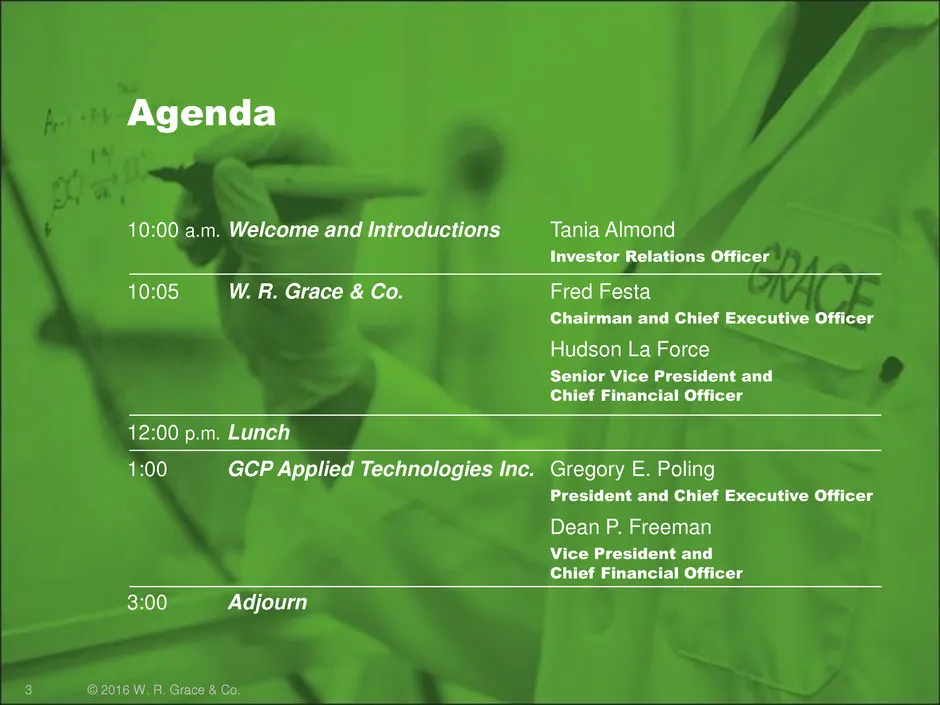
Slide 3: Agenda
Agenda 10:00 a.m. Welcome and Introductions Tania Almond Investor Relations Officer 10:05 W. R. Grace & Co. Fred Festa Chairman and Chief Executive Officer Hudson La Force Senior Vice President and Chief Financial Officer 12:00 p.m. Lunch 1:00 GCP Applied Technologies Inc. Gregory E. Poling Presiden

Slide 4: Separation Transaction
Separation Transaction 4 © 2016 W. R. Grace & Co.
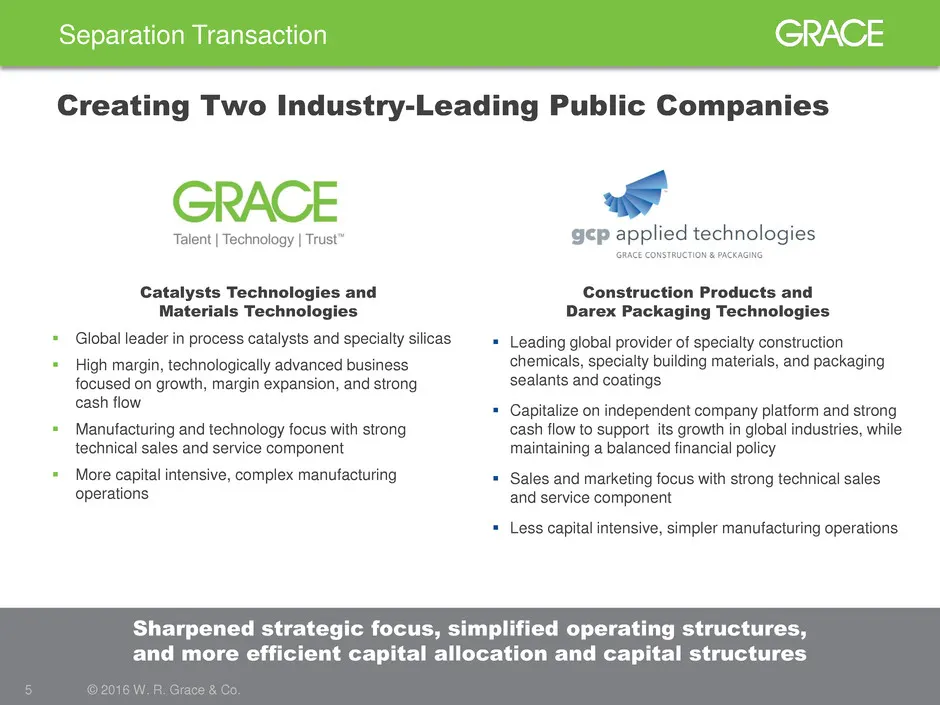
Slide 5: Creating Two Industry-Leading Public Companies
Separation Transaction 5 © 2016 W. R. Grace & Co. Construction Products and Darex Packaging Technologies Leading global provider of specialty construction chemicals, specialty building materials, and packaging sealants and coatings Capitalize on independent company platform and strong cash flow
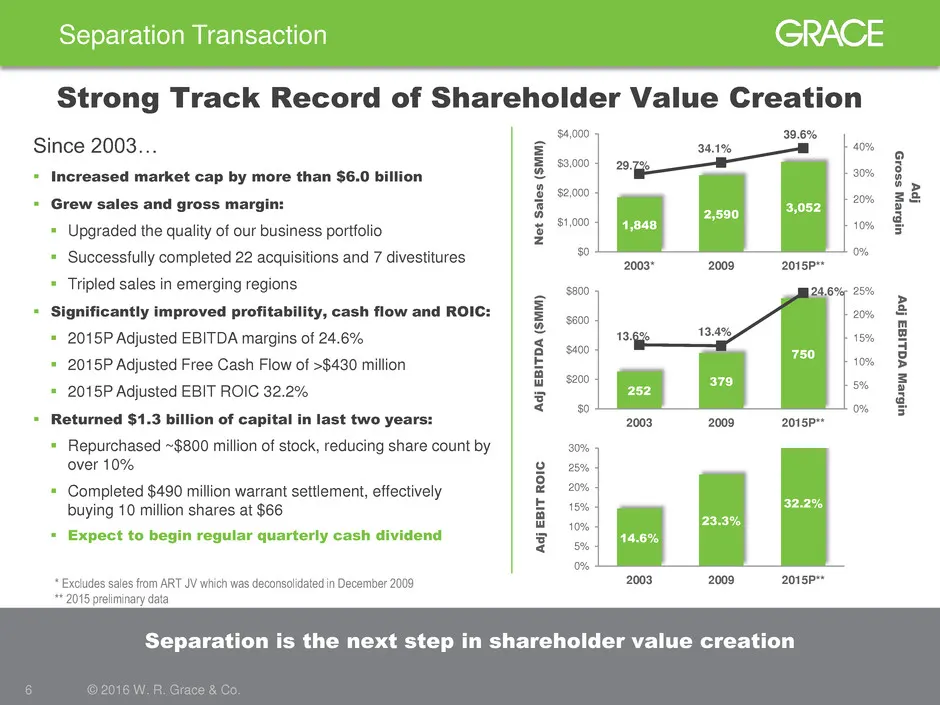
Slide 6: Separation is the next step in shareholder value creation
Separation Transaction 6 © 2016 W. R. Grace & Co. Separation is the next step in shareholder value creation Strong Track Record of Shareholder Value Creation Since 2003… Increased market cap by more than $6.0 billion Grew sales and gross margin: Upgraded the quality of our business portfolio
Slide 7: Compelling Rationale for Spin-Off
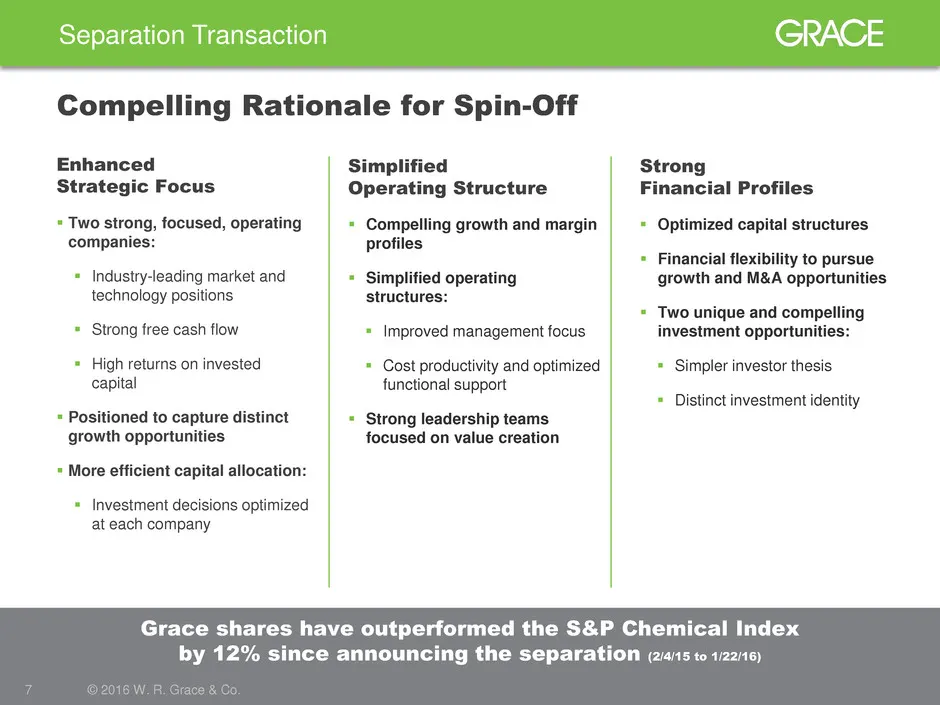
Separation Transaction 7 © 2016 W. R. Grace & Co. Grace shares have outperformed the S&P Chemical Index by 12% since announcing the separation (2/4/15 to 1/22/16) Compelling Rationale for Spin-Off Simplified Operating Structure Compelling growth and margin profiles Simplified operating structure
Slide 8: Transaction Overview
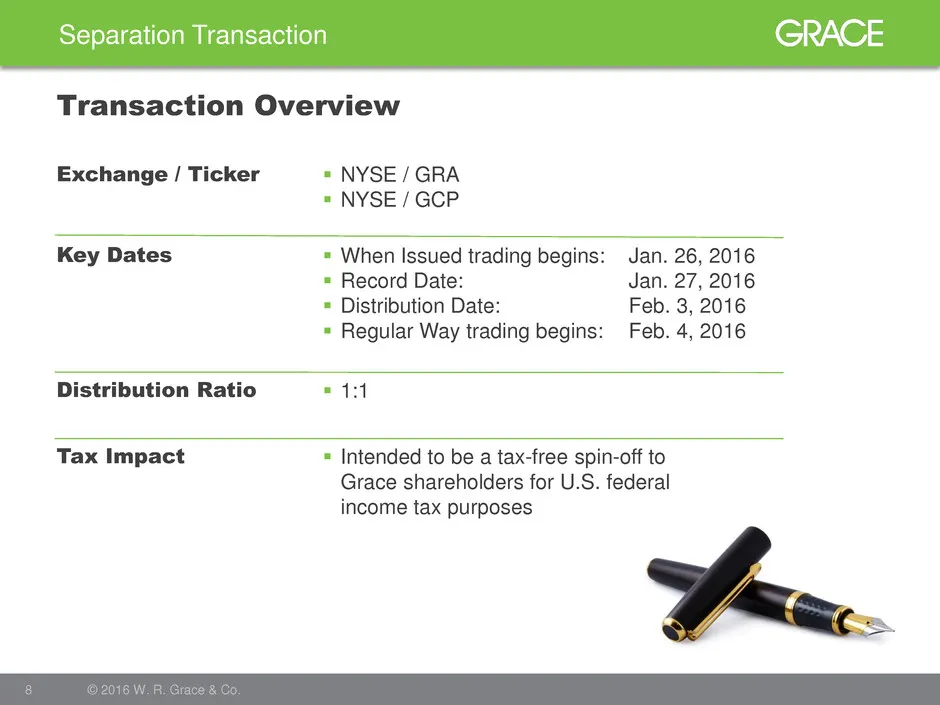
Separation Transaction 8 © 2016 W. R. Grace & Co. Transaction Overview Exchange / Ticker Key Dates Distribution Ratio Tax Impact NYSE / GRA NYSE / GCP When Issued trading begins: Jan. 26, 2016 Record Date: Jan. 27, 2016 Distribution Date: Feb. 3, 2016 Regular Way trading begins: Feb. 4,
Slide 9: 2016 Outlook And Valuation
2016 Outlook And Valuation 9 © 2016 W. R. Grace & Co.
Slide 10: 2016 Outlook and Valuation
Focused. Performance Driven. Innovative. 10 © 2016 W. R. Grace & Co. 2016 Outlook and Valuation
Slide 11: Old Grace Track Record Against 5-Year Framework 2014-2018
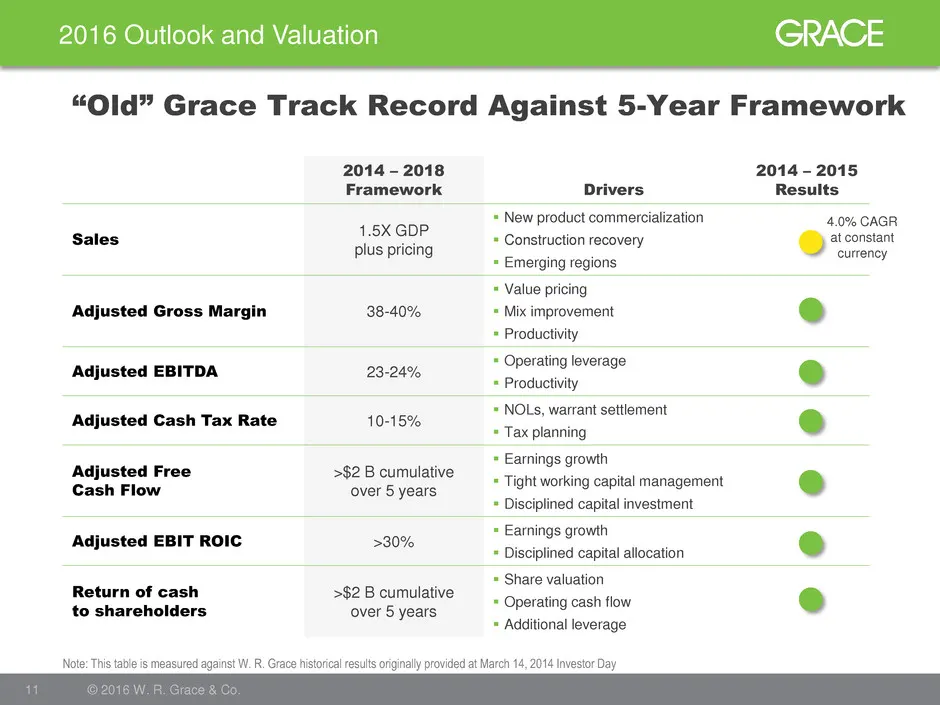
2016 Outlook and Valuation 11 © 2016 W. R. Grace & Co. “Old” Grace Track Record Against 5-Year Framework 2014 – 2018 Framework Drivers 2014 – 2015 Results Sales 1.5X GDP plus pricing New product commercialization Construction recovery Emerging regions Adjusted Gross Margin 38-40% Value prici
Slide 12: 2015 Results and 2016 Combined Outlook
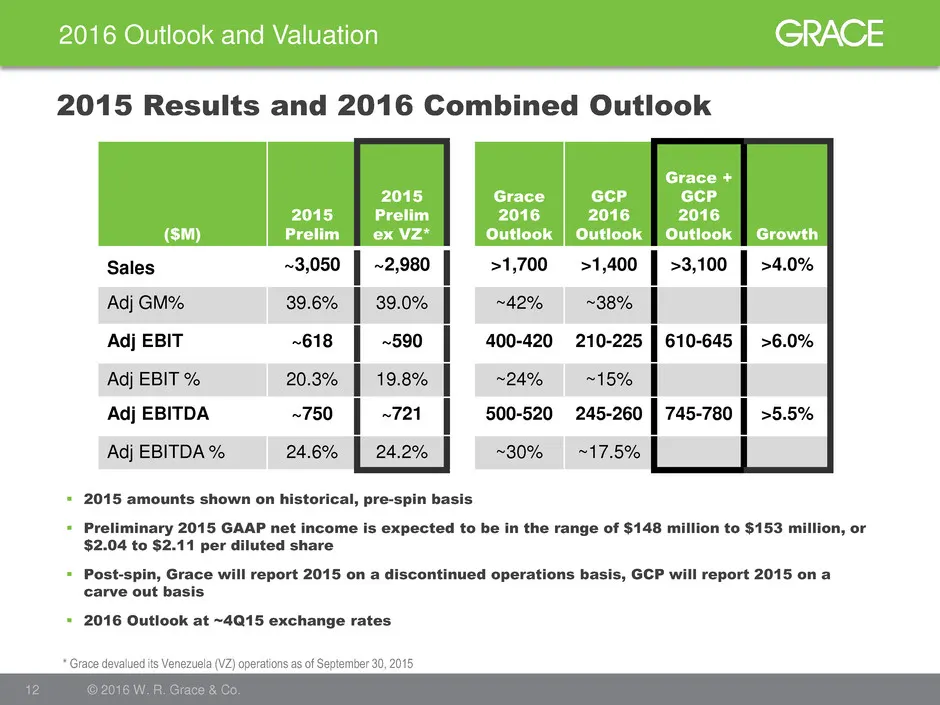
2016 Outlook and Valuation 12 © 2016 W. R. Grace & Co. 2015 Results and 2016 Combined Outlook ($M) 2015 Prelim 2015 Prelim ex VZ* Grace 2016 Outlook GCP 2016 Outlook Grace + GCP 2016 Outlook Growth Sales ~3,050 ~2,980 >1,700 >1,400 >3,100 >4.0% Adj GM% 39.6% 39.0% ~42% ~38% Adj EBIT ~618 ~590 400-42
Slide 13: We use our 2016 outlook range for valuation
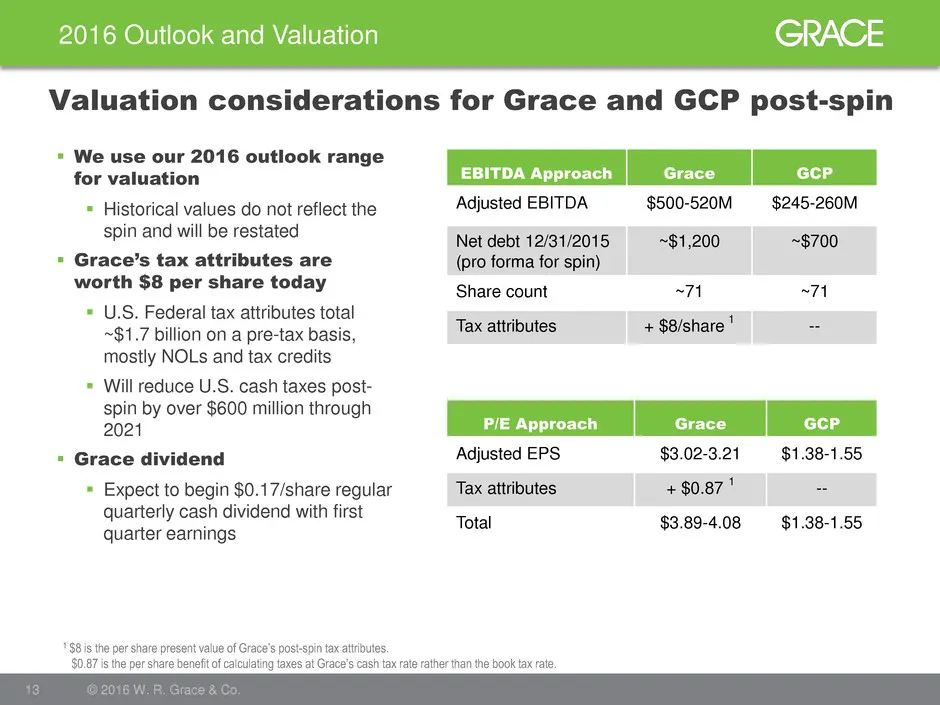
2016 Outlook and Valuation 13 © 2016 W. R. Grace & Co. We use our 2016 outlook range for valuation Historical values do not reflect the spin and will be restated Grace’s tax attributes are worth $8 per share today U.S. Federal tax attributes total ~$1.7 billion on a pre-tax basis, mostly NOL
Slide 14: Strategic Direction
Strategic Direction 14 © 2016 W. R. Grace & Co.
Slide 15: We are a $2 Billion Technology Leader
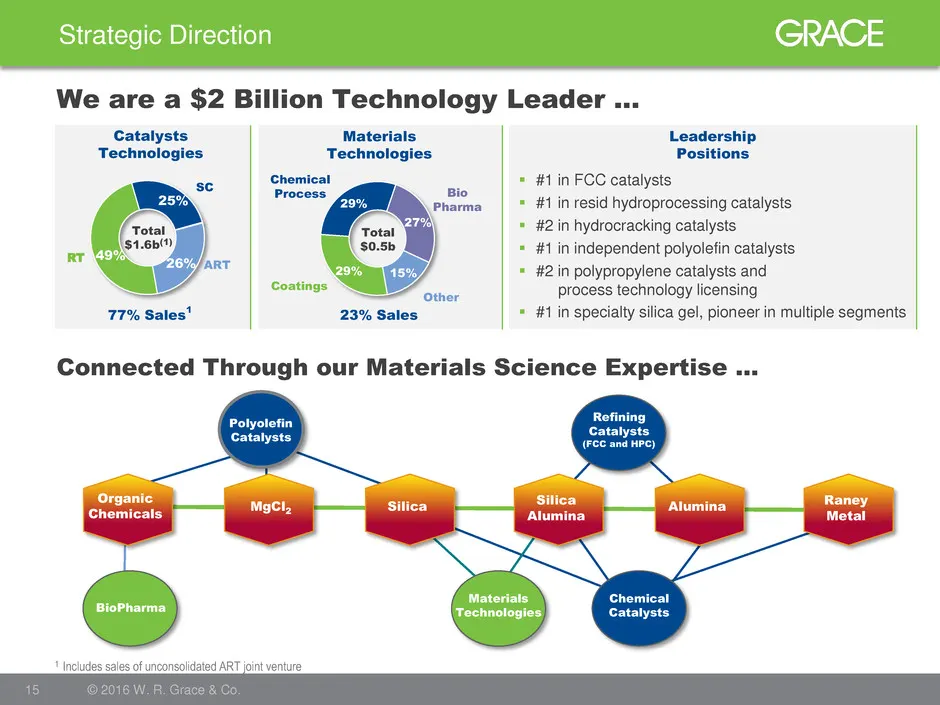
Strategic Direction 15 © 2016 W. R. Grace & Co. We are a $2 Billion Technology Leader … SC RT 25% 49% 26% Total $1.6b(1) 29% 29% 27% 15% Total $0.5b Coatings Other Bio Pharma Chemical Process Catalysts Technologies Materials Technologies 77% Sales 1 23% Sales 1 Includes sales of unconsolidated ART j
Slide 16: Winning Strategic Positions in Both Segments
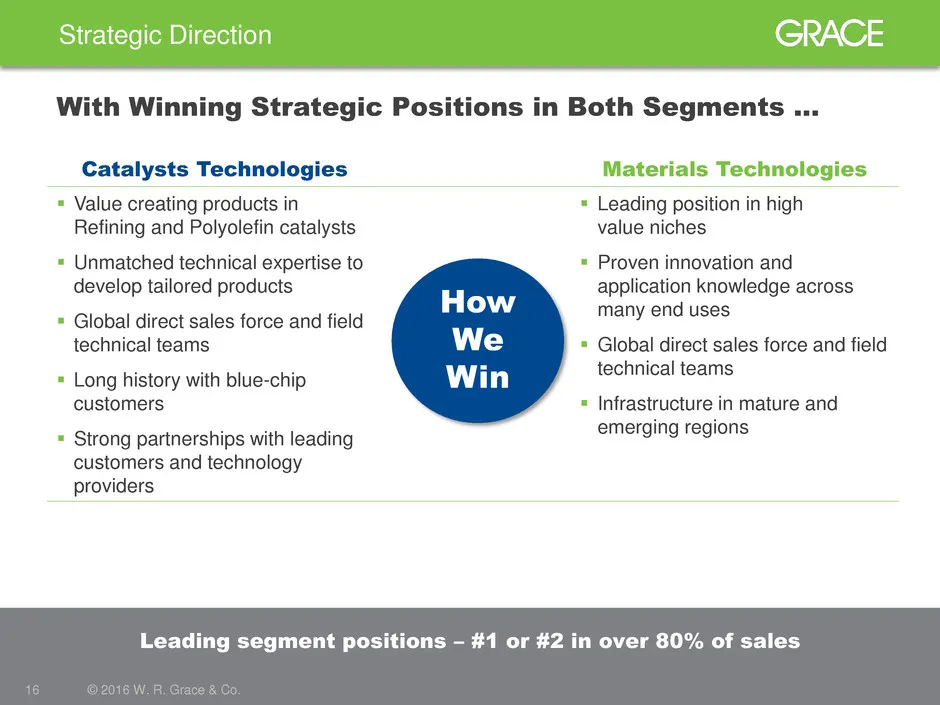
Catalysts Technologies Materials Technologies Value creating products in Refining and Polyolefin catalysts Unmatched technical expertise to develop tailored products Global direct sales force and field technical teams Long history with blue-chip customers Strong partnerships with leading c
Slide 17: Focused on Value
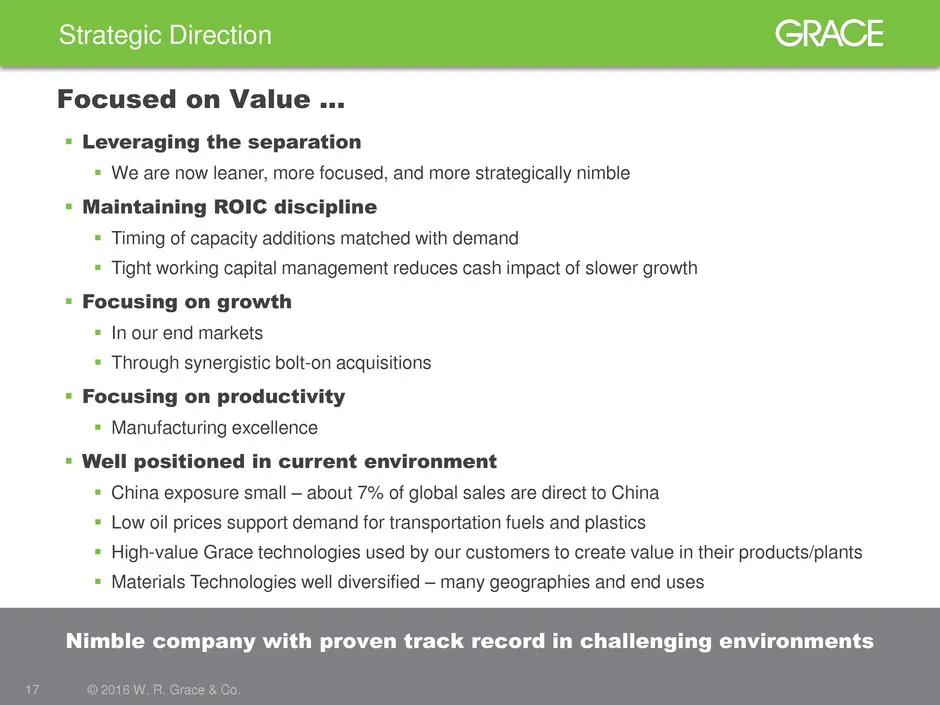
Nimble company with proven track record in challenging environments Strategic Direction 17 © 2016 W. R. Grace & Co. Focused on Value … Leveraging the separation We are now leaner, more focused, and more strategically nimble Maintaining ROIC discipline Timing of capacity additions matched wit
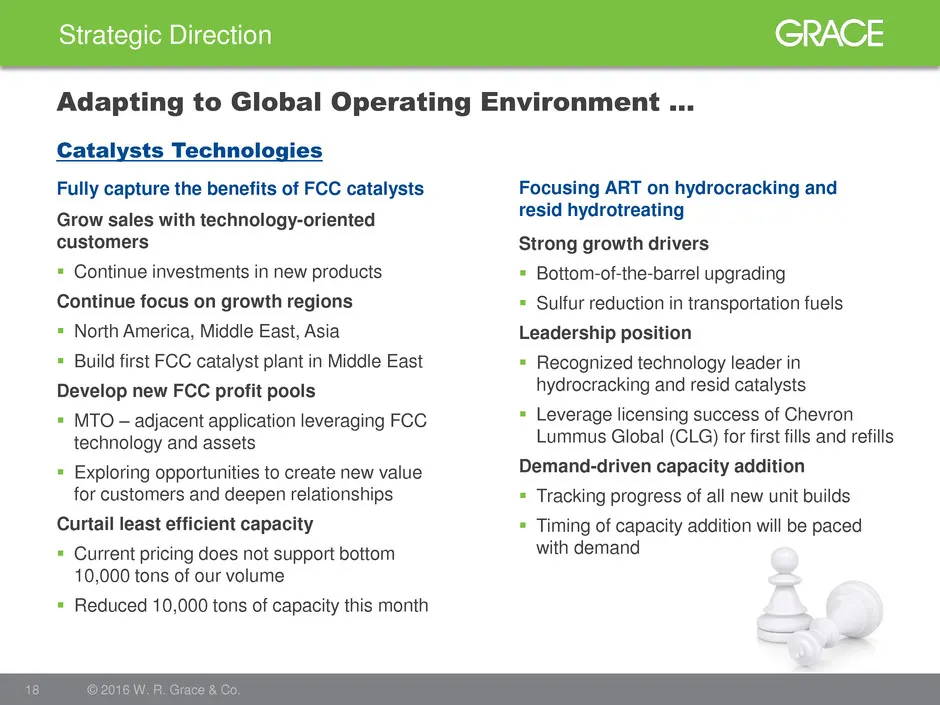
Slide 18: Adapting to Global Operating Environment: Catalysts Technologies
Strategic Direction 18 © 2016 W. R. Grace & Co. Adapting to Global Operating Environment … Catalysts Technologies Fully capture the benefits of FCC catalysts Grow sales with technology-oriented customers Continue investments in new products Continue focus on growth regions North America, Middle
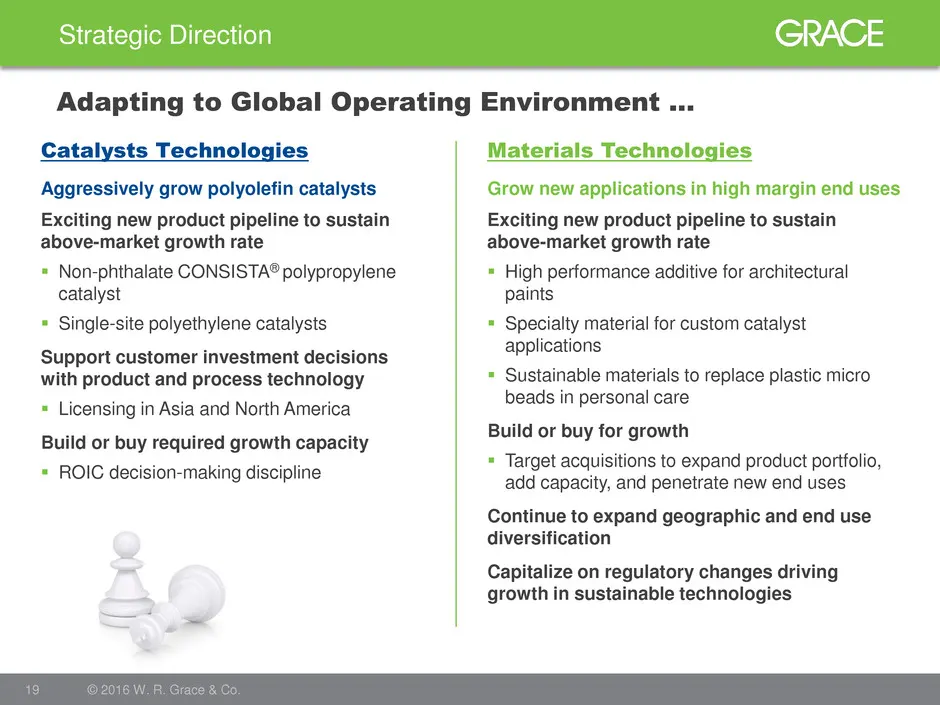
Slide 19: Adapting to Global Operating Environment: Growth Applications
Strategic Direction 19 © 2016 W. R. Grace & Co. Adapting to Global Operating Environment … Catalysts Technologies Grow new applications in high margin end uses Materials Technologies Exciting new product pipeline to sustain above-market growth rate High performance additive for architectural paint
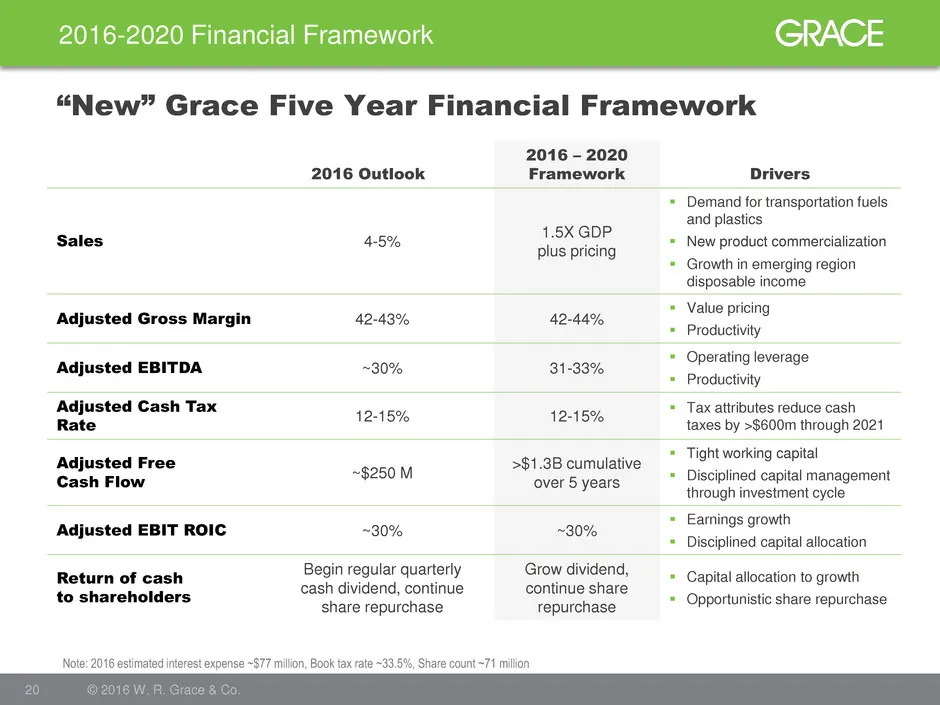
Slide 20: 2016-2020 Financial Framework
2016-2020 Financial Framework 20 © 2016 W. R. Grace & Co. “New” Grace Five Year Financial Framework 2016 Outlook 2016 – 2020 Framework Drivers Sales 4-5% 1.5X GDP plus pricing Demand for transportation fuels and plastics New product commercialization Growth in emerging region disposable income
Slide 21: Business Overview
Business Overview 21 © 2016 W. R. Grace & Co.
Slide 22: Catalysts Technologies: Large Global Opportunity
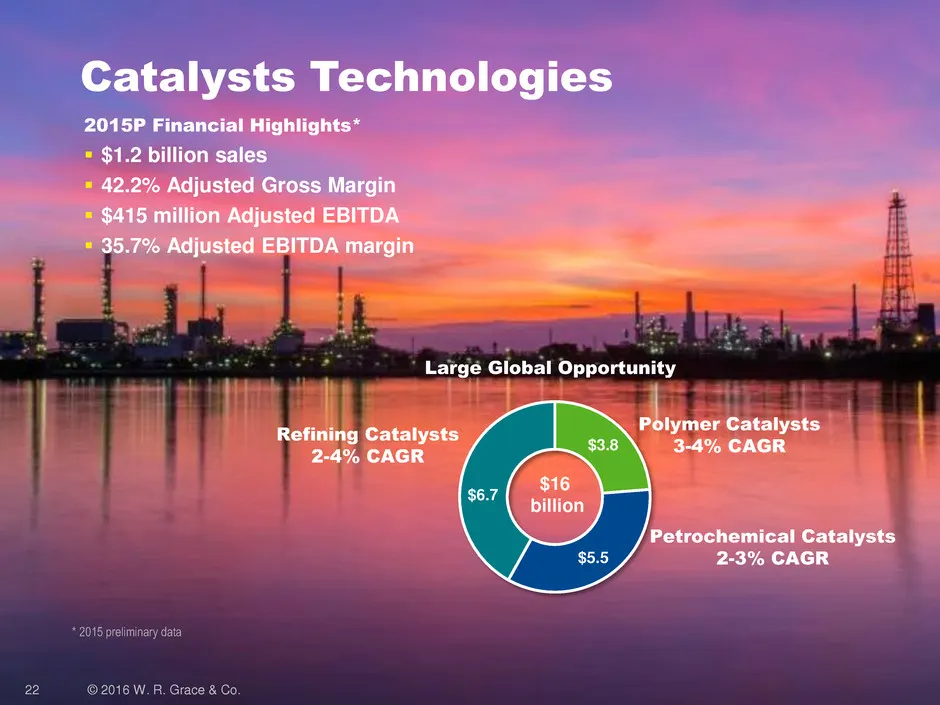
22 © 2016 W. R. Grace & Co. Catalysts Technologies $3.8 $5.5 $6.7 Polymer Catalysts 3-4% CAGR Refining Catalysts 2-4% CAGR Petrochemical Catalysts 2-3% CAGR $16 billion 2015P Financial Highlights* $1.2 billion sales 42.2% Adjusted Gross Margin $415 million Adjusted EBITDA 35.7% Adjusted EBIT
Slide 23: Catalysts Technologies Financial Overview
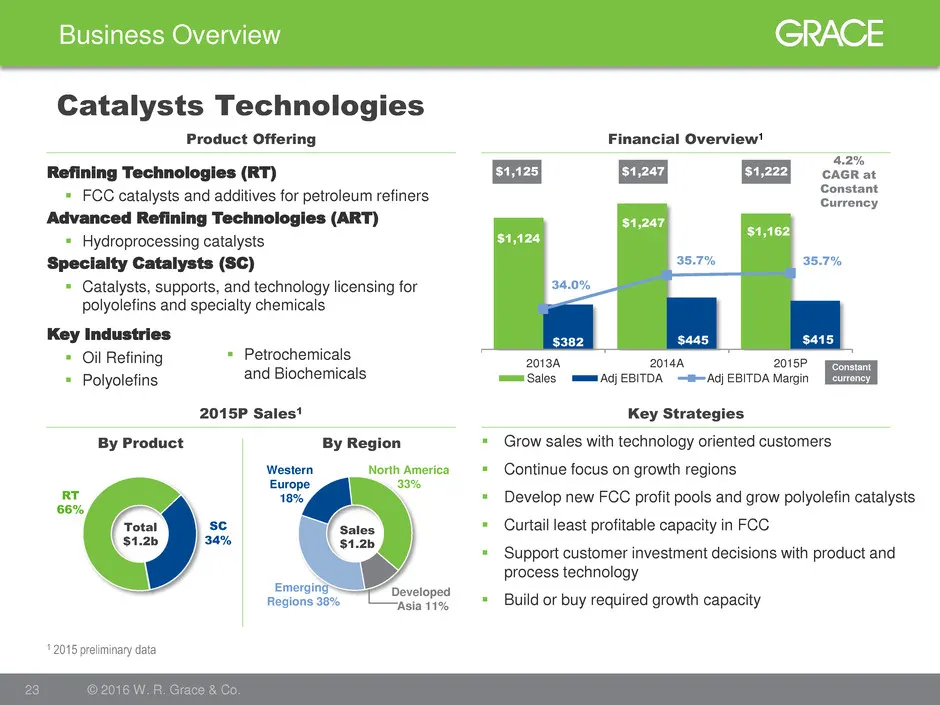
$1,124 $1,247 $1,162 $382 $445 $415 34.0% 35.7% 35.7% 2013A 2014A 2015P Sales Adj EBITDA Adj EBITDA Margin Key Industries Oil Refining Polyolefins SC 34% RT 66% North America 33% Emerging Regions 38% Developed Asia 11% Western Europe 18% Business Overview 23 © 2016 W. R. Grace & Co. Catalysts Te
Slide 24: A strong portfolio getting stronger
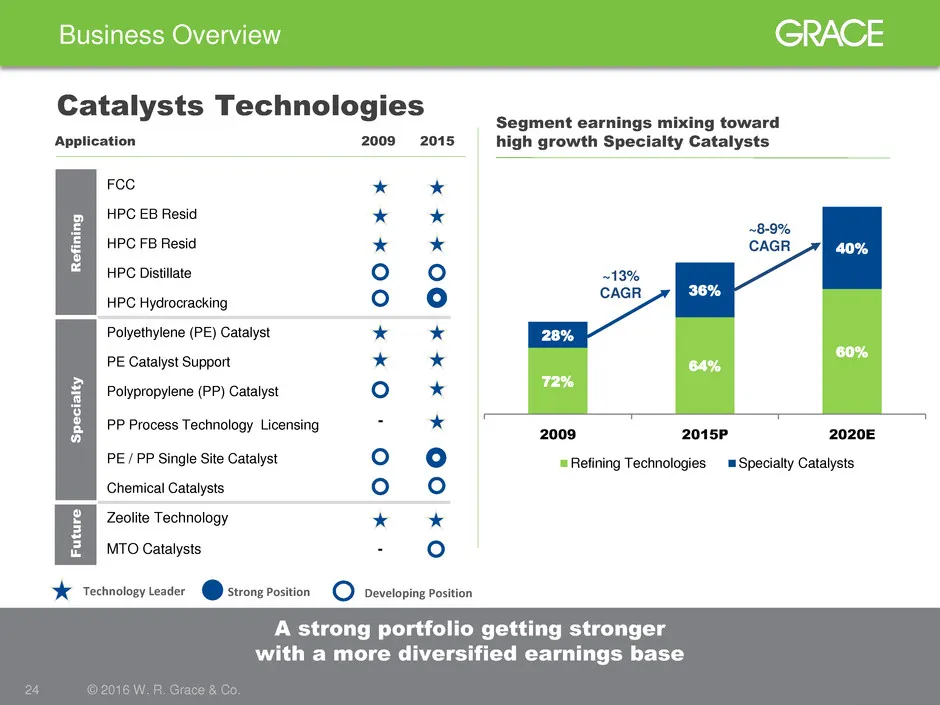
72% 64% 60% 28% 36% 40% 2009 2015P 2020E Refining Technologies Specialty Catalysts A strong portfolio getting stronger with a more diversified earnings base Business Overview 24 © 2016 W. R. Grace & Co. Catalysts Technologies Application 2009 2015 R e fi n in g FCC HPC EB Resid HPC FB Resid HPC Dist
Slide 25: Materials Technologies: Large Global Opportunity
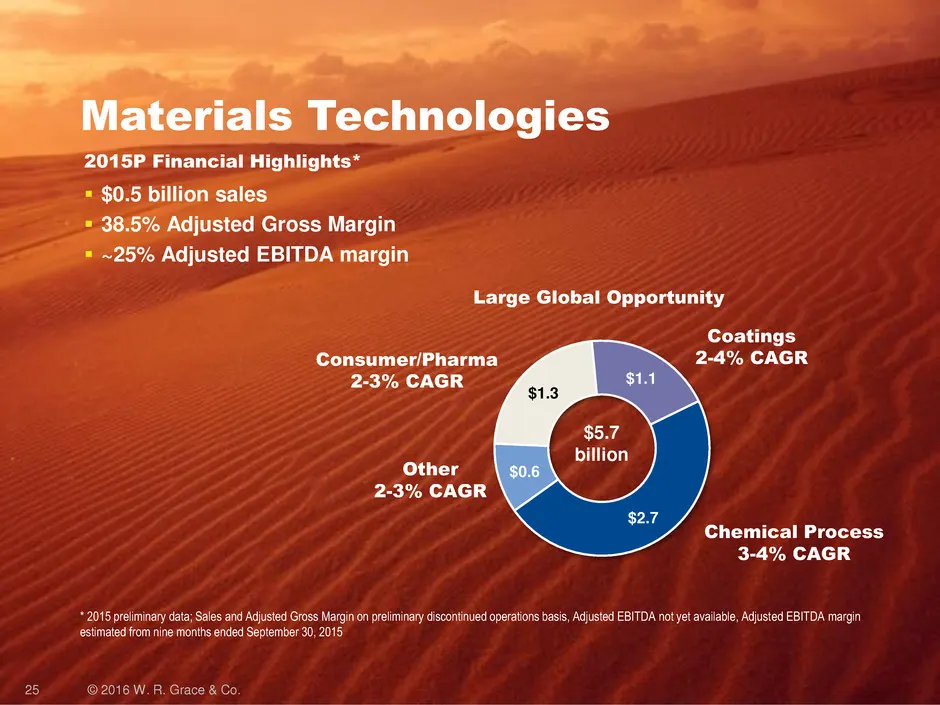
25 © 2016 W. R. Grace & Co. Materials Technologies Consumer/Pharma 2-3% CAGR Chemical Process 3-4% CAGR 2015P Financial Highlights* $0.5 billion sales 38.5% Adjusted Gross Margin ~25% Adjusted EBITDA margin $2.7 $0.6 $1.3 $1.1 $5.7 billion Other 2-3% CAGR Coatings 2-4% CAGR * 2015 preliminary
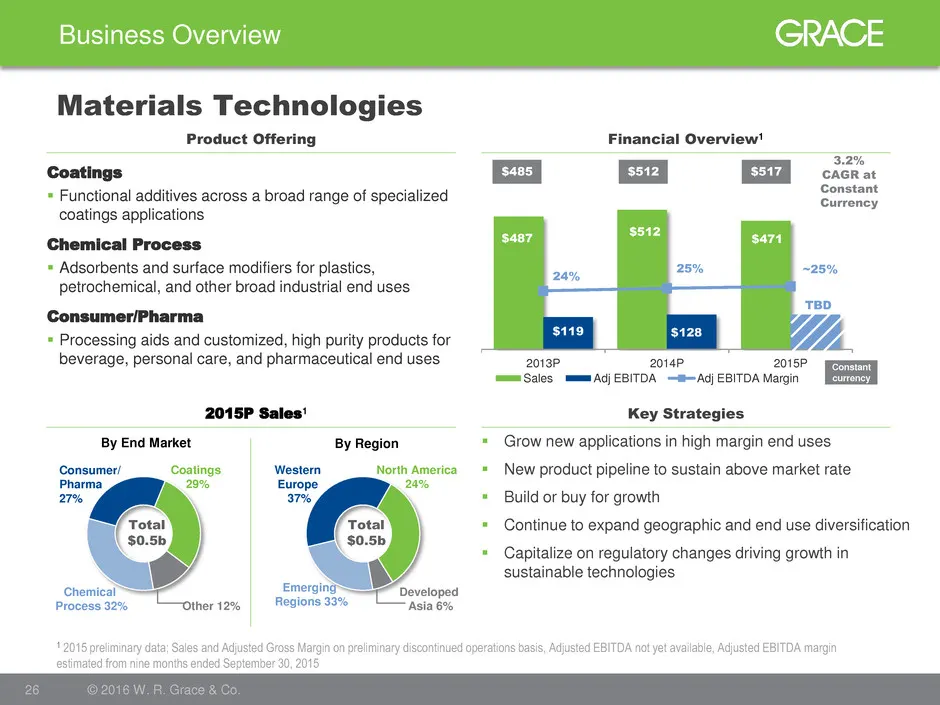
Slide 26: Materials Technologies Financial Overview
$487 $512 $471 $119 $128 $128 24% 25% ~25% 2013P 2014P 2015P Sales Adj EBITDA Adj EBITDA Margin Coatings 29% Chemical Process 32% Other 12% Consumer/ Pharma 27% North America 24% Emerging Regions 33% Developed Asia 6% Western Europe 37% Business Overview 26 © 2016 W. R. Grace & Co. Materials Technol
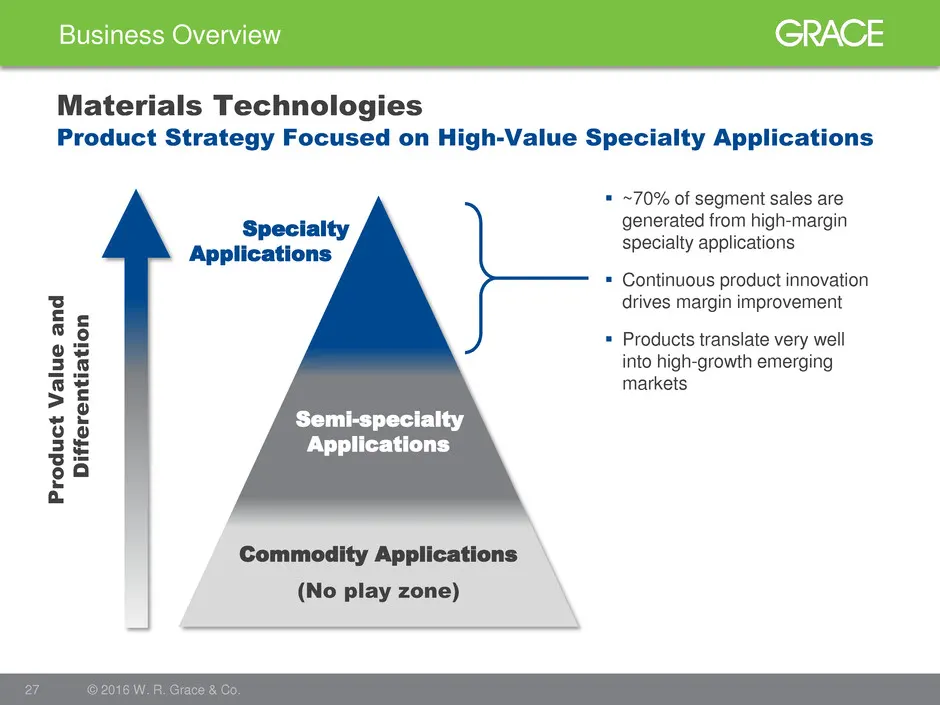
Slide 27: Focused on High-Value Specialty Applications
Business Overview 27 © 2016 W. R. Grace & Co. Materials Technologies Specialty Applications Semi-specialty Applications Commodity Applications Pro d u c t V alu e a n d D iff e re n tiatio n ~70% of segment sales are generated from high-margin specialty applications Continuous product innovation
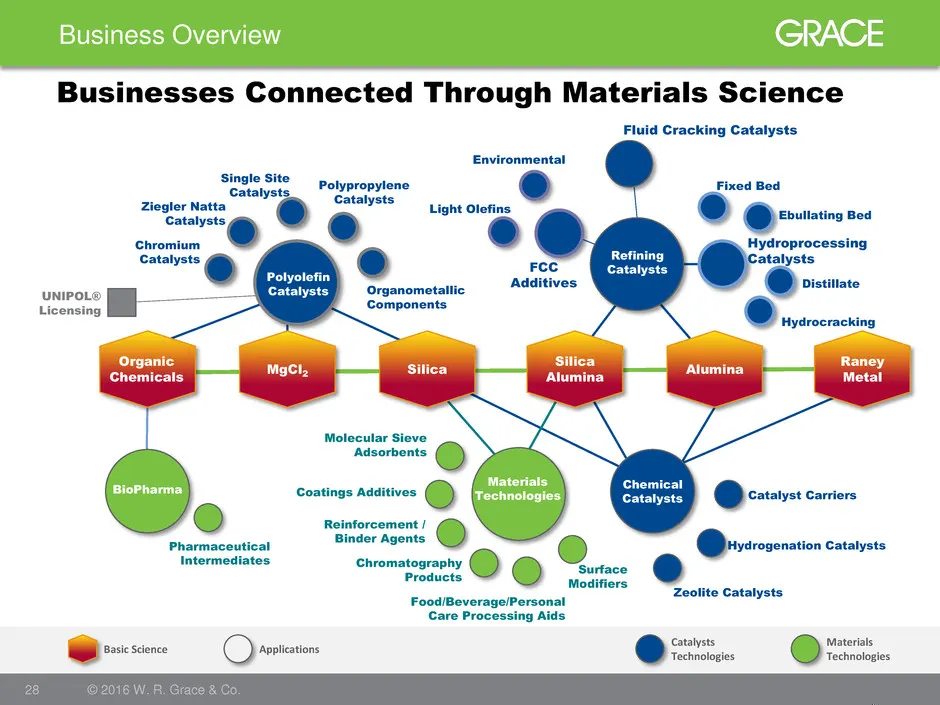
Slide 28: Businesses Connected Through Materials Science
Business Overview 28 © 2016 W. R. Grace & Co. Applications Basic Science Organic Chemicals MgCl2 Silica Silica Alumina Alumina Raney Metal BioPharma Chemical Catalysts Materials Technologies Polyolefin Catalysts Refining Catalysts Pharmaceutical Intermediates Molecular Sieve Adsorbents Coatings Addi
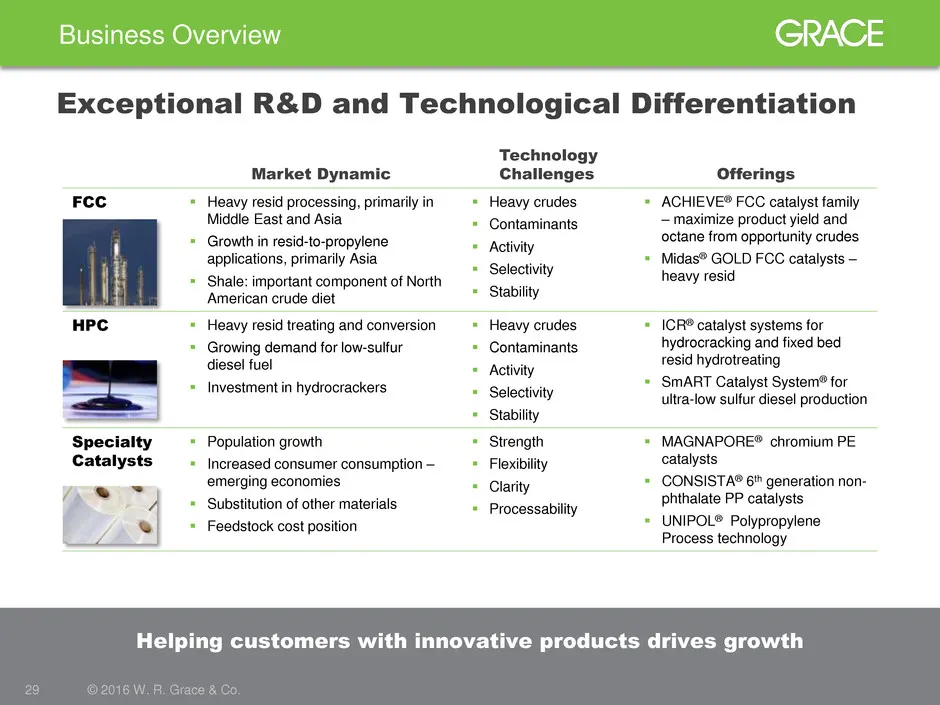
Slide 29: Exceptional R&D and Technological Differentiation
Business Overview 29 © 2016 W. R. Grace & Co. Exceptional R&D and Technological Differentiation Market Dynamic Technology Challenges Offerings FCC Heavy resid processing, primarily in Middle East and Asia Growth in resid-to-propylene applications, primarily Asia Shale: important component of N
Slide 30: Helping customers with innovative products drives growth
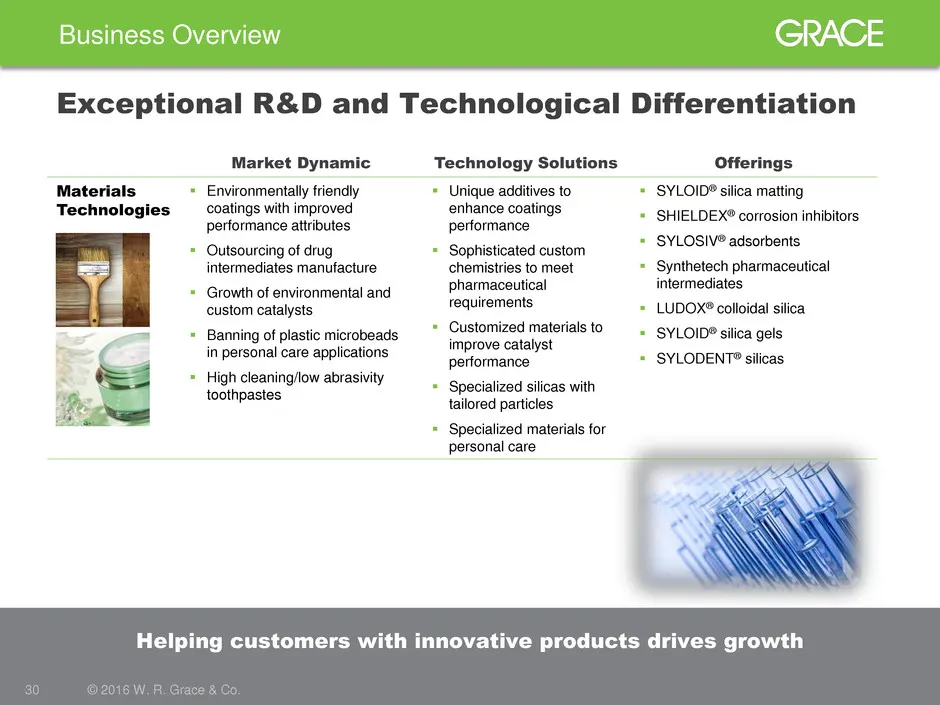
Business Overview 30 © 2016 W. R. Grace & Co. Market Dynamic Technology Solutions Offerings Materials Technologies Environmentally friendly coatings with improved performance attributes Outsourcing of drug intermediates manufacture Growth of environmental and custom catalysts Banning of plas
Slide 31: High Margin Organic Investment Opportunities
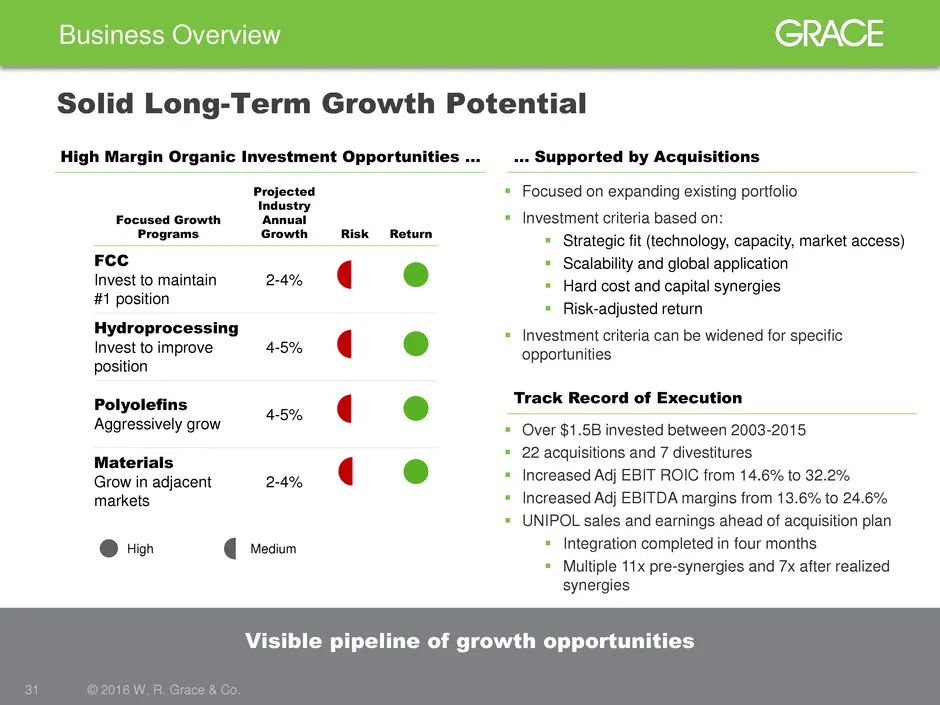
High Margin Organic Investment Opportunities … Business Overview 31 © 2016 W. R. Grace & Co. Visible pipeline of growth opportunities Focused Growth Programs Projected Industry Annual Growth Risk Return FCC Invest to maintain #1 position 2-4% Hydroprocessing Invest to improve position 4-5% Polyolefi
Slide 32: New Grace a Leaner, Less Complex Business to Operate
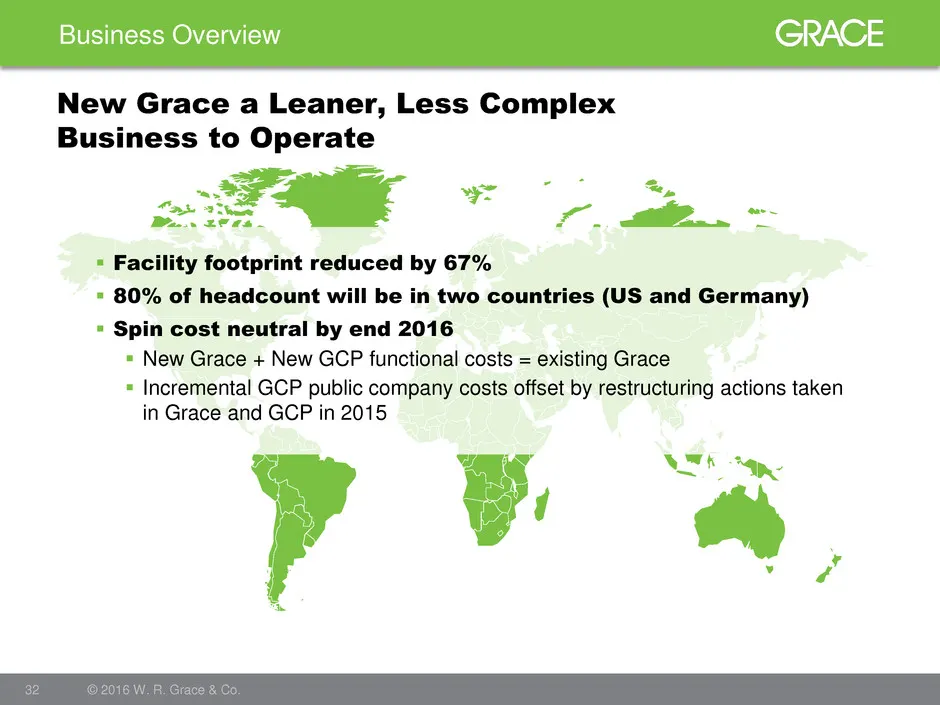
Business Overview 32 © 2016 W. R. Grace & Co. New Grace a Leaner, Less Complex Business to Operate Facility footprint reduced by 67% 80% of headcount will be in two countries (US and Germany) Spin cost neutral by end 2016 New Grace + New GCP functional costs = existing Grace Incremental GC

Slide 33: Capital Allocation and Structure
Capital Allocation and Structure 33 © 2016 W. R. Grace & Co.
Slide 34: Disciplined Capital Allocation Approach
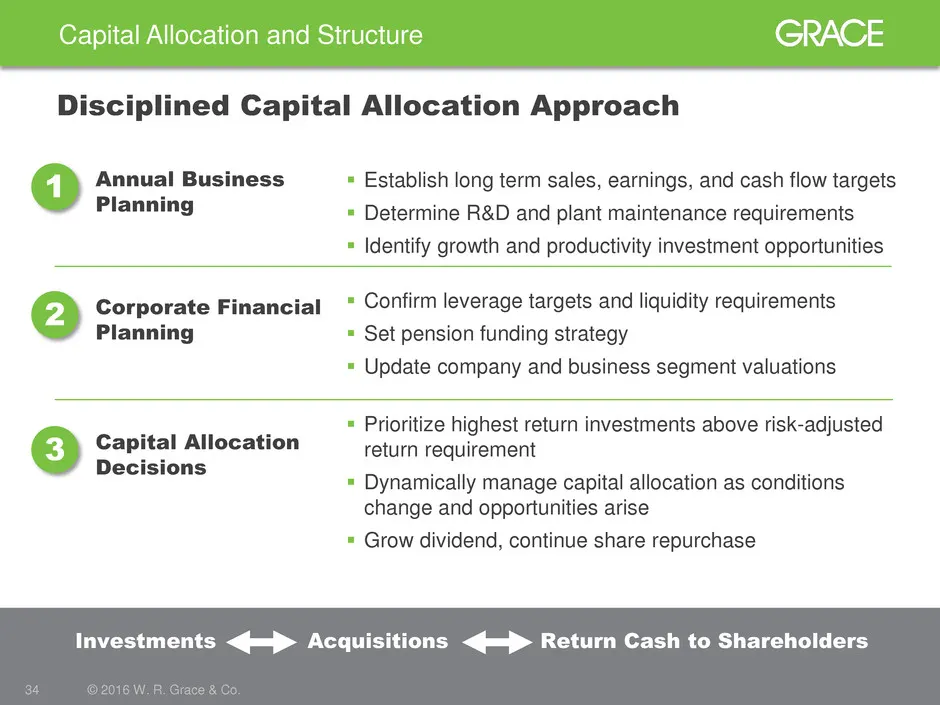
Capital Allocation and Structure 34 © 2016 W. R. Grace & Co. Disciplined Capital Allocation Approach Annual Business Planning Corporate Financial Planning Capital Allocation Decisions Confirm leverage targets and liquidity requirements Set pension funding strategy Update company and business s
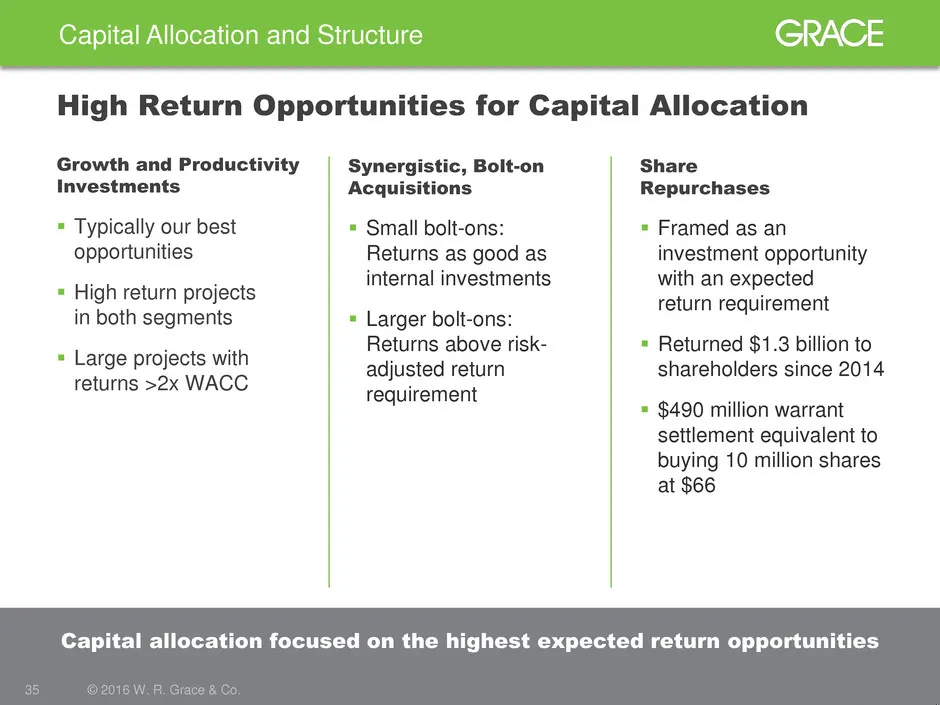
Slide 35: Capital allocation focused on highest expected return opportunities
Capital Allocation and Structure 35 © 2016 W. R. Grace & Co. Capital allocation focused on the highest expected return opportunities High Return Opportunities for Capital Allocation Synergistic, Bolt-on Acquisitions Small bolt-ons: Returns as good as internal investments Larger bolt-ons: Returns
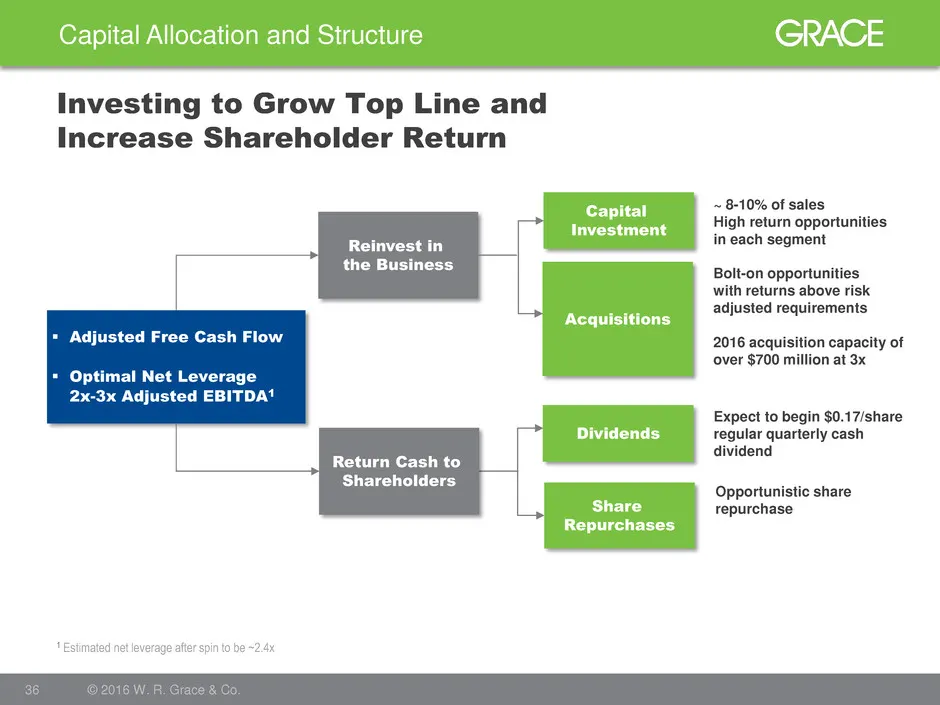
Slide 36: Investing to Grow Top Line and Increase Shareholder Return
Capital Allocation and Structure 36 © 2016 W. R. Grace & Co. Investing to Grow Top Line and Increase Shareholder Return Adjusted Free Cash Flow Optimal Net Leverage 2x-3x Adjusted EBITDA1 Reinvest in the Business Capital Investment Acquisitions Share Repurchases Dividends ~ 8-10% of sales High r
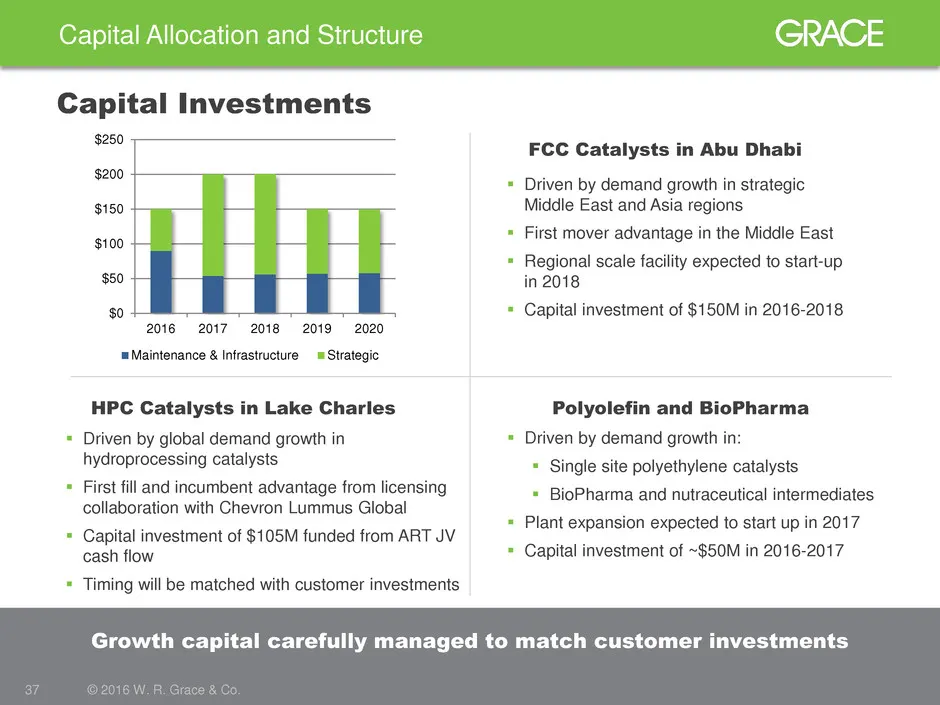
Slide 37: Growth capital carefully managed to match customer investments
Capital Allocation and Structure 37 © 2016 W. R. Grace & Co. Growth capital carefully managed to match customer investments Capital Investments Driven by demand growth in strategic Middle East and Asia regions First mover advantage in the Middle East Regional scale facility expected to start-u
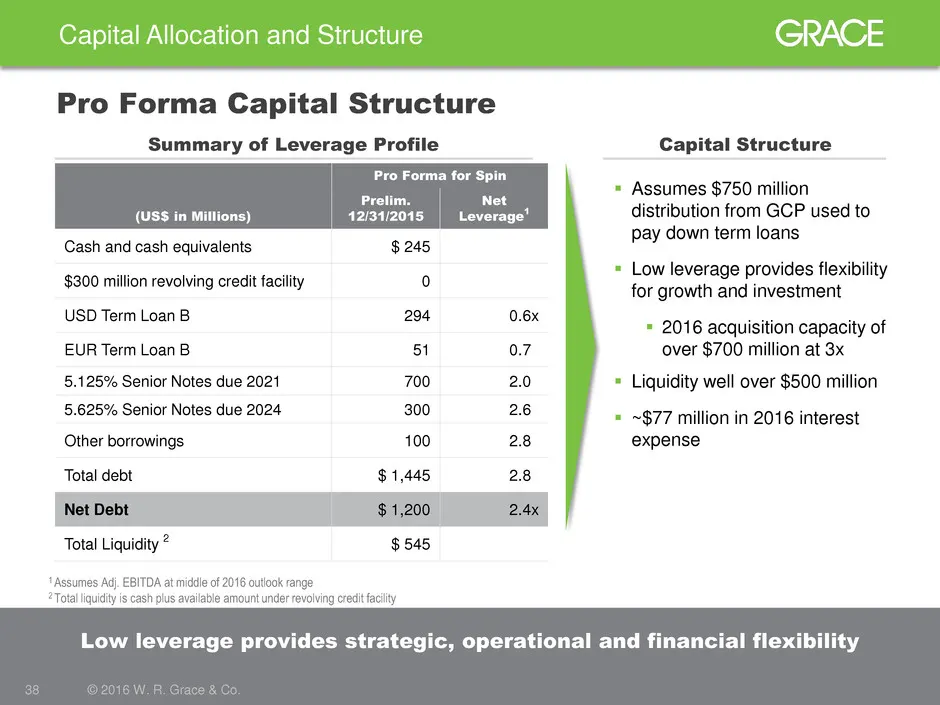
Slide 38: Low leverage provides strategic, operational and financial flexibility
Capital Allocation and Structure 38 © 2016 W. R. Grace & Co. Low leverage provides strategic, operational and financial flexibility Pro Forma Capital Structure Summary of Leverage Profile Assumes $750 million distribution from GCP used to pay down term loans Low leverage provides flexibility for
Slide 39: Strong, Clean Balance Sheet
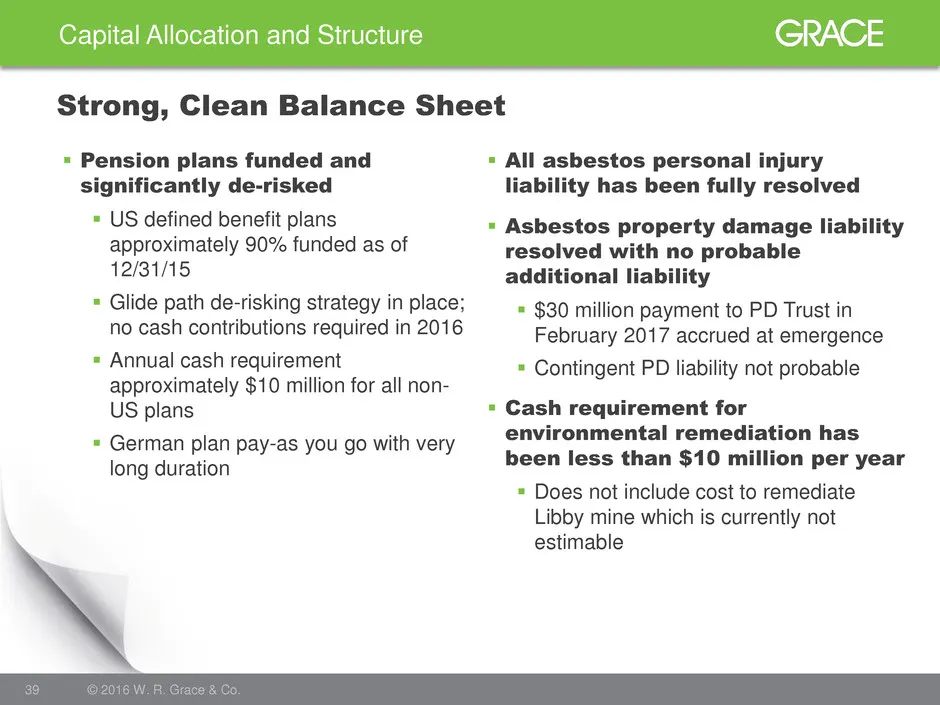
39 © 2016 W. R. Grace & Co. Strong, Clean Balance Sheet All asbestos personal injury liability has been fully resolved Asbestos property damage liability resolved with no probable additional liability $30 million payment to PD Trust in February 2017 accrued at emergence Contingent PD liabili
Slide 40: Summary
Summary 40 © 2016 W. R. Grace & Co.
Slide 41: Unique strategic position, track record, and profitability make Grace a compelling investment
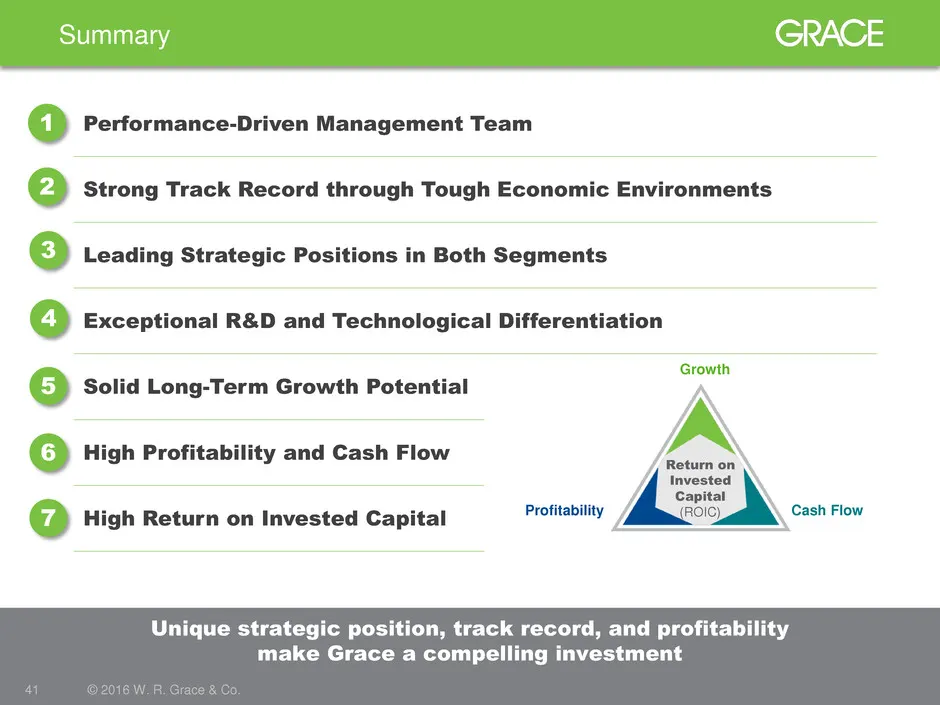
Performance-Driven Management Team Strong Track Record through Tough Economic Environments Leading Strategic Positions in Both Segments Exceptional R&D and Technological Differentiation Solid Long-Term Growth Potential High Profitability and Cash Flow High Return on Invested Capital Summary 41 © 201
Slide 42: Focused. Performance Driven. Innovative.
Focused. Performance Driven. Innovative. 42 © 2016 W. R. Grace & Co.
Slide 43: For more information visit grace.com or contact
43 © 2016 W. R. Grace & Co. For more information visit grace.com or contact: Tania Almond Investor Relations Officer +1 410.531.4590 Tania.Almond@grace.com
Slide 44: Appendix
Appendix 44 © 2016 W. R. Grace & Co.
Slide 45: Materials Technologies: Additional Information
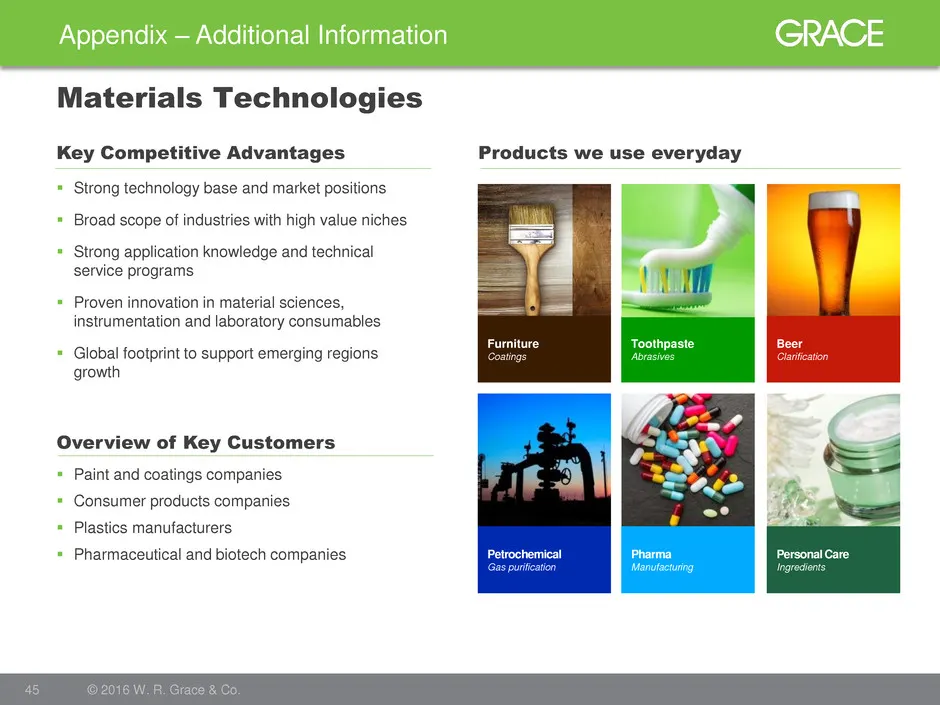
Appendix – Additional Information 45 © 2016 W. R. Grace & Co. Materials Technologies Strong technology base and market positions Broad scope of industries with high value niches Strong application knowledge and technical service programs Proven innovation in material sciences, instrumentatio
Slide 46: Materials Technologies - End Uses
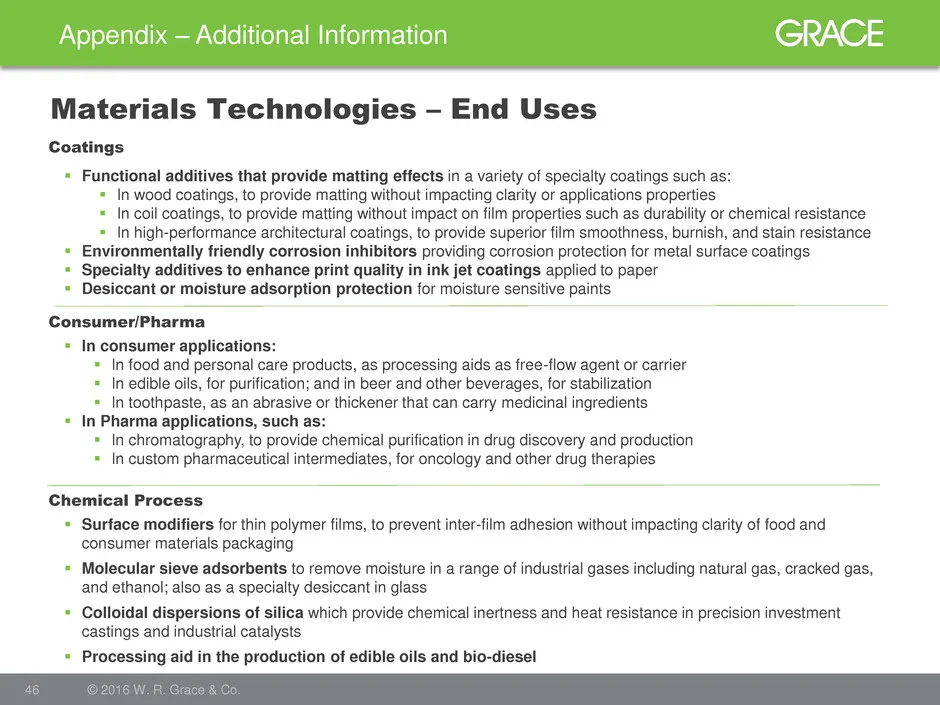
Appendix – Additional Information 46 © 2016 W. R. Grace & Co. Materials Technologies – End Uses Functional additives that provide matting effects in a variety of specialty coatings such as: In wood coatings, to provide matting without impacting clarity or applications properties In coil coatin
Slide 47: Trademark Notices
Appendix – Additional Information 47 © 2016 W. R. Grace & Co. Trademark Notices GRACE®, ACHIEVE®, MIDAS® GOLD, MAGNAPORE®, CONSISTA®, SmART Catalyst System® (Stylized), SYLOID®, SYLOBLOC®, LUDOX®, SYLOBEAD®, CBA®, ADVA®, HEA2®, DCI®, are trademarks, registered in the United States and/or other cou
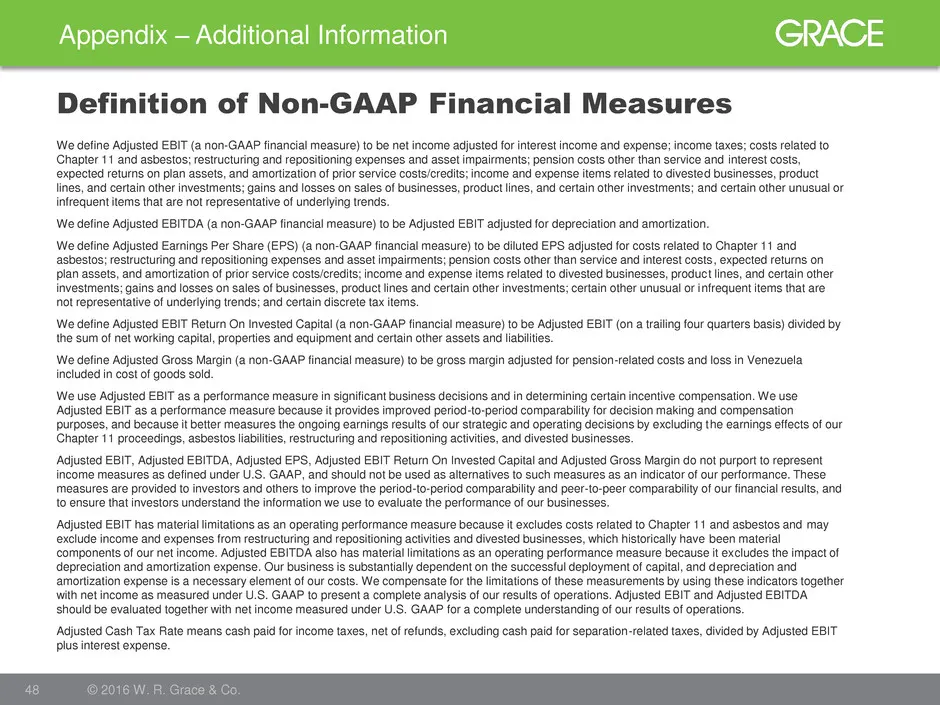
Slide 48: Definition of Non-GAAP Financial Measures
Appendix – Additional Information 48 © 2016 W. R. Grace & Co. Definition of Non-GAAP Financial Measures We define Adjusted EBIT (a non-GAAP financial measure) to be net income adjusted for interest income and expense; income taxes; costs related to Chapter 11 and asbestos; restructuring and repositi
Source: SEC EDGAR · 8-K filed Jan 26, 2016
More decks from W. R. Grace & Co
 Merger or Acquisition (February 2021)11 slides · Feb 26, 2021
 Investor Presentation (September 2020)27 slides · Sep 17, 2020
 Investor Presentation (August 2020)25 slides · Aug 26, 2020
 Investor Presentation (February 2020)25 slides · Feb 11, 2020
 Credit Suisse Basic Materials Conference 201922 slides · Sep 10, 2019
 Deutsche Bank Annual Global Industrials & Materials Summit 201920 slides · Jun 6, 2019