Azek — The AZEK Company — Q1 2023 Earnings Presentation
16 slides from Azek's earnings presentation, Feb 8, 2023
Slide 1: 1st Quarter FY 2023 Earnings Presentation
1st Quarter FY 2023 Earnings Presentation February 8, 2023
Slide 2: Disclaimer
DISCLAIMER Important Notice This presentation contains “forward-looking statements” within the meaning of federal securities laws, including the safe harbor provisions of the United States Private Securities Litigation Reform Act of 1995. All statements other than statements of historical facts cont
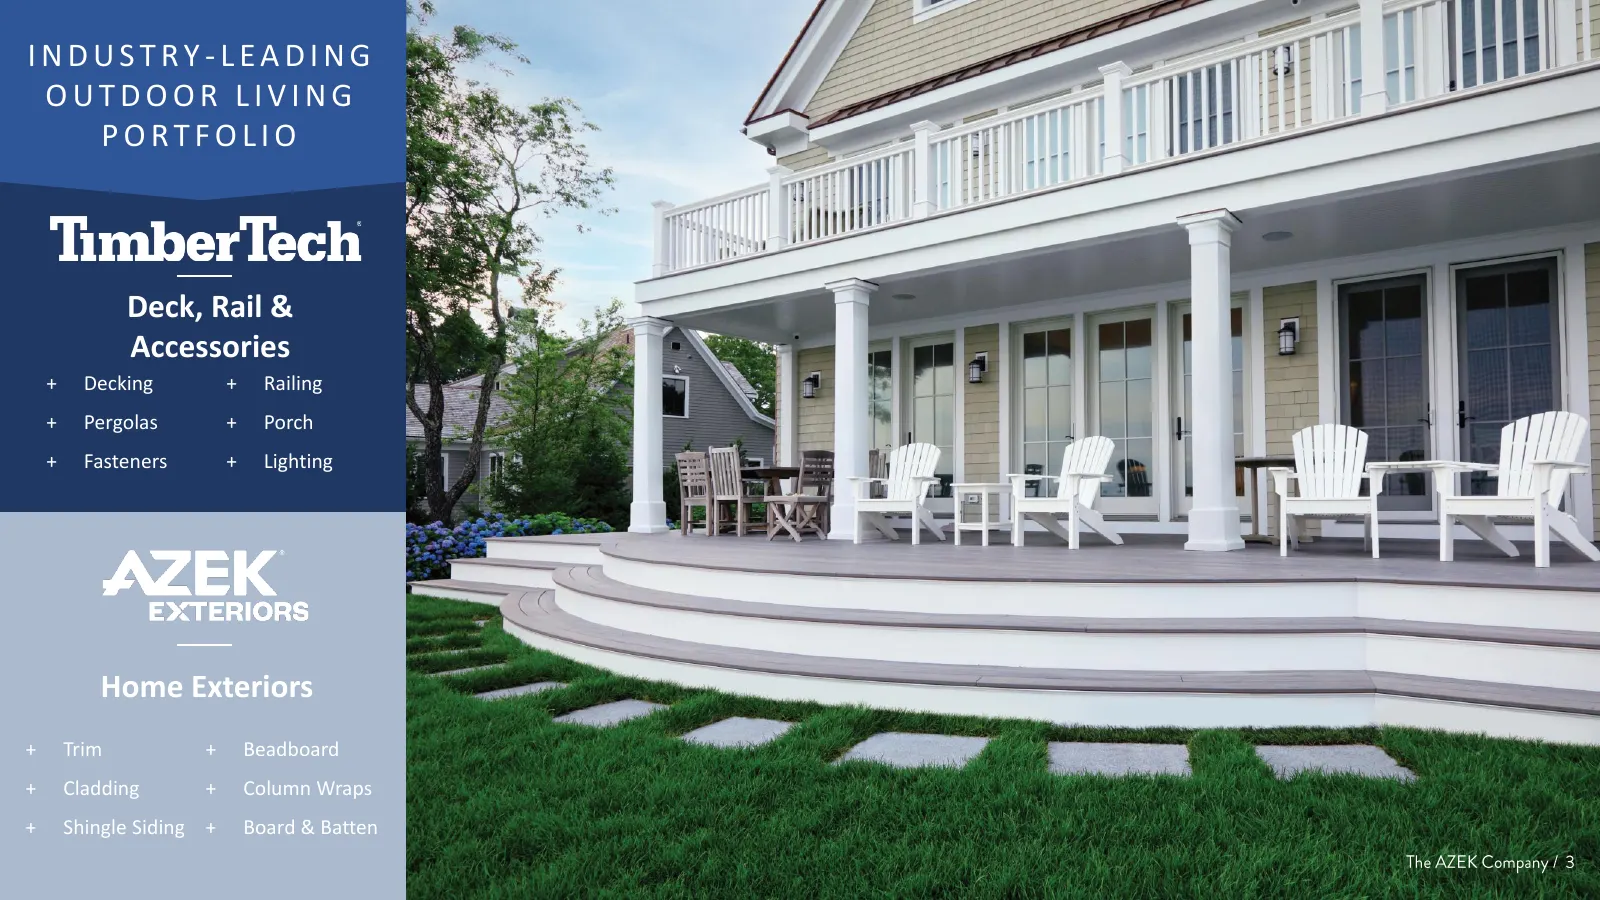
Slide 3: Industry-Leading Outdoor Living Portfolio
INDUSTRY-LEADING OUTDOOR LIVING PORTFOLIO Deck, Rail & Accessories + Decking + Railing + Pergolas + Porch + Fasteners + Lighting Home Exteriors + Trim + Beadboard + Cladding + Column Wraps + Shingle Siding + Board & Batten
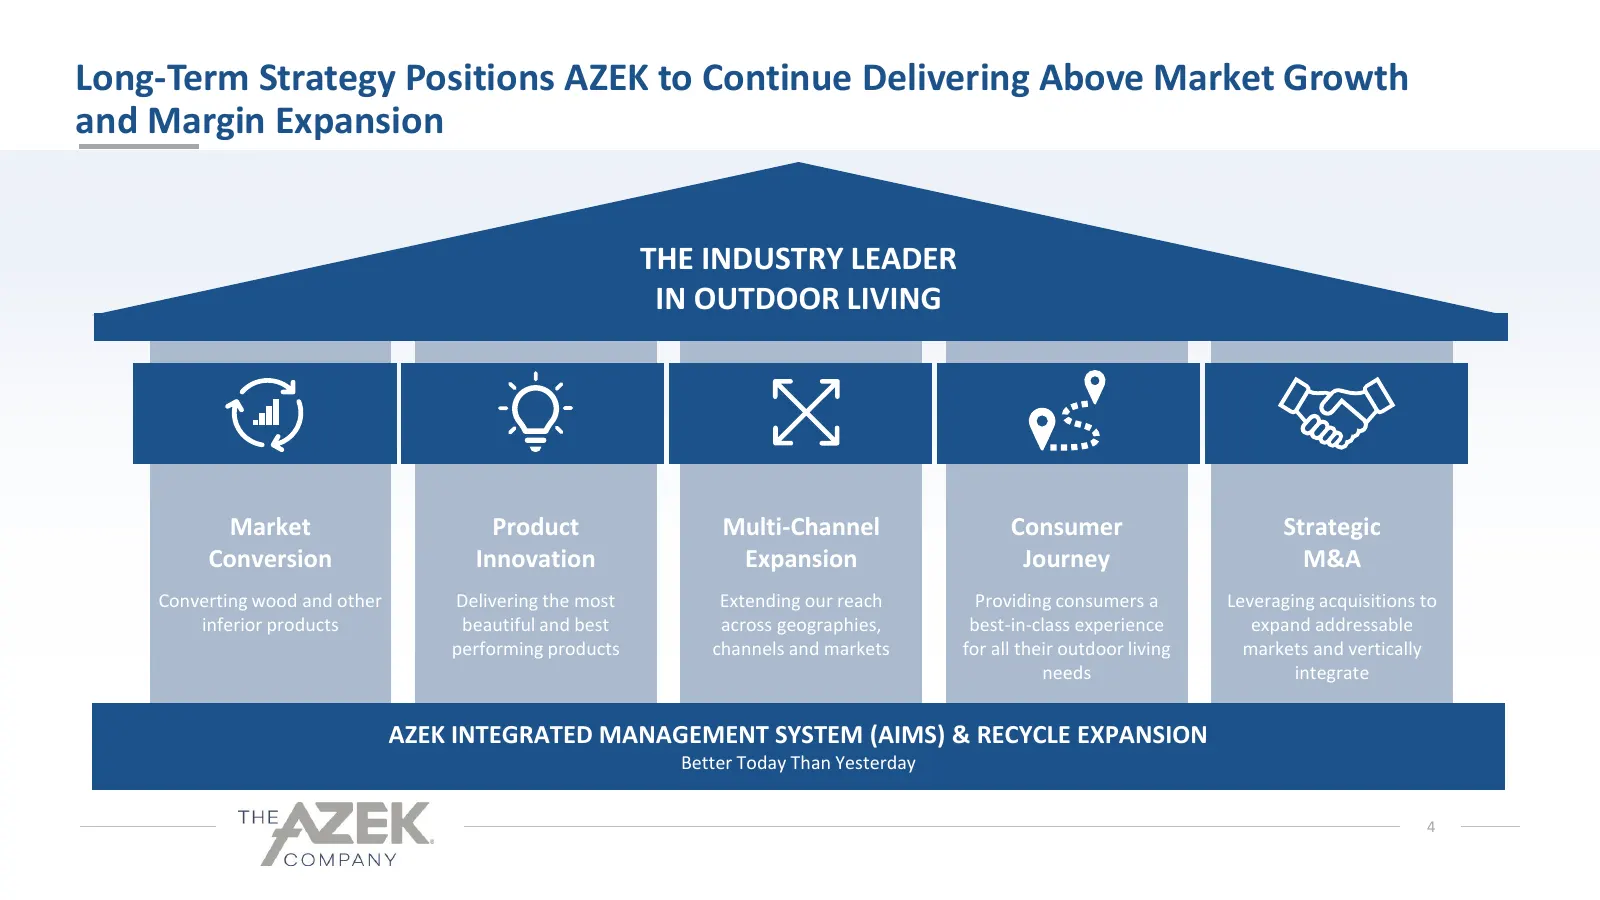
Slide 4: Long-Term Strategy Positions AZEK to Continue Delivering Above Market Growth and Margin Expansion
Long-Term Strategy Positions AZEK to Continue Delivering Above Market Growth and Margin Expansion THE INDUSTRY LEADER IN OUTDOOR LIVING Market Product Multi-Channel Consumer Strategic Conversion Innovation Expansion Journey M&A Converting wood and other Delivering the most Extending our reach Provid
Slide 5: The AZEK Company – Quarter Highlights
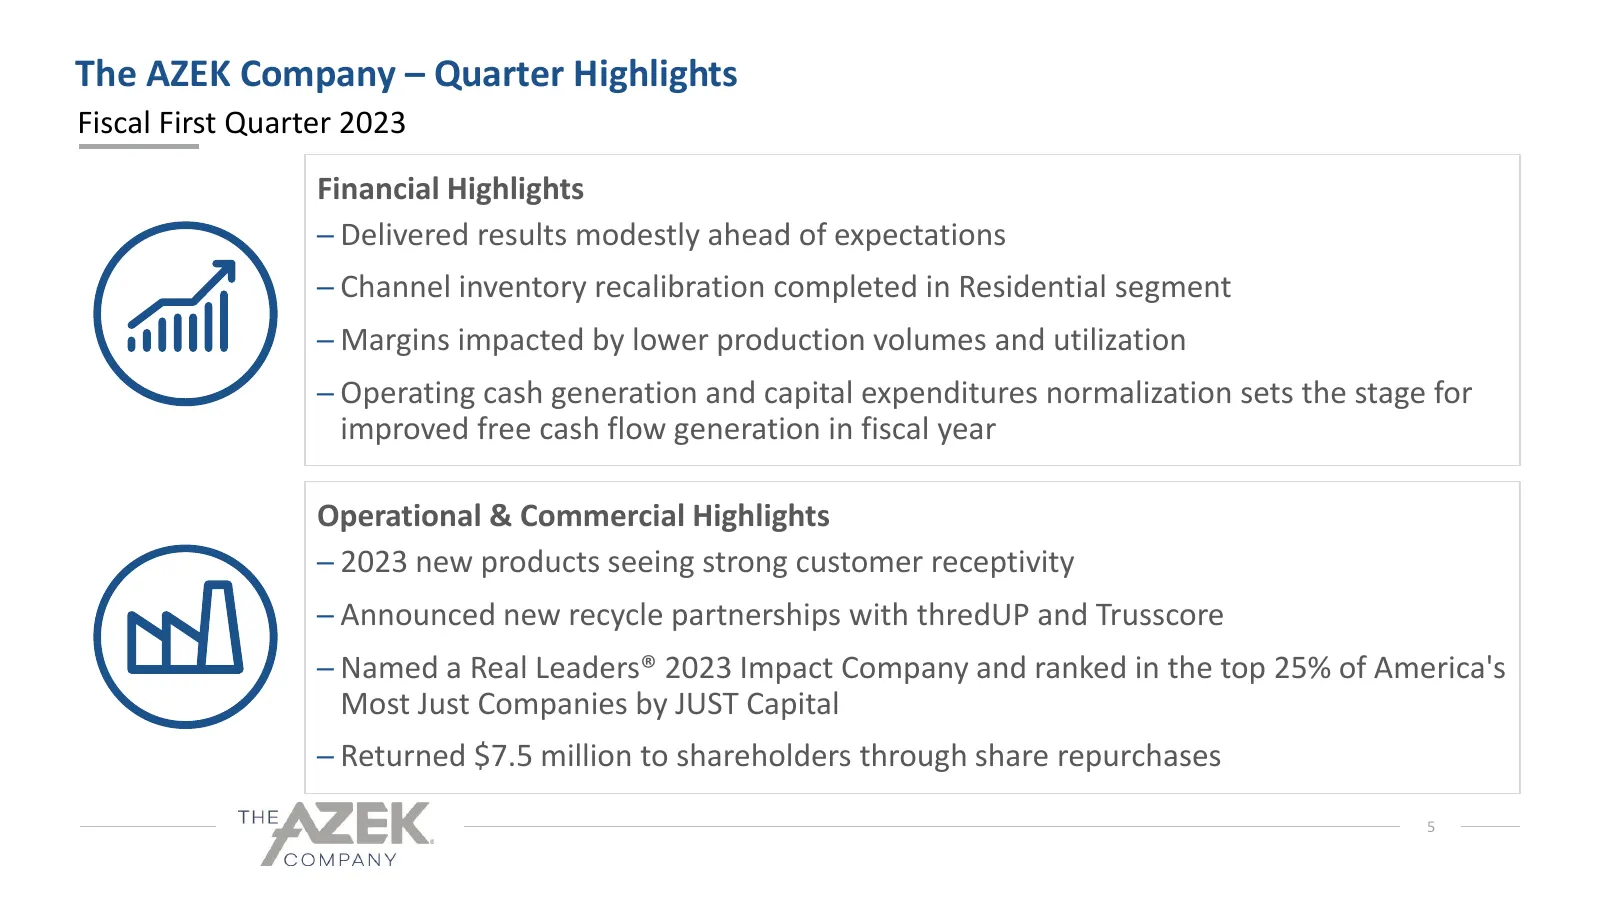
The AZEK Company – Quarter Highlights Fiscal First Quarter 2023 Financial Highlights ─ Delivered results modestly ahead of expectations ─ Channel inventory recalibration completed in Residential segment ─ Margins impacted by lower production volumes and utilization ─ Operating cash generation and ca
Slide 6: Q1 2023 Financial Performance Highlights
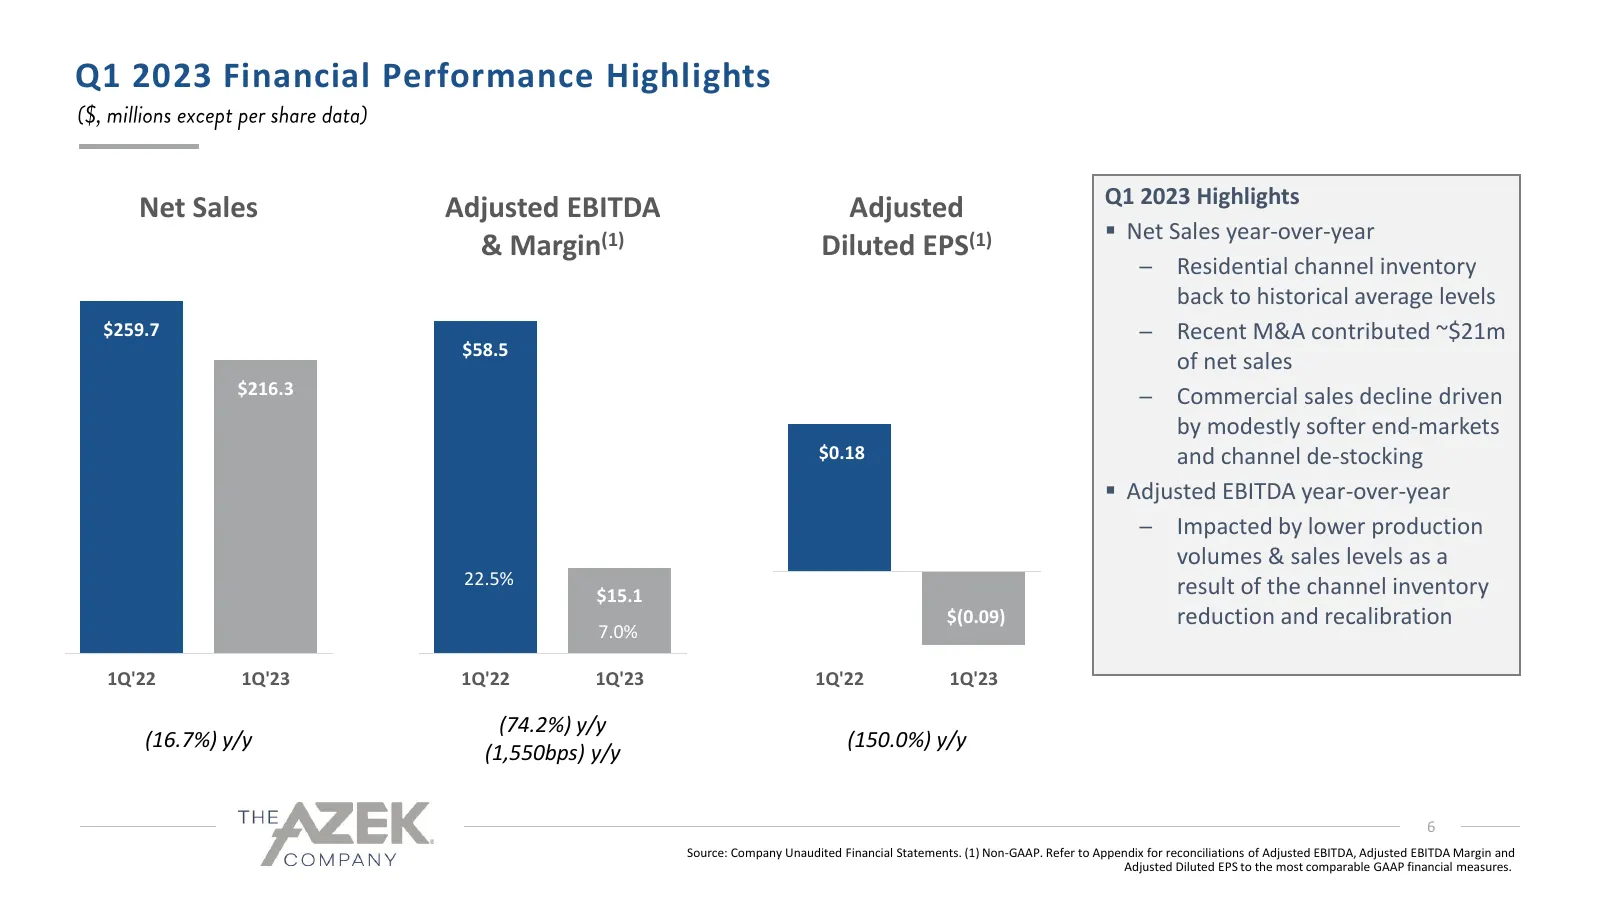
Q1 2023 Financial Performance Highlights Q1 2023 Highlights Net Sales Adjusted EBITDA Adjusted ▪ Net Sales year-over-year & Margin(1) Diluted EPS(1) ─ Residential channel inventory back to historical average levels $259.7 ─ Recent M&A contributed ~$21m $58.5 of net sales $216.3 ─ Commercial sales de
Slide 7: Q1 2023 Financial Results
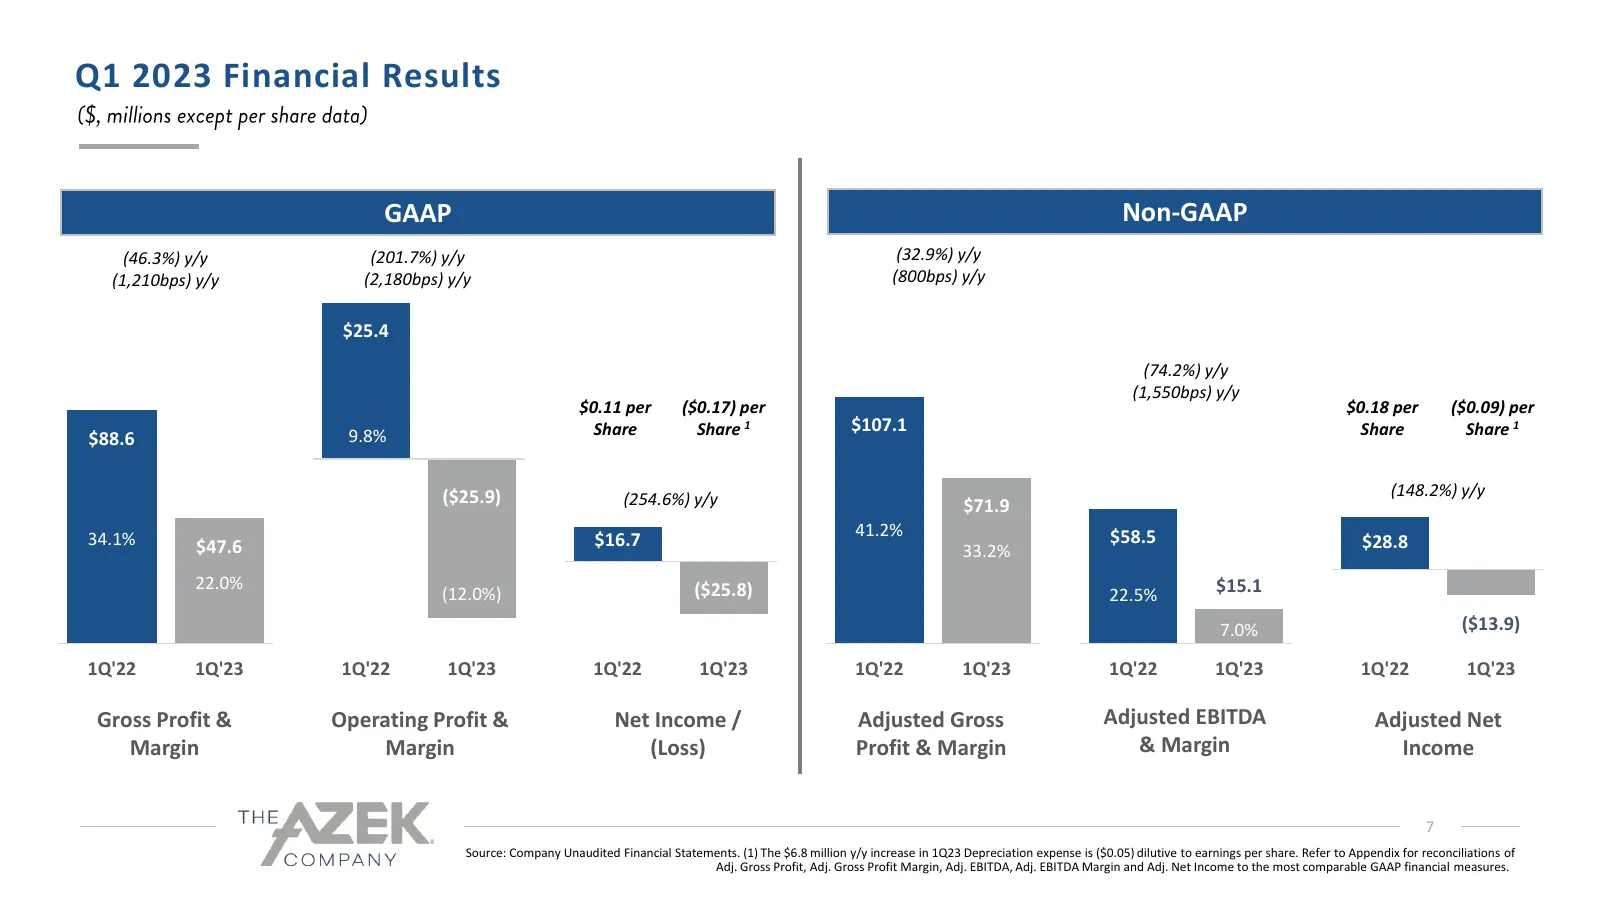
Q1 2023 Financial Results GAAP Non-GAAP (46.3%) y/y (201.7%) y/y (32.9%) y/y (1,210bps) y/y (2,180bps) y/y (800bps) y/y $25.4 (74.2%) y/y (1,550bps) y/y $0.11 per ($0.17) per $0.18 per ($0.09) per Share Share 1 $107.1 Share Share 1 $88.6 9.8% ($25.9) (254.6%) y/y (148.2%) y/y $71.9 34.1% 41.2% $58.5
Slide 8: Q1 2023 Segment Results
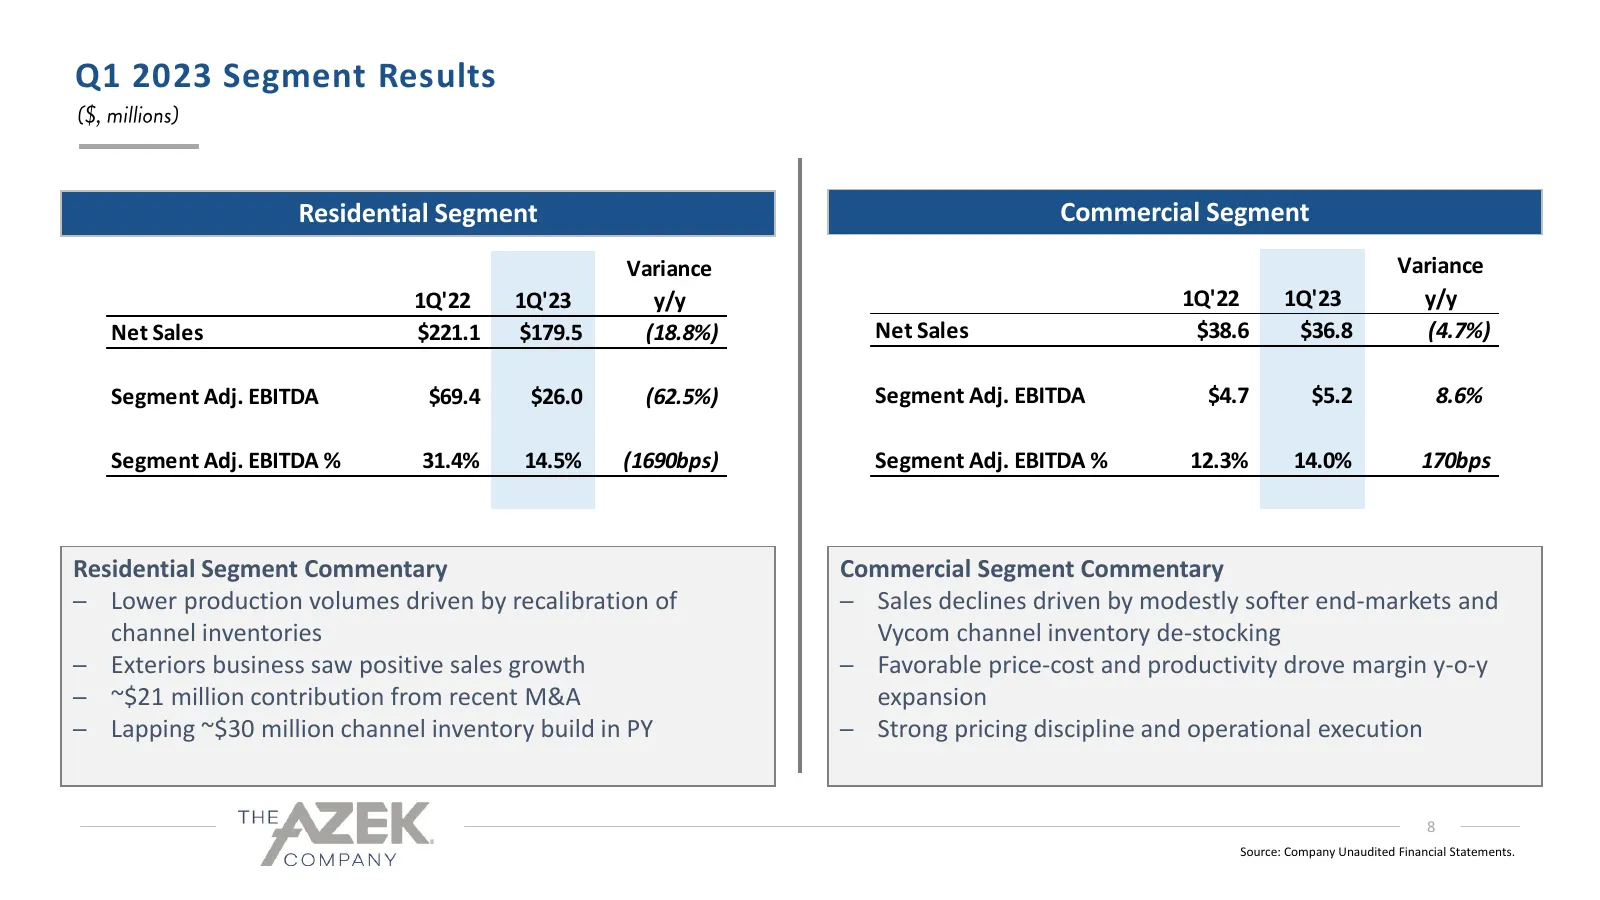
Q1 2023 Segment Results Residential Segment Commercial Segment Variance Variance 1Q'22 1Q'23 y/y 1Q'22 1Q'23 y/y Net Sales $221.1 $179.5 (18.8%) Net Sales $38.6 $36.8 (4.7%) Segment Adj. EBITDA $69.4 $26.0 (62.5%) Segment Adj. EBITDA $4.7 $5.2 8.6% Segment Adj. EBITDA % 31.4% 14.5% (1690bps) Segment
Slide 9: Q1 2023 Balance Sheet and Cash Flow Highlights
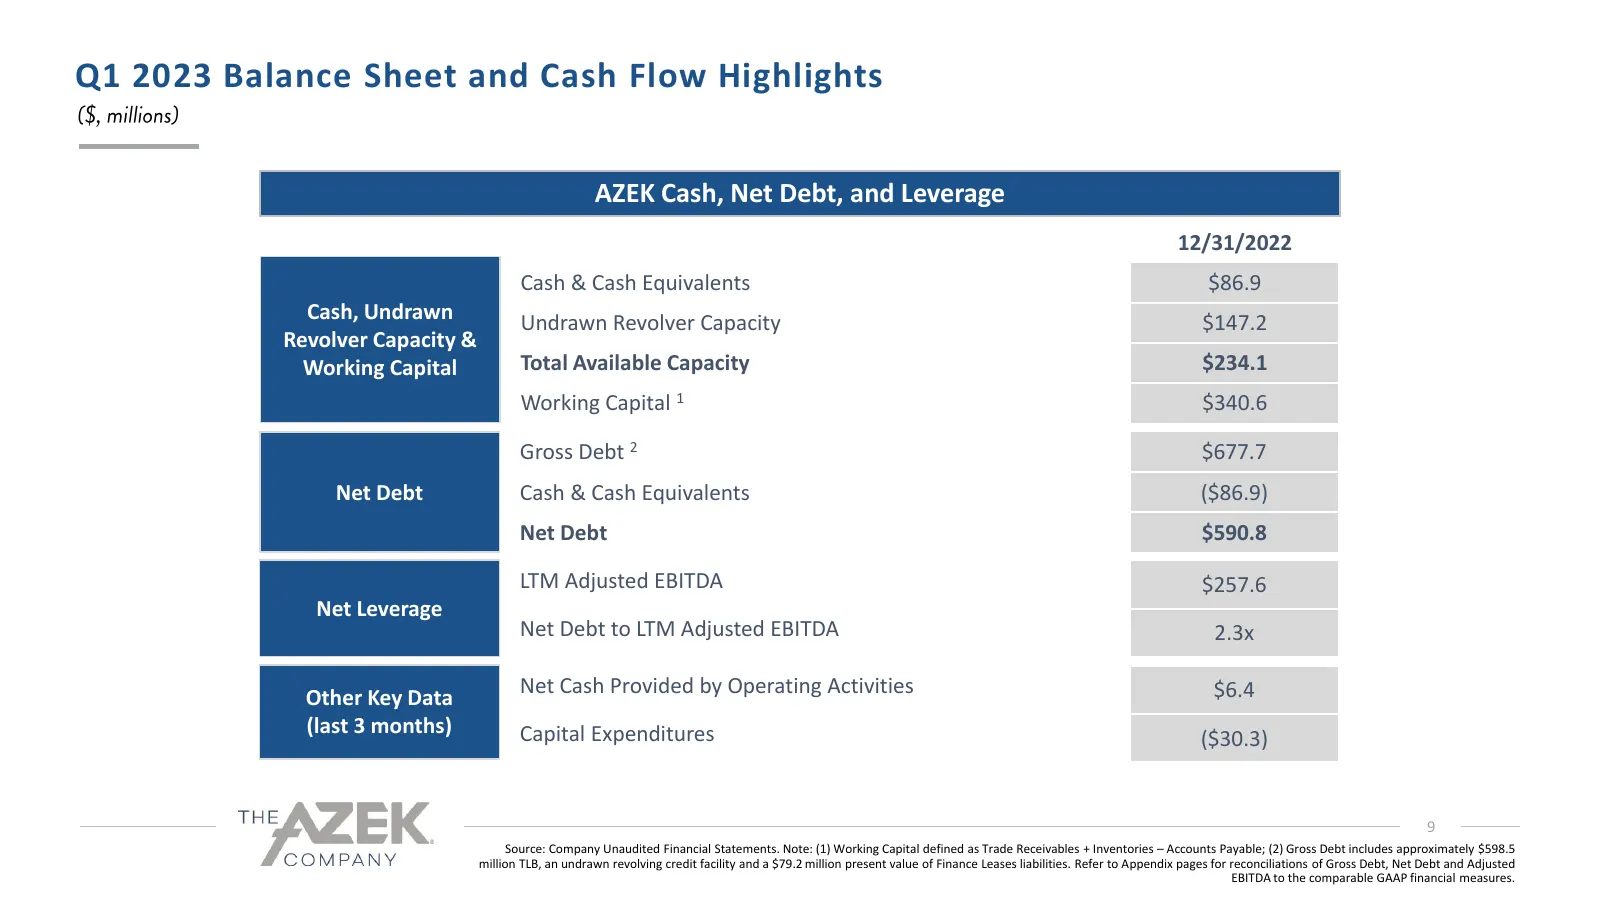
Q1 2023 Balance Sheet and Cash Flow Highlights AZEK Cash, Net Debt, and Leverage 12/31/2022 Cash & Cash Equivalents $86.9 Cash, Undrawn Undrawn Revolver Capacity $147.2 Revolver Capacity & Working Capital Total Available Capacity $234.1 Working Capital 1 $340.6 Gross Debt 2 $677.7 Net Debt Cash & Ca
Slide 10: Fiscal Year 2023 Perspective
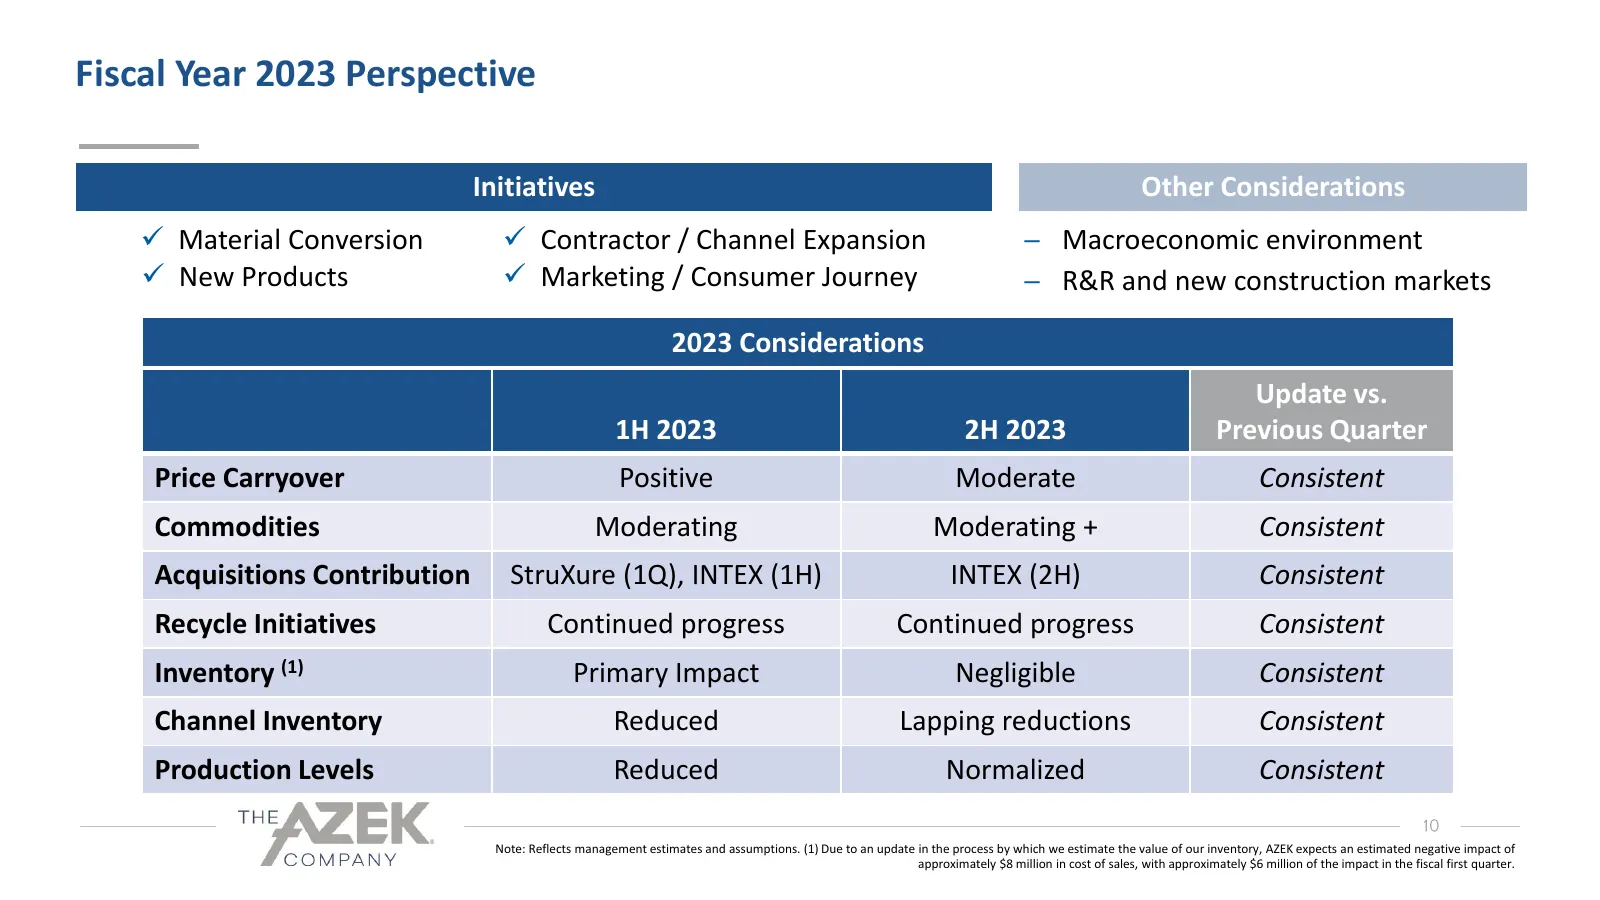
Fiscal Year 2023 Perspective Initiatives Other Considerations ✓ Material Conversion ✓ Contractor / Channel Expansion ─ Macroeconomic environment ✓ New Products ✓ Marketing / Consumer Journey ─ R&R and new construction markets 2023 Considerations Update vs. 1H 2023 2H 2023 Previous Quarter Price Carr
Slide 11: Fiscal Year 2023 Planning Assumptions & Outlook
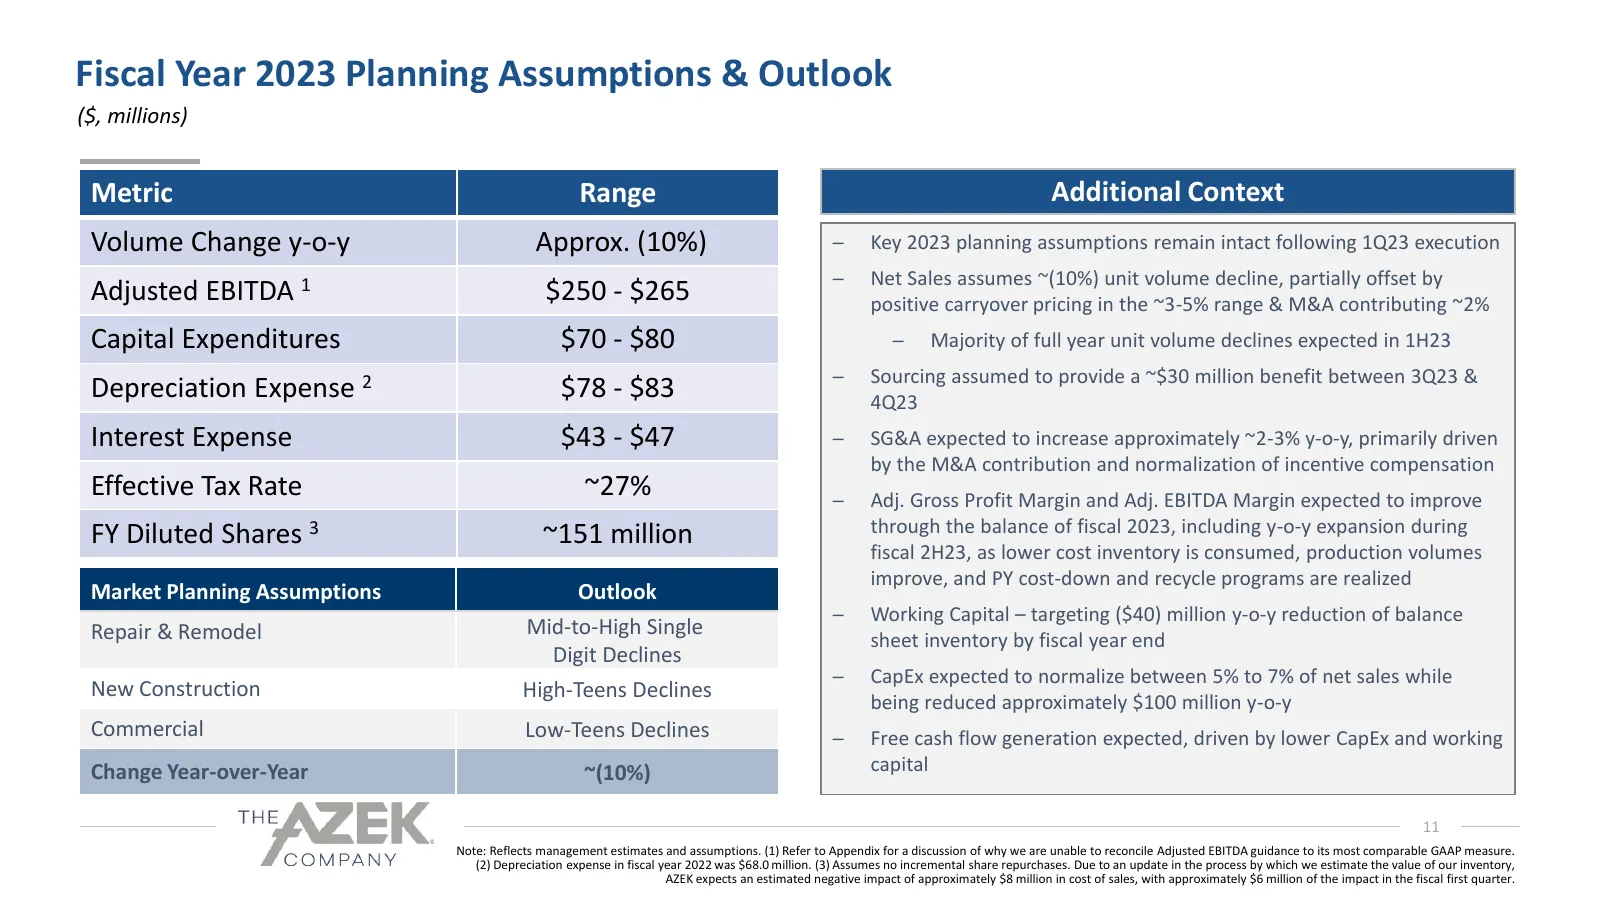
Fiscal Year 2023 Planning Assumptions & Outlook ($, millions) Metric Range Additional Context Volume Change y-o-y Approx. (10%) ─ Key 2023 planning assumptions remain intact following 1Q23 execution ─ Net Sales assumes ~(10%) unit volume decline, partially offset by Adjusted EBITDA 1 $250 - $265 pos
Slide 12: Q2 2023 Guidance
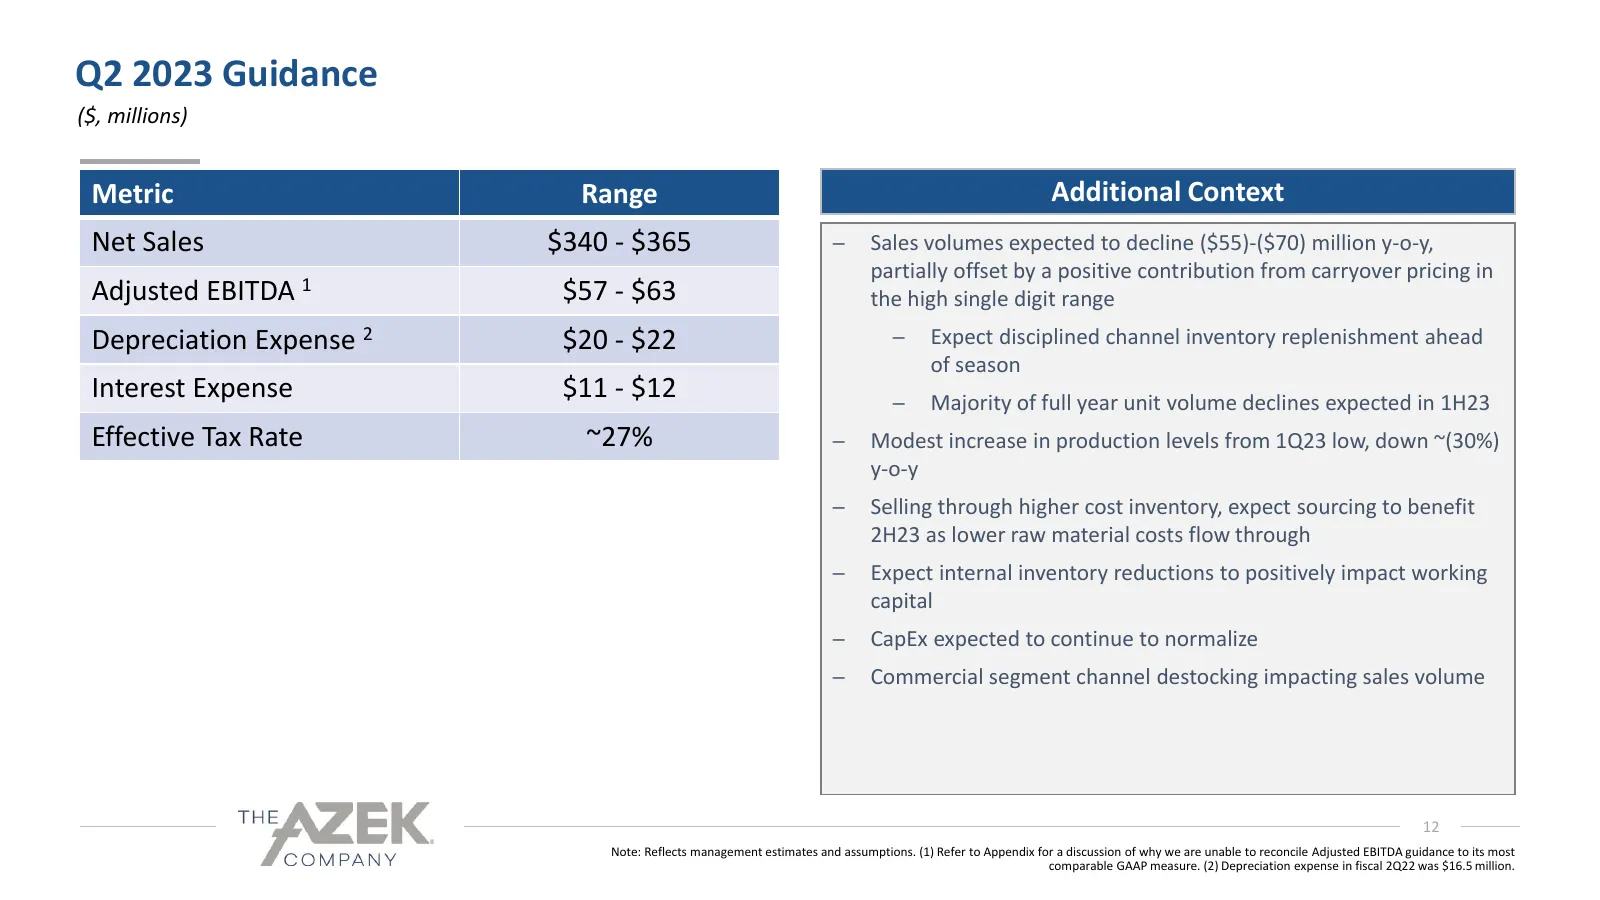
Q2 2023 Guidance ($, millions) Metric Range Additional Context Net Sales $340 - $365 ─ Sales volumes expected to decline ($55)-($70) million y-o-y, partially offset by a positive contribution from carryover pricing in Adjusted EBITDA 1 $57 - $63 the high single digit range Depreciation Expense 2 $20
Slide 13: Appendix
“AZEK 9 COMPANY APPENDIX ee Hae
Slide 14: Non-GAAP Reconciliations
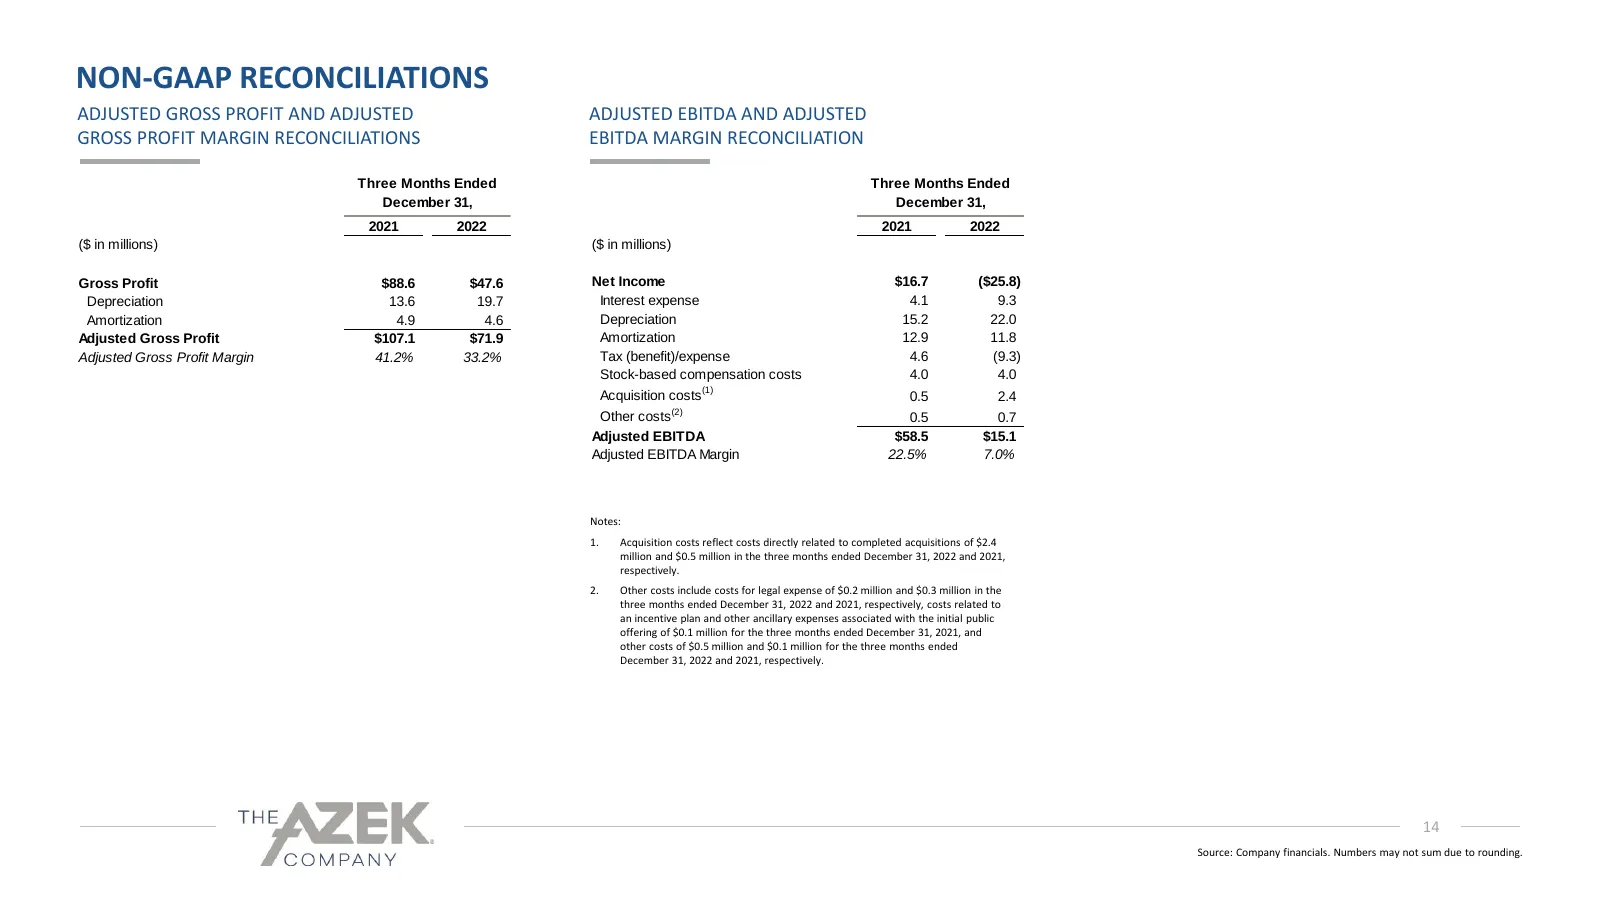
NON-GAAP RECONCILIATIONS ADJUSTED GROSS PROFIT AND ADJUSTED ADJUSTED EBITDA AND ADJUSTED GROSS PROFIT MARGIN RECONCILIATIONS EBITDA MARGIN RECONCILIATION Three Months Ended Three Months Ended December 31, December 31, 2021 2022 2021 2022 ($ in millions) ($ in millions) Gross Profit $88.6 $47.6 Net I
Slide 15: Non-GAAP Reconciliations
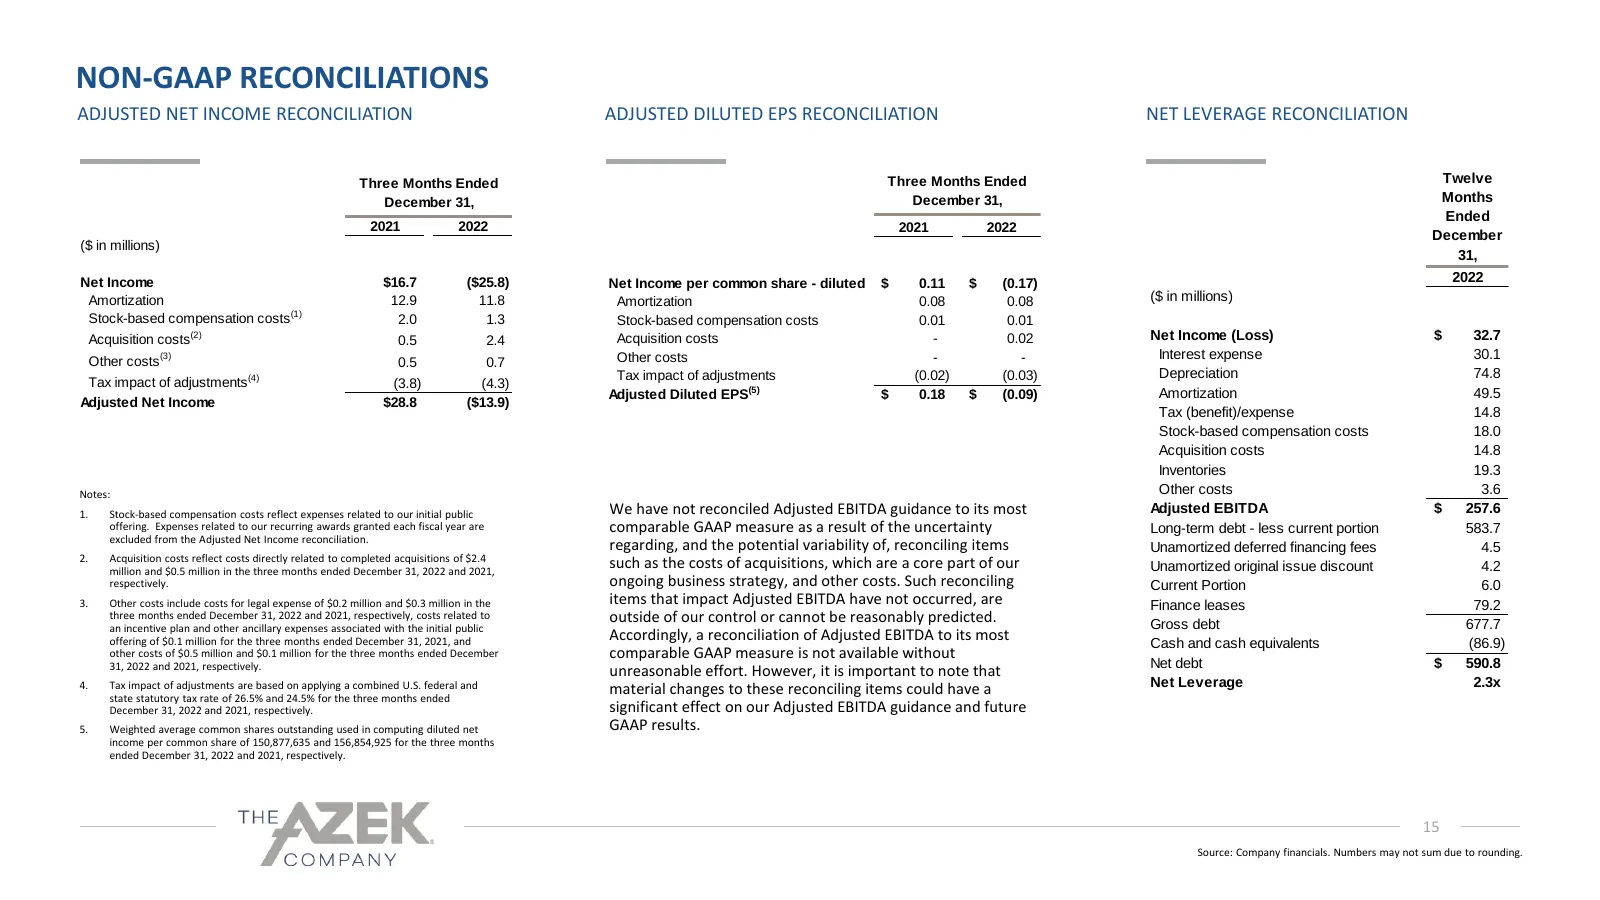
NON-GAAP RECONCILIATIONS ADJUSTED NET INCOME RECONCILIATION ADJUSTED DILUTED EPS RECONCILIATION NET LEVERAGE RECONCILIATION Three Months Ended Three Months Ended Twelve December 31, December 31, Months Ended 2021 2022 2021 2022 December ($ in millions) 31, Net Income $16.7 ($25.8) Net Income per com
Slide 16: Investor Relations Contact
Investor Relations Contact: 312-809-1093 ir@azekco.com NYSE: AZEK
Source: EarningsCall slides
More decks from Azek Company Inc
 Q4 FY2025 Earnings Presentation24 slides · May 21, 2025
 Q2 2025 Earnings Presentation23 slides · May 6, 2025
 Merger or Acquisition (March 2025)27 slides · Mar 24, 2025
 Q1 2025 Earnings Presentation17 slides · Feb 4, 2025
 Q4 2024 Earnings Presentation22 slides · Nov 19, 2024
 Q3 2024 Earnings Presentation18 slides · Aug 7, 2024