Azek — The AZEK Company — Q4 2024 Earnings Presentation
22 slides from Azek's earnings presentation, Nov 19, 2024
Slide 1: 4th Quarter FY 2024 Earnings Presentation
4th Quarter FY 2024 Earnings Presentation November 19, 2024
Slide 2: Disclaimer
DISCLAIMER Important Notice This presentation contains “forward-looking statements” within the meaning of federal securities laws, including the safe harbor provisions of the United States Private Securities Litigation Reform Act of 1995. All statements other than statements of historical facts cont

Slide 3: Industry-Leading Outdoor Living Portfolio
INDUSTRY-LEADING OUTDOOR LIVING PORTFOLIO Deck, Rail & Accessories + Decking + Railing + Pergolas + Porch + Fasteners + Lighting Home Exteriors + Trim boards + Beadboard + Moulding + Column Wraps + Cladding + Board & Batten + Shingle Siding
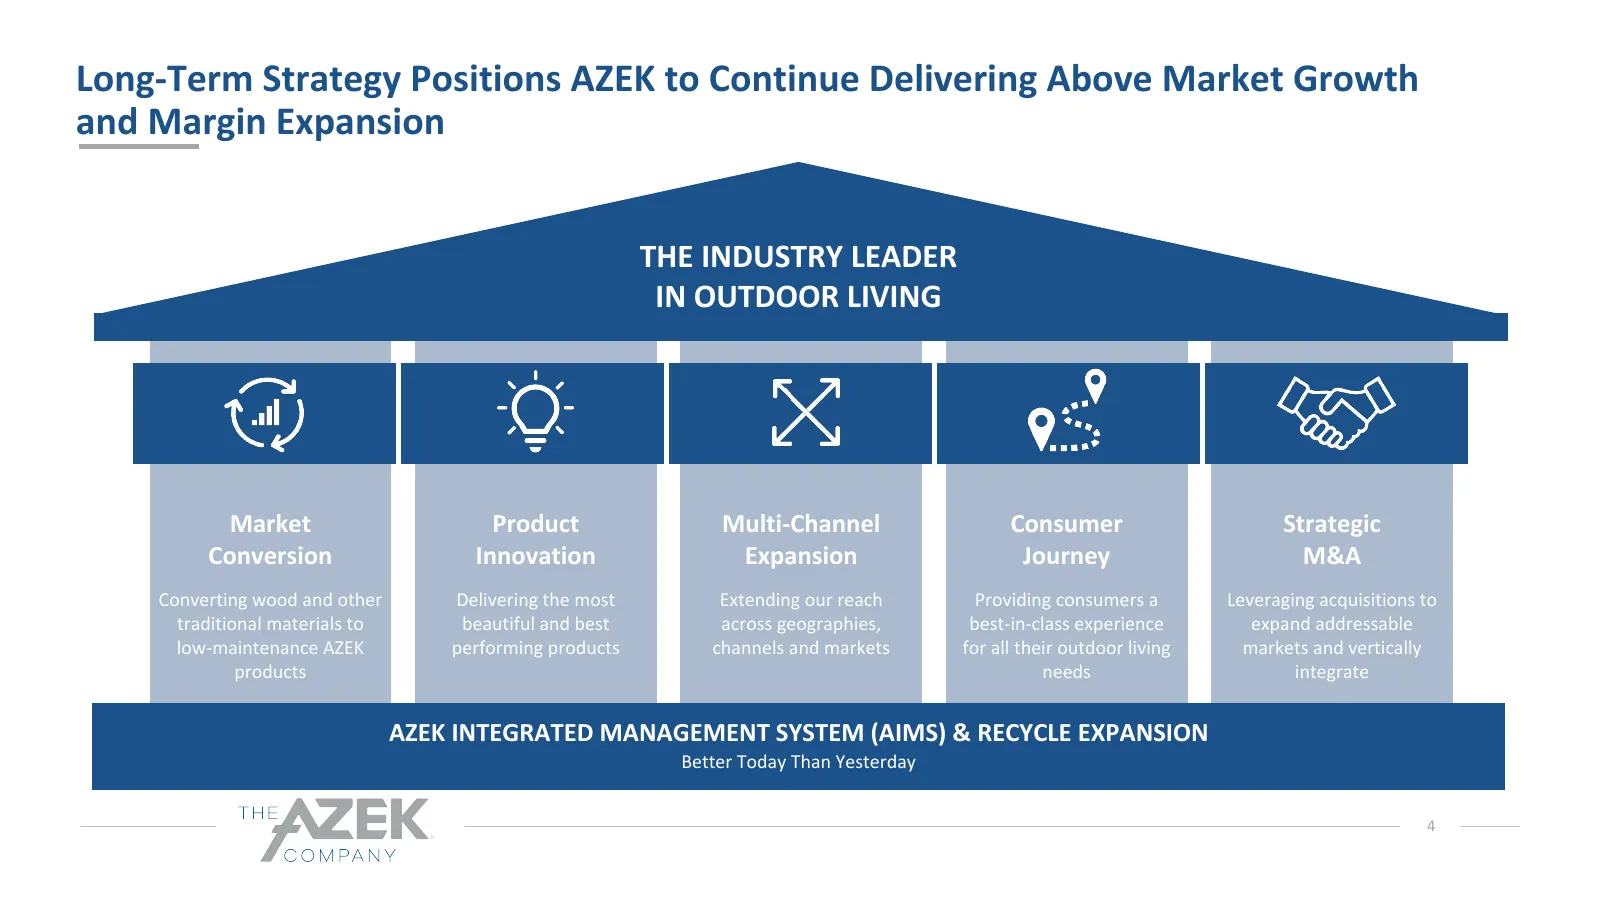
Slide 4: Long-Term Strategy Positions AZEK to Continue Delivering Above Market Growth and Margin Expansion
Long-Term Strategy Positions AZEK to Continue Delivering Above Market Growth and Margin Expansion THE INDUSTRY LEADER IN OUTDOOR LIVING Market Product Multi-Channel Consumer Strategic Conversion Innovation Expansion Journey M&A Converting wood and other Delivering the most Extending our reach Provid
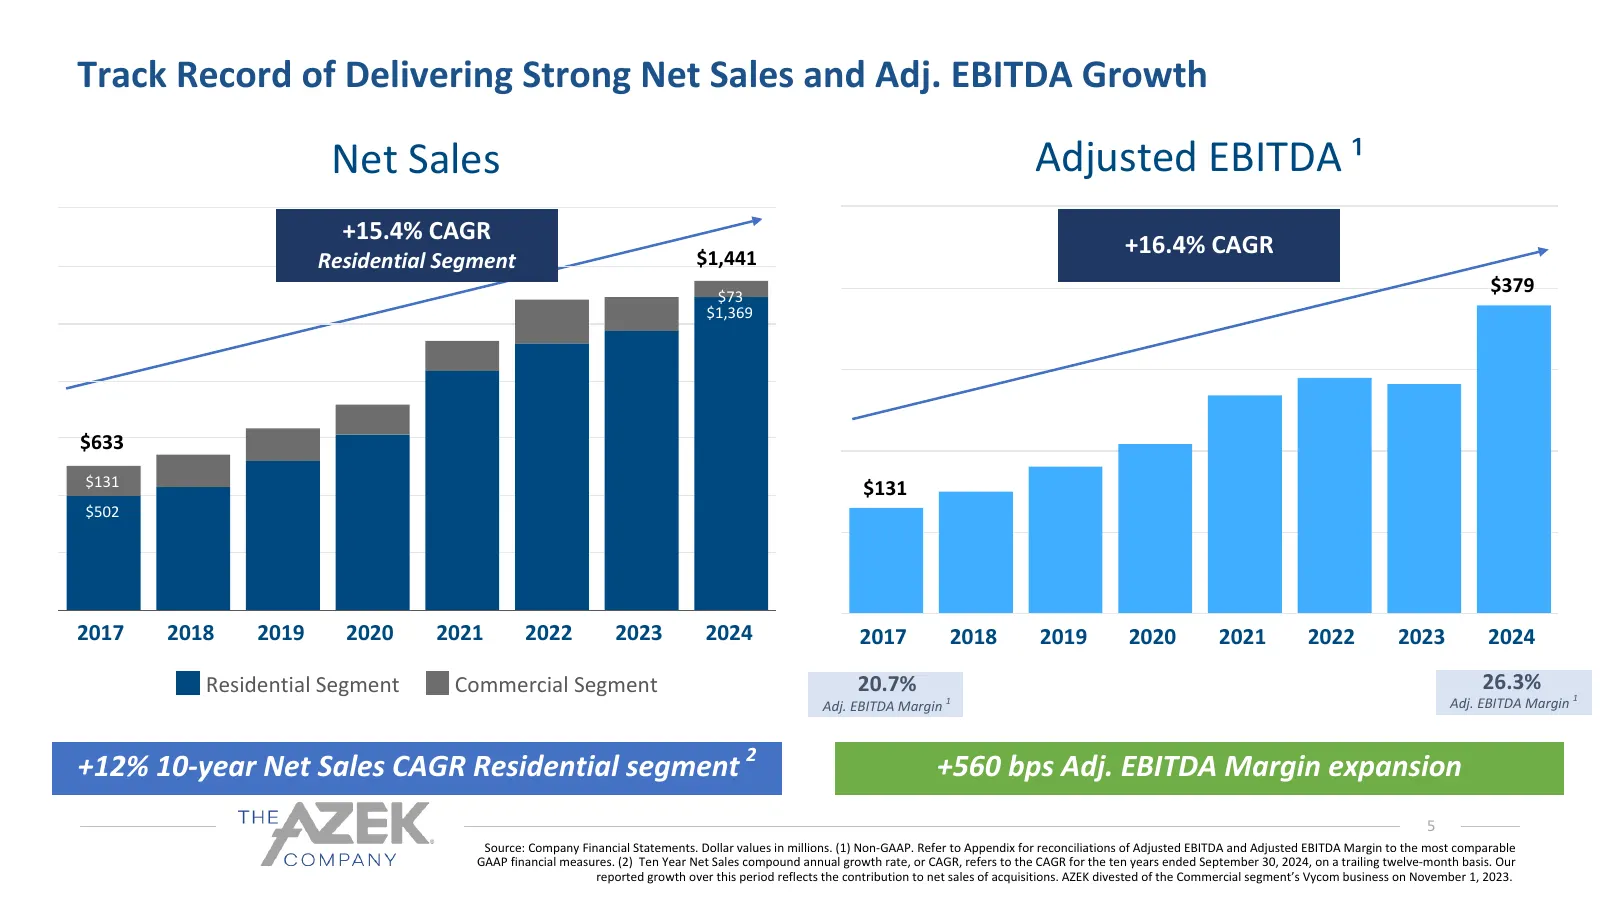
Slide 5: Track Record of Delivering Strong Net Sales and Adj. EBITDA Growth
Track Record of Delivering Strong Net Sales and Adj. EBITDA Growth Net Sales Adjusted EBITDA ¹ +15.4% CAGR $1,441 +16.4% CAGR Residential Segment $73 $379 $1,369 $633 $131 $131 $502 2017 2018 2019 2020 2021 2022 2023 2024 2017 2018 2019 2020 2021 2022 2023 2024 Residential Segment Commercial Segment
Slide 6: The AZEK Company – Annual Highlights
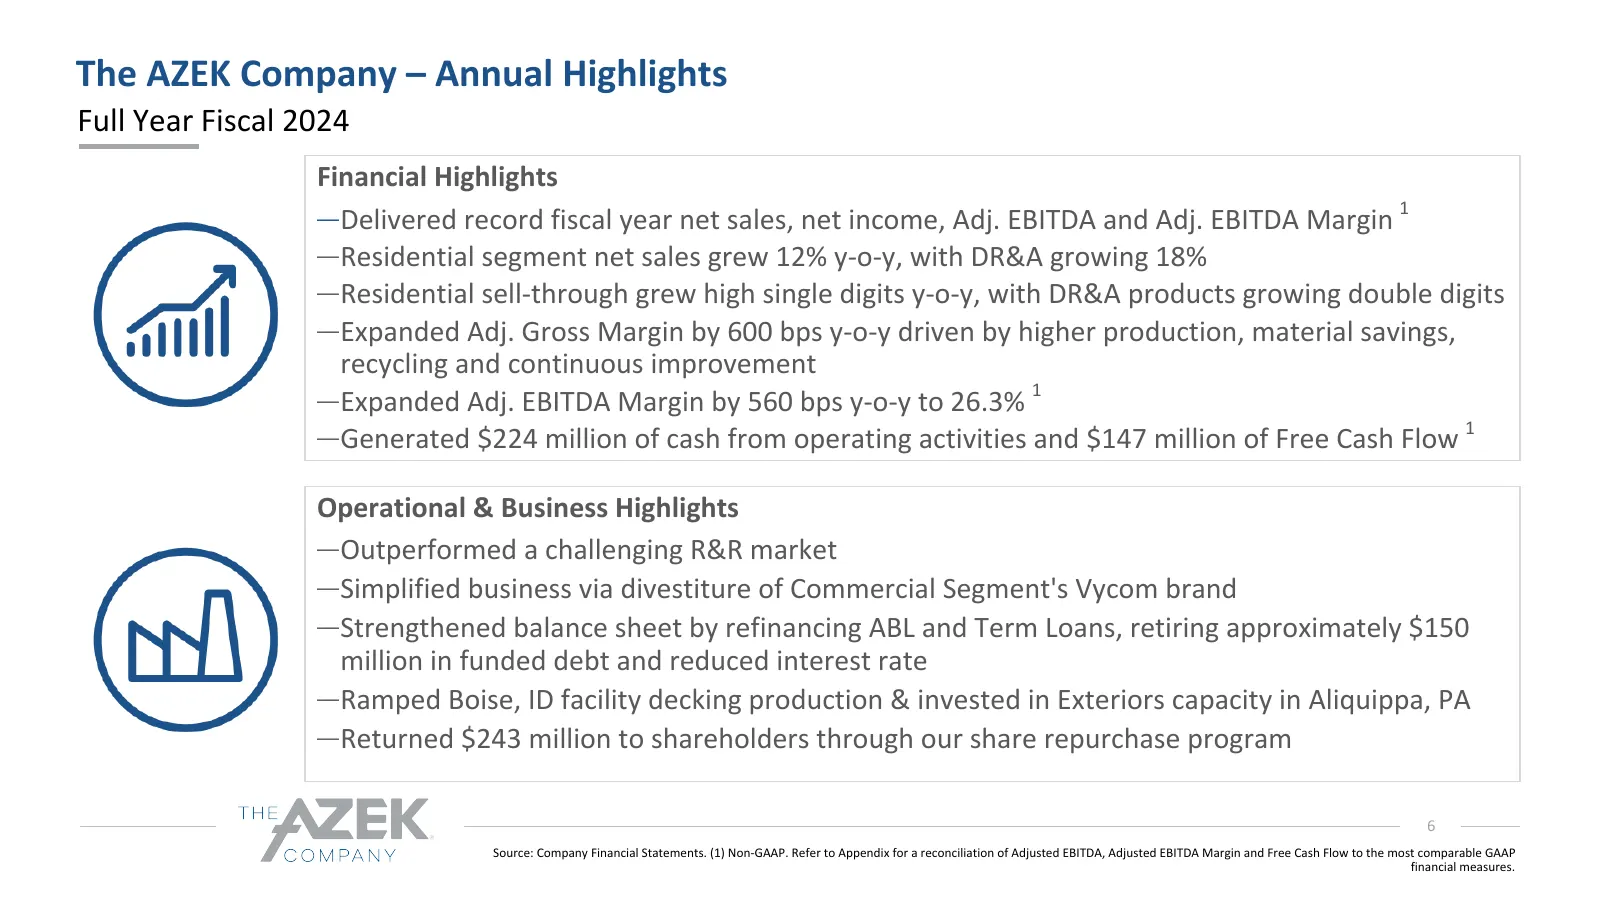
The AZEK Company – Annual Highlights Full Year Fiscal 2024 Financial Highlights ─Delivered record fiscal year net sales, net income, Adj. EBITDA and Adj. EBITDA Margin 1 ─Residential segment net sales grew 12% y-o-y, with DR&A growing 18% ─Residential sell-through grew high single digits y-o-y, with
Slide 7: FY 2024 Financial Performance Highlights
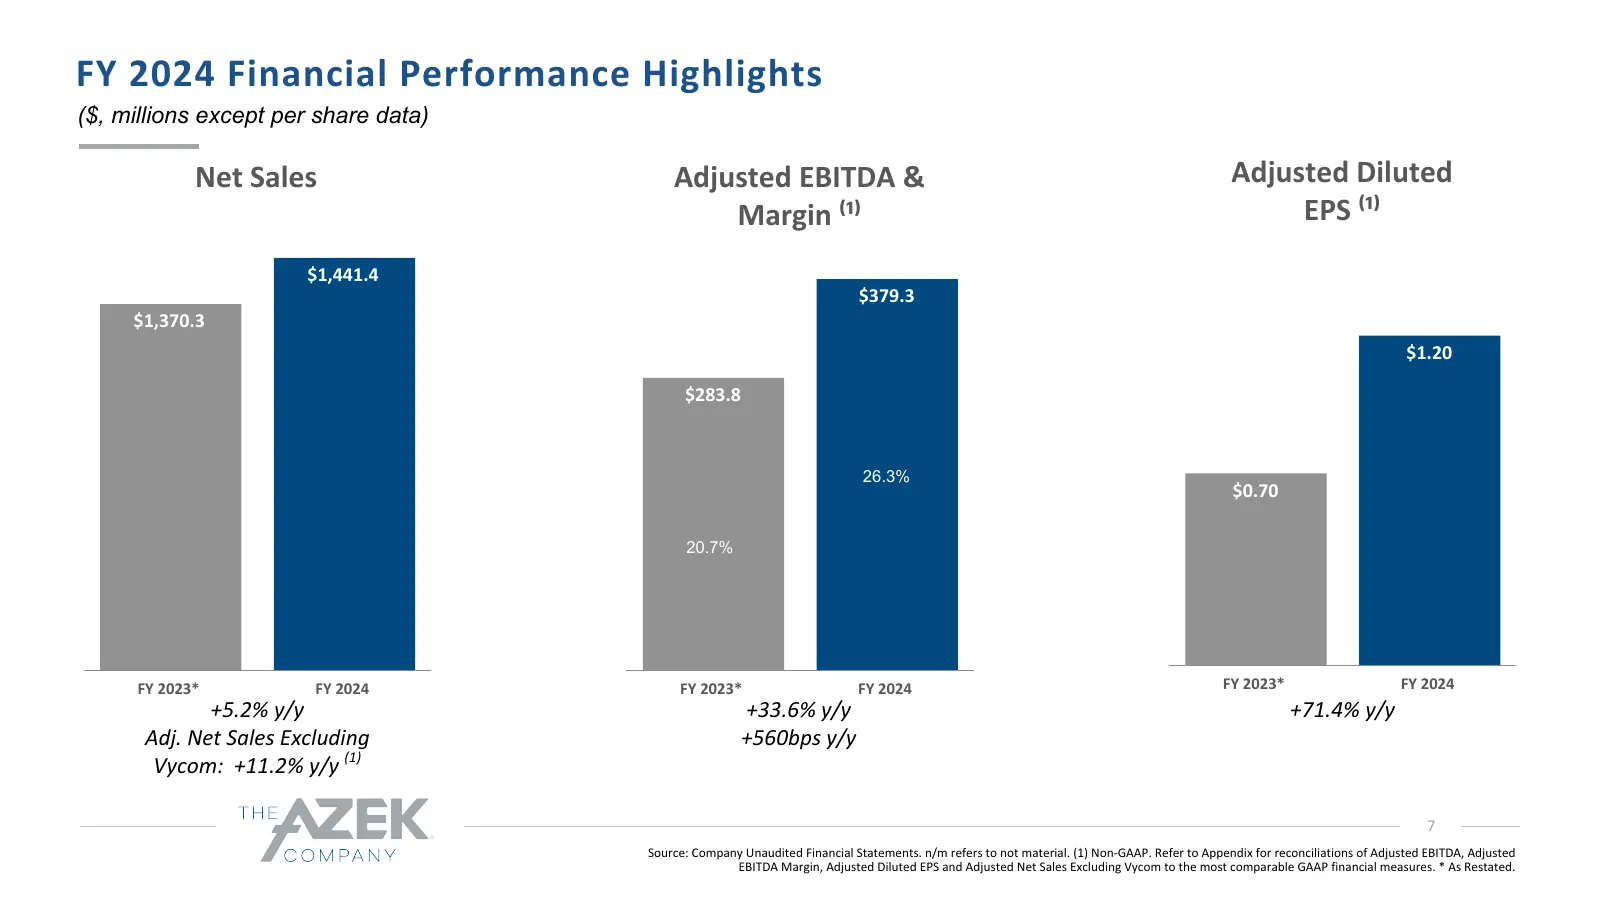
FY 2024 Financial Performance Highlights ($, millions except per share data) Net Sales Adjusted EBITDA & Adjusted Diluted Margin ⁽¹⁾ EPS ⁽¹⁾ $1,441.4 $379.3 $1,370.3 $1.20 $283.8 26.3% $0.70 20.7% FY 2023* FY 2024 FY 2023* FY 2024 FY 2023* FY 2024 +5.2% y/y +33.6% y/y +71.4% y/y Adj. Net Sales Exclu
Slide 8: FY 2024 Financial Results
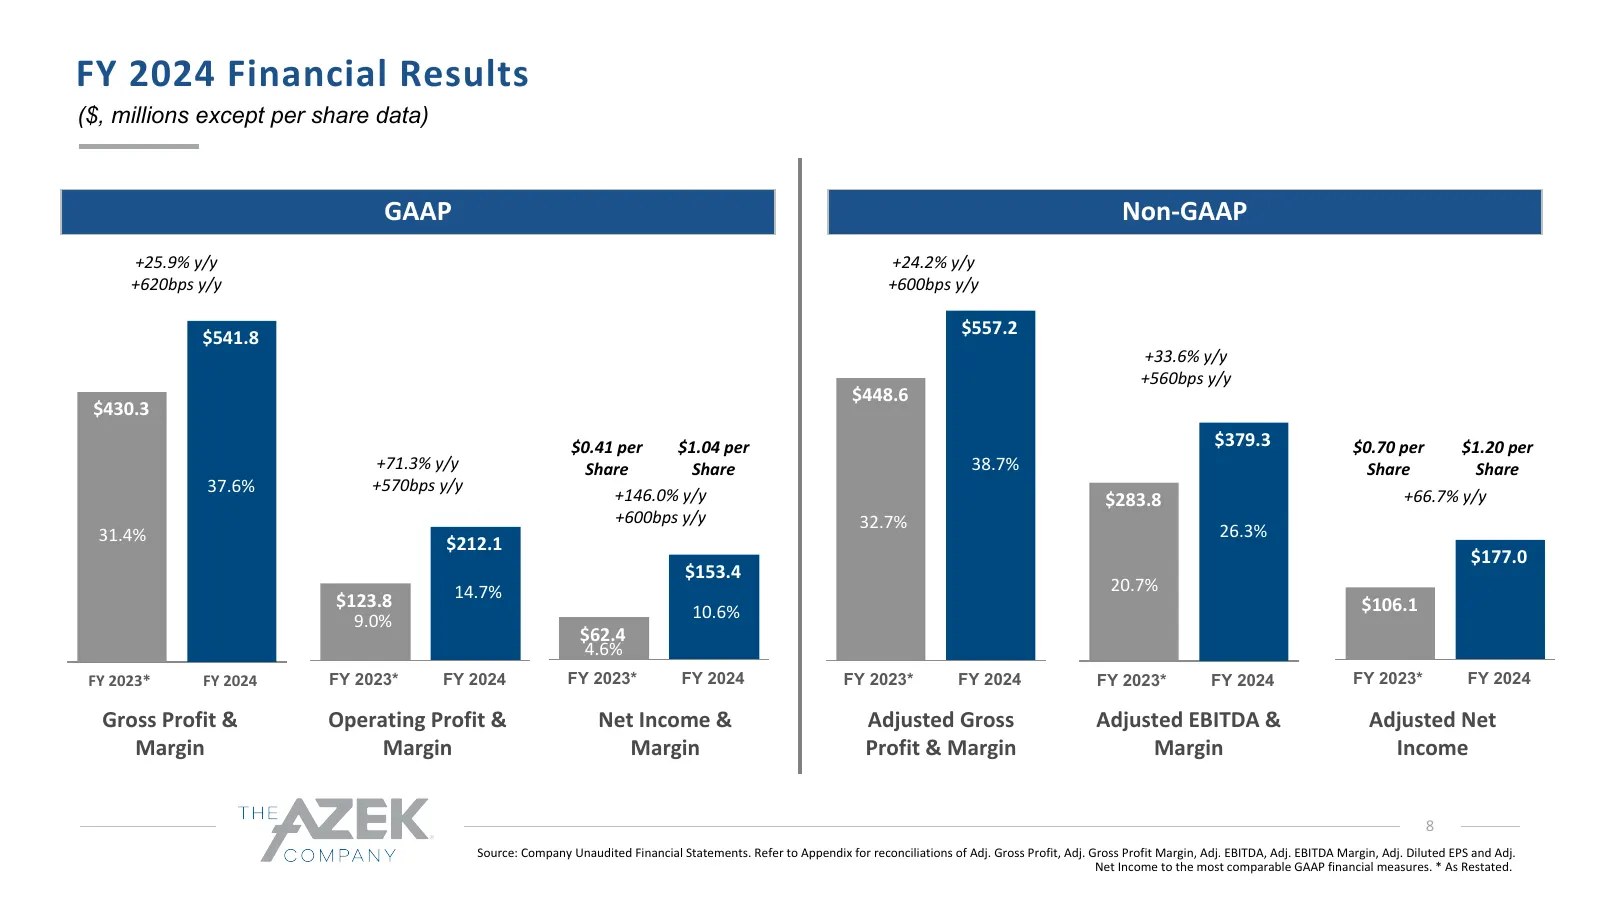
FY 2024 Financial Results ($, millions except per share data) GAAP Non-GAAP +25.9% y/y +24.2% y/y +620bps y/y +600bps y/y $557.2 $541.8 +33.6% y/y +560bps y/y $448.6 $430.3 $0.41 per $1.04 per $379.3 $0.70 per $1.20 per +71.3% y/y Share Share 38.7% Share Share 37.6% +570bps y/y +146.0% y/y $283.8 +6
Slide 9: The AZEK Company – Quarter Highlights
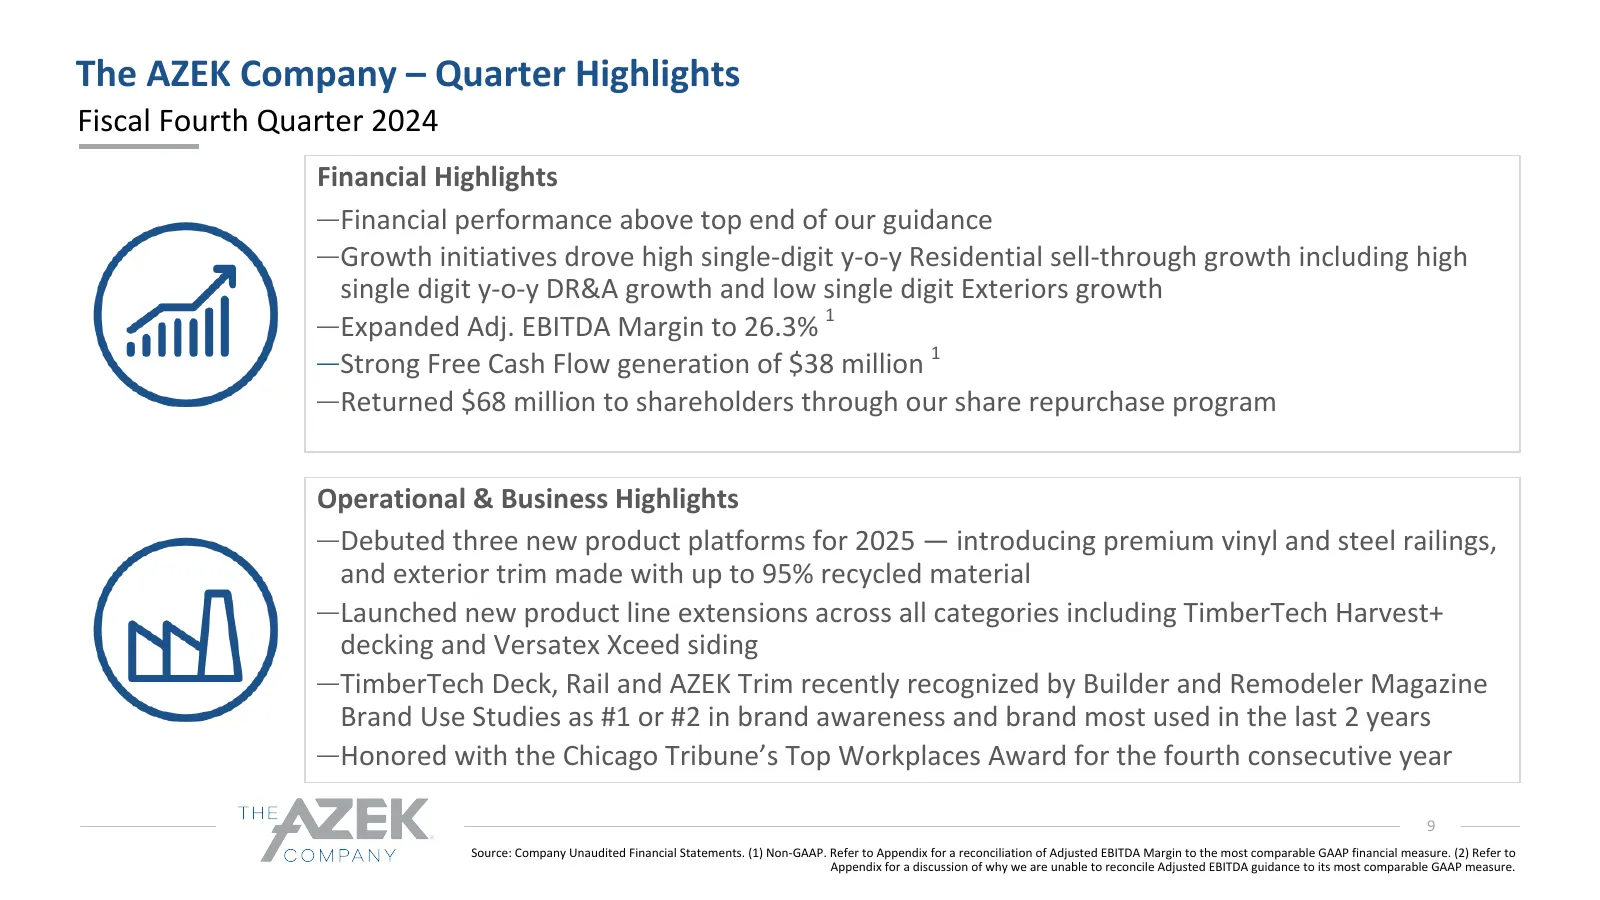
The AZEK Company – Quarter Highlights Fiscal Fourth Quarter 2024 Financial Highlights ─Financial performance above top end of our guidance ─Growth initiatives drove high single-digit y-o-y Residential sell-through growth including high single digit y-o-y DR&A growth and low single digit Exteriors gr
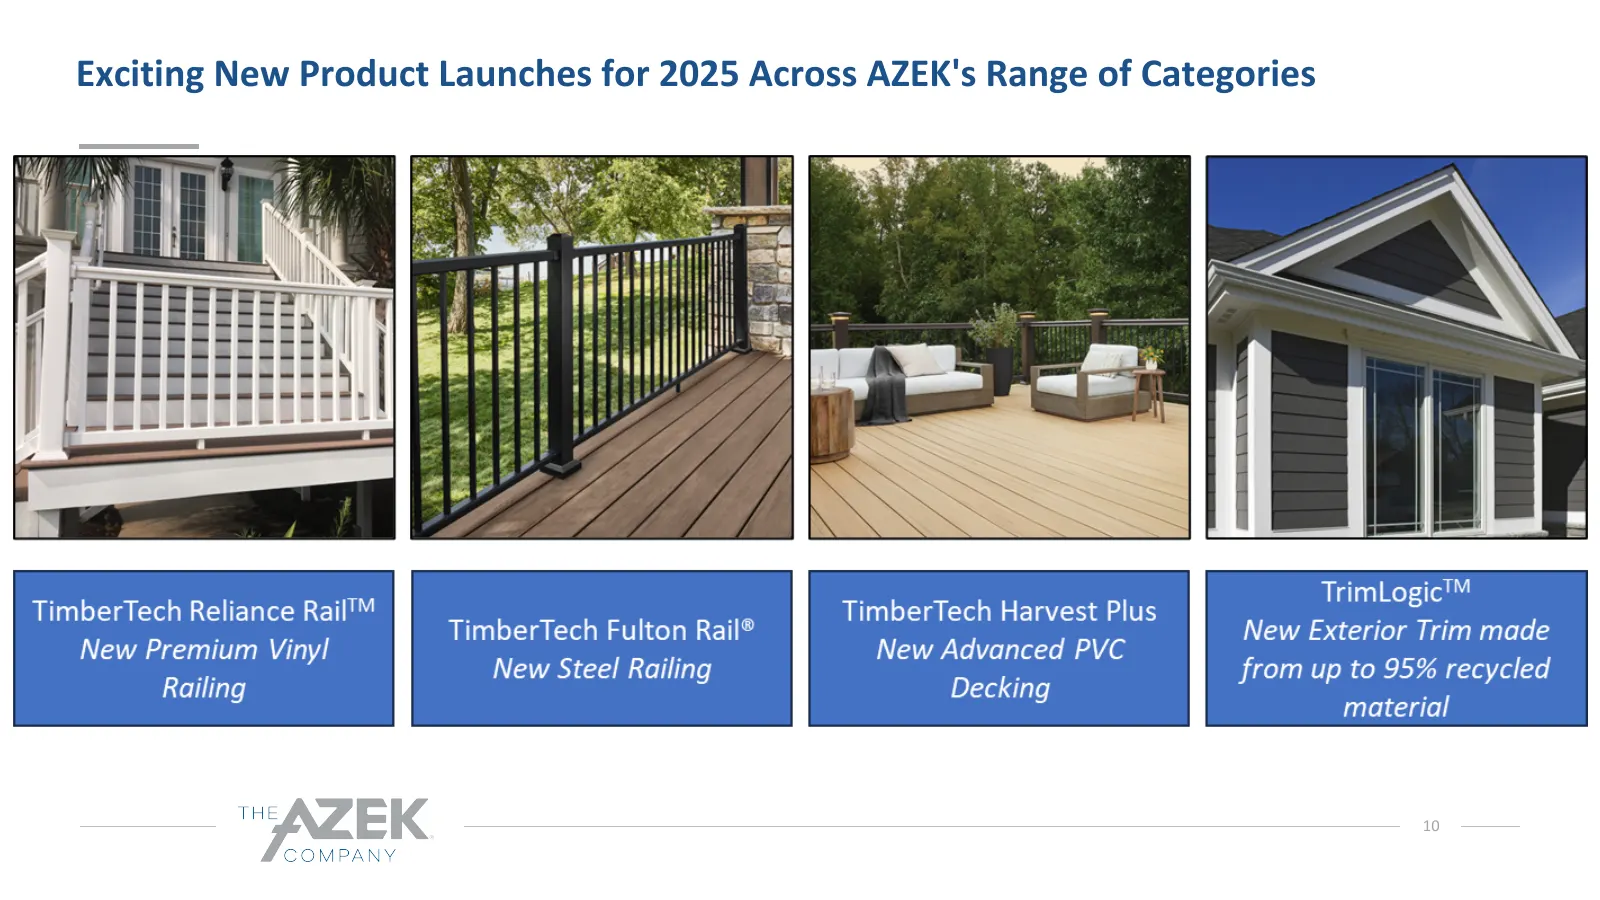
Slide 10: Exciting New Product Launches for 2025 Across AZEK's Range of Categories
Exciting New Product Launches for 2025 Across AZEK's Range of Categories 10
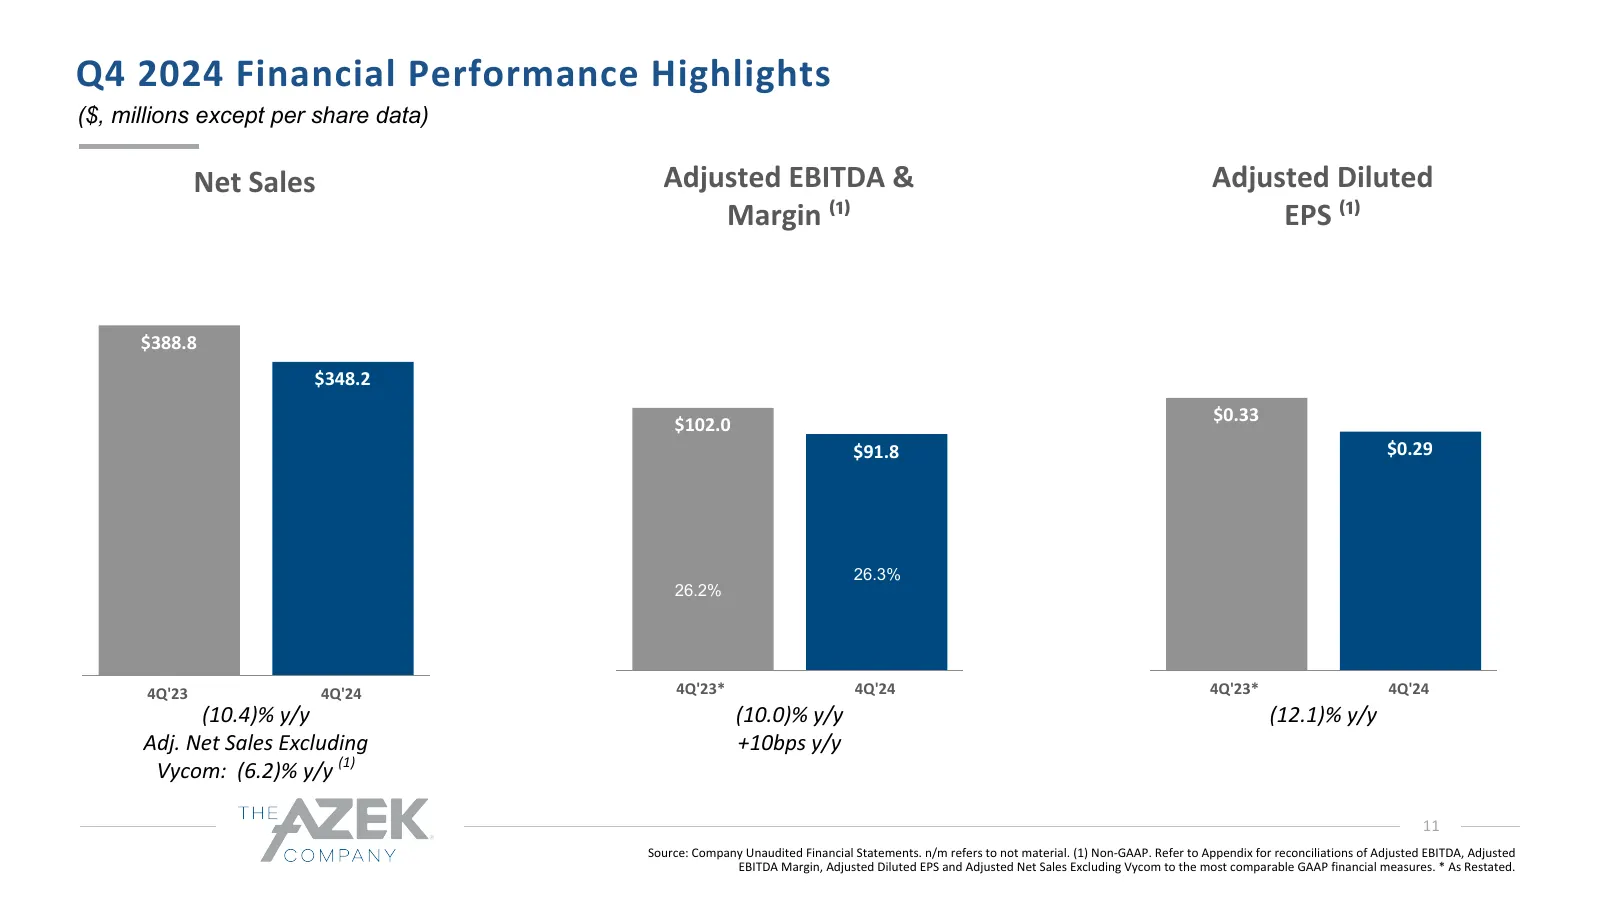
Slide 11: Q4 2024 Financial Performance Highlights
Q4 2024 Financial Performance Highlights ($, millions except per share data) Net Sales Adjusted EBITDA & Adjusted Diluted Margin ⁽¹⁾ EPS ⁽¹⁾ $388.8 $348.2 $0.33 $102.0 $91.8 $0.29 26.3% 26.2% 4Q'23 4Q'24 4Q'23* 4Q'24 4Q'23* 4Q'24 (10.4)% y/y (10.0)% y/y (12.1)% y/y Adj. Net Sales Excluding +10bps y/
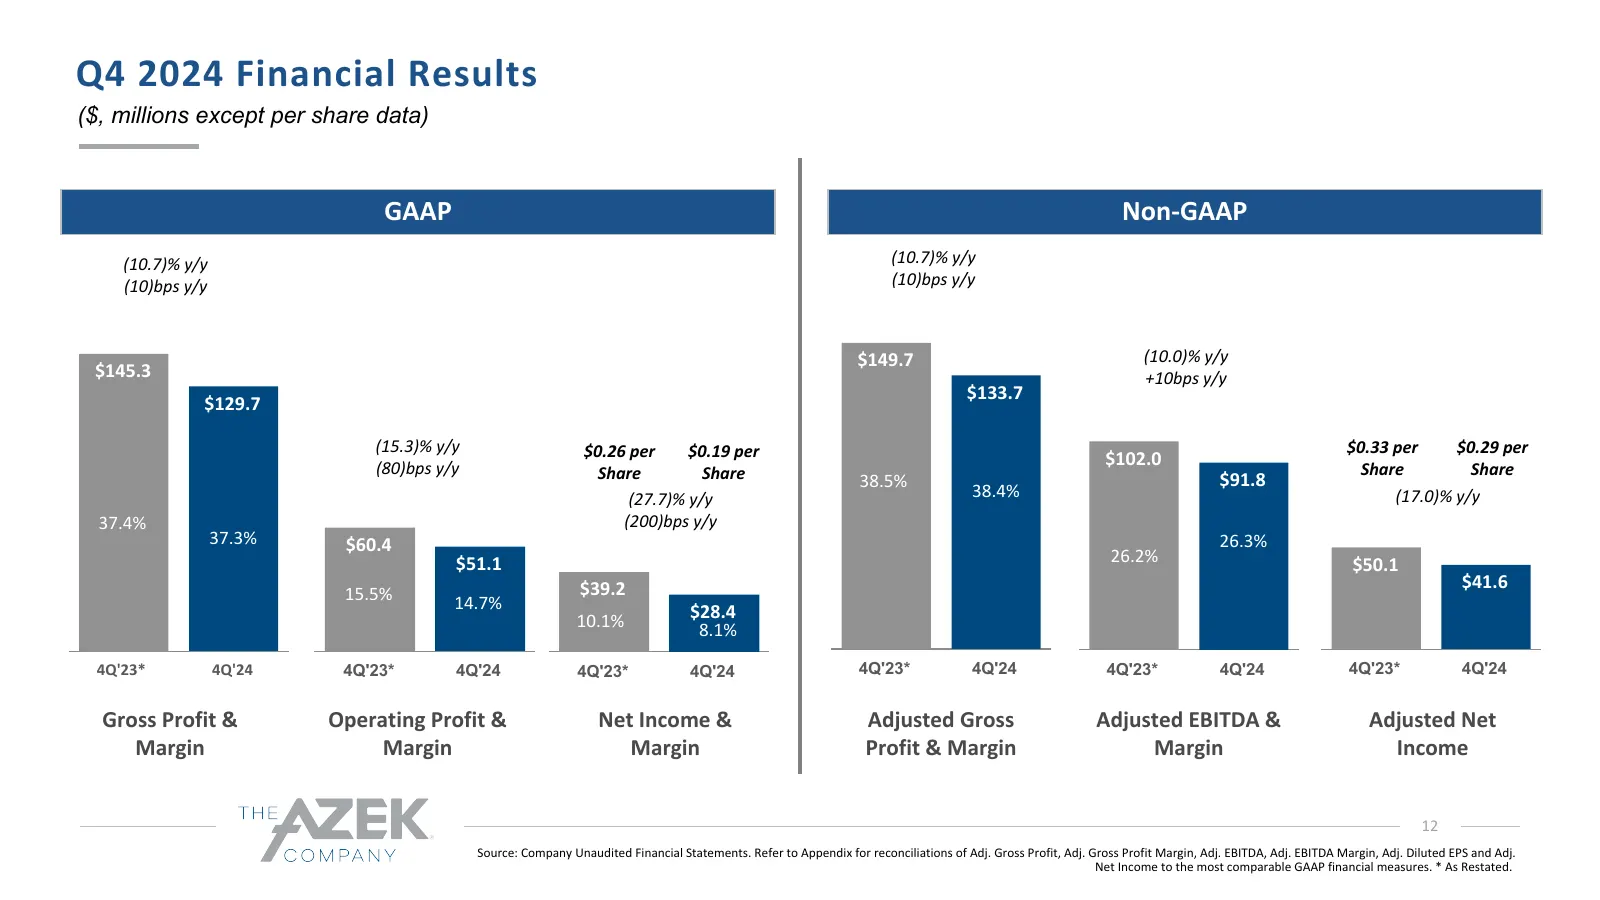
Slide 12: Q4 2024 Financial Results
Q4 2024 Financial Results ($, millions except per share data) GAAP Non-GAAP (10.7)% y/y (10.7)% y/y (10)bps y/y (10)bps y/y $149.7 (10.0)% y/y $145.3 +10bps y/y $133.7 $129.7 (15.3)% y/y $0.26 per $0.19 per $0.33 per $0.29 per (80)bps y/y $102.0 Share Share Share Share 38.5% $91.8 (27.7)% y/y 38.4%
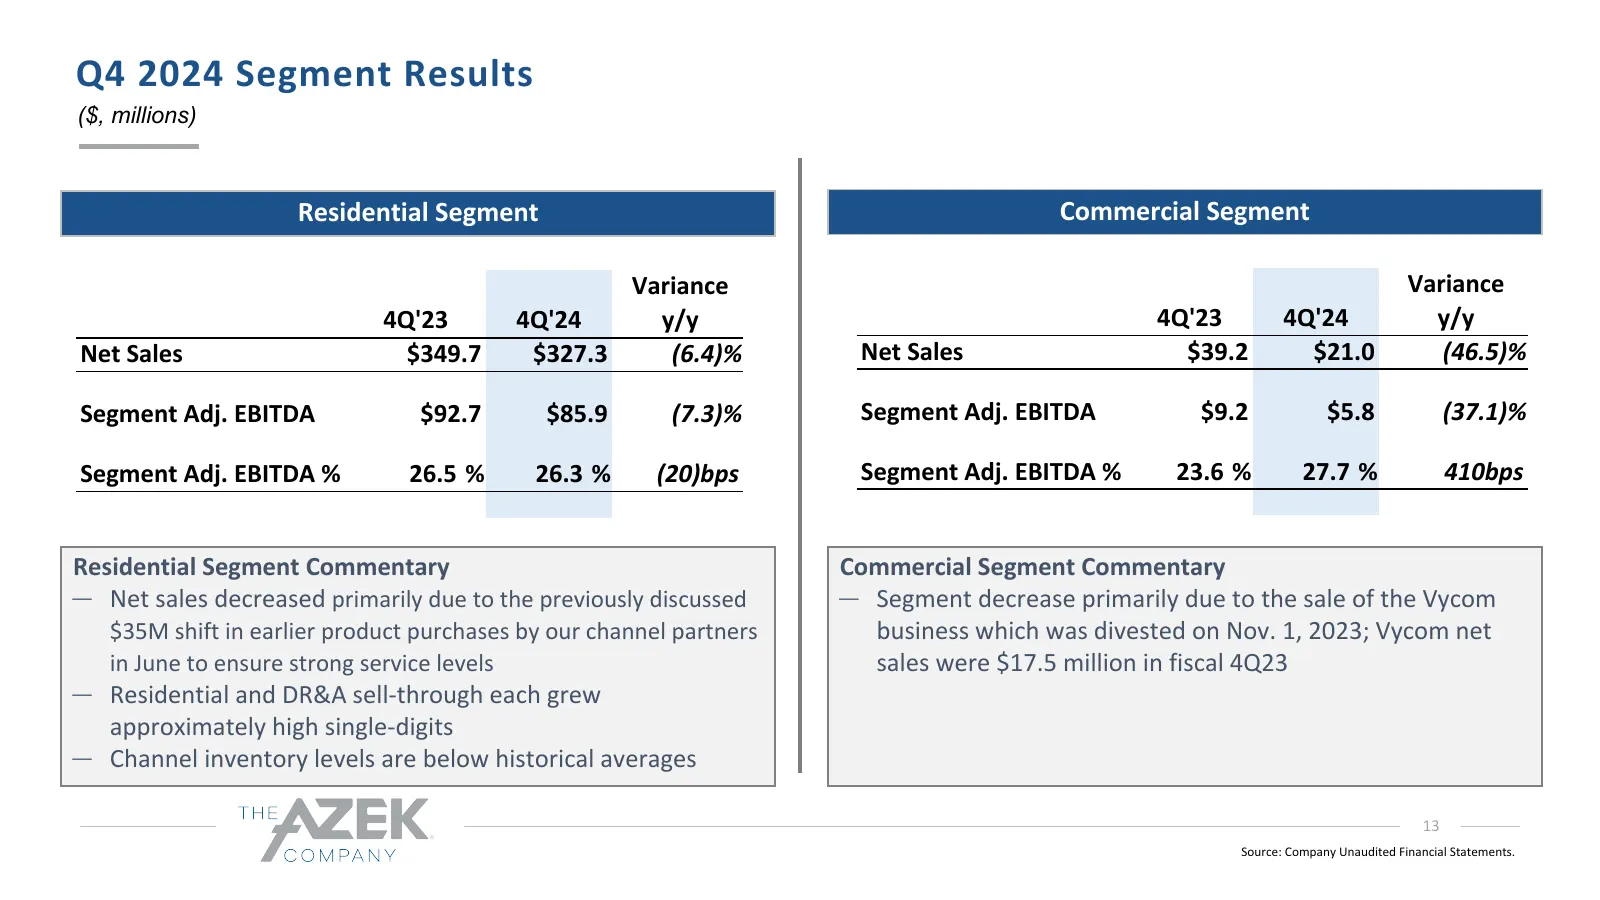
Slide 13: Q4 2024 Segment Results
Q4 2024 Segment Results ($, millions) Residential Segment Commercial Segment Variance Variance 4Q'23 4Q'24 y/y 4Q'23 4Q'24 y/y Net Sales $349.7 $327.3 (6.4)% Net Sales $39.2 $21.0 (46.5)% Segment Adj. EBITDA $92.7 $85.9 (7.3)% Segment Adj. EBITDA $9.2 $5.8 (37.1)% Segment Adj. EBITDA % 26.5 % 26.3 %
Slide 14: Q4 2024 Balance Sheet and Cash Flow Highlights
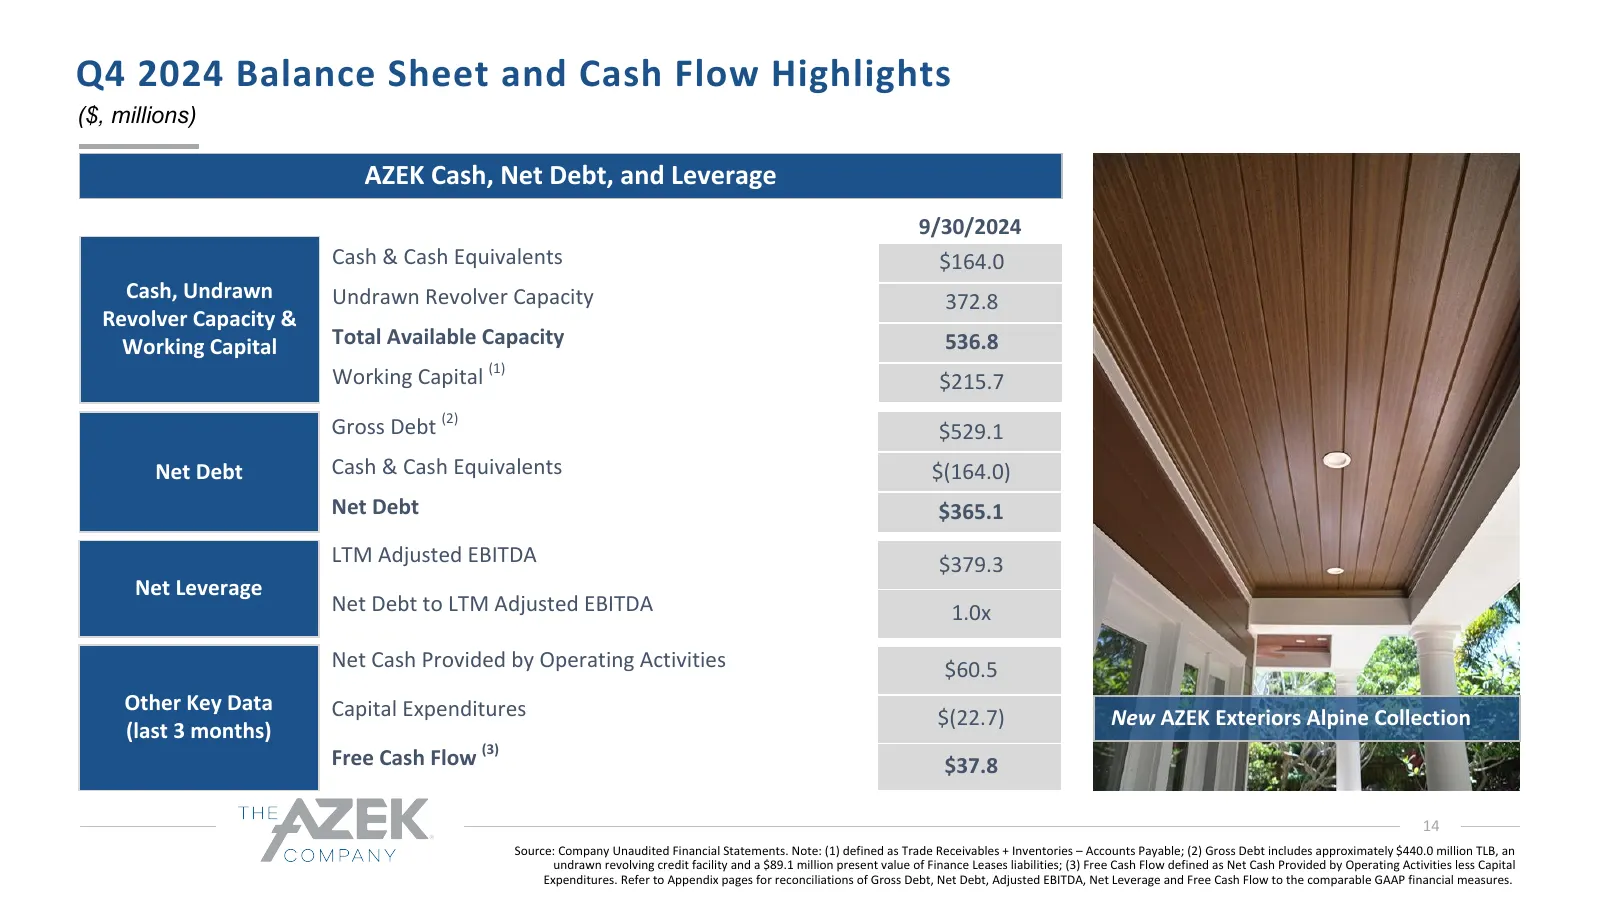
Q4 2024 Balance Sheet and Cash Flow Highlights ($, millions) AZEK Cash, Net Debt, and Leverage 9/30/2024 Cash & Cash Equivalents $164.0 Cash, Undrawn Undrawn Revolver Capacity 372.8 Revolver Capacity & Working Capital Total Available Capacity 536.8 Working Capital (1) $215.7 Gross Debt (2) $529.1 Ne
Slide 15: Fiscal Year 2025 Planning Assumptions
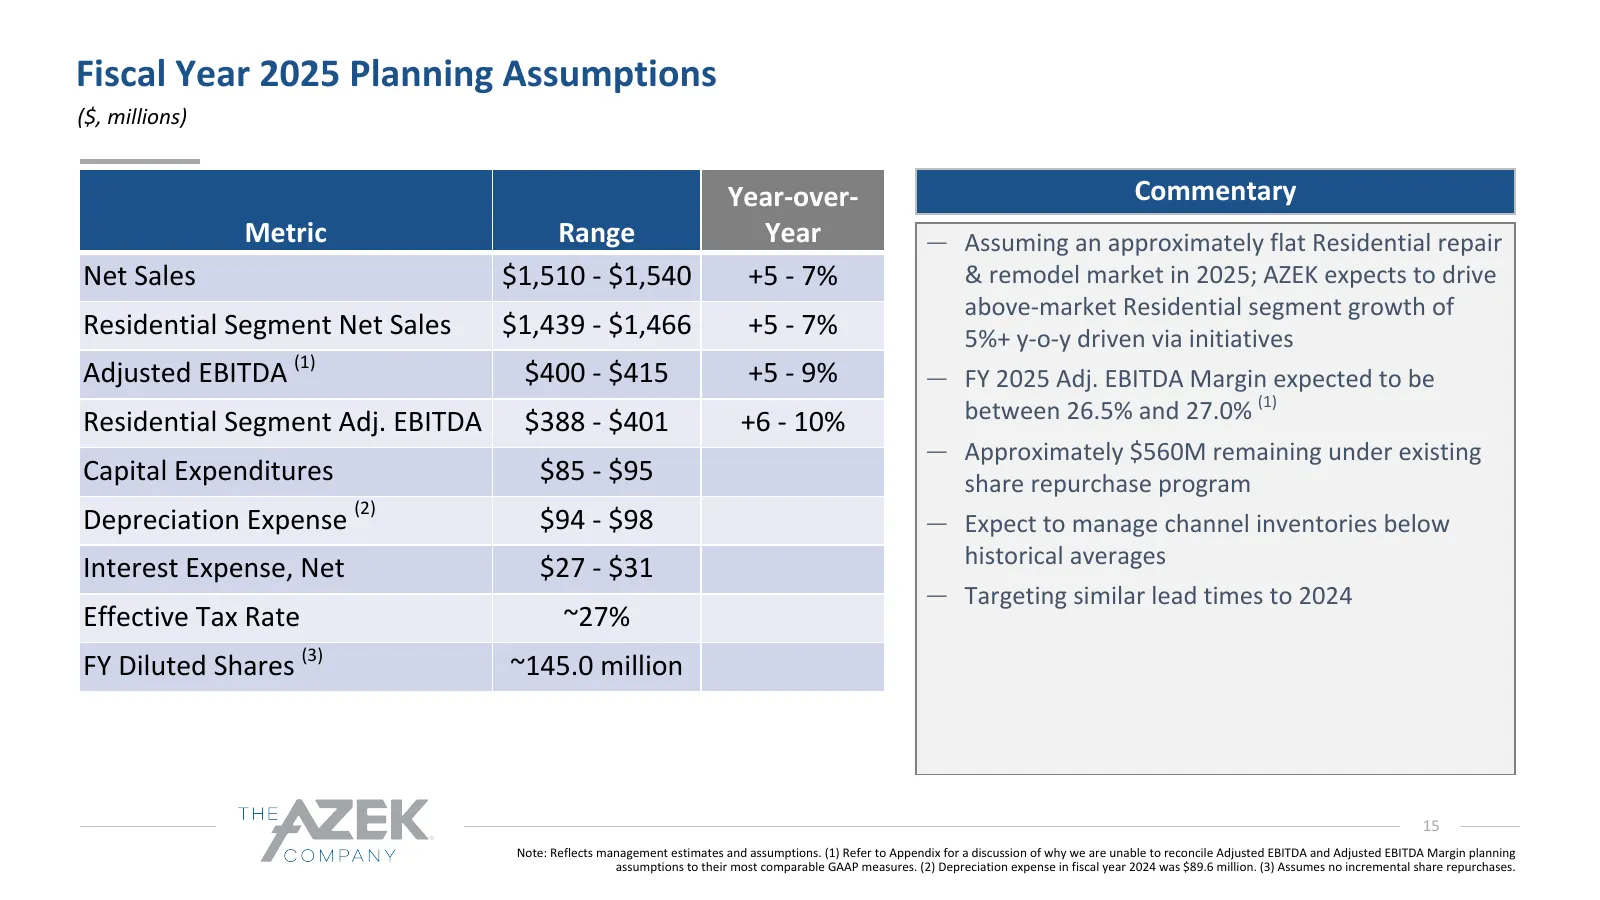
Fiscal Year 2025 Planning Assumptions ($, millions) Year-over- Commentary Metric Range Year ─ Assuming an approximately flat Residential repair Net Sales $1,510 - $1,540 +5 - 7% & remodel market in 2025; AZEK expects to drive above-market Residential segment growth of Residential Segment Net Sales $
Slide 16: Q1 2025 Guidance
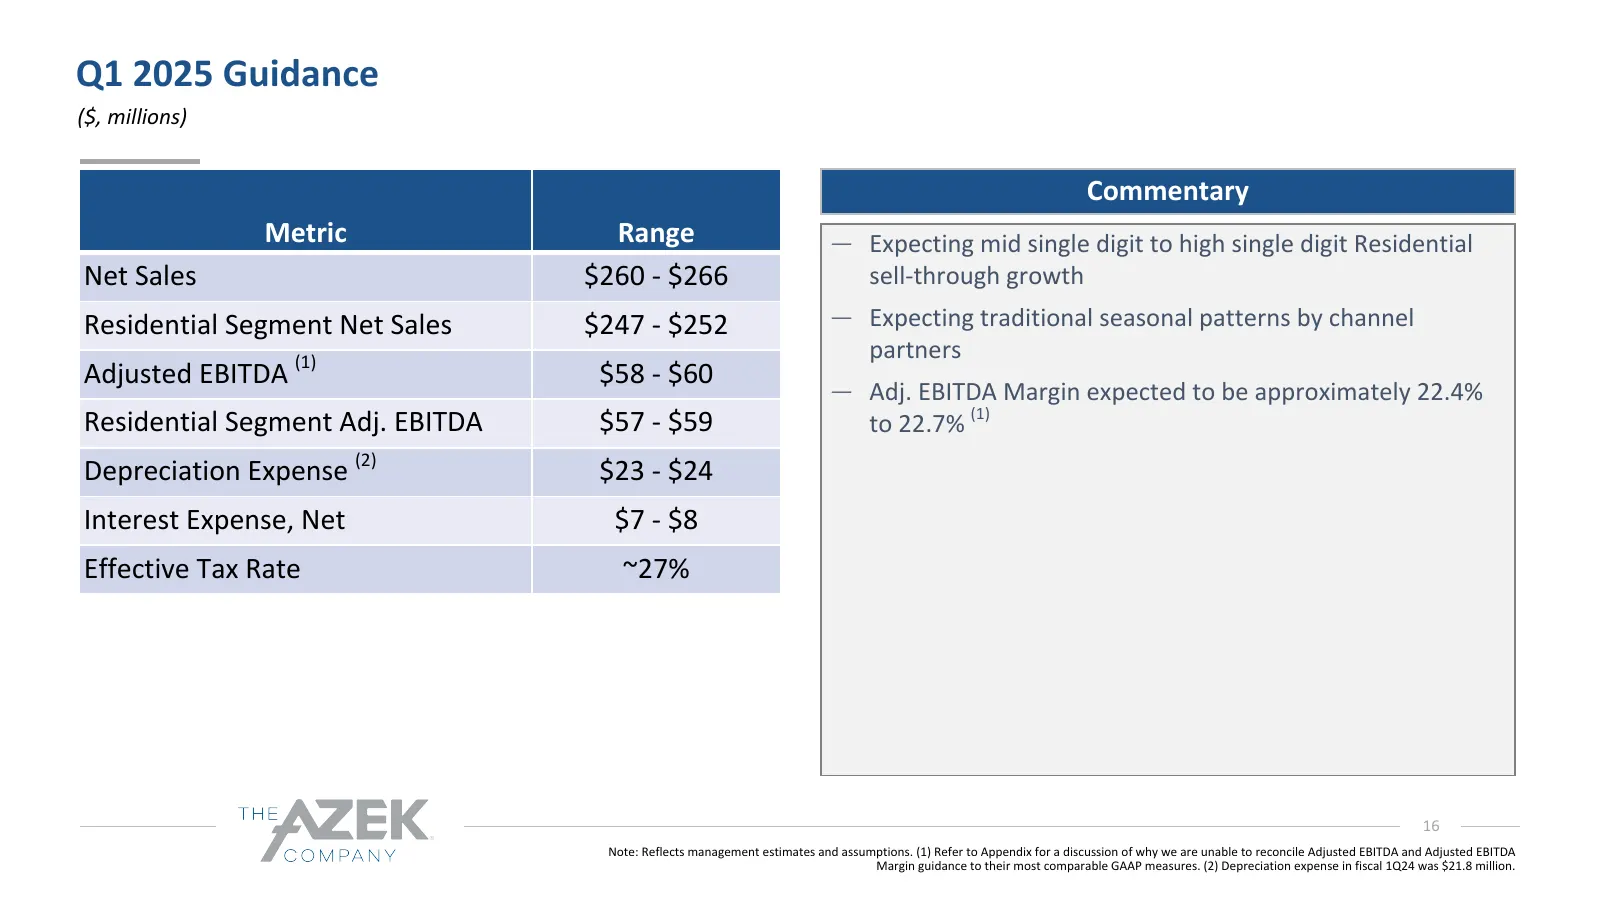
Q1 2025 Guidance ($, millions) Commentary Metric Range ─ Expecting mid single digit to high single digit Residential Net Sales $260 - $266 sell-through growth Residential Segment Net Sales $247 - $252 ─ Expecting traditional seasonal patterns by channel partners Adjusted EBITDA (1) $58 - $60 ─ Adj.
Slide 17: Appendix
Appendix
Slide 18: Non-GAAP Reconciliations
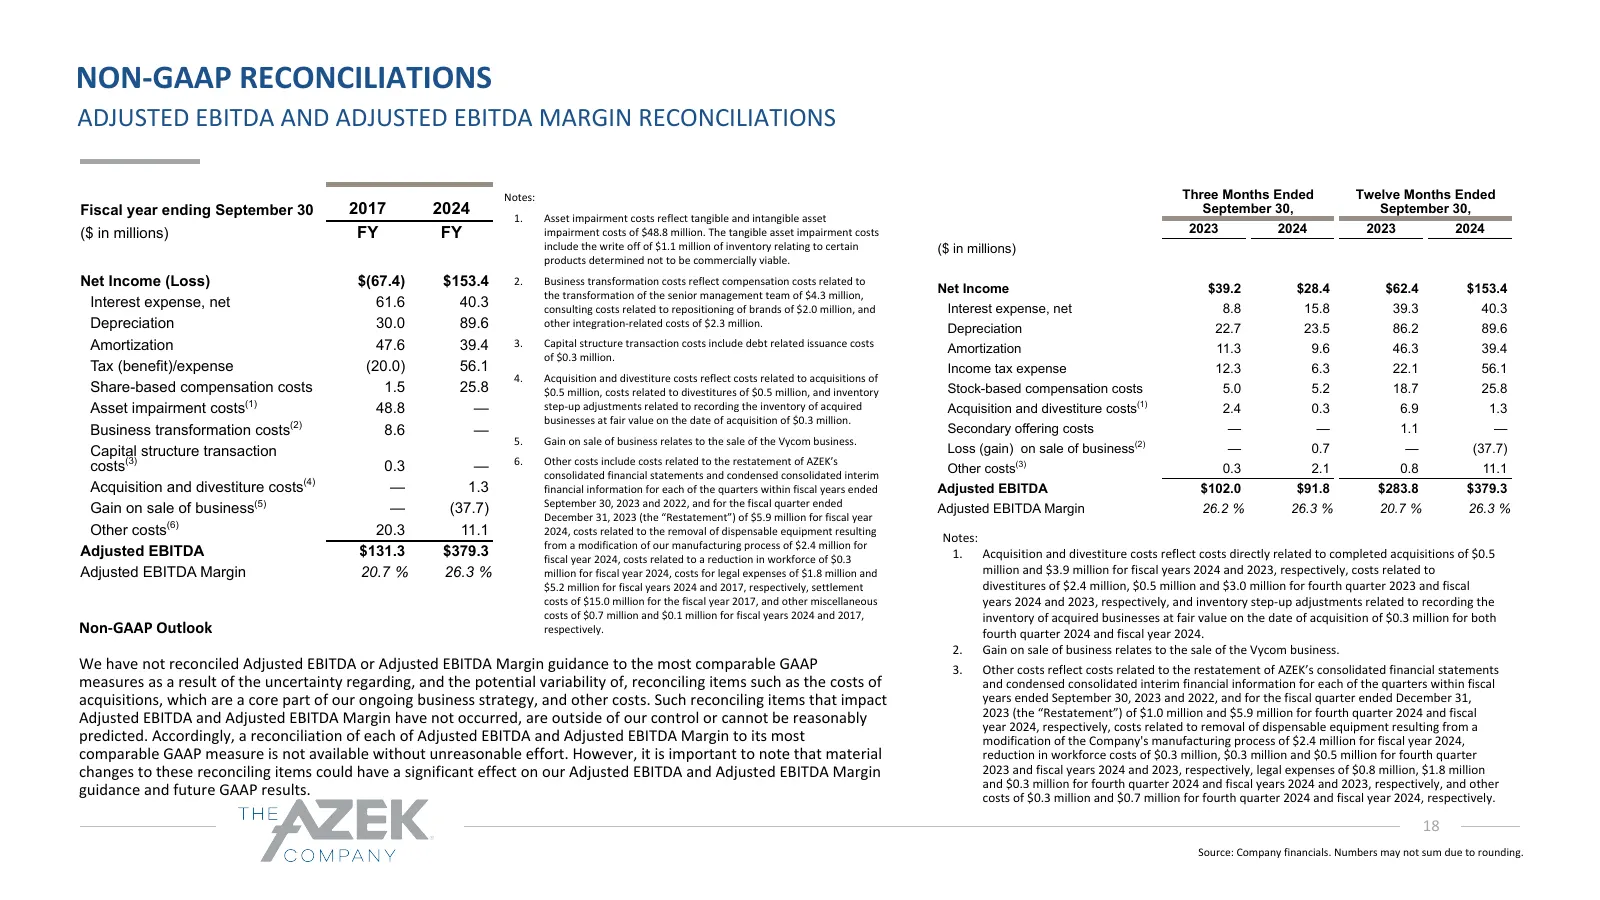
NON-GAAP RECONCILIATIONS ADJUSTED EBITDA AND ADJUSTED EBITDA MARGIN RECONCILIATIONS Notes: Three Months Ended Twelve Months Ended Fiscal year ending September 30 2017 2024 1. Asset impairment costs reflect tangible and intangible asset September 30, September 30, ($ in millions) FY FY impairment cos
Slide 19: Non-GAAP Reconciliations
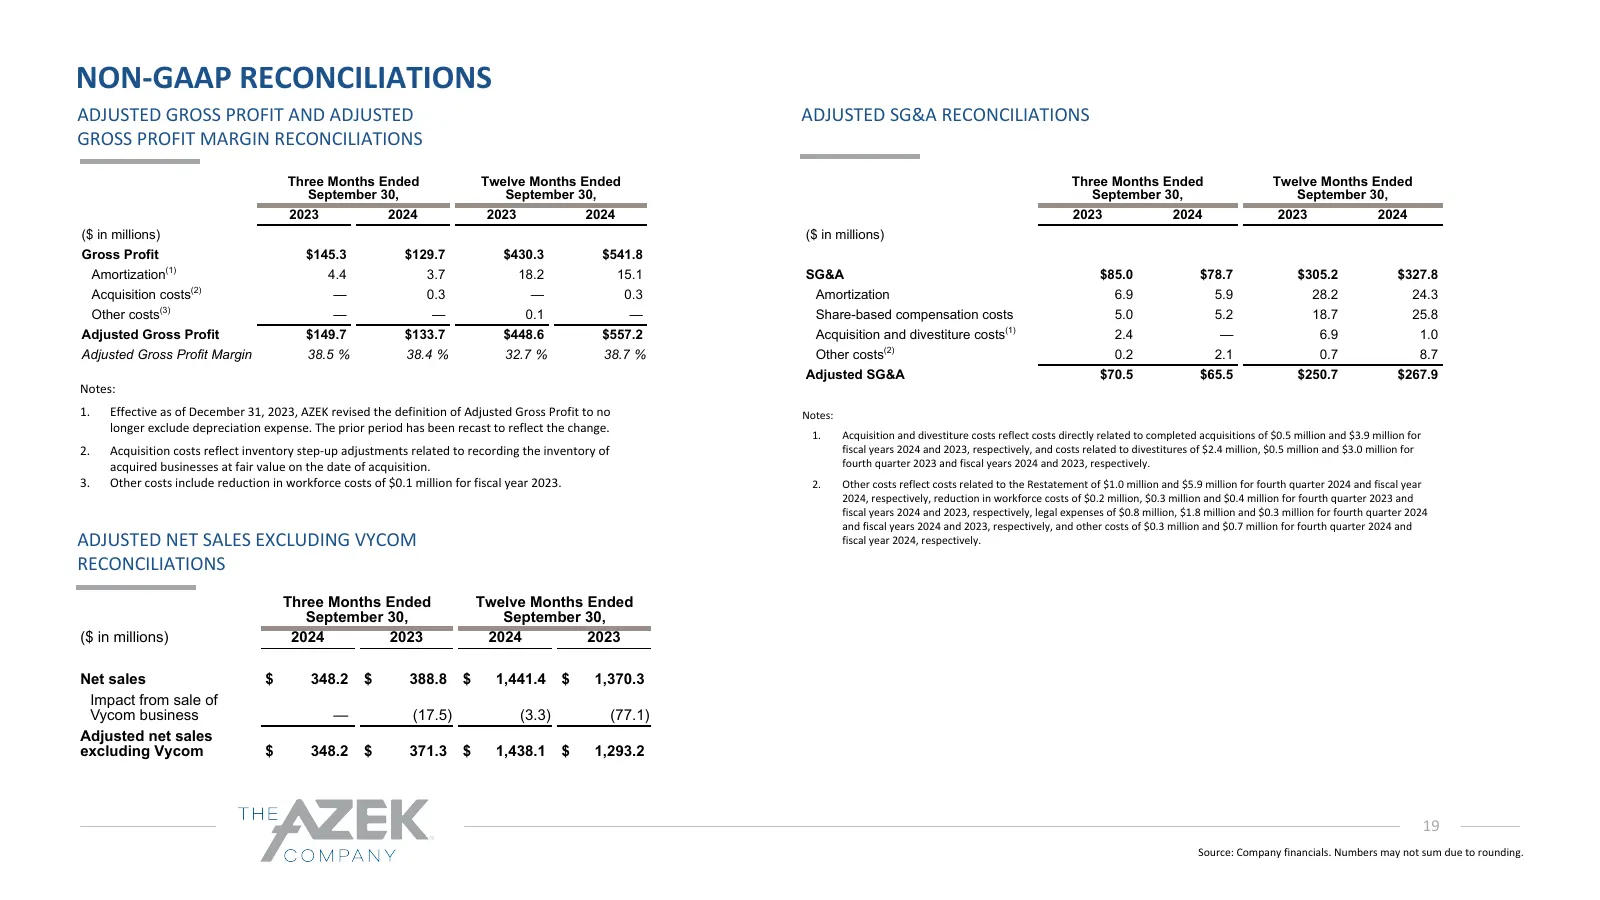
NON-GAAP RECONCILIATIONS ADJUSTED GROSS PROFIT AND ADJUSTED ADJUSTED SG&A RECONCILIATIONS GROSS PROFIT MARGIN RECONCILIATIONS Three Months Ended Twelve Months Ended Three Months Ended Twelve Months Ended September 30, September 30, September 30, September 30, 2023 2024 2023 2024 2023 2024 2023 2024
Slide 20: Non-GAAP Reconciliations
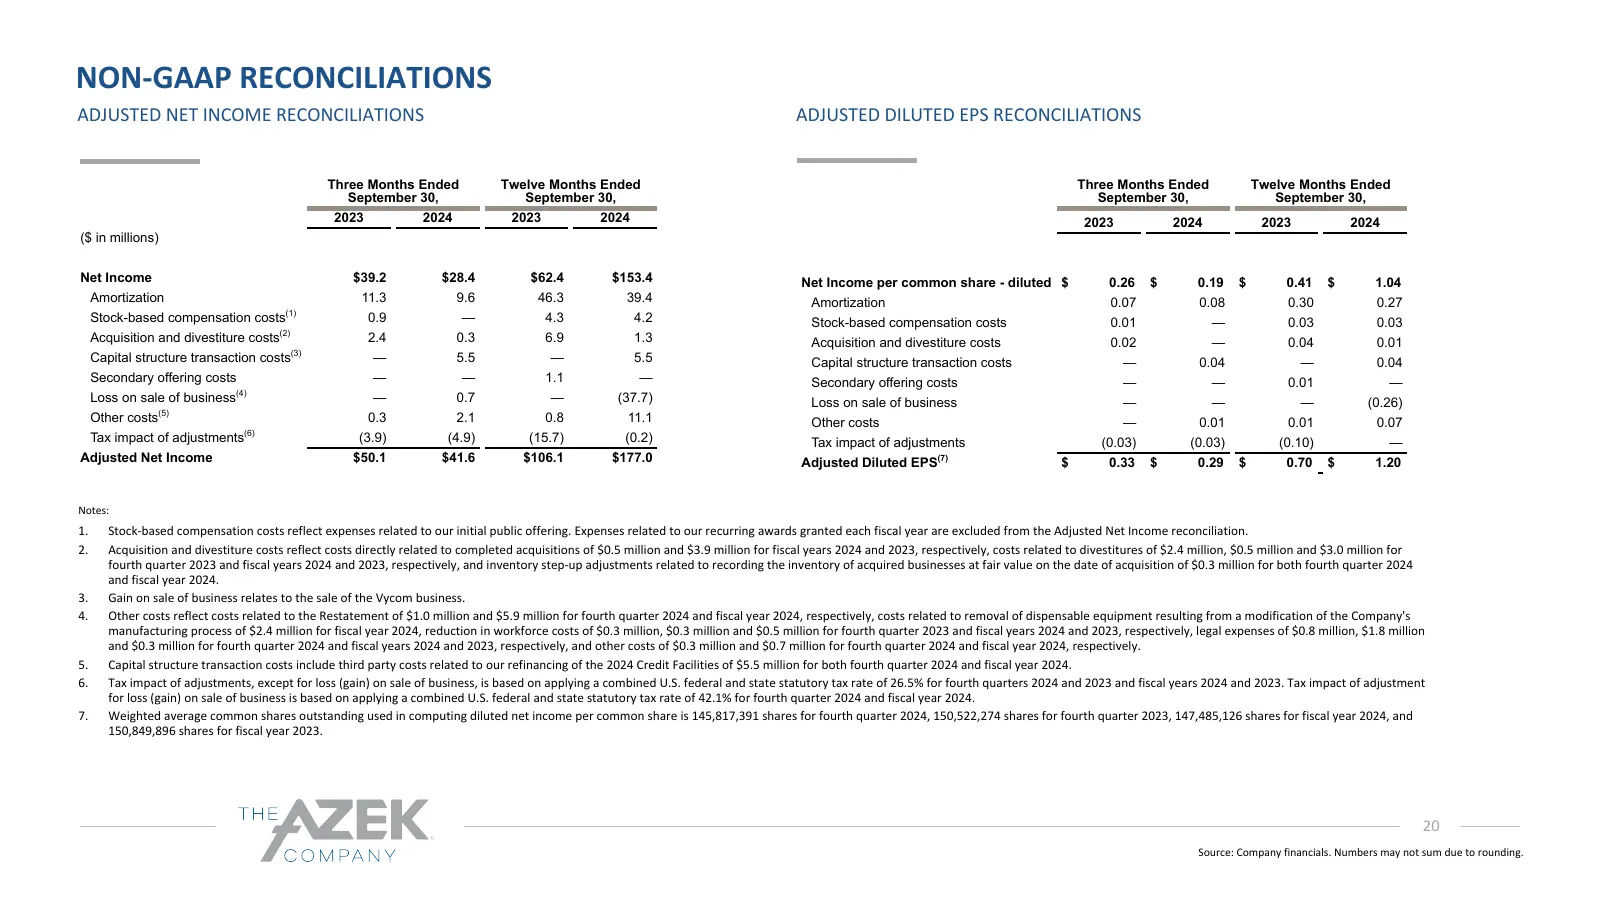
NON-GAAP RECONCILIATIONS ADJUSTED NET INCOME RECONCILIATIONS ADJUSTED DILUTED EPS RECONCILIATIONS Three Months Ended Twelve Months Ended Three Months Ended Twelve Months Ended September 30, September 30, September 30, September 30, 2023 2024 2023 2024 2023 2024 2023 2024 ($ in millions) Net Income $
Slide 21: Non-GAAP Reconciliations
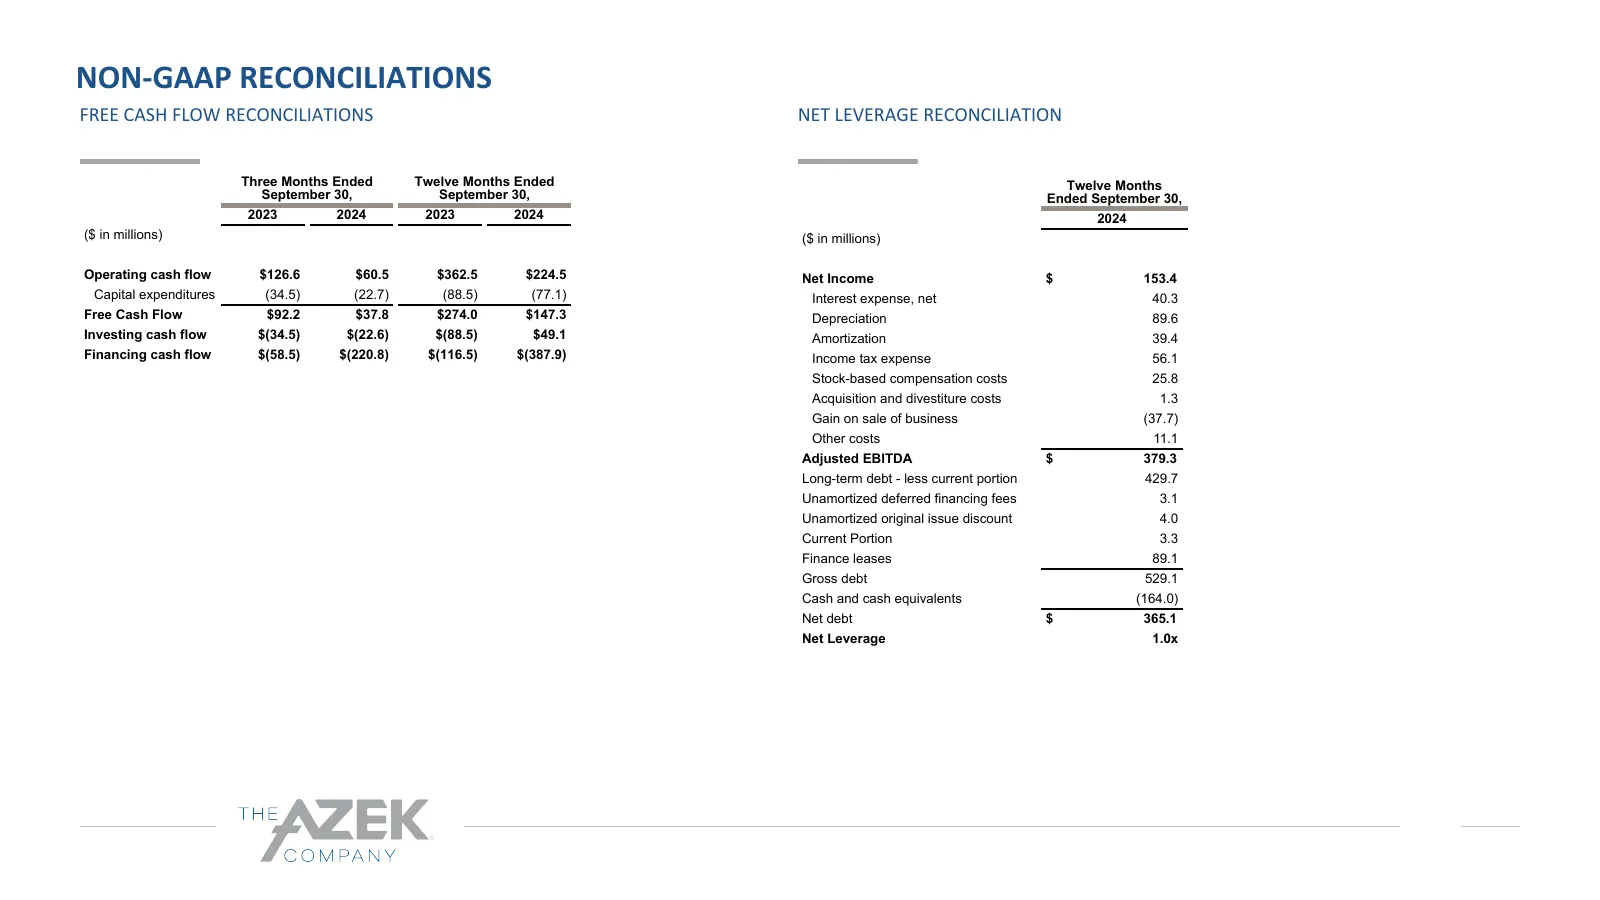
NON-GAAP RECONCILIATIONS FREE CASH FLOW RECONCILIATIONS NET LEVERAGE RECONCILIATION Three Months Ended Twelve Months Ended Twelve Months September 30, September 30, Ended September 30, 2023 2024 2023 2024 2024 ($ in millions) ($ in millions) Operating cash flow $126.6 $60.5 $362.5 $224.5 Net Income
Slide 22: Investor Relations Contact
Investor Relations Contact: Eric Robinson 312-809-1093 ir@azekco.com NYSE: AZEK
Source: EarningsCall slides
More decks from Azek Company Inc
 Q4 FY2025 Earnings Presentation24 slides · May 21, 2025
 Q2 2025 Earnings Presentation23 slides · May 6, 2025
 Merger or Acquisition (March 2025)27 slides · Mar 24, 2025
 Q1 2025 Earnings Presentation17 slides · Feb 4, 2025
 Q3 2024 Earnings Presentation18 slides · Aug 7, 2024
 Q2 2024 Earnings Presentation18 slides · May 8, 2024