comScore, Inc. · NASDAQ:SCOR
comScore — comScore and Conductor Webinar: SEO & Retail (April 2010)
42 slides from comScore's conference presentation, April 2010

Slide 1: SEO & Retail: Who Are the Top Performers and How Do You Become One?
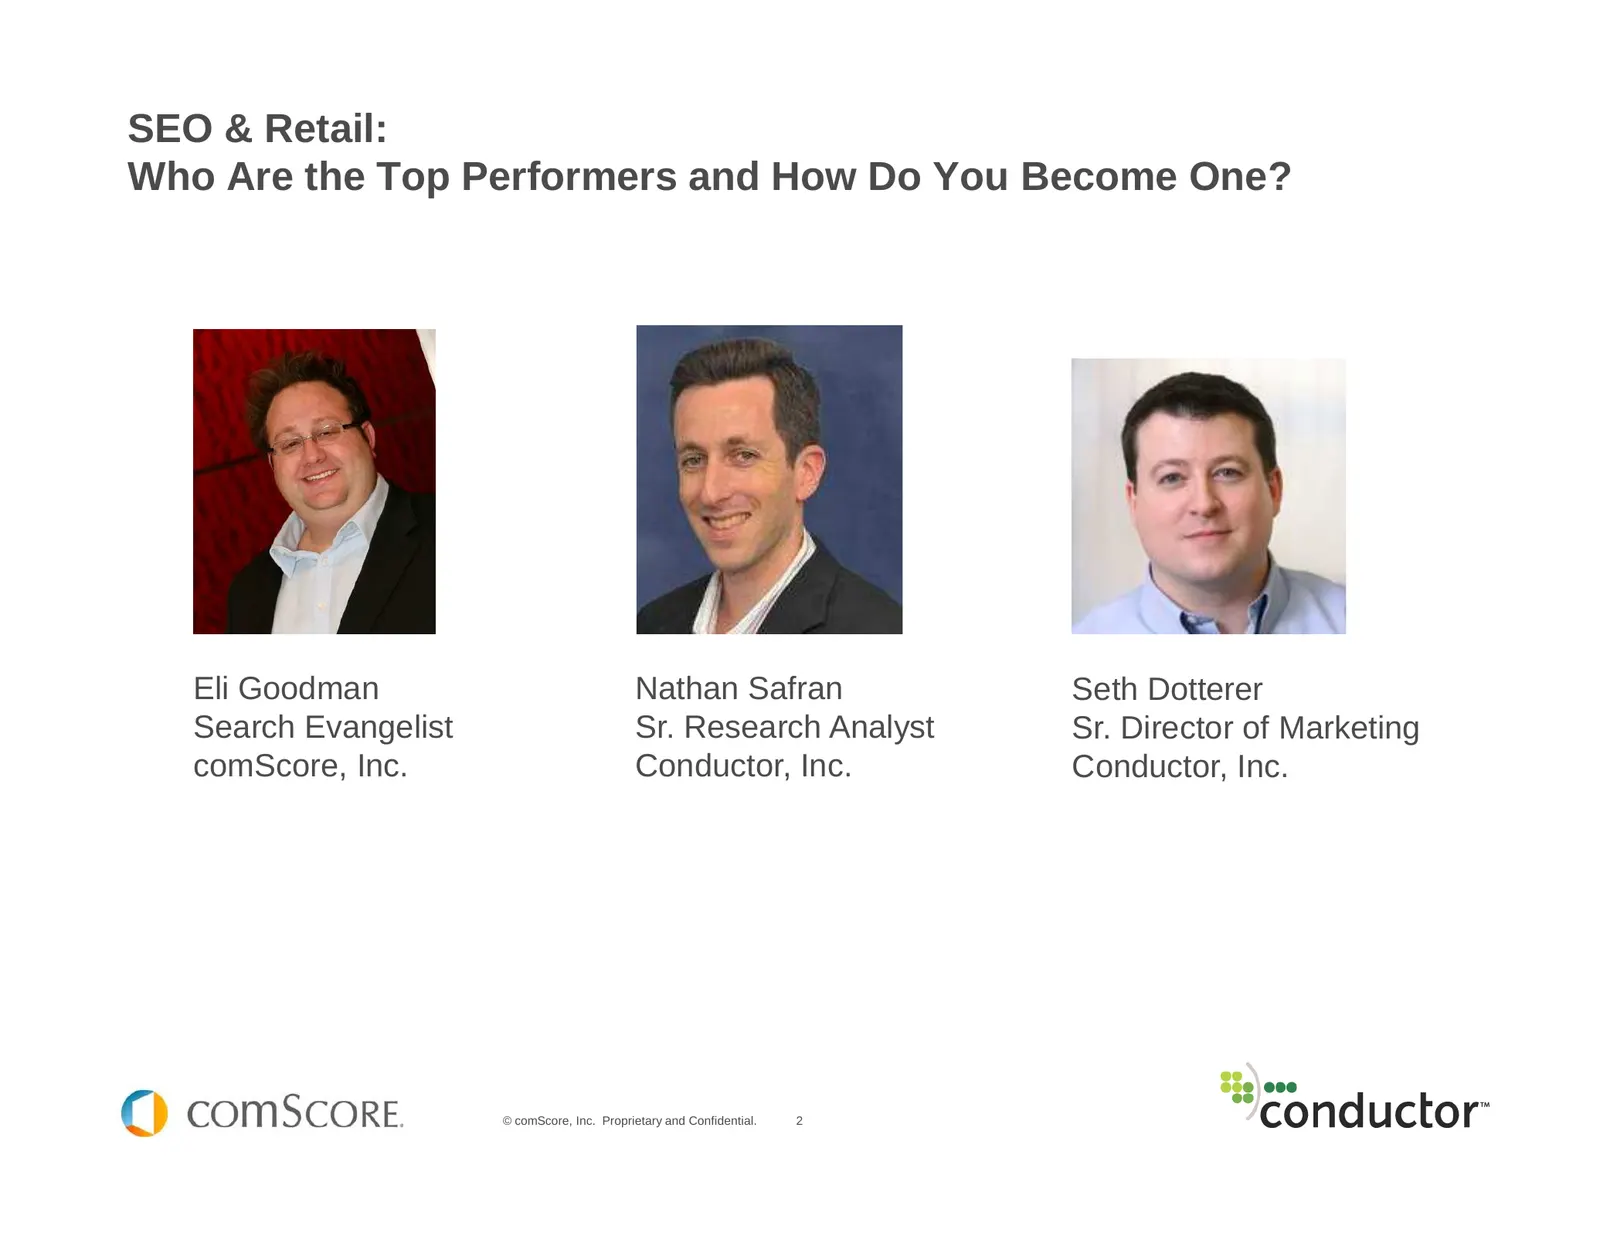
SEO & Retail Who Are the Top Performers and How Do You Become One? Eli Goodman Nathan Safran Seth Dotterer Search Evangelist Sr. Research Analyst Sr. Director of Marketing comScore, Inc. Conductor Conductor
Slide 2: SEO & Retail: Who Are the Top Performers and How Do You Become One?
SEO & Retail: Who Are the Top Performers and How Do You Become One? Eli Goodman Nathan Safran Seth Dotterer Search Evangelist Sr. Research Analyst Sr. Director of Marketing comScore, Inc. Conductor, Inc. Conductor, Inc. © comScore, Inc. Proprietary and Confidential. 2
Slide 3: Agenda
Agenda State of Search State of Retail Search Where are they searching? Where are they clicking? How are they searching? Conductor’s Internet Retailer 500 Natural Search Visibility Study A 3 tiered approach to success in natural search © comScore, Inc. Proprietary and Confidential. 3
Slide 4: Powerful Platform
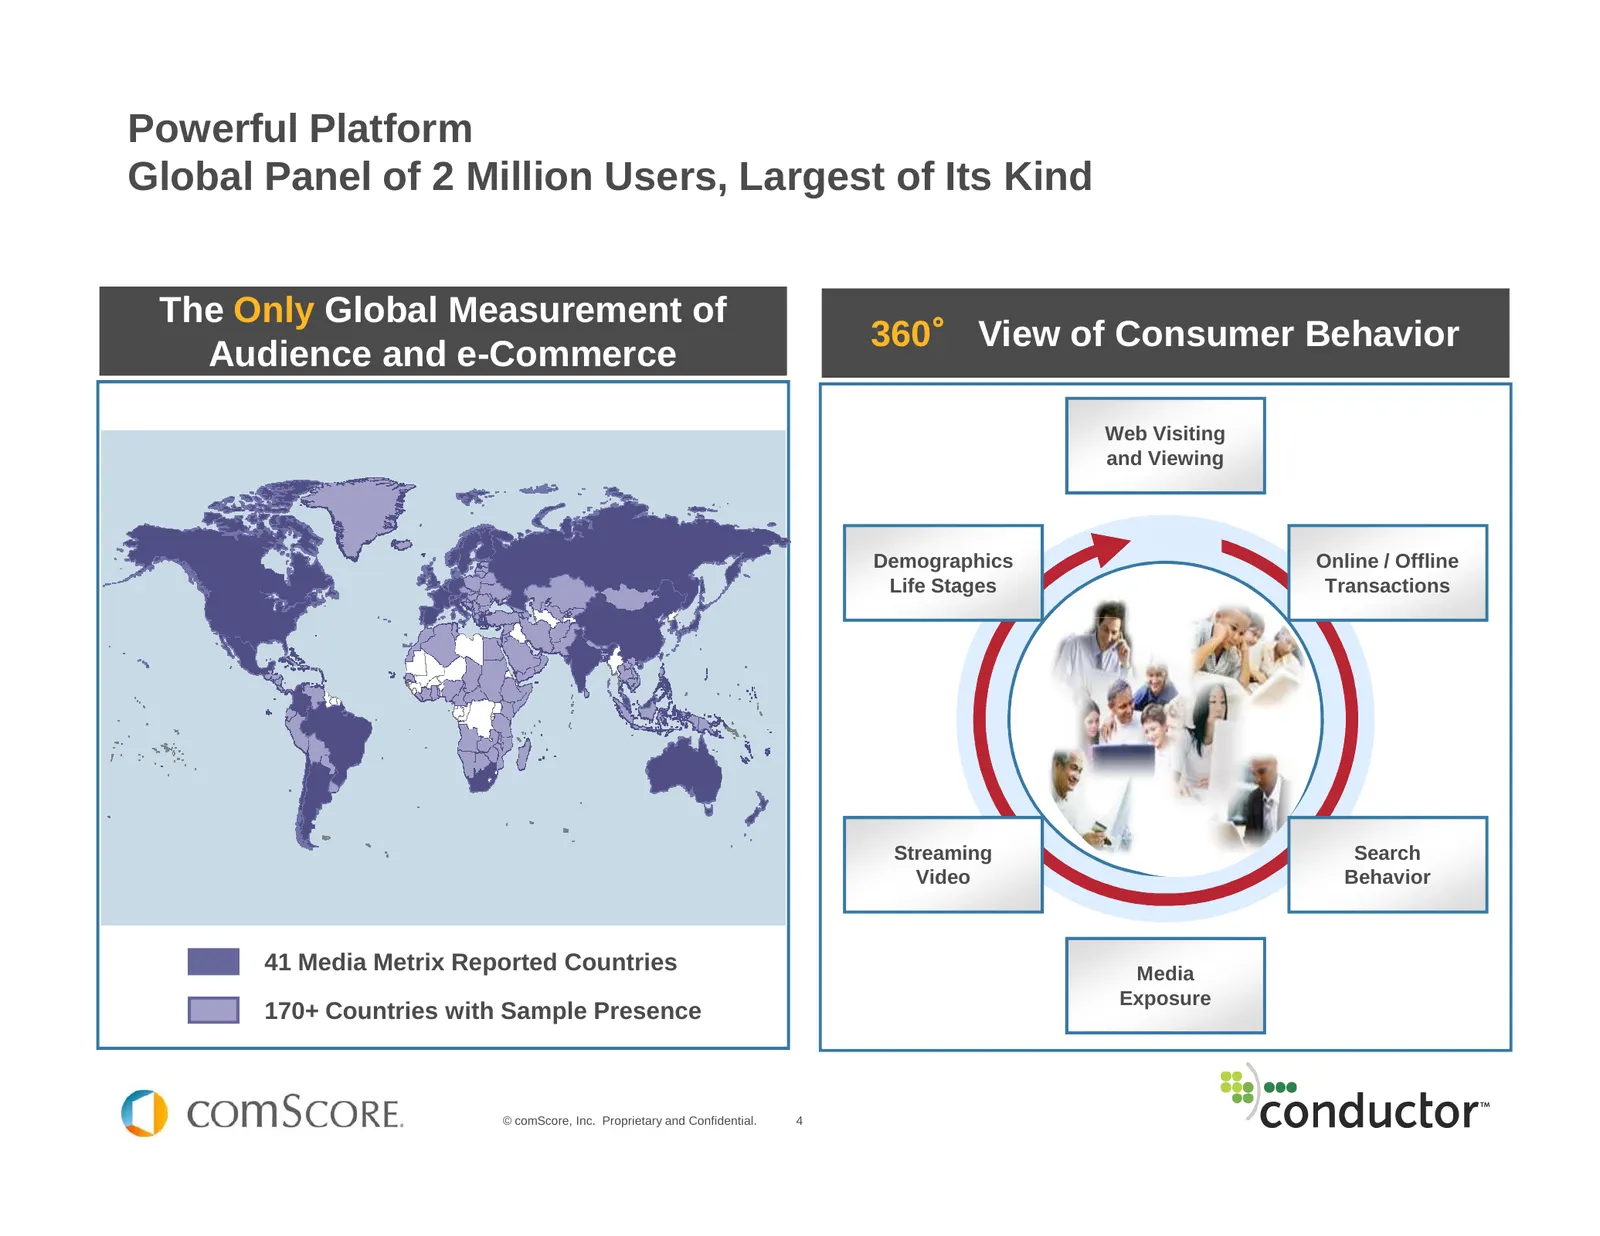
Powerful Platform Global Panel of 2 Million Users, Largest of Its Kind The Only Global Measurement of ° View of Consumer Behavior 360° Audience and e-Commerce Web Visiting and Viewing Demographics Online / Offline Life Stages Transactions Streaming Search Video Behavior 41 Media Metrix Reported Coun
Slide 5: About Conductor, Inc.
About Conductor, Inc. • Conductor has developed the leading platform for analyzing, managing, and optimizing natural search for the Mid-Market and Enterprise – Conductor Searchlight • 65+ employees, with backgrounds from Google, Yahoo, MSN, agencies, and technology providers • Largest technology com
Slide 6: 22.3 Billion Searches: 16% YOY Growth
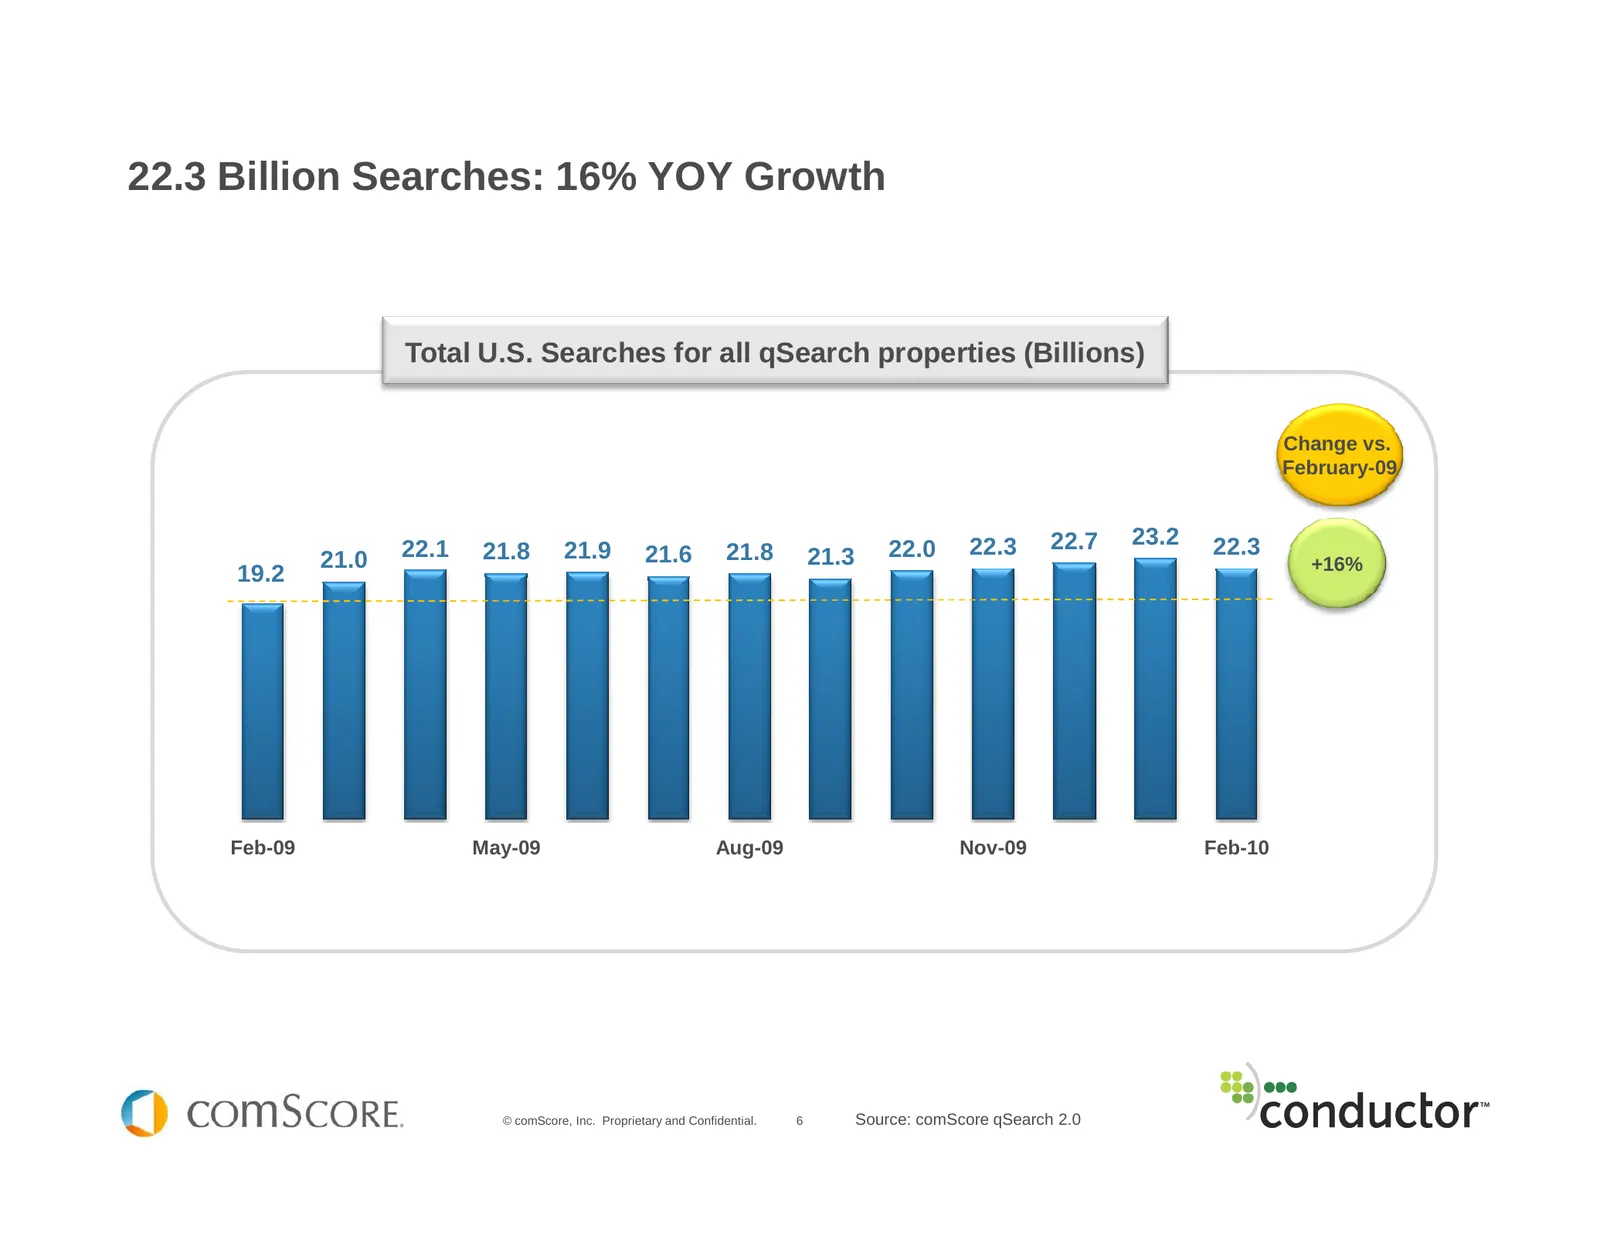
22.3 Billion Searches: 16% YOY Growth Total U.S. Searches for all qSearch properties (Billions) Change vs. February-09 22.3 22.7 23.2 22.3 21.0 22.1 21.8 21.9 21.6 21.8 21.3 22.0 +16% 19.2 Feb-09 May-09 Aug-09 Nov-09 Feb-10 © comScore, Inc. Proprietary and Confidential. 6 Source: comScore qSearch 2.
Slide 7: Search Growth is Driven by Increased Intensity and an Increasing Searcher Base
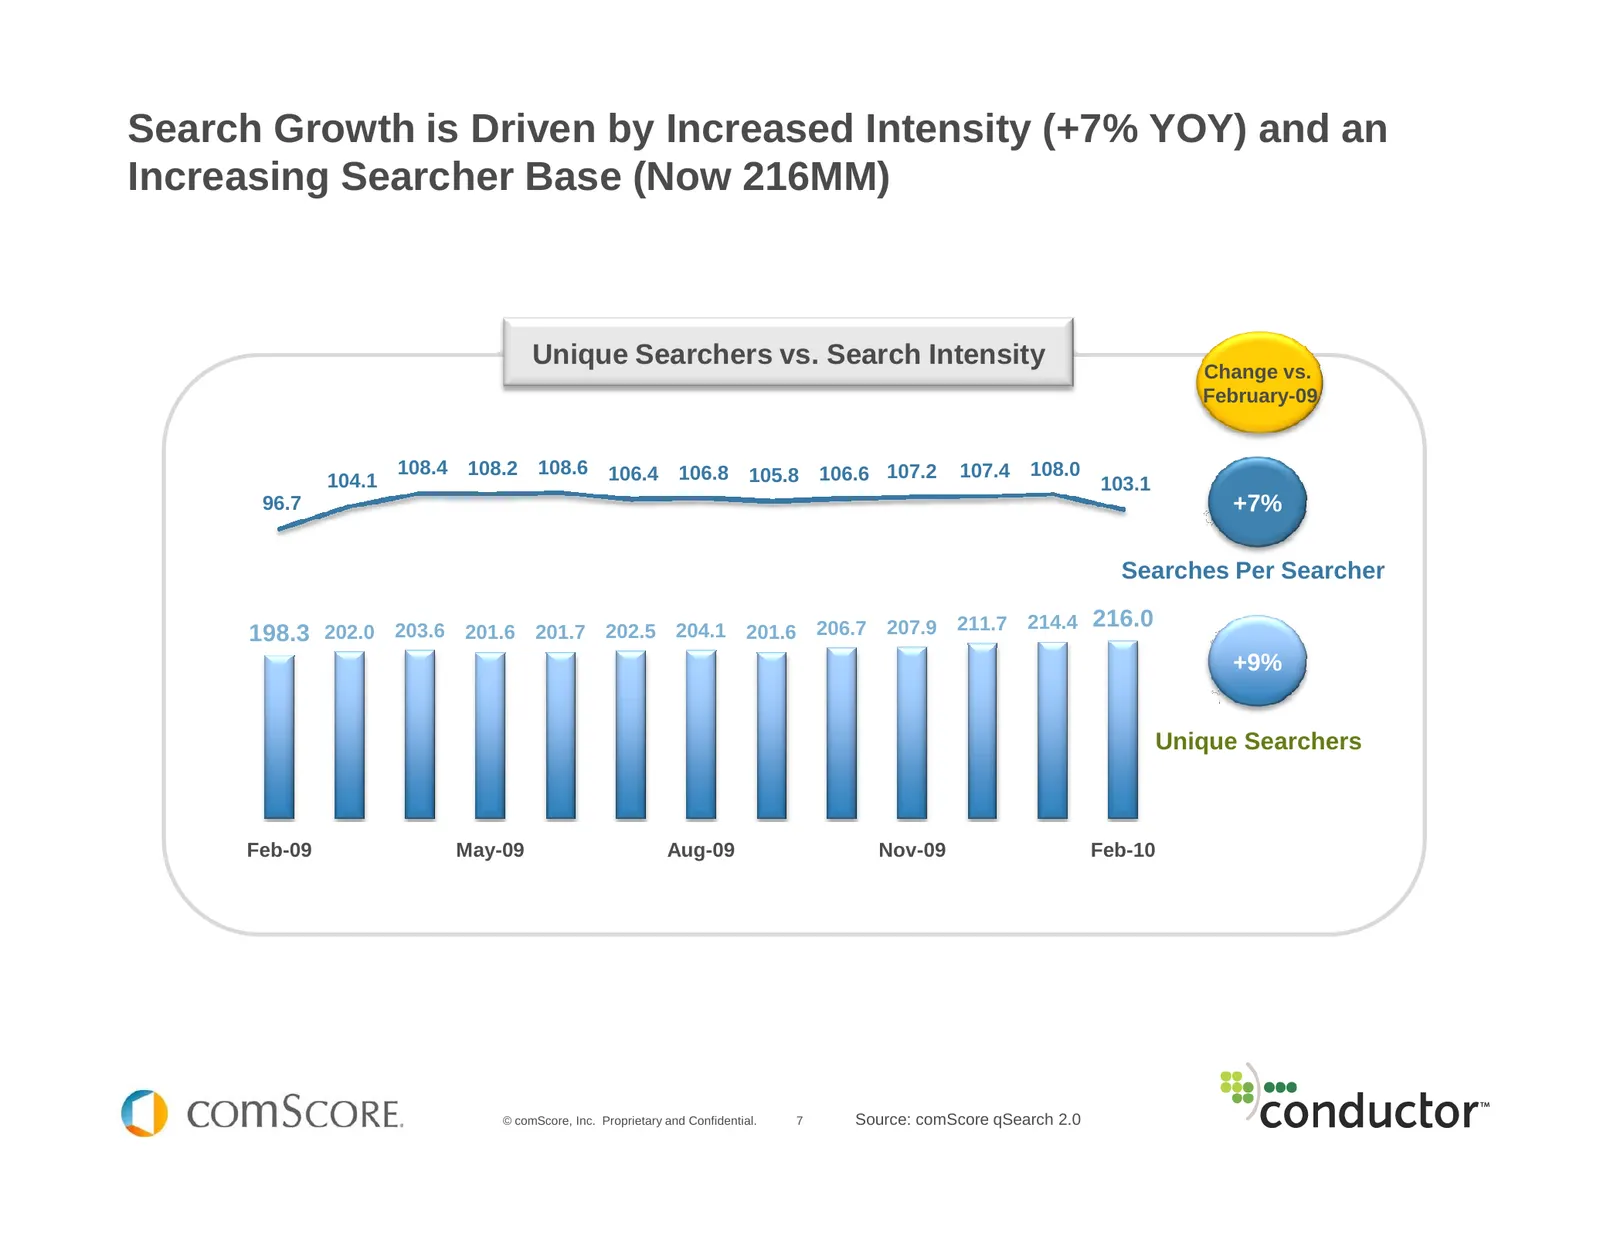
Search Growth is Driven by Increased Intensity (+7% YOY) and an Increasing Searcher Base (Now 216MM) Unique Searchers vs. Search Intensity Change vs. February-09 108.4 108.2 108.6 106.4 106.8 105.8 106.6 107.2 107.4 108.0 400.0 104.1 103.1 96.7 +7% 100.0 350.0 300.0 Searches 80.0 Per Searcher 250.0
Slide 8: Heavy Searchers' Intensity Grew the Most YOY
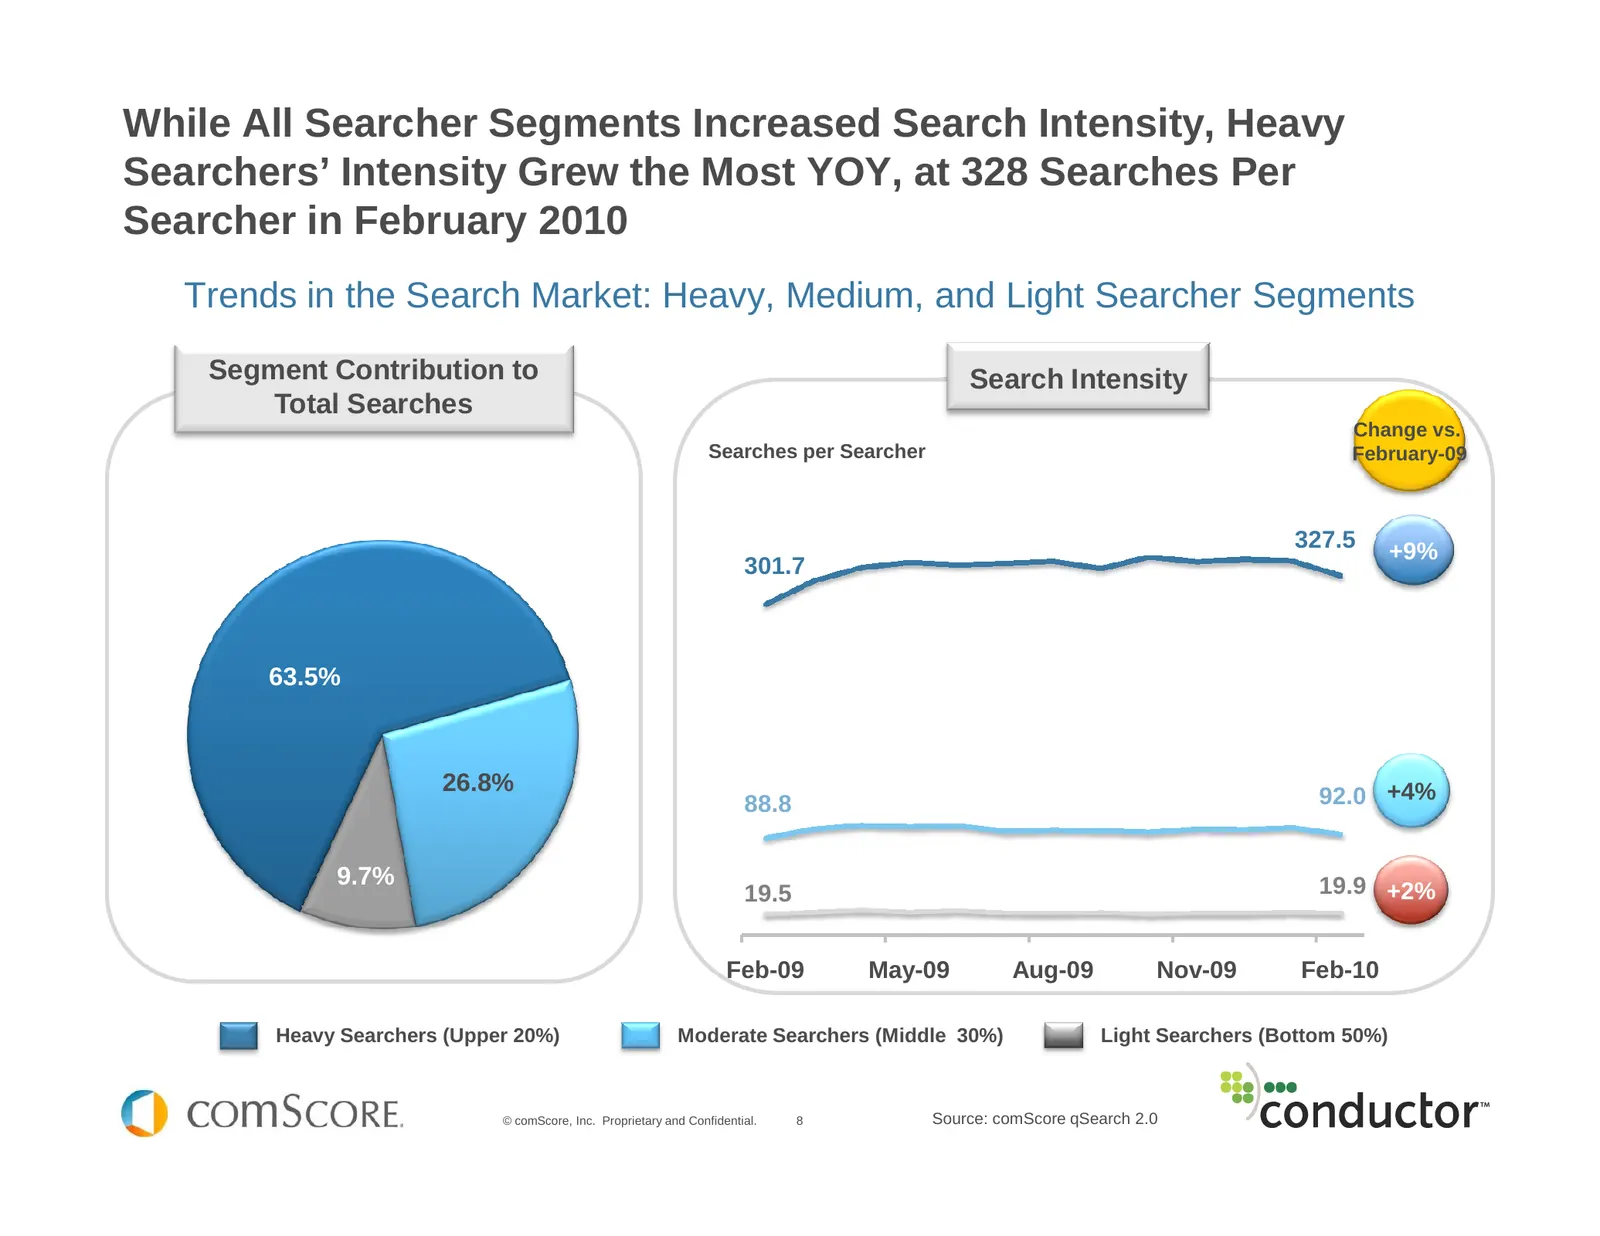
While All Searcher Segments Increased Search Intensity, Heavy Searchers’ Intensity Grew the Most YOY, at 328 Searches Per Searcher in February 2010 Trends in the Search Market: Heavy, Medium, and Light Searcher Segments Segment Contribution to Search Intensity Total Searches Change vs. Searches per
Slide 9: Search Isn't Confined to the Engines Anymore
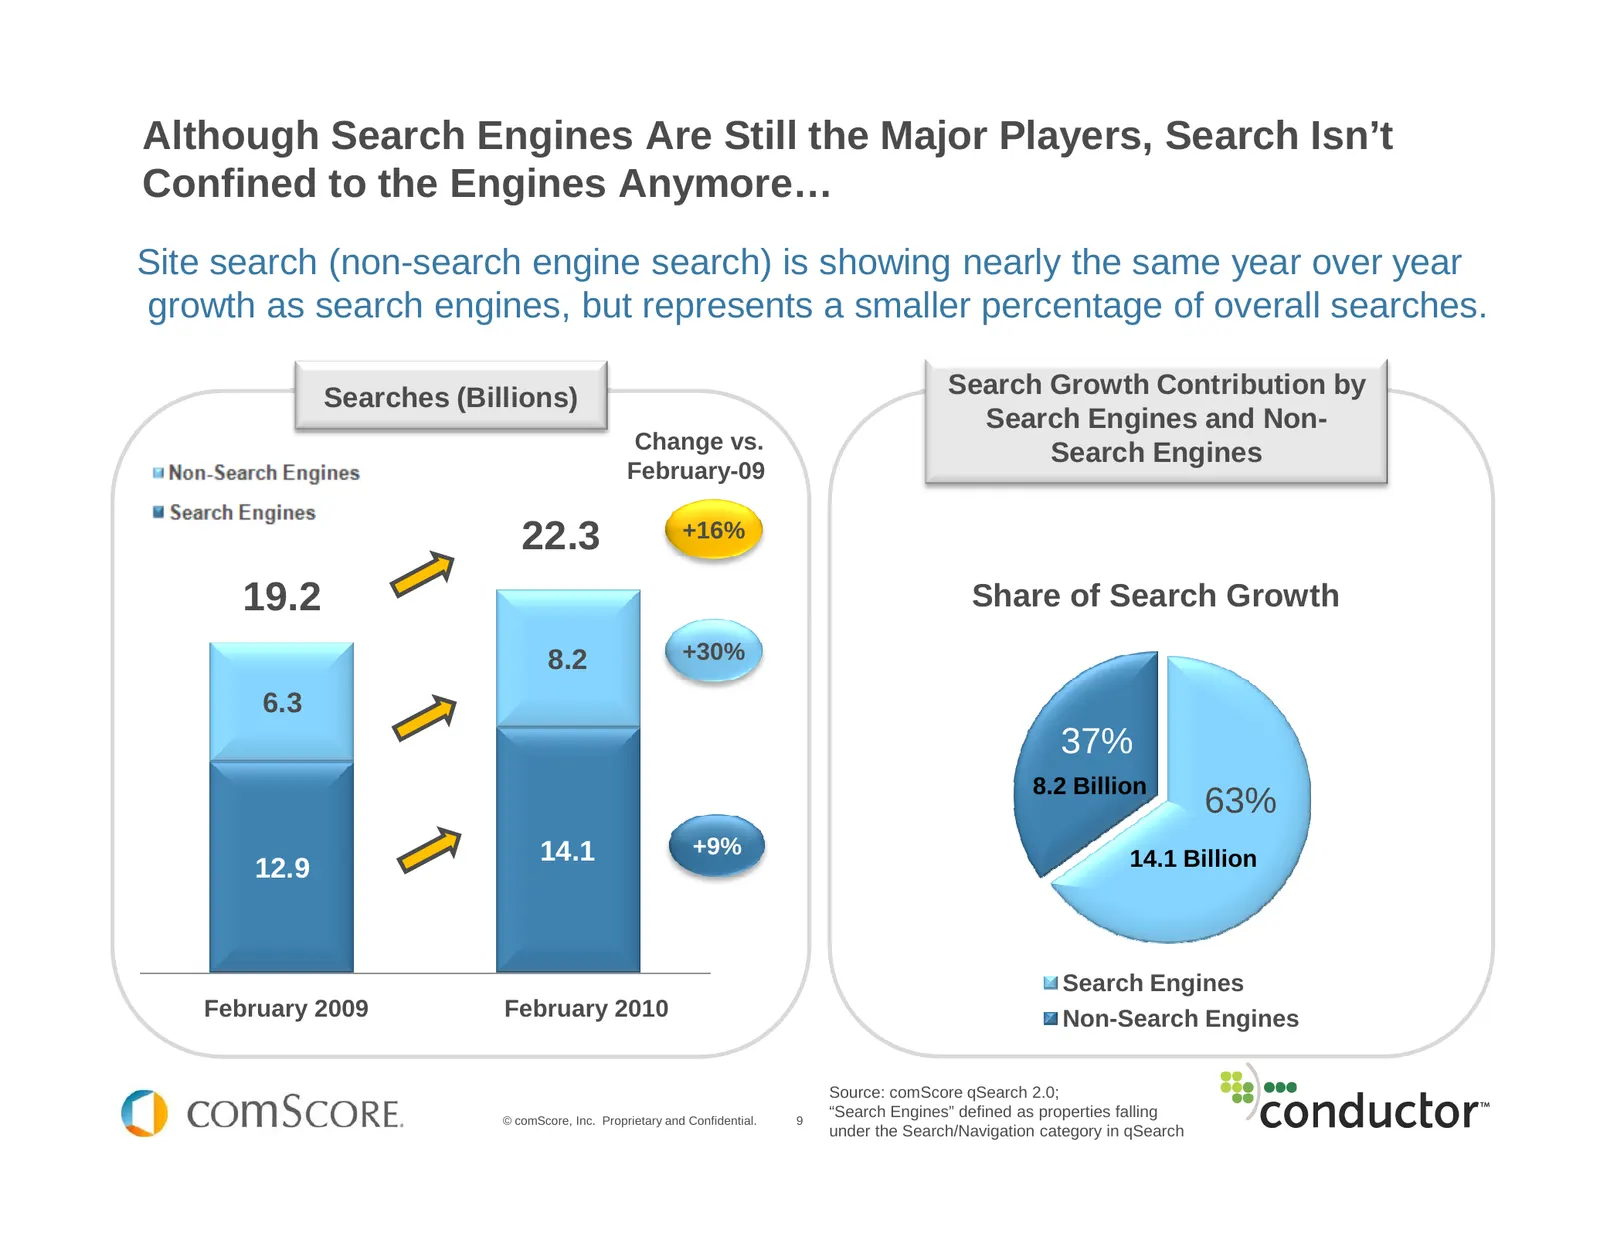
Although Search Engines Are Still the Major Players, Search Isn’t Confined to the Engines Anymore… Site search (non-search engine search) is showing nearly the same year over year growth as search engines, but represents a smaller percentage of overall searches. Searches (Billions) Search Growth Con
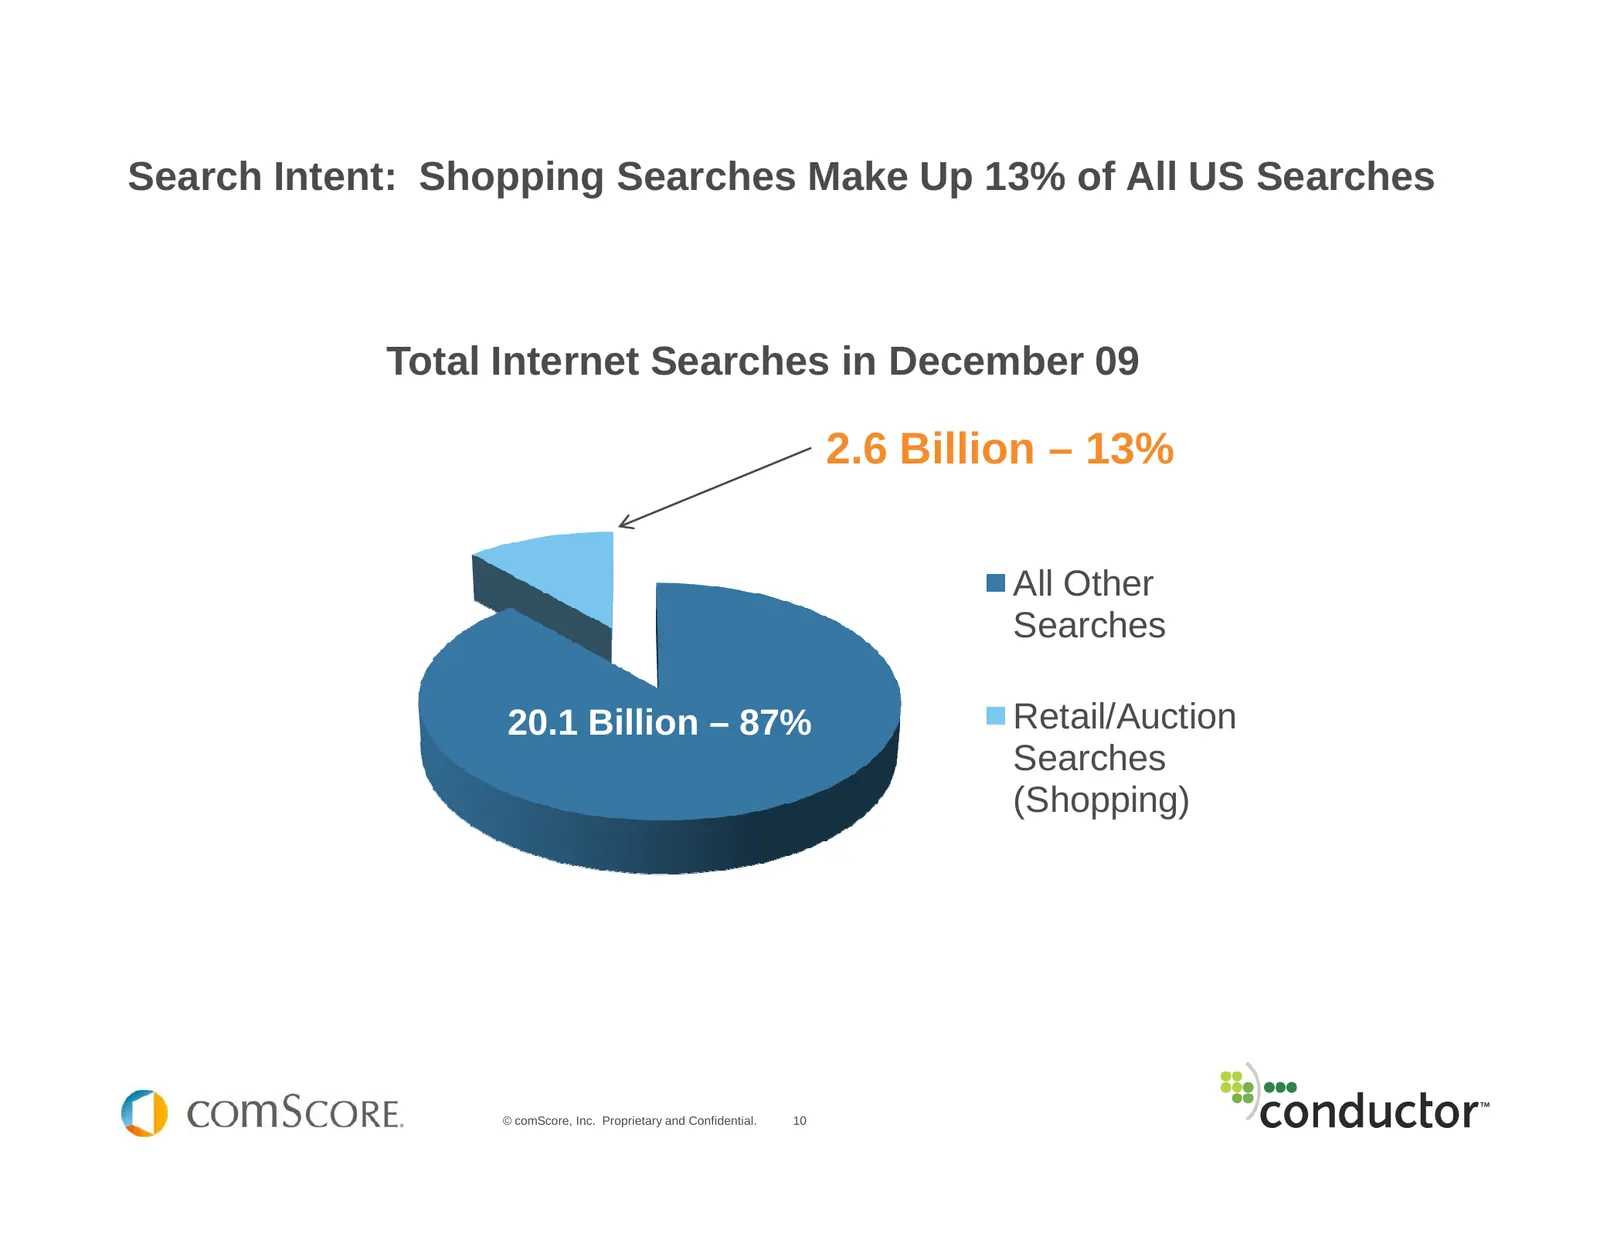
Slide 10: Search Intent: Shopping Searches Make Up 13% of All US Searches
Search Intent: Shopping Searches Make Up 13% of All US Searches Total Internet Searches in December 09 2.6 Billion – 13% All Other Searches 20.1 Billion – 87% Retail/Auction Searches (Shopping) © comScore, Inc. Proprietary and Confidential. 10
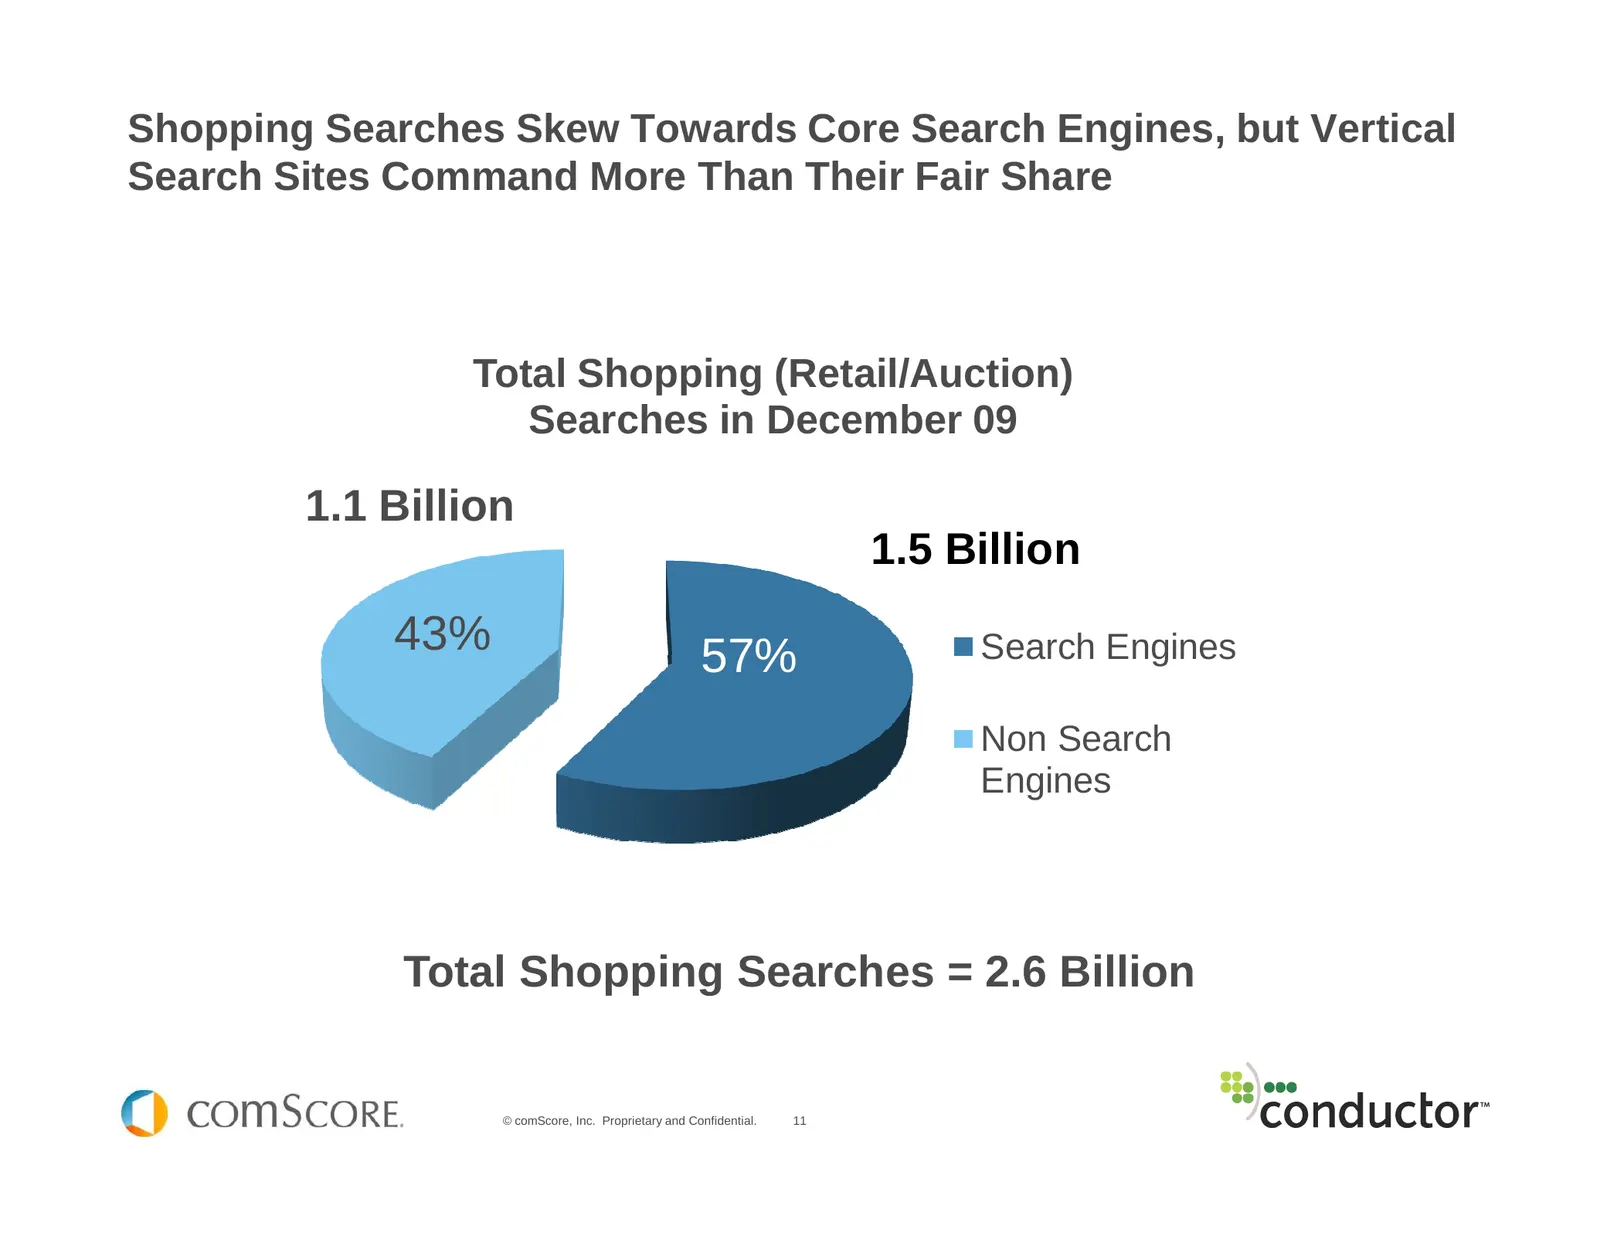
Slide 11: Shopping Searches Skew Towards Core Search Engines
Shopping Searches Skew Towards Core Search Engines, but Vertical Search Sites Command More Than Their Fair Share Total Shopping (Retail/Auction) Searches in December 09 1.1 Billion 1.5 Billion 43% 57% Search Engines Non Search Engines Total Shopping Searches = 2.6 Billion © comScore, Inc. Proprietar
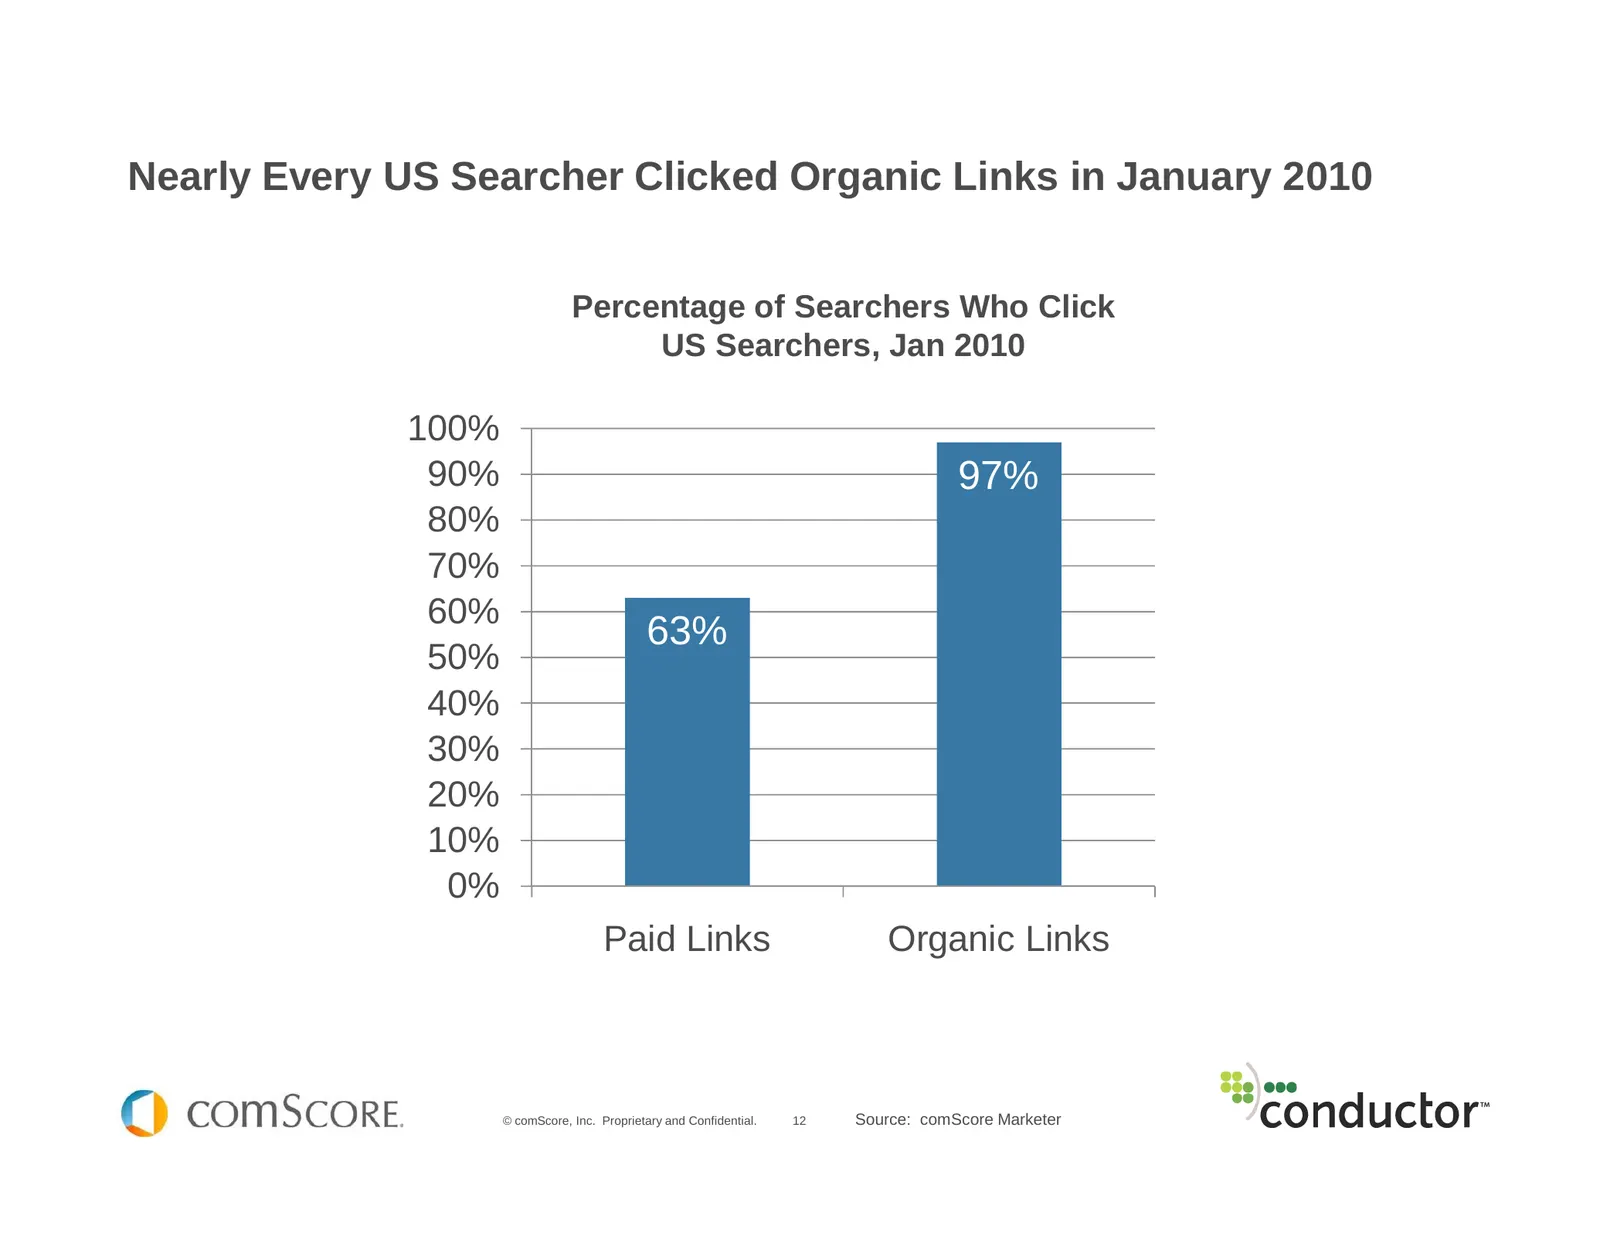
Slide 12: Nearly Every US Searcher Clicked Organic Links in January 2010
Nearly Every US Searcher Clicked Organic Links in January 2010 Percentage of Searchers Who Click US Searchers, Jan 2010 100% 90% 97% 80% 70% 60% 63% 50% 40% 30% 20% 10% 0% Paid Links Organic Links © comScore, Inc. Proprietary and Confidential. 12 Source: comScore Marketer
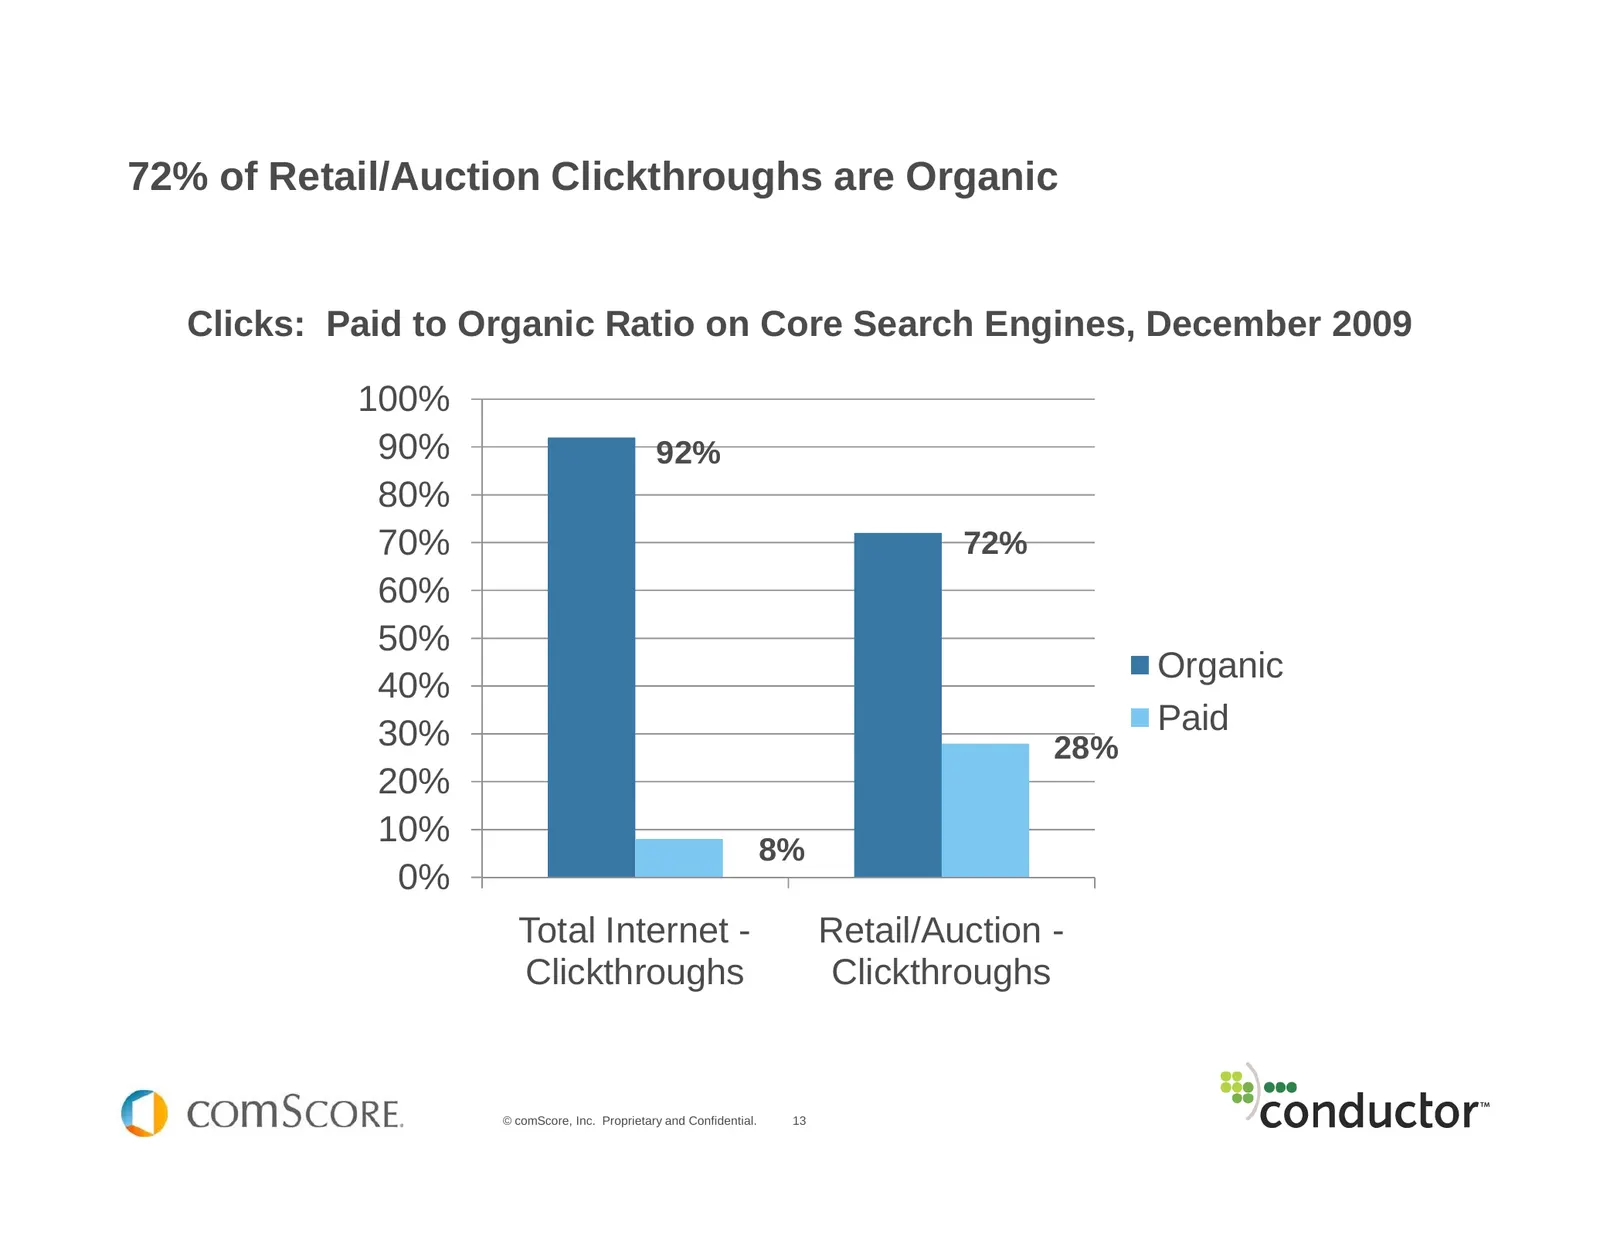
Slide 13: 72% of Retail/Auction Clickthroughs are Organic
72% of Retail/Auction Clickthroughs are Organic Clicks: Paid to Organic Ratio on Core Search Engines, December 2009 100% 90% 92% 80% 70% 72% 60% 50% Organic 40% 30% Paid 28% 20% 10% 8% 0% Total Internet - Retail/Auction - Clickthroughs Clickthroughs © comScore, Inc. Proprietary and Confidential. 13
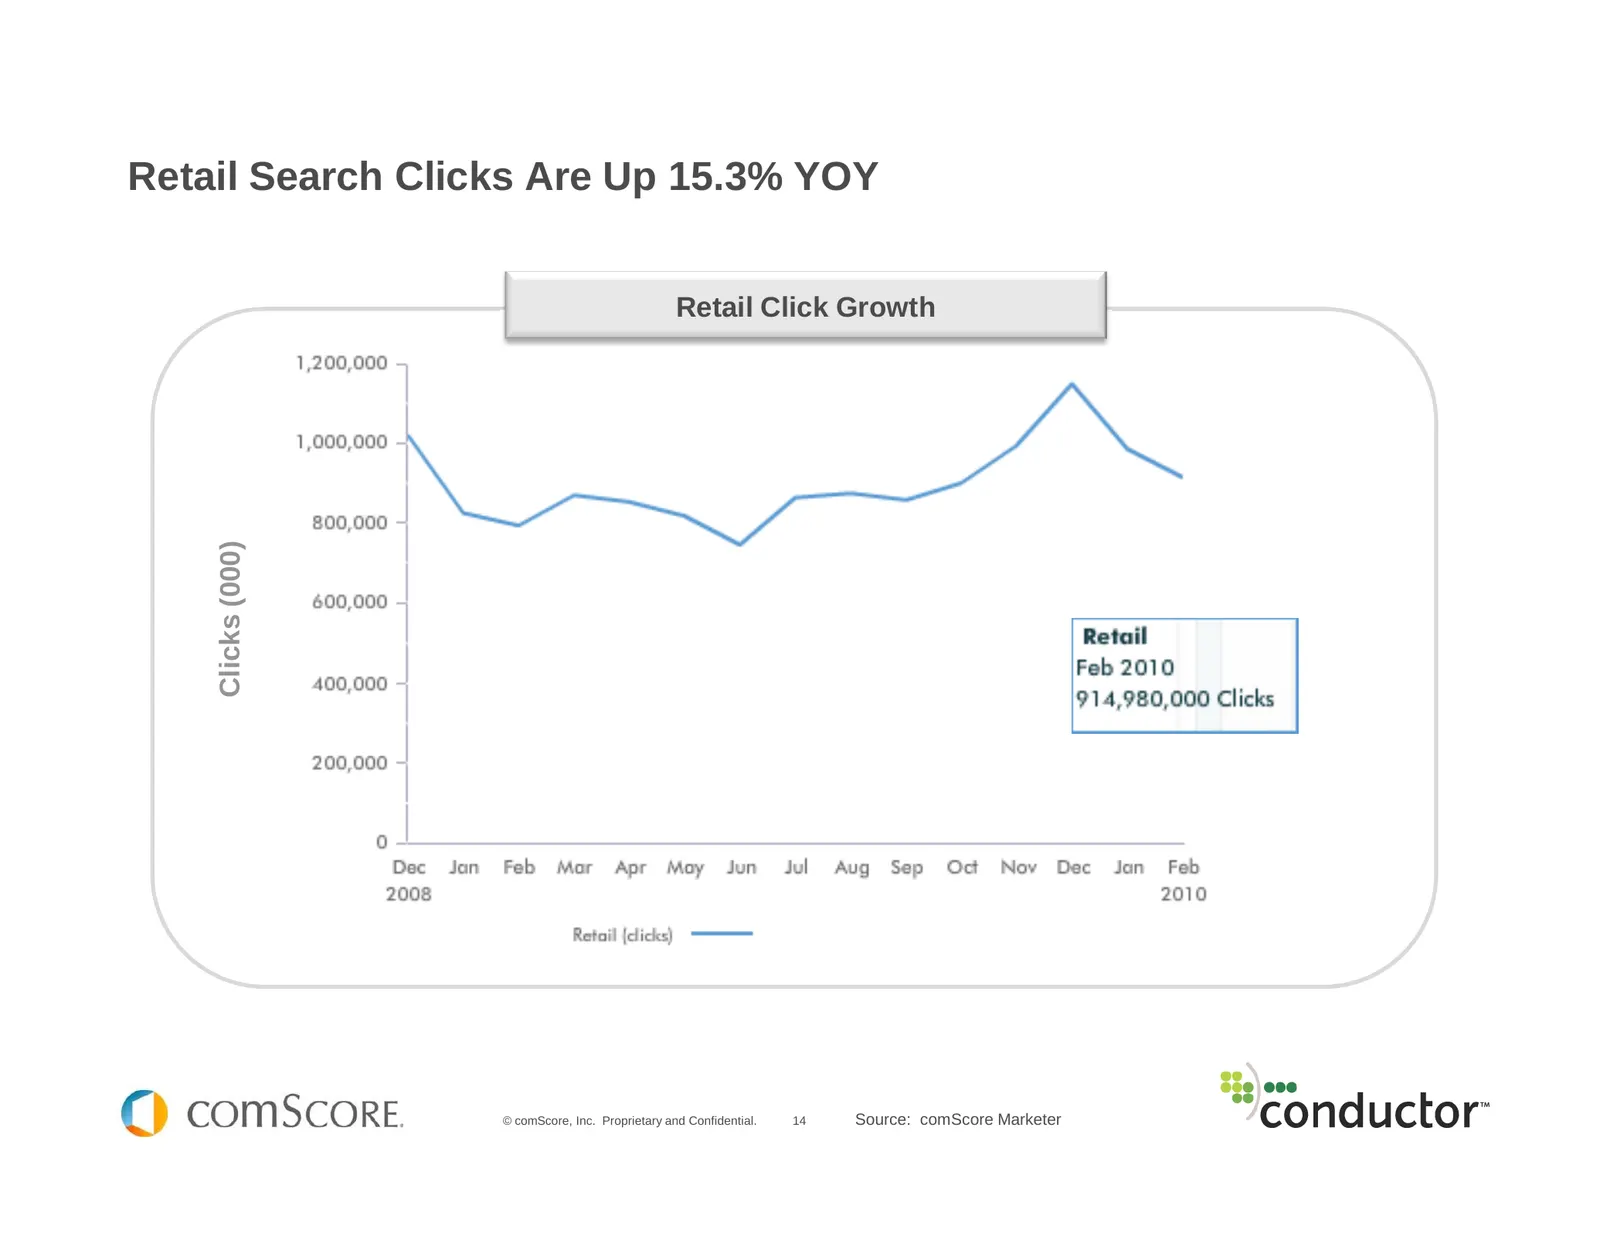
Slide 14: Retail Search Clicks Are Up 15.3% YOY
Retail Search Clicks Are Up 15.3% YOY Retail Click Growth Clicks (000) © comScore, Inc. Proprietary and Confidential. 14 Source: comScore Marketer
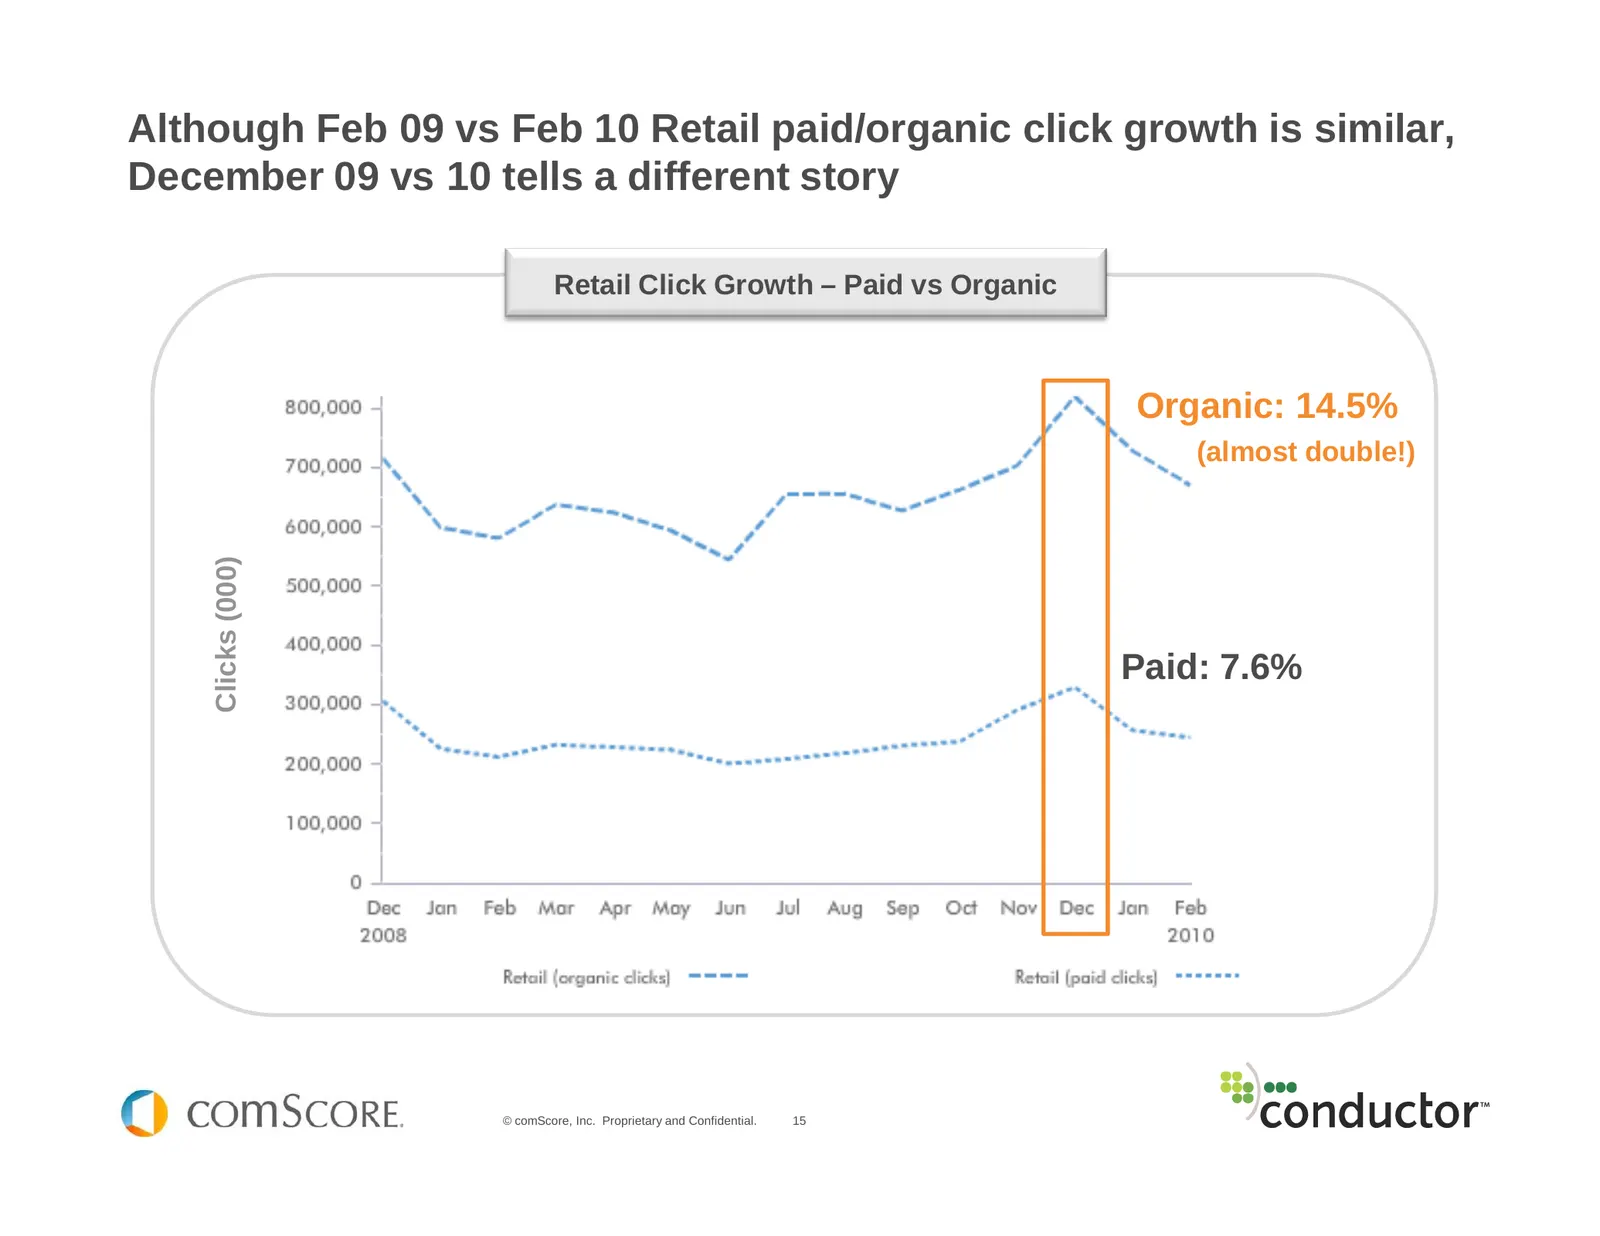
Slide 15: Retail paid/organic click growth: Feb vs Feb and December
Although Feb 09 vs Feb 10 Retail paid/organic click growth is similar, December 09 vs 10 tells a different story Retail Click Growth – Paid vs Organic Organic: 14.5% (almost double!) Clicks (000) Paid: 7.6% © comScore, Inc. Proprietary and Confidential. 15
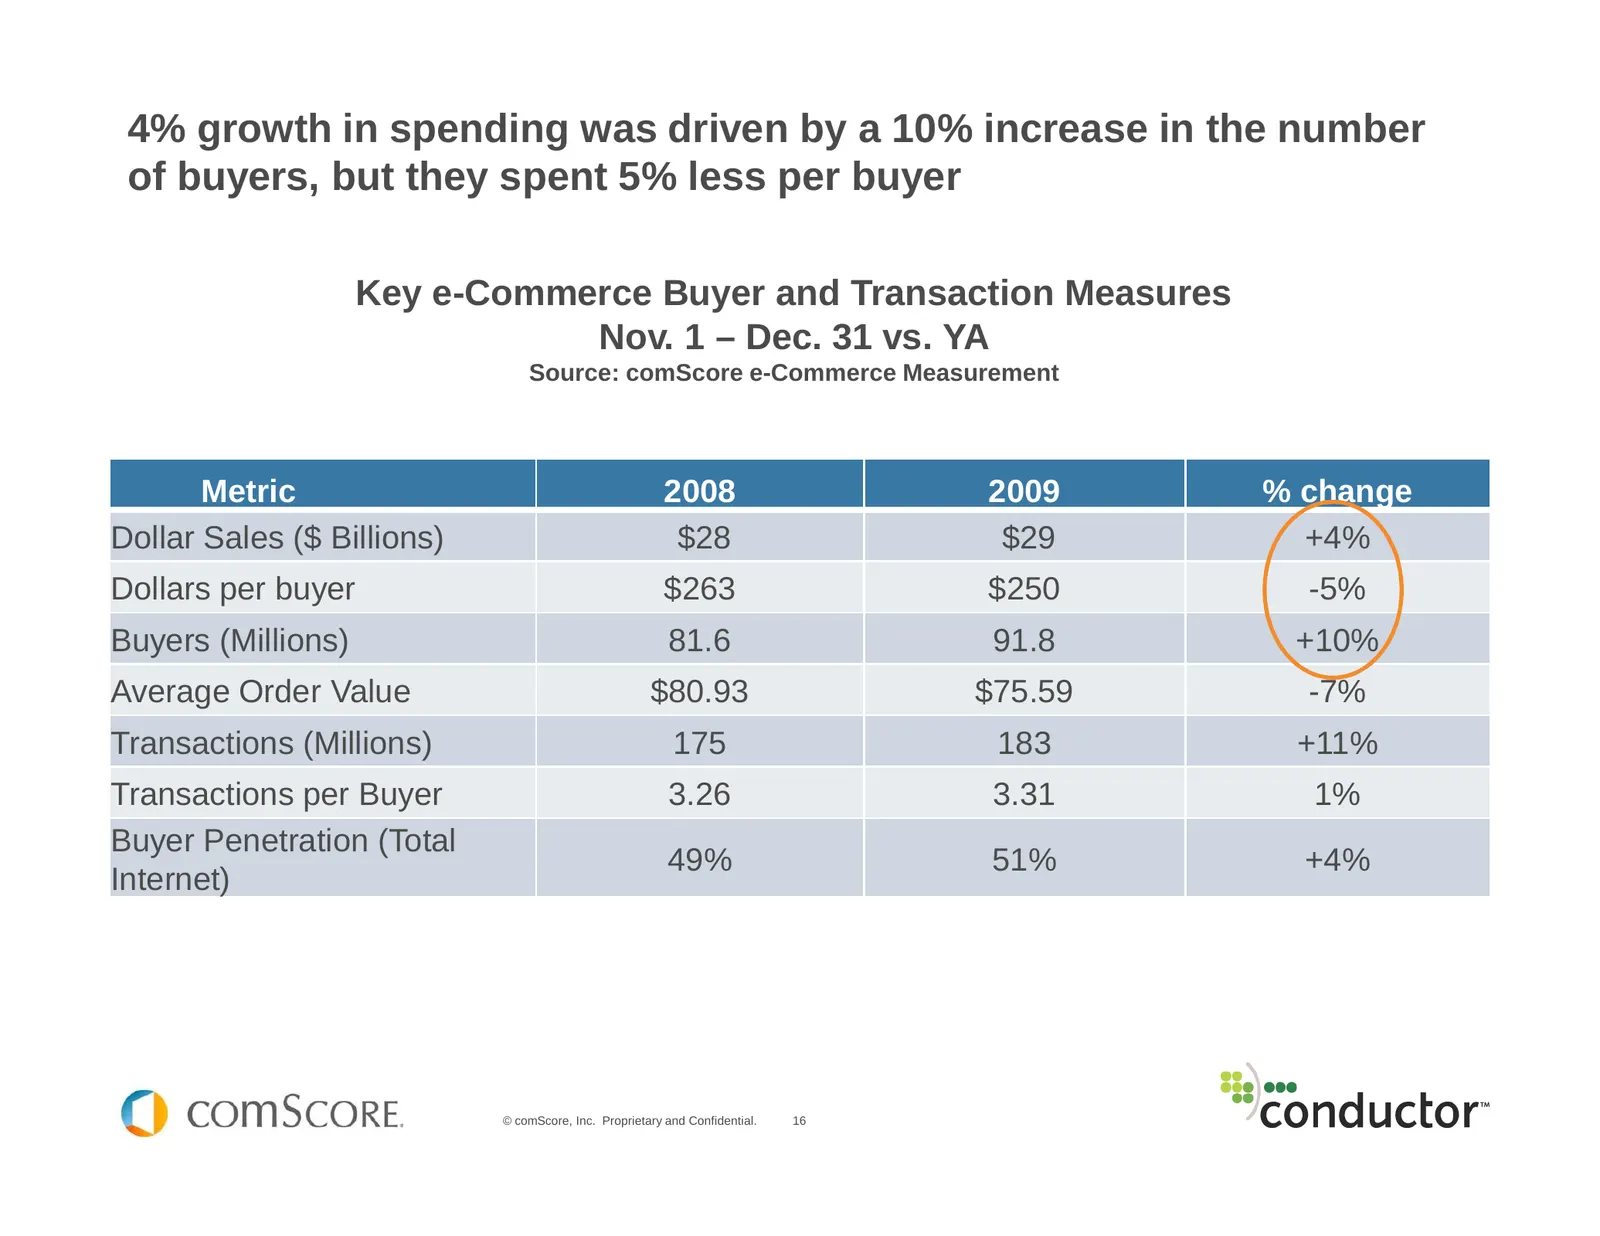
Slide 16: 4% growth in spending driven by 10% increase in buyers
4% growth in spending was driven by a 10% increase in the number of buyers, but they spent 5% less per buyer Key e-Commerce Buyer and Transaction Measures Nov. 1 – Dec. 31 vs. YA Source: comScore e-Commerce Measurement Metric 2008 2009 % change Dollar Sales ($ Billions) $28 $29 +4% Dollars per buyer
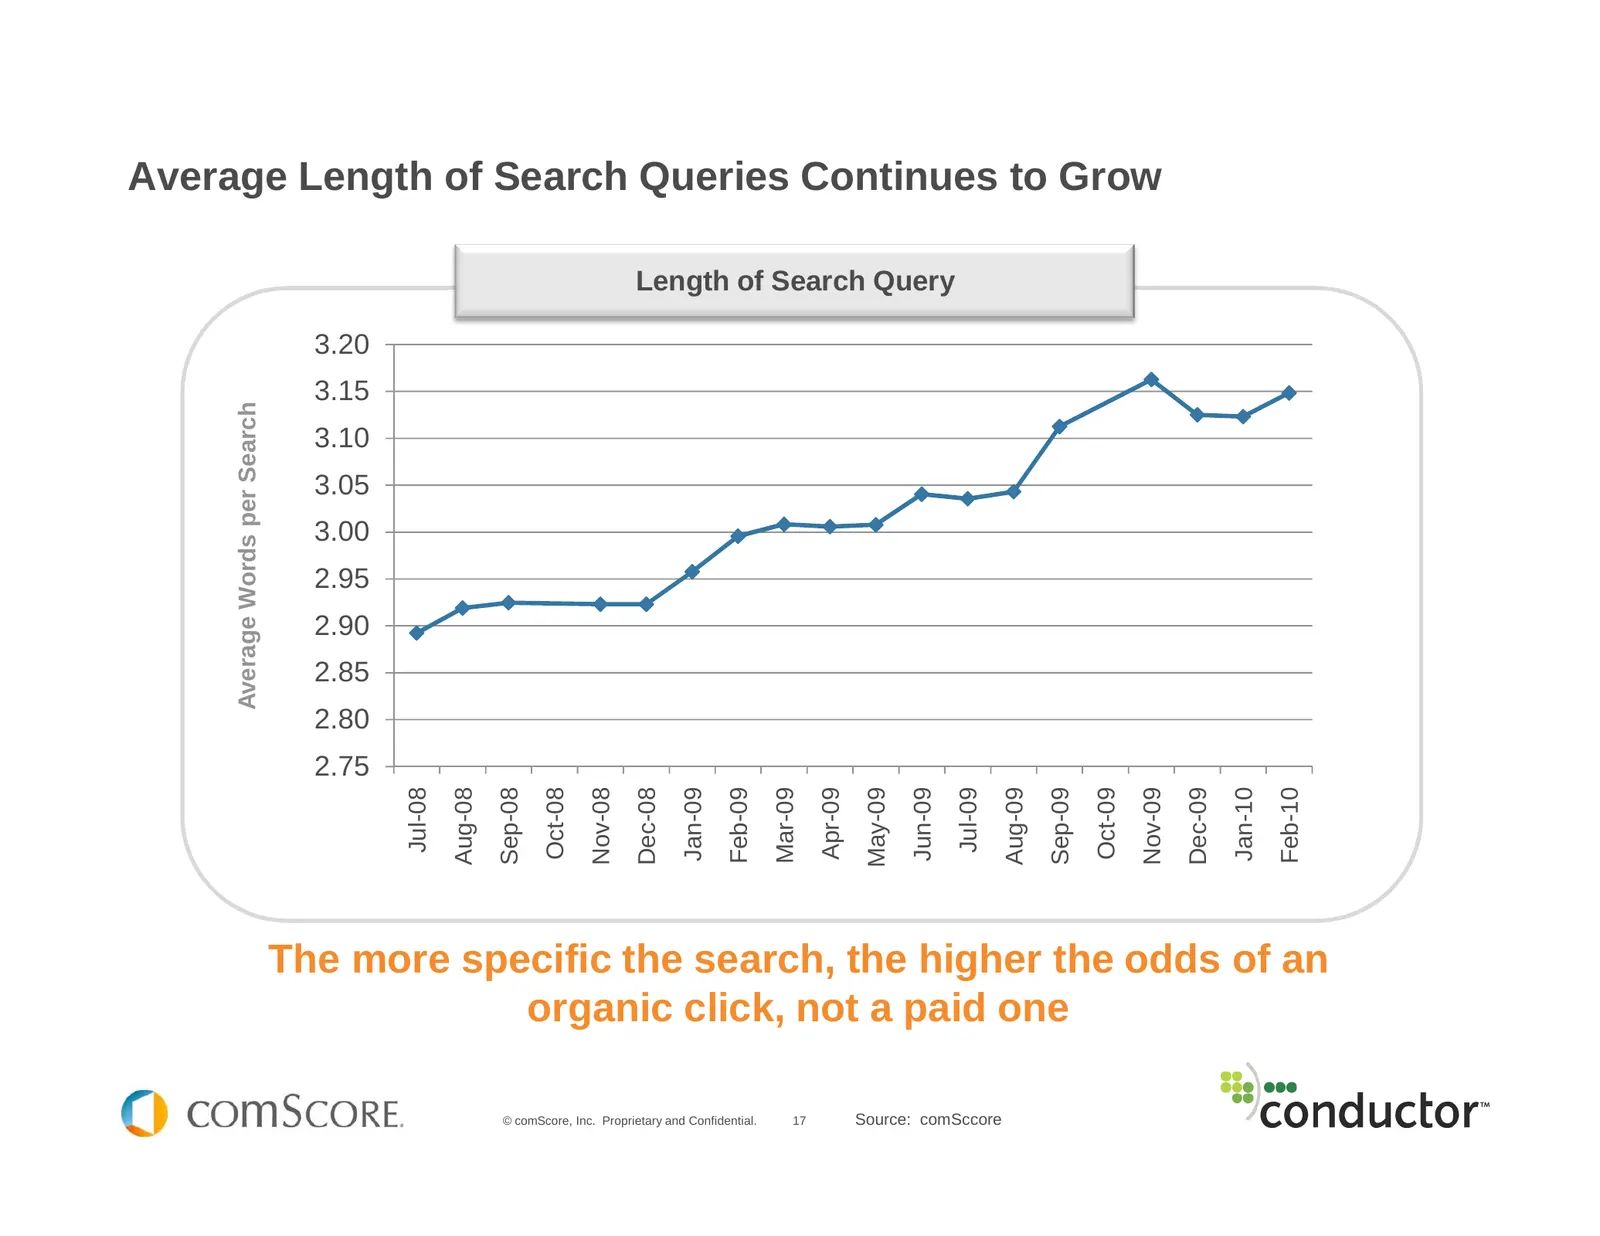
Slide 17: Average Length of Search Queries Continues to Grow
Average Length of Search Queries Continues to Grow Length of Search Query 3.20 3.15 Average Words per Search 3.10 3.05 3.00 2.95 2.90 2.85 2.80 2.75 Sep-08 Feb-09 Sep-09 Feb-10 Jul-08 Aug-08 Oct-08 Nov-08 Dec-08 Jan-09 Mar-09 Apr-09 May-09 Jun-09 Jul-09 Aug-09 Oct-09 Nov-09 Dec-09 Jan-10 The more sp
Slide 18: The SEO Opportunity
The SEO Opportunity The Internet Retailer 500’s Natural Search Visibility © comScore, Inc. Proprietary and Confidential. 18
Slide 19: The Study: Natural Search Effectiveness of the Internet Retailer 500
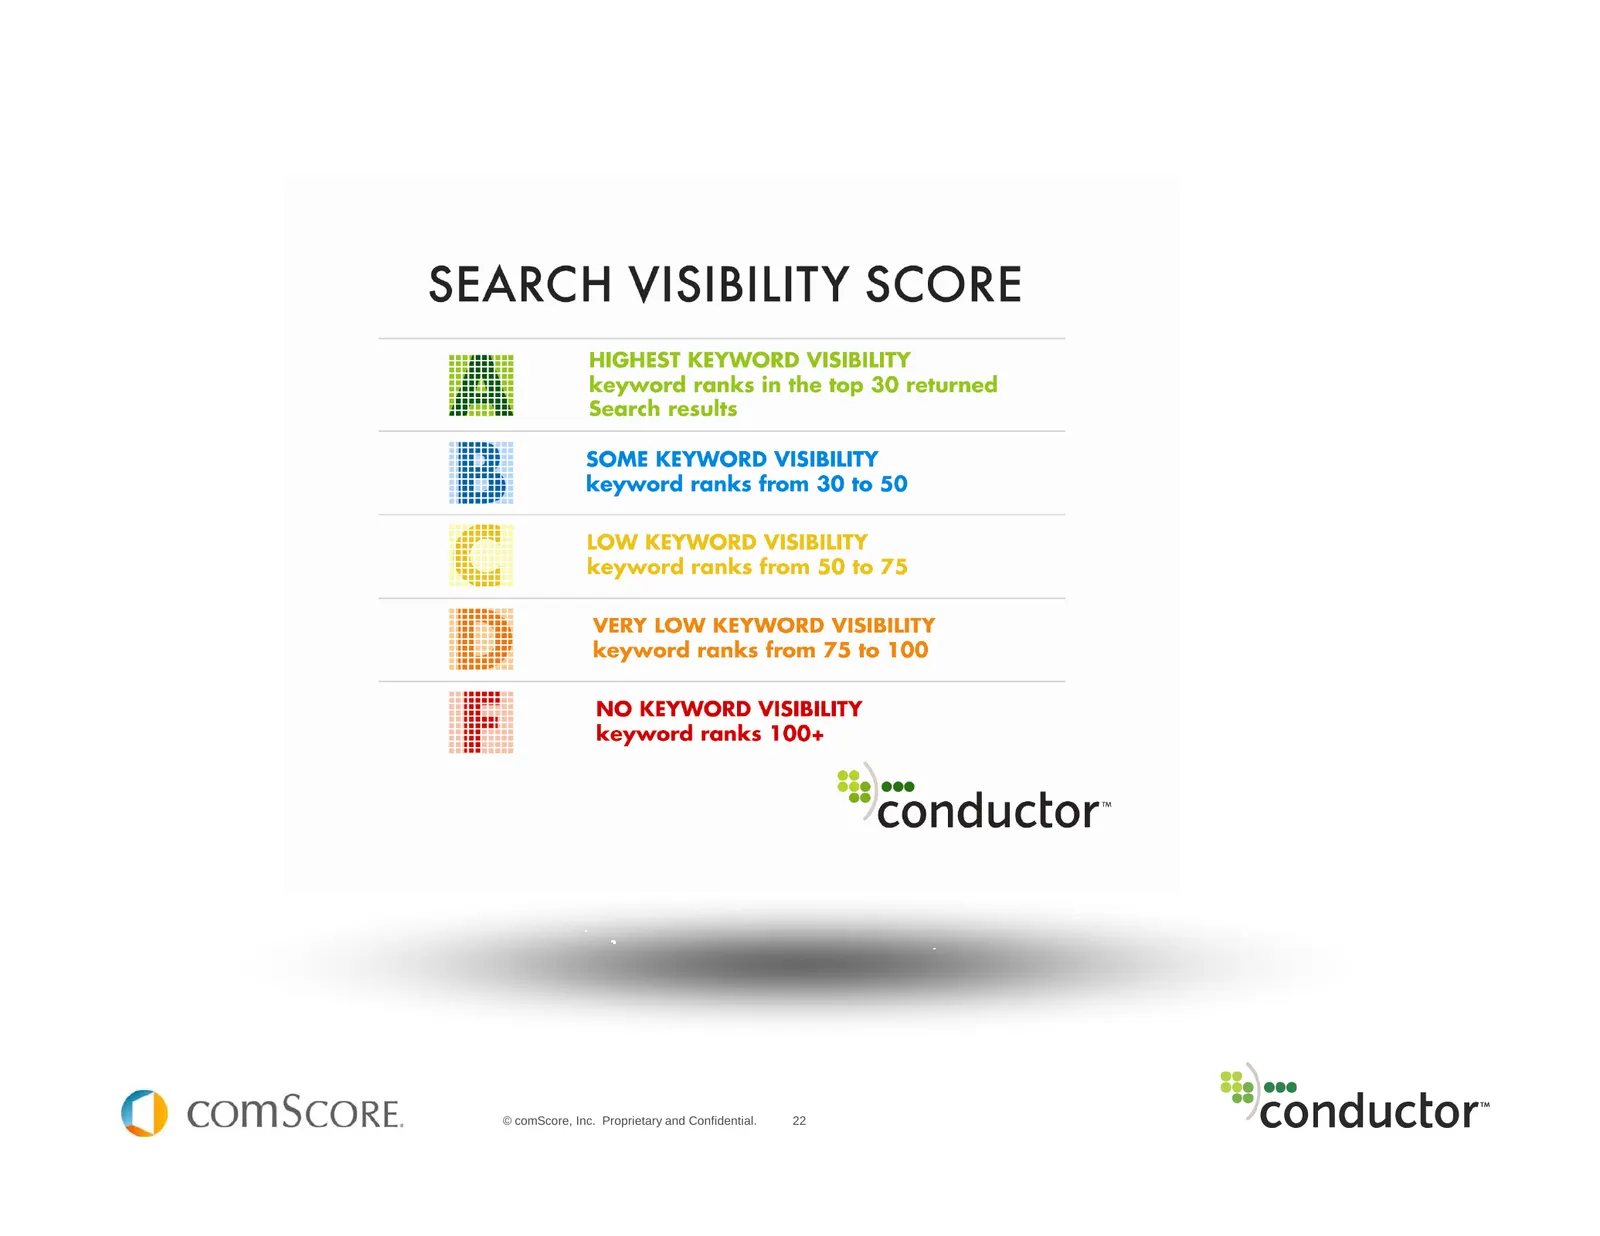
The Study: An Analysis of the Natural Search Effectiveness of the Internet Retailer 500 Set out to measure the SEO effectiveness of the IR 500 Challenge: Measuring the intent of search marketers while external to the organization Developed methodology to gauge the retailer’s success at SEO © comScor
Slide 20: Methodologies
Methodologies Websites: Analyzed a single primary domain for each retailer Keywords: Measure retailer’s intent by assuming they voted with their wallets in prioritizing paid keywords Gathered retailer’s 200 most expensive keywords (Spyfu) Tracked natural search rankings of 88,758 keywords; Visibilit
Slide 21: Paid Keyword Distribution – What Industries are Spending the Most?
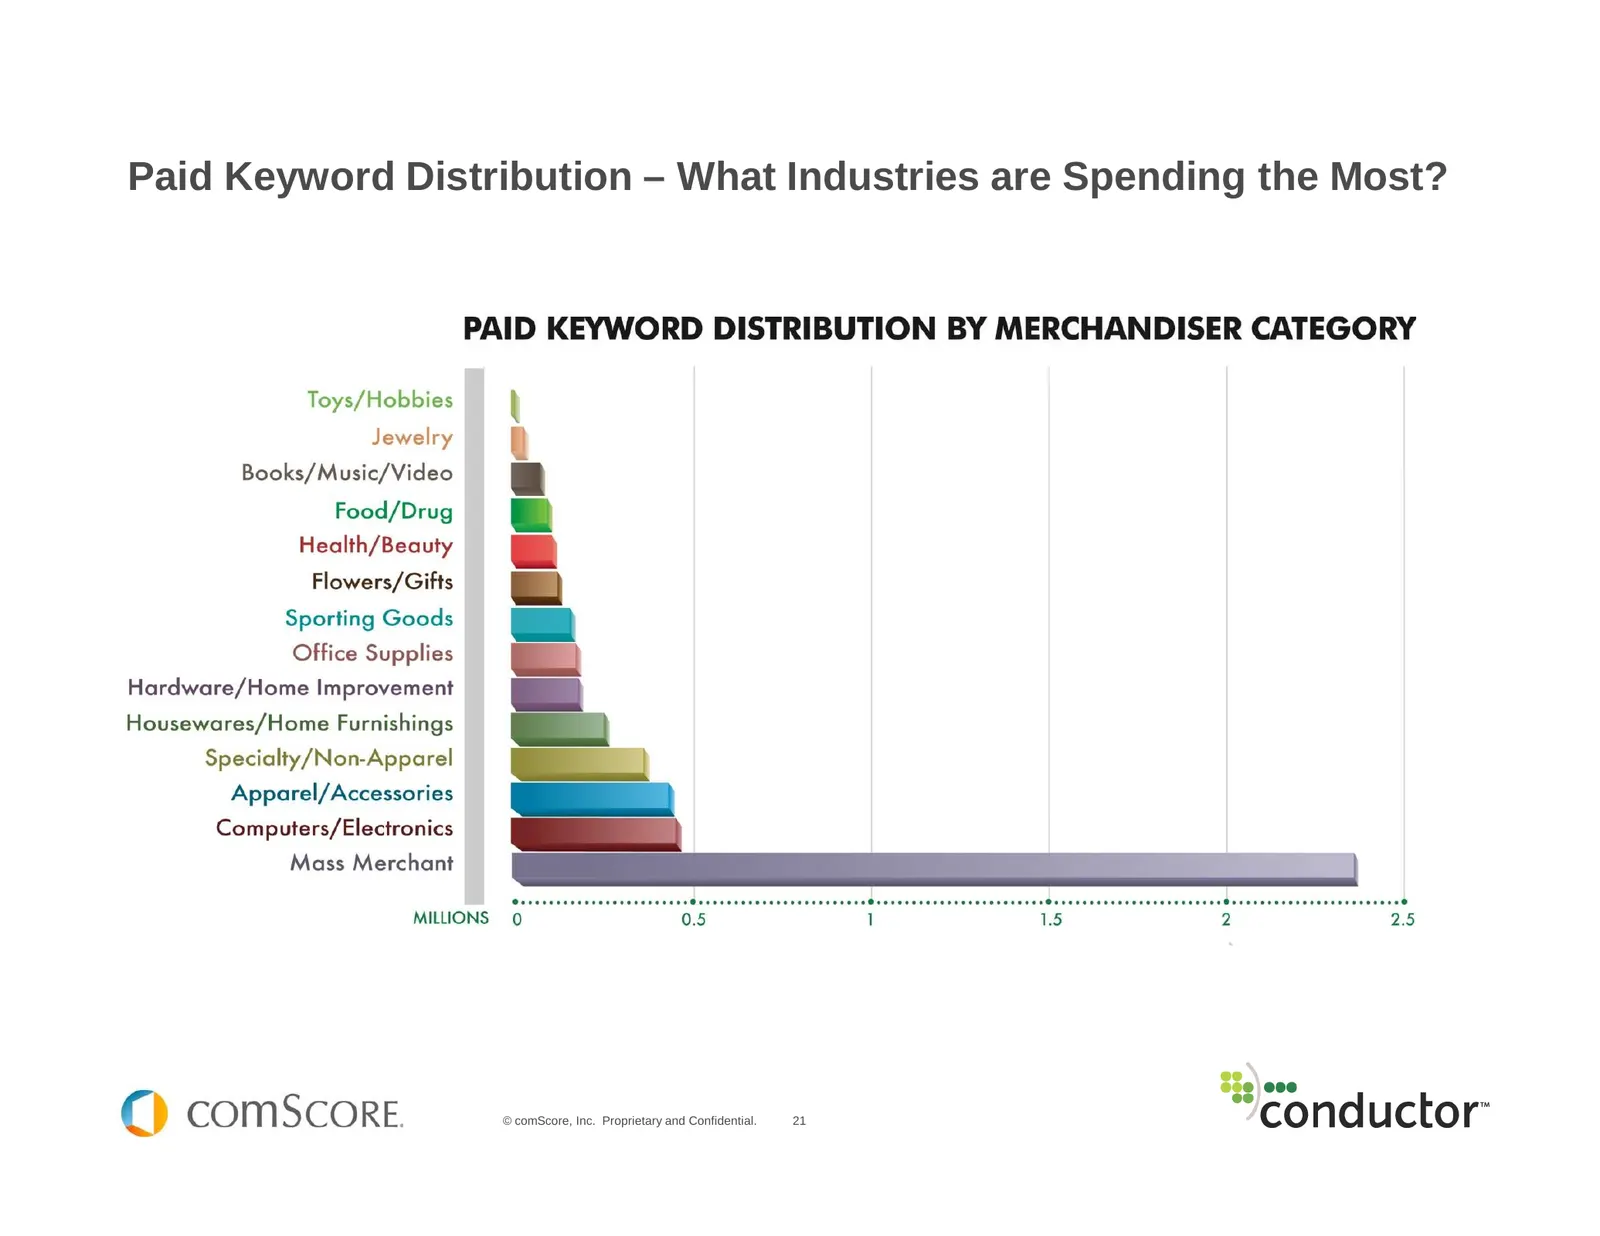
Paid Keyword Distribution – What Industries are Spending the Most? © comScore, Inc. Proprietary and Confidential. 21
Slide 22: © comScore, Inc. Proprietary and Confidential.
© comScore, Inc. Proprietary and Confidential. 22
Slide 23: The Results – The Good, the Bad and the Ugly
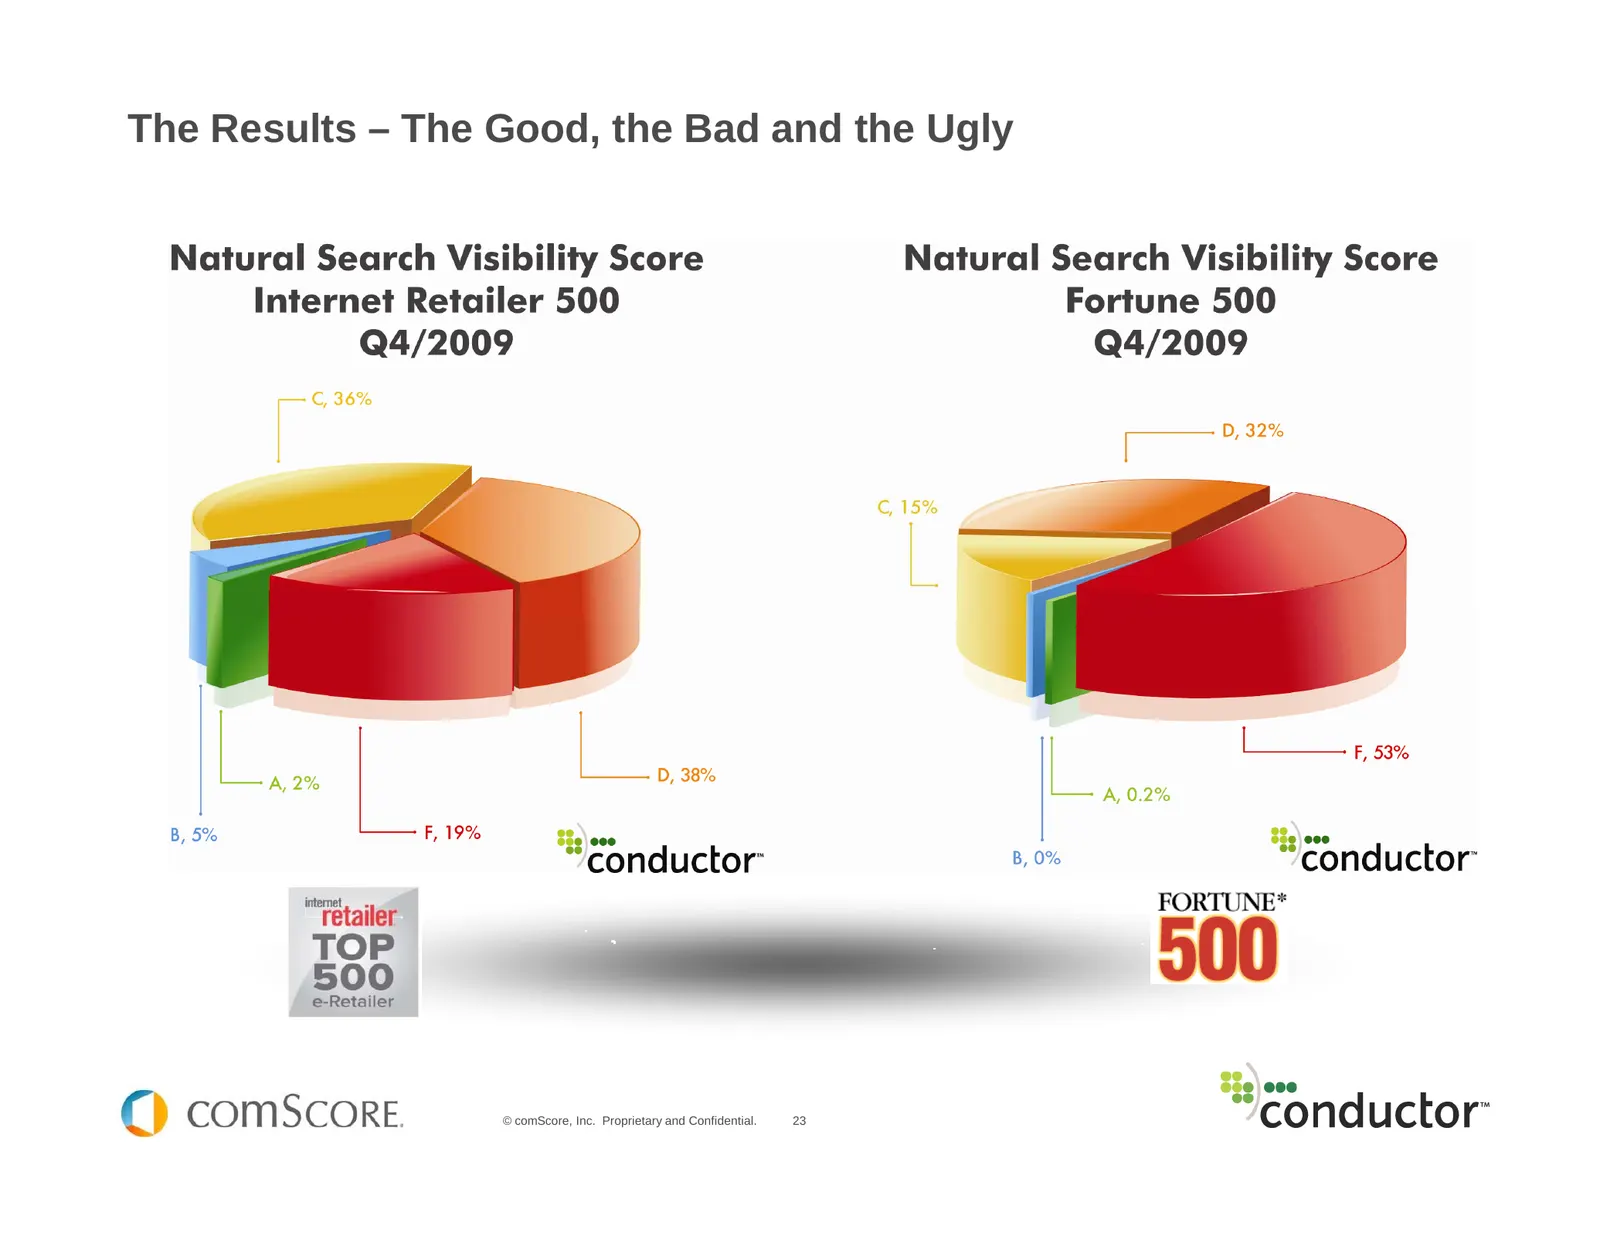
The Results – The Good, the Bad and the Ugly © comScore, Inc. Proprietary and Confidential. 23
Slide 24: © comScore, Inc. Proprietary and Confidential.
© comScore, Inc. Proprietary and Confidential. 24
Slide 25: © comScore, Inc. Proprietary and Confidential.
© comScore, Inc. Proprietary and Confidential. 25
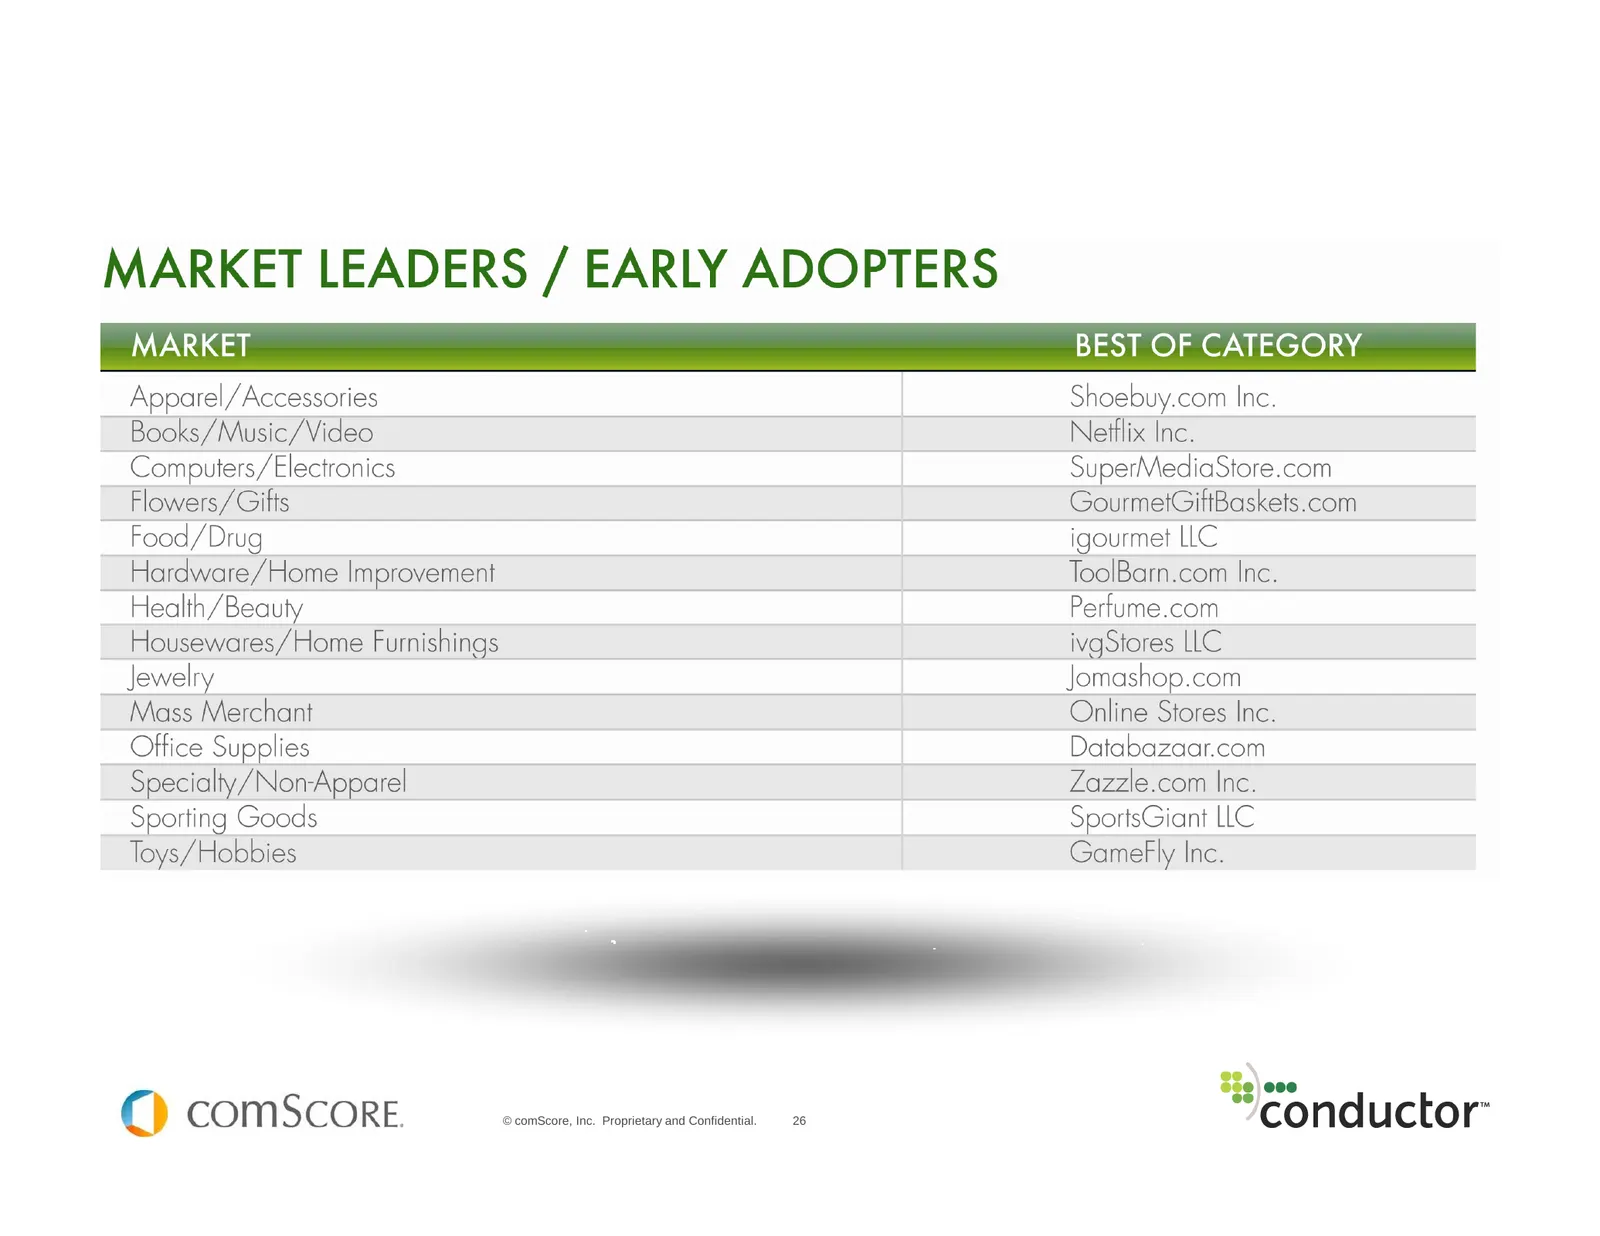
Slide 26: © comScore, Inc. Proprietary and Confidential.
© comScore, Inc. Proprietary and Confidential. 26
Slide 27: The SEO Opportunity
The SEO Opportunity The SEO Opportunity © comScore, Inc. Proprietary and Confidential. 27
Slide 28: Natural Search is most under spent channel in web marketing
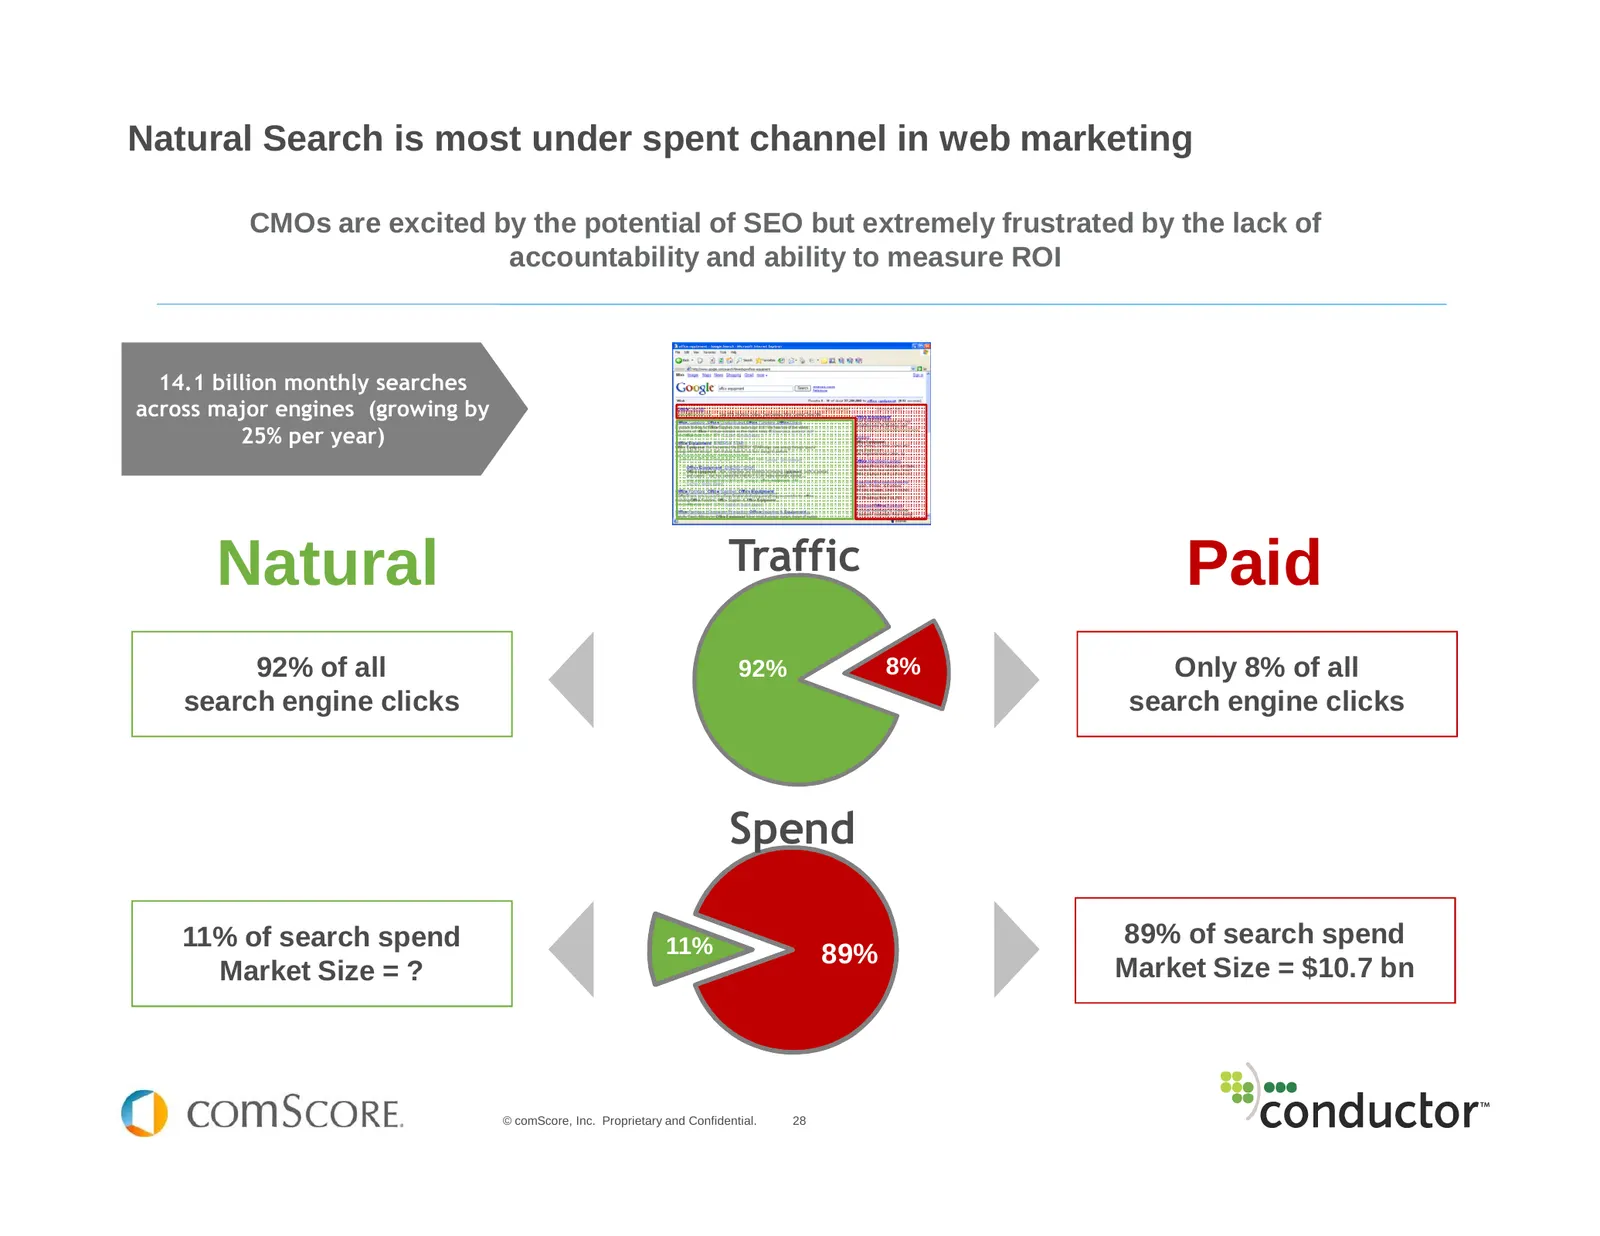
Natural Search is most under spent channel in web marketing CMOs are excited by the potential of SEO but extremely frustrated by the lack of accountability and ability to measure ROI 14.1 billion monthly searches across major engines (growing by 25% per year) Natural Traffic Paid 92% of all 92% 8% O
Slide 29: SEO is Getting More Complicated: The Evolution of SEO
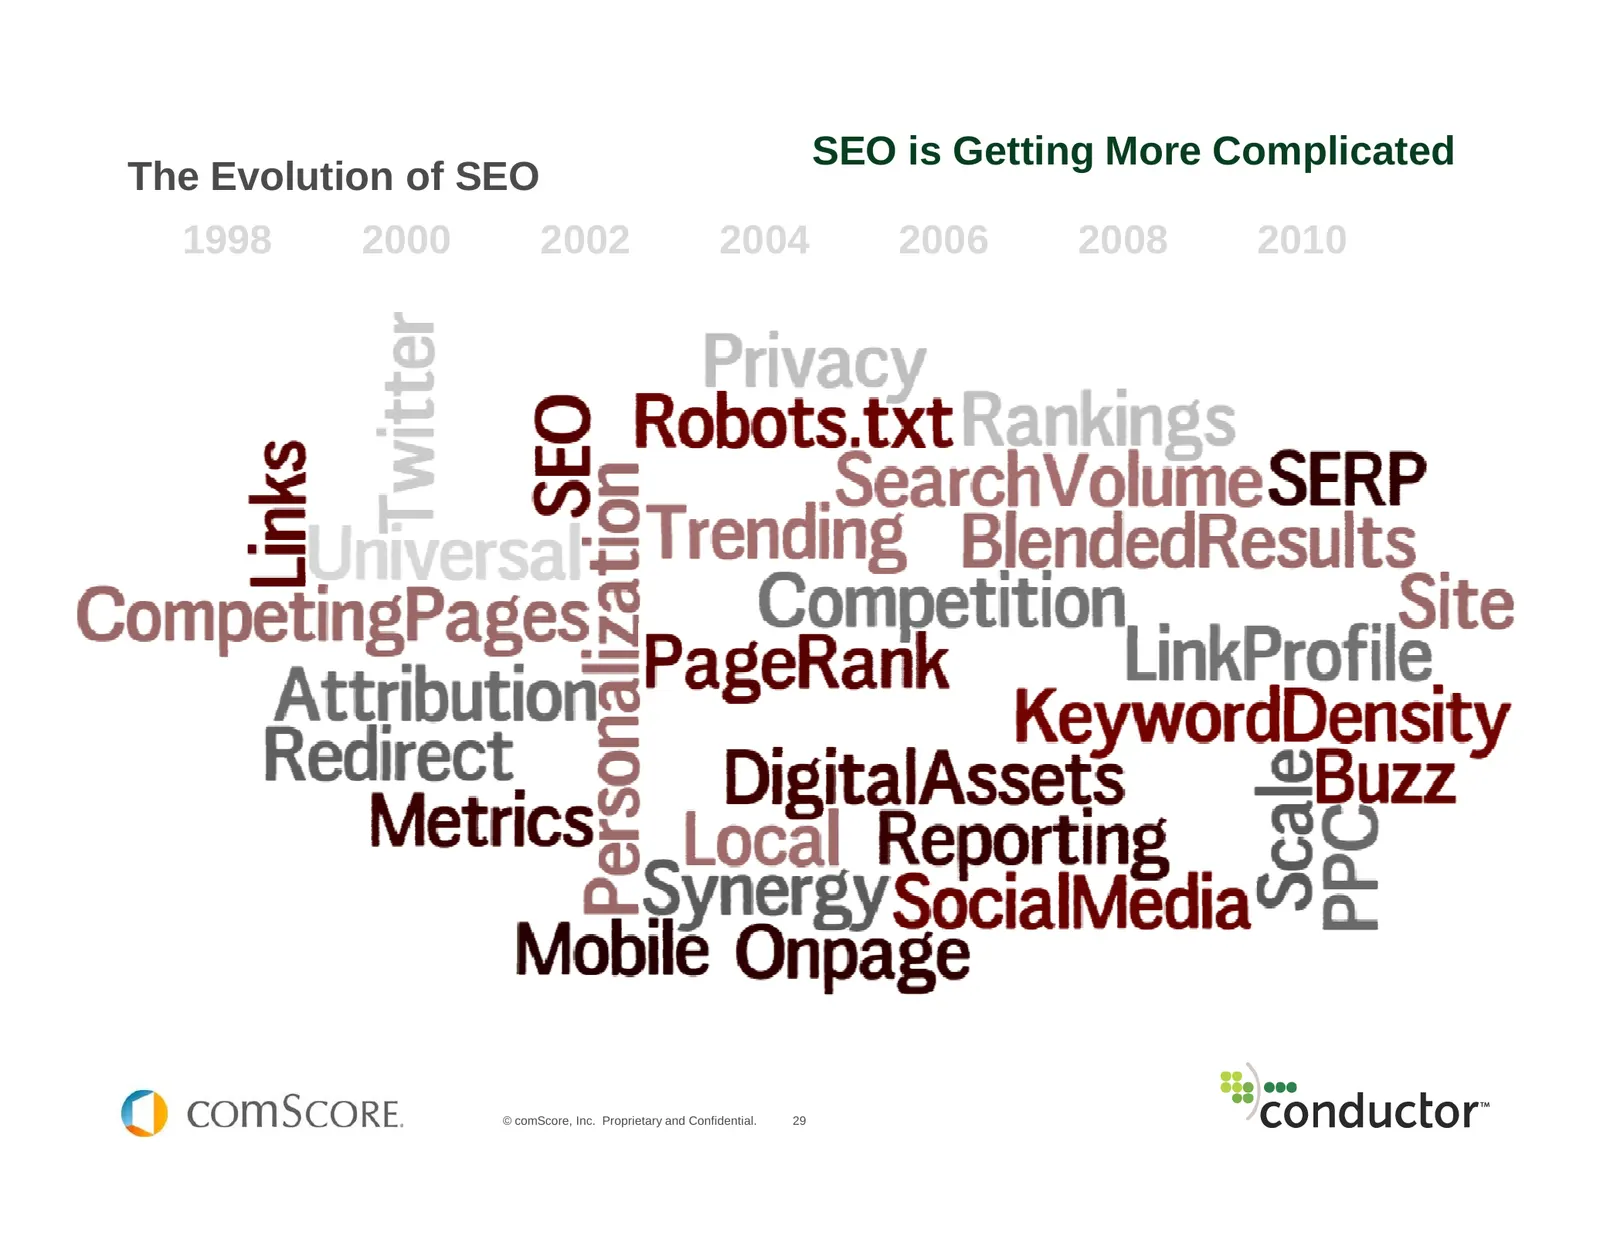
SEO is Getting More Complicated The Evolution of SEO 1998 2000 2002 2004 2006 2008 2010 © comScore, Inc. Proprietary and Confidential. 29 www.conductor.com
Slide 30: A Tiered Approach to Success in Natural Search
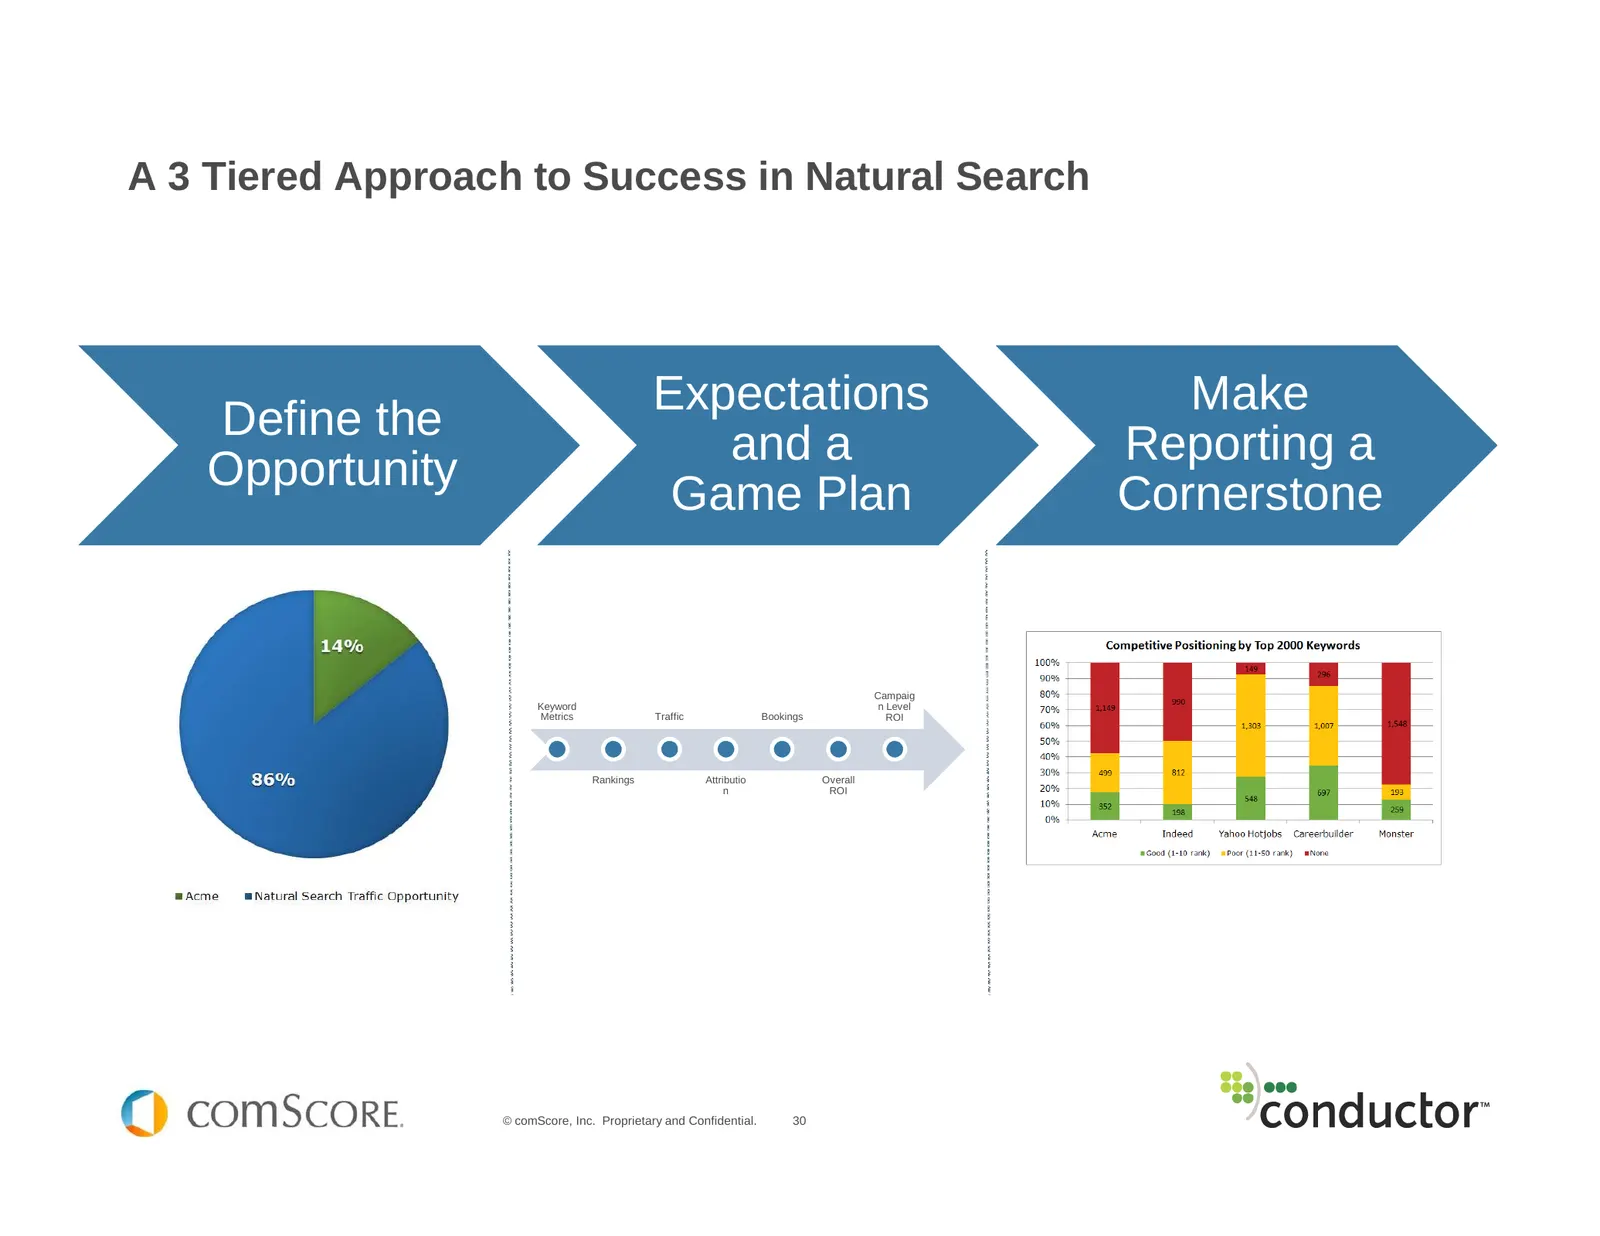
A 3 Tiered Approach to Success in Natural Search Expectations Make Define the and a Reporting a Opportunity Game Plan Cornerstone Campaig Keyword n Level Metrics Traffic Bookings ROI Rankings Attributio Overall n ROI © comScore, Inc. Proprietary and Confidential. 30 www.conductor.com
Slide 31: Define the Opportunity
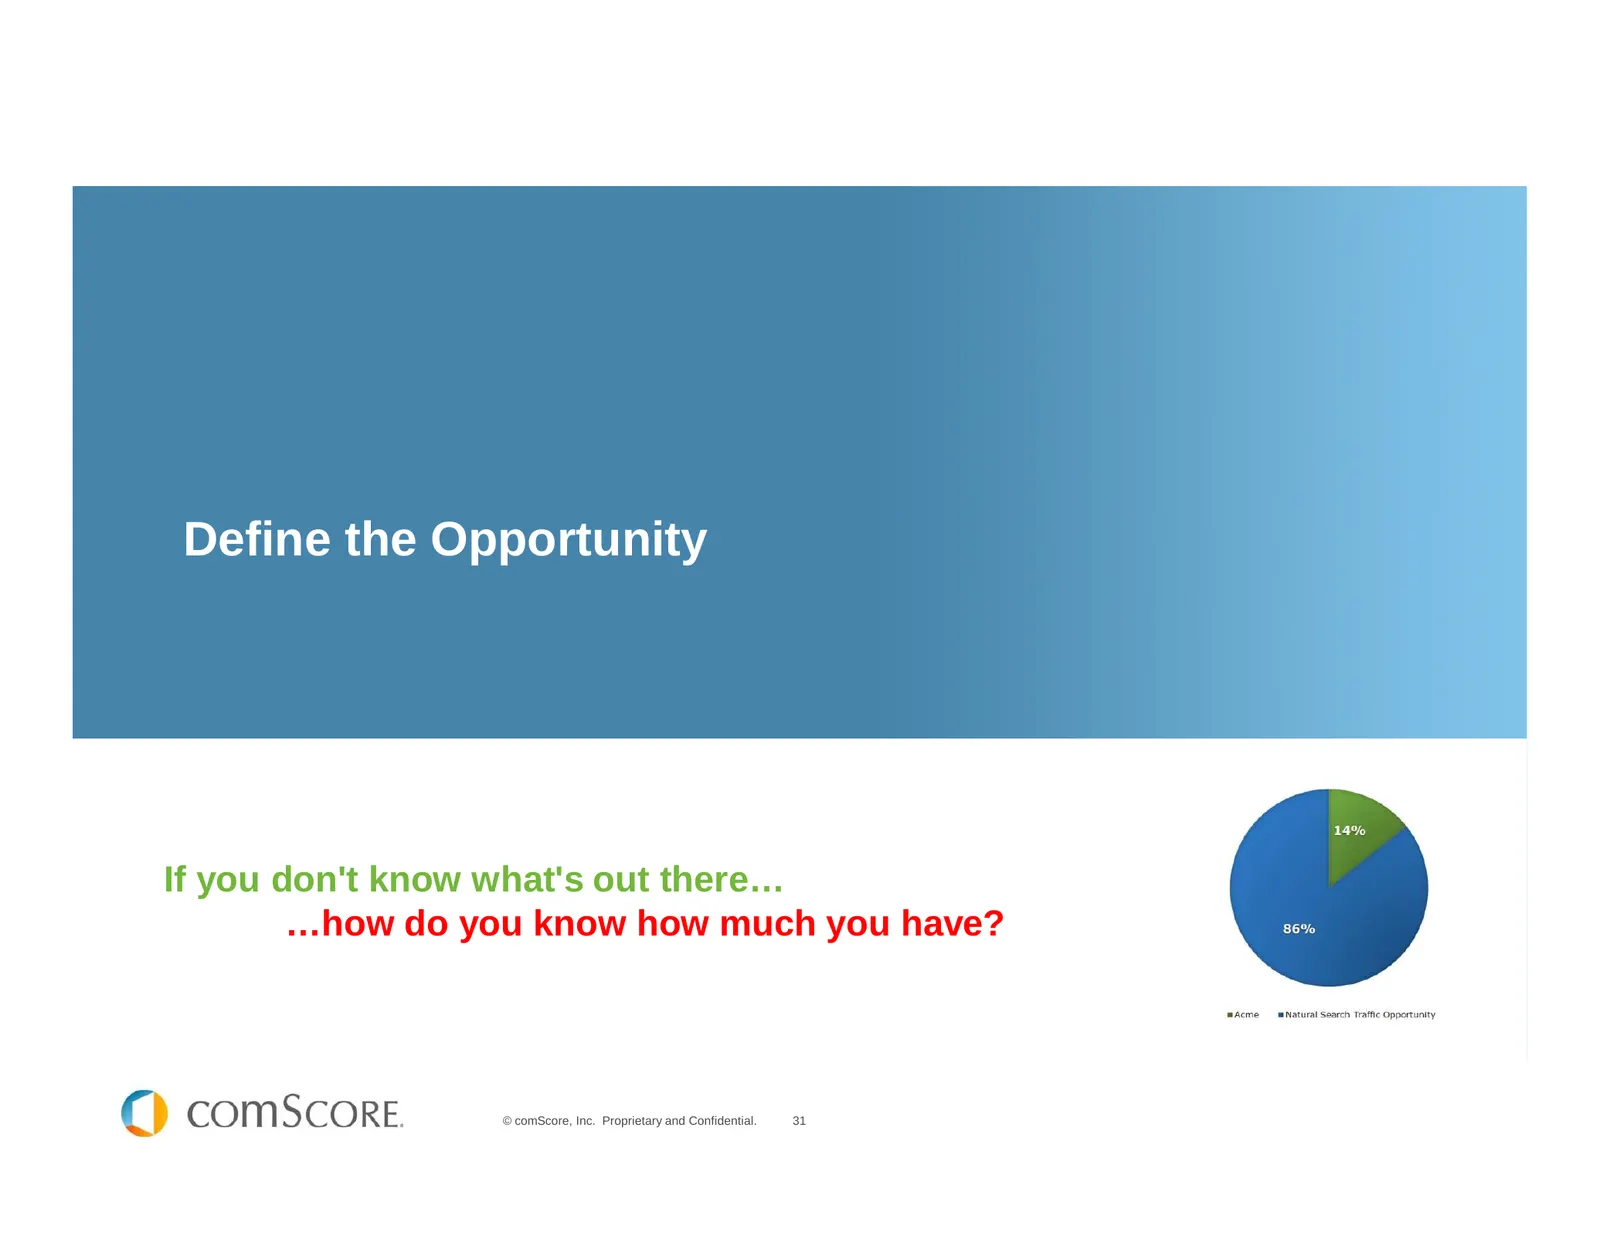
Define the Opportunity If you don't know what's out there… …how do you know how much you have? © comScore, Inc. Proprietary and Confidential. 31
Slide 32: Define the market opportunity
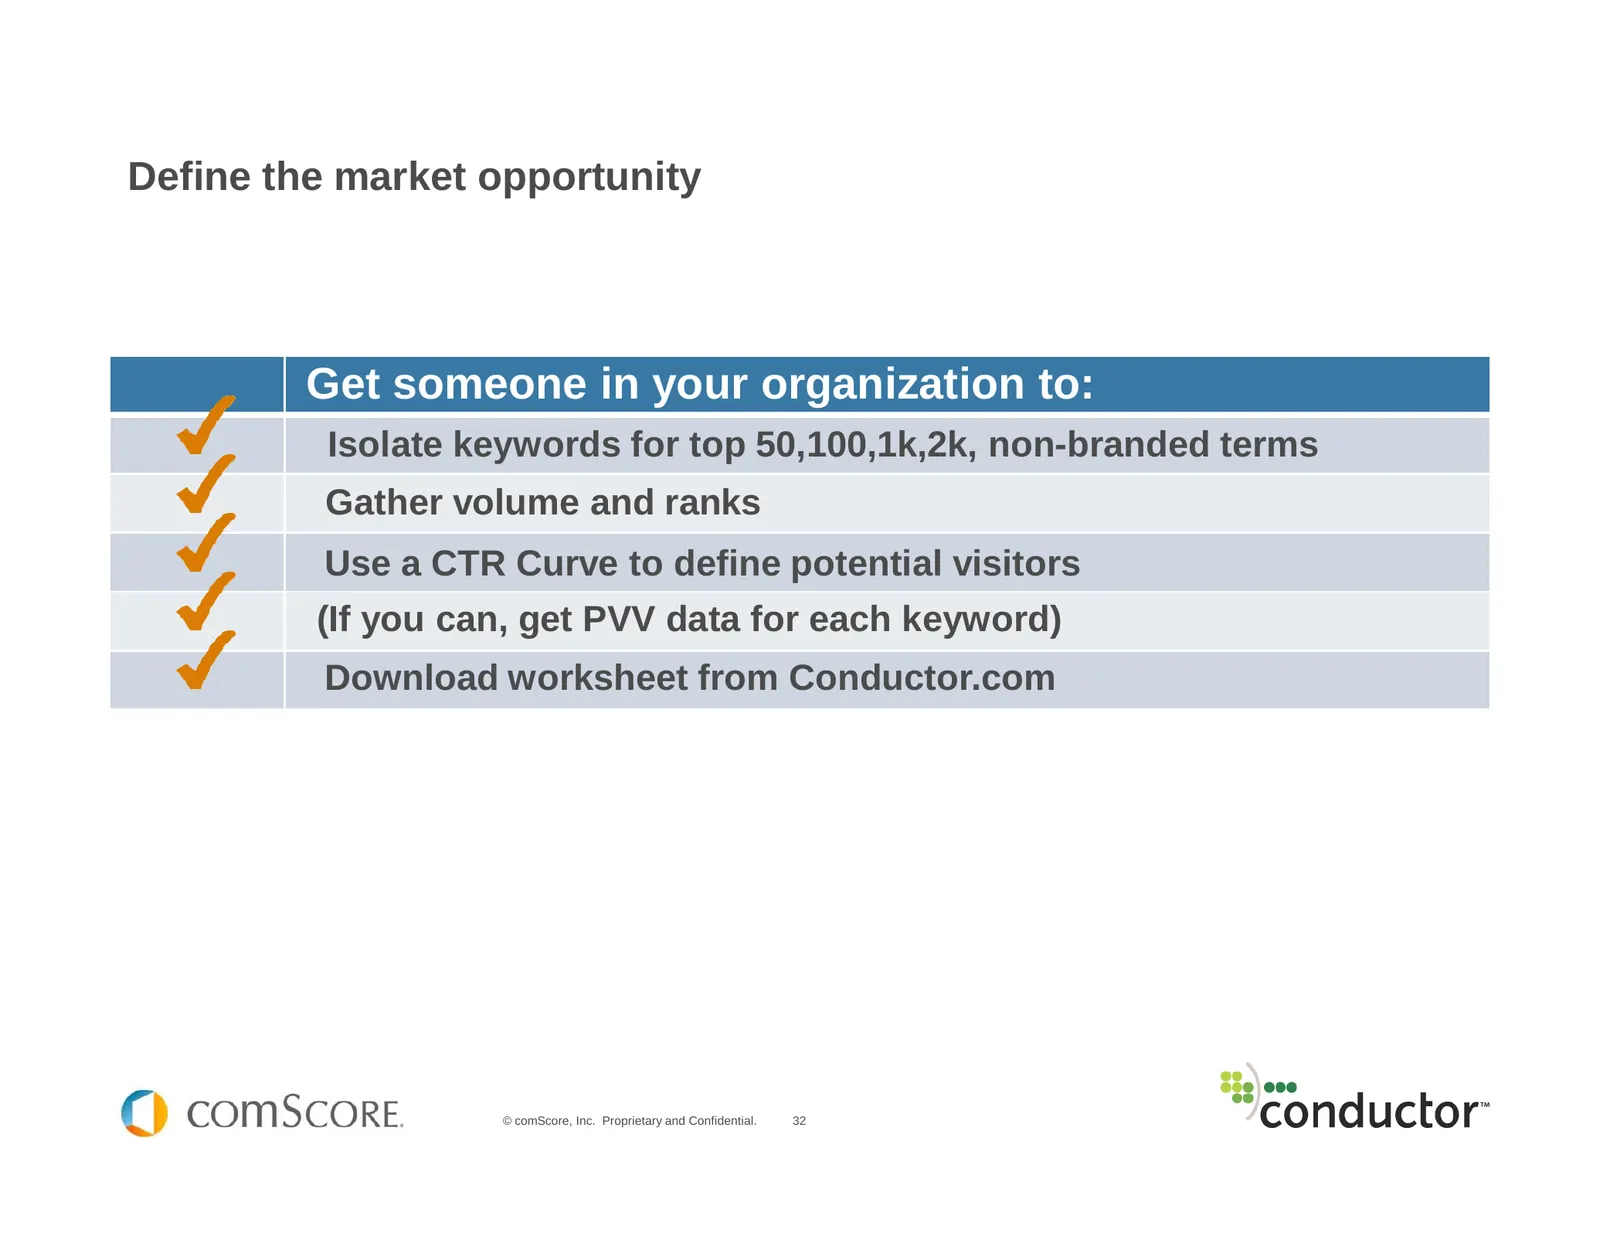
Define the market opportunity Get someone in your organization to: Isolate keywords for top 50,100,1k,2k, non-branded terms Gather volume and ranks Use a CTR Curve to define potential visitors (If you can, get PVV data for each keyword) Download worksheet from Conductor.com © comScore, Inc. Propriet
Slide 33: What is SEO Worth to Your Organization?
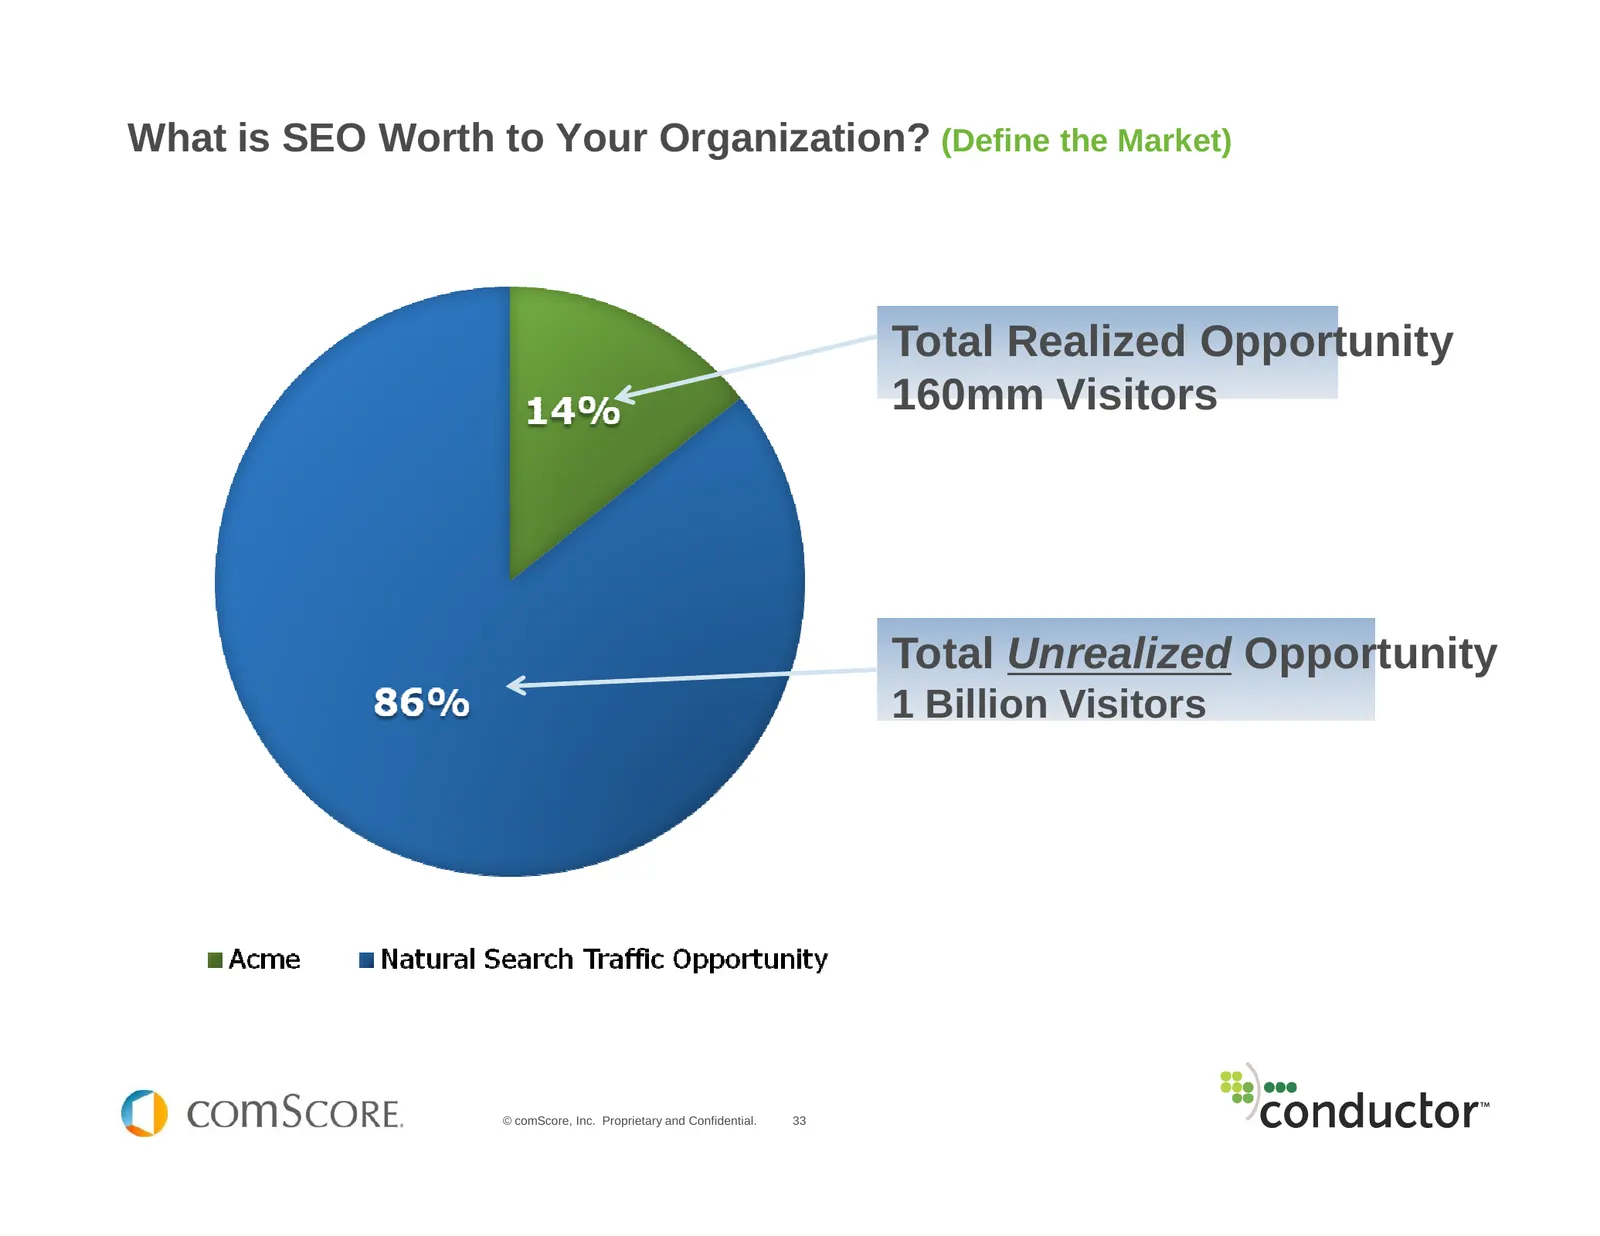
What is SEO Worth to Your Organization? (Define the Market) Total Realized Opportunity 160mm Visitors Total Unrealized Opportunity 1 Billion Visitors © comScore, Inc. Proprietary and Confidential. 33
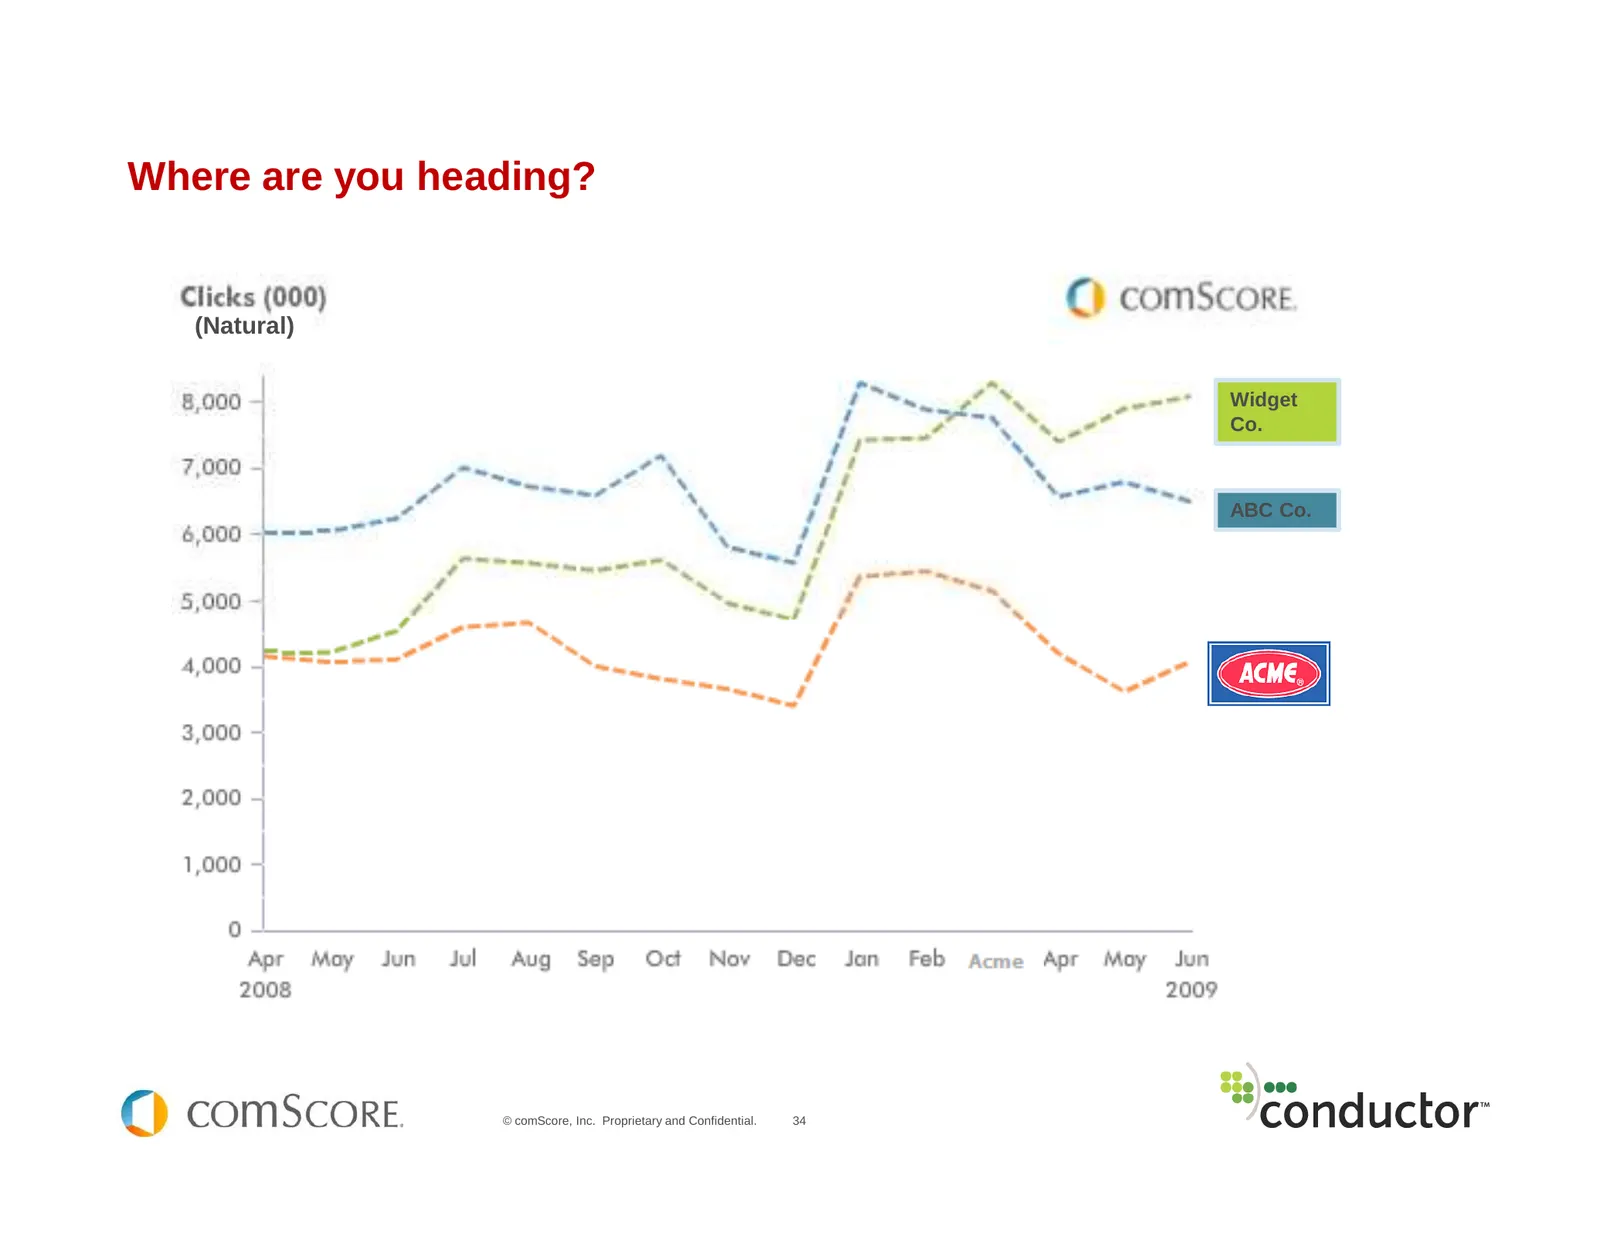
Slide 34: Where are you heading?
Where are you heading? (Natural) Widget Co. ABC Co. © comScore, Inc. Proprietary and Confidential. 34
Slide 35: Create a Game Plan for Success
Create a Game Plan for Success Educate, Manage Expectations, Create Success Metrics, and Establish Milestones © comScore, Inc. Proprietary and Confidential. 35
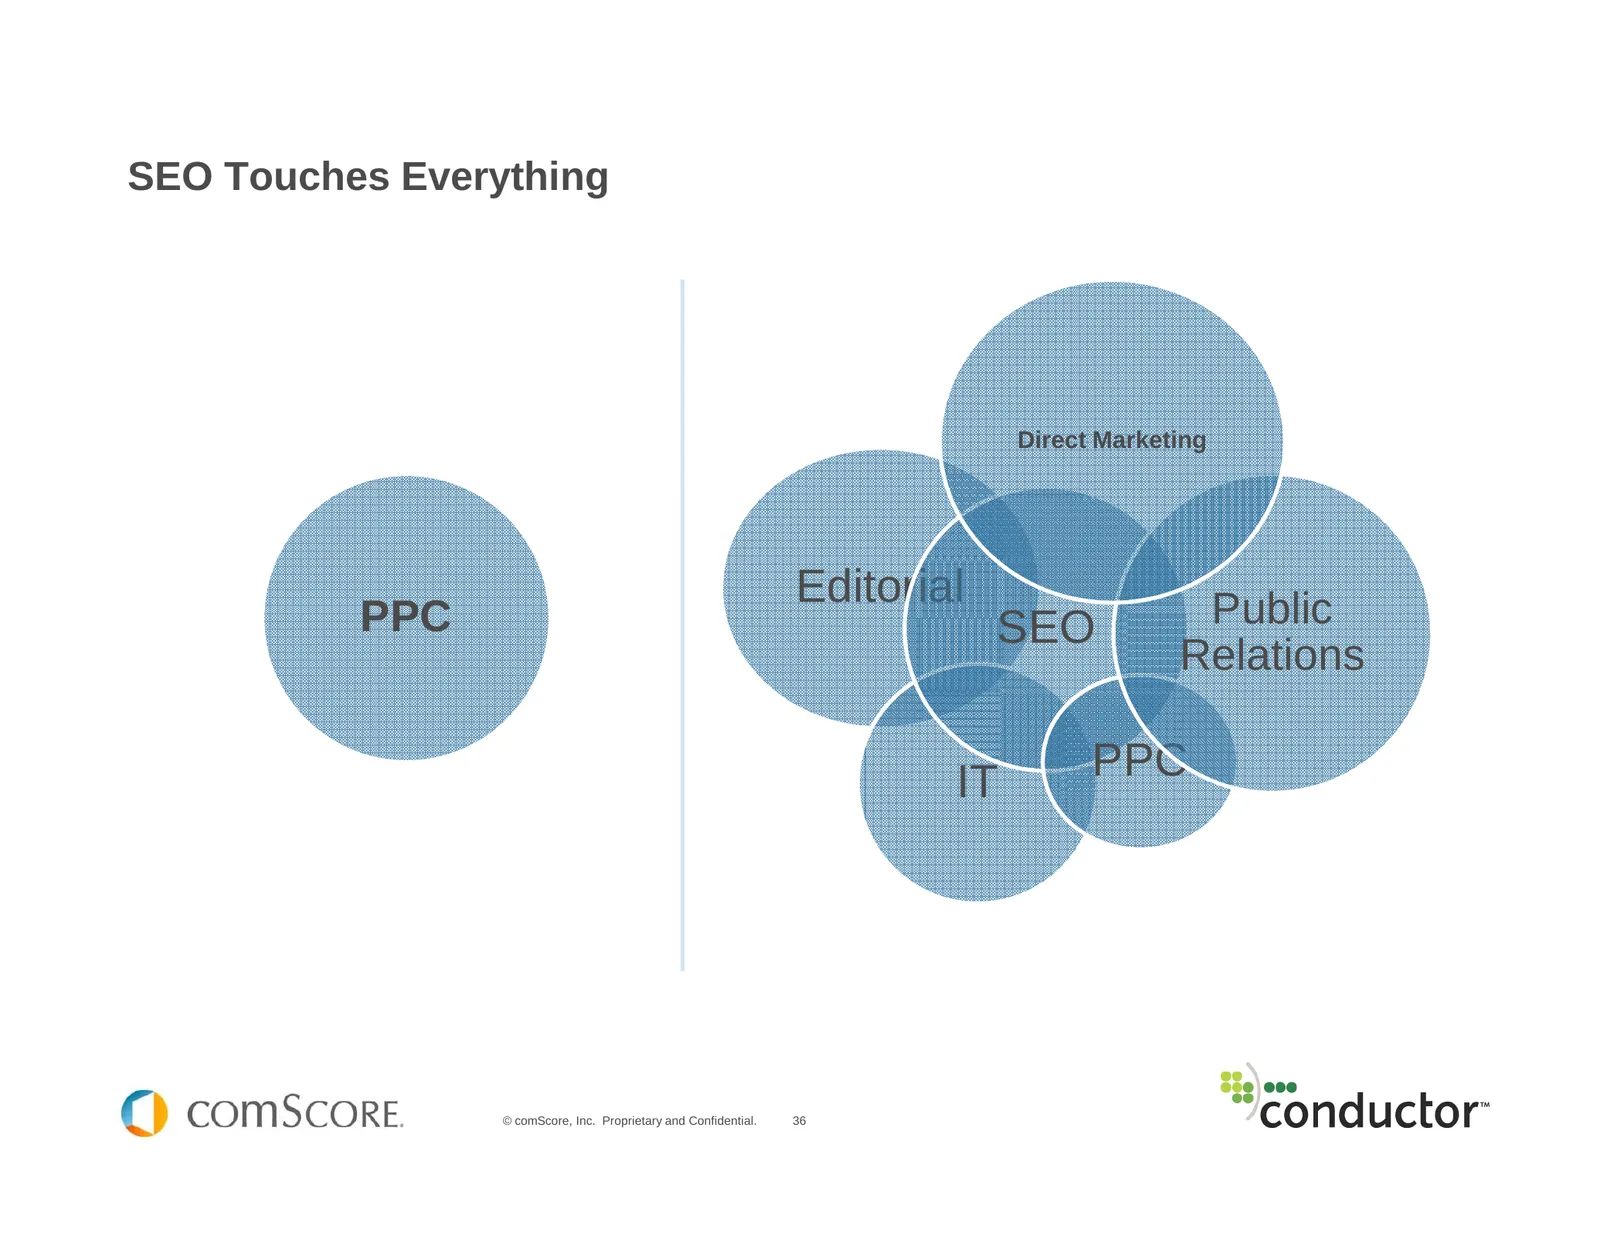
Slide 36: SEO Touches Everything
SEO Touches Everything Direct Marketing Editorial Public PPC SEO Relations IT PPC © comScore, Inc. Proprietary and Confidential. 36
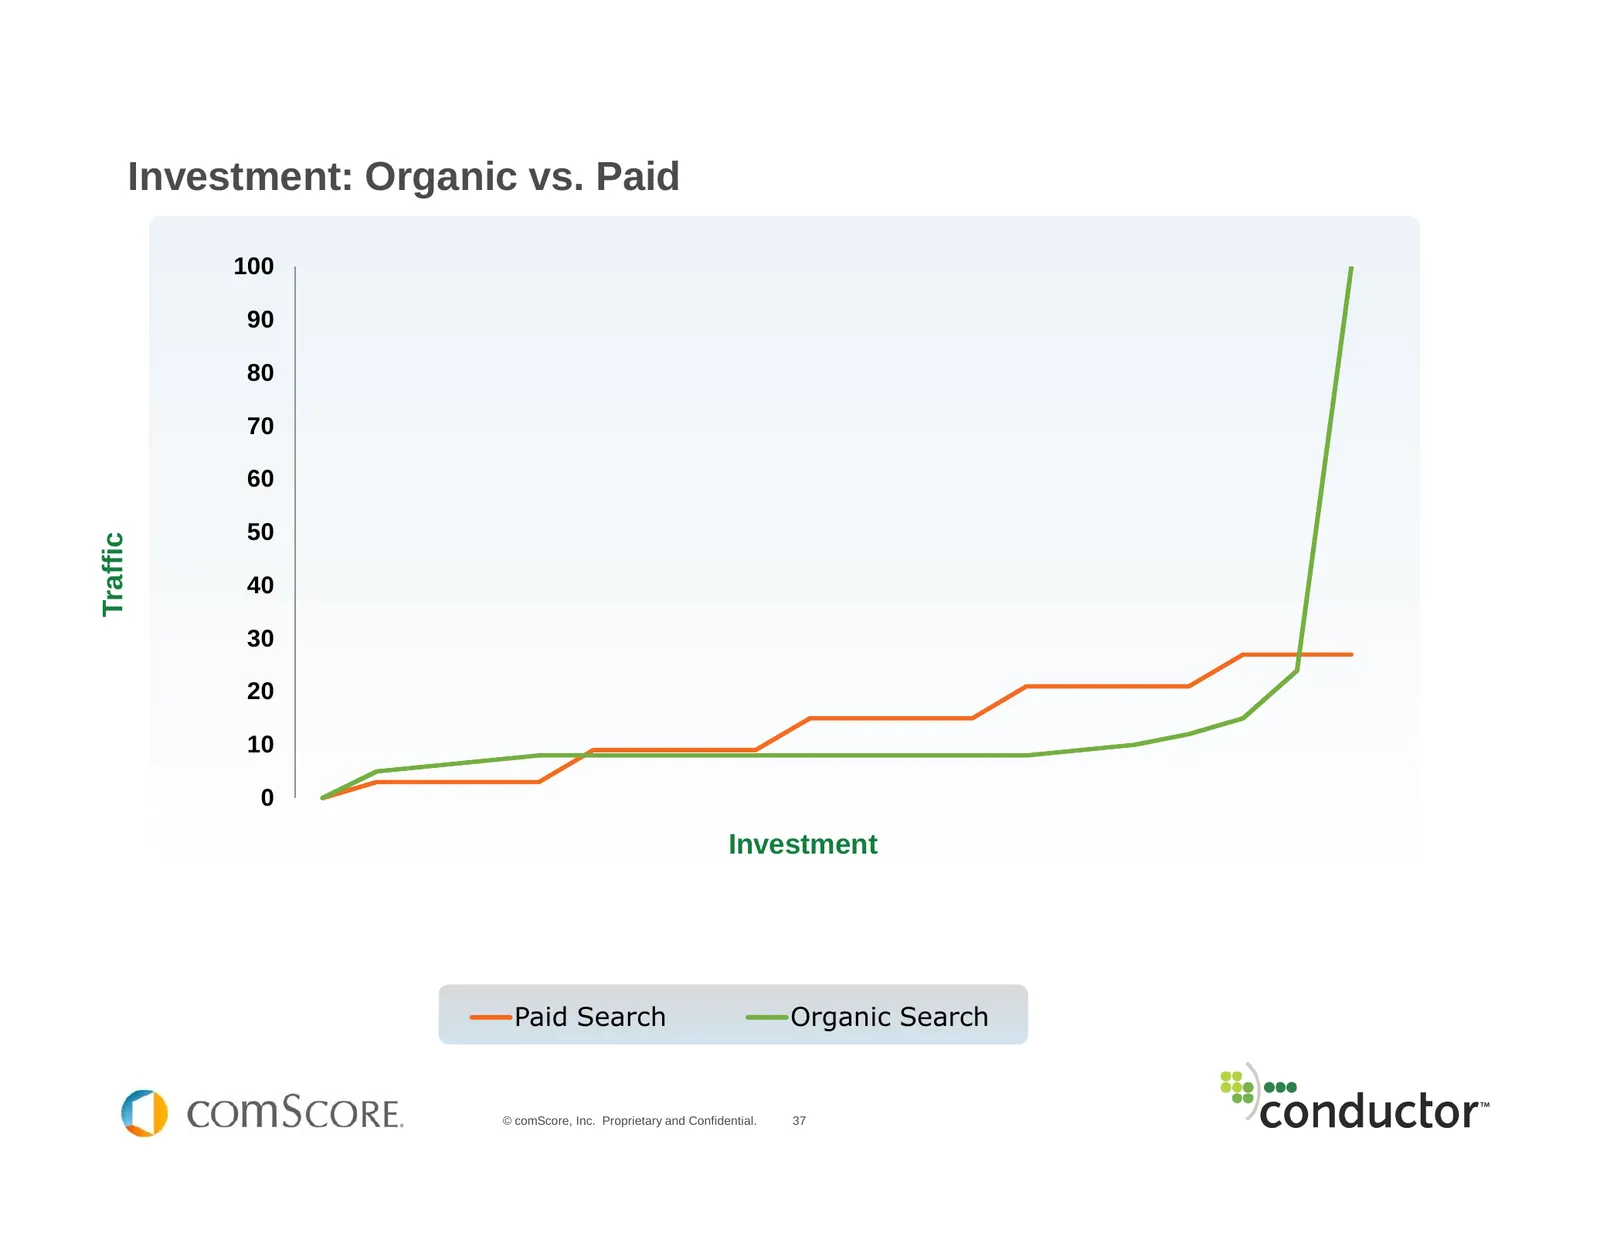
Slide 37: Investment: Organic vs. Paid
Investment: Organic vs. Paid 100 90 80 70 60 50 Traffic 40 30 20 10 0 Investment Paid Search Organic Search © comScore, Inc. Proprietary and Confidential. 37
Slide 38: Reporting – The Roadmap to Continued Success
Reporting – The Roadmap to Continued Success © comScore, Inc. Proprietary and Confidential. 38
Slide 39: Stepping Stone SEO Metrics
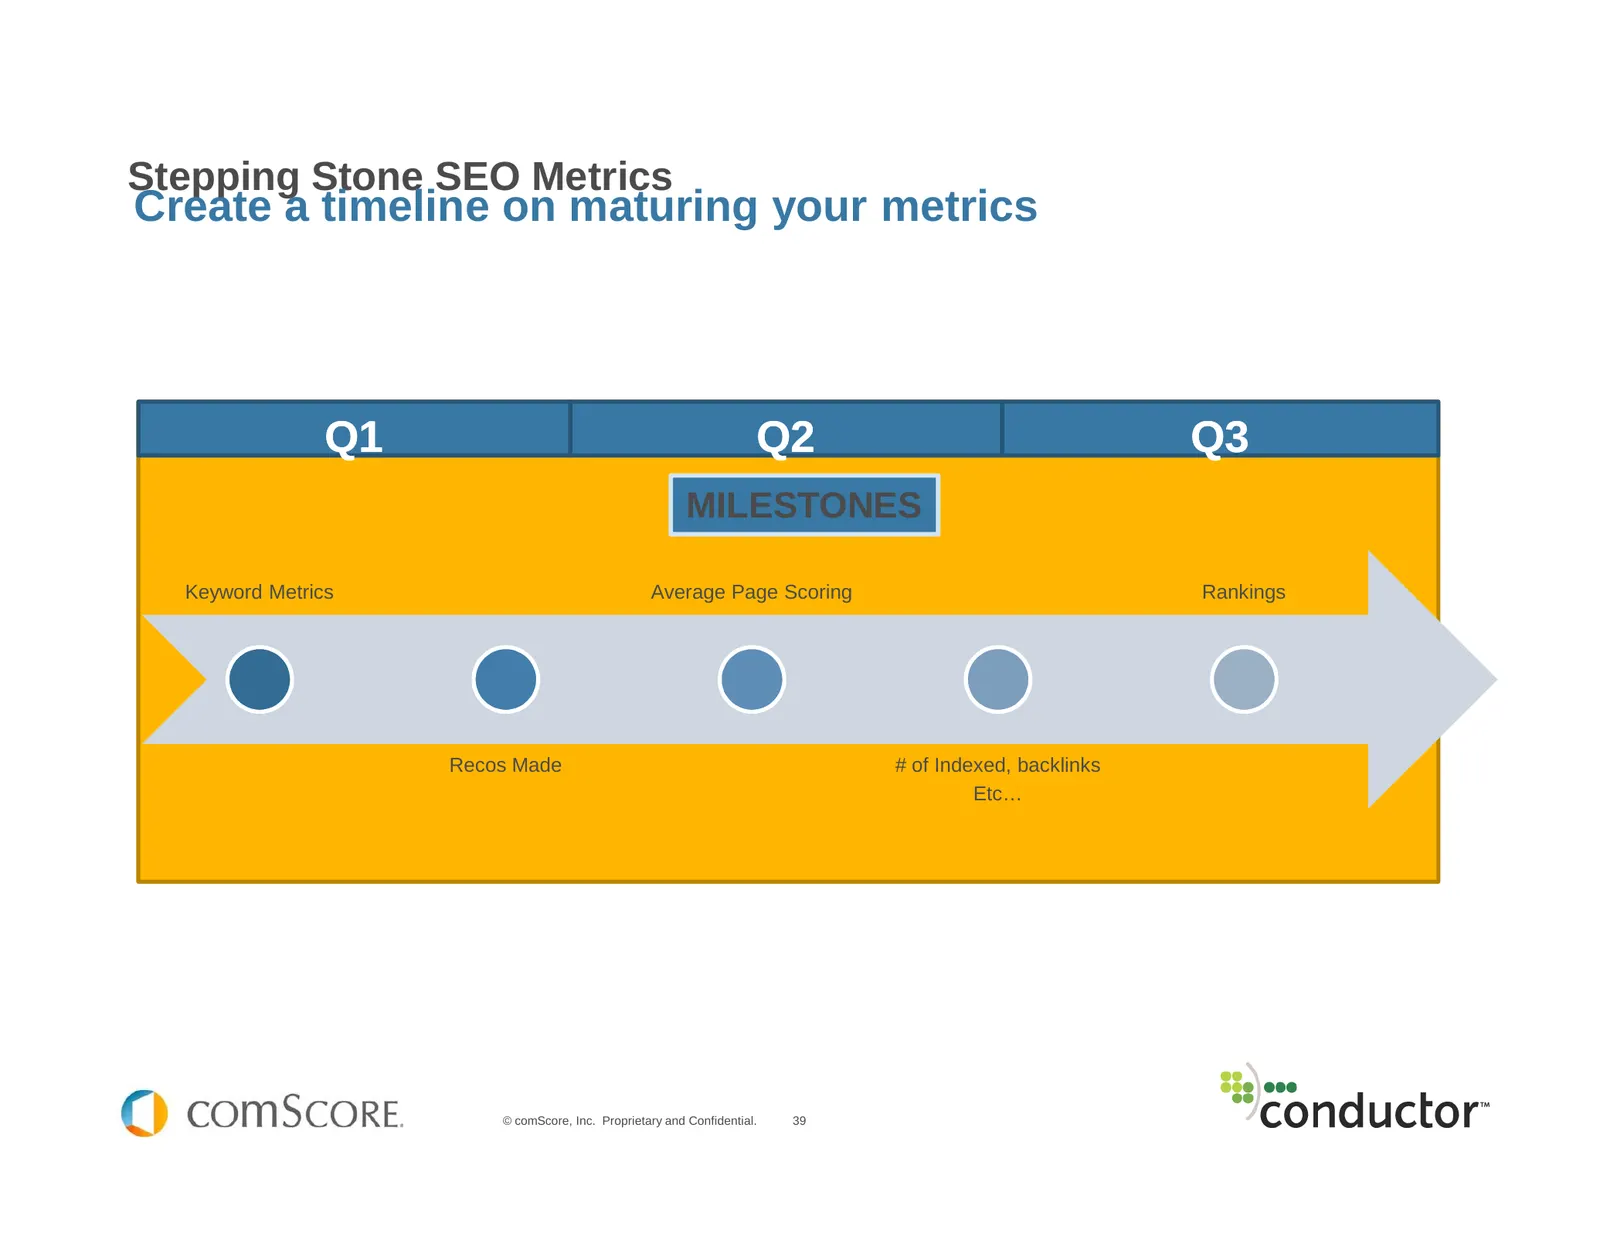
Stepping Stone SEO Metrics Create a timeline on maturing your metrics Q1 Q2 Q3 MILESTONES Keyword Metrics Average Page Scoring Rankings Recos Made # of Indexed, backlinks Etc… © comScore, Inc. Proprietary and Confidential. 39
Slide 40: Keep urgency alive with Share of Search reporting
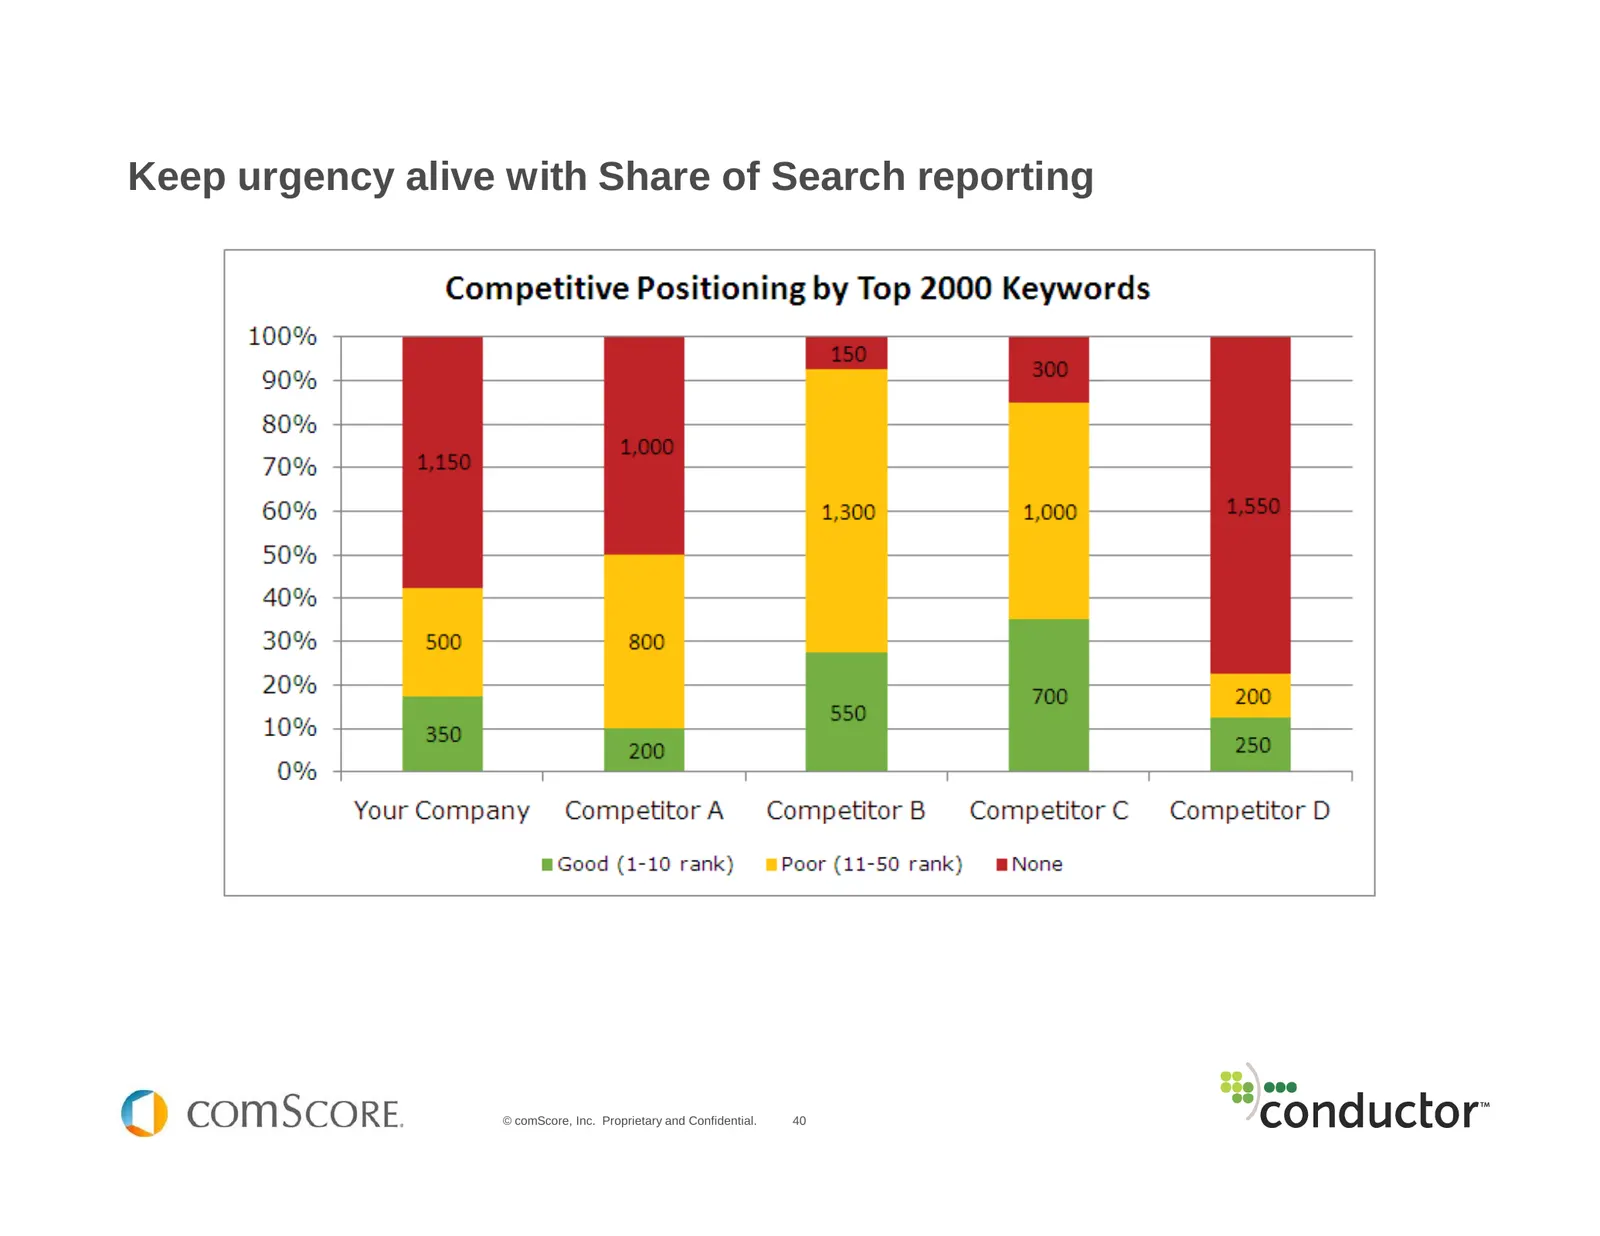
Keep urgency alive with Share of Search reporting © comScore, Inc. Proprietary and Confidential. 40
Slide 41: Summary
Summary 93% of Internet Retailer Companies average page 5 in natural search results for their money keywords 3 Tiered Approach to Success in Natural Search: – Define the Opportunity – Expectations and a Game Plan – Make Reporting a Cornerstone All registrants will receive an email with a link to dow
Slide 42: Questions?
Questions? – Eli Goodman Search Evangelist comScore, Inc. egoodman@comscore.com – Nathan Safran Sr. Research Analyst Conductor nsafran@conductor.com – Seth Dotterer Sr. Director of Marketing Conductor sdotterer@conductor.com © comScore, Inc. Proprietary and Confidential. 42
Source: Internet Archive copy of comscore.com
More decks from comScore, Inc.
 Q3 2026 Earnings Presentation17 slides · Nov 3, 2026
 Q2 2026 Earnings Presentation20 slides · Aug 12, 2026
 Investor Presentation (June 2026)27 slides · Jun 10, 2026
 Q4 2025 Earnings Presentation13 slides · Mar 17, 2026
 Q3 2025 Earnings Presentation15 slides · Nov 4, 2025
 Q2 2025 Earnings Presentation11 slides · Aug 5, 2025