Columbia Property Trust — Investor Presentation (September 2013)
26 slides from Columbia Property Trust's investor presentation, Sep 30, 2013

Slide 1: Columbia Property Trust, October 2013
Columbia 7 October 2013 Property Trust
Slide 2: Forward Looking Statements
Forward Looking Statements Certain statements contained in this presentation may be considered forward-looking statements. All statements that address operating performance, events or developments that we expect or anticipate will occur in the future, including, without limitation, statements relate
Slide 3: Listing Summary
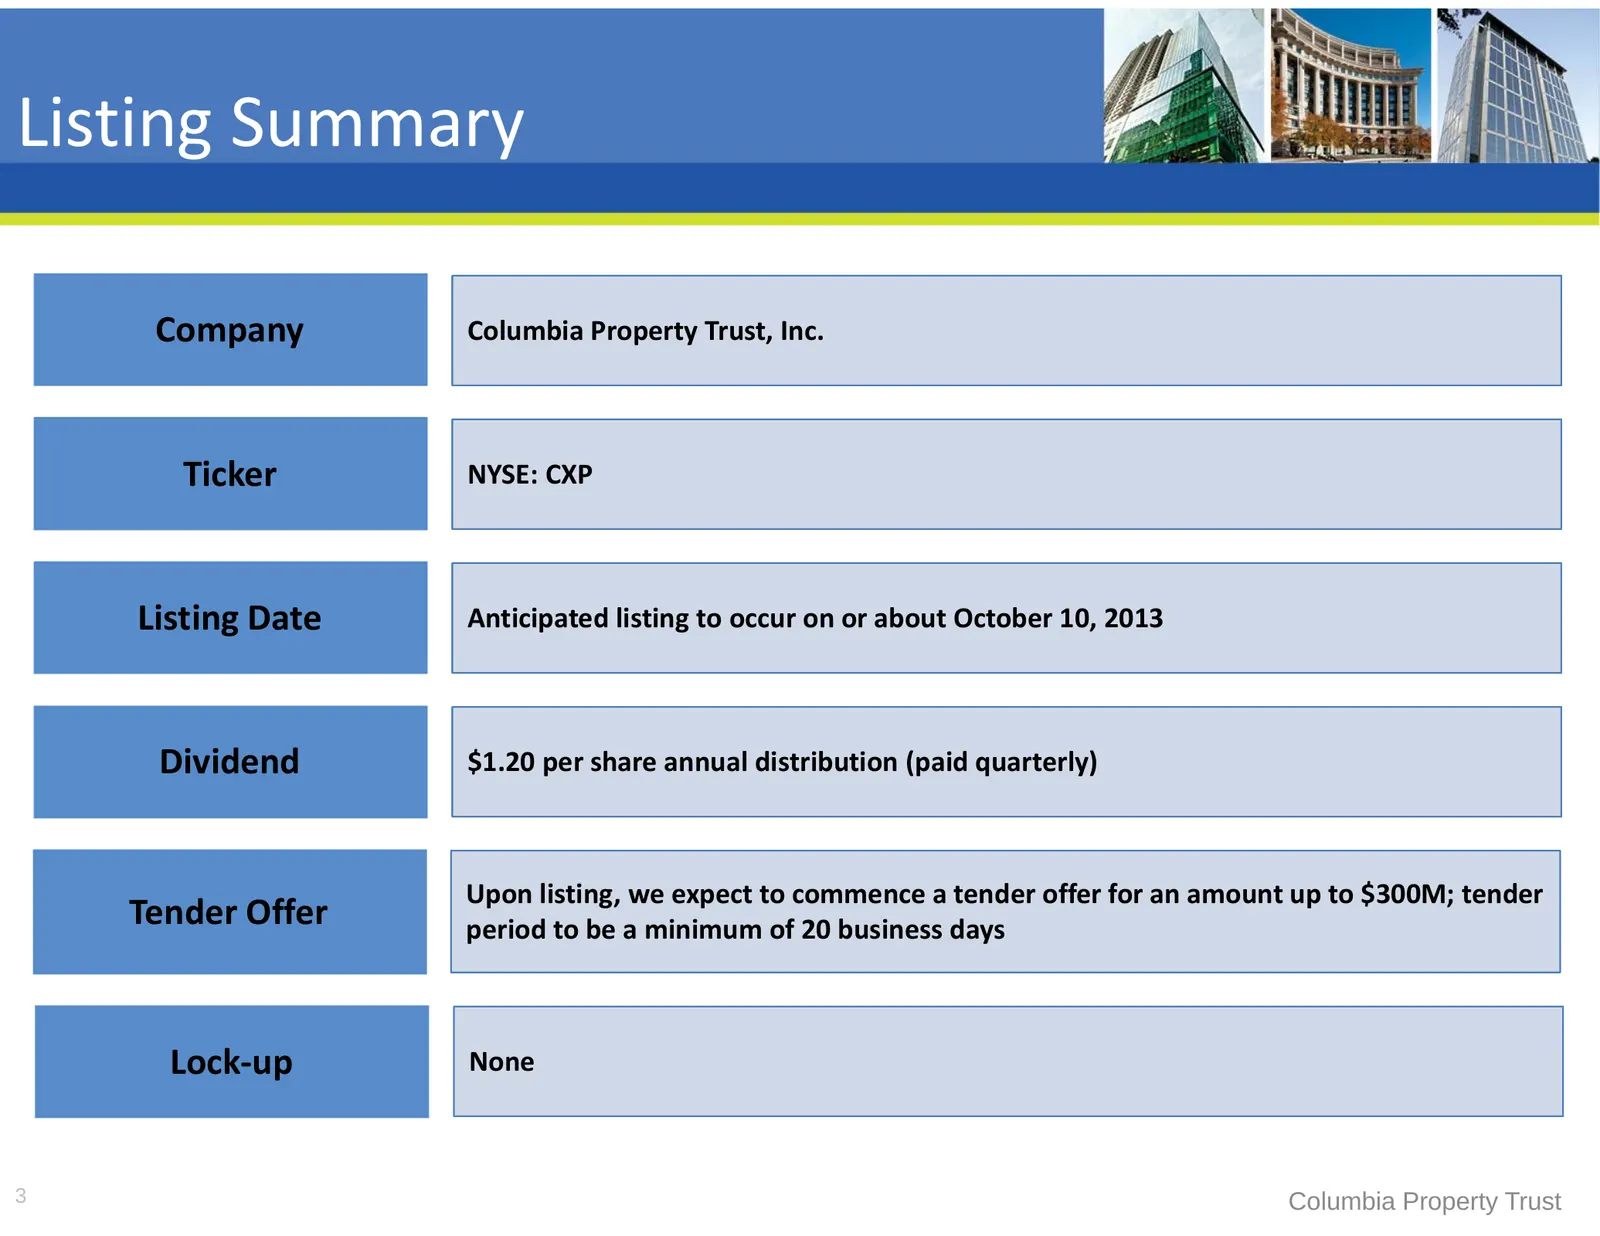
Listing Summary Company Columbia Property Trust, Inc. Ticker NYSE: CXP Listing Date Anticipated listing to occur on or about October 10, 2013 Dividend $1.20 per share annual distribution (paid quarterly) Upon listing, we expect to commence a tender offer for an amount up to $300M; tender Tender Offe
Slide 4: Investment Highlights
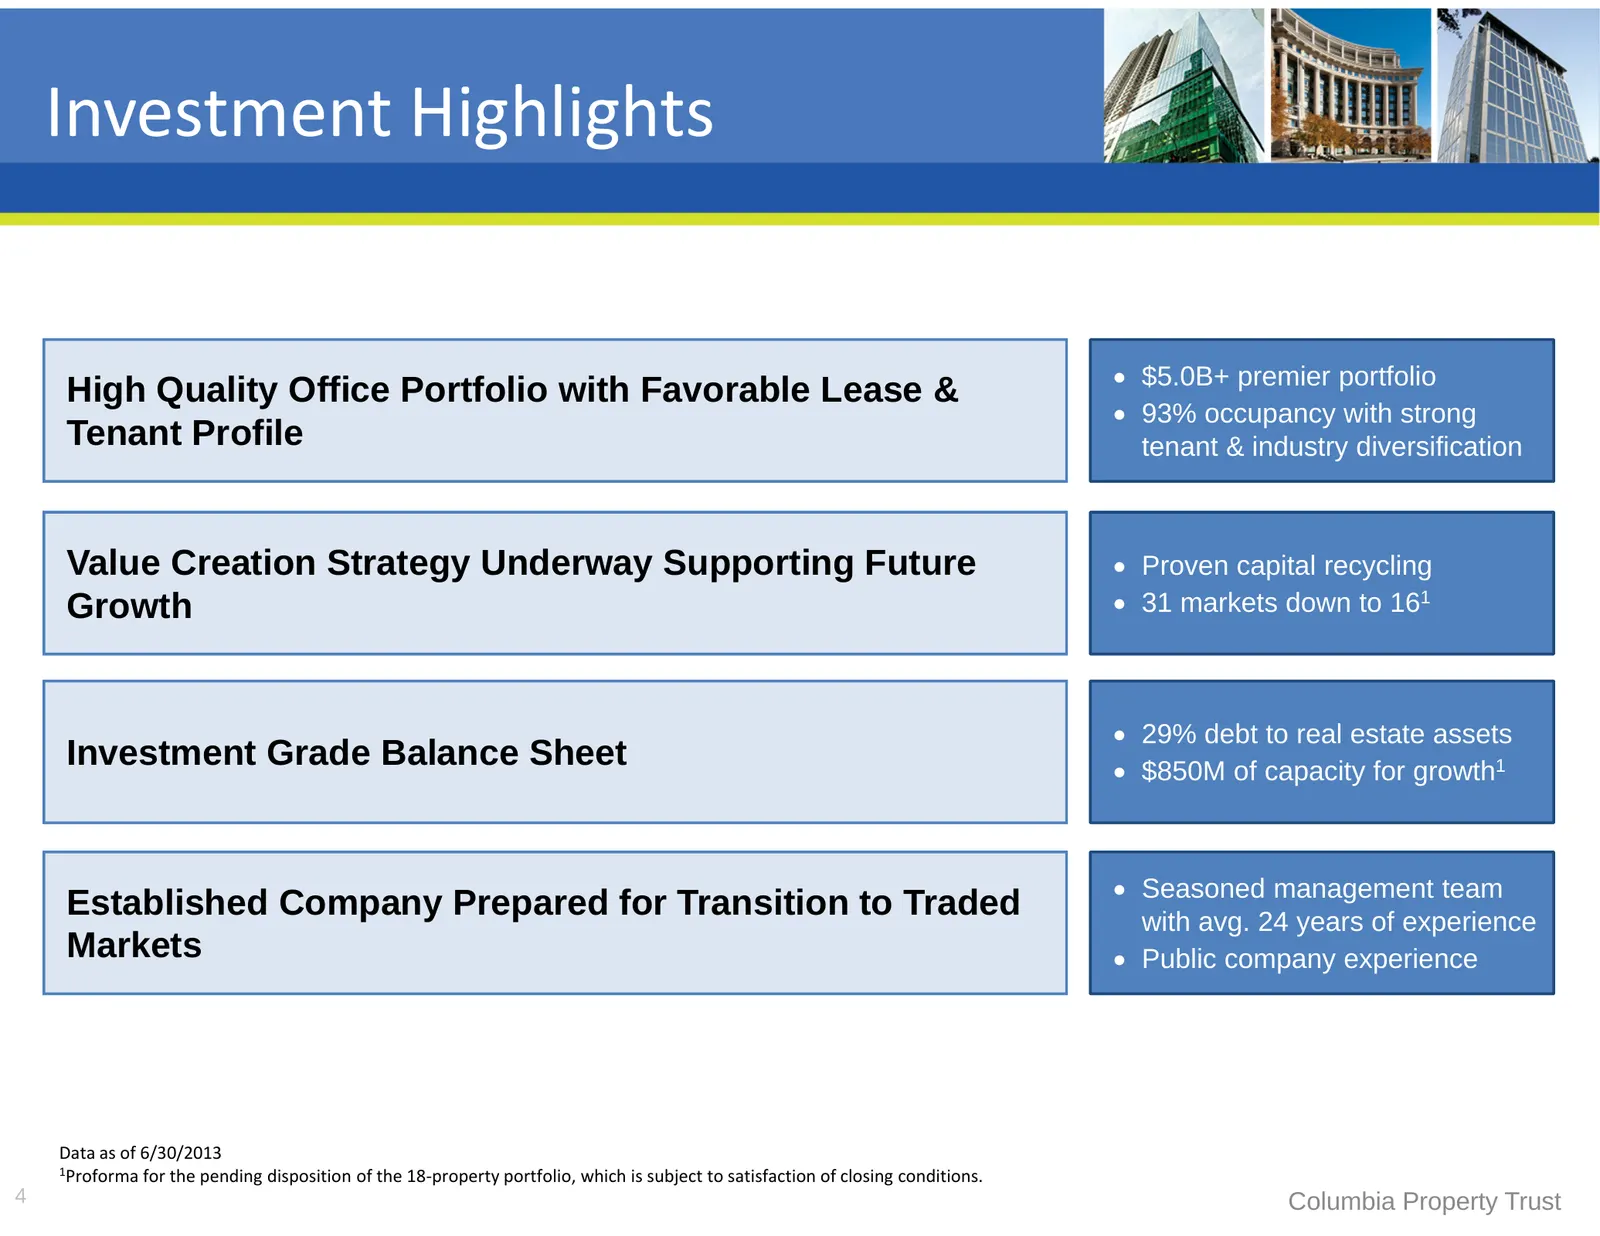
Investment Highlights $5.0B+ premier portfolio High Quality Office Portfolio with Favorable Lease & 93% occupancy with strong Tenant Profile tenant & industry diversification Value Creation Strategy Underway Supporting Future Proven capital recycling Growth 31 markets down to 161 29% debt
Slide 5: Past, Present & Future
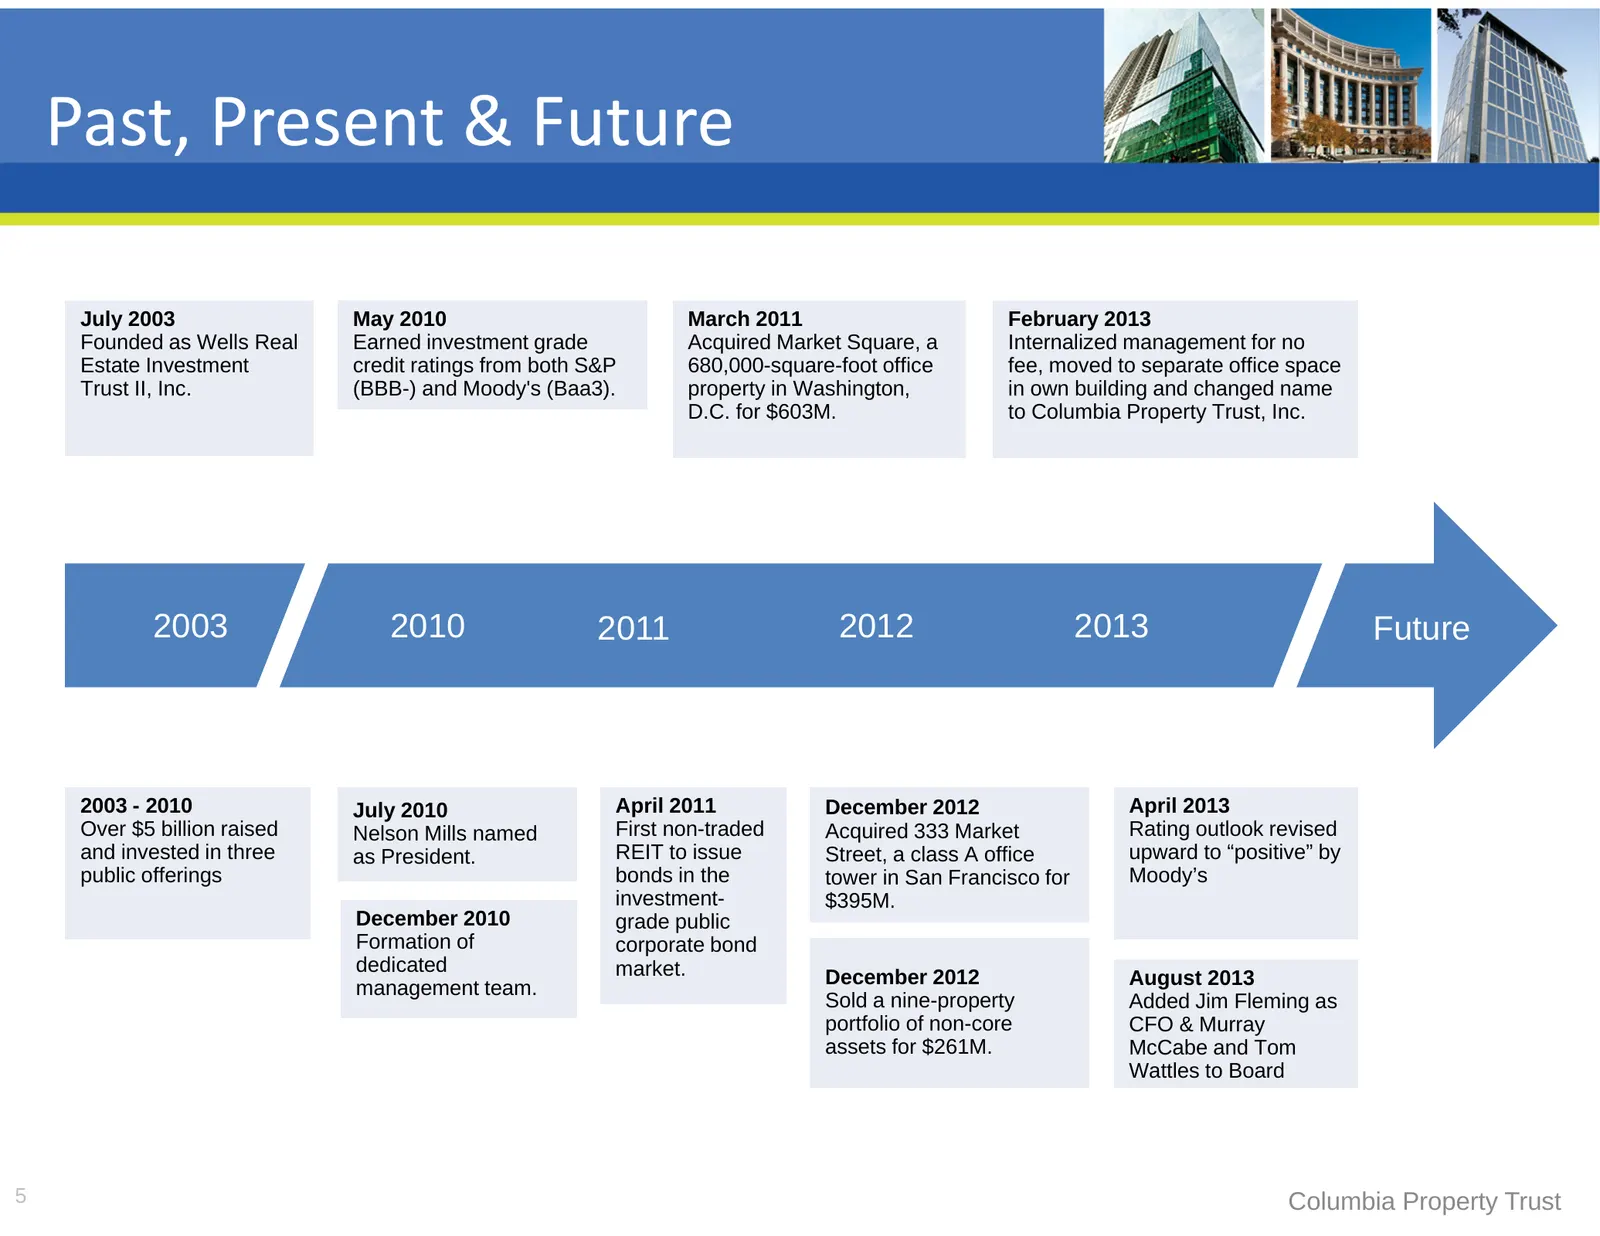
Past, Present & Future July 2003 May 2010 March 2011 February 2013 Founded as Wells Real Earned investment grade Acquired Market Square, a Internalized management for no Estate Investment credit ratings from both S&P 680,000-square-foot office fee, moved to separate office space Trust II, Inc. (BBB-
Slide 6: Attractive Competitive Positioning
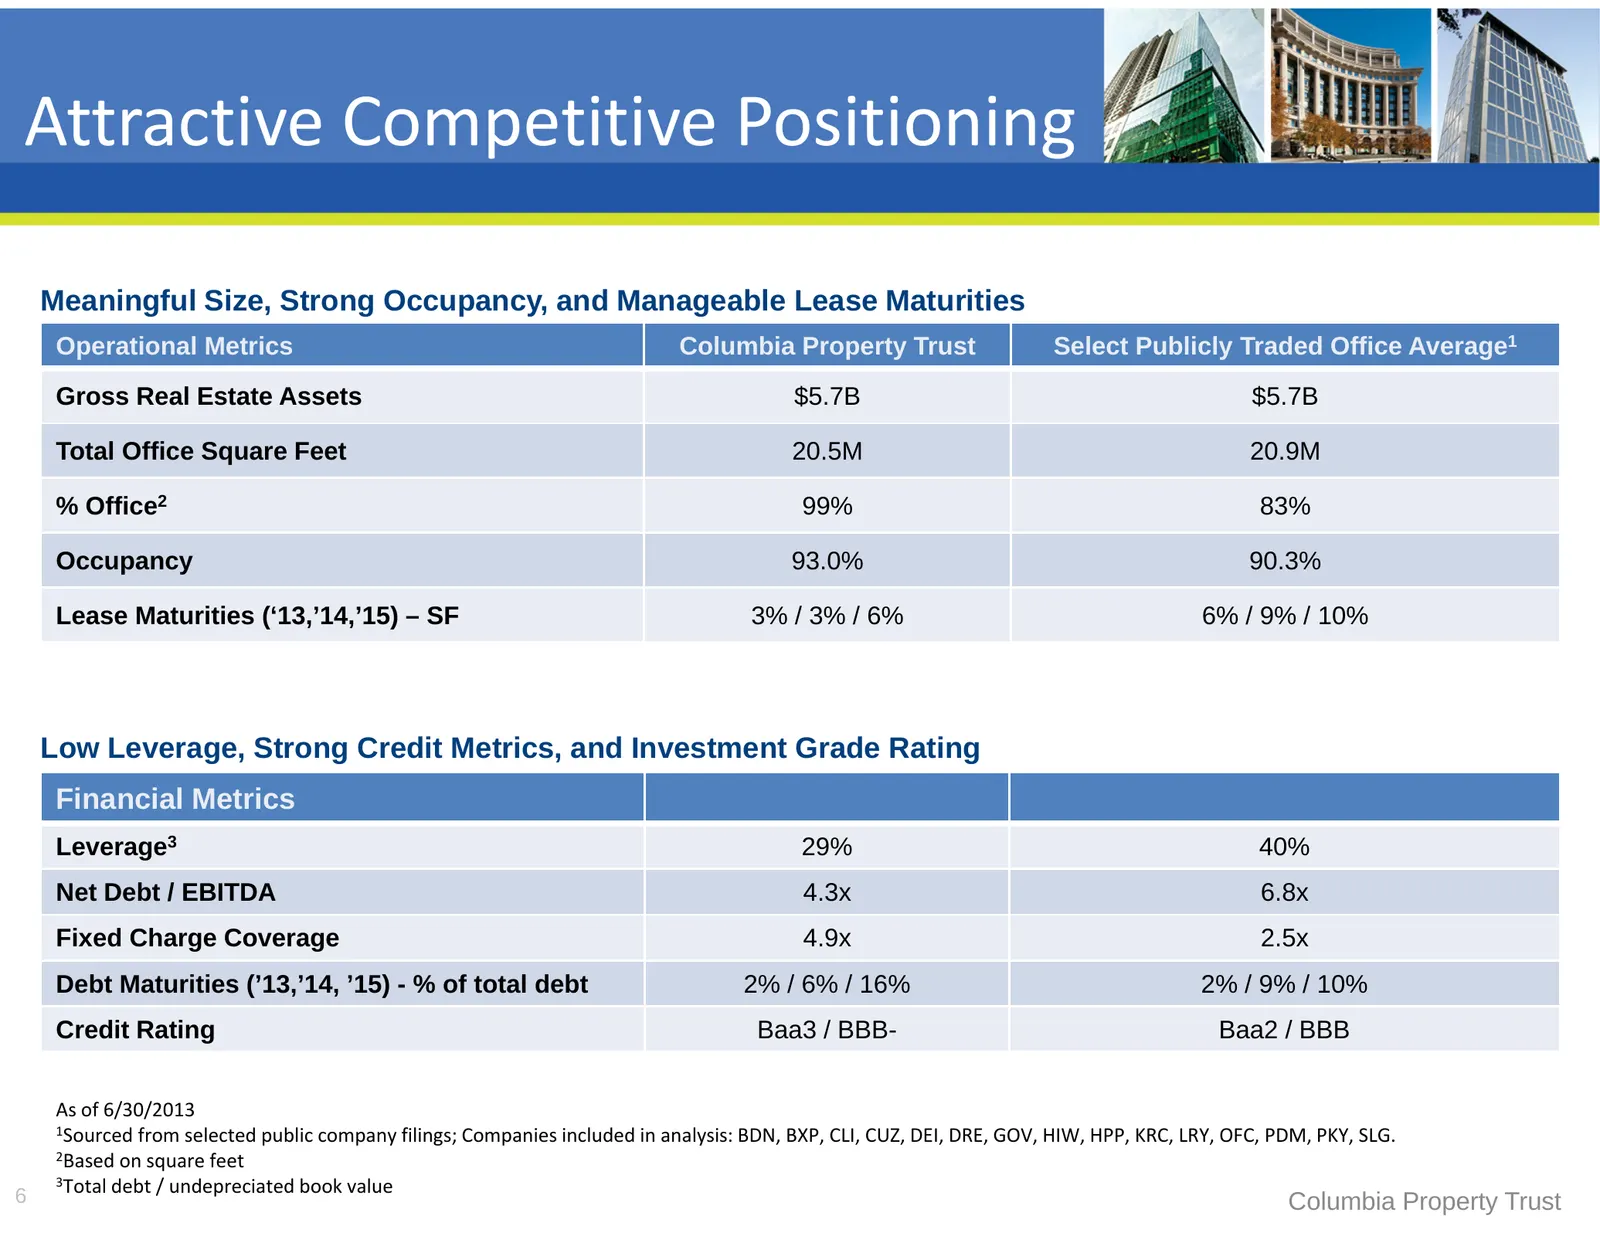
Attractive Competitive Positioning Meaningful Size, Strong Occupancy, and Manageable Lease Maturities Operational Metrics Columbia Property Trust Select Publicly Traded Office Average1 Gross Real Estate Assets $5.7B $5.7B Total Office Square Feet 20.5M 20.9M % Office2 99% 83% Occupancy 93.0% 90.3% L
Slide 7: High Quality Portfolio
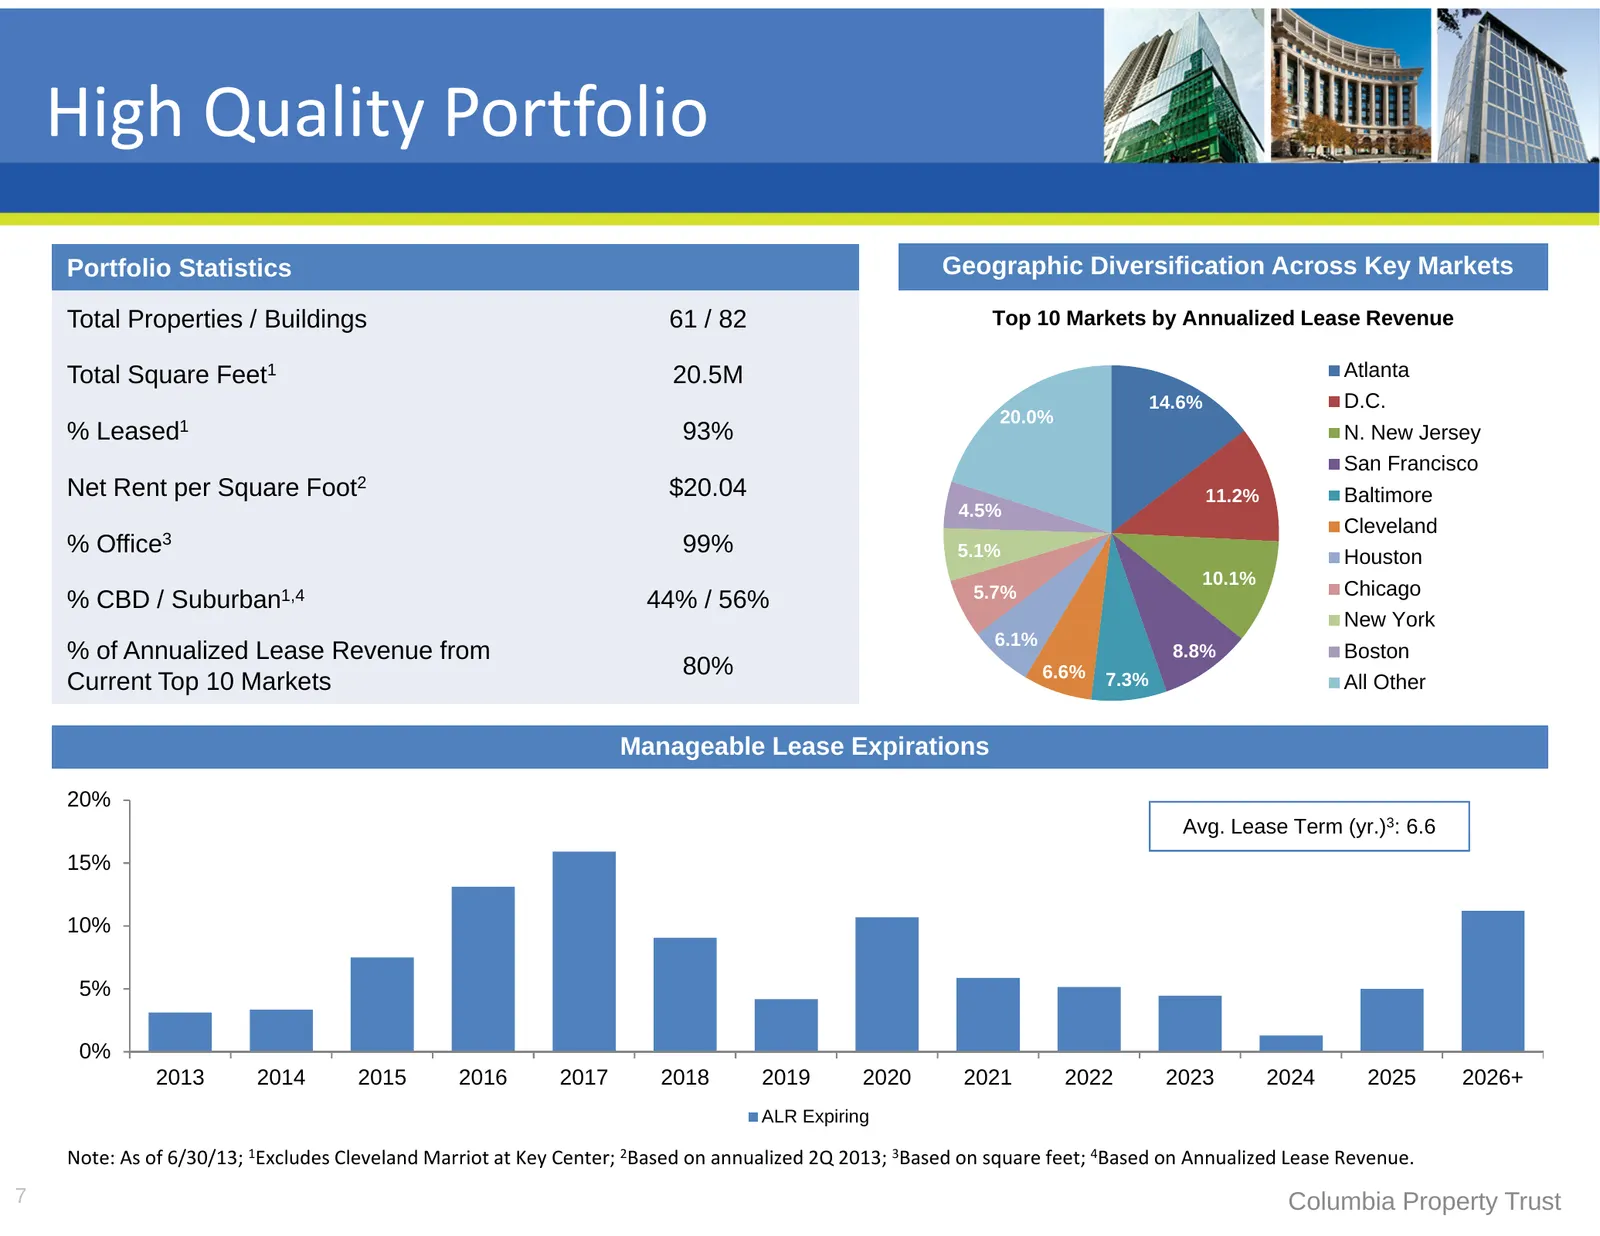
High Quality Portfolio Portfolio Statistics Geographic Diversification Across Key Markets Total Properties / Buildings 61 / 82 Top 10 Markets by Annualized Lease Revenue Total Square Feet1 20.5M Atlanta 14.6% D.C. 20.0% % Leased1 93% N. New Jersey San Francisco Net Rent per Square Foot2 $20.04 11.2%
Slide 8: Favorable Lease & Tenant Profile
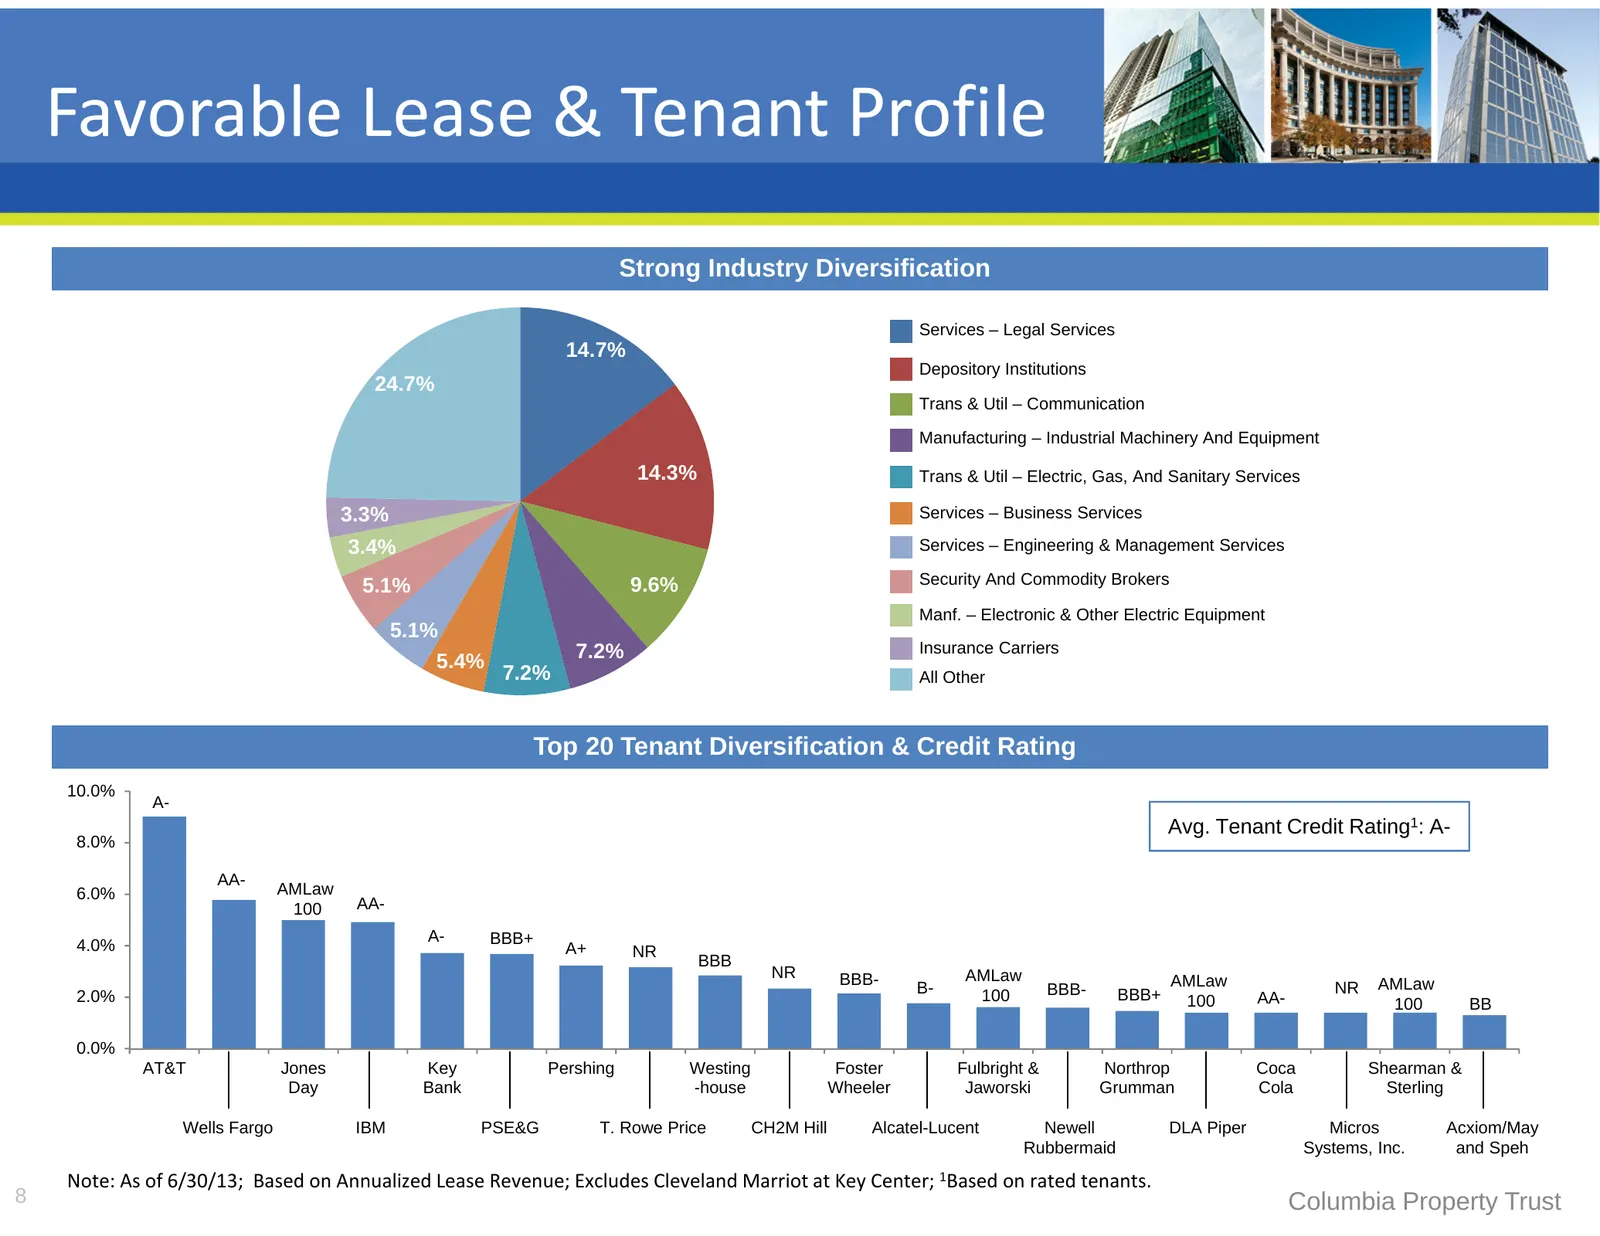
Favorable Lease & Tenant Profile Strong Industry Diversification Services – Legal Services 14.7% Depository Institutions 24.7% Trans & Util – Communication Manufacturing – Industrial Machinery And Equipment 14.3% Trans & Util – Electric, Gas, And Sanitary Services 3.3% Services – Business Services 3
Slide 9: Value Creation & Growth Strategies
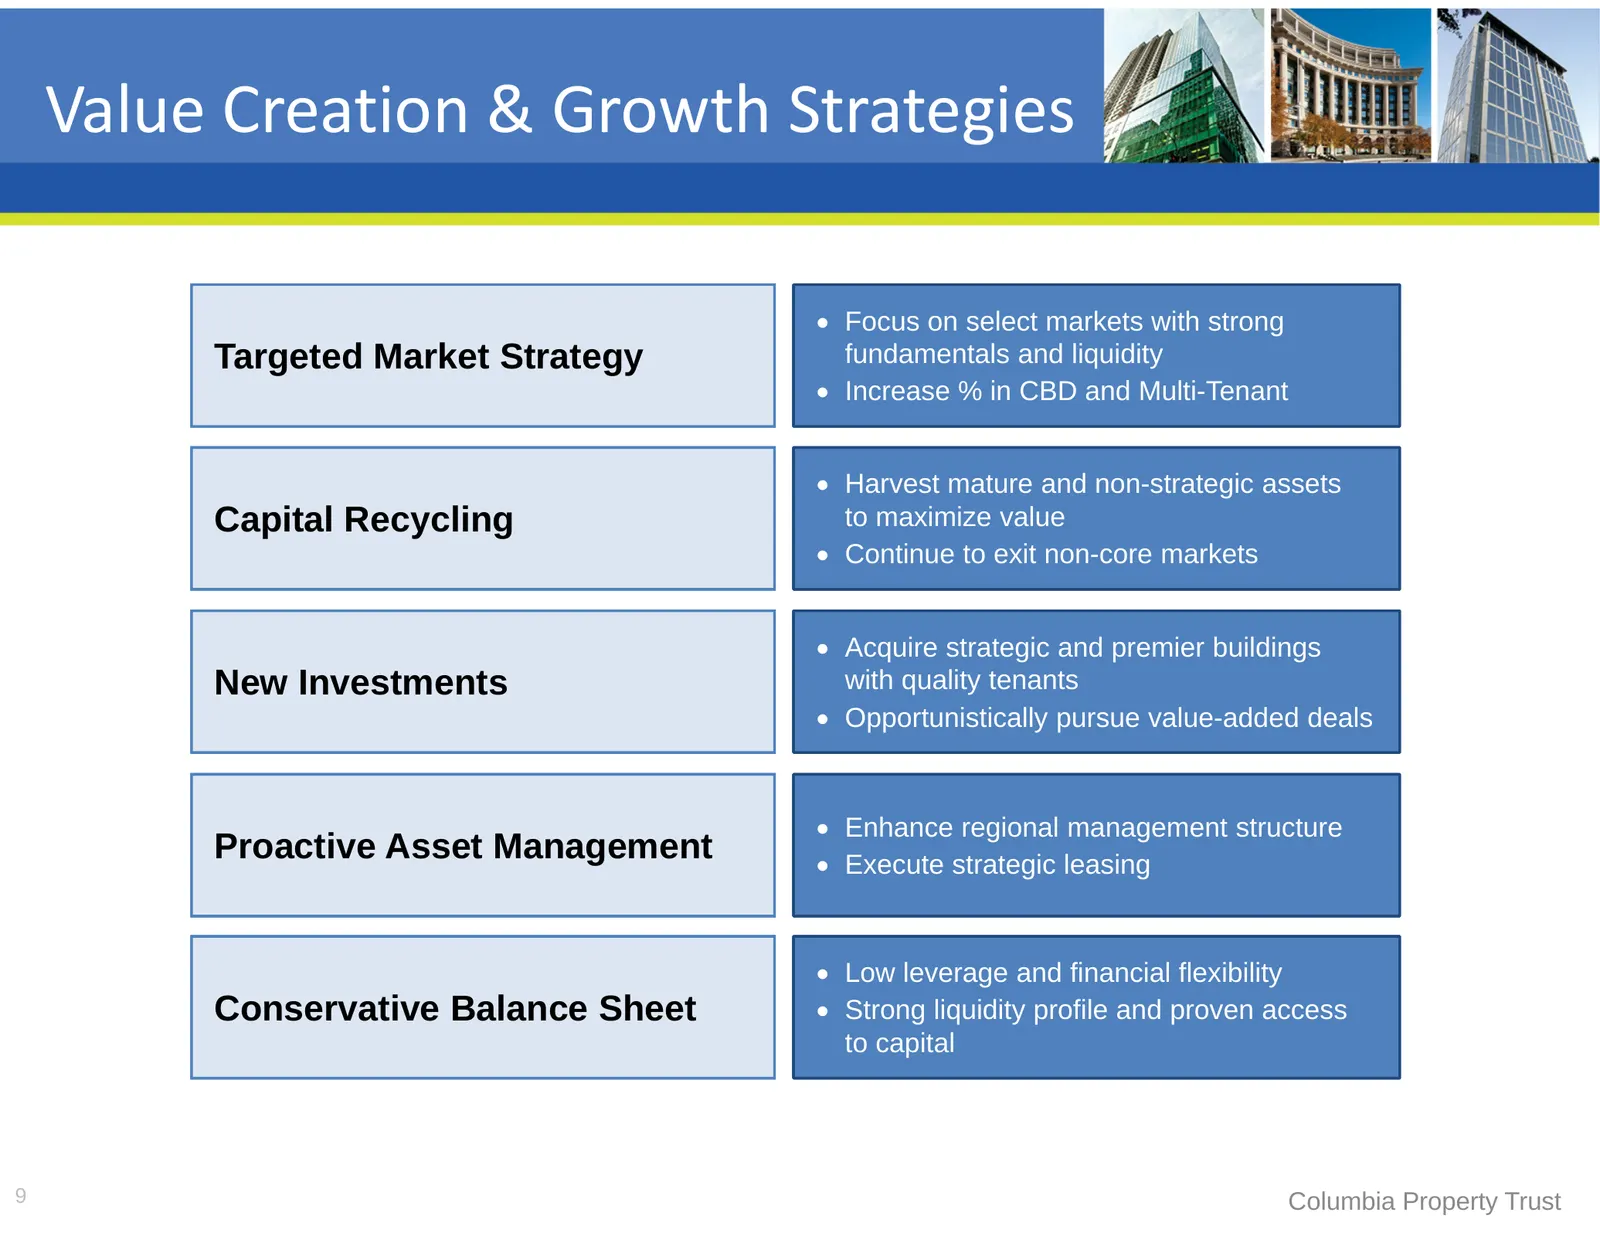
Value Creation & Growth Strategies Focus on select markets with strong Targeted Market Strategy fundamentals and liquidity Increase % in CBD and Multi-Tenant Harvest mature and non-strategic assets Capital Recycling to maximize value Continue to exit non-core markets Acquire strategic and
Slide 10: Market Strategy
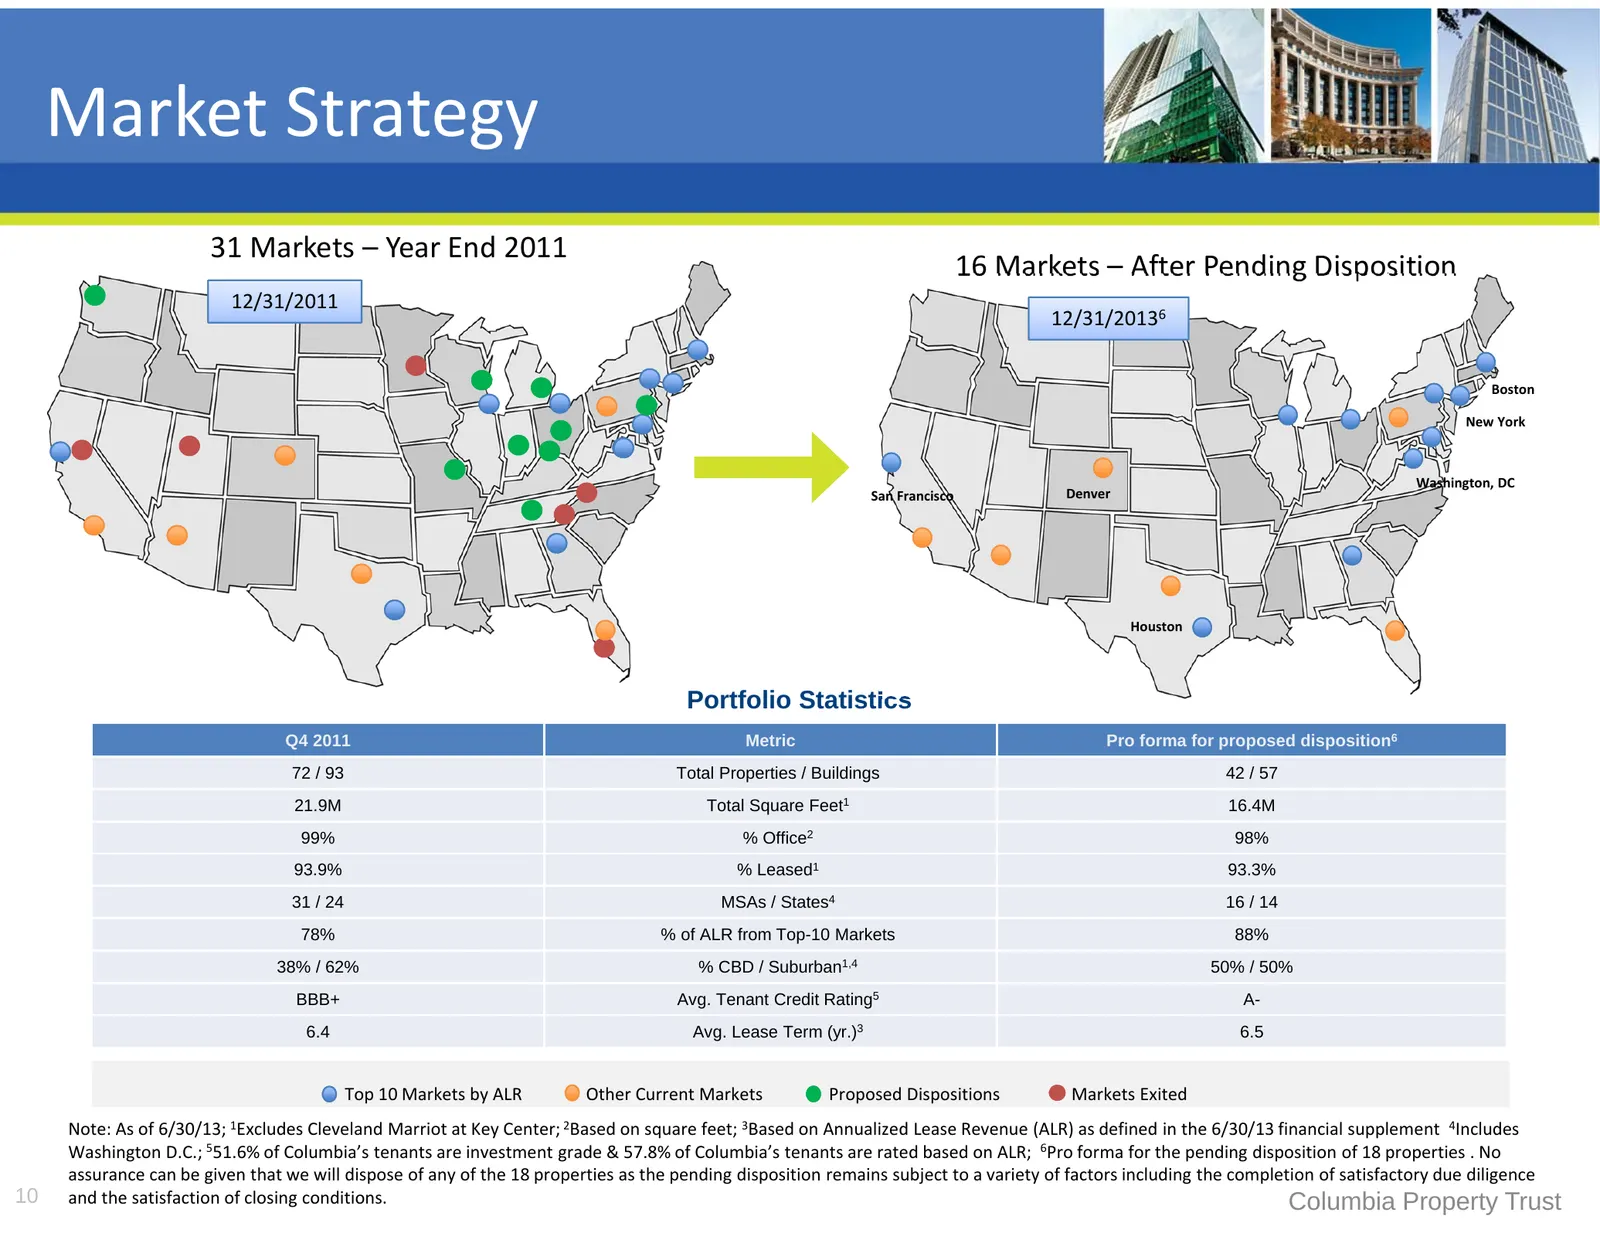
Market Strategy 31 Markets – Year End 2011 16 Markets – After Pending Disposition 12/31/2011 12/31/20136 Boston New York Washington, DC San Francisco Denver Houston Portfolio Statistics Q4 2011 Metric Pro forma for proposed disposition6 72 / 93 Total Properties / Buildings 42 / 57 21.9M Total Square
Slide 11: Capital Recycling Underway
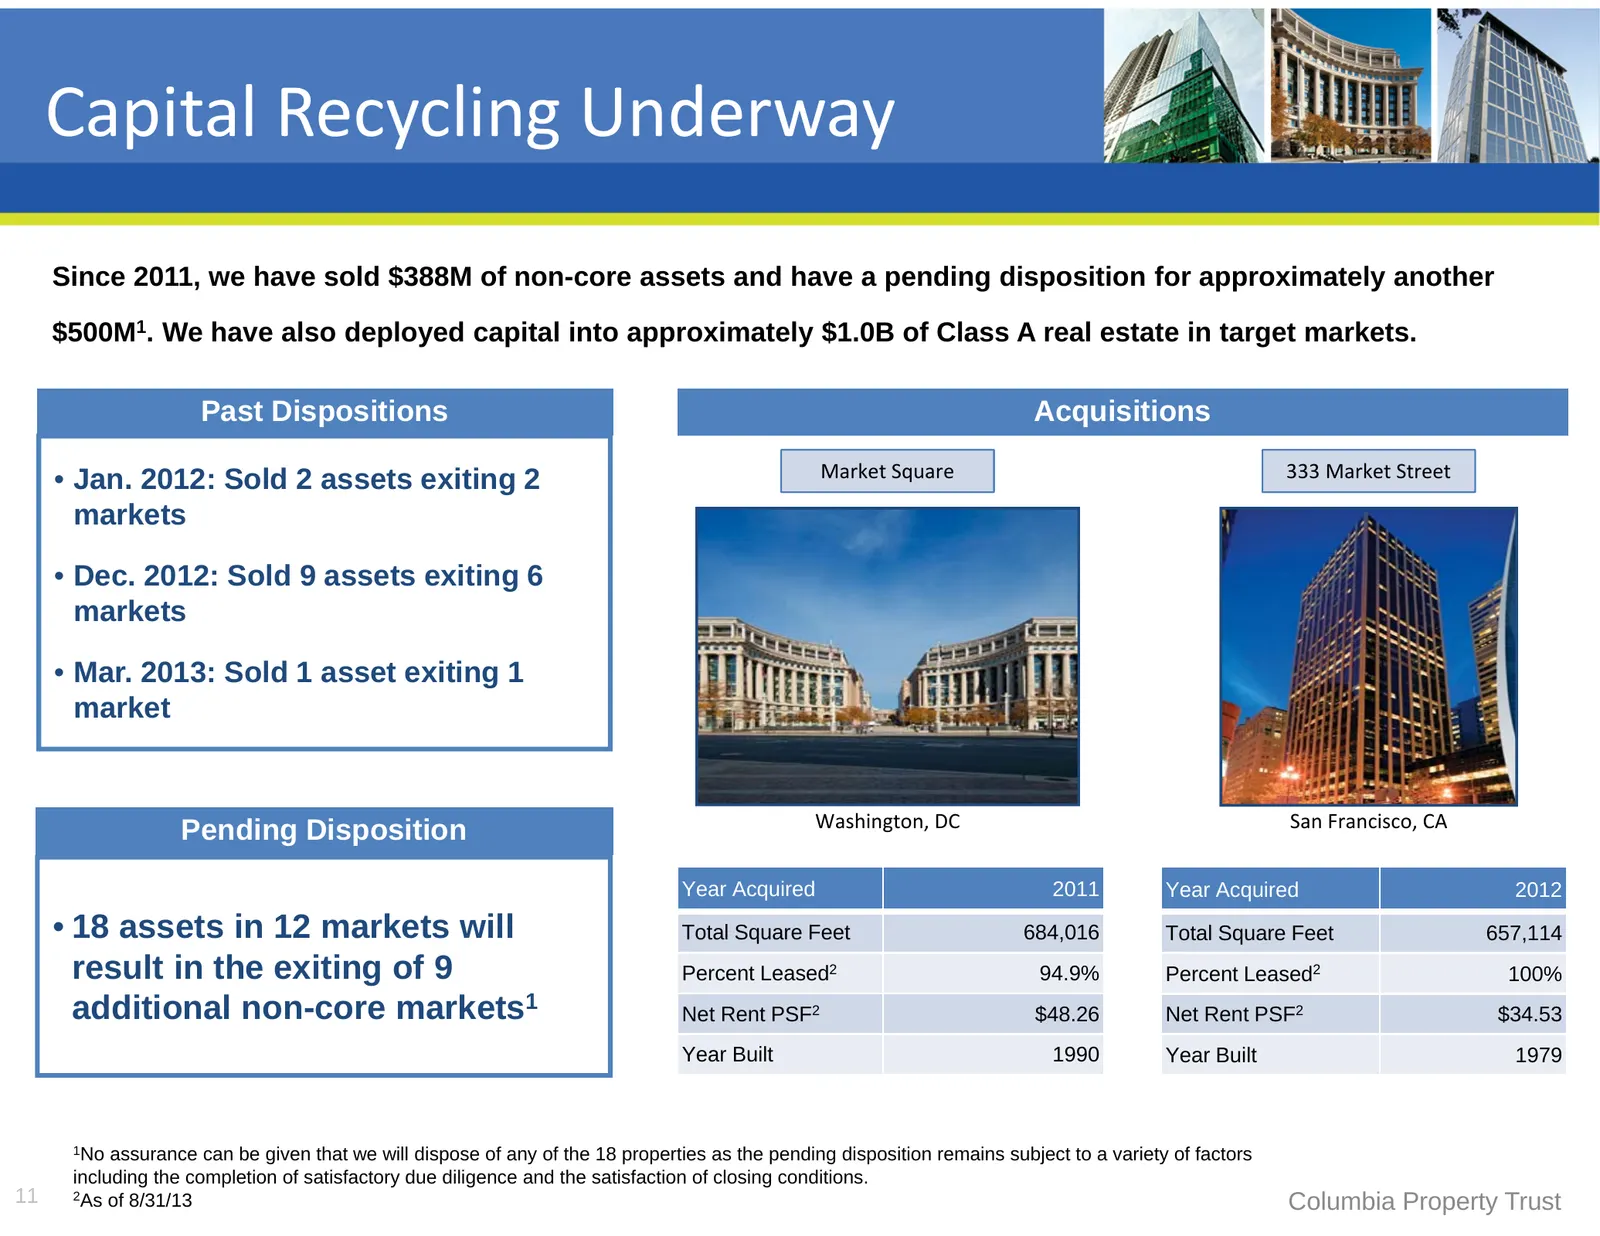
Capital Recycling Underway Since 2011, we have sold $388M of non-core assets and have a pending disposition for approximately another $500M1. We have also deployed capital into approximately $1.0B of Class A real estate in target markets. Past Dispositions Acquisitions • Jan. 2012: Sold 2 assets exi
Slide 12: Proactive Asset Management
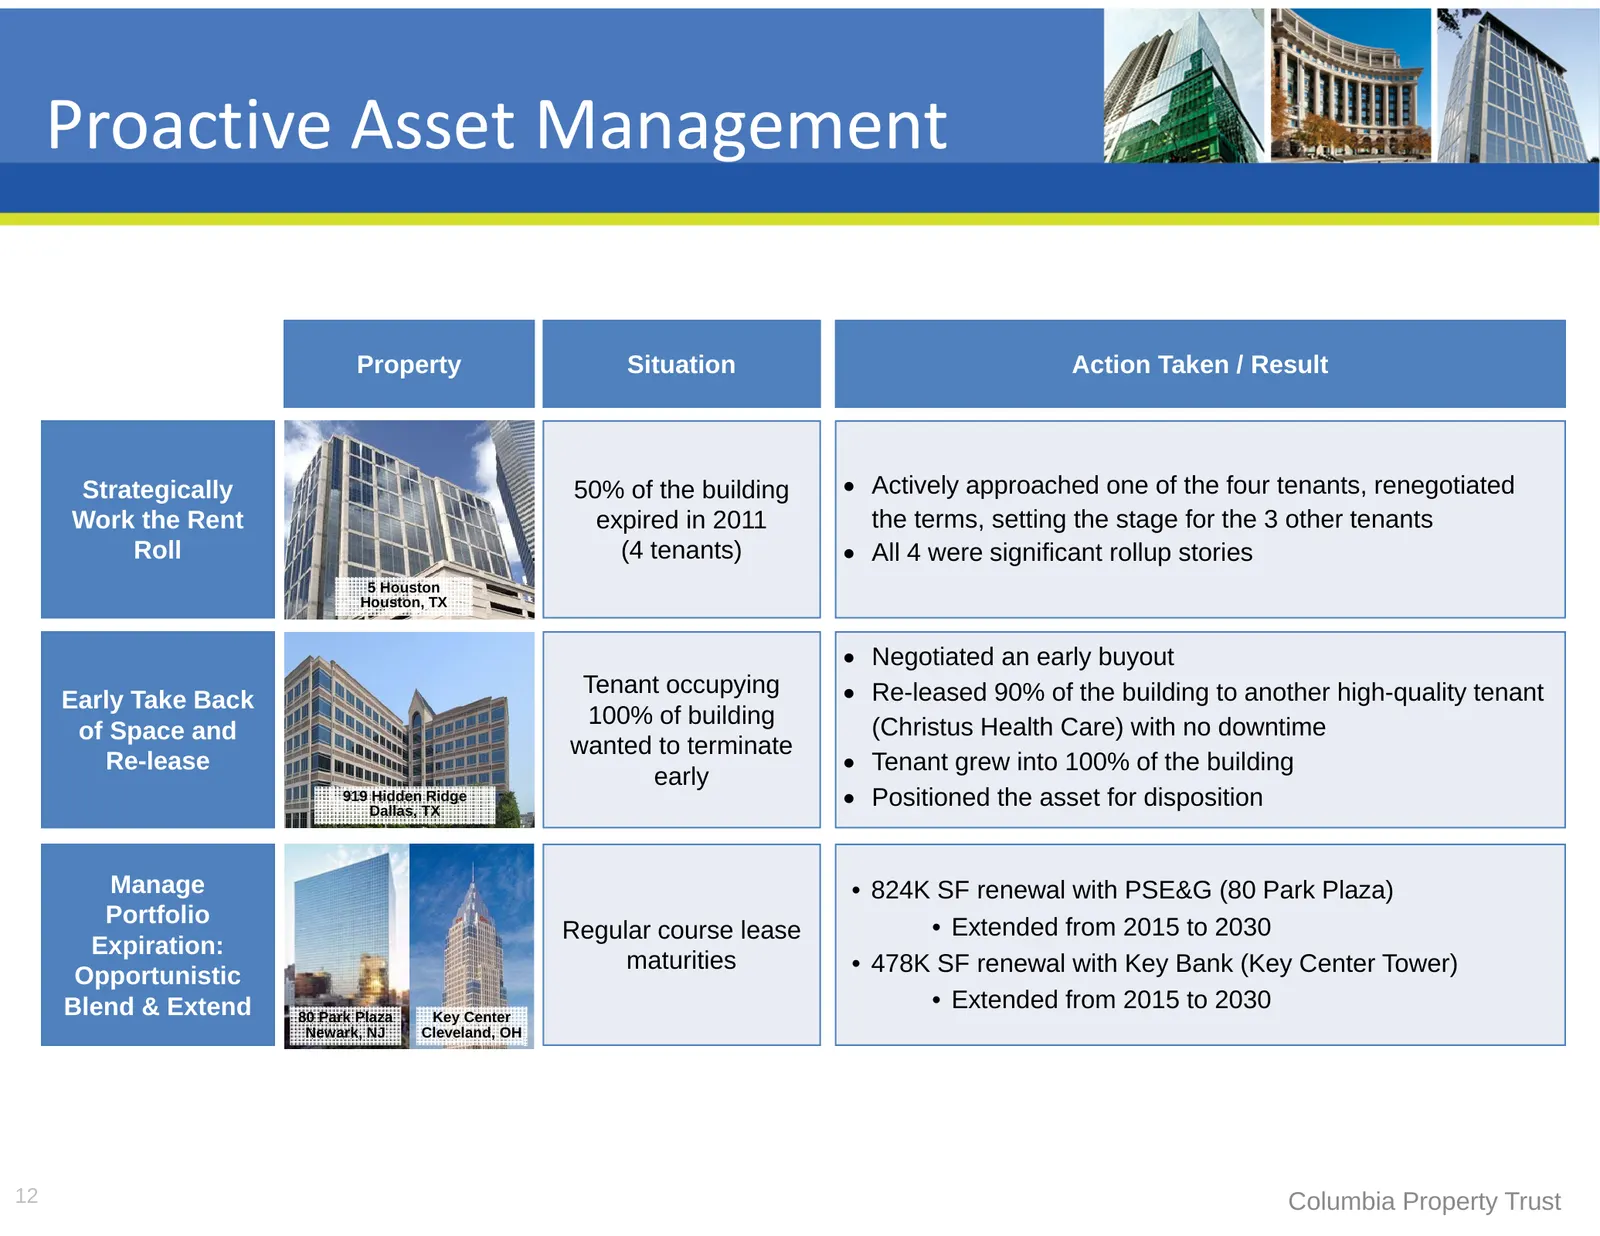
Proactive Asset Management Property Situation Action Taken / Result Strategically 50% of the building Actively approached one of the four tenants, renegotiated Work the Rent expired in 2011 the terms, setting the stage for the 3 other tenants Roll (4 tenants) All 4 were significant rollup storie
Slide 13: Leasing Activity Summary
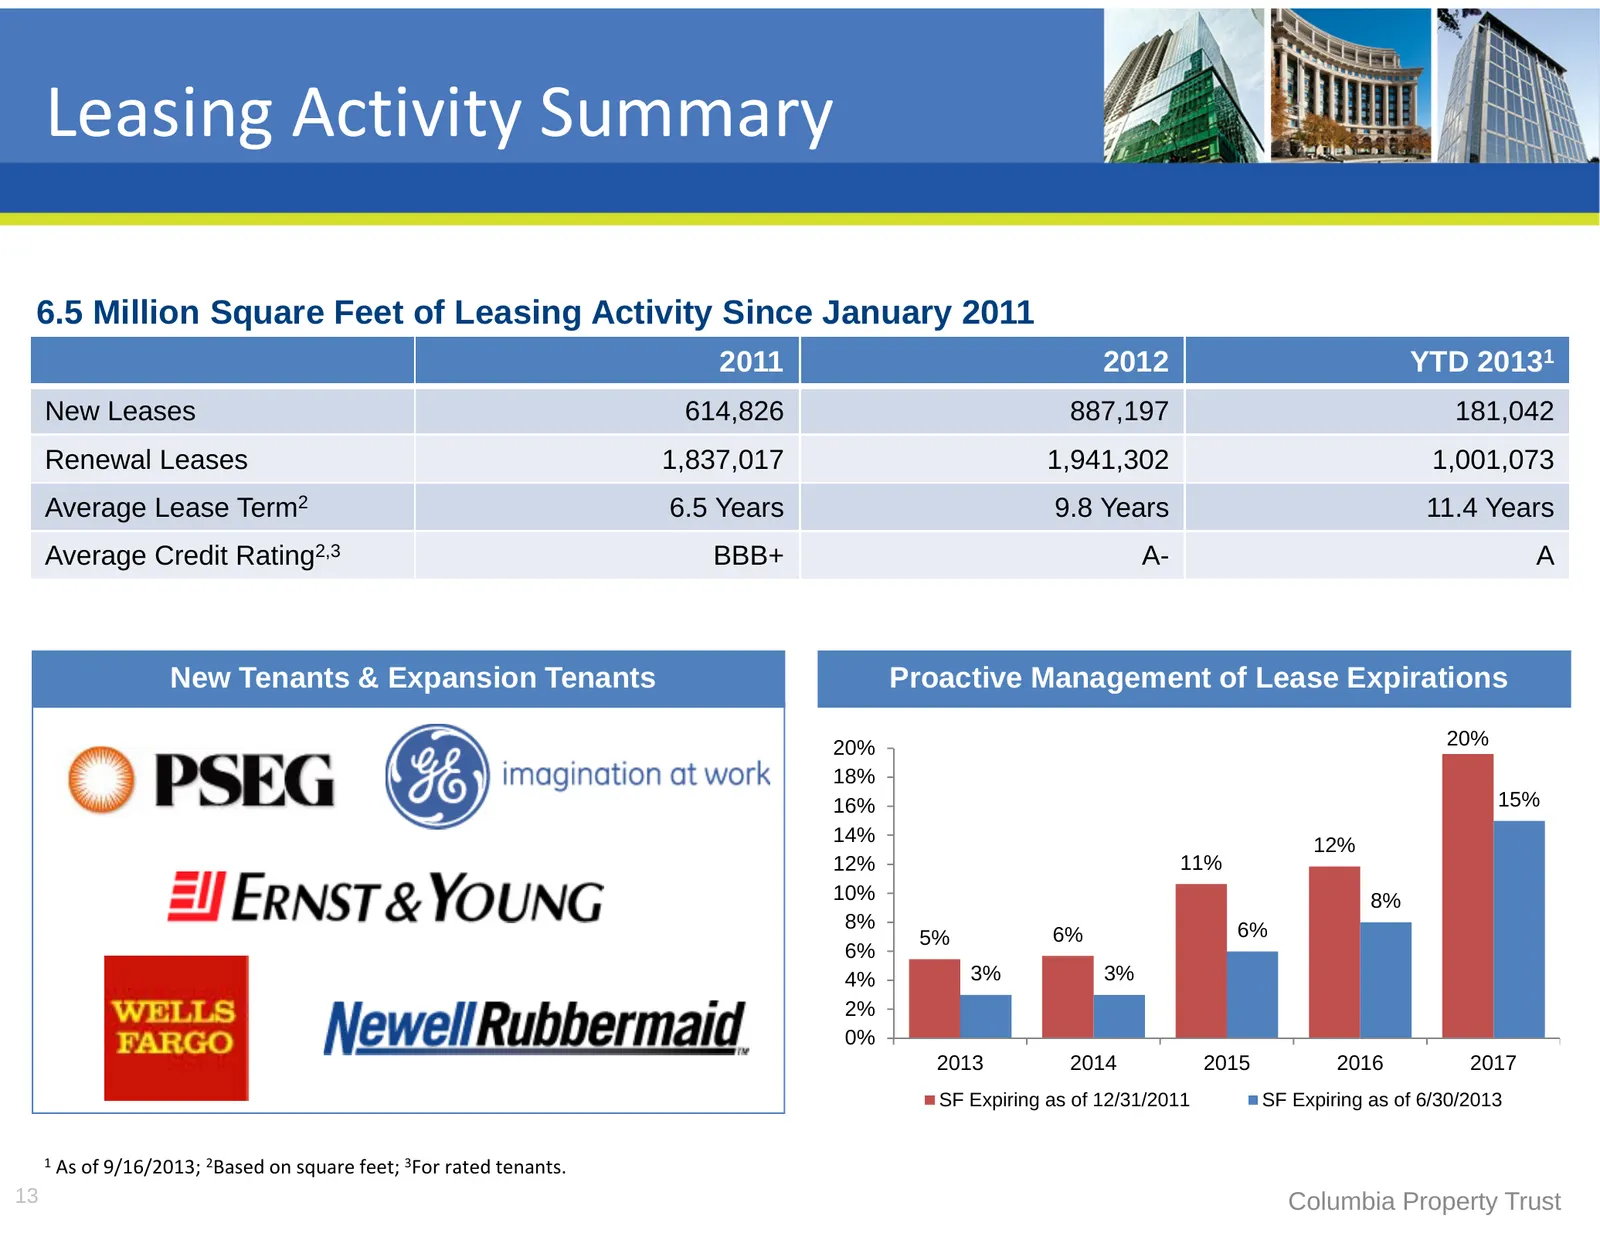
Leasing Activity Summary 6.5 Million Square Feet of Leasing Activity Since January 2011 2011 2012 YTD 20131 New Leases 614,826 887,197 181,042 Renewal Leases 1,837,017 1,941,302 1,001,073 Average Lease Term2 6.5 Years 9.8 Years 11.4 Years Average Credit Rating2,3 BBB+ A- A New Tenants & Expansion Te
Slide 14: Management & Governance
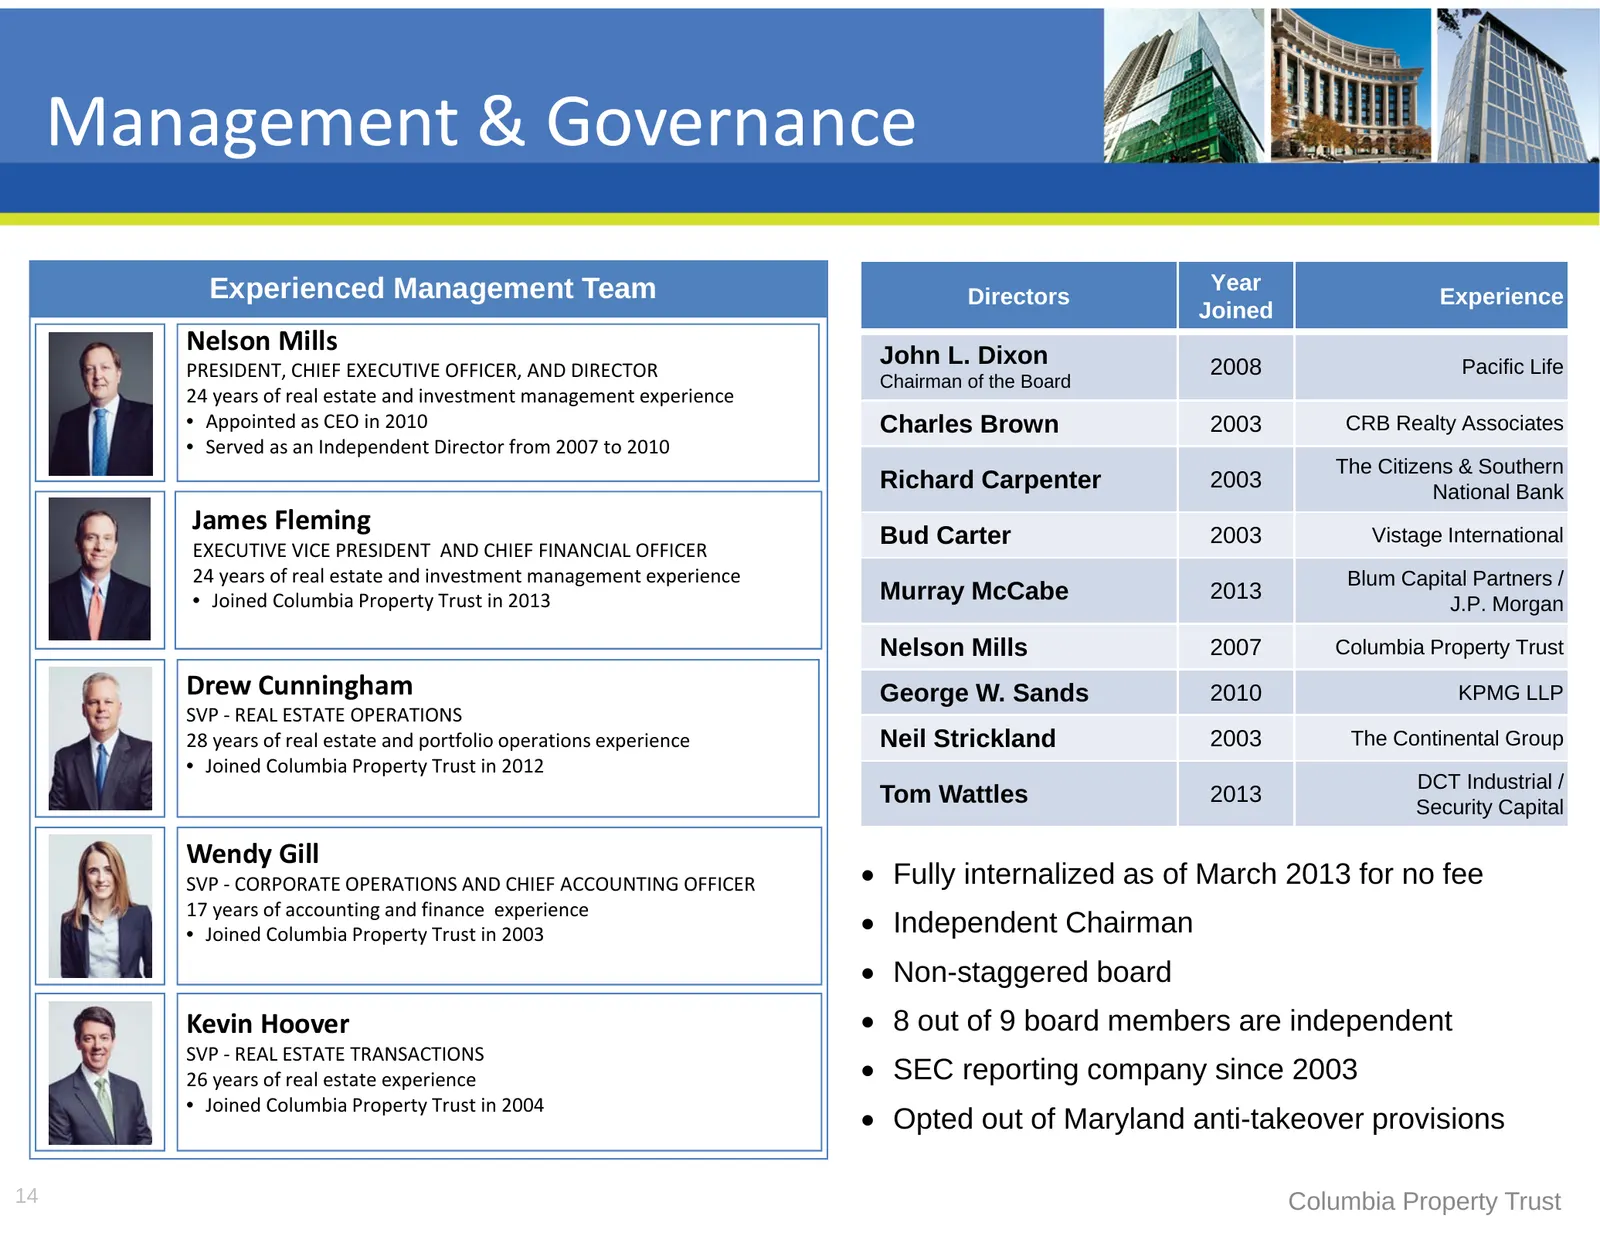
Management & Governance Experienced Management Team Year Directors Experience Joined Nelson Mills John L. Dixon PRESIDENT, CHIEF EXECUTIVE OFFICER, AND DIRECTOR 2008 Pacific Life Chairman of the Board 24 years of real estate and investment management experience • Appointed as CEO in 2010 Charles Bro
Slide 15: Investment Grade Balance Sheet
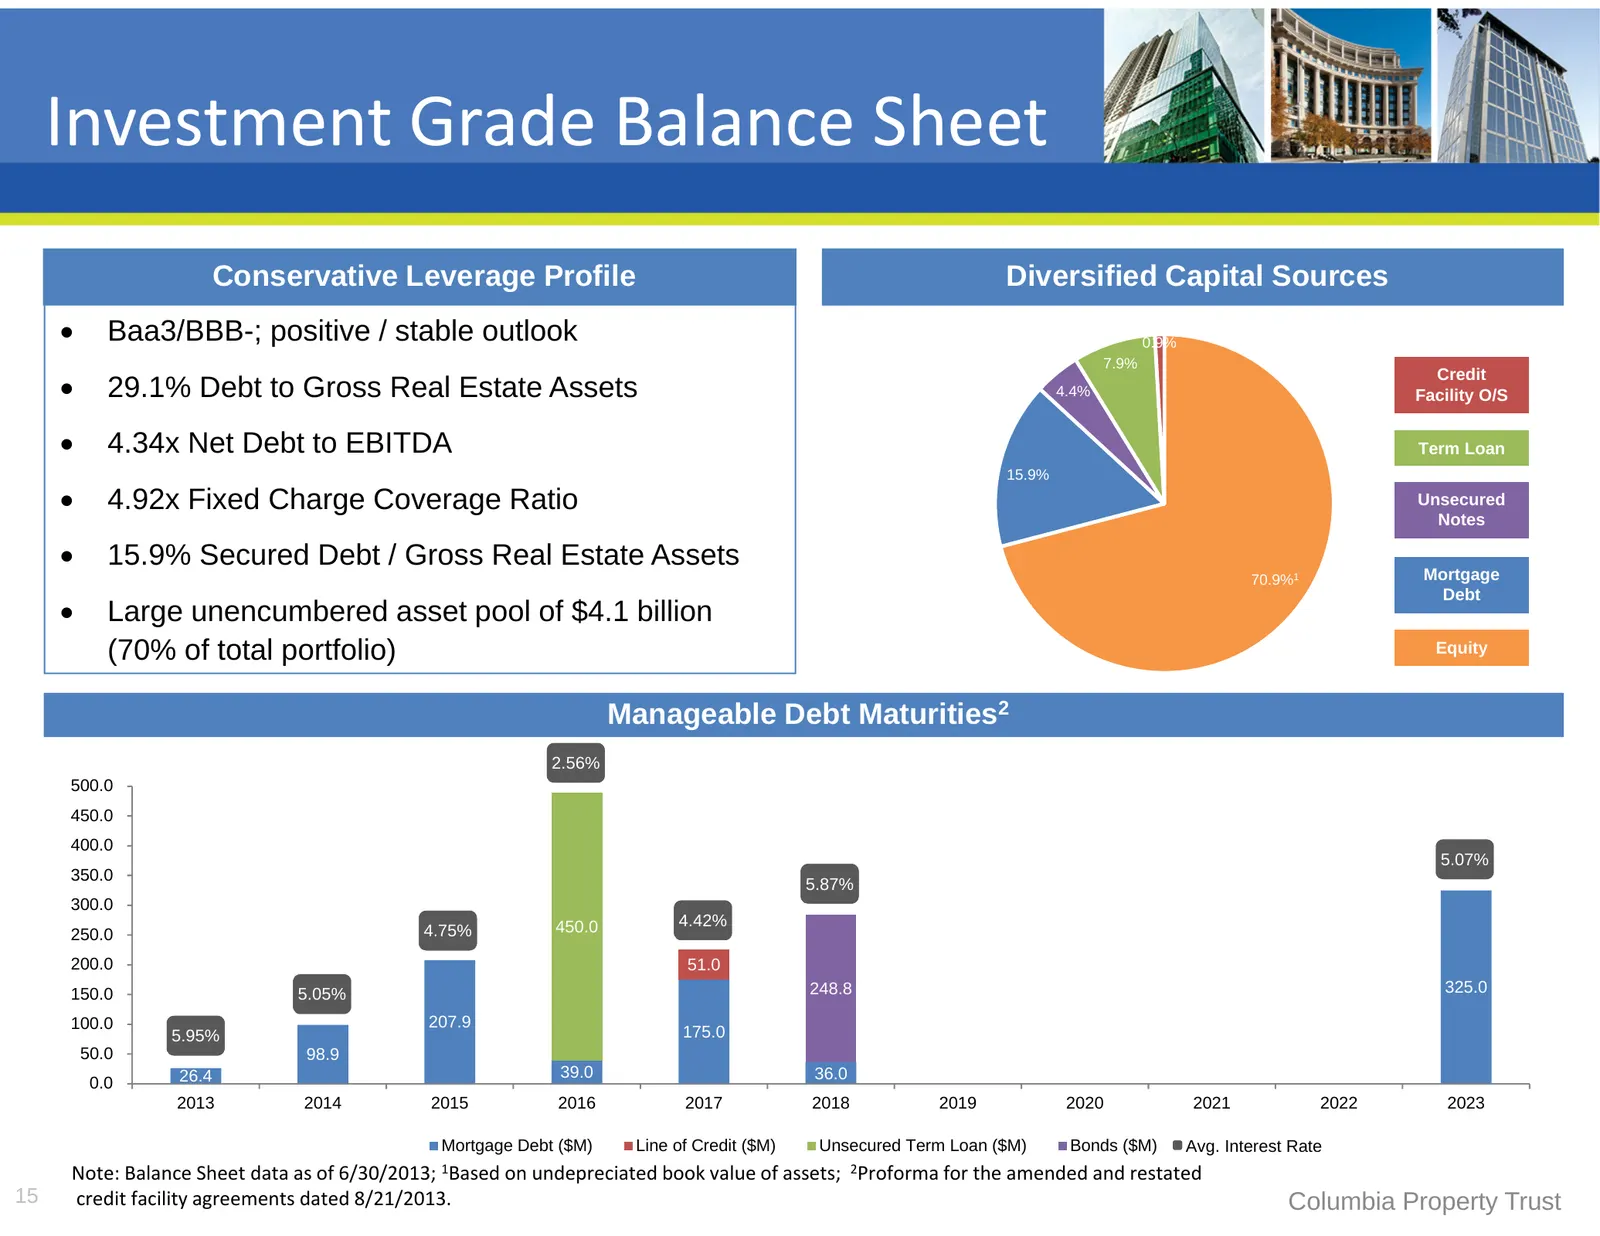
Investment Grade Balance Sheet Conservative Leverage Profile Diversified Capital Sources Baa3/BBB-; positive / stable outlook 0.9% 7.9% Credit 29.1% Debt to Gross Real Estate Assets 4.4% Facility O/S 4.34x Net Debt to EBITDA Term Loan 15.9% 4.92x Fixed Charge Coverage Ratio Unsecured Notes
Slide 16: Capital Profile Primed for Growth
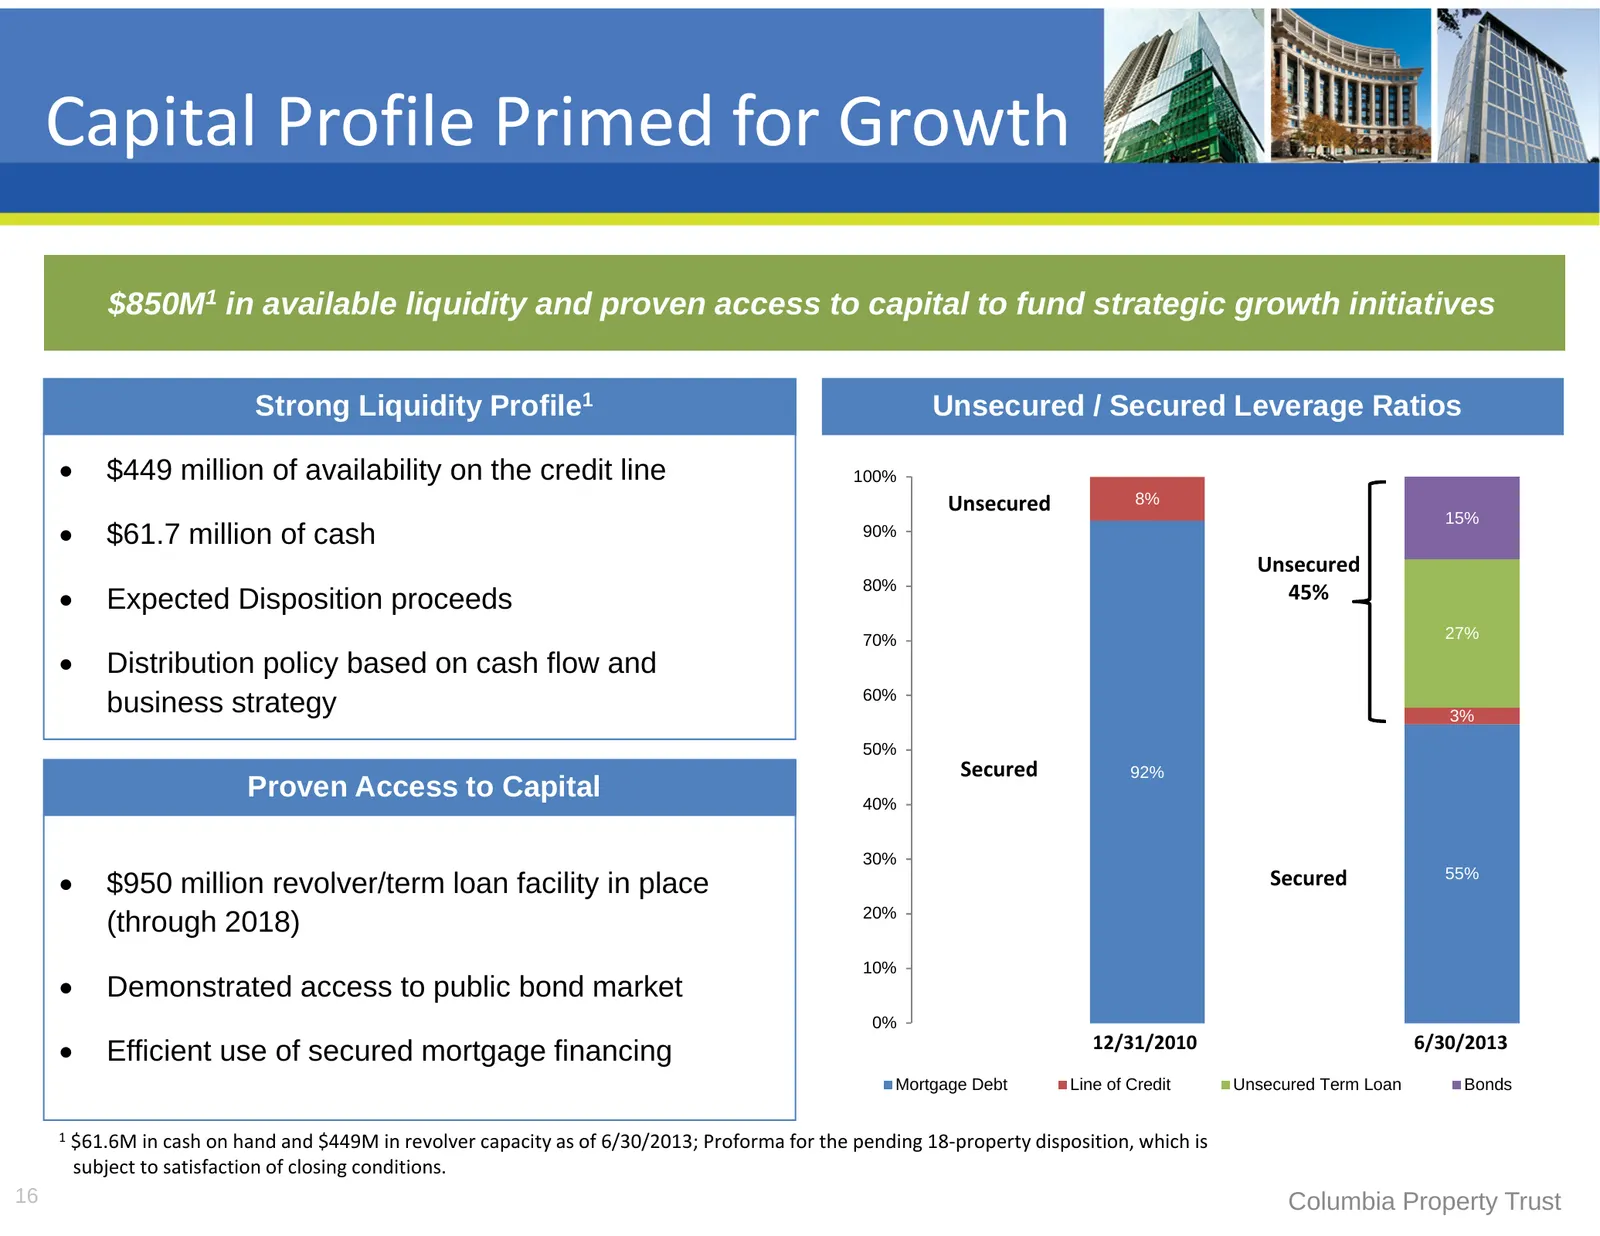
Capital Profile Primed for Growth $850M1 in available liquidity and proven access to capital to fund strategic growth initiatives Strong Liquidity Profile1 Unsecured / Secured Leverage Ratios $449 million of availability on the credit line 100% Unsecured 8% 15% $61.7 million of cash 90% Unsecure
Slide 17: Income Performance
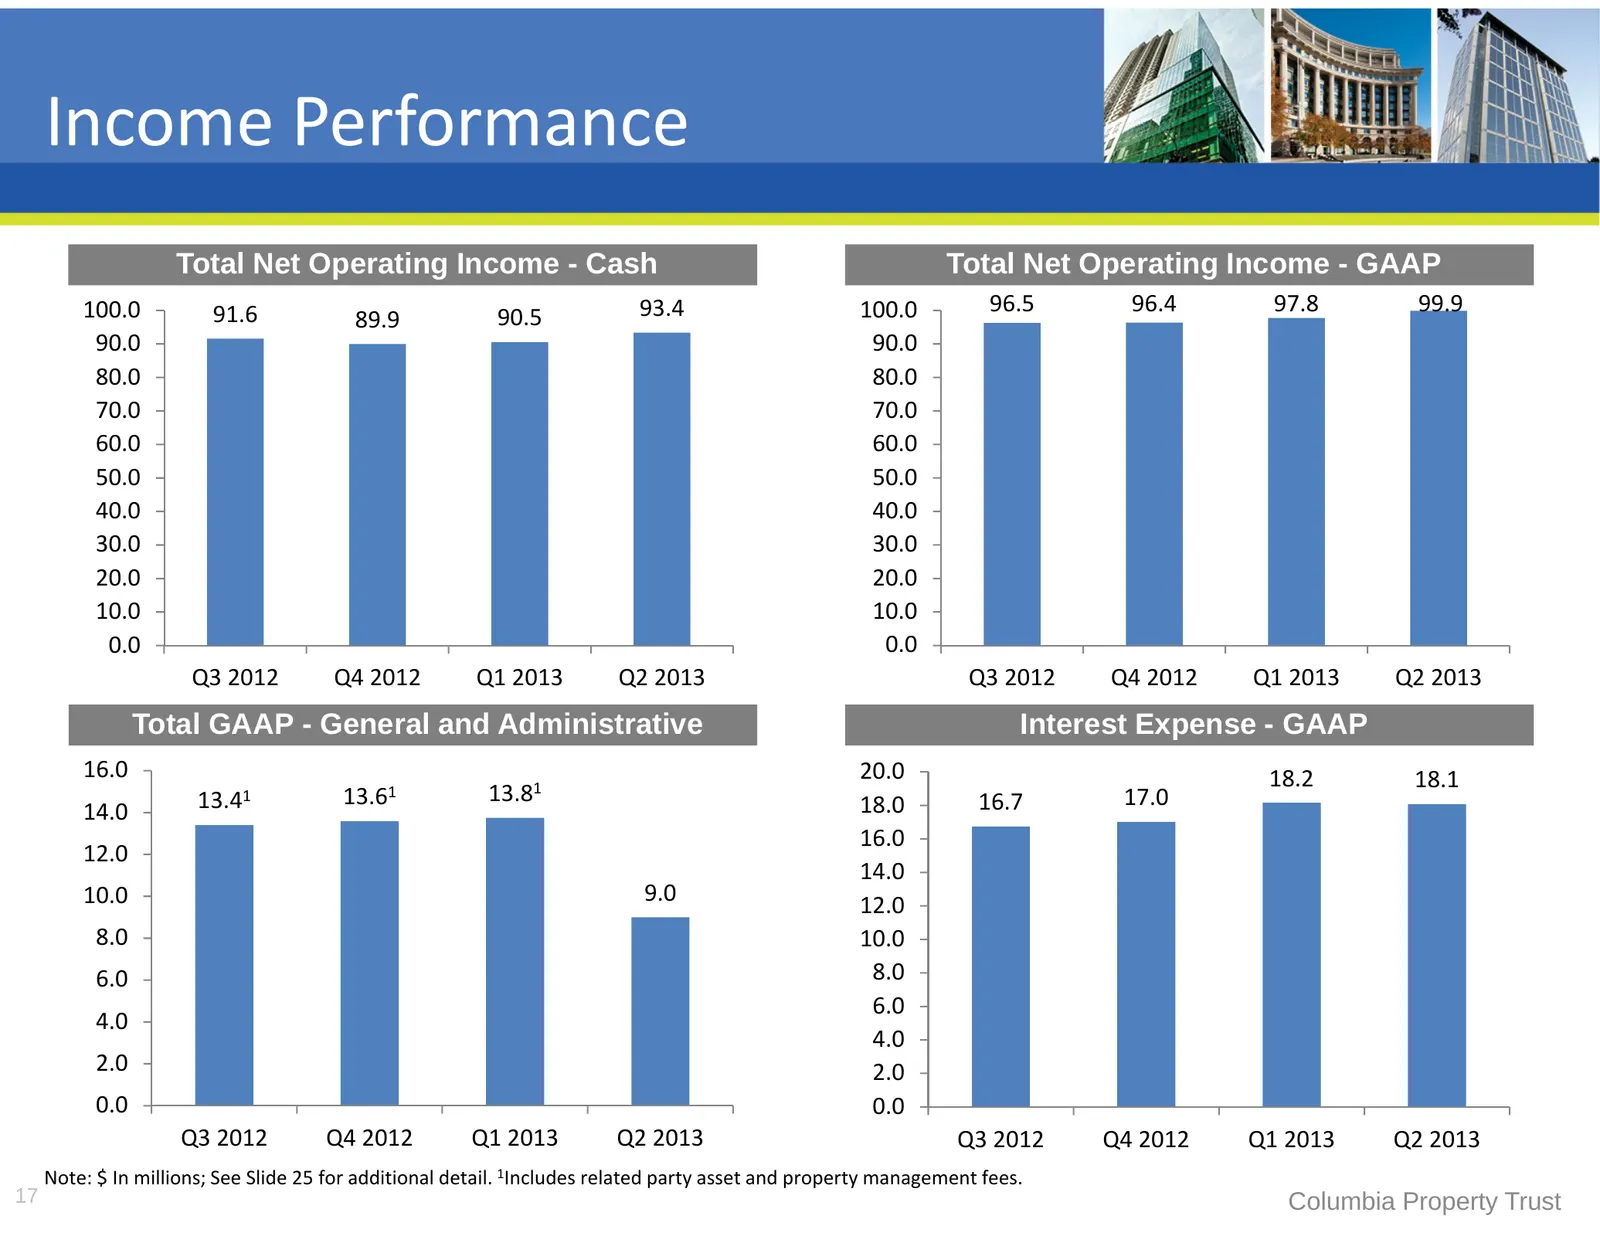
Income Performance Total Net Operating Income - Cash Total Net Operating Income - GAAP 100.0 91.6 93.4 100.0 96.5 96.4 97.8 99.9 89.9 90.5 90.0 90.0 80.0 80.0 70.0 70.0 60.0 60.0 50.0 50.0 40.0 40.0 30.0 30.0 20.0 20.0 10.0 10.0 0.0 0.0 Q3 2012 Q4 2012 Q1 2013 Q2 2013 Q3 2012 Q4 2012 Q1 2013 Q2 2013
Slide 18: Roadmap to CXP Net Asset Value
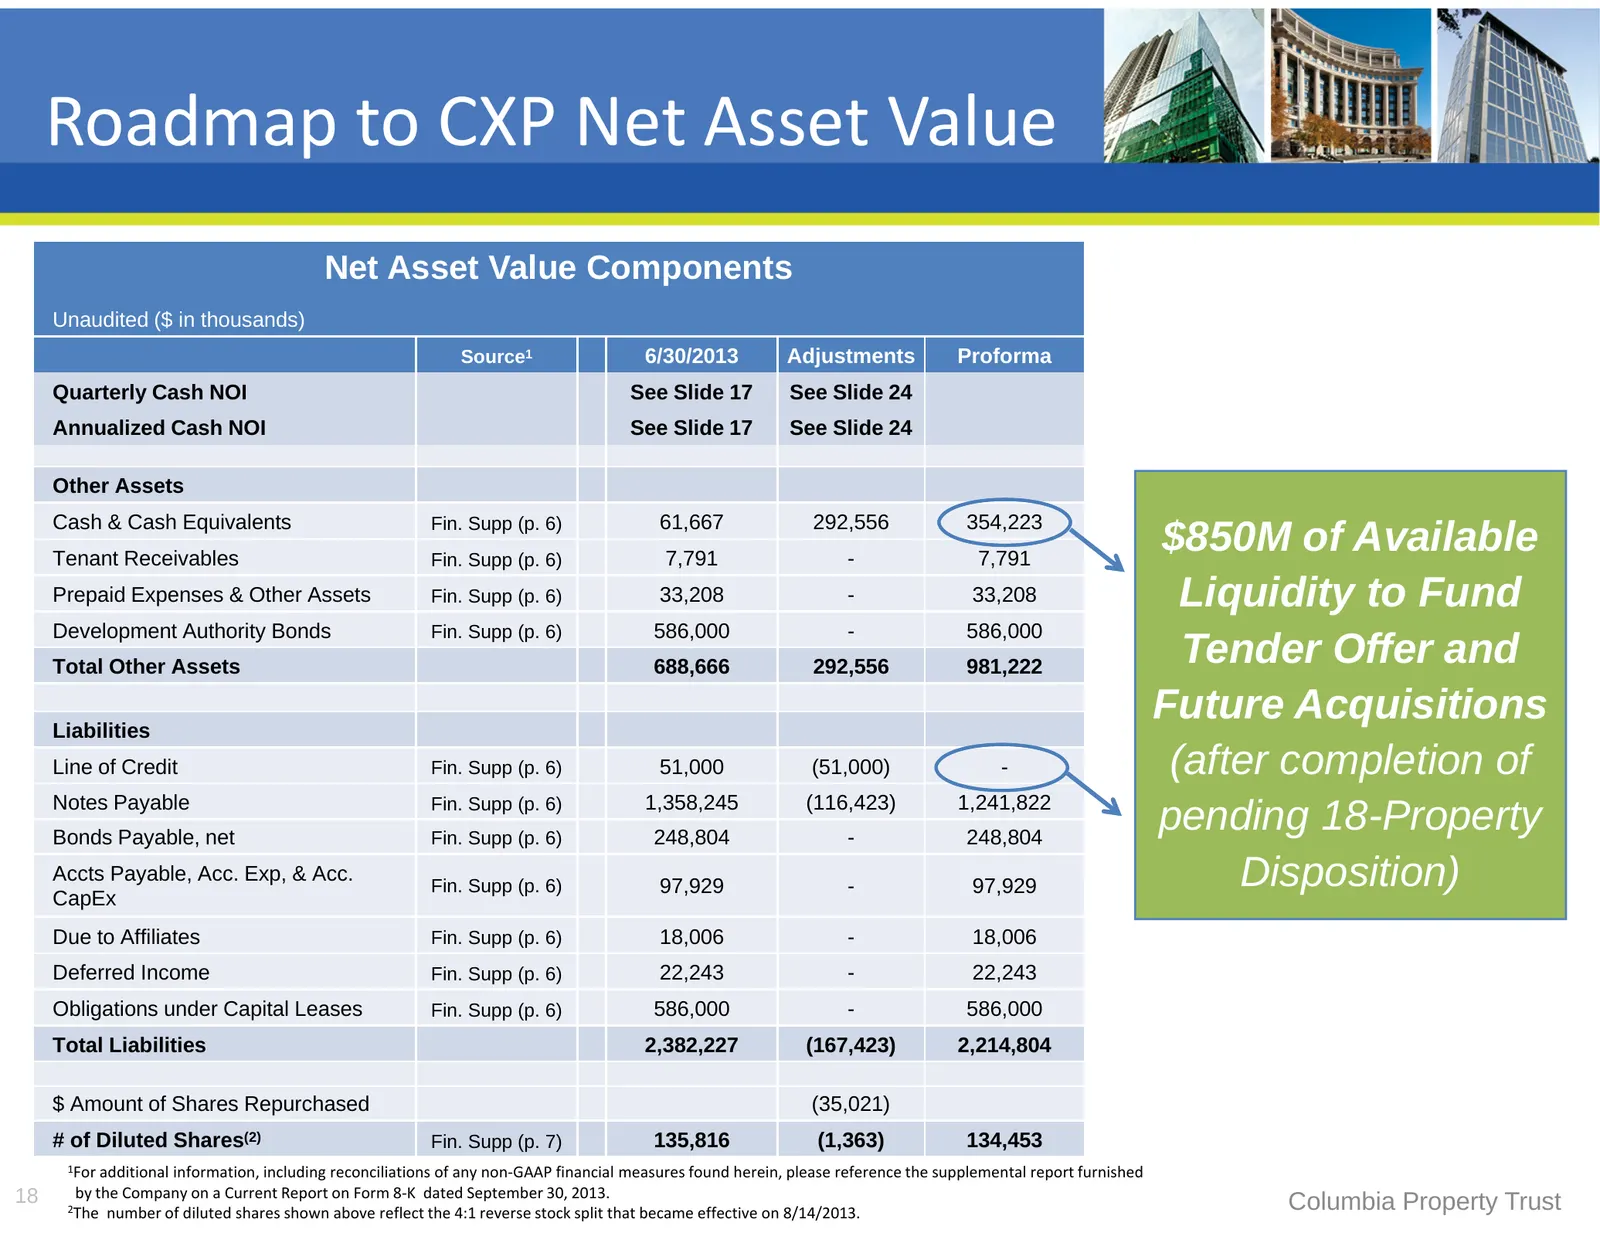
Roadmap to CXP Net Asset Value Net Asset Value Components Unaudited ($ in thousands) Source1 6/30/2013 Adjustments Proforma Quarterly Cash NOI See Slide 17 See Slide 24 Annualized Cash NOI See Slide 17 See Slide 24 Other Assets Cash & Cash Equivalents Fin. Supp (p. 6) 61,667 292,556 354,223 Tenant R
Slide 19: Assessing the Progress
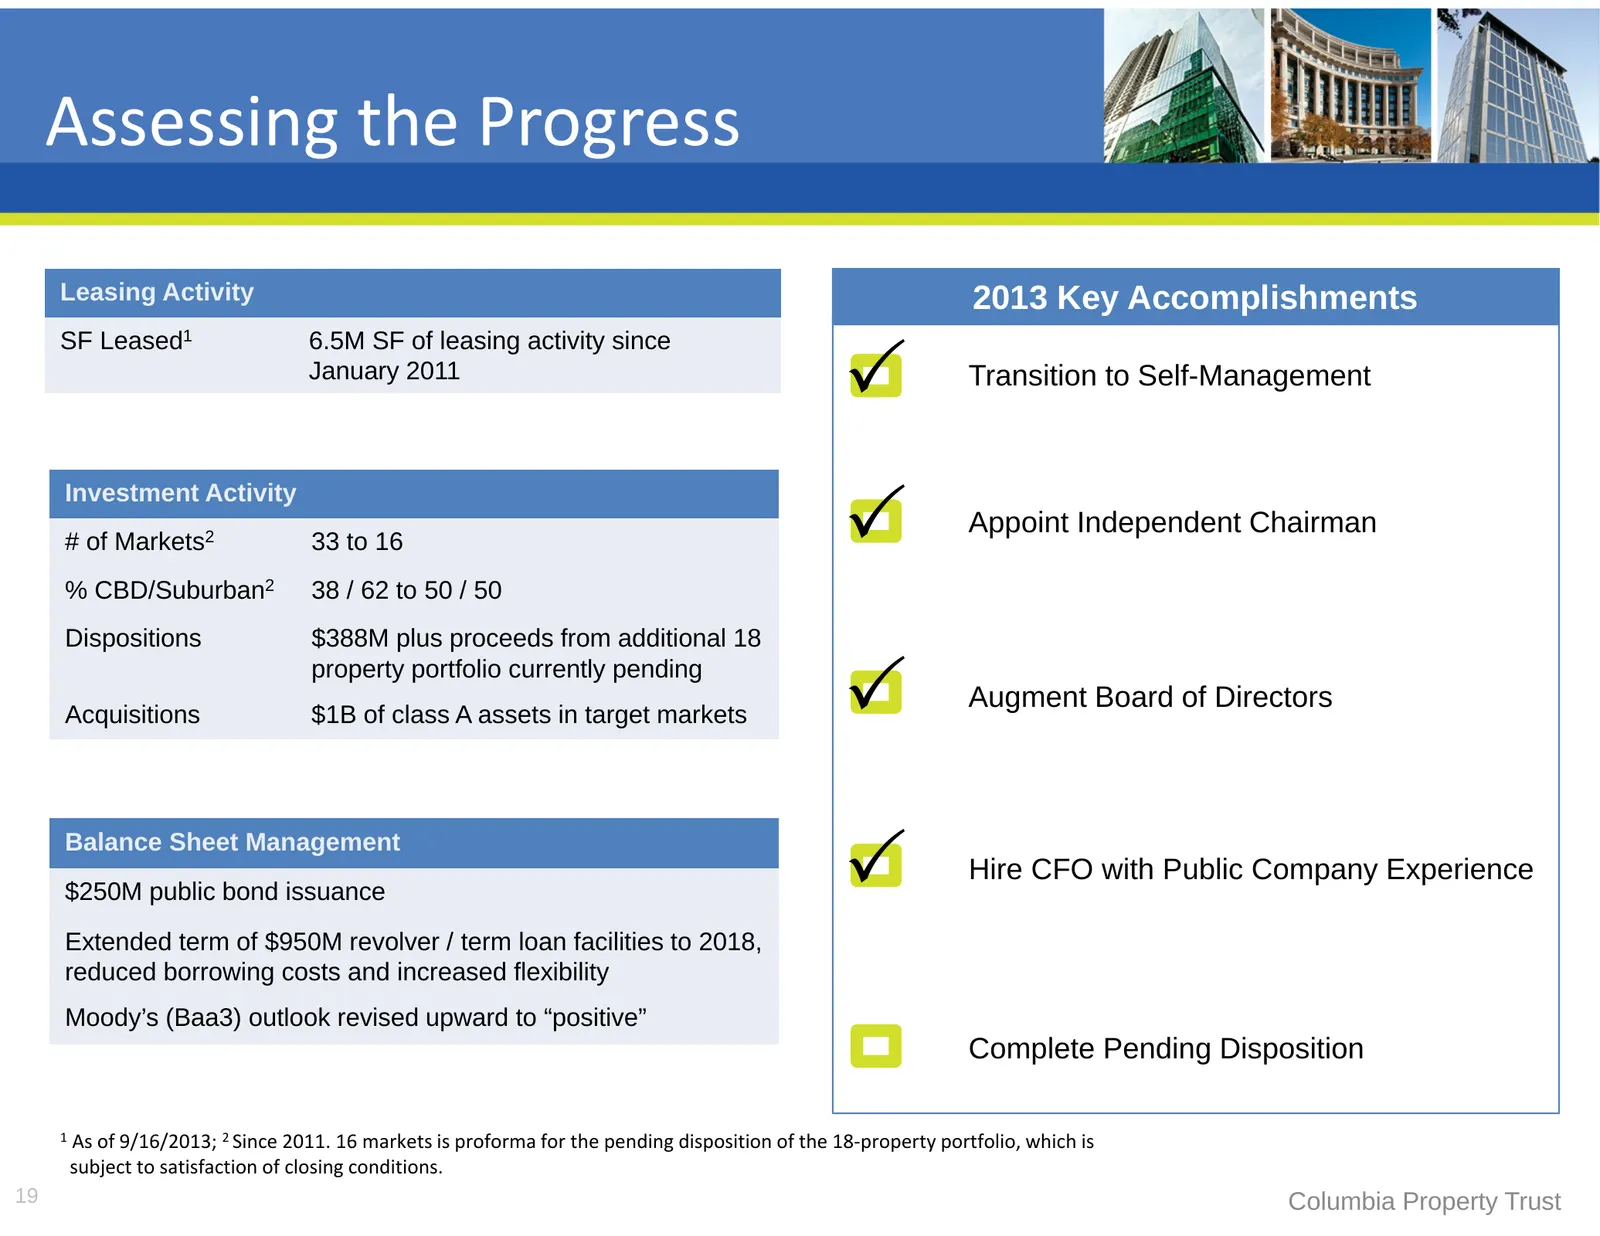
Assessing the Progress Leasing Activity 2013 Key Accomplishments SF Leased1 6.5M SF of leasing activity since January 2011 Transition to Self-Management Investment Activity Appoint Independent Chairman # of Markets2 33 to 16 % CBD/Suburban2 38 / 62 to 50 / 50 Dispositions $388M plus proceeds fro
Slide 20: Ongoing Objectives
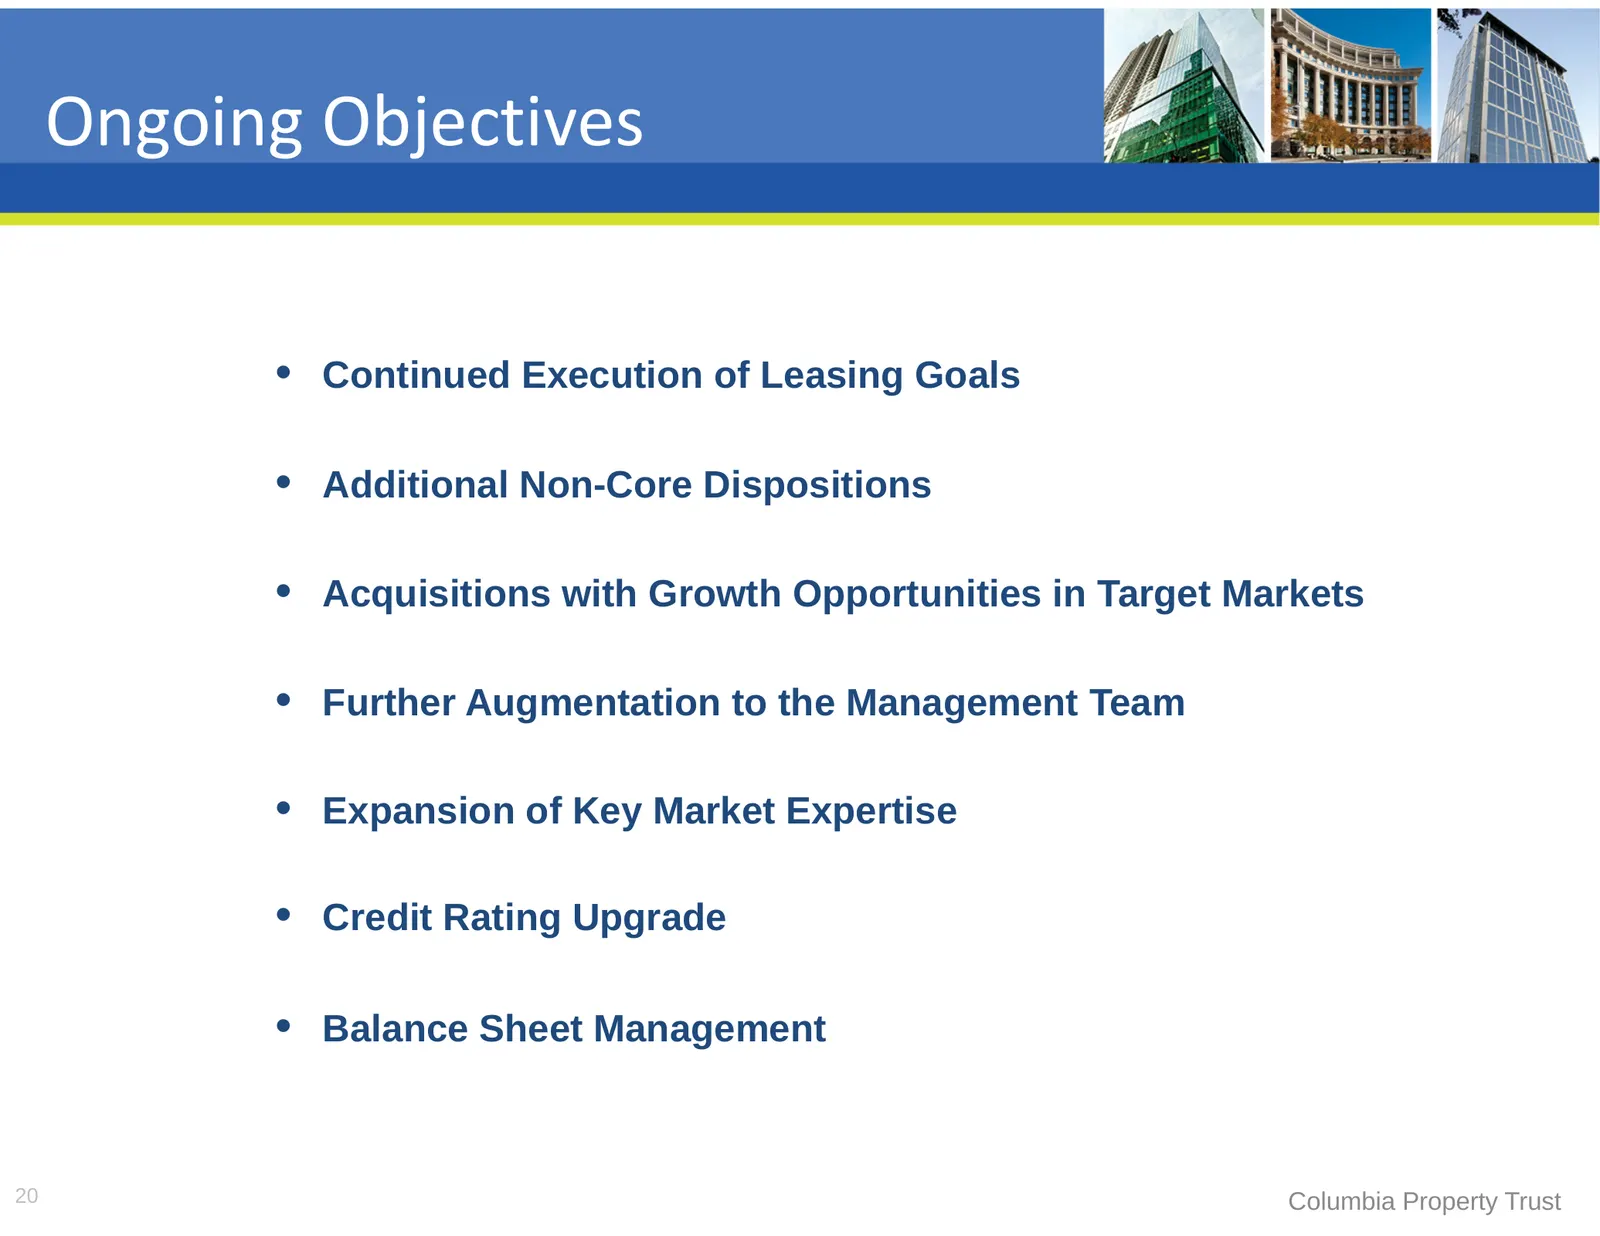
Ongoing Objectives • Continued Execution of Leasing Goals • Additional Non-Core Dispositions • Acquisitions with Growth Opportunities in Target Markets • Further Augmentation to the Management Team • Expansion of Key Market Expertise • Credit Rating Upgrade • Balance Sheet Management 20 Columbia Pro
Slide 21: Investment Highlights
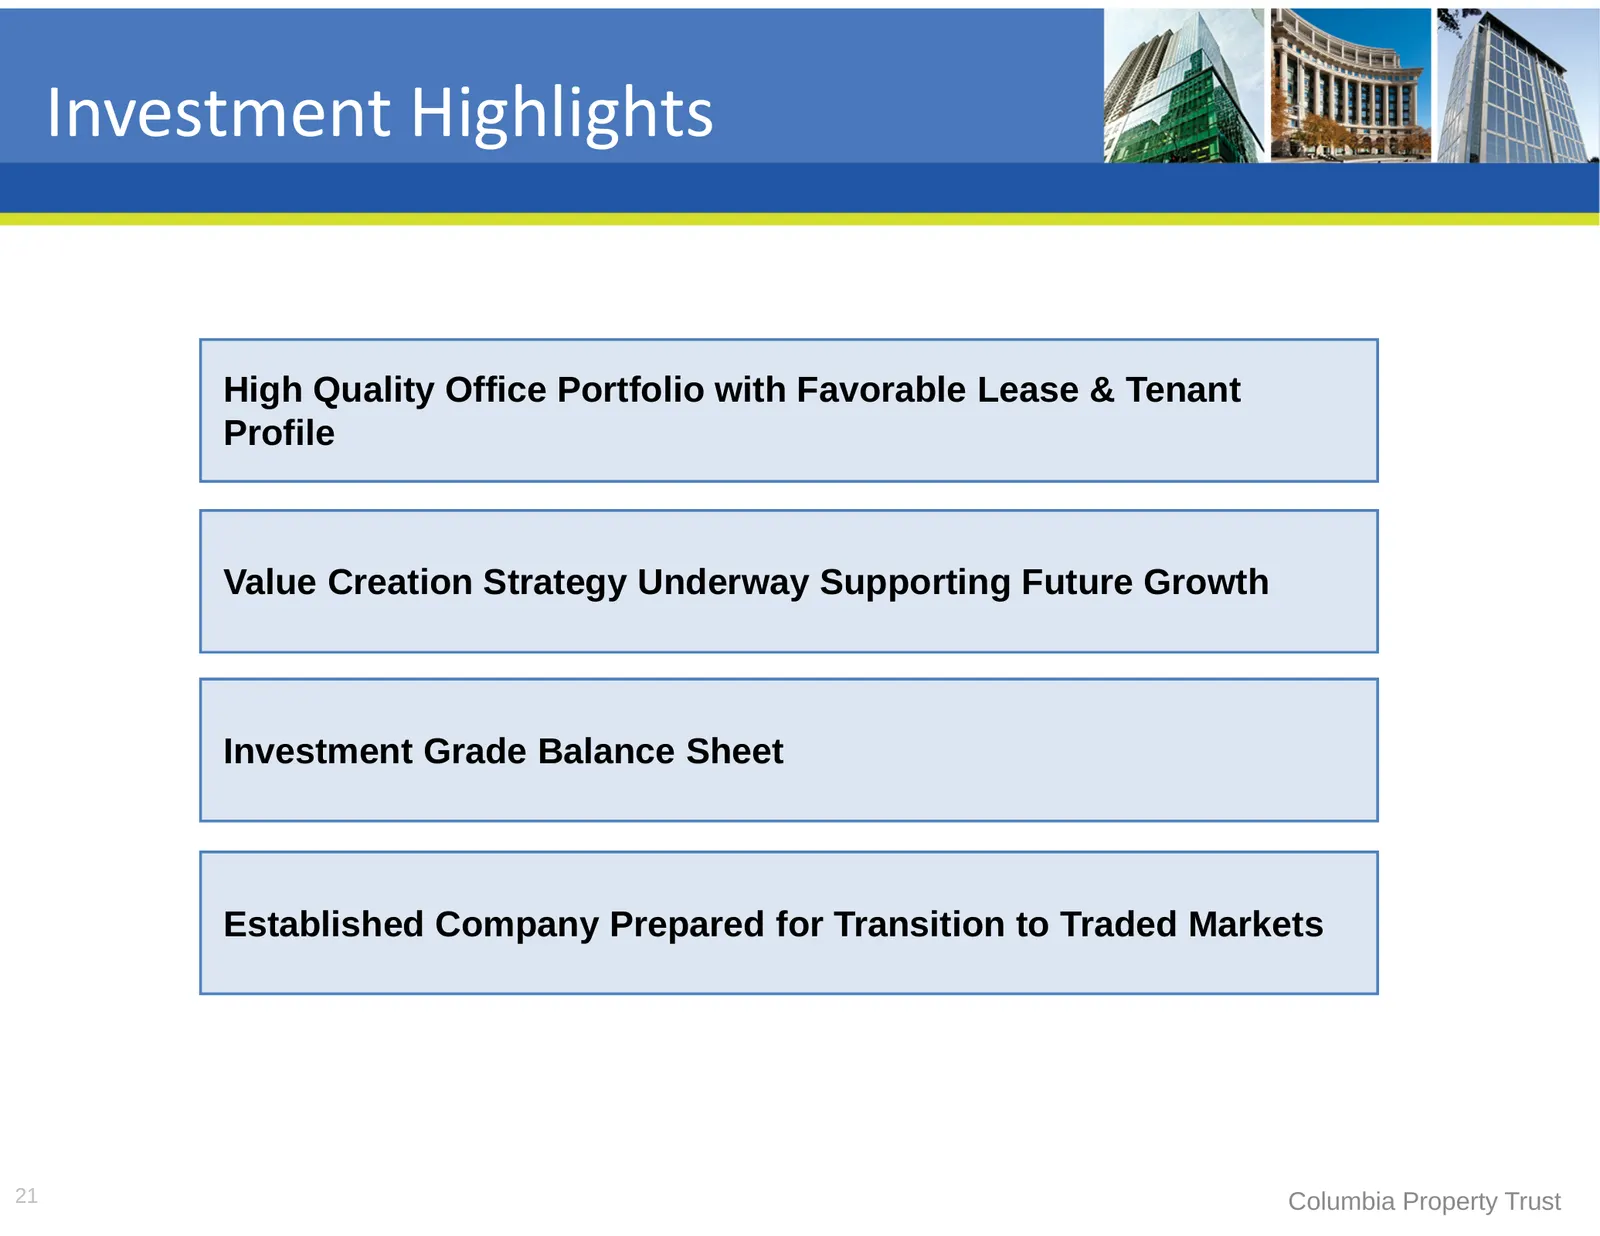
Investment Highlights High Quality Office Portfolio with Favorable Lease & Tenant Profile Value Creation Strategy Underway Supporting Future Growth Investment Grade Balance Sheet Established Company Prepared for Transition to Traded Markets 21 Columbia Property Trust

Slide 22: Appendix
af D =) — -e > (= O al i a Columb Lg a a 227 ZZ = ZG Zoe LIL ry = 72. LAGE Za Appendix
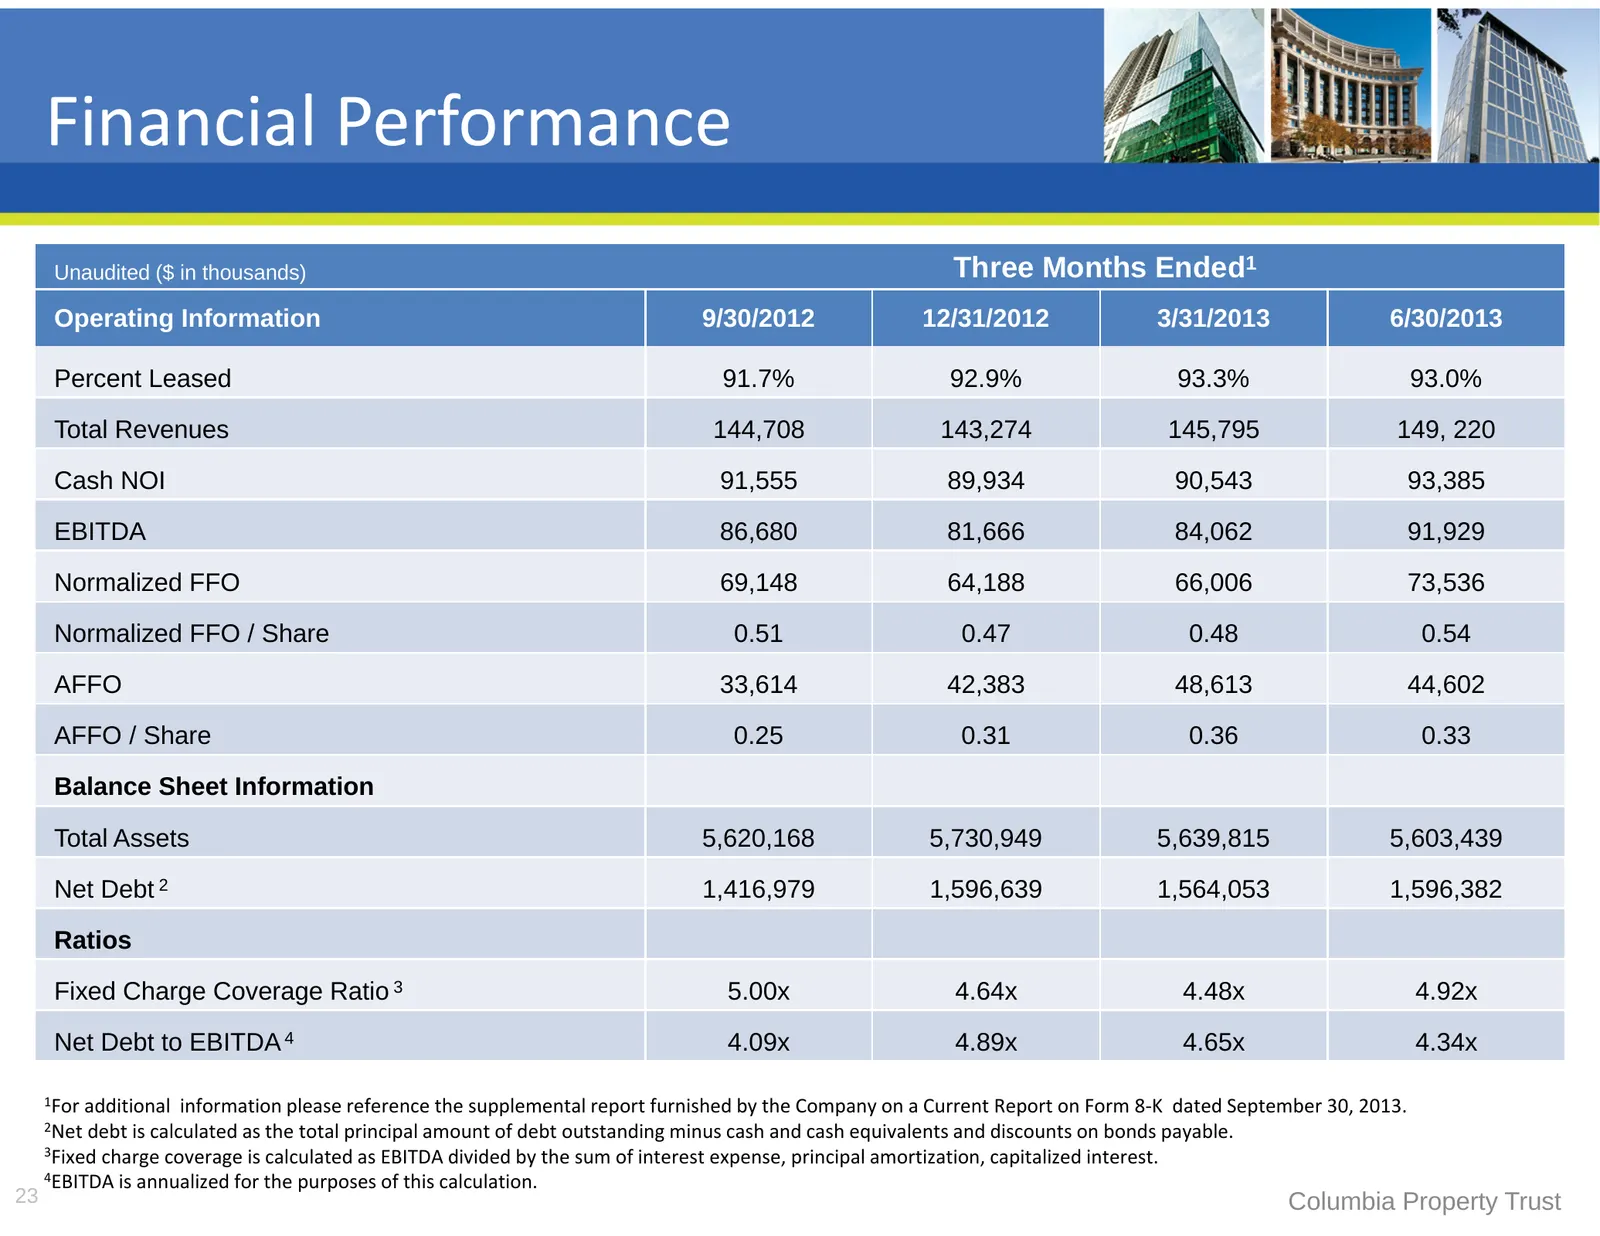
Slide 23: Financial Performance
Financial Performance Unaudited ($ in thousands) Three Months Ended1 Operating Information 9/30/2012 12/31/2012 3/31/2013 6/30/2013 Percent Leased 91.7% 92.9% 93.3% 93.0% Total Revenues 144,708 143,274 145,795 149, 220 Cash NOI 91,555 89,934 90,543 93,385 EBITDA 86,680 81,666 84,062 91,929 Normalize
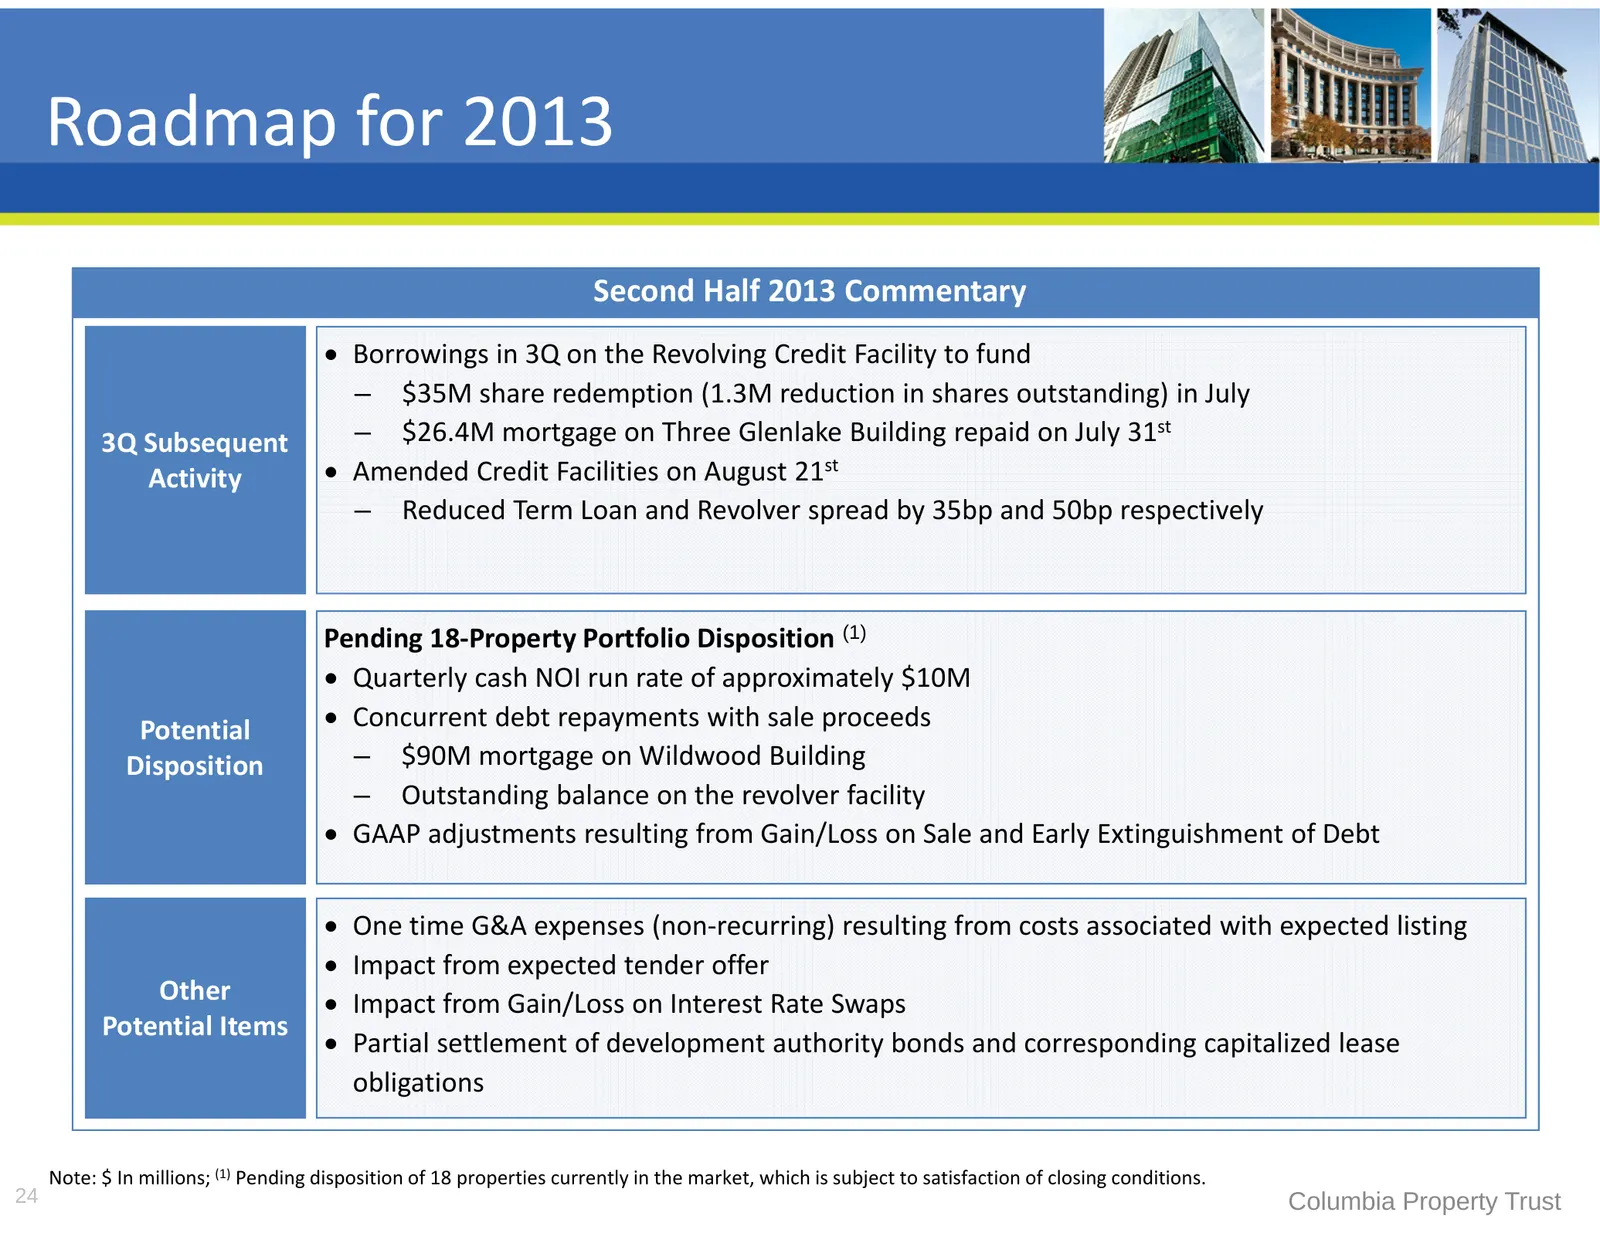
Slide 24: Roadmap for 2013
Roadmap for 2013 Second Half 2013 Commentary Borrowings in 3Q on the Revolving Credit Facility to fund – $35M share redemption (1.3M reduction in shares outstanding) in July 3Q Subsequent – $26.4M mortgage on Three Glenlake Building repaid on July 31st Activity Amended Credit Facilities on Augus
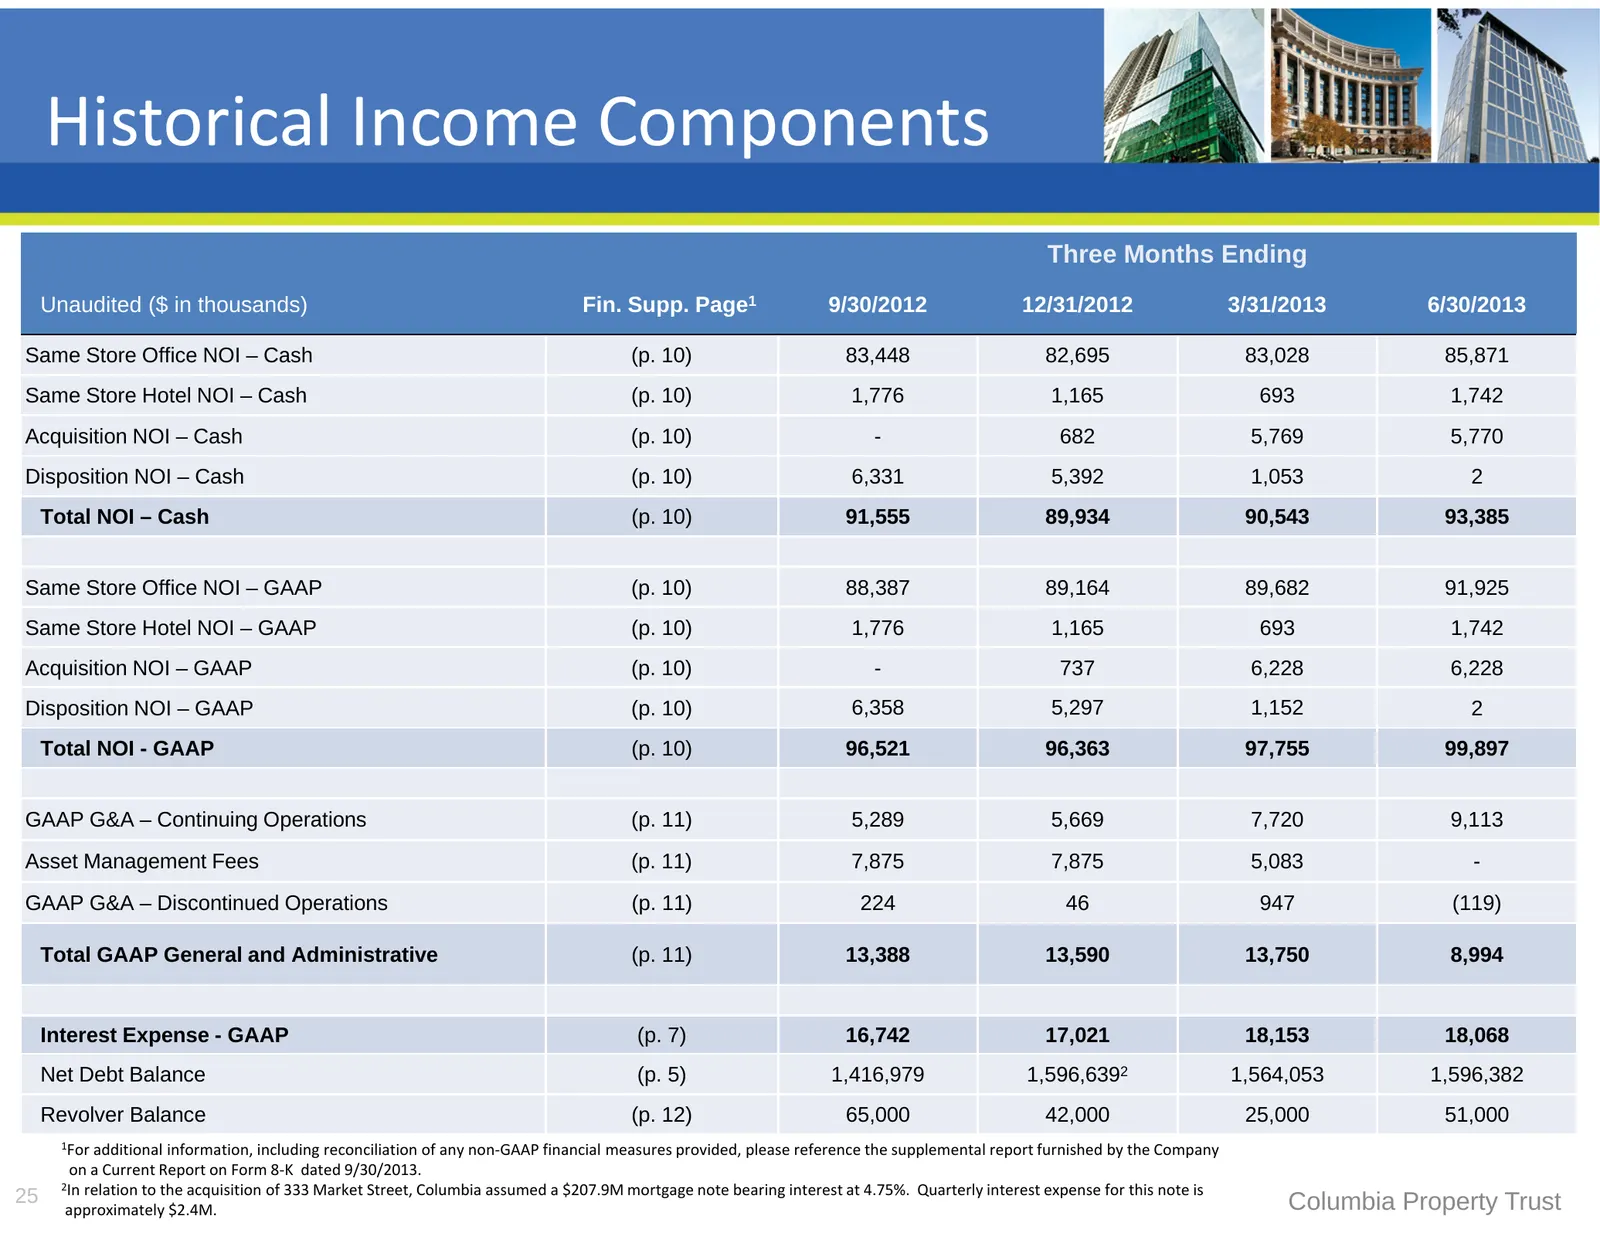
Slide 25: Historical Income Components
Historical Income Components Three Months Ending Unaudited ($ in thousands) Fin. Supp. Page1 9/30/2012 12/31/2012 3/31/2013 6/30/2013 Same Store Office NOI – Cash (p. 10) 83,448 82,695 83,028 85,871 Same Store Hotel NOI – Cash (p. 10) 1,776 1,165 693 1,742 Acquisition NOI – Cash (p. 10) - 682 5,769
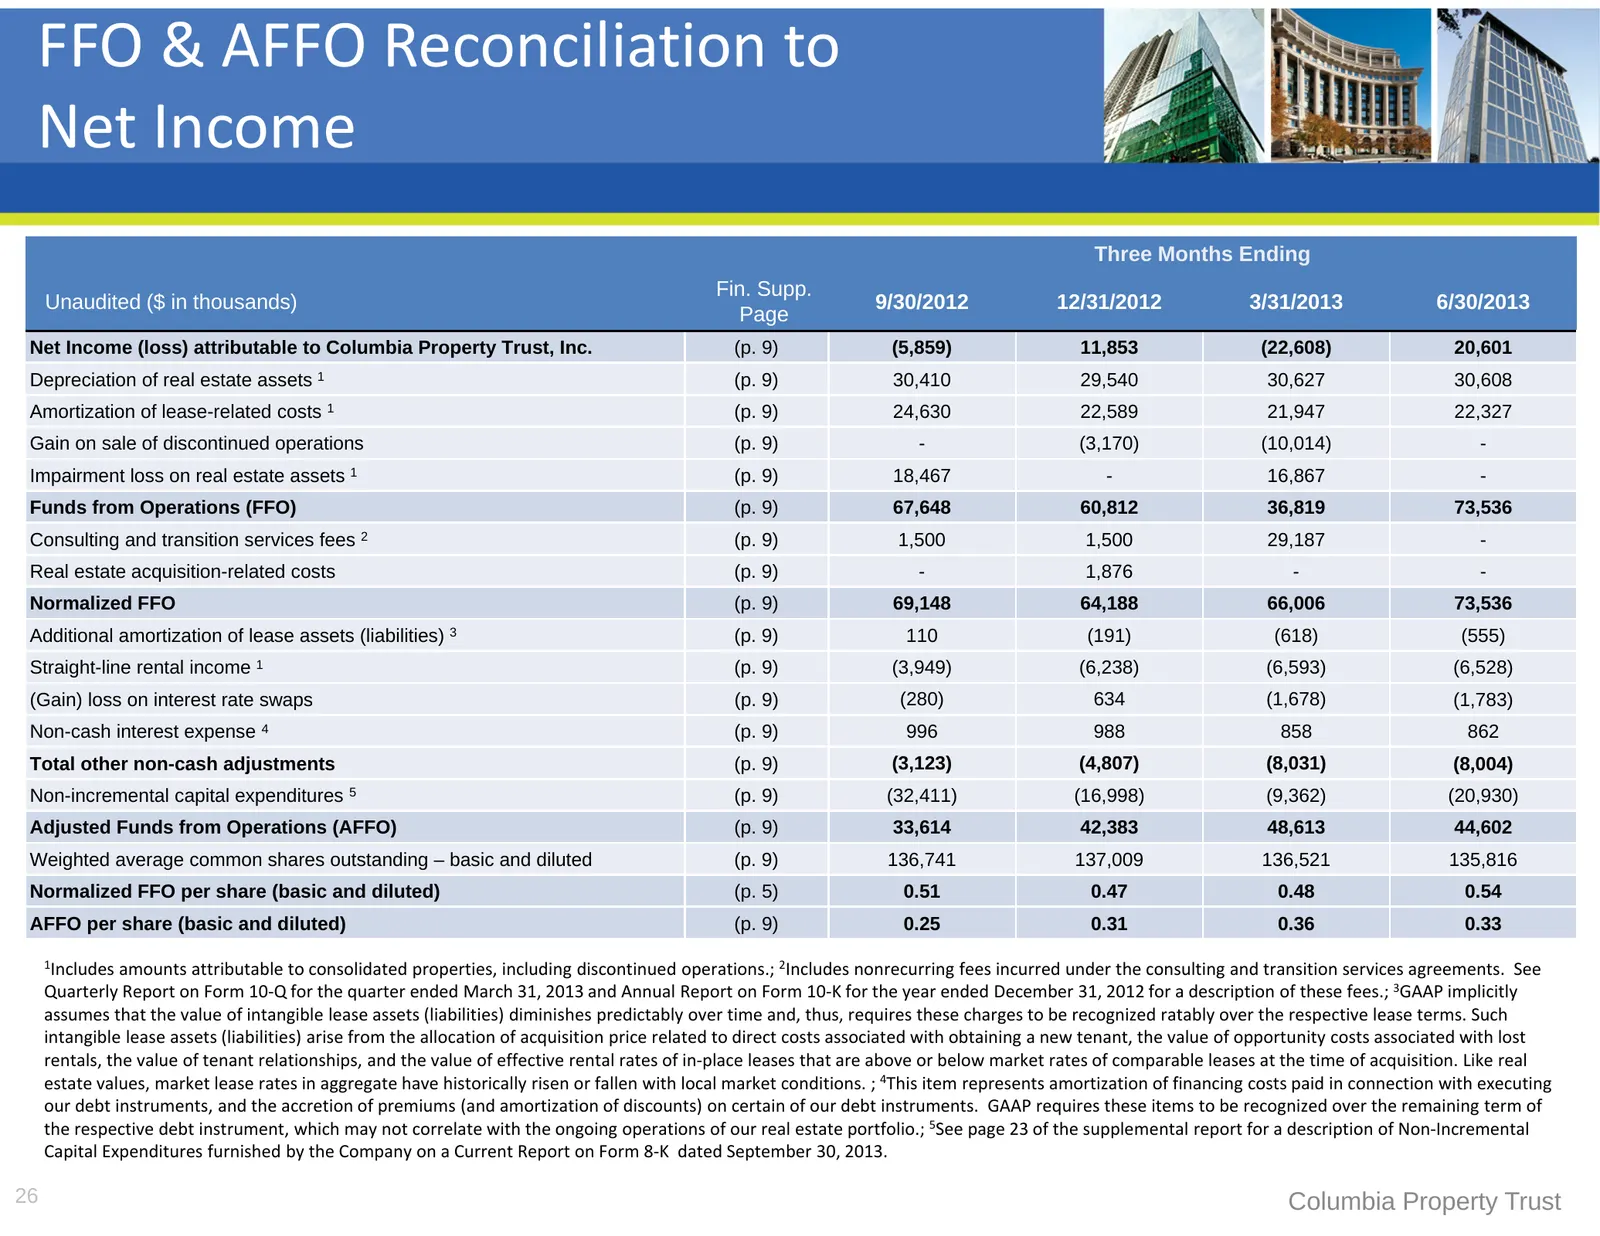
Slide 26: FFO & AFFO Reconciliation to Net Income
FFO & AFFO Reconciliation to Net Income Three Months Ending Fin. Supp. Unaudited ($ in thousands) 9/30/2012 12/31/2012 3/31/2013 6/30/2013 Page Net Income (loss) attributable to Columbia Property Trust, Inc. (p. 9) (5,859) 11,853 (22,608) 20,601 Depreciation of real estate assets 1 (p. 9) 30,410 29,
Source: SEC EDGAR · 8-K filed Sep 30, 2013
More decks from Columbia Property Trust Inc
 Investor Presentation (November 2020)33 slides · Nov 17, 2020
 Investor Presentation (August 2020)34 slides · Aug 31, 2020
 Investor Presentation (June 2020)34 slides · Jun 1, 2020
 Investor Presentation (February 2020)29 slides · Feb 26, 2020
 Corporate Update (December 2019)12 slides · Dec 3, 2019
 Investor Presentation (November 2019)28 slides · Nov 12, 2019