Vincom Retail JSC · HOSE:VRE
Vincom Retail JSC — Vincom Retail Joint Stock Company — Q4 2018 Earnings Presentation
20 slides from Vincom Retail JSC's earnings presentation, Feb 1, 2019
Slide 1: 4Q2018 and FY2018 Financial Results
Vincom Retail Joint Stock Company 4Q2018 and FY2018 Financial Results 01 February 2019
Slide 2: Disclaimer
Disclaimer IMPORTANT: The information contained herein is preliminary and subject to change without notice, its accuracy is not guaranteed, has not been independently verified and may not contain all material information concerning Vincom Retail Joint Stock Company (the “Company”) and its subsidiari
Slide 3: 1. Key Highlights
1. Key Highlights
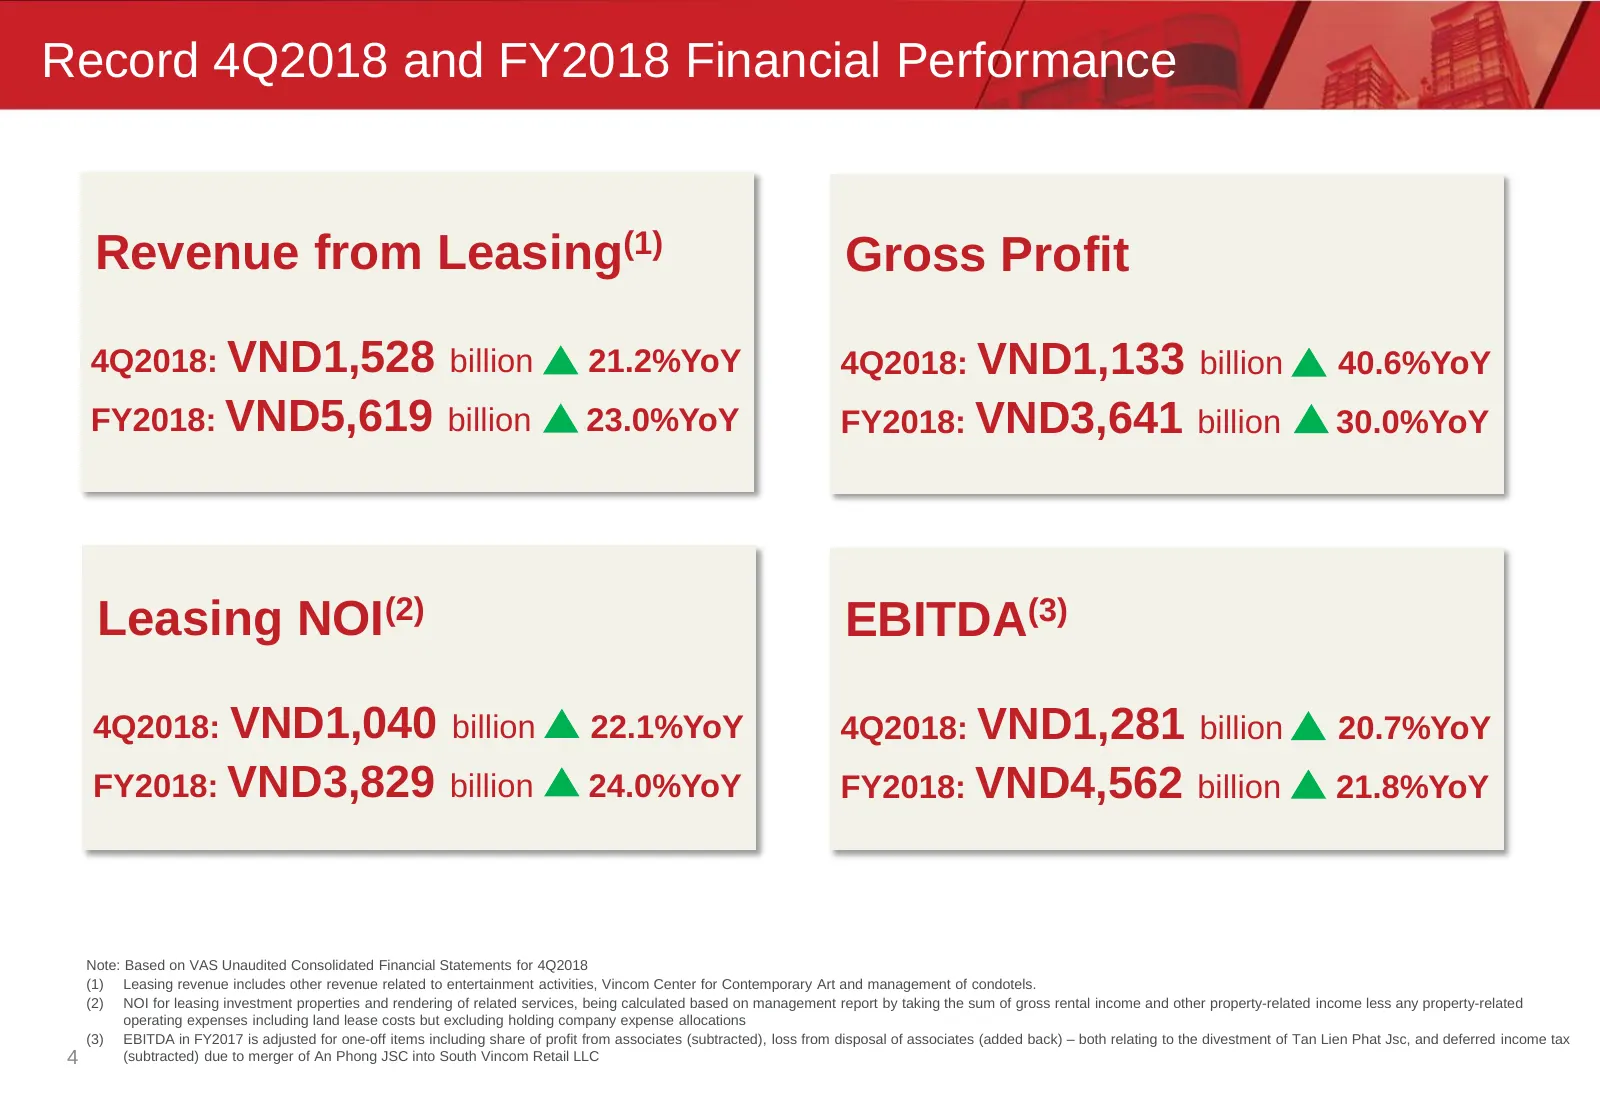
Slide 4: Record 4Q2018 and FY2018 Financial Performance
Record 4Q2018 and FY2018 Financial Performance Revenue from Leasing(1) Gross Profit 4Q2018: VND1,528 billion 21.2%YoY 4Q2018: VND1,133 billion 40.6%YoY FY2018: VND5,619 billion 23.0%YoY FY2018: VND3,641 billion 30.0%YoY Leasing NOI(2) EBITDA(3) 4Q2018: VND1,040 billion 22.1%YoY 4Q2018: VND1,281 bill
Slide 5: Solidified Position as Dominant Retail Platform in Vietnam
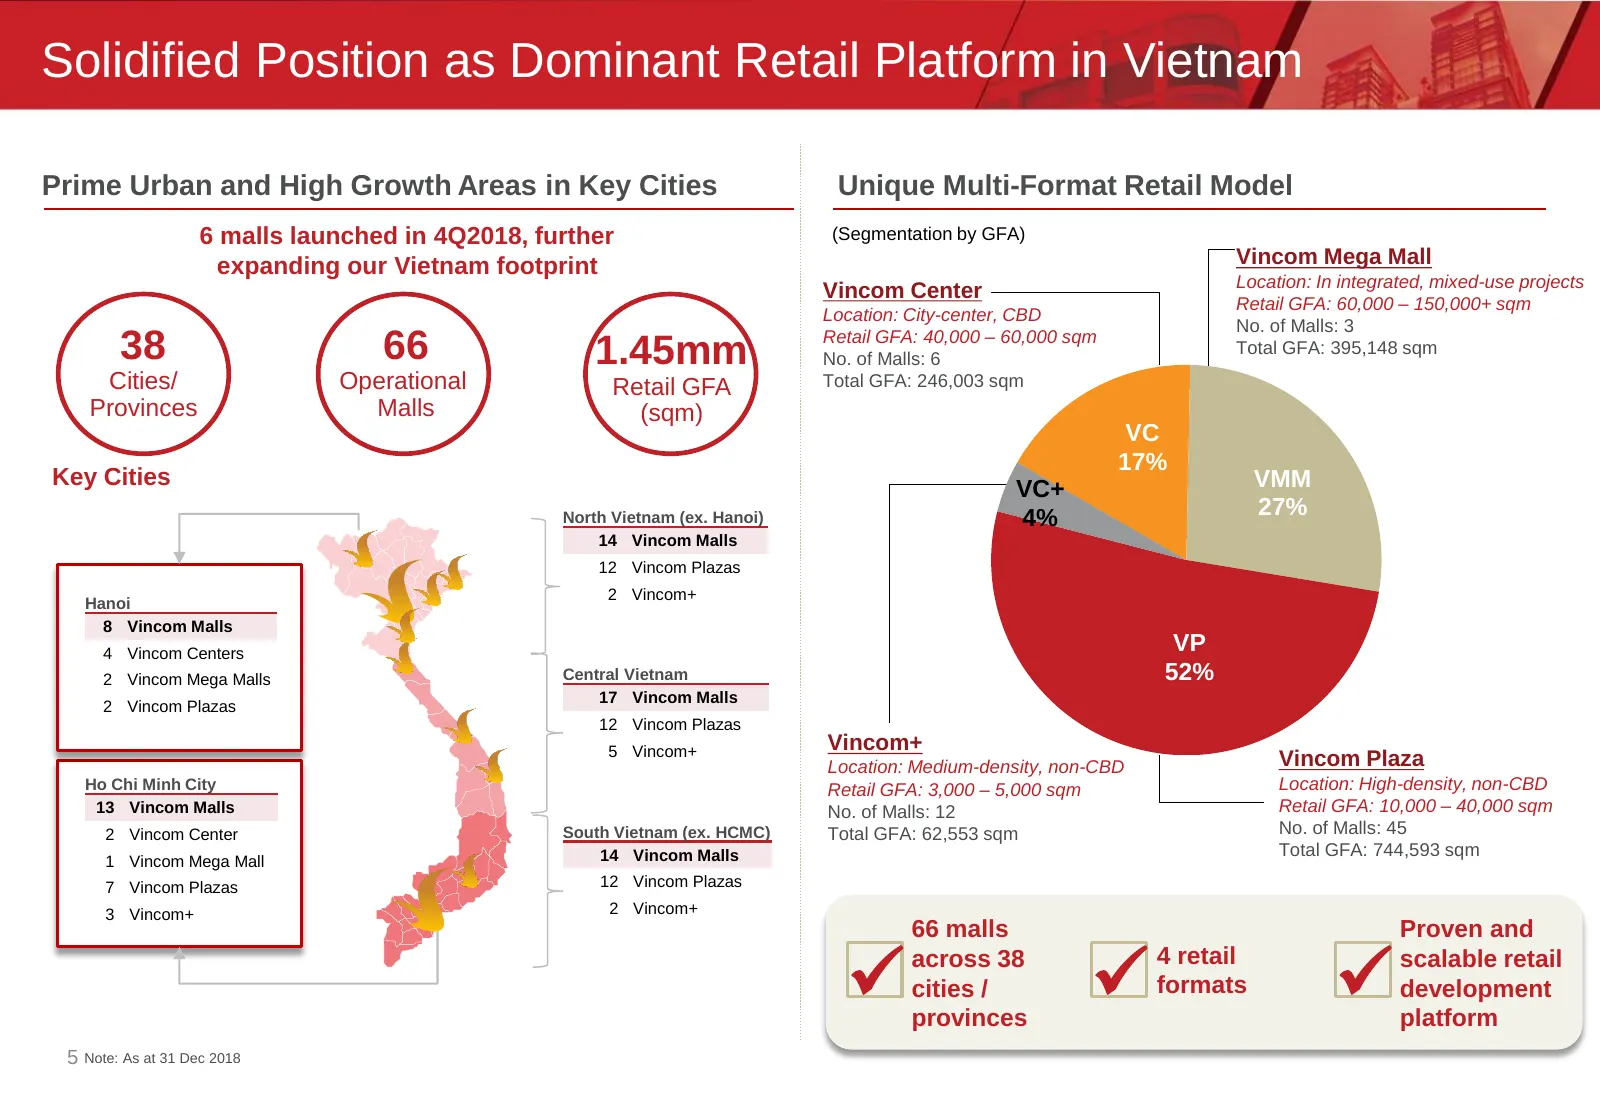
Solidified Position as Dominant Retail Platform in Vietnam Prime Urban and High Growth Areas in Key Cities Unique Multi-Format Retail Model 6 malls launched in 4Q2018, further (Segmentation by GFA) expanding our Vietnam footprint Vincom Mega Mall Location: In integrated, mixed-use projects Vincom Ce
Slide 6: New Mall Openings in 4Q2018
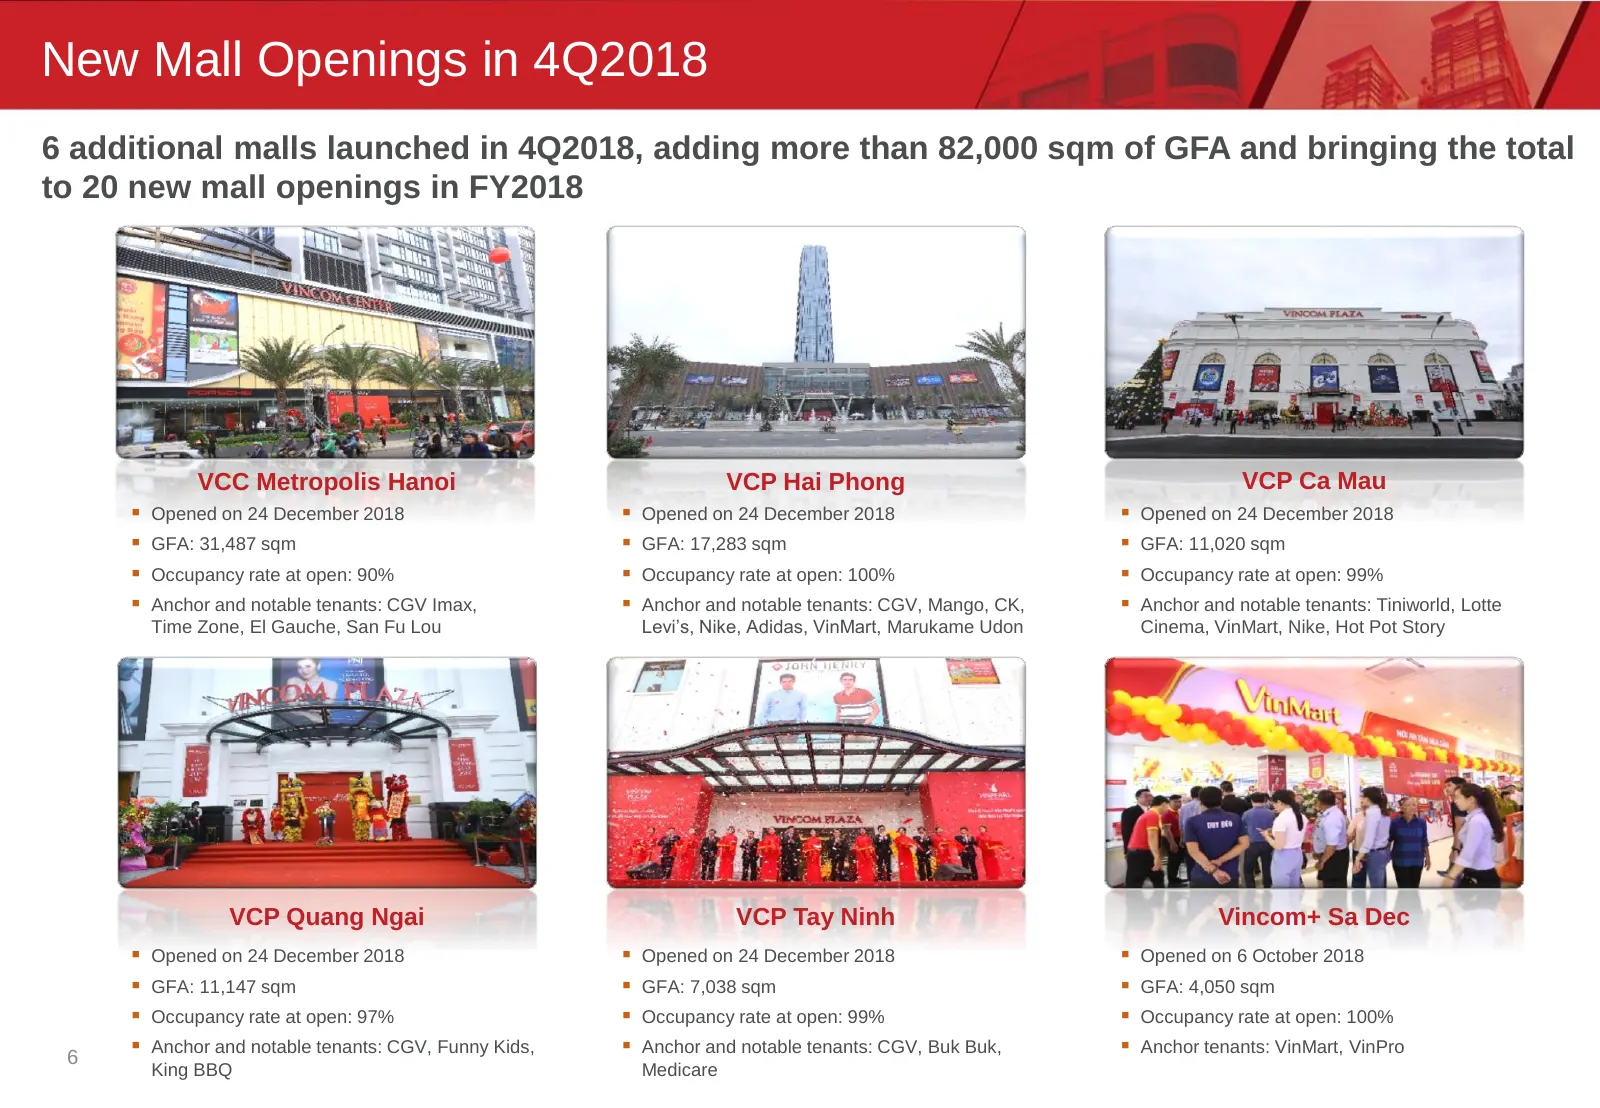
New Mall Openings in 4Q2018 6 additional malls launched in 4Q2018, adding more than 82,000 sqm of GFA and bringing the total to 20 new mall openings in FY2018 VCC Metropolis Hanoi VCP Hai Phong VCP Ca Mau Opened on 24 December 2018 Opened on 24 December 2018 Opened on 24 December 2018 GFA: 3
Slide 7: 2. Operational Update
2. Operational Update
Slide 8: 4Q2018 and FY2018 Operational Highlights and Updates
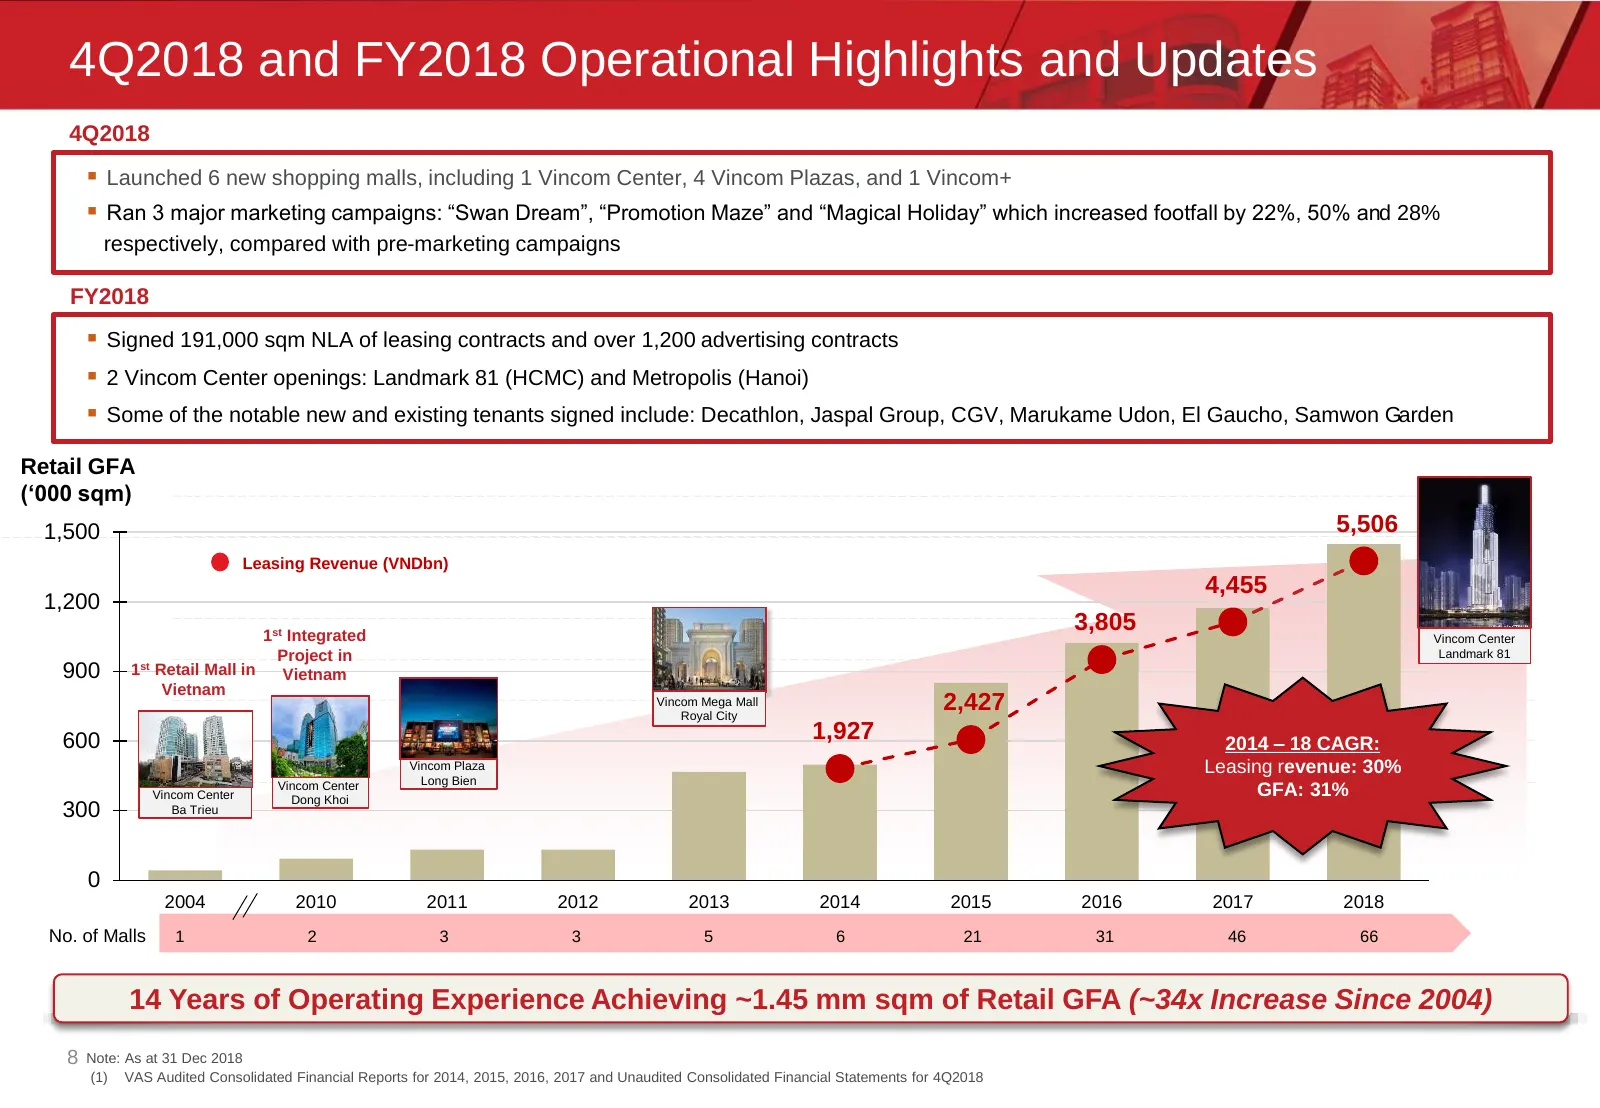
4Q2018 and FY2018 Operational Highlights and Updates 4Q2018 Launched 6 new shopping malls, including 1 Vincom Center, 4 Vincom Plazas, and 1 Vincom+ Ran 3 major marketing campaigns: “Swan Dream”, “Promotion Maze” and “Magical Holiday” which increased footfall by 22%, 50% and 28% respectively, co
Slide 9: Key Operational Metrics
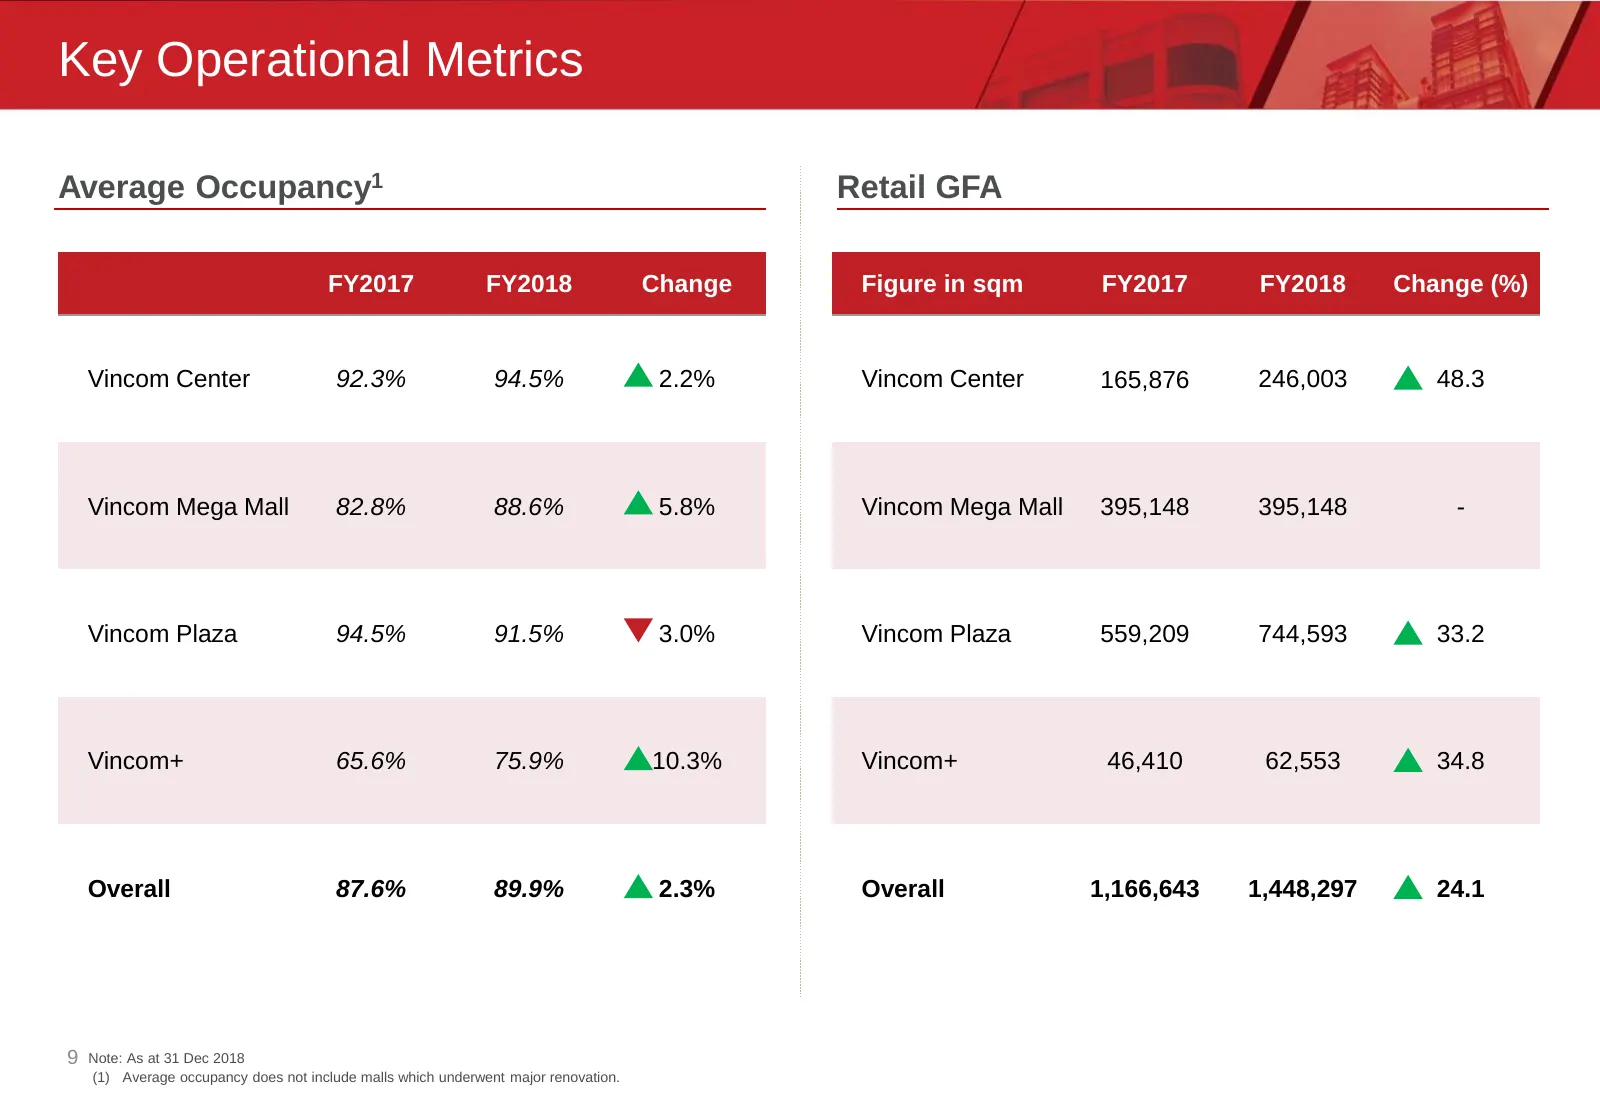
Key Operational Metrics Average Occupancy1 Retail GFA FY2017 FY2018 Change Figure in sqm FY2017 FY2018 Change (%) Vincom Center 92.3% 94.5% 2.2% Vincom Center 165,876 246,003 48.3 Vincom Mega Mall 82.8% 88.6% 5.8% Vincom Mega Mall 395,148 395,148 - Vincom Plaza 94.5% 91.5% 3.0% Vincom Plaza 559,209
Slide 10: Vincom Mega Malls: Improved and Stabilized Occupancy post AEIs
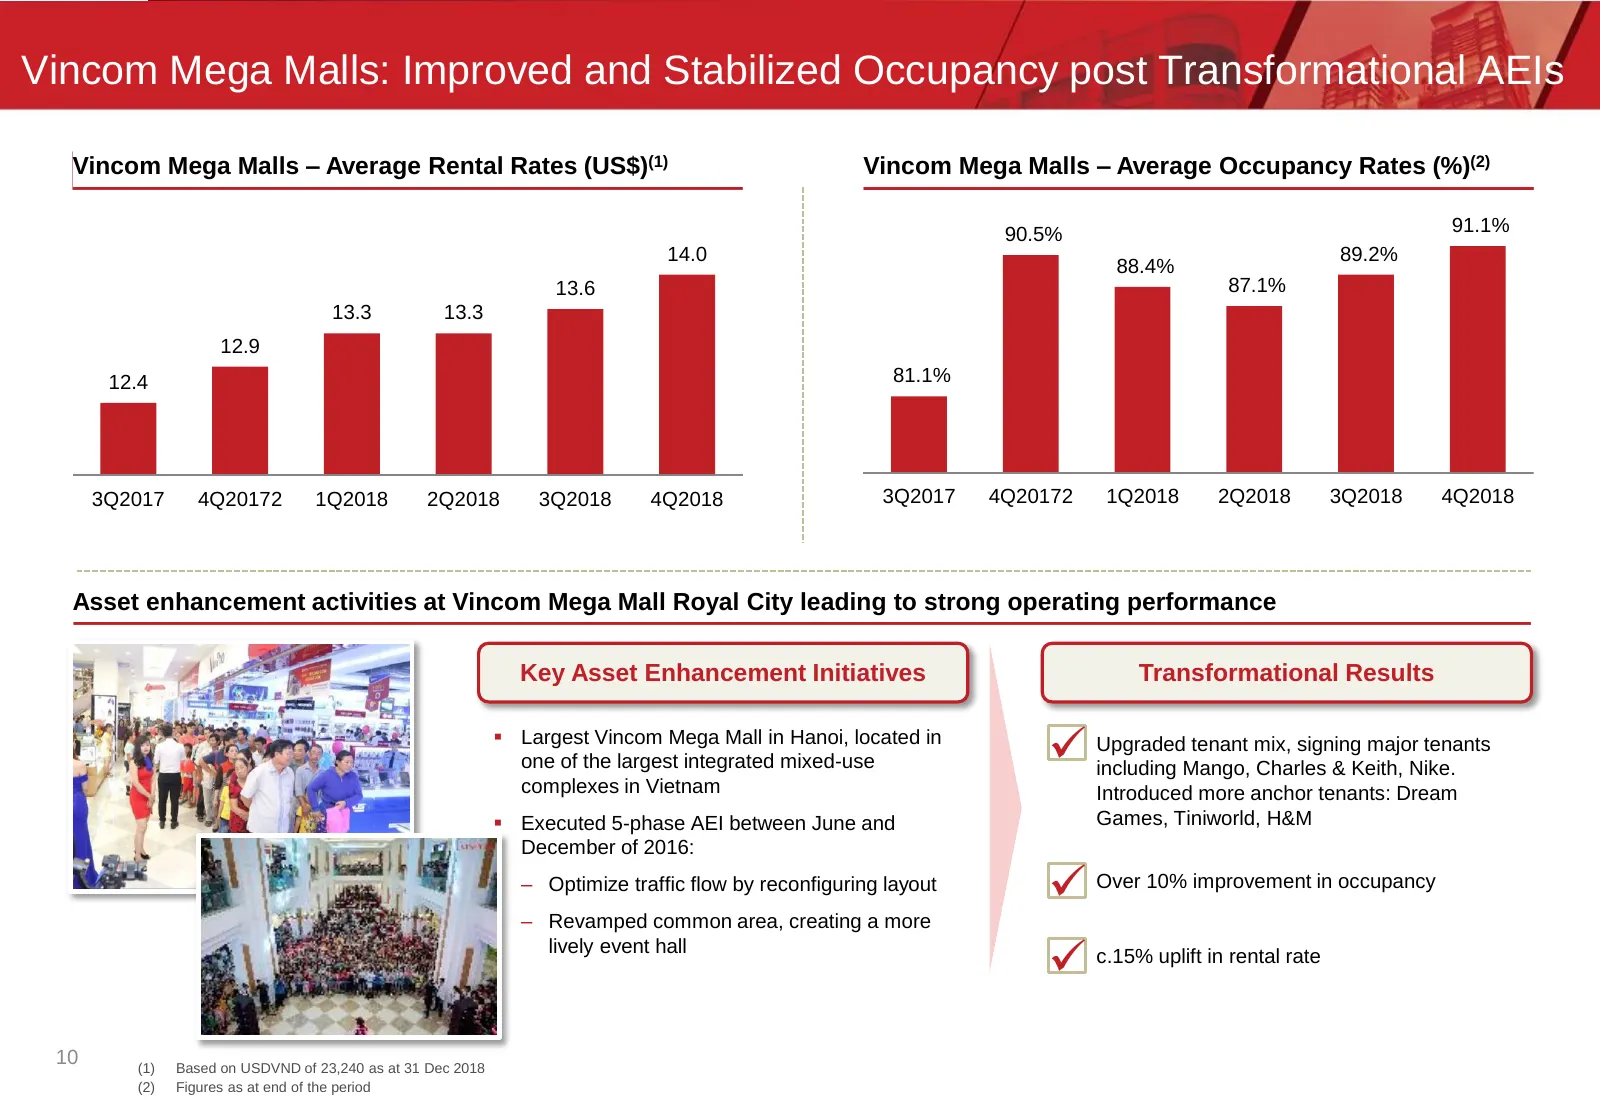
Vincom Mega Malls: Improved and Stabilized Occupancy post Transformational AEIs Vincom Mega Malls – Average Rental Rates (US$)(1) Vincom Mega Malls – Average Occupancy Rates (%)(2) 90.5% 91.1% 14.0 89.2% 88.4% 13.6 87.1% 13.3 13.3 12.9 12.4 81.1% 3Q2017 4Q20172 1Q2018 2Q2018 3Q2018 4Q2018 3Q2017 4Q2
Slide 11: Vincom Plazas: Rapid Roll-out of Additional Malls
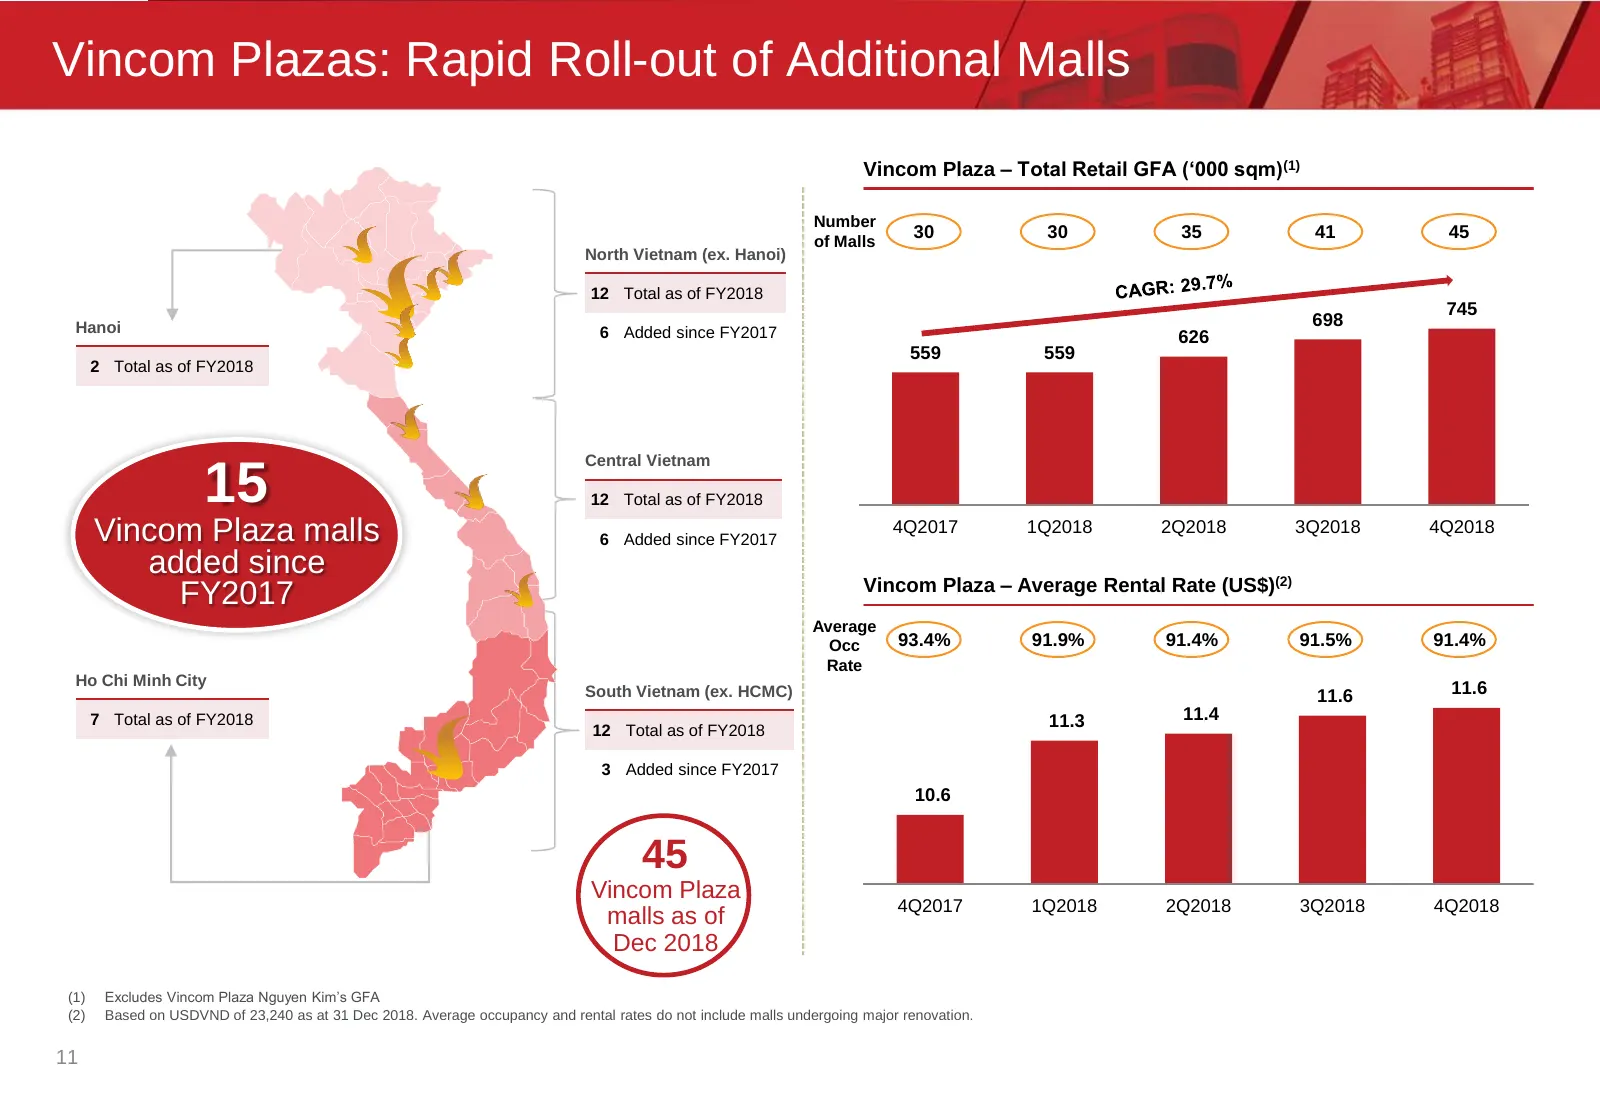
Vincom Plazas: Rapid Roll-out of Additional Malls Vincom Plaza – Total Retail GFA (‘000 sqm)(1) Number of Malls 30 30 35 41 45 North Vietnam (ex. Hanoi) 12 Total as of FY2018 745 Hanoi 698 6 Added since FY2017 626 559 559 2 Total as of FY2018 Central Vietnam 15 12 Total as of FY2018 Vincom Plaza mal
Slide 12: Sales and Marketing Activities
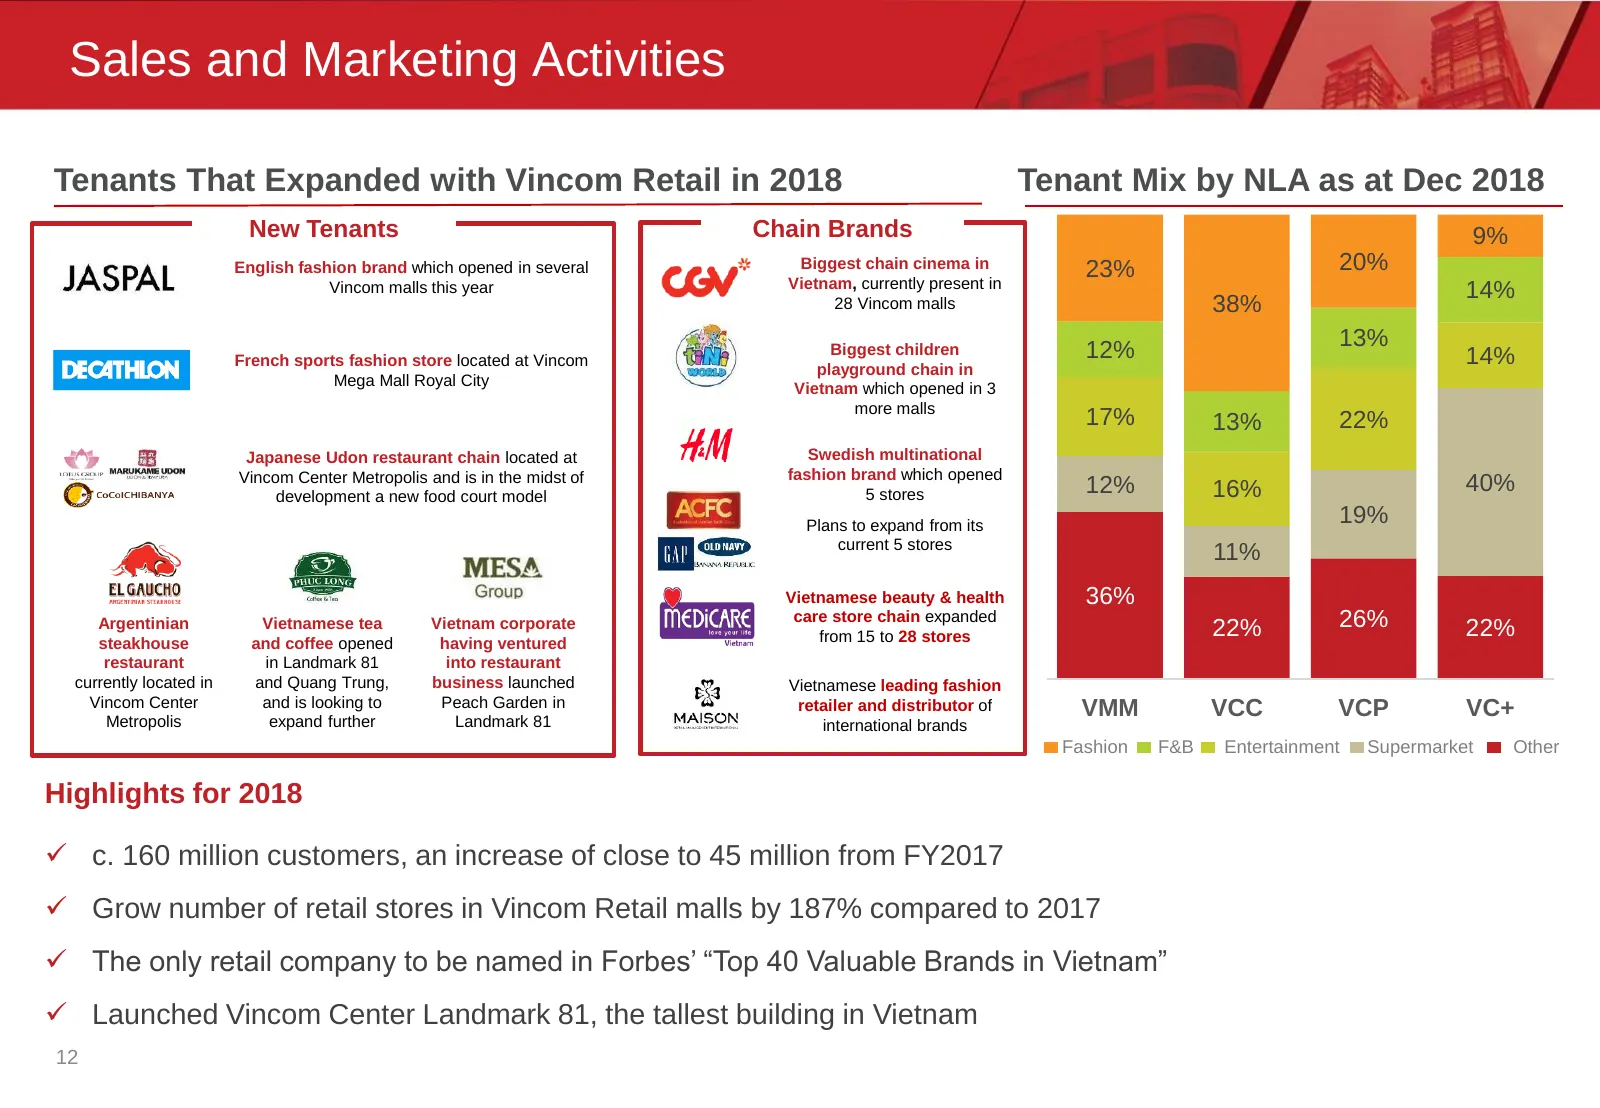
Sales and Marketing Activities Tenants That Expanded with Vincom Retail in 2018 Tenant Mix by NLA as at Dec 2018 New Tenants Chain Brands 9% English fashion brand which opened in several Biggest chain cinema in 23% 20% Vietnam, currently present in Vincom malls this year 14% 28 Vincom malls 38% Bigg
Slide 13: 2019 Plan
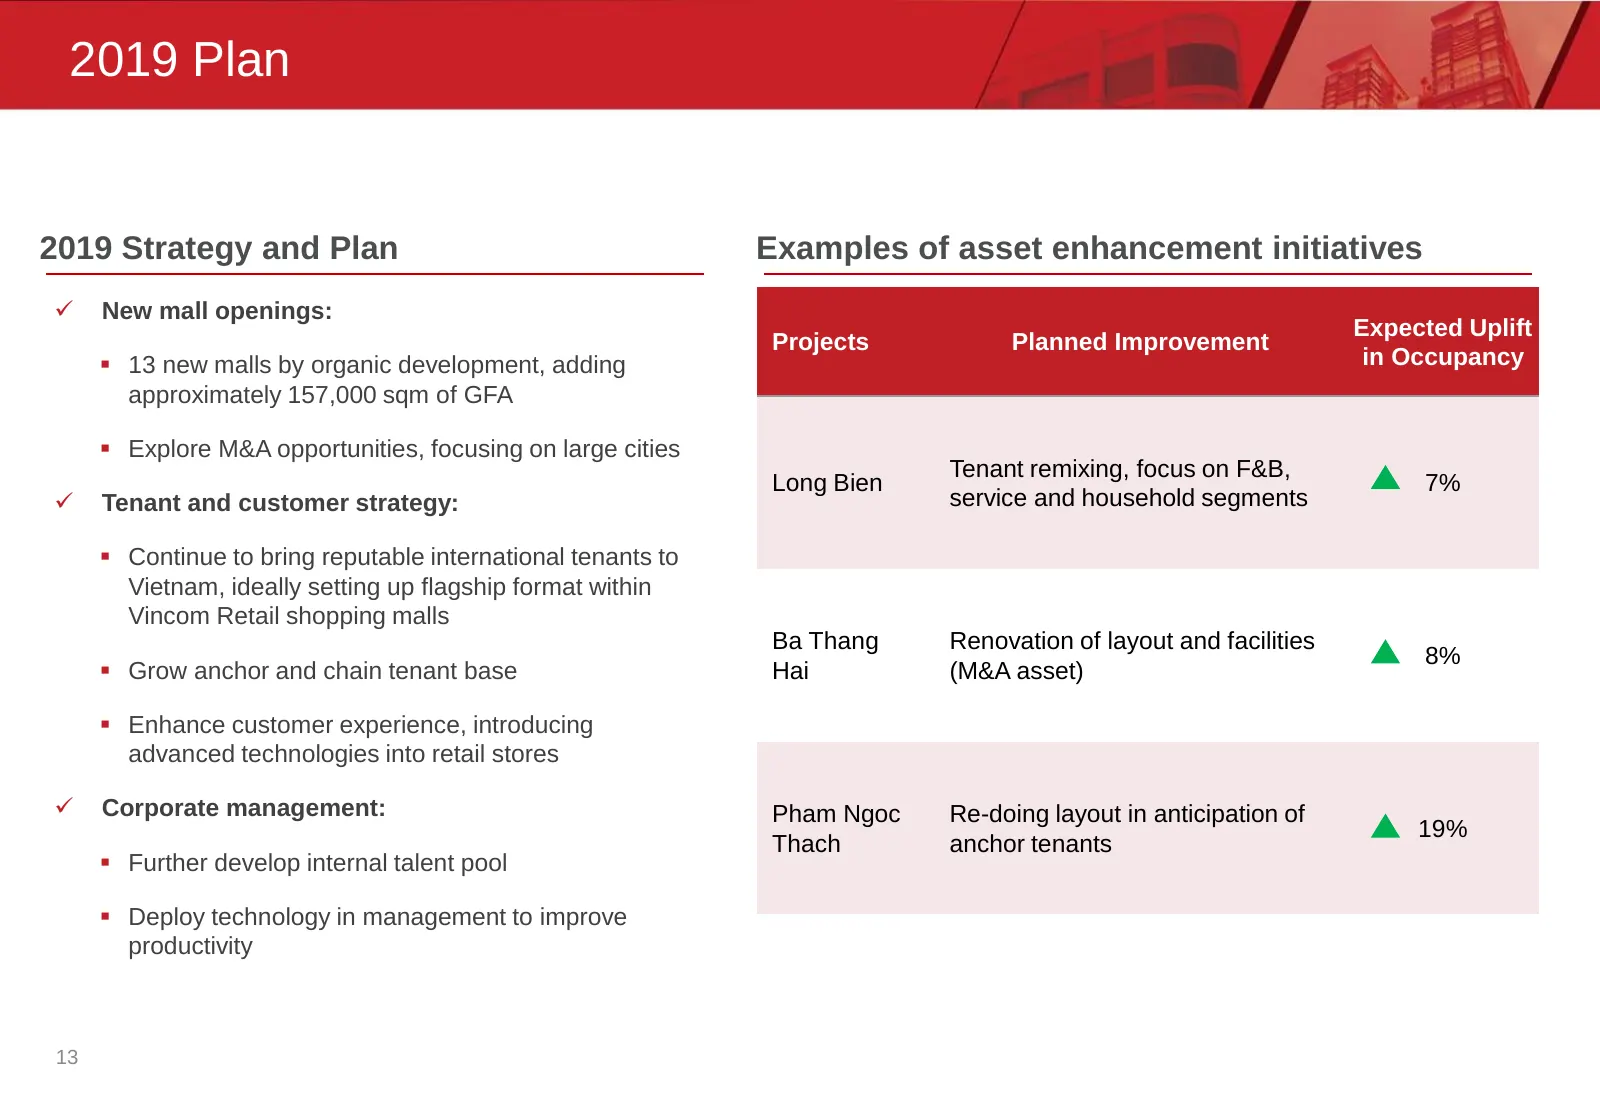
2019 Plan 2019 Strategy and Plan Examples of asset enhancement initiatives New mall openings: Expected Uplift Projects Planned Improvement 13 new malls by organic development, adding in Occupancy approximately 157,000 sqm of GFA Explore M&A opportunities, focusing on large cities Tenant remixi
Slide 14: 3. Financials and Capital Management Update
3. Financials and Capital Management Update
Slide 15: Financial Performance in 4Q 2018 vs. 4Q 2017
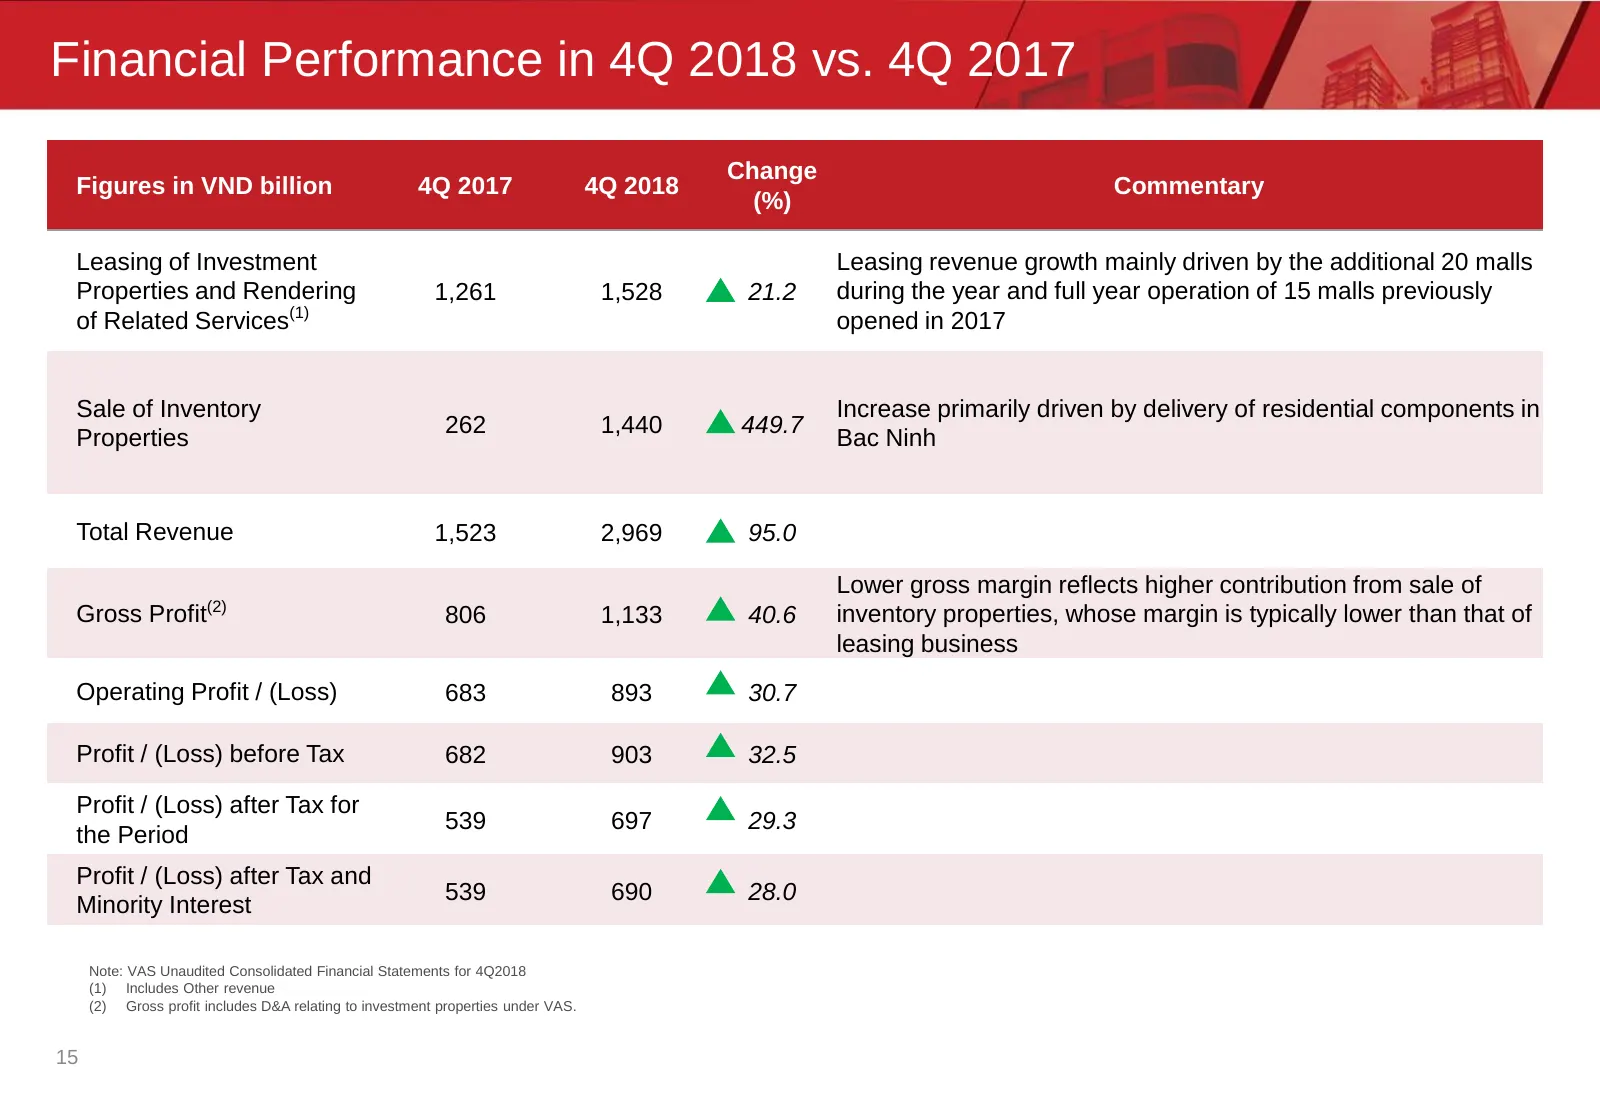
Financial Performance in 4Q 2018 vs. 4Q 2017 Change Figures in VND billion 4Q 2017 4Q 2018 Commentary (%) Leasing of Investment Leasing revenue growth mainly driven by the additional 20 malls Properties and Rendering 1,261 1,528 21.2 during the year and full year operation of 15 malls previously of
Slide 16: Financial Performance in FY2018 vs. FY2017
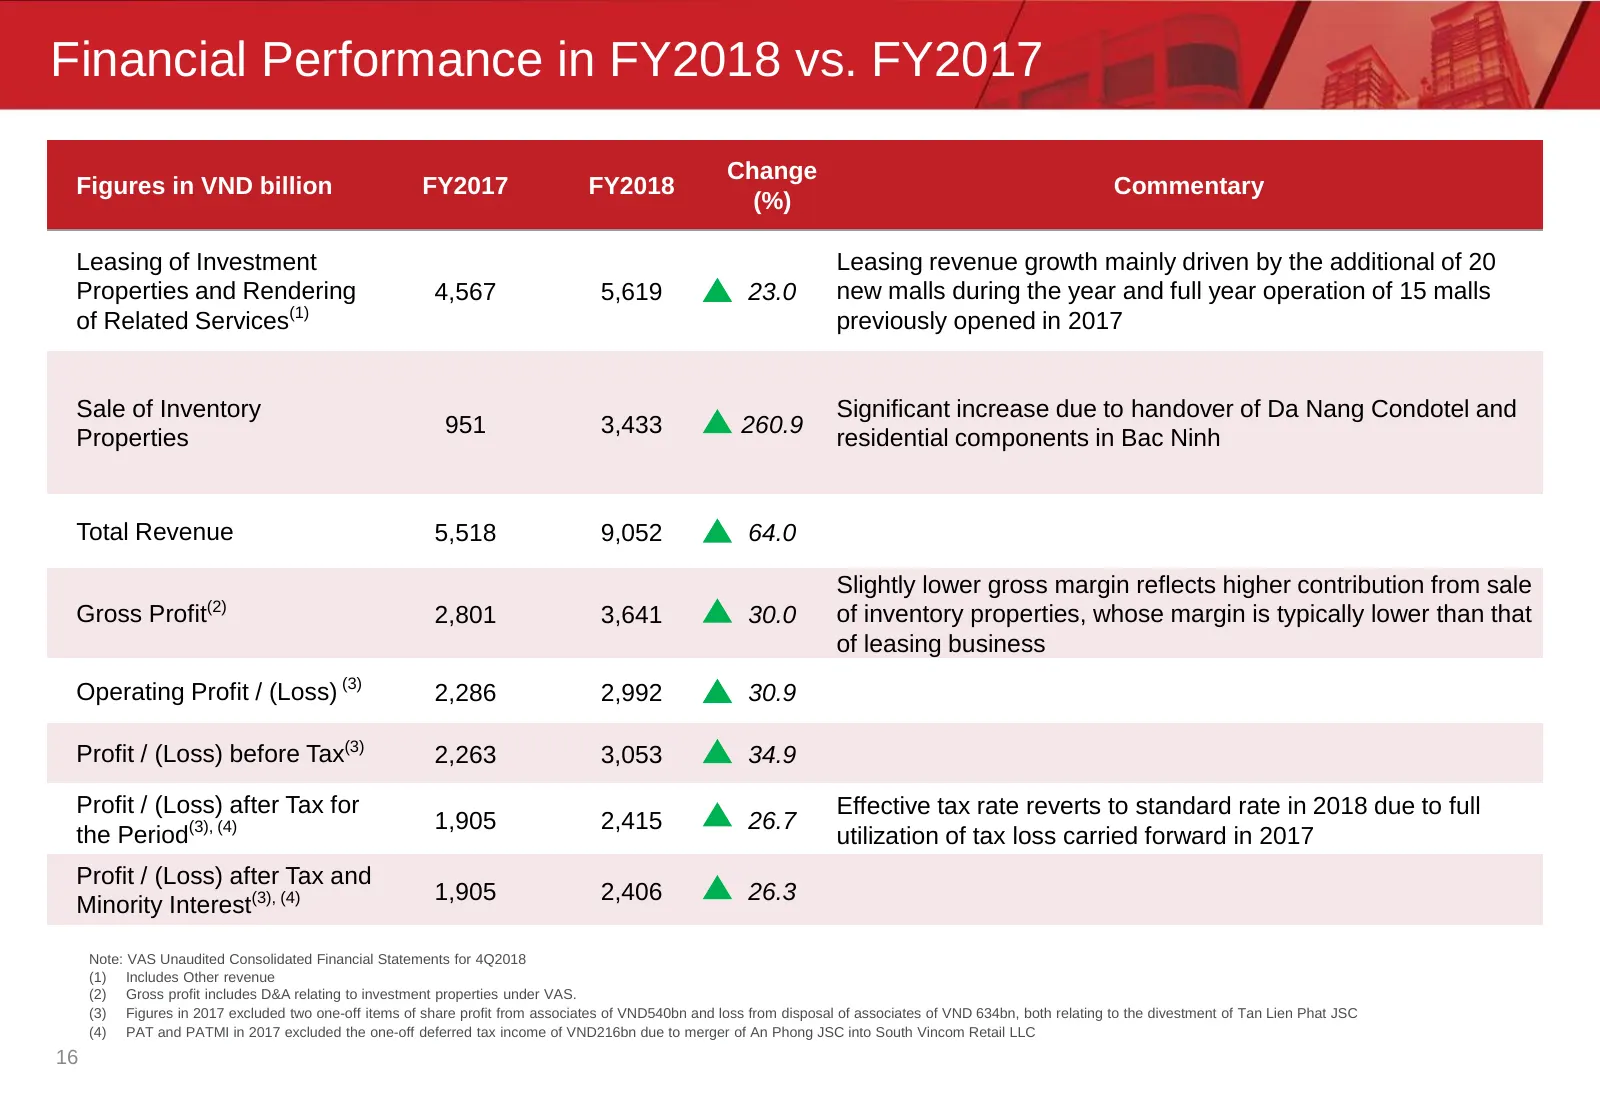
Financial Performance in FY2018 vs. FY2017 Change Figures in VND billion FY2017 FY2018 Commentary (%) Leasing of Investment Leasing revenue growth mainly driven by the additional of 20 Properties and Rendering 4,567 5,619 23.0 new malls during the year and full year operation of 15 malls of Related
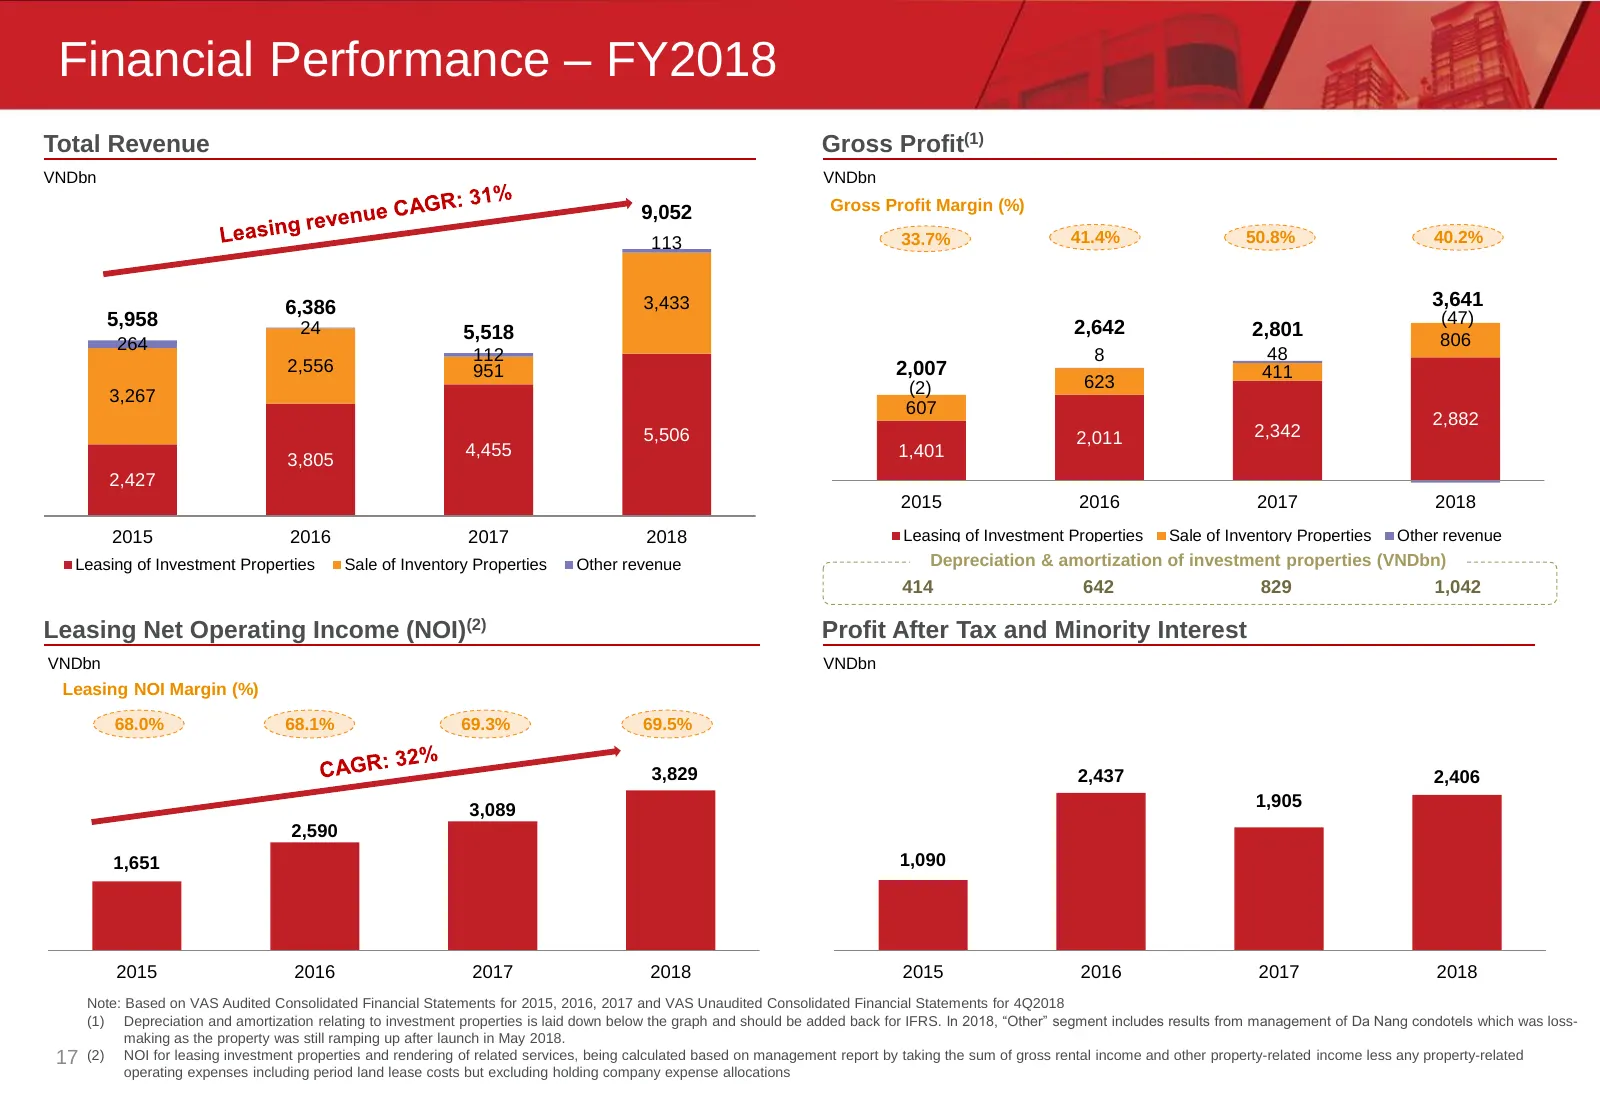
Slide 17: Financial Performance – FY2018
Financial Performance – FY2018 Total Revenue Gross Profit(1) VNDbn VNDbn 9,052 Gross Profit Margin (%) 113 33.7% 41.4% 50.8% 40.2% 6,386 3,433 3,641 5,958 (47) 24 5,518 2,642 2,801 264 806 112 8 48 2,556 951 2,007 411 (2) 623 3,267 607 2,882 5,506 2,011 2,342 4,455 1,401 3,805 2,427 2015 2016 2017 2
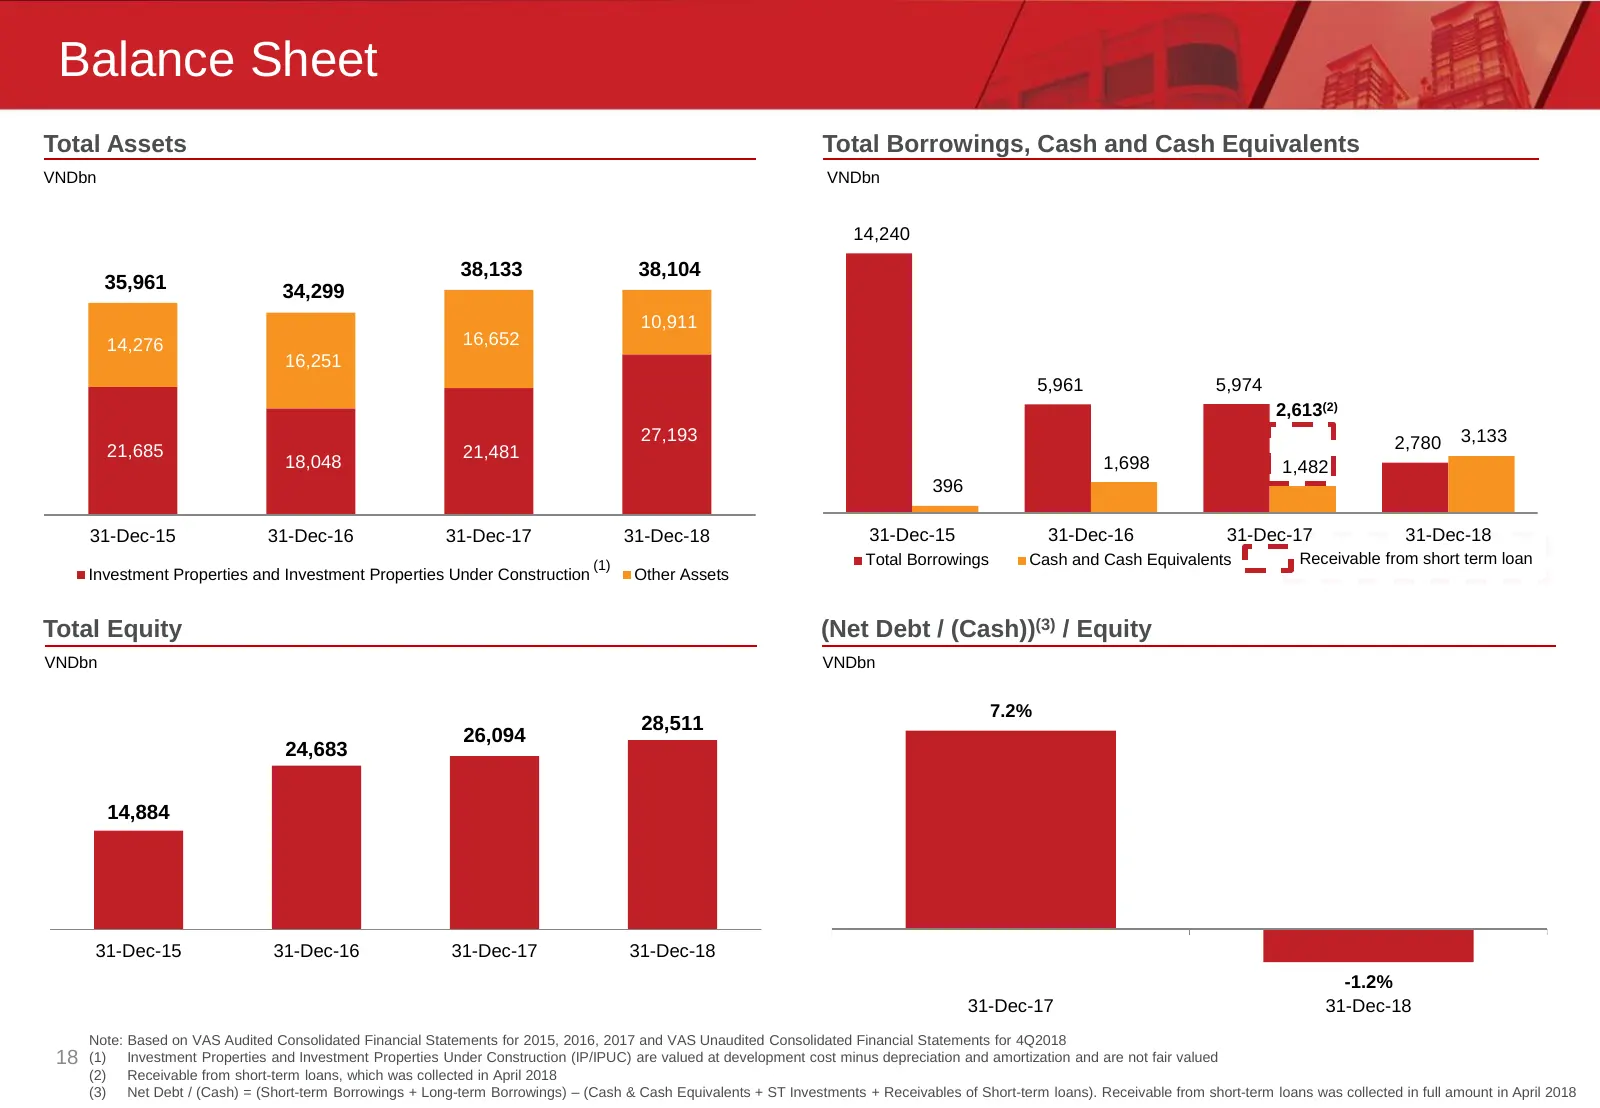
Slide 18: Balance Sheet
Balance Sheet Total Assets Total Borrowings, Cash and Cash Equivalents VNDbn VNDbn 14,240 38,133 38,104 35,961 34,299 10,911 14,276 16,652 16,251 5,961 5,974 2,613(2) 27,193 2,780 3,133 21,685 21,481 18,048 1,698 1,482 396 31-Dec-15 31-Dec-16 31-Dec-17 31-Dec-18 31-Dec-15 31-Dec-16 31-Dec-17 31-Dec-
Slide 19: Appendix
Appendix
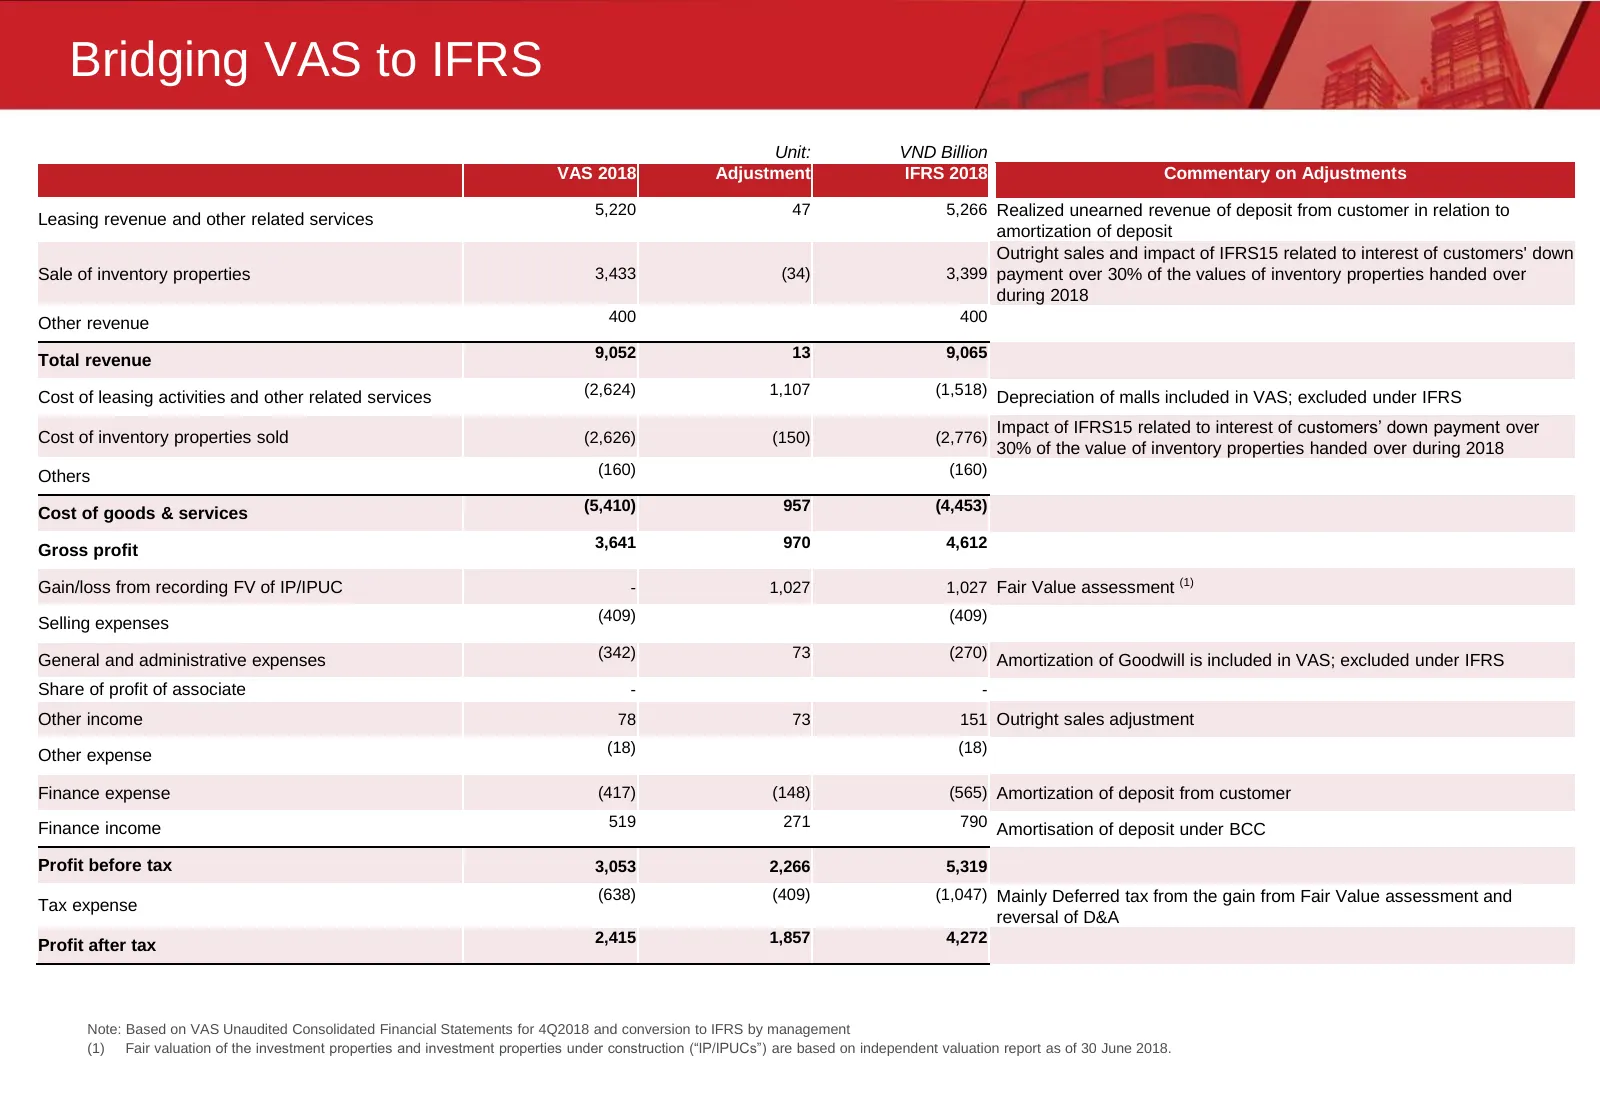
Slide 20: Bridging VAS to IFRS
Bridging VAS to IFRS Unit: VND Billion VAS 2018 Adjustment IFRS 2018 Commentary on Adjustments 5,220 47 5,266 Realized unearned revenue of deposit from customer in relation to Leasing revenue and other related services amortization of deposit Outright sales and impact of IFRS15 related to interest o
Source: Internet Archive copy of ir.vincom.com.vn
More decks from Vincom Retail JSC
 Q3 2026 Earnings Presentation17 slides · Oct 29, 2026
 Investor Presentation (June 2026)25 slides · June 2026
 Q3 2025 Earnings Presentation16 slides · Oct 29, 2025
 Q2 2025 Earnings Presentation19 slides · Jul 29, 2025
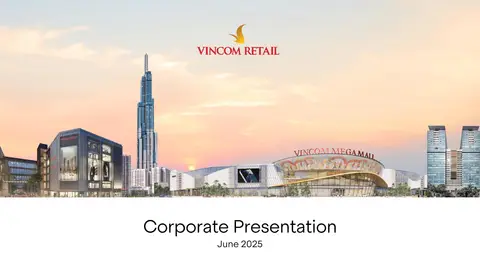 Investor Presentation (June 2025)22 slides · June 2025
 Q1 2025 Earnings Presentation20 slides · Apr 28, 2025