Celsia SA ESP · BVC:CELSIA
Celsia SA ESP — Celsia — Q1 2023 Earnings Presentation
19 slides from Celsia SA ESP's earnings presentation, April 2023
Slide 1: Financial Results First quarter 2023
Financial Results First quarter 2023
Slide 2: Disinvestment Central America Assets
Disinvestment Central America Assets
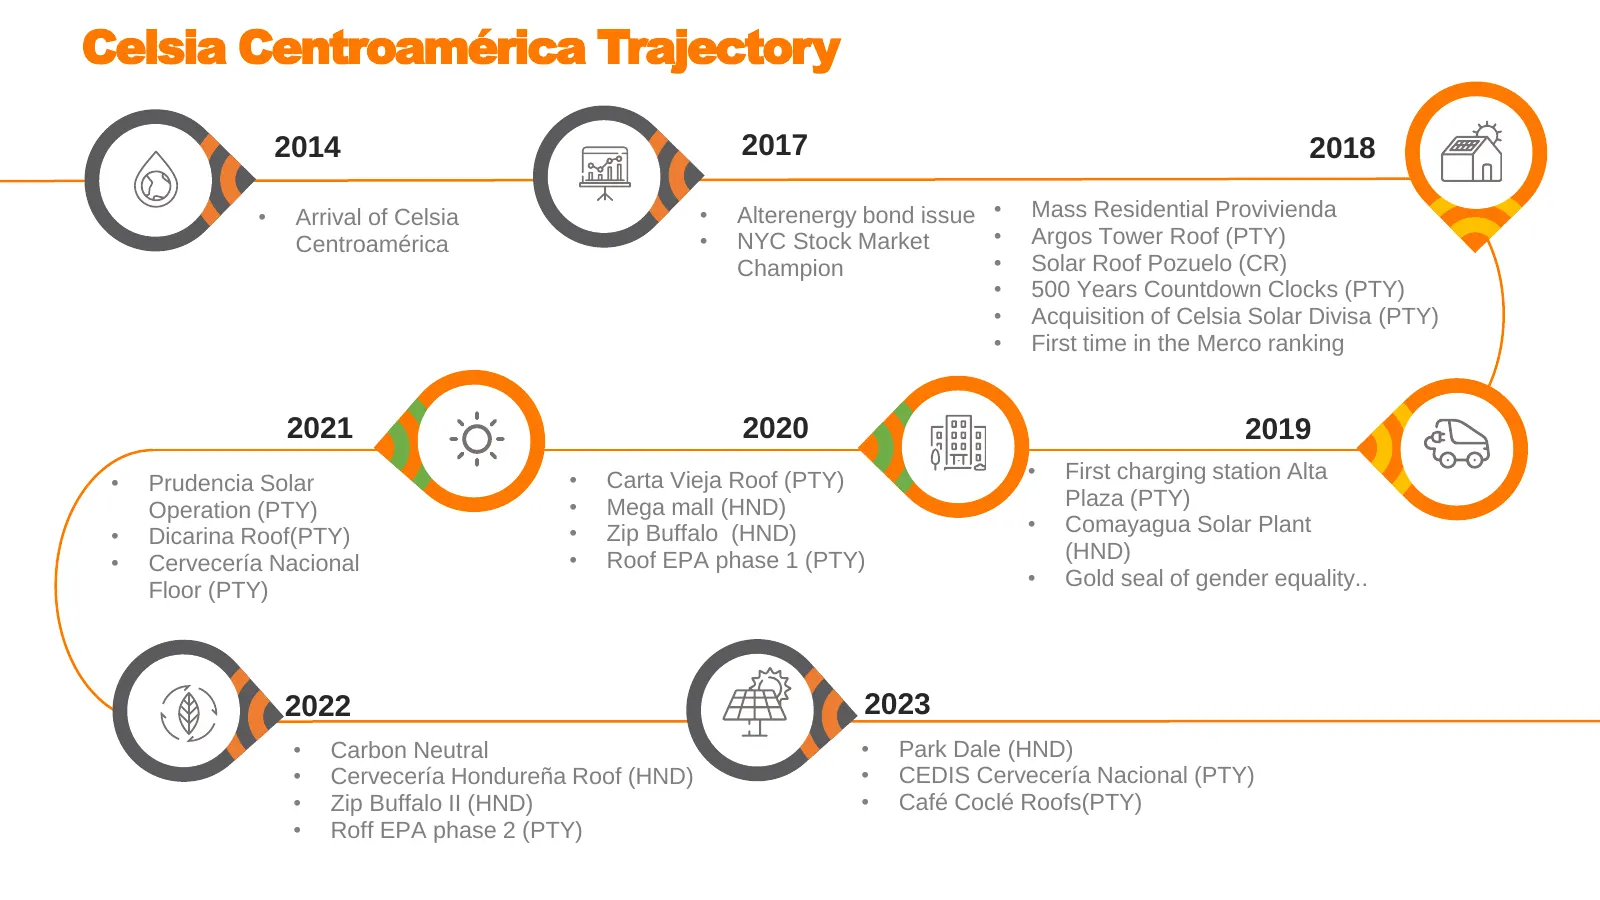
Slide 3: Celsia Centroamérica Trajectory
Celsia Centroamérica Trajectory 2014 2017 2018 • Arrival of Celsia • Alterenergy bond issue • Mass Residential Provivienda Centroamérica • NYC Stock Market • Argos Tower Roof (PTY) Champion • Solar Roof Pozuelo (CR) • 500 Years Countdown Clocks (PTY) • Acquisition of Celsia Solar Divisa (PTY) • Firs
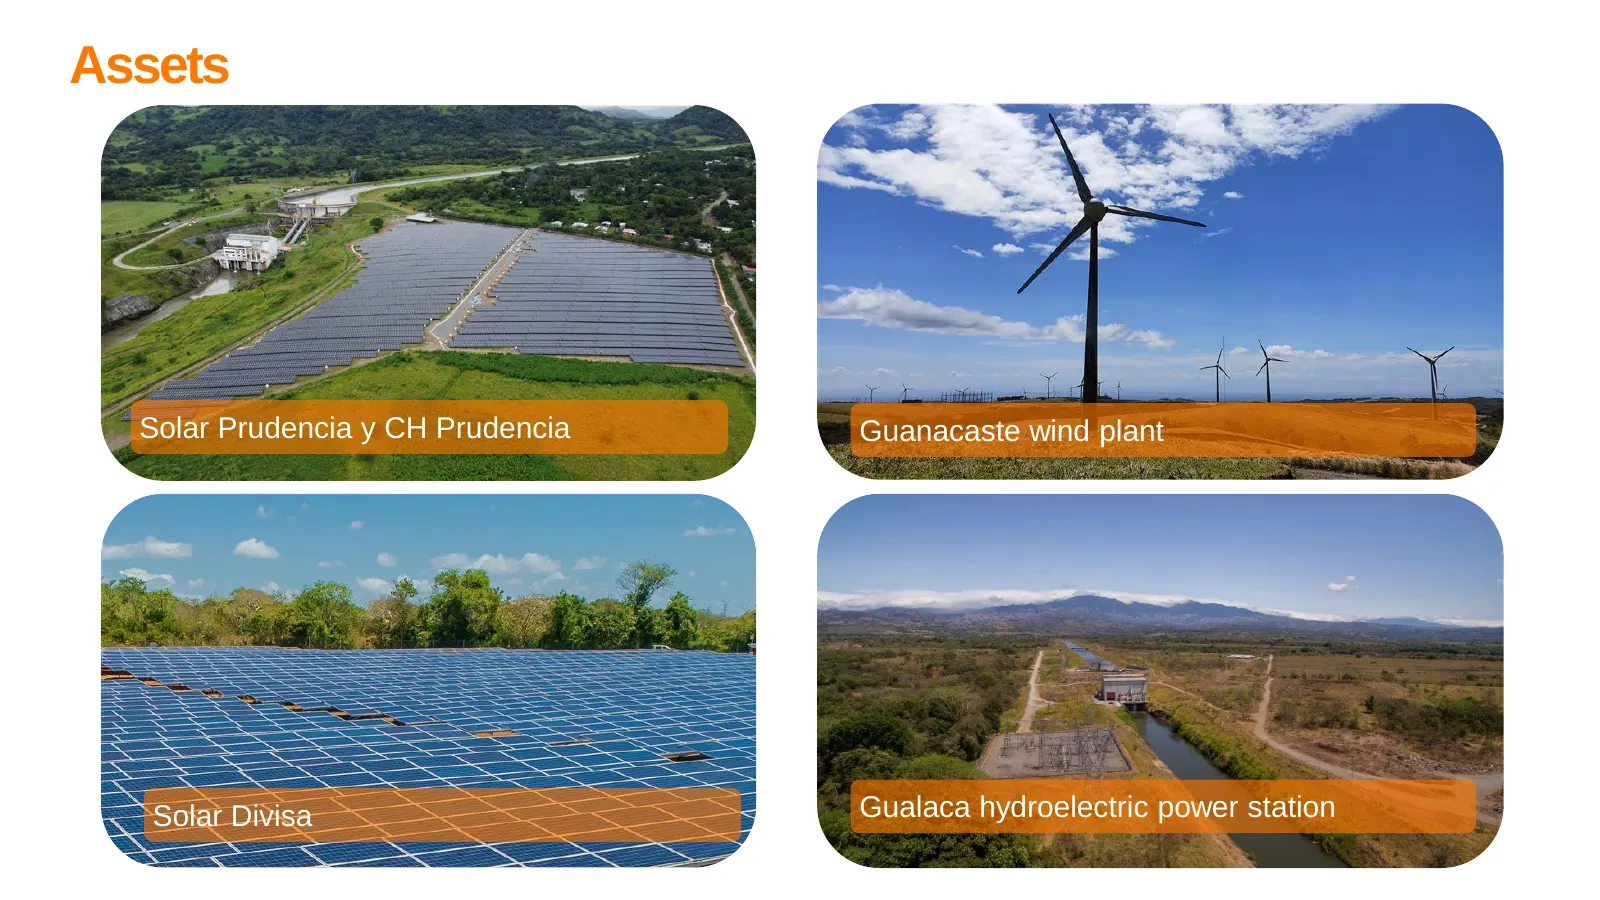
Slide 4: Assets
Assets Solar Prudencia y CH Prudencia Guanacaste wind plant Solar Divisa Gualaca hydroelectric power station
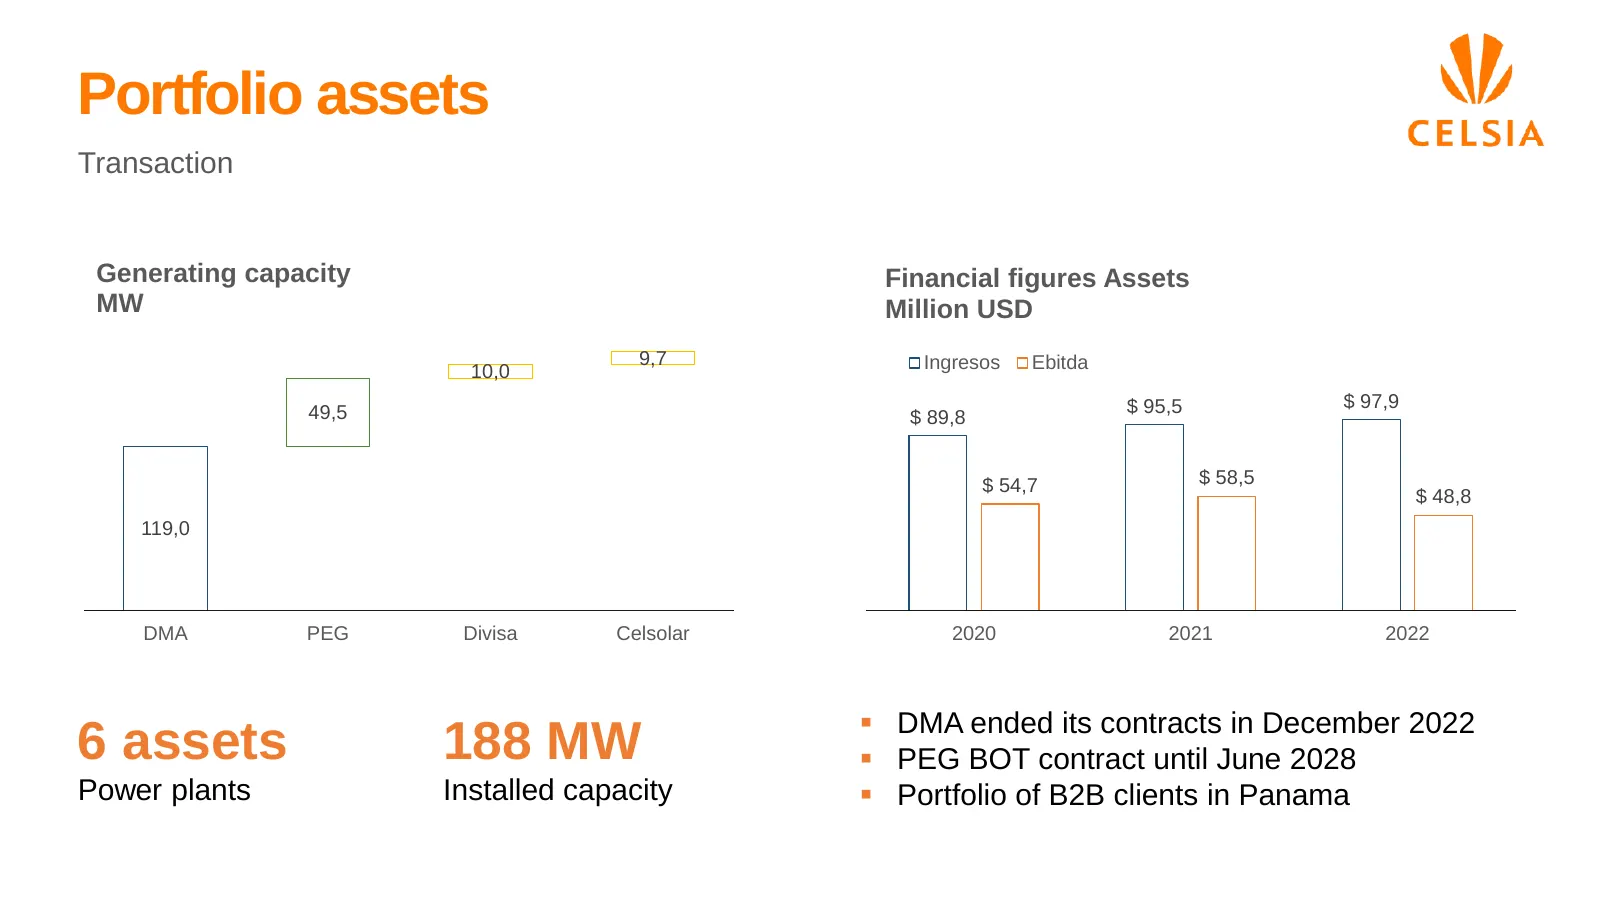
Slide 5: Portfolio assets
Portfolio assets Transaction Generating capacity Financial figures Assets MW Million USD 9,7 Ingresos Ebitda 10,0 $ 95,5 $ 97,9 49,5 $ 89,8 $ 54,7 $ 58,5 $ 48,8 119,0 DMA PEG Divisa Celsolar 2020 2021 2022 ▪ DMA ended its contracts in December 2022 6 assets 188 MW ▪ PEG BOT contract until June 2028
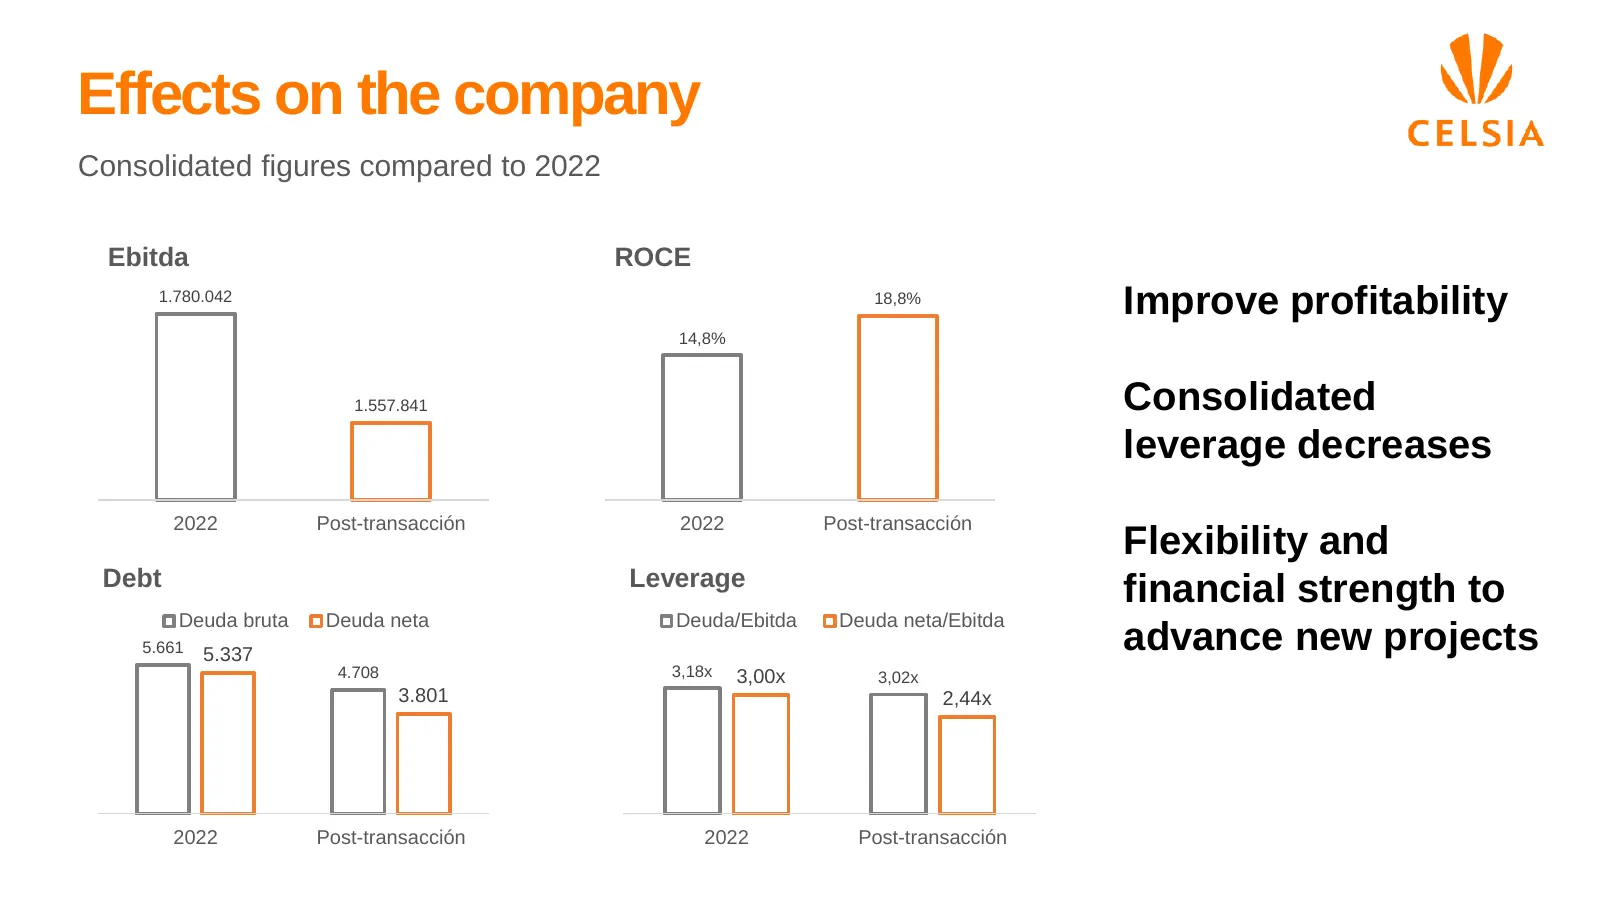
Slide 6: Effects on the company
Effects on the company Consolidated figures compared to 2022 Ebitda ROCE 1.780.042 18,8% Improve profitability 14,8% 1.557.841 Consolidated leverage decreases 2022 Post-transacción 2022 Post-transacción Flexibility and Debt Leverage financial strength to Deuda bruta Deuda neta Deuda/Ebitda Deuda net
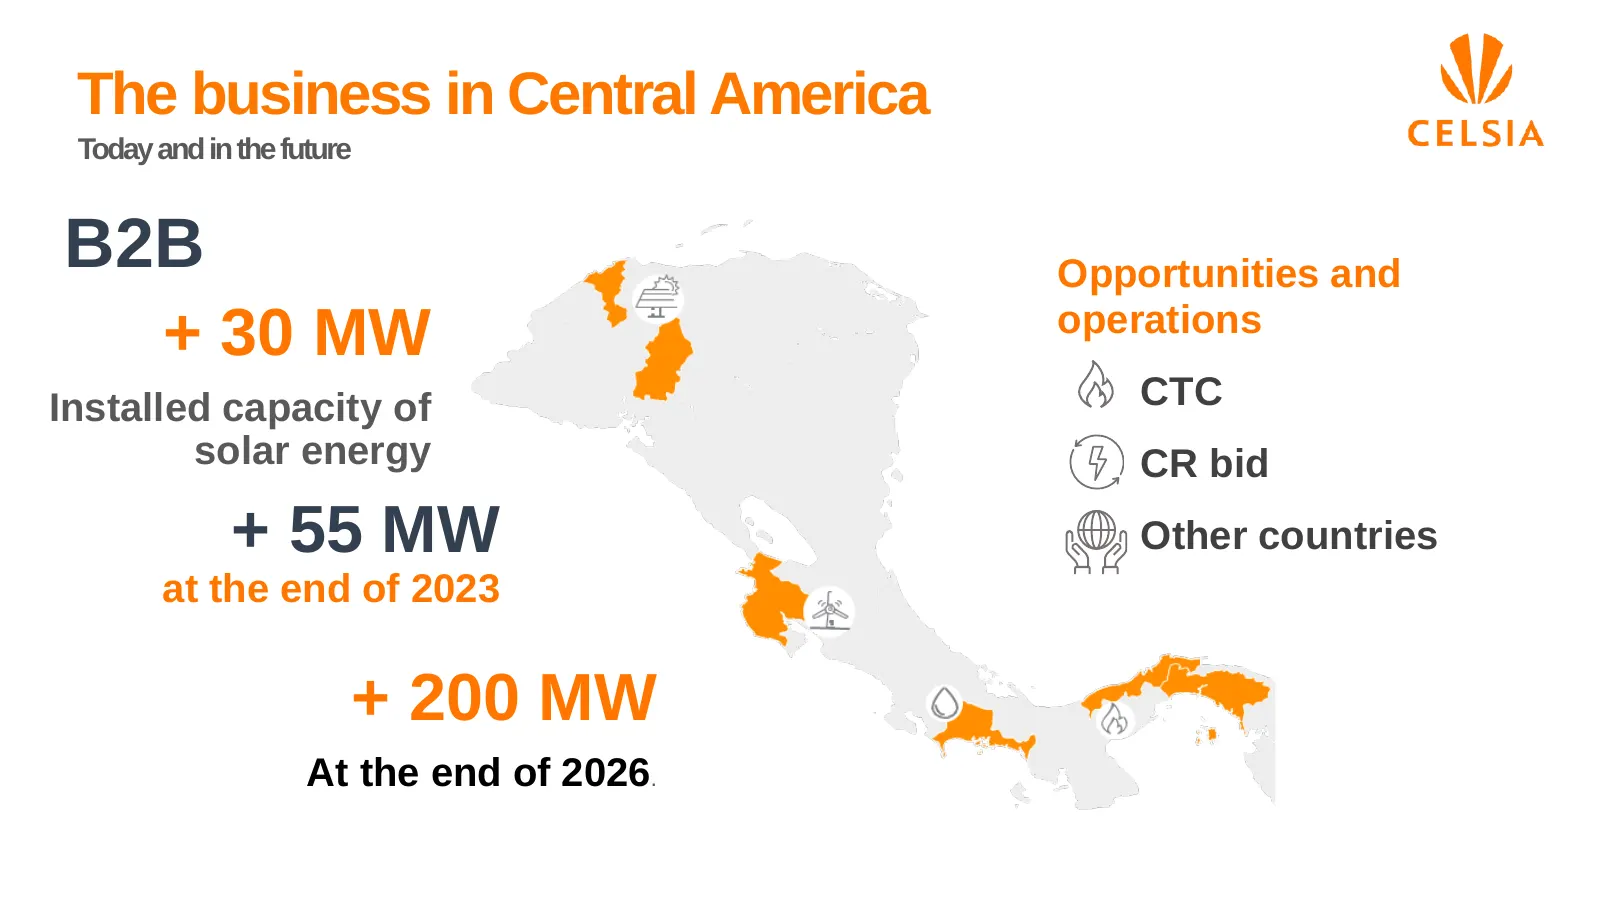
Slide 7: The business in Central America: today and in the future
The business in Central America Today and in the future B2B Opportunities and operations + 30 MW Installed capacity of CTC solar energy CR bid + 55 MW Other countries at the end of 2023 + 200 MW At the end of 2026.
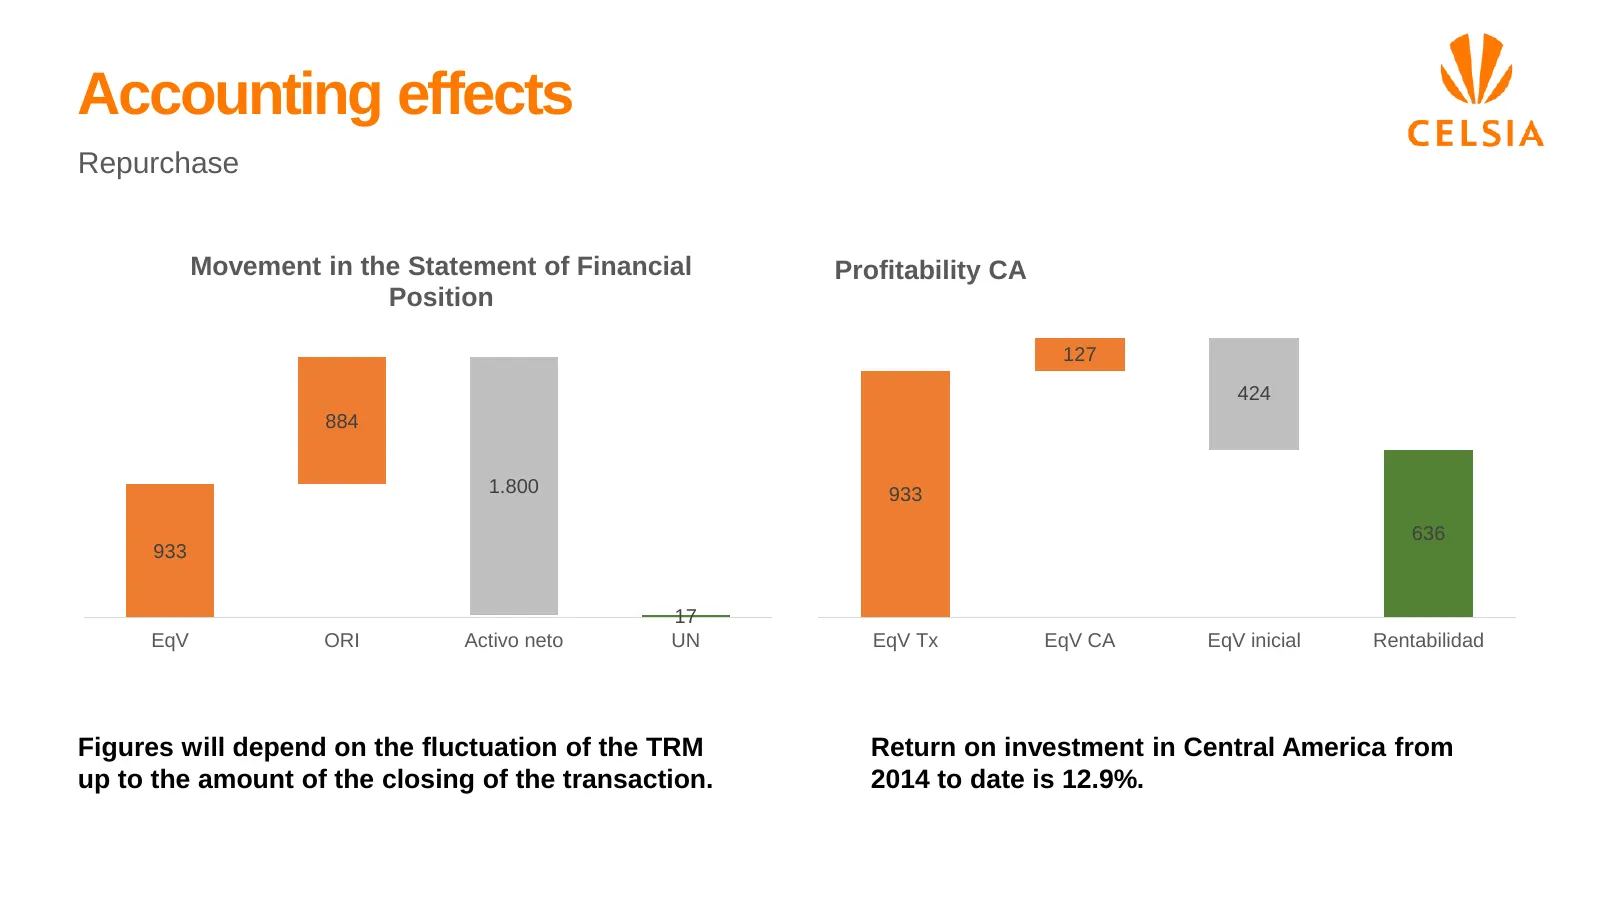
Slide 8: Accounting effects
Accounting effects Repurchase Movement in the Statement of Financial Profitability CA Position 127 424 884 1.800 933 636 933 17 EqV ORI Activo neto UN EqV Tx EqV CA EqV inicial Rentabilidad Figures will depend on the fluctuation of the TRM Return on investment in Central America from up to the amoun
Slide 9: Our commitment to the future
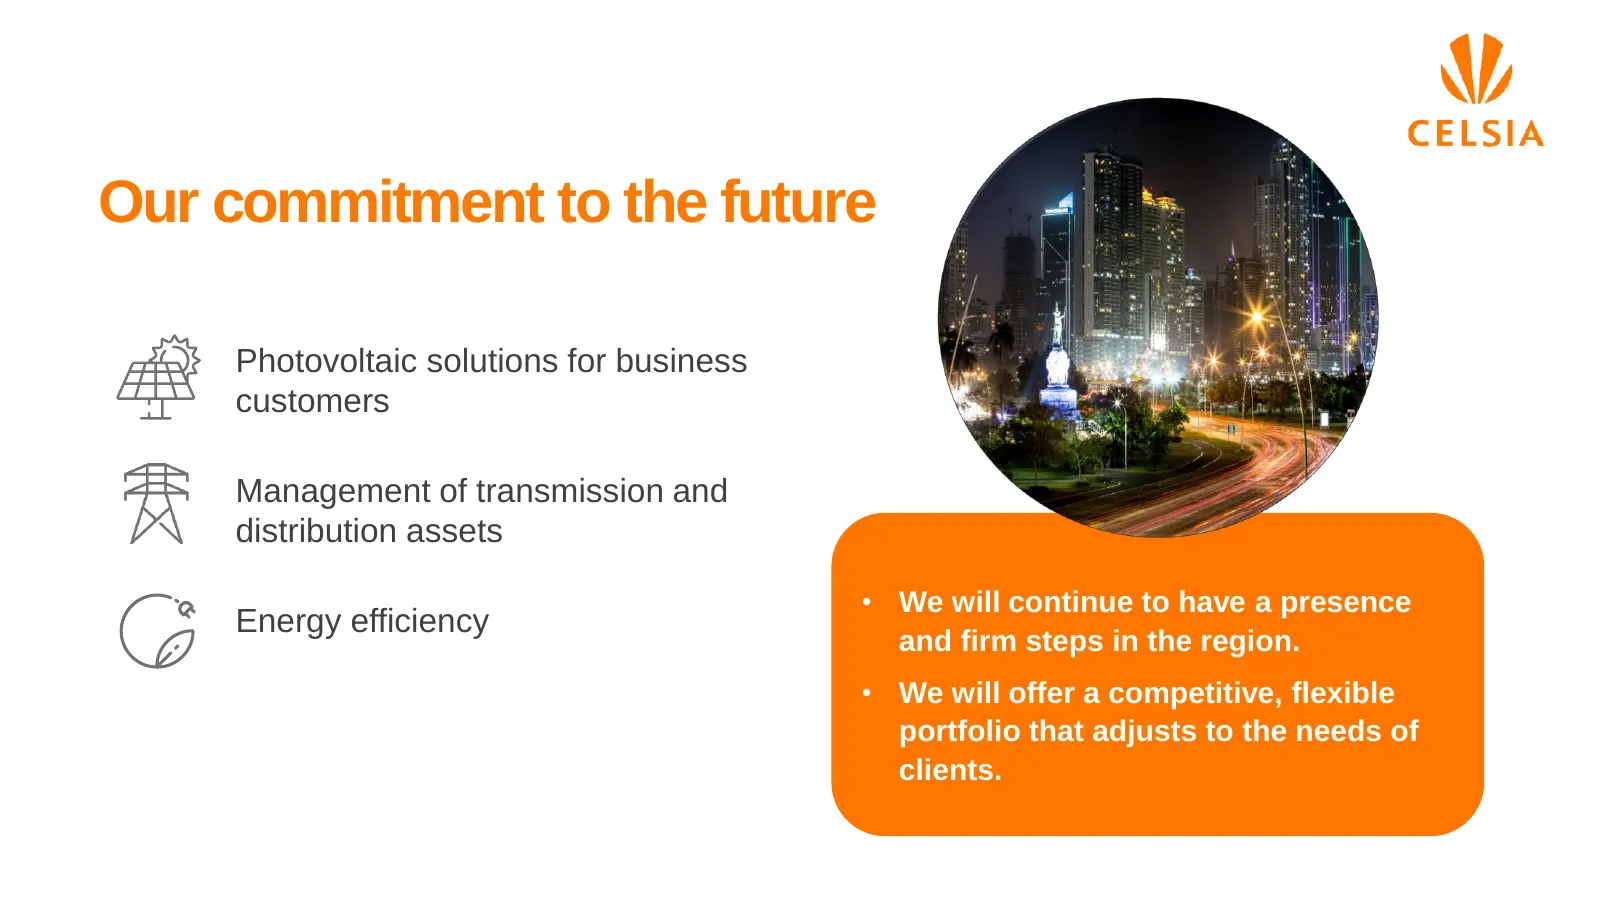
Our commitment to the future Photovoltaic solutions for business customers Management of transmission and distribution assets • We will continue to have a presence Energy efficiency and firm steps in the region. • We will offer a competitive, flexible portfolio that adjusts to the needs of clients.

Slide 10: Use of funds: Shares buyback
Use of funds Shares buyback We are advancing all the authorizations and procedures with the BVC.
Slide 11: EBITDA and Net earnings
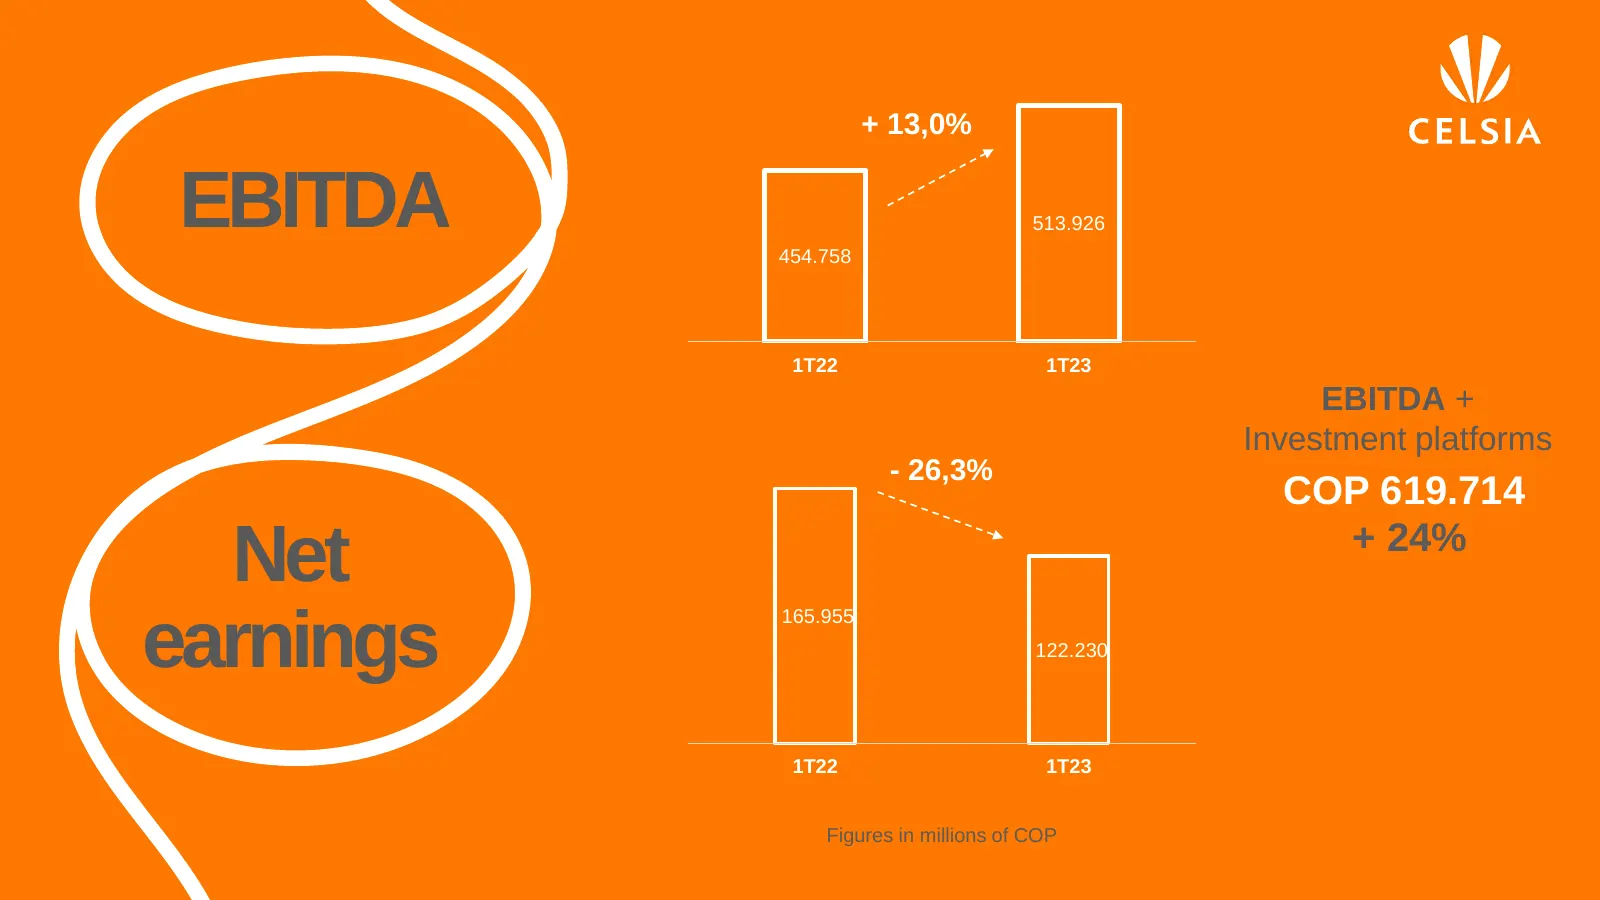
+ 13,0% EBITDA 454.758 513.926 1T22 1T23 EBITDA + Investment platforms - 26,3% COP 619.714 + 24% Net 165.955 earnings 122.230 1T22 1T23 Figures in millions of COP
Slide 12: Investment platforms
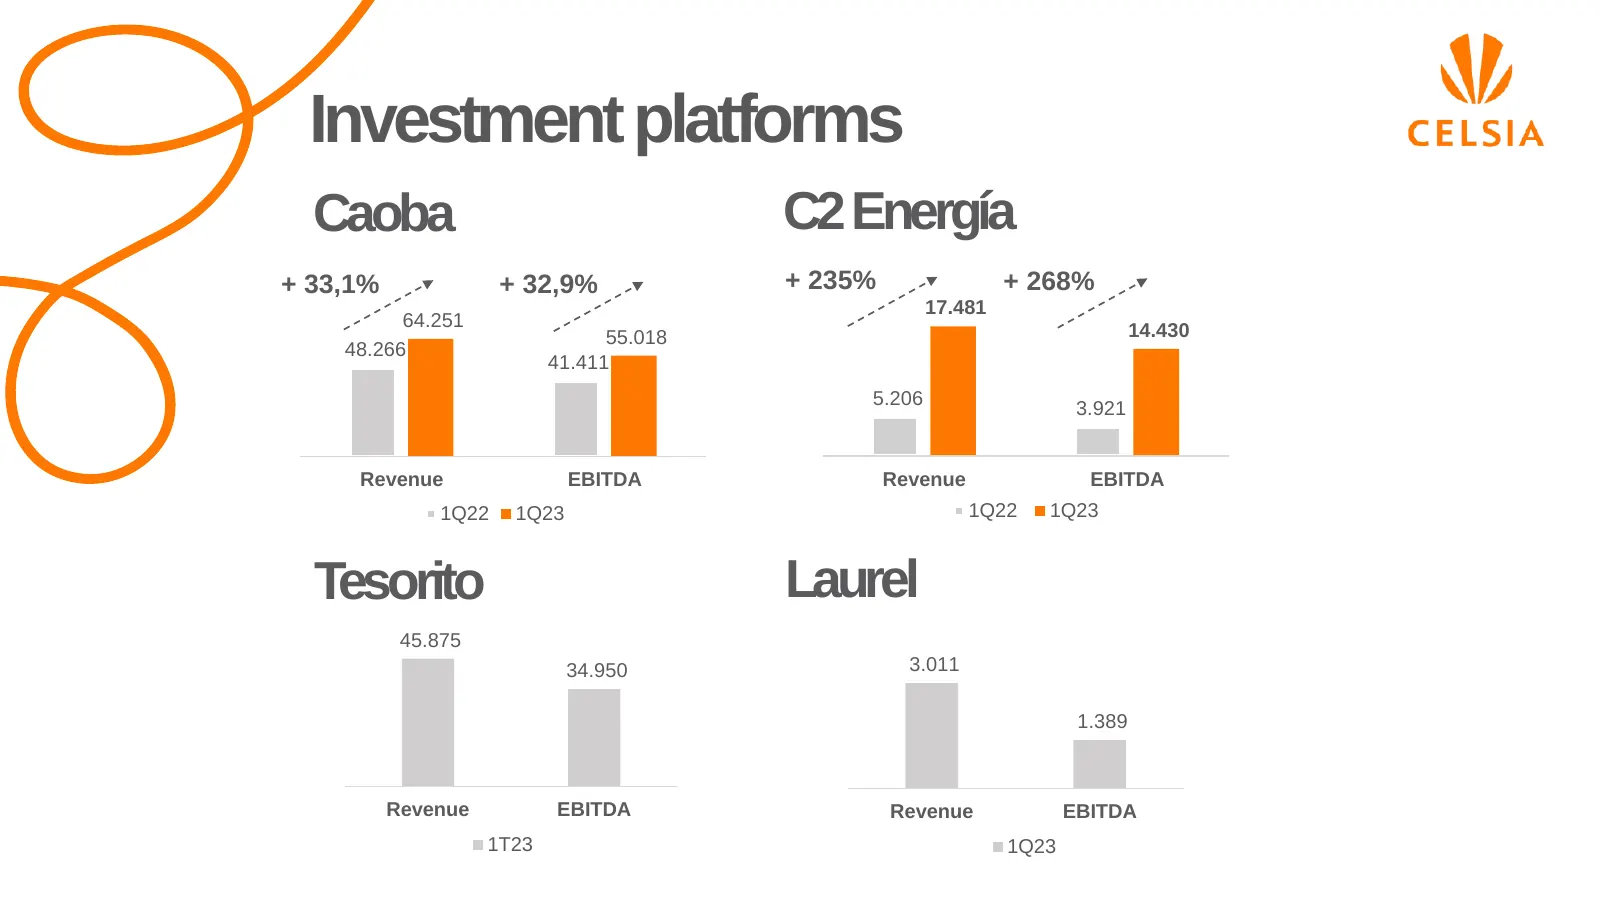
Investment platforms Caoba C2 Energía + 33,1% + 32,9% + 235% + 268% 17.481 64.251 55.018 14.430 48.266 41.411 5.206 3.921 Revenue EBITDA Revenue EBITDA 1Q22 1Q23 1Q22 1Q23 Tesorito Laurel 45.875 34.950 3.011 1.389 Revenue EBITDA Revenue EBITDA 1T23 1Q23 Cifras en millones de COP
Slide 13: Financial results
Financial results
Slide 14: Revenue
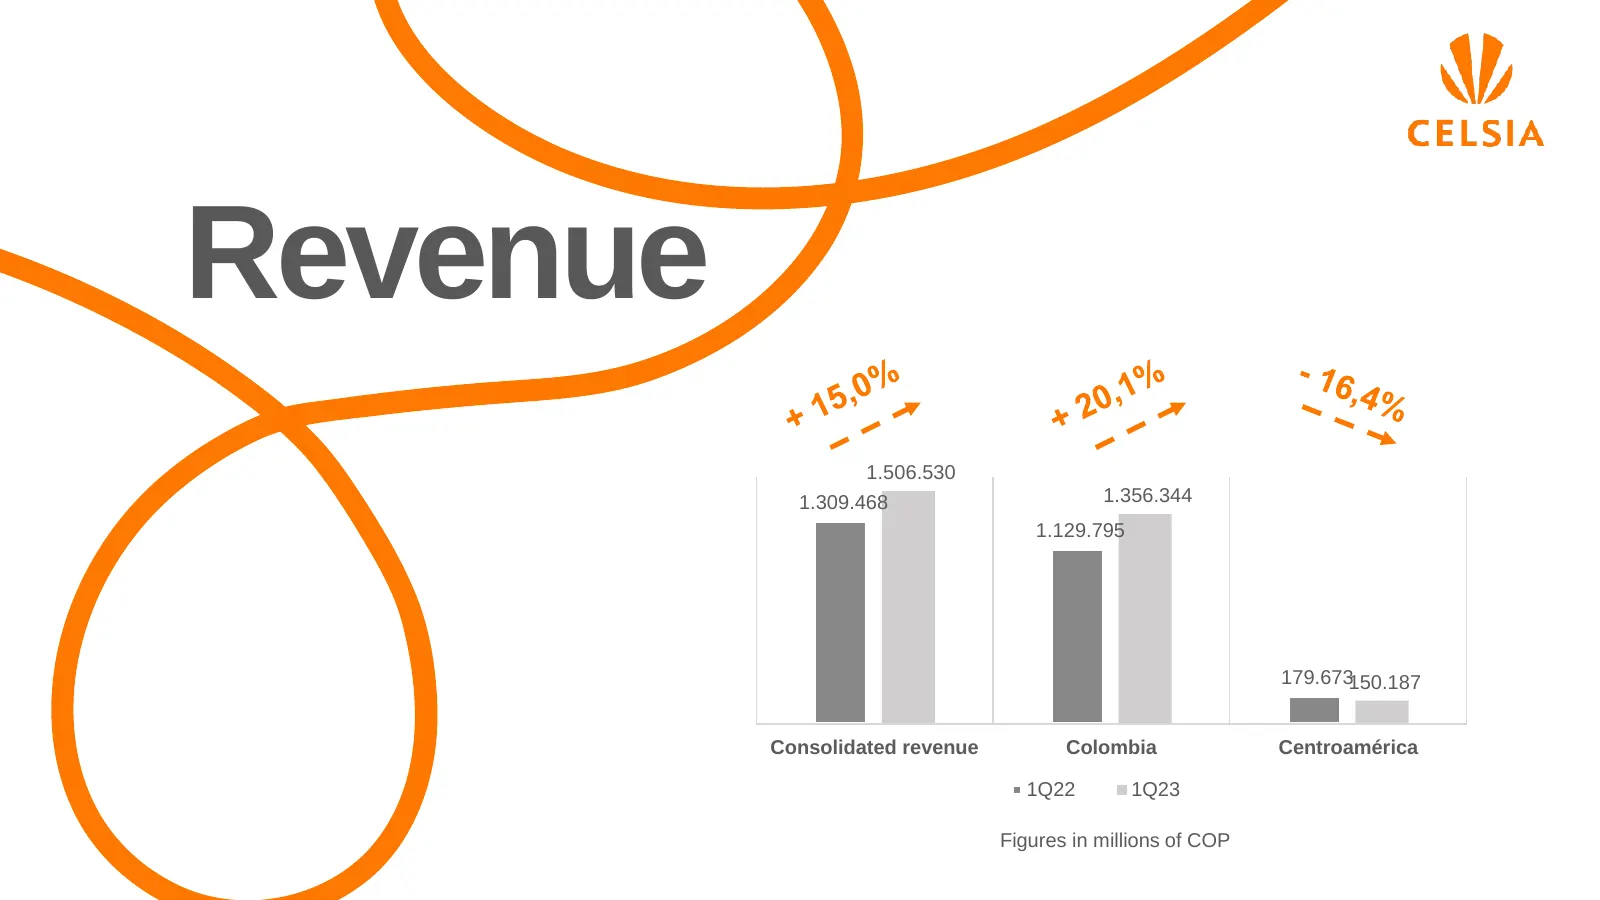
Revenue 1.506.530 1.309.468 1.356.344 1.129.795 179.673150.187 Consolidated revenue Colombia Centroamérica 1Q22 1Q23 Figures in millions of COP
Slide 15: Ebitda
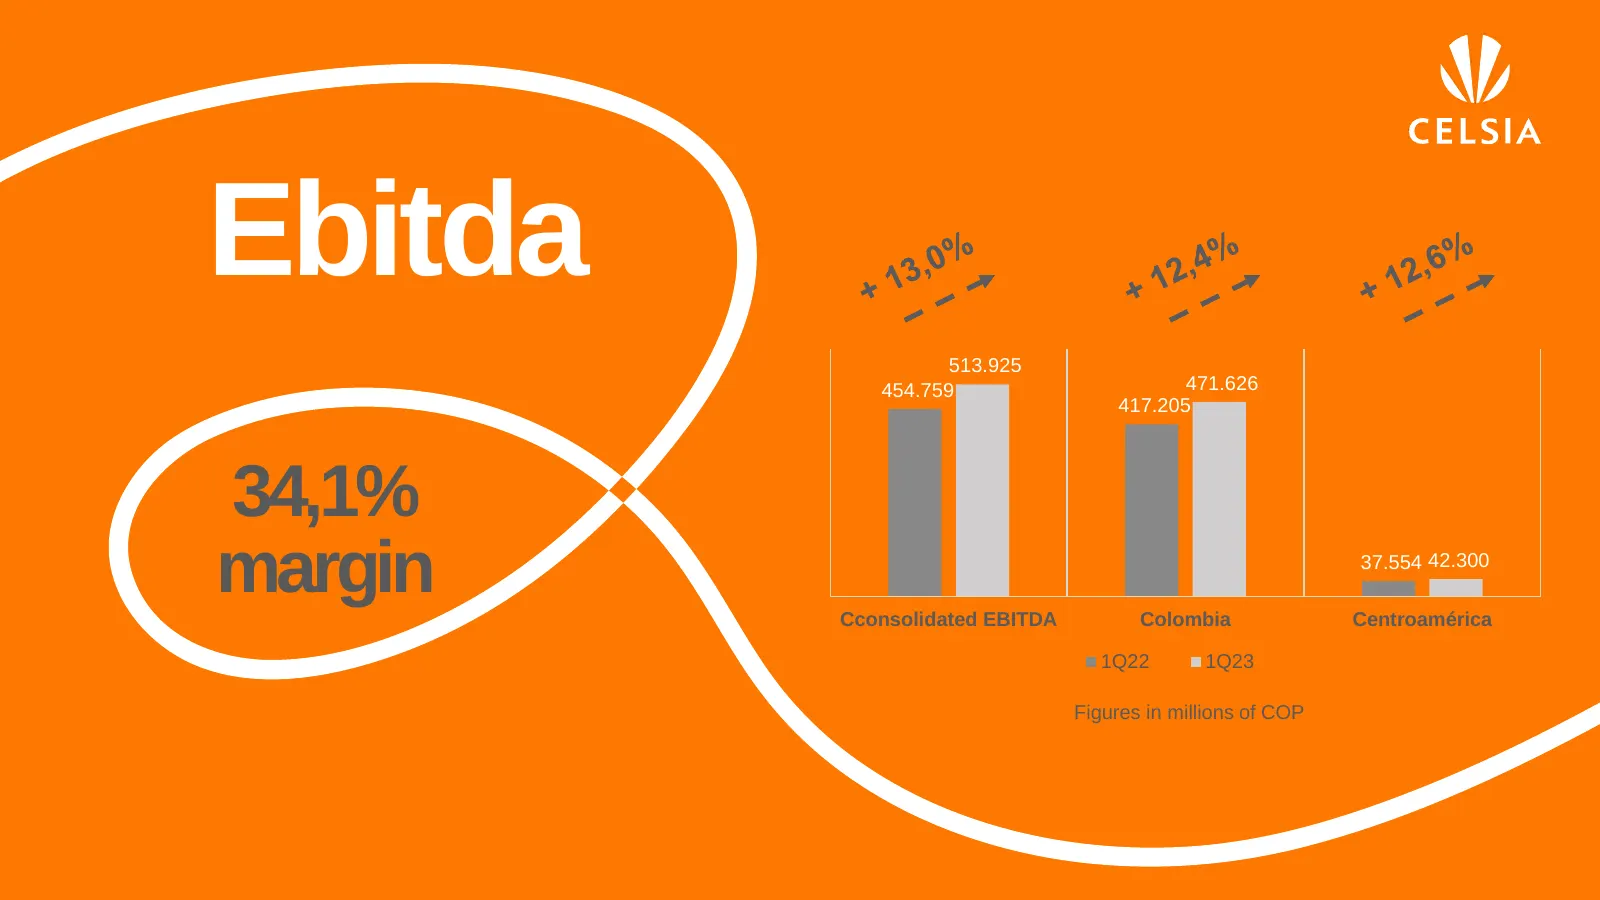
Ebitda 513.925 454.759 471.626 417.205 34,1% margin Cconsolidated EBITDA Colombia 37.554 42.300 Centroamérica 1Q22 1Q23 Figures in millions of COP
Slide 16: Financial costs
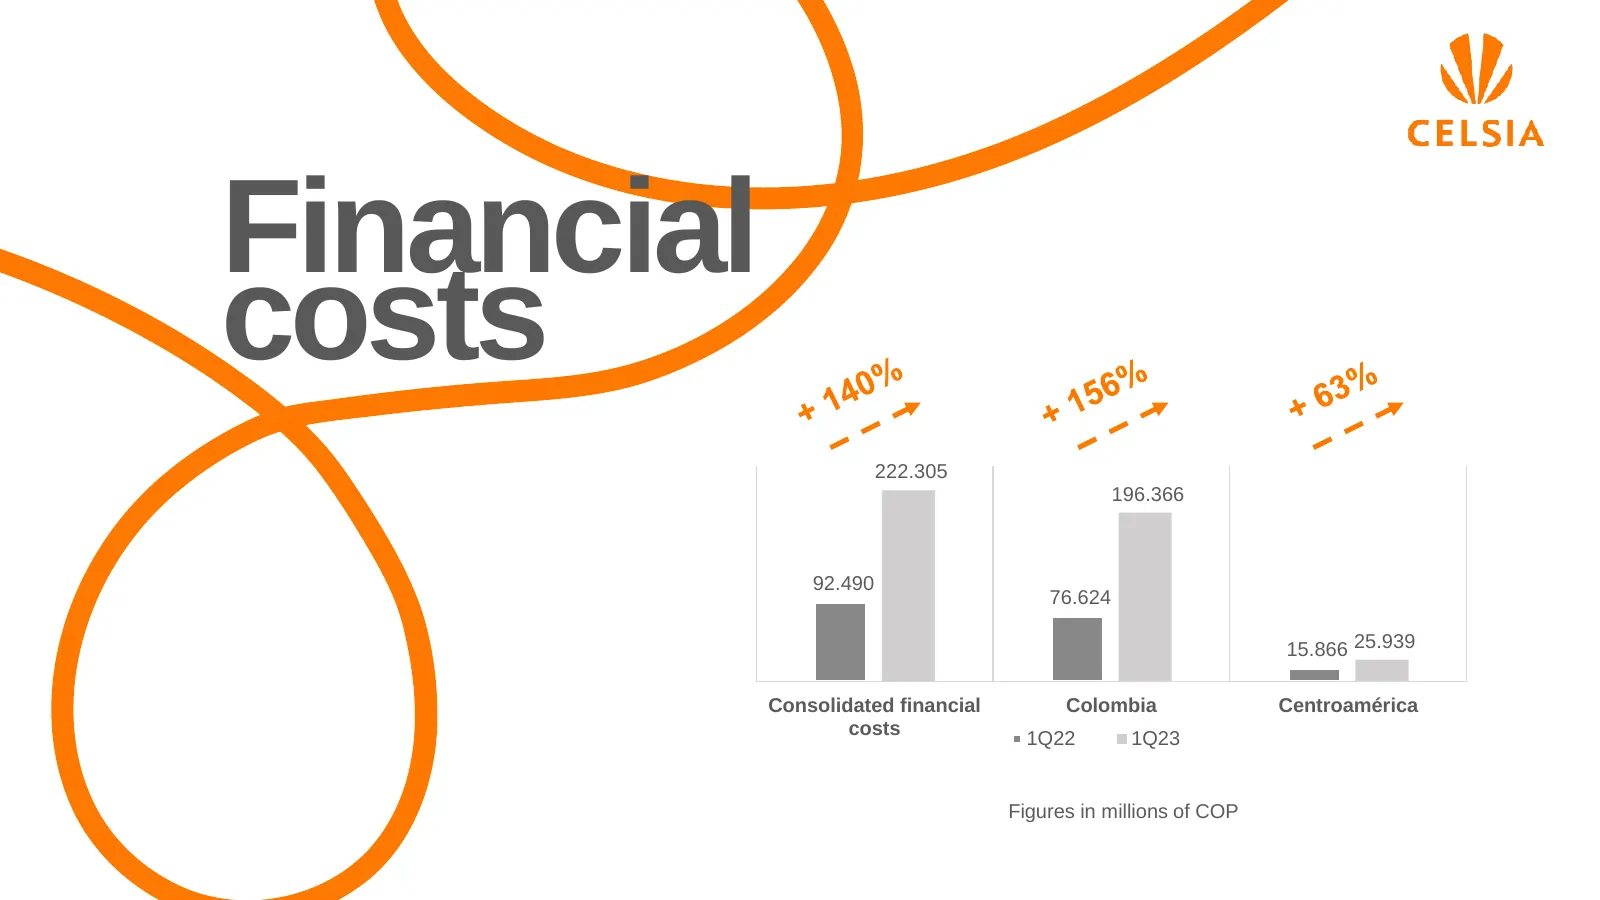
Financial costs 222.305 196.366 92.490 76.624 15.866 25.939 Consolidated financial Colombia Centroamérica costs 1Q22 1Q23 Figures in millions of COP
Slide 17: Net earnings
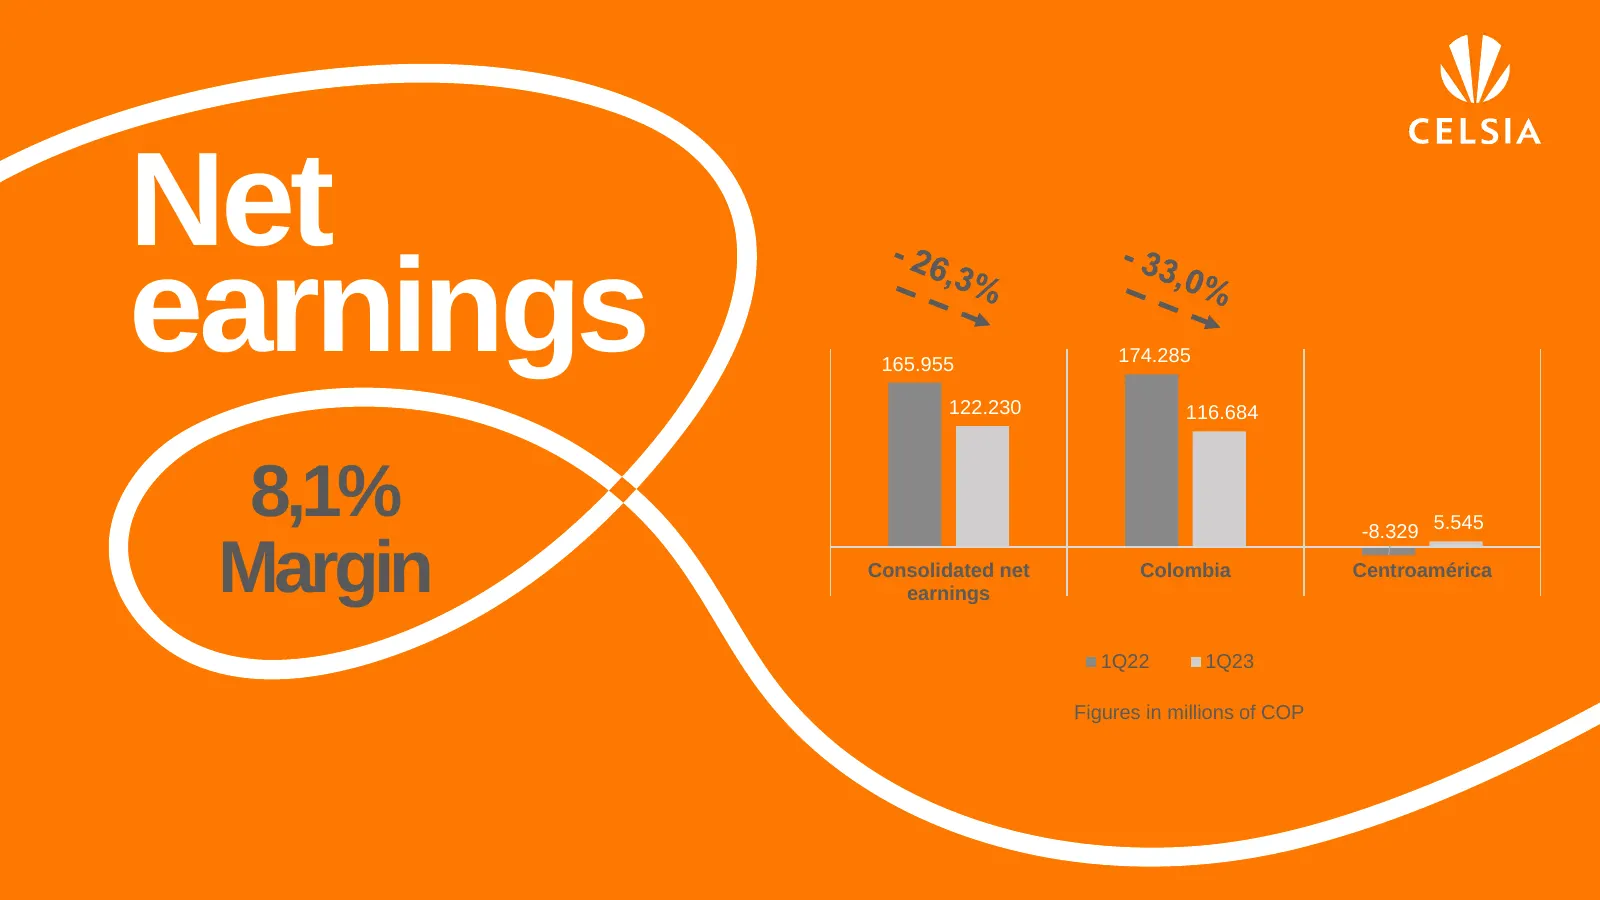
Net earnings 165.955 122.230 174.285 116.684 8,1% -8.329 5.545 Margin Consolidated net earnings Colombia Centroamérica 1Q22 1Q23 Figures in millions of COP
Slide 18: Debt
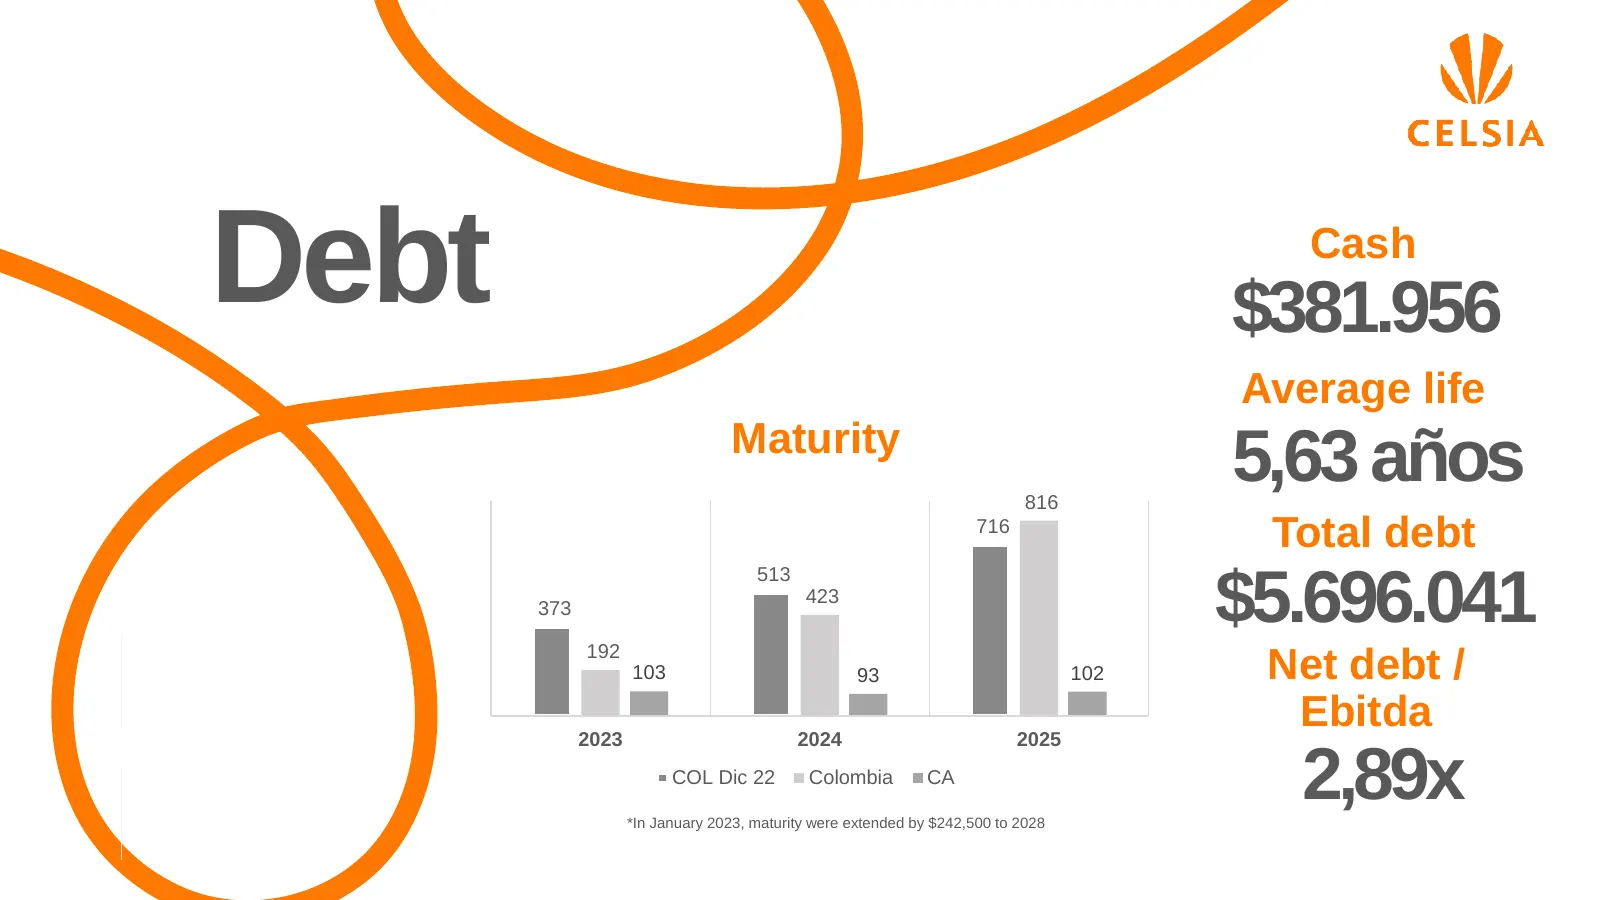
Debt Cash $381.956 Average life Maturity 816 5,63 años 716 Total debt 513 373 192 423 $5.696.041 103 93 102 Net debt / 2023 2024 2025 Ebitda COL Dic 22 Colombia CA *In January 2023, maturity were extended by $242,500 to 2028 2,89x

Slide 19: Celsia
W CELSIA
Source: Internet Archive copy of celsia.com
More decks from Celsia SA ESP
 Q3 2026 Earnings Presentation15 slides · November 2026
 Celsia — Investor Presentation (June 2026)26 slides · June 2026
 Celsia — Investor Presentation (June 2026)26 slides · June 2026
 Q4 2025 Earnings Presentation28 slides · February 2026
 Q2 2026 Earnings Presentation16 slides · 2026
 Investor Day (October 2025)46 slides · October 2025