Guaranty Bancorp — FIG Partners 8th Annual Bank CEO Forum (September 2012)
27 slides from Guaranty Bancorp's conference presentation, Sep 19, 2012

Slide 1: FIG Partners 8th Annual Bank CEO Forum
FIG Partners 8th Annual Bank CEO Forum Atlanta, Georgia September 20, 2012
Slide 2: Forward Looking Statements
Forward Looking Statements 2 This presentation contains forward-looking statements, which are included in accordance with the “safe harbor” provisions of the Private Securities Litigation Reform Act of 1995. In some cases, you can identify forward-looking statements by terminology such as “may,” “wi
Slide 3: Company Highlights
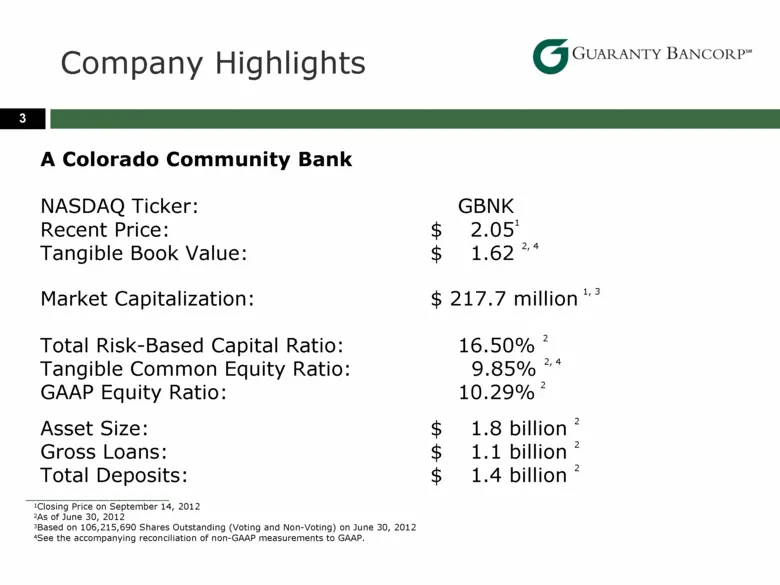
Company Highlights 3 A Colorado Community Bank NASDAQ Ticker: GBNK Recent Price: $ 2.051 Tangible Book Value: $ 1.62 2, 4 Market Capitalization: $ 217.7 million 1, 3 Total Risk-Based Capital Ratio: 16.50% 2 Tangible Common Equity Ratio: 9.85% 2, 4 GAAP Equity Ratio: 10.29% 2 1Closing Price on Septem
Slide 4: About Us
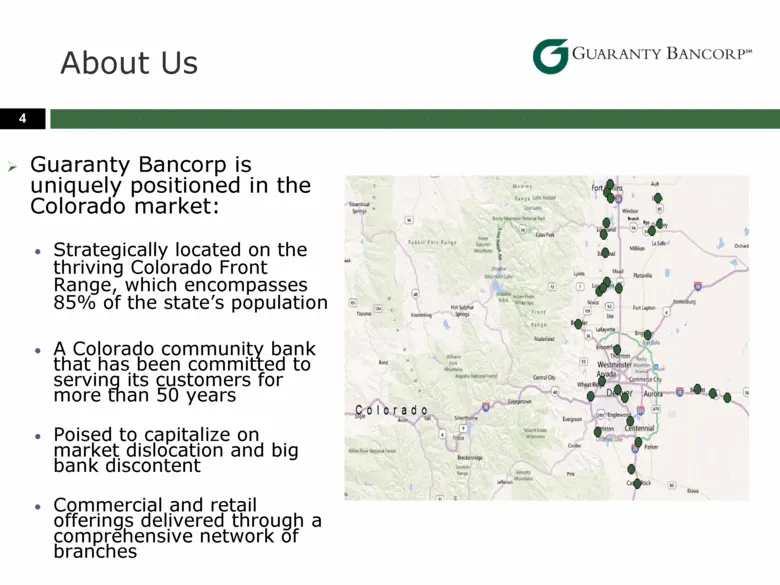
4 Guaranty Bancorp is uniquely positioned in the Colorado market: Strategically located on the thriving Colorado Front Range, which encompasses 85% of the state’s population A Colorado community bank that has been committed to serving its customers for more than 50 years Poised to capitalize on mark
Slide 5: Investment Considerations
Investment Considerations 5 Earnings Momentum Six consecutive quarters of incremental growth in core earnings Net interest income continues to grow as a result of an increased level of earning assets coupled with declining interest expense Continued Asset Quality Improvement Classified assets decrea
Slide 6: Investment Considerations
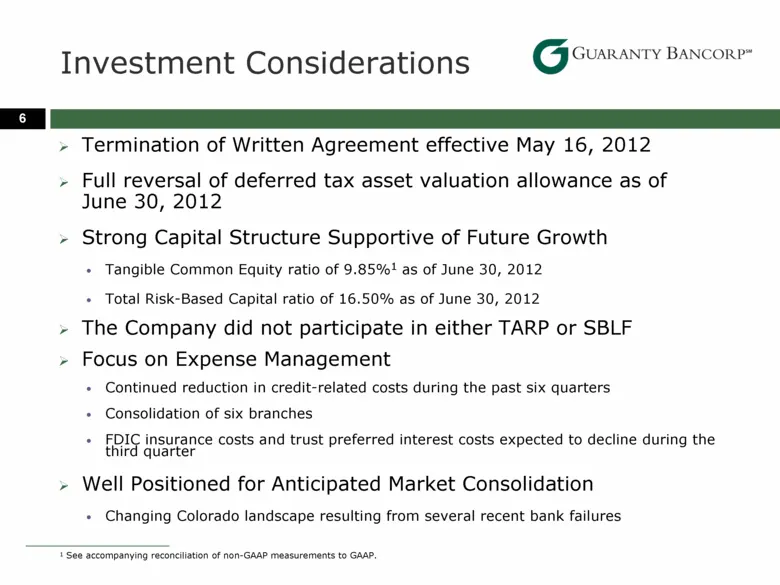
Investment Considerations 6 Termination of Written Agreement effective May 16, 2012 Full reversal of deferred tax asset valuation allowance as of June 30, 2012 Strong Capital Structure Supportive of Future Growth Tangible Common Equity ratio of 9.85%1 as of June 30, 2012 Total Risk-Based Capital rat
Slide 7: Private Capital Management Acquisition
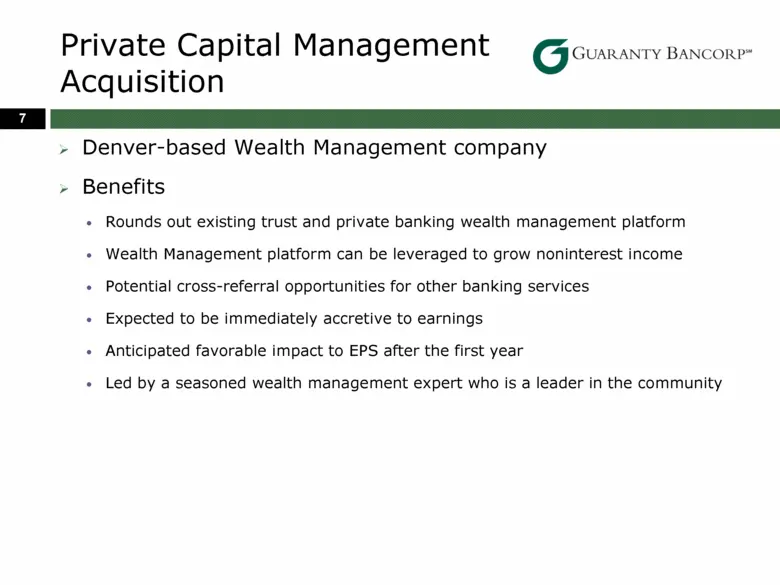
Private Capital Management Acquisition 7 Denver-based Wealth Management company Benefits Rounds out existing trust and private banking wealth management platform Wealth Management platform can be leveraged to grow noninterest income Potential cross-referral opportunities for other banking services E
Slide 8: June 30, 2012 Deposit Composition
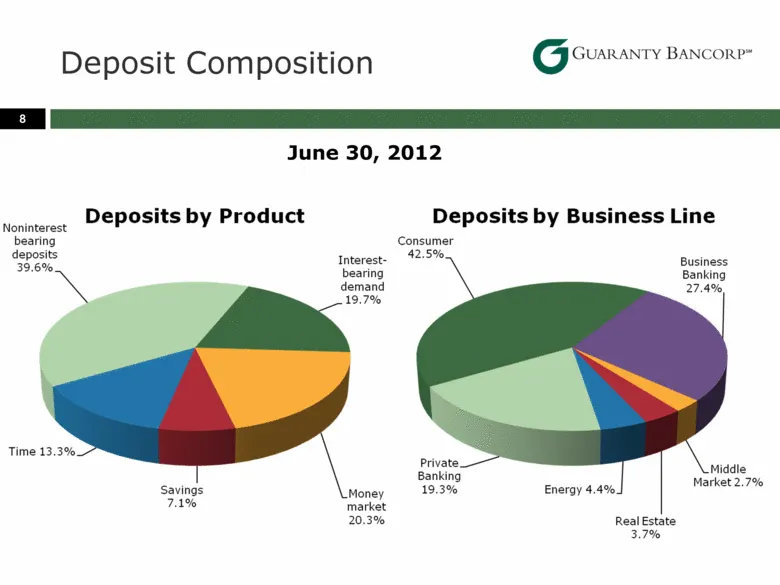
8 June 30, 2012 Deposit Composition Deposits by Product Deposits by Business Line
Slide 9: Deposit Trends
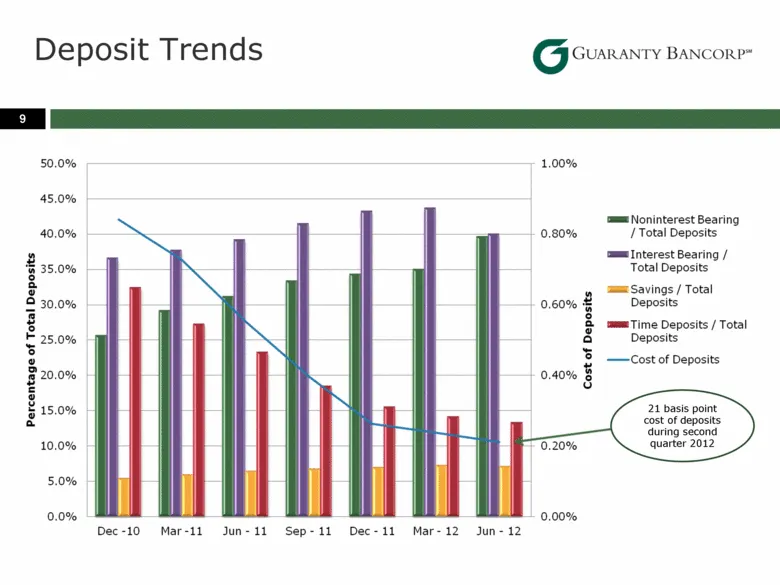
9 Deposit Trends 21 basis point cost of deposits during second quarter 2012 Noninterest Bearing / Total Deposits Interest Bearing / Total Deposits Savings / Total Deposits TimeDeposits /Total Deposits Cost of Deposits 21 basis point cost of deposits during second quarter 2012
Slide 10: Loan Composition
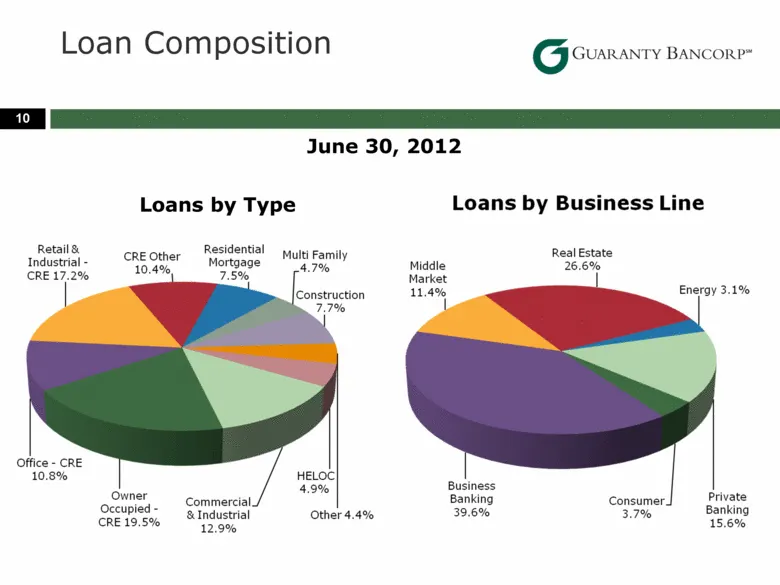
10 Loan Composition June 30, 2012 Loans by Type Loans by Type Loans by Business Line
Slide 11: Positive CRE Loan Trend
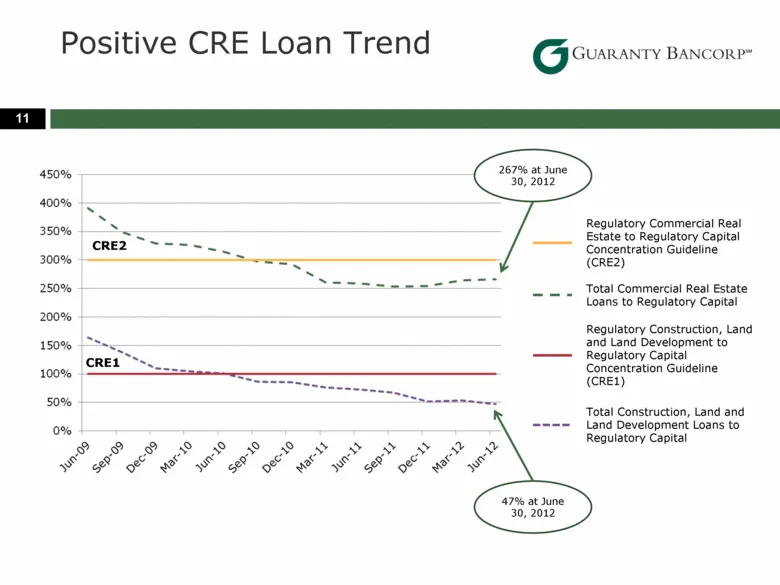
11 Positive CRE Loan Trend CRE2 CRE1 267% at June 30, 2012 47% at June 30, 2012 Regulatory Commercial Real Estate to Regulatory Capital Concentration Guideline (CRE2) Total Commercial Real Estate Loans to Regulatory Capital Regulatory Construction, Land and Land Development to Regulatory Capital Con
Slide 12: Loan Portfolio Activity
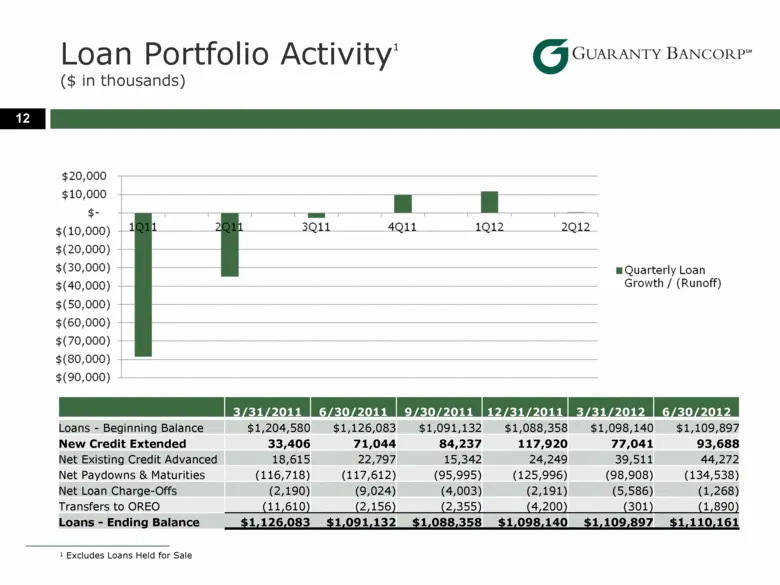
Loan Portfolio Activity1 ($ in thousands) 12 1 Excludes Loans Held for Sale 3/31/2011 6/30/2011 9/30/2011 12/31/2011 3/31/2012 6/30/2012 Loans - Beginning Balance $1,204,580 $1,126,083 $1,091,132 $1,088,358 $1,098,140 $1,109,897 New Credit Extended 33,406 71,044 84,237 117,920 77,041 93,688 Net Exis
Slide 13: Classified Assets / Tier 1 Capital & Allowance
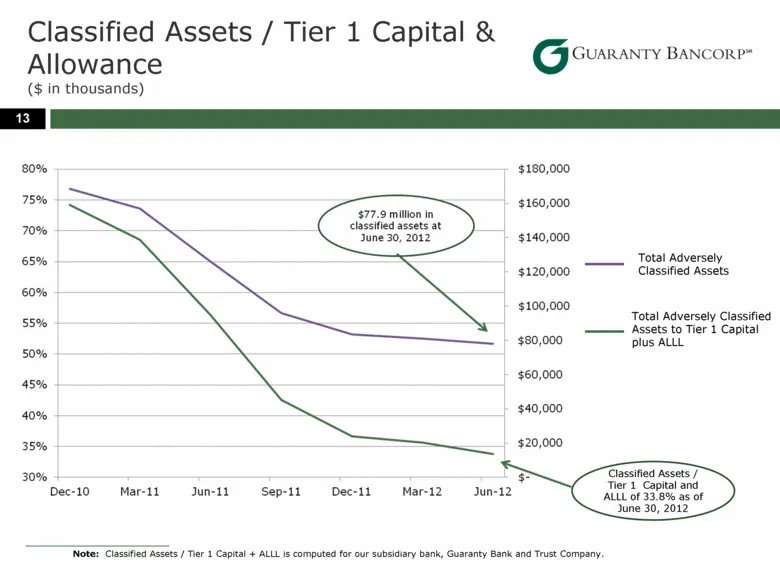
Classified Assets / Tier 1 Capital & Allowance ($ in thousands) 13 Note: Classified Assets / Tier 1 Capital + ALLL is computed for our subsidiary bank, Guaranty Bank and Trust Company. Classified Assets / Tier 1 Capital and ALLL of 33.8% as of June 30, 2012 Total Adversely Classified Assets Total Ad
Slide 14: Strong Capital Ratios
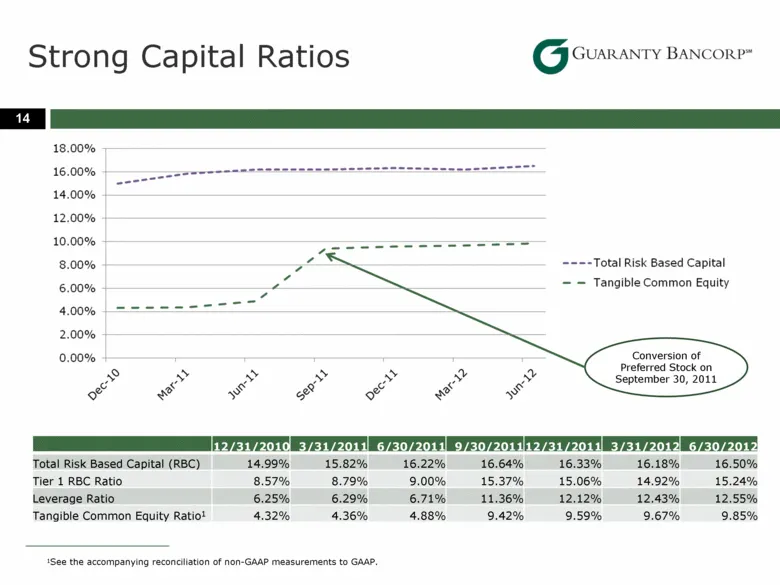
Strong Capital Ratios 14 12/31/2010 3/31/2011 6/30/2011 9/30/2011 12/31/2011 3/31/2012 6/30/2012 Total Risk Based Capital (RBC) 14.99% 15.82% 16.22% 16.64% 16.33% 16.18% 16.50% Tier 1 RBC Ratio 8.57% 8.79% 9.00% 15.37% 15.06% 14.92% 15.24% Leverage Ratio 6.25% 6.29% 6.71% 11.36% 12.12% 12.43% 12.55%
Slide 15: Income Statement and Balance Sheet Trends
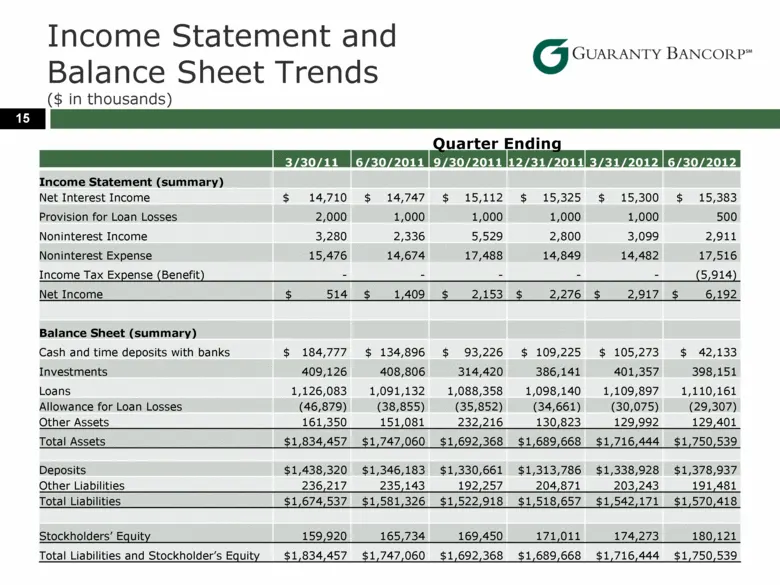
Income Statement and Balance Sheet Trends ($ in thousands) 15 3/30/11 6/30/2011 9/30/2011 12/31/2011 3/31/2012 6/30/2012 Income Statement (summary) Net Interest Income $ 14,710 $ 14,747 $ 15,112 $ 15,325 $ 15,300 $ 15,383 Provision for Loan Losses 2,000 1,000 1,000 1,000 1,000 500 Noninterest Income
Slide 16: Net Interest Margin Trend
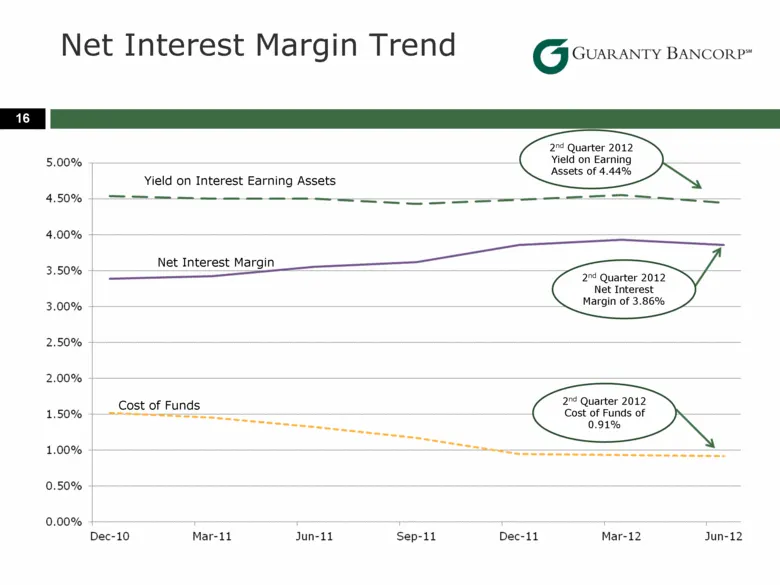
Net Interest Margin Trend 16 Net Interest Margin Cost of Funds Yield on Interest Earning Assets 2nd Quarter 2012 Net Interest Margin of 3.86% 2nd Quarter 2012 Cost of Funds of 0.91% 2nd Quarter 2012 Yield on Earning Assets of 4.44%
Slide 17: Core Operating Income
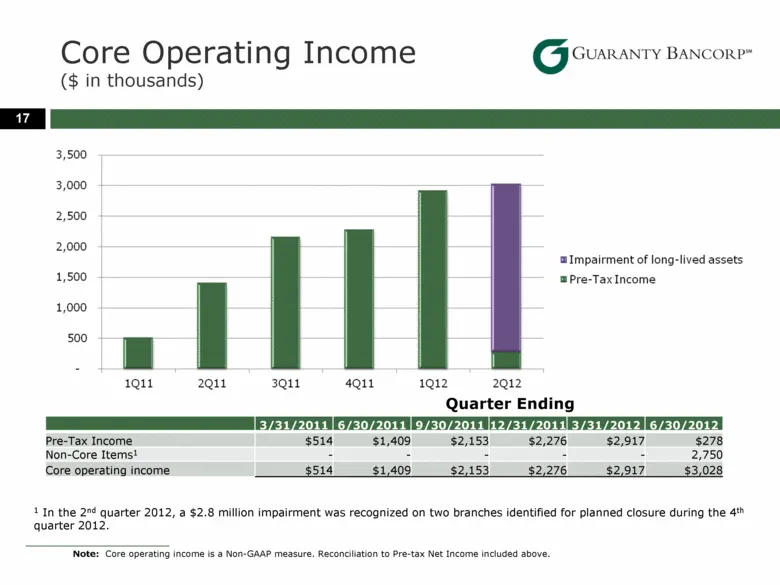
Core Operating Income ($ in thousands) 17 3/31/2011 6/30/2011 9/30/2011 12/31/2011 3/31/2012 6/30/2012 Pre-Tax Income $514 $1,409 $2,153 $2,276 $2,917 $278 Non-Core Items1 - - - - - 2,750 Core operating income $514 $1,409 $2,153 $2,276 $2,917 $3,028 Quarter Ending Note: Core operating income is a No
Slide 18: Noninterest Expense
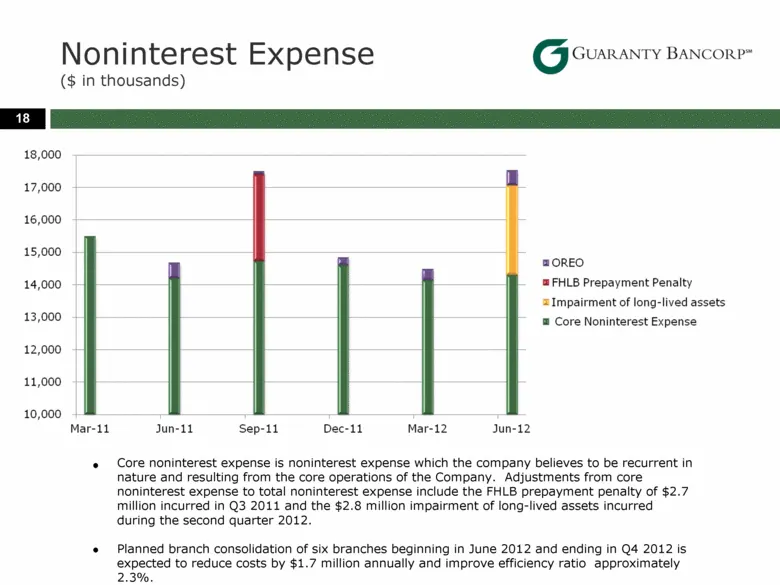
Noninterest Expense ($ in thousands) 18 Core noninterest expense is noninterest expense which the company believes to be recurrent in nature and resulting from the core operations of the Company. Adjustments from core noninterest expense to total noninterest expense include the FHLB prepayment penal
Slide 19: Colorado Market Opportunity
Colorado Market Opportunity 19
Slide 20: Our Marketplace Demographics
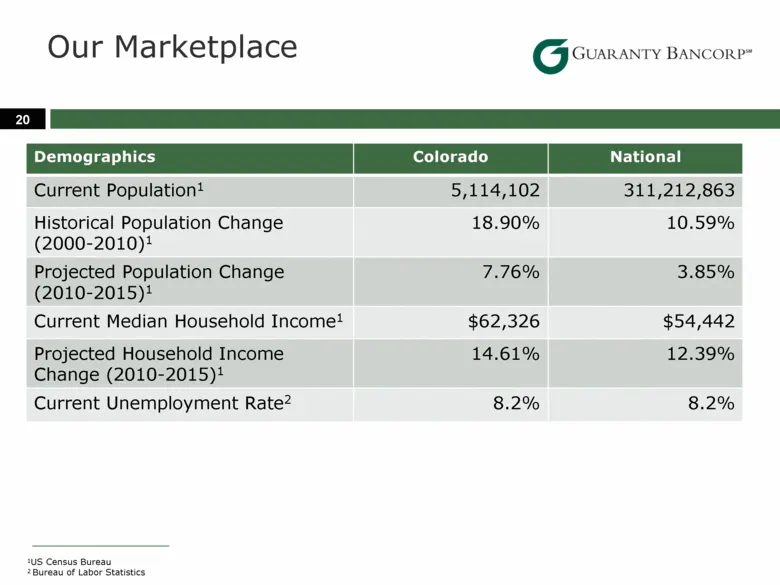
20 Our Marketplace Demographics Colorado National Current Population1 5,114,102 311,212,863 Historical Population Change (2000-2010)1 18.90% 10.59% Projected Population Change (2010-2015)1 7.76% 3.85% Current Median Household Income1 $62,326 $54,442 Projected Household Income Change (2010-2015)1 14.
Slide 21: Our Marketplace Business Climate
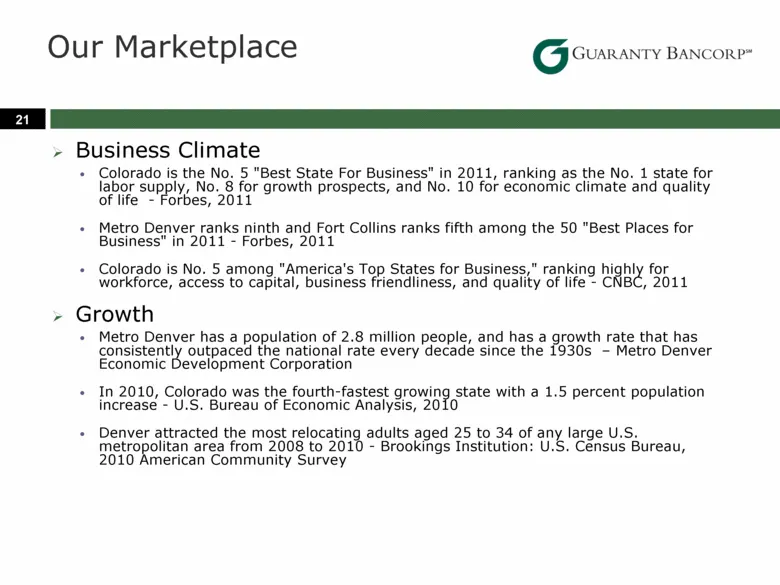
21 Our Marketplace Business Climate Colorado is the No. 5 "Best State For Business" in 2011, ranking as the No. 1 state for labor supply, No. 8 for growth prospects, and No. 10 for economic climate and quality of life - Forbes, 2011 Metro Denver ranks ninth and Fort Collins ranks fifth among the 50
Slide 22: Our Marketplace Economy
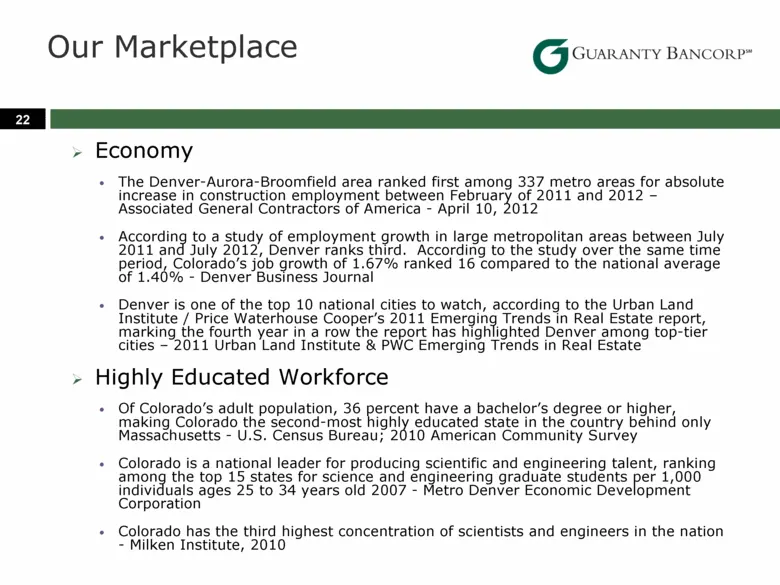
22 Our Marketplace Economy The Denver-Aurora-Broomfield area ranked first among 337 metro areas for absolute increase in construction employment between February of 2011 and 2012 – Associated General Contractors of America - April 10, 2012 According to a study of employment growth in large metropoli
Slide 23: Recent Major Relocations and Expansions
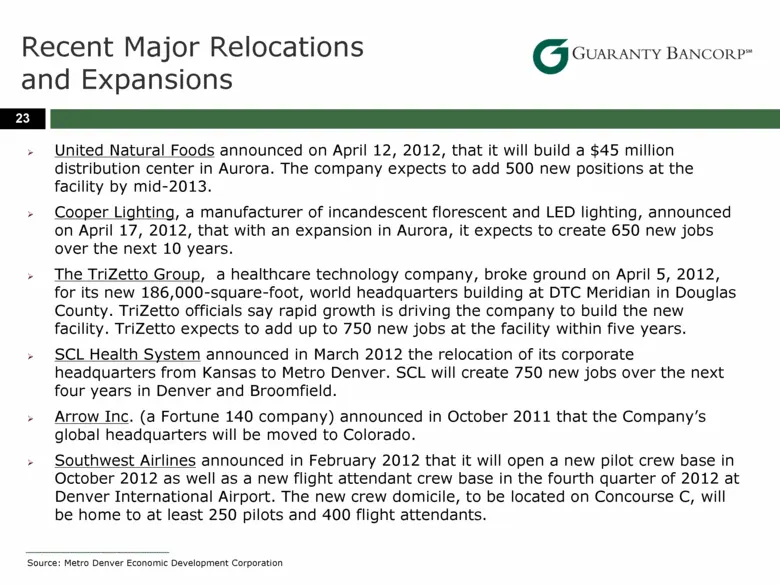
Recent Major Relocations and Expansions 23 United Natural Foods announced on April 12, 2012, that it will build a $45 million distribution center in Aurora. The company expects to add 500 new positions at the facility by mid-2013. Cooper Lighting, a manufacturer of incandescent florescent and LED li
Slide 24: Recent Major Relocations and Expansions
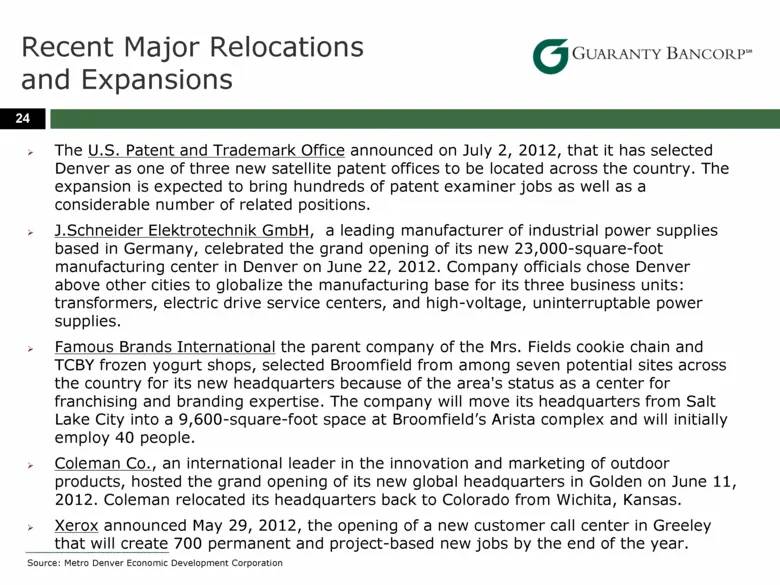
Recent Major Relocations and Expansions 24 The U.S. Patent and Trademark Office announced on July 2, 2012, that it has selected Denver as one of three new satellite patent offices to be located across the country. The expansion is expected to bring hundreds of patent examiner jobs as well as a consi
Slide 25: Colorado Bank Failures
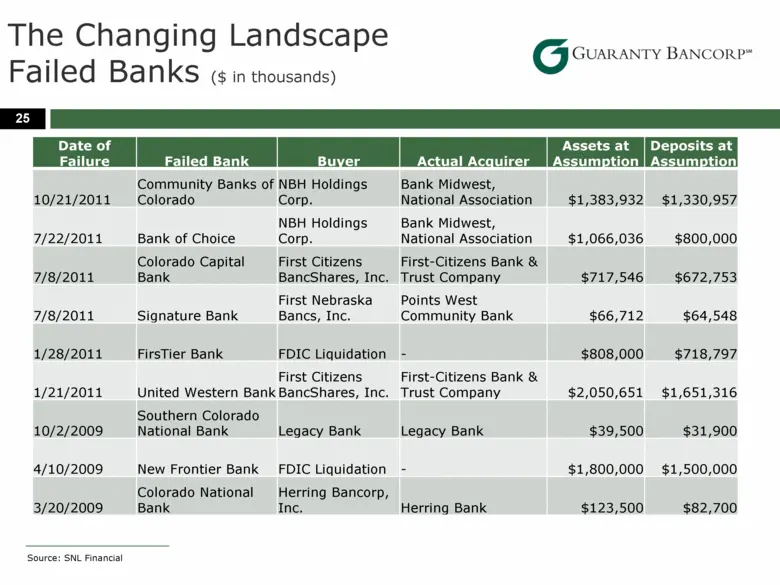
25 Date of Failure Failed Bank Buyer Actual Acquirer Assets at Assumption Deposits at Assumption 10/21/2011 Community Banks of Colorado NBH Holdings Corp. Bank Midwest, National Association $1,383,932 $1,330,957 7/22/2011 Bank of Choice NBH Holdings Corp. Bank Midwest, National Association $1,066,03
Slide 26: Reconciliations of Non-GAAP Measures
26 Reconciliations of Non-GAAP Measures
Slide 27: Non-GAAP Measure Reconcilements
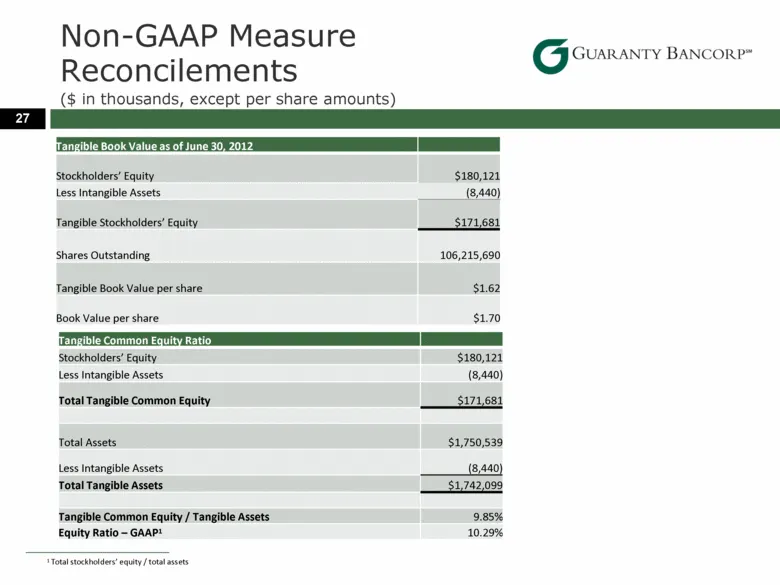
Non-GAAP Measure Reconcilements ($ in thousands, except per share amounts) 27 Tangible Book Value as of June 30, 2012 Stockholders’ Equity $180,121 Less Intangible Assets (8,440) Tangible Stockholders’ Equity $171,681 Shares Outstanding 106,215,690 Tangible Book Value per share $1.62 Book Value per
Source: SEC EDGAR · 8-K filed Sep 19, 2012
More decks from Guaranty Bancorp
 Merger or Acquisition (May 2018)19 slides · May 23, 2018
 Merger or Acquisition (July 2017)8 slides · Jul 19, 2017
 D.A. Davidson 19th Annual Financial Services Conference 201722 slides · May 9, 2017
 FIG Partners 8th Annual West Coast Bank CEO Forum 201727 slides · Jan 31, 2017
 2016 FBR 23rd Annual Investor Conference27 slides · Nov 28, 2016
 2016 KBW Community Bank Investor Conference26 slides · Aug 1, 2016