K+s AG · XETR:SDF
K+s — K+S Aktiengesellschaft — Non-Deal Roadshow (June 2014)
32 slides from K+s's roadshow presentation, Jun 26, 2014
Slide 1: Roadshow Stuttgart
K+S Aktiengesellschaft Roadshow Stuttgart 26 June 2014 Patrick Kofler, Senior IR Manager
Slide 2: Content
K+S Group Content A. K+S’ Unique Strategic Position 1. Potash and Magnesium Products 2. Salt B. Current Trading C. Outlook and Summary K+S Group 2
Slide 3: Focus on two strong pillars
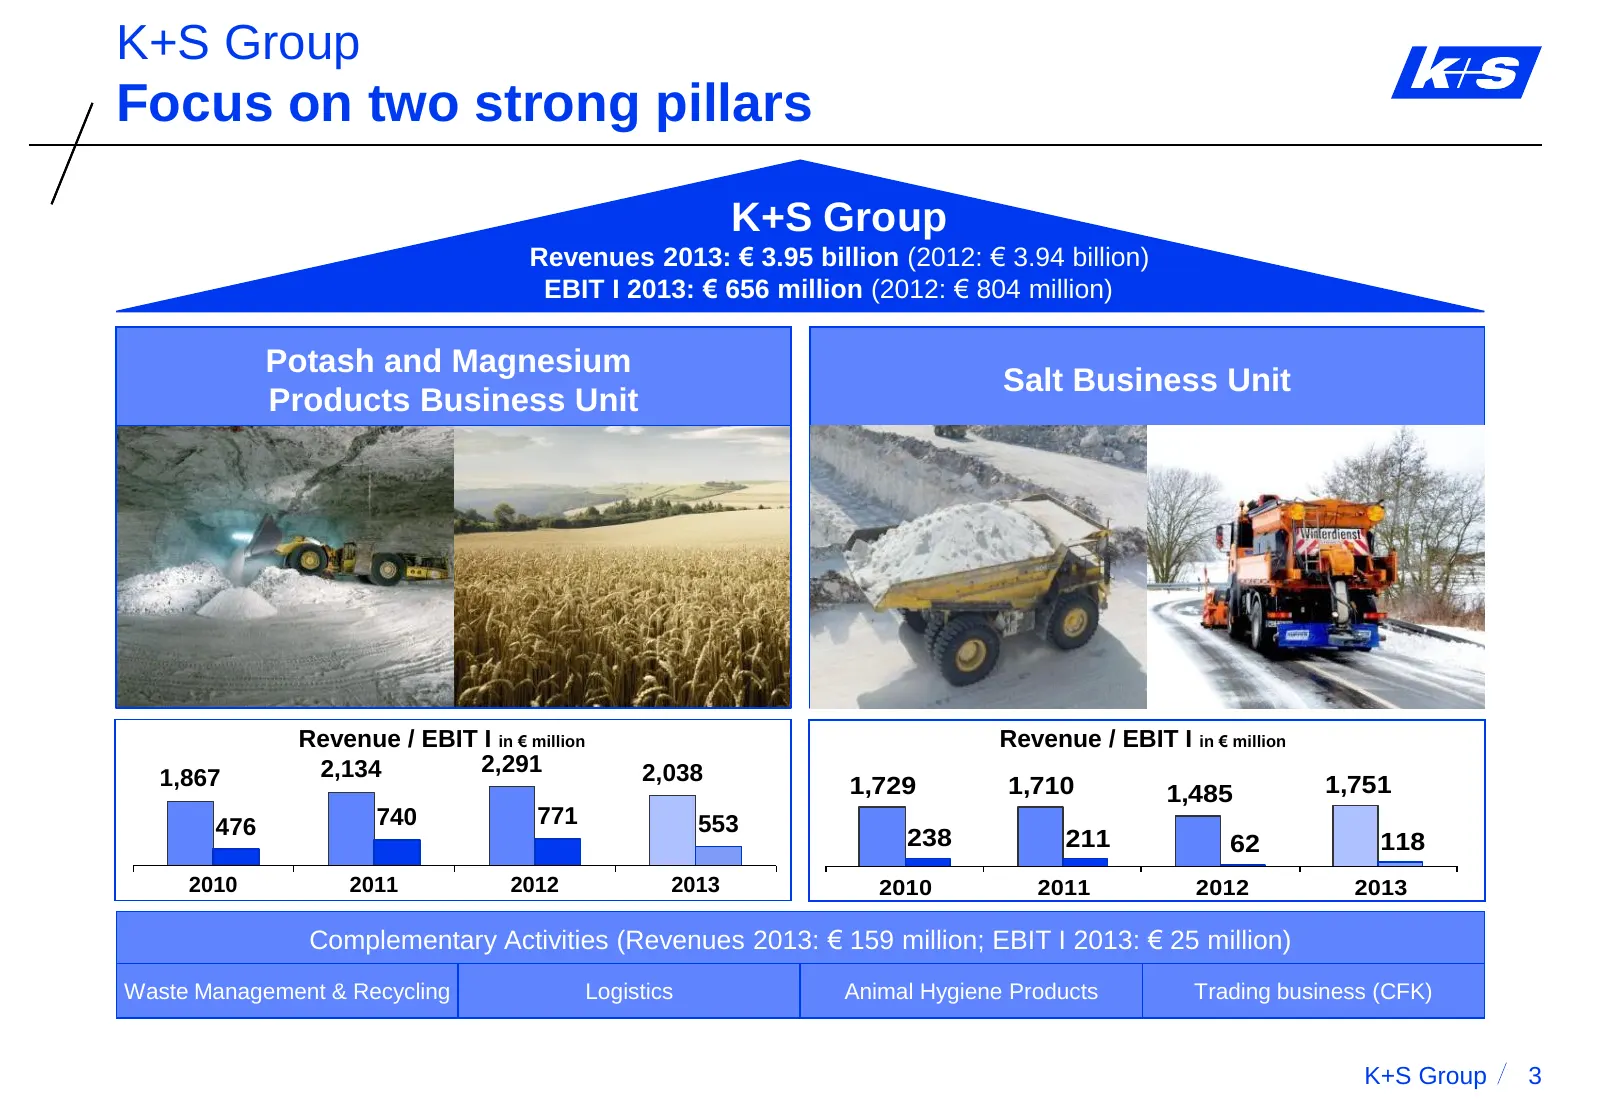
K+S Group Focus on two strong pillars K+S Group Revenues 2013: € 3.95 billion (2012: € 3.94 billion) EBIT I 2013: € 656 million (2012: € 804 million) Potash and Magnesium Salt Business Unit Products Business Unit Revenue / EBIT I in € million Revenue / EBIT I in € million 2,134 2,291 2,038 1,867 1,7
Slide 4: Broad range of applications for our products
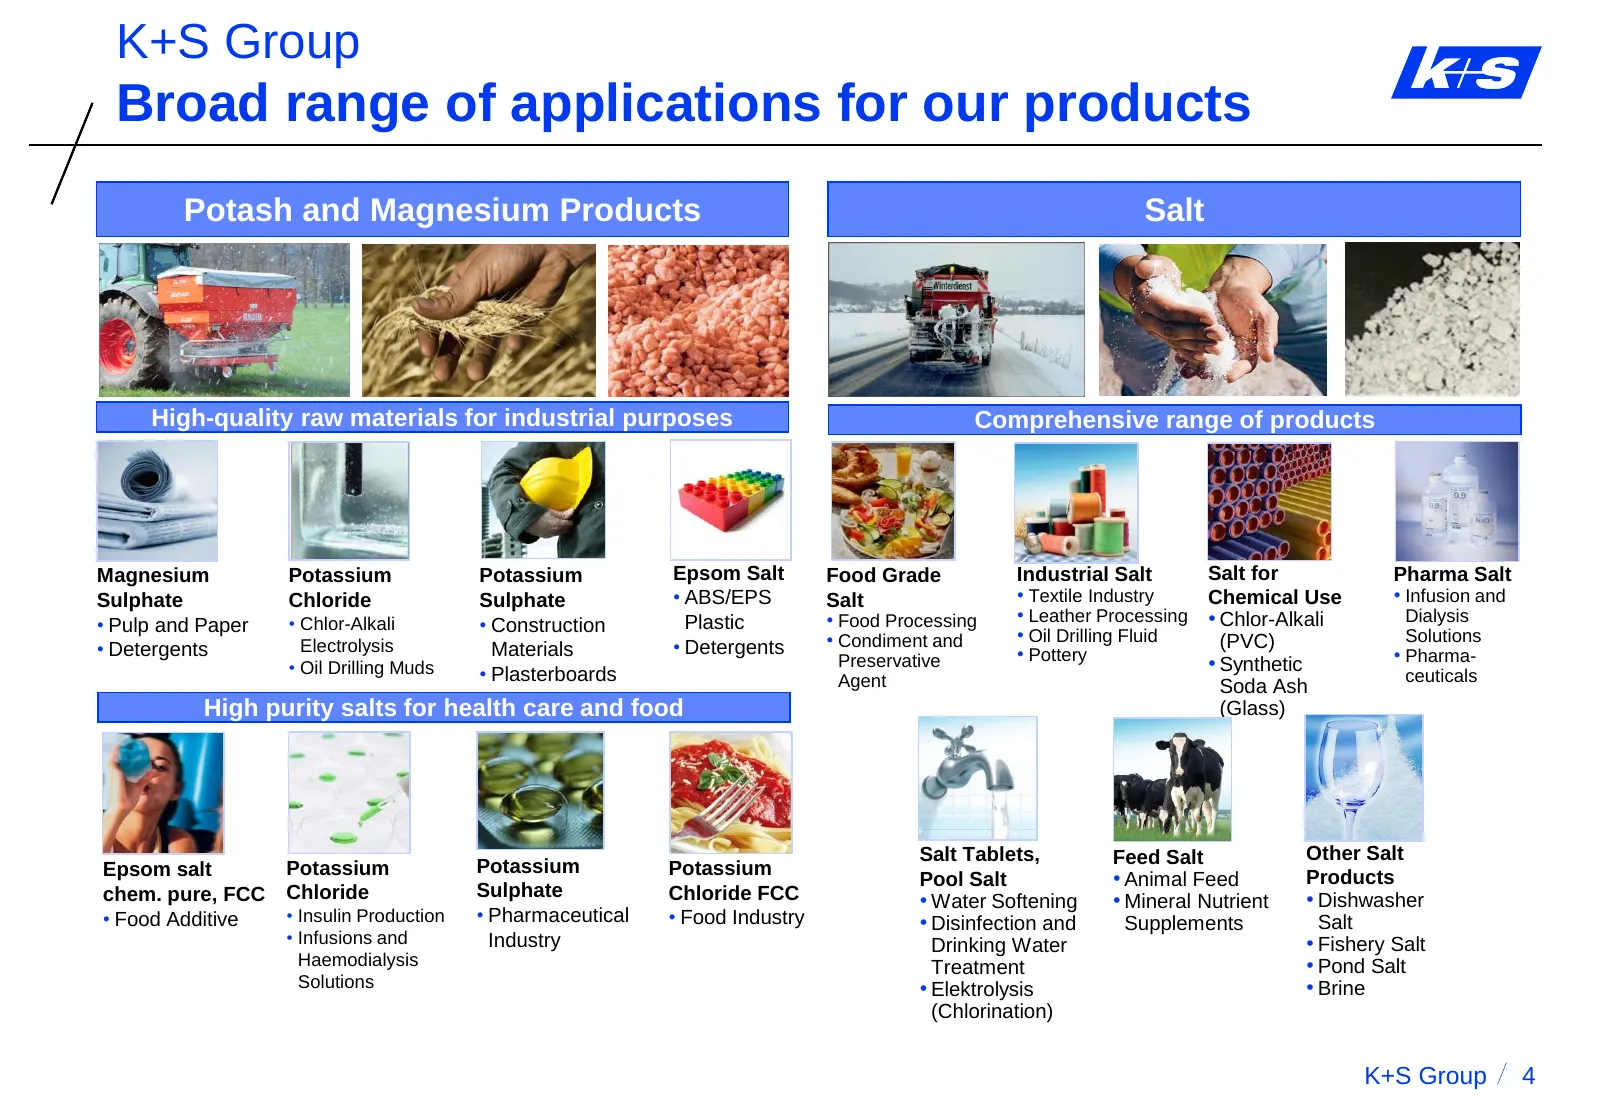
K+S Group Broad range of applications for our products Potash and Magnesium Products Salt High-quality raw materials for industrial purposes Comprehensive range of products Magnesium Potassium Potassium Epsom Salt Food Grade Industrial Salt Salt for Pharma Salt Sulphate Chloride Sulphate • ABS/EPS S
Slide 5: Content
K+S Group Content A. K+S’ Unique Strategic Position 1. Potash and Magnesium Products 2. Salt B. Current Trading C. Outlook and Summary K+S Group 5
Slide 6: Key drivers of the fertilizer business
Potash and Magnesium Products Key drivers of the fertilizer business Need for • Steadily increasing world population and growing meat consumption (e.g. increased 1 kg beef = 8 kg animal feed) global production of • Decreasing availability of arable farm land agricultural • Increasing importance of r
Slide 7: Significant downward revisions of capacity estimates in the past
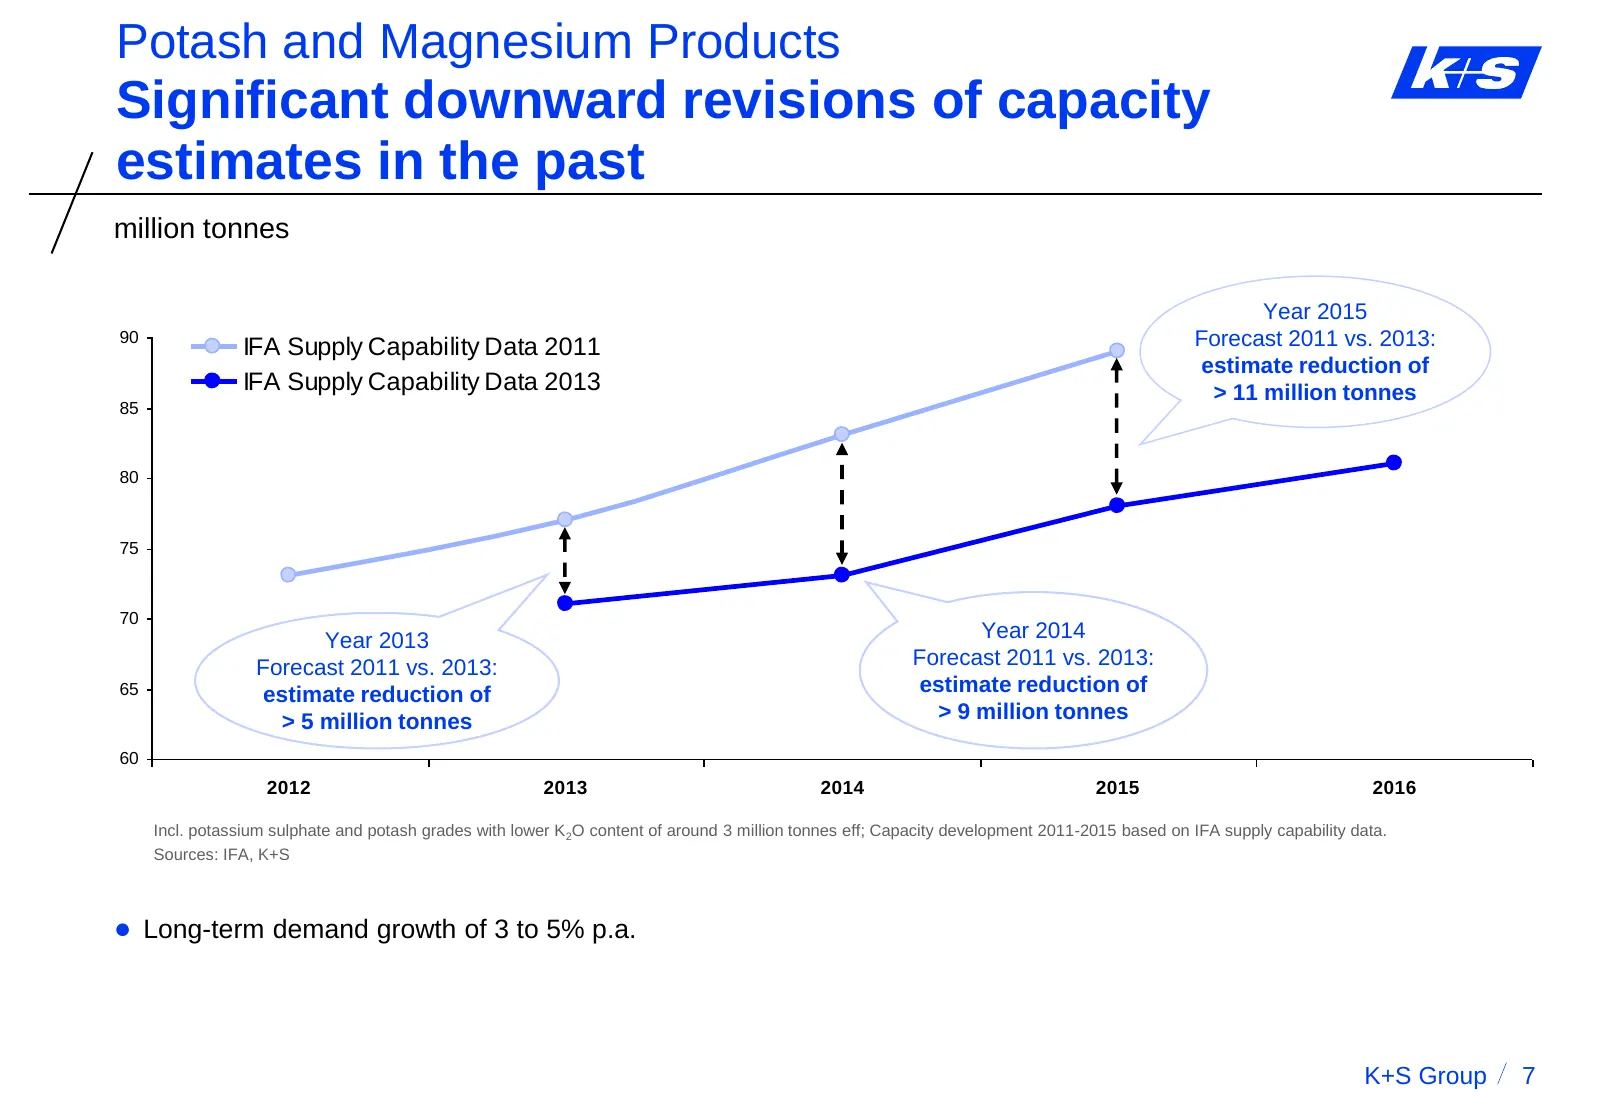
Potash and Magnesium Products Significant downward revisions of capacity estimates in the past million tonnes Year 2015 90 IFA Supply Capability Data 2011 Forecast 2011 vs. 2013: estimate reduction of IFA Supply Capability Data 2013 > 11 million tonnes 85 80 75 70 Year 2013 Year 2014 Forecast 2011 v
Slide 8: Our unique portfolio makes us more robust
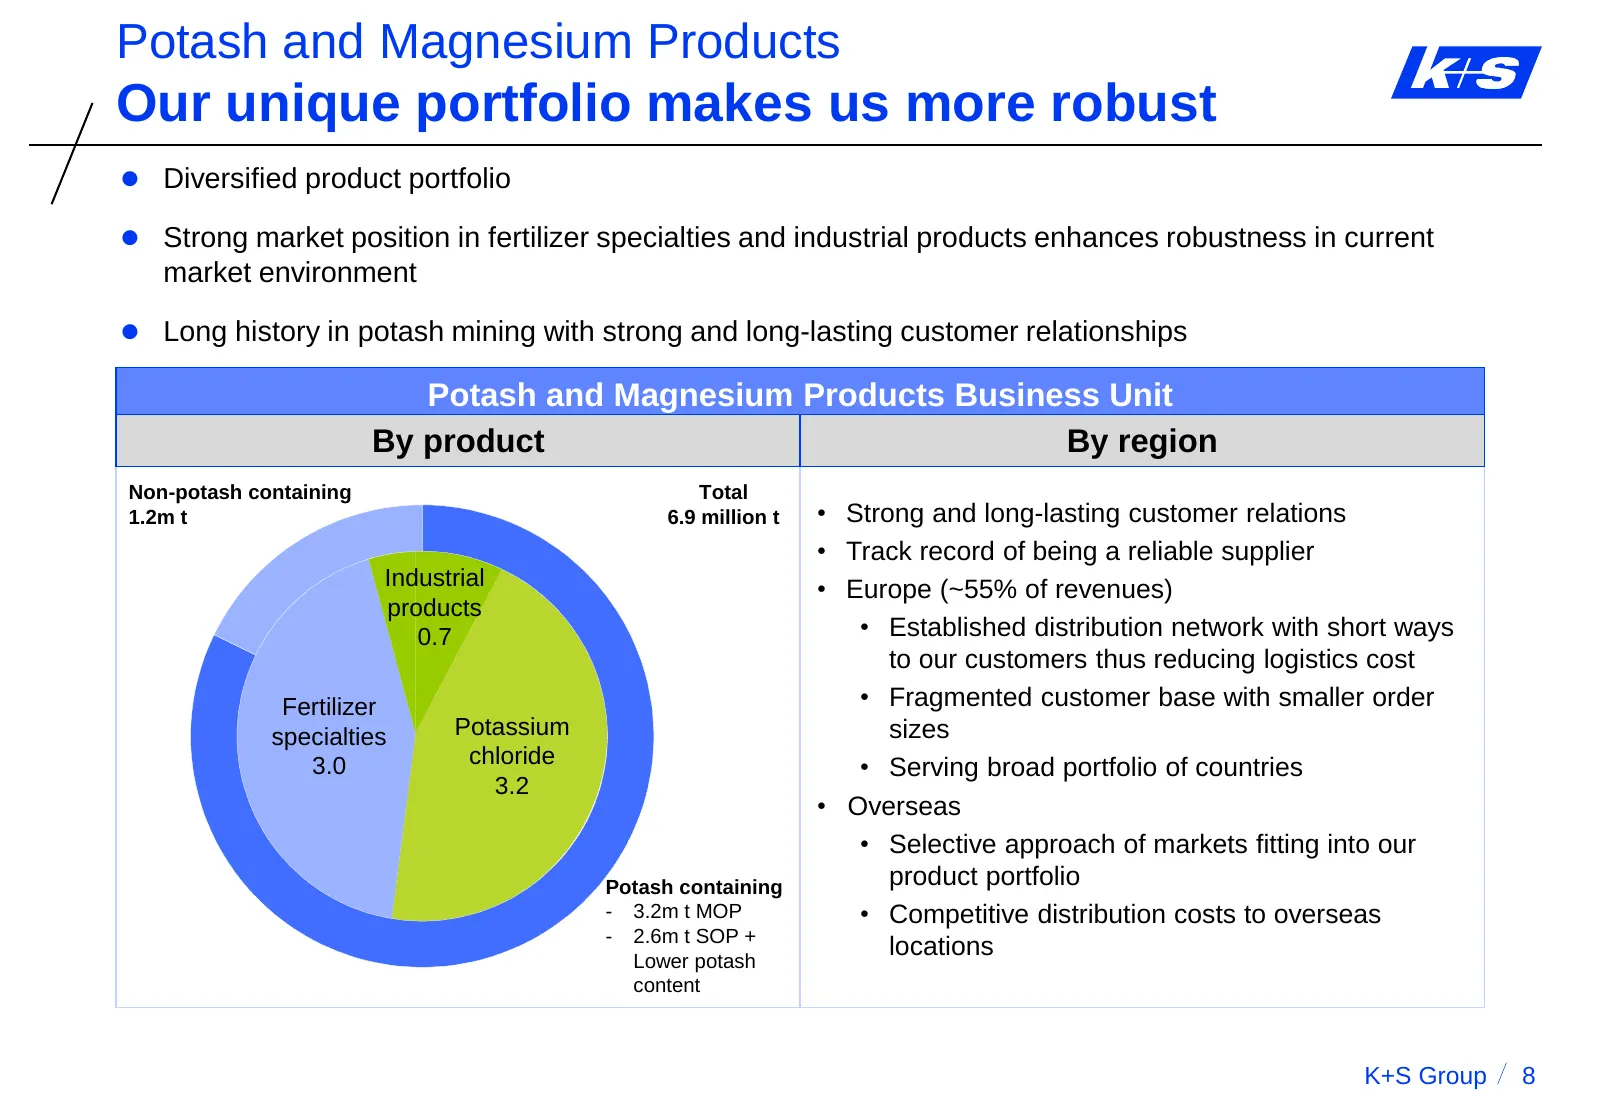
Potash and Magnesium Products Our unique portfolio makes us more robust Diversified product portfolio Strong market position in fertilizer specialties and industrial products enhances robustness in current market environment Long history in potash mining with strong and long-lasting customer r
Slide 9: Legacy Project: Significant strategic importance
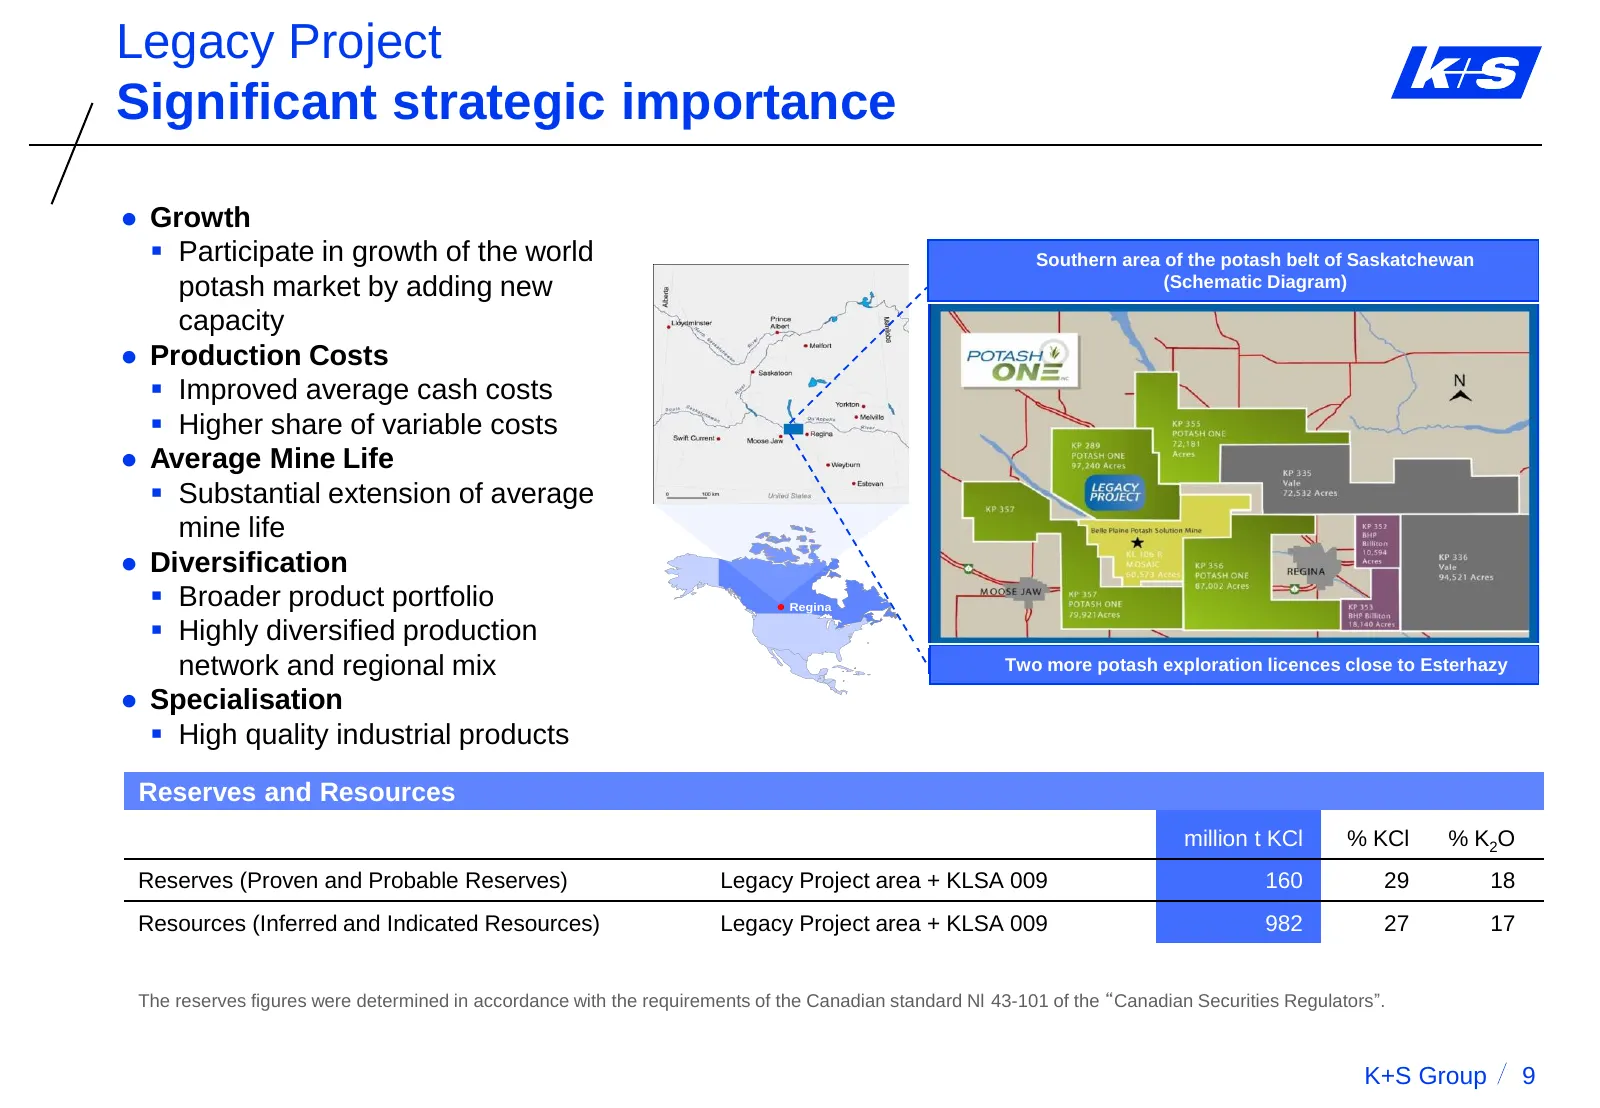
Legacy Project Significant strategic importance Growth Participate in growth of the world Southern area of the potash belt of Saskatchewan potash market by adding new Located in the Heart of(Schematic Diagram) Saskatchewan’s Potash-Rich Basin capacity Production Costs Improved average cash c
Slide 10: Legacy Project: Course of capex
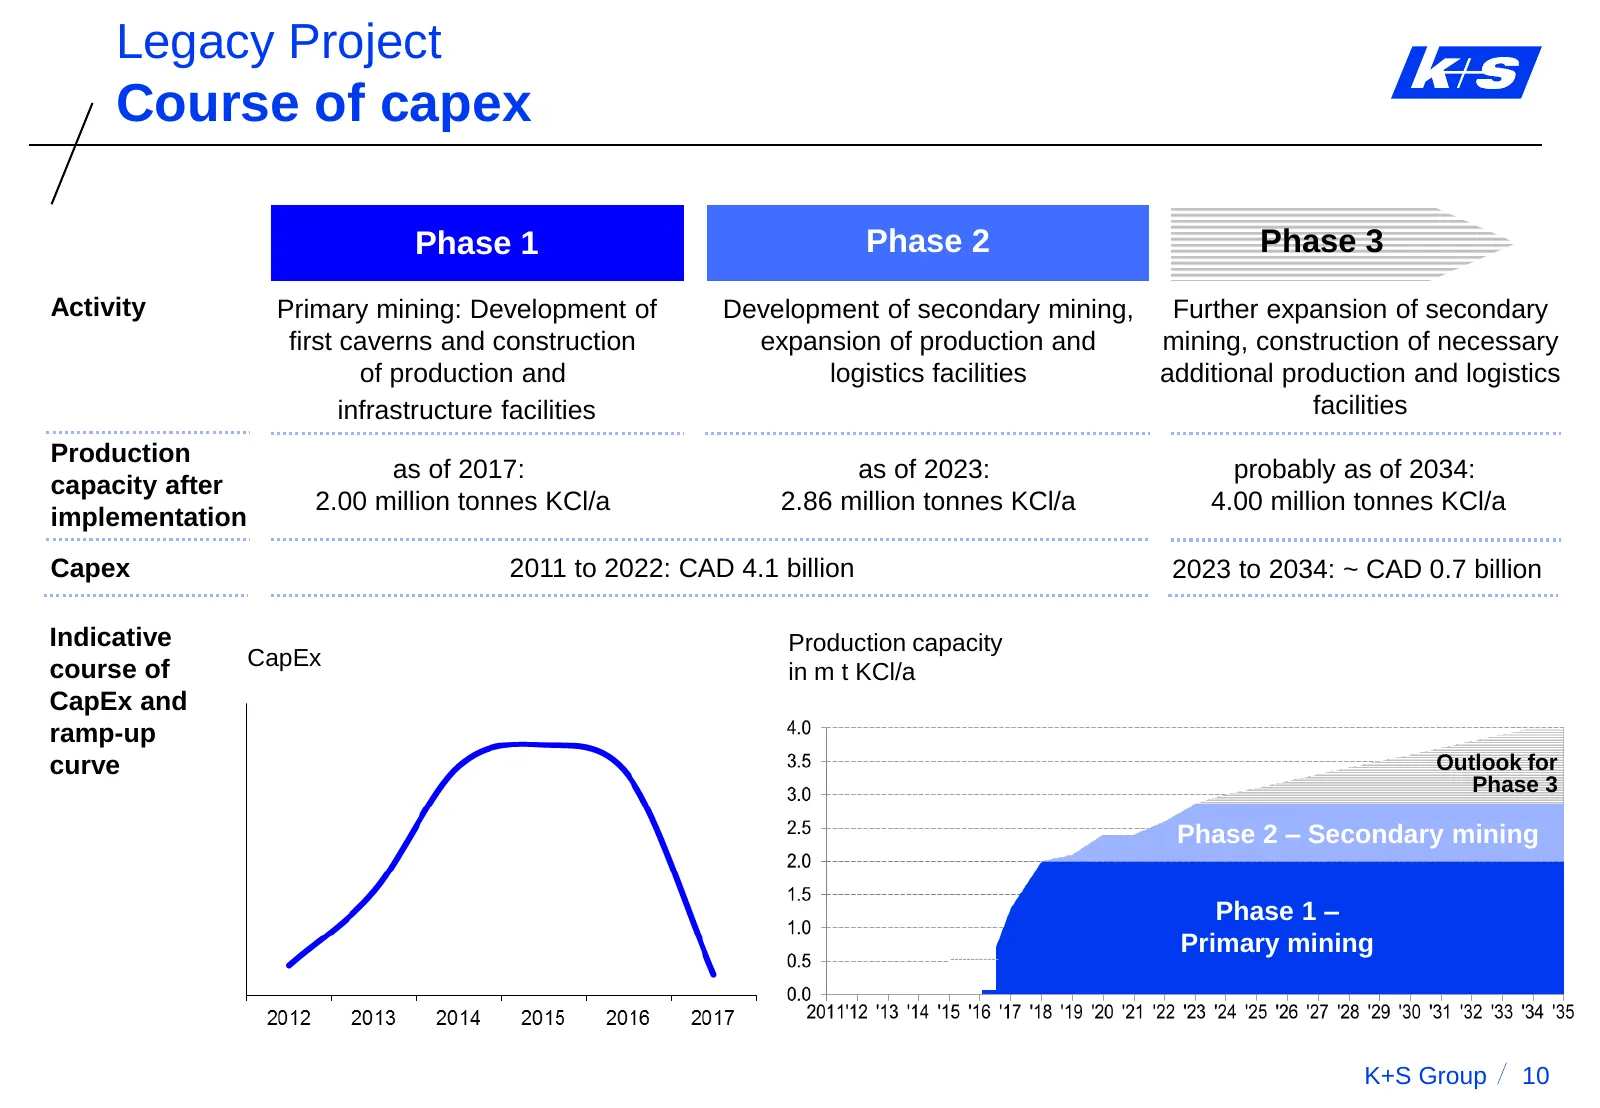
Legacy Project Course of capex Phase 1 Phase 2 Phase 3 Activity Primary mining: Development of Development of secondary mining, Further expansion of secondary first caverns and construction expansion of production and mining, construction of necessary of production and logistics facilities additiona
Slide 11: Legacy Project: Competitive production costs
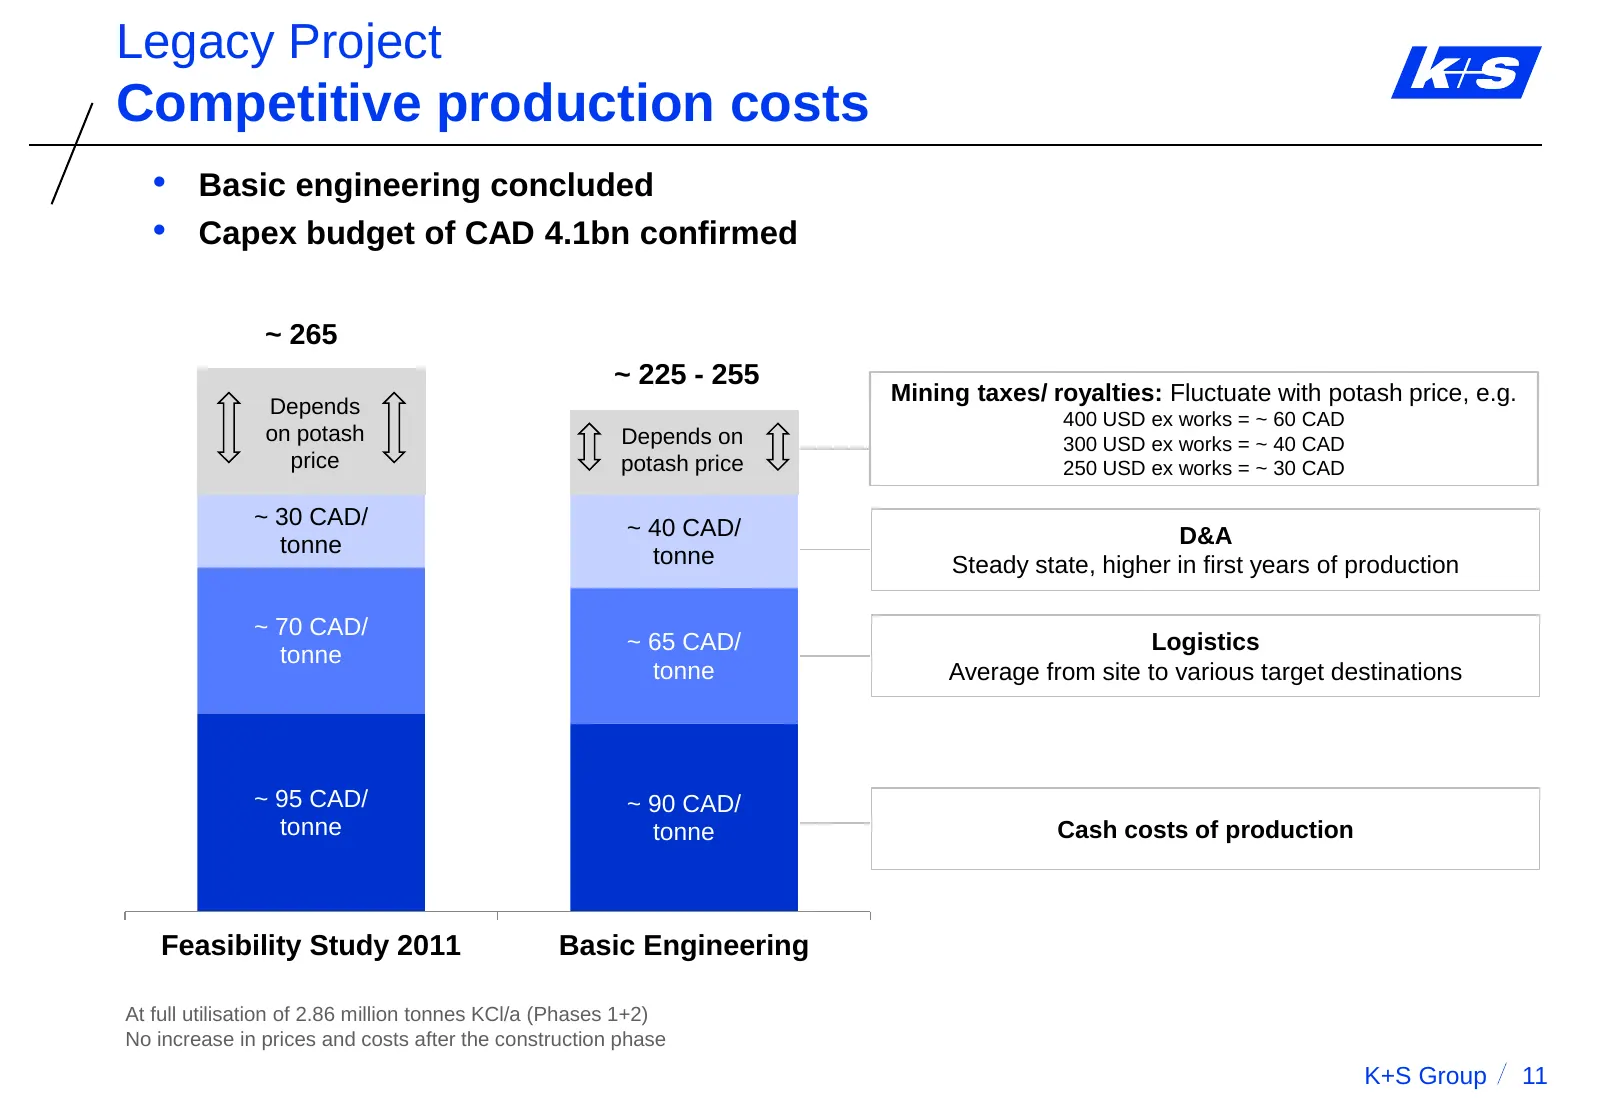
Legacy Project Competitive production costs • Basic engineering concluded • Capex budget of CAD 4.1bn confirmed ~ 265 ~ 225 - 255 Mining taxes/ royalties: Fluctuate with potash price, e.g. Depends 400 USD ex works = ~ 60 CAD on potash Depends on 300 USD ex works = ~ 40 CAD price potash price 250 USD
Slide 12: Legacy Project: On track
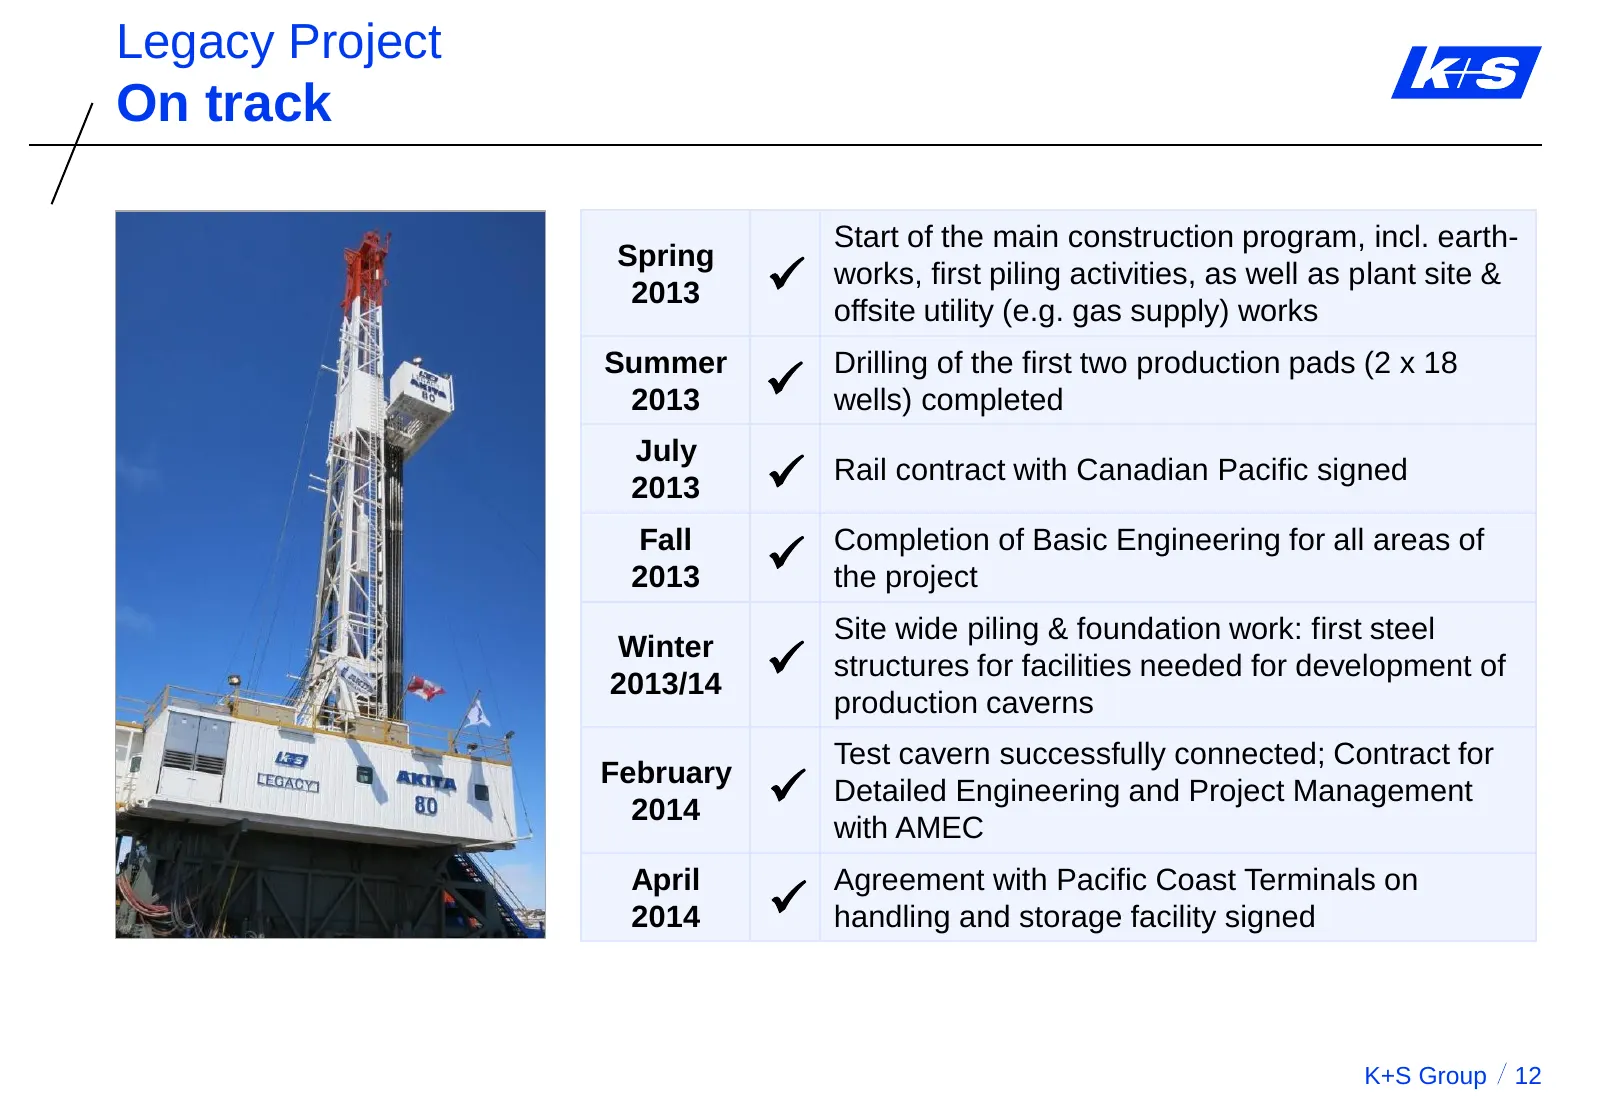
Legacy Project On track Start of the main construction program, incl. earth- Spring 2013 works, first piling activities, as well as plant site & offsite utility (e.g. gas supply) works Summer Drilling of the first two production pads (2 x 18 2013 wells) completed July 2013 Rail contract with C
Slide 13: Content
K+S Group Content A. K+S’ Unique Strategic Position 1. Potash and Magnesium Products 2. Salt B. Current Trading C. Outlook and Summary K+S Group 13
Slide 14: Key drivers of the salt business
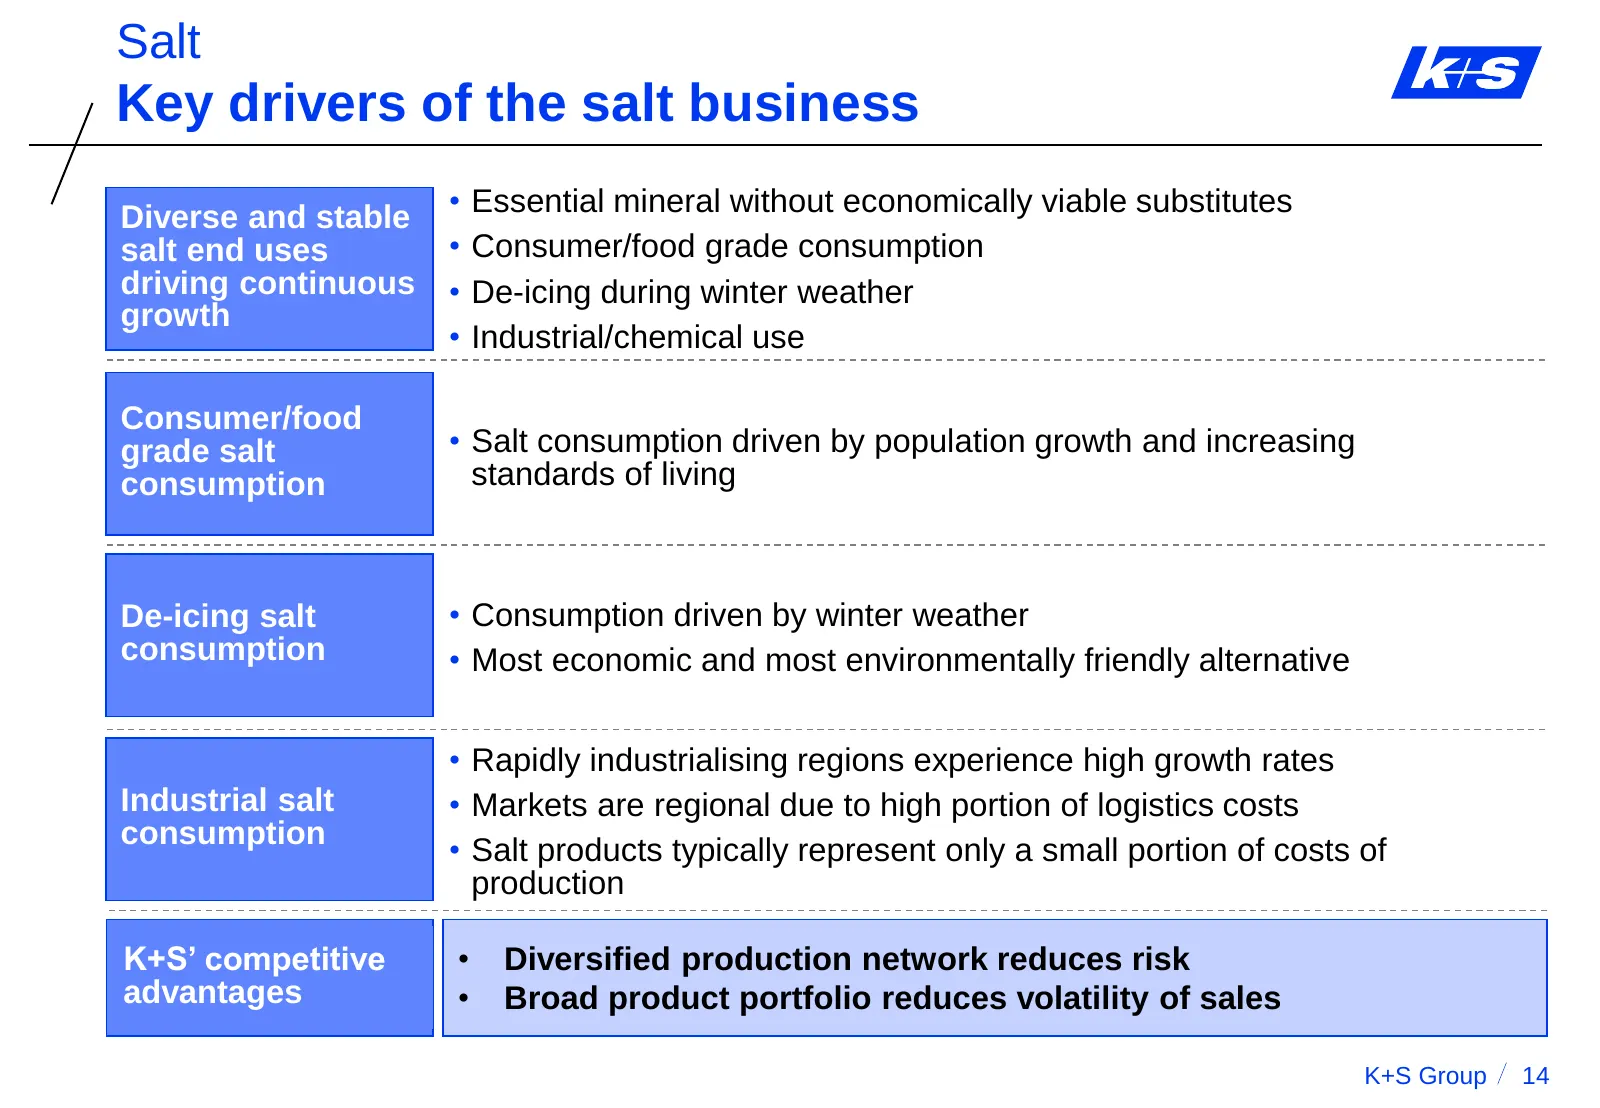
Salt Key drivers of the salt business Diverse and stable • Essential mineral without economically viable substitutes salt end uses • Consumer/food grade consumption driving continuous • De-icing during winter weather growth • Industrial/chemical use Consumer/food grade salt • Salt consumption driven
Slide 15: Main salt suppliers worldwide
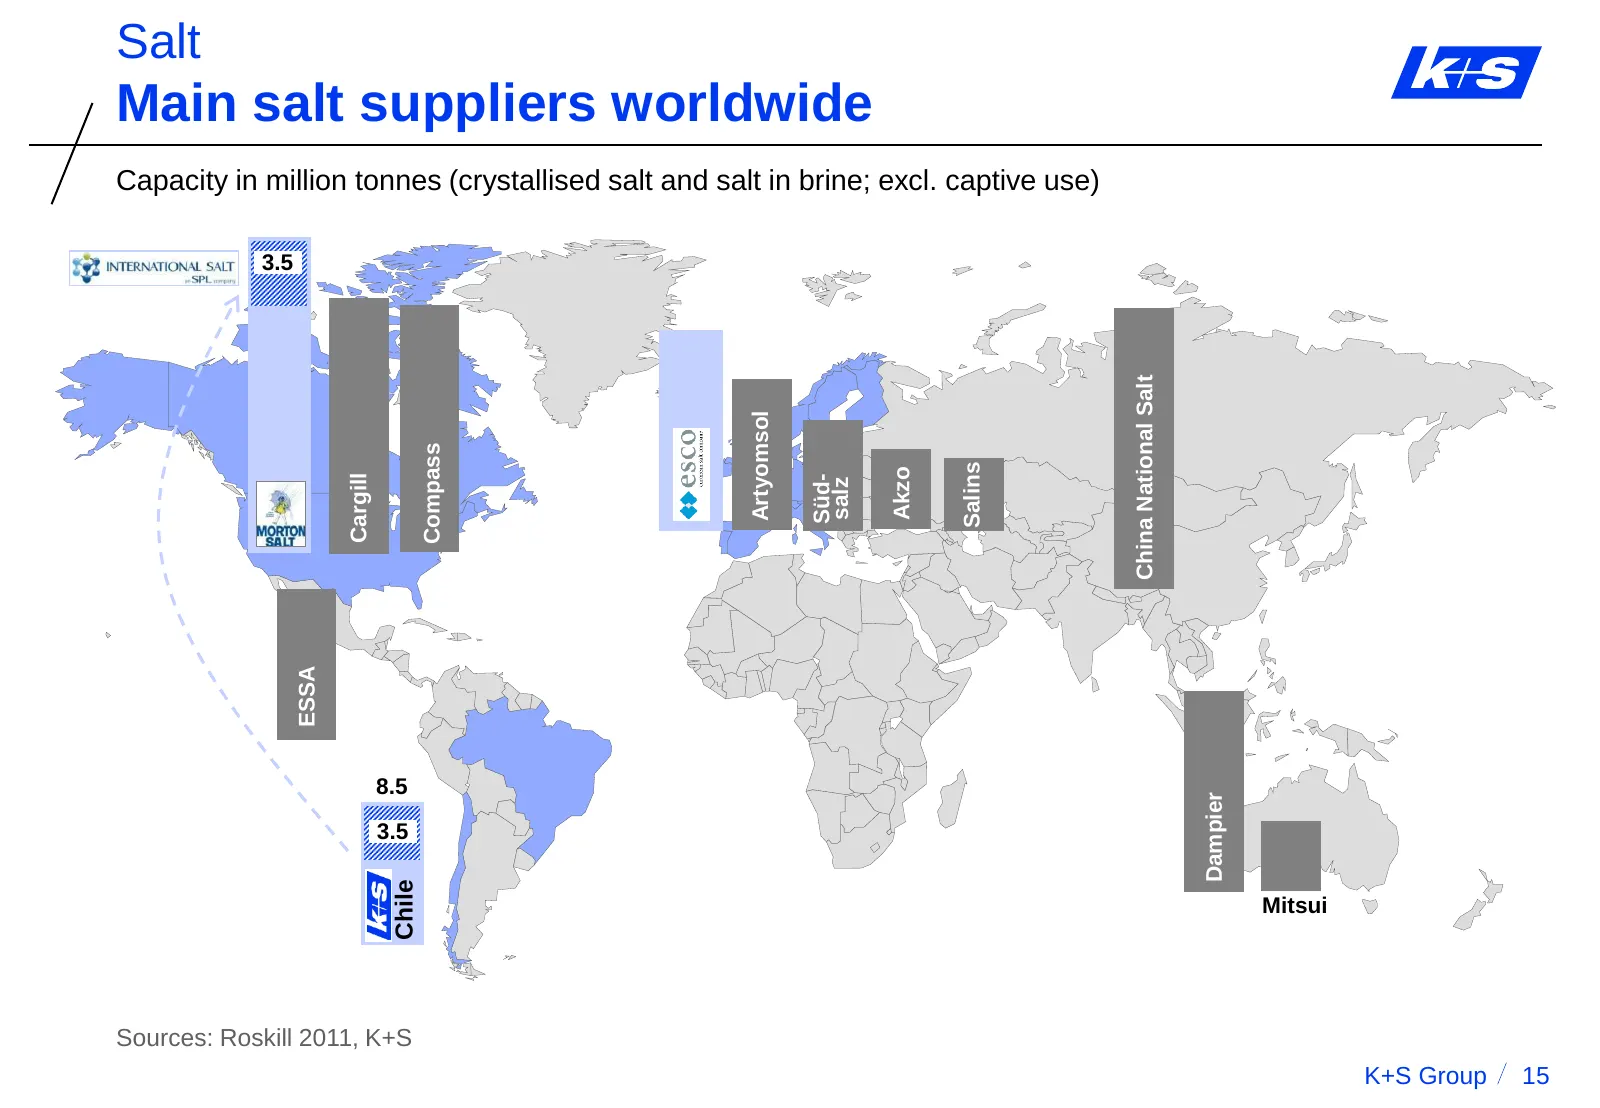
Salt Main salt suppliers worldwide Capacity in million tonnes (crystallised salt and salt in brine; excl. captive use) 3.5 13.1 9.7 China National Salt Artyomsol Compass Salins Akzo Cargill Süd- salz ESSA 8.5 Dampier 3.5 Chile Mitsui Sources: Roskill 2011, K+S K+S Group 15
Slide 16: Presence in attractive de-icing markets
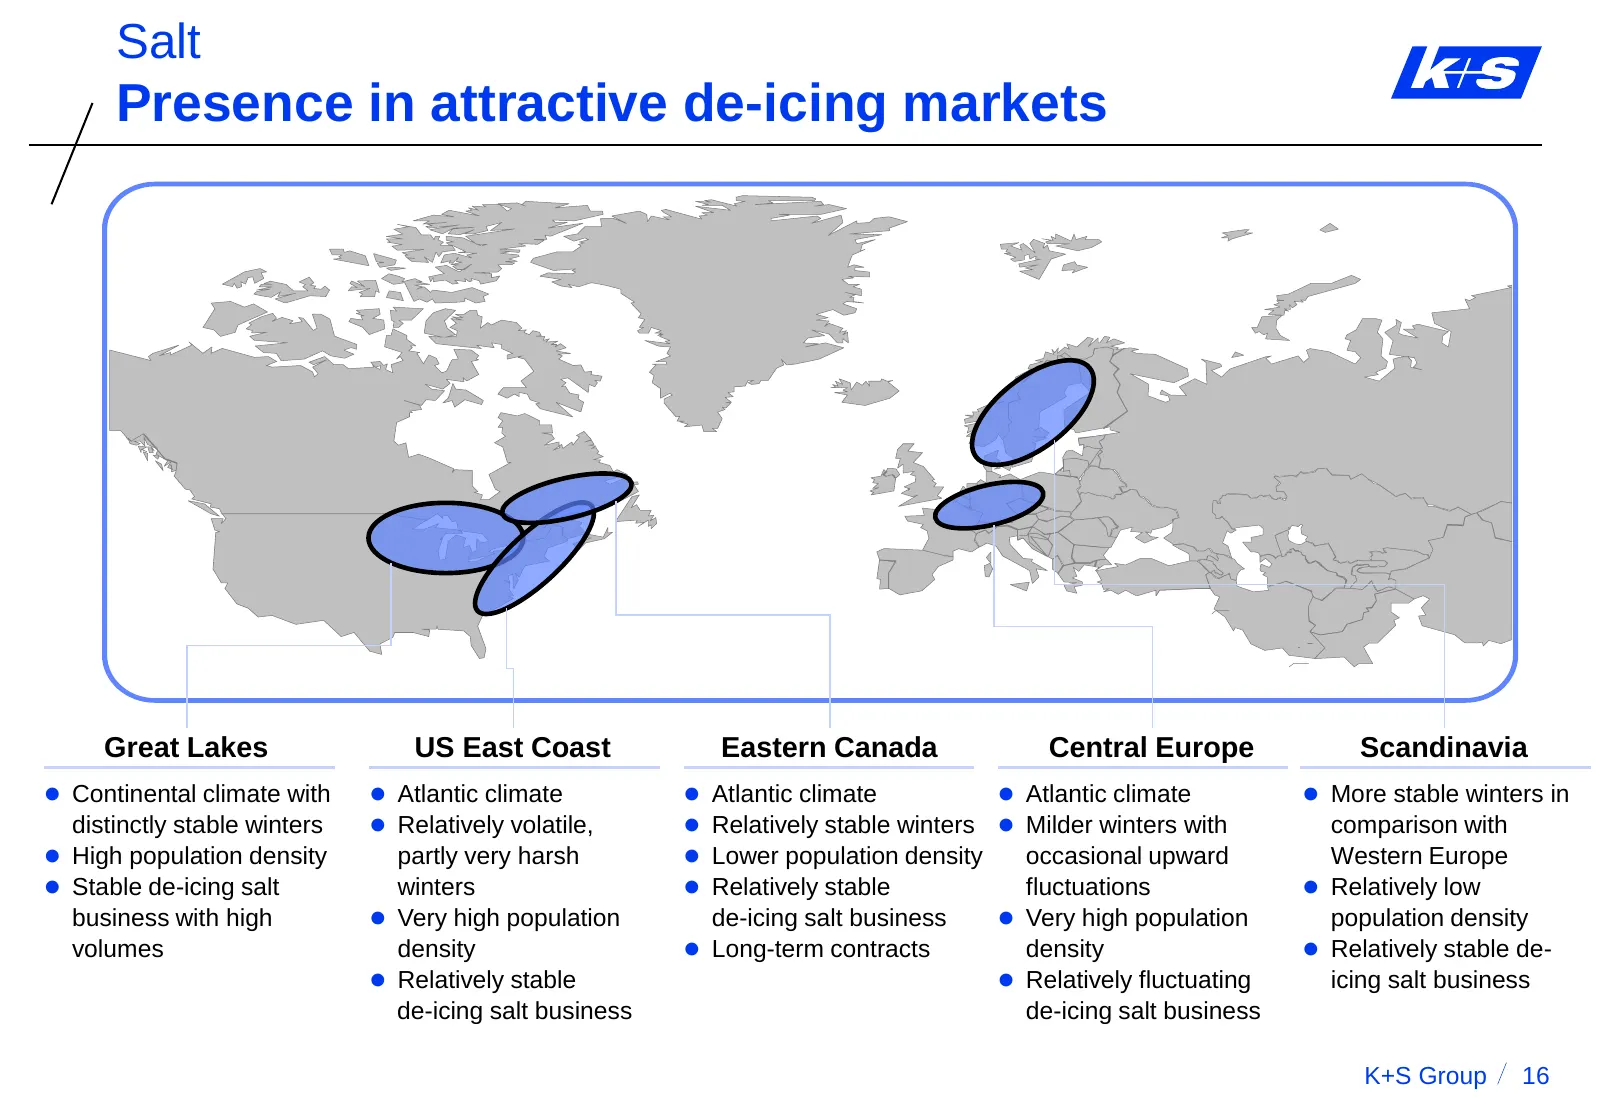
Salt Presence in attractive de-icing markets Great Lakes US East Coast Eastern Canada Central Europe Scandinavia Continental climate with Atlantic climate Atlantic climate Atlantic climate More stable winters in distinctly stable winters Relatively volatile, Relatively stable winters
Slide 17: Strengthening the salt business unit
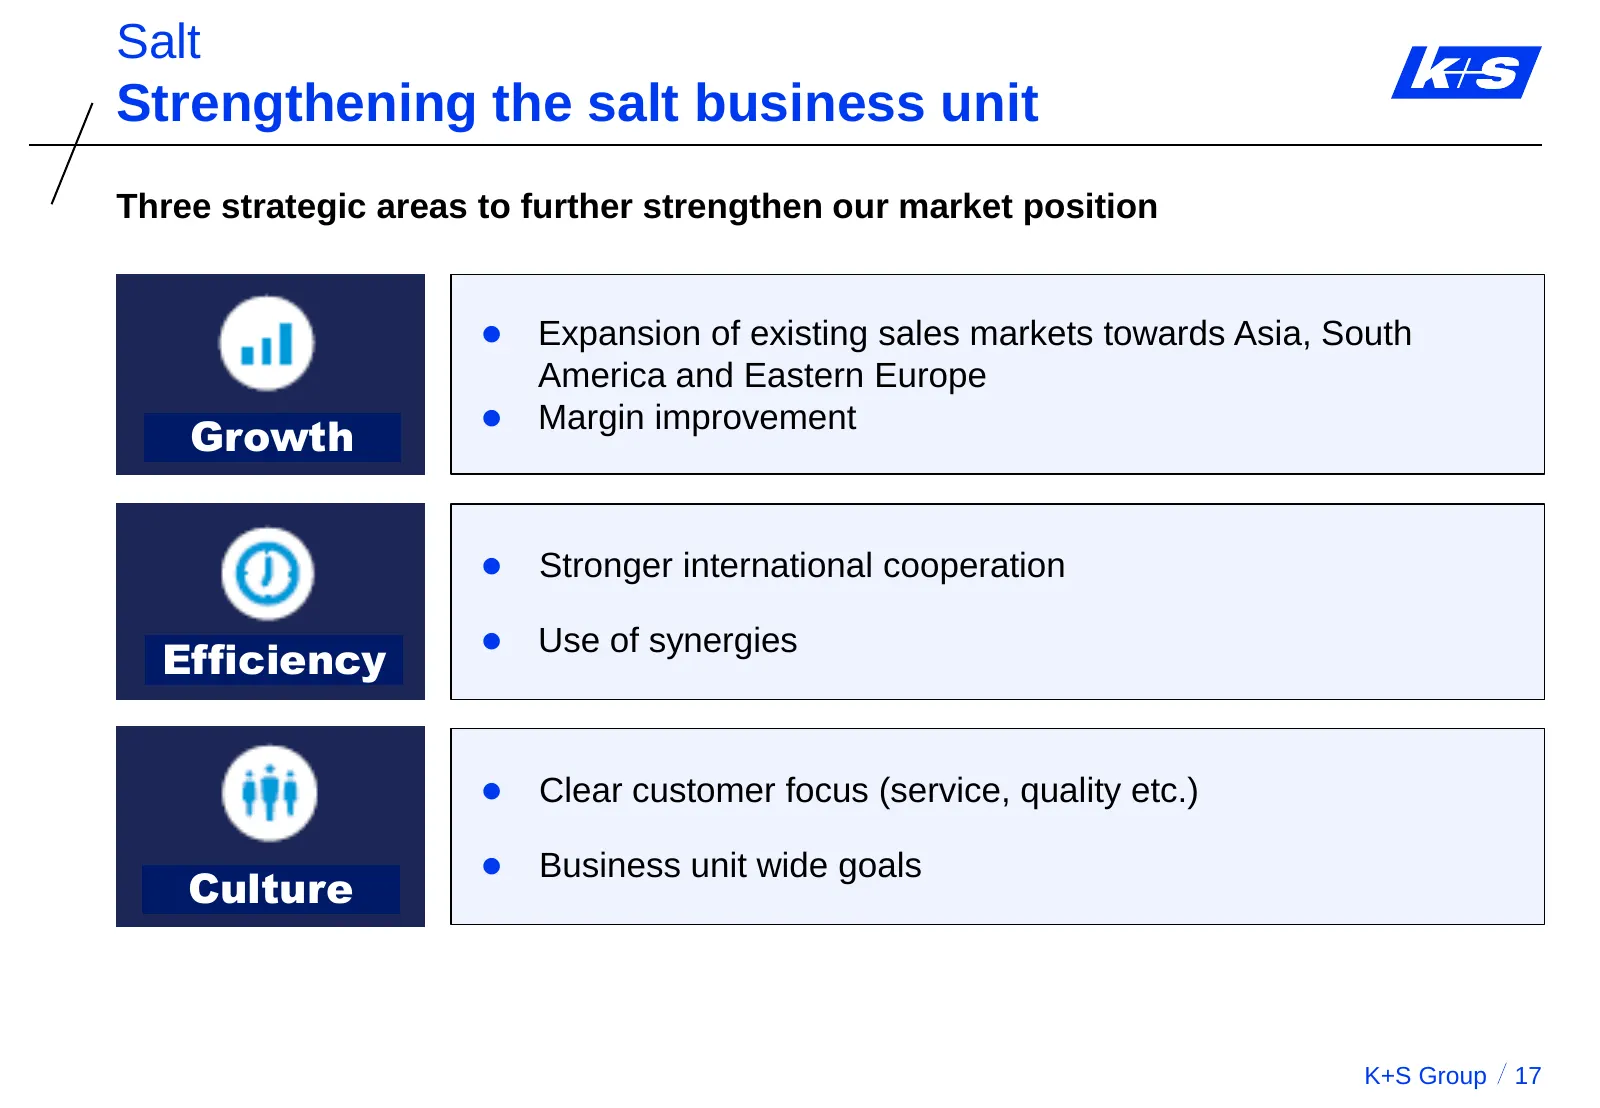
Salt Strengthening the salt business unit Three strategic areas to further strengthen our market position ● Expansion of existing sales markets towards Asia, South America and Eastern Europe ● Margin improvement Growth ● Stronger international cooperation ● Use of synergies Efficiency ● Clear custom
Slide 18: Content
K+S Group Content A. K+S’ Unique Strategic Position 1. Potash and Magnesium Products 2. Salt B. Current Trading C. Outlook and Summary K+S Group 18
Slide 19: P&L Q1/14
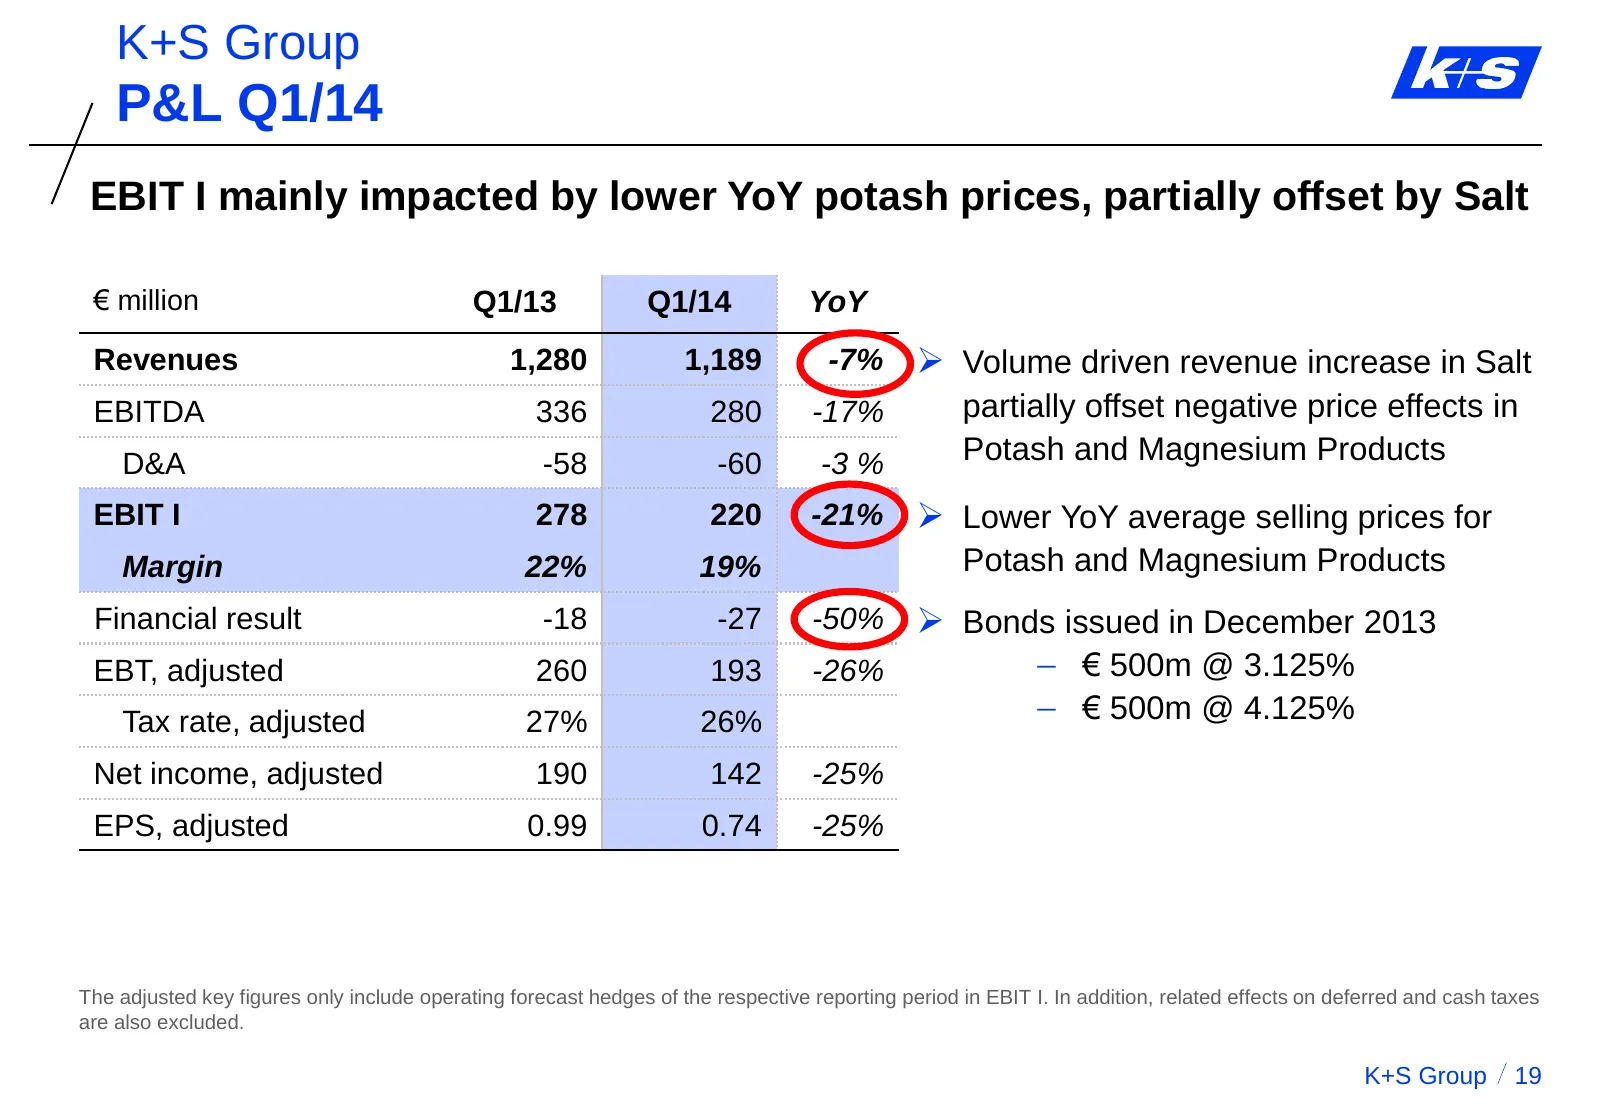
K+S Group P&L Q1/14 EBIT I mainly impacted by lower YoY potash prices, partially offset by Salt € million Q1/13 Q1/14 YoY Revenues 1,280 1,189 -7% Volume driven revenue increase in Salt EBITDA 336 280 -17% partially offset negative price effects in D&A -58 -60 -3 % Potash and Magnesium Products EB
Slide 20: Market: Prices bottomed in Q1/14
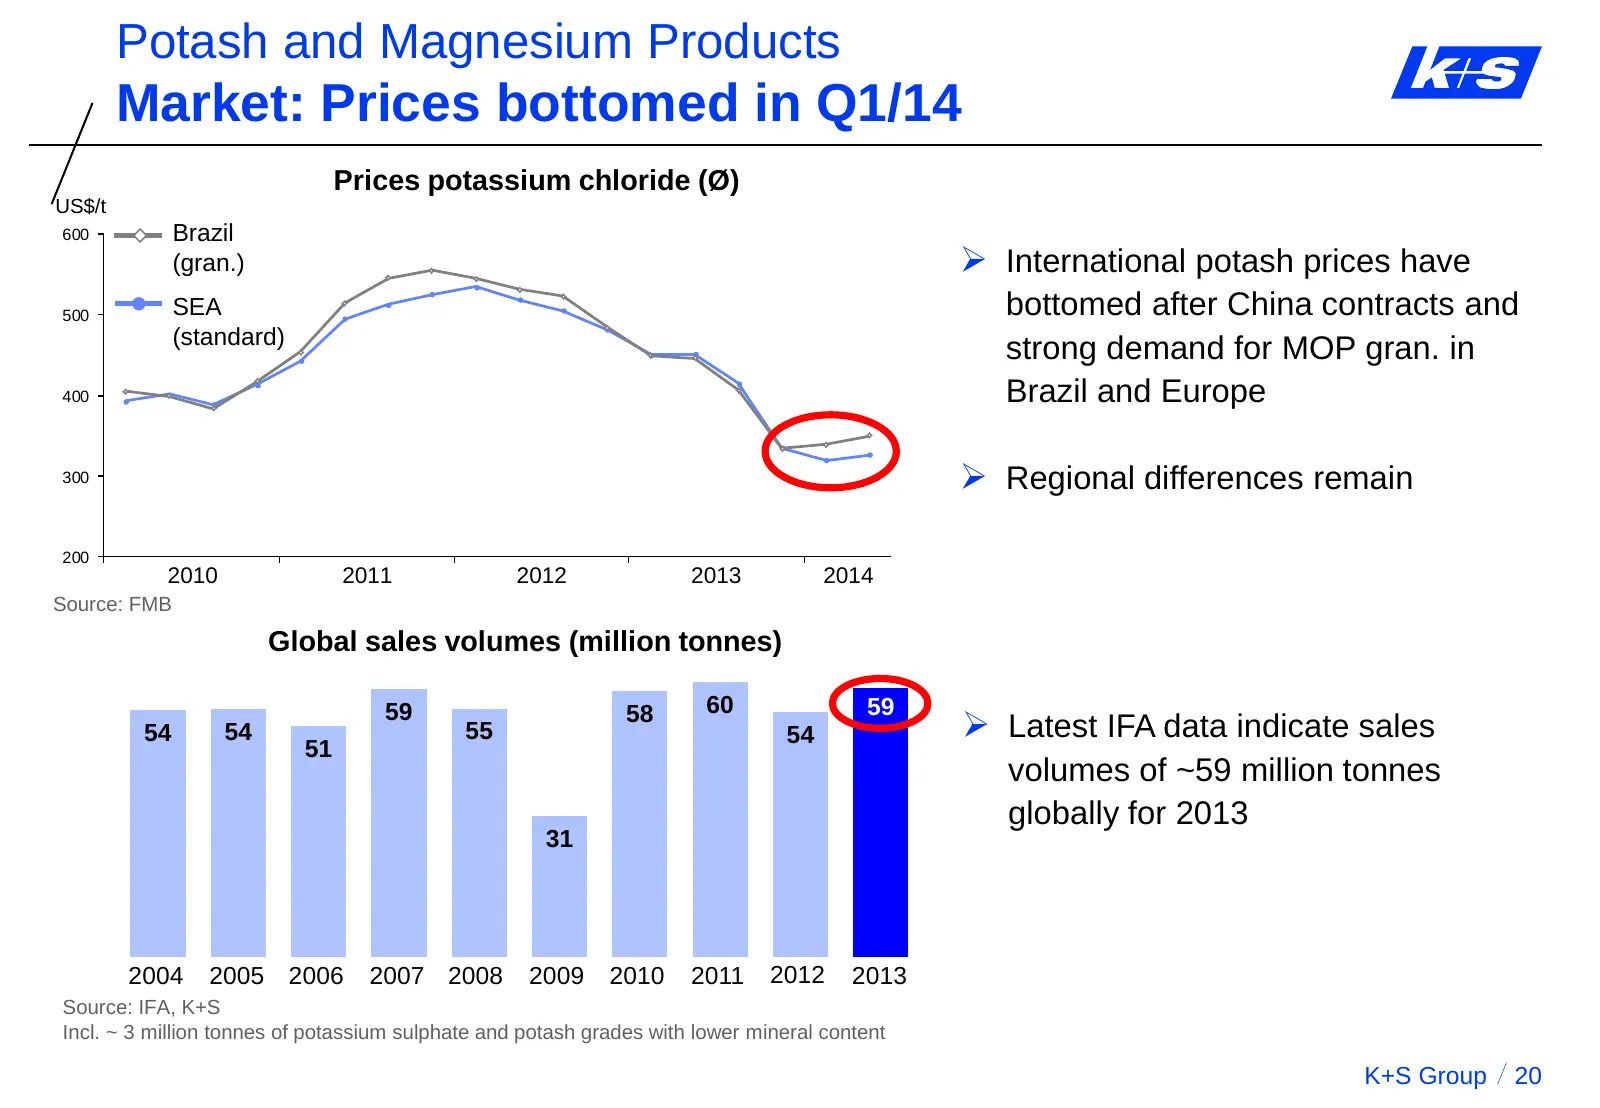
Potash and Magnesium Products Market: Prices bottomed in Q1/14 Prices potassium chloride (Ø) US$/t 600 Brazil (gran.) International potash prices have 500 SEA bottomed after China contracts and (standard) strong demand for MOP gran. in 400 Brazil and Europe 300 Regional differences remain 200 20
Slide 21: Price development
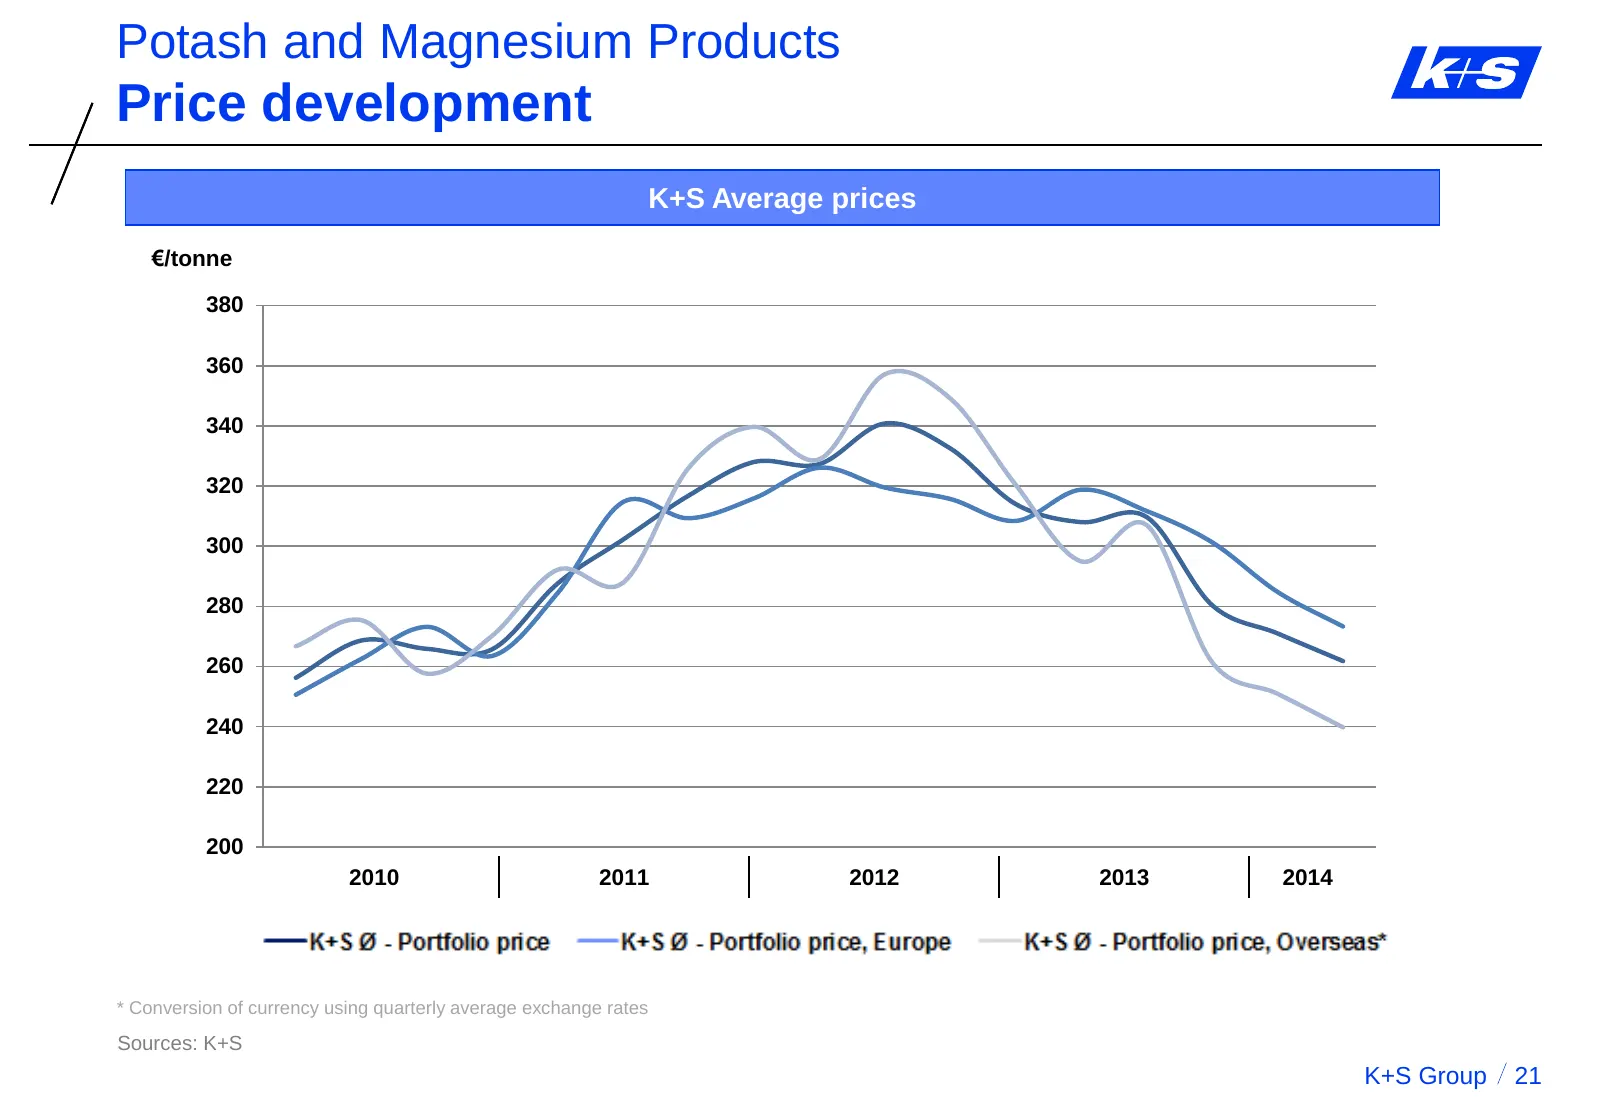
Potash and Magnesium Products Price development K+S Average prices €/tonne 380 360 340 320 300 280 260 240 220 200 2010 2011 2012 2013 2014 * Conversion of currency using quarterly average exchange rates Sources: K+S K+S Group 21
Slide 22: Potash and Magnesium Products: Business unit performance
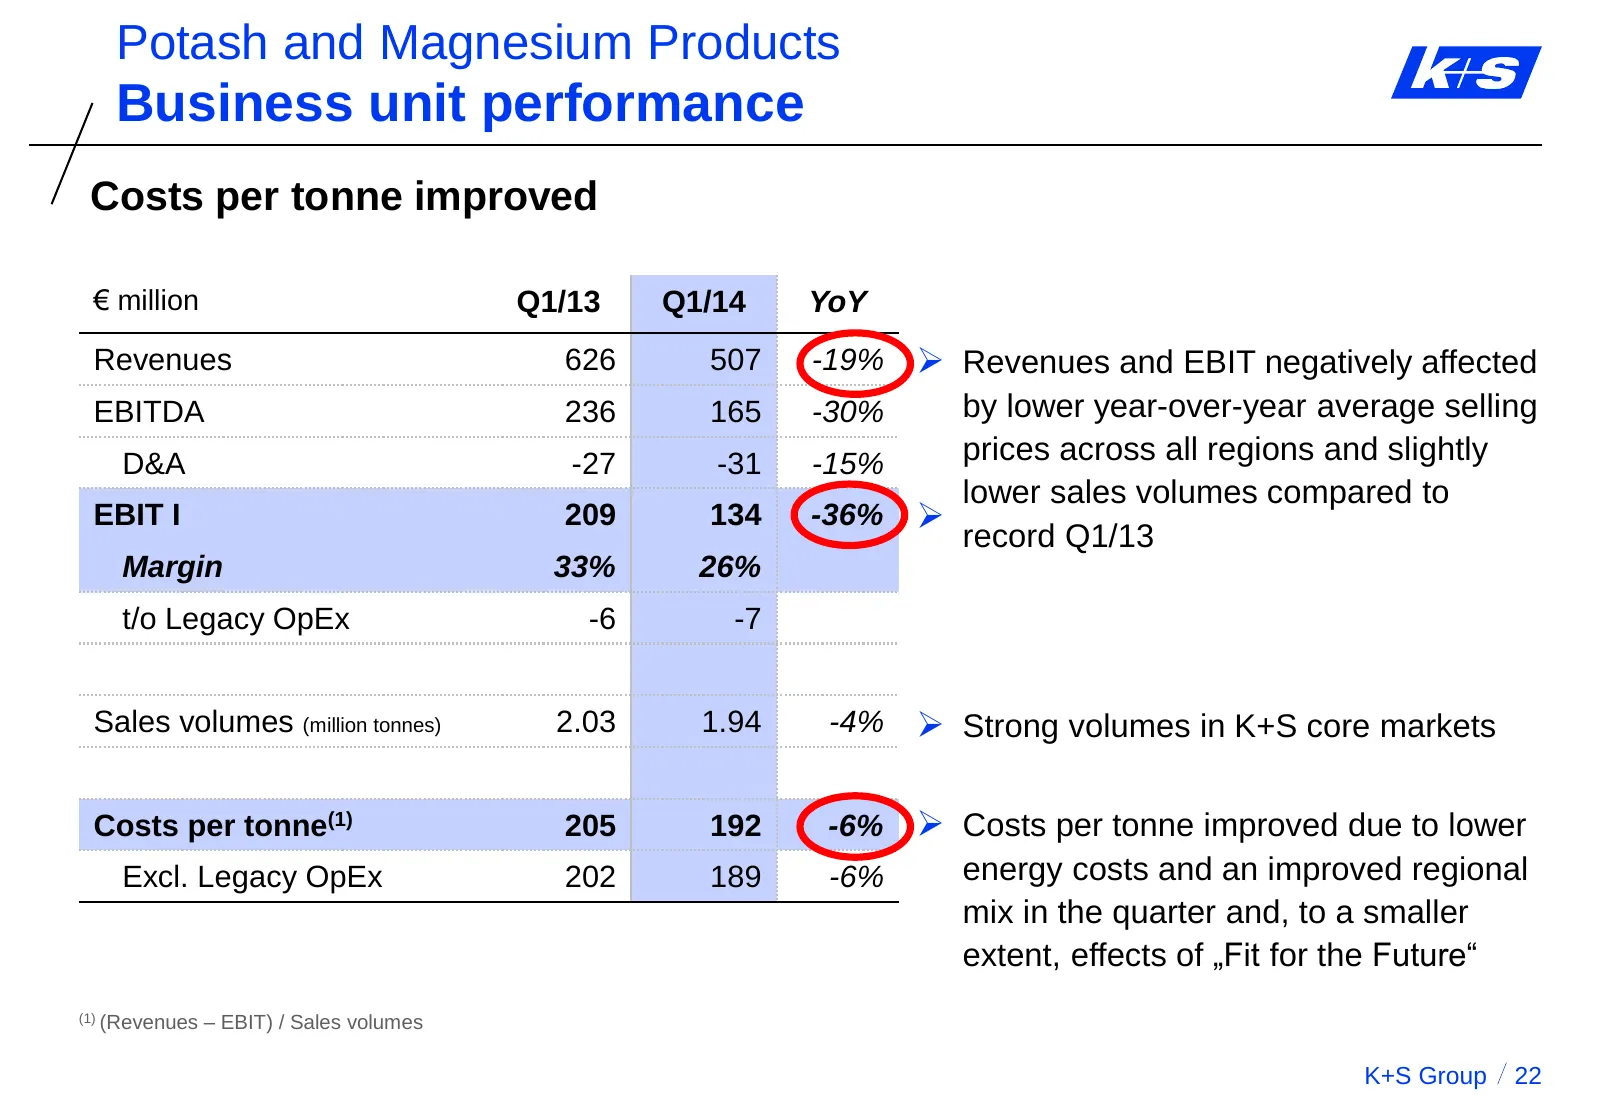
Potash and Magnesium Products Business unit performance Costs per tonne improved € million Q1/13 Q1/14 YoY Revenues 626 507 -19% Revenues and EBIT negatively affected EBITDA 236 165 -30% by lower year-over-year average selling D&A -27 -31 -15% prices across all regions and slightly lower sales vol
Slide 23: North America offsets mild European winter
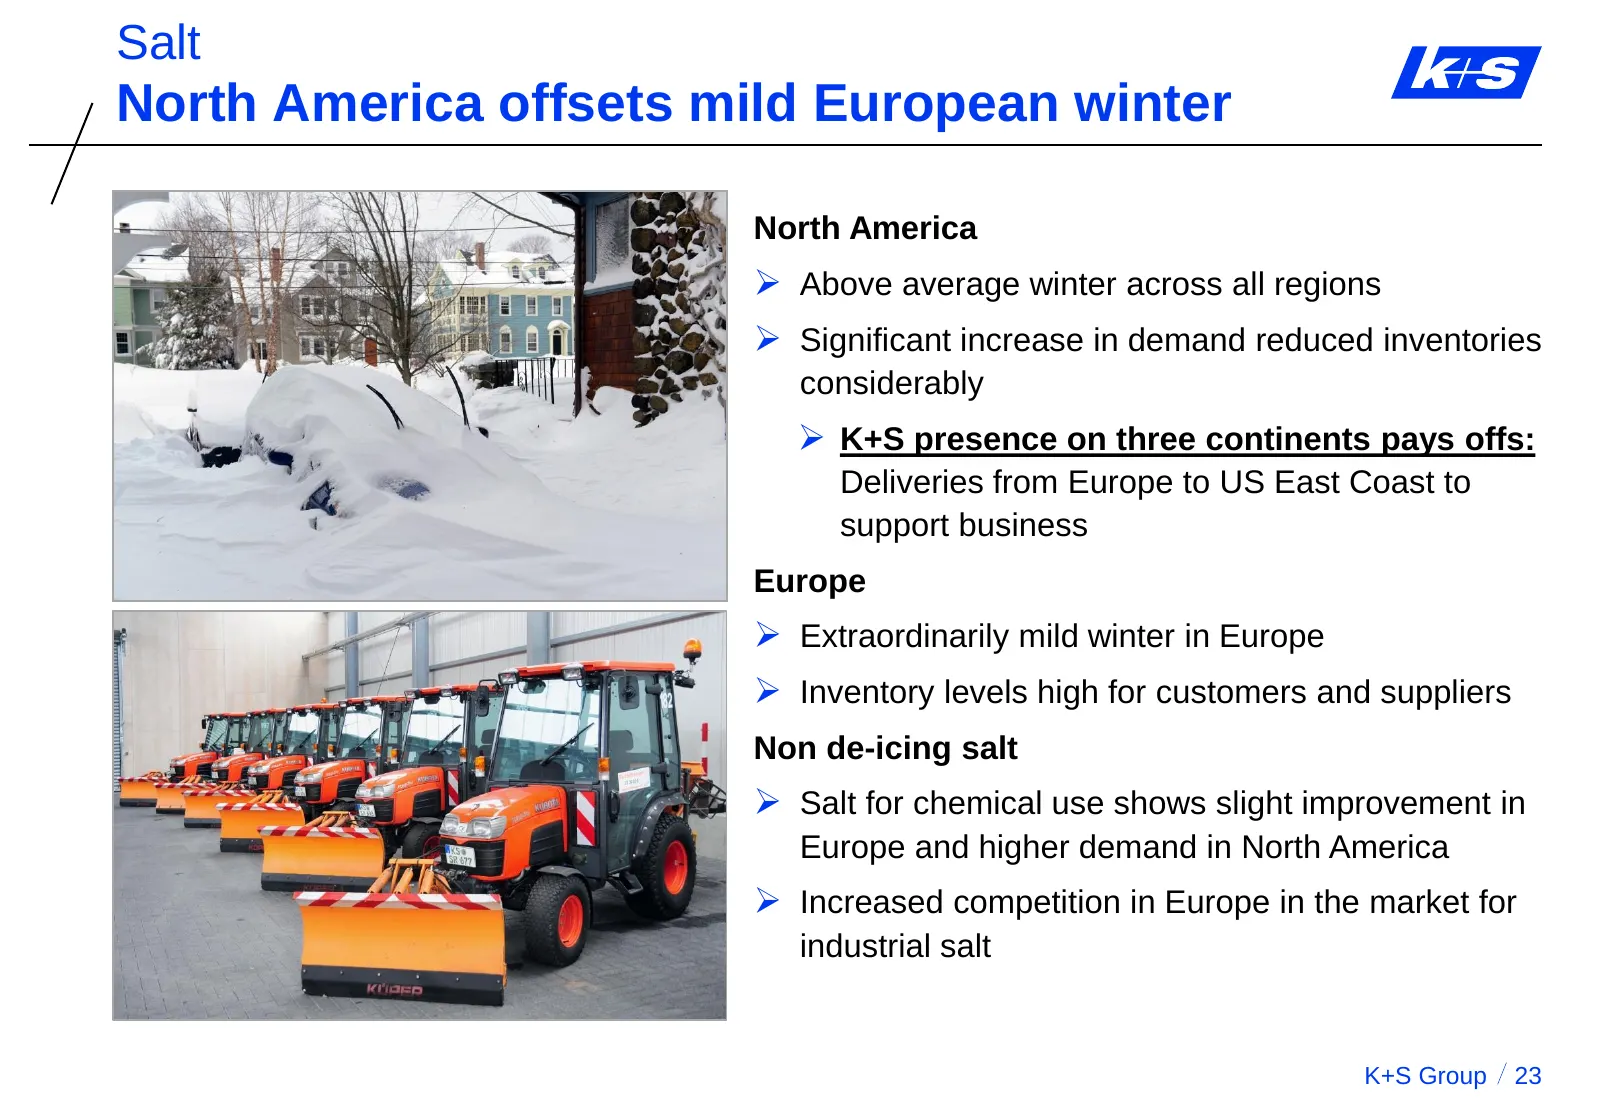
Salt North America offsets mild European winter North America Above average winter across all regions Significant increase in demand reduced inventories considerably K+S presence on three continents pays offs: Deliveries from Europe to US East Coast to support business Europe Extraordinarily
Slide 24: Salt: Business unit performance
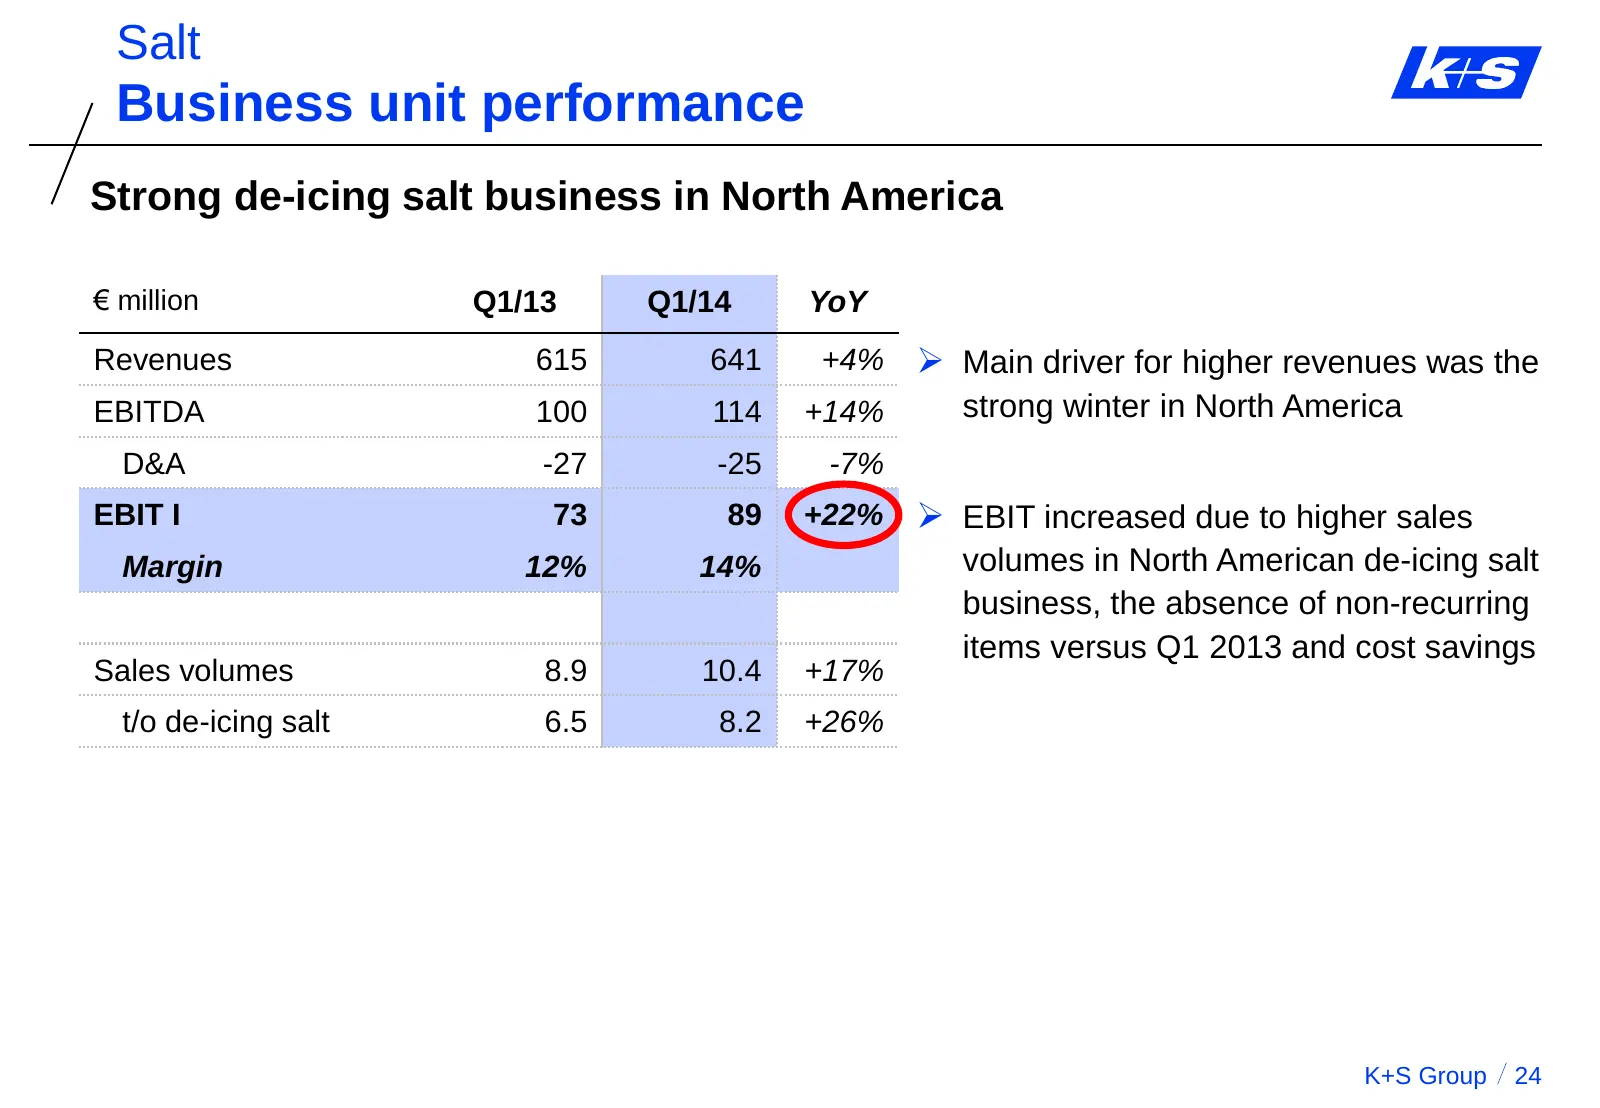
Salt Business unit performance Strong de-icing salt business in North America € million Q1/13 Q1/14 YoY Revenues 615 641 +4% Main driver for higher revenues was the EBITDA 100 114 +14% strong winter in North America D&A -27 -25 -7% EBIT I 73 89 +22% EBIT increased due to higher sales Margin 12%
Slide 25: Operating cash flow and net debt
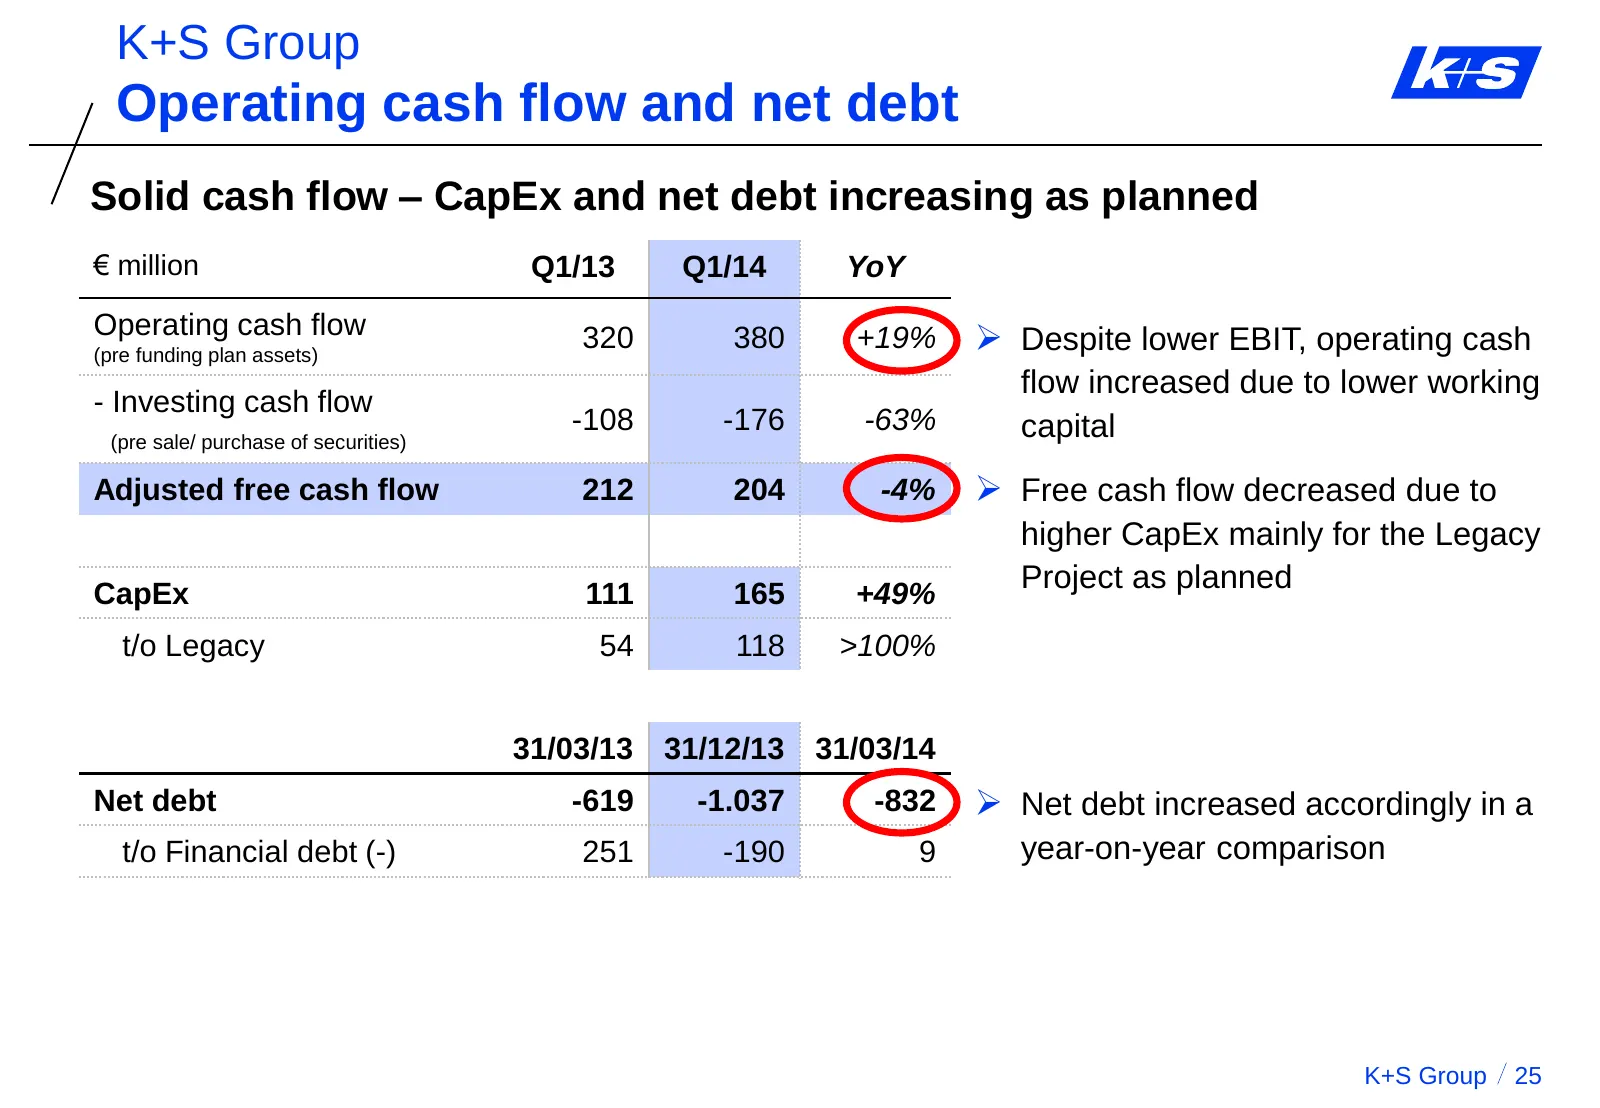
K+S Group Operating cash flow and net debt Solid cash flow – CapEx and net debt increasing as planned € million Q1/13 Q1/14 YoY Operating cash flow 320 380 +19% Despite lower EBIT, operating cash (pre funding plan assets) flow increased due to lower working - Investing cash flow -108 -176 -63% cap
Slide 26: Content
K+S Group Content A. K+S’ Unique Strategic Position 1. Potash and Magnesium Products 2. Salt B. Current Trading C. Outlook and Summary K+S Group 26
Slide 27: Guidance 2014 remains unchanged
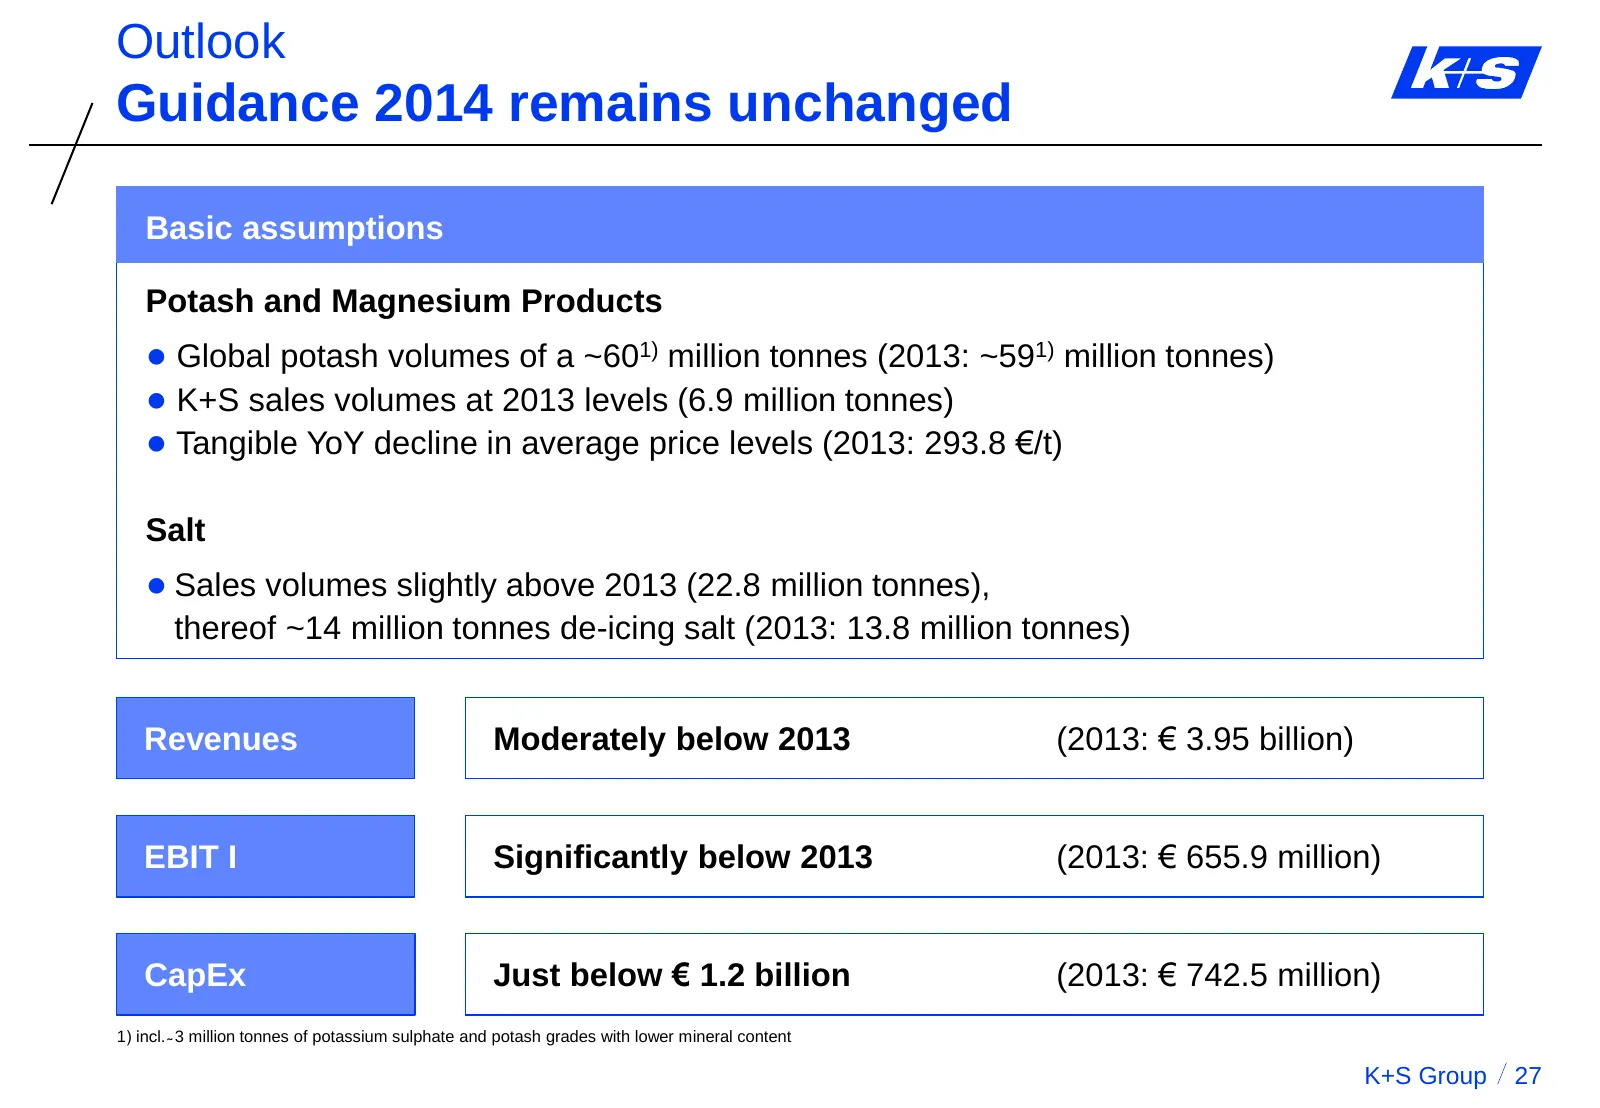
Outlook Guidance 2014 remains unchanged Basic assumptions Potash and Magnesium Products ● Global potash volumes of a ~601) million tonnes (2013: ~591) million tonnes) ● K+S sales volumes at 2013 levels (6.9 million tonnes) ● Tangible YoY decline in average price levels (2013: 293.8 €/t) Salt ● Sales
Slide 28: Summary
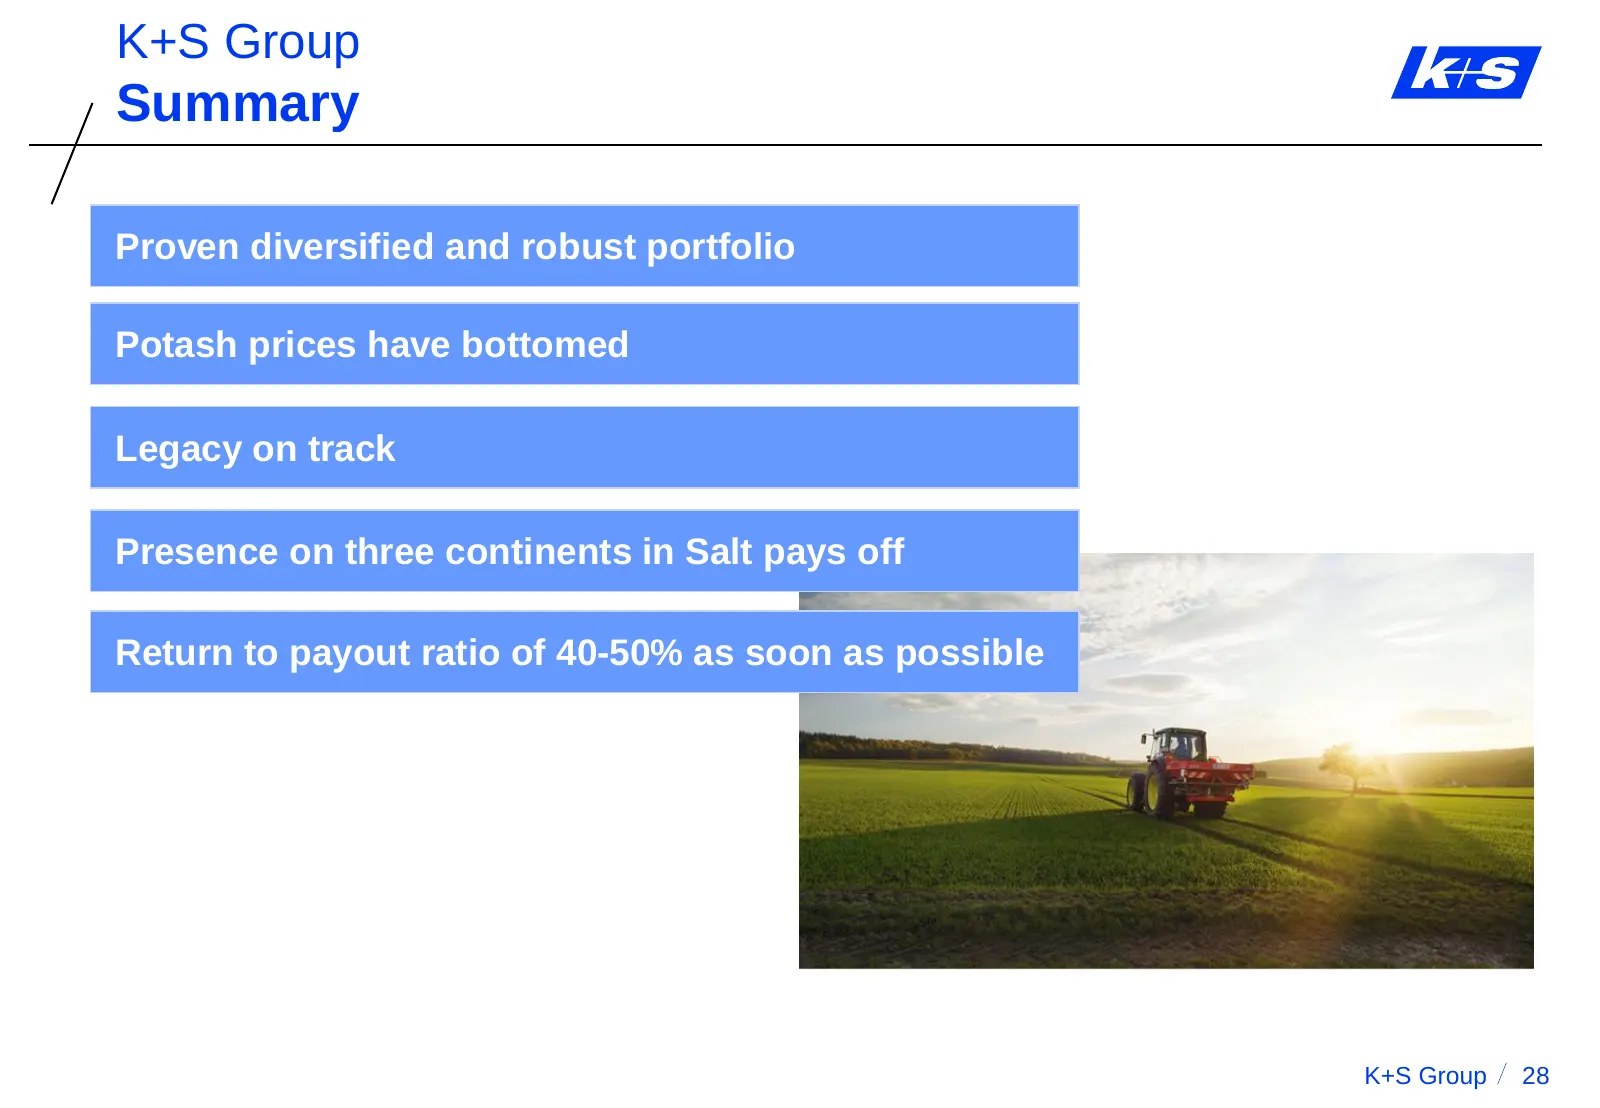
K+S Group Summary Proven diversified and robust portfolio Potash prices have bottomed Legacy on track Presence on three continents in Salt pays off Return to payout ratio of 40-50% as soon as possible K+S Group 28
Slide 29: K+S Investor Relations Contact details
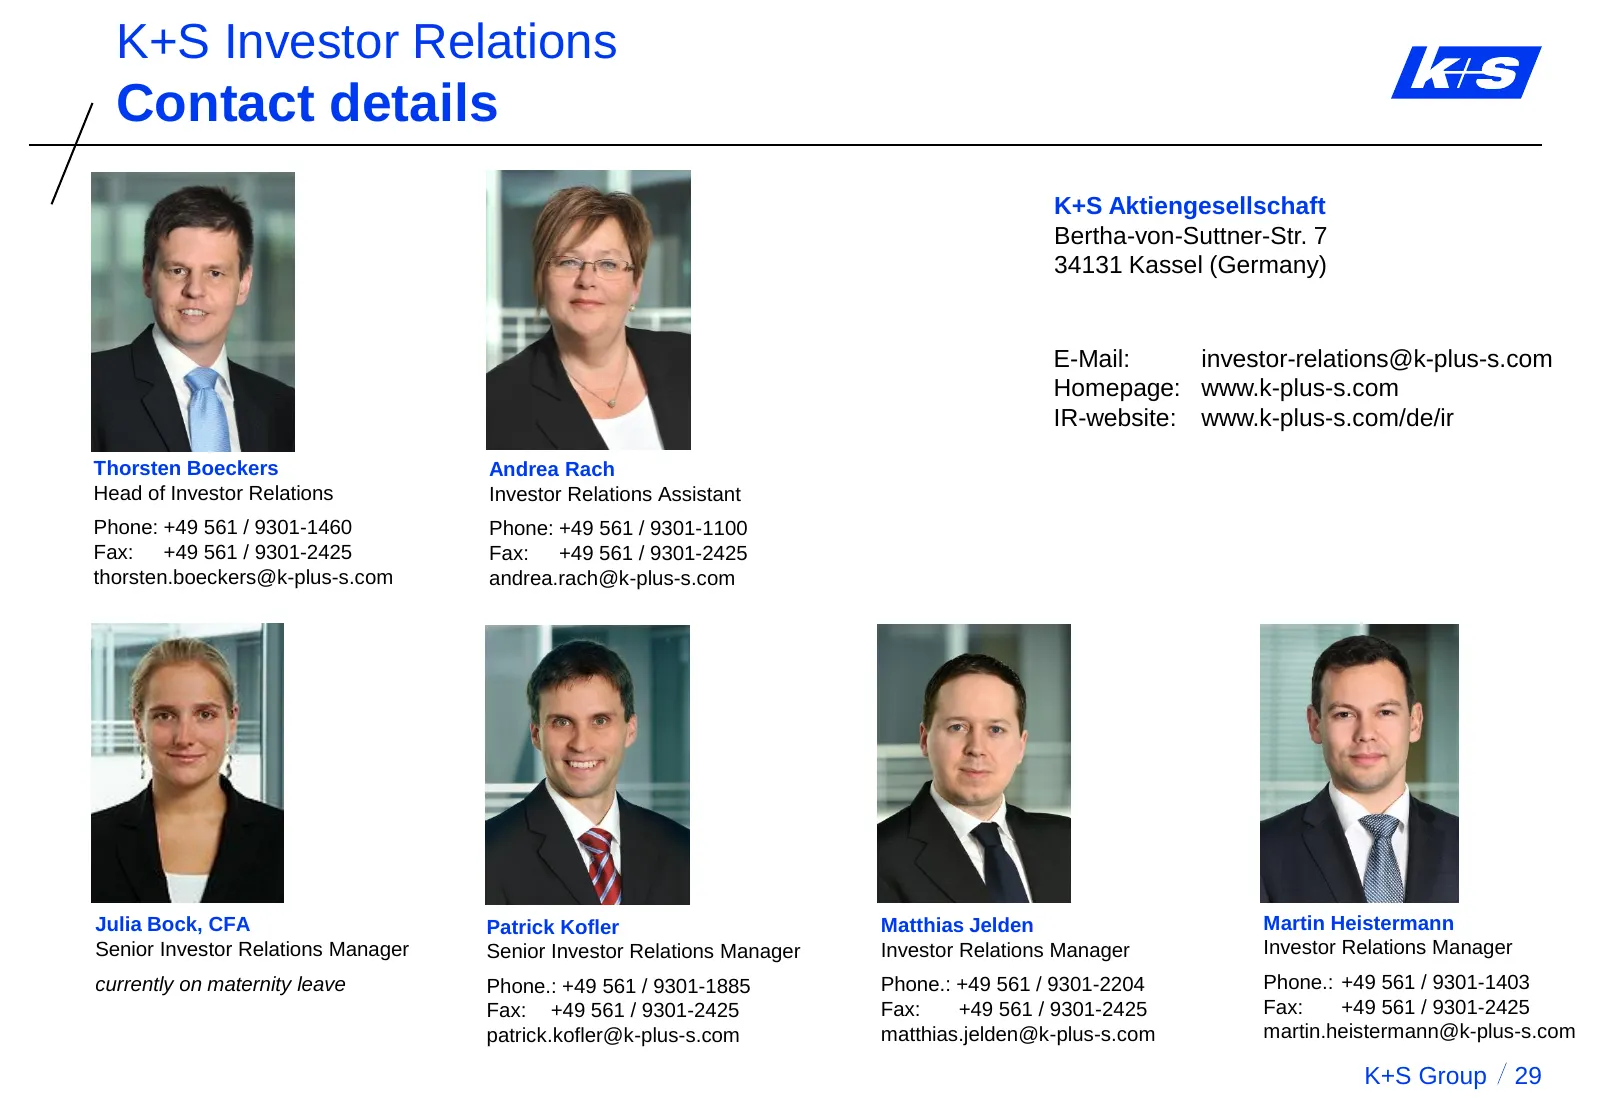
K+S Investor Relations Contact details K+S Aktiengesellschaft Bertha-von-Suttner-Str. 7 34131 Kassel (Germany) E-Mail: investor-relations@k-plus-s.com Homepage: www.k-plus-s.com IR-website: www.k-plus-s.com/de/ir Thorsten Boeckers Andrea Rach Head of Investor Relations Investor Relations Assistant P
Slide 30: Forward-looking Statements
K+S Group Forward-looking Statements This presentation contains facts and forecasts that relate to the future development of the K+S Group and its companies. The forecasts are estimates that we have made on the basis of all the information available to us at this moment in time. Should the assumptio

Slide 31: 31
31
Slide 32: Financial Calendar
K+S Aktiengesellschaft K+S Aktiengesellschaft · Bertha-von-Suttner-Straße 7 · 34131 Kassel | Germany · Internet: www.k-plus-s.com Investor Relations · phone: +49 (0)561 / 9301-1100 · fax: +49 (0)561 / 9301-2425 · email: investor-relations@k-plus-s.com Financial Calendar 14 Aug 2014: Q2 report - 13 N
Source: Internet Archive copy of k-plus-s.com
More decks from K+s AG
 Investor Presentation (October 2026)100 slides · October 2026
 Q2 2026 Earnings Presentation9 slides · Aug 12, 2026
 Investor Presentation (August 2026)102 slides · August 2026
 Q1 2026 Earnings Presentation11 slides · May 11, 2026
 Investor Presentation (May 2026)89 slides · May 2026
 Q4 2025 Earnings Presentation11 slides · Mar 13, 2026