Australian Agricultural Company Limited · ASX:AAC
Australian Agricultural — Shareholder Meeting (June 2011)
22 slides from Australian Agricultural's shareholder meeting presentation, June 2011
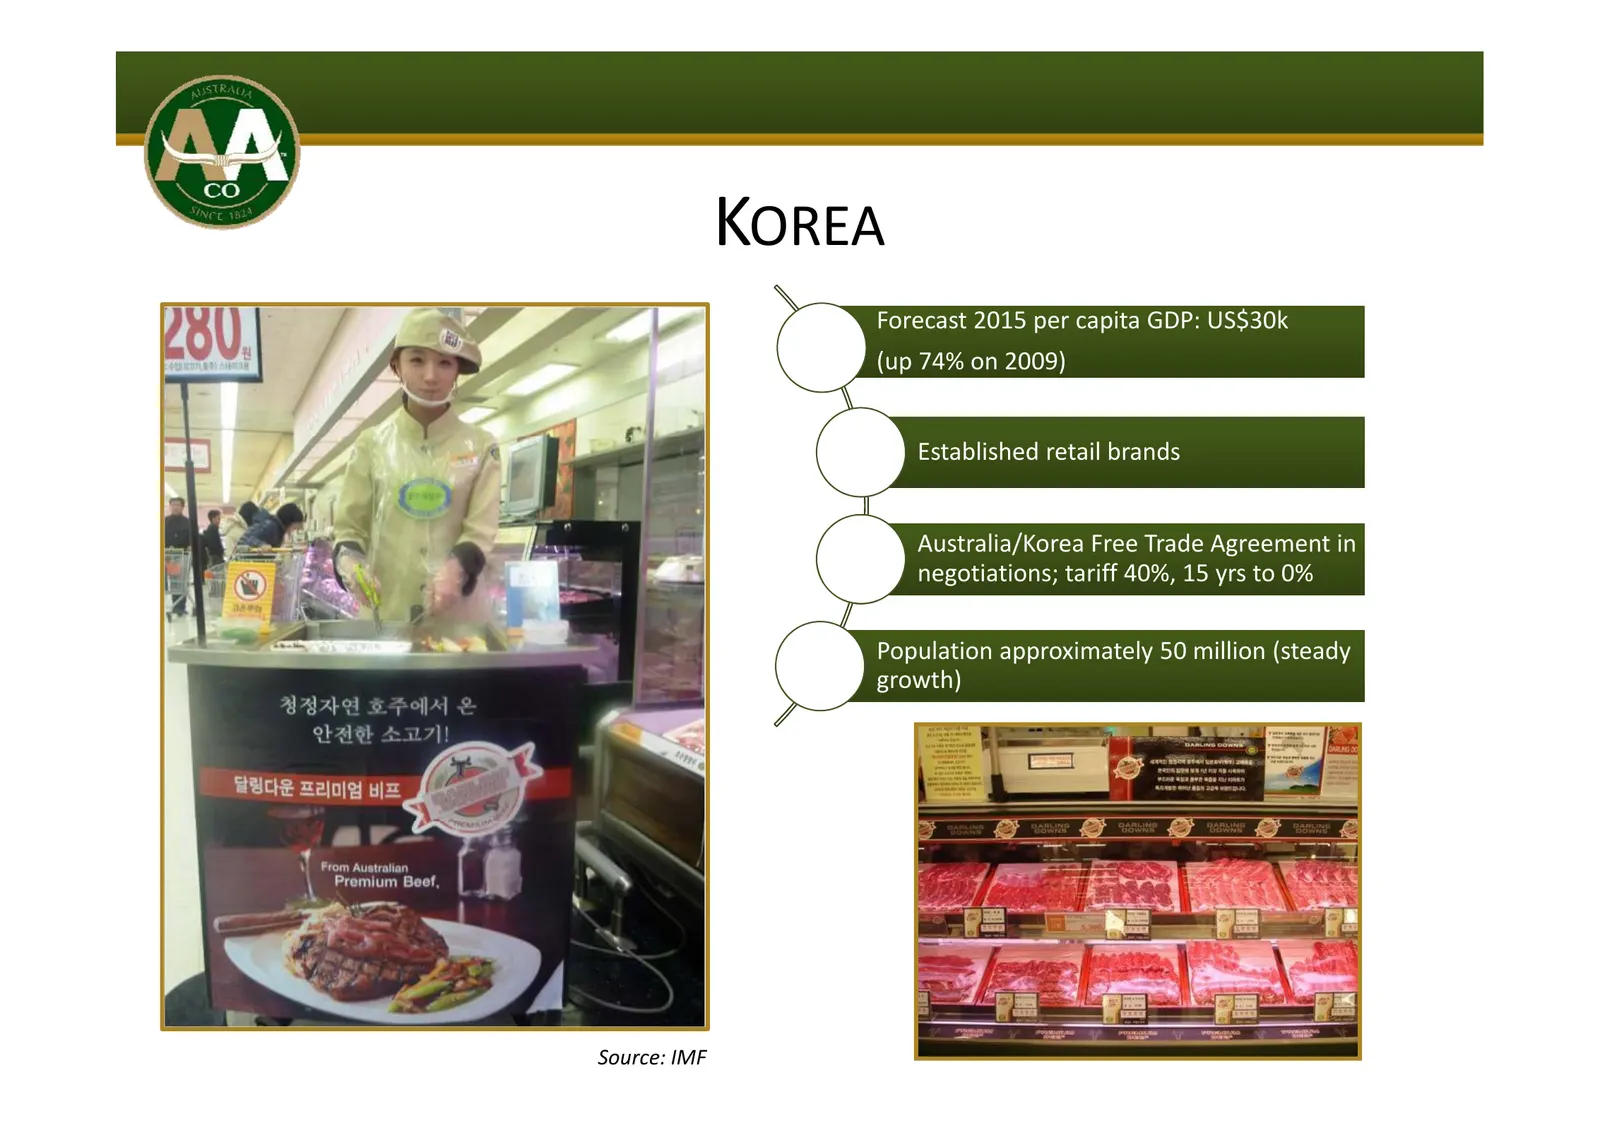
Slide 1: Korea
KOREA Forecast 2015 per capita GDP: US$30k (up 74% on 2009) Established retail brands Australia/Korea Free Trade Agreement in negotiations; i i tariff iff 40% 40%, 15 yrs to 0% Population approximately 50 million (steady growth) Source: IMF
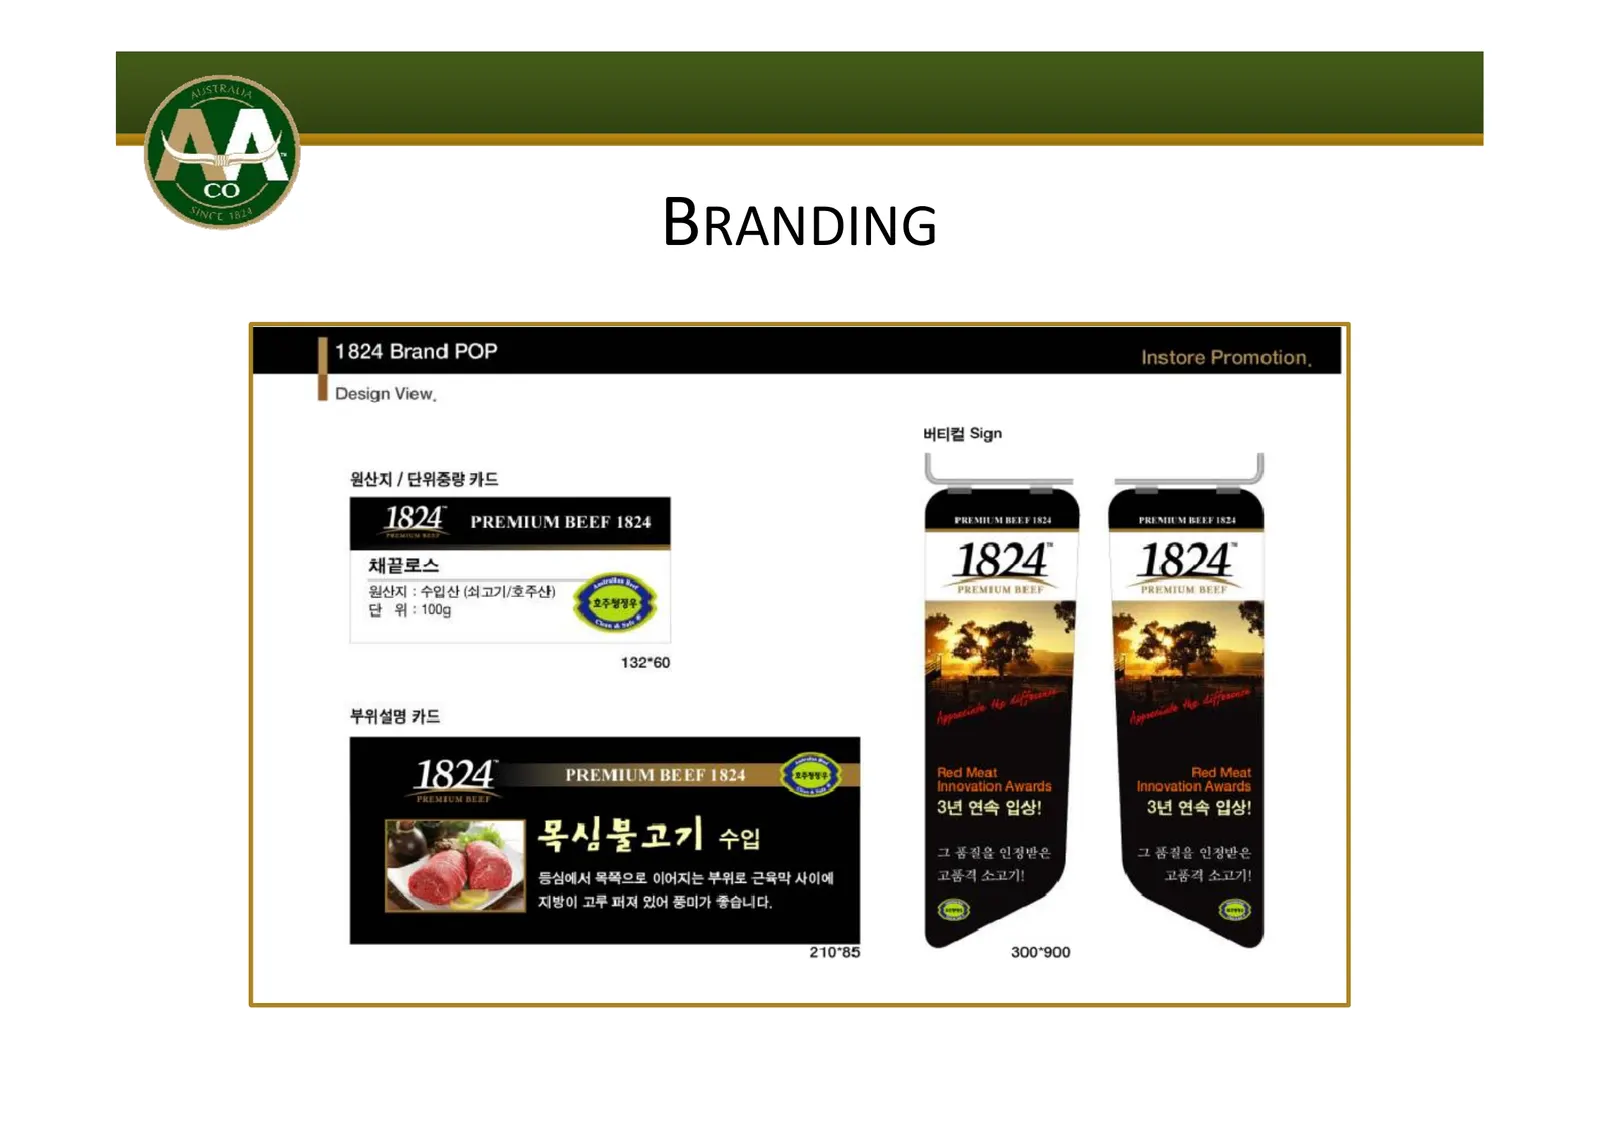
Slide 2: Branding
co 1824 Brand POP Design View. att] / SASS IS BRANDING ABeA 9: 100g BAA : $e4t (ADS RAH &3 FH 98 7S 132*°60 PREMIUM BEEF 1824 ZA 527] +3 SAHA S422 OA FAS DH Apolo Ai Ho) DF A VO} Sol7} SScich. 210°6S HEI® Sign PREMIUM BEEF 1824 PREMIUM REEF 1824 “PREMIUM BEEF “PREMIUM BEEF
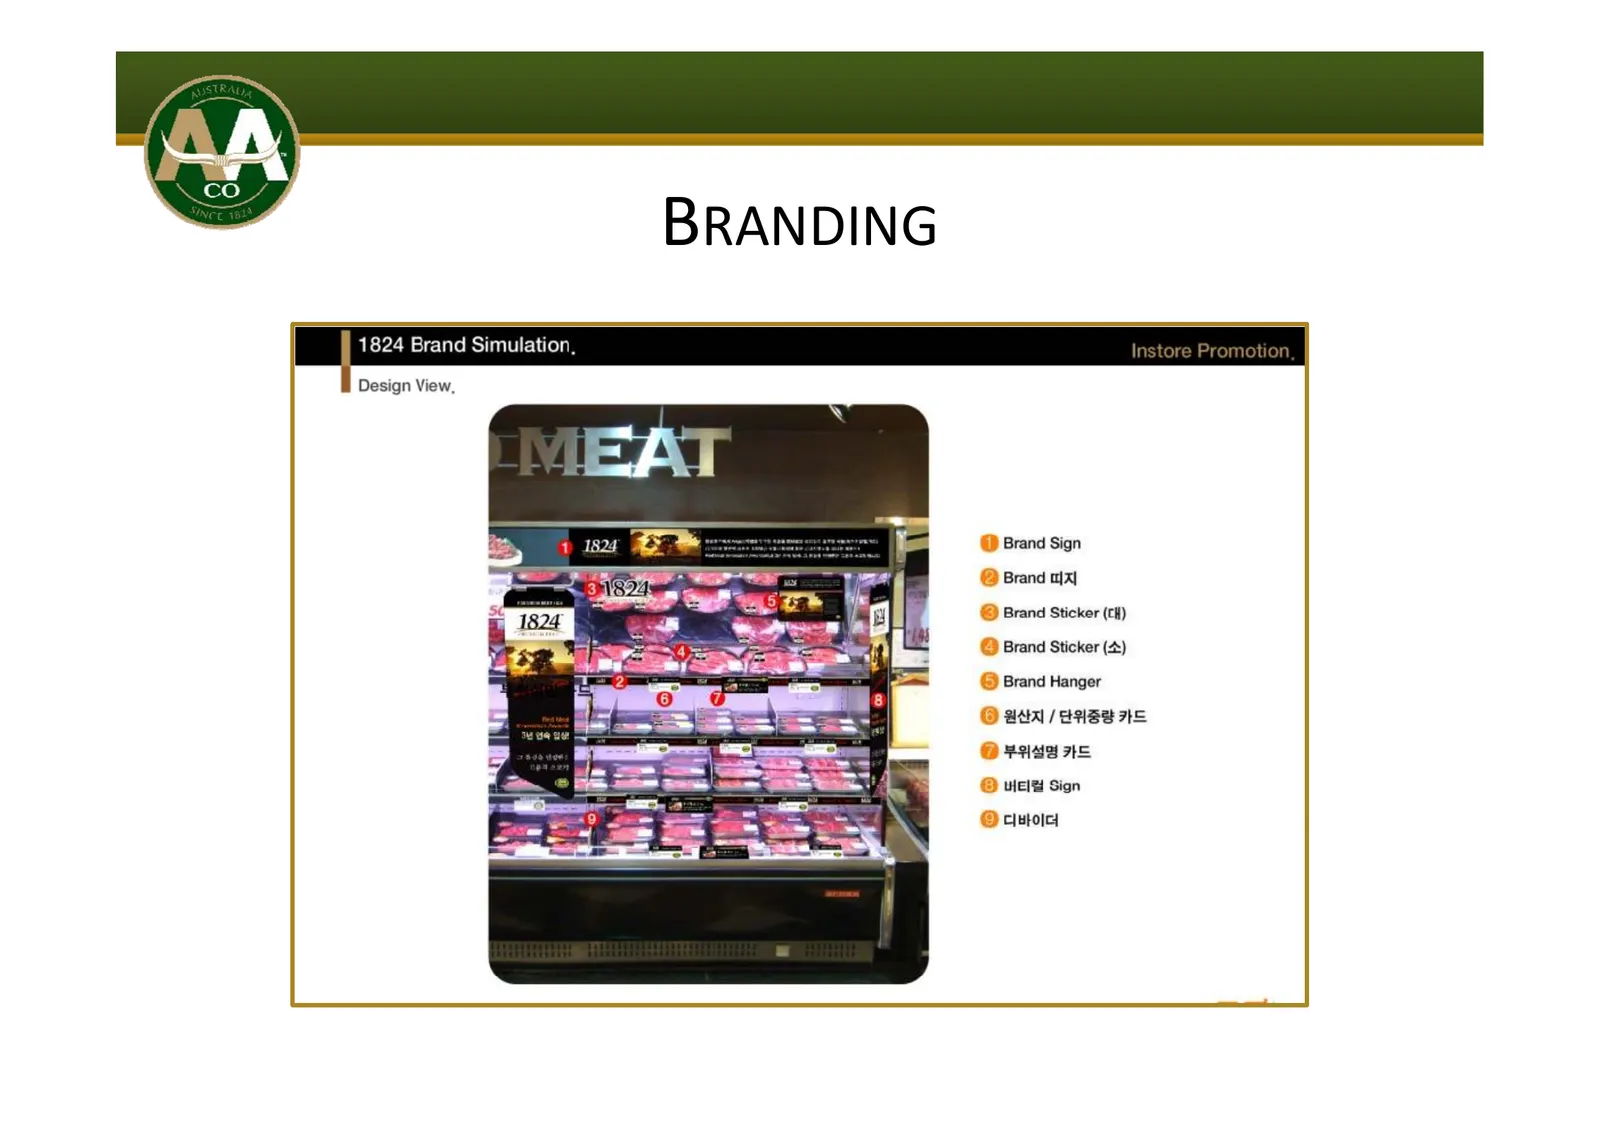
Slide 3: Branding
co BRANDING 1824 Brand Simulation, Design View, @ Brand Sign @ Brand az) @ Brand Sticker (cH) © Brand Sticker (4) @ Brand Hanger O aaa / ase 2e @ e944 7£ © uel Sign © cutoicy
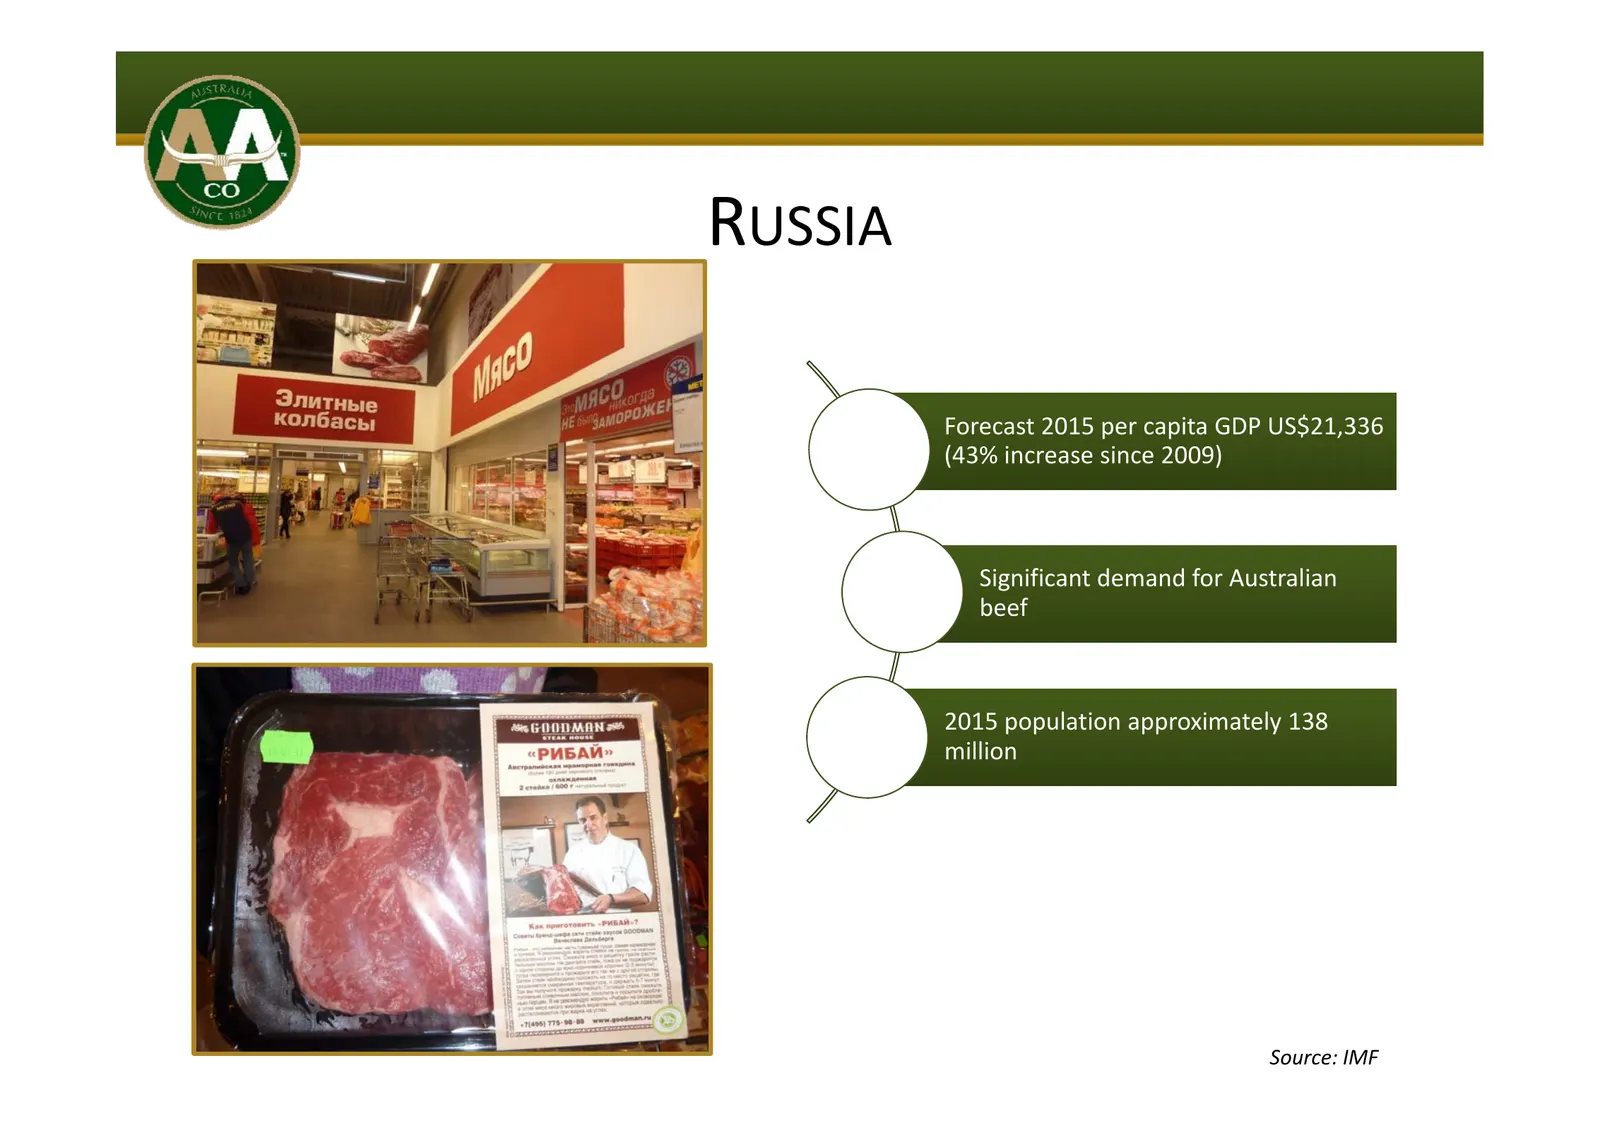
Slide 4: Russia
RUSSIA Forecast 2015 p per capita p GDP US$21,336 $ , (43% increase since 2009) Significant demand for Australian beef 2015 population approximately 138 million Source: IMF
Slide 5: China
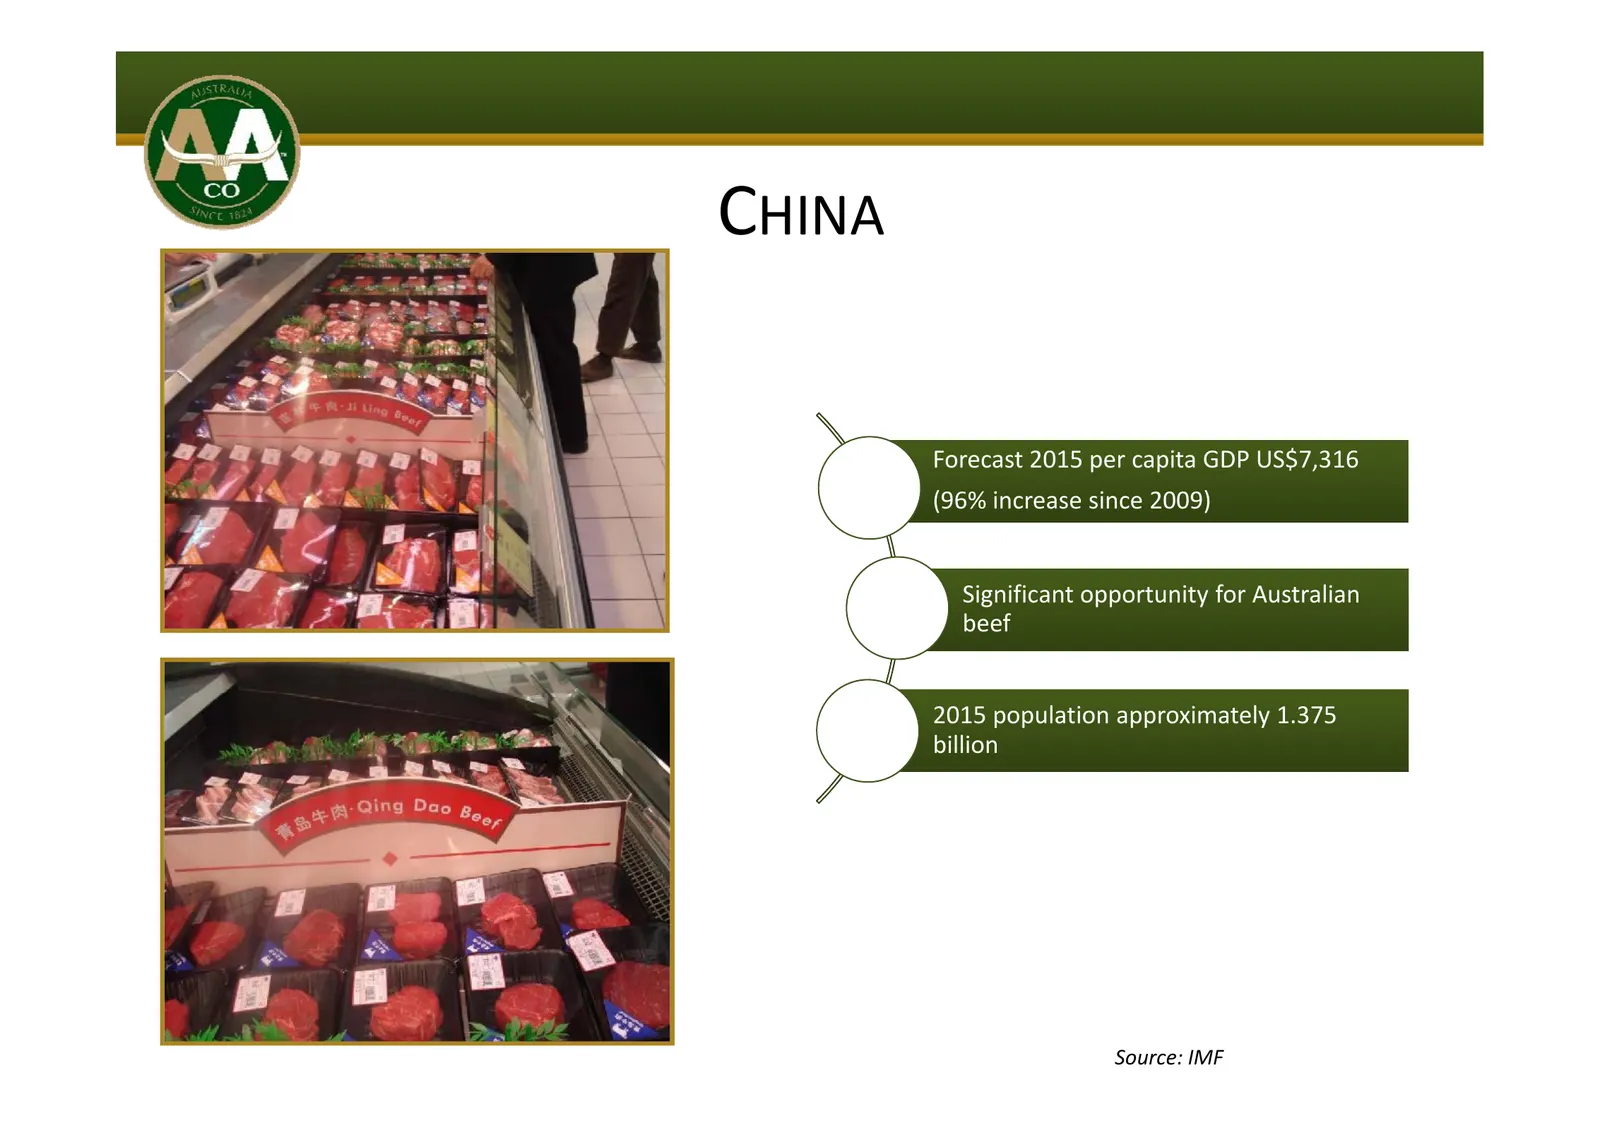
CHINA Forecast 2015 per capita GDP US$7,316 (96% increase since 2009) Significant opportunity for Australian beef 2015 population approximately 1.375 billion Source: IMF
Slide 6: Beef Group Strengths
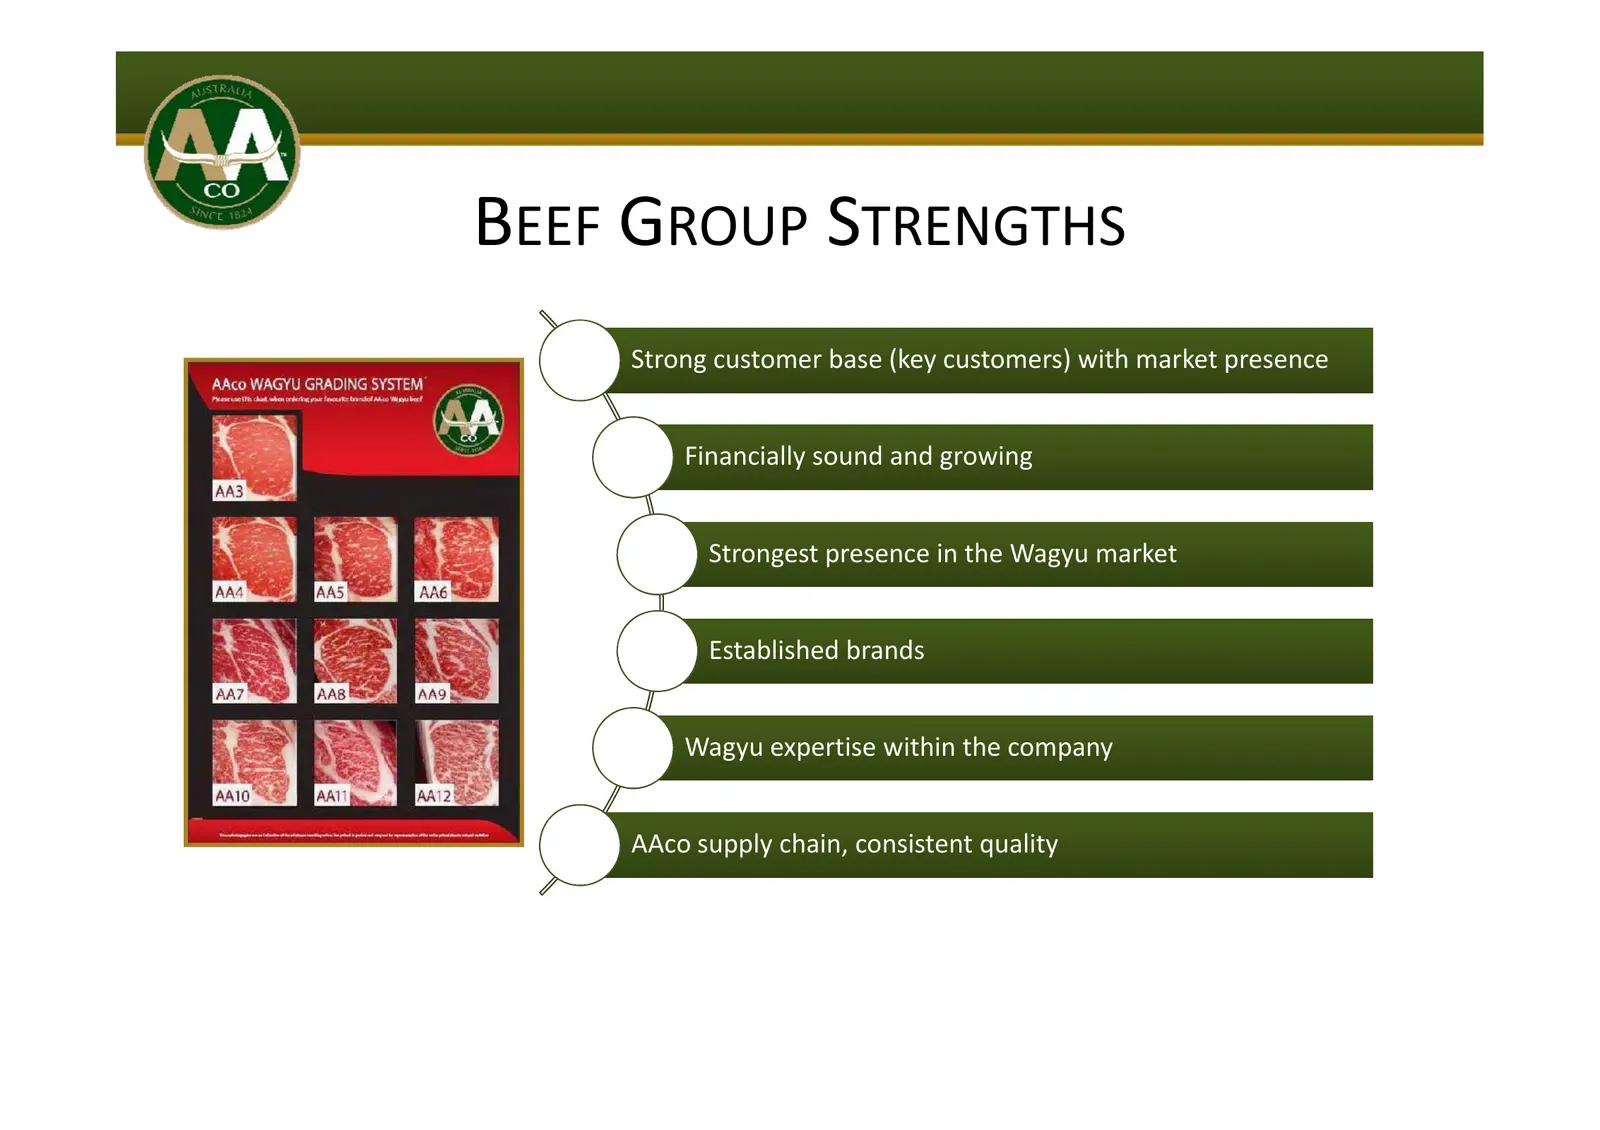
BEEF GROUP STRENGTHS Strong customer base (key customers) with market presence Financially sound and growing Strongest g p presence in the Wagyu gy market Established brands Wagyu expertise within the company AAco supply chain, consistent quality
Slide 7: Meat Trading Focus on Growth
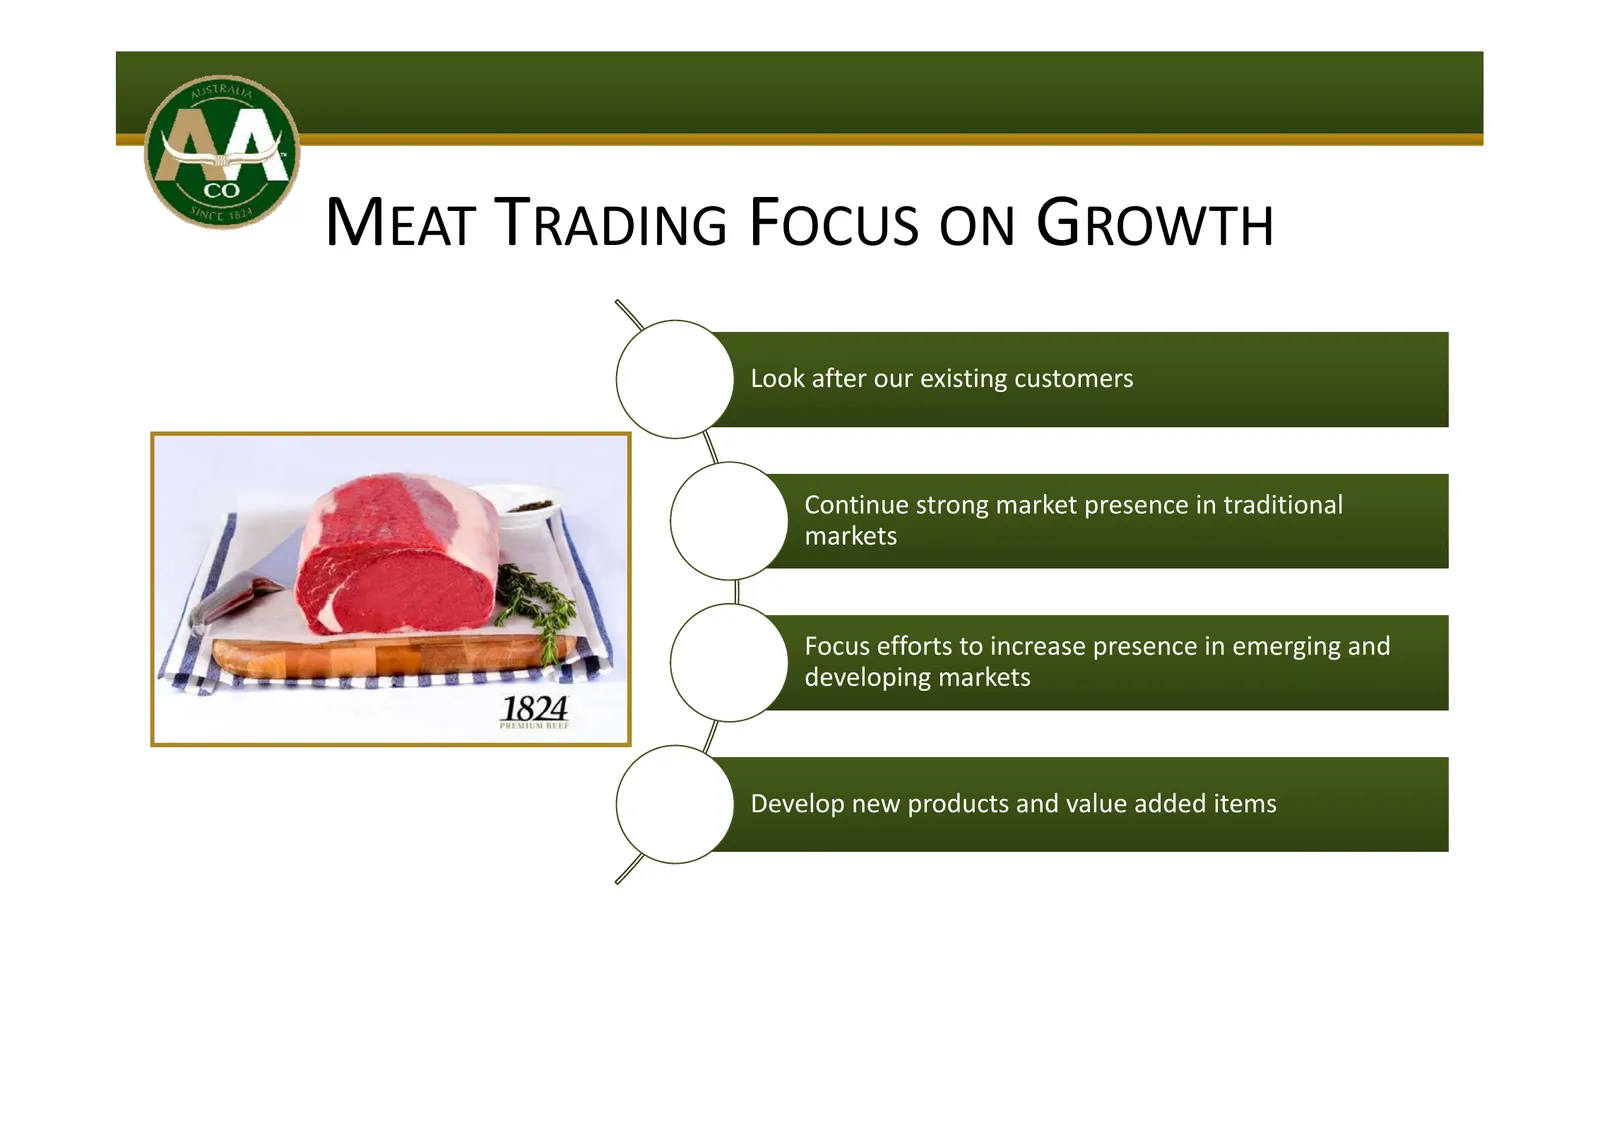
MEAT TRADING FOCUS ON GROWTH Look after our existing customers Continue strong market presence in traditional markets Focus efforts to increase presence in emerging and developing markets Develop new products and value added items
Slide 8: New Product Development
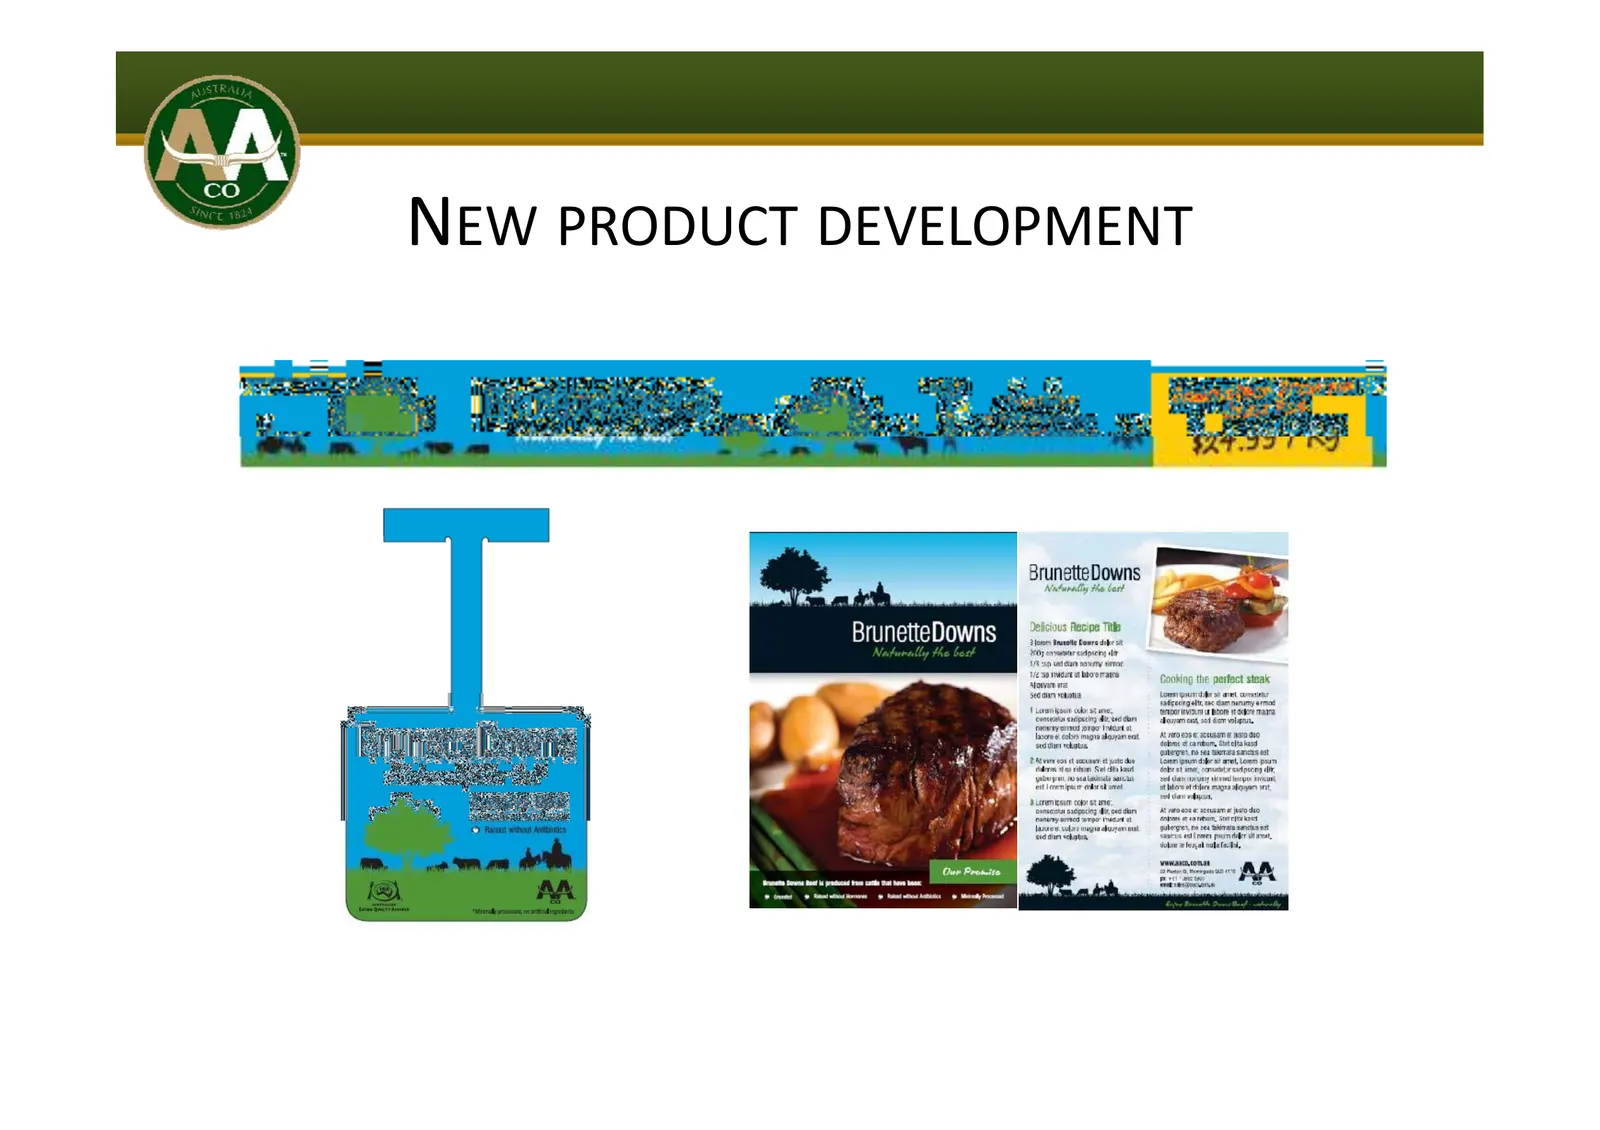
NEW PRODUCT DEVELOPMENT BrunetteDowns Nnurally the best Delicious Recine Title 2 over Bante Cours dk 2% 203 onset siden ir 18 se tt are wey sere Ve'sp naat bboorratra Swen are Seen veka 1 Lorri cob 3 ‘contenu sacescing ee 4c dary ‘pane erncd sarge" ert at Itnore cole magna lasram erat sed ir van van
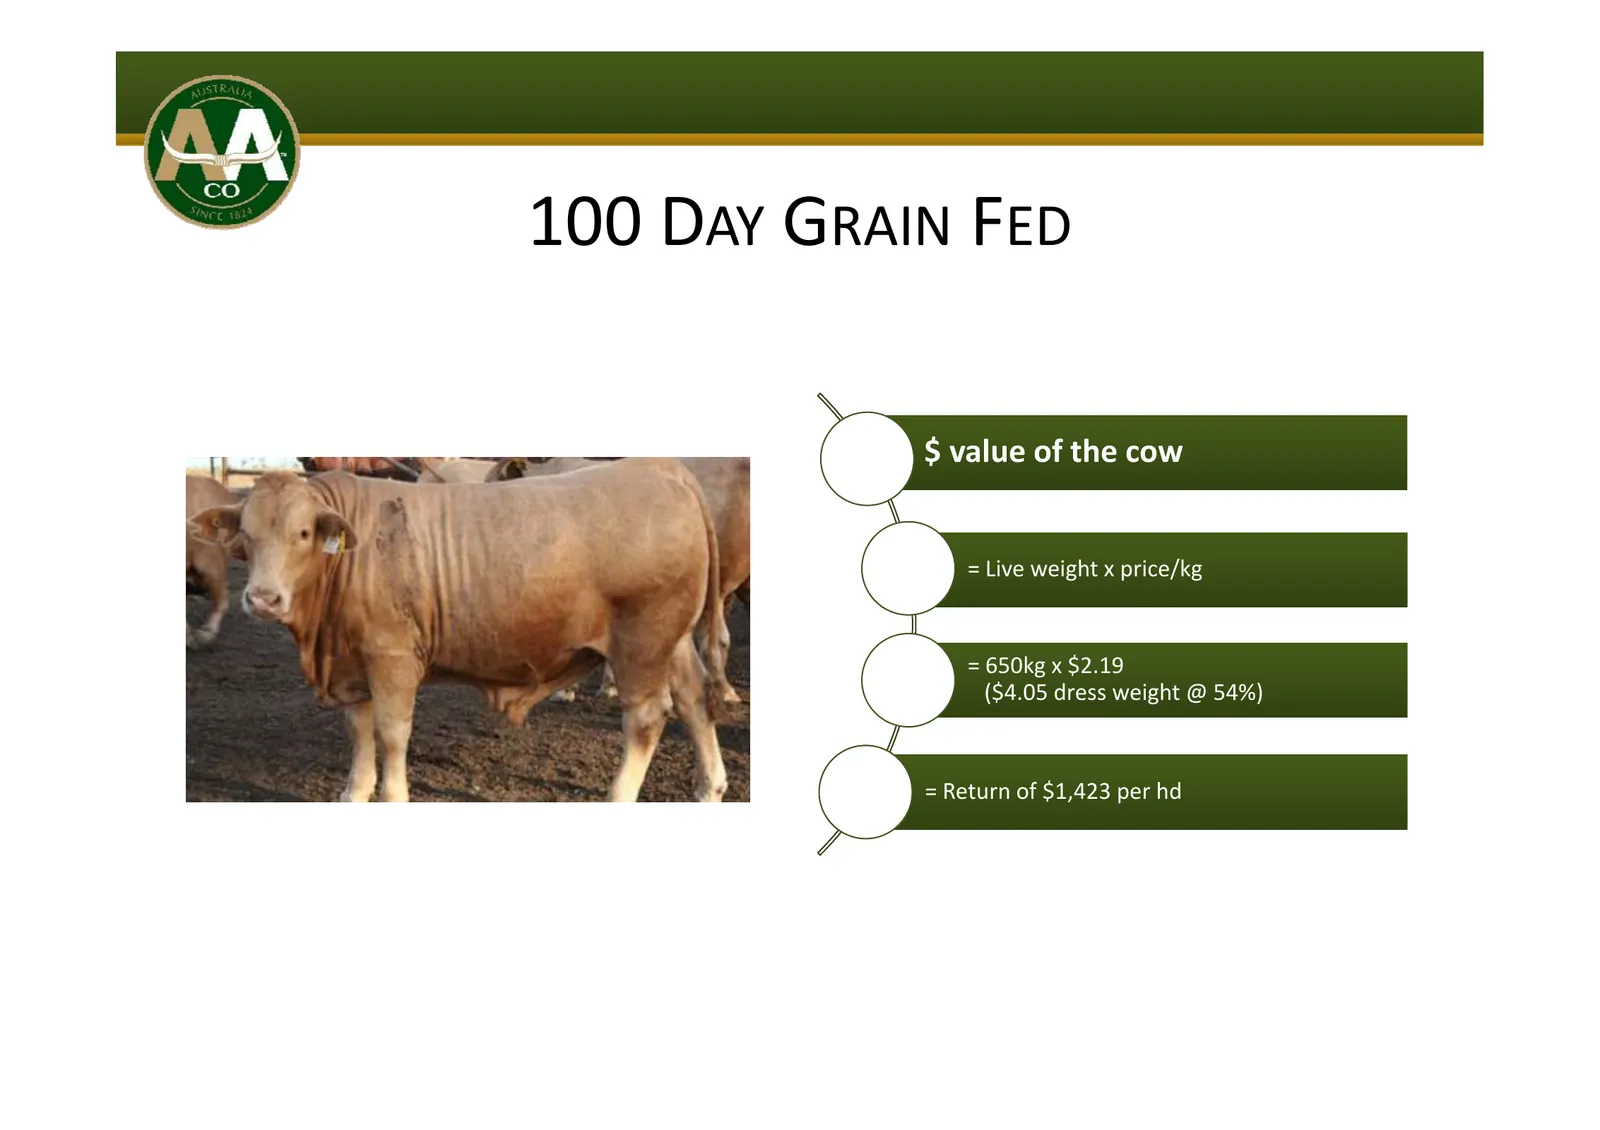
Slide 9: 100 Day Grain Fed
100 DAY GRAIN FED $ value of the cow = Live Li weight i ht x price/kg i /k = 650kg x $2.19 ($4 05 dress weight @ 54%) ($4.05 = Return of $1,423 per hd
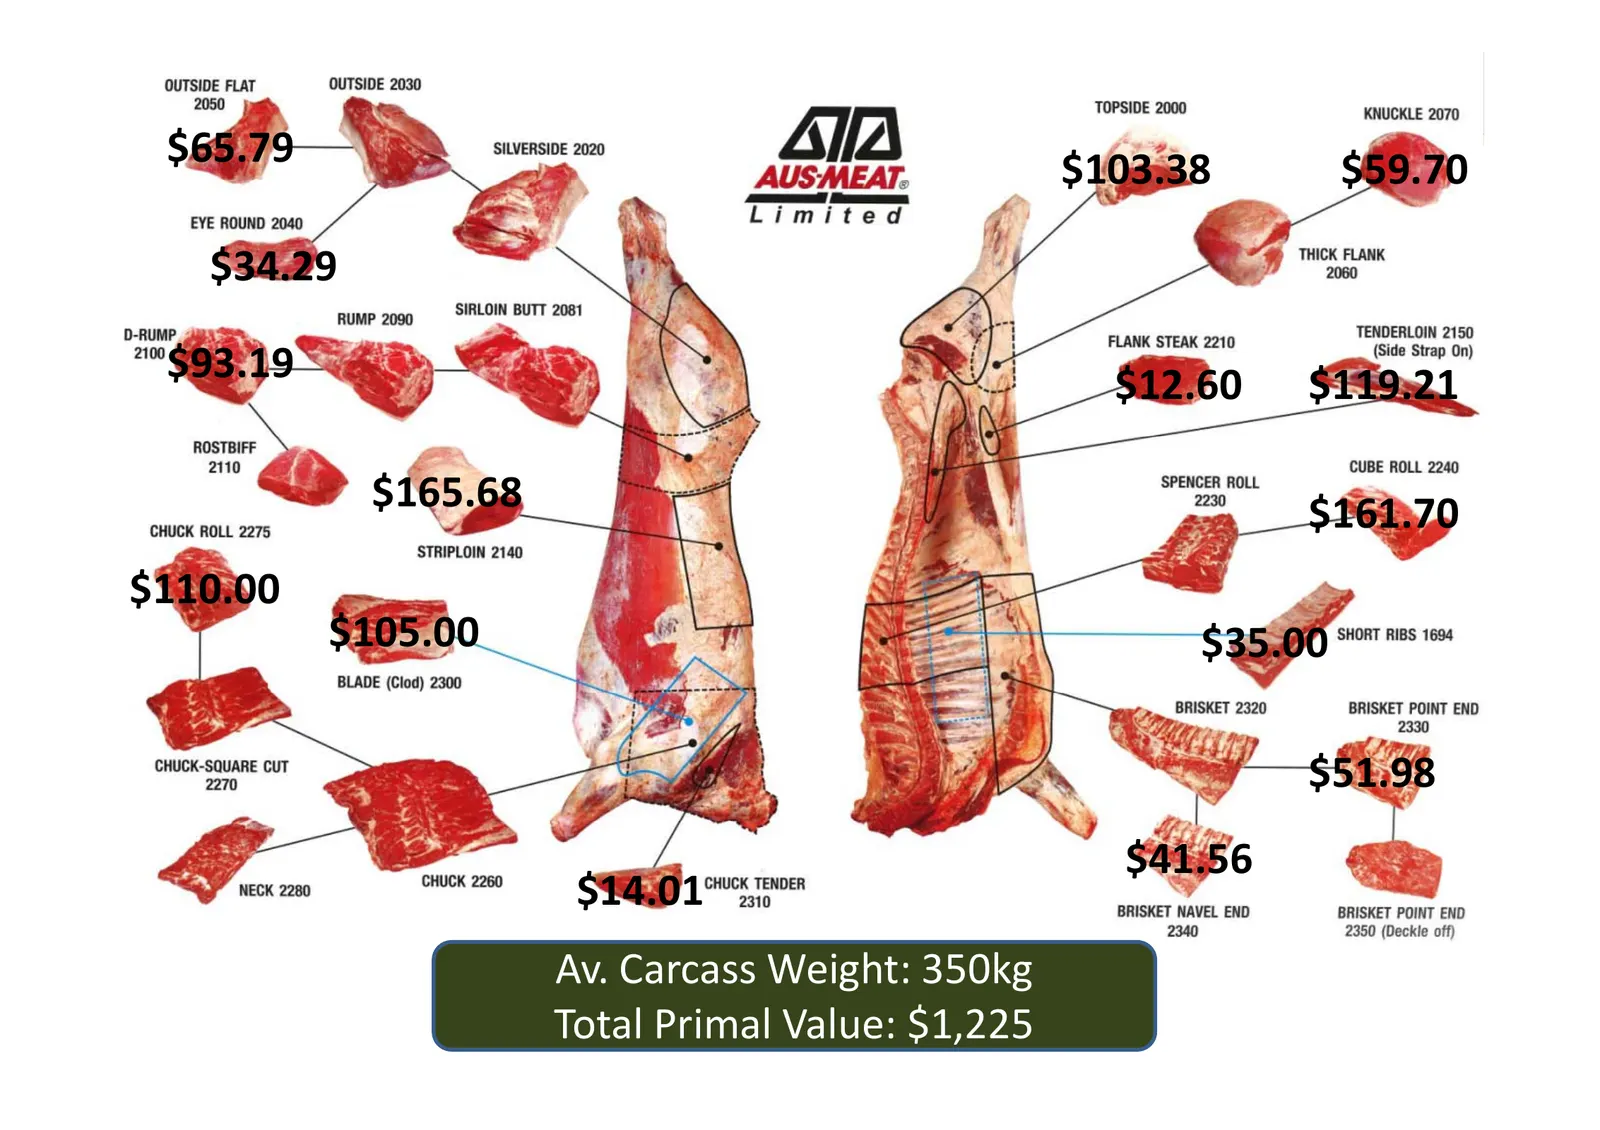
Slide 10: Average Carcass Weight: 350kg, Total Primal Value
$65.79 $103.38 $59.70 $34.29 $93.19 $12.60 $119.21 $165.68 $161.70 $110.00 $105.00 $35.00 $51.98 $41.56 $14.01 Av. Carcass Weight: 350kg Total Primal Value: $1,225
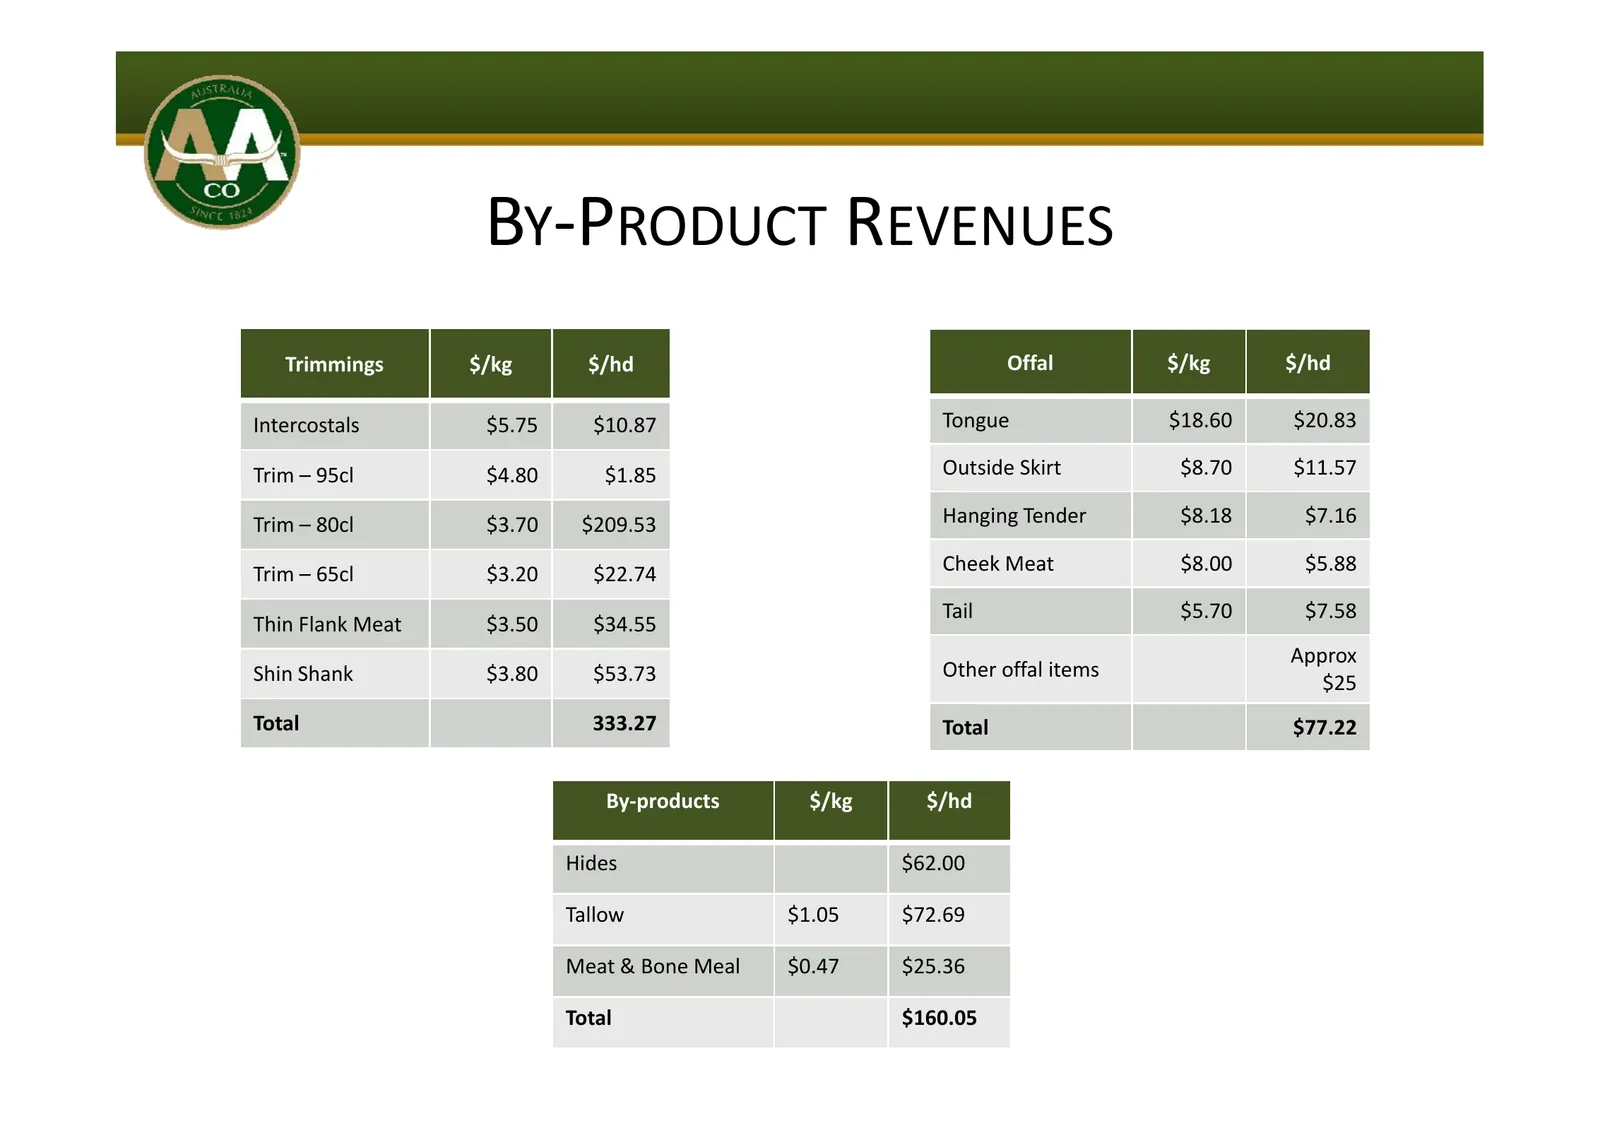
Slide 11: By-Product Revenues
BY‐PRODUCT REVENUES Trimmings $/kg $/hd Offal $/kg $/hd Intercostals $5.75 $10.87 Tongue $18.60 $20.83 Trim – 95cl $4.80 $1.85 Outside Skirt $8.70 $11.57 Trim – 80cl $3.70 $209.53 Hanging Tender $8.18 $7.16 Trim – 65cl $ $3.20 $ $22.74 Cheek Meat $8 00 $8.00 $5 88 $5.88 Tail $5.70 $7.58 Thin Flank M
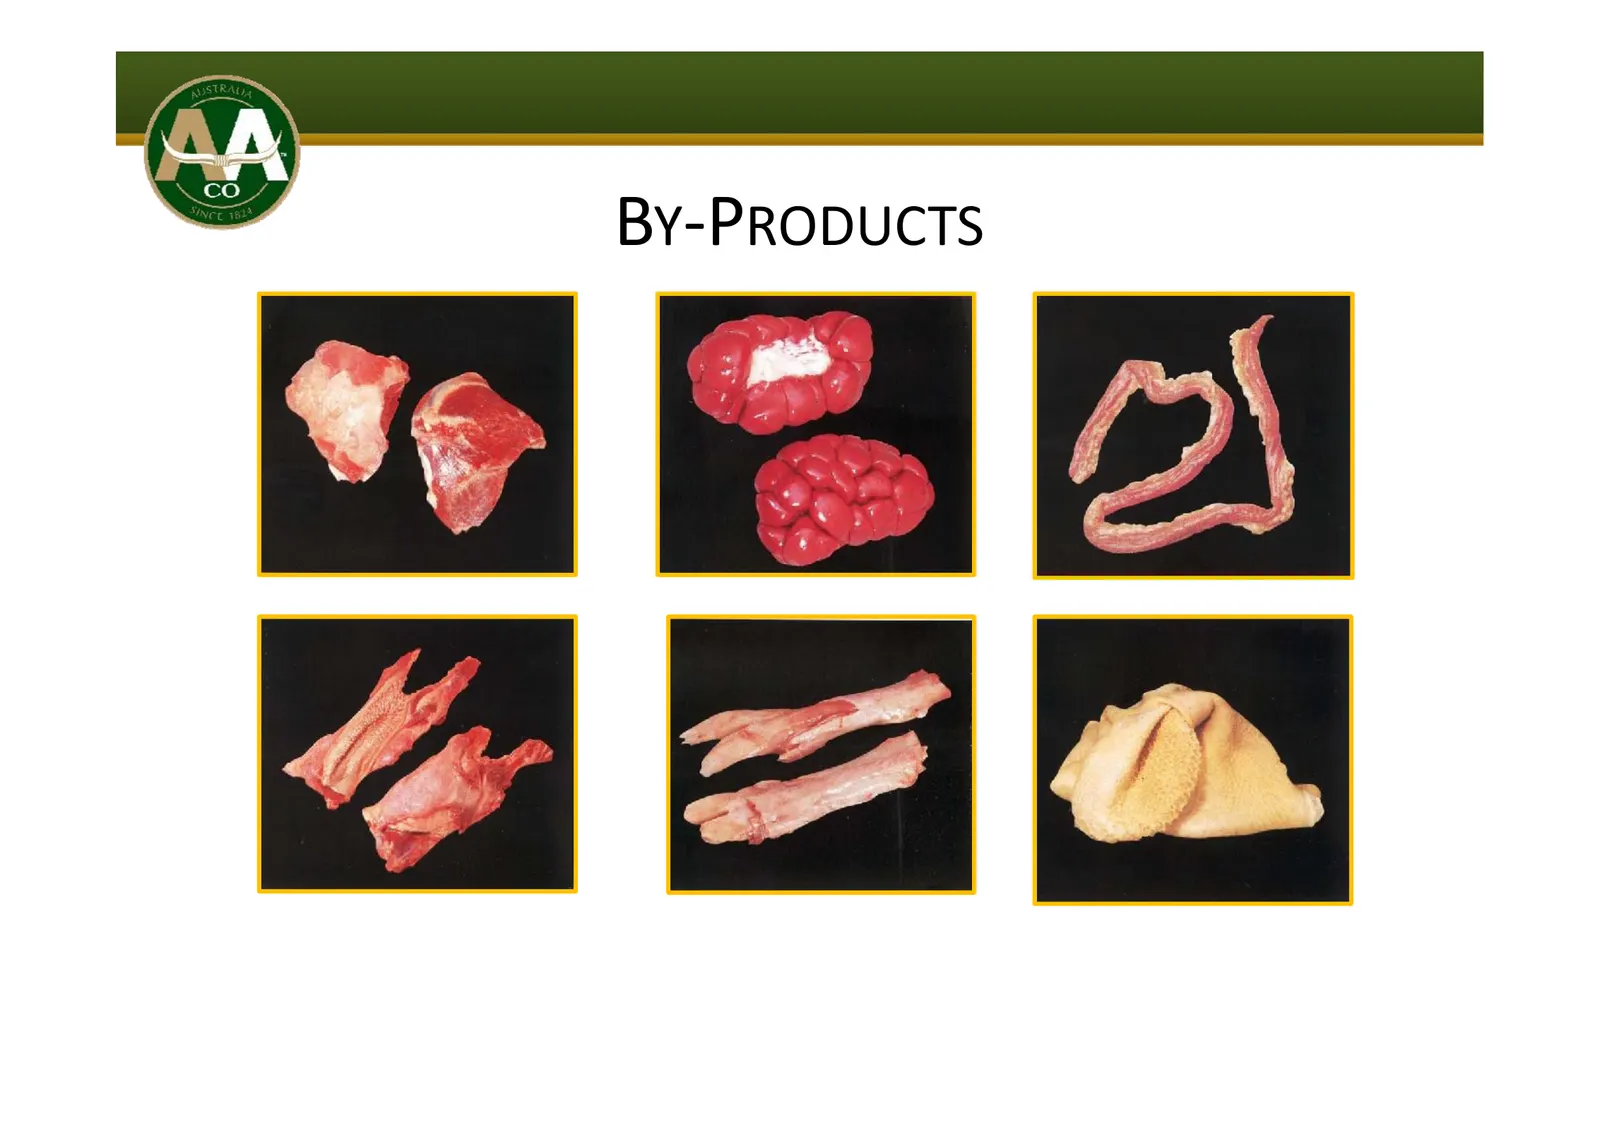
Slide 12: By-Products
BY‐PRODUCTS
Slide 13: Value Added Revenue
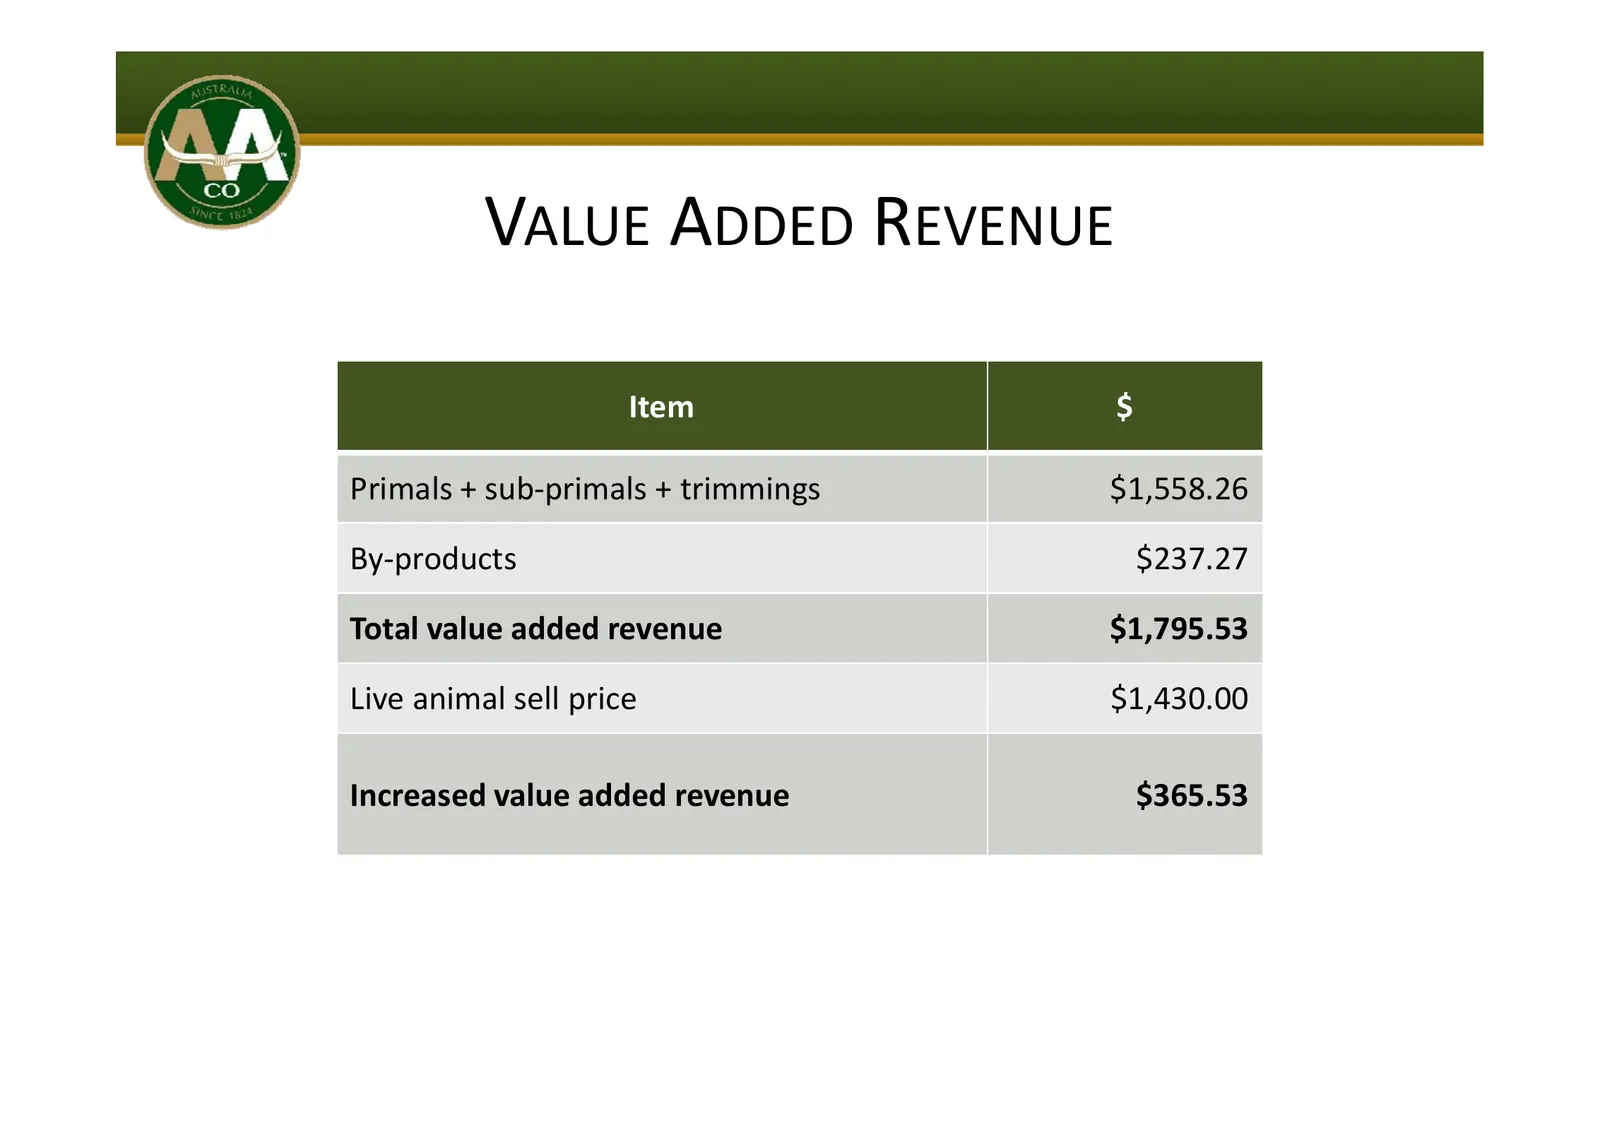
VALUE ADDED REVENUE Item $ Primals + sub‐primals + trimmings $1,558.26 By‐products By products $237 27 $237.27 Total value added revenue $1,795.53 Li animal Live i l sellll price i $1 430 00 $1,430.00 Increased value added revenue $365.53
Slide 14: Financial Performance
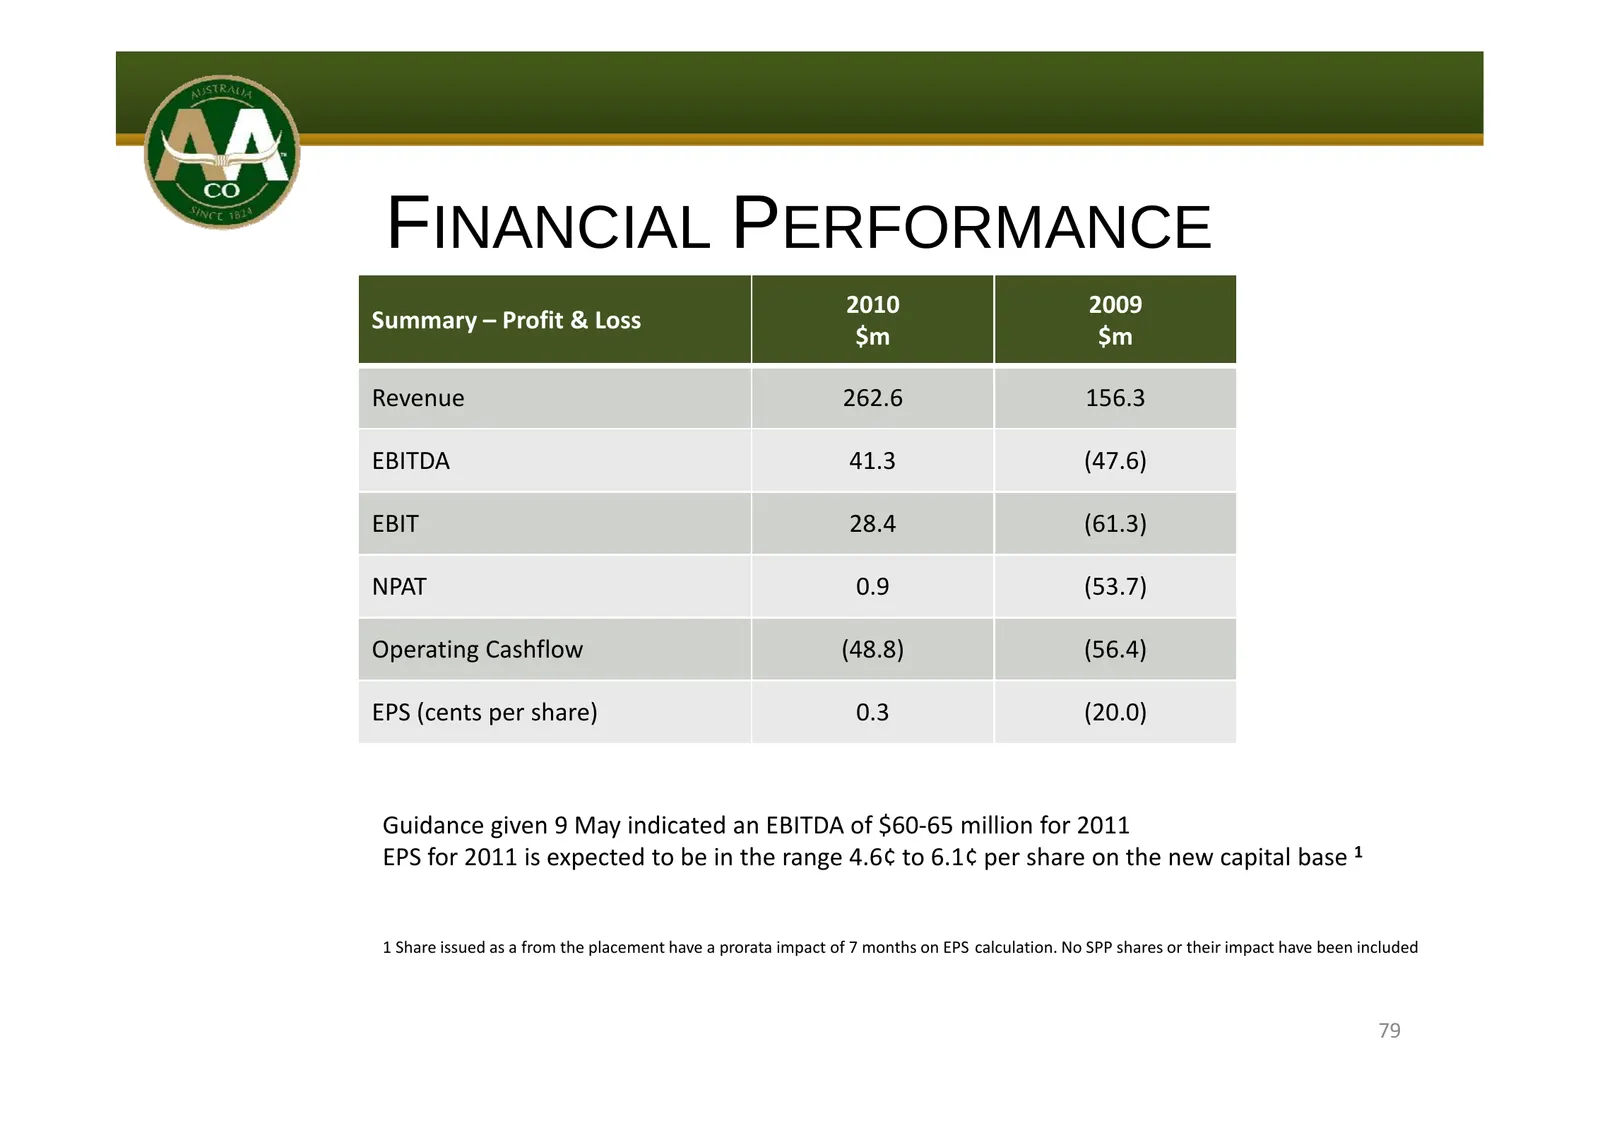
FINANCIAL PERFORMANCE 2010 2009 Summary – Profit & Loss $m $m Revenue 262.6 156.3 EBITDA 41.3 (47.6) EBIT 28.4 (61.3) NPAT 0.9 (53.7) Operating Cashflow (48.8) (56.4) EPS (cents per share) 0.3 (20.0) Guidance given 9 May indicated an EBITDA of $60$60‐65 65 million for 2011 EPS for 2011 is expected t
Slide 15: Balance Sheet
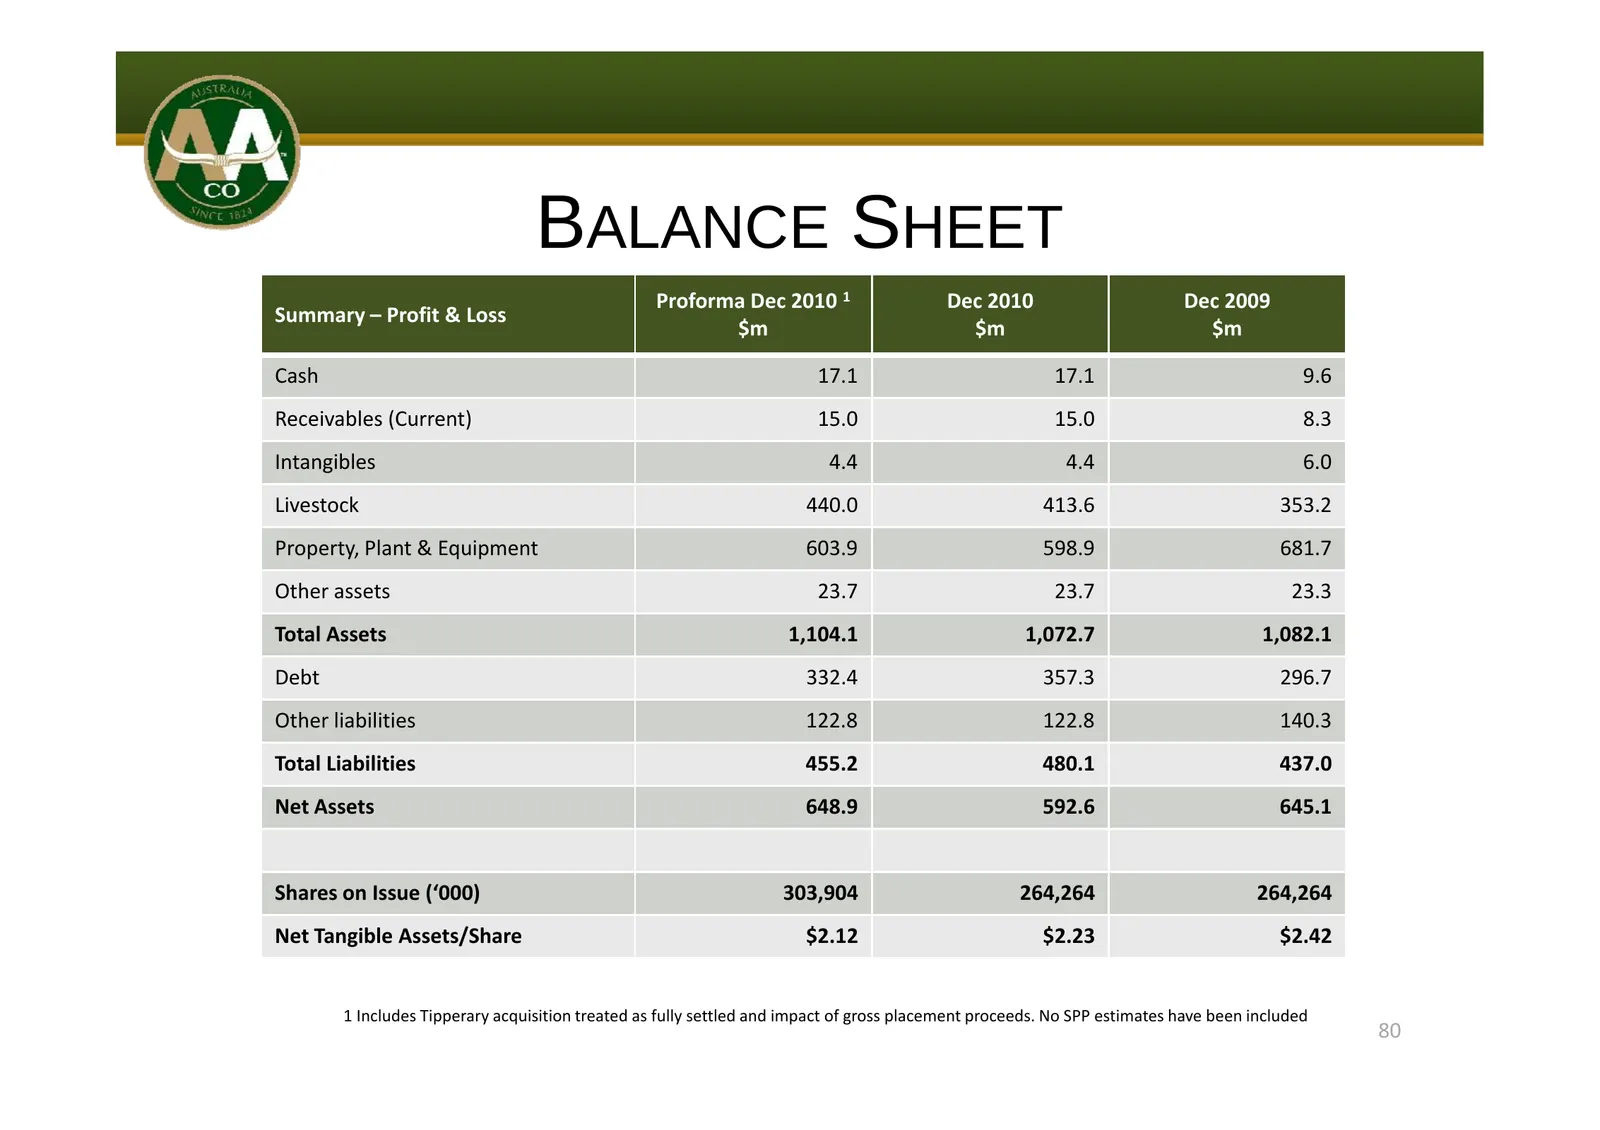
BALANCE SHEET Proforma Dec 2010 1 Dec 2010 Dec 2009 S Summary – Profit P fi & LLoss $m $m $m Cash 17.1 17.1 9.6 Receivables (Current) 15.0 15.0 8.3 Intangibles 4.4 4.4 6.0 Livestock 440.0 413.6 353.2 Property, Plant & Equipment 603.9 598.9 681.7 Other assets 23.7 23.7 23.3 Total Assets 1,104.1 1,072
Slide 16: AACO Capital Management
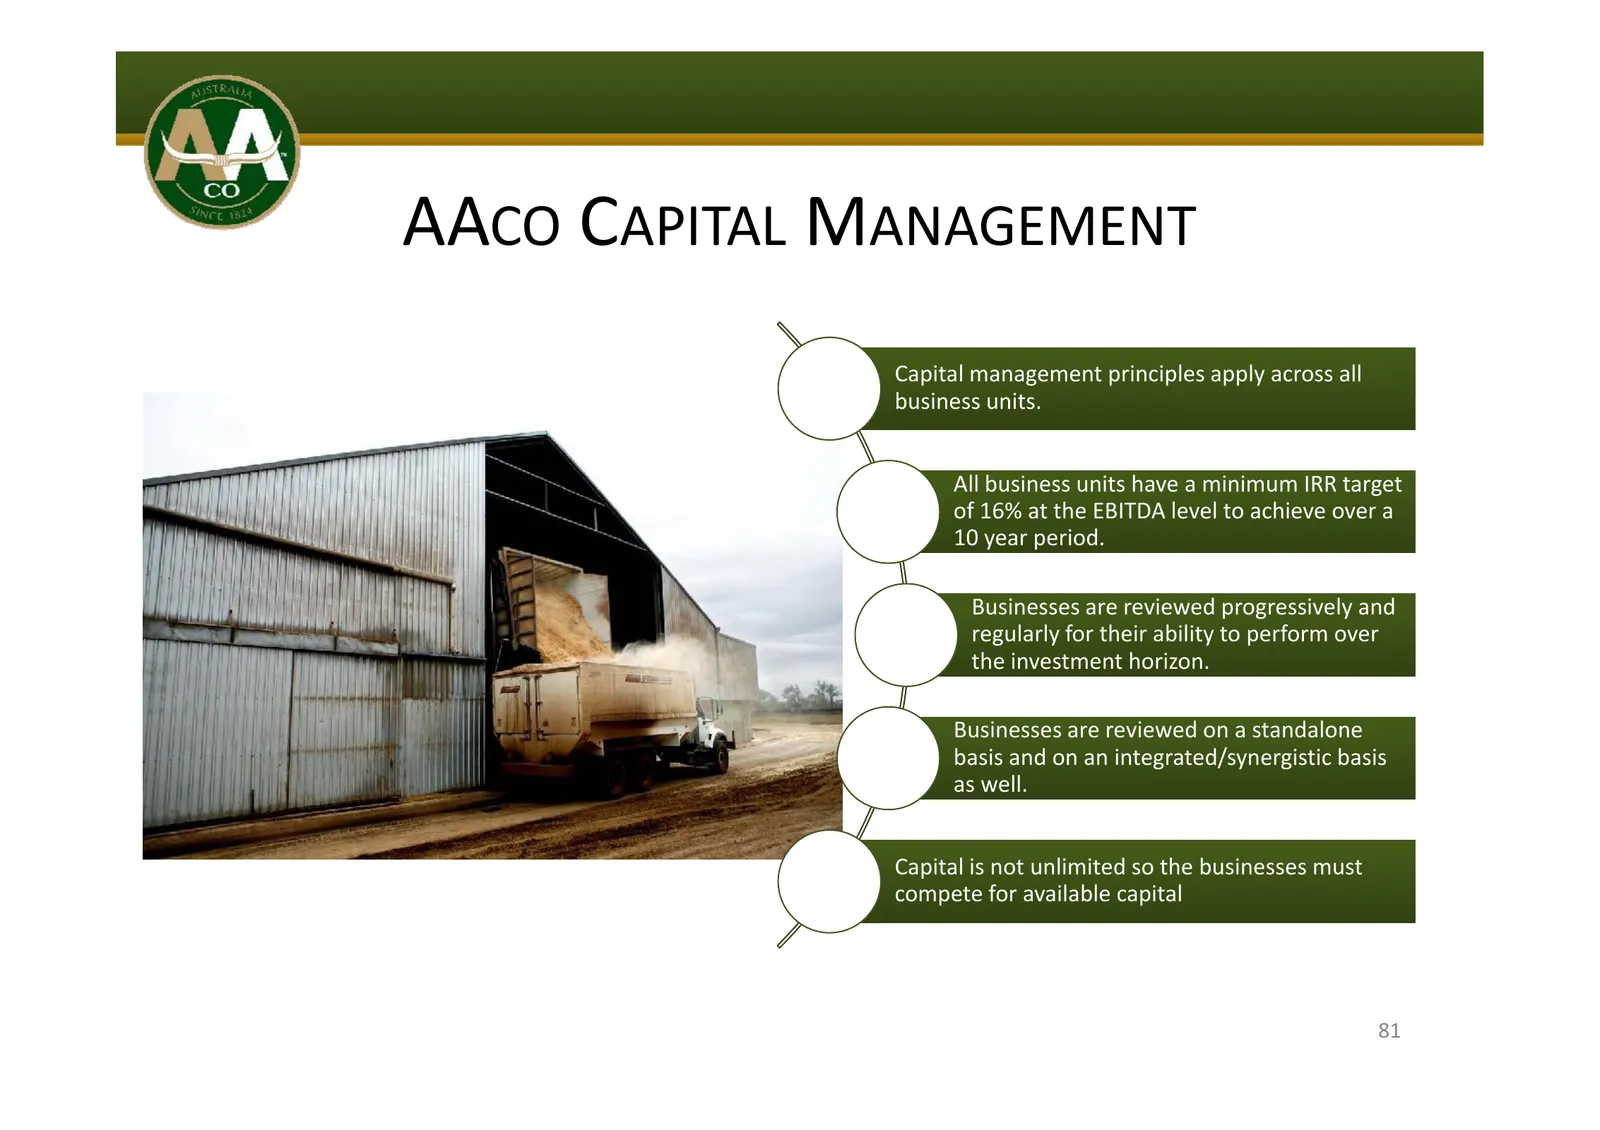
AACO CAPITAL MANAGEMENT Capital management principles apply across all business units. All business units have a minimum IRR target of 16% at the EBITDA level to achieve over a 10 year period. Businesses are reviewed progressively and regularly for their ability to perform over the investment horizo
Slide 17: AACO Capital Management
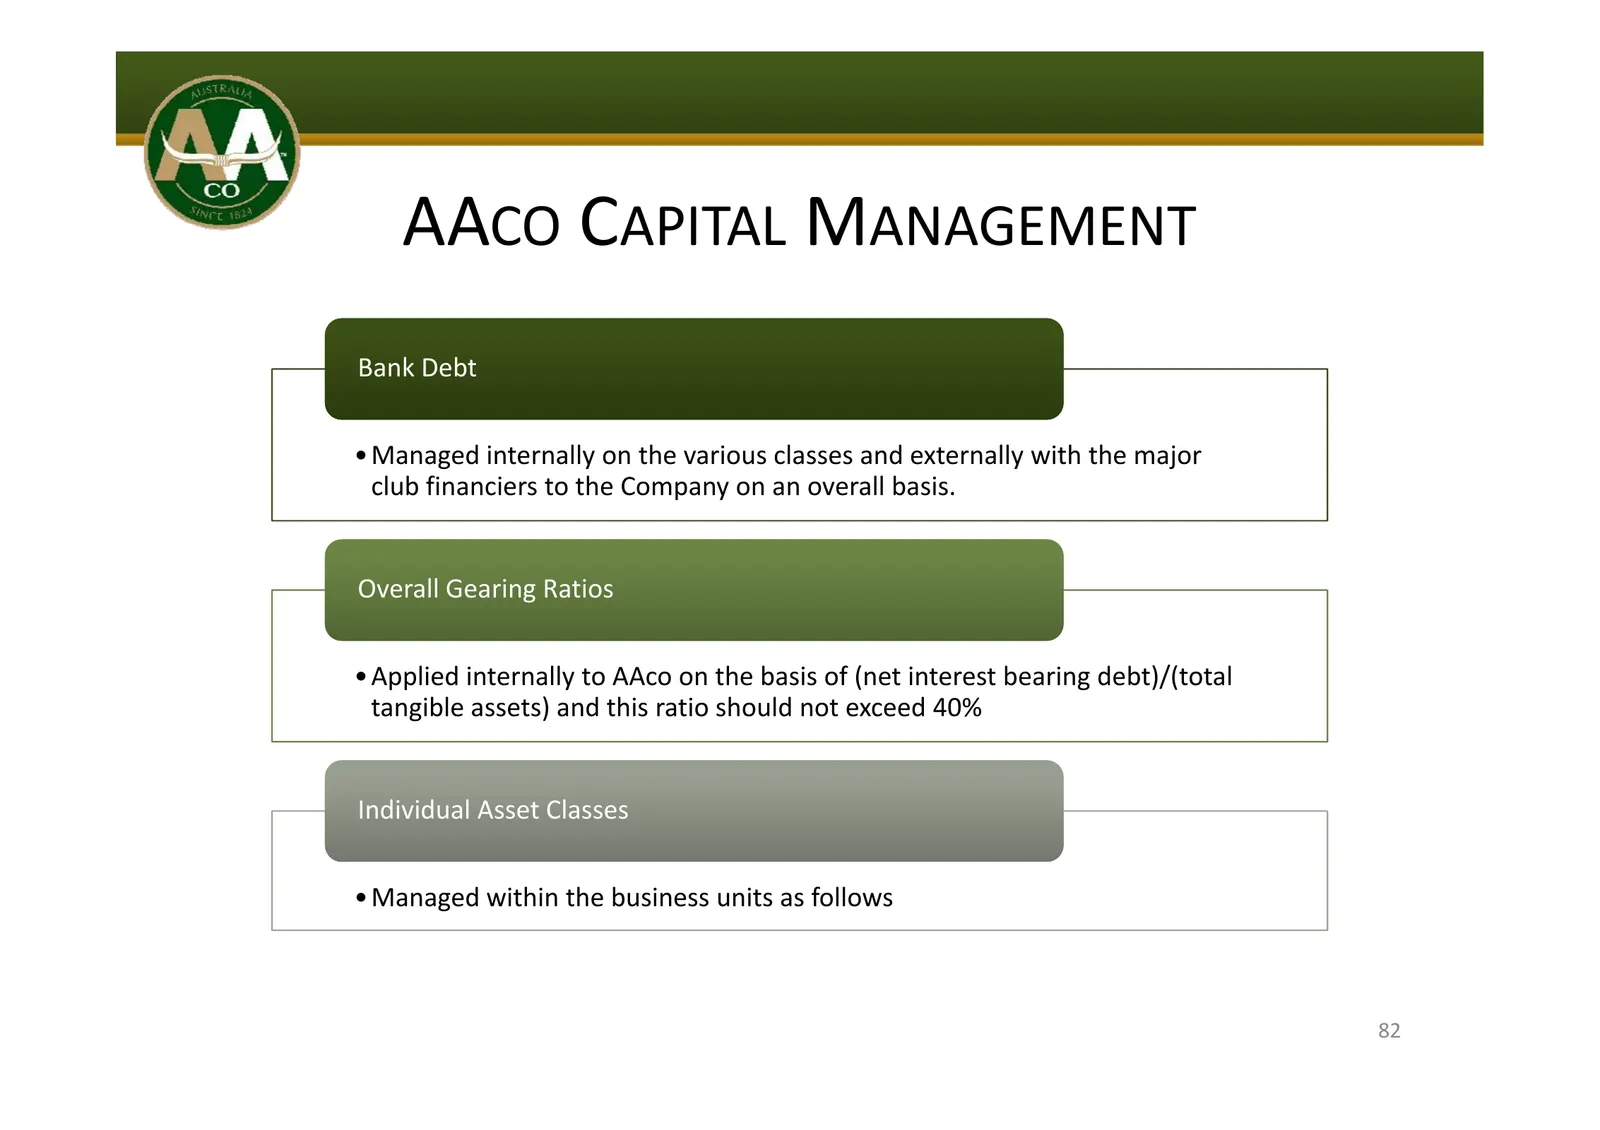
AACO CAPITAL MANAGEMENT Bank Debt • Managed internally on the various classes and externally with the major club financiers to the Company on an overall basis. Overall Gearing Ratios • Applied internally to AAco on the basis of (net interest bearing debt)/(total tangible assets) and this ratio shoul
Slide 18: AACO Capital Management
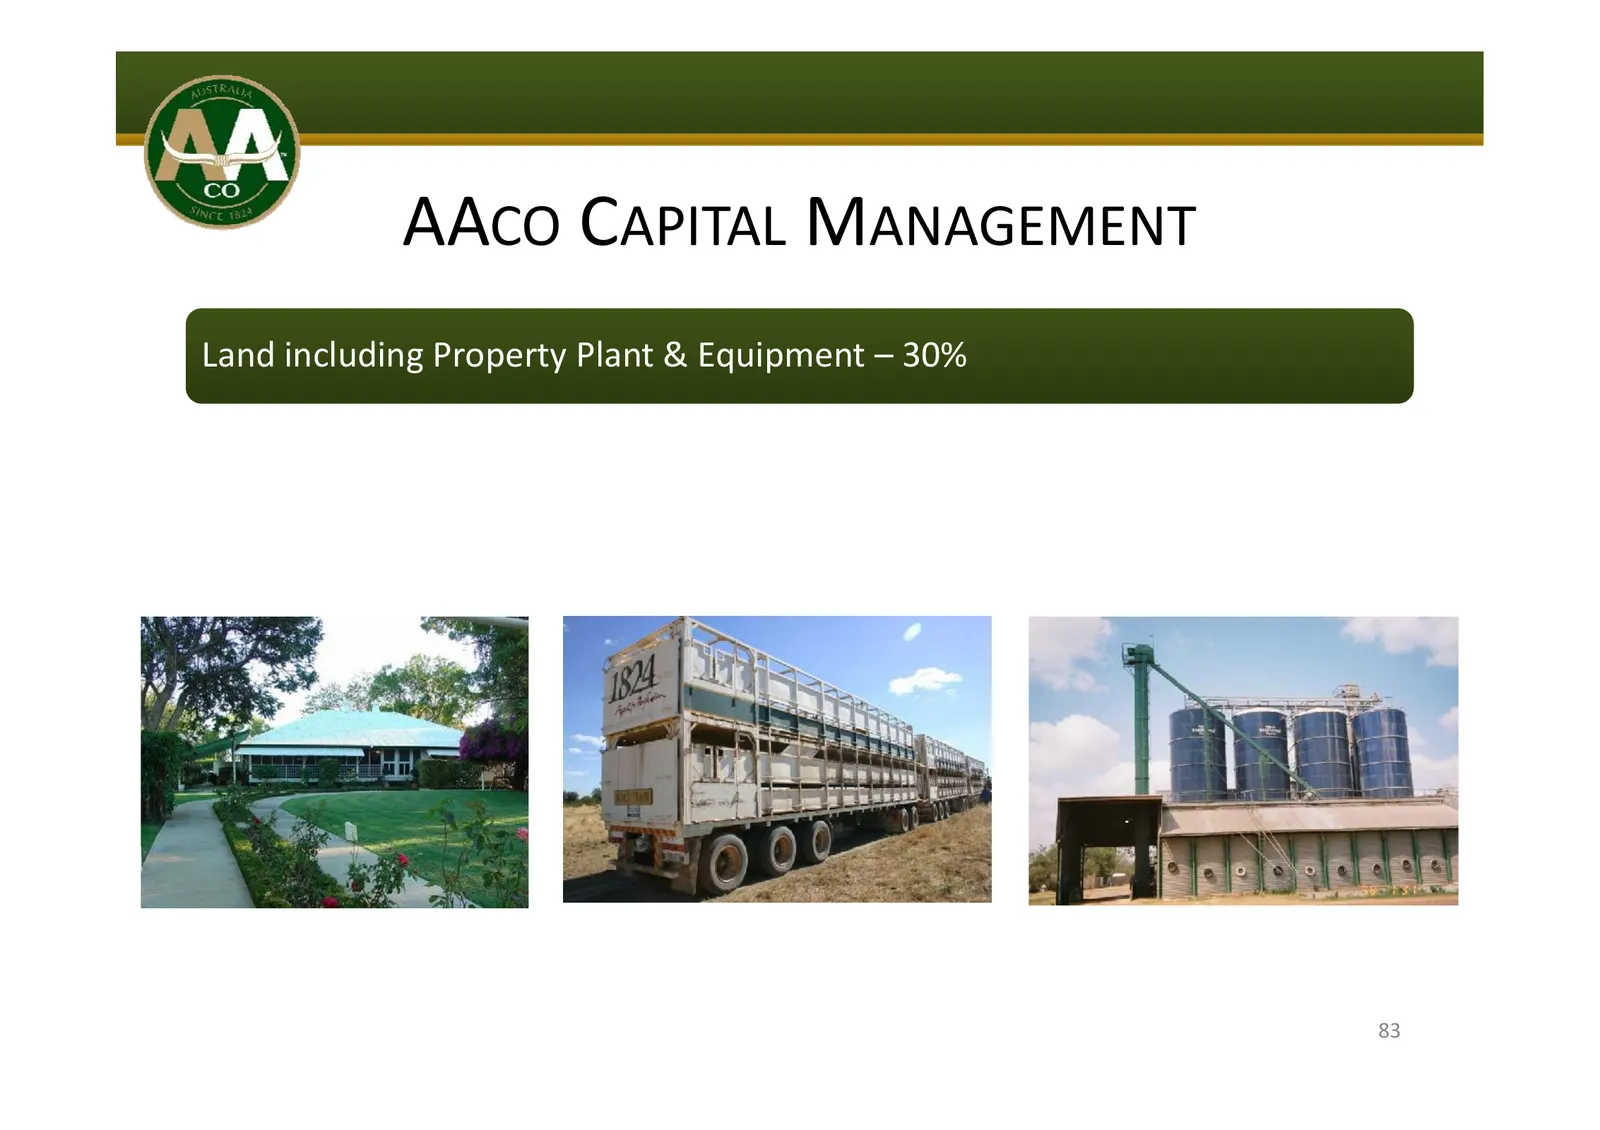
AACO CAPITAL MANAGEMENT Land including Property Plant & Equipment – 30% 83
Slide 19: AACO Capital Management
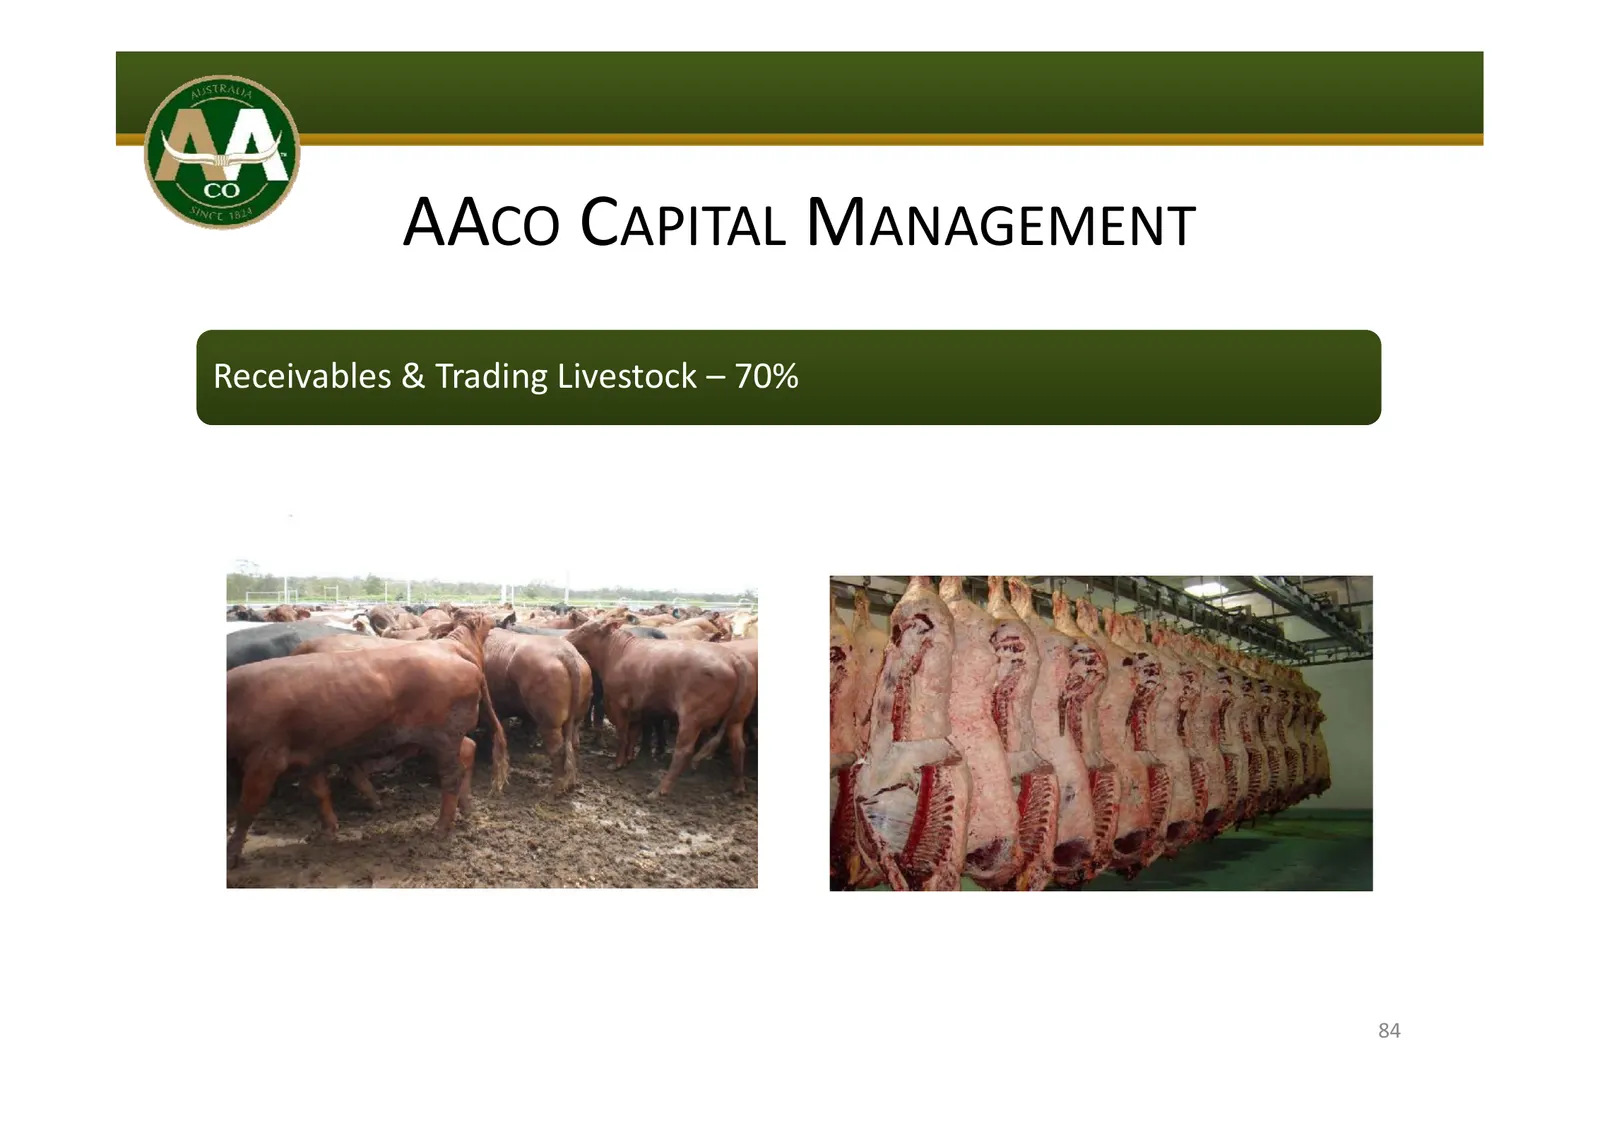
AACO CAPITAL MANAGEMENT Receivables & Trading Livestock – 70% 84
Slide 20: AACO Capital Management
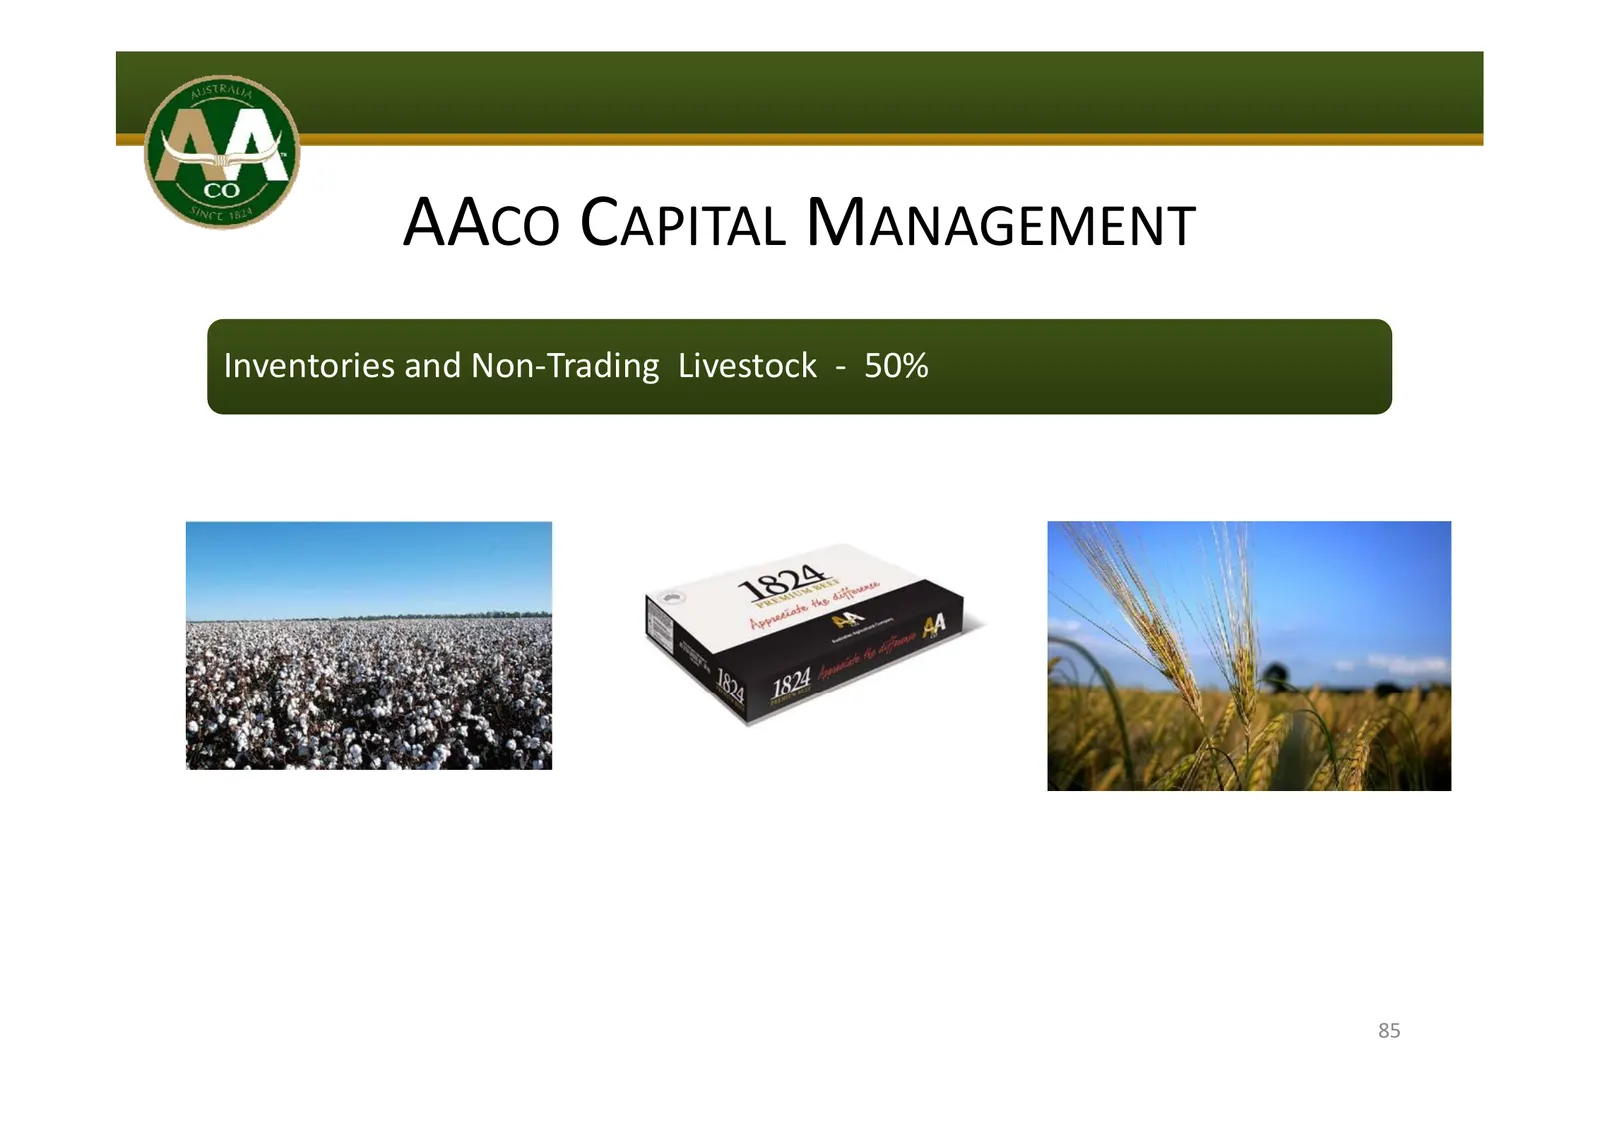
AACO CAPITAL MANAGEMENT Inventories and Non‐Trading Livestock ‐ 50% 85
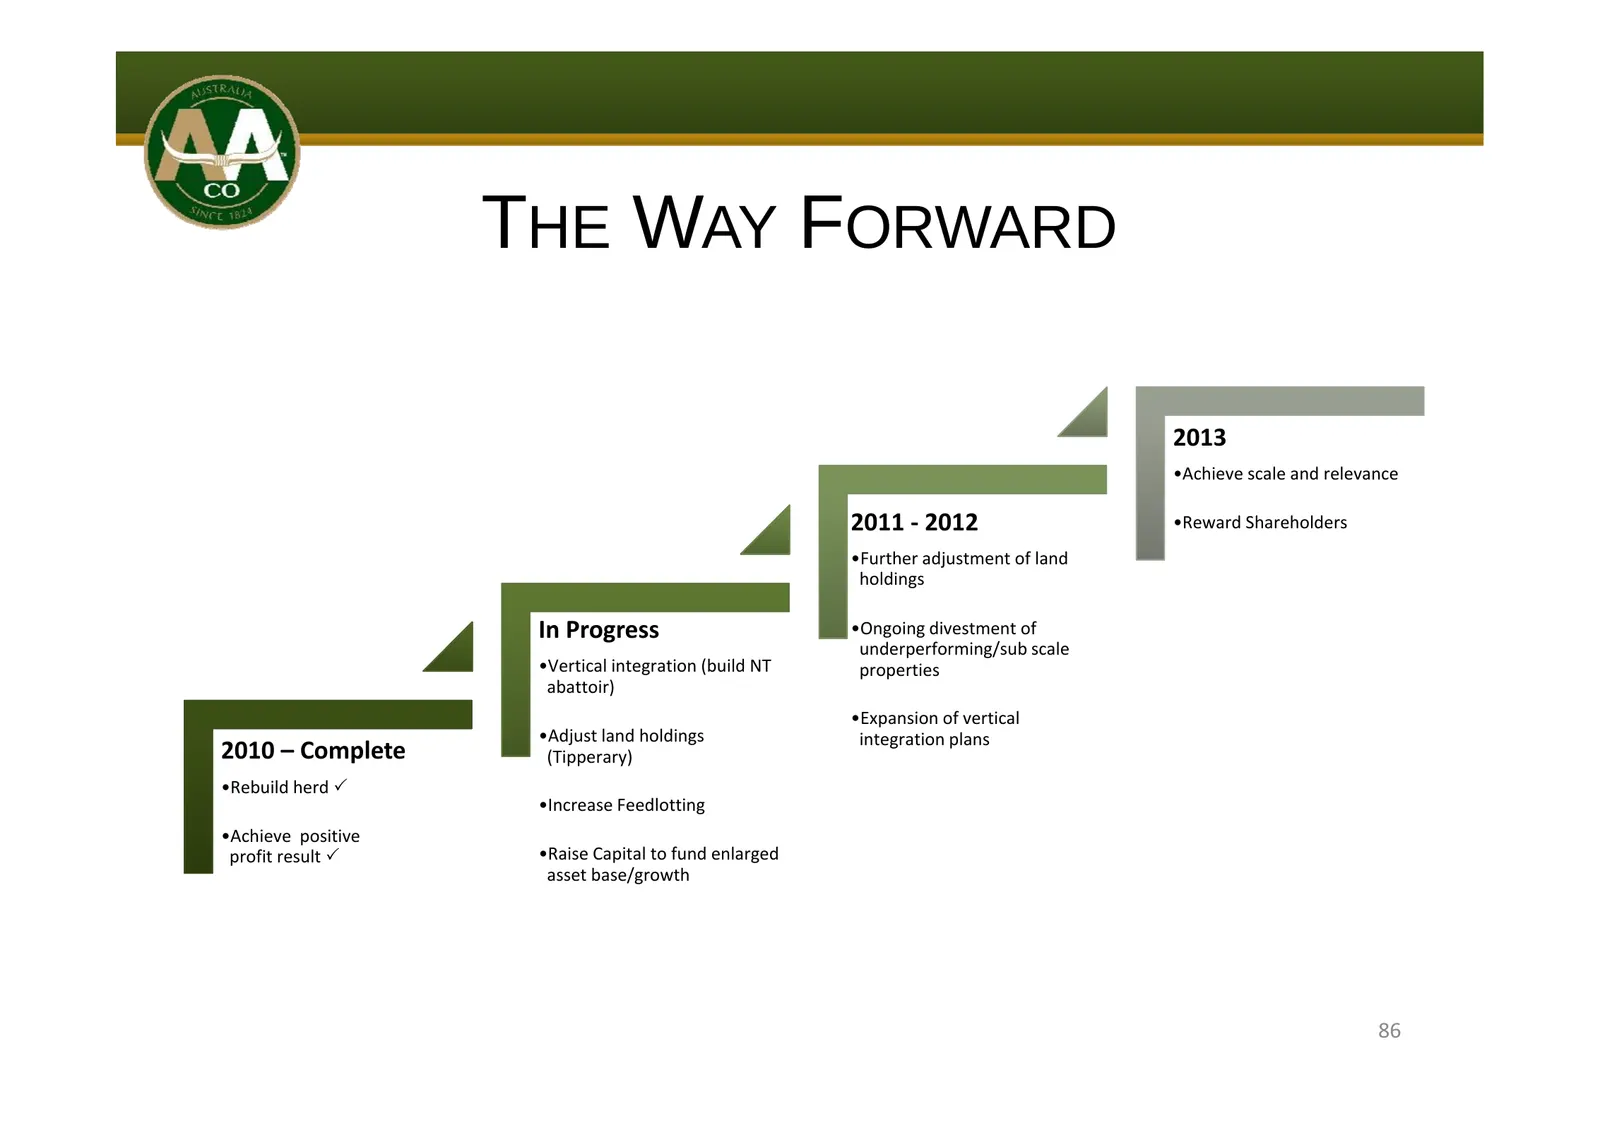
Slide 21: The Way Forward
THE WAY FORWARD 2013 •Achieve scale and relevance 2011 ‐ 2012 •Reward Shareholders •Further adjustment j of land holdings In Progress •Ongoing divestment of underperforming/sub scale •Vertical integration (build NT properties abattoir) •Expansion of vertical •Adjust land holdings integration plans 2
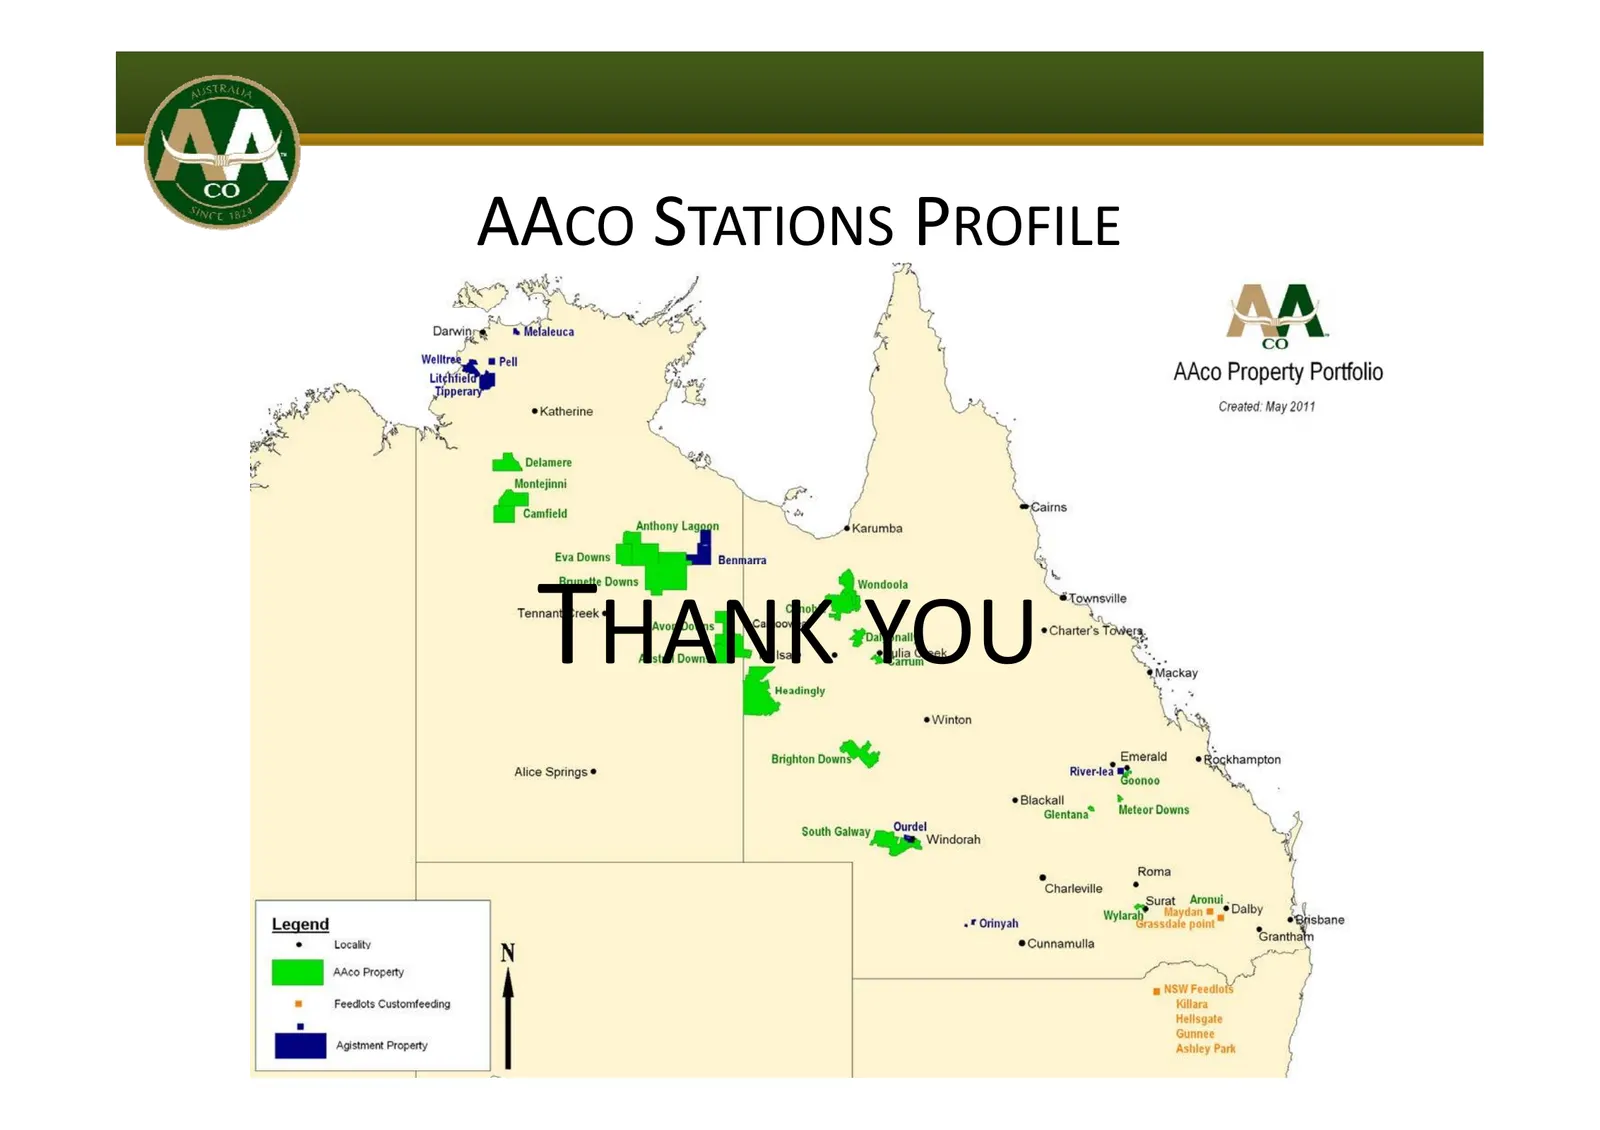
Slide 22: Thank You
AACO STATIONS PROFILE THANK YOU 87
Source: Internet Archive copy of aaco.com.au
More decks from Australian Agricultural Company Limited
 HY27 Earnings Presentation23 slides · Nov 19, 2026
 Investor Presentation (May 2026)22 slides · May 21, 2026
 H1 FY2026 Earnings Presentation23 slides · Nov 20, 2025
 Investor Presentation (May 2025)22 slides · May 22, 2025
 H1 2025 Earnings Presentation23 slides · Nov 15, 2024
 FY2024 Earnings Presentation28 slides · May 15, 2024