Perion Network Ltd · NASDAQ:PERI
Perion Network — Investor Presentation (January 2021)
29 slides from Perion Network's investor presentation, Jan 12, 2021
Slide 1: The capture & convince company
the capture & convince company 1
Slide 2: Forward looking statements; Non-GAAP measures
FORWARD LOOKING STATEMENTS This press release contains historical information and forward looking statements within the meaning of The Private Securities Litigation Reform Act of 1995 with respect to the business, financial condition and results of operations of Perion The words will believe, expect
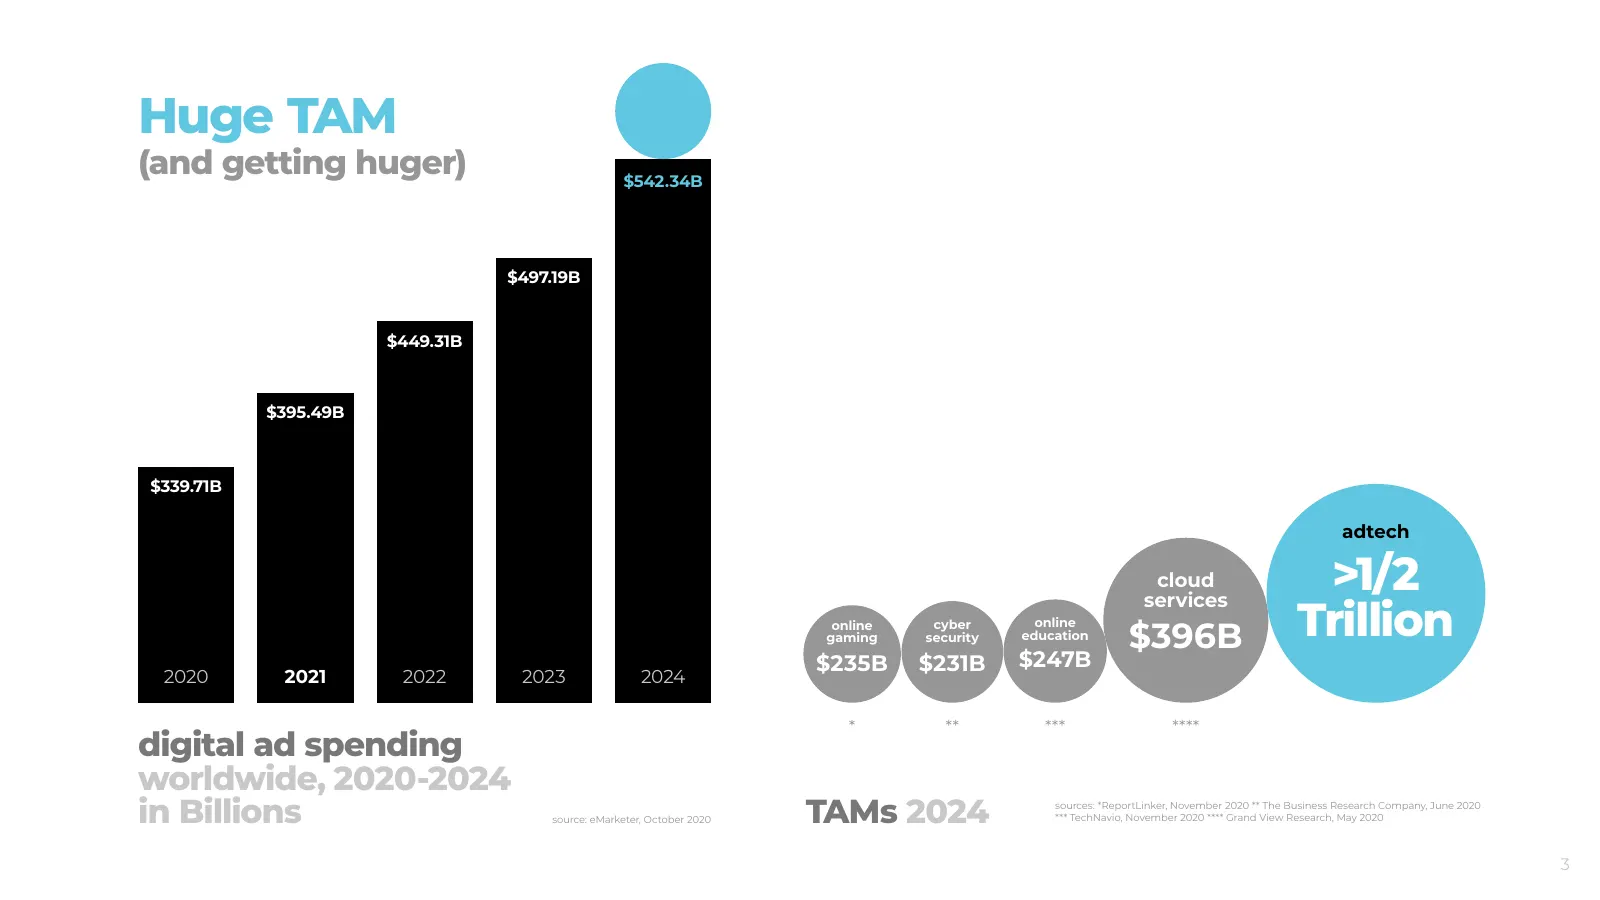
Slide 3: Huge TAM (and getting huger)
Huge TAM (and getting huger) $542.34B $497.19B $449.31B $395.49B $339.71B adtech cloud services >1/2 online gaming cyber security online education $396B Trillion $235B $231B $247B 2020 2021 2022 2023 2024 * ** *** **** digital ad spending worldwide, 2020-2024 in Billions source: eMarketer, October 2
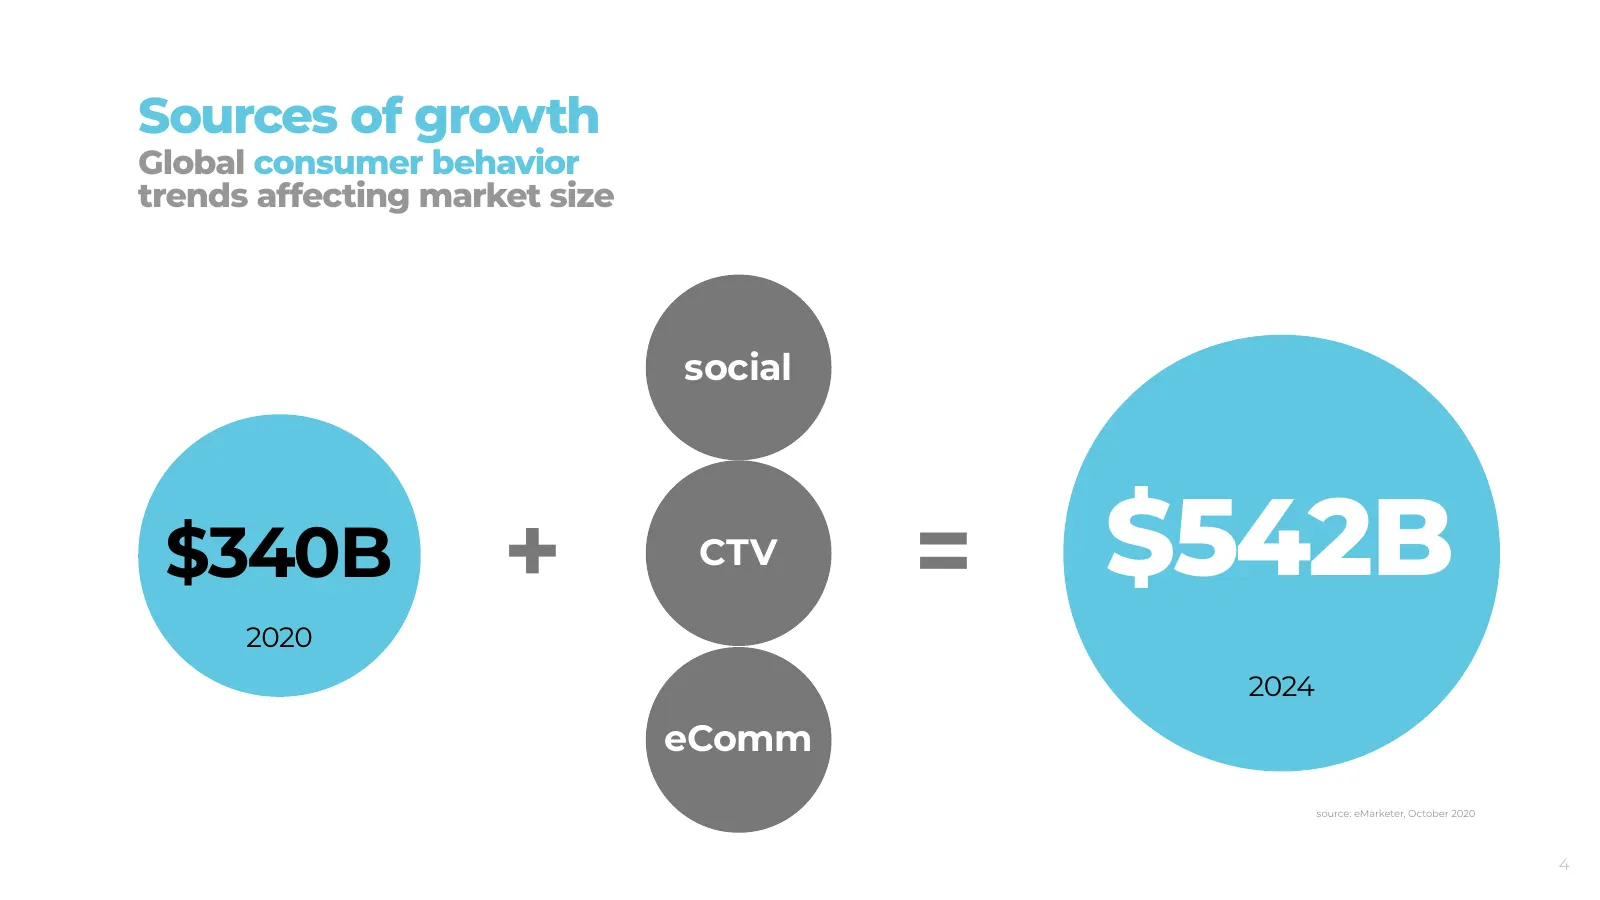
Slide 4: Sources of growth
Sources of growth Global consumer behavior trends affecting market size social $340B + CTV = $542B 2020 2024 eComm source: eMarketer, October 2020 4
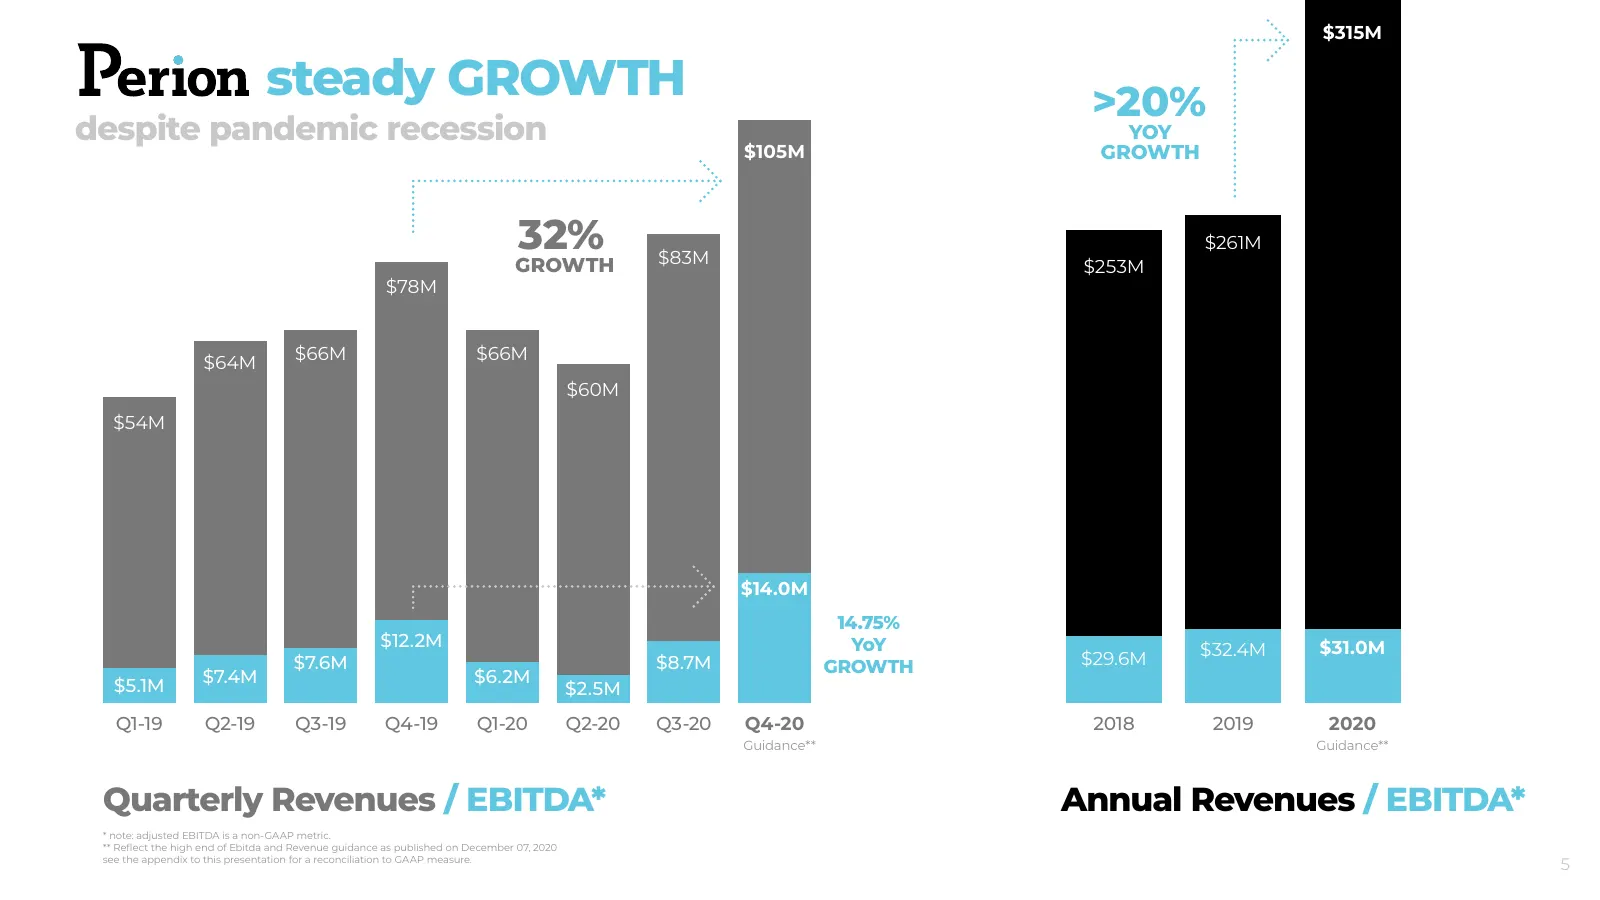
Slide 5: Steady growth
$315M steady GROWTH >20% despite pandemic recession YOY $105M GROWTH 32% $83M $261M GROWTH $253M $78M $64M $66M $66M $60M $54M $14.0M 14.75% $12.2M YoY $32.4M $31.0M $7.6M $8.7M GROWTH $29.6M $5.1M $7.4M $6.2M $2.5M Q1-19 Q2-19 Q3-19 Q4-19 Q1-20 Q2-20 Q3-20 Q4-20 2018 2019 2020 Guidance** Guidance**
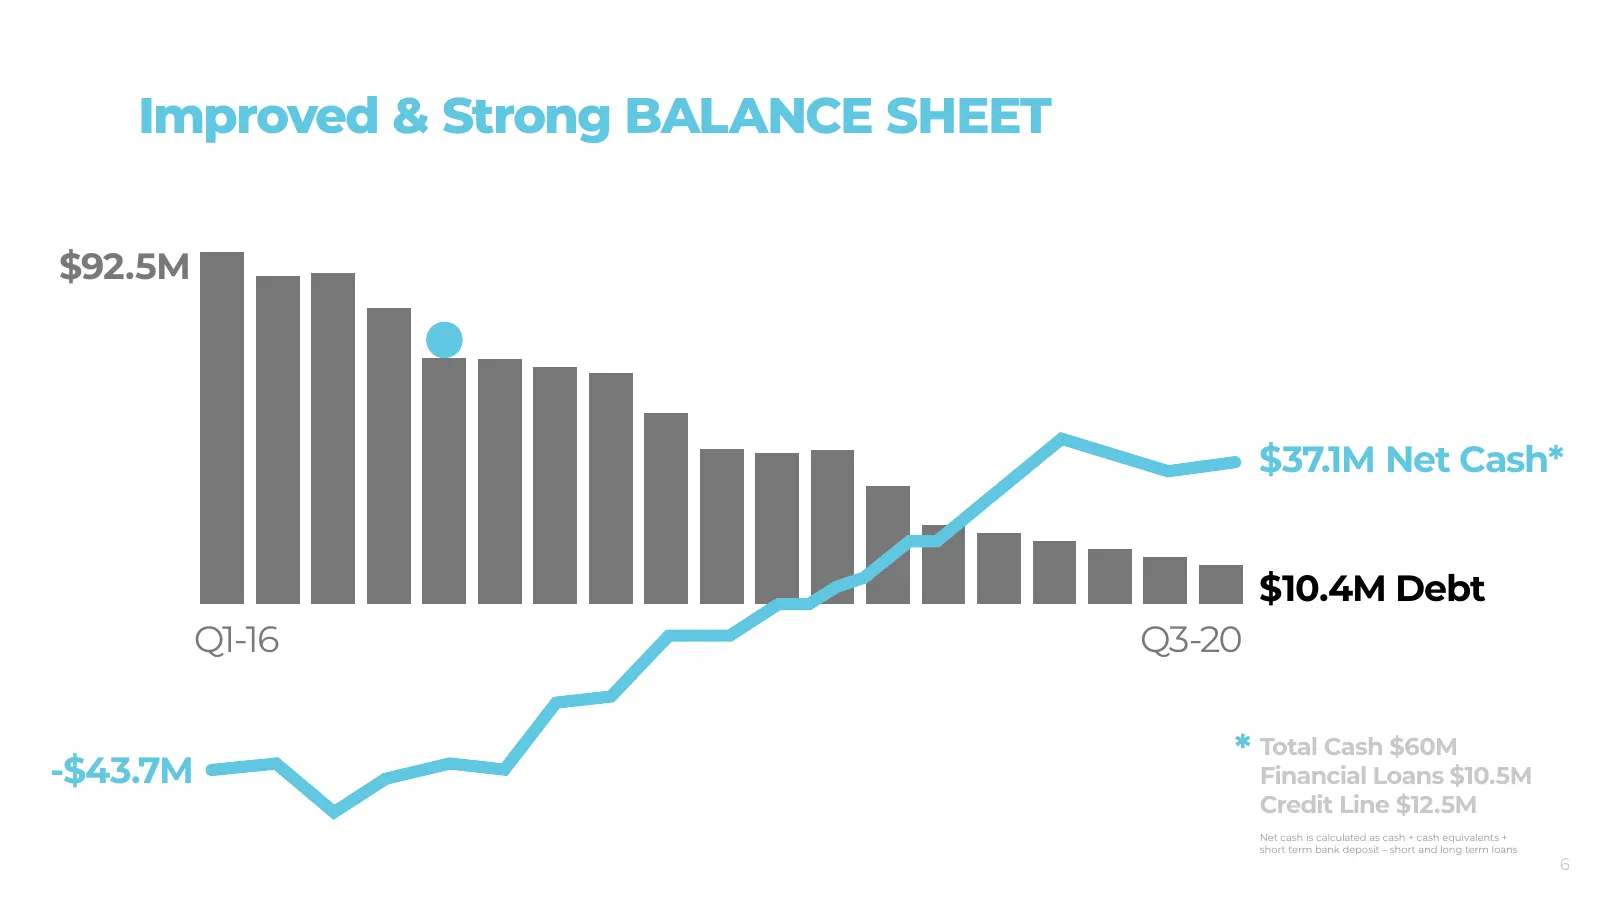
Slide 6: Improved & Strong Balance Sheet
Improved & Strong BALANCE SHEET $92.5M 86.2 86.9 77.7 64.6 64.4 62.3 60.7 50.2 40.8 39.7 40.5 $37.1M Net Cash* 31 20.8 18.8 16.7 14.6 $10.4M Debt 12.5 10.4 Q1-16 Q2-16 Q3-16 Q4-16 Q1-17 Q2-17 Q3-17 Q4-17 Q1-18 Q2-18 Q3-18 Q4-18 Q1-19 Q2-19 Q3-19 Q4-19 Q1-20 Q2-20 Q3-20 Q1-16 Q3-20 Total Cash $60M -$
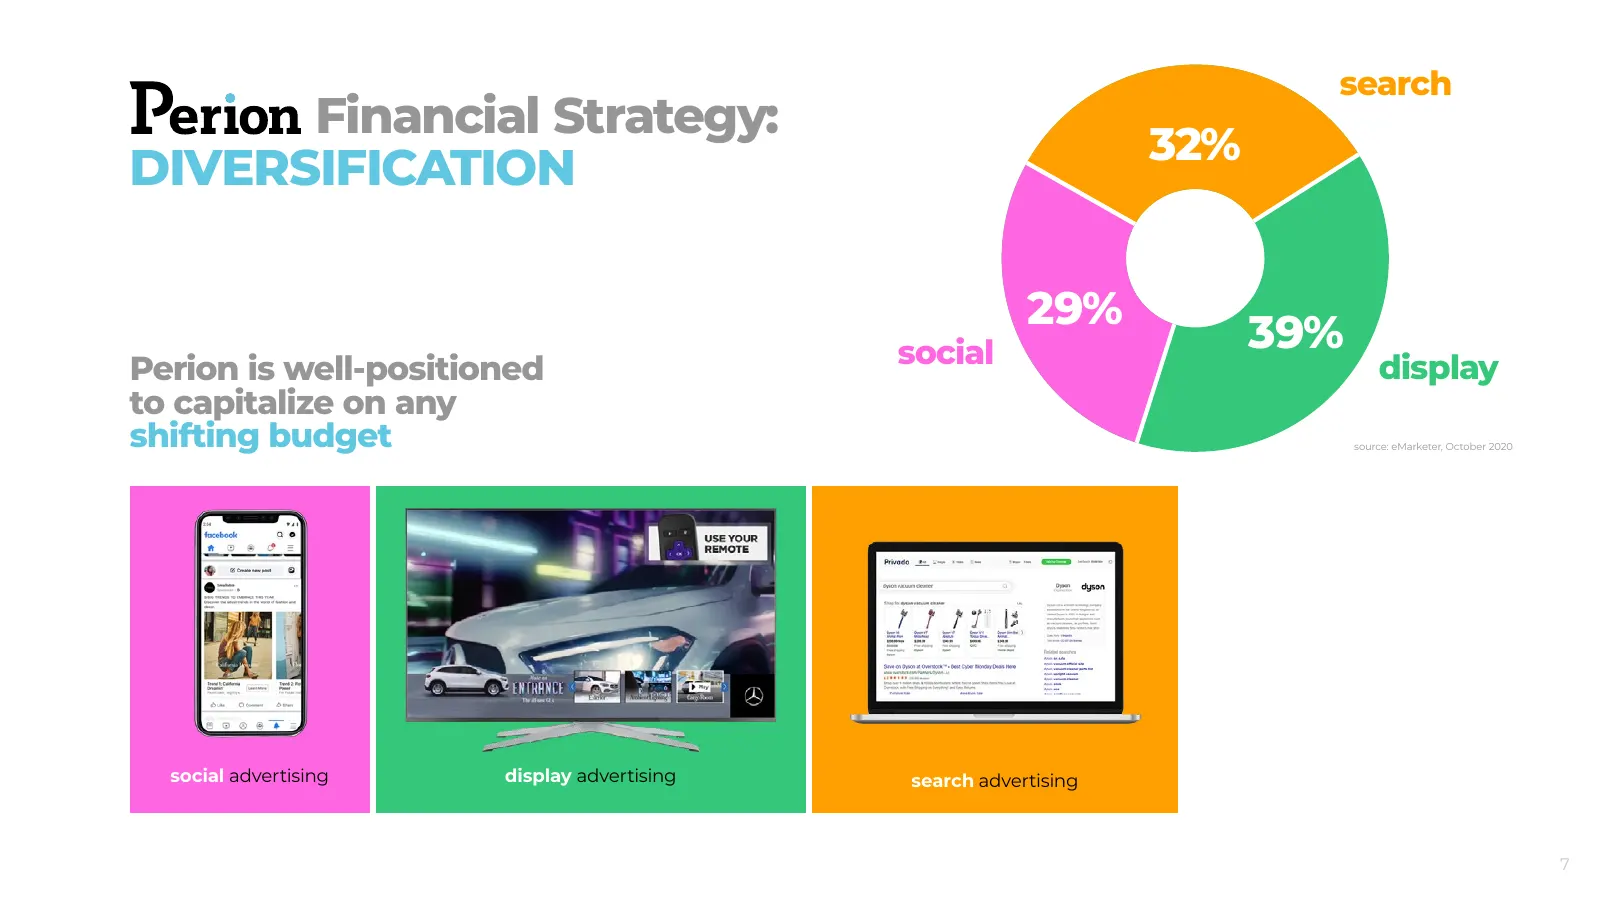
Slide 7: Financial Strategy: Diversification
search Financial Strategy: 32% DIVERSIFICATION 29% social 39% Perion is well-positioned display to capitalize on any shifting budget source: eMarketer, October 2020 social advertising display advertising search advertising 7
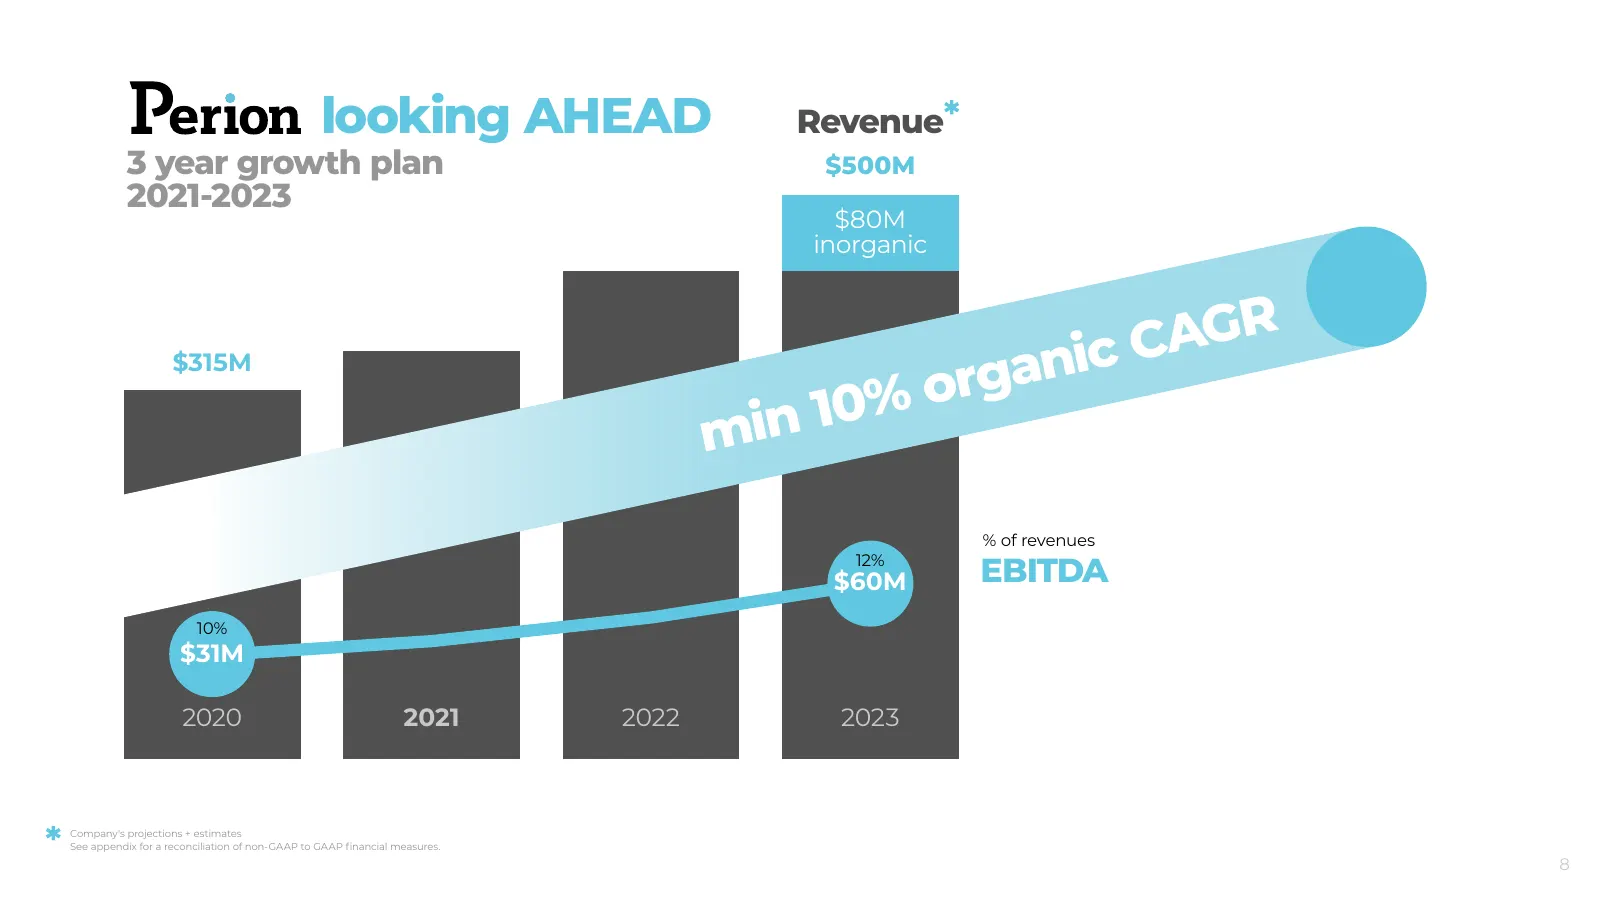
Slide 8: Looking ahead
looking AHEAD Revenue 3 year growth plan $500M 2021-2023 $80M inorganic CAGR ganic r $315M 10% o min % of revenues 12% $60M EBITDA 10% $31M 2020 2021 2022 2023 Company's projections + estimates See appendix for a reconciliation of non-GAAP to GAAP financial measures. 8
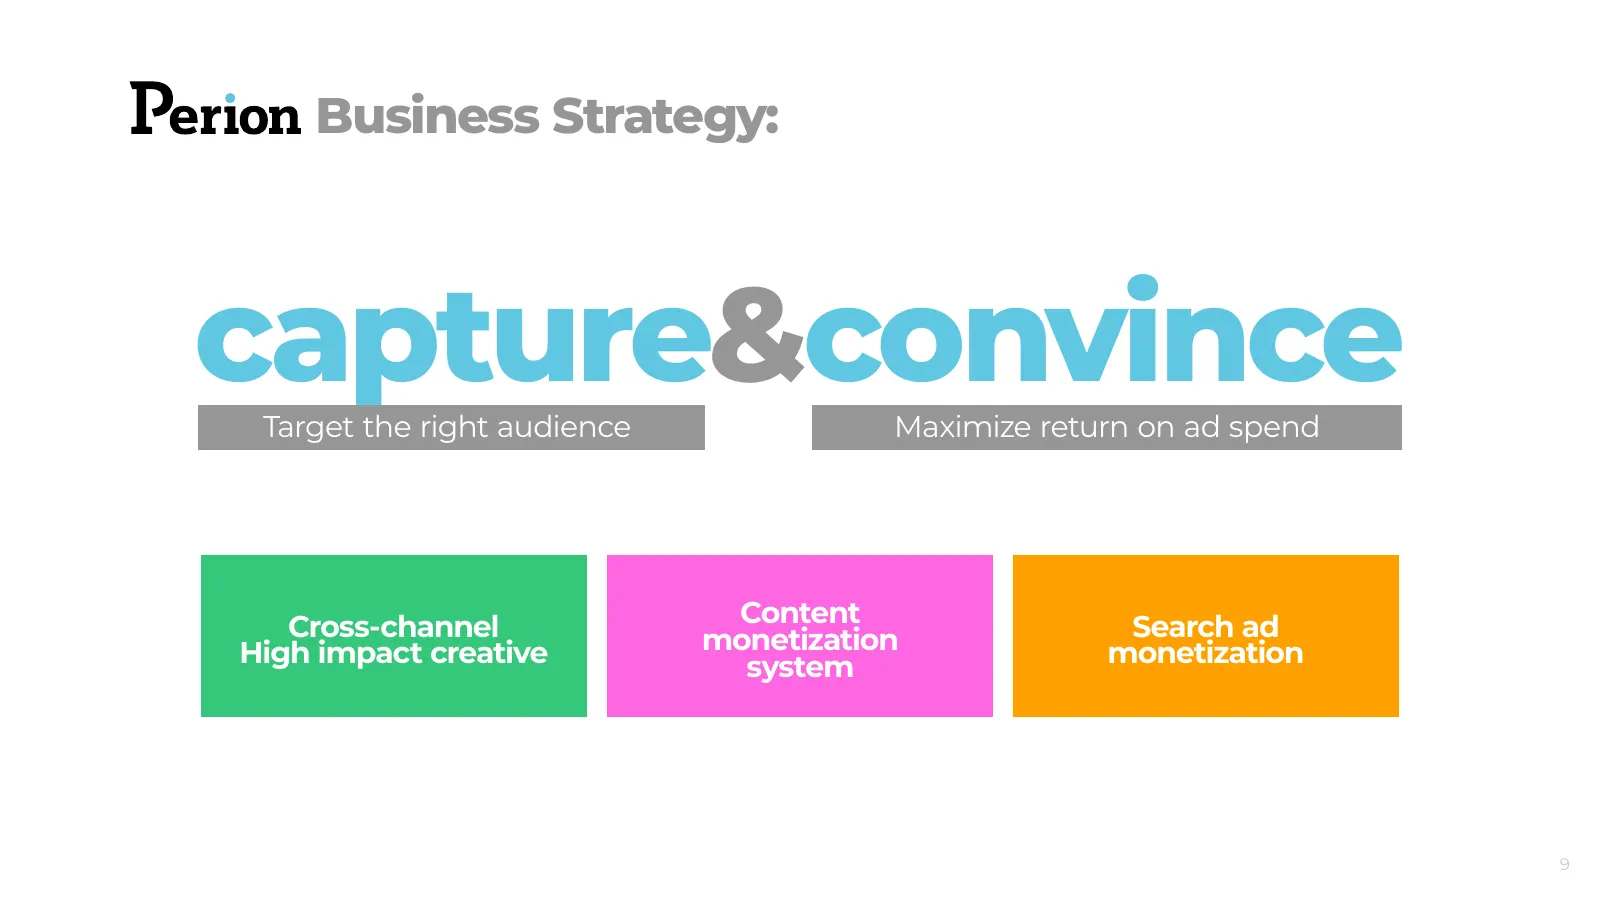
Slide 9: Business Strategy: capture&convince
Business Strategy: capture&convince Target the right audience Maximize return on ad spend Cross-channel Content Search ad High impact creative monetization monetization system 9
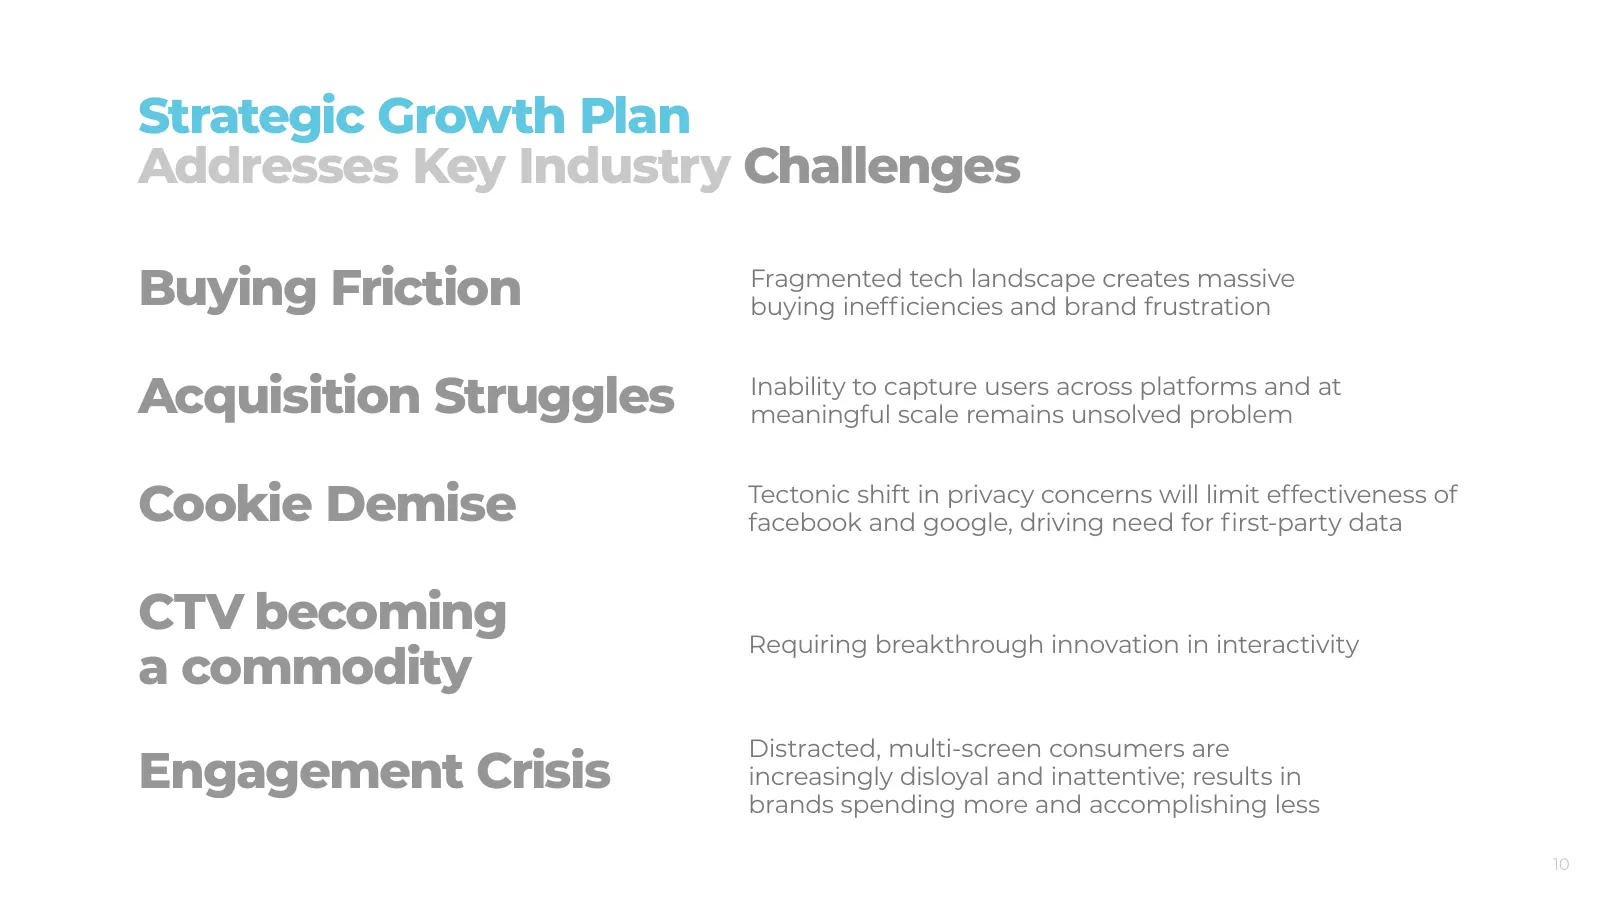
Slide 10: Strategic Growth Plan Addresses Key Industry Challenges
Strategic Growth Plan Addresses Key Industry Challenges Buying Friction Fragmented tech landscape creates massive buying inefficiencies and brand frustration Acquisition Struggles Inability to capture users across platforms and at meaningful scale remains unsolved problem Cookie Demise Tectonic shif
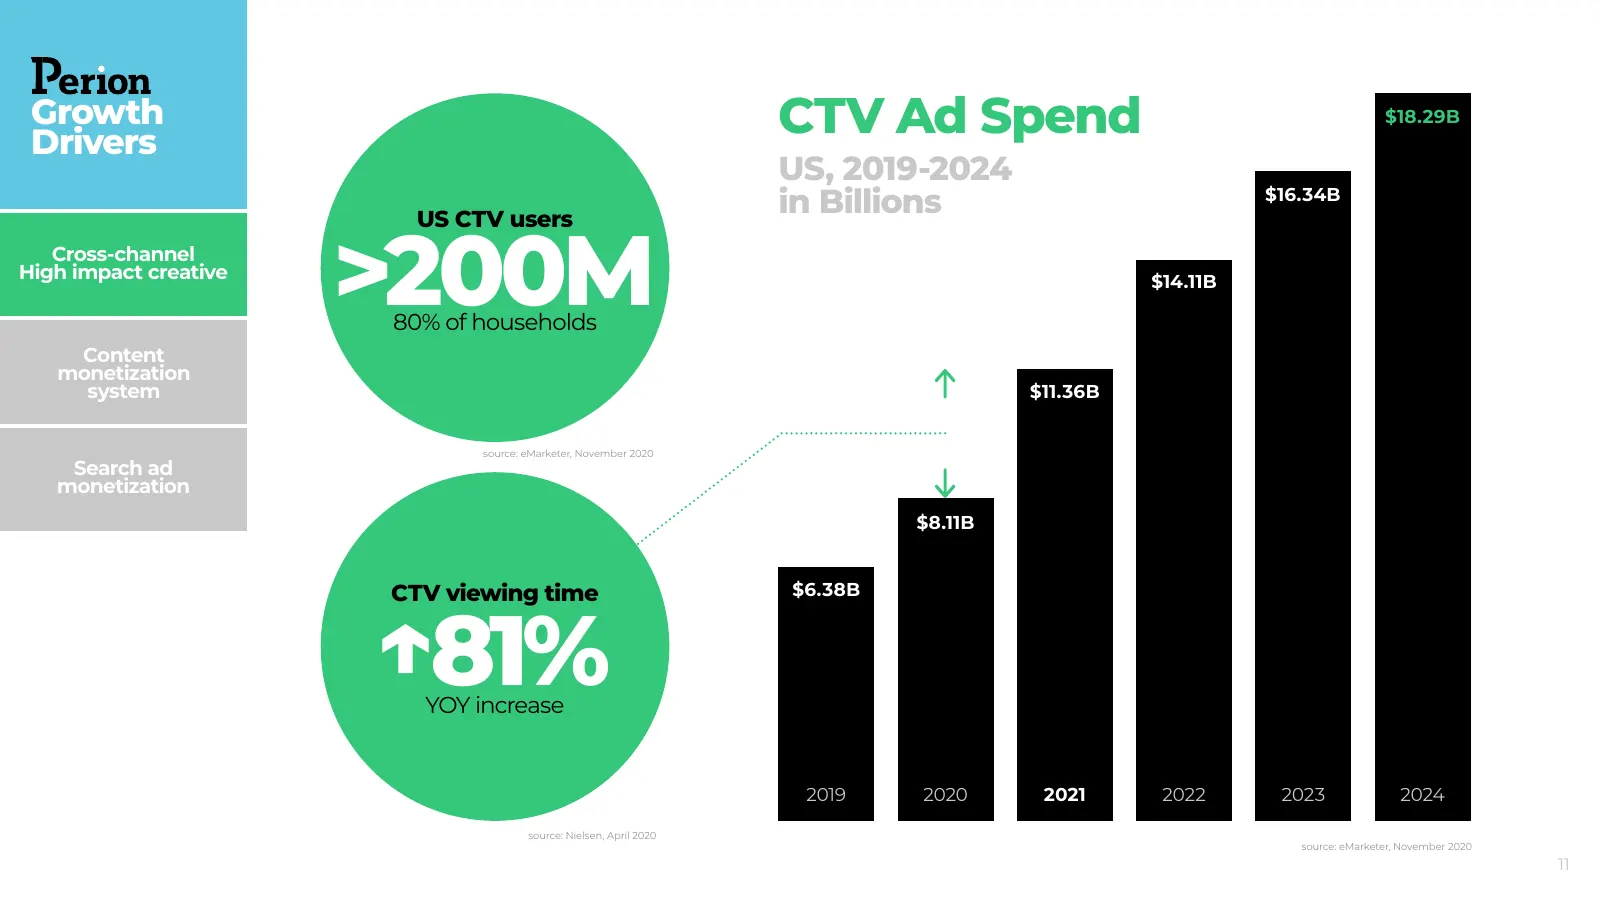
Slide 11: CTV Ad Spend growth driver
Growth Drivers CTV Ad Spend $18.29B US, 2019-2024 in Billions $16.34B >200M US CTV users Cross-channel High impact creative $14.11B 80% of households Content monetization system $11.36B source: eMarketer, November 2020 Search ad monetization $8.11B ↑81% CTV viewing time $6.38B YOY increase 2019 2020
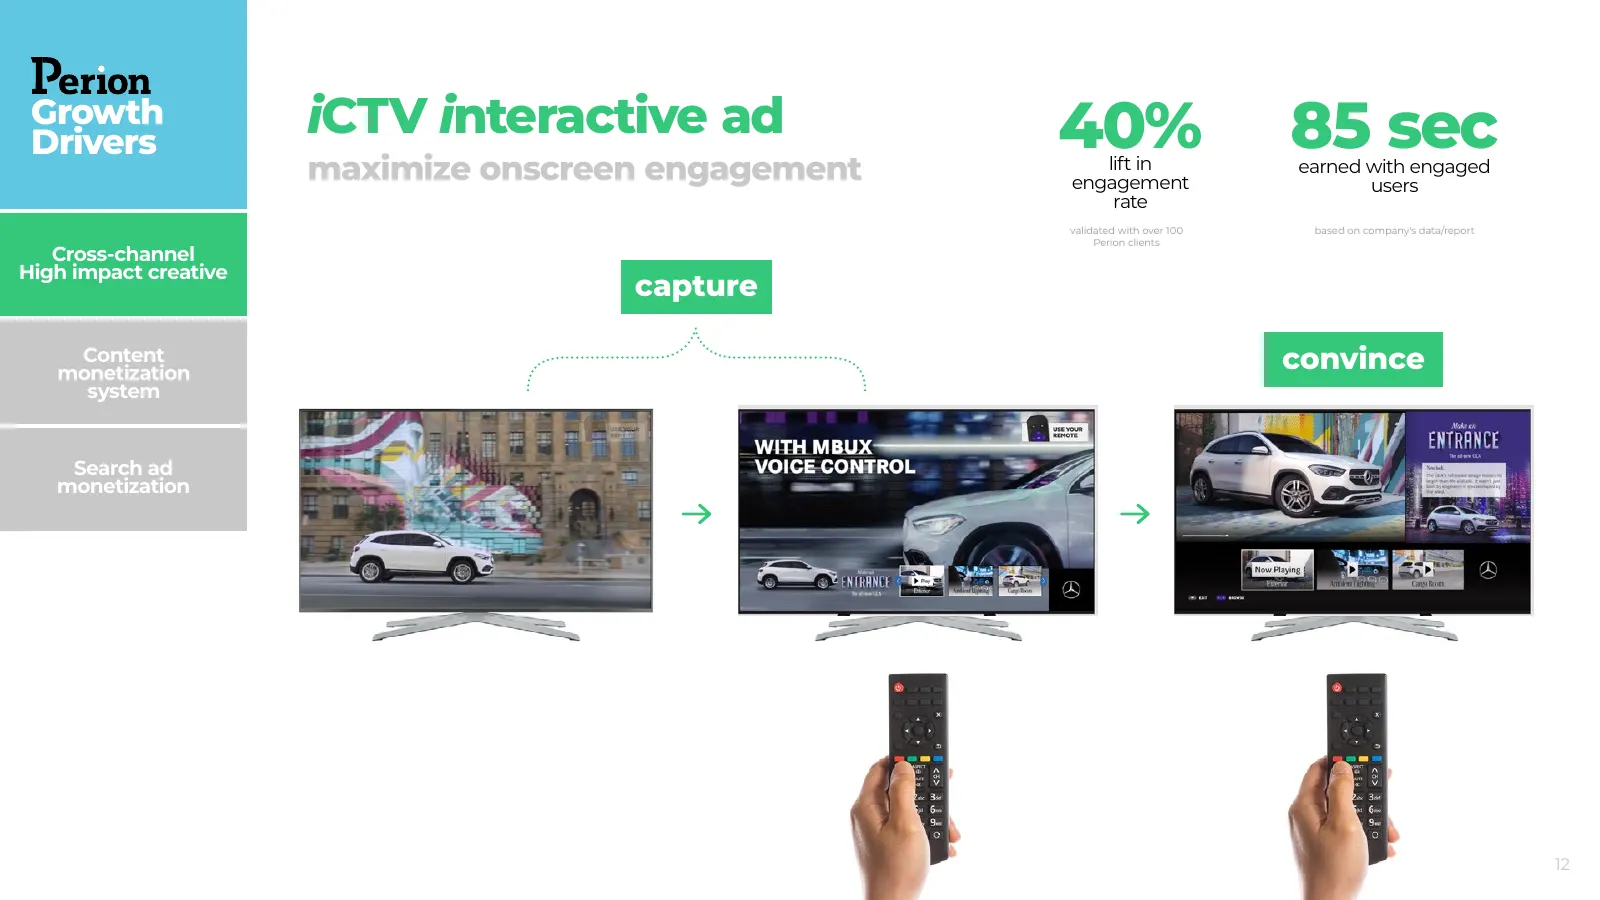
Slide 12: iCTV interactive ad
Growth Drivers iCTV interactive ad maximize onscreen engagement 40%lift in 85 sec earned with engaged engagement users rate validated with over 100 based on company's data/report Perion clients Cross-channel High impact creative capture Content monetization convince system Search ad monetization 12
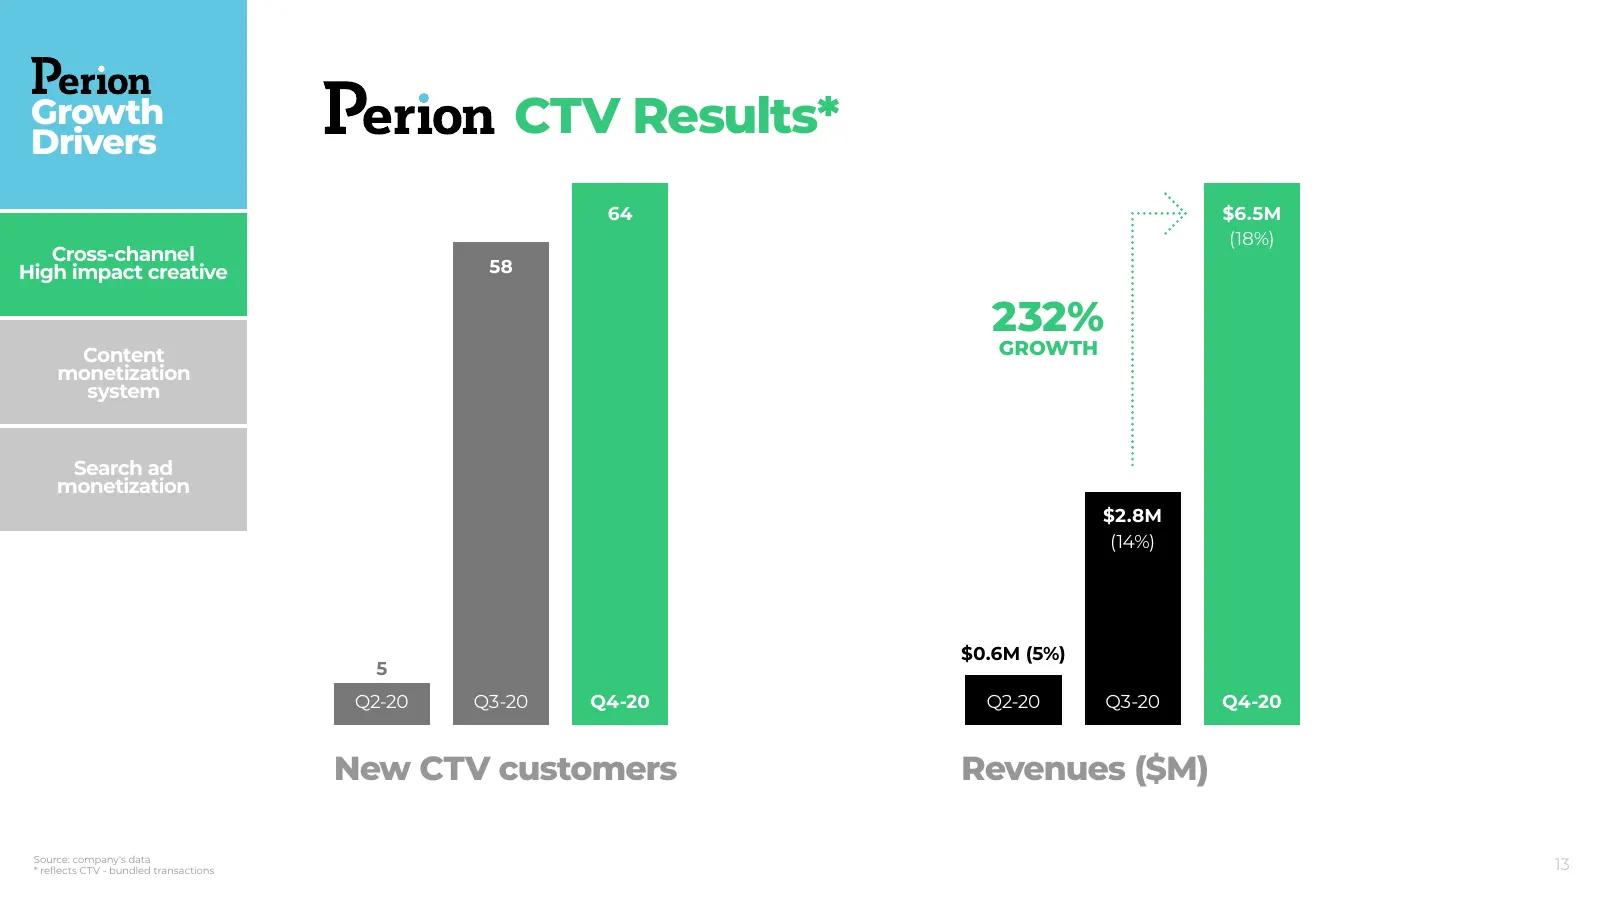
Slide 13: CTV Results
Growth Drivers CTV Results* 64 $6.5M (18%) Cross-channel High impact creative 58 232% Content GROWTH monetization system Search ad monetization $2.8M (14%) $0.6M (5%) 5 Q2-20 Q3-20 Q4-20 Q2-20 Q3-20 Q4-20 New CTV customers Revenues ($M) Source: company's data * reflects CTV - bundled transactions 13
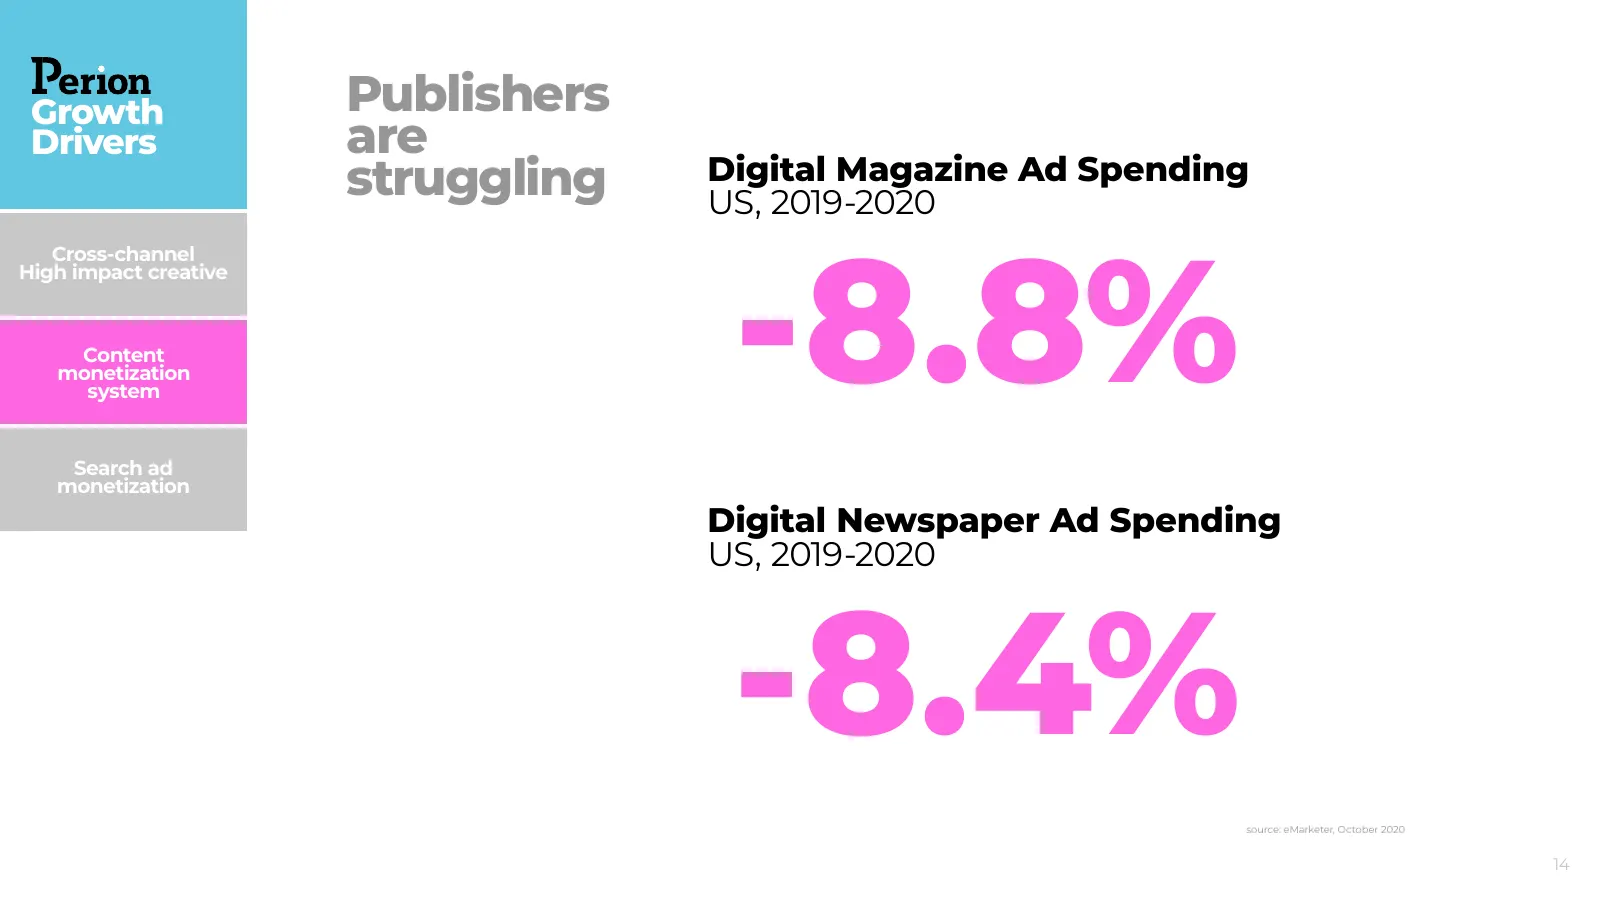
Slide 14: Publishers are struggling
Growth Publishers Drivers are struggling Digital Magazine Ad Spending US, 2019-2020 -8.8% Cross-channel High impact creative Content monetization system Search ad monetization Digital Newspaper Ad Spending US, 2019-2020 -8.4% source: eMarketer, October 2020 14
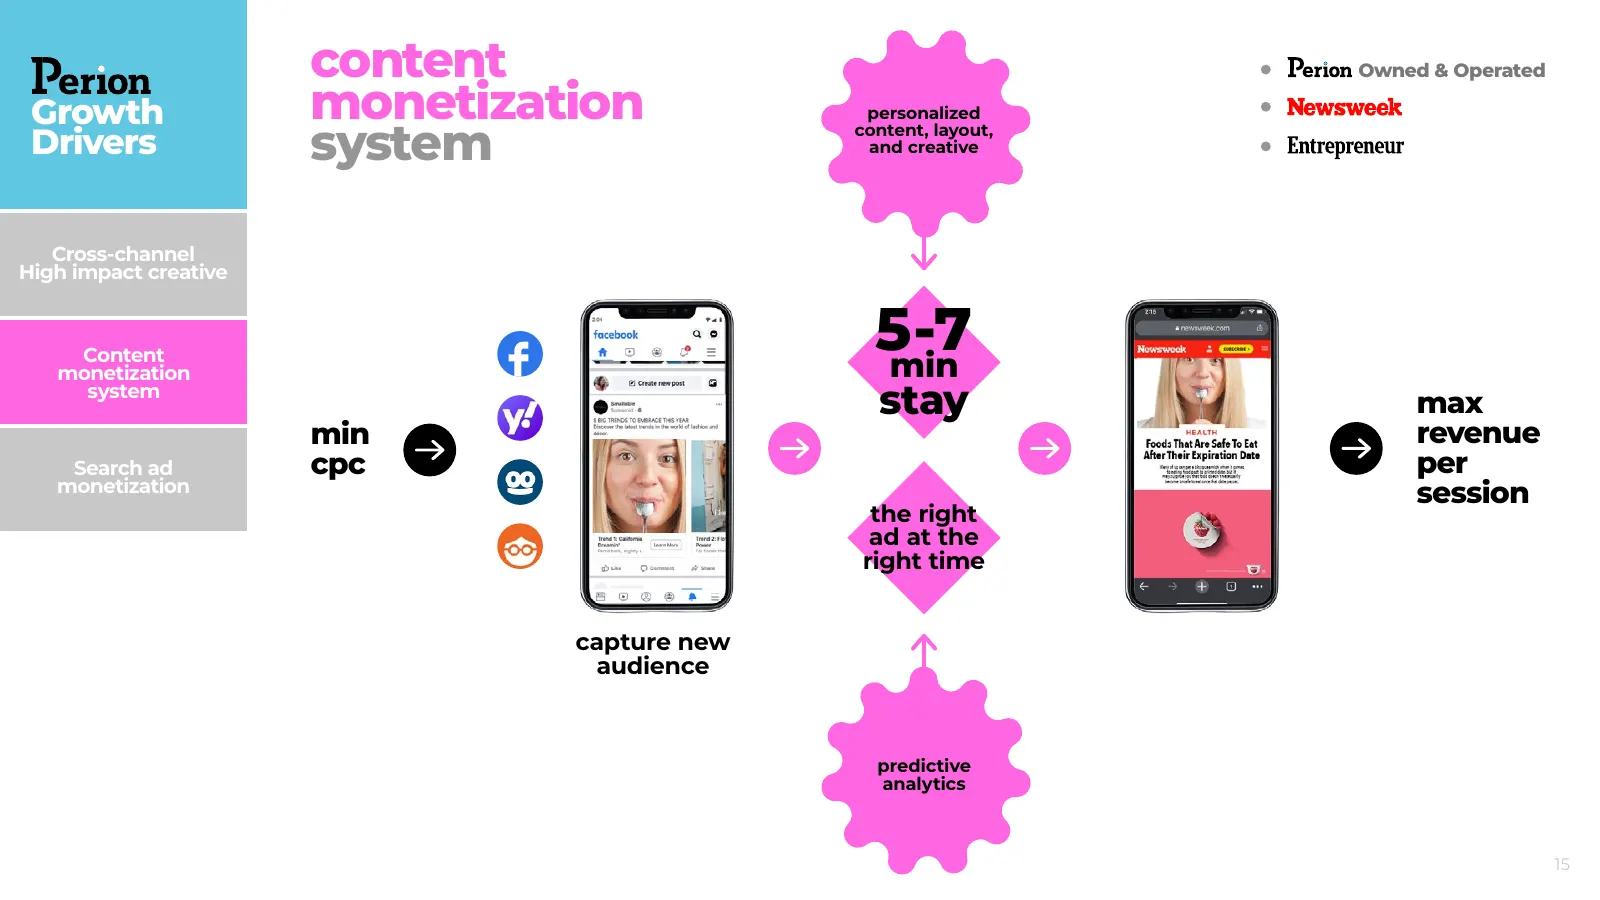
Slide 15: Content monetization system
content Owned & Operated Growth monetization personalized Drivers system content, layout, and creative Cross-channel High impact creative Content monetization 5-7 min system stay max min revenue Search ad cpc per monetization session the right ad at the right time capture new audience predictive ana
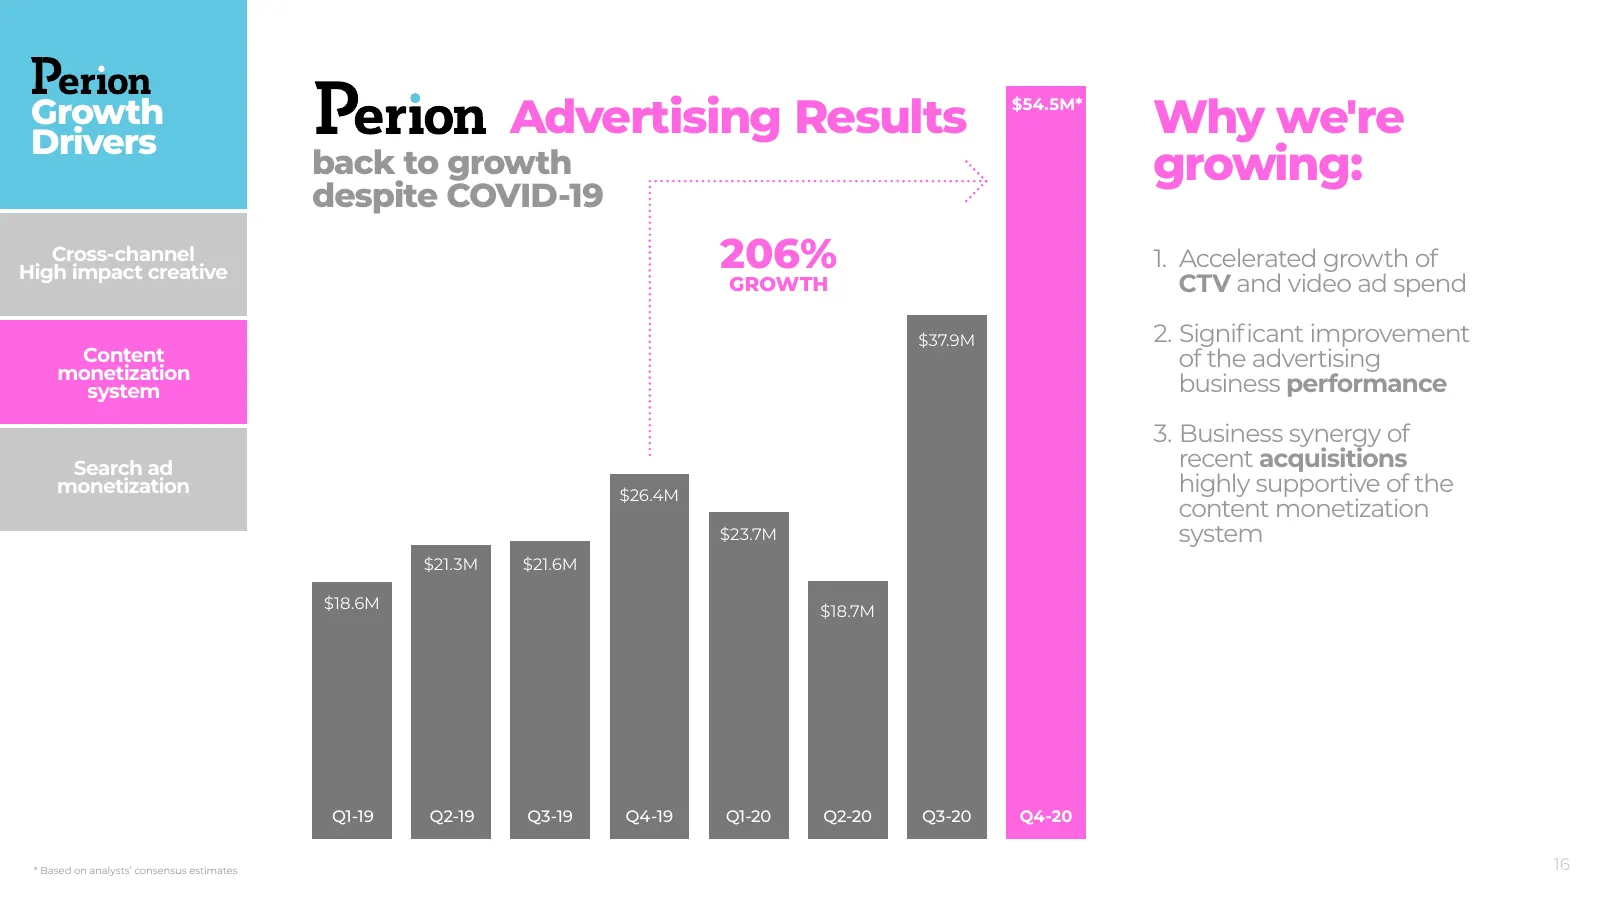
Slide 16: Advertising Results
Growth Drivers Advertising Results $54.5M* Why we're back to growth growing: despite COVID-19 Cross-channel High impact creative 206% 1. Accelerated growth of GROWTH CTV and video ad spend $37.9M 2. Significant improvement Content of the advertising monetization system business performance 3. Busine
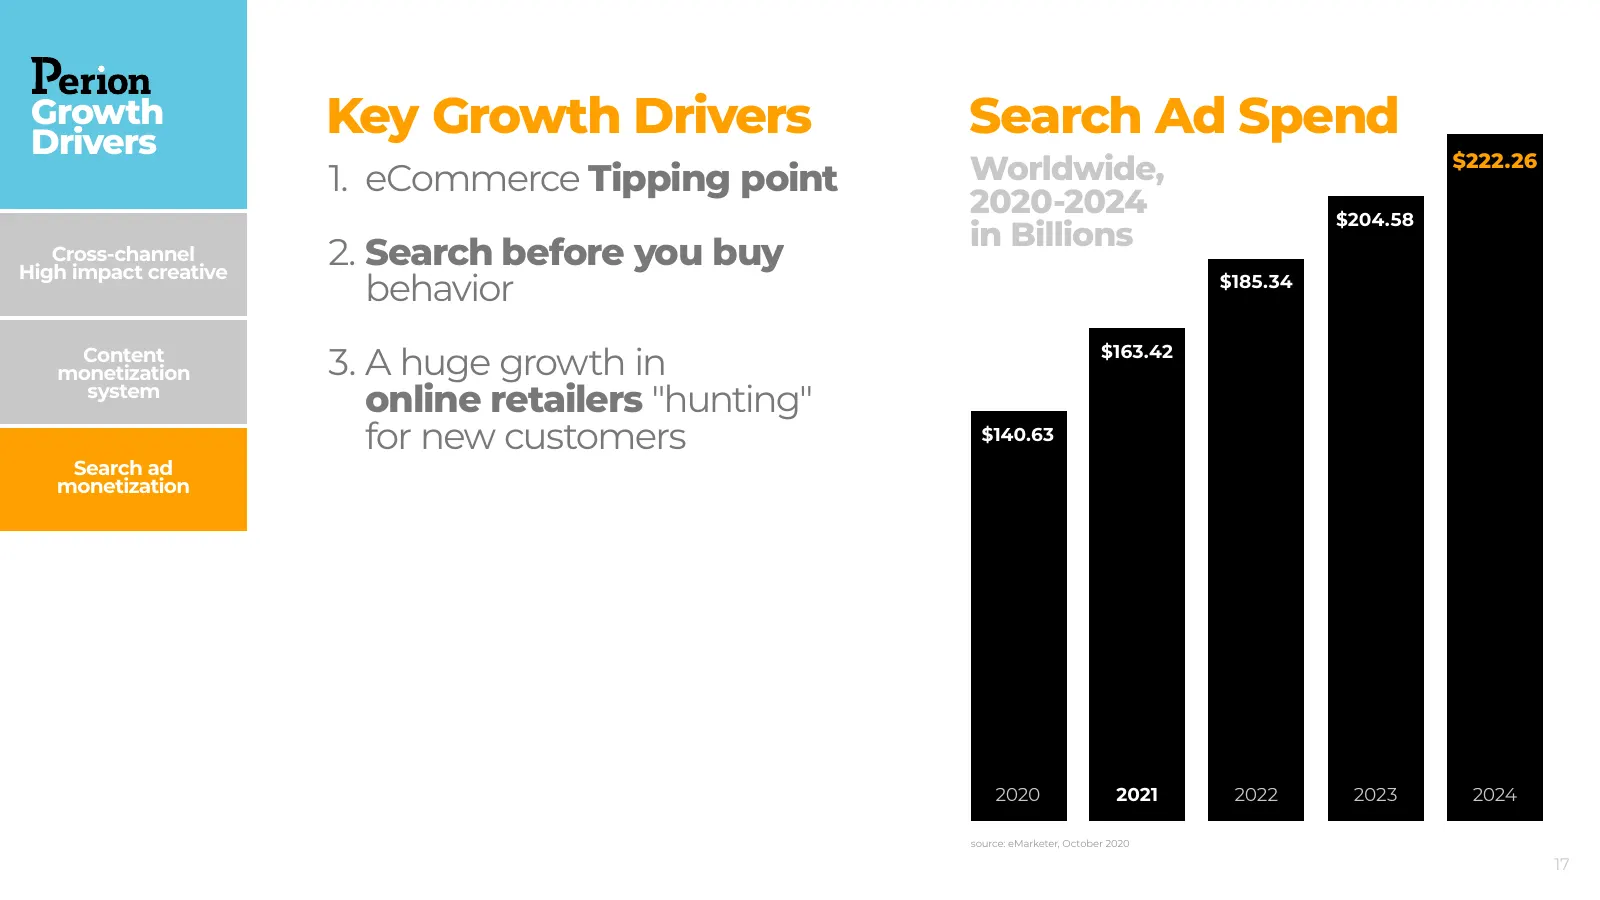
Slide 17: Key Growth Drivers: Search Ad Spend
Growth Drivers Key Growth Drivers Search Ad Spend 1. eCommerce Tipping point Worldwide, $222.26 2020-2024 $204.58 in Billions Cross-channel High impact creative 2. Search before you buy behavior $185.34 Content monetization 3. A huge growth in $163.42 system online retailers "hunting" for new custom
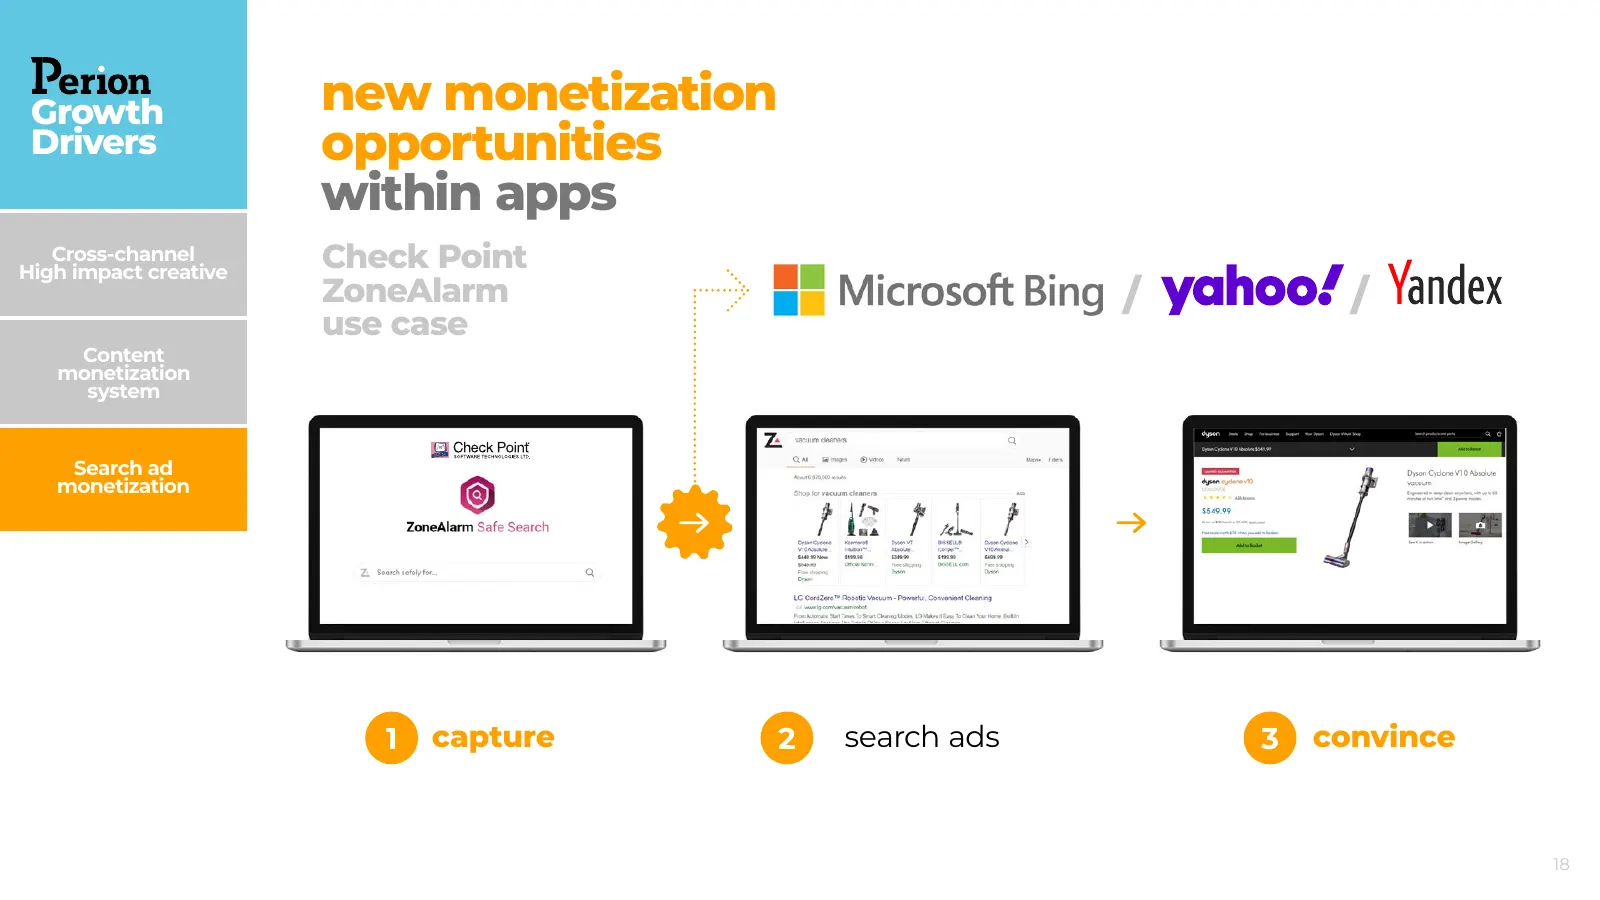
Slide 18: New monetization opportunities within apps
Growth new monetization Drivers opportunities within apps Cross-channel High impact creative Check Point ZoneAlarm / / use case Content monetization system Search ad monetization 1 capture 2 search ads 3 convince 18

Slide 19: Search mediation for publishers
Search mediation Growth for publishers Drivers Cross-channel High impact creative Content monetization system Search ad monetization 1 2 Display to Search convince 19
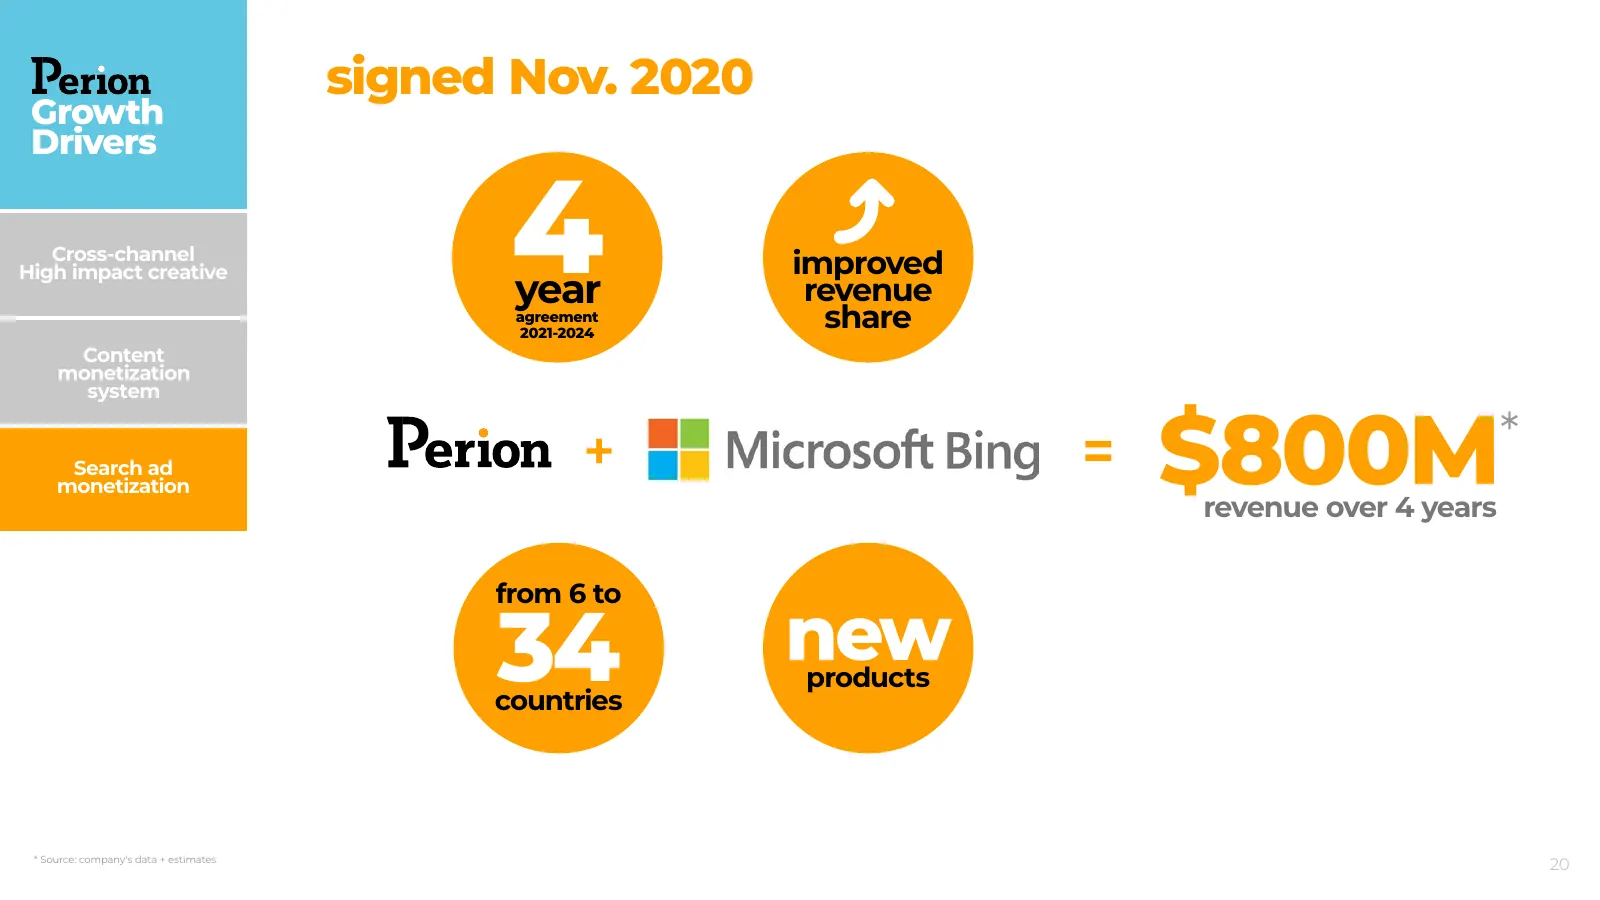
Slide 20: $800M new agreement signed Nov. 2020
signed Nov. 2020 Growth Drivers Cross-channel High impact creative 4 year agreement 2021-2024 improved revenue share Content monetization system Search ad monetization + = $800M revenue over 4 years * from 6 to 34 countries new products * Source: company's data + estimates 20
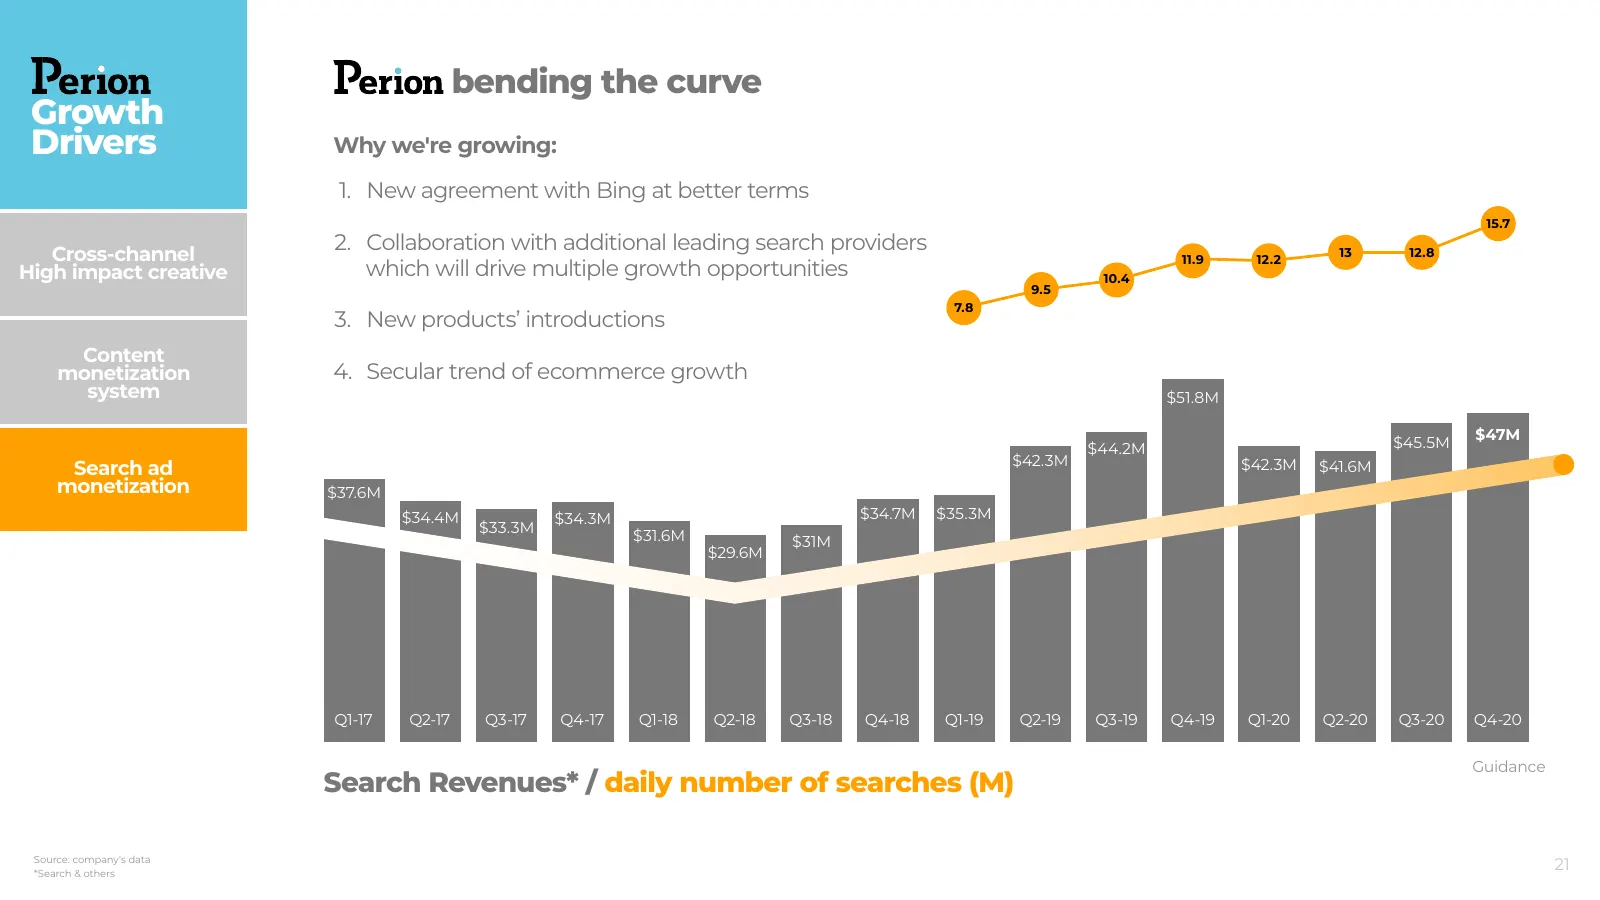
Slide 21: Growth Drivers: bending the curve
bending the curve Growth Drivers Why we're growing: 1. New agreement with Bing at better terms 15.7 Cross-channel 2. Collaboration with additional leading search providers 13 12.8 11.9 12.2 High impact creative which will drive multiple growth opportunities 10.4 9.5 7.8 3. New products’ introduction
Slide 22: Ways the Future Points to Revenue
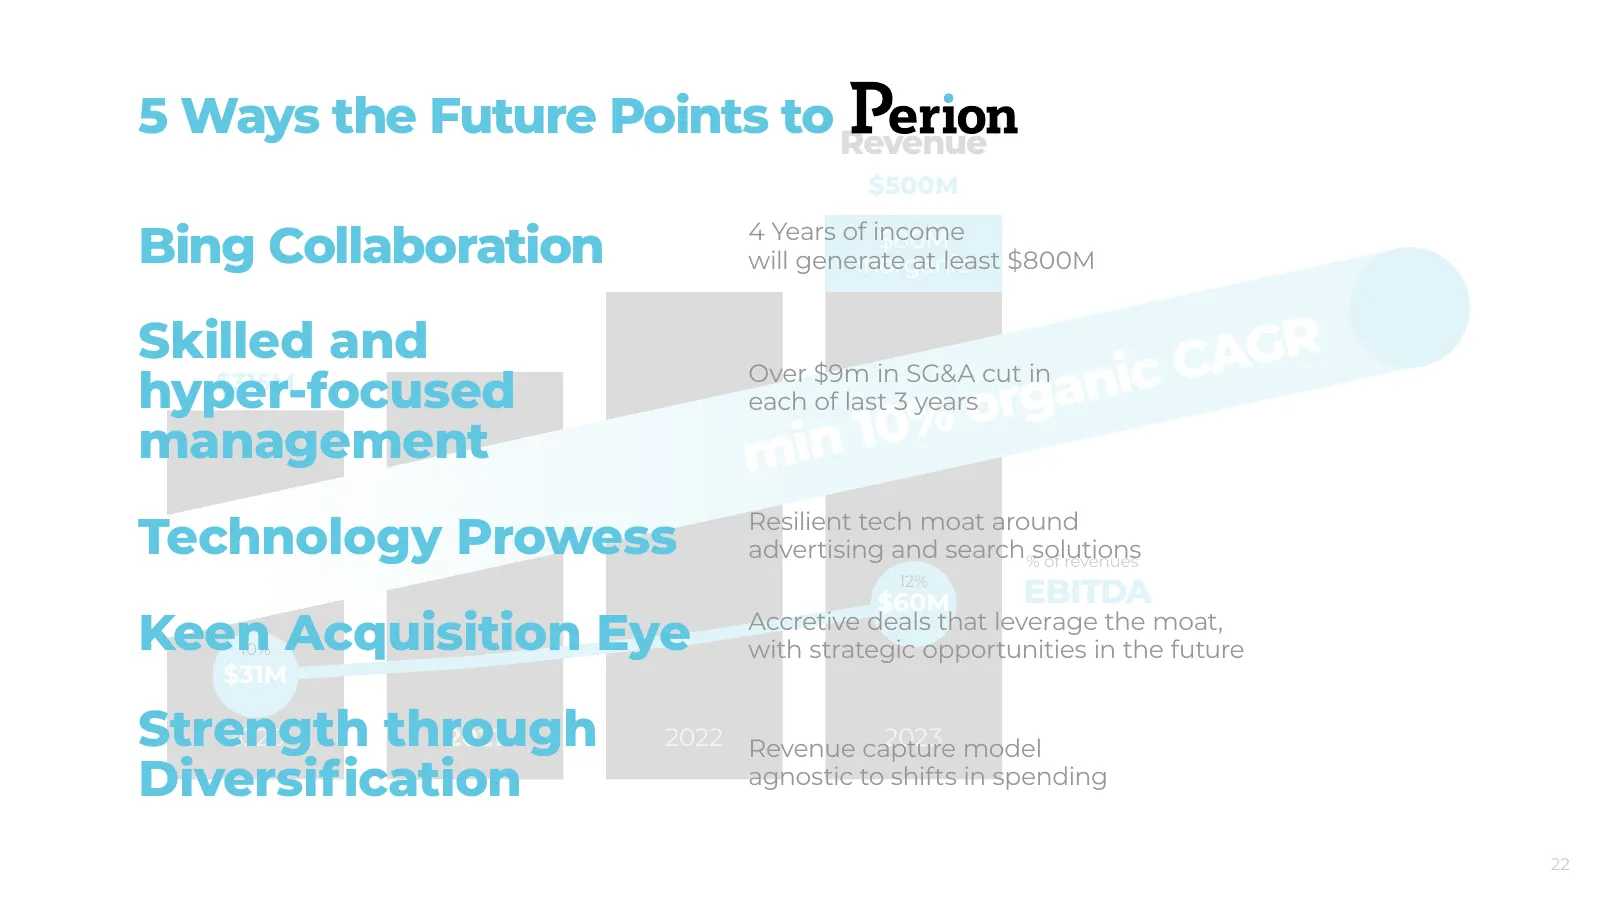
5 Ways the Future Points to Revenue $500M Bing Collaboration 4 Years of income $80M will generate at least $800M inorganic Skilled and CAGR hyper-focused $315M each of last 3 years rga Over $9m in SG&A cut in nic 10 % o management m i n Technology Prowess Resilient tech moat around advertising and s

Slide 23: Thank you
thank you 23

Slide 24: Appendix
appendix 24
Slide 25: Balance Sheet Overview
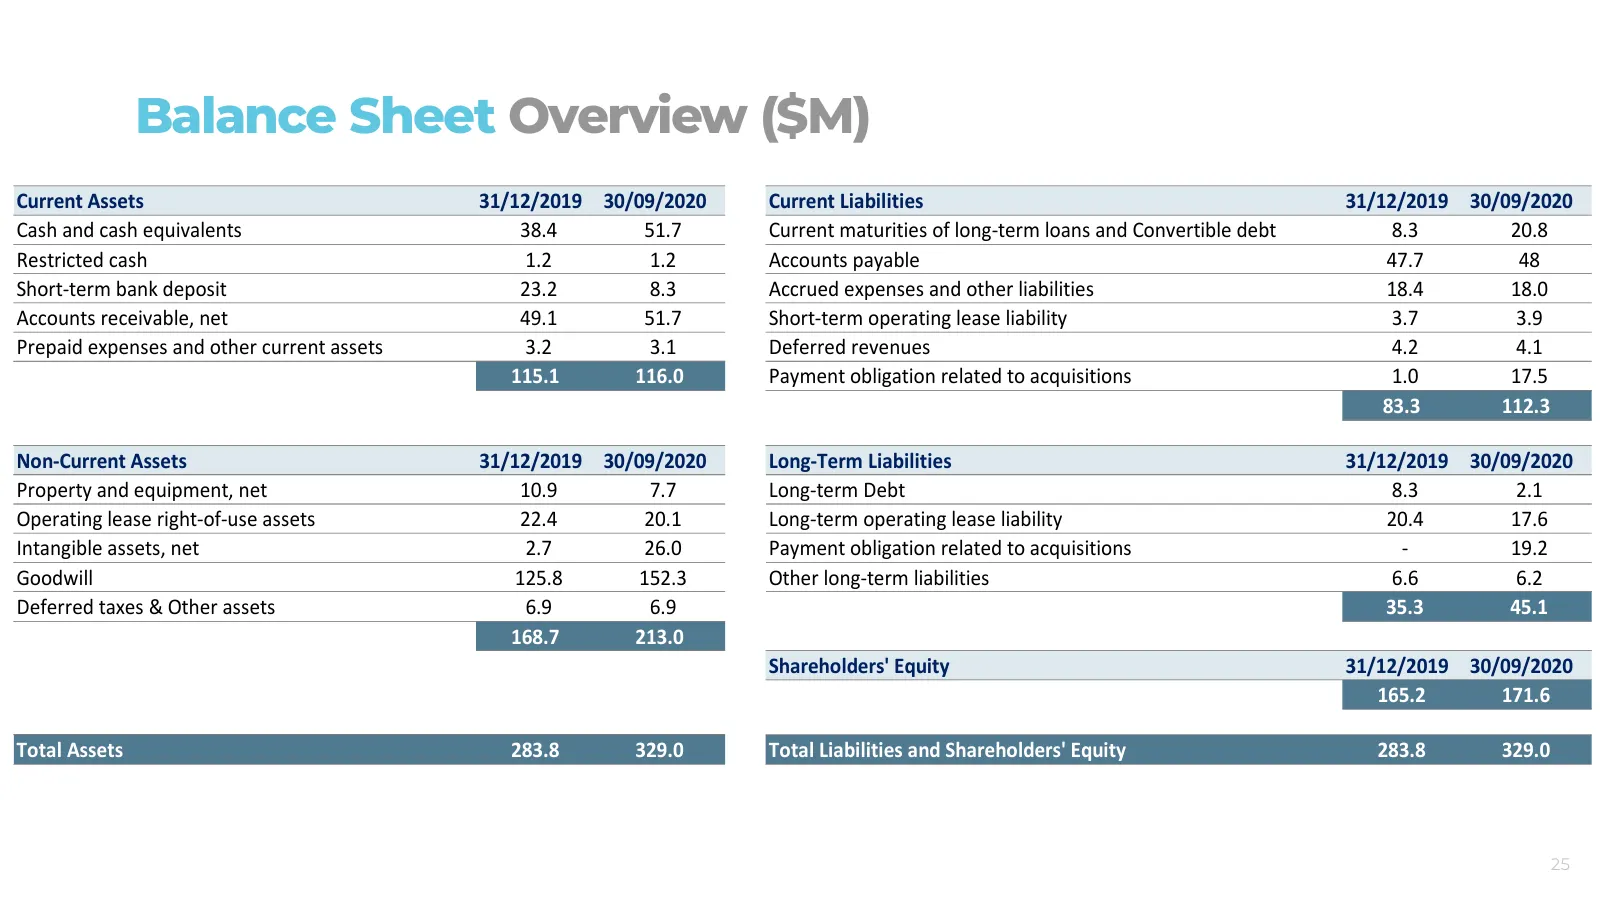
Balance Sheet Overview Balance Sheet Overview ($M) ($M) Current Assets 31/12/2019 30/09/2020 Current Liabilities 31/12/2019 30/09/2020 Cash and cash equivalents 38.4 51.7 Current maturities of long-term loans and Convertible debt 8.3 20.8 Restricted cash 1.2 1.2 Accounts payable 47.7 48 Short-term b
Slide 26: Income Statement GAAP Basis ($M)
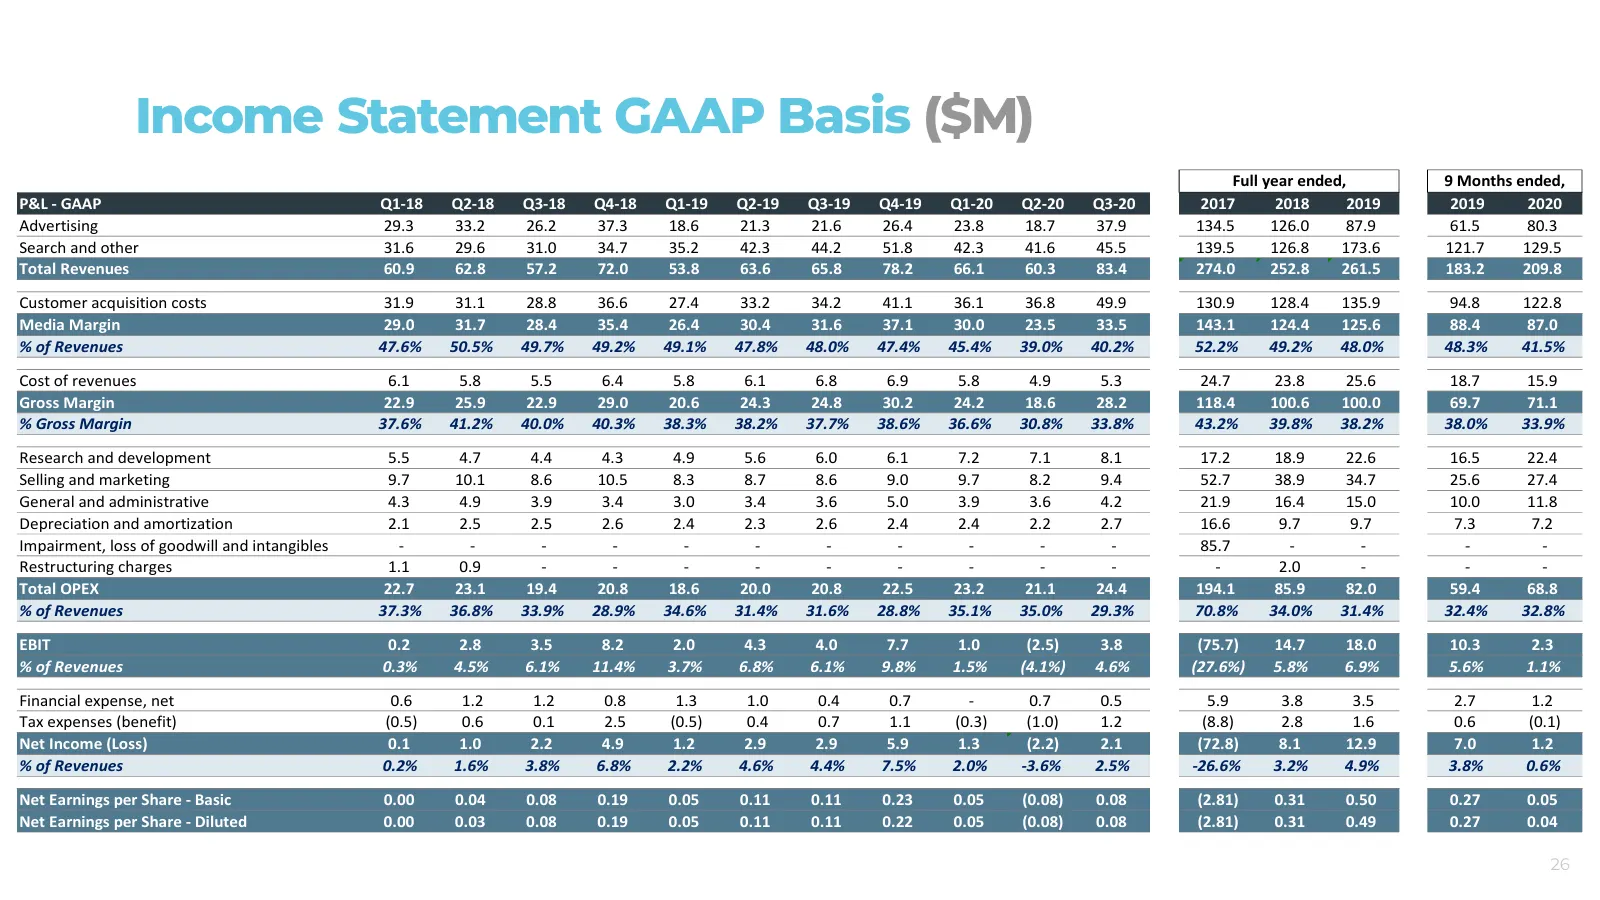
Income Statement GAAP Basis ($M) Income Statement GAAP Basis ($M) Full year ended, 9 Months ended, P&L - GAAP Q1-18 Q2-18 Q3-18 Q4-18 Q1-19 Q2-19 Q3-19 Q4-19 Q1-20 Q2-20 Q3-20 2017 2018 2019 2019 2020 Advertising 29.3 33.2 26.2 37.3 18.6 21.3 21.6 26.4 23.8 18.7 37.9 134.5 126.0 87.9 61.5 80.3 Searc
Slide 27: Cash Flow Overview ($M)
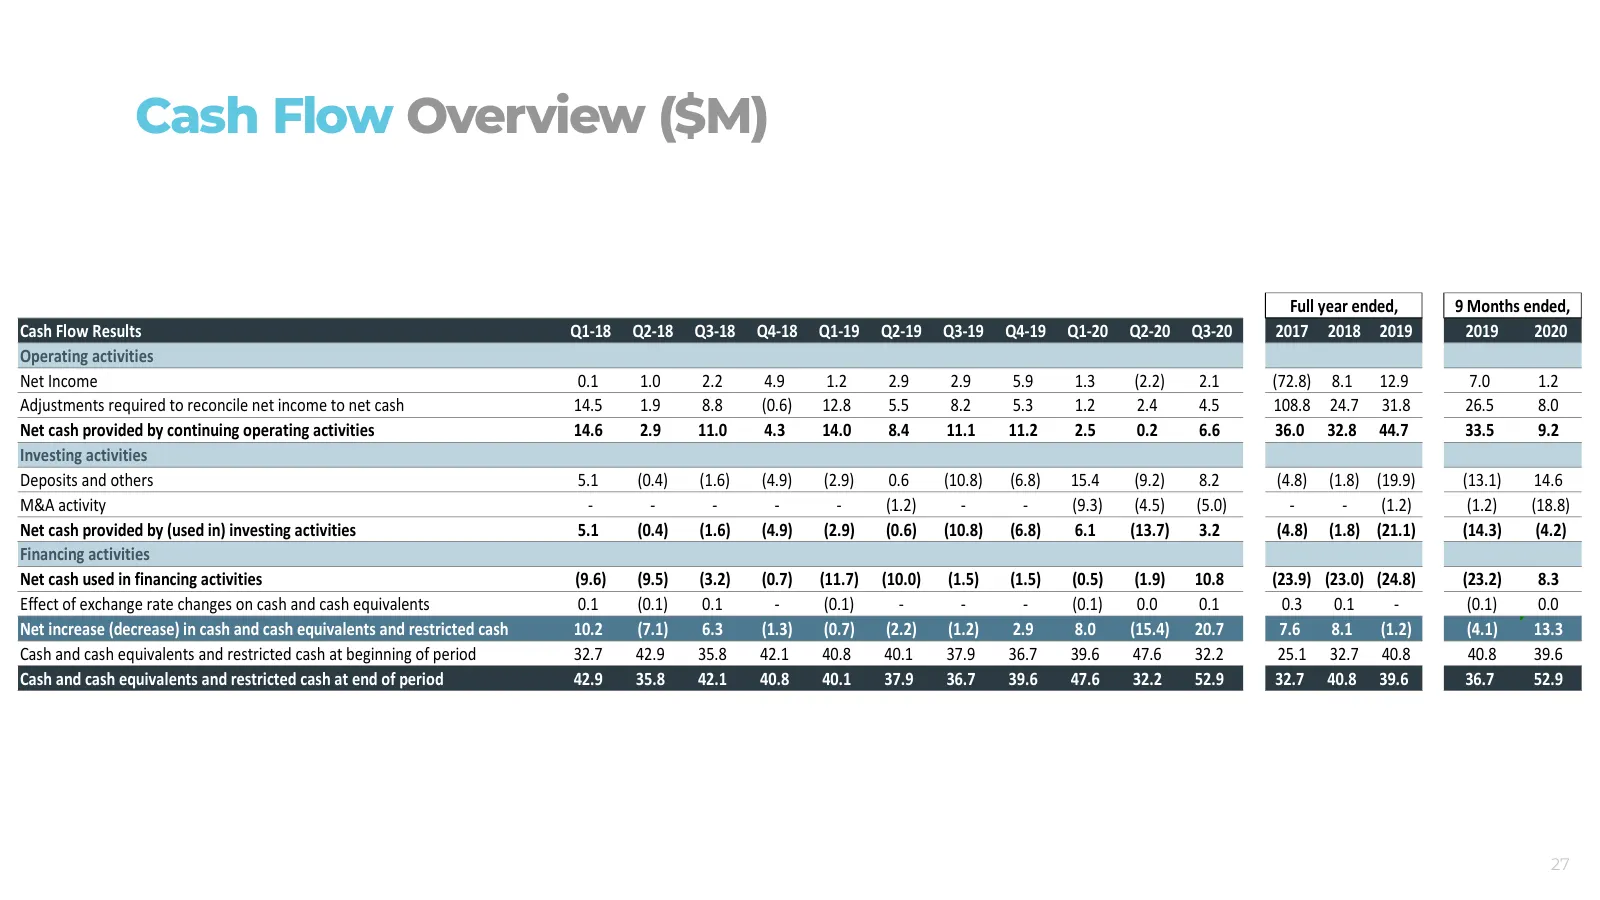
Cash Flow Overview ($M) Cash Flow Overview ($M) Full year ended, 9 Months ended, Cash Flow Results Q1-18 Q2-18 Q3-18 Q4-18 Q1-19 Q2-19 Q3-19 Q4-19 Q1-20 Q2-20 Q3-20 2017 2018 2019 2019 2020 Operating activities Net Income 0.1 1.0 2.2 4.9 1.2 2.9 2.9 5.9 1.3 (2.2) 2.1 (72.8) 8.1 12.9 7.0 1.2 Adjustme
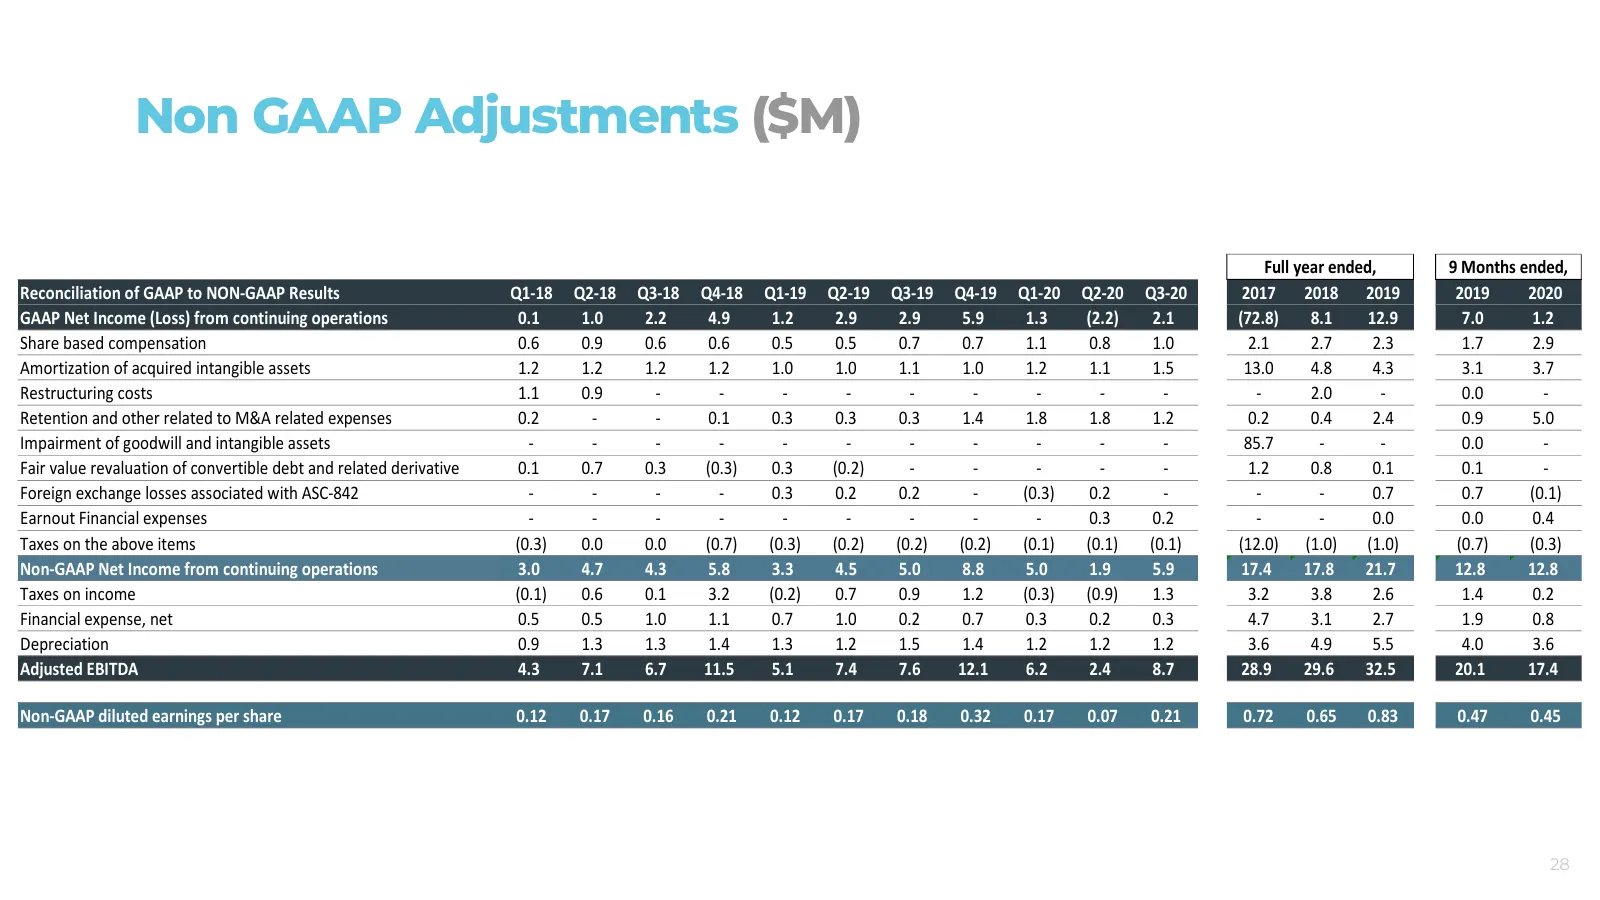
Slide 28: Non-GAAP Adjustments ($M)
Non-GAAP Non GAAPAdjustments Adjustments($M) ($M) Full year ended, 9 Months ended, Reconciliation of GAAP to NON-GAAP Results Q1-18 Q2-18 Q3-18 Q4-18 Q1-19 Q2-19 Q3-19 Q4-19 Q1-20 Q2-20 Q3-20 2017 2018 2019 2019 2020 GAAP Net Income (Loss) from continuing operations 0.1 1.0 2.2 4.9 1.2 2.9 2.9 5.9 1
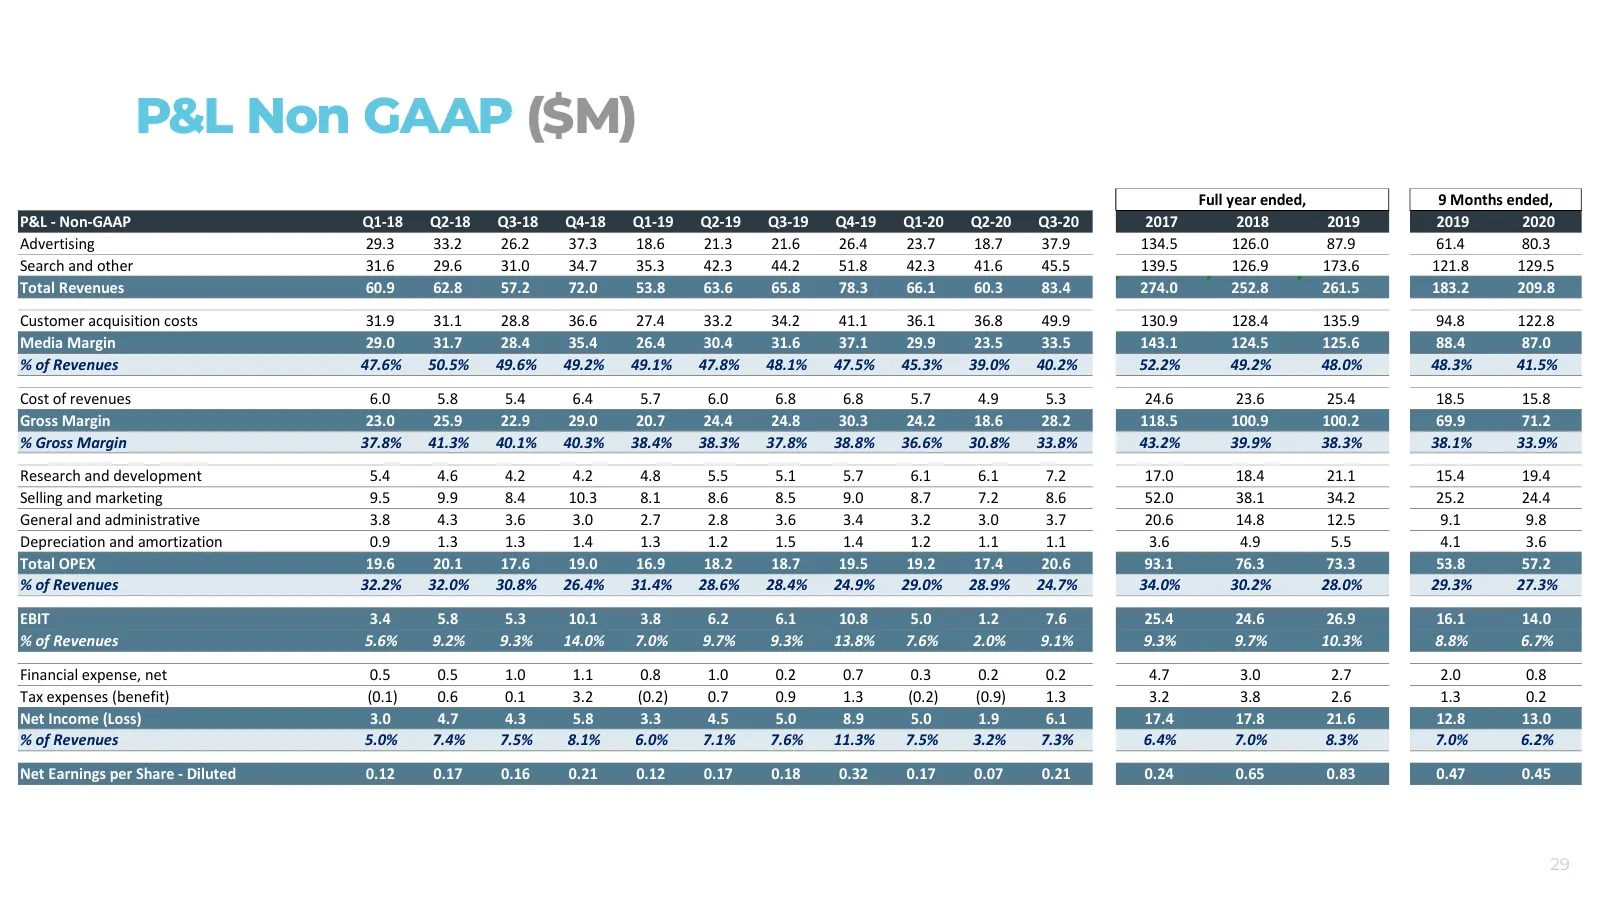
Slide 29: P&L Non-GAAP ($M)
P&L Non GAAP ($M) P&L Non-GAAP ($M) Full year ended, 9 Months ended, P&L - Non-GAAP Q1-18 Q2-18 Q3-18 Q4-18 Q1-19 Q2-19 Q3-19 Q4-19 Q1-20 Q2-20 Q3-20 2017 2018 2019 2019 2020 Advertising 29.3 33.2 26.2 37.3 18.6 21.3 21.6 26.4 23.7 18.7 37.9 134.5 126.0 87.9 61.4 80.3 Search and other 31.6 29.6 31.0
Source: Internet Archive copy of perion.com
More decks from Perion Network Ltd
 Q2 2026 Earnings Presentation43 slides · Aug 10, 2026
 Investor Presentation (August 2026)83 slides · August 2026
 Investor Presentation (June 2026)80 slides · Jun 29, 2026
 Q1 2026 Earnings Presentation39 slides · May 20, 2026
 Q4 2025 Earnings Presentation54 slides · Feb 18, 2026
 Q3 2025 Earnings Presentation40 slides · Nov 12, 2025