NexTier Oilfield Solutions Inc
NexTier Oilfield Solutions — Investor Day (March 2022)
148 slides from NexTier Oilfield Solutions's investor day presentation, Mar 3, 2022
Slide 1: NexTier 2022 Investor Day
vo o d o o 1 NexTier 2022 Investor Day March 3, 2022
Slide 2: Forward Looking Statements & Disclosures
2 Forward Looking Statements & Disclosures All statements other than statements of historical facts contained in this presentation and any oral statements made in connection with this presentation, including guidance for 2022 and beyond and other outlook information (including with respect to the in
Slide 3: Non-GAAP Financial Measures
3 Non-GAAP Financial Measures We have included in this presentation and in oral comments made in connection with this presentation certain non-GAAP financial measures, some of which are calculated on segment basis or product line basis. These measurements provide supplemental information which manag
Slide 4: The Future of Frac
vo o d o o 4 The Future of Frac Robert Drummond, President & CEO Delivering on the Right Strategy at the Right Time
Slide 5: Leading the Future of Frac
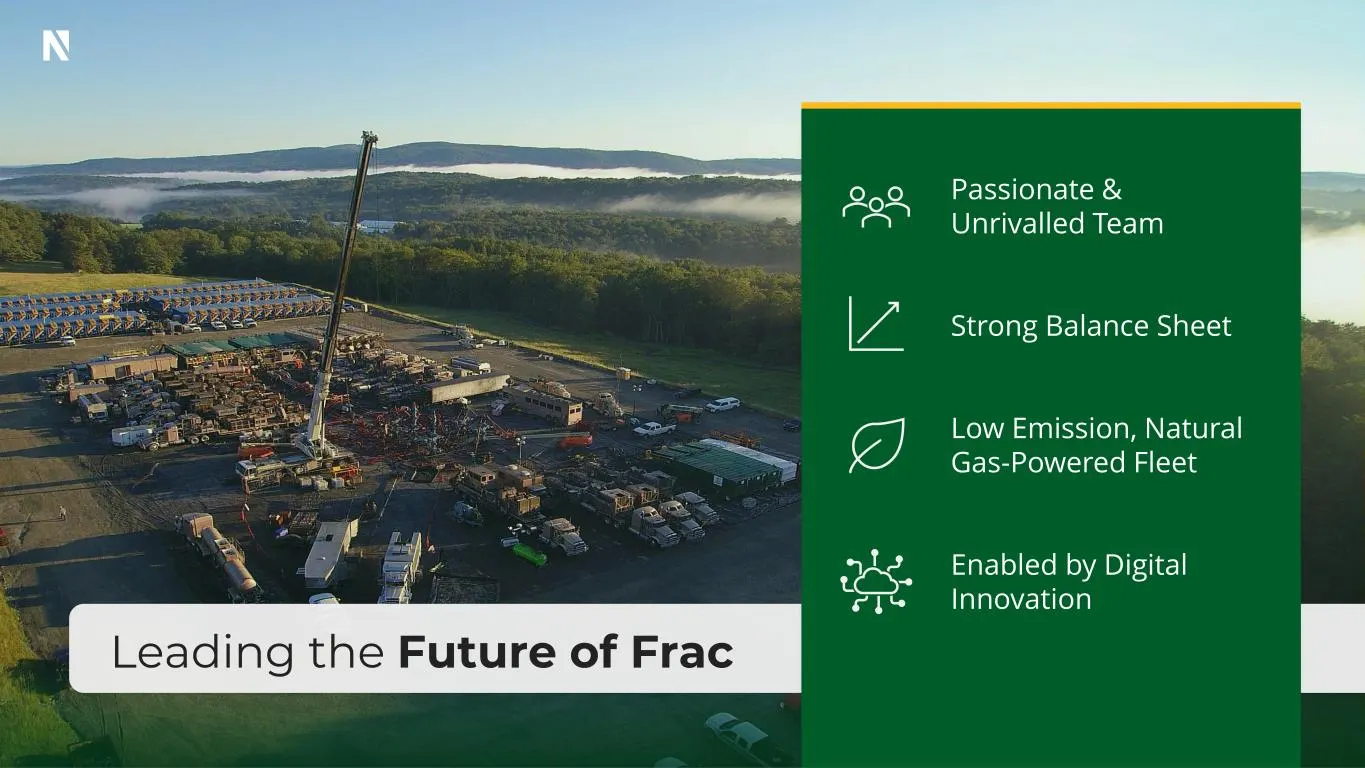
5 Leading the Future of Frac Passionate & Unrivalled Team Strong Balance Sheet Low Emission, Natural Gas-Powered Fleet Enabled by Digital Innovation
Slide 6: The Resilience of U.S. Shale
6 The Resilience of U.S. Shale
Slide 7: The Return of Balance in the Post-Pandemic Recovery
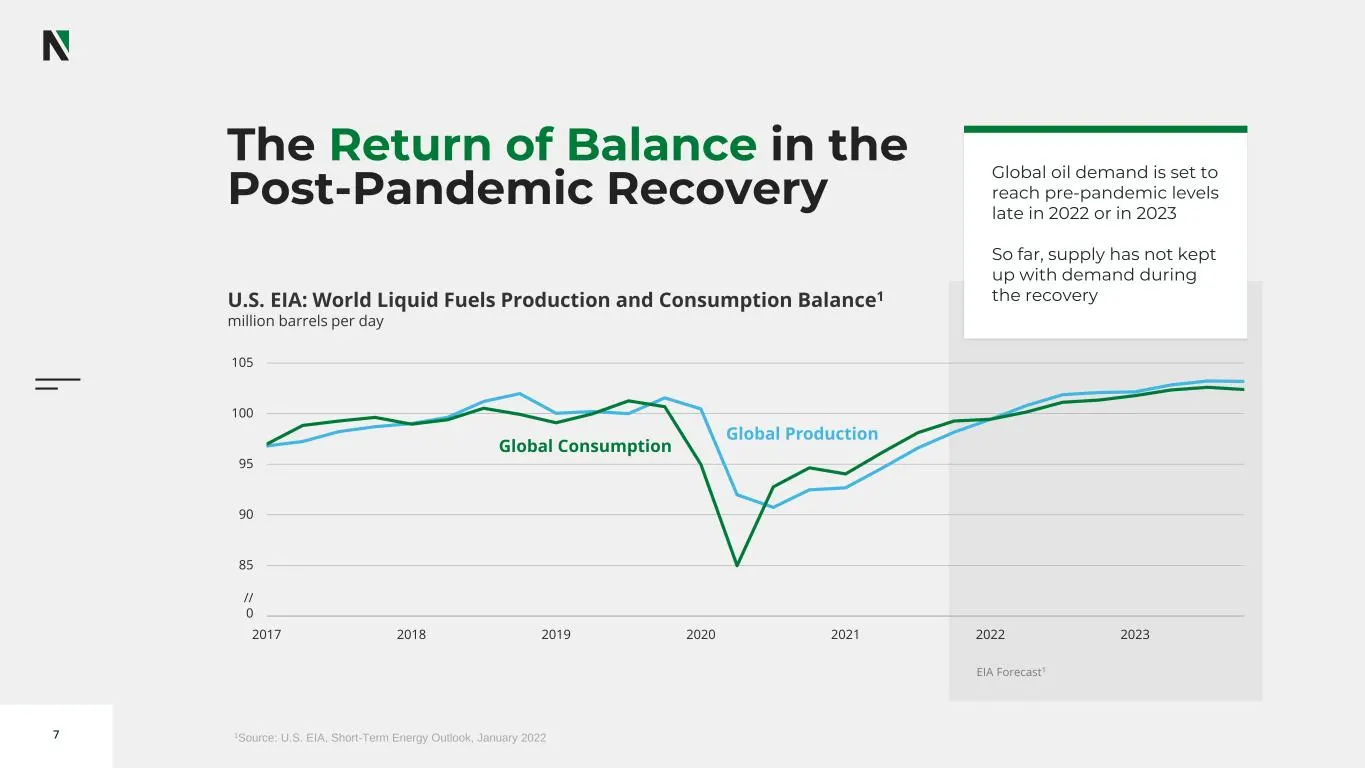
7 80 85 90 95 100 105 2017 2018 2019 2020 2021 2022 2023 U.S. EIA: World Liquid Fuels Production and Consumption Balance1 million barrels per day The Return of Balance in the Post-Pandemic Recovery Global Consumption EIA Forecast1 // 1Source: U.S. EIA, Short-Term Energy Outlook, January 2022 Global
Slide 8: World energy consumption will need Oil and Gas for years
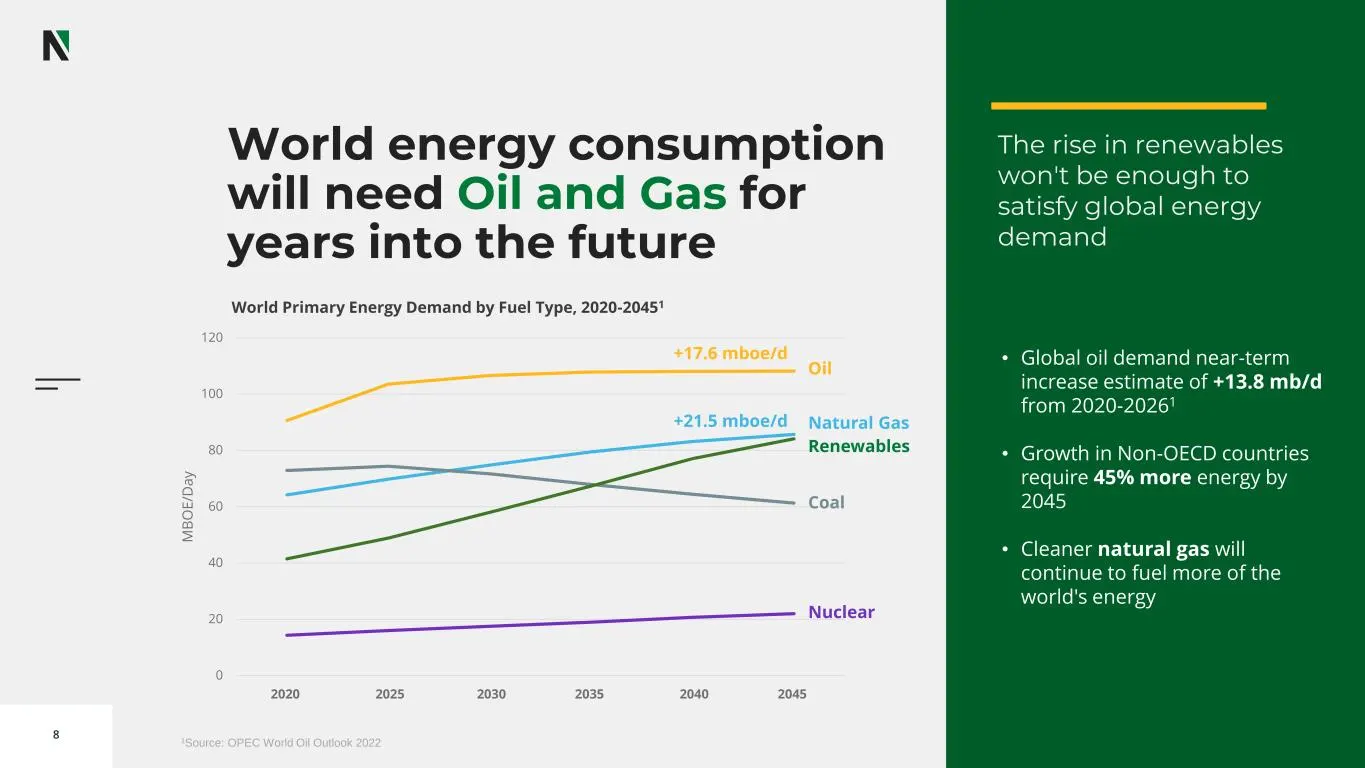
8 World energy consumption will need Oil and Gas for years into the future 0 20 40 60 80 100 120 2020 2025 2030 2035 2040 2045 M B O E /D a y World Primary Energy Demand by Fuel Type, 2020-20451 Oil Natural Gas Renewables Coal Nuclear +17.6 mboe/d +21.5 mboe/d 1Source: OPEC World Oil Outlook 2022 •
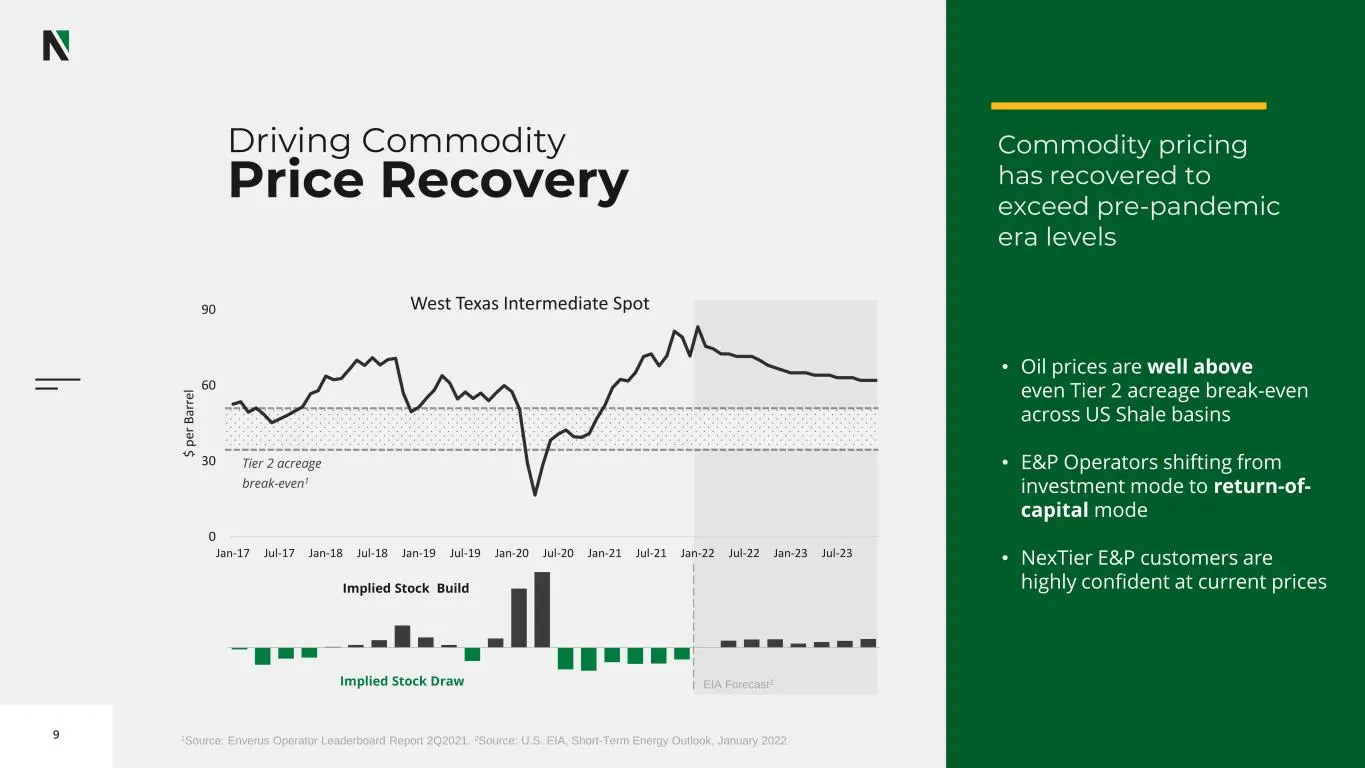
Slide 9: Driving Commodity Price Recovery
9 Driving Commodity Price Recovery Tier 2 acreage break-even1 Implied Stock Build 0 30 60 90 Jan-17 Jul-17 Jan-18 Jul-18 Jan-19 Jul-19 Jan-20 Jul-20 Jan-21 Jul-21 Jan-22 Jul-22 Jan-23 Jul-23 $ p er B ar re l West Texas Intermediate Spot Implied Stock Draw EIA Forecast2 • Oil prices are well above ev
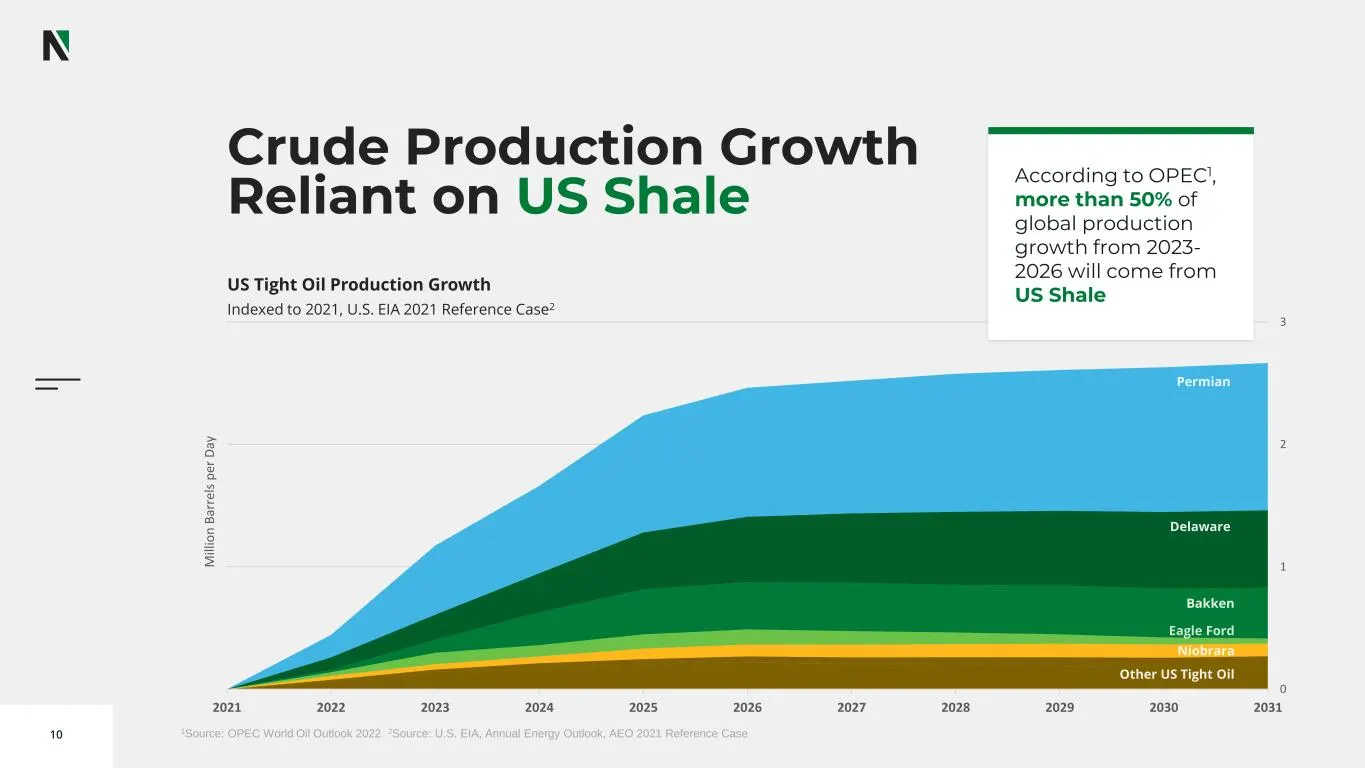
Slide 10: Crude Production Growth Reliant on US Shale
10 Crude Production Growth Reliant on US Shale 0 1 2 3 2021 2022 2023 2024 2025 2026 2027 2028 2029 2030 2031 M ill io n B ar re ls p er D ay US Tight Oil Production Growth Indexed to 2021, U.S. EIA 2021 Reference Case2 1Source: OPEC World Oil Outlook 2022 2Source: U.S. EIA, Annual Energy Outlook, A
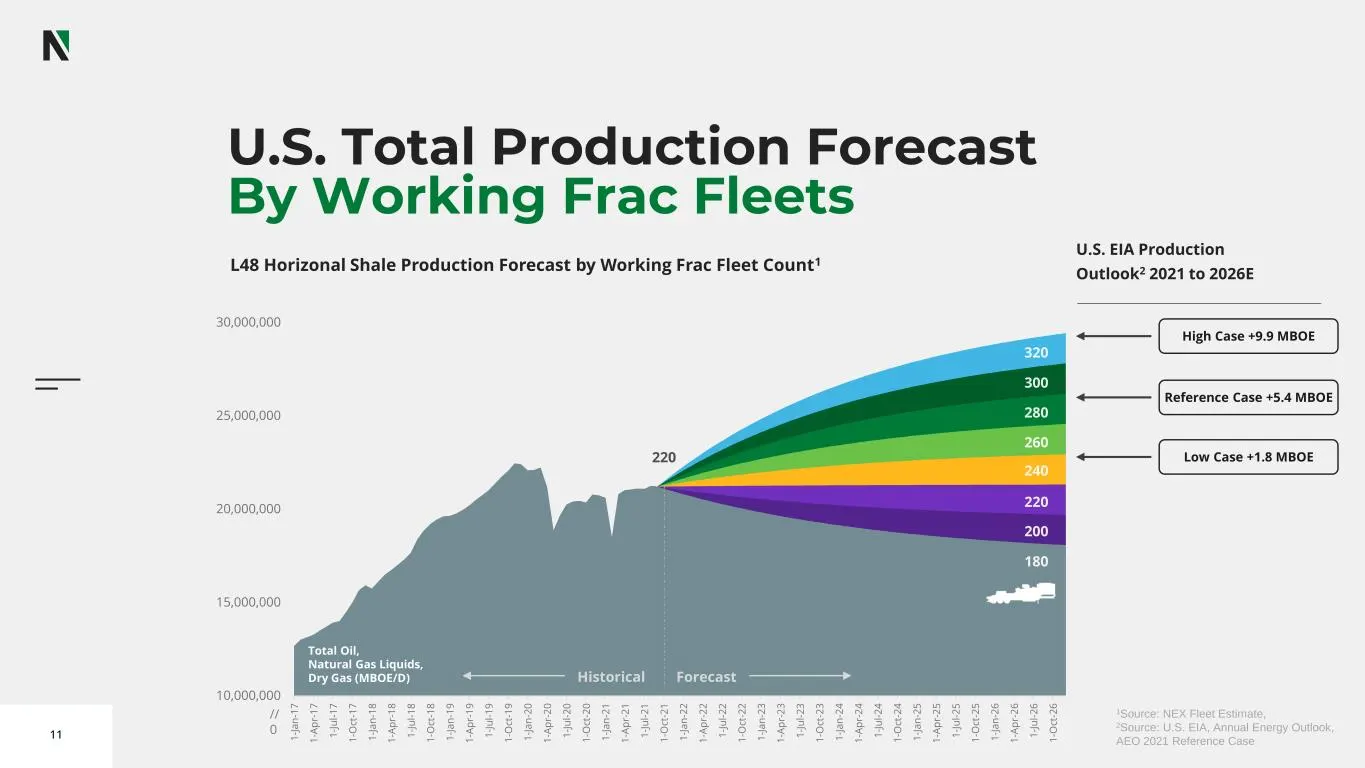
Slide 11: U.S. Total Production Forecast By Working Frac Fleets
11 U.S. Total Production Forecast By Working Frac Fleets 10,000,000 15,000,000 20,000,000 25,000,000 30,000,000 1 -J a n -1 7 1 -A p r- 1 7 1 -J u l- 1 7 1 -O ct -1 7 1 -J a n -1 8 1 -A p r- 1 8 1 -J u l- 1 8 1 -O ct -1 8 1 -J a n -1 9 1 -A p r- 1 9 1 -J u l- 1 9 1 -O ct -1 9 1 -J a n -2 0 1 -A p r-
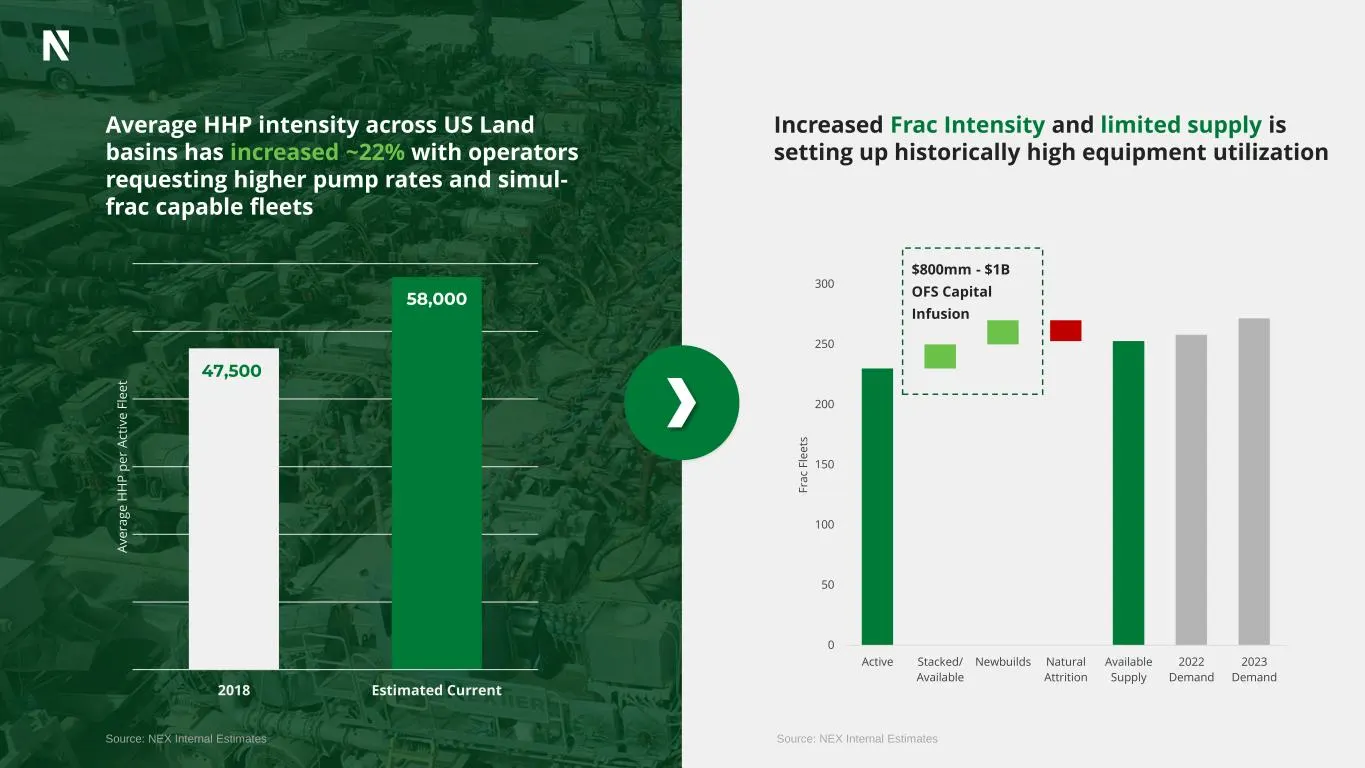
Slide 12: Increased Frac Intensity and Limited Supply
12 Average HHP intensity across US Land basins has increased ~22% with operators requesting higher pump rates and simul- frac capable fleets Increased Frac Intensity and limited supply is setting up historically high equipment utilization 0 50 100 150 200 250 300 Active Stacked/ Available Newbuilds
Slide 13: The NexTier Fleet Transformation
13 The NexTier Fleet Transformation
Slide 14: Not all Horsepower is created equal
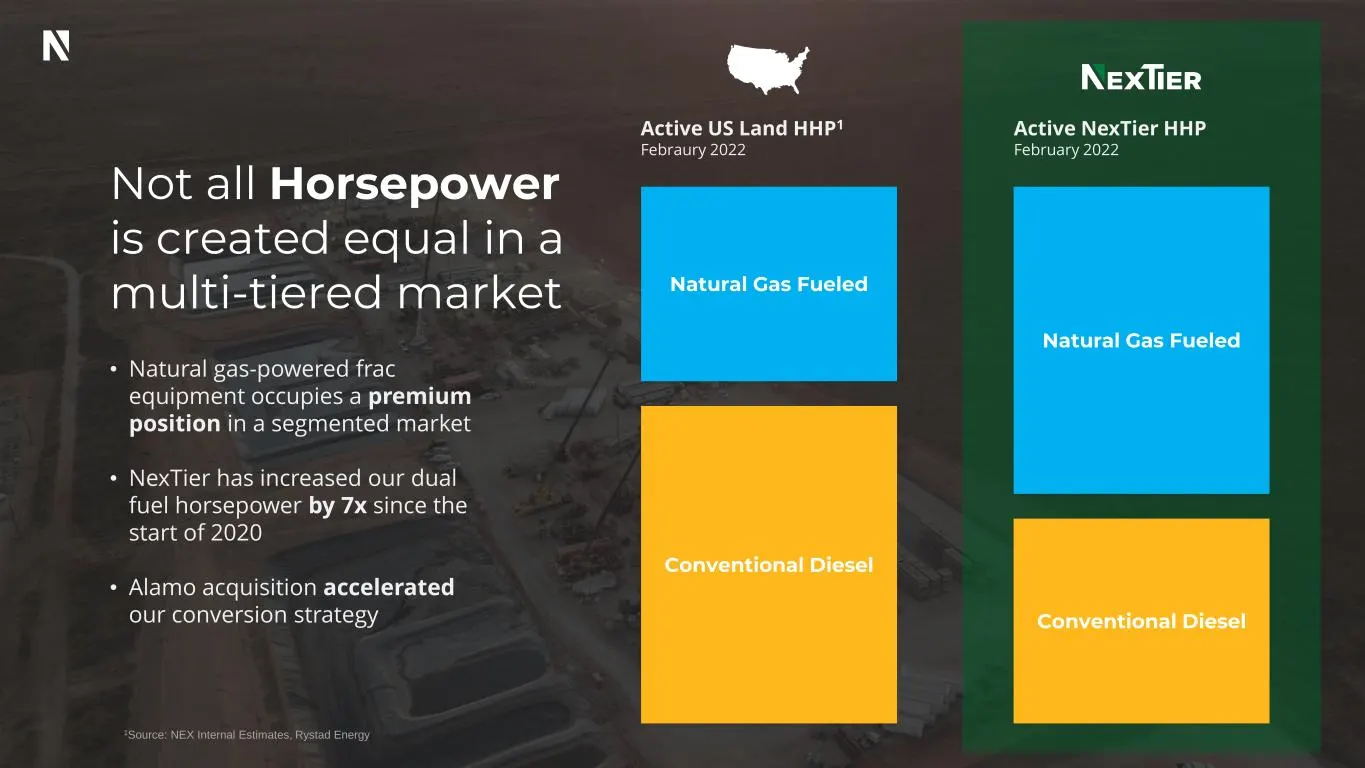
14 Not all Horsepower is created equal in a multi-tiered market • Natural gas-powered frac equipment occupies a premium position in a segmented market • NexTier has increased our dual fuel horsepower by 7x since the start of 2020 • Alamo acquisition accelerated our conversion strategy Active NexTier
Slide 15: Maximizing Returns with Dual-Fuel Conversion
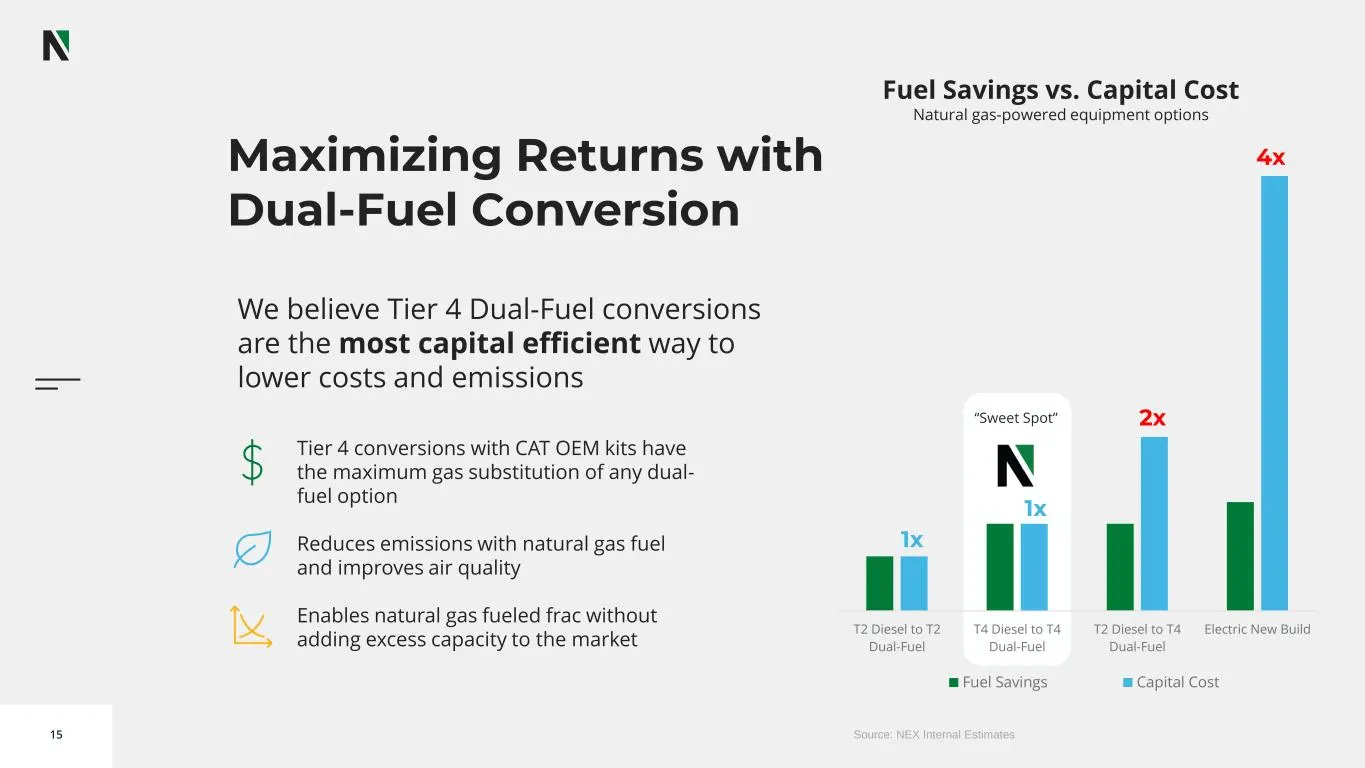
15 T2 Diesel to T2 Dual-Fuel T4 Diesel to T4 Dual-Fuel T2 Diesel to T4 Dual-Fuel Electric New Build Fuel Savings Capital Cost Maximizing Returns with Dual-Fuel Conversion We believe Tier 4 Dual-Fuel conversions are the most capital efficient way to lower costs and emissions Fuel Savings vs. Capital
Slide 16: Incremental Pricing Power
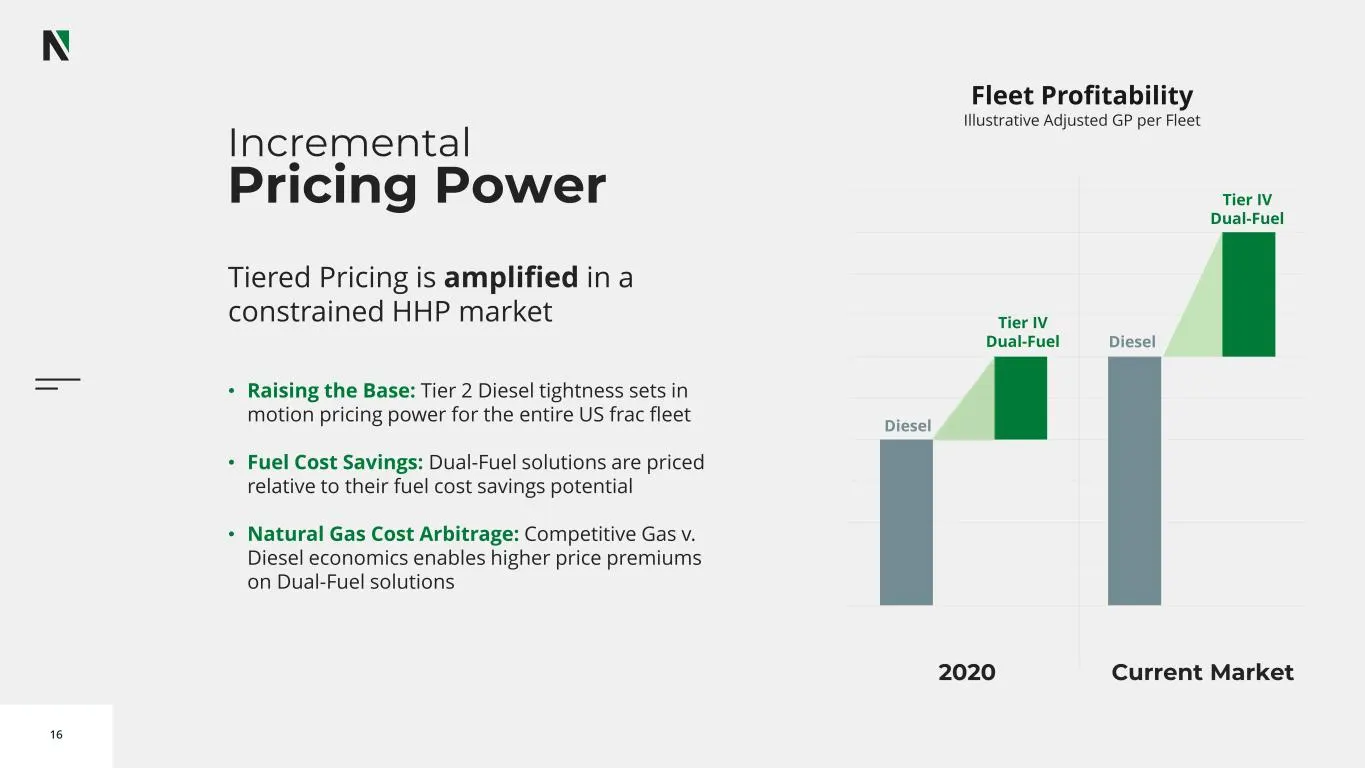
16 Incremental Pricing Power Tiered Pricing is amplified in a constrained HHP market • Raising the Base: Tier 2 Diesel tightness sets in motion pricing power for the entire US frac fleet • Fuel Cost Savings: Dual-Fuel solutions are priced relative to their fuel cost savings potential • Natural Gas C
Slide 17: Strategy
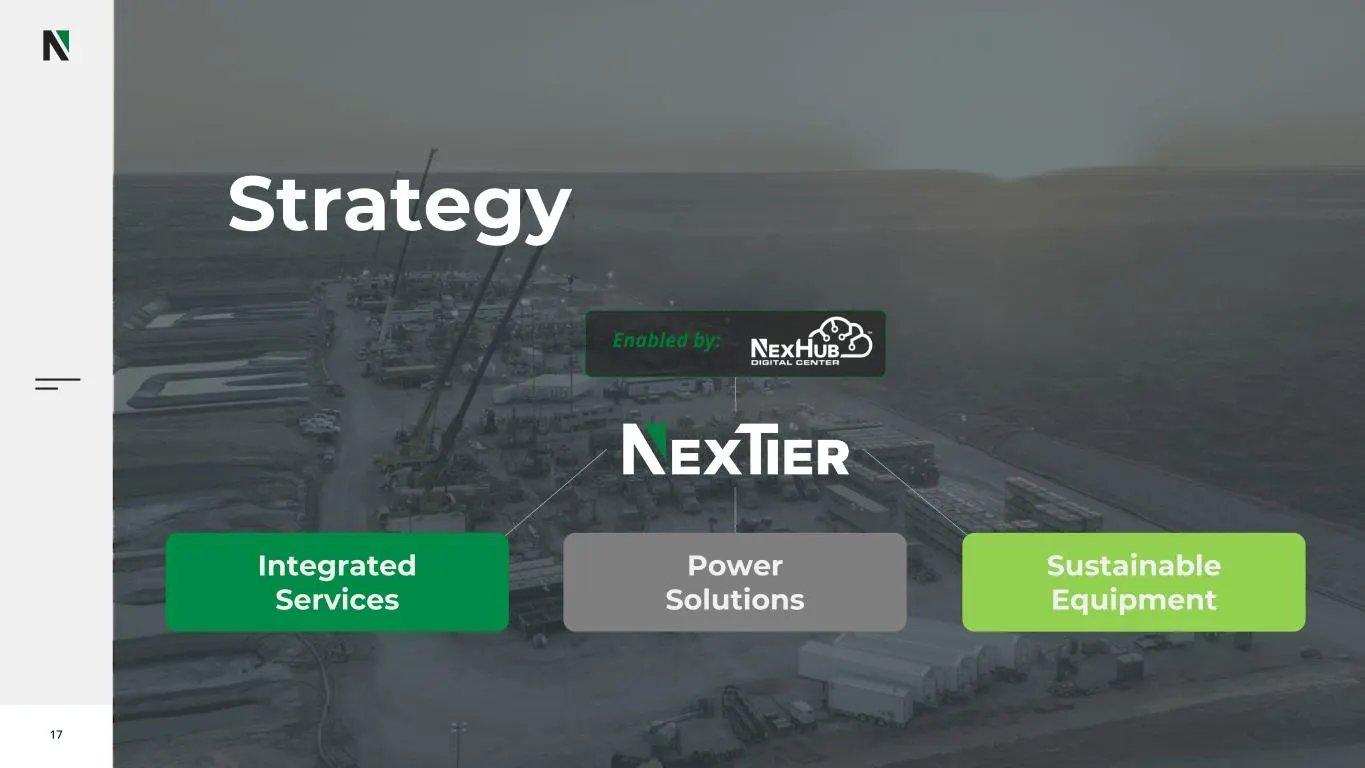
17 Strategy Integrated Services Power Solutions Sustainable Equipment Enabled by:
Slide 18: Integrate for Efficiency, Create Value
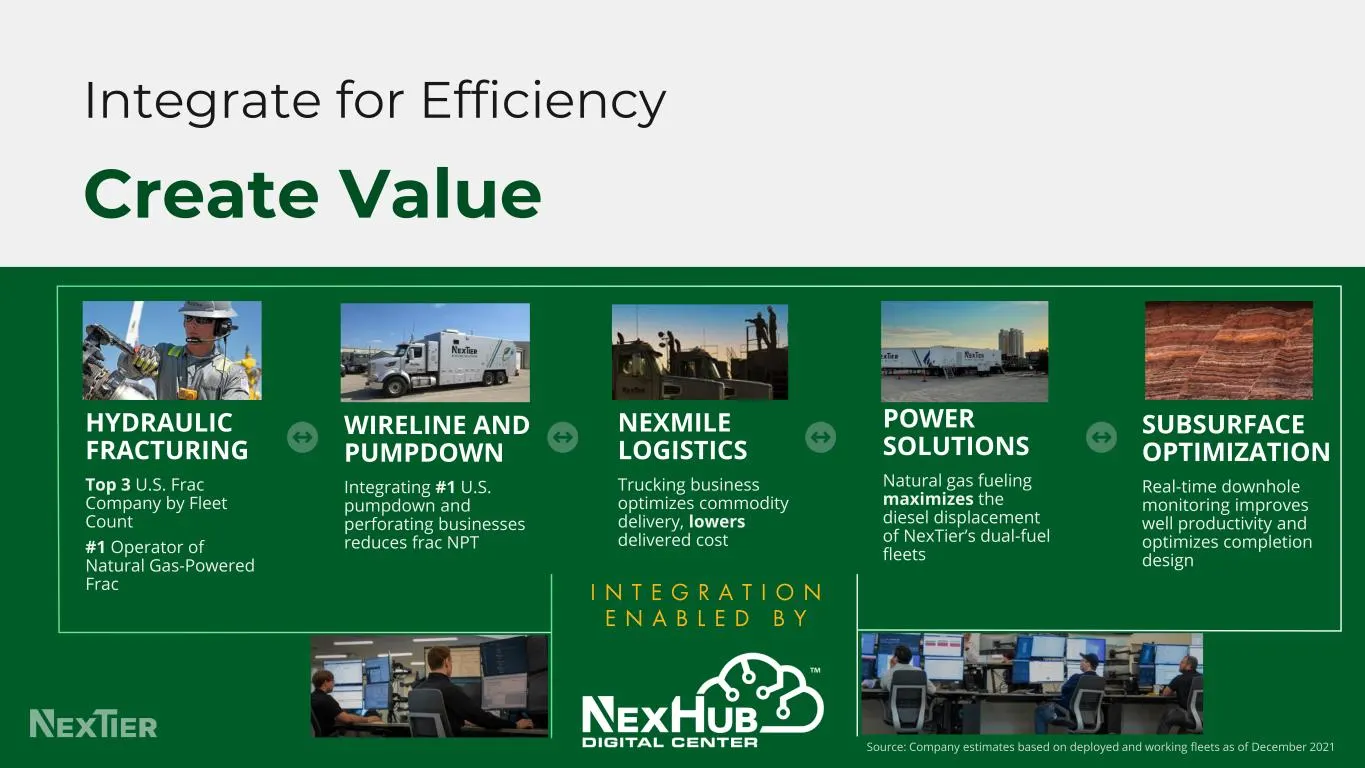
HYDRAULIC FRACTURING Top 3 U.S. Frac Company by Fleet Count #1 Operator of Natural Gas-Powered Frac POWER SOLUTIONS Natural gas fueling maximizes the diesel displacement of NexTier’s dual-fuel fleets NEXMILE LOGISTICS Trucking business optimizes commodity delivery, lowers delivered cost WIRELINE AND
Slide 19: Reduce Carbon, Reduce Cost
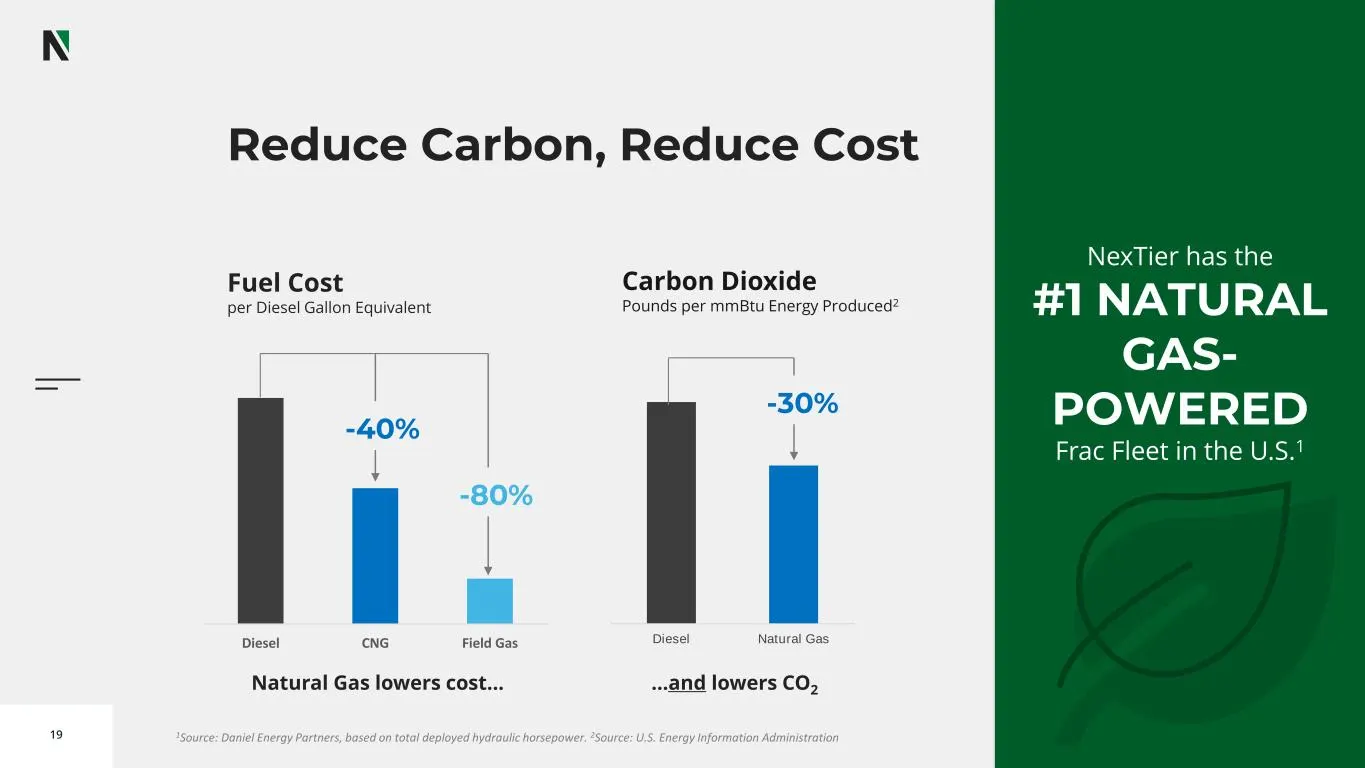
19 Reduce Carbon, Reduce Cost Diesel CNG Field Gas Fuel Cost per Diesel Gallon Equivalent -40% -80% Diesel Natural Gas 1Source: Daniel Energy Partners, based on total deployed hydraulic horsepower. 2Source: U.S. Energy Information Administration Carbon Dioxide Pounds per mmBtu Energy Produced2 -30%
Slide 20: 2021 ESG Initiatives in Action
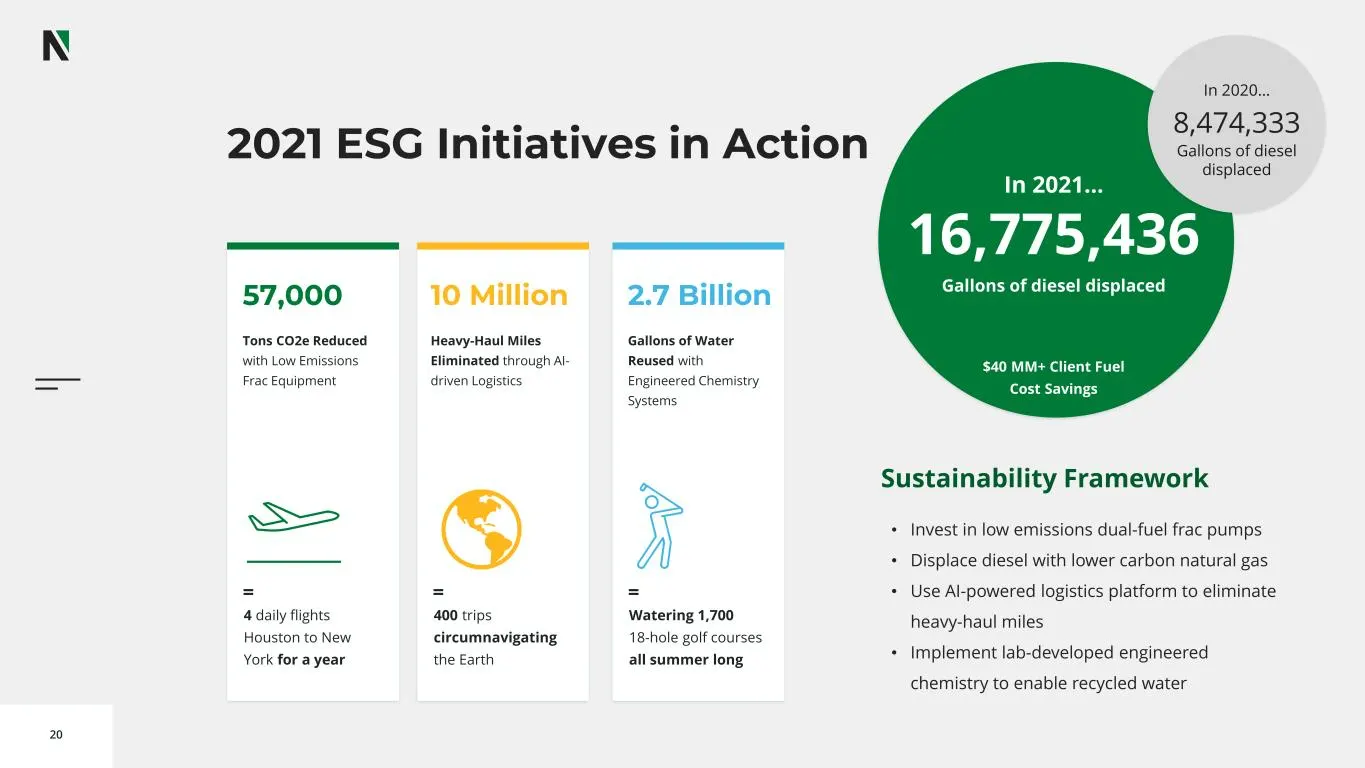
20 2021 ESG Initiatives in Action Sustainability Framework 57,000 Tons CO2e Reduced with Low Emissions Frac Equipment 4 daily flights Houston to New York for a year = 10 Million Heavy-Haul Miles Eliminated through AI- driven Logistics 400 trips circumnavigating the Earth = 2.7 Billion Gallons of Wat
Slide 21: About Us
21 About Us
Slide 22: We are the Leader in U.S. Land Completions
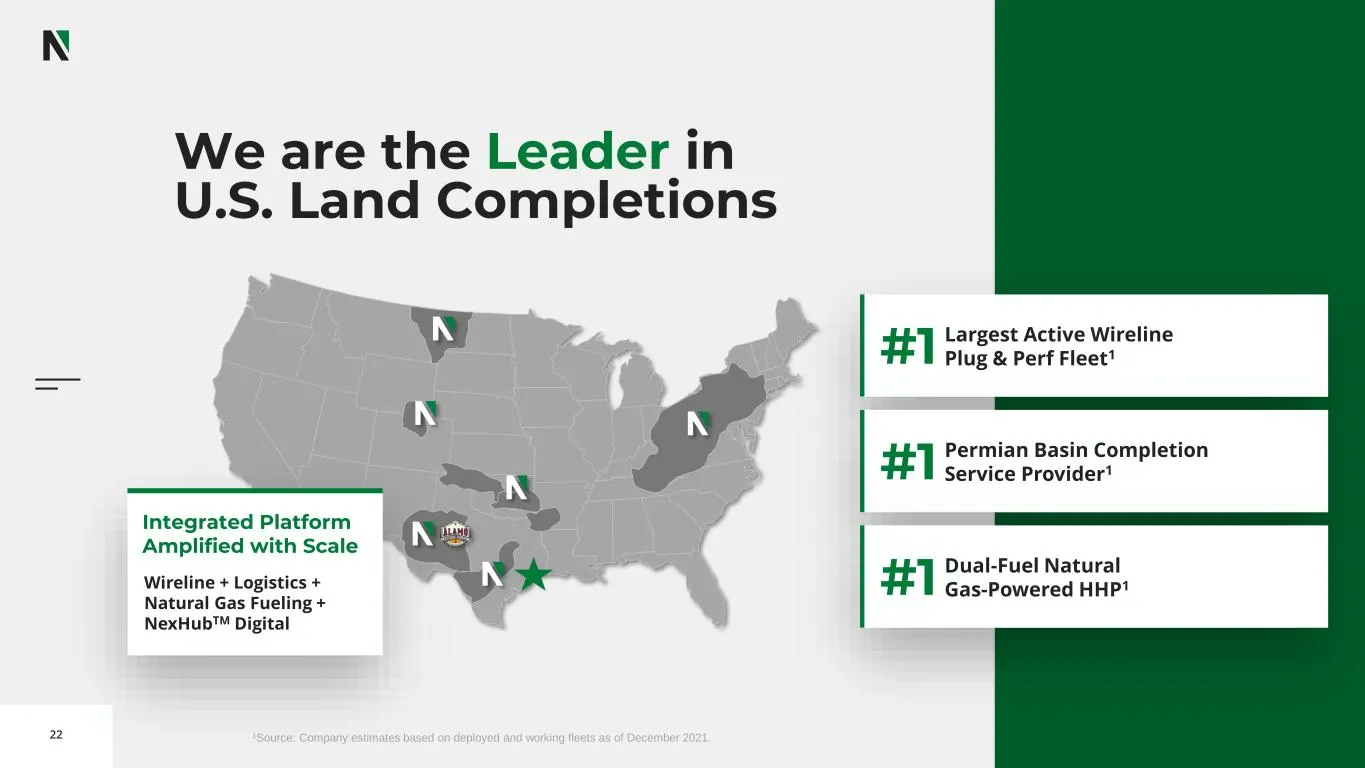
22 We are the Leader in U.S. Land Completions Largest Active Wireline Plug & Perf Fleet1#1 Permian Basin Completion Service Provider1#1 Dual-Fuel Natural Gas-Powered HHP1#1 1Source: Company estimates based on deployed and working fleets as of December 2021. Integrated Platform Amplified with Scale W
Slide 23: NexTier + Alamo: The Premier Permian Partnership
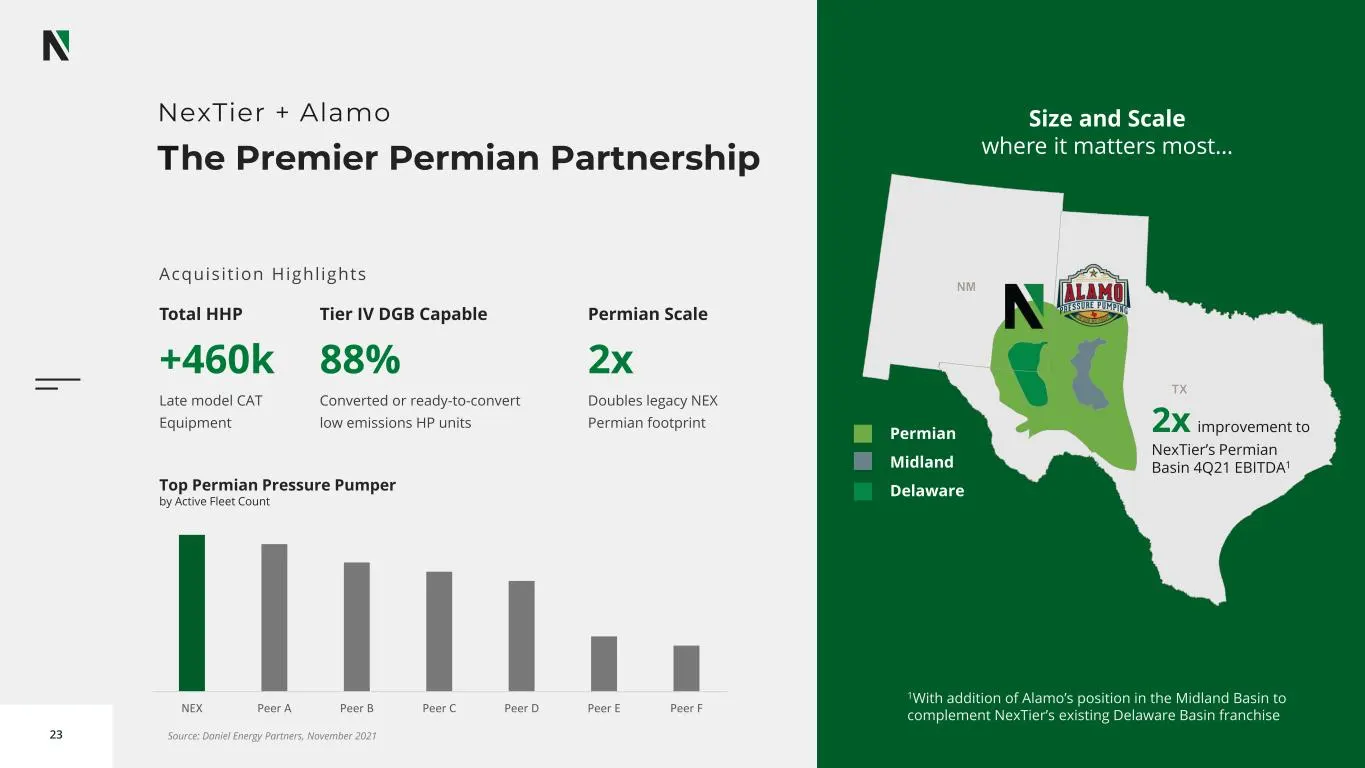
23 NexTier + Alamo Source: Daniel Energy Partners, November 2021 Top Permian Pressure Pumper by Active Fleet Count Size and Scale where it matters most… 2x improvement to NexTier’s Permian Basin 4Q21 EBITDA1 Total HHP +460k Late model CAT Equipment Tier IV DGB Capable 88% Converted or ready-to-conve
Slide 24: Finance Impact
24 Finance Impact
Slide 25: Consistent Top Line Growth
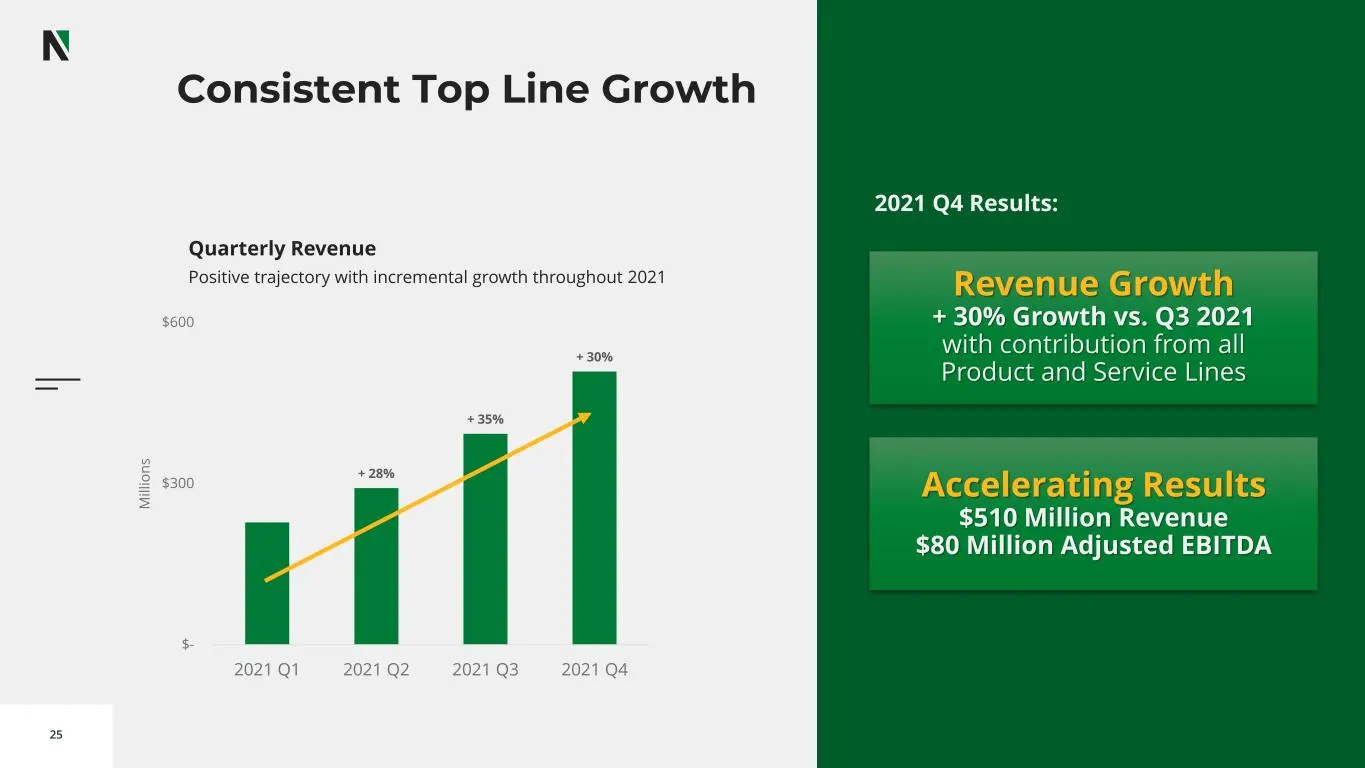
25 Consistent Top Line Growth Quarterly Revenue Positive trajectory with incremental growth throughout 2021 + 28% + 35% + 30% $- $300 $600 2021 Q1 2021 Q2 2021 Q3 2021 Q4 M il li o n s Accelerating Results $510 Million Revenue $80 Million Adjusted EBITDA 2021 Q4 Results: Revenue Growth + 30% Growth
Slide 26: Capitalize on Cycle Dynamics
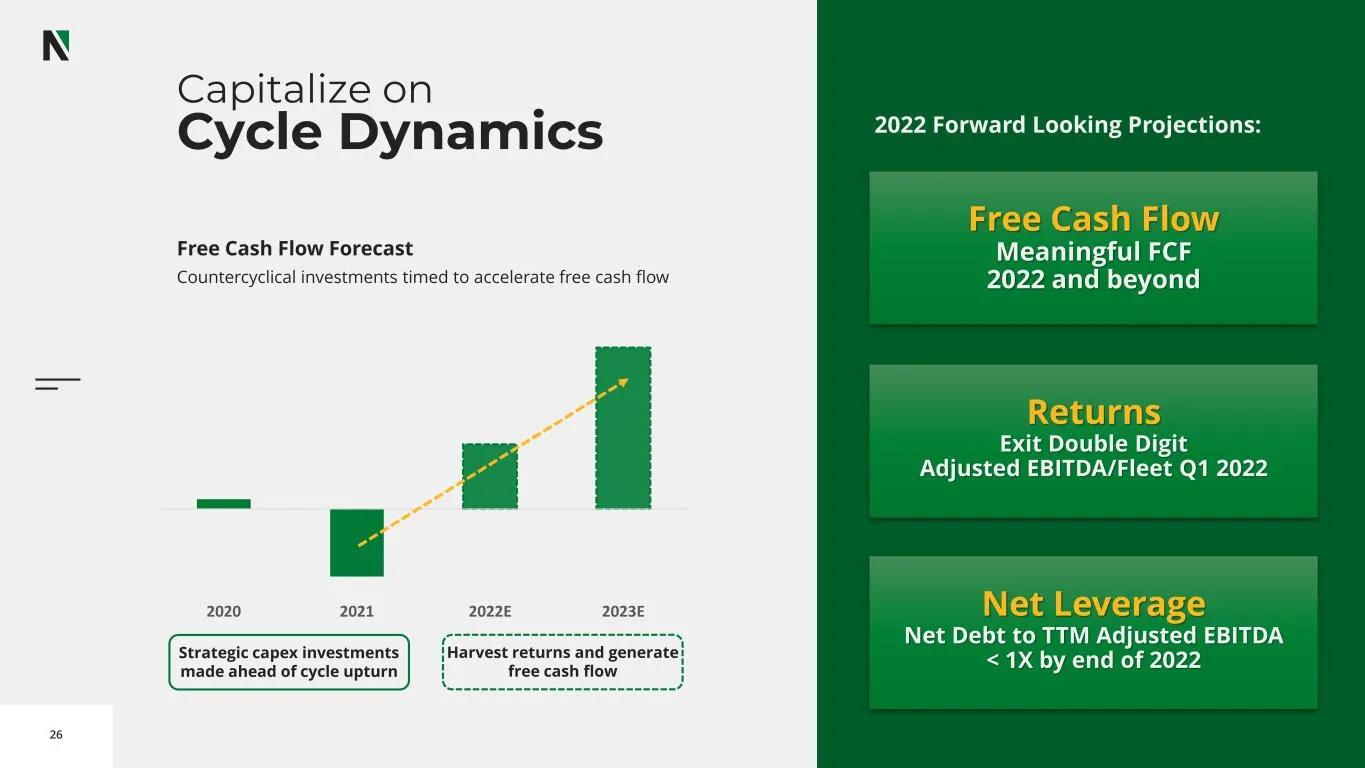
26 Capitalize on Cycle Dynamics Free Cash Flow Forecast Countercyclical investments timed to accelerate free cash flow 2022 Forward Looking Projections: Net Leverage Net Debt to TTM Adjusted EBITDA < 1X by end of 2022 Returns Exit Double Digit Adjusted EBITDA/Fleet Q1 2022 Free Cash Flow Meaningful
Slide 27: Elevate Value
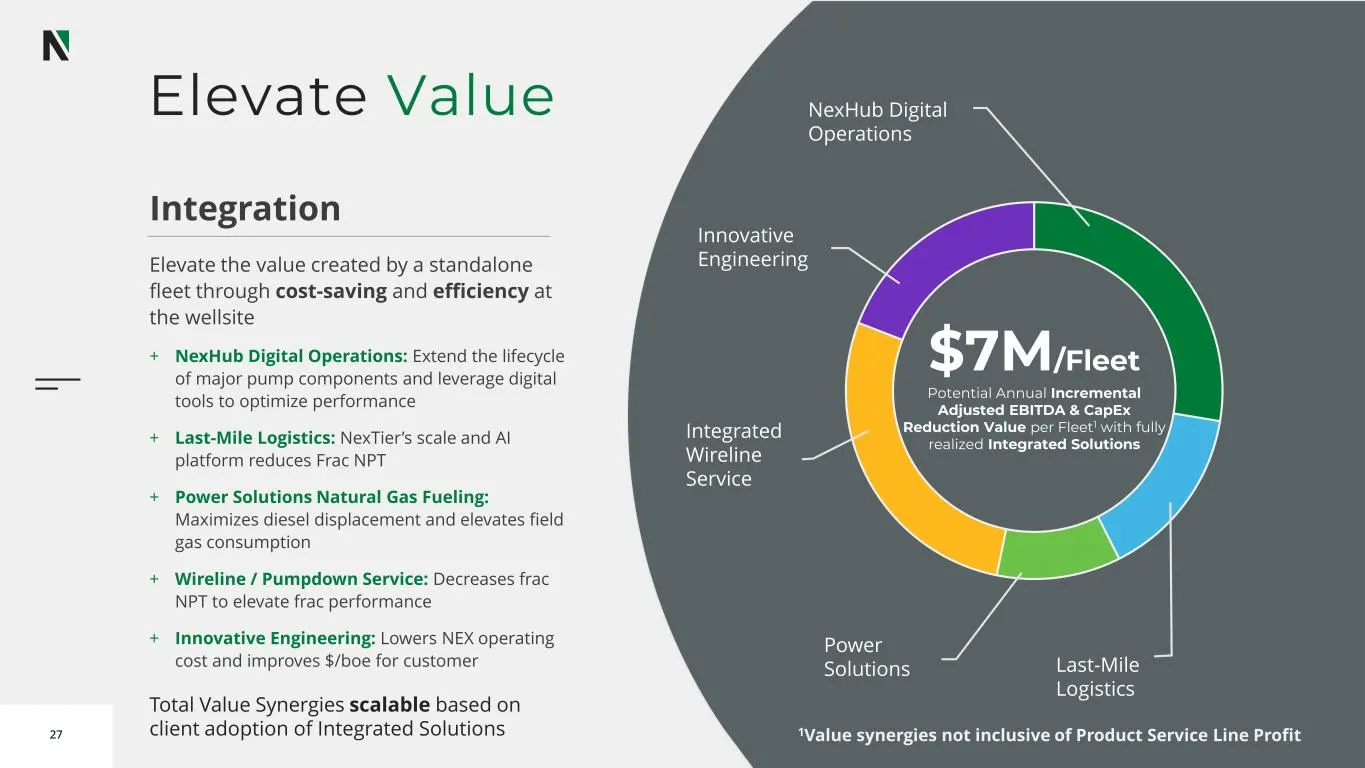
27 Elevate Value Power Solutions NexHub Digital Operations Innovative Engineering Integrated Wireline Service $7M/Fleet Potential Annual Incremental Adjusted EBITDA & CapEx Reduction Value per Fleet1 with fully realized Integrated Solutions Last-Mile Logistics Integration Elevate the value created b
Slide 28: Our Presentation Team
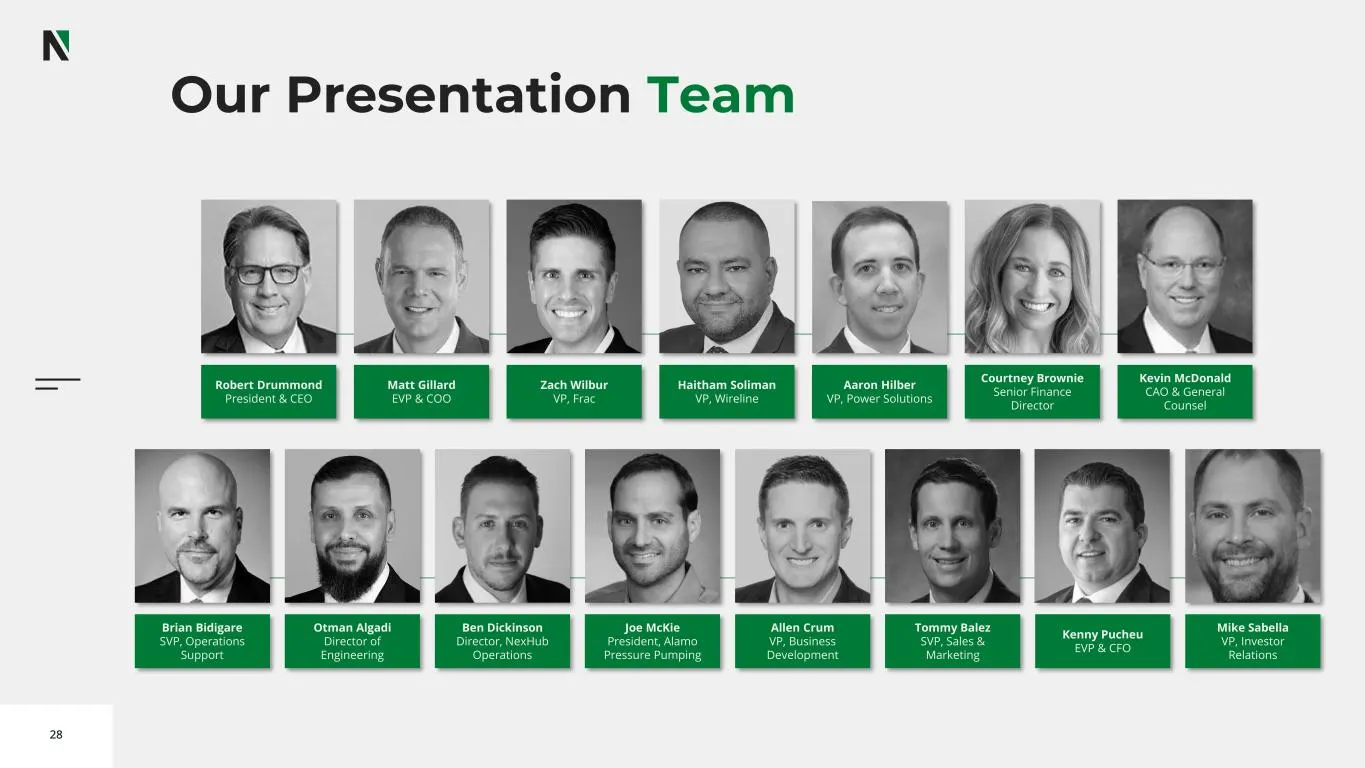
28 Our Presentation Team Aaron Hilber VP, Power Solutions Haitham Soliman VP, Wireline Zach Wilbur VP, Frac Courtney Brownie Senior Finance Director Matt Gillard EVP & COO Robert Drummond President & CEO Kevin McDonald CAO & General Counsel Tommy Balez SVP, Sales & Marketing Allen Crum VP, Business
Slide 29: Integration Works
vo o d o o 29 Integration Works Matt Gillard, Chief Operating Officer - NexTier Joe McKie, President - Alamo Pressure Pumping Wellsite Solutions with Value Generation at the Core
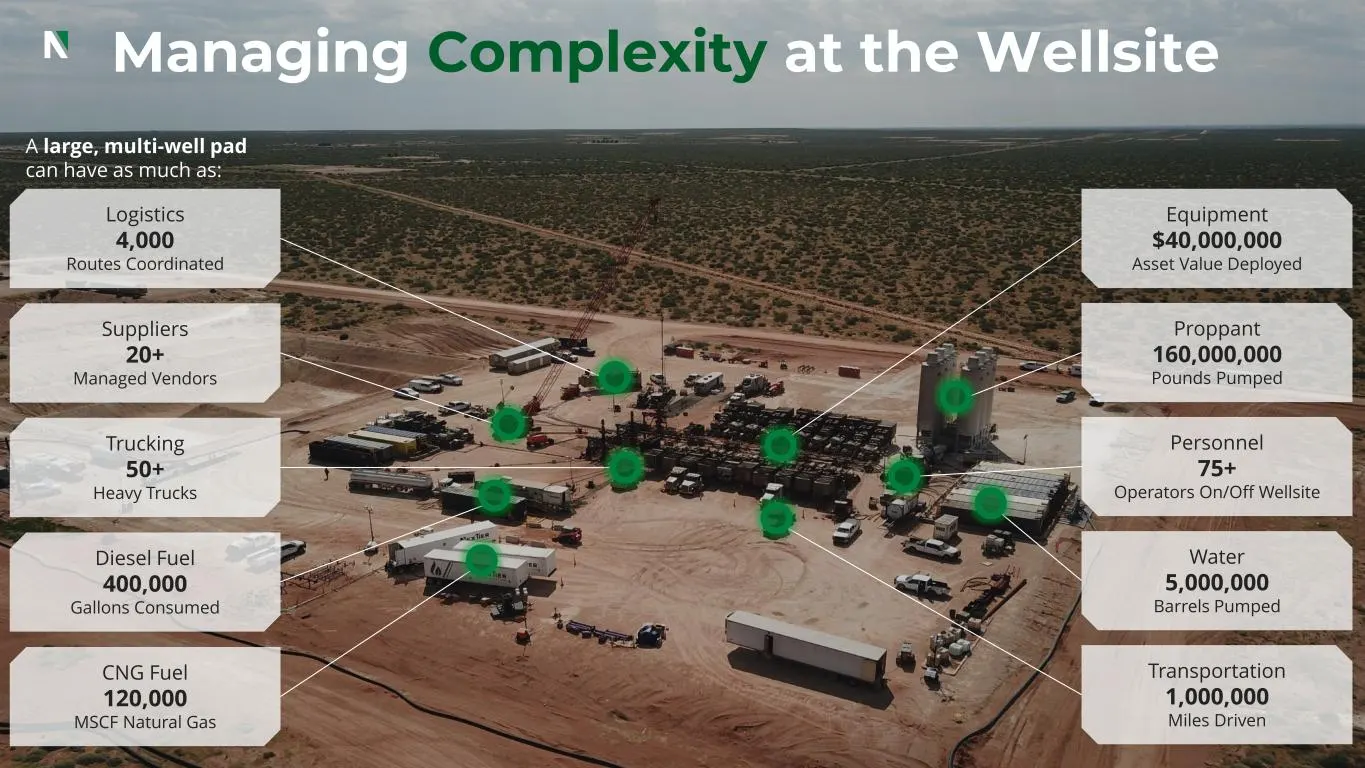
Slide 30: Managing Complexity at the Wellsite
A large, multi-well pad can have as much as: Managing Complexity at the Wellsite Logistics 4,000 Routes Coordinated Trucking 50+ Heavy Trucks CNG Fuel 120,000 MSCF Natural Gas Proppant 160,000,000 Pounds Pumped Equipment $40,000,000 Asset Value Deployed Transportation 1,000,000 Miles Driven Personne
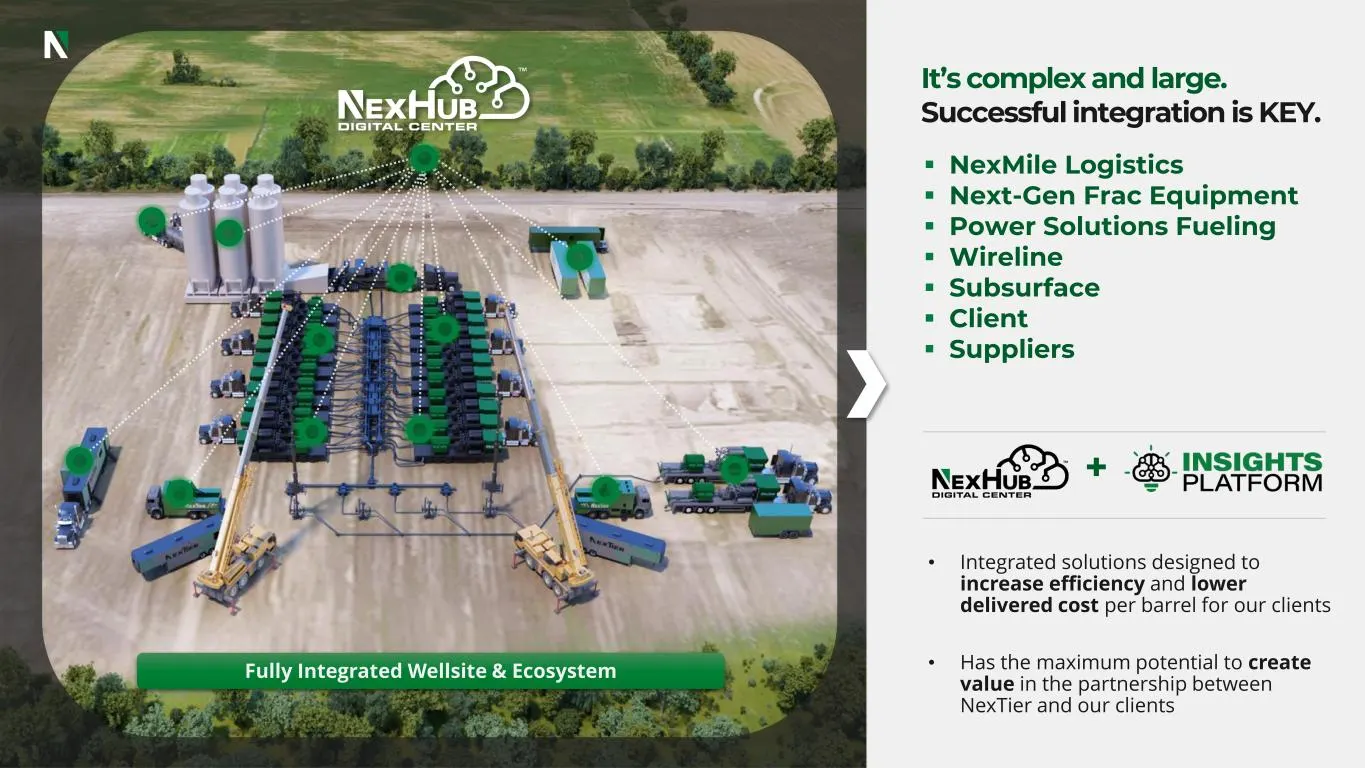
Slide 31: Fully Integrated Wellsite & Ecosystem
Fully Integrated Wellsite & Ecosystem ▪ NexMile Logistics ▪ Next-Gen Frac Equipment ▪ Power Solutions Fueling ▪ Wireline ▪ Subsurface ▪ Client ▪ Suppliers It’s complex and large. Successful integration is KEY. + • Integrated solutions designed to increase efficiency and lower delivered cost per barr
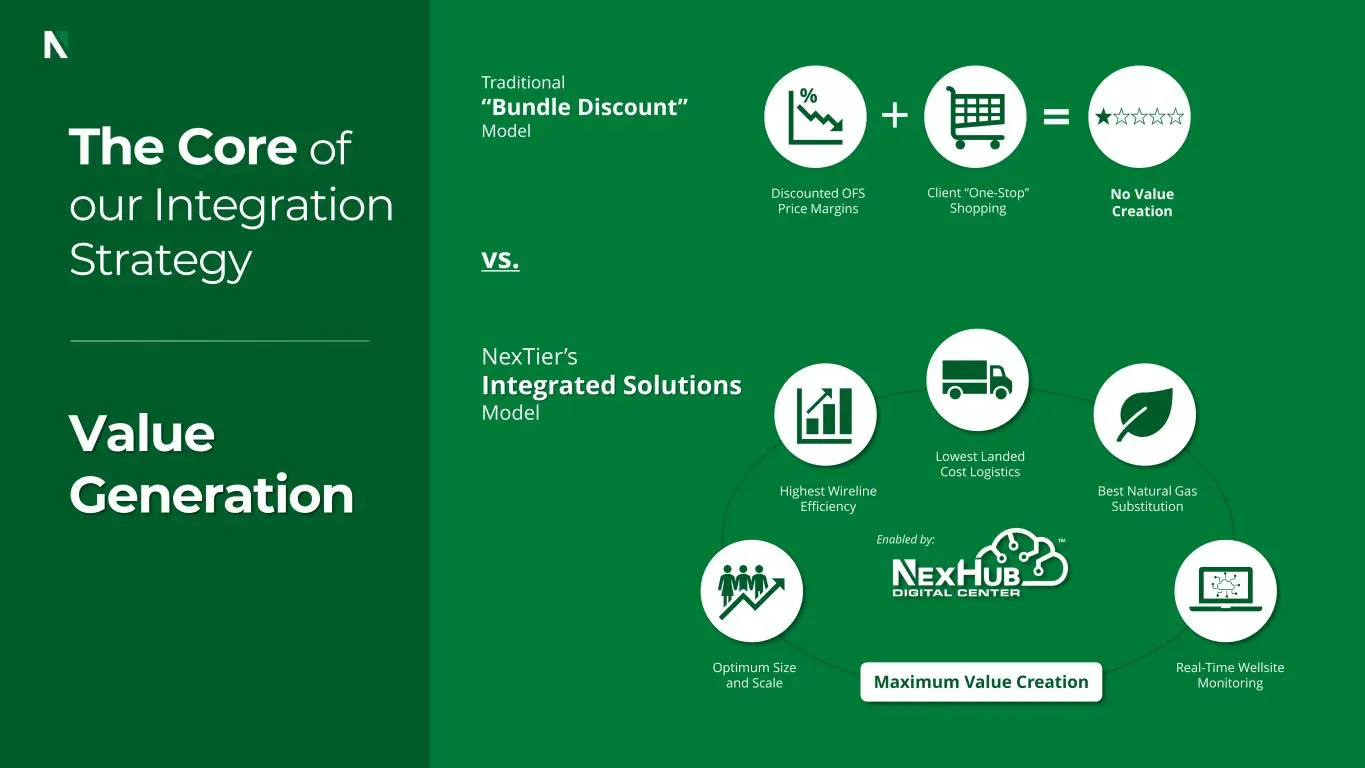
Slide 32: Traditional Bundle Discount vs Integrated Solutions Model
Traditional “Bundle Discount” Model Discounted OFS Price Margins Client “One-Stop” Shopping = No Value Creation The Core of our Integration Strategy Value Generation NexTier’s Integrated Solutions Model % Lowest Landed Cost Logistics Best Natural Gas Substitution Highest Wireline Efficiency Optimum
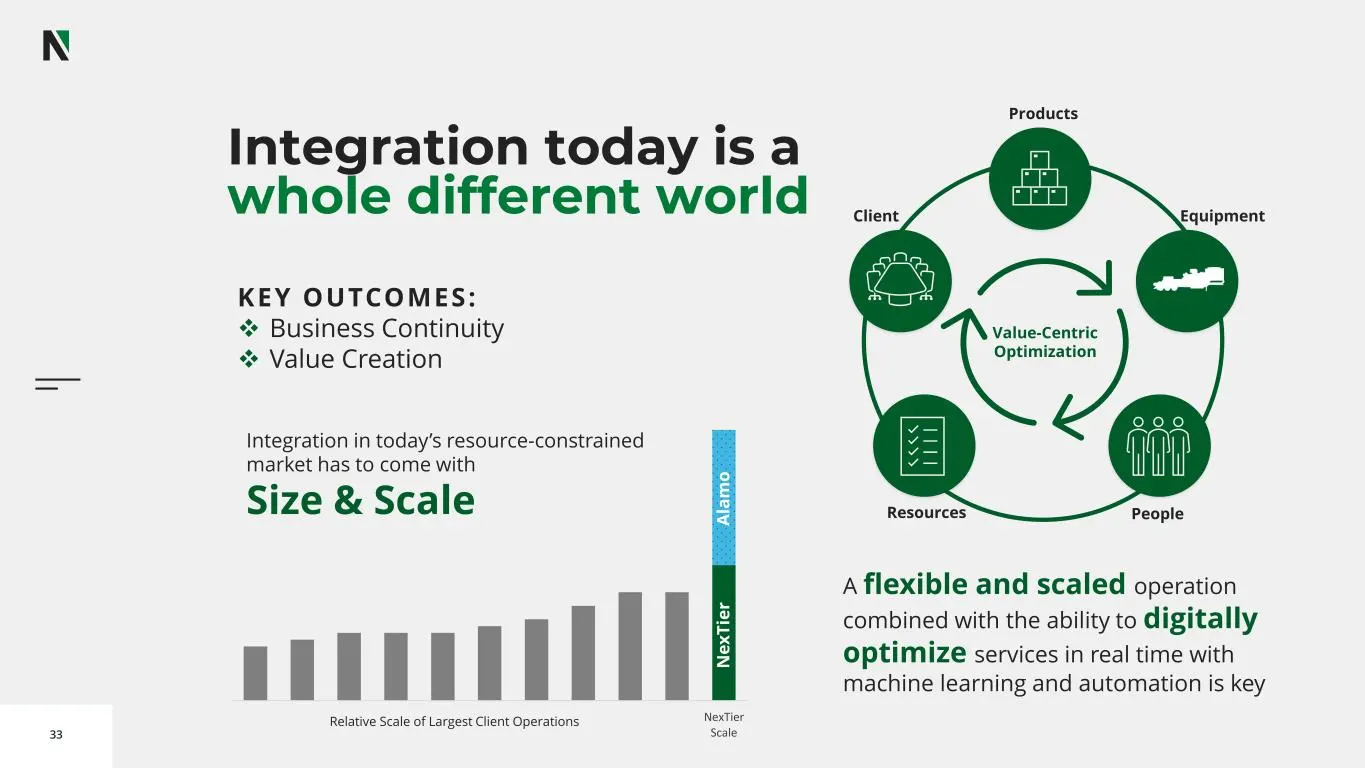
Slide 33: Integration today is a whole different world
33 Integration today is a whole different world Client Resources People Equipment Products A flexible and scaled operation combined with the ability to digitally optimize services in real time with machine learning and automation is key Value-Centric Optimization Client A Client B Client C Client D
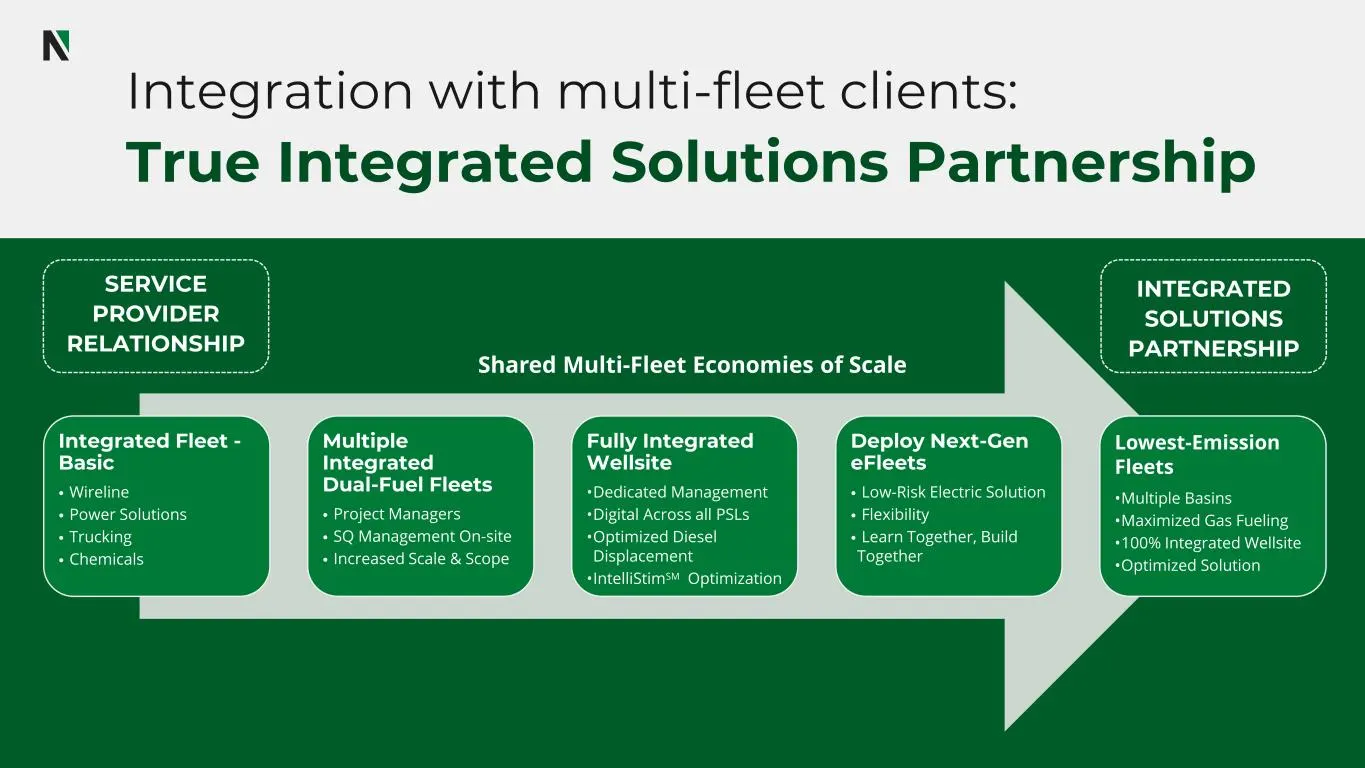
Slide 34: Integration with multi-fleet clients
Integration with multi-fleet clients: True Integrated Solutions Partnership Integrated Fleet - Basic • Wireline • Power Solutions • Trucking • Chemicals Multiple Integrated Dual-Fuel Fleets • Project Managers • SQ Management On-site • Increased Scale & Scope Fully Integrated Wellsite •Dedicated Mana
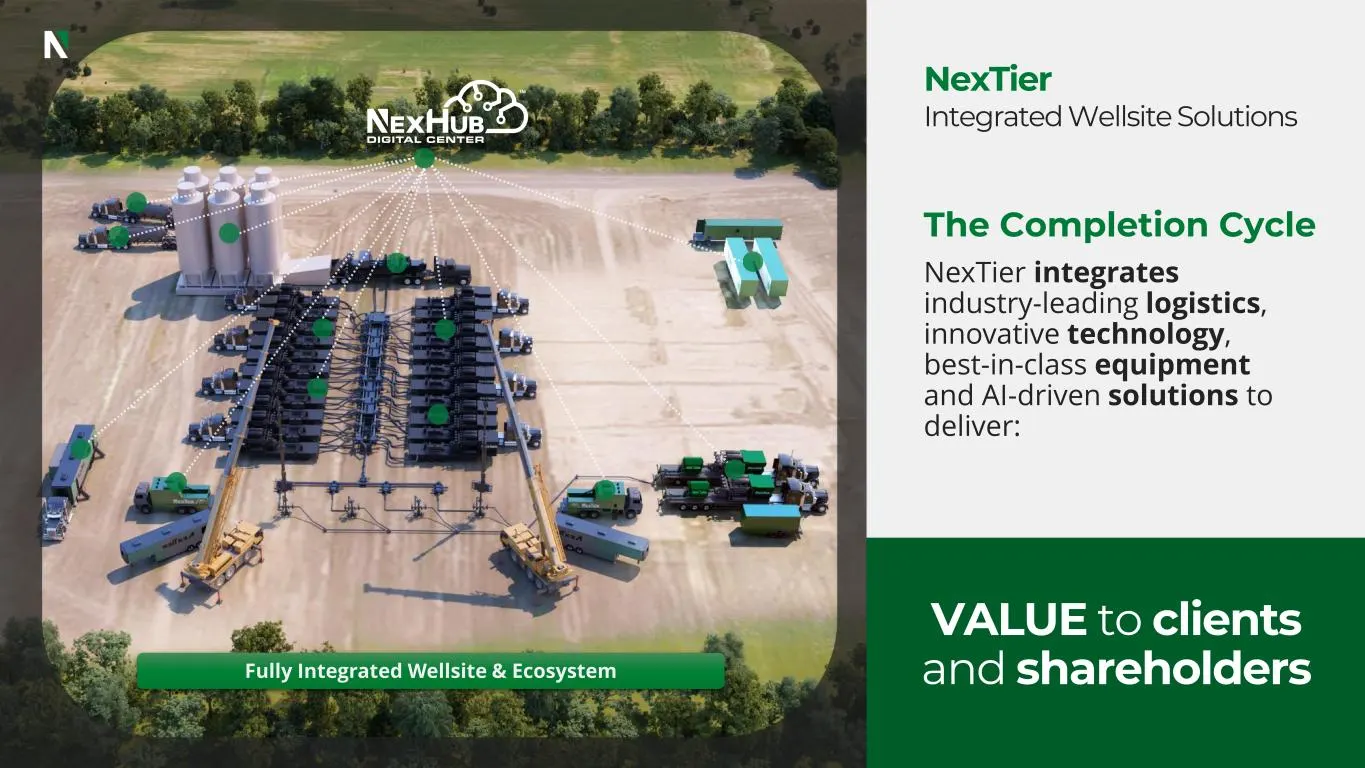
Slide 35: Fully Integrated Wellsite & Ecosystem
Fully Integrated Wellsite & Ecosystem NexTier integrates industry-leading logistics, innovative technology, best-in-class equipment and AI-driven solutions to deliver: NexTier Integrated Wellsite Solutions VALUE to clients and shareholders The Completion Cycle
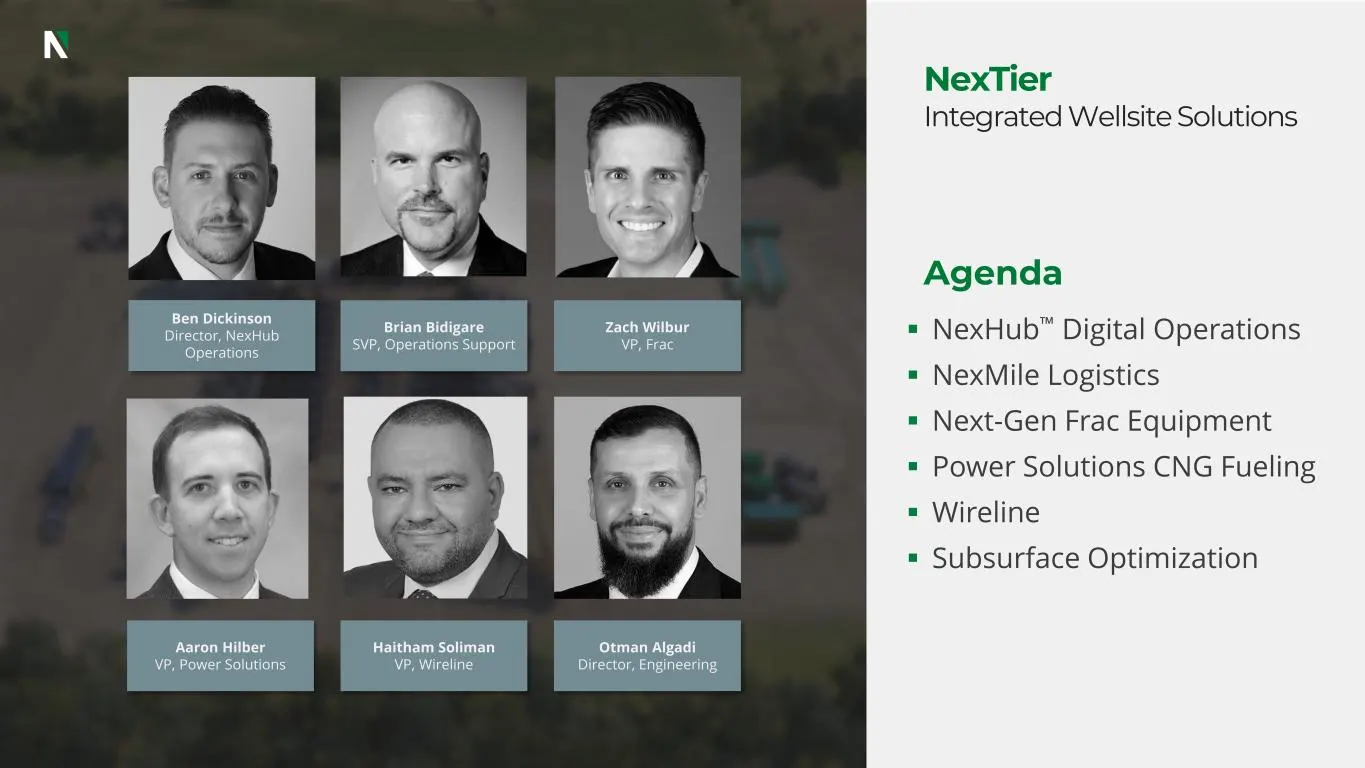
Slide 36: NexTier Integrated Wellsite Solutions Agenda
36 Aaron Hilber VP, Power Solutions Haitham Soliman VP, Wireline Zach Wilbur VP, Frac Ben Dickinson Director, NexHub Operations Otman Algadi Director, Engineering Brian Bidigare SVP, Operations Support Agenda ▪ NexHub™ Digital Operations ▪ NexMile Logistics ▪ Next-Gen Frac Equipment ▪ Power Solution
Slide 37: NexHub Digital Operations
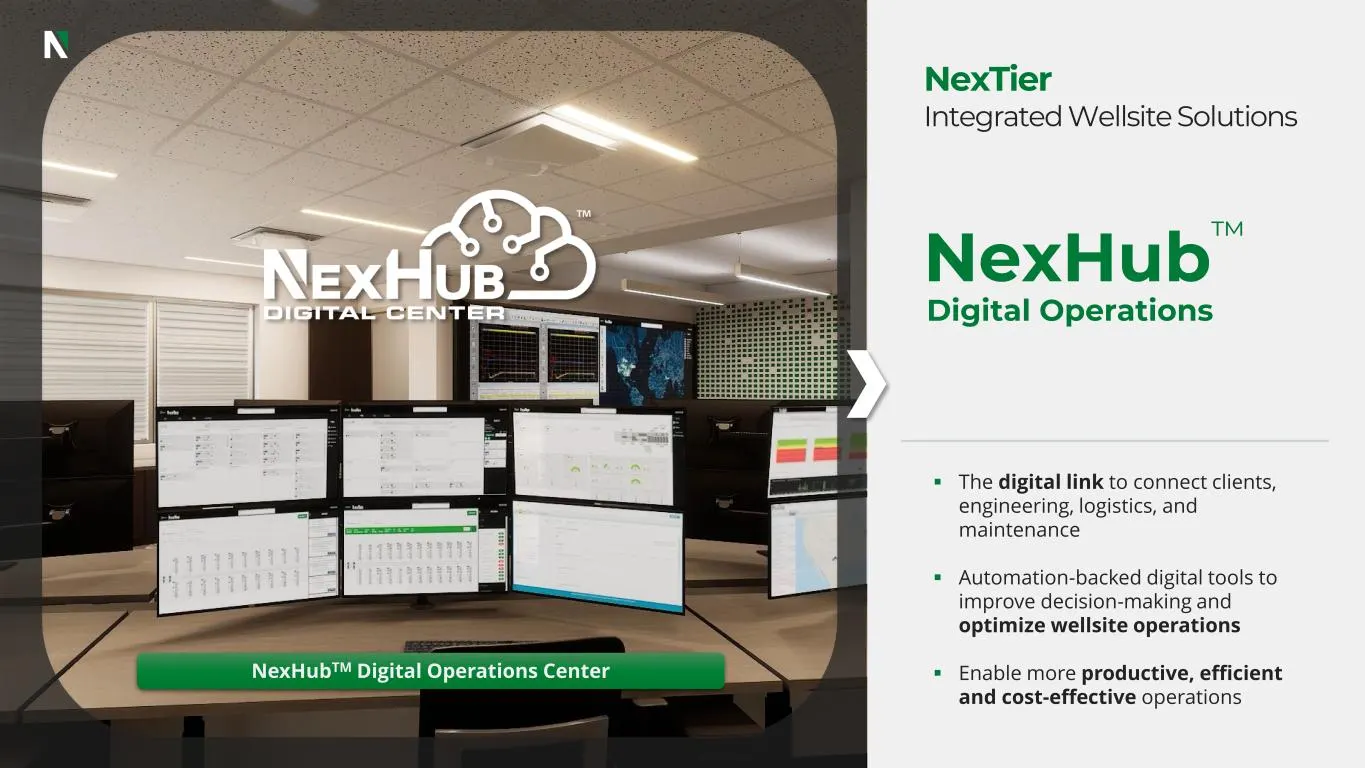
NexHub™ Digital Operations ▪ The digital link to connect clients, engineering, logistics, and maintenance ▪ Automation-backed digital tools to improve decision-making and optimize wellsite operations ▪ Enable more productive, efficient and cost-effective operations NexTier Integrated Wellsite Soluti
Slide 38: The Tools Have Changed
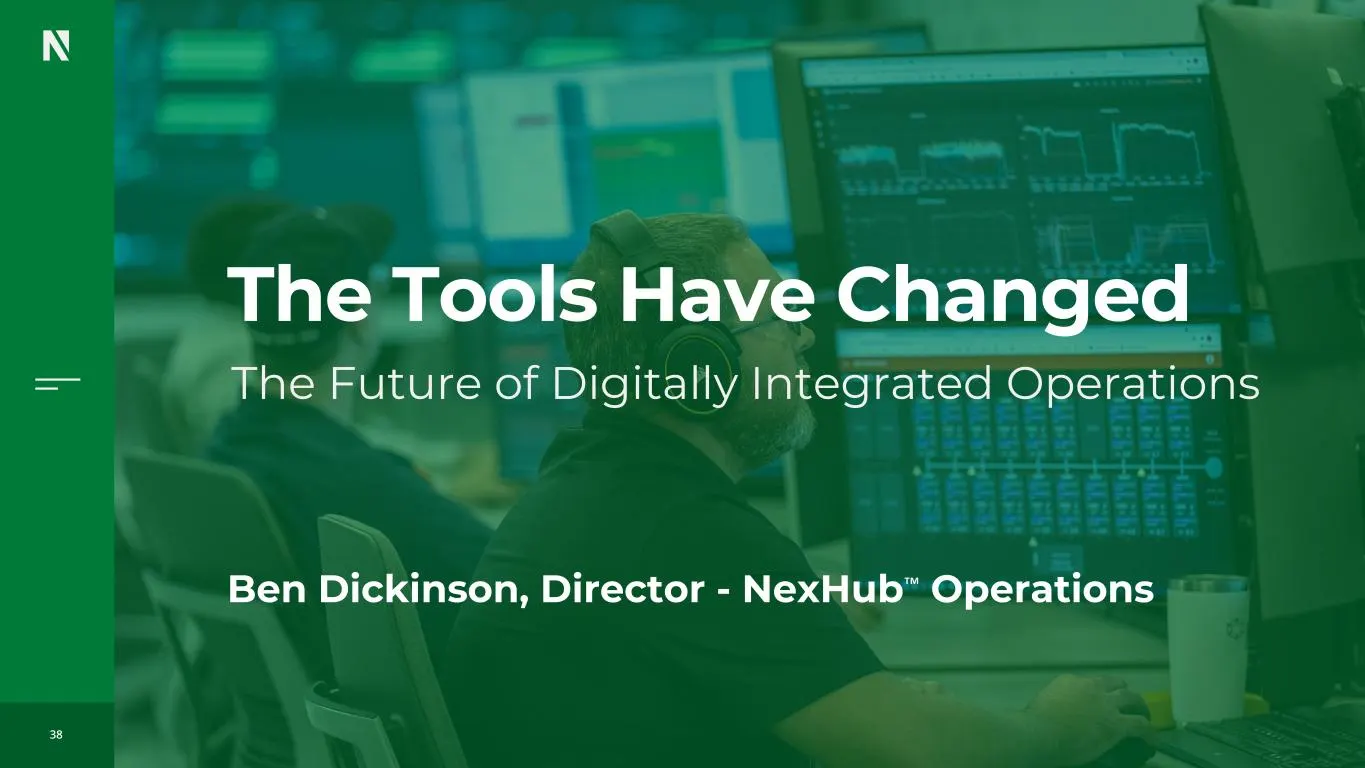
38 The Tools Have Changed Ben Dickinson, Director - NexHub™ Operations The Future of Digitally Integrated Operations
Slide 39: Barriers to Efficient, Cost-Effective Operations
Manual Processes Traditional Data Architecture Growing Reliance on Data Inconsistent Practices Rising Costs Human Errors Limited Skillsets Barriers to Efficient, Cost-Effective Operations
Slide 40: Digital Automation
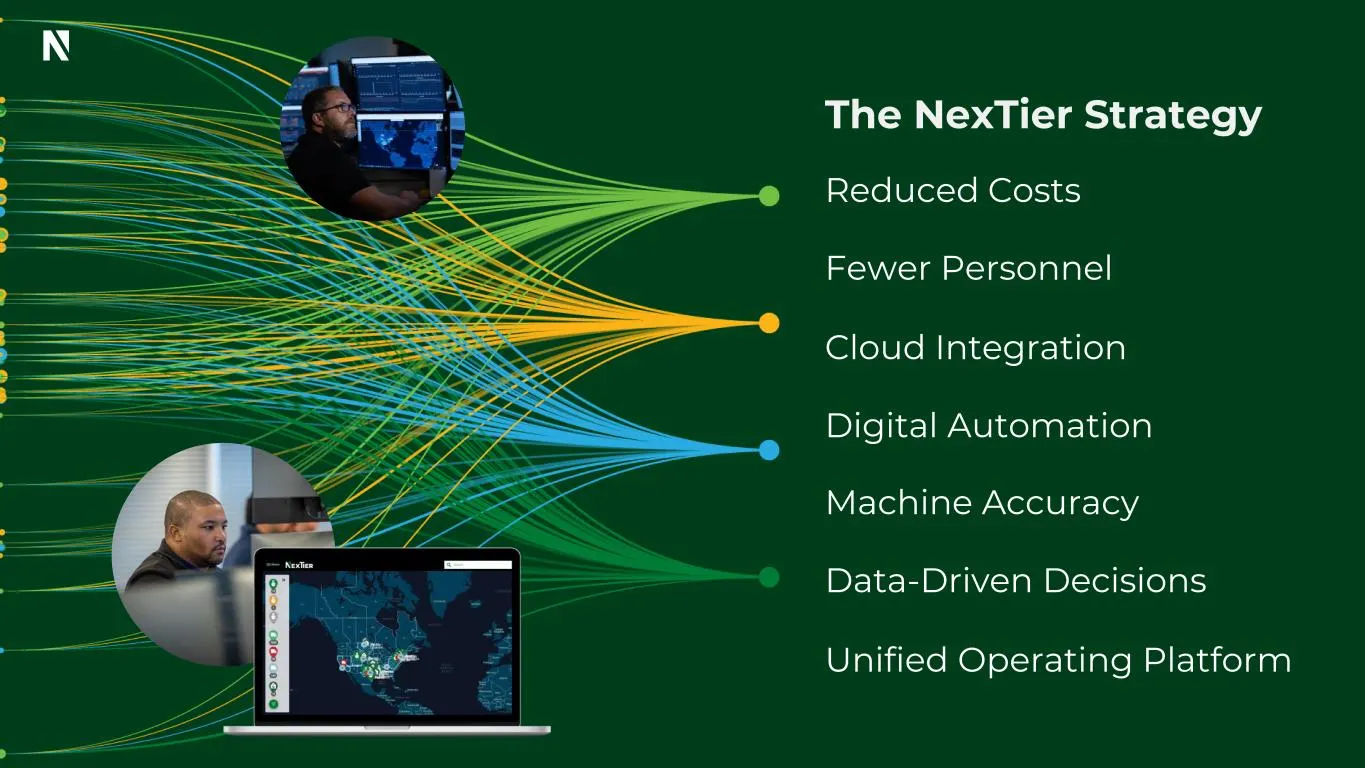
Digital Automation Unified Operating Platform Data-Driven Decisions Machine Accuracy Reduced Costs Fewer Personnel Cloud Integration The NexTier Strategy
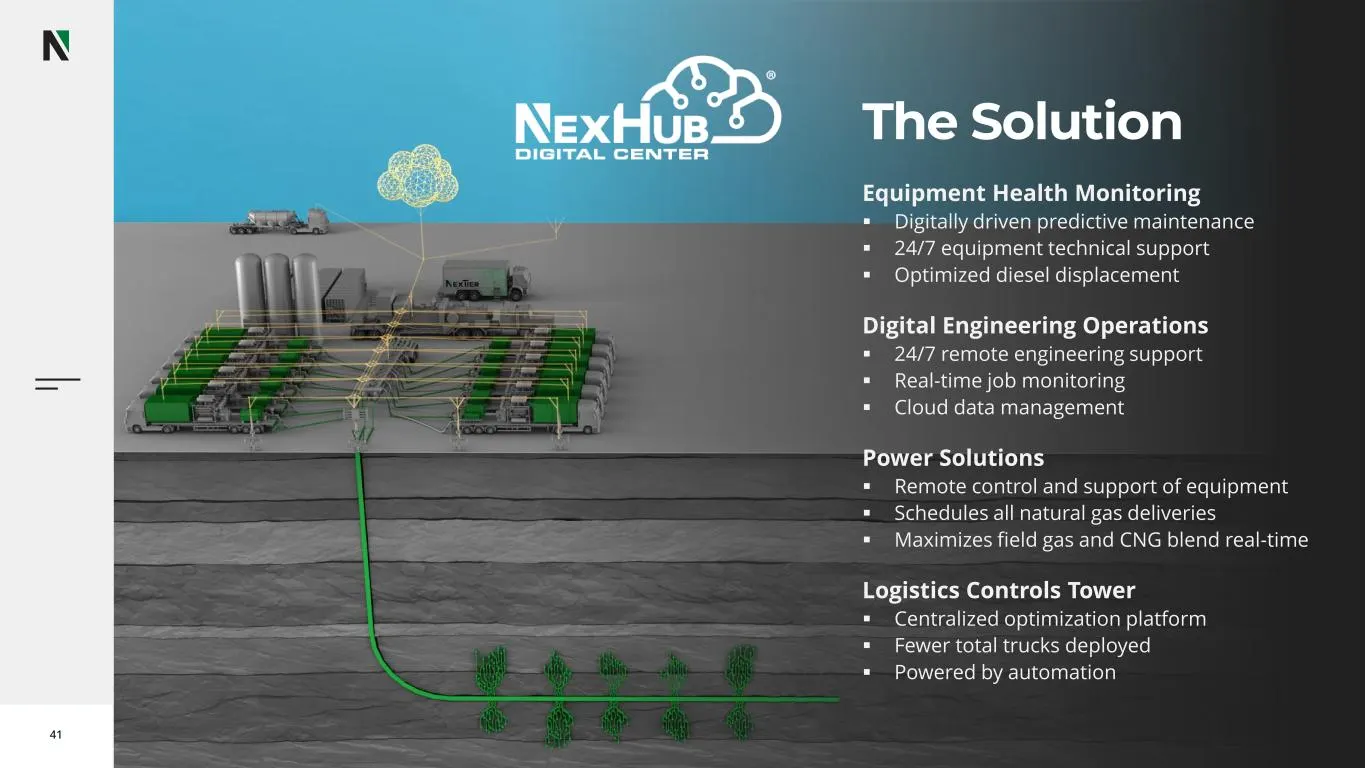
Slide 41: The Solution
41 The Solution Digital Engineering Operations ▪ 24/7 remote engineering support ▪ Real-time job monitoring ▪ Cloud data management Logistics Controls Tower ▪ Centralized optimization platform ▪ Fewer total trucks deployed ▪ Powered by automation Equipment Health Monitoring ▪ Digitally driven predic
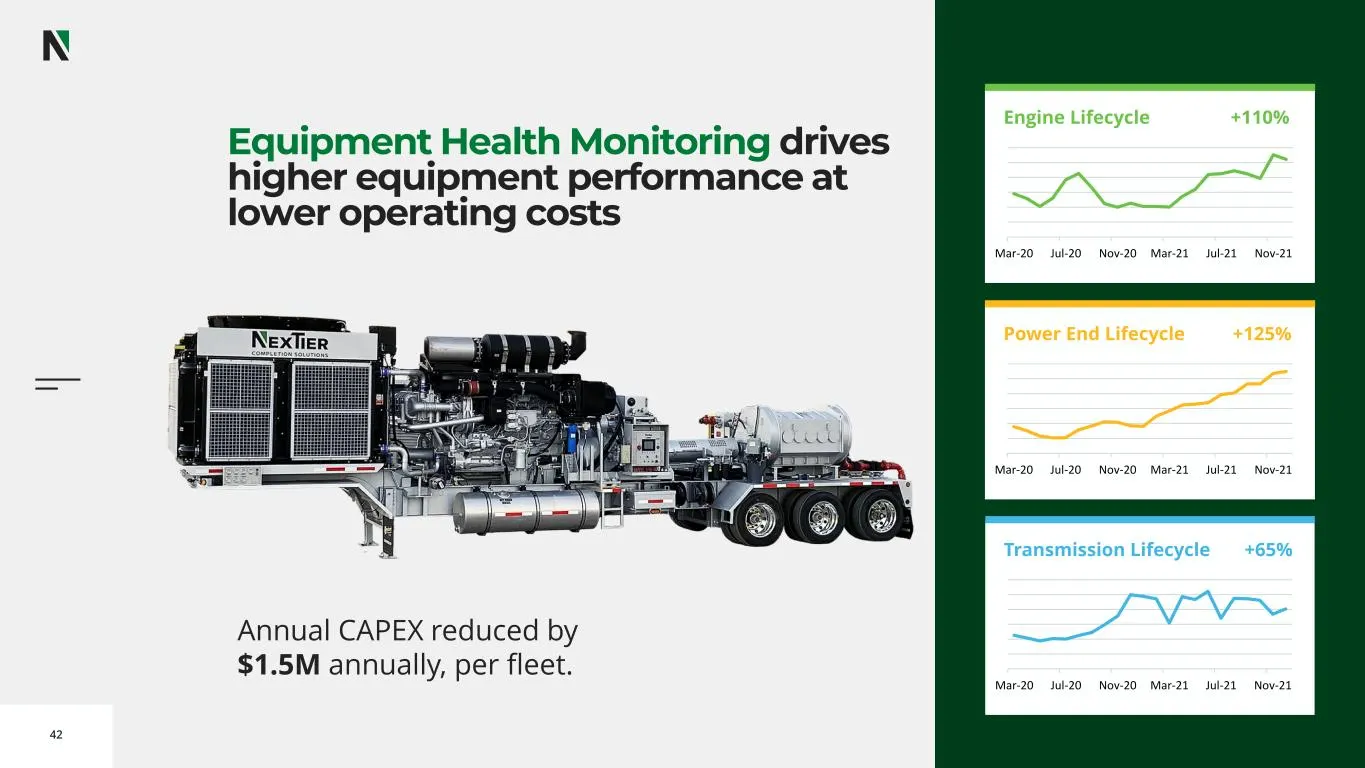
Slide 42: Equipment Health Monitoring
42 Equipment Health Monitoring drives higher equipment performance at lower operating costs Mar-20 Jul-20 Nov-20 Mar-21 Jul-21 Nov-21 +110% Engine Lifecycle Mar-20 Jul-20 Nov-20 Mar-21 Jul-21 Nov-21 +125% Power End Lifecycle Mar-20 Jul-20 Nov-20 Mar-21 Jul-21 Nov-21 +65% Transmission Lifecycle Annua
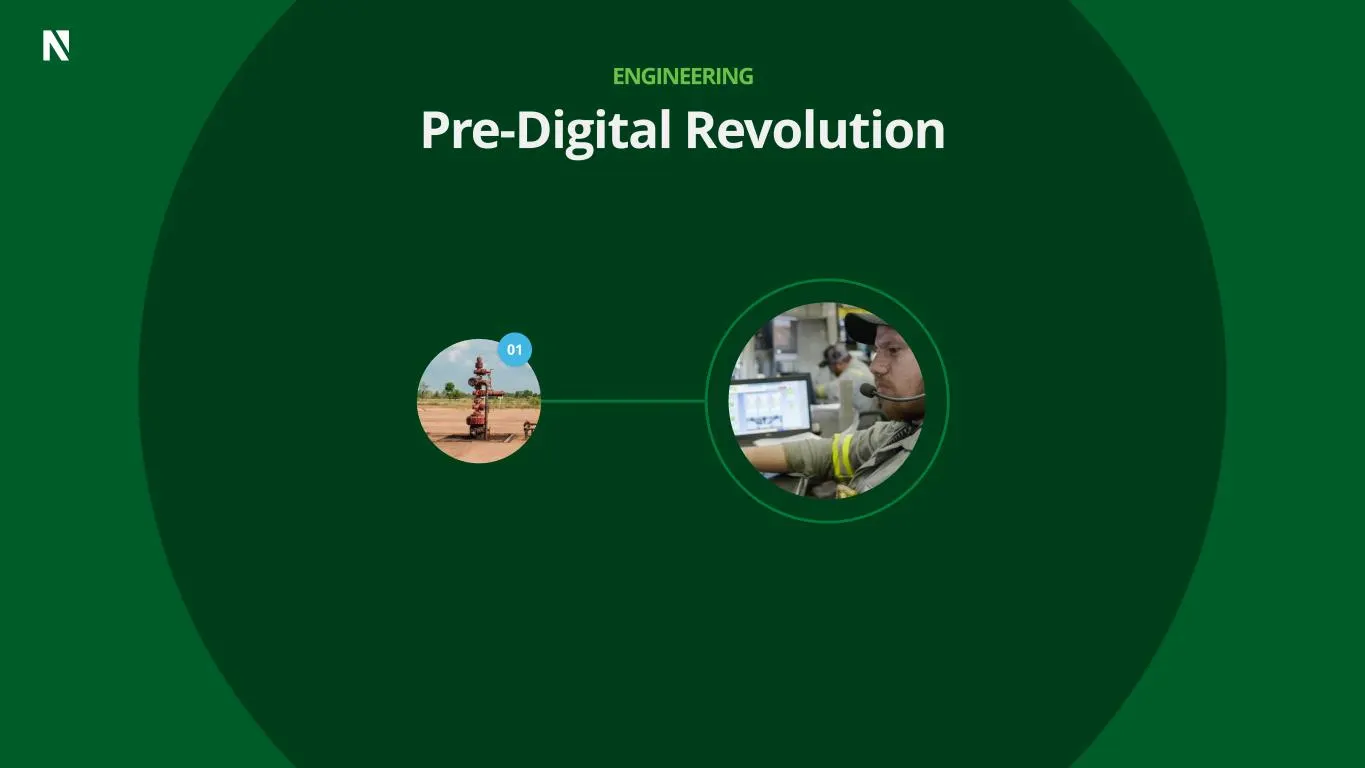
Slide 43: Pre-Digital Revolution Engineering
01 Pre-Digital Revolution ENGINEERING
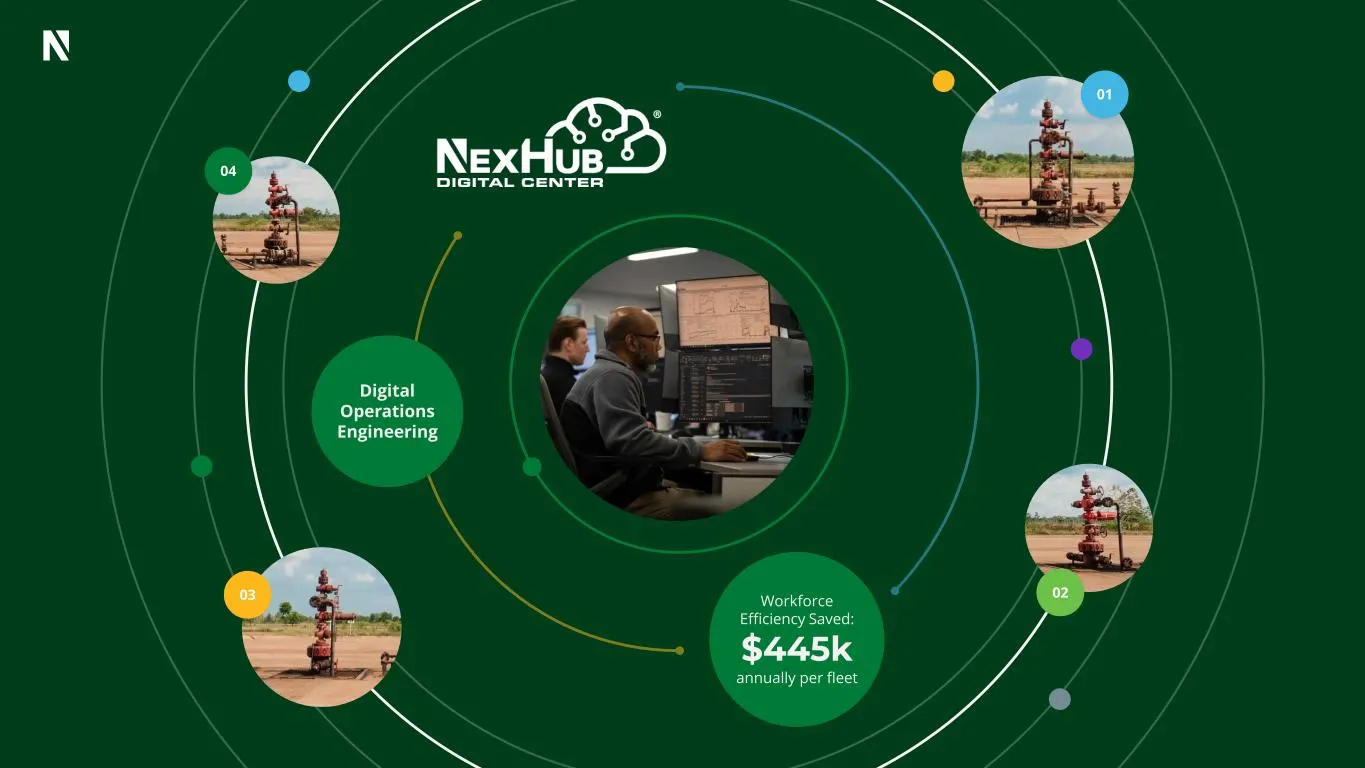
Slide 44: Digital Operations Engineering
01 0203 04 Workforce Efficiency Saved: $445k annually per fleet Digital Operations Engineering
Slide 45: Power Solutions CNG Fueling
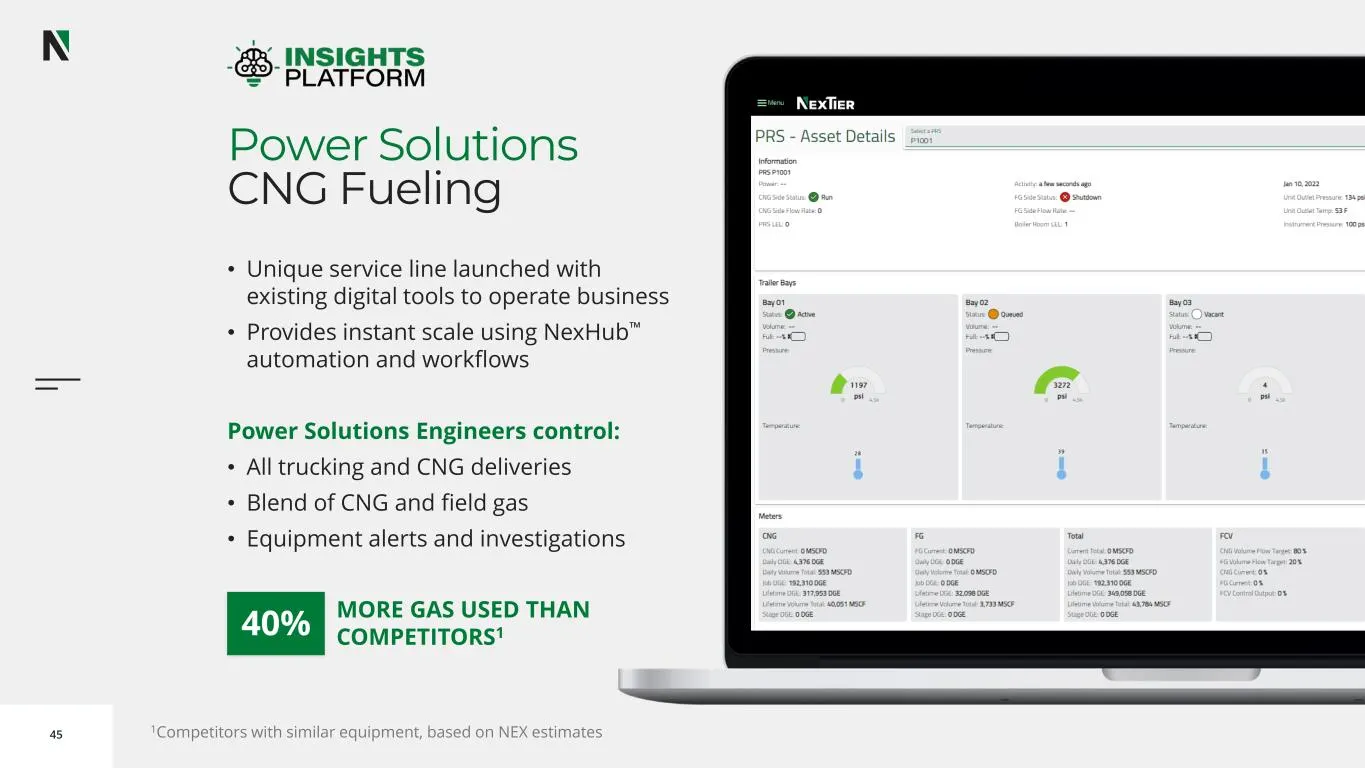
45 Power Solutions CNG Fueling 40% MORE GAS USED THAN COMPETITORS1 1Competitors with similar equipment, based on NEX estimates • Unique service line launched with existing digital tools to operate business • Provides instant scale using NexHub™ automation and workflows Power Solutions Engineers cont
Slide 46: Integrated Logistics Control Tower
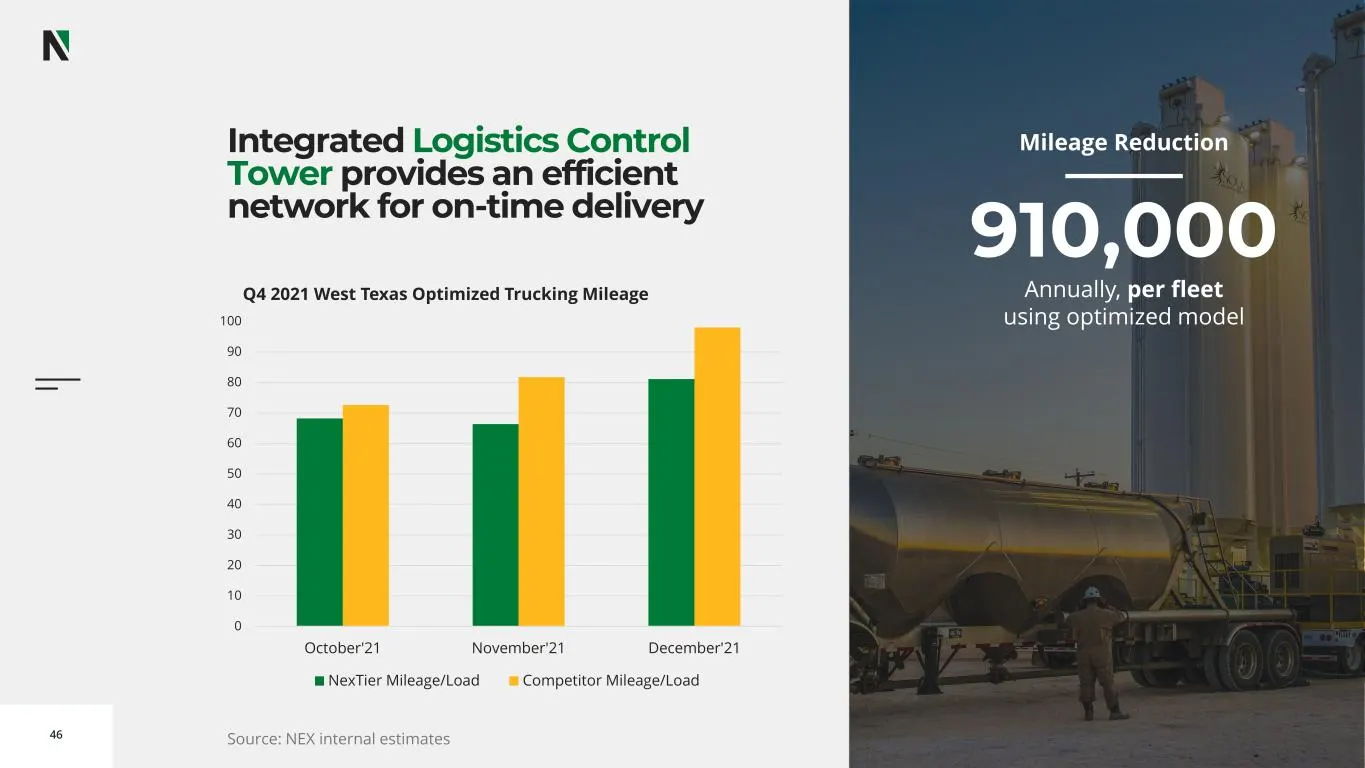
46 Integrated Logistics Control Tower provides an efficient network for on-time delivery 0 10 20 30 40 50 60 70 80 90 100 October'21 November'21 December'21 Q4 2021 West Texas Optimized Trucking Mileage NexTier Mileage/Load Competitor Mileage/Load Mileage Reduction 910,000 Annually, per fleet using
Slide 47: NexHub Capabilities Enable Full Client Integration
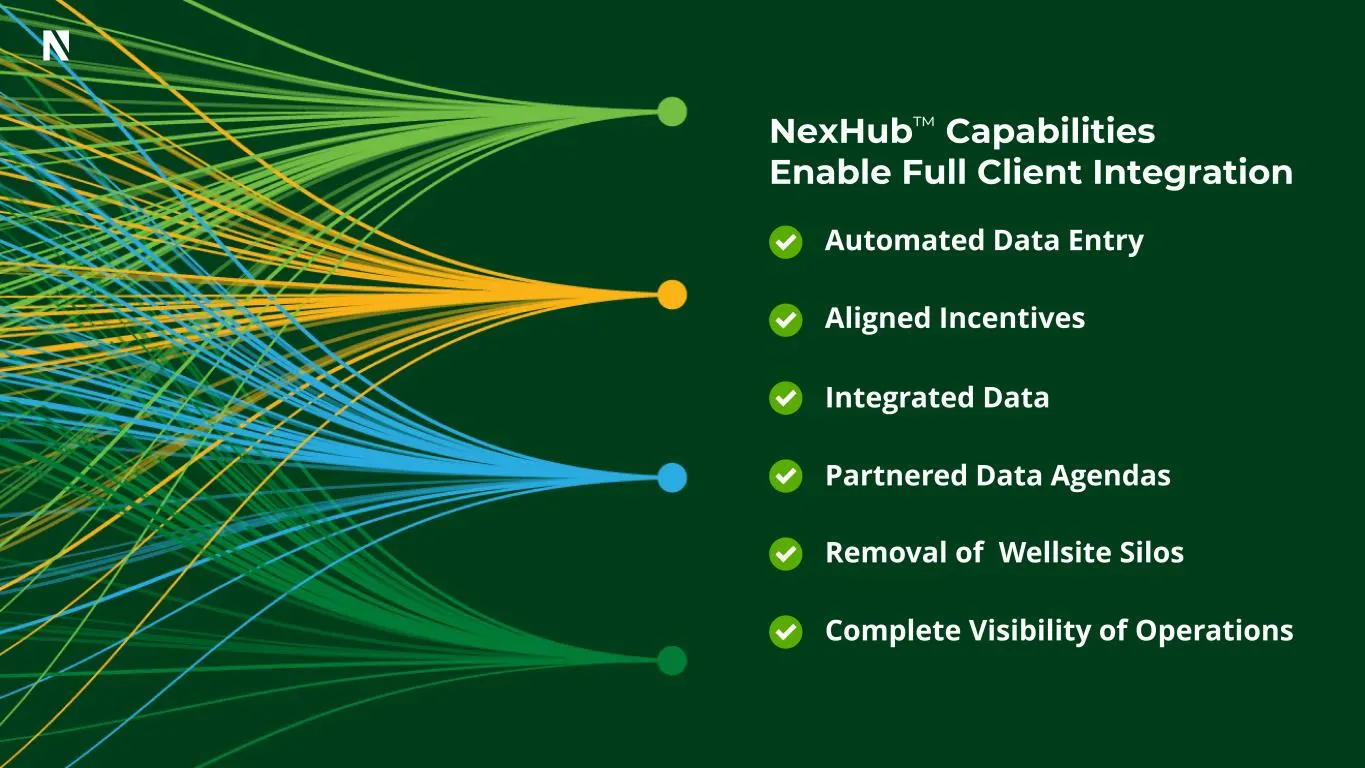
Partnered Data Agendas Complete Visibility of Operations Removal of Wellsite Silos Automated Data Entry Aligned Incentives Integrated Data NexHub™ Capabilities Enable Full Client Integration
Slide 48: Traditional Digital Operating Model
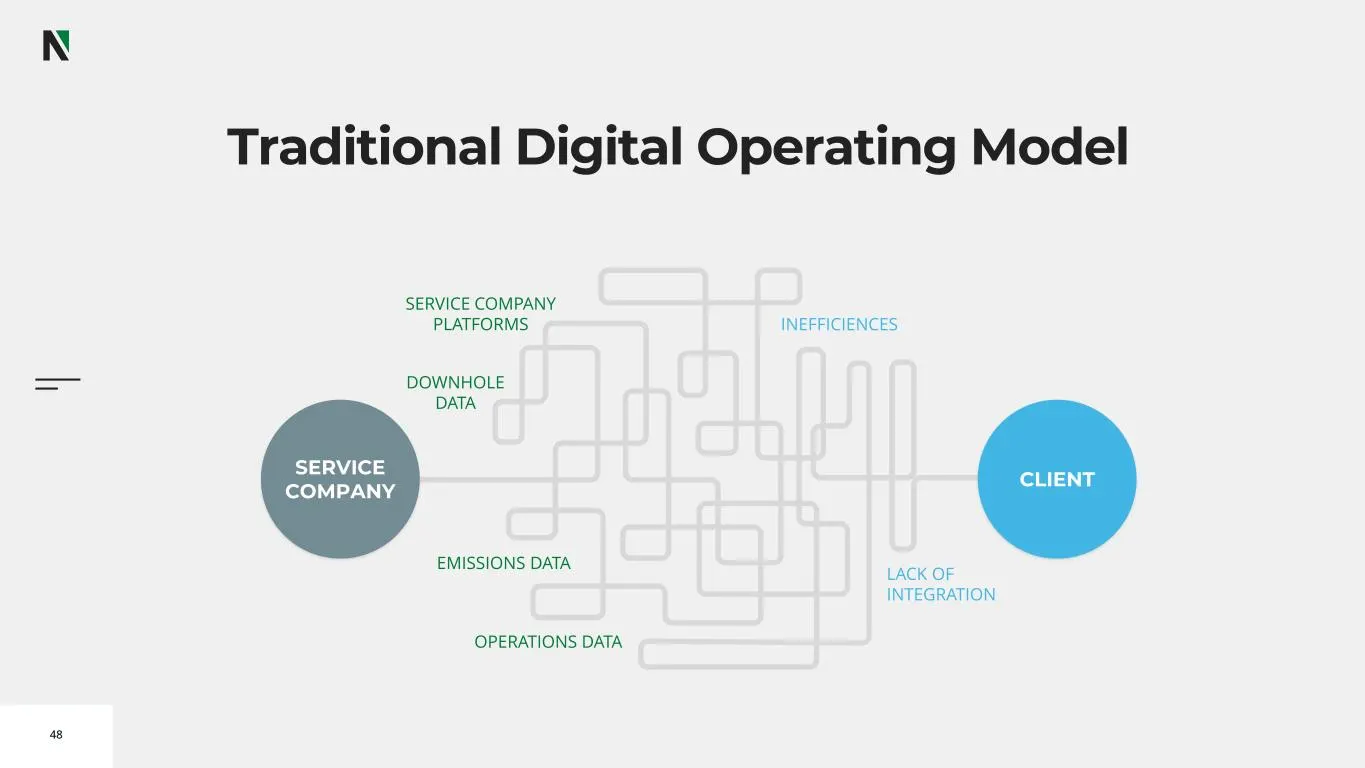
48 Traditional Digital Operating Model SERVICE COMPANY CLIENT OPERATIONS DATA INEFFICIENCES LACK OF INTEGRATION SERVICE COMPANY PLATFORMS DOWNHOLE DATA EMISSIONS DATA
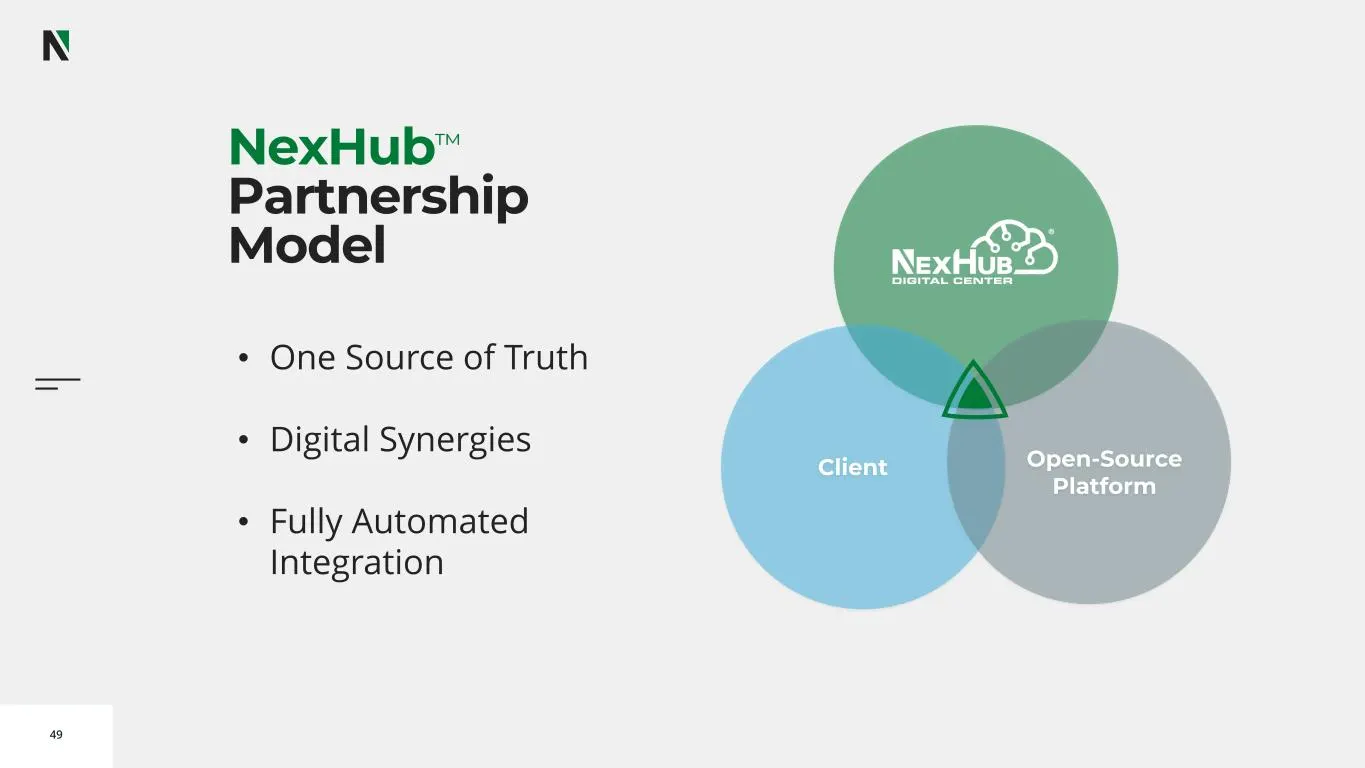
Slide 49: NexHub Partnership Model
49 NexHub™ Partnership Model • One Source of Truth • Digital Synergies • Fully Automated Integration Client Open-Source Platform
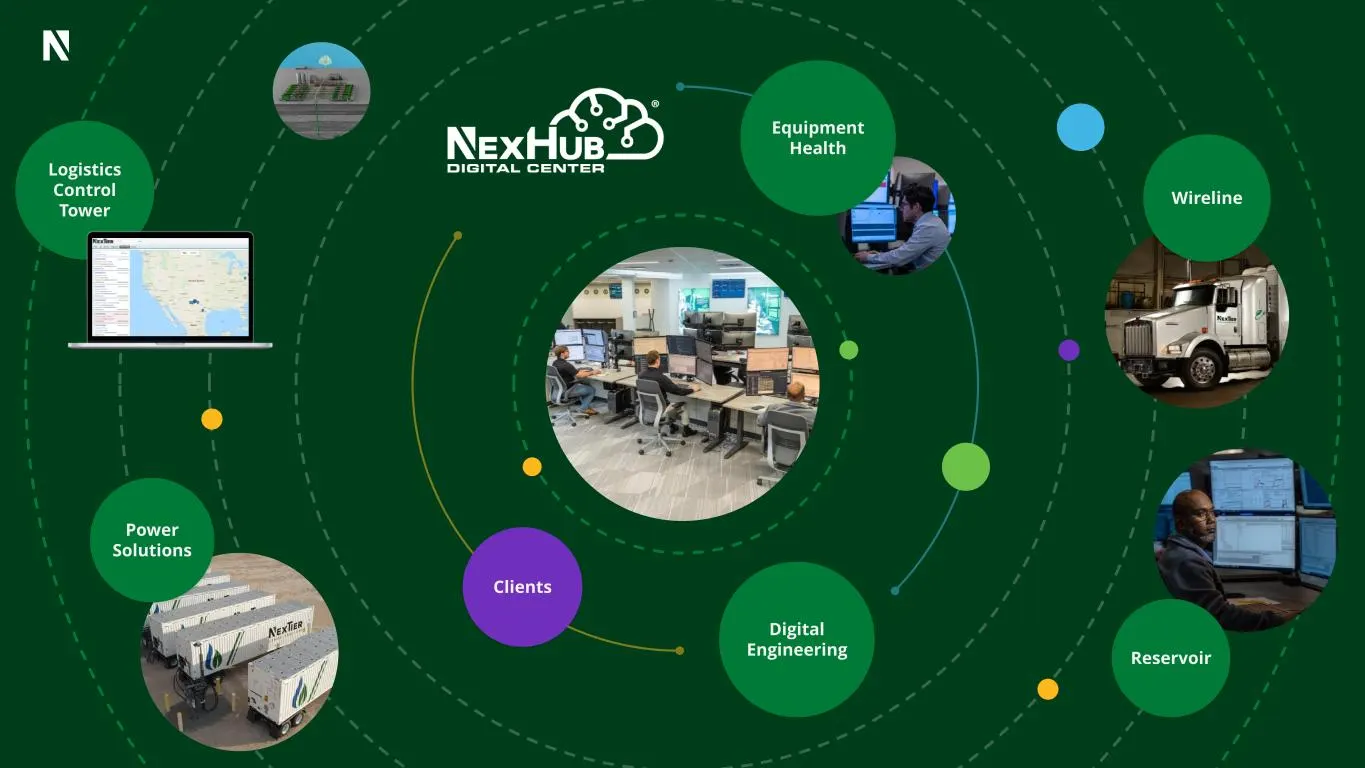
Slide 50: NexHub Digital Platform Components
Digital Engineering Clients Power Solutions Wireline Reservoir Equipment Health Logistics Control Tower
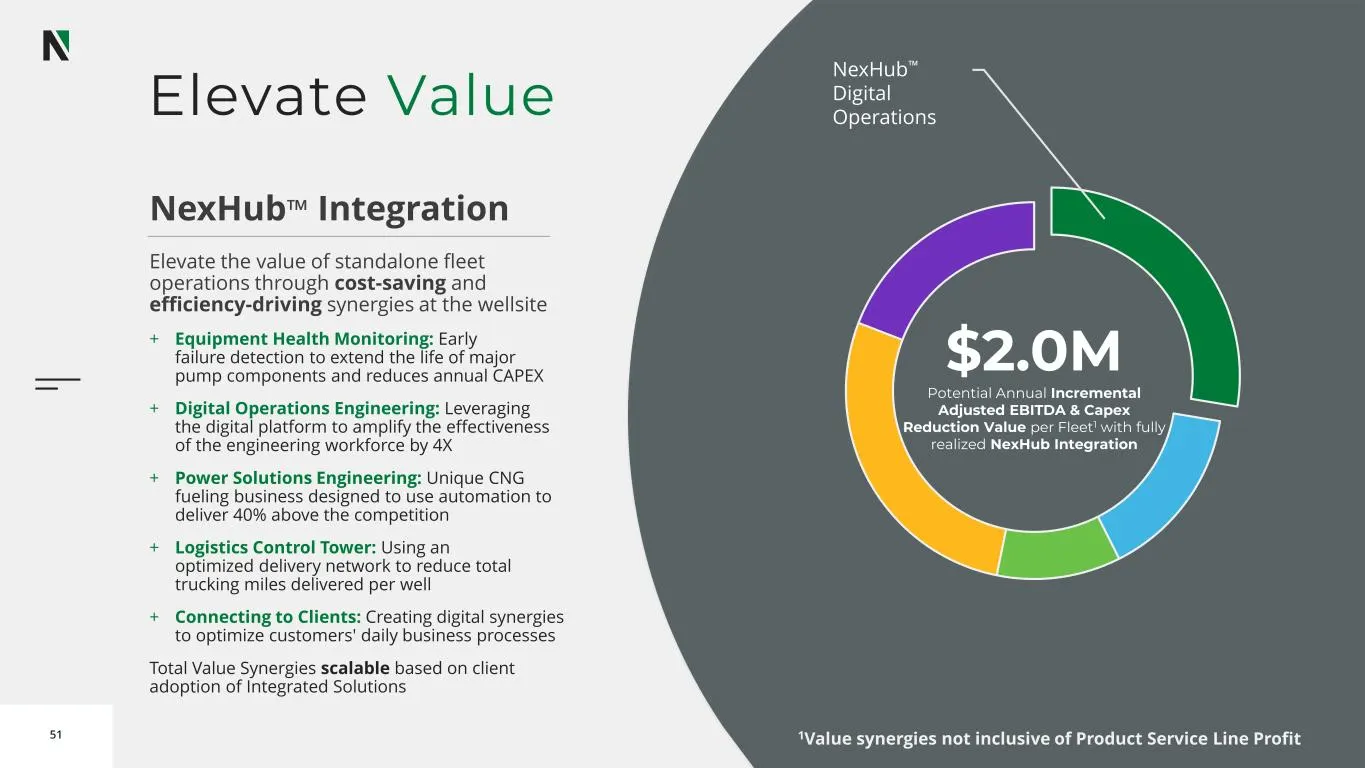
Slide 51: Elevate Value: NexHub Digital Operations
51 Elevate Value NexHub™ Digital Operations NexHub™ Integration Elevate the value of standalone fleet operations through cost-saving and efficiency-driving synergies at the wellsite + Equipment Health Monitoring: Early failure detection to extend the life of major pump components and reduces annual
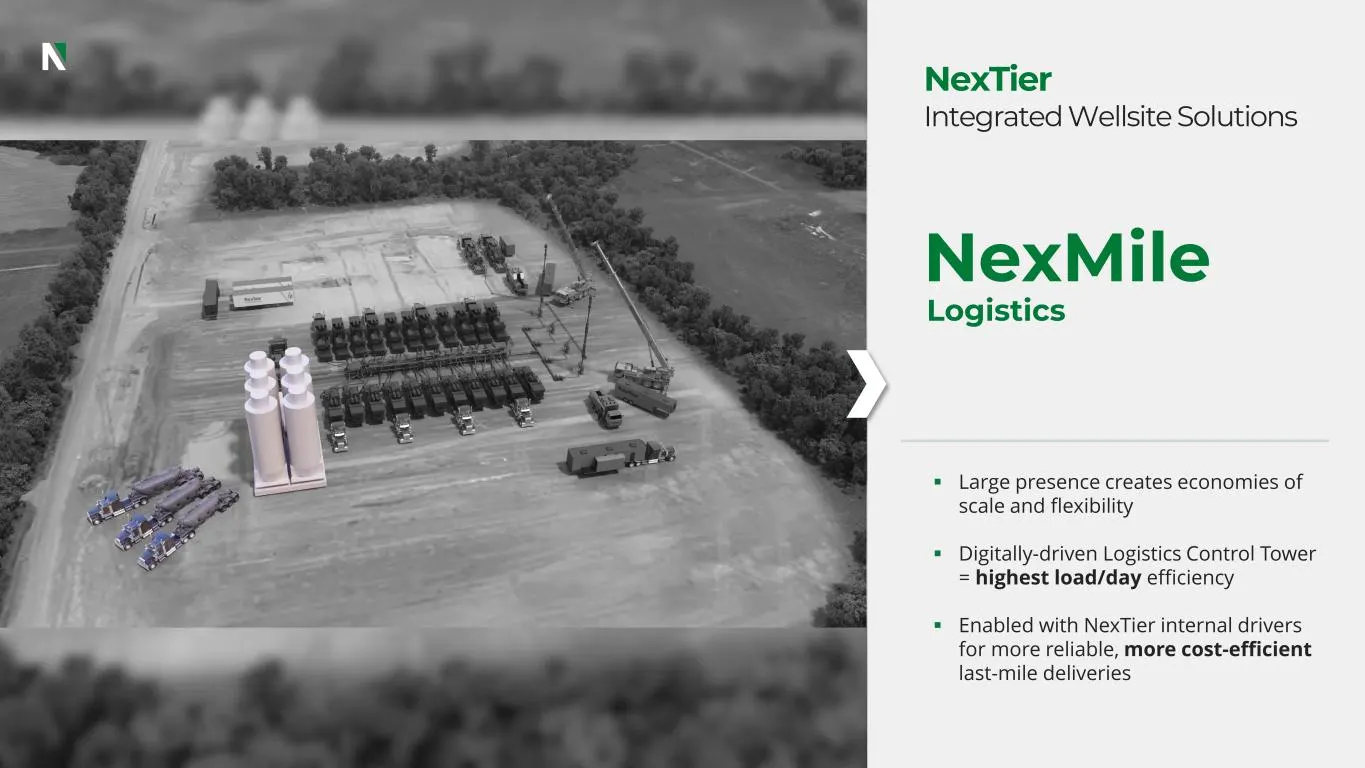
Slide 52: NexMile Logistics
▪ Large presence creates economies of scale and flexibility ▪ Digitally-driven Logistics Control Tower = highest load/day efficiency ▪ Enabled with NexTier internal drivers for more reliable, more cost-efficient last-mile deliveries NexMile Logistics NexTier Integrated Wellsite Solutions
Slide 53: Logistics Control Tower
vo o d o o 53 Logistics Control Tower Brian Bidigare, SVP, Operations Support Leveraging Scale and Technology to Enhance Frac Efficiency Enabled by:
Slide 54: The Issues We Saw That Made Us Invest: Driver Shortage
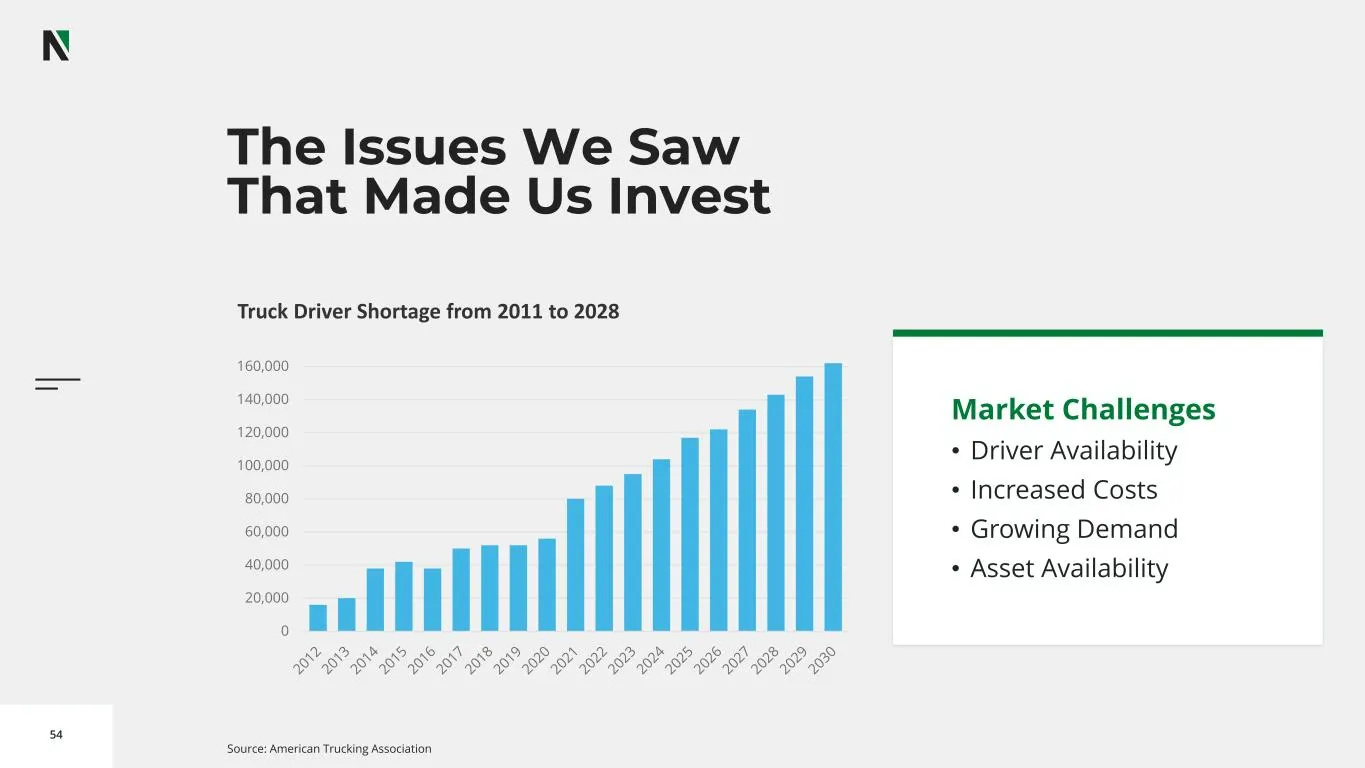
54 The Issues We Saw That Made Us Invest 0 20,000 40,000 60,000 80,000 100,000 120,000 140,000 160,000 Market Challenges • Driver Availability • Increased Costs • Growing Demand • Asset Availability Truck Driver Shortage from 2011 to 2028 Source: American Trucking Association
Slide 55: The Issues We Saw That Made Us Invest: Trucking Costs
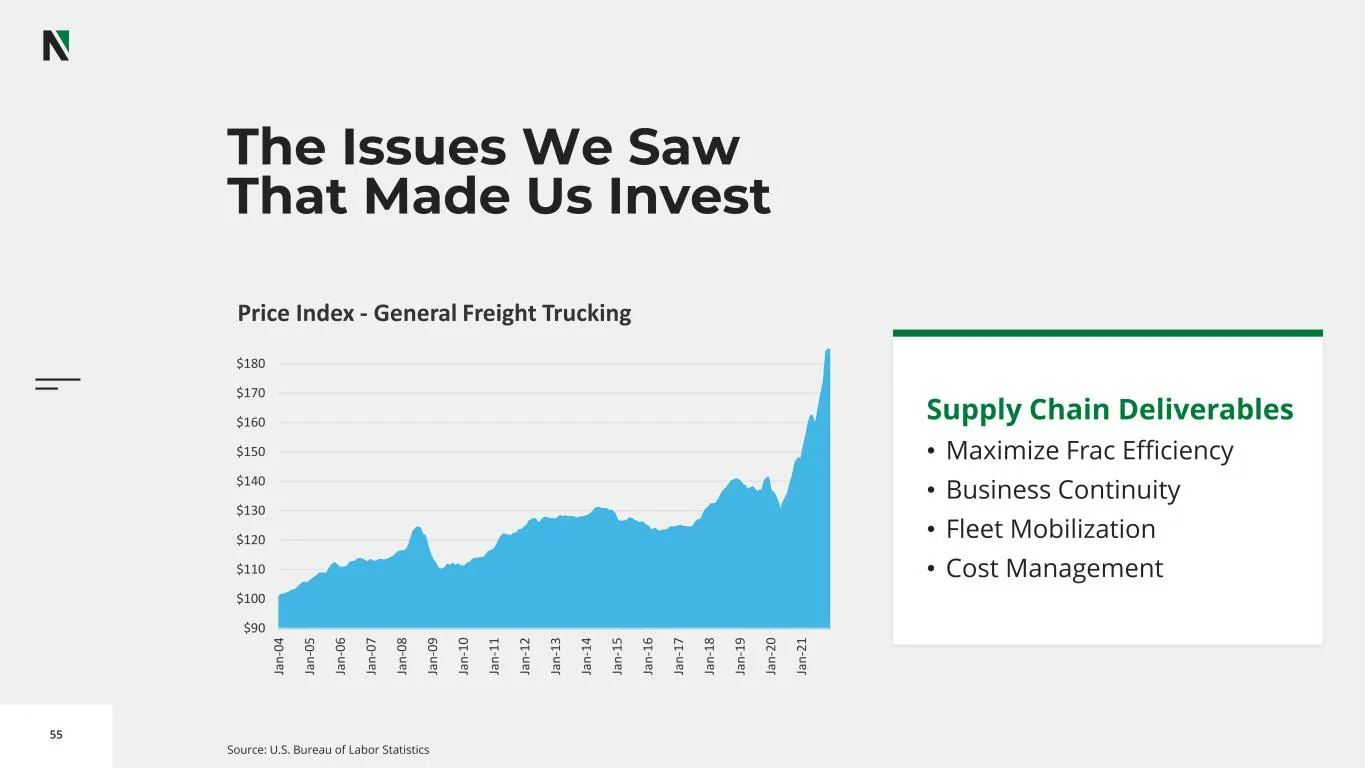
55 The Issues We Saw That Made Us Invest $90 $100 $110 $120 $130 $140 $150 $160 $170 $180 Ja n -0 4 Ja n -0 5 Ja n -0 6 Ja n -0 7 Ja n -0 8 Ja n -0 9 Ja n -1 0 Ja n -1 1 Ja n -1 2 Ja n -1 3 Ja n -1 4 Ja n -1 5 Ja n -1 6 Ja n -1 7 Ja n -1 8 Ja n -1 9 Ja n -2 0 Ja n -2 1 Supply Chain Deliverables • Ma
Slide 56: Answers to the Challenge
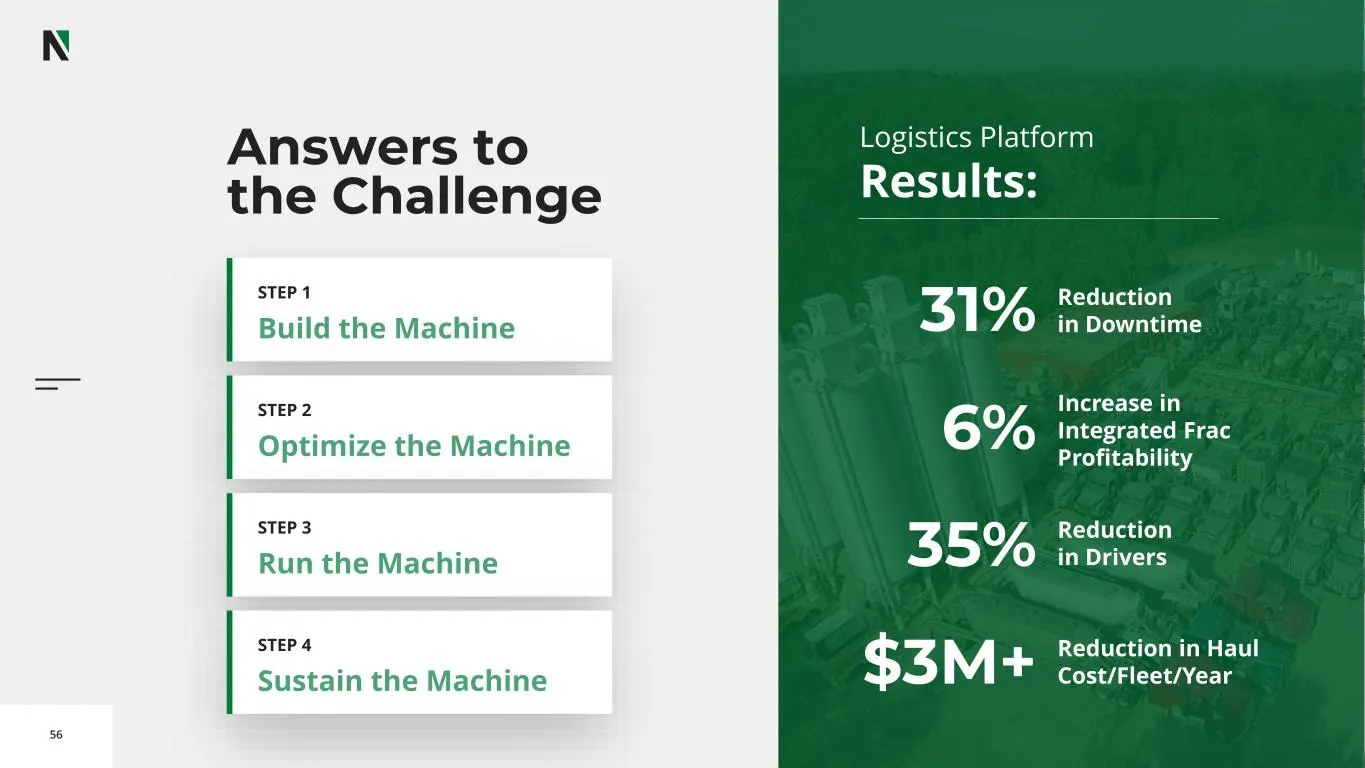
56 Answers to the Challenge STEP 1 STEP 2 STEP 3 STEP 4 31% 6% 35% $3M+ Reduction in Downtime Increase in Integrated Frac Profitability Reduction in Drivers Reduction in Haul Cost/Fleet/Year Logistics Platform Results:
Slide 57: Build the Machine
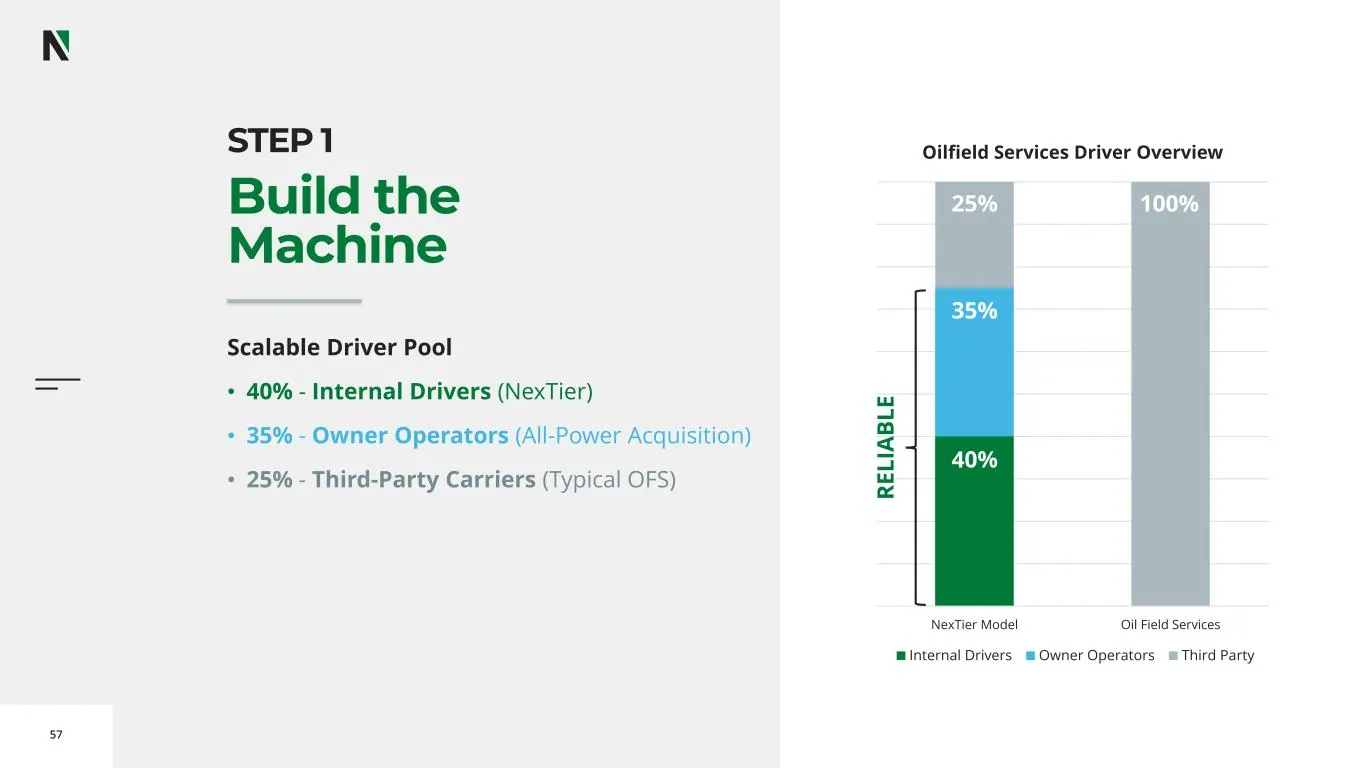
57 NexTier Model Oil Field Services Oilfield Services Driver Overview Internal Drivers Owner Operators Third Party R E L IA B L E 100%25% 35% 40% Build the Machine STEP 1 Scalable Driver Pool • 40% - Internal Drivers (NexTier) • 35% - Owner Operators (All-Power Acquisition) • 25% - Third-Party Carri
Slide 58: Optimize the Machine
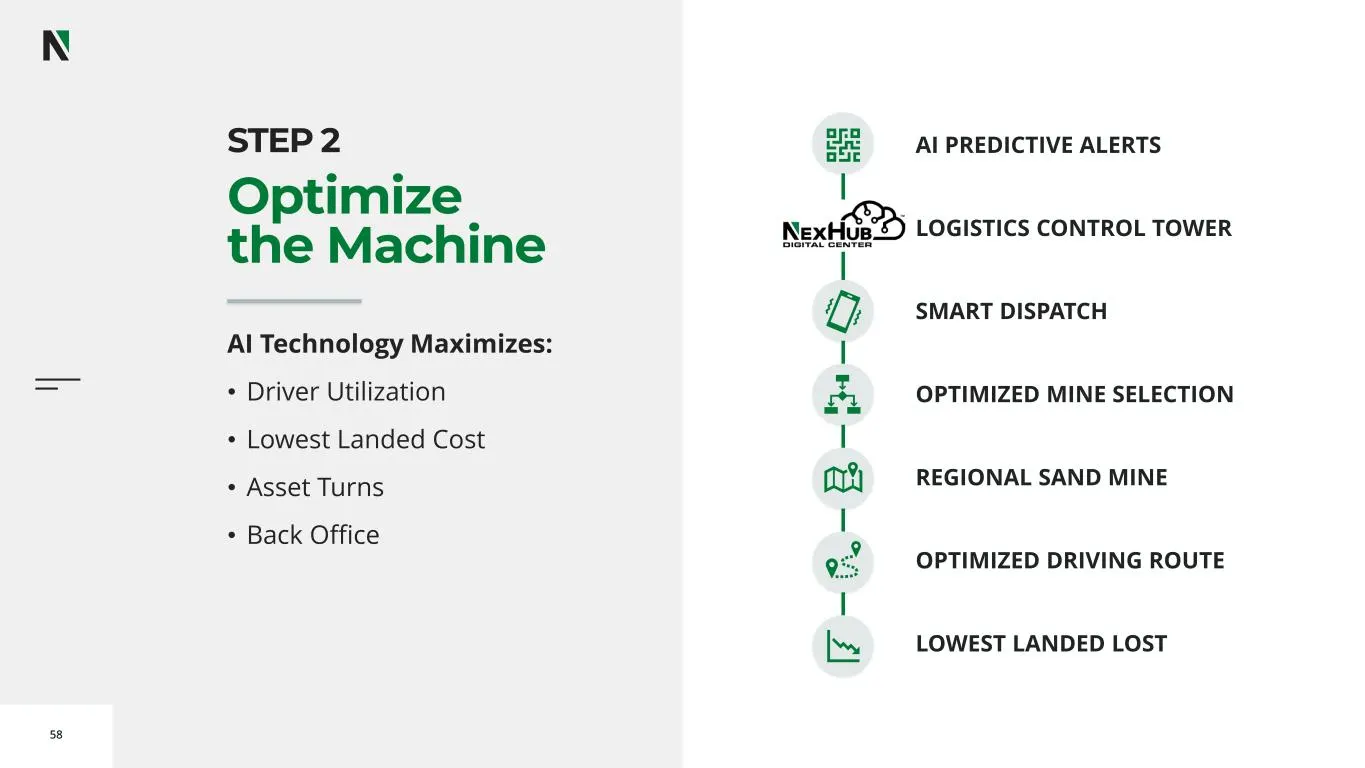
58 Optimize the Machine STEP 2 AI Technology Maximizes: • Driver Utilization • Lowest Landed Cost • Asset Turns • Back Office AI PREDICTIVE ALERTS SMART DISPATCH OPTIMIZED MINE SELECTION REGIONAL SAND MINE OPTIMIZED DRIVING ROUTE LOWEST LANDED LOST LOGISTICS CONTROL TOWER
Slide 59: Run the Machine
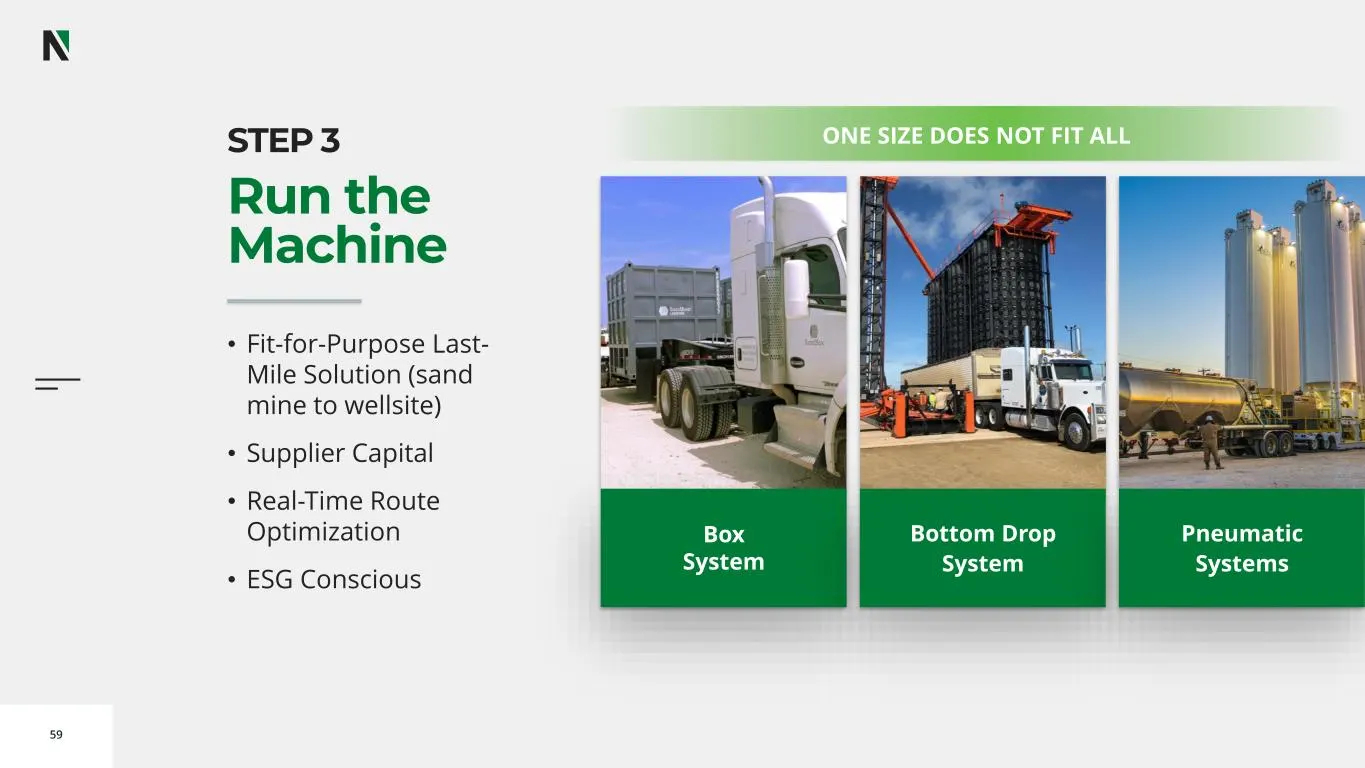
59 Run the Machine Box System Bottom Drop System Pneumatic Systems STEP 3 • Fit-for-Purpose Last- Mile Solution (sand mine to wellsite) • Supplier Capital • Real-Time Route Optimization • ESG Conscious ONE SIZE DOES NOT FIT ALL
Slide 60: Sustain the Machine
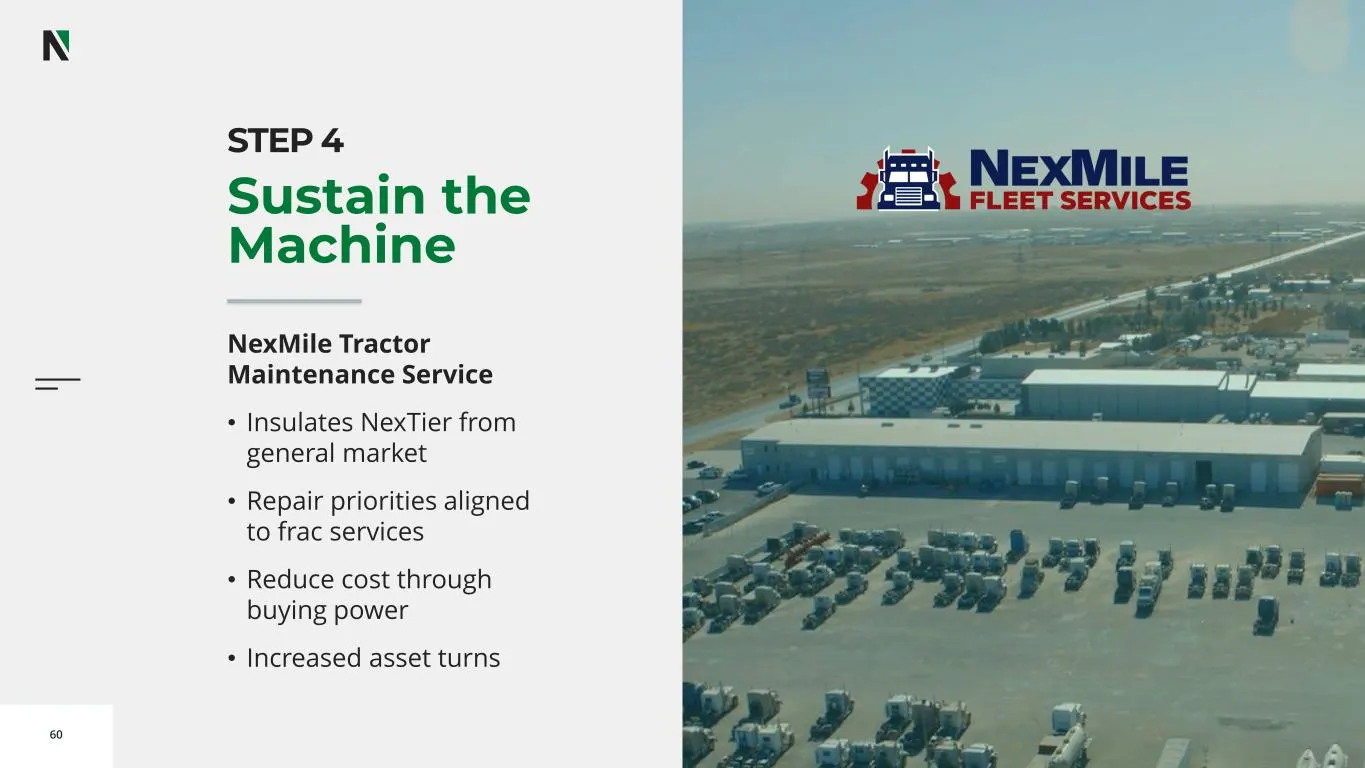
60 Sustain the Machine STEP 4 NexMile Tractor Maintenance Service • Insulates NexTier from general market • Repair priorities aligned to frac services • Reduce cost through buying power • Increased asset turns
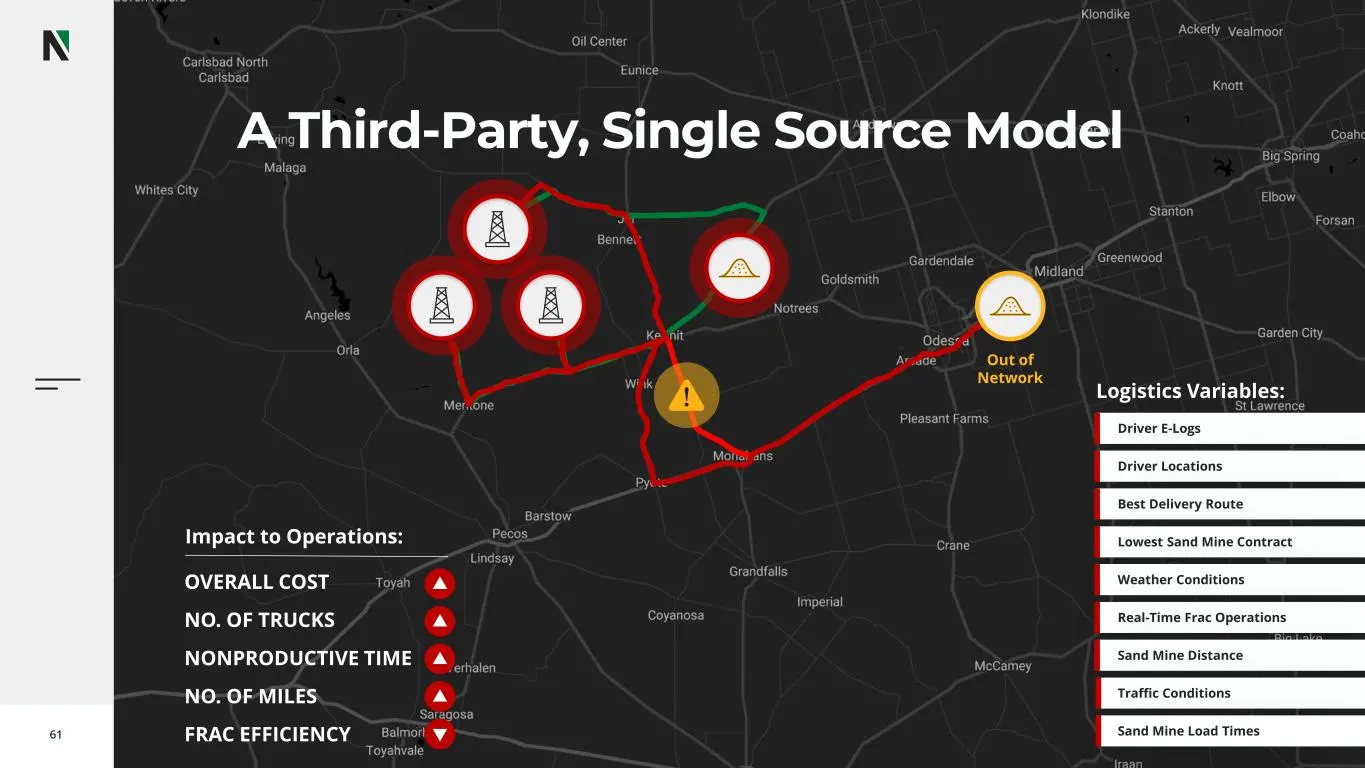
Slide 61: Out of Network Third-Party Single Source Model
61 OVERALL COST NO. OF TRUCKS NONPRODUCTIVE TIME NO. OF MILES FRAC EFFICIENCY Impact to Operations: Out of Network A Third-Party, Single Source Model Logistics Variables: Driver E-Logs Driver Locations Best Delivery Route Lowest Sand Mine Contract Weather Conditions Real-Time Frac Operations Sand Mi
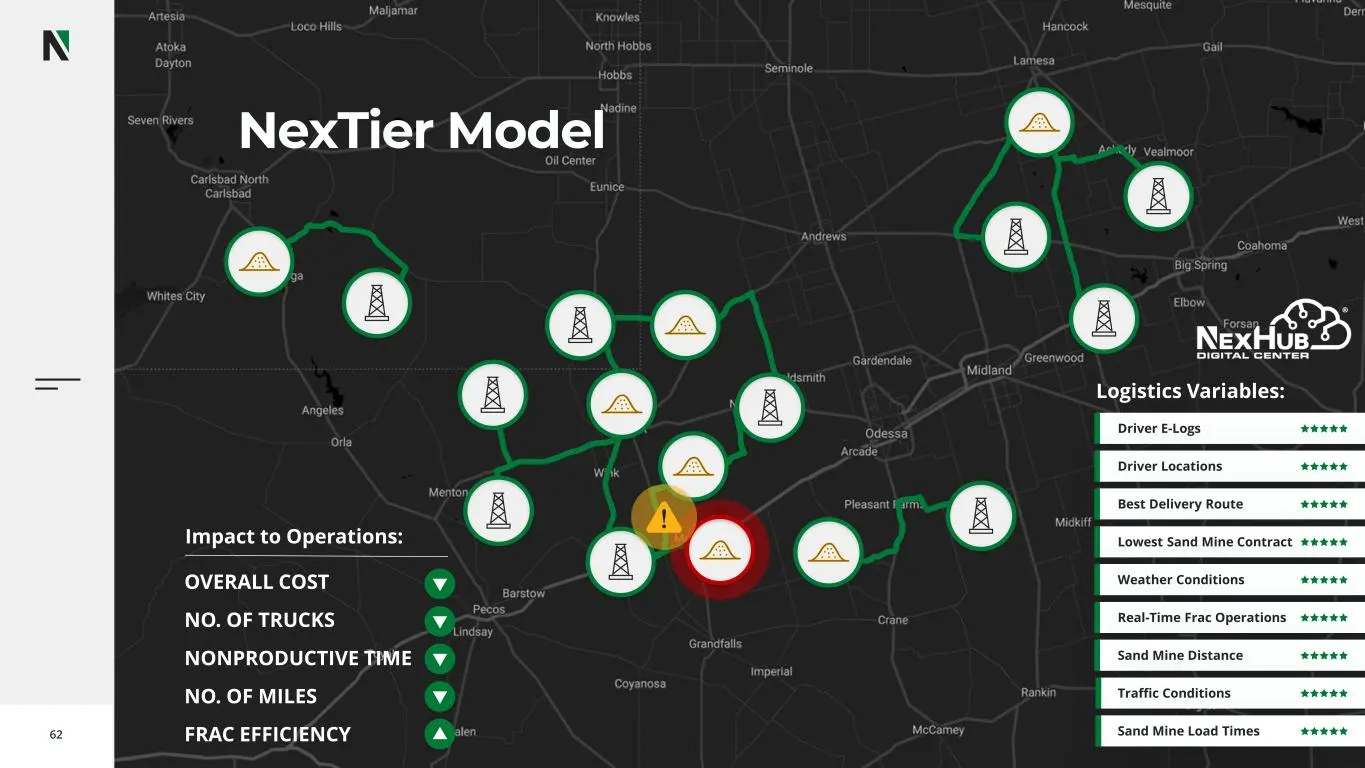
Slide 62: NexTier Model Logistics Variables
62 Driver E-Logs Driver Locations Best Delivery Route Lowest Sand Mine Contract Weather Conditions Real-Time Frac Operations Sand Mine Distance Traffic Conditions Sand Mine Load Times NexTier Model Logistics Variables: OVERALL COST NO. OF TRUCKS NONPRODUCTIVE TIME NO. OF MILES FRAC EFFICIENCY Impact
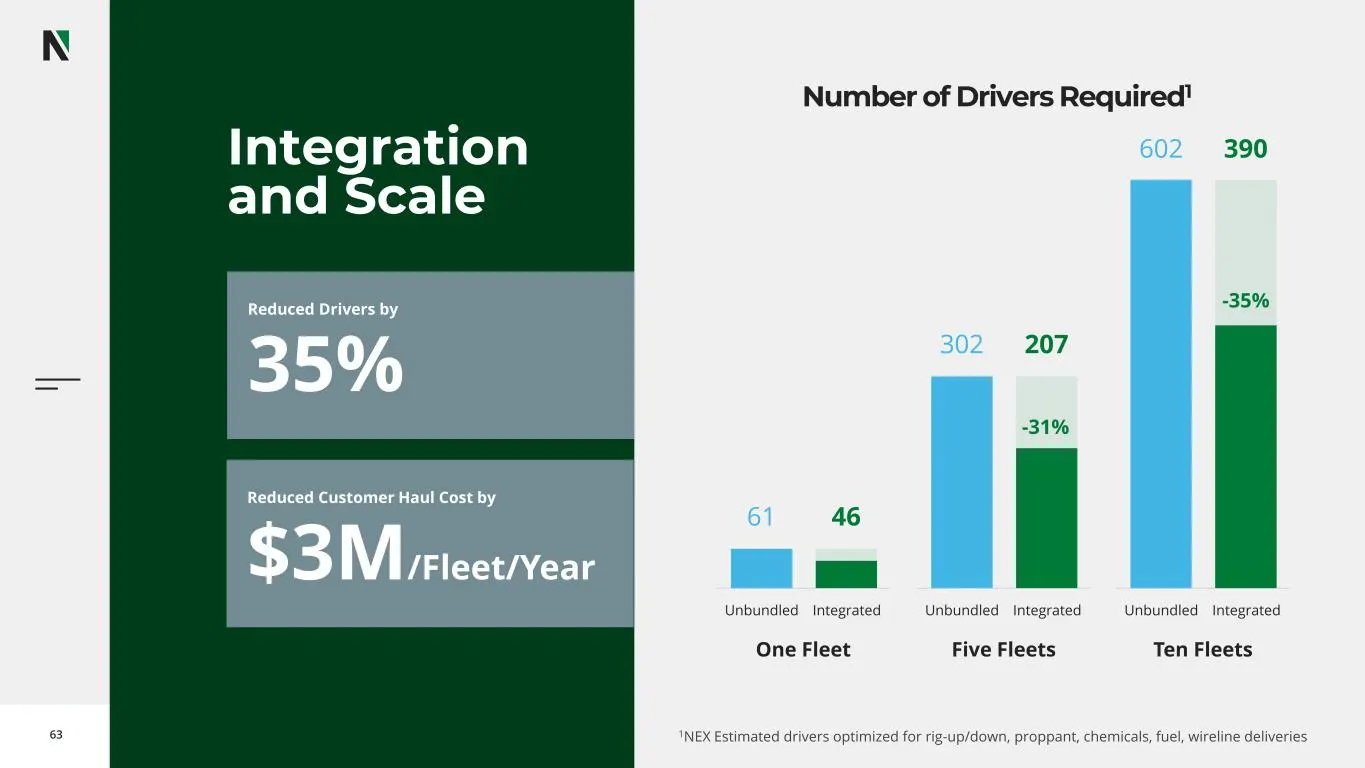
Slide 63: Integration and Scale
63 Integration and Scale 1NEX Estimated drivers optimized for rig-up/down, proppant, chemicals, fuel, wireline deliveries Unbundled Integrated One Fleet 61 46 Unbundled Integrated Five Fleets 302 207 Unbundled Integrated Ten Fleets 302 207 602 390 -35% -31% Reduced Drivers by 35% Reduced Customer Ha
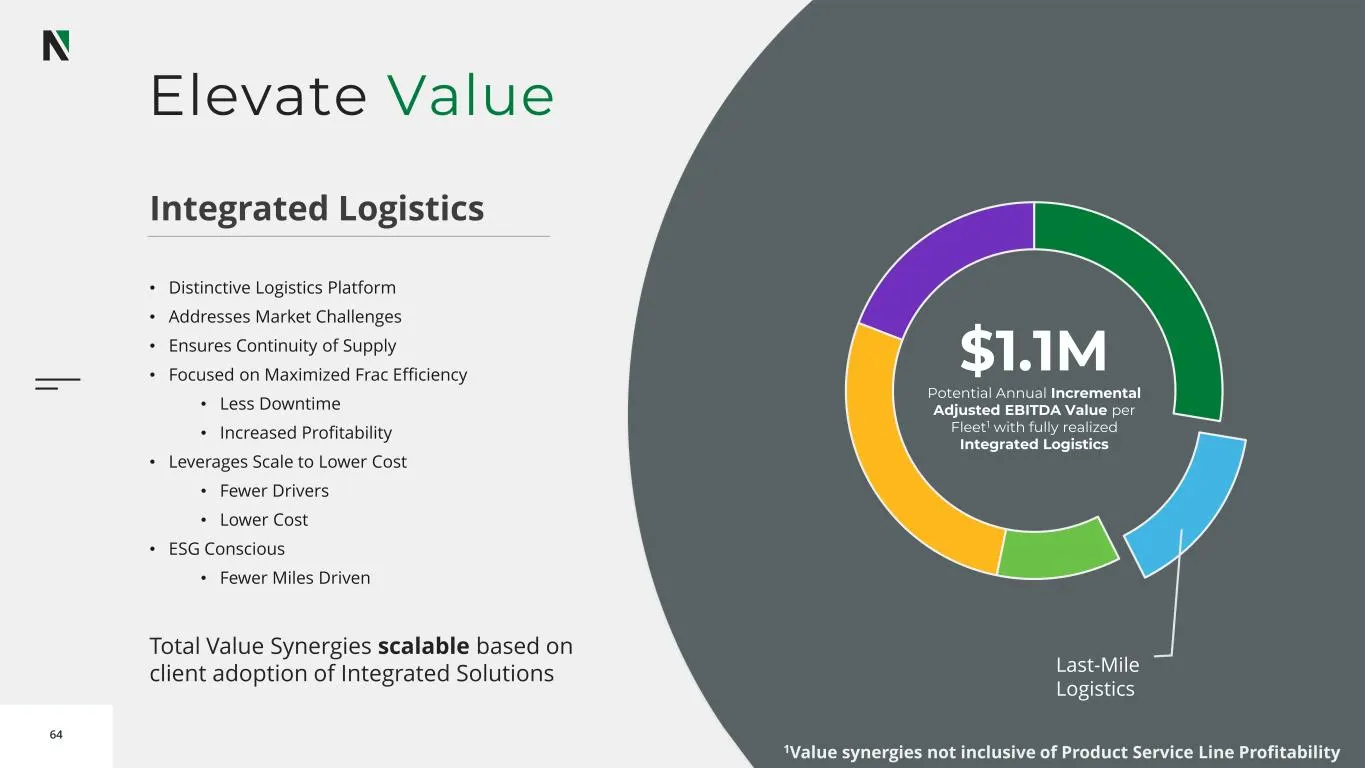
Slide 64: Elevate Value: Last-Mile Logistics
64 Elevate Value Last-Mile Logistics Integrated Logistics • Distinctive Logistics Platform • Addresses Market Challenges • Ensures Continuity of Supply • Focused on Maximized Frac Efficiency • Less Downtime • Increased Profitability • Leverages Scale to Lower Cost • Fewer Drivers • Lower Cost • ESG
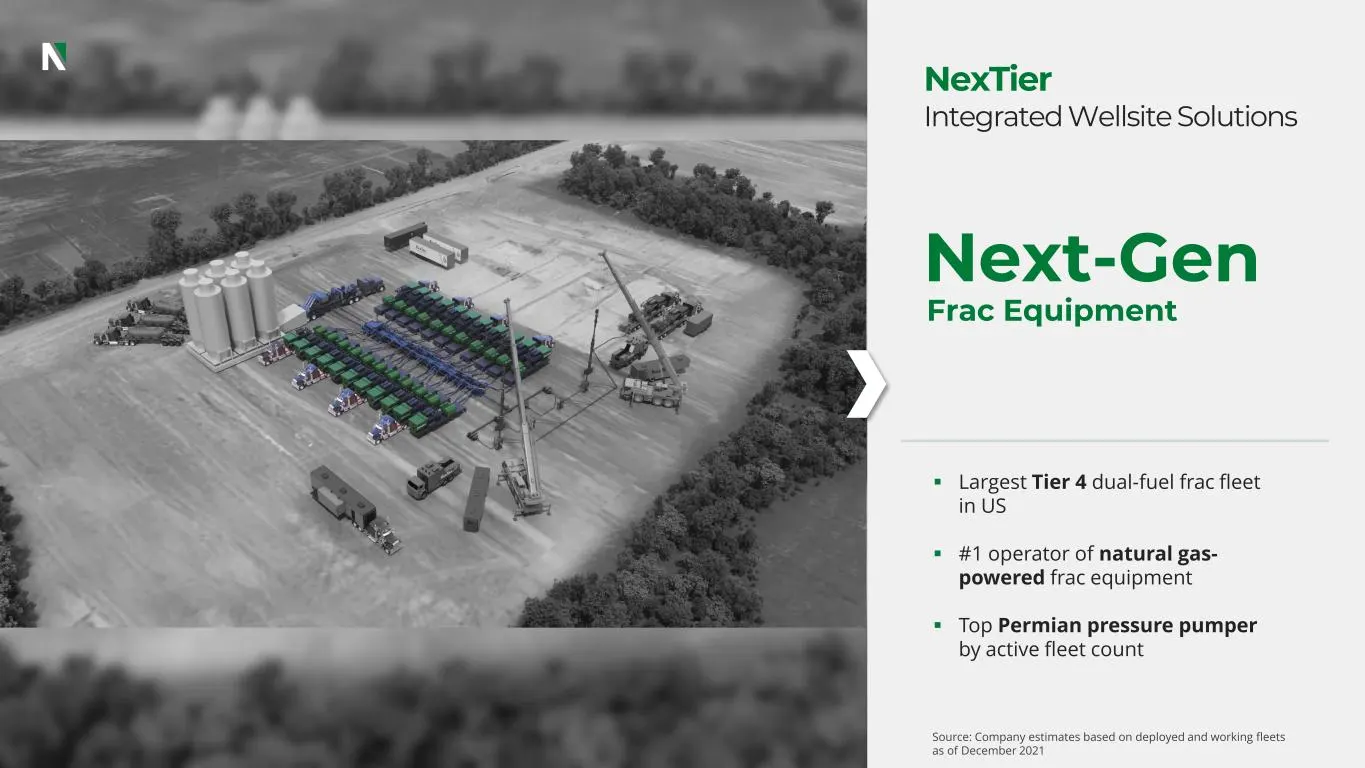
Slide 65: Next-Gen Frac Equipment
▪ Largest Tier 4 dual-fuel frac fleet in US ▪ #1 operator of natural gas- powered frac equipment ▪ Top Permian pressure pumper by active fleet count Next-Gen Frac Equipment Source: Company estimates based on deployed and working fleets as of December 2021 NexTier Integrated Wellsite Solutions
Slide 66: Next-Generation Frac
vo o d o o 66 Next-Generation Frac Zach Wilbur, VP - Frac Optimizing Fuel Sources and Reducing Emissions at the Wellsite
Slide 67: Drivers for Next-Generation Market
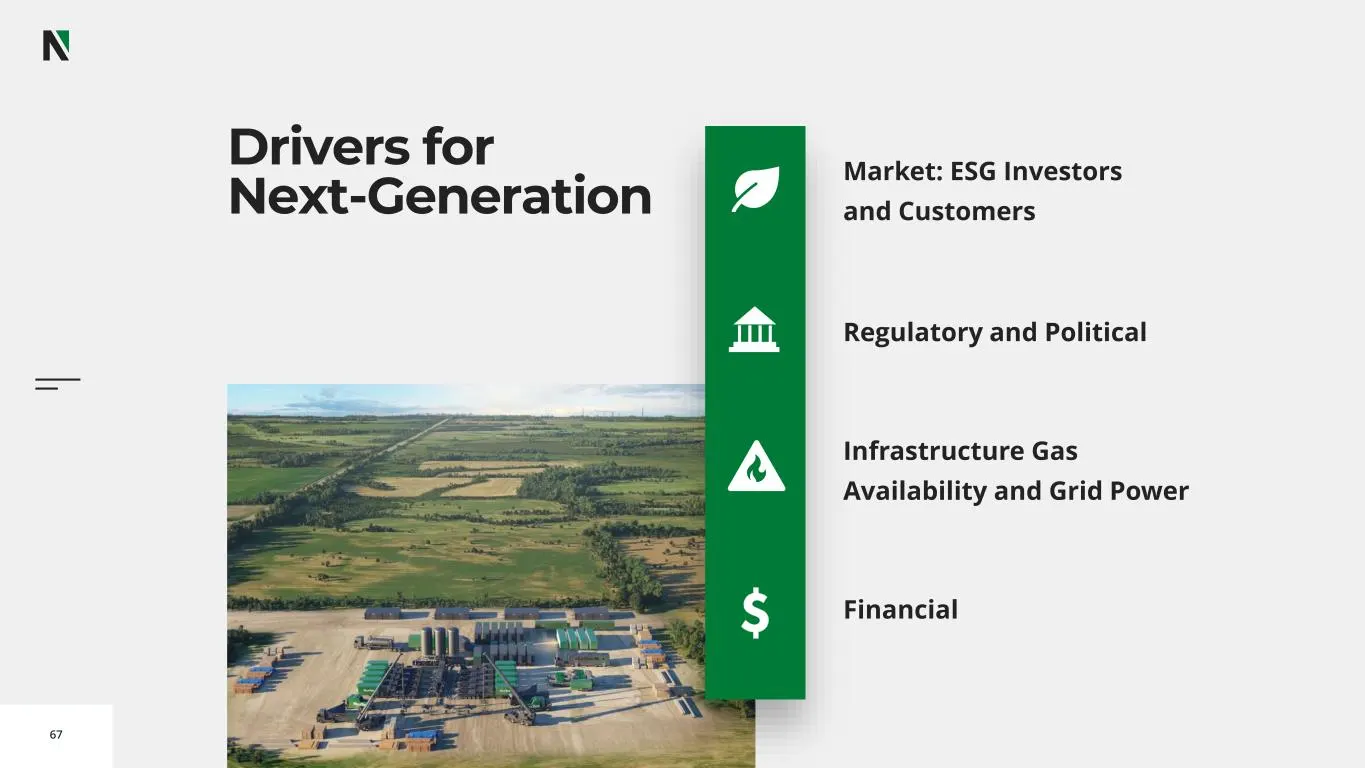
67 Drivers for Next-Generation Market: ESG Investors and Customers Regulatory and Political Infrastructure Gas Availability and Grid Power Financial
Slide 68: Industry ESG Headlines
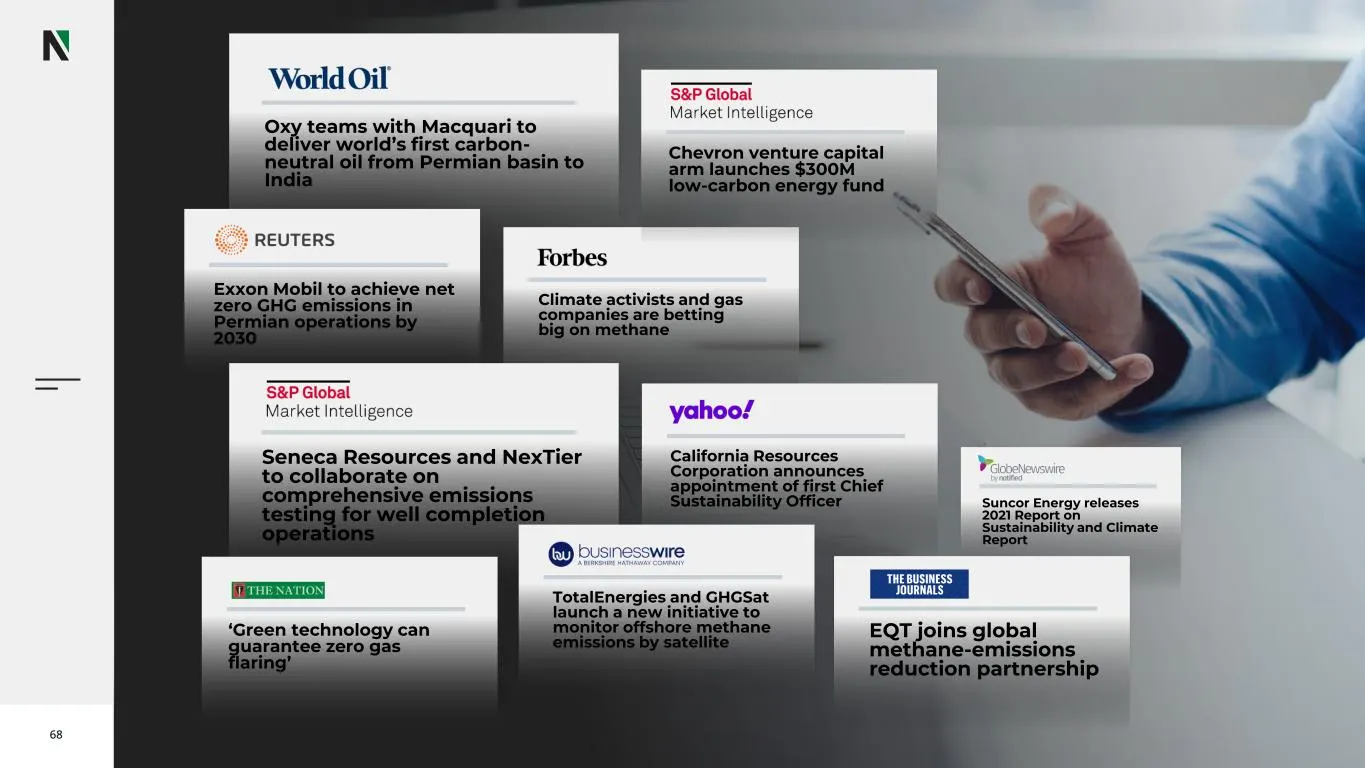
68 Oxy teams with Macquari to deliver world’s first carbon- neutral oil from Permian basin to India Suncor Energy releases 2021 Report on Sustainability and Climate Report Exxon Mobil to achieve net zero GHG emissions in Permian operations by 2030 Climate activists and gas companies are betting big
Slide 69: Regulatory and Political Drivers
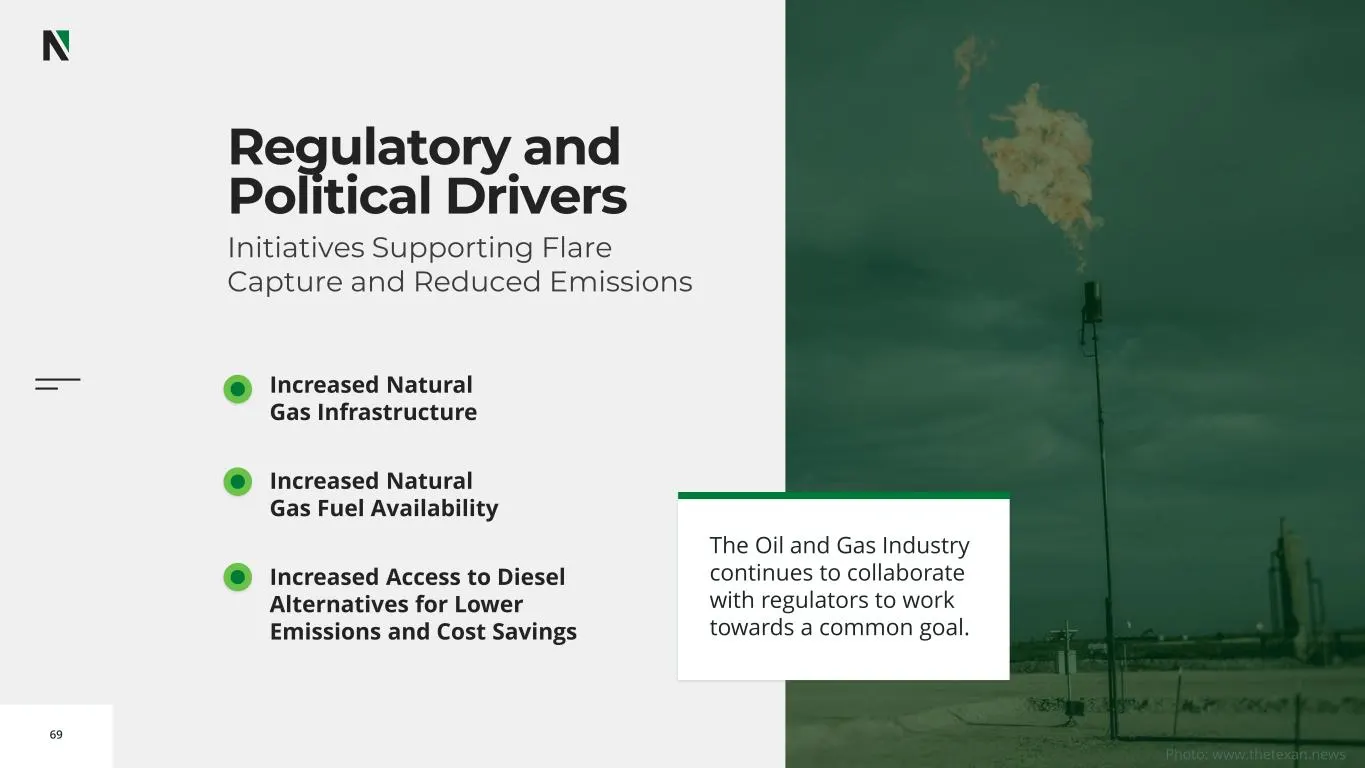
69 Photo: www.thetexan.news Regulatory and Political Drivers Initiatives Supporting Flare Capture and Reduced Emissions Increased Natural Gas Infrastructure Increased Natural Gas Fuel Availability Increased Access to Diesel Alternatives for Lower Emissions and Cost Savings The Oil and Gas Industry c
Slide 70: Grid Power Infrastructure
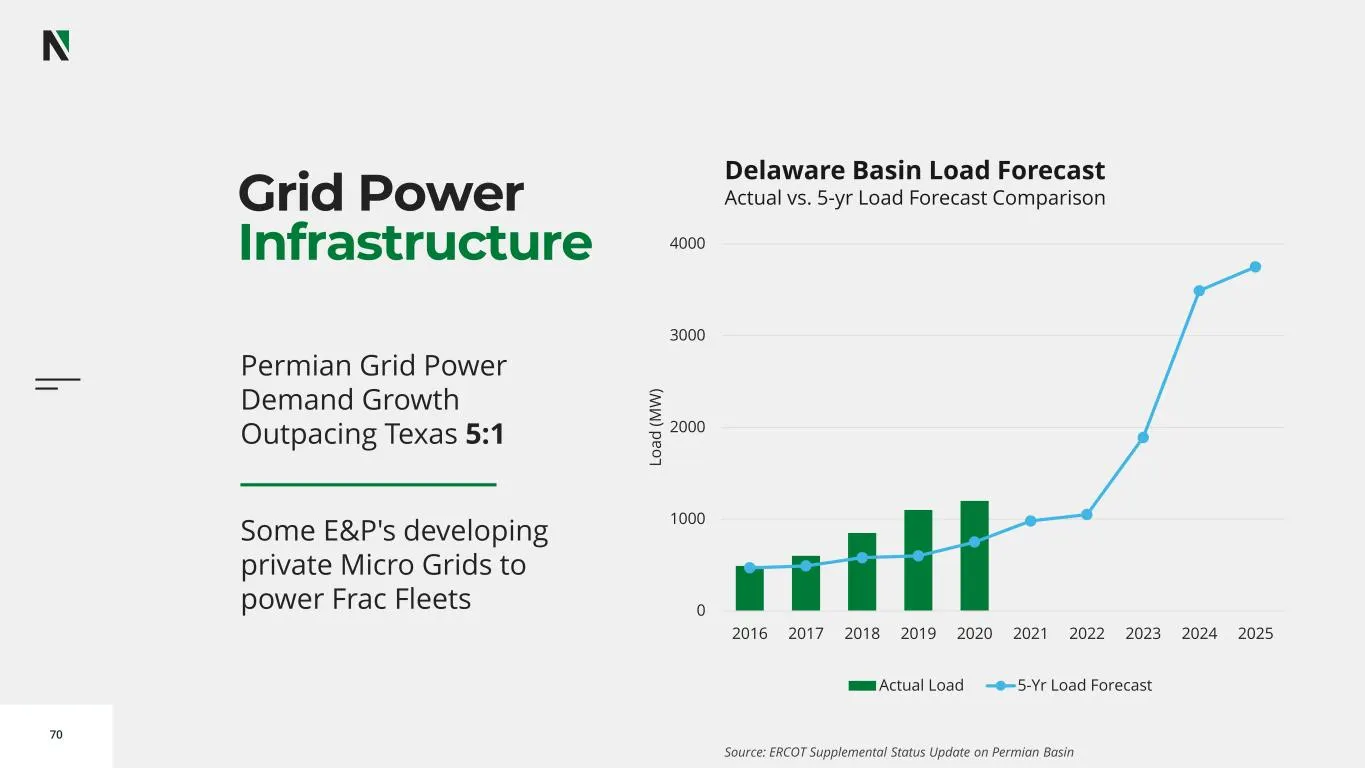
70 Grid Power Infrastructure 0 1000 2000 3000 4000 2016 2017 2018 2019 2020 2021 2022 2023 2024 2025 L o a d ( M W ) Actual Load 5-Yr Load Forecast Delaware Basin Load Forecast Actual vs. 5-yr Load Forecast Comparison Source: ERCOT Supplemental Status Update on Permian Basin Permian Grid Power Deman
Slide 71: Natural Gas Infrastructure
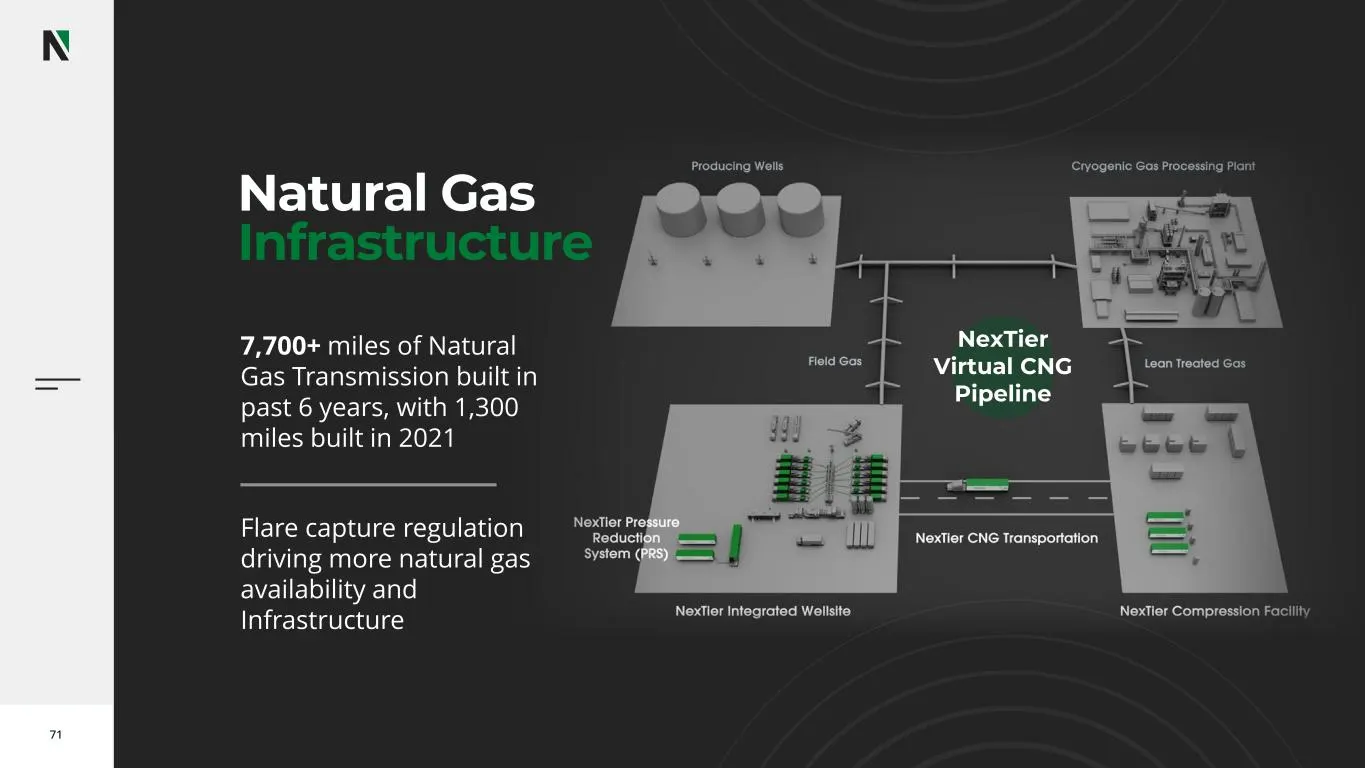
71 Natural Gas Infrastructure 7,700+ miles of Natural Gas Transmission built in past 6 years, with 1,300 miles built in 2021 Flare capture regulation driving more natural gas availability and Infrastructure NexTier Virtual CNG Pipeline
Slide 72: The Natural Gas Advantage
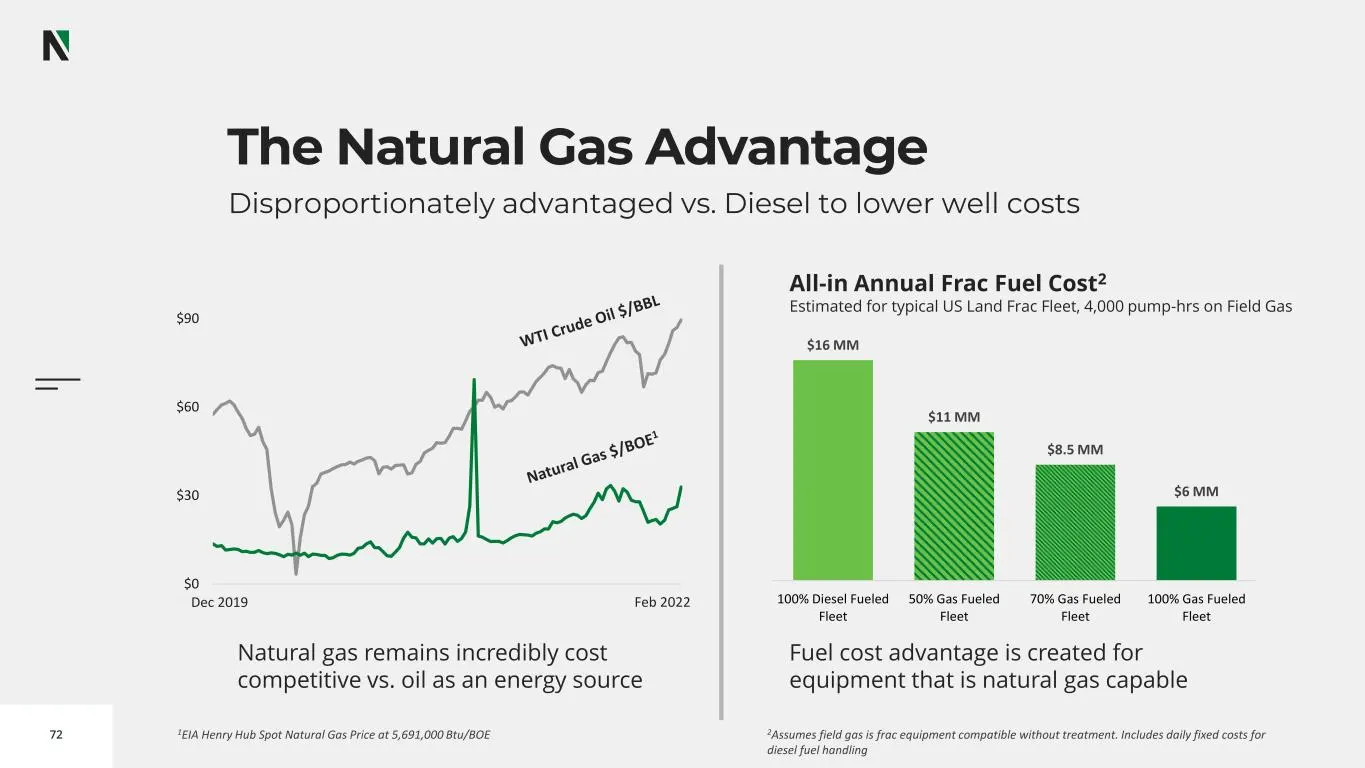
72 The Natural Gas Advantage Disproportionately advantaged vs. Diesel to lower well costs 1EIA Henry Hub Spot Natural Gas Price at 5,691,000 Btu/BOE $16 MM $11 MM $8.5 MM $6 MM 100% Diesel Fueled Fleet 50% Gas Fueled Fleet 70% Gas Fueled Fleet 100% Gas Fueled Fleet All-in Annual Frac Fuel Cost2 Esti
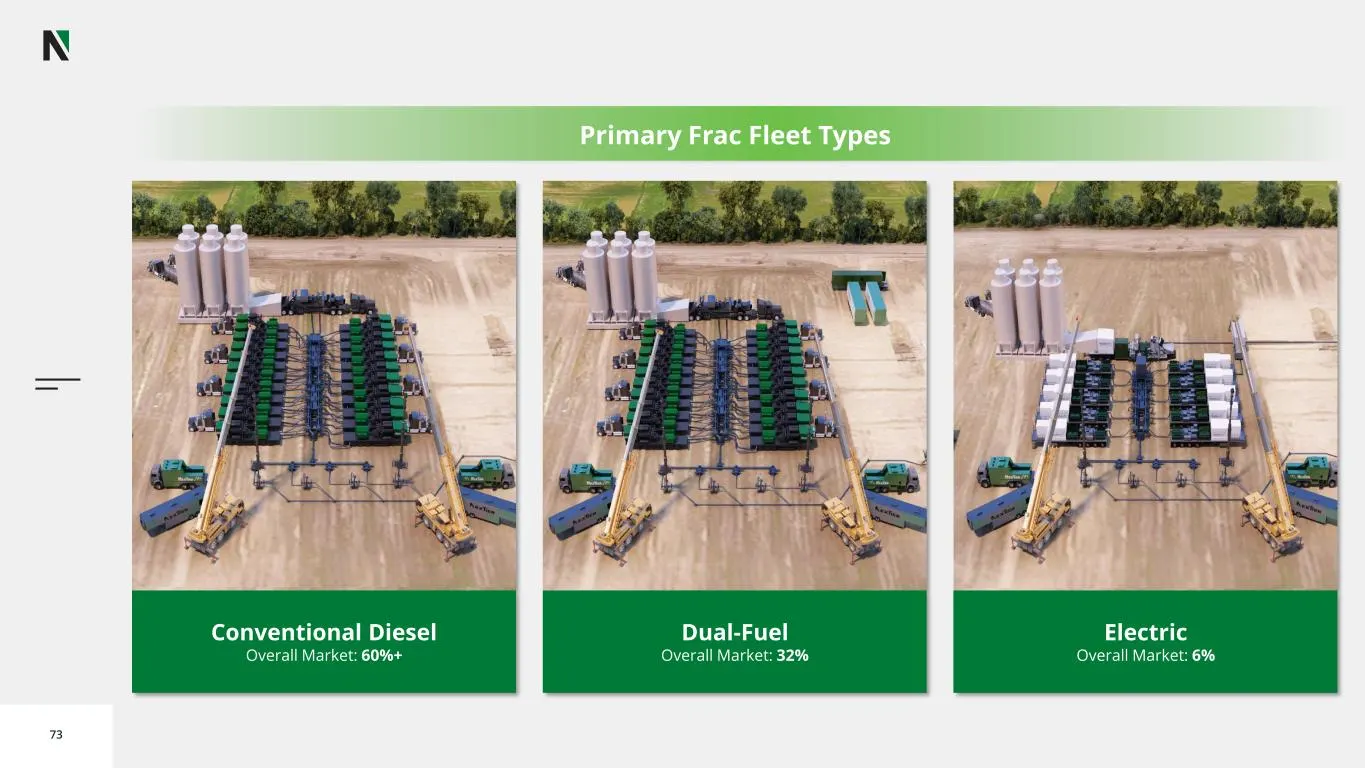
Slide 73: Primary Frac Fleet Types
73 Primary Frac Fleet Types Conventional Diesel Overall Market: 60%+ Dual-Fuel Overall Market: 32% Electric Overall Market: 6%
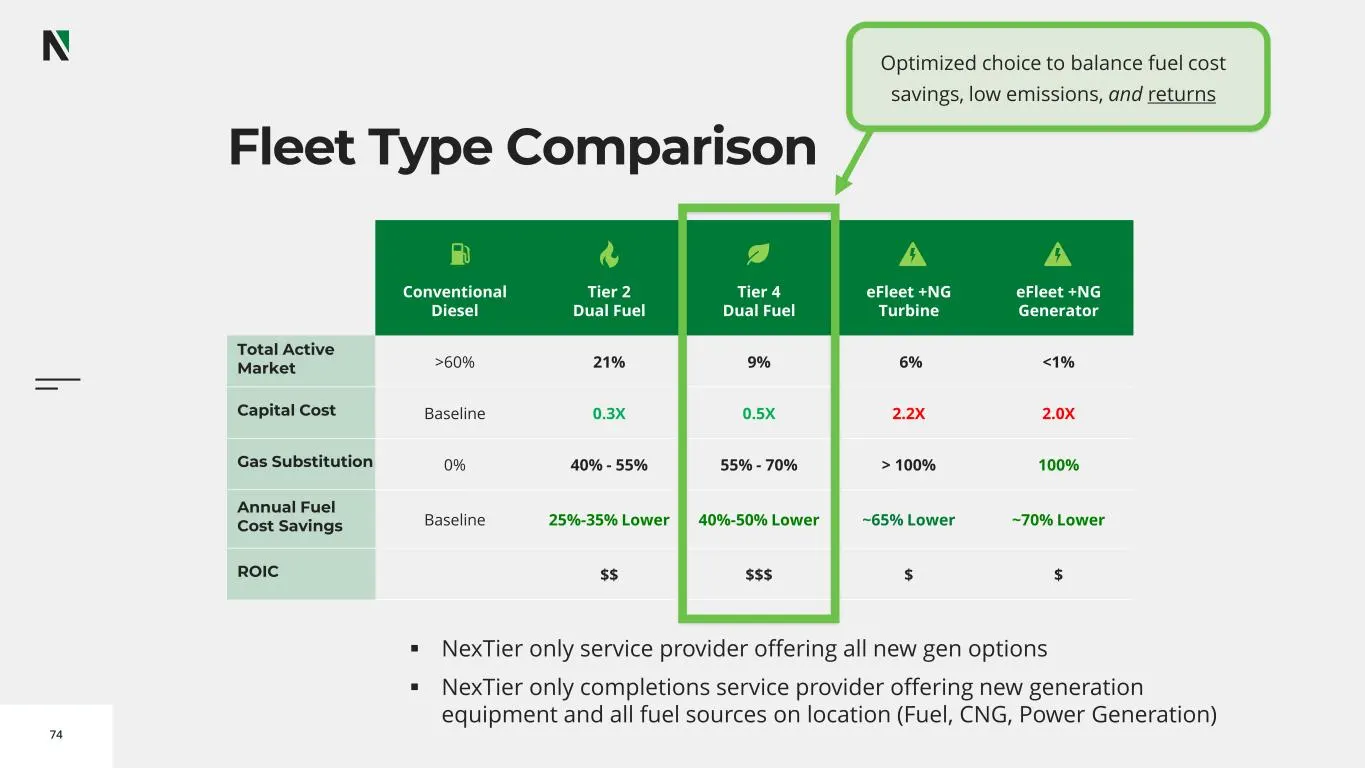
Slide 74: Fleet Type Comparison
74 Conventional Diesel Tier 2 Dual Fuel Tier 4 Dual Fuel eFleet +NG Turbine eFleet +NG Generator Total Active Market >60% 21% 9% 6% <1% Capital Cost Baseline 0.3X 0.5X 2.2X 2.0X Gas Substitution 0% 40% - 55% 55% - 70% > 100% 100% Annual Fuel Cost Savings Baseline 25%-35% Lower 40%-50% Lower ~65% Low
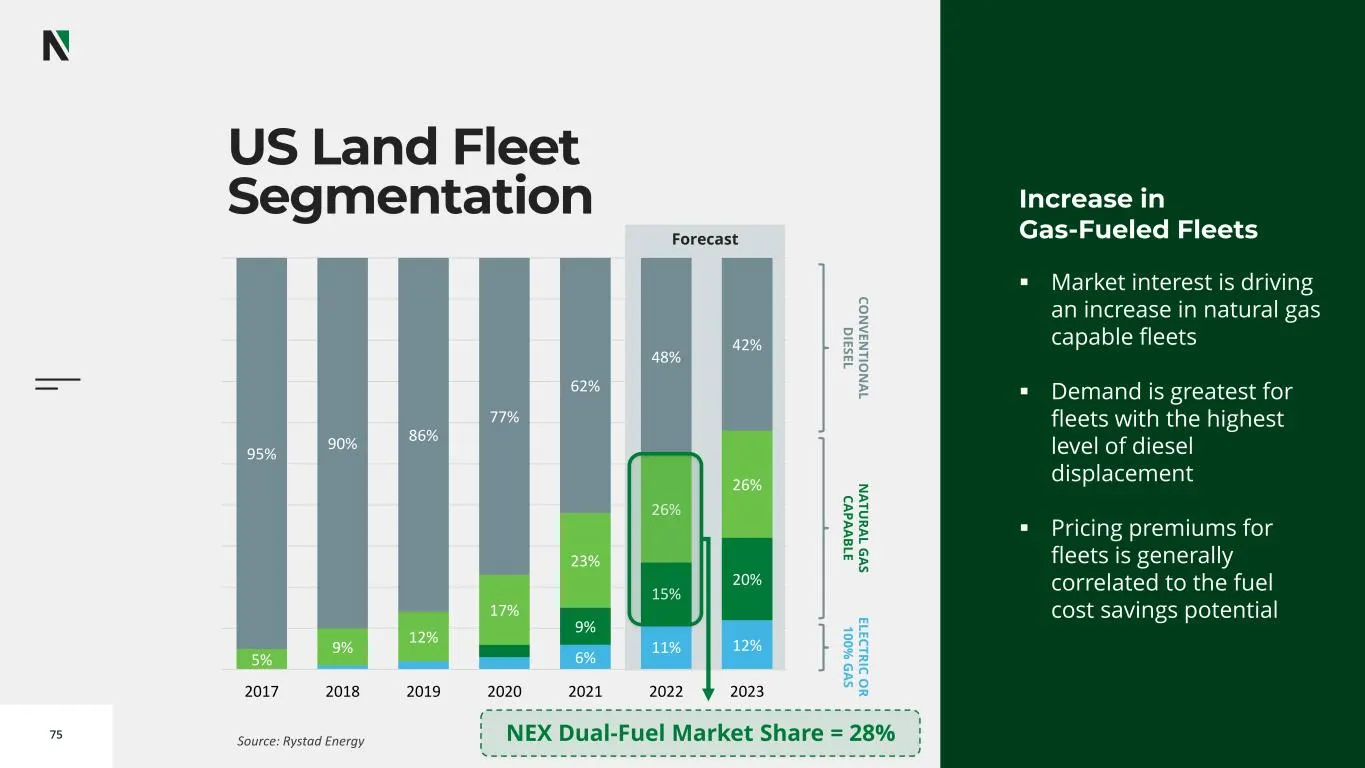
Slide 75: US Land Fleet Segmentation Forecast
75 US Land Fleet Segmentation Forecast 6% 11% 12% 9% 15% 20% 5% 9% 12% 17% 23% 26% 26% 95% 90% 86% 77% 62% 48% 42% 2017 2018 2019 2020 2021 2022 2023 C O N V E N T IO N A L D IE S E L N A T U R A L G A S C A P A A B L E E L E C T R IC O R 1 0 0 % G A S Increase in Gas-Fueled Fleets ▪ Market interest
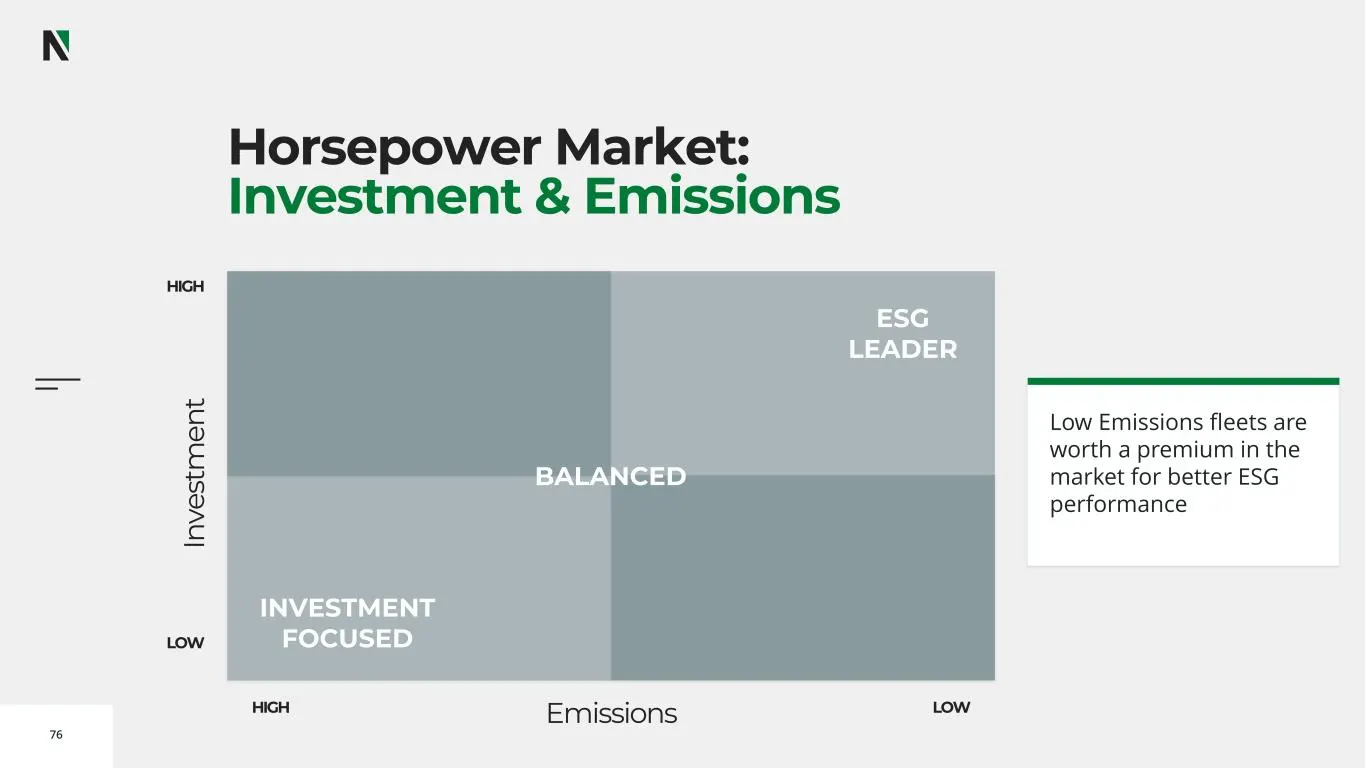
Slide 76: Horsepower Market: Investment & Emissions
76 Horsepower Market: Investment & Emissions BALANCED ESG LEADER INVESTMENT FOCUSED Emissions In ve st m en t HIGH LOW HIGH LOW Low Emissions fleets are worth a premium in the market for better ESG performance
Slide 77: Elevate Value: Tiered Equipment
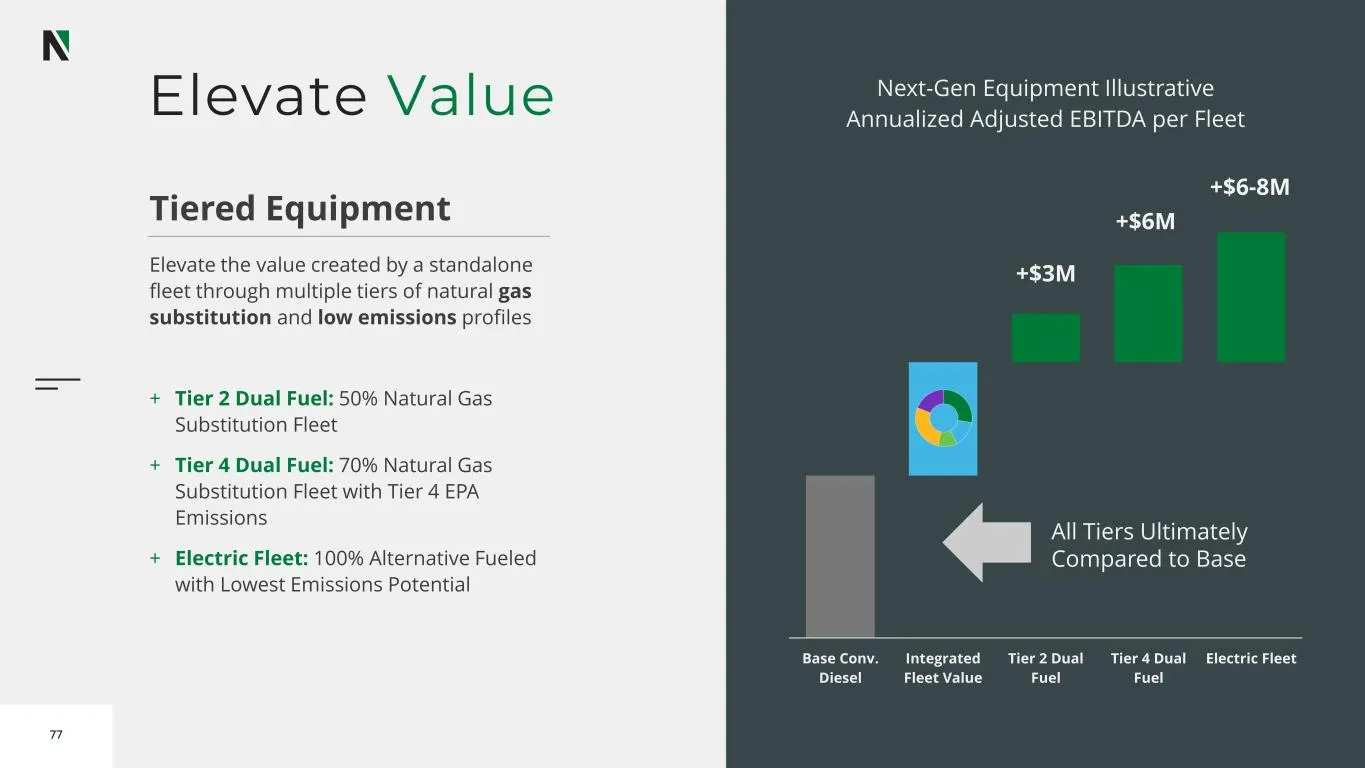
77 Elevate Value Tiered Equipment Elevate the value created by a standalone fleet through multiple tiers of natural gas substitution and low emissions profiles + Tier 2 Dual Fuel: 50% Natural Gas Substitution Fleet + Tier 4 Dual Fuel: 70% Natural Gas Substitution Fleet with Tier 4 EPA Emissions + El
Slide 78: Power Solutions Natural Gas Fueling
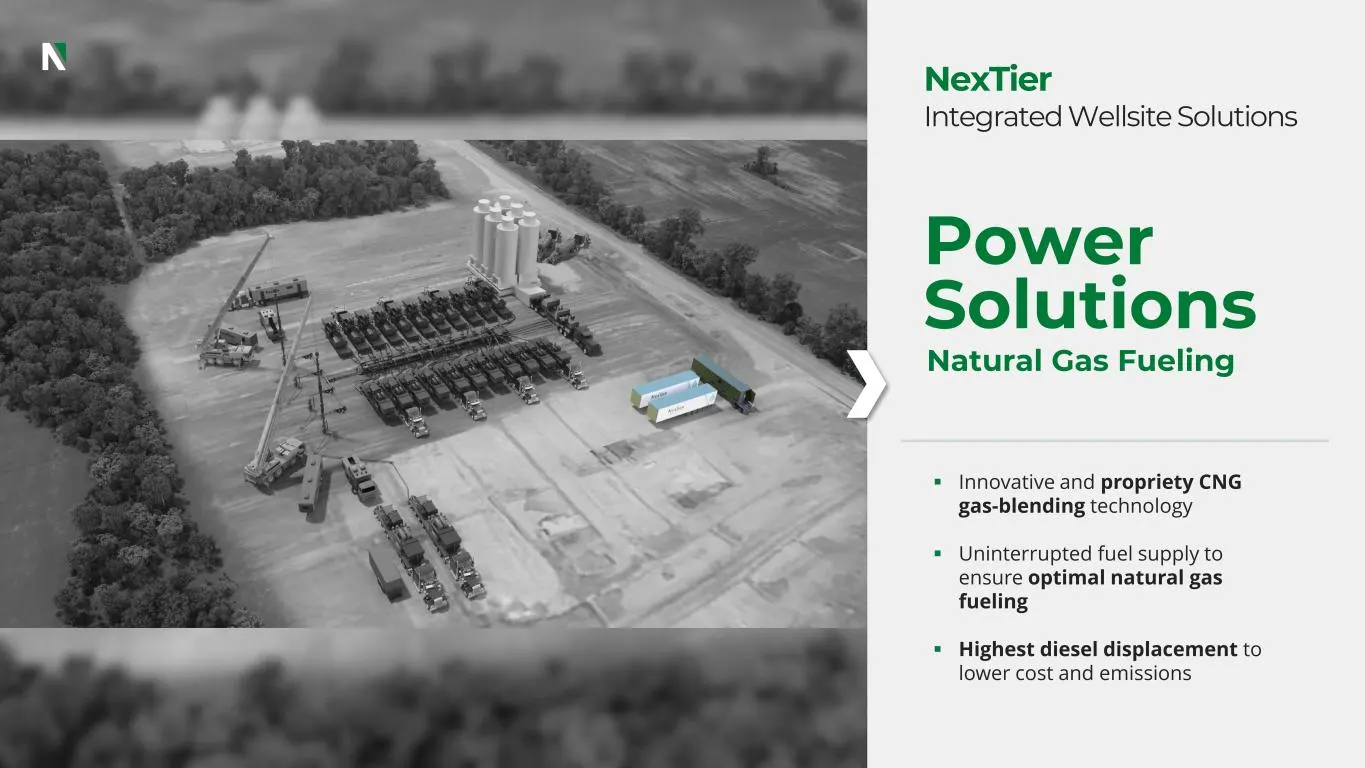
▪ Innovative and propriety CNG gas-blending technology ▪ Uninterrupted fuel supply to ensure optimal natural gas fueling ▪ Highest diesel displacement to lower cost and emissions Power Solutions Natural Gas Fueling NexTier Integrated Wellsite Solutions
Slide 79: Power Solutions
vo o d o o 79 Power Solutions Aaron Hilber, VP - Power Solutions Courtney Brownie, Senior Finance Director Leading the Transition to Alternative Fuels
Slide 80: New Natural Gas Fueling Service to Address Common E&P Challenges
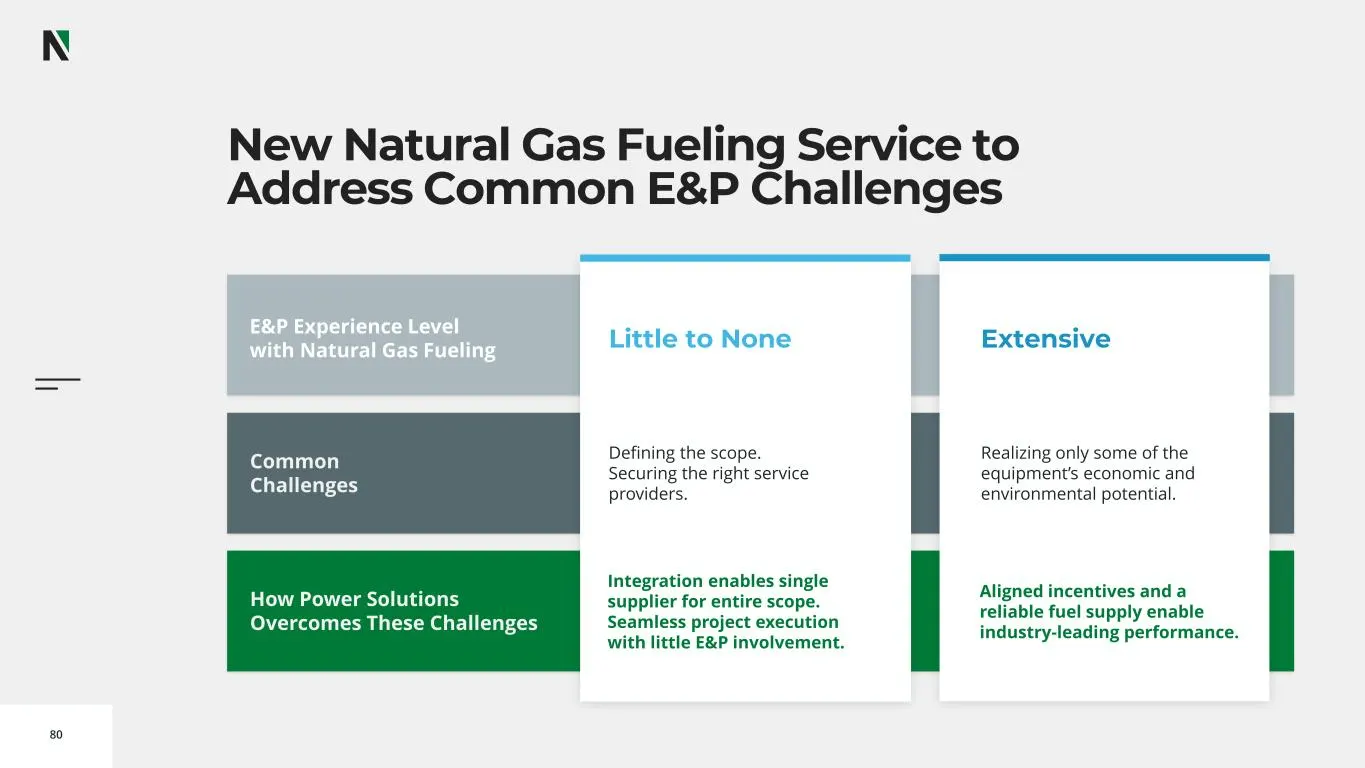
80 New Natural Gas Fueling Service to Address Common E&P Challenges E&P Experience Level with Natural Gas Fueling Common Challenges How Power Solutions Overcomes These Challenges Little to None Extensive Defining the scope. Securing the right service providers. Realizing only some of the equipment’s
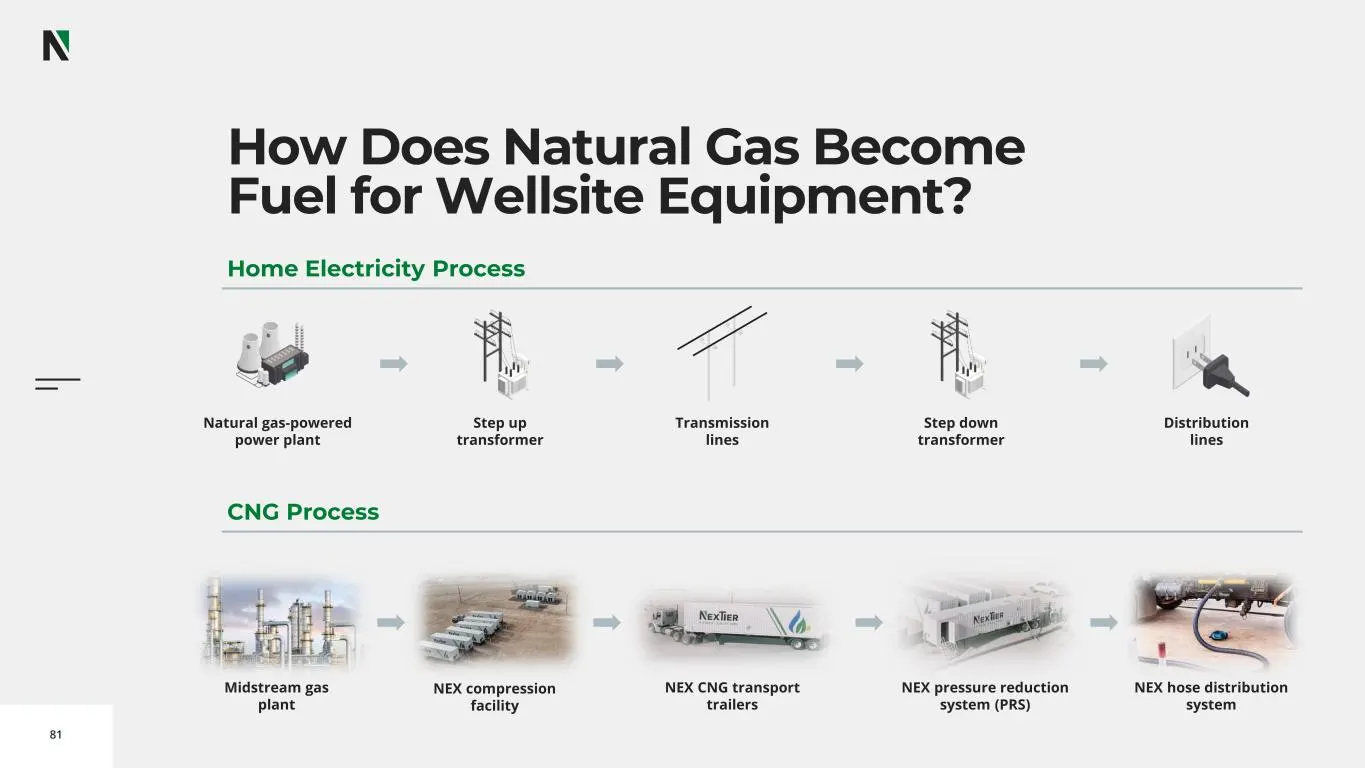
Slide 81: How Does Natural Gas Become Fuel for Wellsite Equipment?
81 Step up transformer Transmission lines Step down transformer Distribution lines Natural gas-powered power plant Midstream gas plant NEX compression facility NEX CNG transport trailers NEX pressure reduction system (PRS) NEX hose distribution system How Does Natural Gas Become Fuel for Wellsite Eq
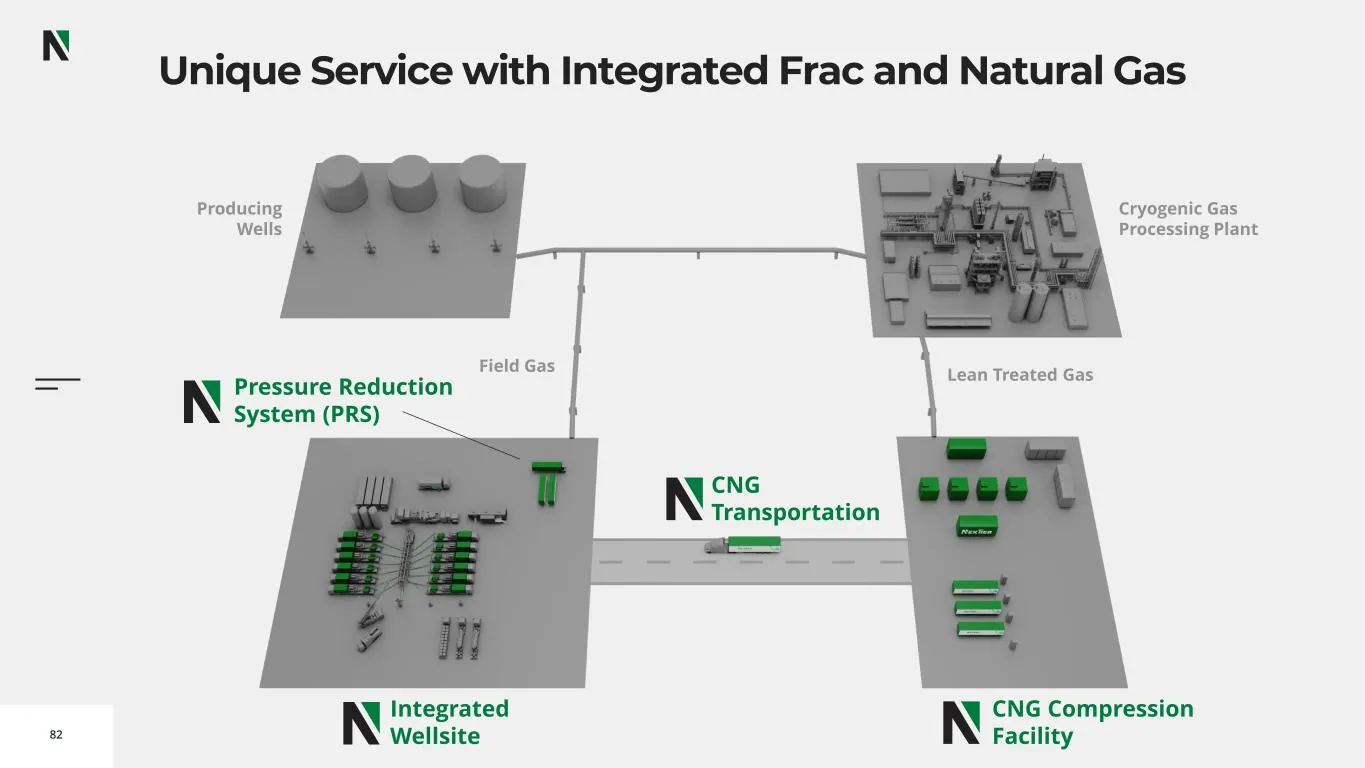
Slide 82: Unique Service with Integrated Frac and Natural Gas
82 Unique Service with Integrated Frac and Natural Gas Producing Wells Integrated Wellsite Cryogenic Gas Processing Plant Lean Treated Gas Field Gas CNG Transportation Pressure Reduction System (PRS) CNG Compression Facility
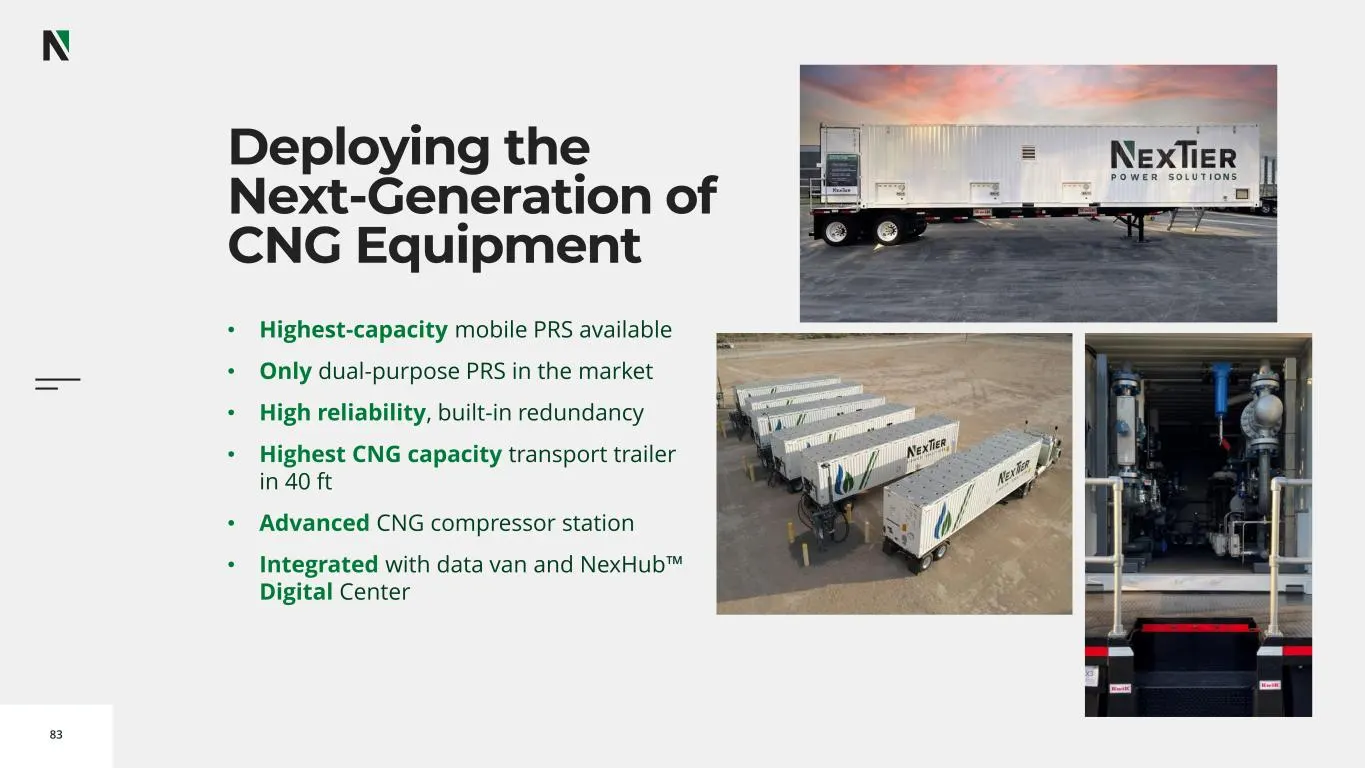
Slide 83: Deploying the Next-Generation of CNG Equipment
83 Deploying the Next-Generation of CNG Equipment • Highest-capacity mobile PRS available • Only dual-purpose PRS in the market • High reliability, built-in redundancy • Highest CNG capacity transport trailer in 40 ft • Advanced CNG compressor station • Integrated with data van and NexHub™ Digital C
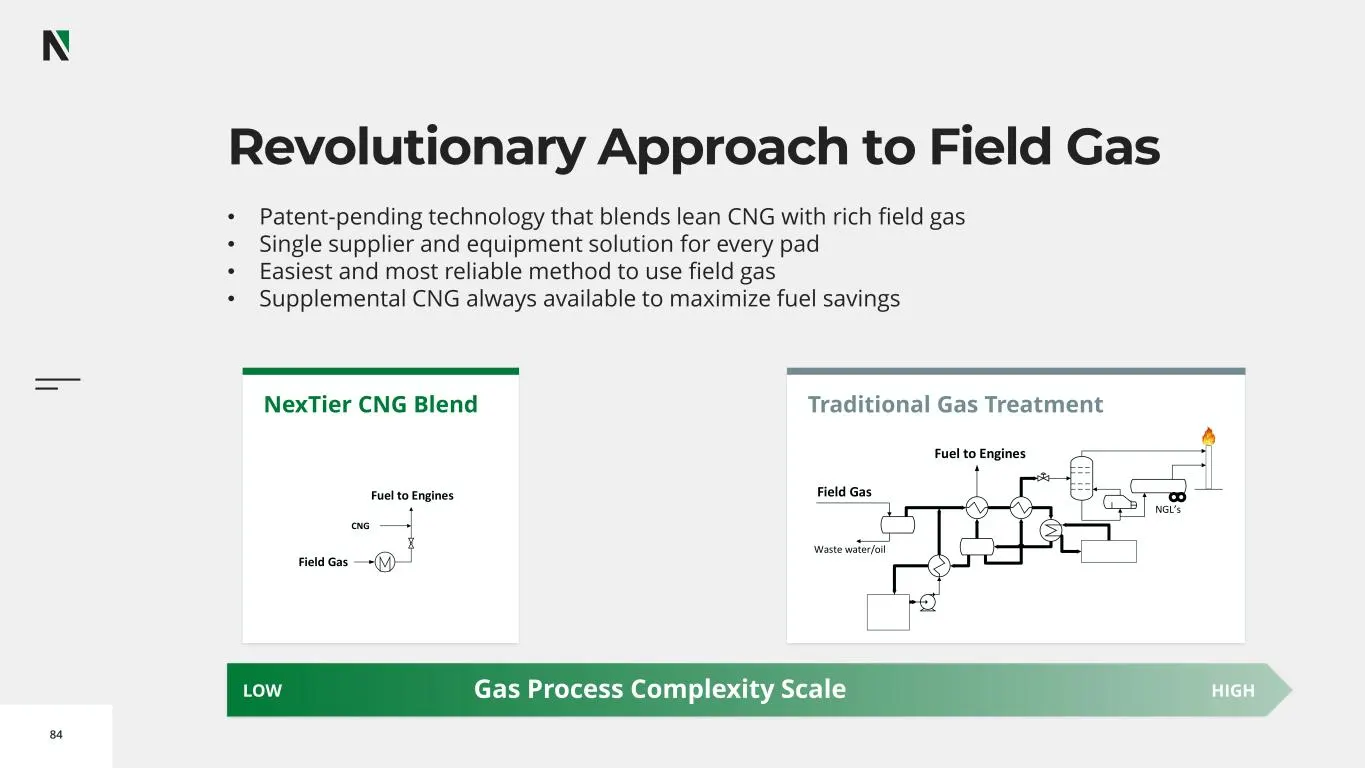
Slide 84: Revolutionary Approach to Field Gas
84 Revolutionary Approach to Field Gas • Patent-pending technology that blends lean CNG with rich field gas • Single supplier and equipment solution for every pad • Easiest and most reliable method to use field gas • Supplemental CNG always available to maximize fuel savings Traditional Gas Treatmen
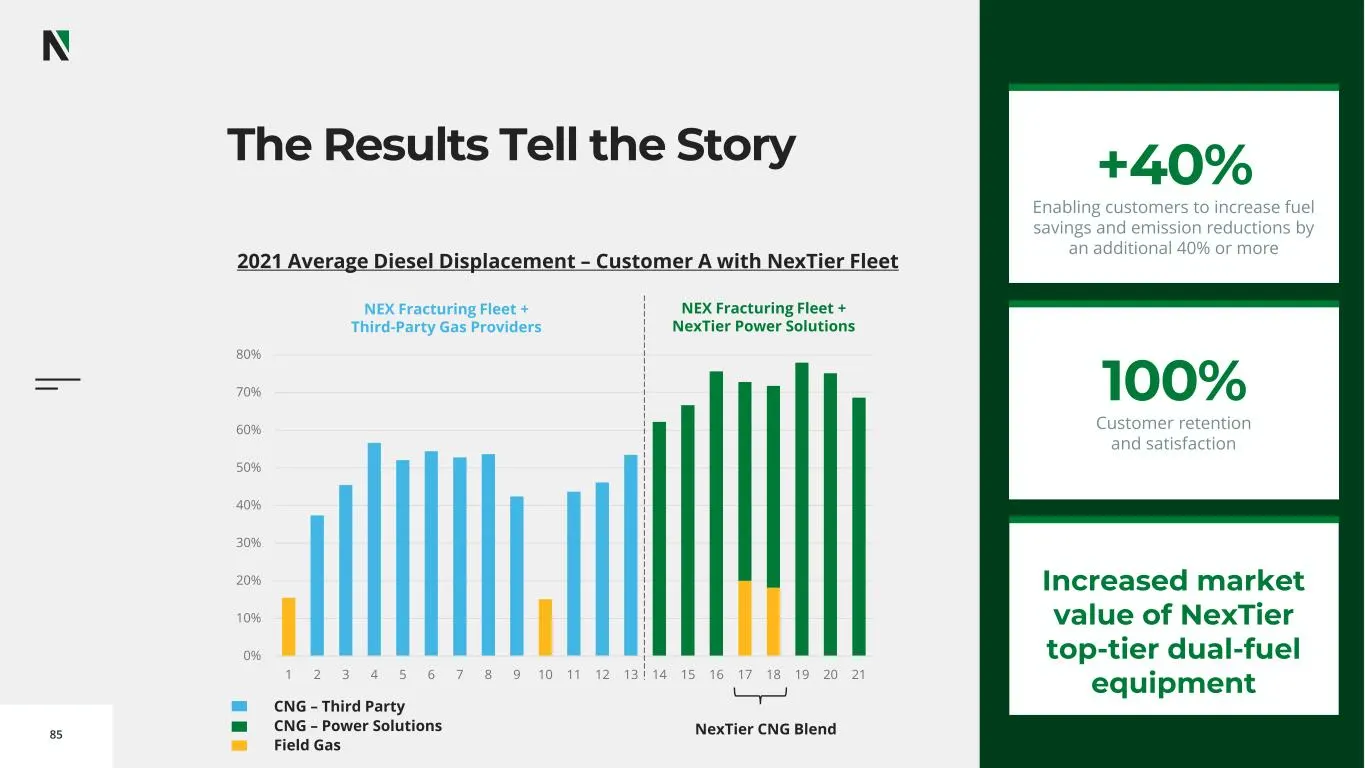
Slide 85: The Results Tell the Story
85 0% 10% 20% 30% 40% 50% 60% 70% 80% 90% 1 2 3 4 5 6 7 8 9 10 11 12 13 14 15 16 17 18 19 20 21 The Results Tell the Story NEX Fracturing Fleet + NexTier Power Solutions NEX Fracturing Fleet + Third-Party Gas Providers CNG – Third Party CNG – Power Solutions Field Gas NexTier CNG Blend 2021 Average
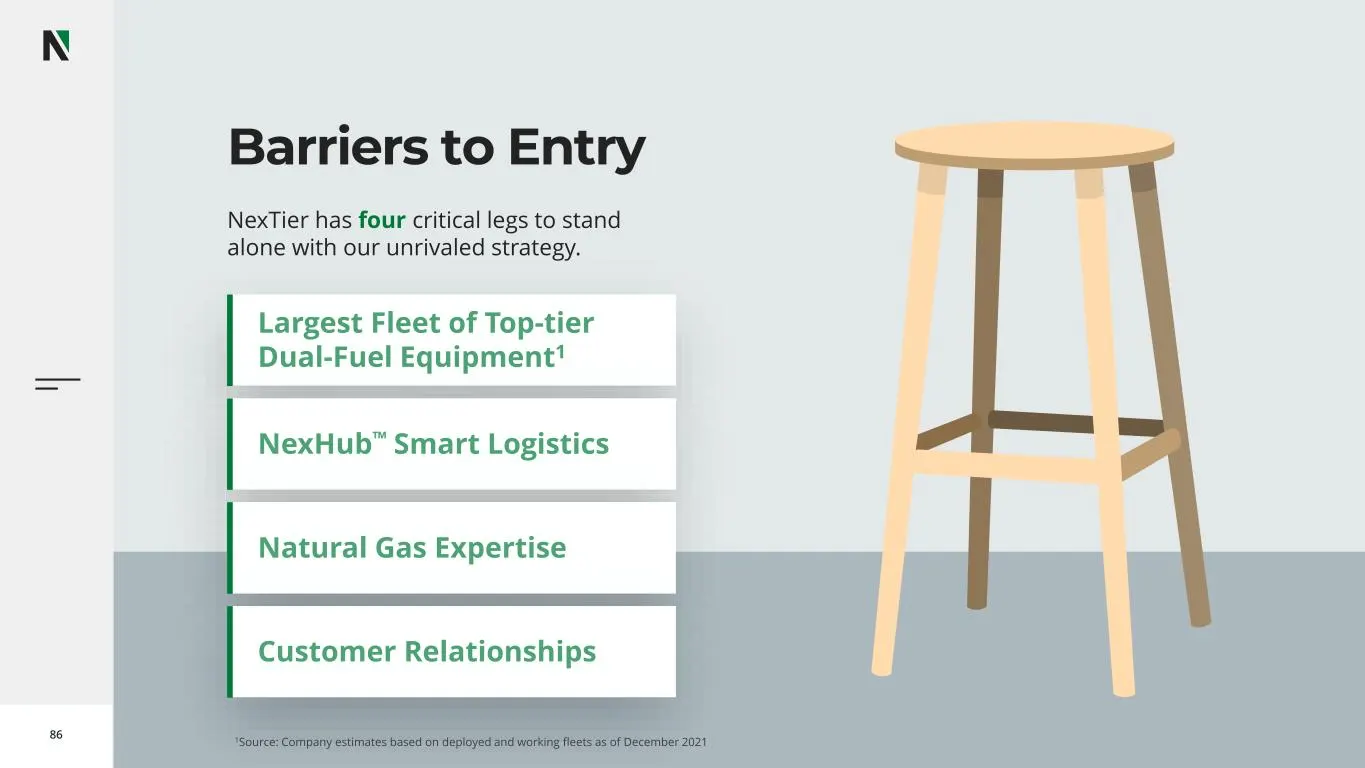
Slide 86: Barriers to Entry
86 Barriers to Entry NexTier has four critical legs to stand alone with our unrivaled strategy. 1Source: Company estimates based on deployed and working fleets as of December 2021
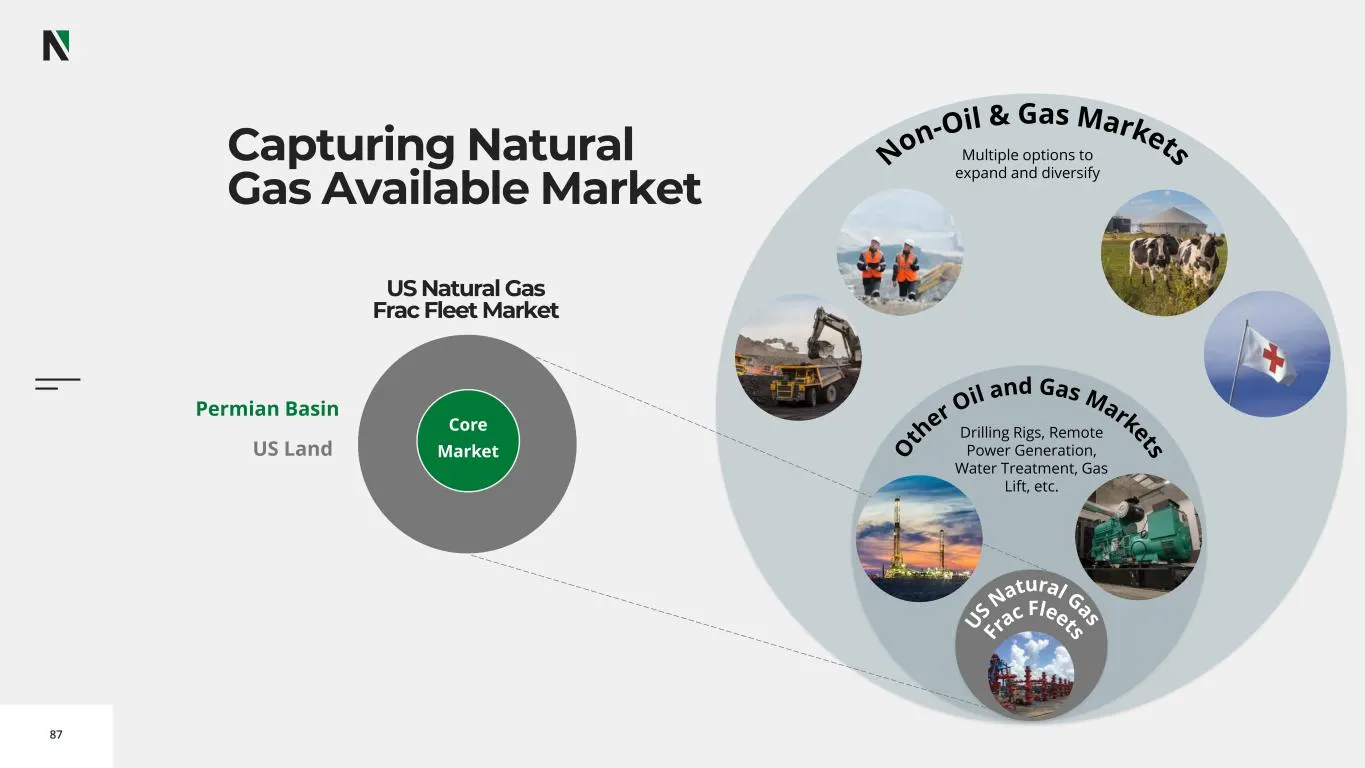
Slide 87: Capturing Natural Gas Available Market
87 Capturing Natural Gas Available Market Drilling Rigs, Remote Power Generation, Water Treatment, Gas Lift, etc. Multiple options to expand and diversify US Natural Gas Frac Fleet Market Permian Basin US Land Core Market
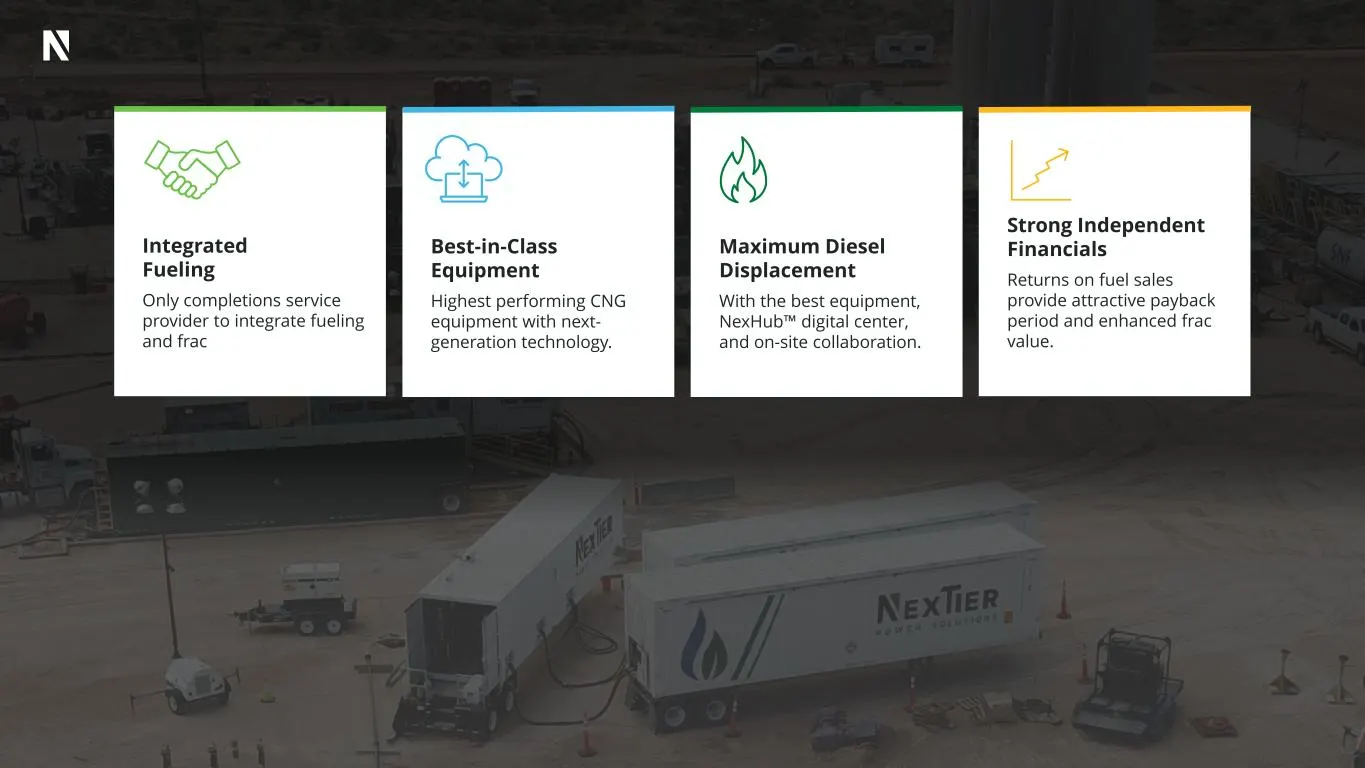
Slide 88: Integrated Fueling
Integrated Fueling Only completions service provider to integrate fueling and frac Maximum Diesel Displacement With the best equipment, NexHub™ digital center, and on-site collaboration. Best-in-Class Equipment Highest performing CNG equipment with next- generation technology. Strong Independent Fin
Slide 89: Standalone Power Solutions Profit Delivers a Quick Return
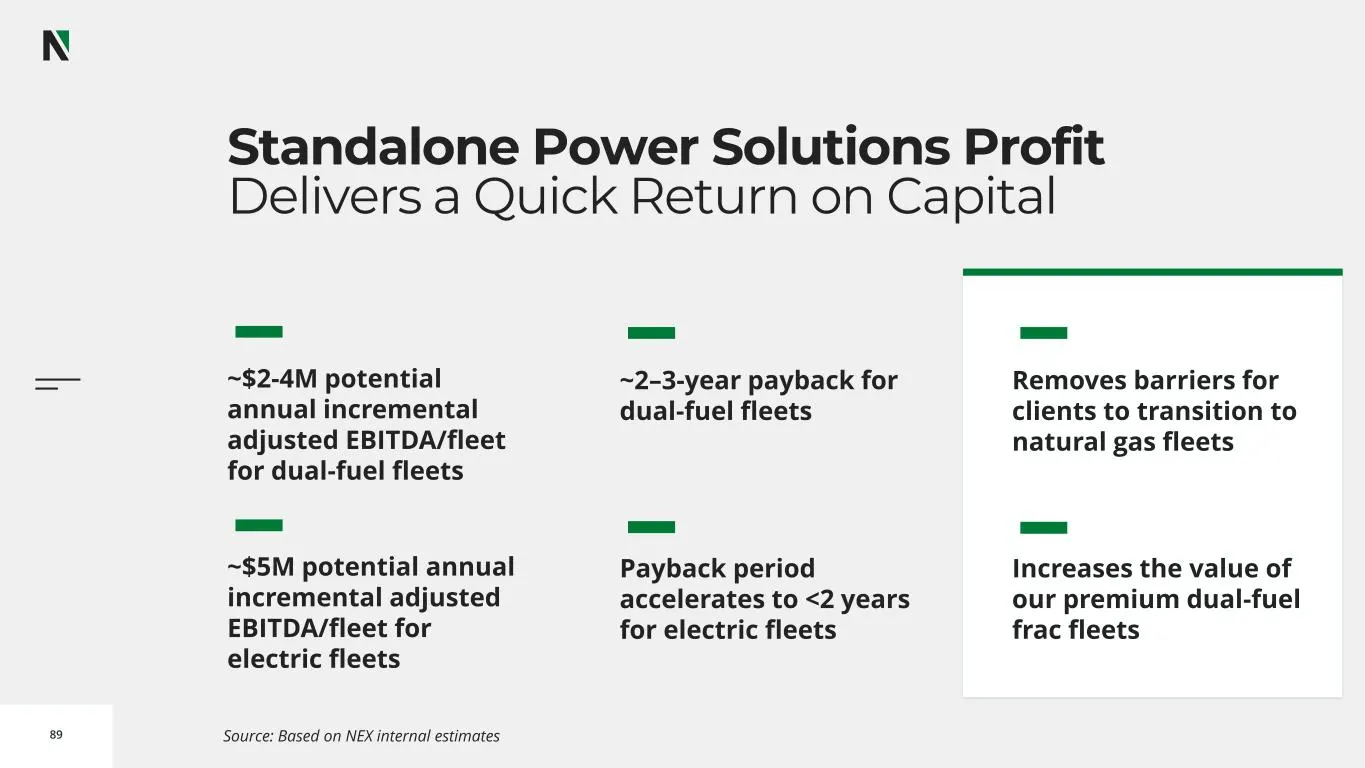
89 Standalone Power Solutions Profit Delivers a Quick Return on Capital Source: Based on NEX internal estimates Removes barriers for clients to transition to natural gas fleets ~2–3-year payback for dual-fuel fleets Payback period accelerates to <2 years for electric fleets Increases the value of ou
Slide 90: Elevate Value: Power Solutions
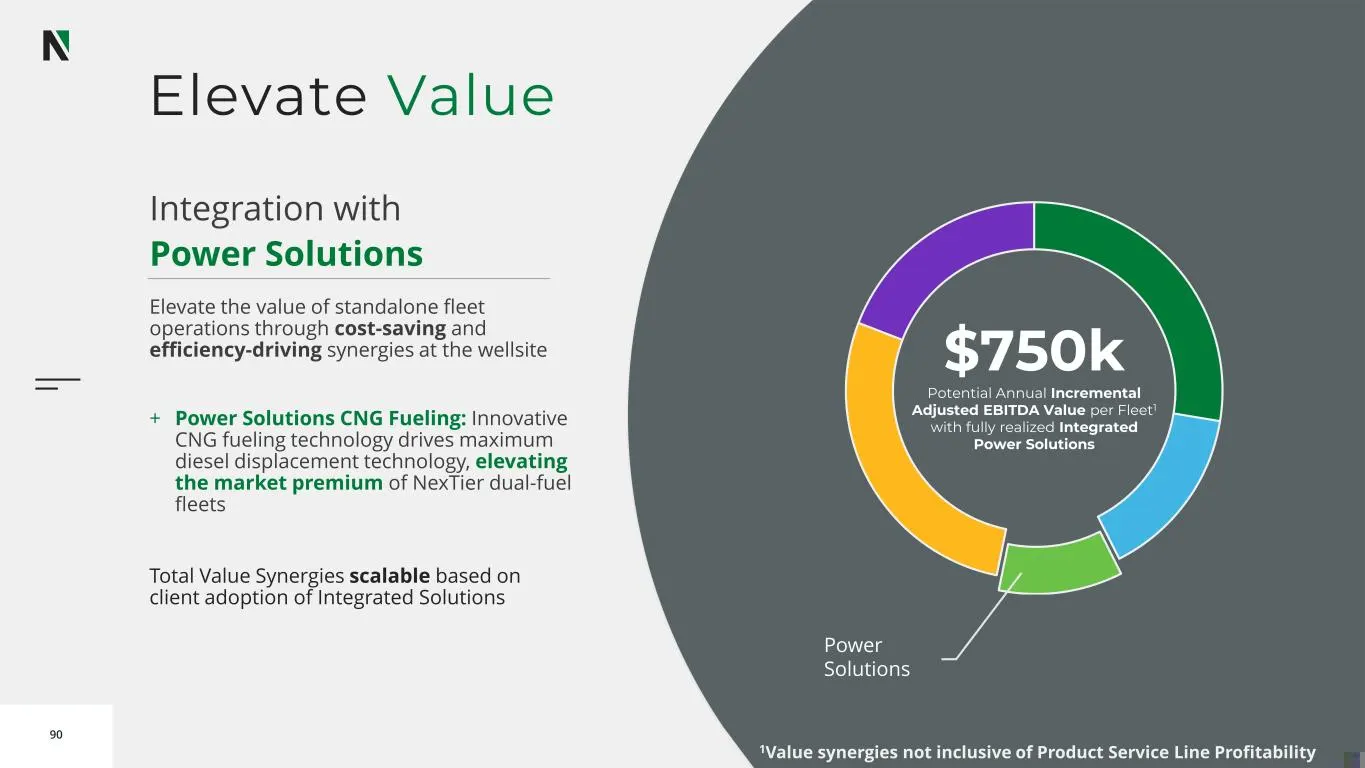
90 Elevate Value Power Solutions Integration with Power Solutions Elevate the value of standalone fleet operations through cost-saving and efficiency-driving synergies at the wellsite + Power Solutions CNG Fueling: Innovative CNG fueling technology drives maximum diesel displacement technology, elev
Slide 91: Wireline Operations
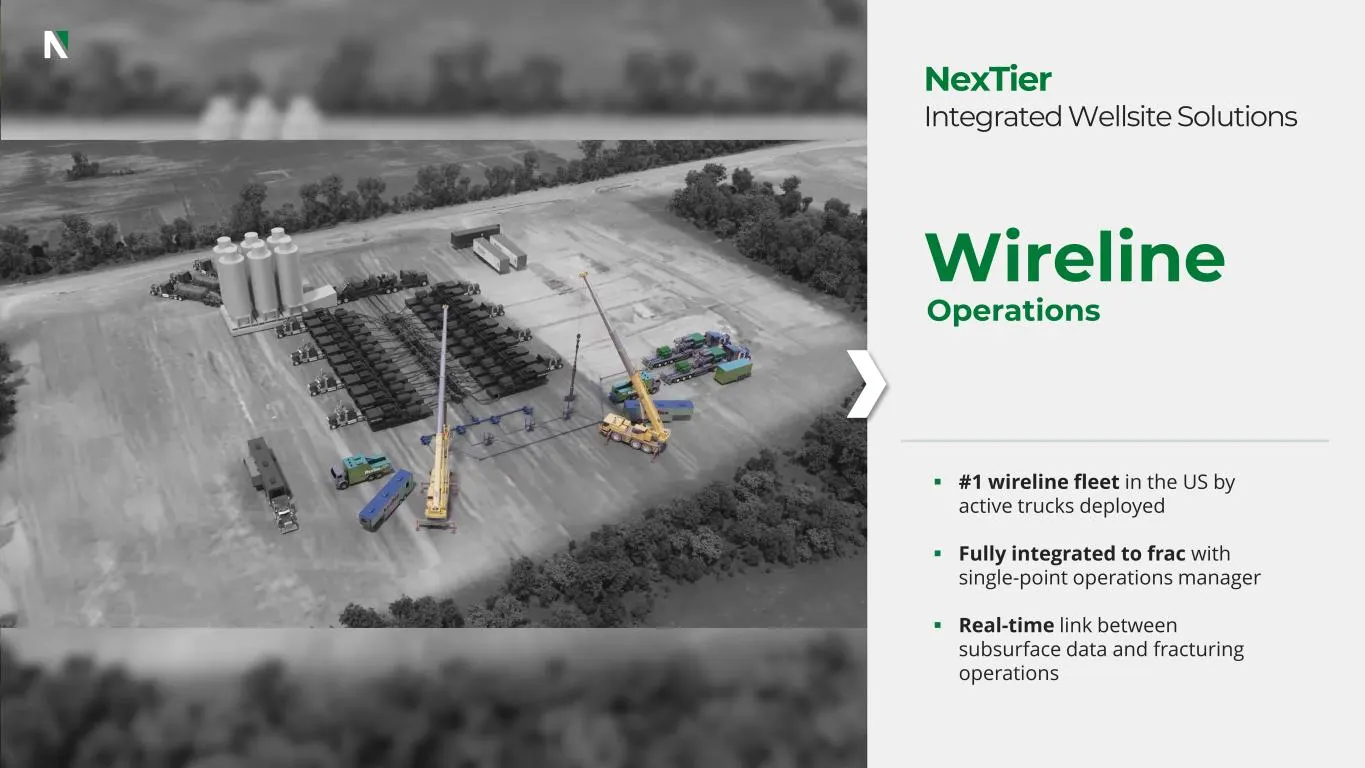
Wireline Operations ▪ #1 wireline fleet in the US by active trucks deployed ▪ Fully integrated to frac with single-point operations manager ▪ Real-time link between subsurface data and fracturing operations NexTier Integrated Wellsite Solutions
Slide 92: Wireline
vo o d o o 92 Wireline Haitham Soliman, VP Wireline Capturing the Value of Integration at the Wellsite
Slide 93: Why NexTier Wireline
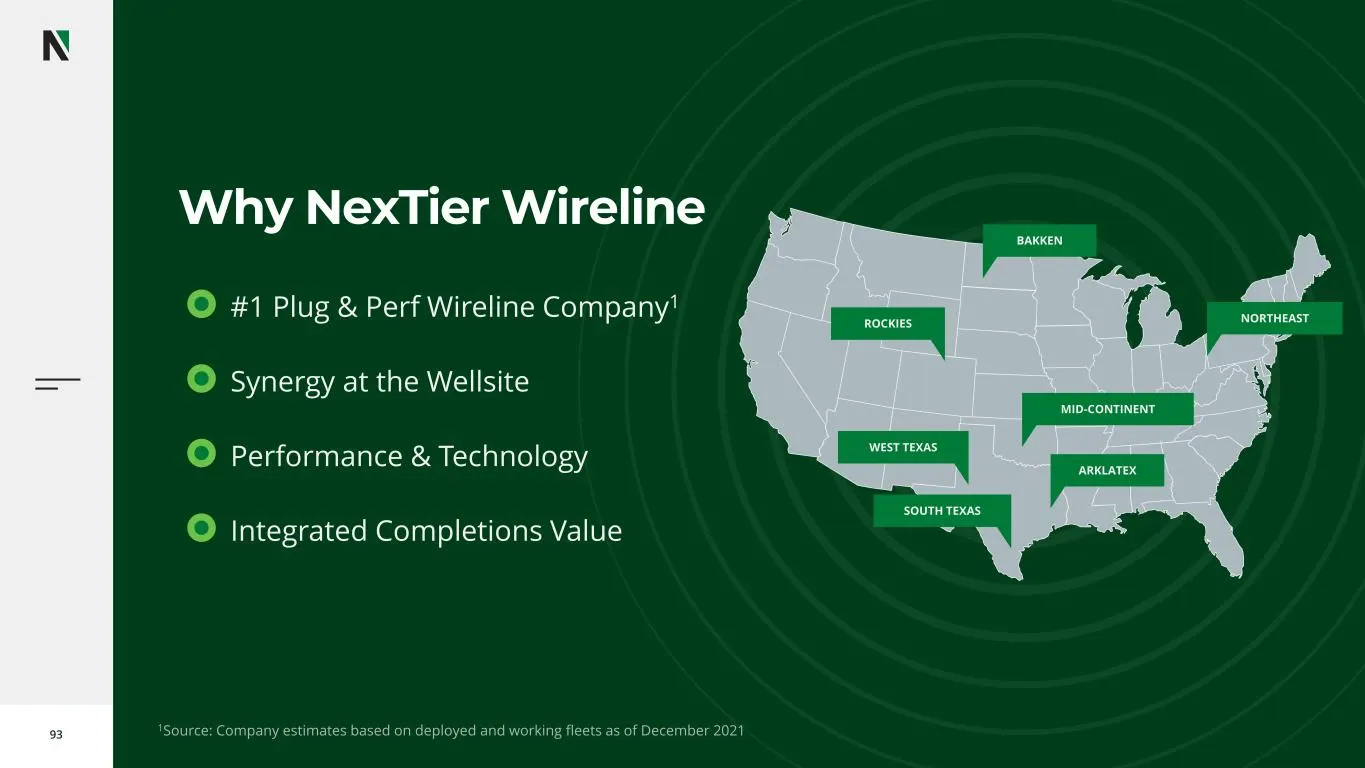
93 ARKLATEX WEST TEXAS SOUTH TEXAS MID-CONTINENT ROCKIES BAKKEN NORTHEAST Why NexTier Wireline #1 Plug & Perf Wireline Company1 Synergy at the Wellsite Performance & Technology Integrated Completions Value 1Source: Company estimates based on deployed and working fleets as of December 2021
Slide 94
Slide 95: Revisiting Integration
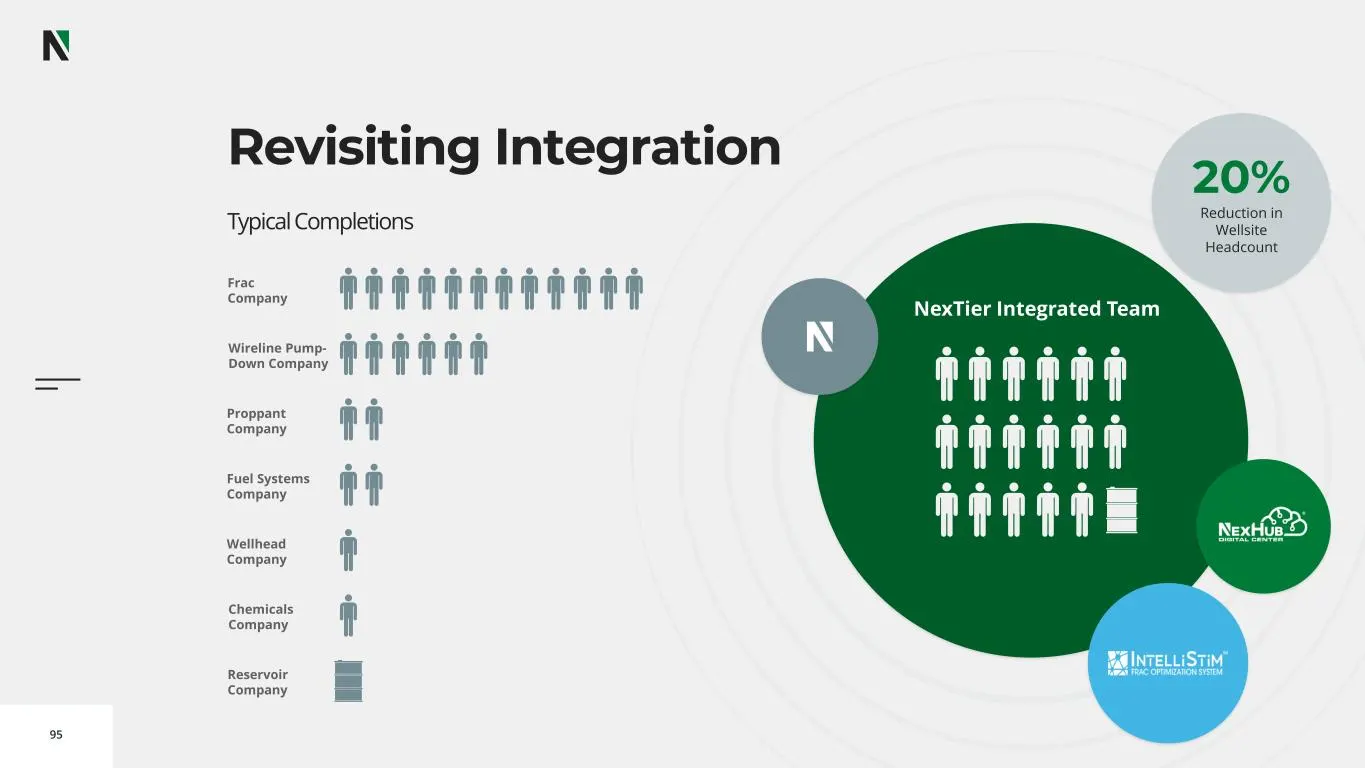
95 Revisiting Integration 20% Reduction in Wellsite Headcount Typical Completions NexTier Integrated Team
Slide 96: Performance and Technology
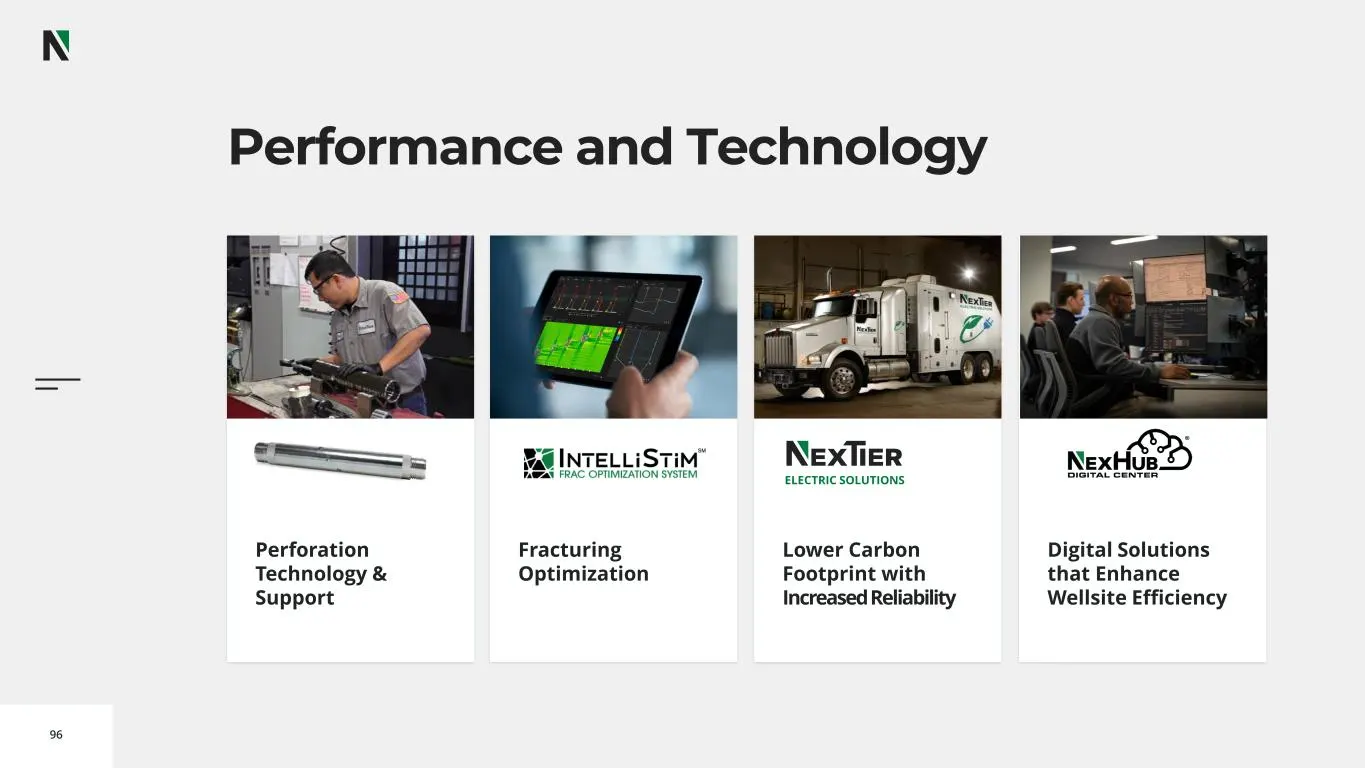
96 Perforation Technology & Support Digital Solutions that Enhance Wellsite Efficiency Performance and Technology Fracturing Optimization Lower Carbon Footprint with Increased Reliability ELECTRIC SOLUTIONS
Slide 97: Enhancing Frac Efficiency
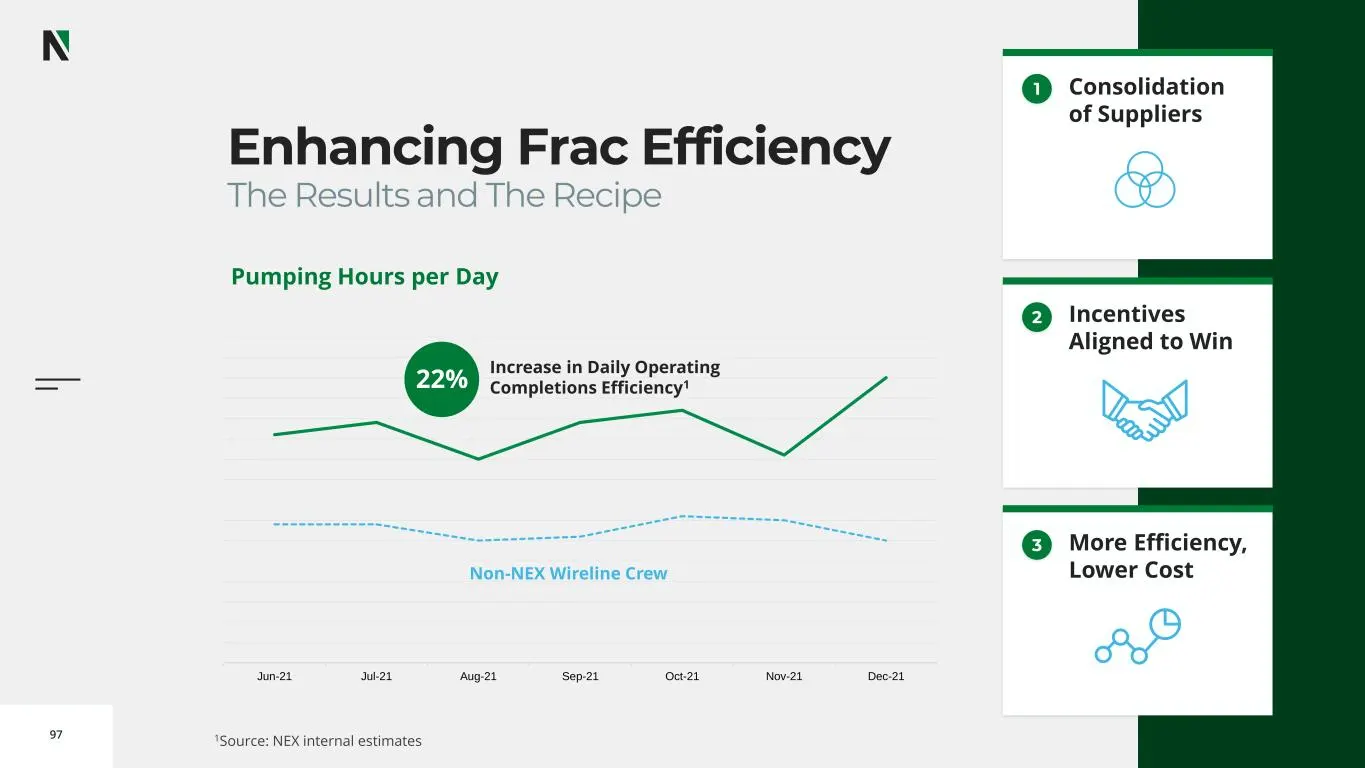
97 Enhancing Frac Efficiency Jun-21 Jul-21 Aug-21 Sep-21 Oct-21 Nov-21 Dec-21 Increase in Daily Operating Completions Efficiency122% 1 2 3 Pumping Hours per Day Consolidation of Suppliers Incentives Aligned to Win More Efficiency, Lower CostNon-NEX Wireline Crew The Results and The Recipe 1Source: N
Slide 98: Integrated Completions Value Potential
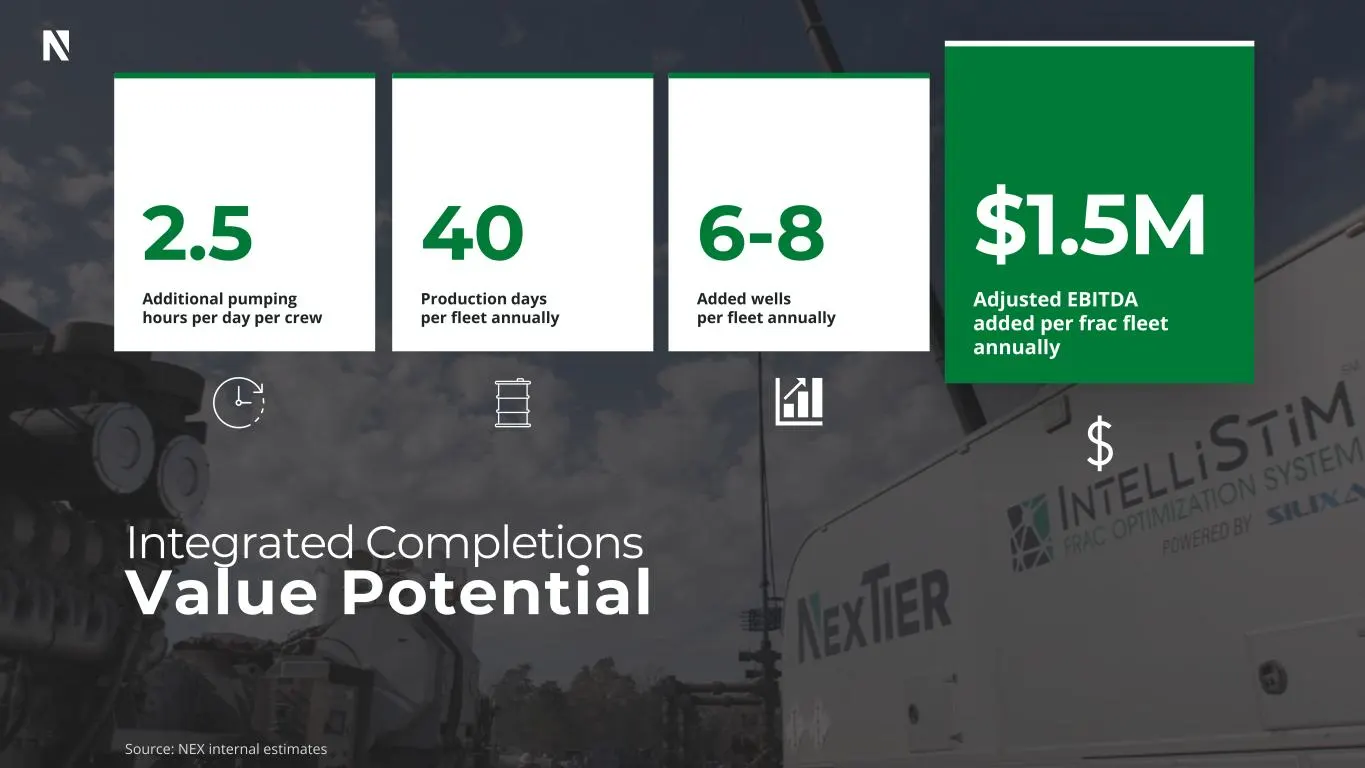
Integrated Completions Value Potential $1.5M Adjusted EBITDA added per frac fleet annually 2.5 Additional pumping hours per day per crew 40 Production days per fleet annually 6-8 Added wells per fleet annually Source: NEX internal estimates
Slide 99: Elevate Value: Integrated Wireline Service
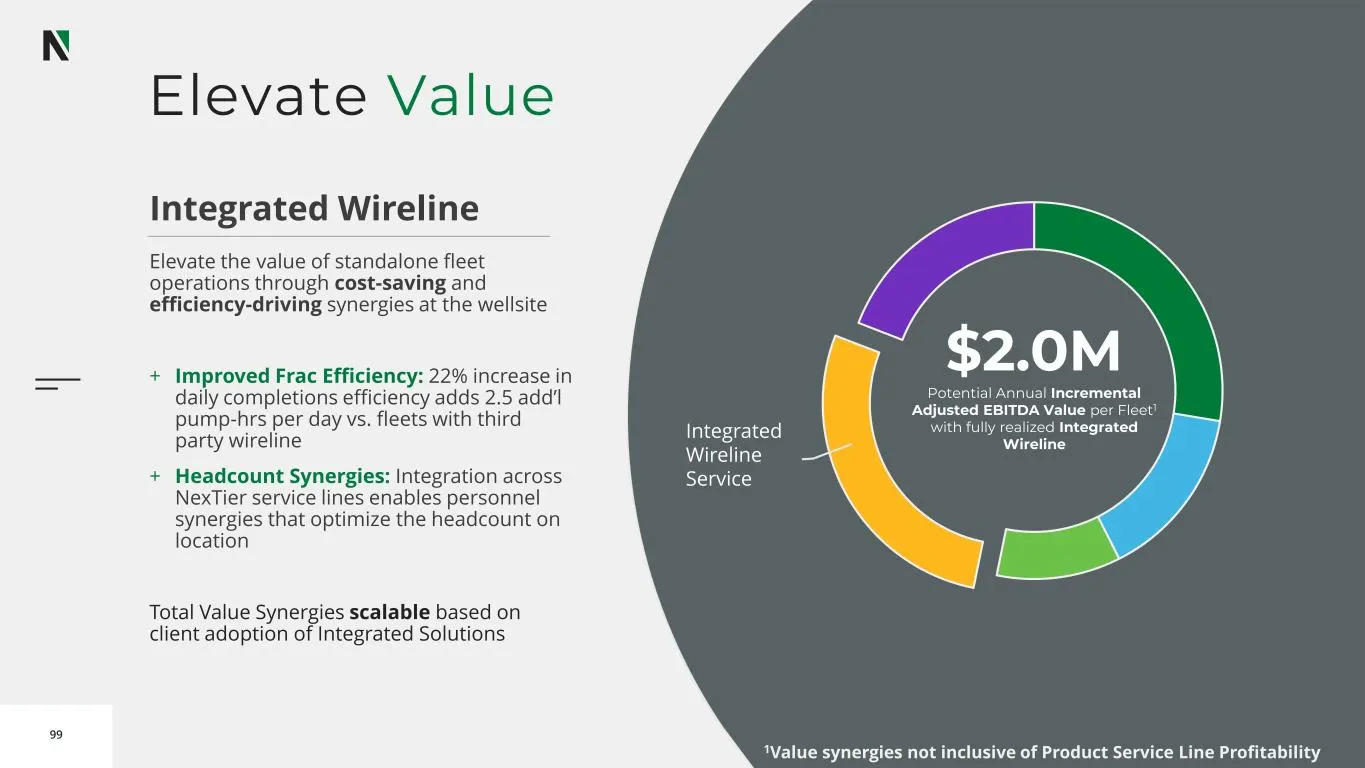
99 Elevate Value Integrated Wireline Service Integrated Wireline Elevate the value of standalone fleet operations through cost-saving and efficiency-driving synergies at the wellsite + Improved Frac Efficiency: 22% increase in daily completions efficiency adds 2.5 add’l pump-hrs per day vs. fleets w
Slide 100: Subsurface Engineering & Technology
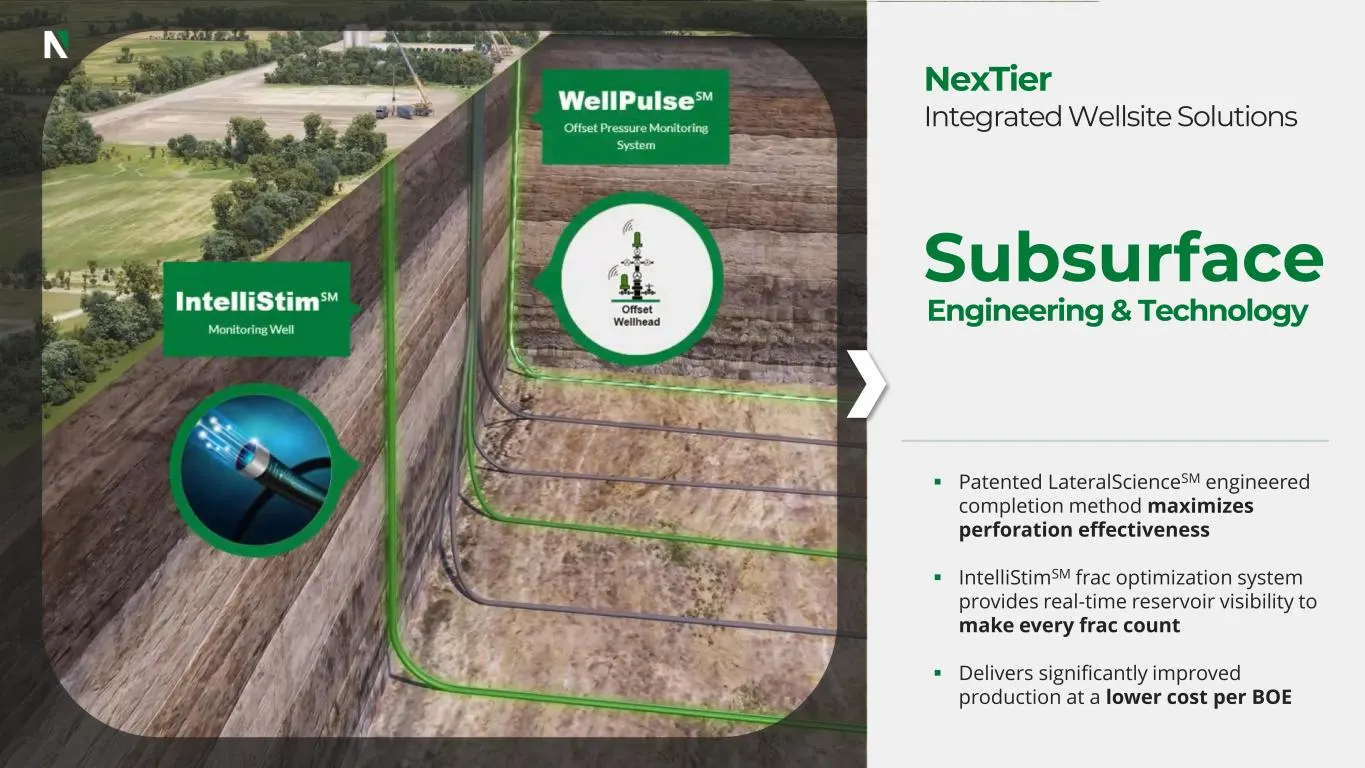
Subsurface Engineering & Technology ▪ Patented LateralScienceSM engineered completion method maximizes perforation effectiveness ▪ IntelliStimSM frac optimization system provides real-time reservoir visibility to make every frac count ▪ Delivers significantly improved production at a lower cost per
Slide 101: Reservoir Unlocked
vo o d o o 101 Reservoir Unlocked Otman Algadi, Director of Engineering Engineered Solutions to Elevate Performance in US Shale
Slide 102: Using Technology to Add Value and Reduce Cost per BOE
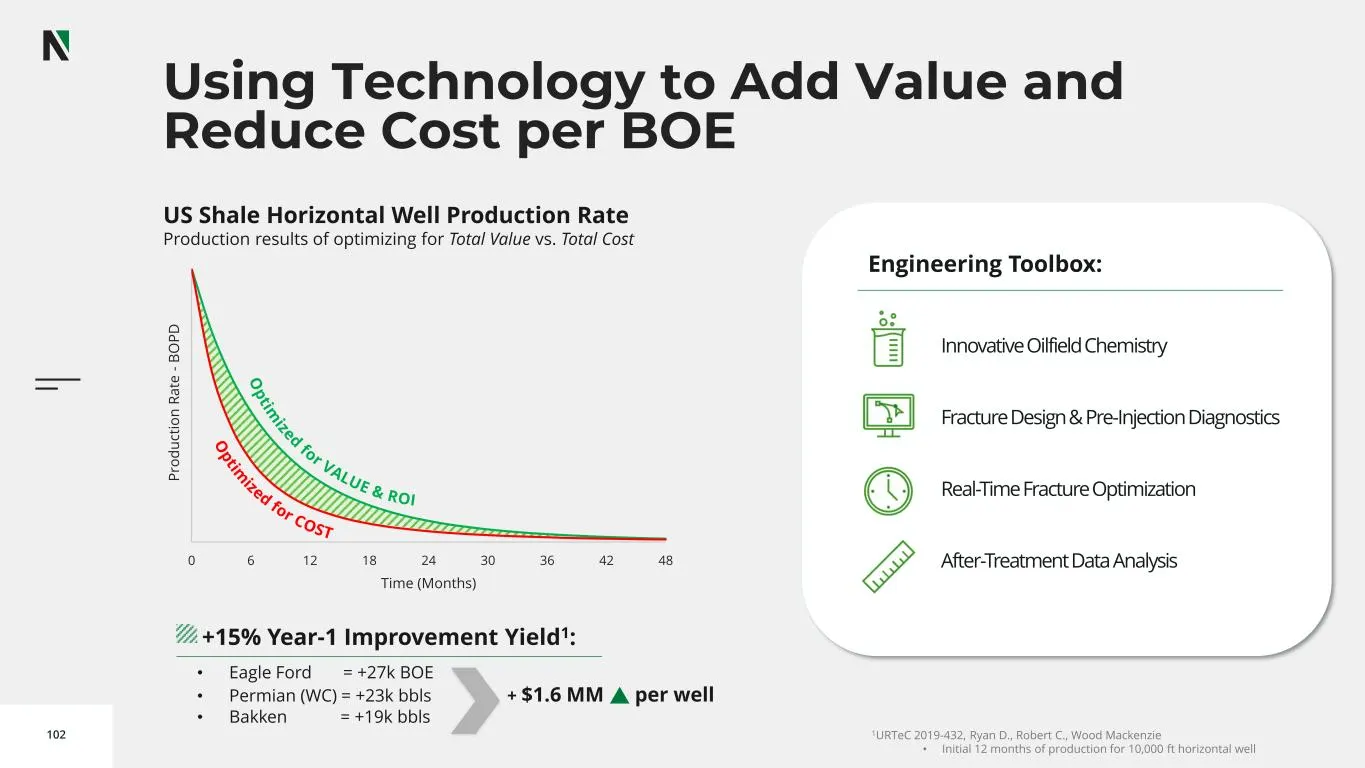
102 Using Technology to Add Value and Reduce Cost per BOE 0 100 200 300 400 500 600 700 800 900 1000 0 6 12 18 24 30 36 42 48 P ro d u ct io n R a te - B O P D Time (Months) Innovative Oilfield Chemistry Fracture Design & Pre-Injection Diagnostics Real-Time Fracture Optimization After-Treatment Data
Slide 103: Chemistry Innovation
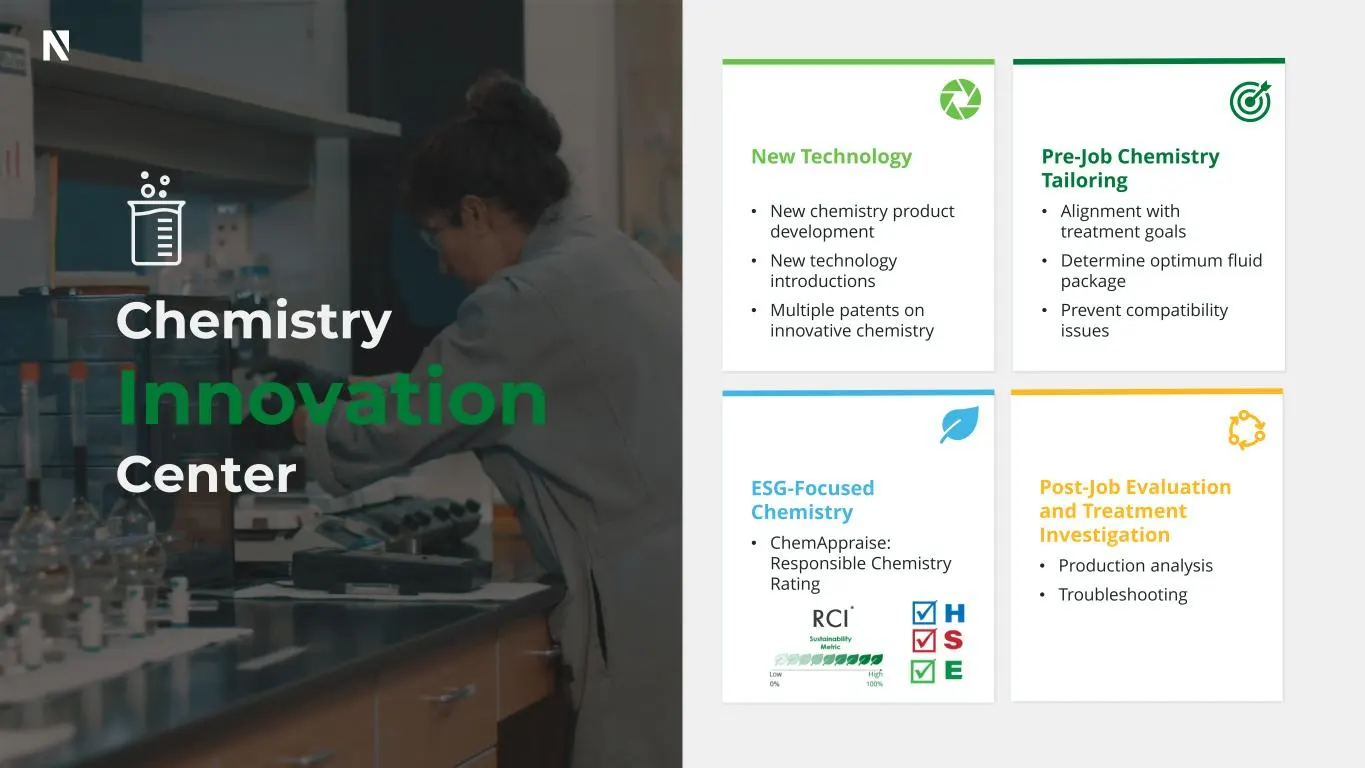
New Technology • New chemistry product development • New technology introductions • Multiple patents on innovative chemistry Pre-Job Chemistry Tailoring • Alignment with treatment goals • Determine optimum fluid package • Prevent compatibility issues Post-Job Evaluation and Treatment Investigation •
Slide 104: Tailored Chemistry Frac Fluid Optimization
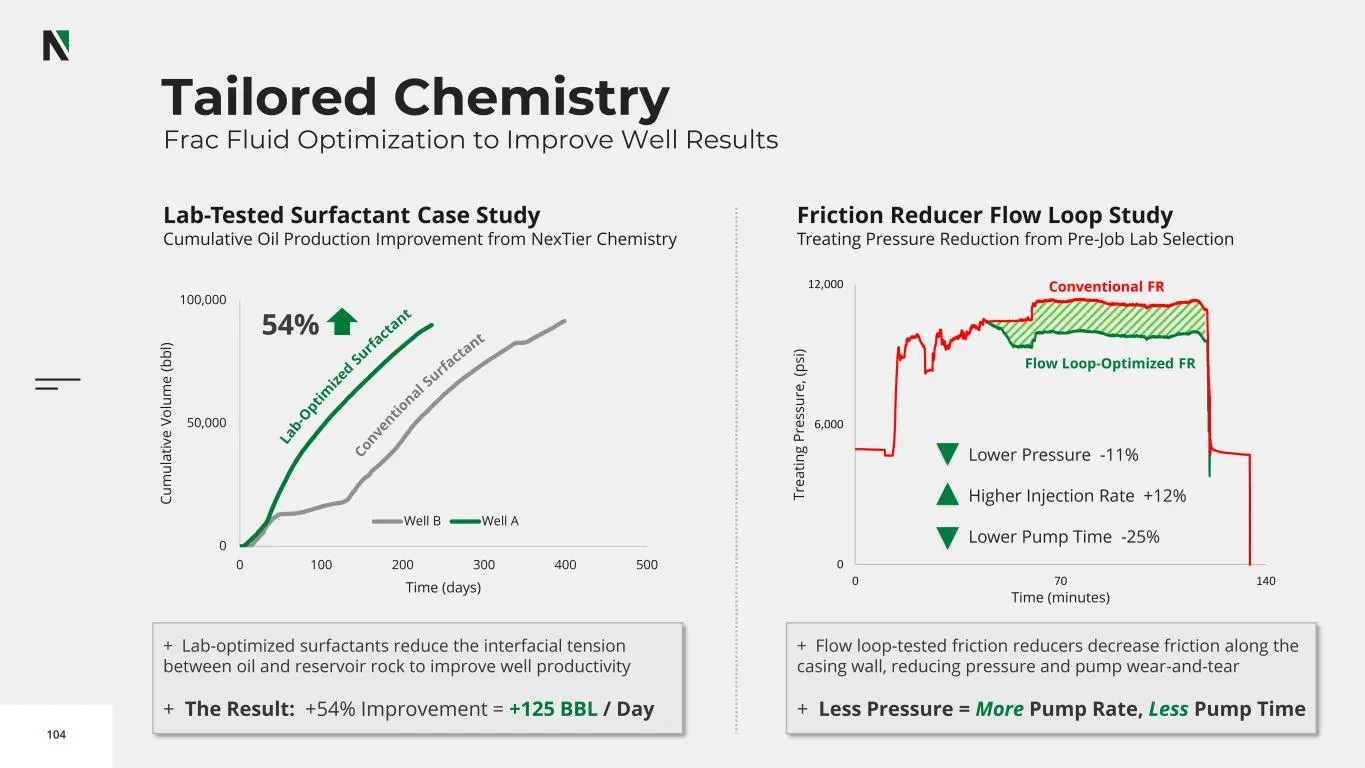
104 Tailored Chemistry Frac Fluid Optimization to Improve Well Results 0 50,000 100,000 0 100 200 300 400 500 C u m u la ti v e V o lu m e ( b b l) Time (days) Well B Well A Lab-Tested Surfactant Case Study Cumulative Oil Production Improvement from NexTier Chemistry 54% + Lab-optimized surfactants
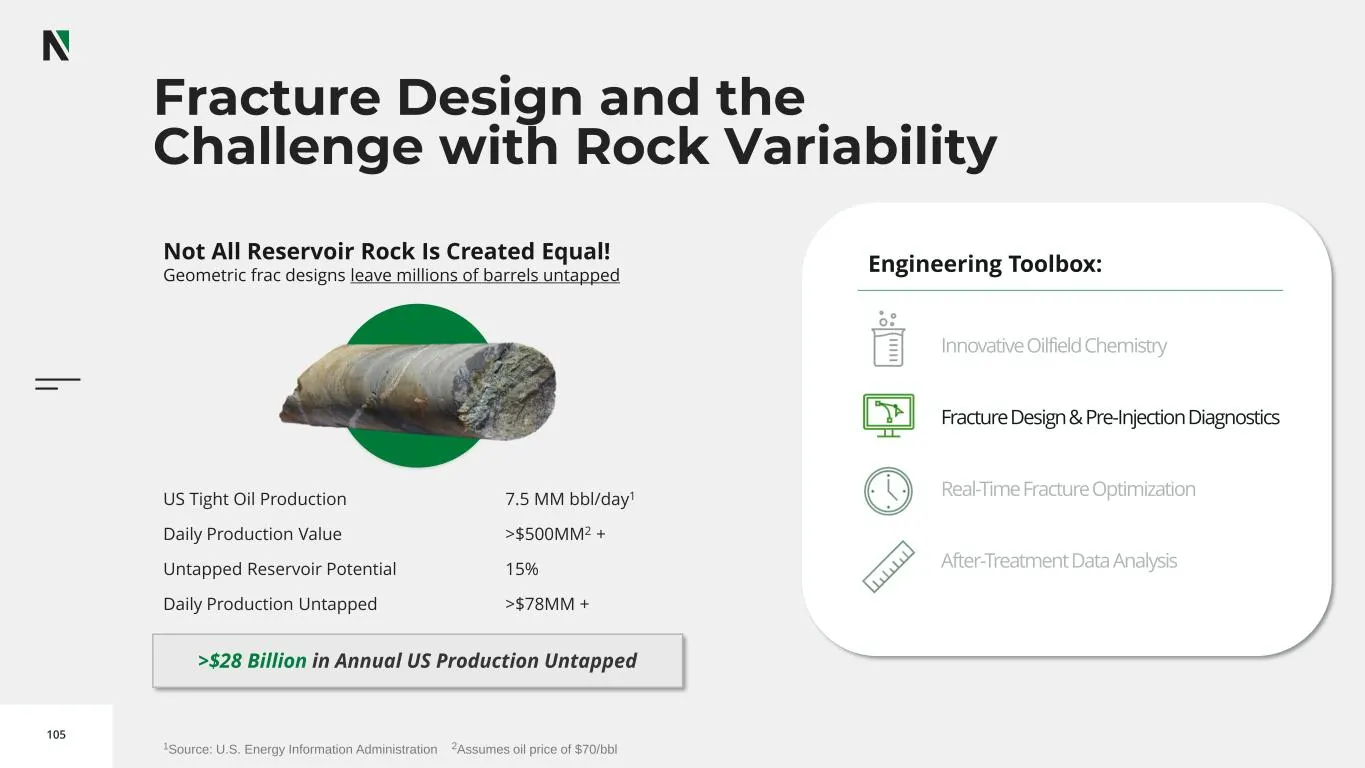
Slide 105: Fracture Design and the Challenge with Rock Variability
105 1Source: U.S. Energy Information Administration 2Assumes oil price of $70/bbl Innovative Oilfield Chemistry Fracture Design & Pre-Injection Diagnostics Real-Time Fracture Optimization After-Treatment Data Analysis Engineering Toolbox: >$28 Billion in Annual US Production Untapped US Tight Oil Pr
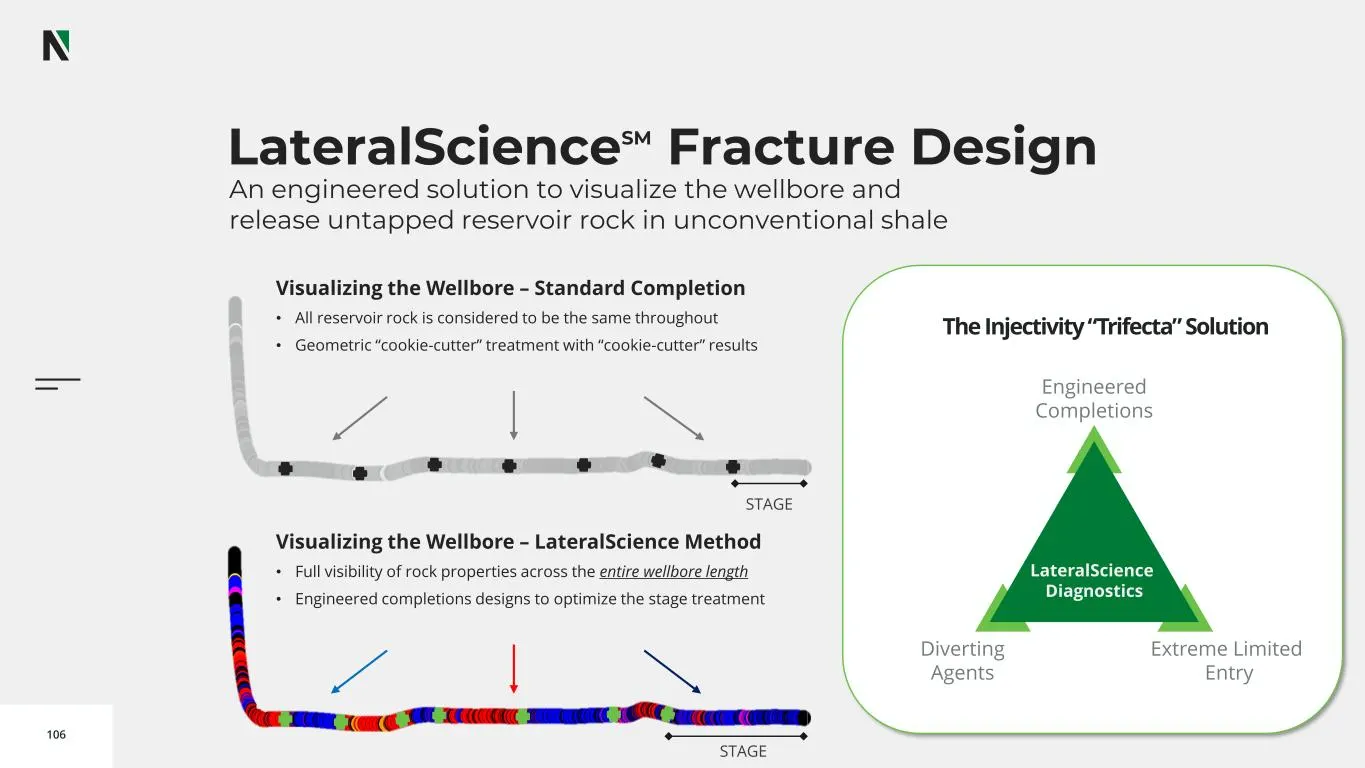
Slide 106: LateralScience Fracture Design
106 LateralScienceSM Fracture Design An engineered solution to visualize the wellbore and release untapped reservoir rock in unconventional shale Diverting Agents Extreme Limited Entry Engineered Completions LateralScience Diagnostics The Injectivity “Trifecta” Solution Visualizing the Wellbore – St
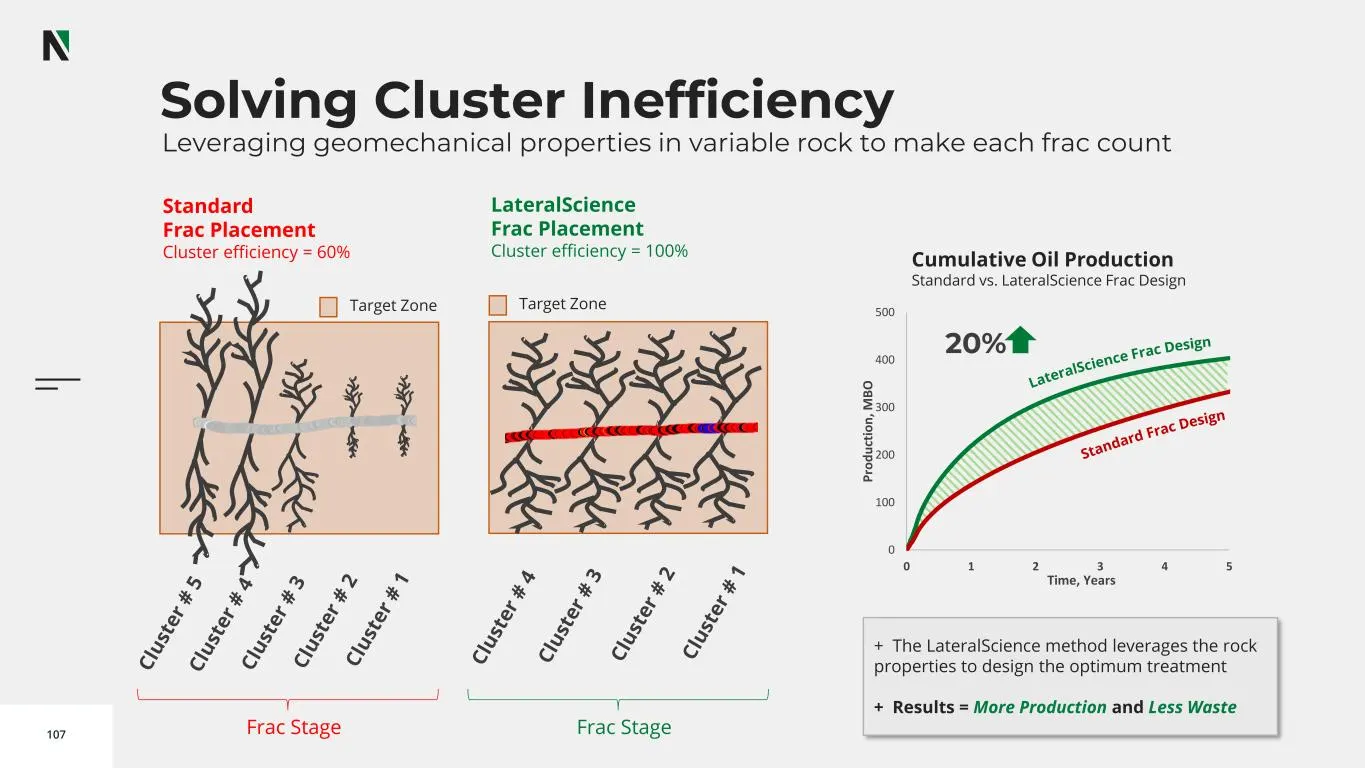
Slide 107: Solving Cluster Inefficiency
107 0 100 200 300 400 500 0 1 2 3 4 5 P ro d u ct io n , M B O Time, Years Solving Cluster Inefficiency Leveraging geomechanical properties in variable rock to make each frac count Cumulative Oil Production Standard vs. LateralScience Frac Design + The LateralScience method leverages the rock proper
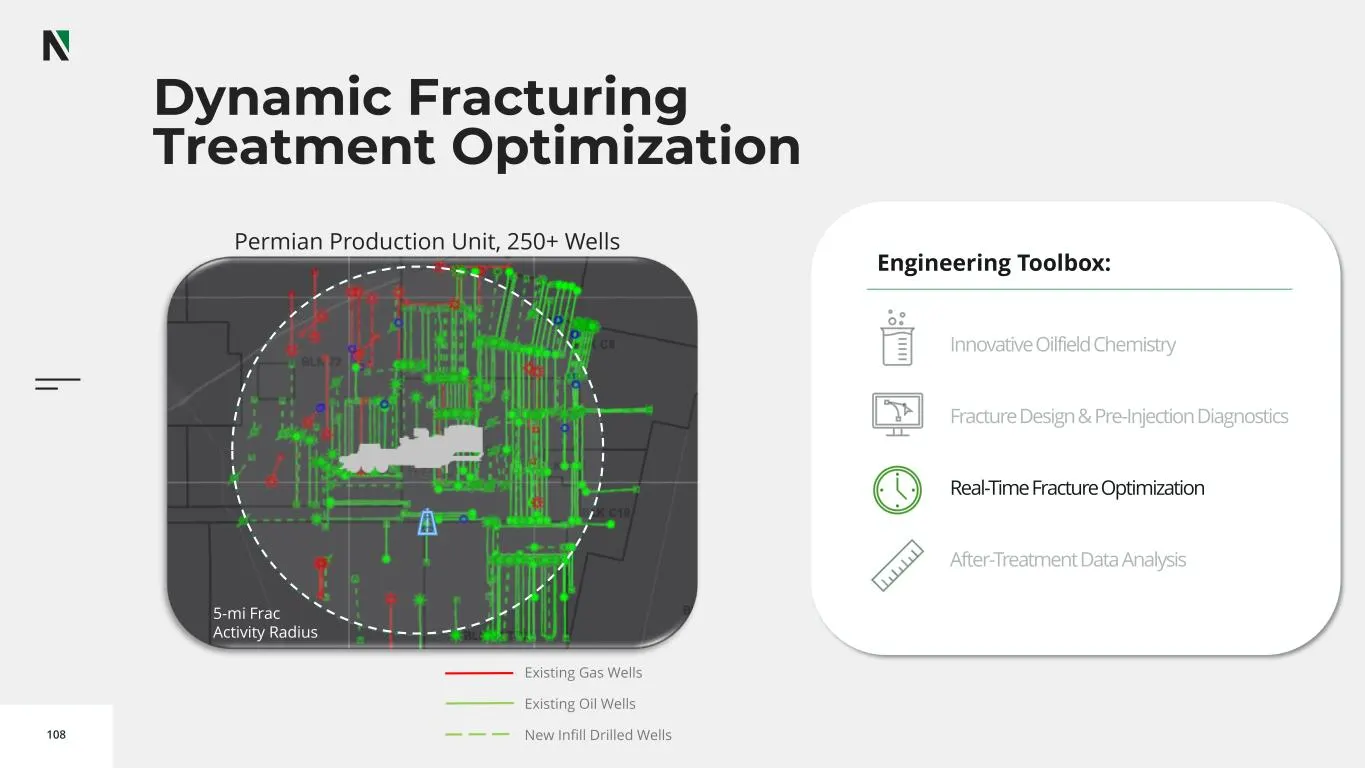
Slide 108: Dynamic Fracturing Treatment Optimization
108 Dynamic Fracturing Treatment Optimization Innovative Oilfield Chemistry Fracture Design & Pre-Injection Diagnostics Real-Time Fracture Optimization After-Treatment Data Analysis Engineering Toolbox: Permian Production Unit, 250+ Wells Existing Gas Wells Existing Oil Wells New Infill Drilled Well
Slide 109: IntelliStim Frac Optimization System
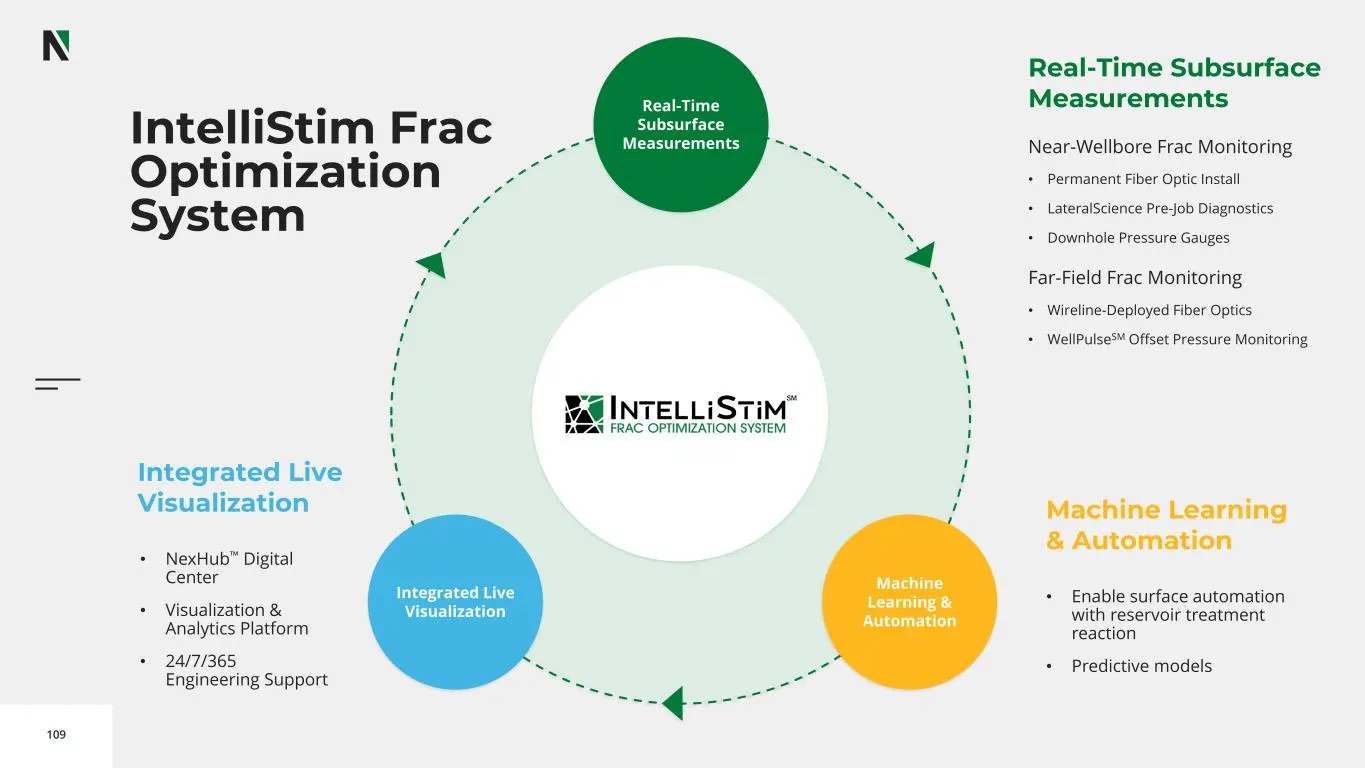
109 Integrated Live Visualization Machine Learning & Automation Real-Time Subsurface Measurements Real-Time Subsurface Measurements Near-Wellbore Frac Monitoring • Permanent Fiber Optic Install • LateralScience Pre-Job Diagnostics • Downhole Pressure Gauges Far-Field Frac Monitoring • Wireline-Deplo
Slide 110: IntelliStim
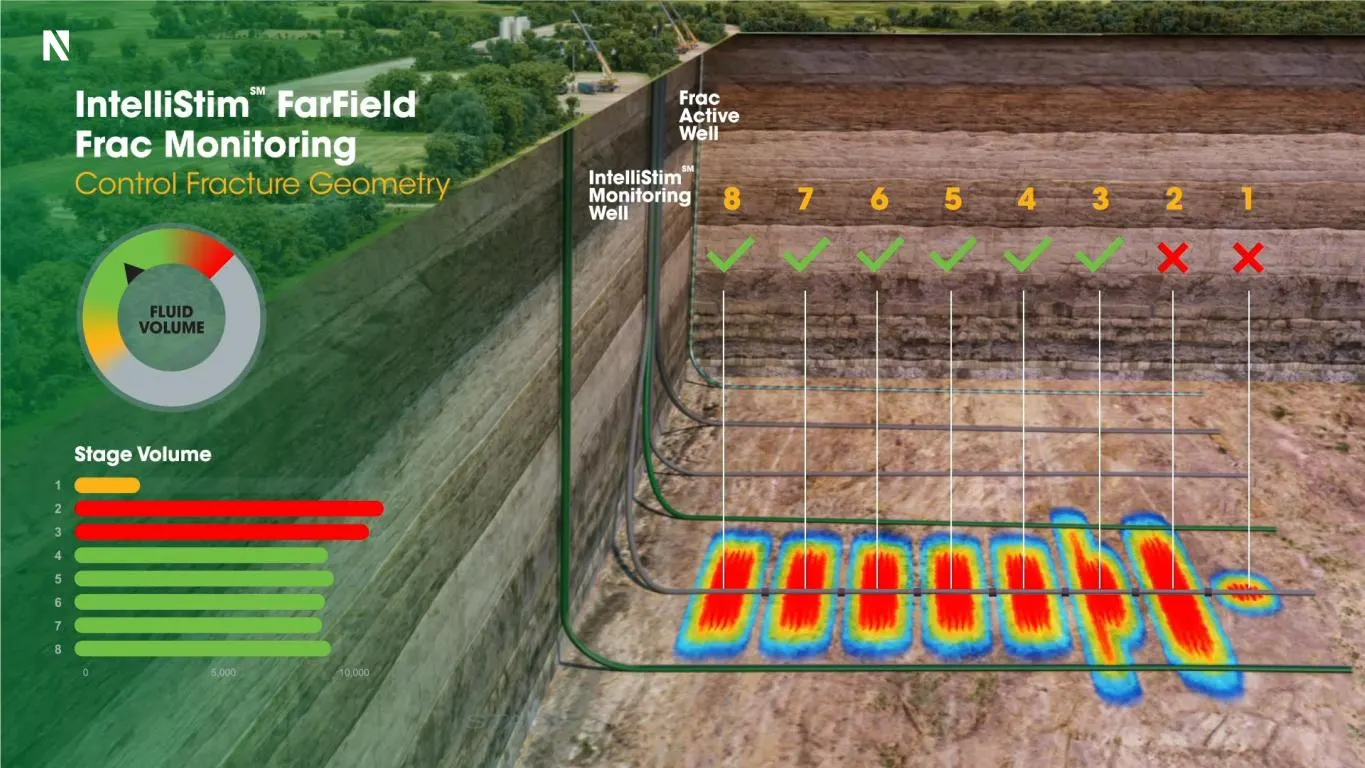
N Slat 8 UES. IntelliStim Id. EOS get atid
Slide 111: The Journey to Automation
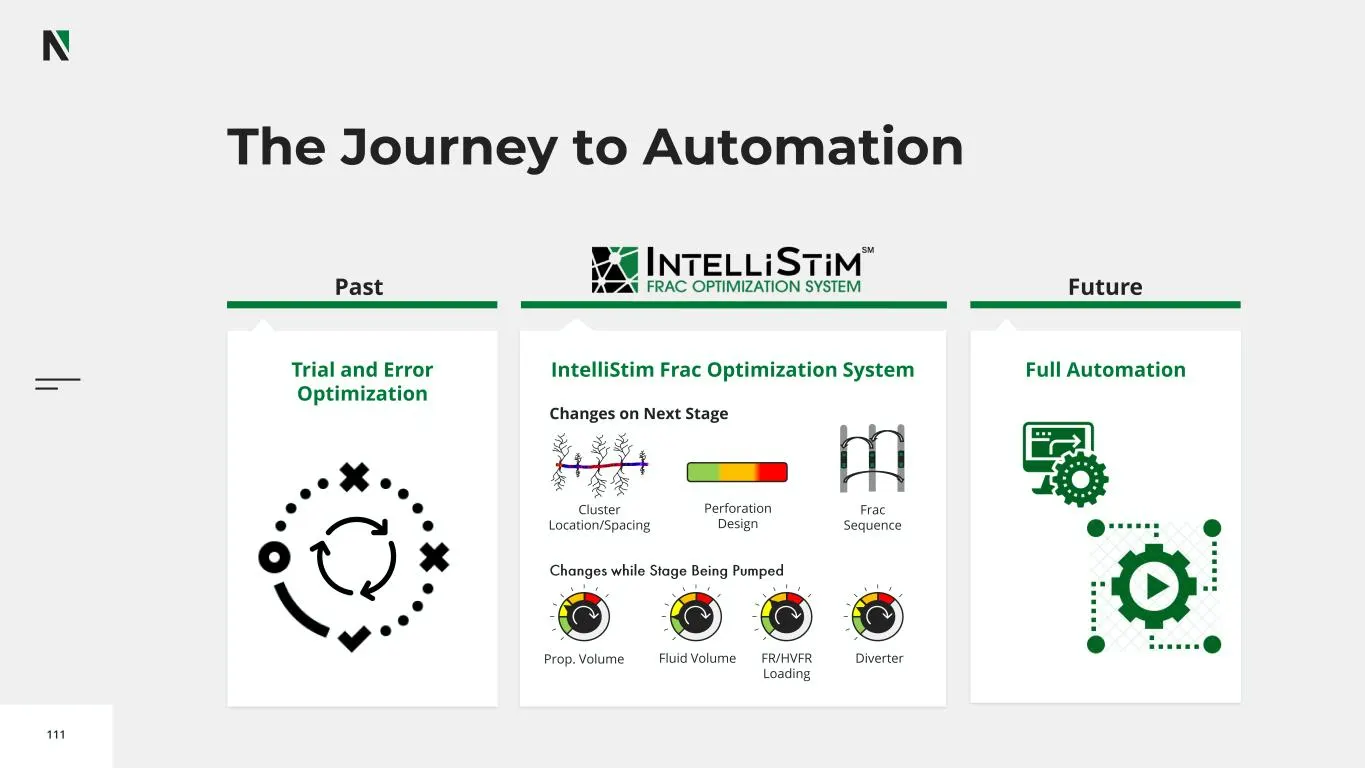
111 The Journey to Automation Past Future IntelliStim Frac Optimization System Full AutomationTrial and Error Optimization Changes on Next Stage Cluster Location/Spacing Perforation Design Frac Sequence Prop. Volume Fluid Volume FR/HVFR Loading Diverter
Slide 112: Elevate Value: Innovative Engineering
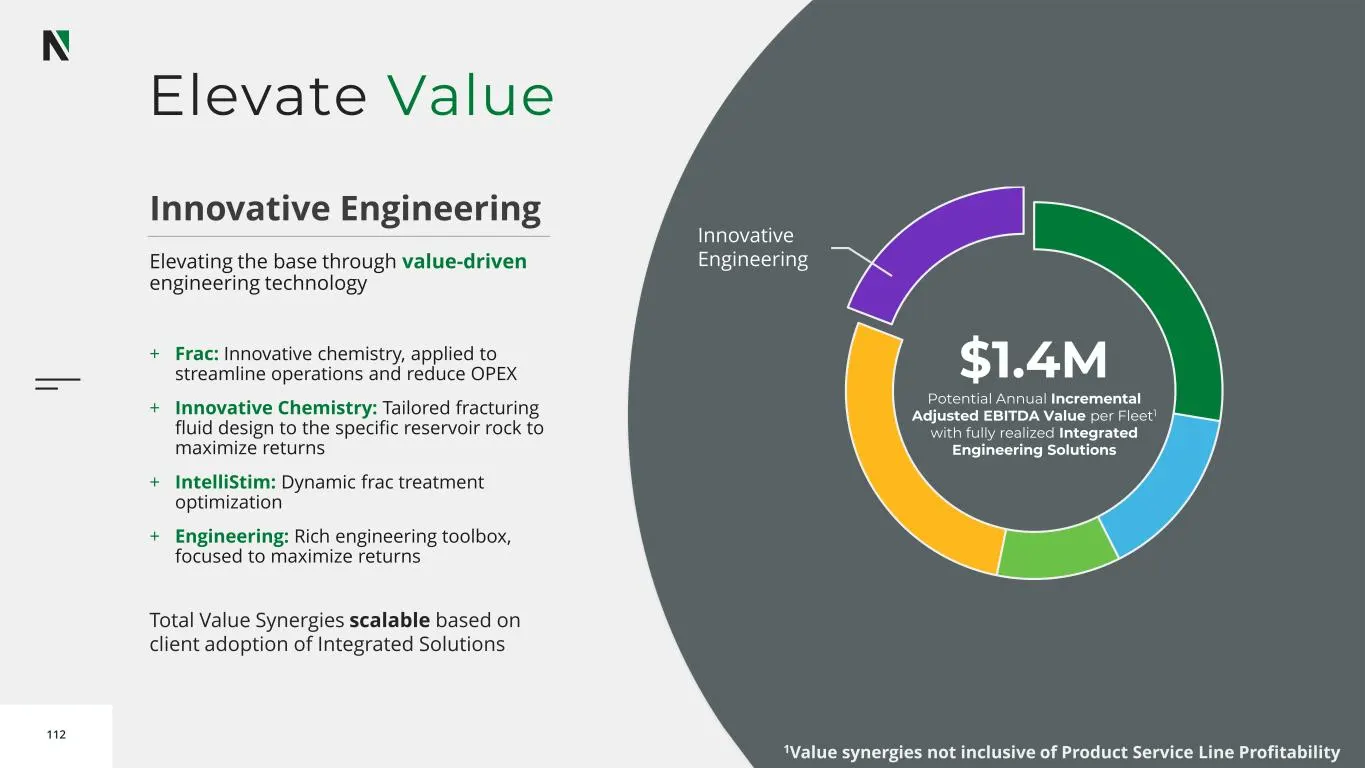
112 Elevate Value Innovative Engineering $1.4M Potential Annual Incremental Adjusted EBITDA Value per Fleet1 with fully realized Integrated Engineering Solutions Innovative Engineering Elevating the base through value-driven engineering technology + Frac: Innovative chemistry, applied to streamline
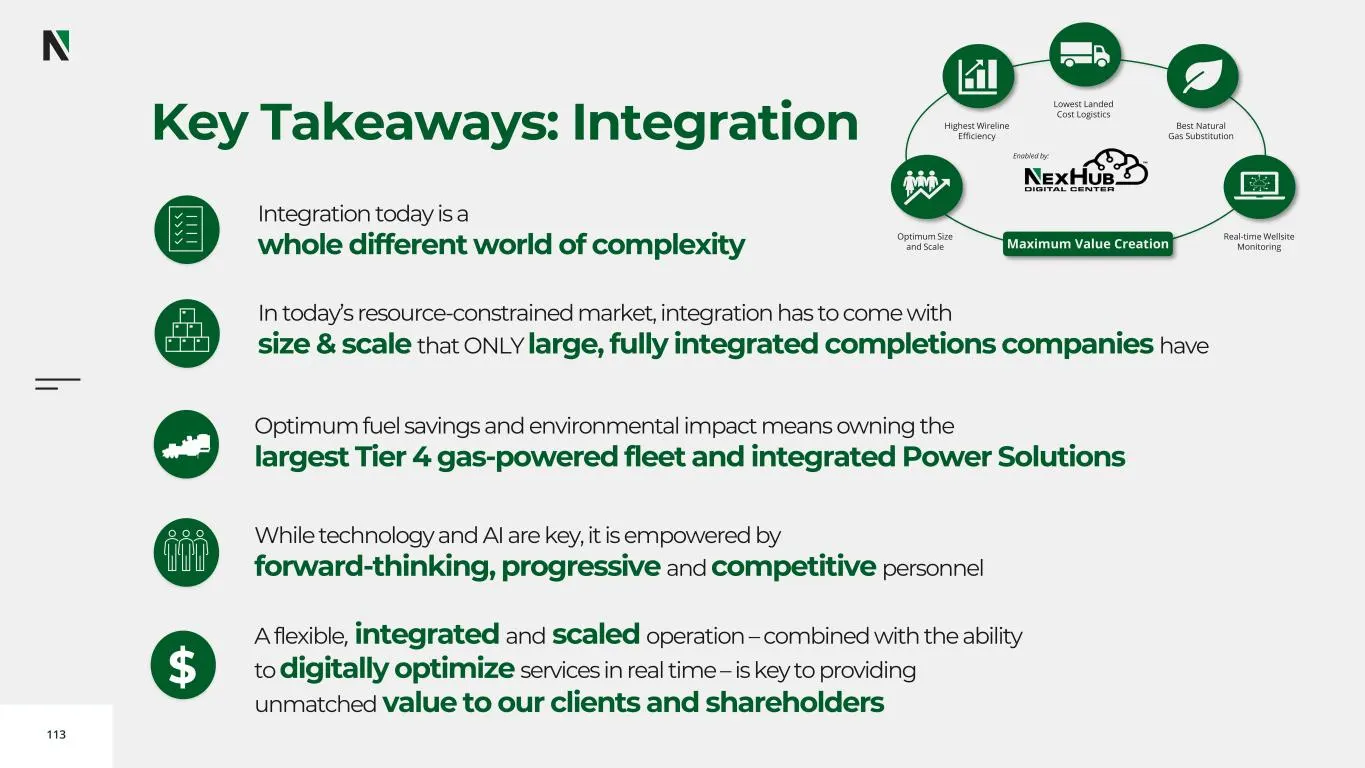
Slide 113: Key Takeaways: Integration
113 Integration today is a whole different world of complexity In today’s resource-constrained market, integration has to come with size & scale that ONLY large, fully integrated completions companies have A flexible, integrated and scaled operation – combined with the ability to digitally optimize
Slide 114: The NexTier Advantage
vo o d o o 114 The NexTier Advantage Tommy Balez, SVP, Sales & Marketing Unlocking Value for Our Customers
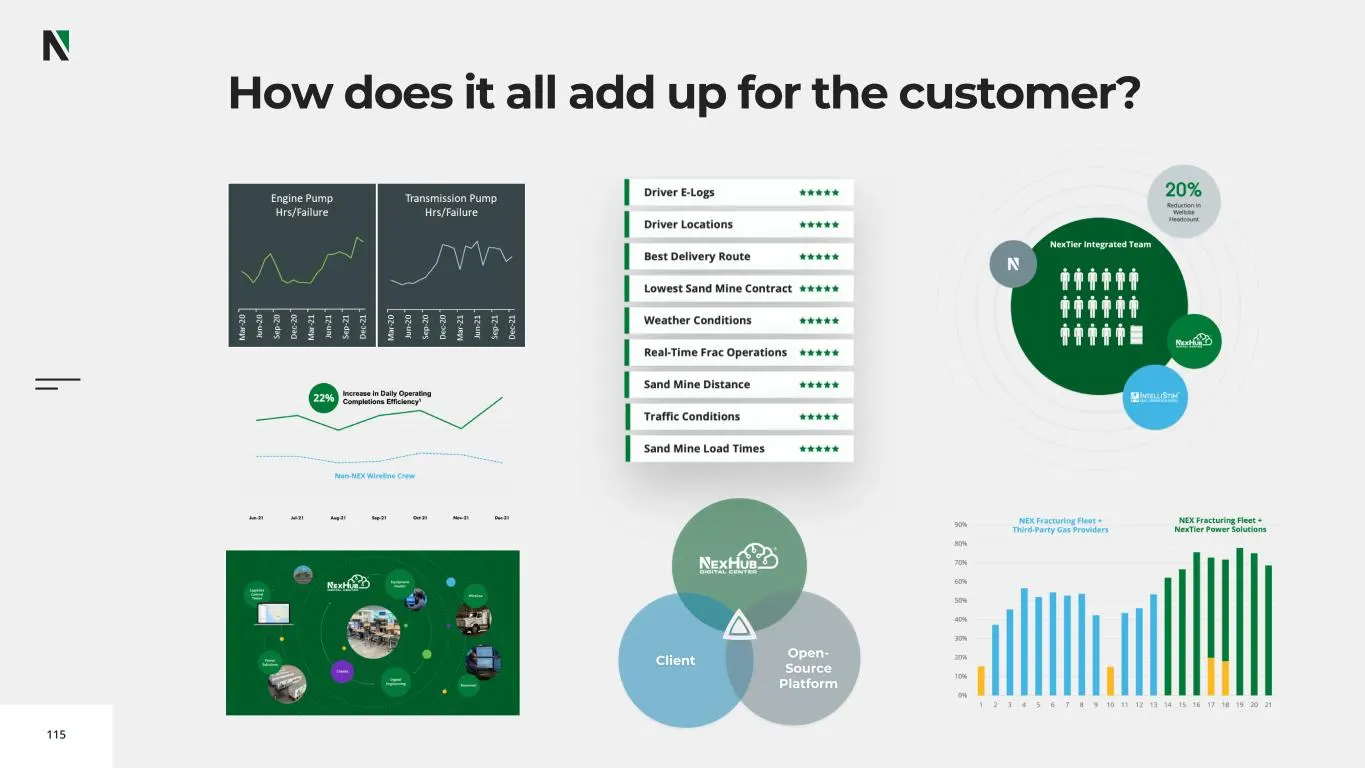
Slide 115: How does it all add up for the customer?
115 How does it all add up for the customer? Client Open- Source Platform
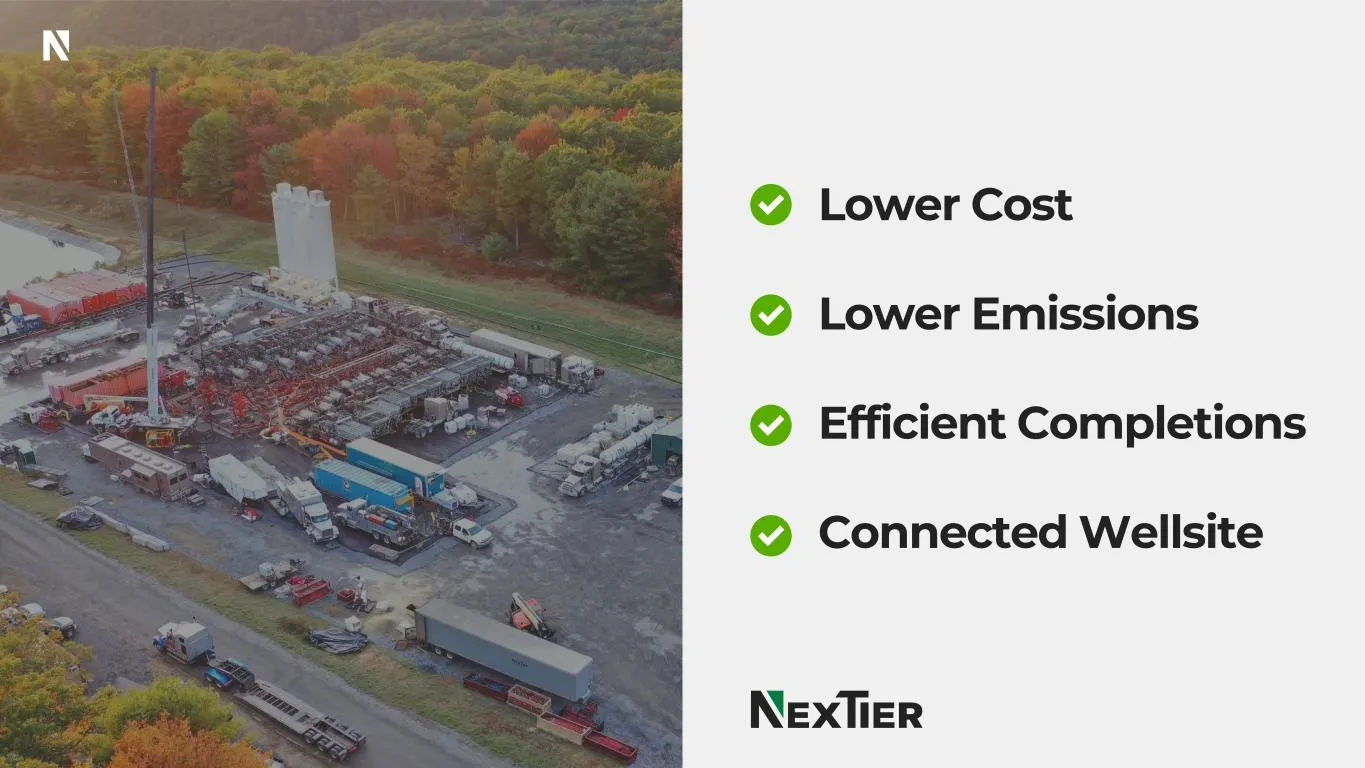
Slide 116: Lower Cost, Lower Emissions, Efficient Completions
116 Lower Cost Lower Emissions Efficient Completions Connected Wellsite
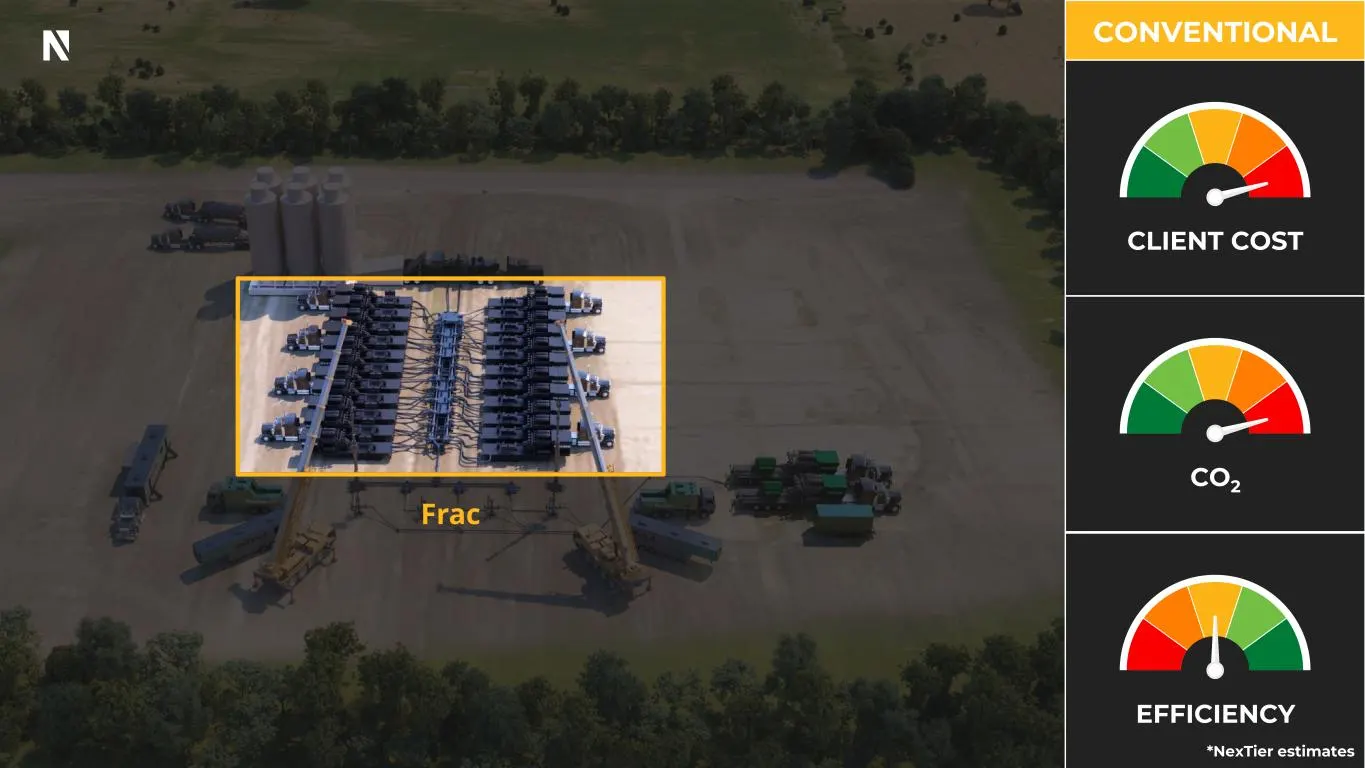
Slide 117: Frac: Client Cost, Efficiency and CO2
117 Frac CONVENTIONAL CO2 CLIENT COST EFFICIENCY *NexTier estimates
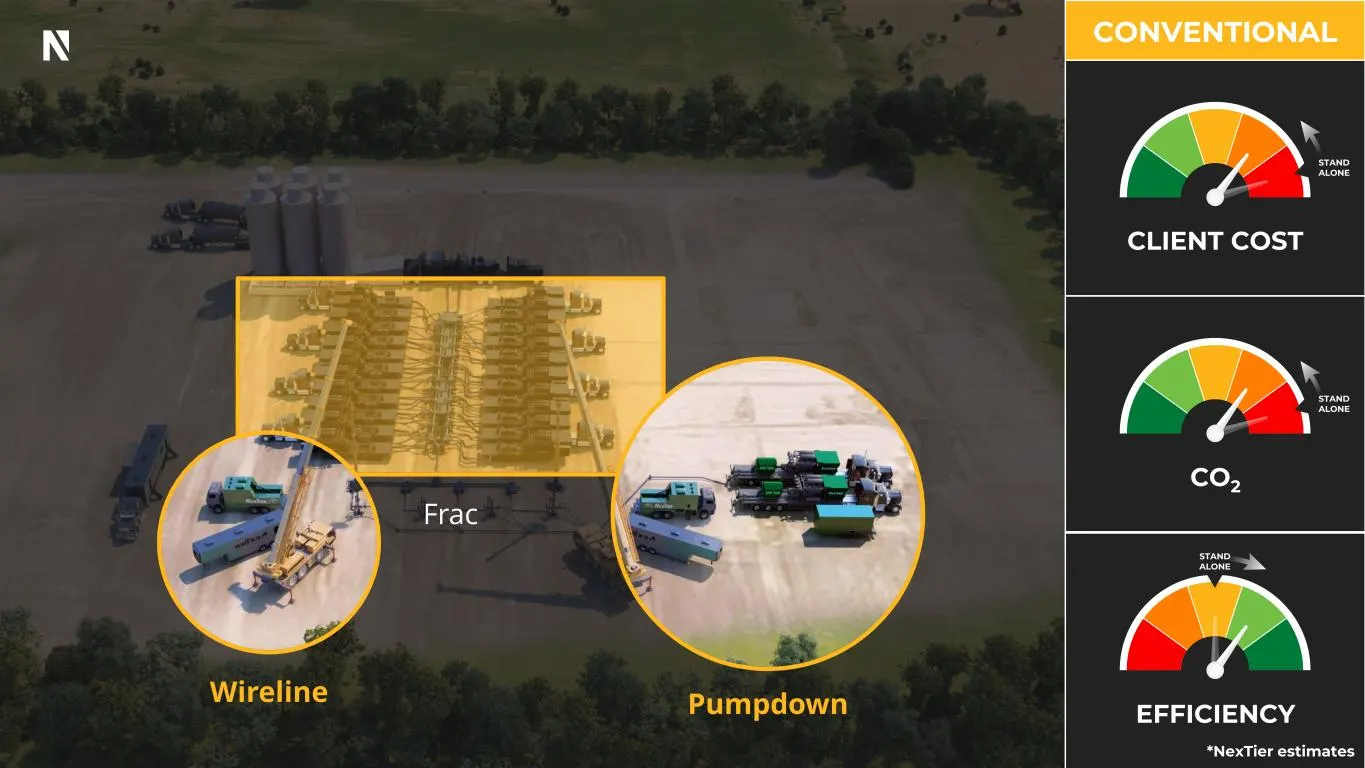
Slide 118: Wireline, Pumpdown and Frac: Client Value
118 Wireline Pumpdown Frac CO2 STAND ALONE STAND ALONE EFFICIENCY STAND ALONE CONVENTIONAL CLIENT COST *NexTier estimates
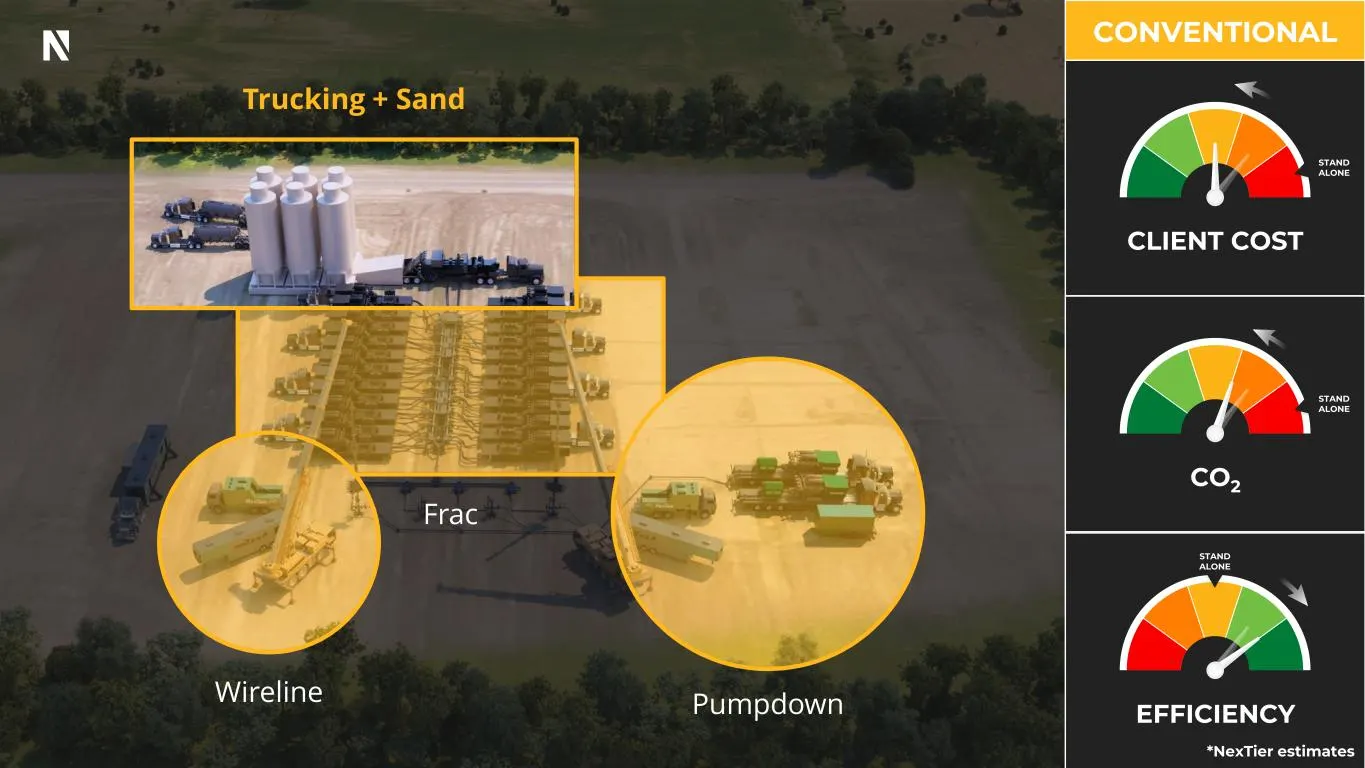
Slide 119: Adding Trucking and Sand
119 Wireline Pumpdown Trucking + Sand Frac CO2 STAND ALONE STAND ALONE EFFICIENCY STAND ALONE CONVENTIONAL CLIENT COST *NexTier estimates
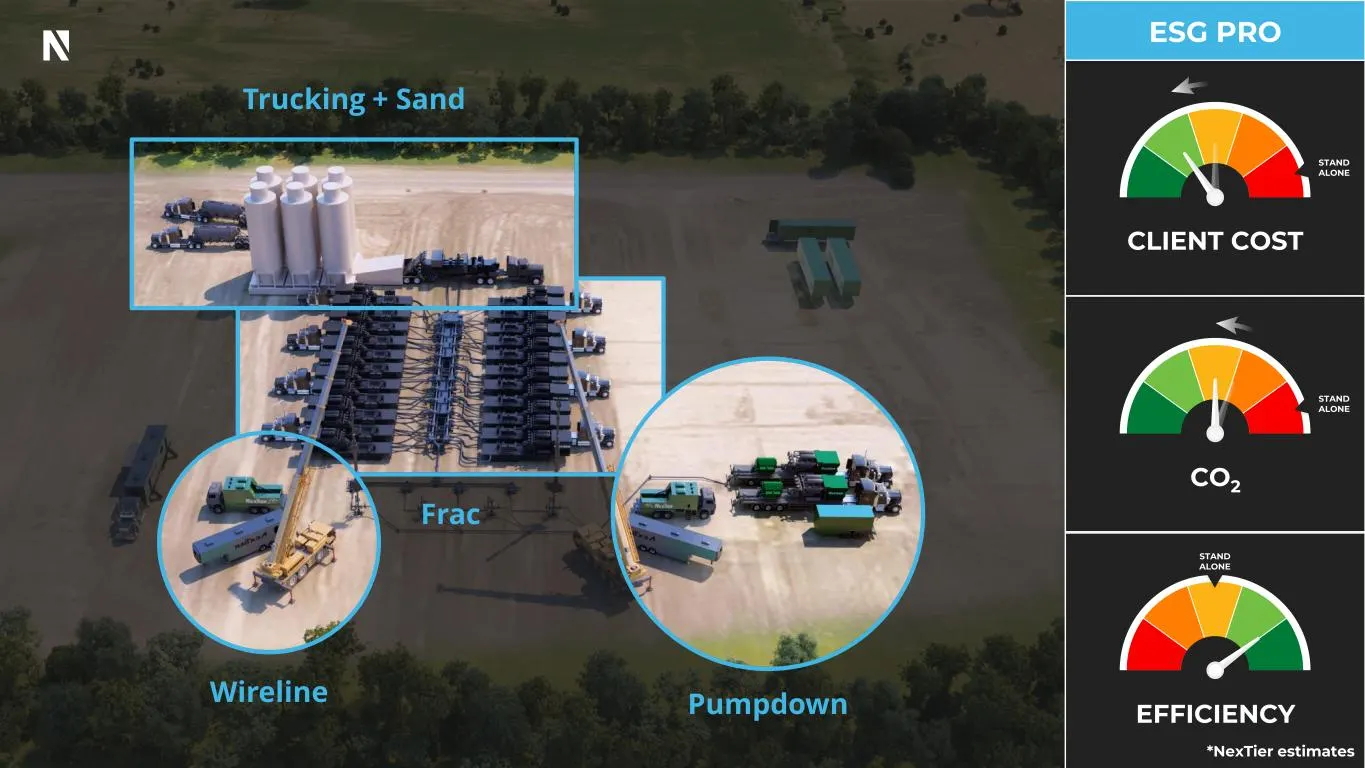
Slide 120: ESG Pro
120 Wireline Pumpdown Trucking + Sand Frac CO2 STAND ALONE STAND ALONE EFFICIENCY STAND ALONE ESG PRO CLIENT COST *NexTier estimates
Slide 121: ESG Platinum
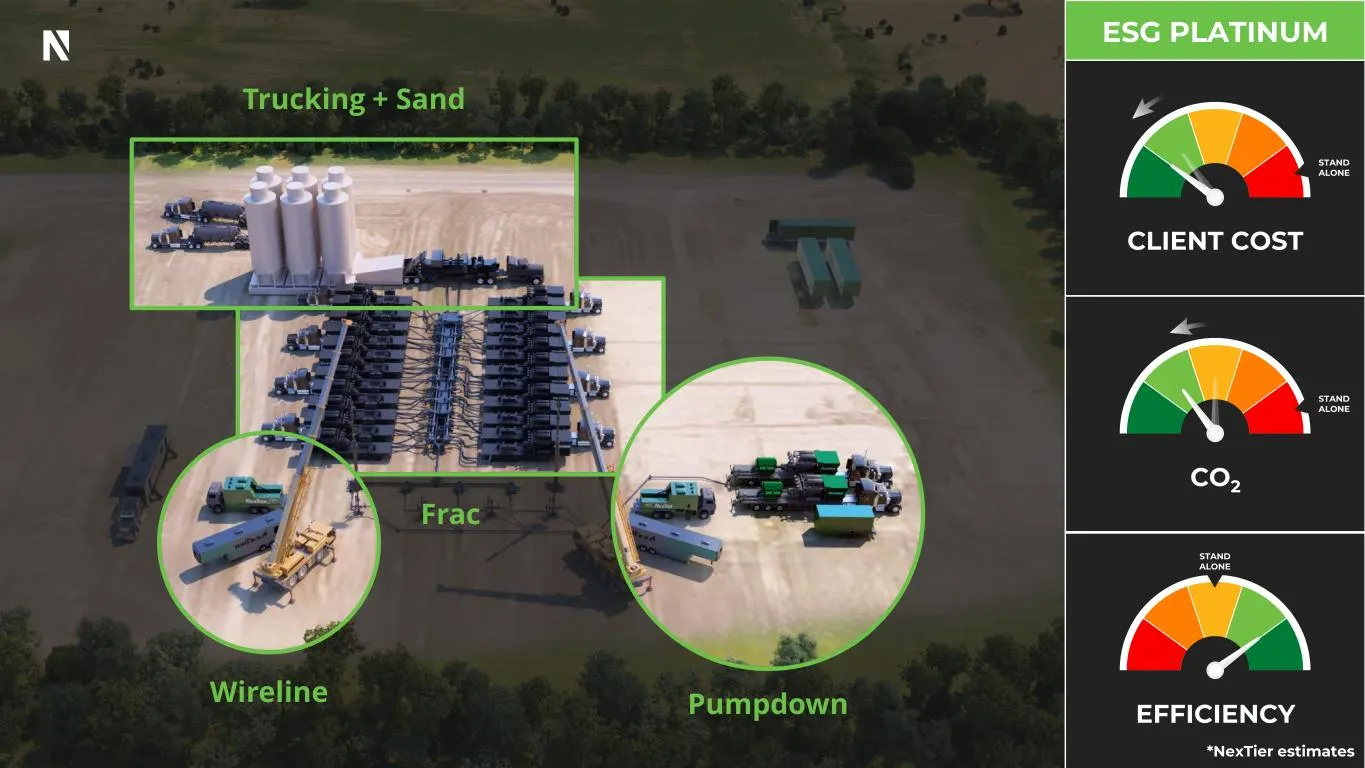
121 Wireline Pumpdown Trucking + Sand Frac CO2 STAND ALONE STAND ALONE ESG PLATINUM EFFICIENCY STAND ALONE CLIENT COST *NexTier estimates
Slide 122: Adding Power Solutions
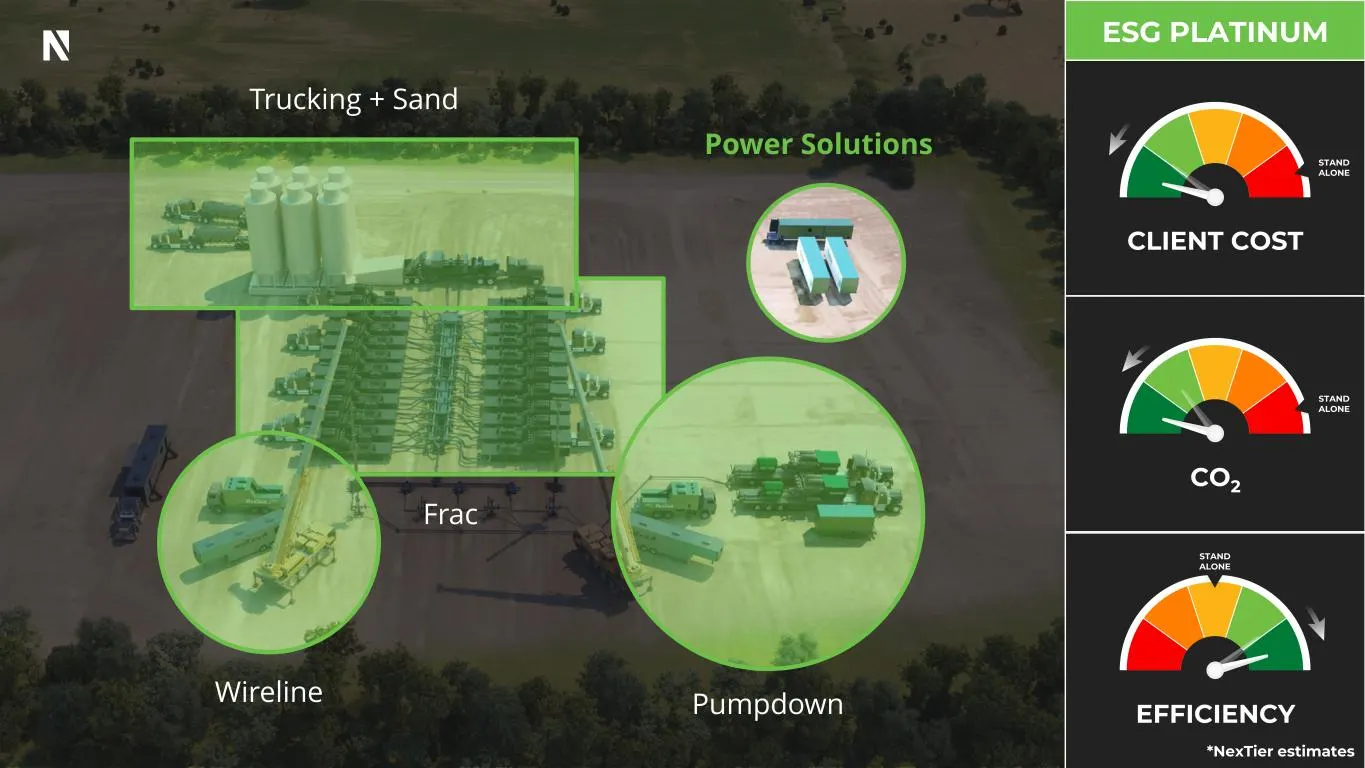
122 Wireline Pumpdown Trucking + Sand Frac EFFICIENCY STAND ALONE CO2 STAND ALONE STAND ALONE ESG PLATINUM CLIENT COST Power Solutions *NexTier estimates
Slide 123: NexTier Advantage
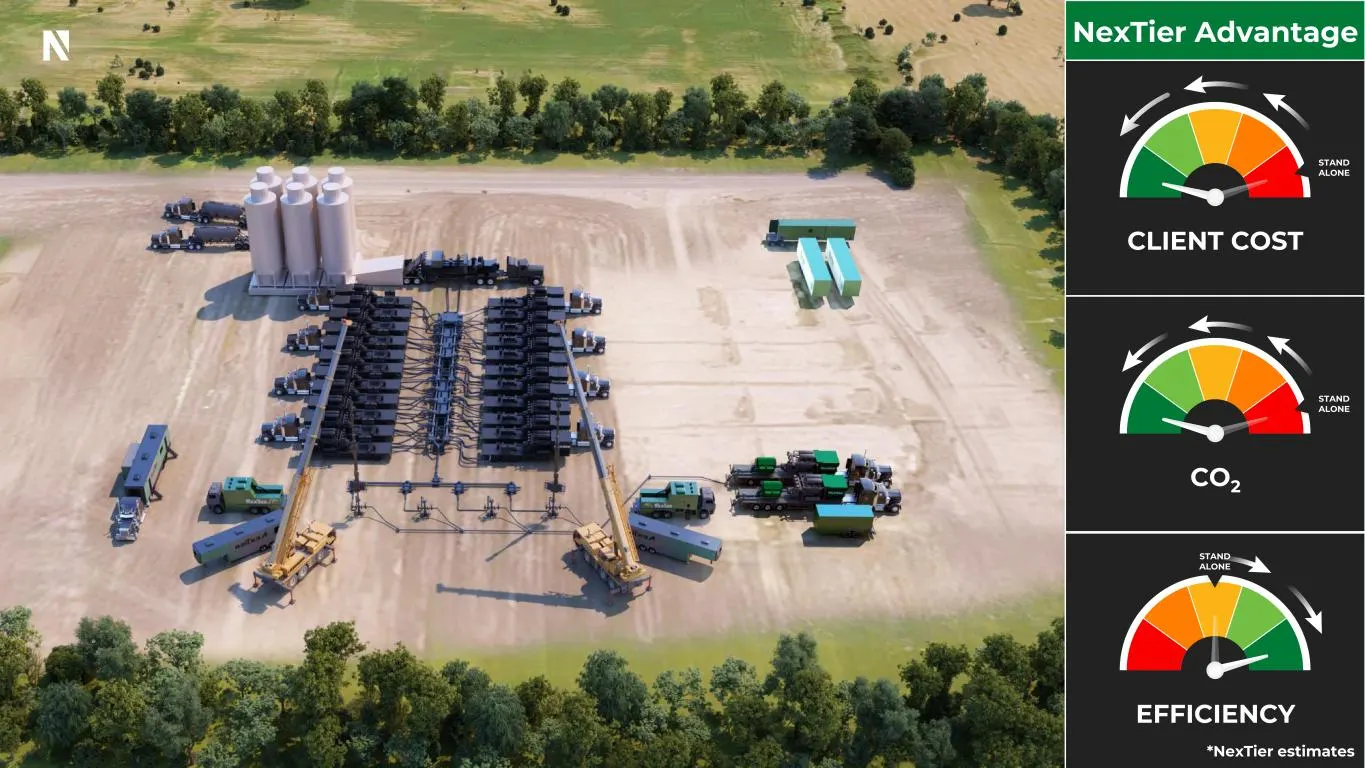
123 EFFICIENCY STAND ALONE CO2 STAND ALONE STAND ALONE NexTier Advantage CLIENT COST *NexTier estimates
Slide 124: NexTier Advantage Customer Results
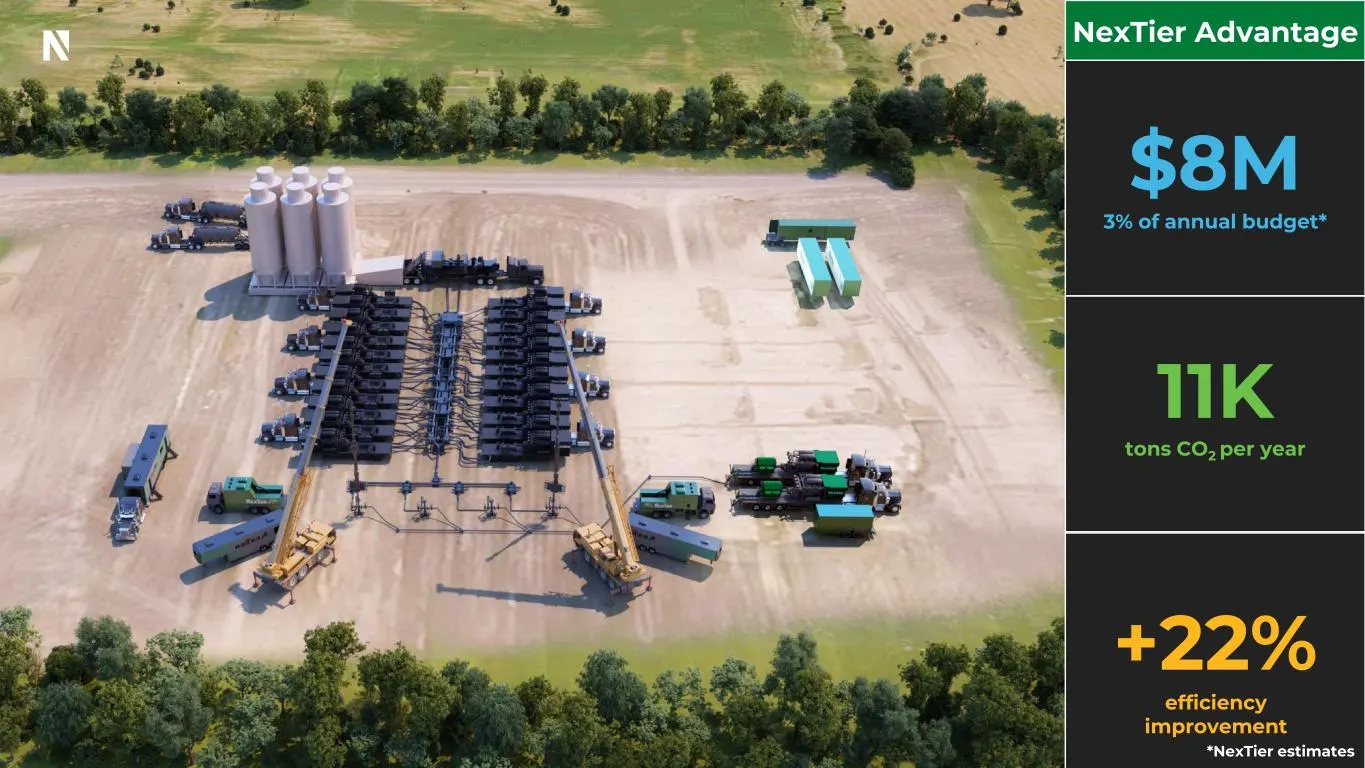
124 efficiency improvement tons CO2 per year NexTier Advantage 3% of annual budget* $8M +22% 11K *NexTier estimates
Slide 125: Client Open-Source Platform
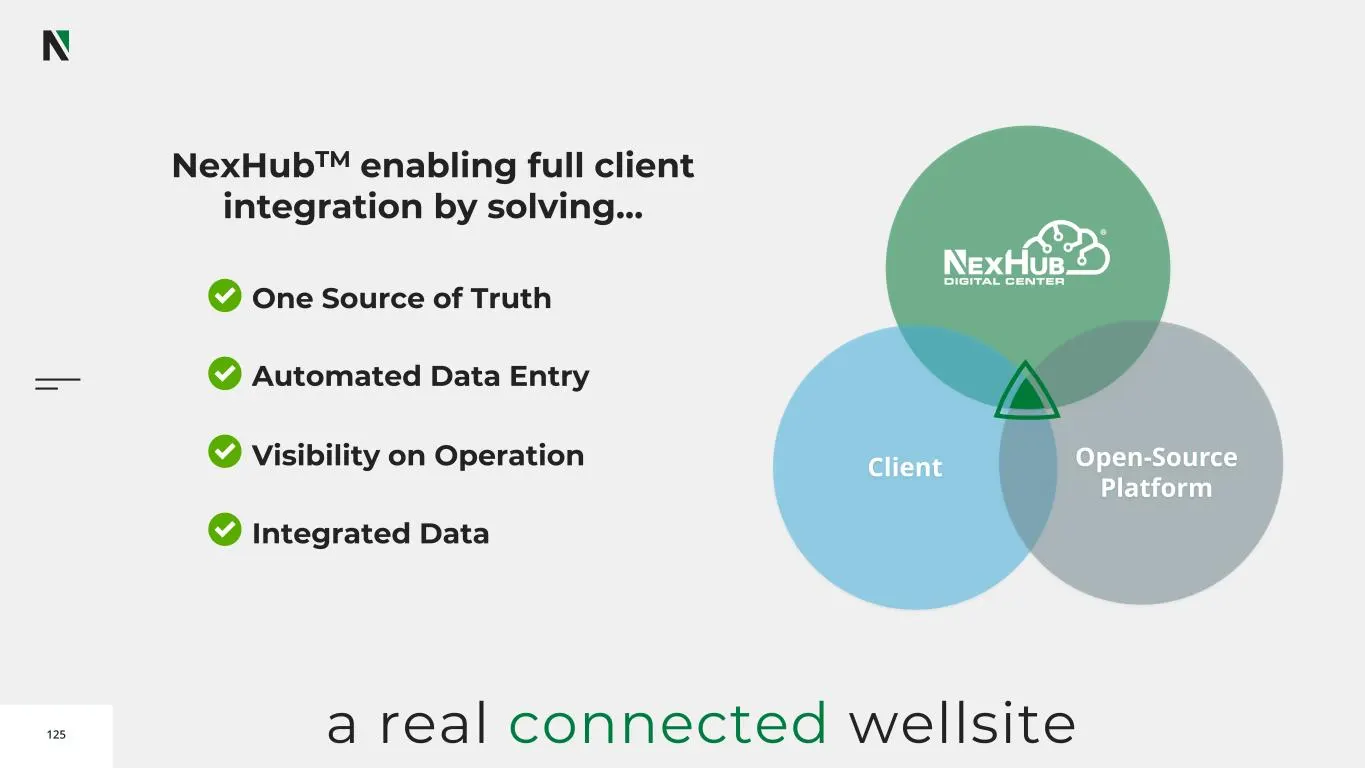
125 Client Open-Source Platform Integrated Data One Source of Truth Automated Data Entry Visibility on Operation NexHubTM enabling full client integration by solving… a real connected wellsite
Slide 126: Individualized Dashboard
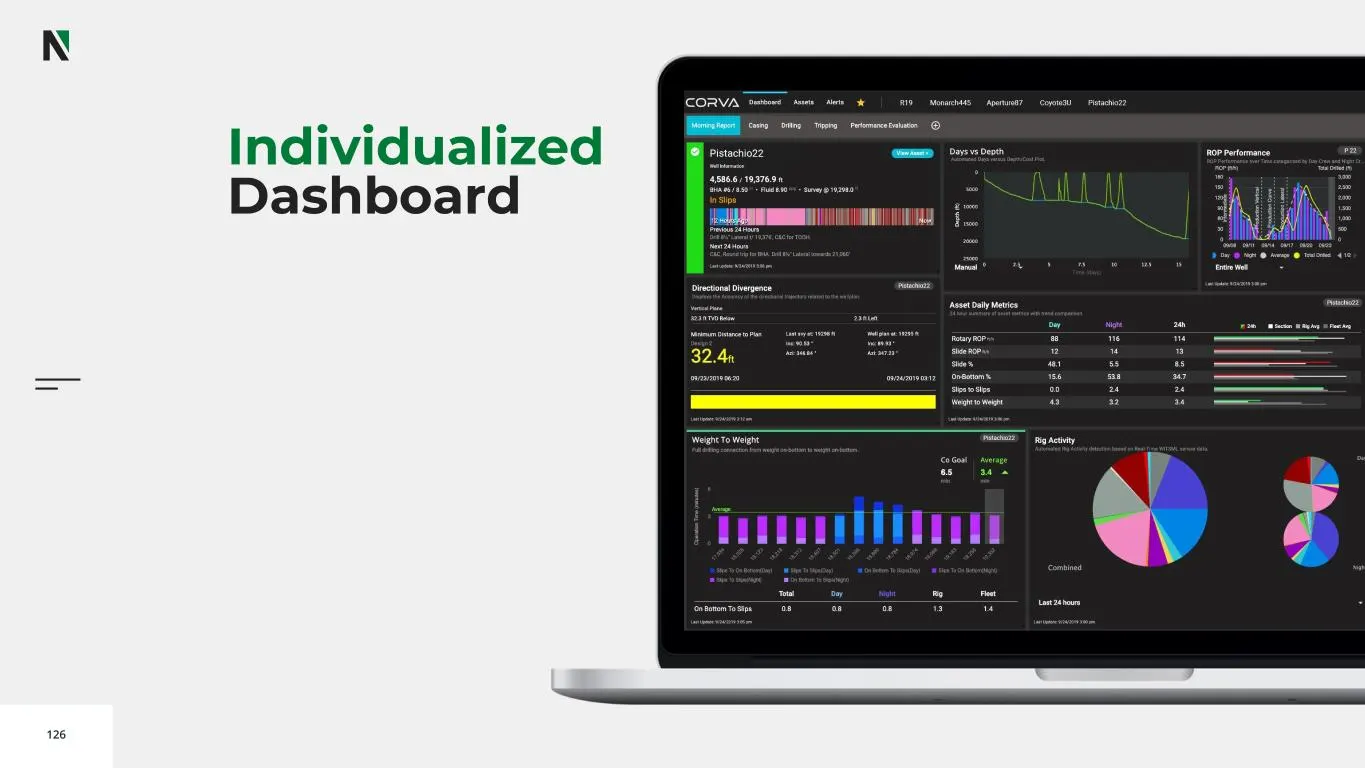
126 Individualized Dashboard
Slide 127: NexTier Proprietary Apps
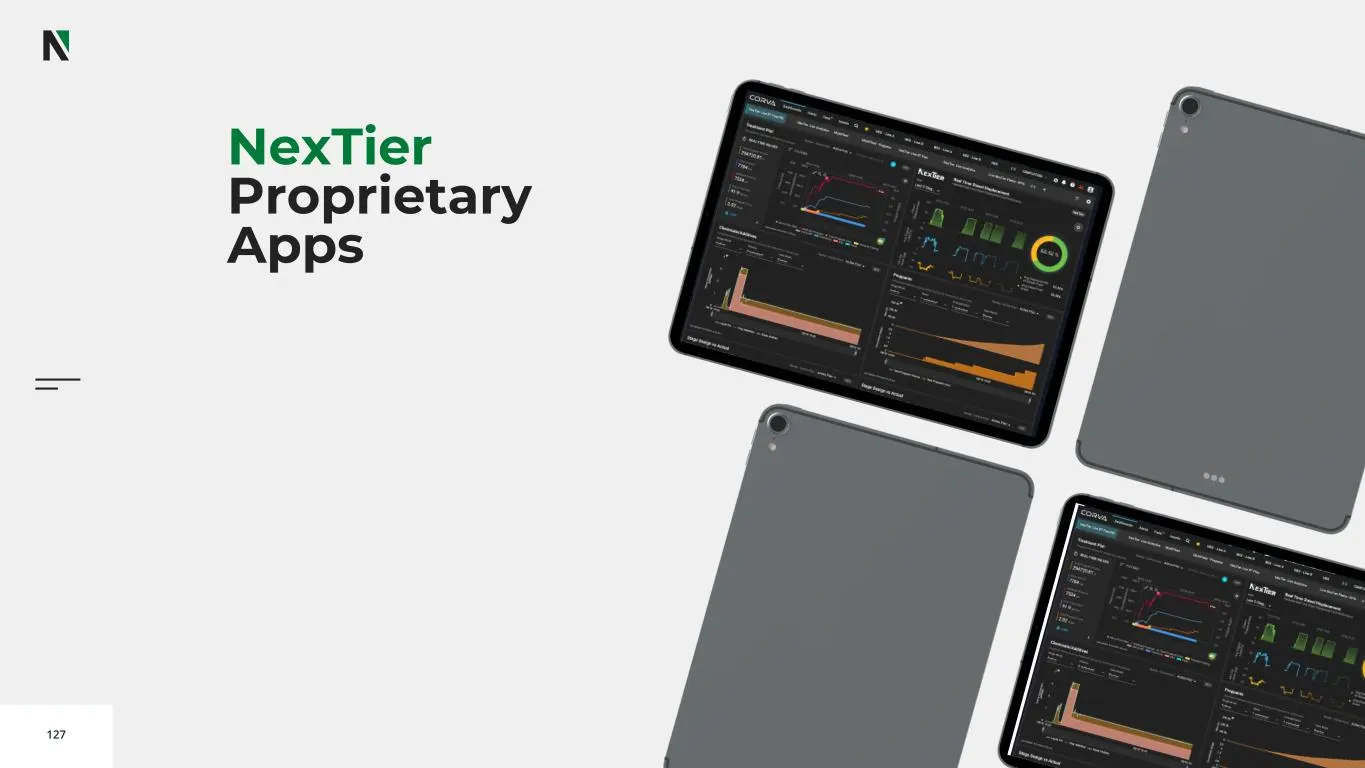
127 NexTier Proprietary Apps
Slide 128: Integration Powered by Digital
128 Higher efficiency and lower cost Real-time reservoir visibility with zero loss of ops efficiency Integration Powered by Digital Industry-leading diesel displacement and reduced emissions Instant digital connection to the entire operation Scale and integration to deliver in a resource-constrained
Slide 129: Quantifying the Value
vo o d o o 129 Quantifying the Value Kenny Pucheu, EVP & CFO Poised to Outperform
Slide 130: NexTier Poised for Outperformance
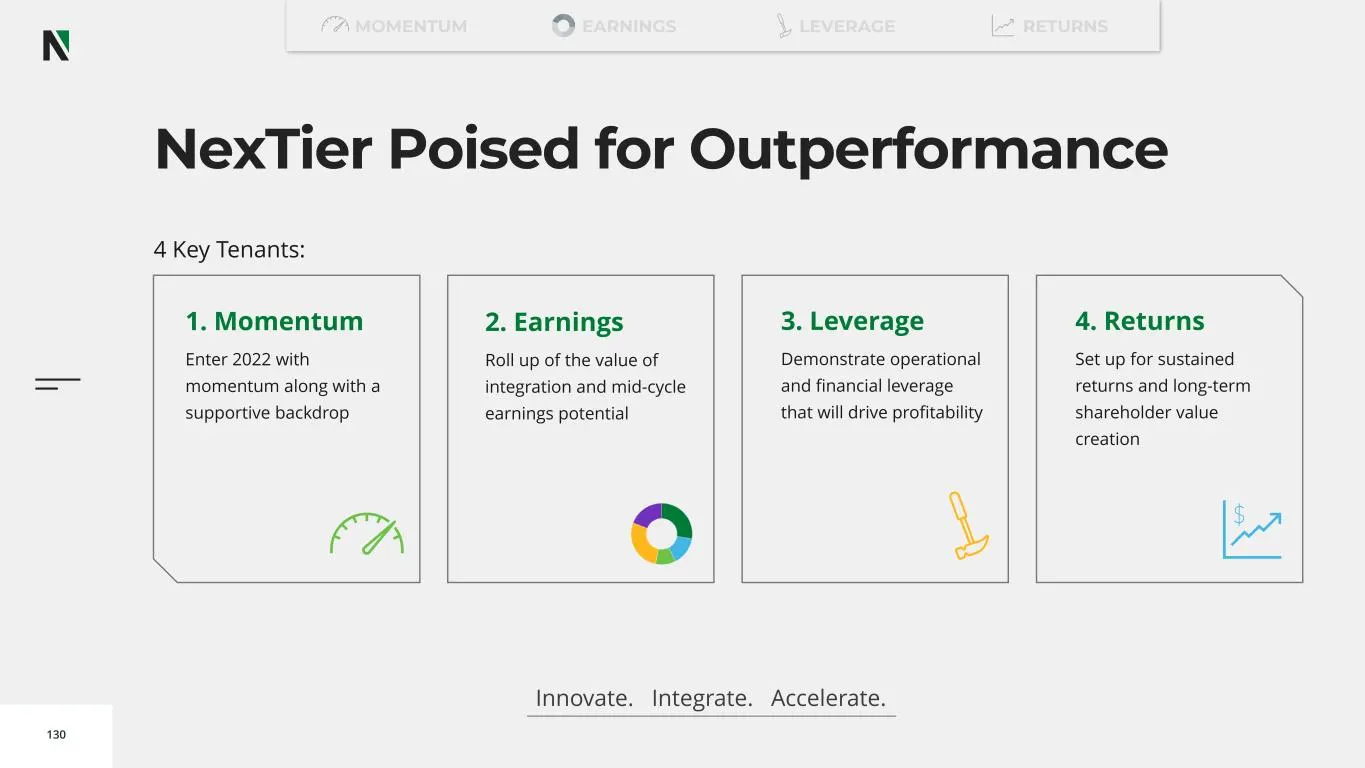
130 NexTier Poised for Outperformance 2. Earnings Roll up of the value of integration and mid-cycle earnings potential 3. Leverage Demonstrate operational and financial leverage that will drive profitability 1. Momentum Enter 2022 with momentum along with a supportive backdrop 4. Returns Set up for
Slide 131: Enter 2022 with Momentum
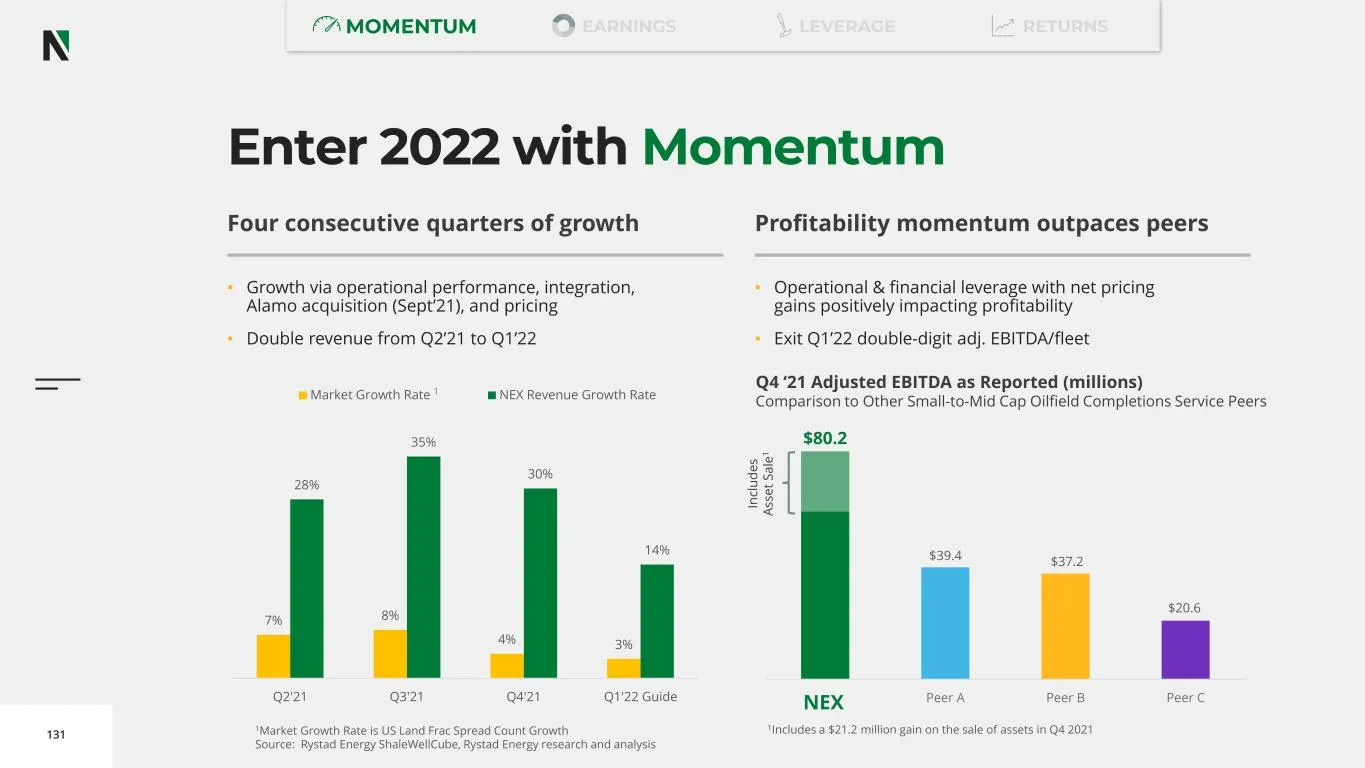
131 Enter 2022 with Momentum Four consecutive quarters of growth Profitability momentum outpaces peers 7% 8% 4% 3% 28% 35% 30% 14% Q2'21 Q3'21 Q4'21 Q1'22 Guide Market Growth Rate 1 NEX Revenue Growth Rate • Growth via operational performance, integration, Alamo acquisition (Sept’21), and pricing •
Slide 132: Elevate Value: Integrated Solutions
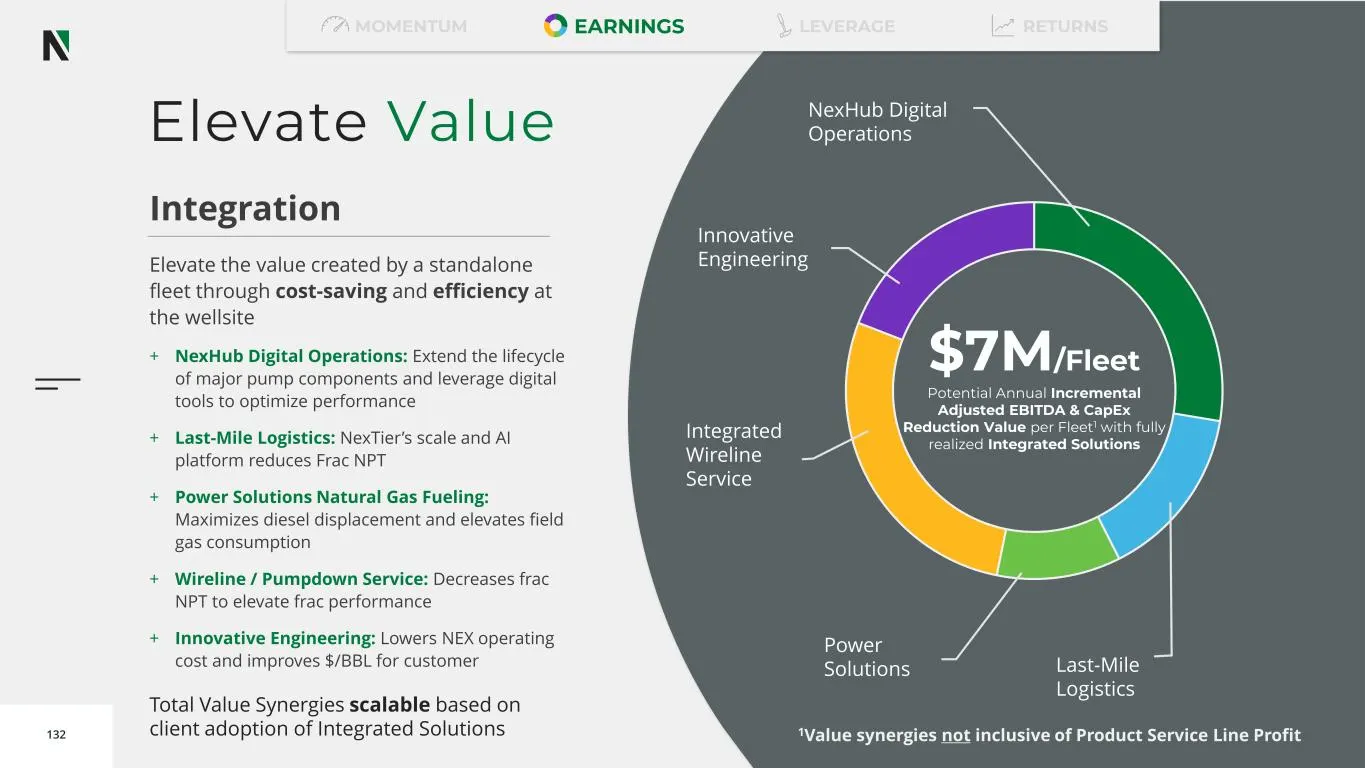
132 Elevate Value Power Solutions NexHub Digital Operations Innovative Engineering Integrated Wireline Service $7M/Fleet Potential Annual Incremental Adjusted EBITDA & CapEx Reduction Value per Fleet1 with fully realized Integrated Solutions Last-Mile Logistics Integration Elevate the value created
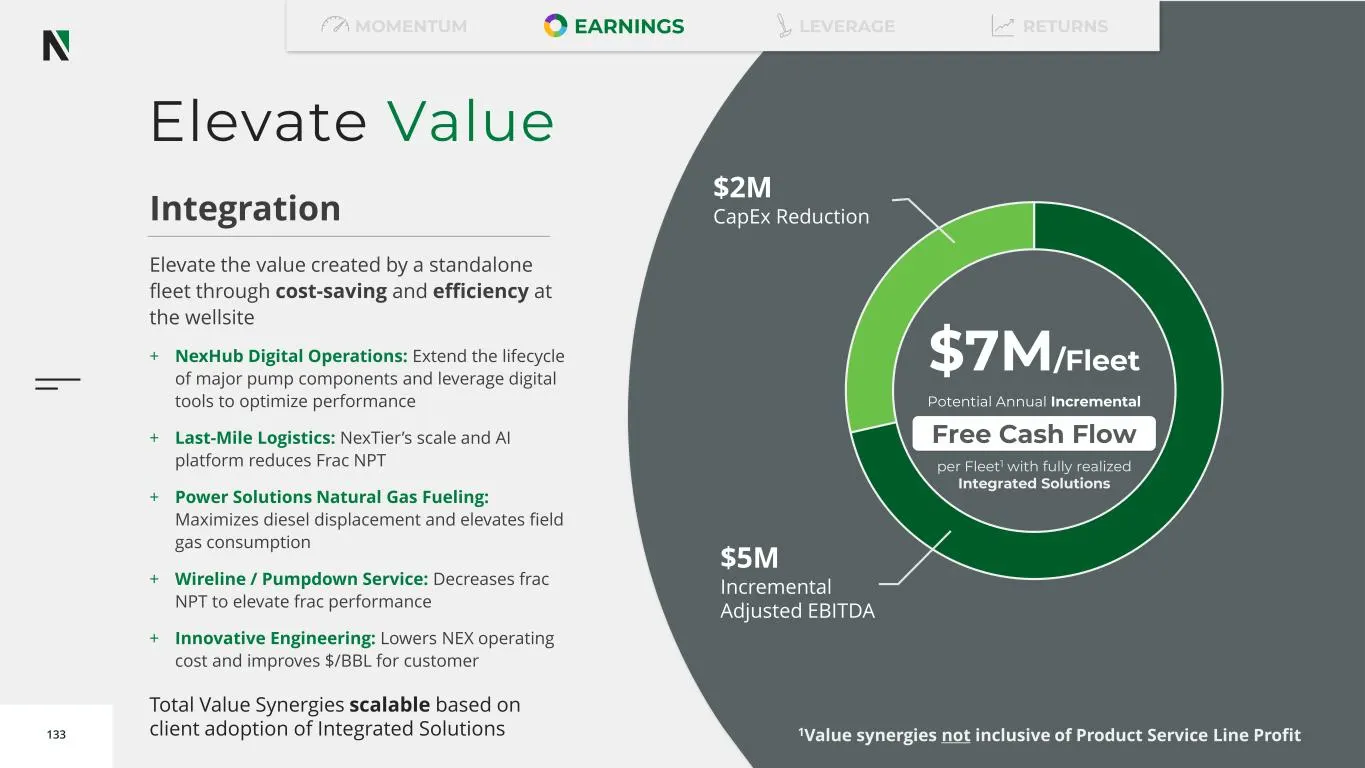
Slide 133: Elevate Value: Incremental Free Cash Flow per Fleet
133 Elevate Value $7M/Fleet Potential Annual Incremental Free Cash Flow per Fleet1 with fully realized Integrated Solutions Integration Elevate the value created by a standalone fleet through cost-saving and efficiency at the wellsite + NexHub Digital Operations: Extend the lifecycle of major pump c
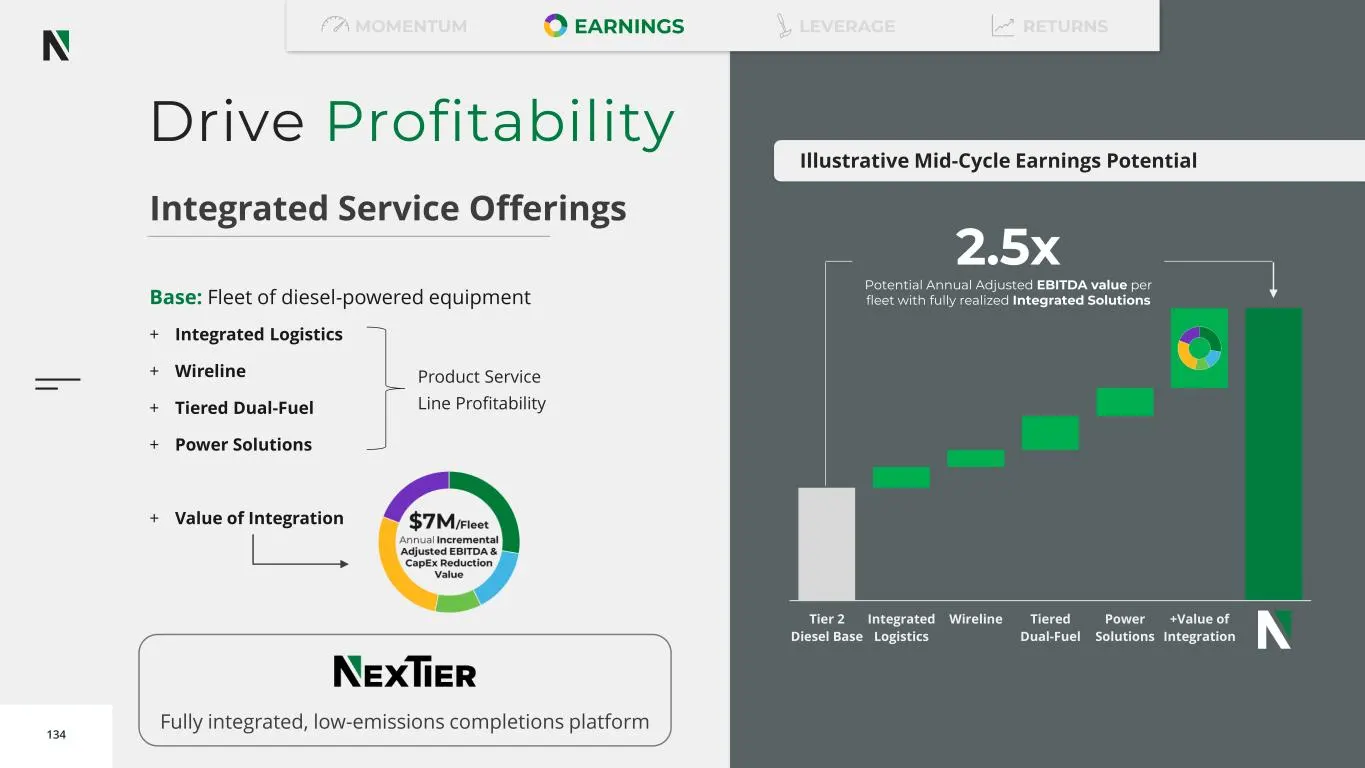
Slide 134: Illustrative Mid-Cycle Earnings Potential
134 Illustrative Mid-Cycle Earnings Potential Tier 2 Diesel Base Integrated Logistics Wireline Tiered Dual-Fuel Power Solutions +Value of Integration NexTier 2.5x Potential Annual Adjusted EBITDA value per fleet with fully realized Integrated Solutions MOMENTUM LEVERAGE RETURNSEARNINGS Drive Profita
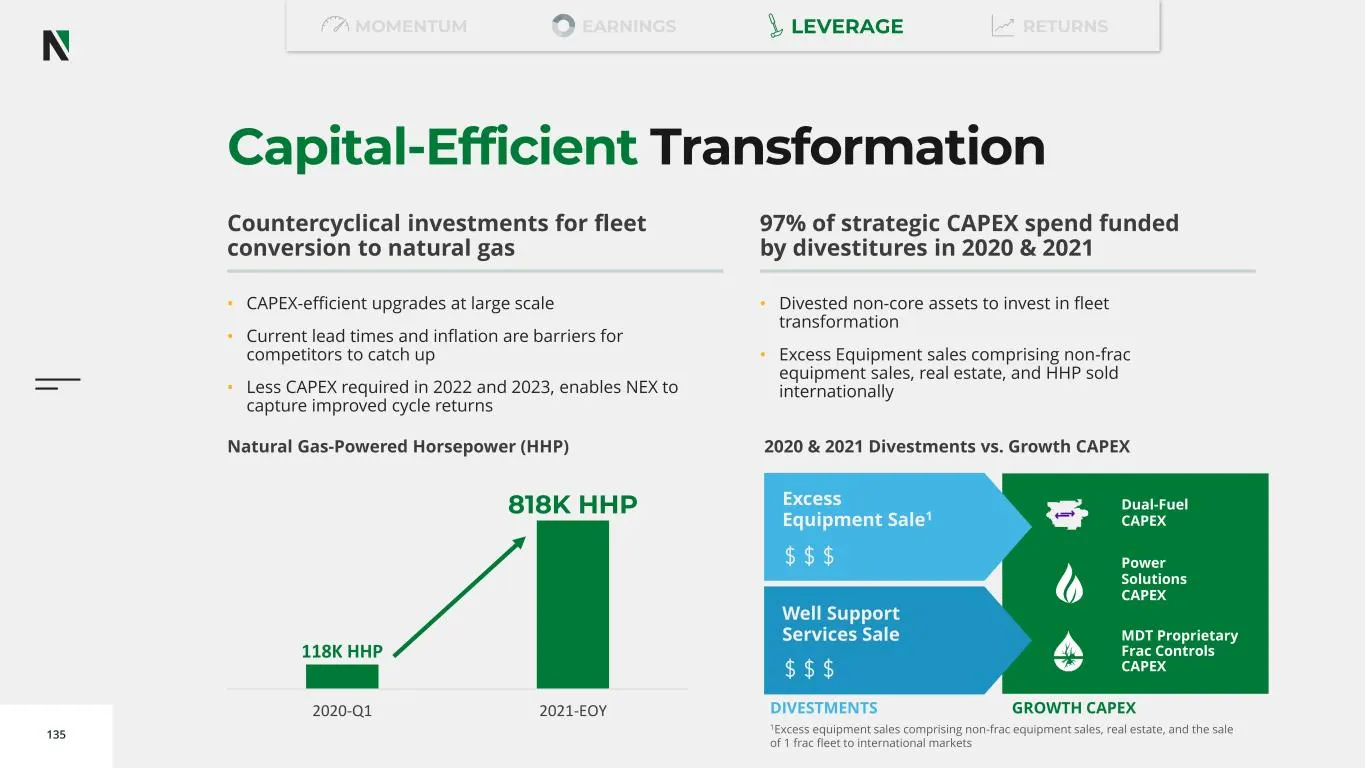
Slide 135: Capital-Efficient Transformation
135 Capital-Efficient Transformation Countercyclical investments for fleet conversion to natural gas 97% of strategic CAPEX spend funded by divestitures in 2020 & 2021 • CAPEX-efficient upgrades at large scale • Current lead times and inflation are barriers for competitors to catch up • Less CAPEX r
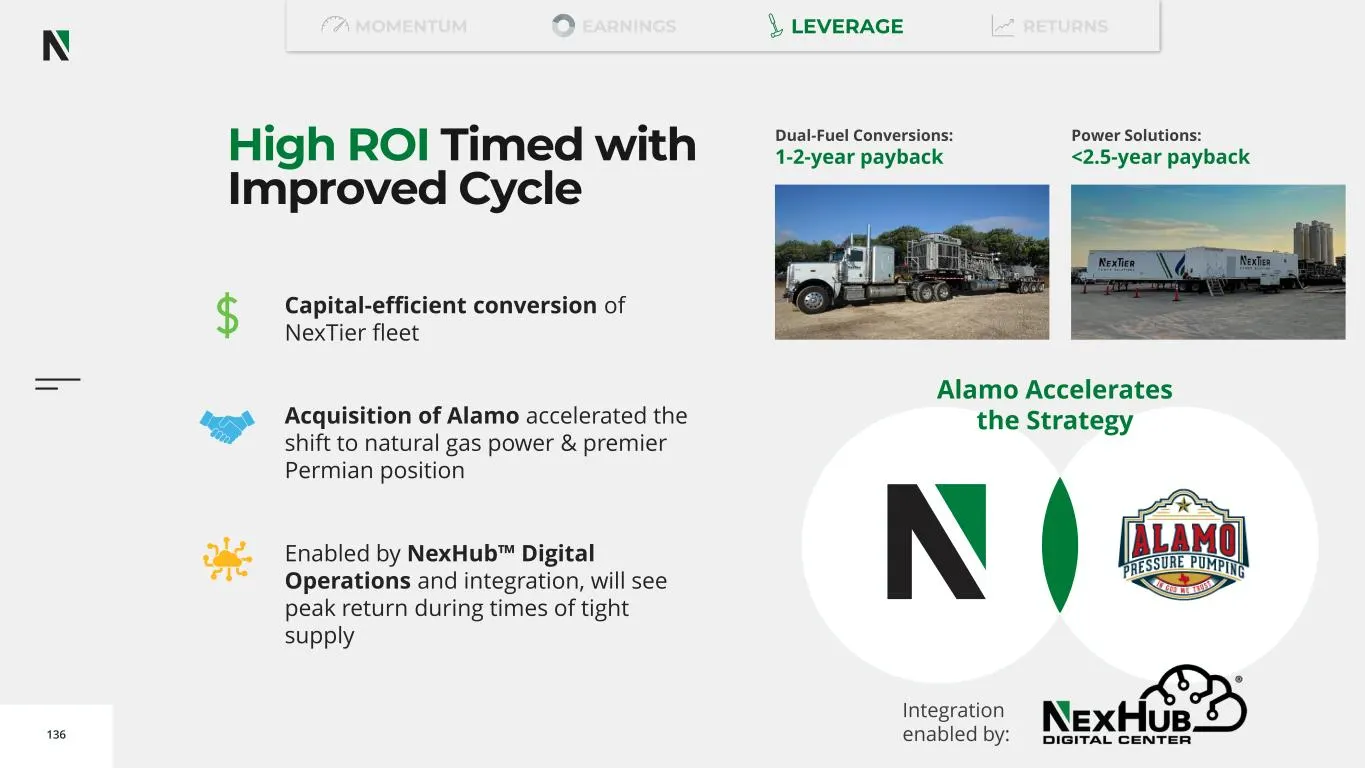
Slide 136: High ROI Timed with Improved Cycle
136 High ROI Timed with Improved Cycle Capital-efficient conversion of NexTier fleet Acquisition of Alamo accelerated the shift to natural gas power & premier Permian position Enabled by NexHub™ Digital Operations and integration, will see peak return during times of tight supply Dual-Fuel Conversio
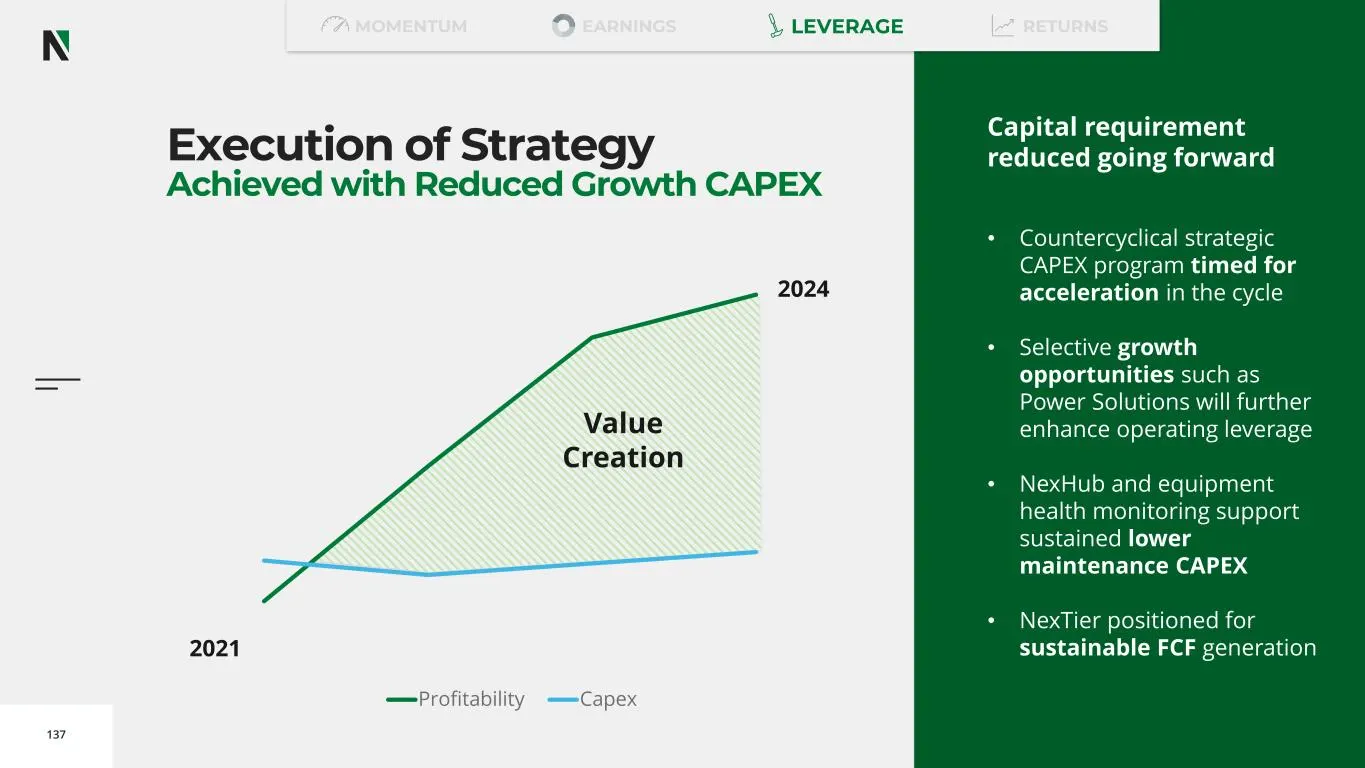
Slide 137: Execution of Strategy Achieved with Reduced Growth CAPEX
137 Profitability Capex Execution of Strategy Achieved with Reduced Growth CAPEX Capital requirement reduced going forward • Countercyclical strategic CAPEX program timed for acceleration in the cycle • Selective growth opportunities such as Power Solutions will further enhance operating leverage •
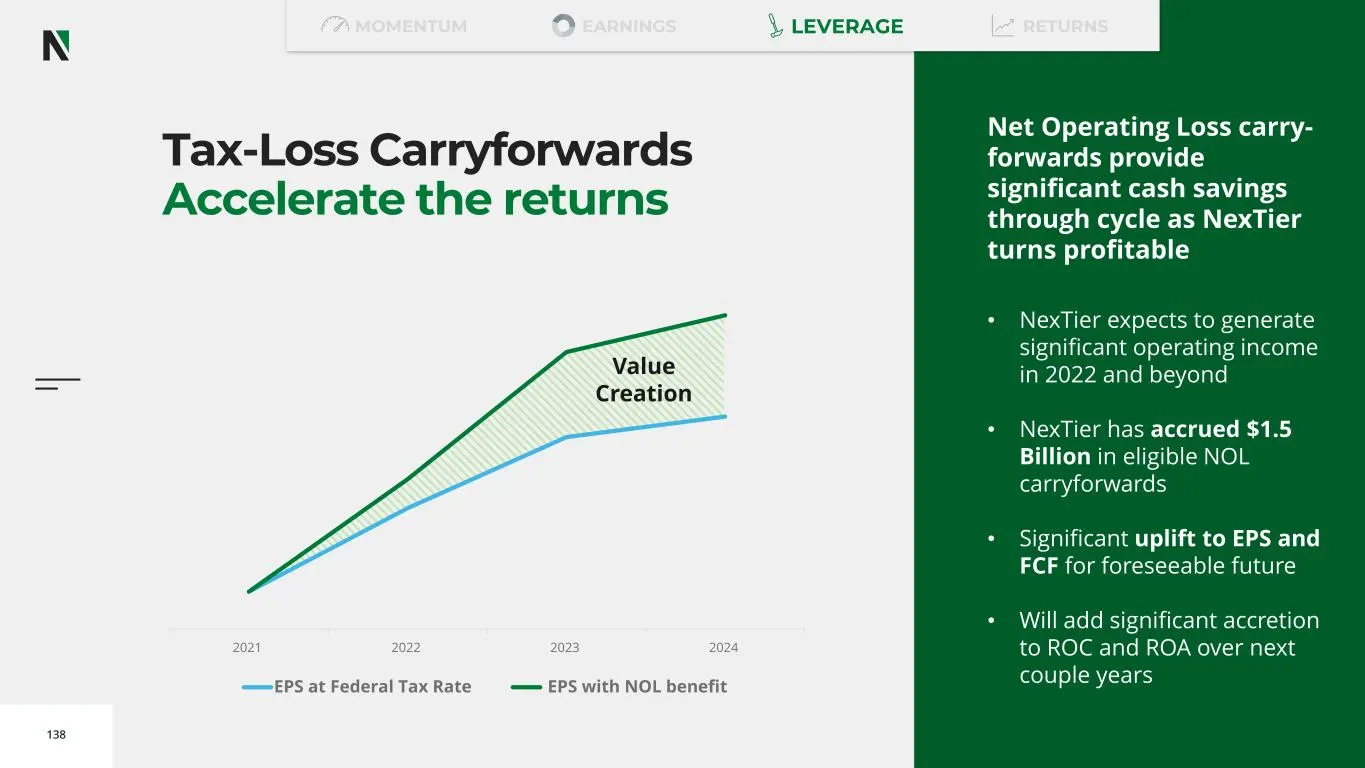
Slide 138: Tax-Loss Carryforwards
138 Tax-Loss Carryforwards Accelerate the returns Net Operating Loss carry- forwards provide significant cash savings through cycle as NexTier turns profitable • NexTier expects to generate significant operating income in 2022 and beyond • NexTier has accrued $1.5 Billion in eligible NOL carryforwar
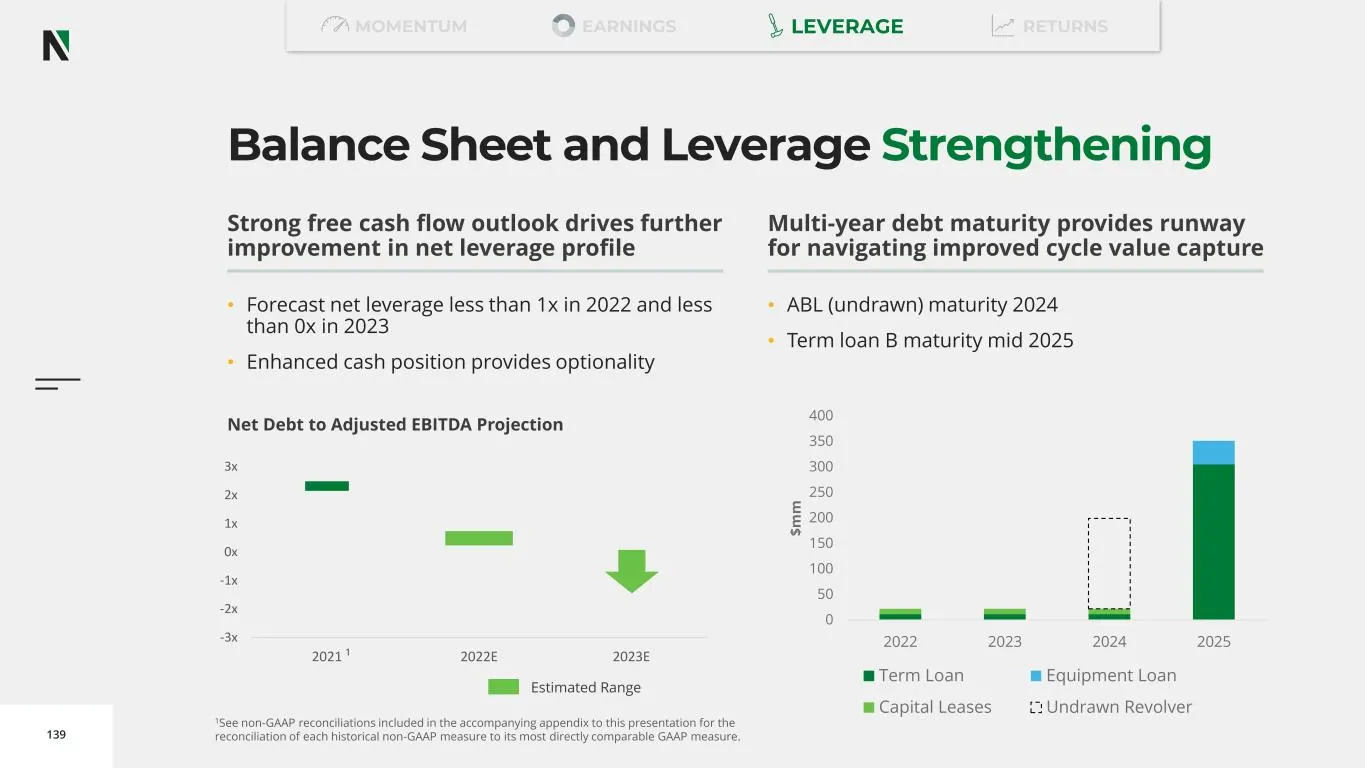
Slide 139: Balance Sheet and Leverage Strengthening
139 Balance Sheet and Leverage Strengthening Strong free cash flow outlook drives further improvement in net leverage profile Multi-year debt maturity provides runway for navigating improved cycle value capture • Forecast net leverage less than 1x in 2022 and less than 0x in 2023 • Enhanced cash pos
Slide 140: CEO Conclusion
vo o d o o 140 Robert Drummond, CEO CEO Conclusion
Slide 141: Uniquely positioned to capture market momentum
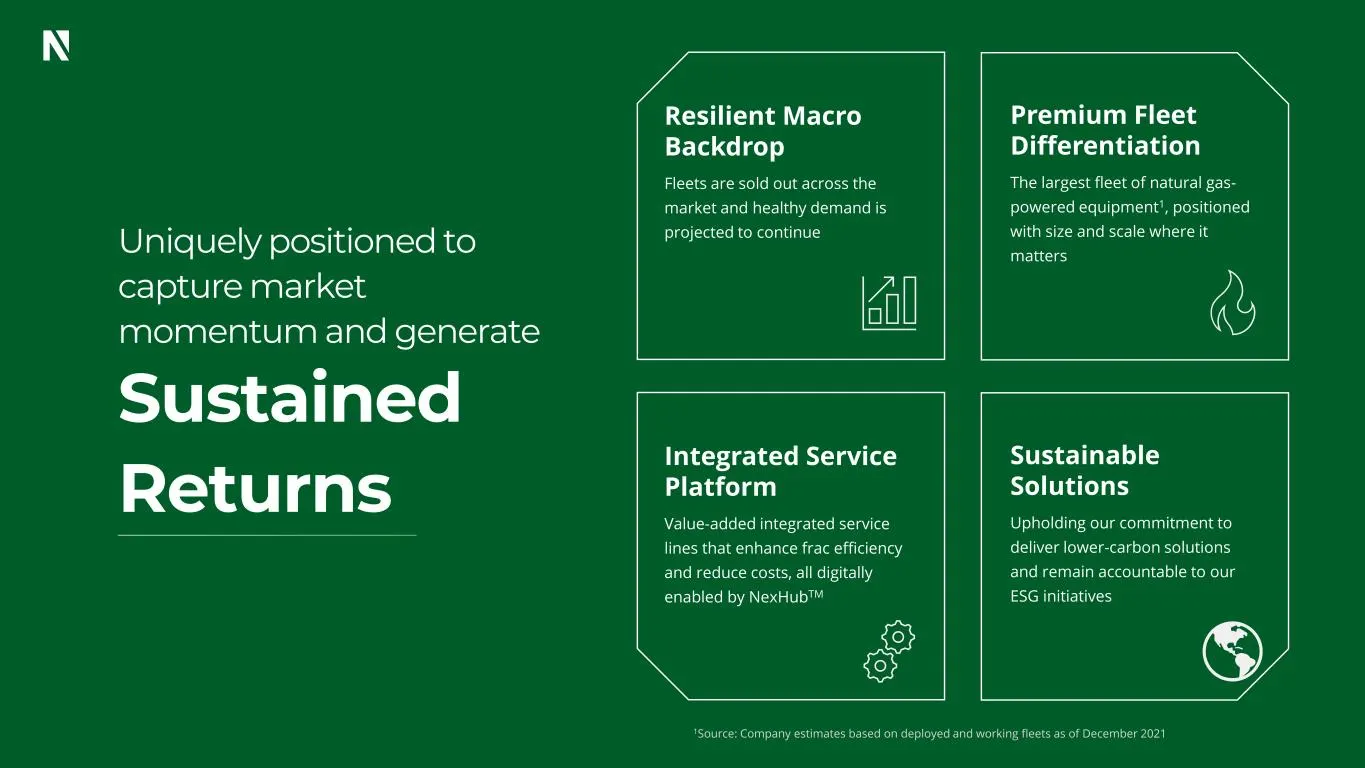
141 Uniquely positioned to capture market momentum and generate Sustained Returns Resilient Macro Backdrop Fleets are sold out across the market and healthy demand is projected to continue Premium Fleet Differentiation The largest fleet of natural gas- powered equipment1, positioned with size and sc
Slide 142: 2022 Near-Term Outlook
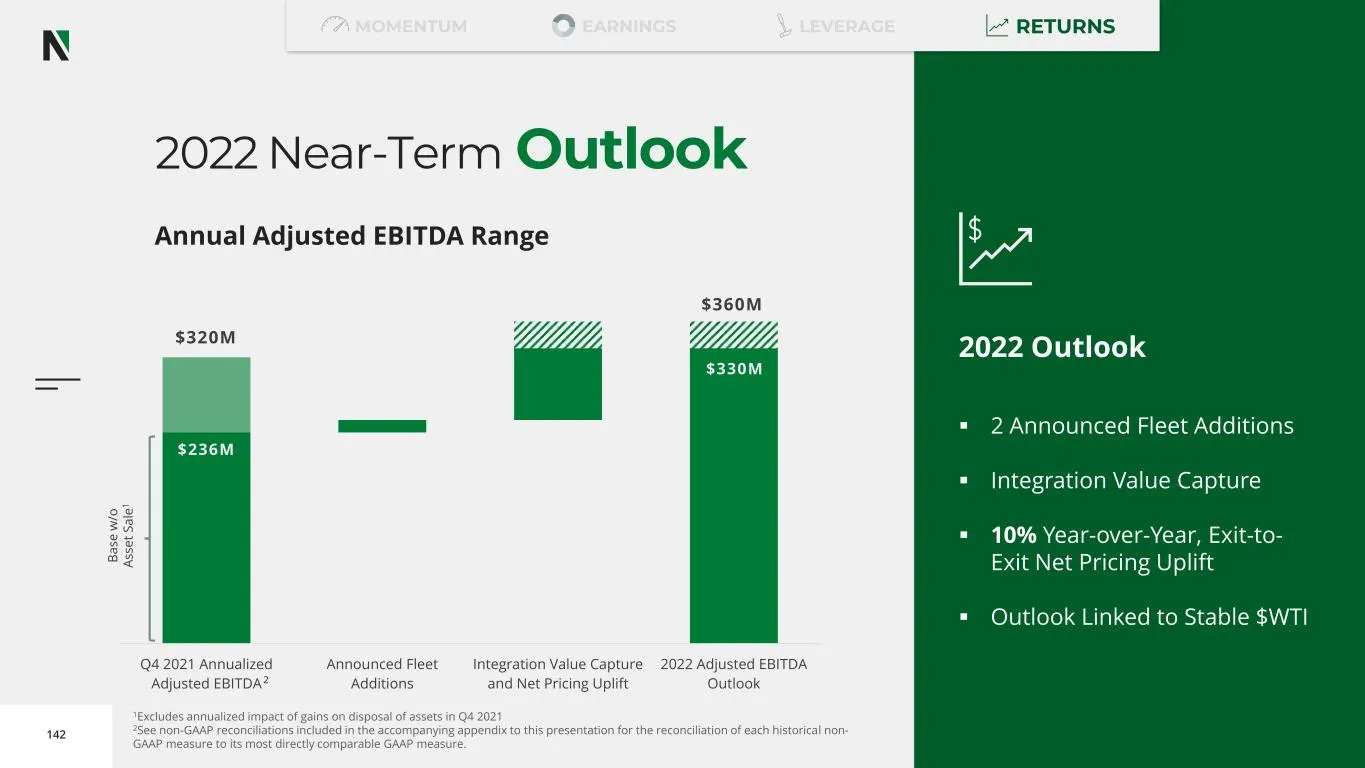
142 2022 Near-Term Outlook 2022 Outlook ▪ 2 Announced Fleet Additions ▪ Integration Value Capture ▪ 10% Year-over-Year, Exit-to- Exit Net Pricing Uplift ▪ Outlook Linked to Stable $WTI Annual Adjusted EBITDA Range EARNINGS LEVERAGE RETURNSMOMENTUM $236M $330M $320M $360M Q4 2021 Annualized Adjusted
Slide 143: Significant Profitability Upside
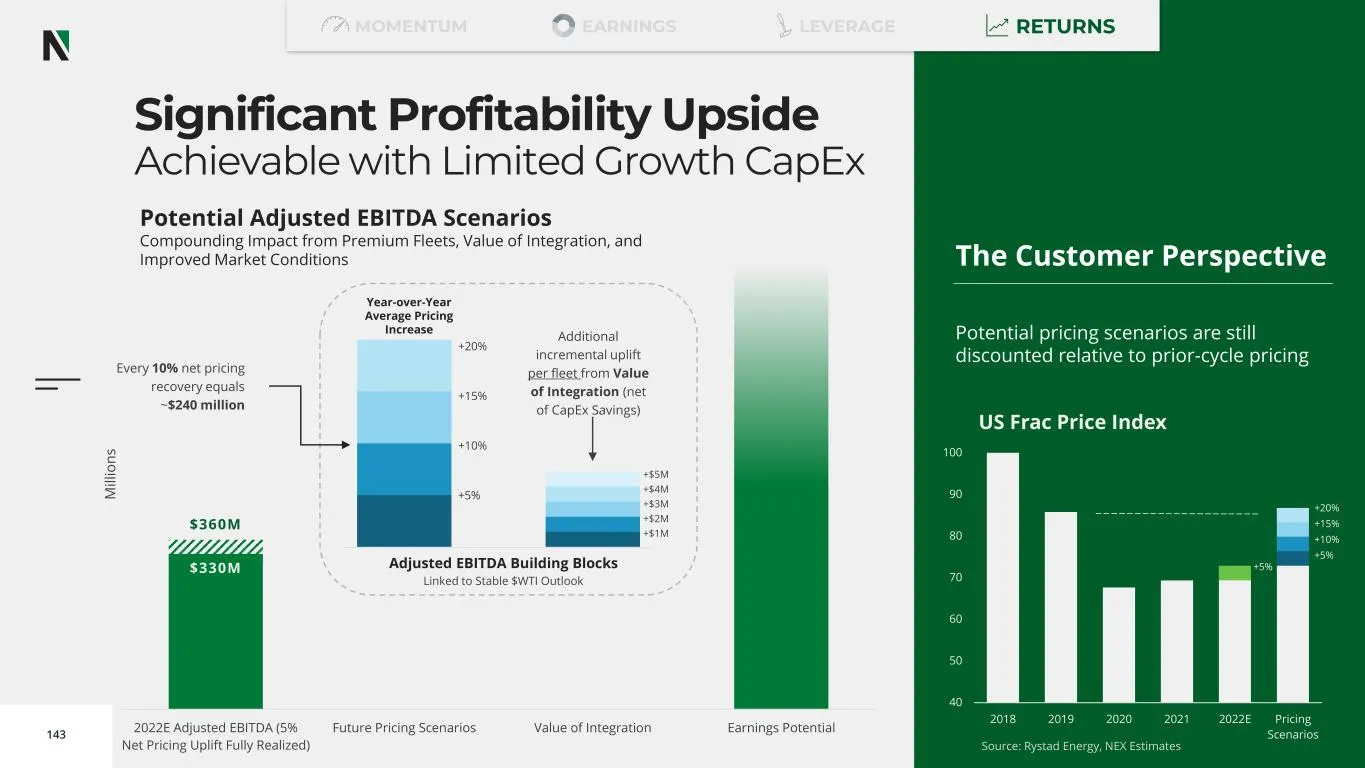
143 Significant Profitability Upside Achievable with Limited Growth CapEx Potential Adjusted EBITDA Scenarios Compounding Impact from Premium Fleets, Value of Integration, and Improved Market Conditions EARNINGS LEVERAGE RETURNSMOMENTUM $330M $360M 2022E Adjusted EBITDA (5% Net Pricing Uplift Fully
Slide 144: Market Beating Return Potential
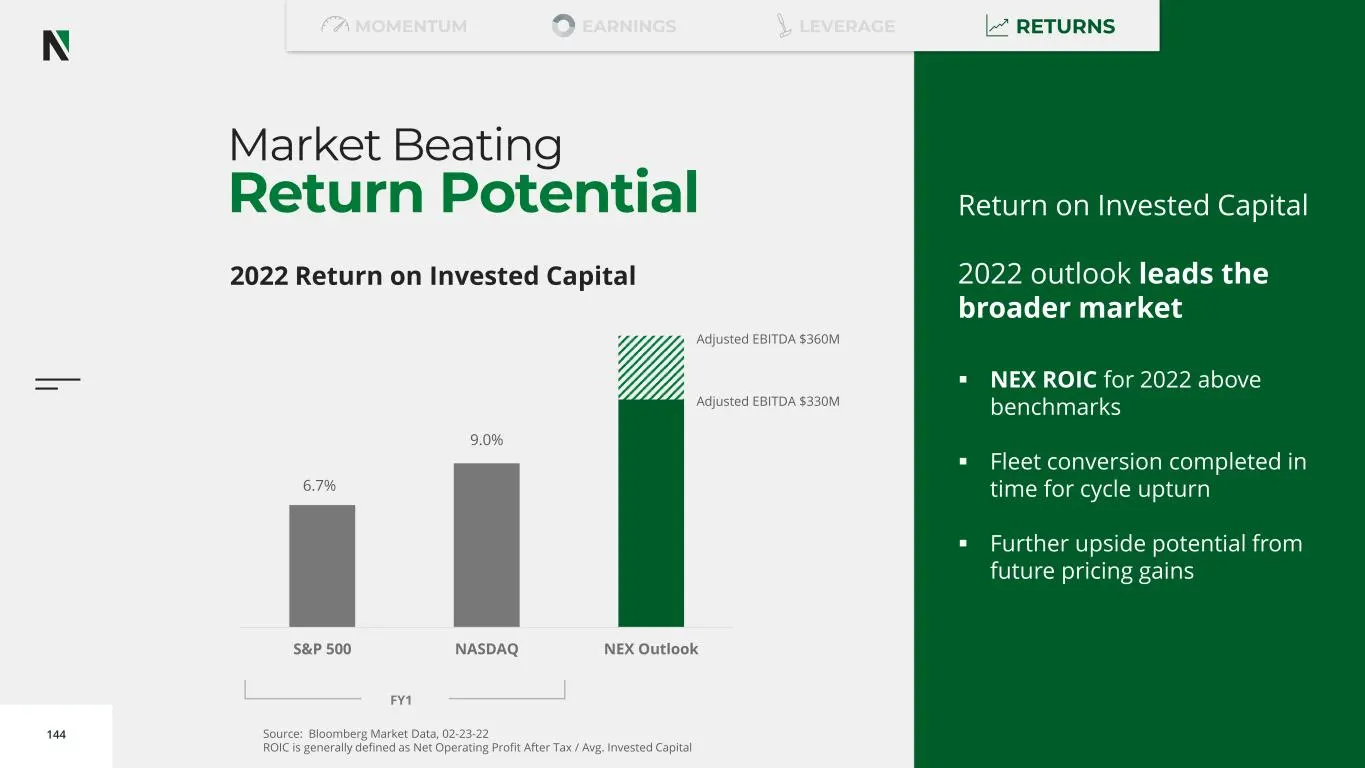
144 6.7% 9.0% S&P 500 NASDAQ NEX Outlook FY1 Market Beating Return Potential Return on Invested Capital 2022 outlook leads the broader market ▪ NEX ROIC for 2022 above benchmarks ▪ Fleet conversion completed in time for cycle upturn ▪ Further upside potential from future pricing gains 2022 Return on
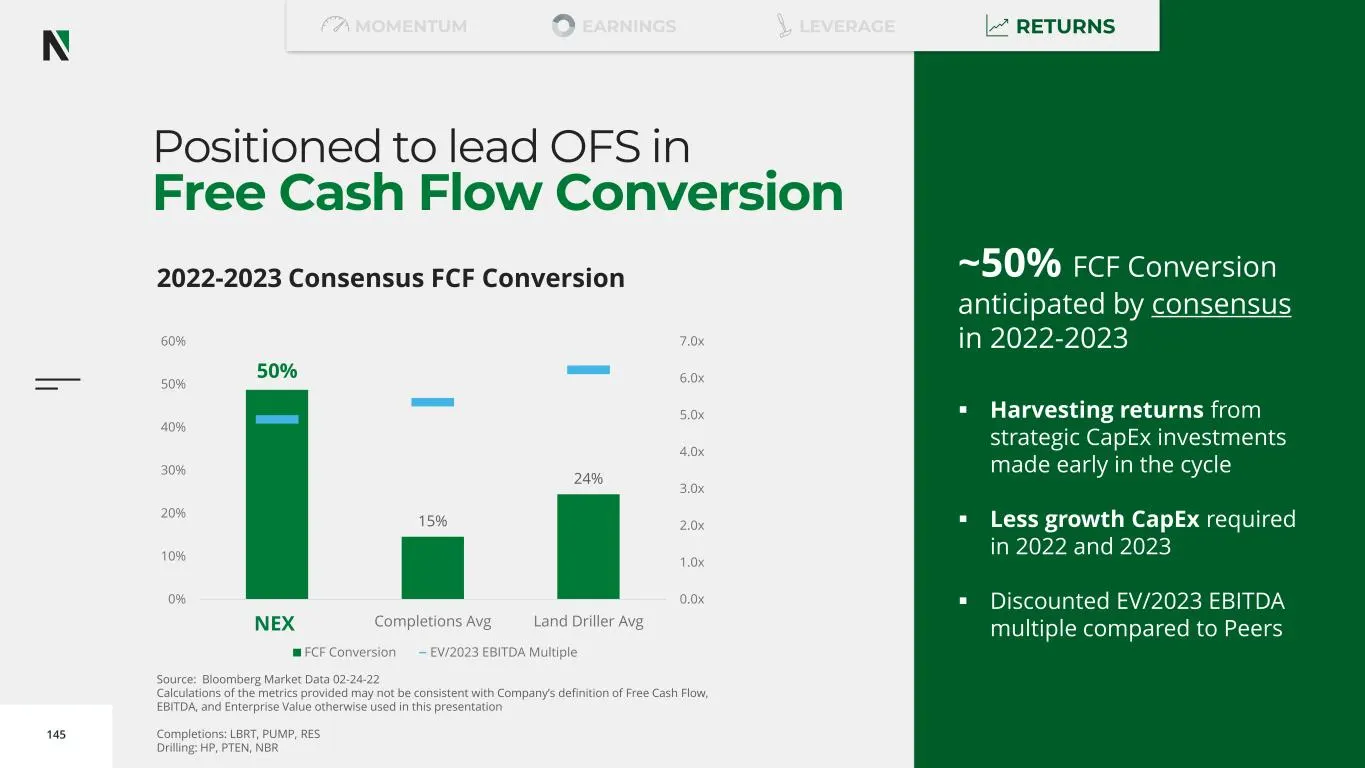
Slide 145: Positioned to lead OFS in Free Cash Flow Conversion
145 Positioned to lead OFS in Free Cash Flow Conversion ~50% FCF Conversion anticipated by consensus in 2022-2023 ▪ Harvesting returns from strategic CapEx investments made early in the cycle ▪ Less growth CapEx required in 2022 and 2023 ▪ Discounted EV/2023 EBITDA multiple compared to Peers 2022-20
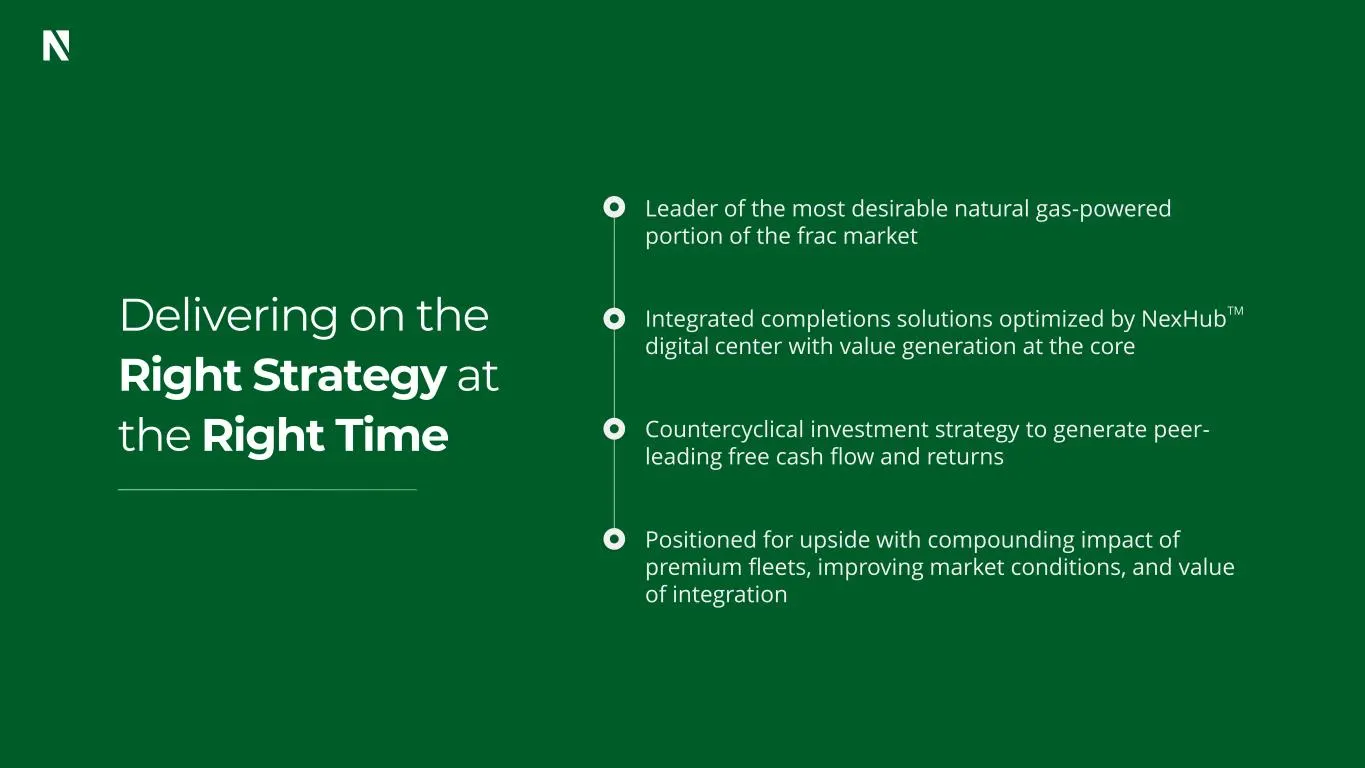
Slide 146: Delivering on the Right Strategy at the Right Time
146 Delivering on the Right Strategy at the Right Time Leader of the most desirable natural gas-powered portion of the frac market Integrated completions solutions optimized by NexHub TM digital center with value generation at the core Countercyclical investment strategy to generate peer- leading fr
Slide 147: Appendix
147 Appendix
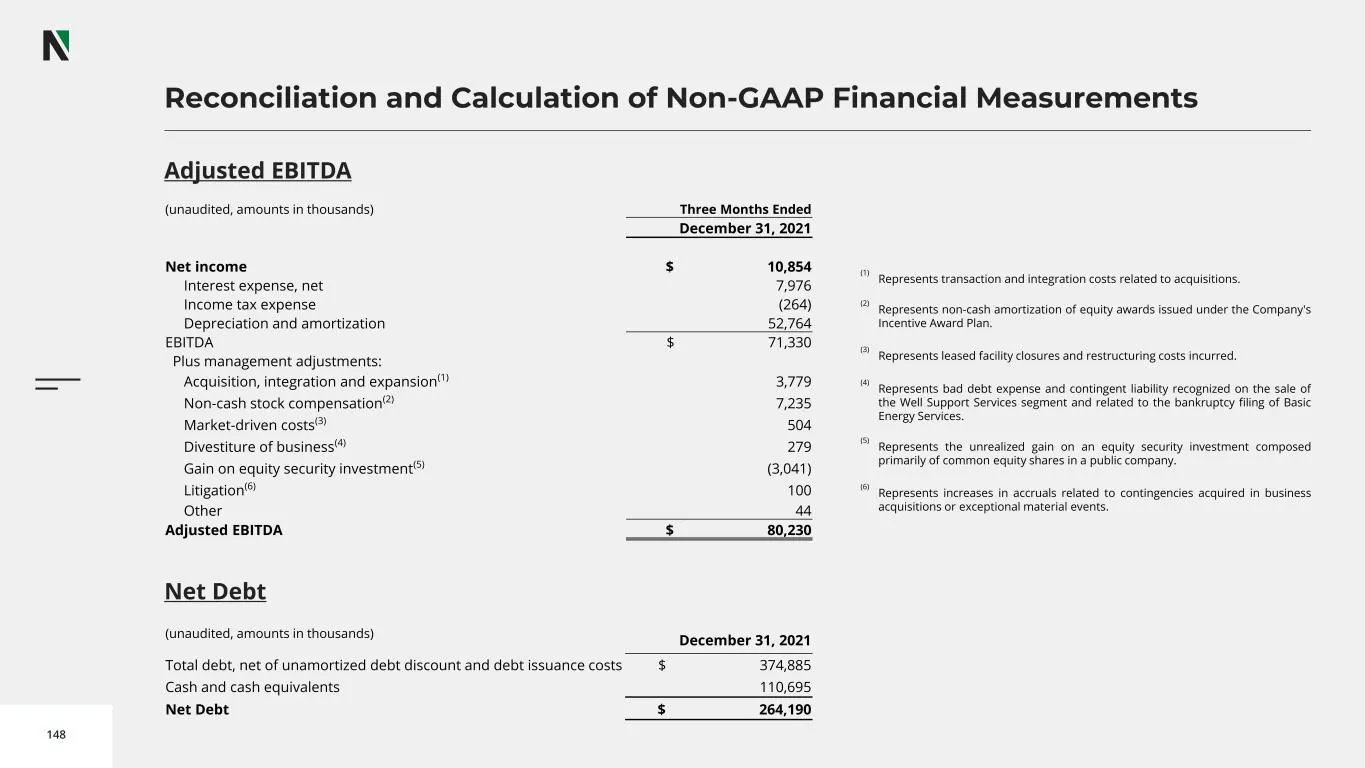
Slide 148: Reconciliation and Calculation of Non-GAAP Financial Measurements
148 Reconciliation and Calculation of Non-GAAP Financial Measurements Adjusted EBITDA (unaudited, amounts in thousands) Three Months Ended December 31, 2021 Net income $ 10,854 Interest expense, net 7,976 Income tax expense (264) Depreciation and amortization 52,764 EBITDA $ 71,330 Plus management a
Source: SEC EDGAR · 8-K filed Mar 3, 2022
More decks from NexTier Oilfield Solutions Inc
 Merger or Acquisition (July 2023)18 slides · Jul 5, 2023
 Merger or Acquisition (June 2023)18 slides · Jun 16, 2023
 Merger or Acquisition (June 2023)23 slides · Jun 15, 2023
 Shareholder Meeting (June 2023)23 slides · Jun 1, 2023
 Investor Presentation (February 2023)26 slides · Feb 15, 2023
 Investor Presentation (October 2022)28 slides · Oct 25, 2022