Relx PLC · LSE:REL
Relx — Investor Presentation (August 2022)
59 slides from Relx's investor presentation, August 2022
Slide 1: The global provider of information-based analytics and decision tools
The global provider of information-based analytics and decision tools August 2022
Slide 2: RELX Investor Relations contacts
RELX Investor Relations contacts Colin Tennant – Head of Investor Relations James Statham – Director, Investor Relations colin.tennant@relx.com james.statham@relx.com +44 (0)20 7166 5751 +44 (0)20 7166 5688 Kate Whitaker – Investor Relations Nicole Doel – Investor Relations Associate kate.whitaker@r
Slide 3: Disclaimer regarding forward-looking statements
DISCLAIMER REGARDING FORWARD-LOOKING STATEMENTS This presentation contains forward-looking statements within the meaning of Section 27A of the US Securities Act of 1933, as amended, and Section 21E of the US Securities Exchange Act of 1934, as amended. These statements are subject to risks and uncer
Slide 4: RELX is a provider of information-based analytics and decision tools
RELX is a provider of information-based analytics and decision tools for professional and business customers, enabling them to make better decisions, get better results and be more productive. 4
Slide 5: RELX global scale and growth 2021
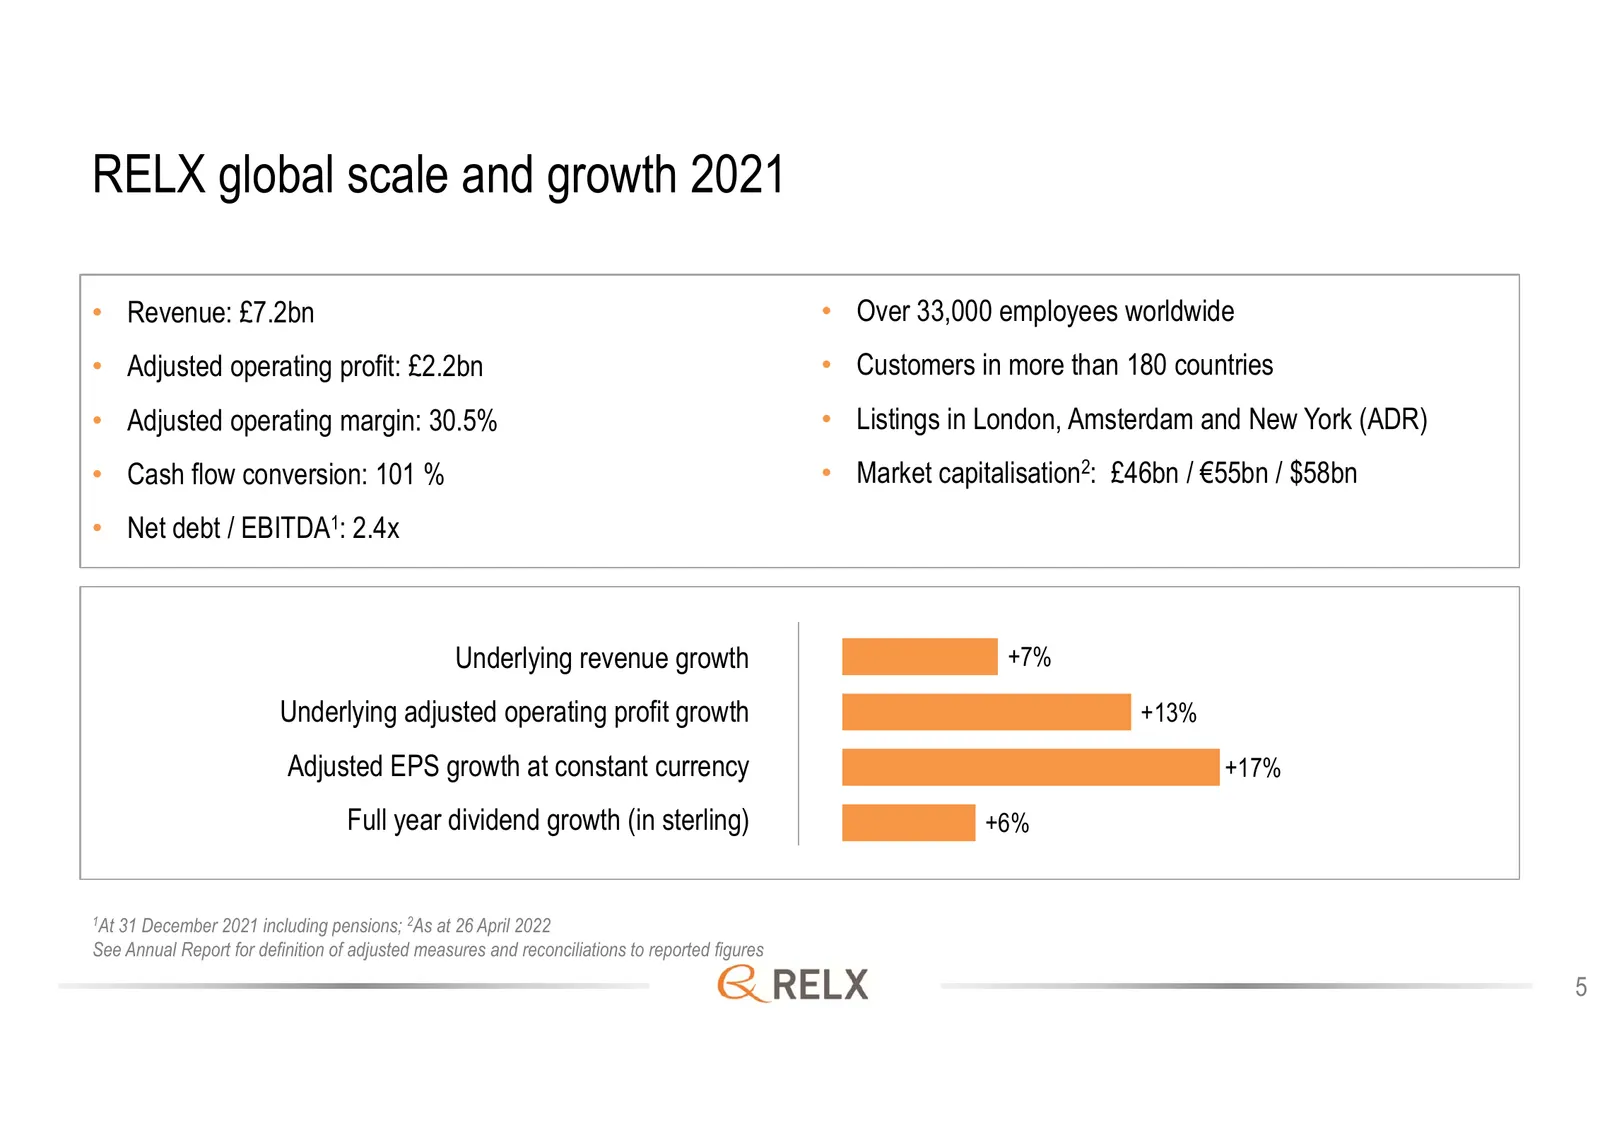
RELX global scale and growth 2021 • Revenue: £7.2bn • Over 33,000 employees worldwide • Adjusted operating profit: £2.2bn • Customers in more than 180 countries • Adjusted operating margin: 30.5% \ • Listings in London, Amsterdam and New York (ADR) • Cash flow conversion: 101 % • Market capitalisati
Slide 6: RELX H1 2022 progress and financial highlights
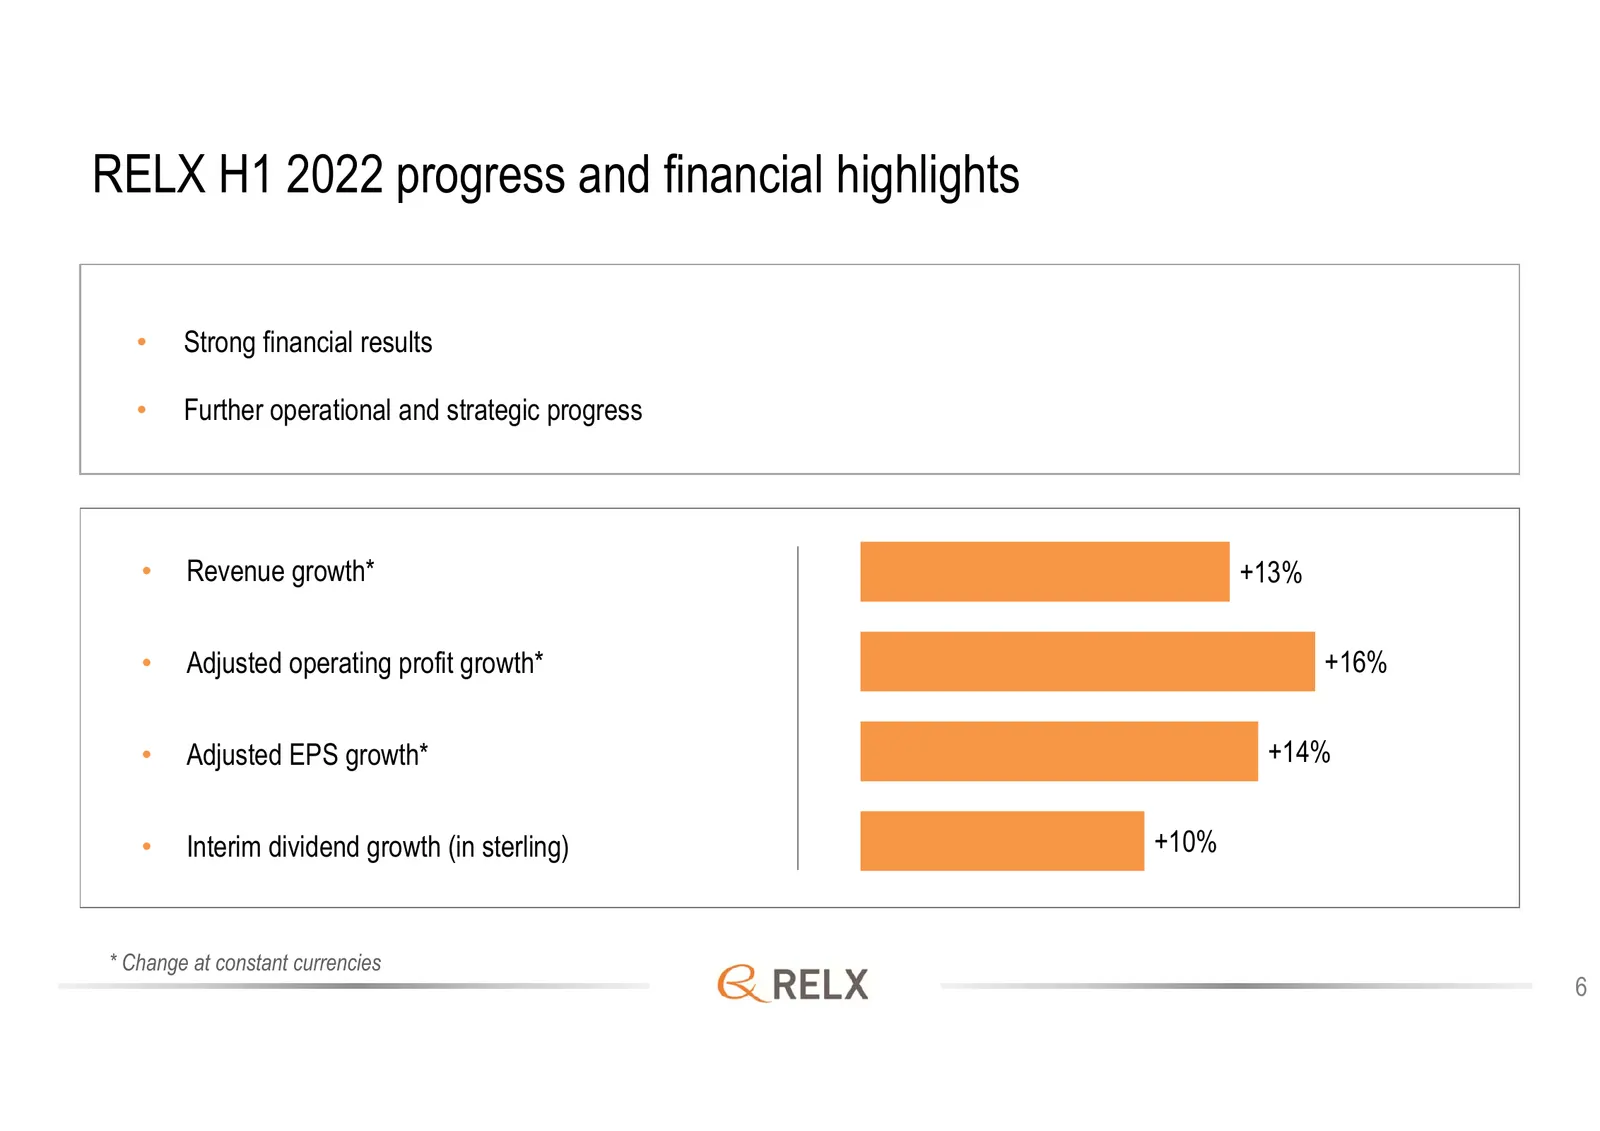
RELX H1 2022 progress and financial highlights • Strong financial results • Further operational and strategic progress • Revenue growth* +13% • Adjusted operating profit growth* +16% • Adjusted EPS growth* +14% • Interim dividend growth (in sterling) +10% * Change at constant currencies 6
Slide 7: RELX revenue by category
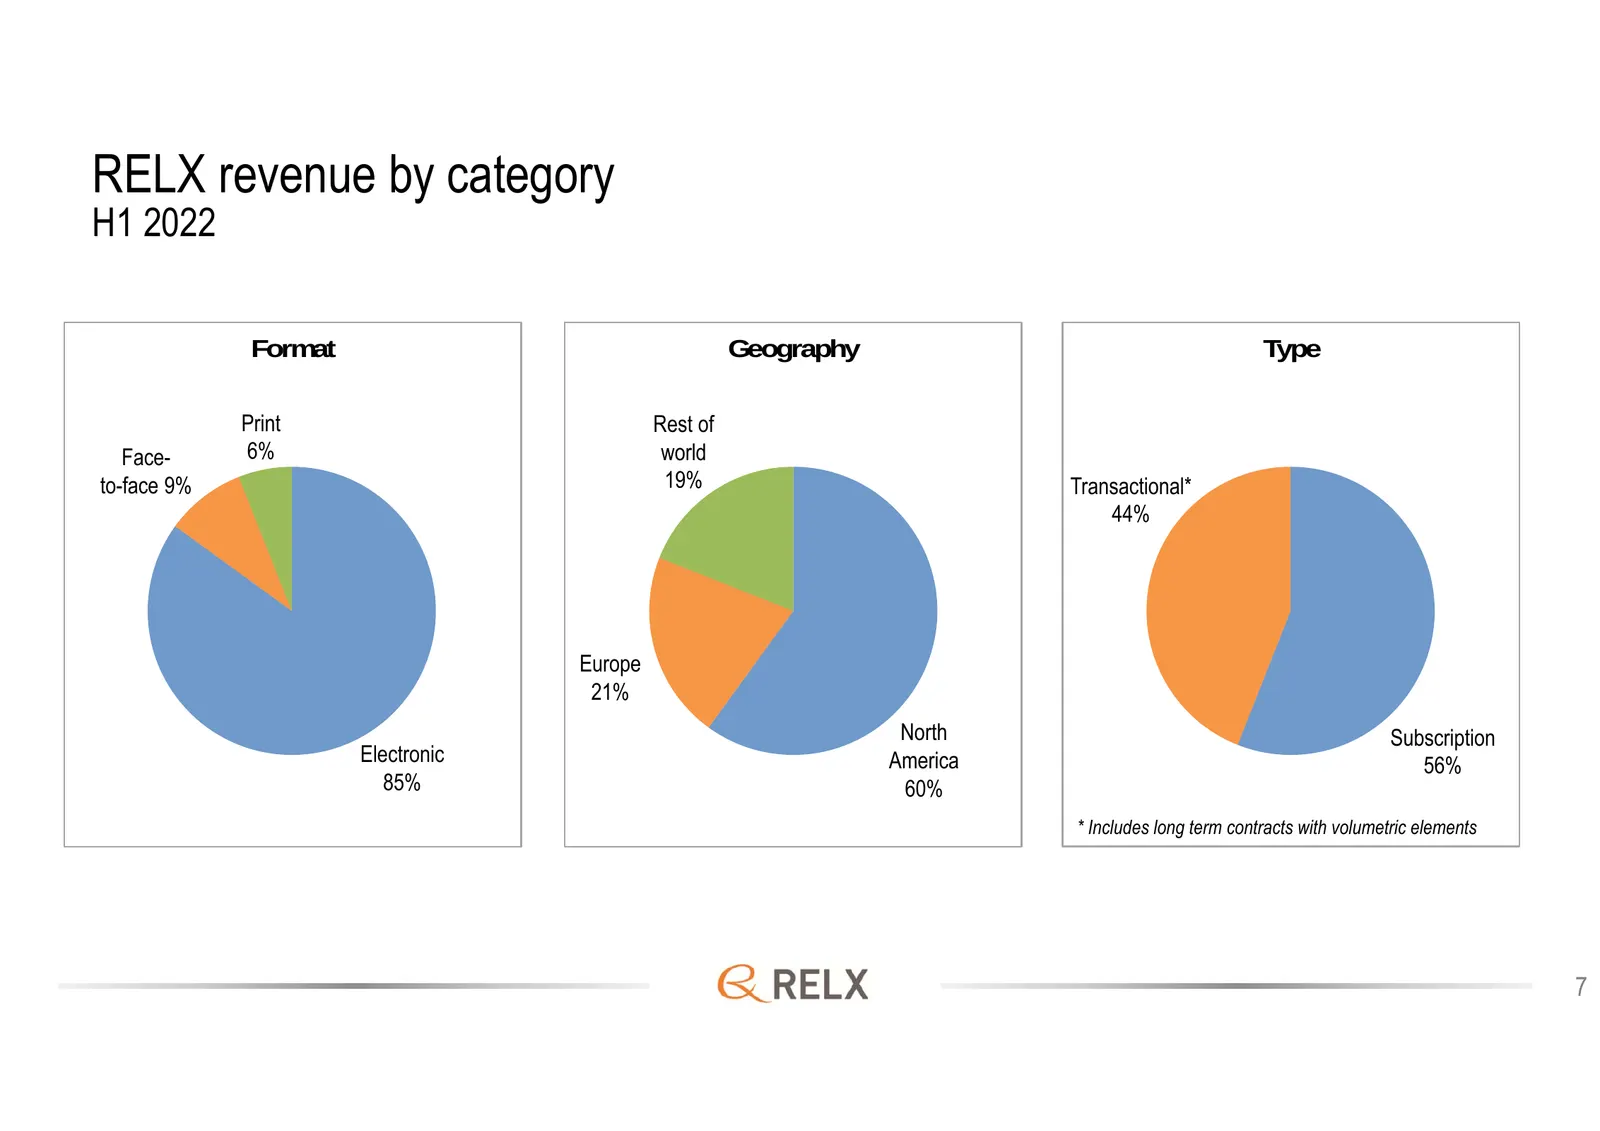
RELX revenue by category H1 2022 Format Geography Type Print Rest of Face- 6% world to-face 9% 19% Transactional* 44% Europe 21% North Subscription Electronic America 56% 85% 60% * Includes long term contracts with volumetric elements 7
Slide 8: RELX revenue by format
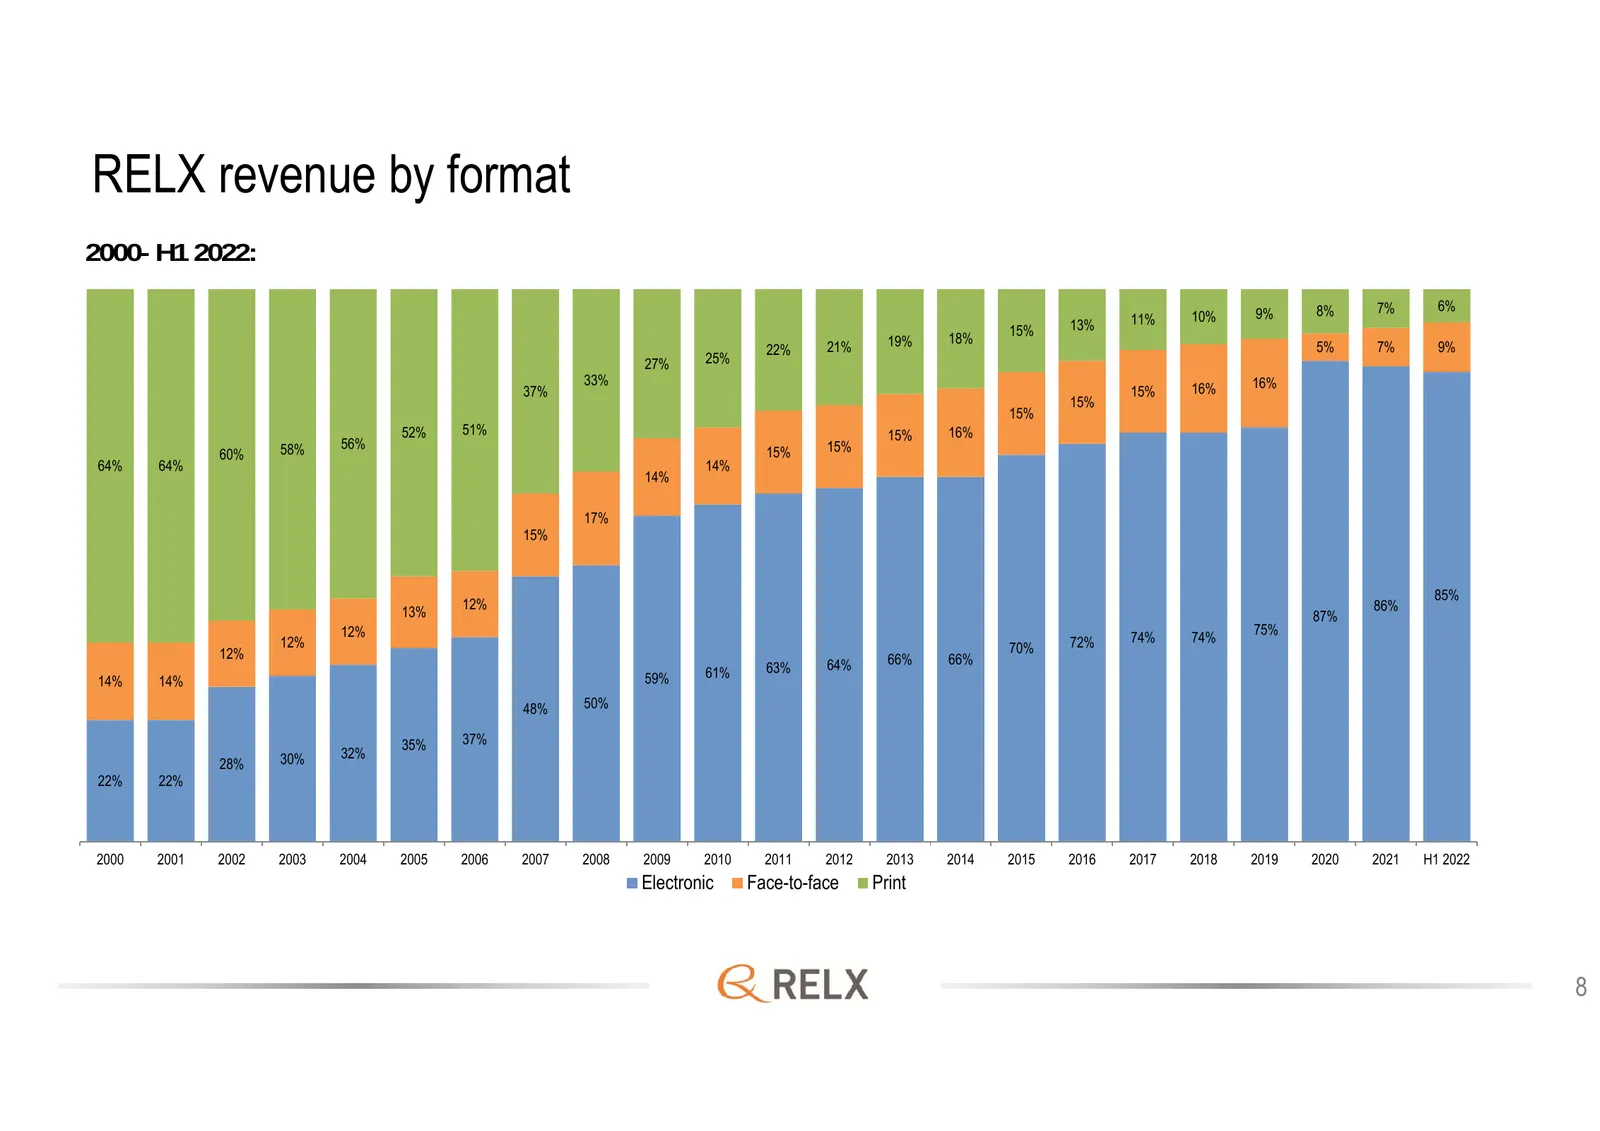
RELX revenue by format 2000- H1 2022: 8% 7% 6% 11% 10% 9% 15% 13% 19% 18% 22% 21% 5% 7% 9% 27% 25% 33% 16% 37% 15% 16% 15% 15% 52% 51% 15% 16% 58% 56% 15% 60% 15% 64% 64% 14% 14% 17% 15% 85% 12% 86% 13% 87% 12% 75% 12% 72% 74% 74% 12% 70% 64% 66% 66% 61% 63% 14% 14% 59% 48% 50% 35% 37% 30% 32% 28% 2
Slide 9: RELX strategic direction
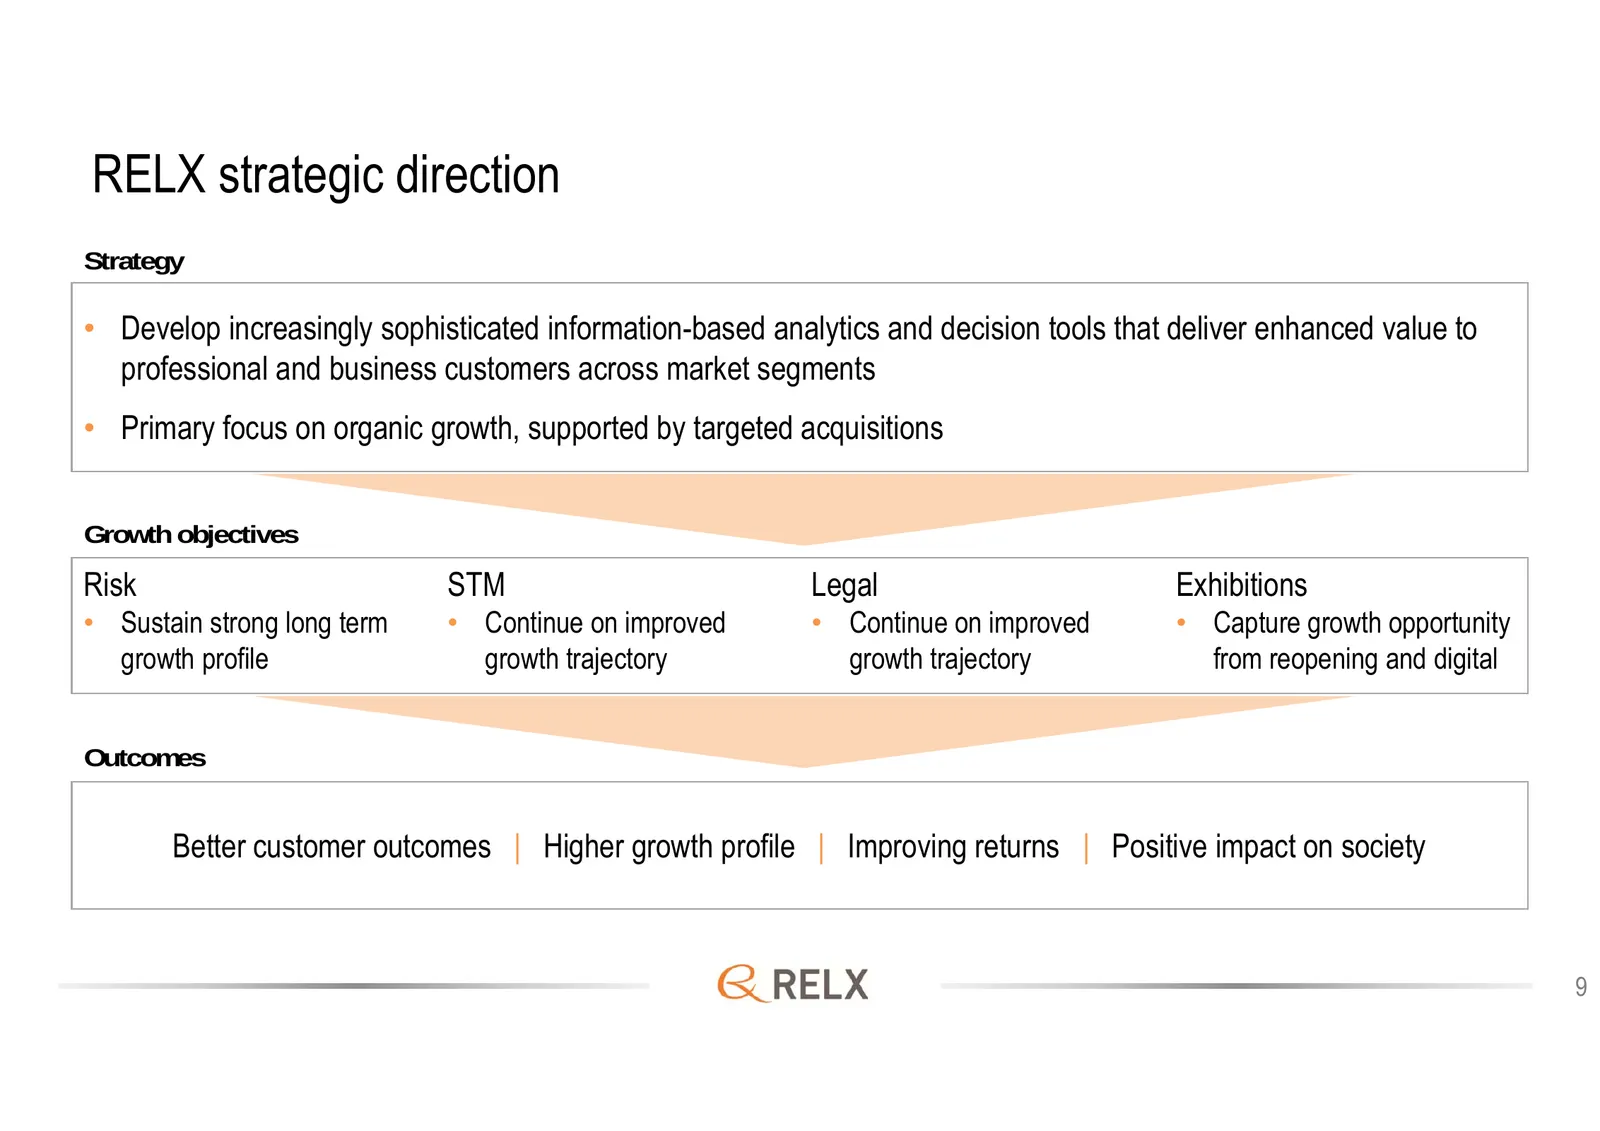
RELX strategic direction Strategy • Develop increasingly sophisticated information-based analytics and decision tools that deliver enhanced value to professional and business customers across market segments • Primary focus on organic growth, supported by targeted acquisitions Growth objectives Risk
Slide 10: Financial performance
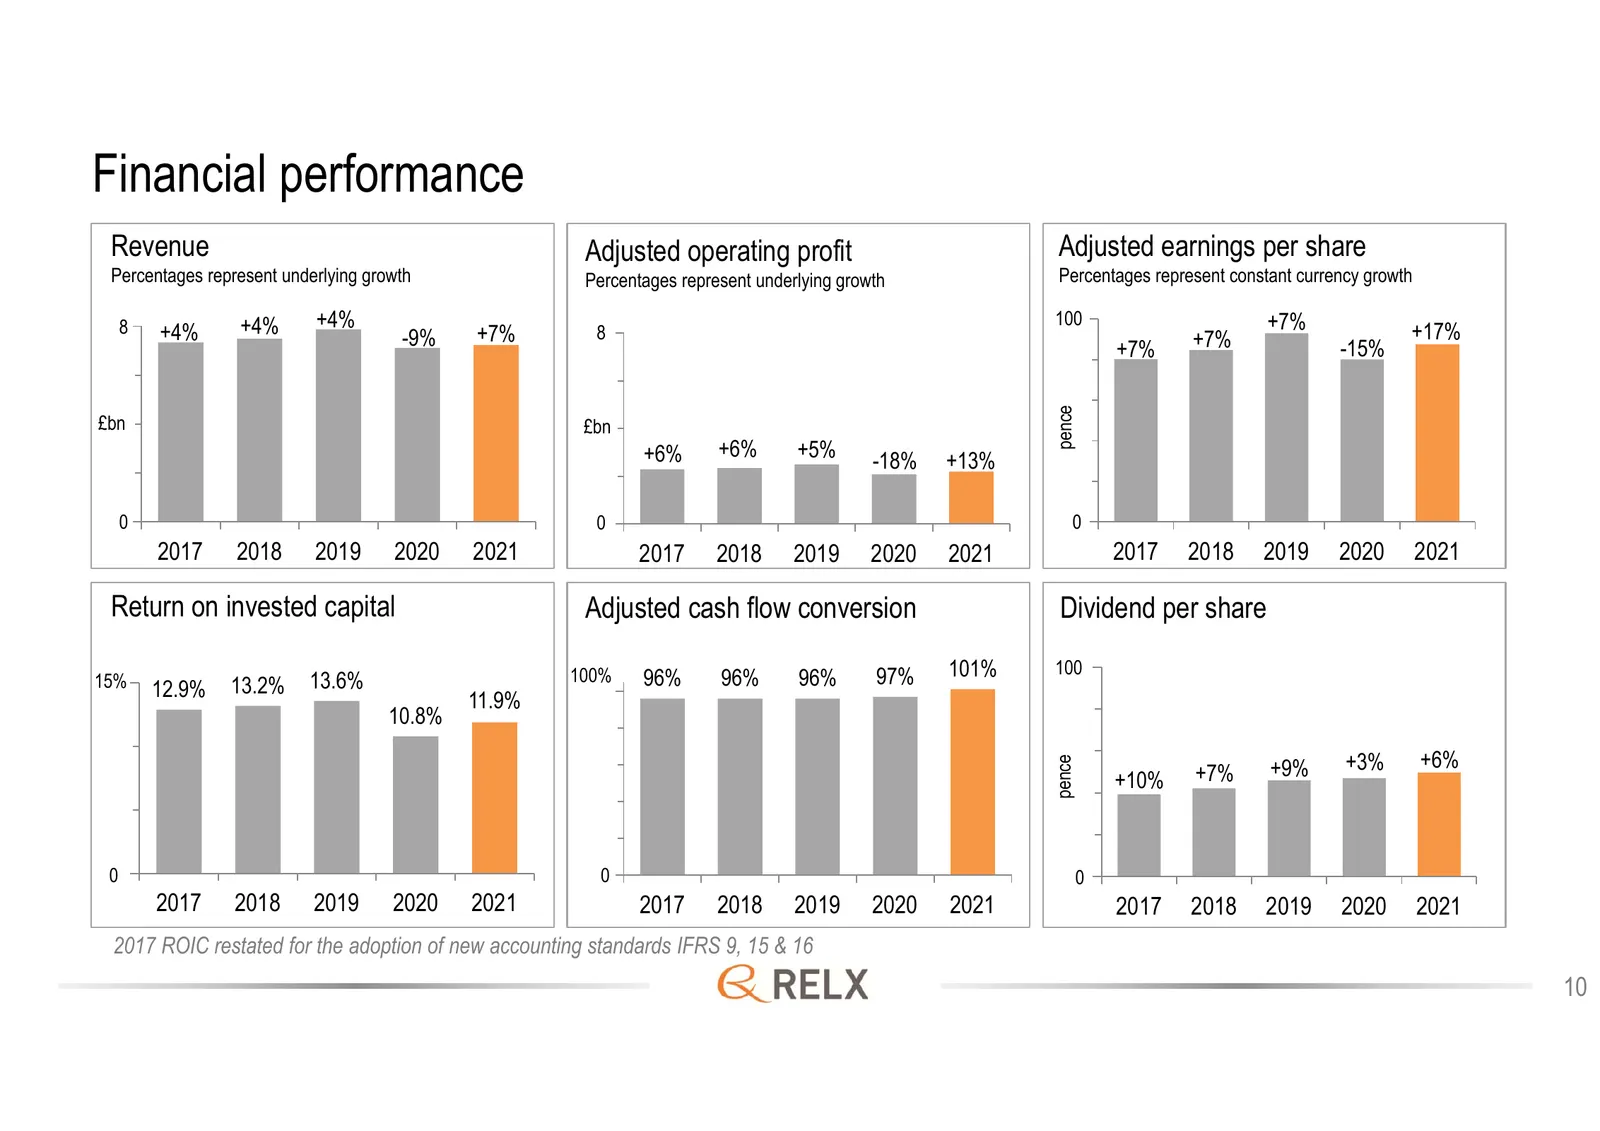
Financial performance Revenue Adjusted operating profit Adjusted earnings per share Percentages represent underlying growth Percentages represent underlying growth Percentages represent constant currency growth 8 +4% +4% 100 +7% +4% -9% +7% 8 +7% +17% +7% -15% pence £bn £bn +6% +6% +5% +13% -18% 0 0
Slide 11: Uses of cash - priorities
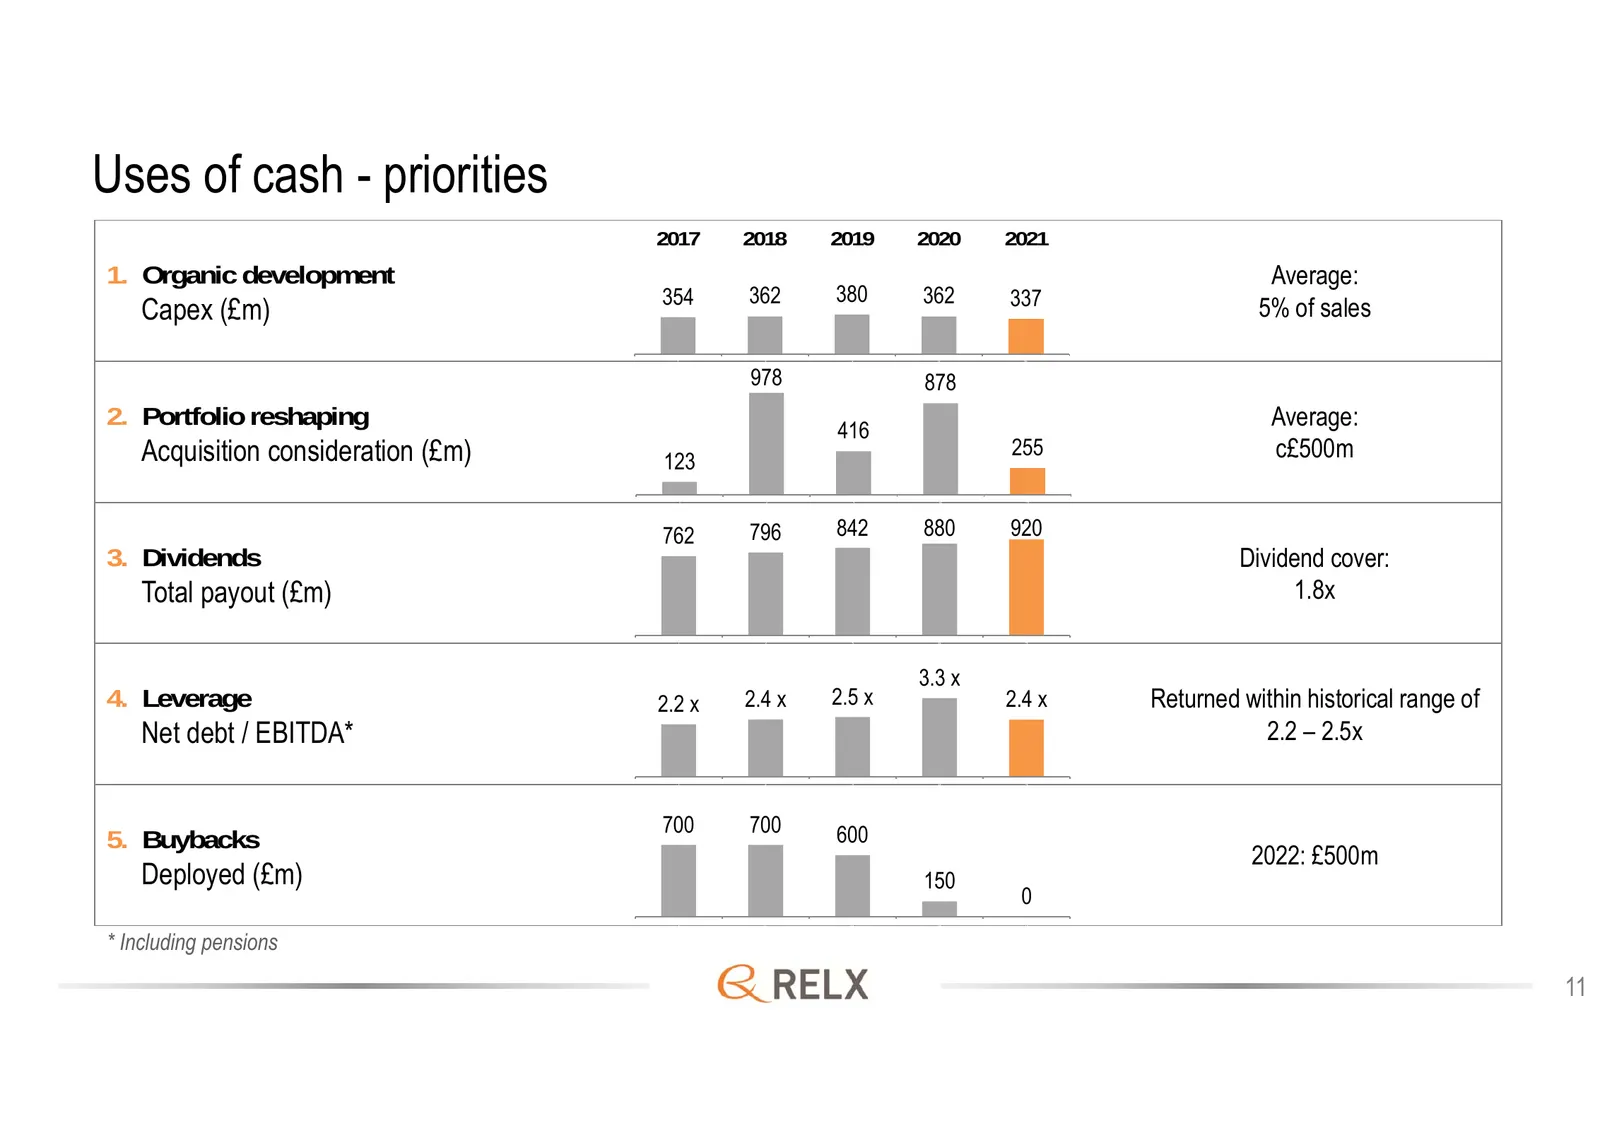
Uses of cash - priorities 2017 2018 2019 2020 2021 1. Organic development Average: 354 362 380 362 337 Capex (£m) 5% of sales 1 2 3 4 5 978 878 2. Portfolio reshaping 416 Average: Acquisition consideration (£m) 123 255 c£500m 1 2 3 4 5 762 796 842 880 920 3. Dividends Dividend cover: Total payout (£
Slide 12: Overview of business areas
Overview of business areas 12
Slide 13: RELX revenue by segment
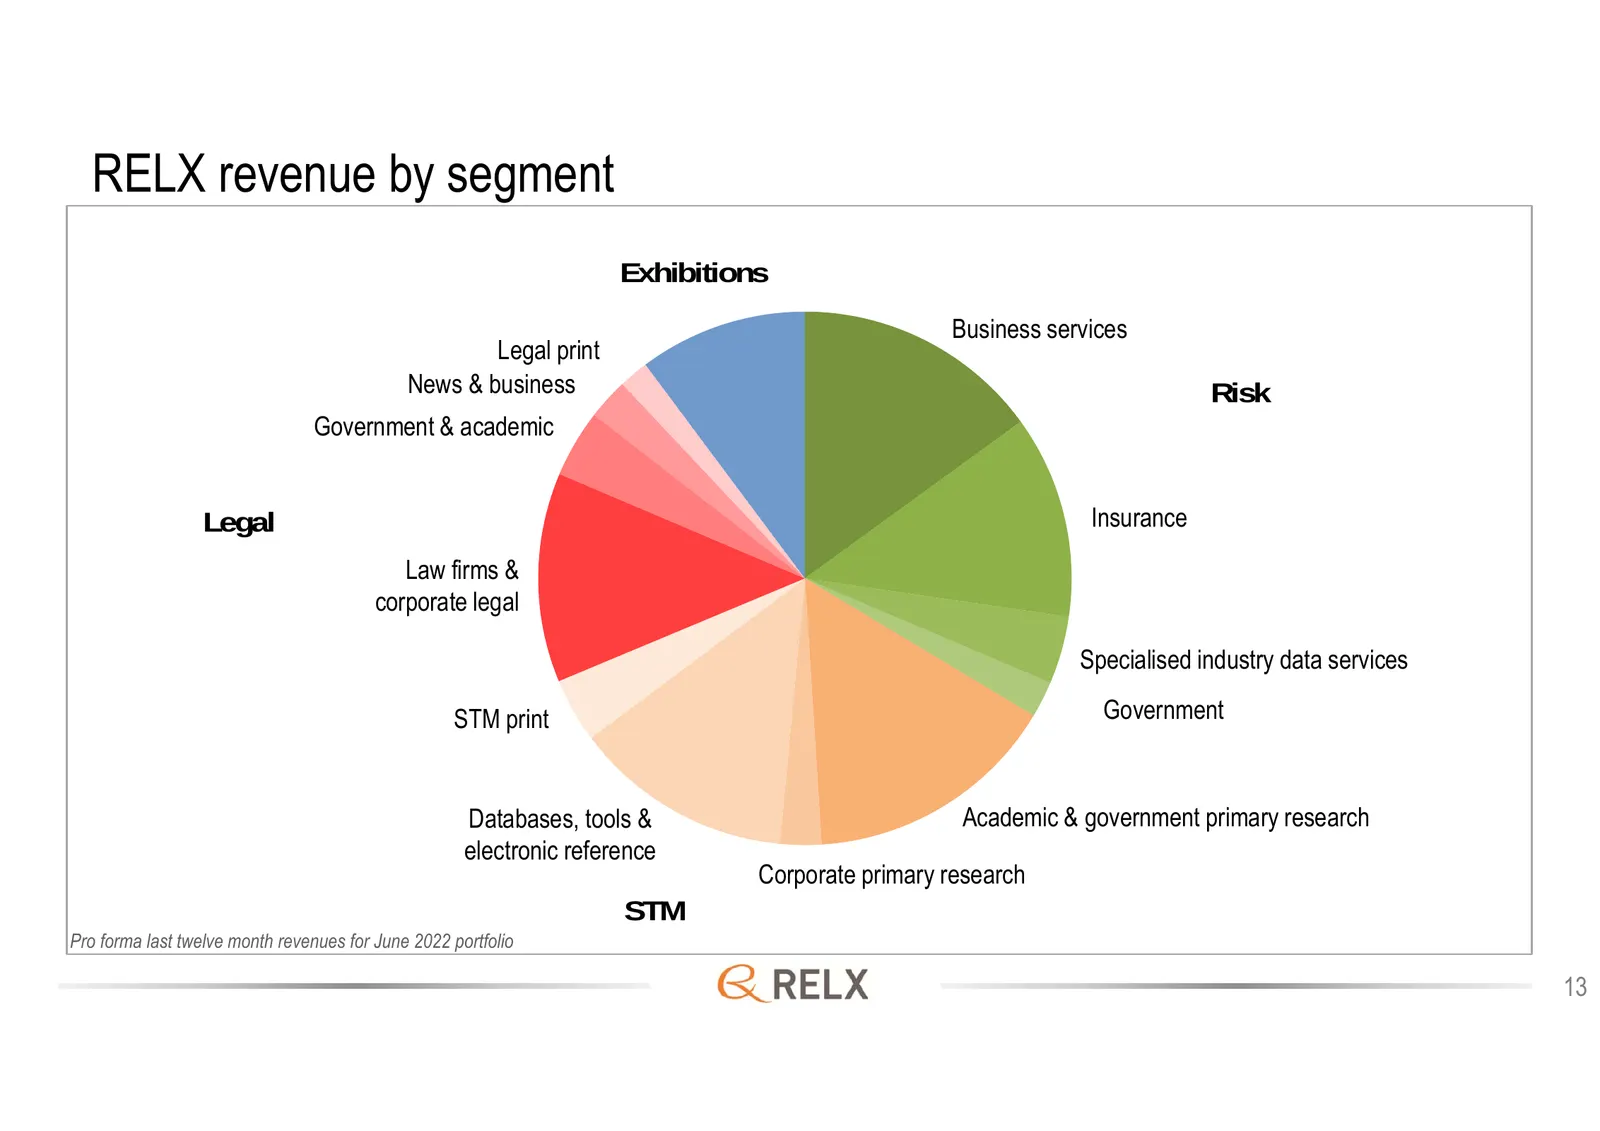
RELX revenue by segment Exhibitions Business services Legal print News & business Risk Government & academic Legal Insurance Law firms & corporate legal Specialised industry data services STM print Government Databases, tools & Academic & government primary research electronic reference Corporate pr
Slide 14: RELX revenue by segment 2021
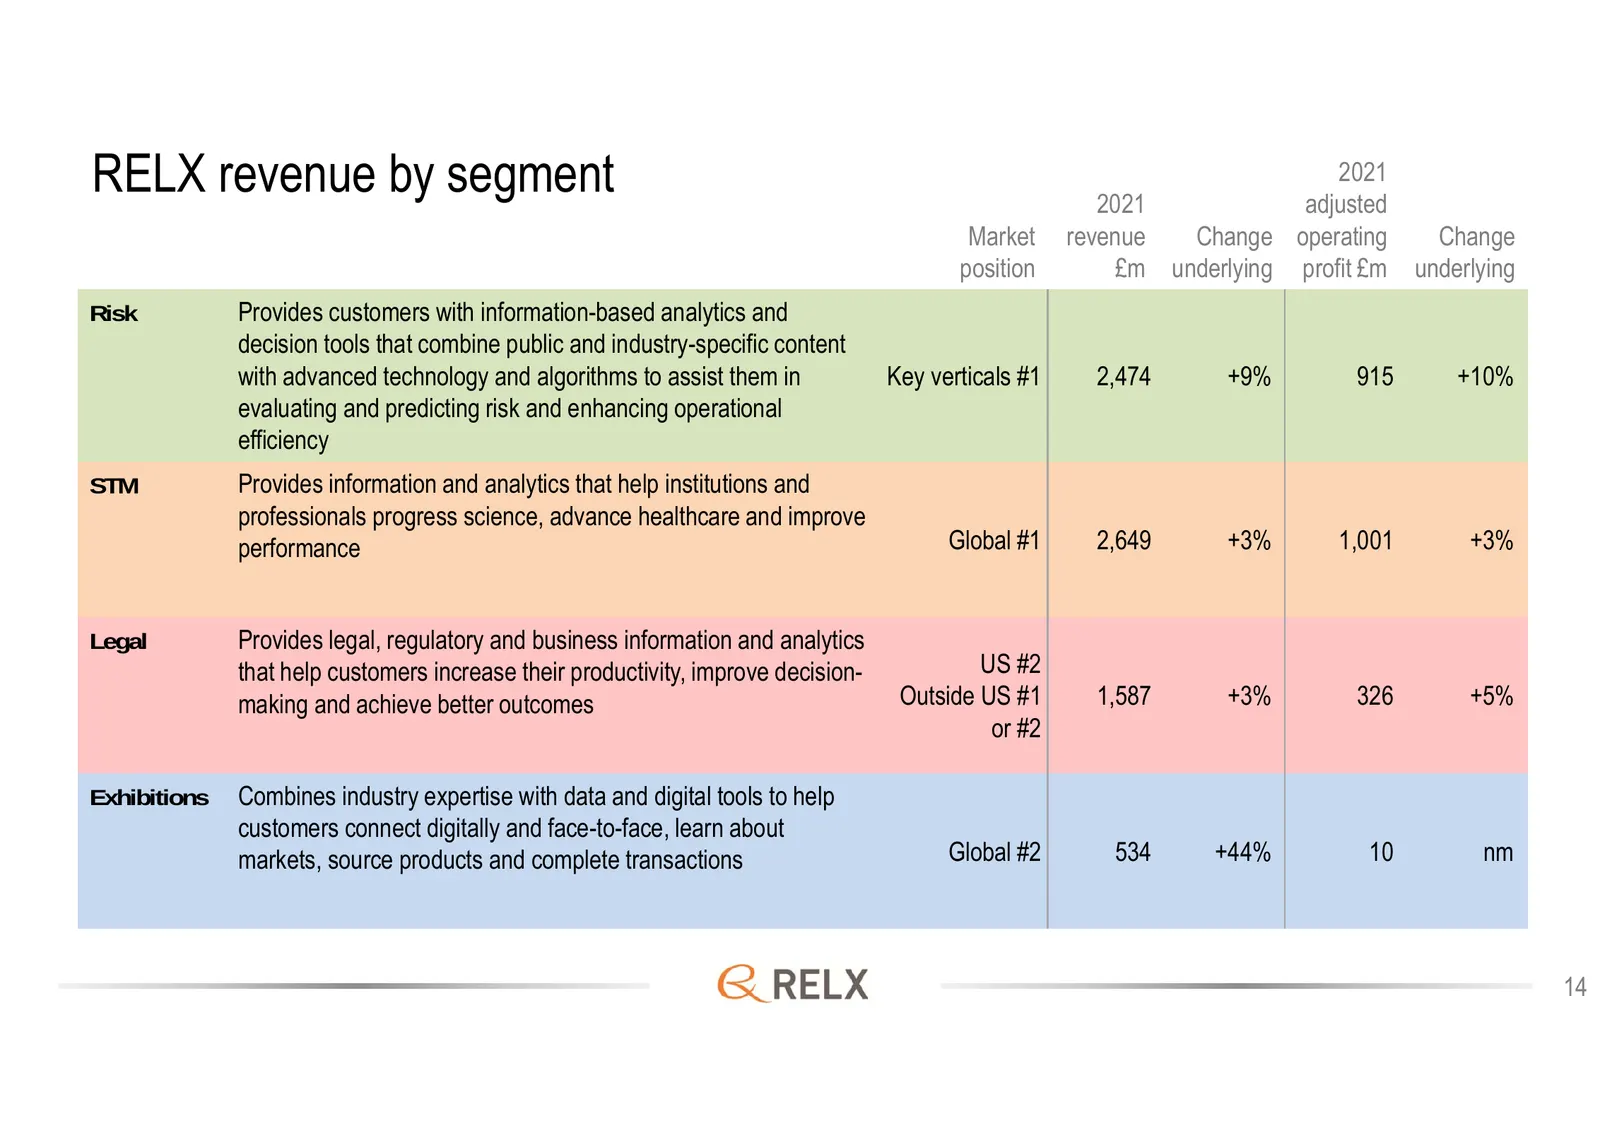
RELX revenue by segment 2021 2021 adjusted Market revenue Change operating Change position £m underlying profit £m underlying Risk Provides customers with information-based analytics and decision tools that combine public and industry-specific content with advanced technology and algorithms to assis
Slide 15: Risk
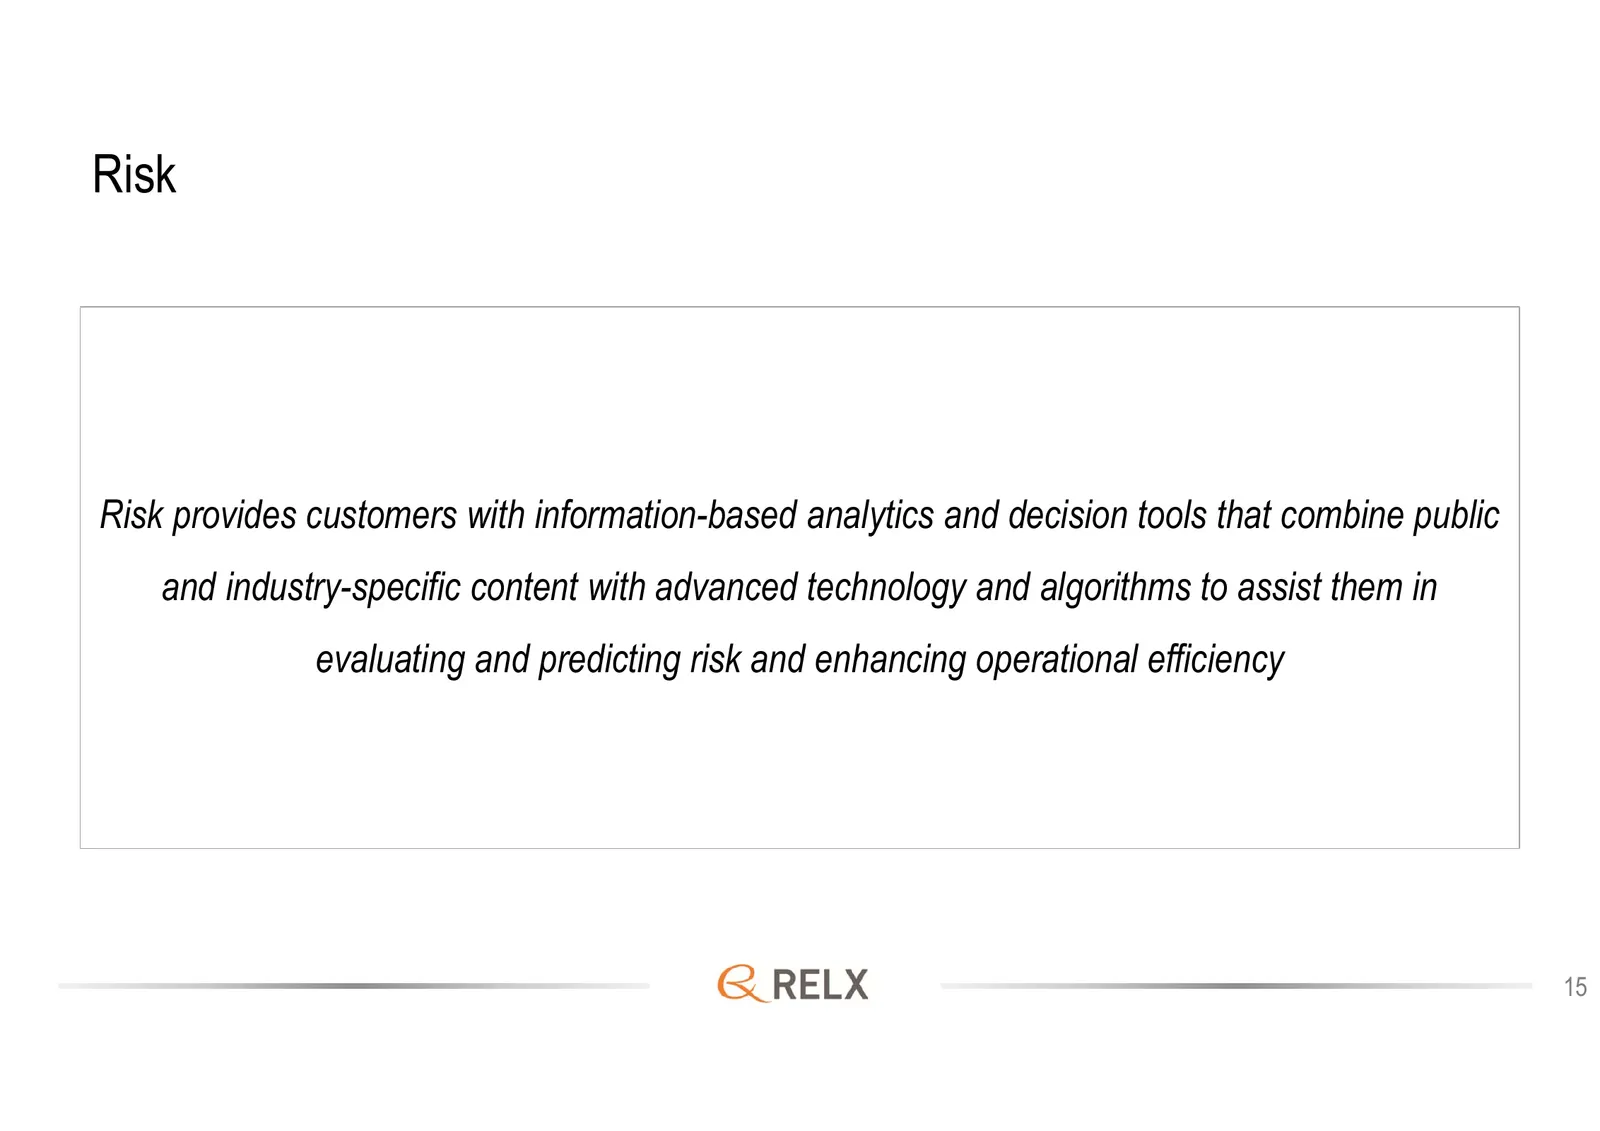
Risk Risk provides customers with information-based analytics and decision tools that combine public and industry-specific content with advanced technology and algorithms to assist them in evaluating and predicting risk and enhancing operational efficiency 15
Slide 16: Risk: revenue by segment
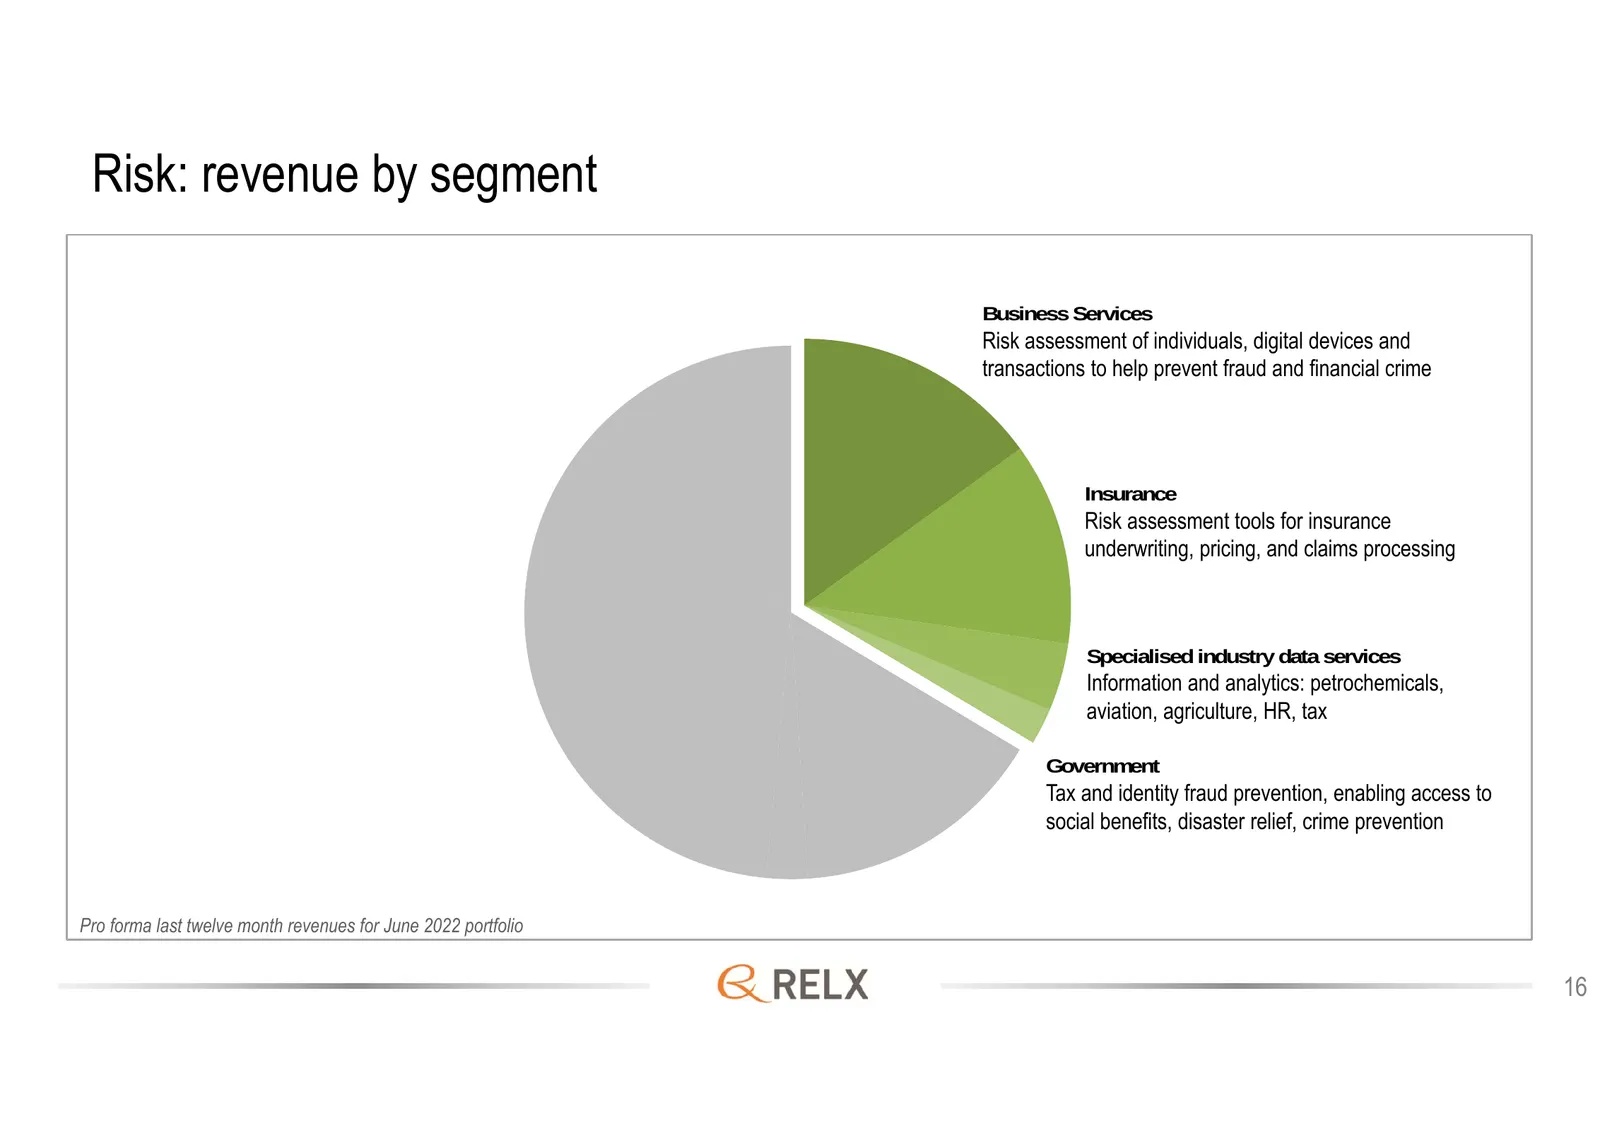
Risk: revenue by segment Business Services Risk assessment of individuals, digital devices and transactions to help prevent fraud and financial crime Insurance Risk assessment tools for insurance underwriting, pricing, and claims processing Specialised industry data services Information and analytic
Slide 17: Risk: H1 2022 revenue
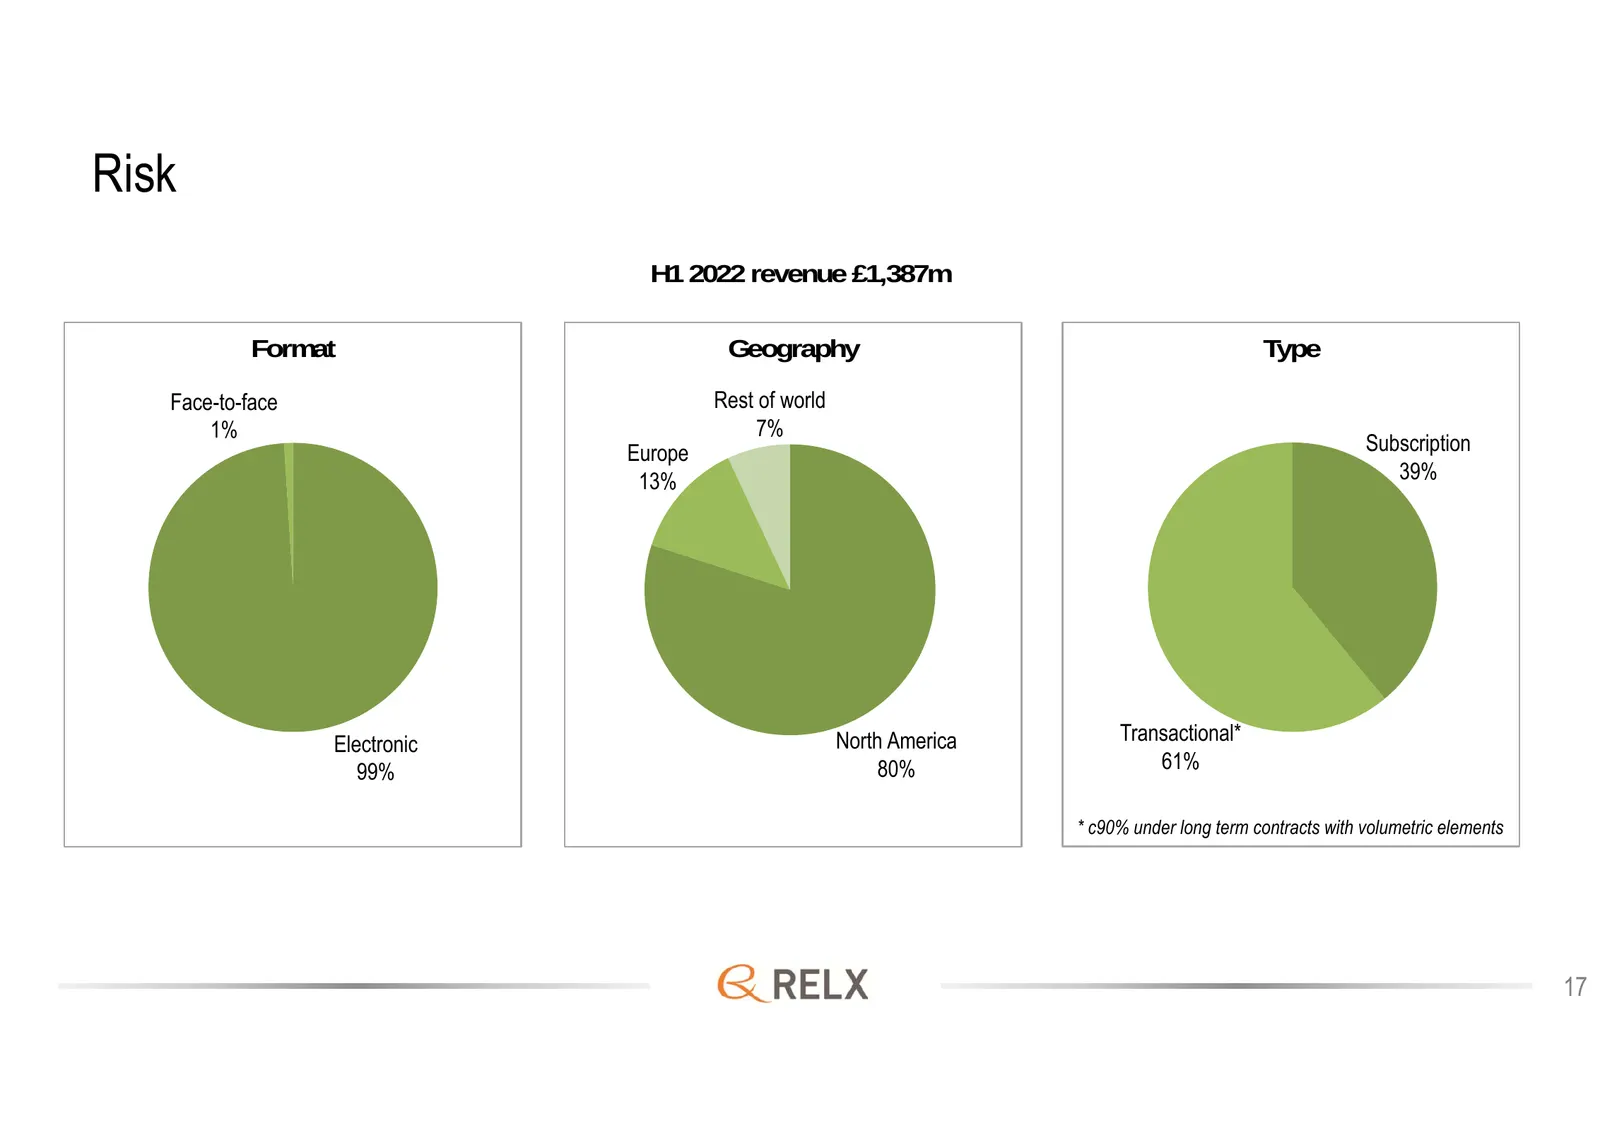
Risk H1 2022 revenue £1,387m Format Geography Type Face-to-face Rest of world 1% 7% Europe Subscription 13% 39% Electronic North America Transactional* 99% 80% 61% * c90% under long term contracts with volumetric elements 17
Slide 18: Risk: underlying growth rates
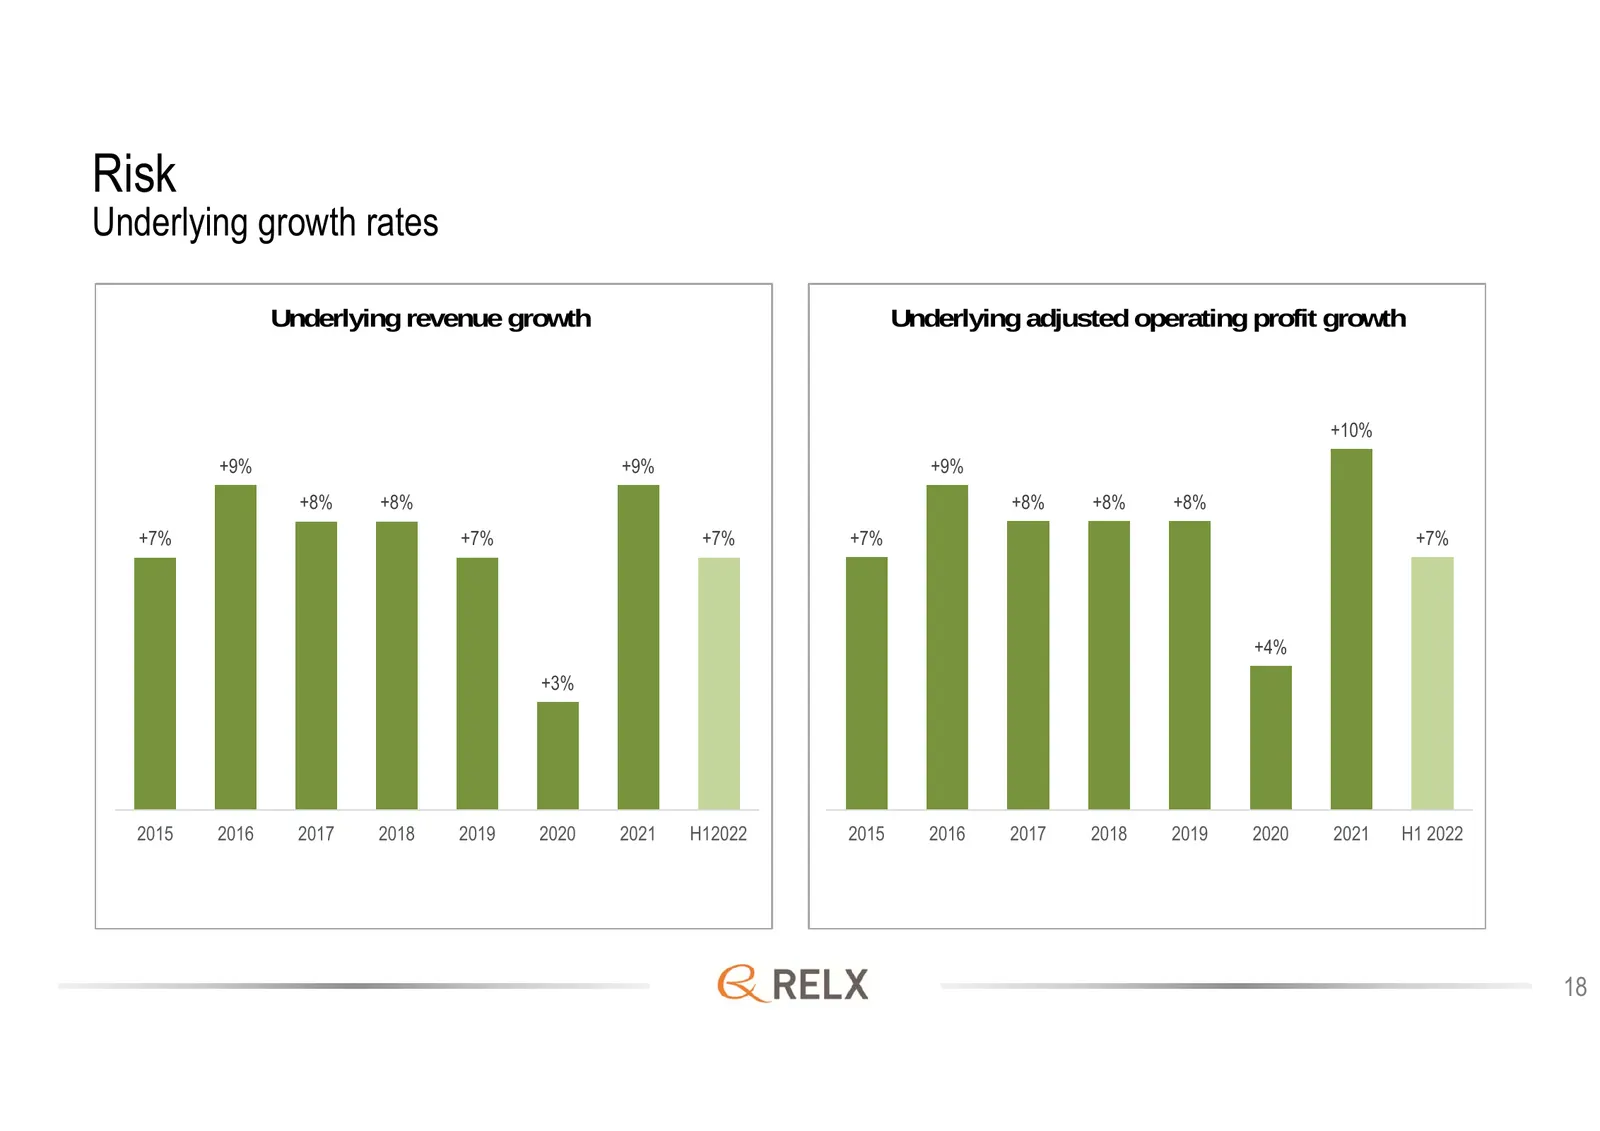
Risk Underlying growth rates Underlying revenue growth Underlying adjusted operating profit growth +10% +9% +9% +9% +8% +8% +8% +8% +8% +7% +7% +7% +7% +7% +4% +3% 2015 2016 2017 2018 2019 2020 2021 H12022 2015 2016 2017 2018 2019 2020 2021 H1 2022 18
Slide 19: Risk underlying revenue growth
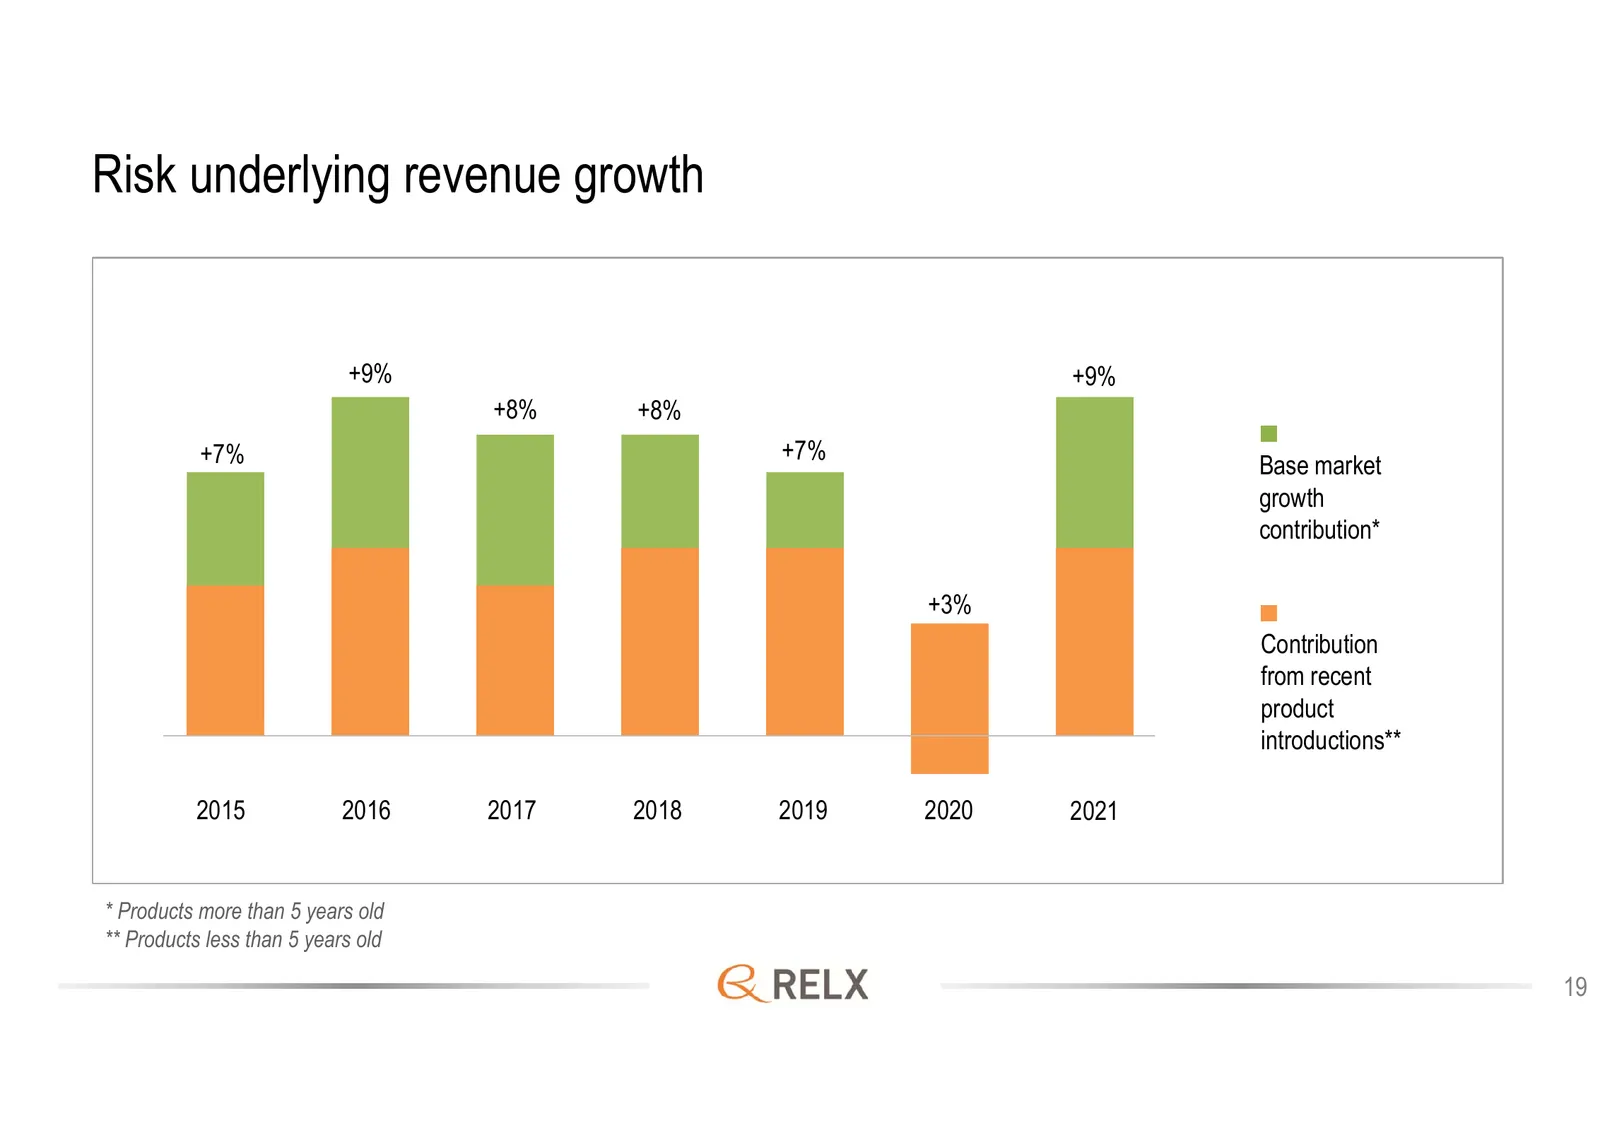
Risk underlying revenue growth +9% +9% +8% +8% +7% +7% Base market growth contribution* +3% Contribution from recent product introductions** 2015 2016 2017 2018 2019 2020 2021 * Products more than 5 years old ** Products less than 5 years old 19
Slide 20: Risk: our four key capabilities
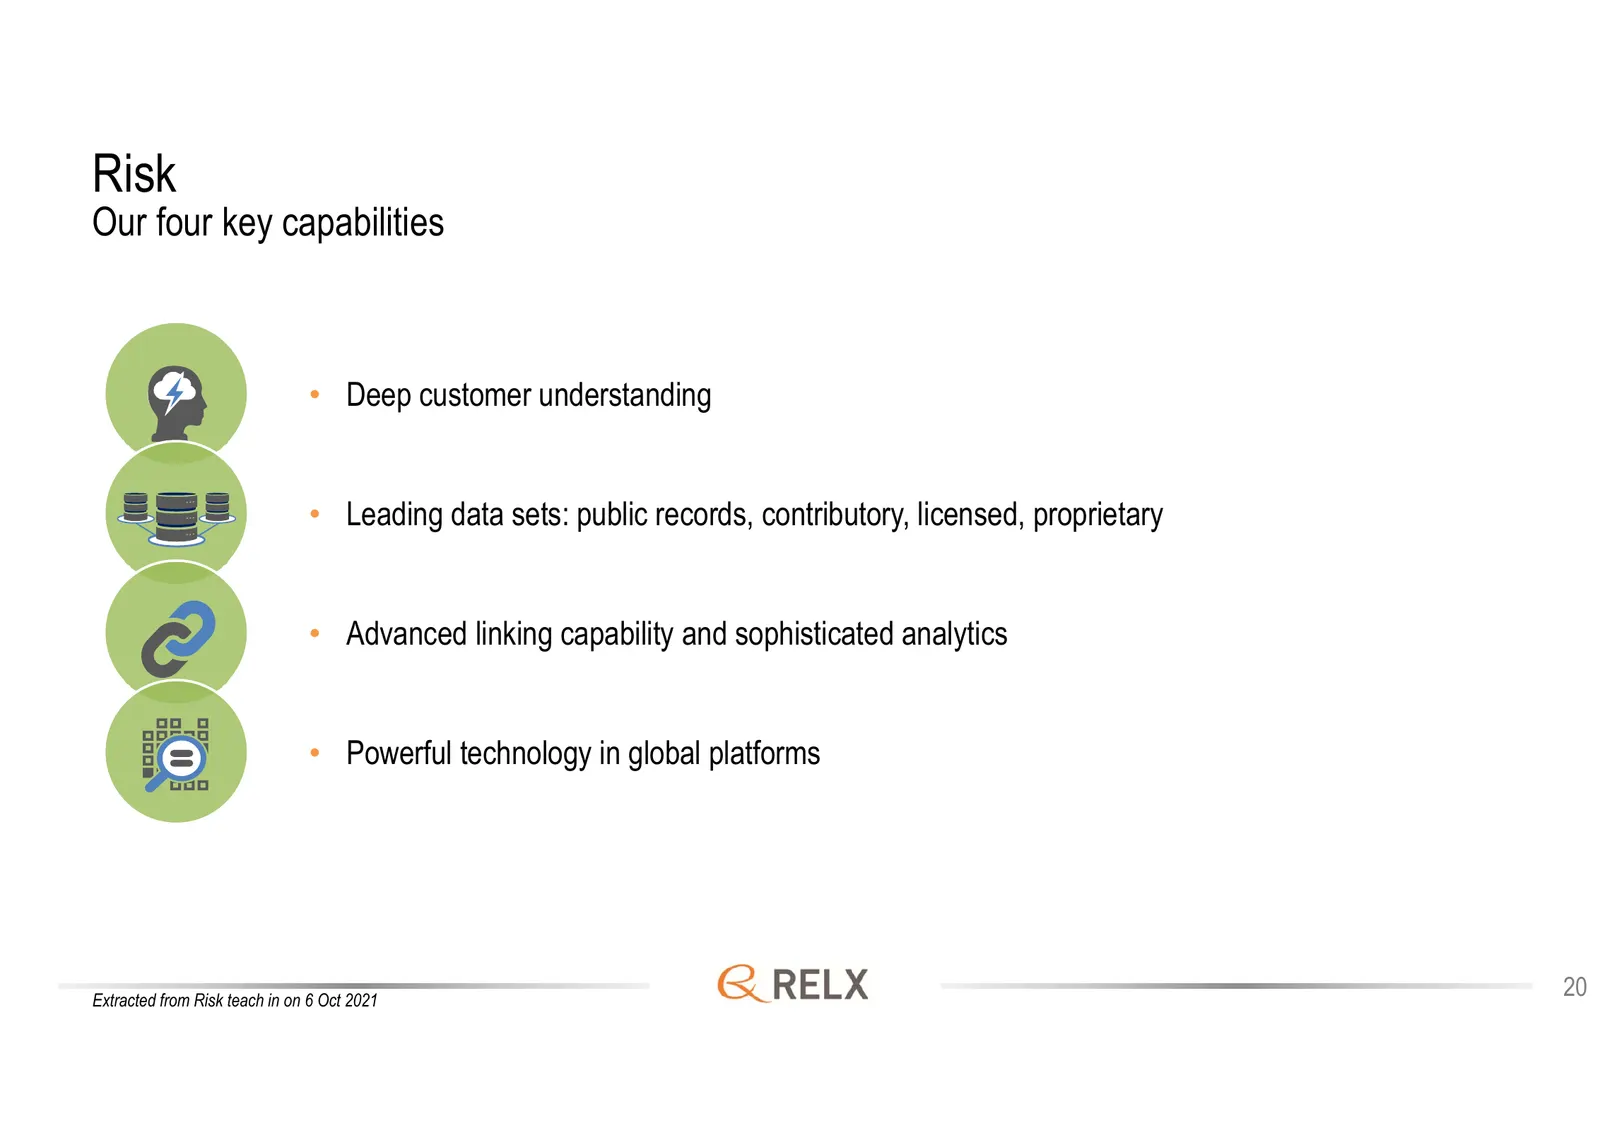
Risk Our four key capabilities • Deep customer understanding • Leading data sets: public records, contributory, licensed, proprietary • Advanced linking capability and sophisticated analytics • Powerful technology in global platforms Extracted from Risk teach in on 6 Oct 2021 20
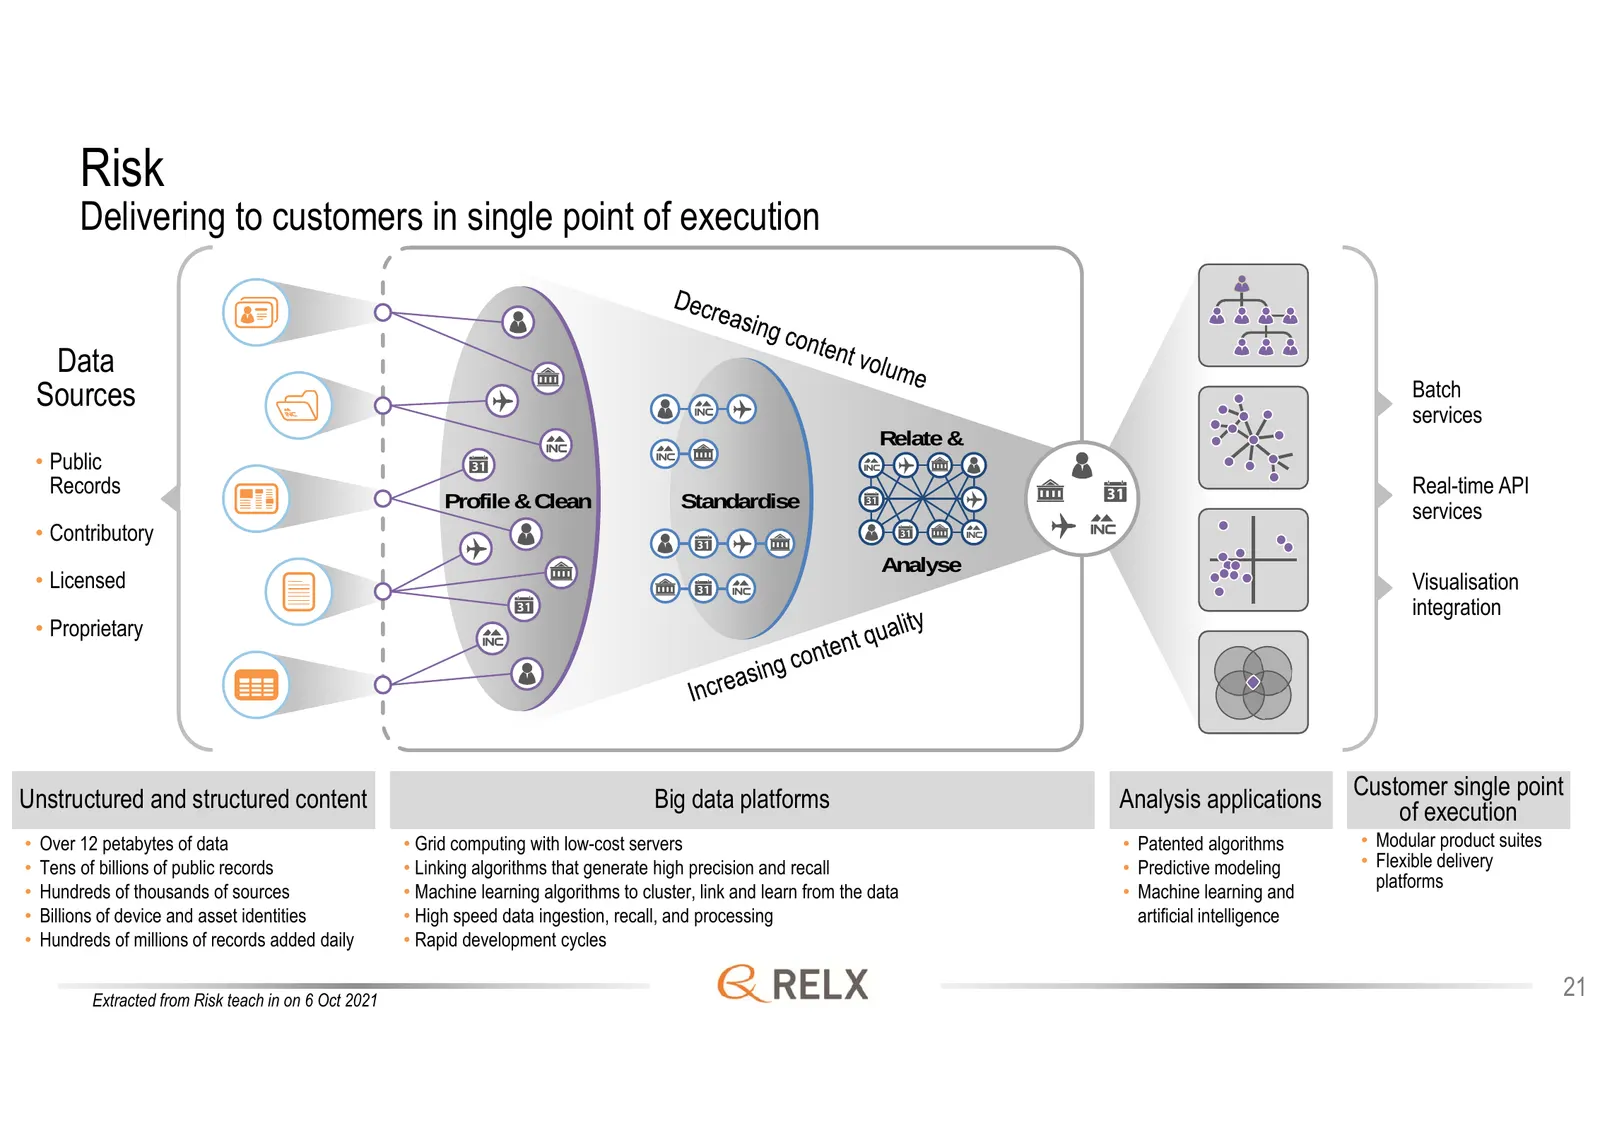
Slide 21: Risk: delivering to customers in single point of execution
Risk Delivering to customers in single point of execution Data Sources Batch services Relate & • Public Records Real-time API Profile & Clean Standardise services • Contributory Analyse • Licensed Visualisation integration • Proprietary Unstructured and structured content Big data platforms Analysis
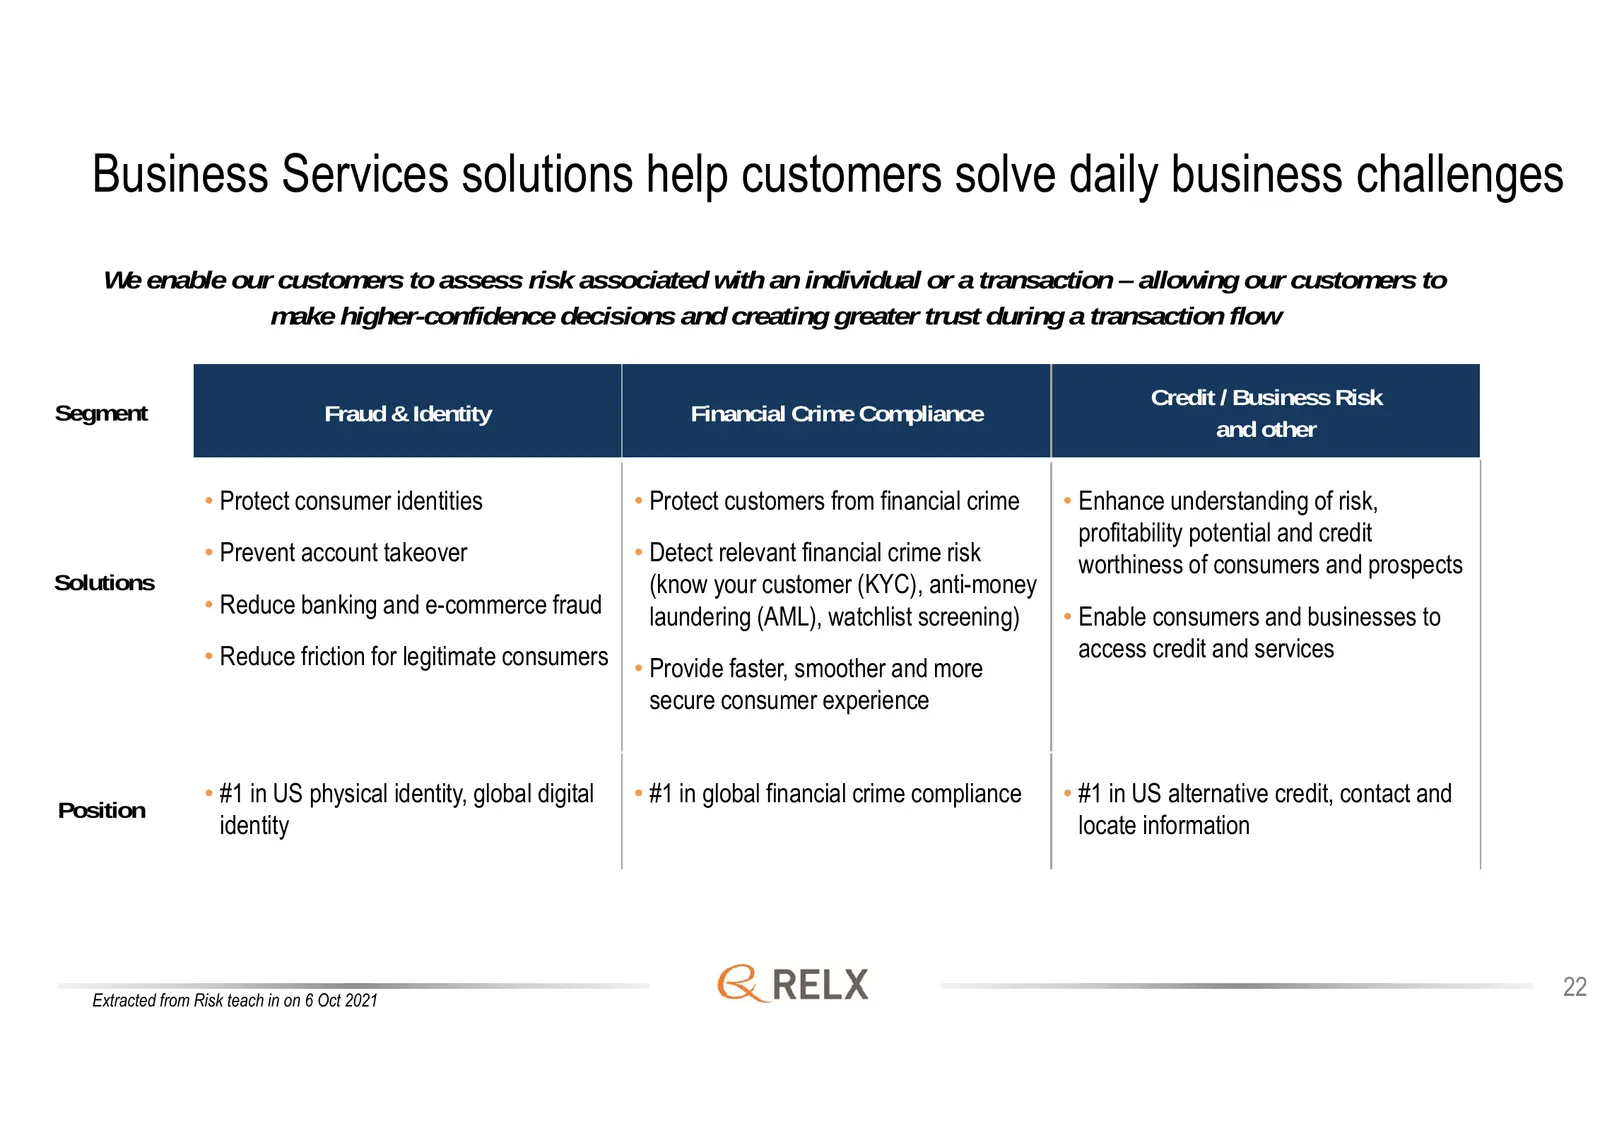
Slide 22: Business Services solutions help customers solve daily business challenges
Business Services solutions help customers solve daily business challenges We enable our customers to assess risk associated with an individual or a transaction – allowing our customers to make higher-confidence decisions and creating greater trust during a transaction flow Credit / Business Risk Se
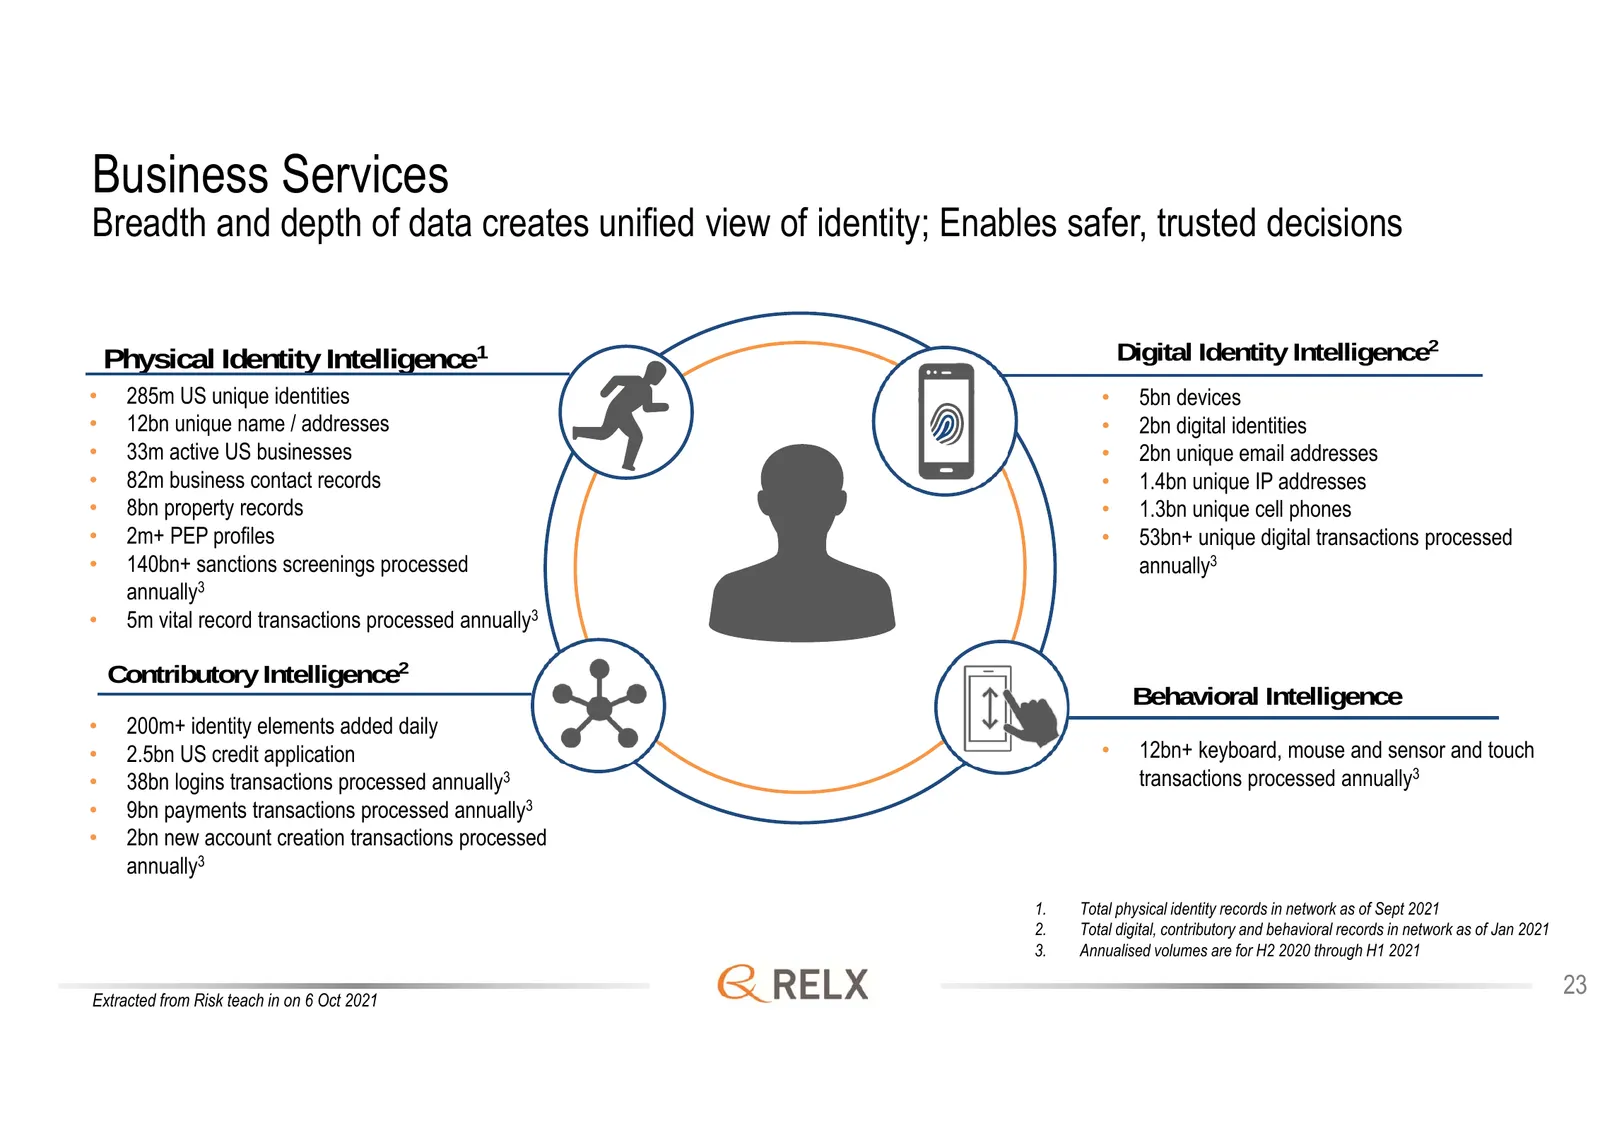
Slide 23: Business Services
Business Services Breadth and depth of data creates unified view of identity; Enables safer, trusted decisions Physical Identity Intelligence1 Digital Identity Intelligence2 • 285m US unique identities • 5bn devices • 12bn unique name / addresses • 2bn digital identities • 33m active US businesses •
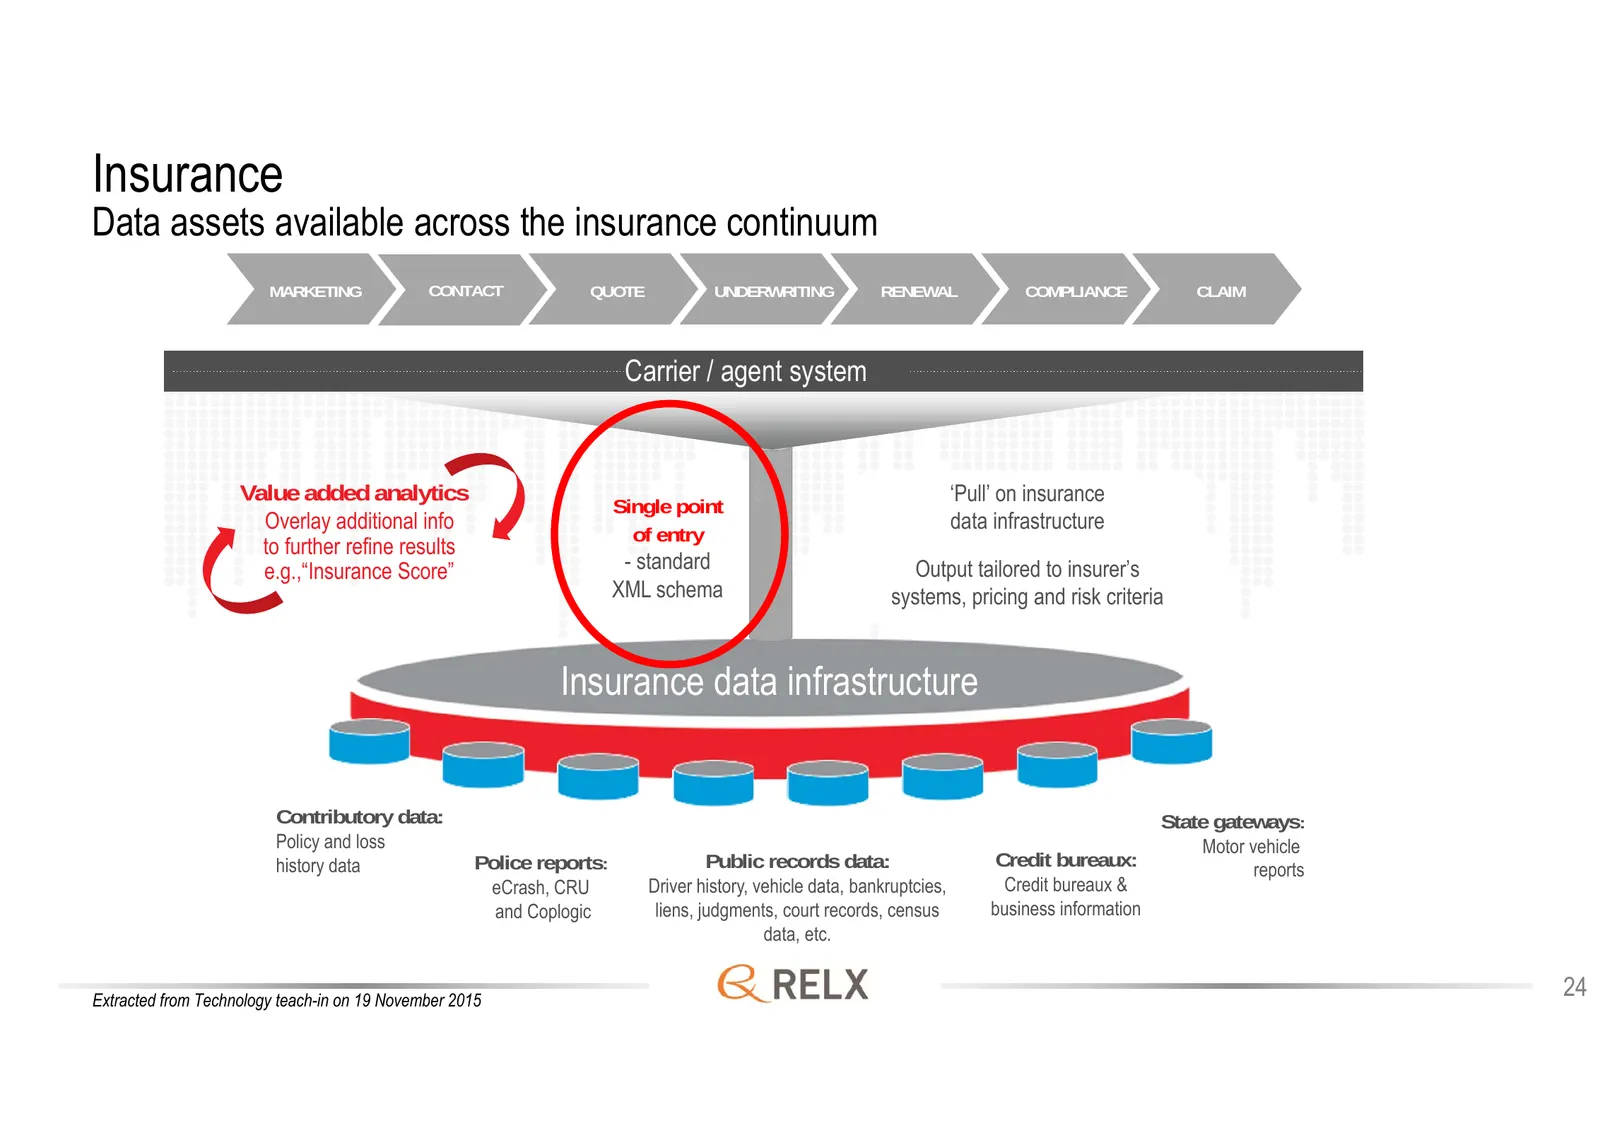
Slide 24: Insurance
Insurance Data assets available across the insurance continuum MARKETING CONTACT QUOTE QUOTE UNDERWRITING UNDERWRITING RENEWAL RENEWAL COMPLIANCE CLAIM Carrier / agent system Value added analytics Single point ‘Pull’ on insurance Overlay additional info data infrastructure of entry to further refine
Slide 25: Scientific, Technical & Medical
Scientific, Technical & Medical Scientific, Technical & Medical provides information and analytics that help institutions and professionals progress science, advance healthcare and improve performance 25
Slide 26: Scientific, Technical & Medical: revenue by segment
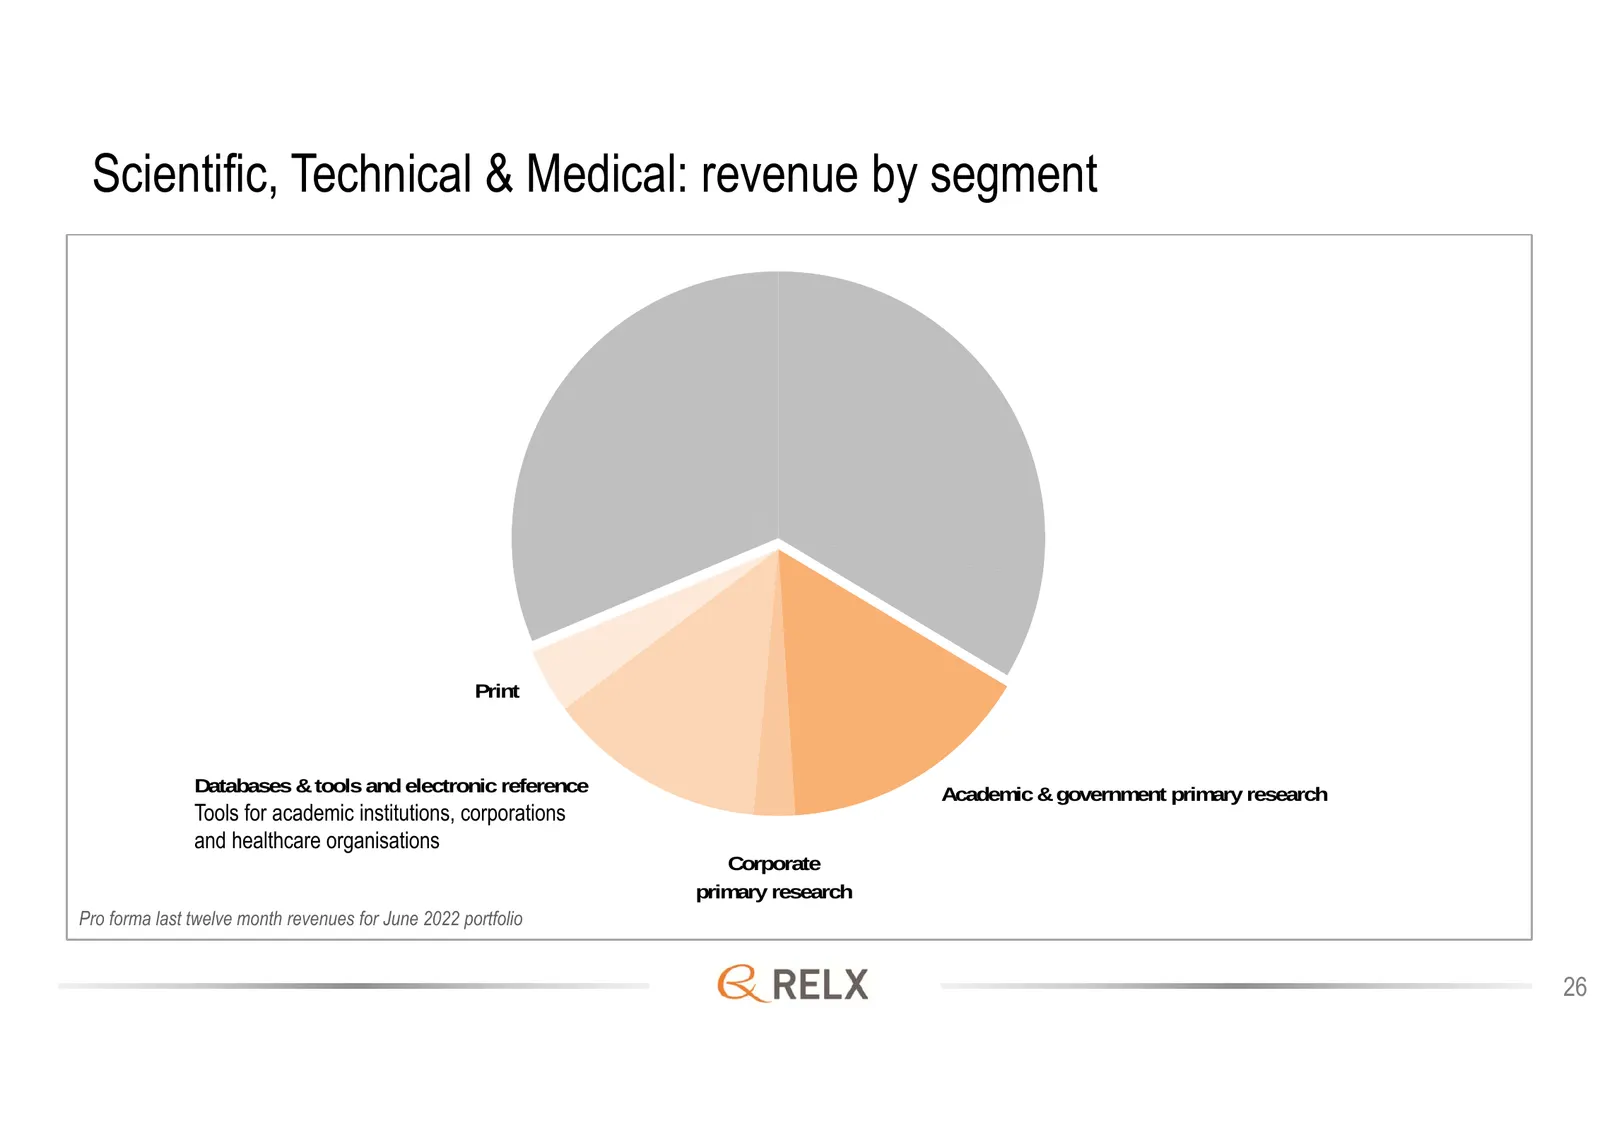
Scientific, Technical & Medical: revenue by segment Print Databases & tools and electronic reference Academic & government primary research Tools for academic institutions, corporations and healthcare organisations Corporate primary research Pro forma last twelve month revenues for June 2022 portfol
Slide 27: Scientific, Technical & Medical: H1 2022 revenue
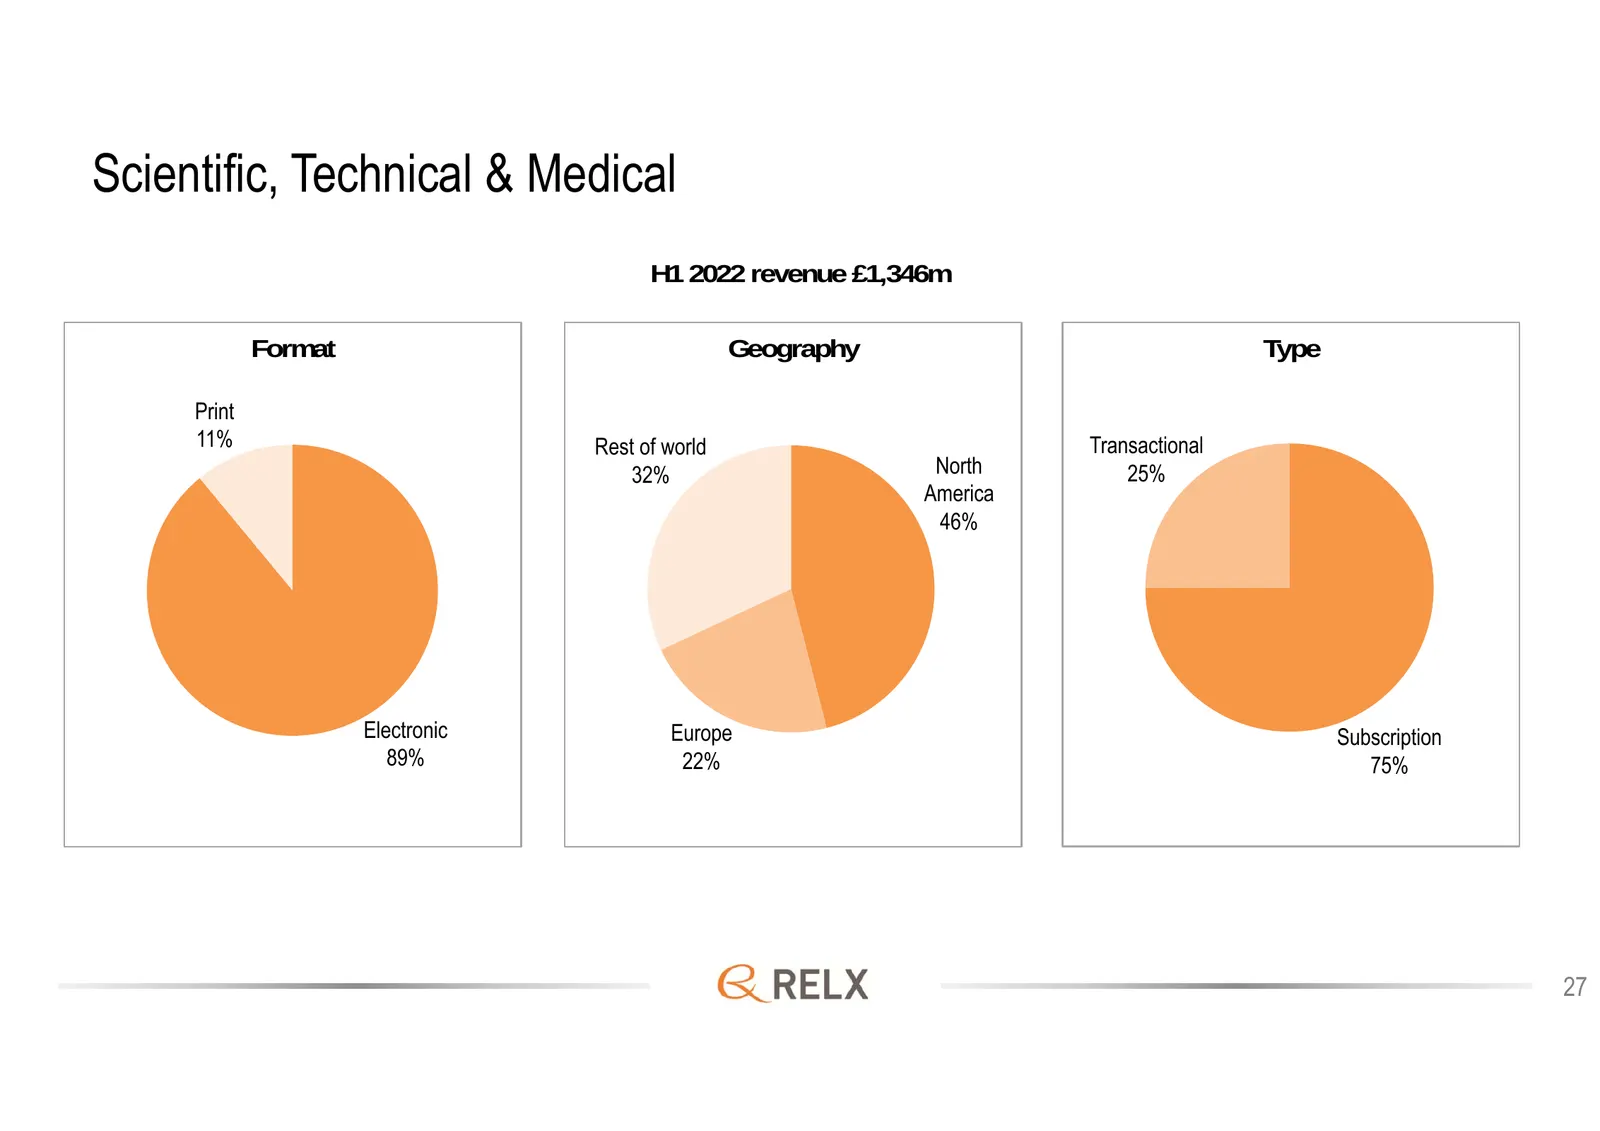
Scientific, Technical & Medical H1 2022 revenue £1,346m Format Geography Type Print 11% Rest of world Transactional 32% North 25% America 46% Electronic Europe Subscription 89% 22% 75% 27
Slide 28: Scientific, Technical & Medical: underlying growth rates
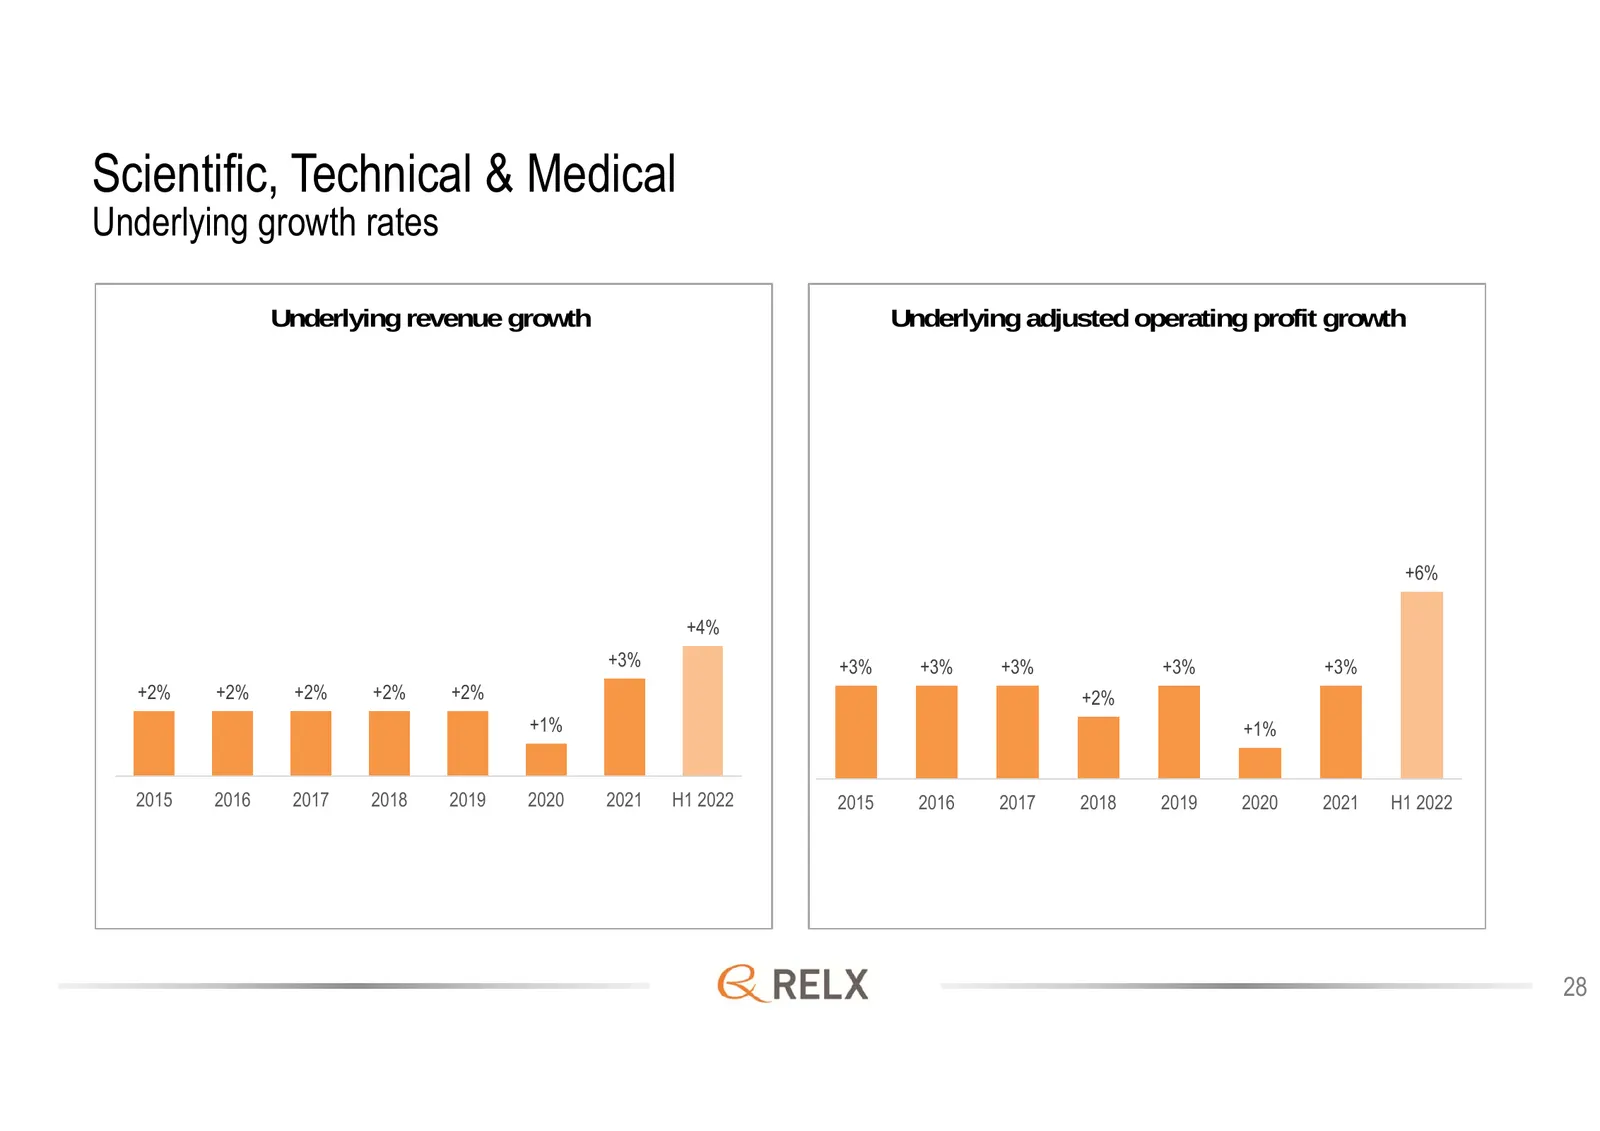
Scientific, Technical & Medical Underlying growth rates Underlying revenue growth Underlying adjusted operating profit growth +6% +4% +3% +3% +3% +3% +3% +3% +2% +2% +2% +2% +2% +2% +1% +1% 2015 2016 2017 2018 2019 2020 2021 H1 2022 2015 2016 2017 2018 2019 2020 2021 H1 2022 28
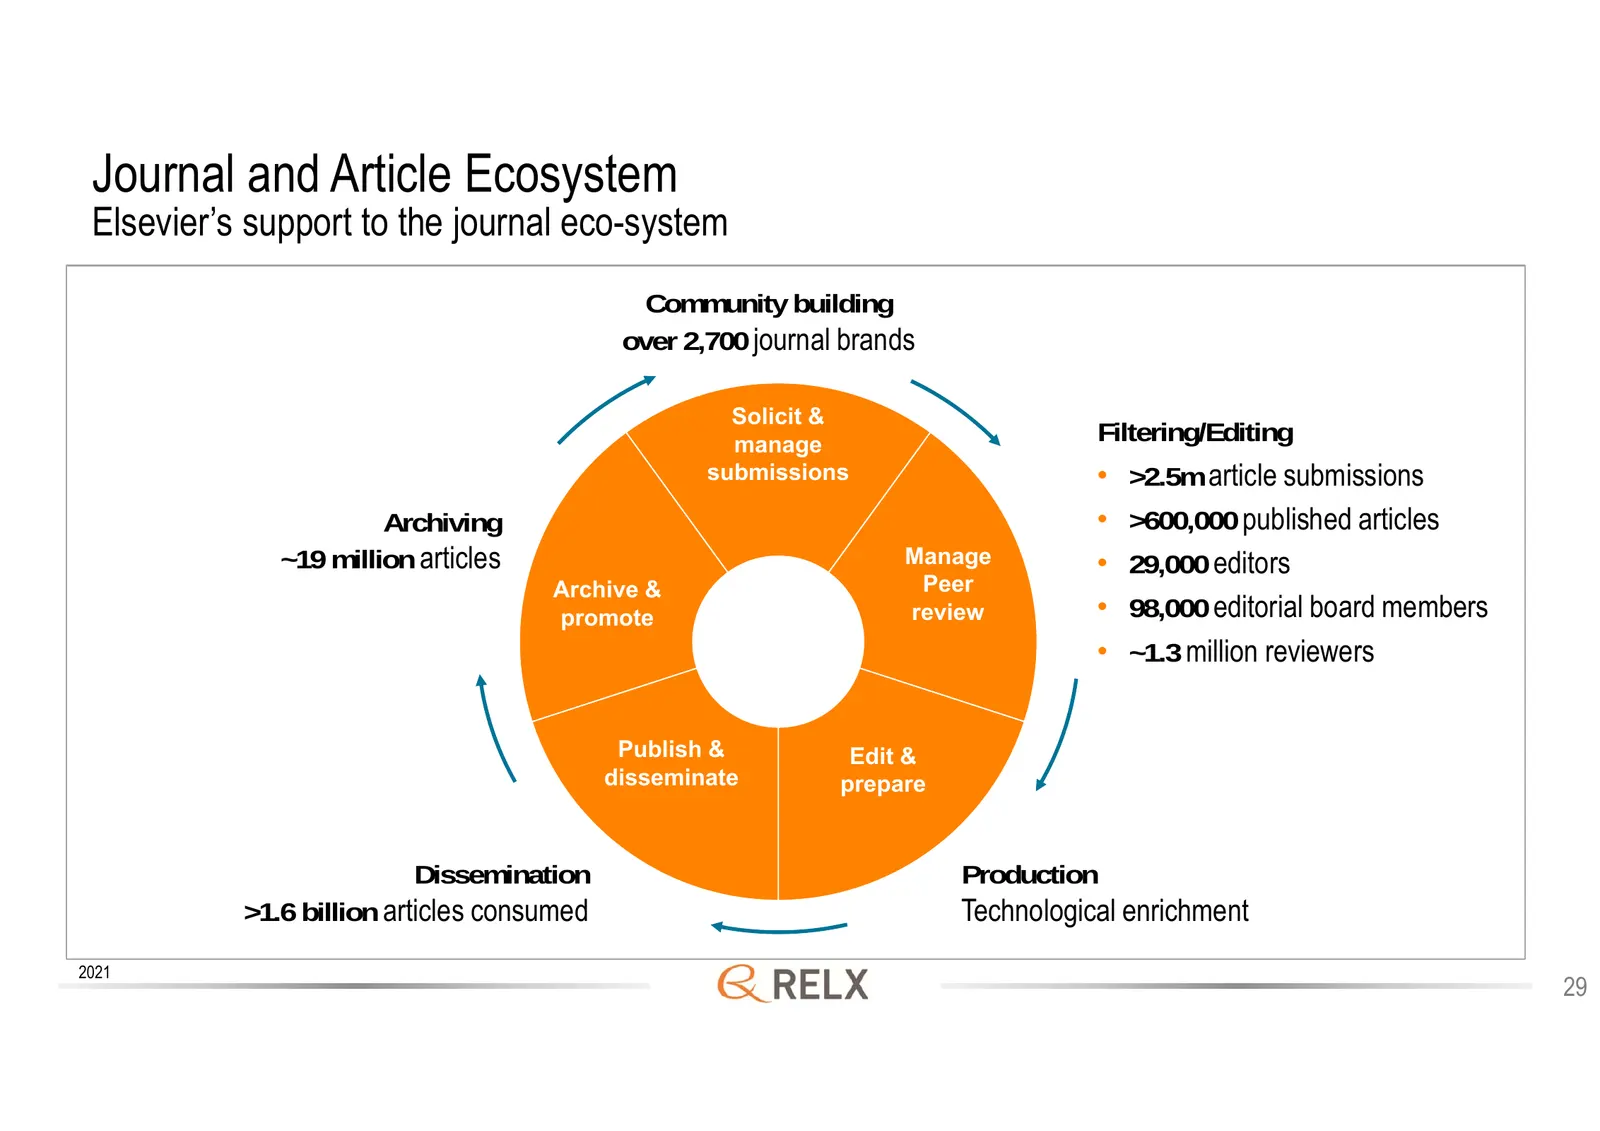
Slide 29: Journal and Article Ecosystem
Journal and Article Ecosystem Elsevier’s support to the journal eco-system Community building over 2,700 journal brands Solicit & manage Filtering/Editing submissions • >2.5m article submissions Archiving • >600,000 published articles ~19 million articles Manage • 29,000 editors Archive & Peer promo
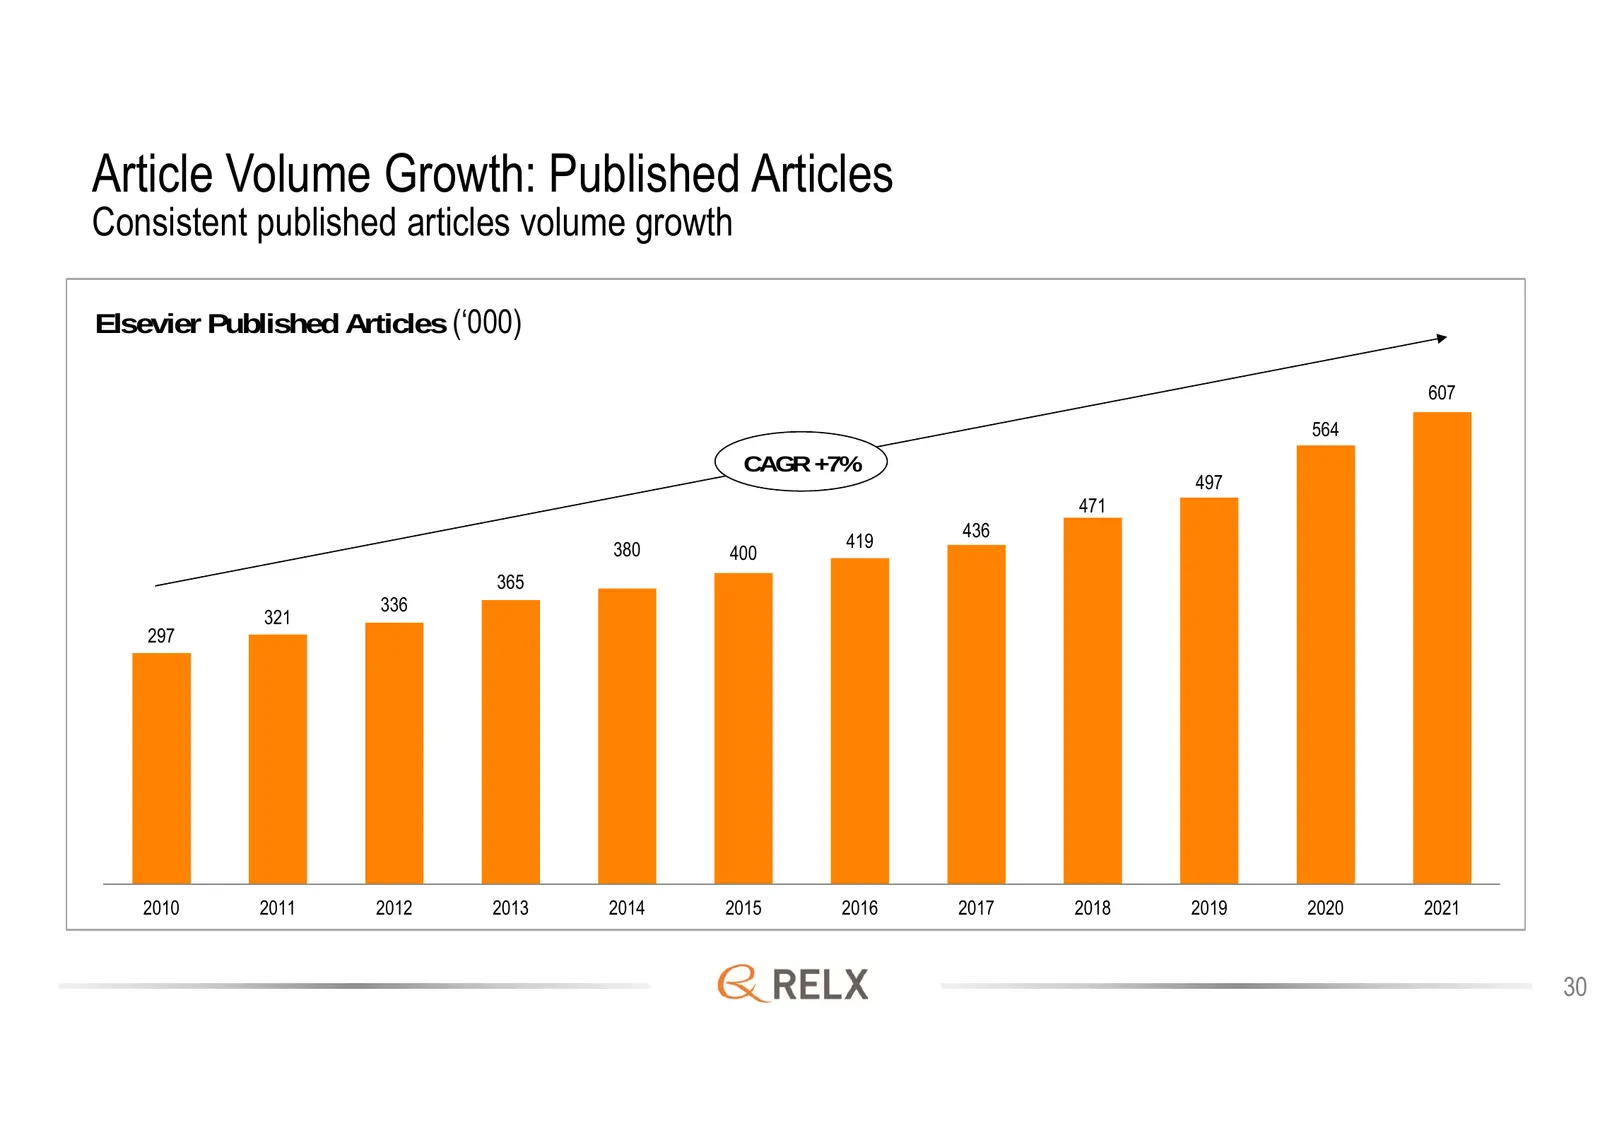
Slide 30: Article Volume Growth: Published Articles
Article Volume Growth: Published Articles Consistent published articles volume growth Elsevier Published Articles (‘000) 607 564 CAGR +7% 497 471 436 380 419 400 365 336 321 297 2010 2011 2012 2013 2014 2015 2016 2017 2018 2019 2020 2021 30
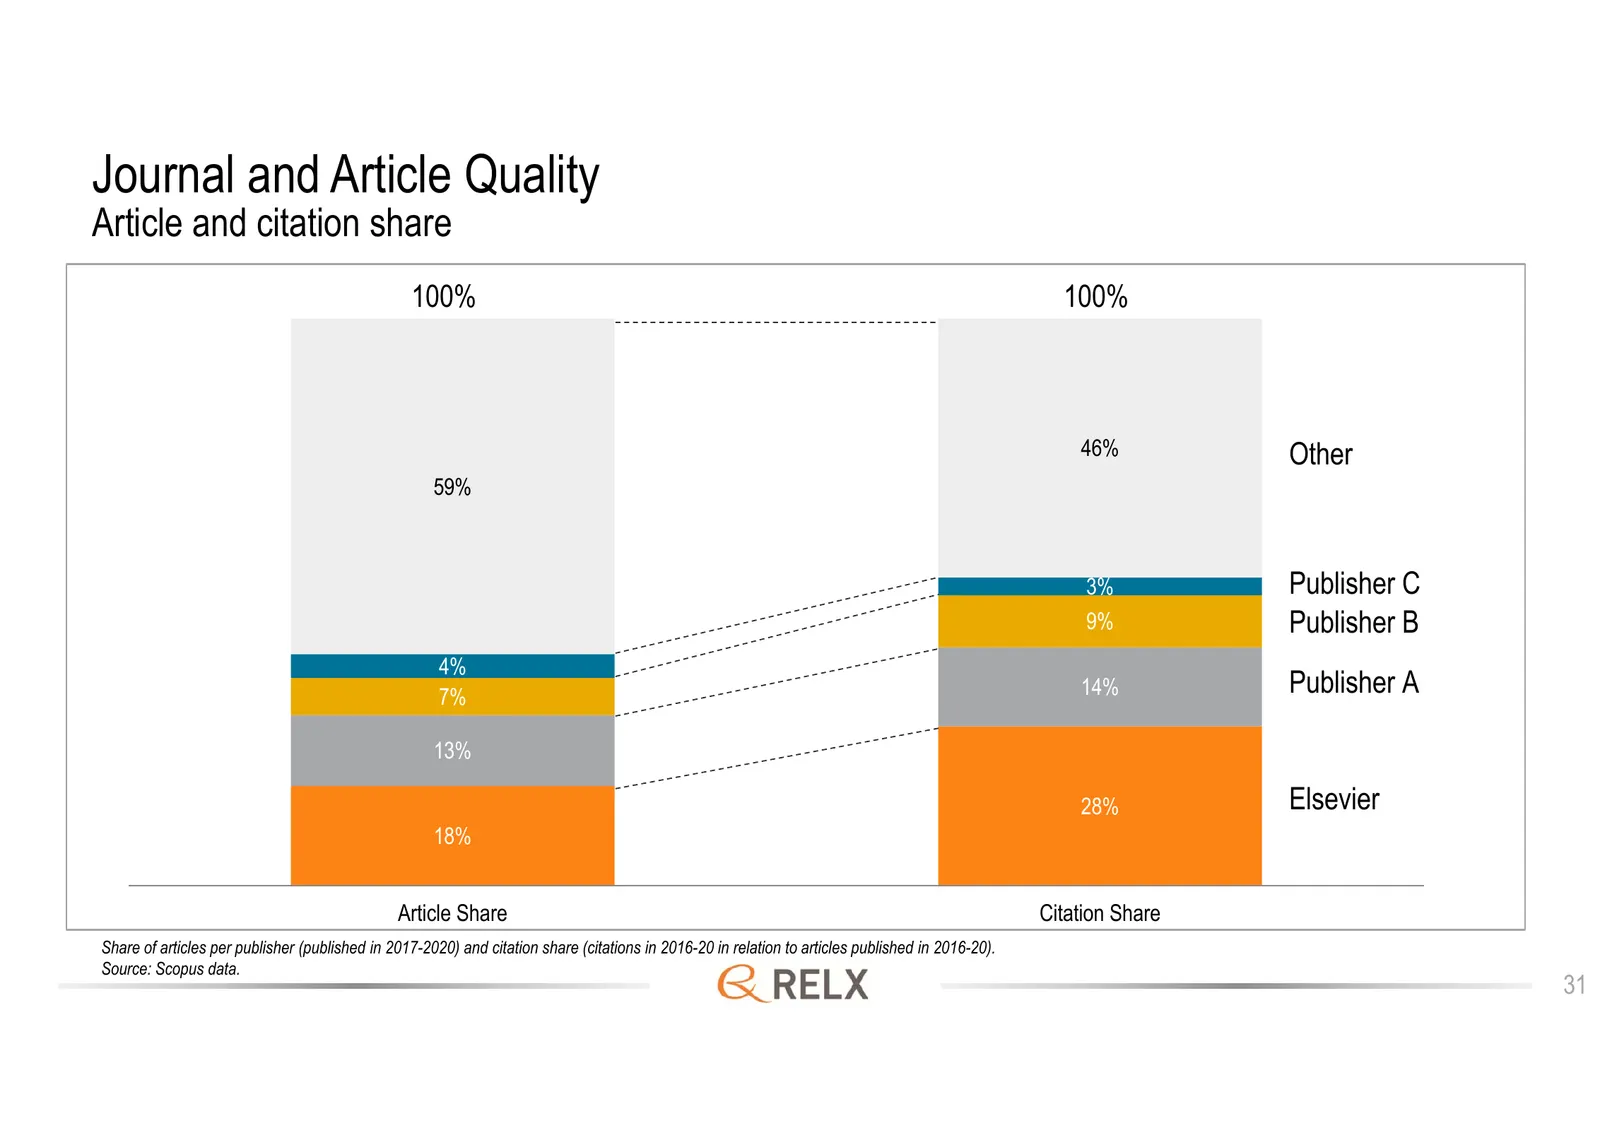
Slide 31: Journal and Article Quality
Journal and Article Quality Article and citation share 100% 100% 46% Other 59% 3% Publisher C 9% Publisher B 4% 7% 14% Publisher A 13% 28% Elsevier 18% Article Share Citation Share Share of articles per publisher (published in 2017-2020) and citation share (citations in 2016-20 in relation to articl
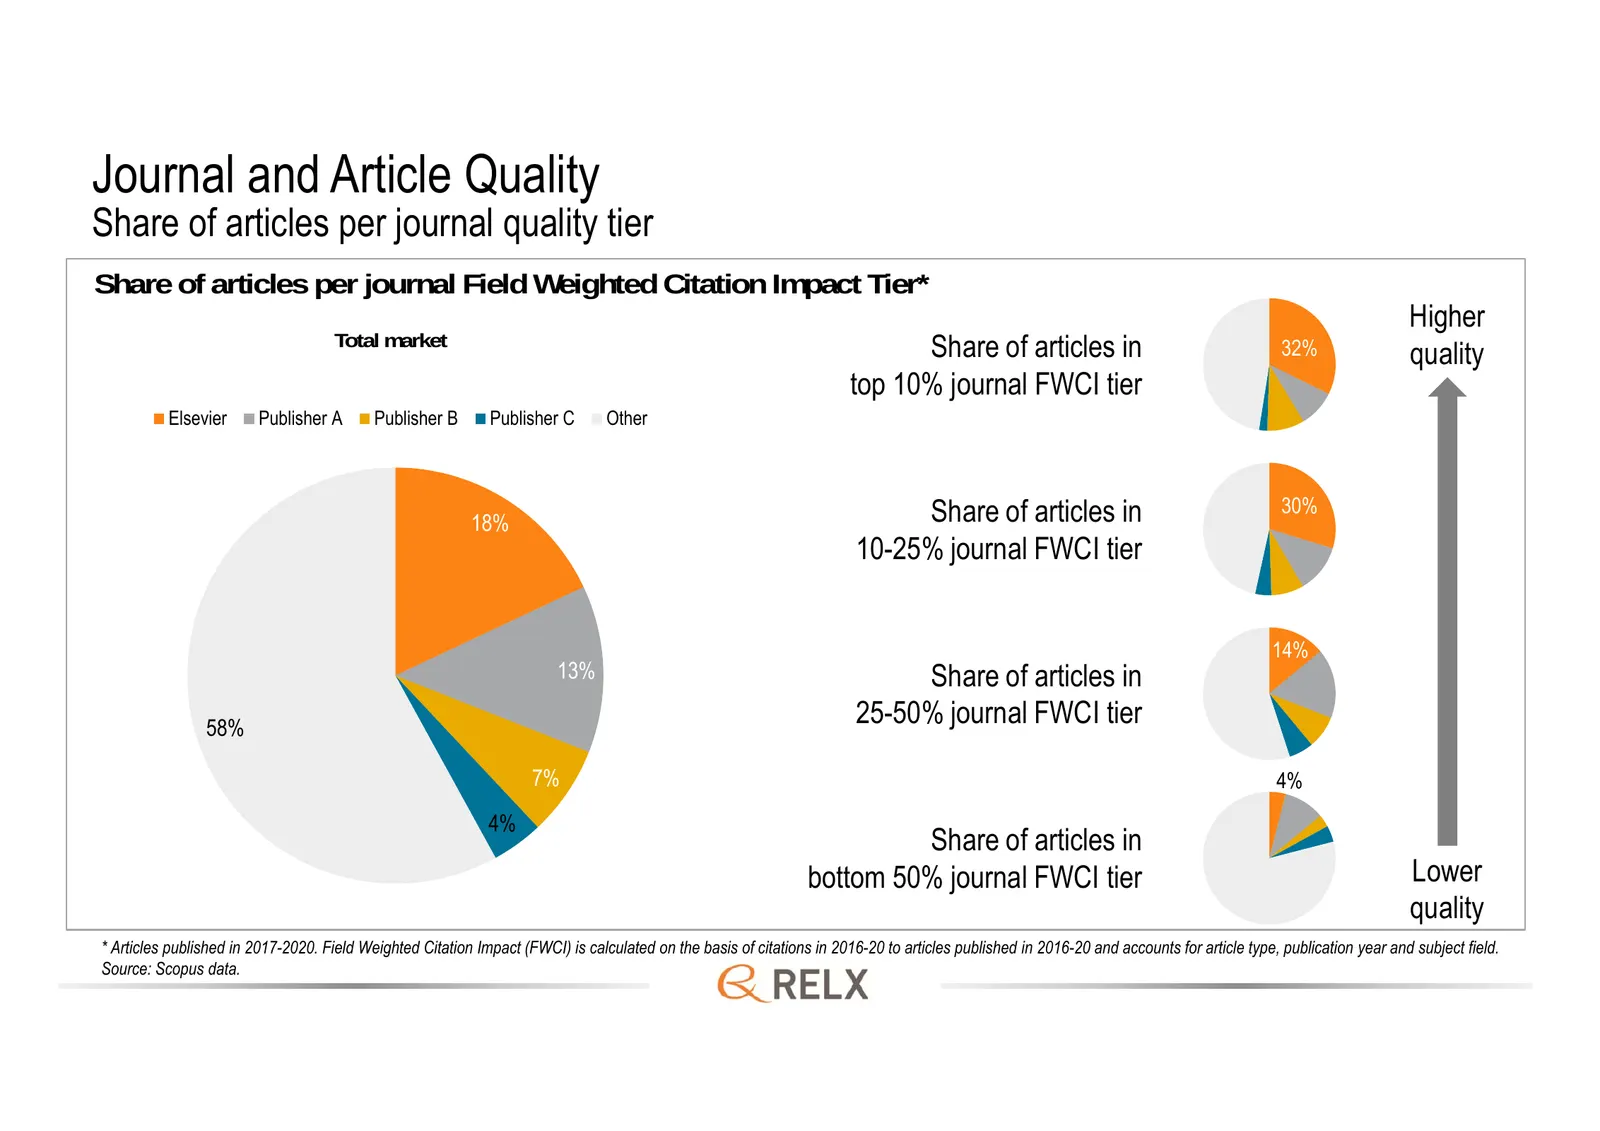
Slide 32: Journal and Article Quality
Journal and Article Quality Share of articles per journal quality tier Share of articles per journal Field Weighted Citation Impact Tier* Higher Total market Share of articles in 32% quality top 10% journal FWCI tier Elsevier Publisher A Publisher B Publisher C Other 18% Share of articles in 30% 10-
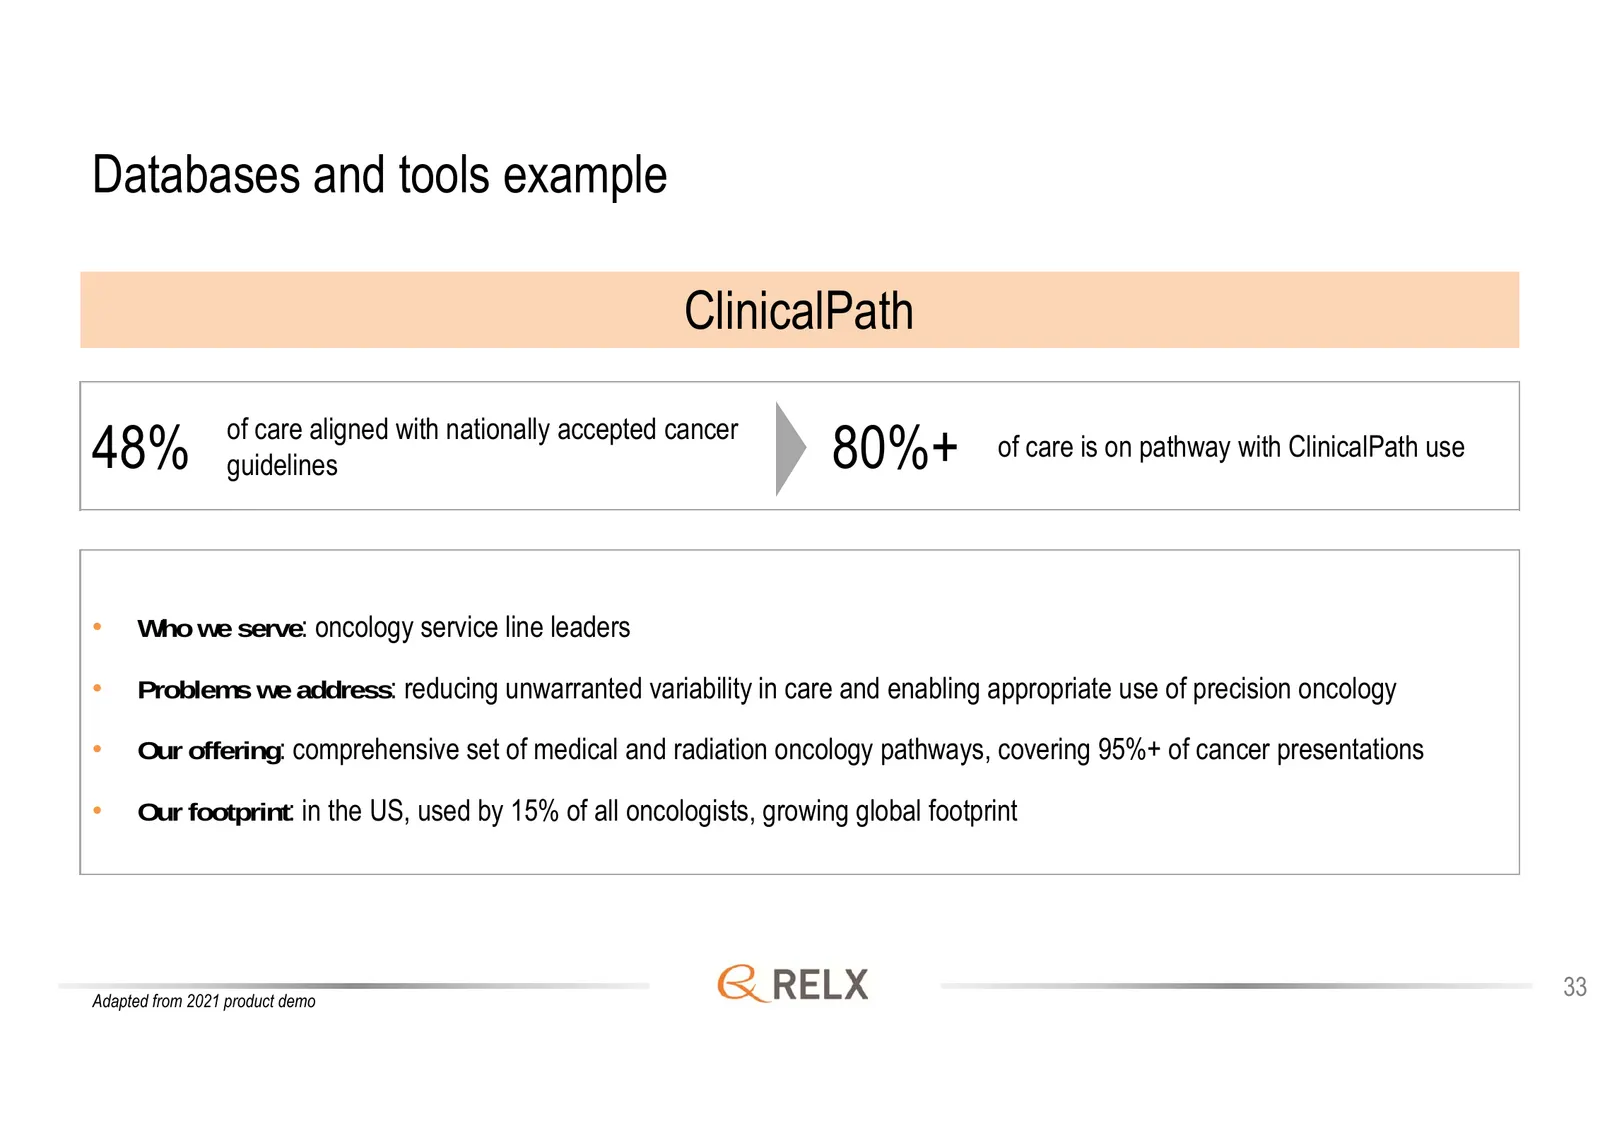
Slide 33: 80%+ of care is on pathway with ClinicalPath use
Databases and tools example ClinicalPath of care aligned with nationally accepted cancer 48% guidelines 80%+ of care is on pathway with ClinicalPath use • Who we serve: oncology service line leaders • Problems we address: reducing unwarranted variability in care and enabling appropriate use of preci
Slide 34: Legal
Legal Legal provides legal, regulatory and business information and analytics that help customers increase their productivity, improve decision-making and achieve better outcomes 34
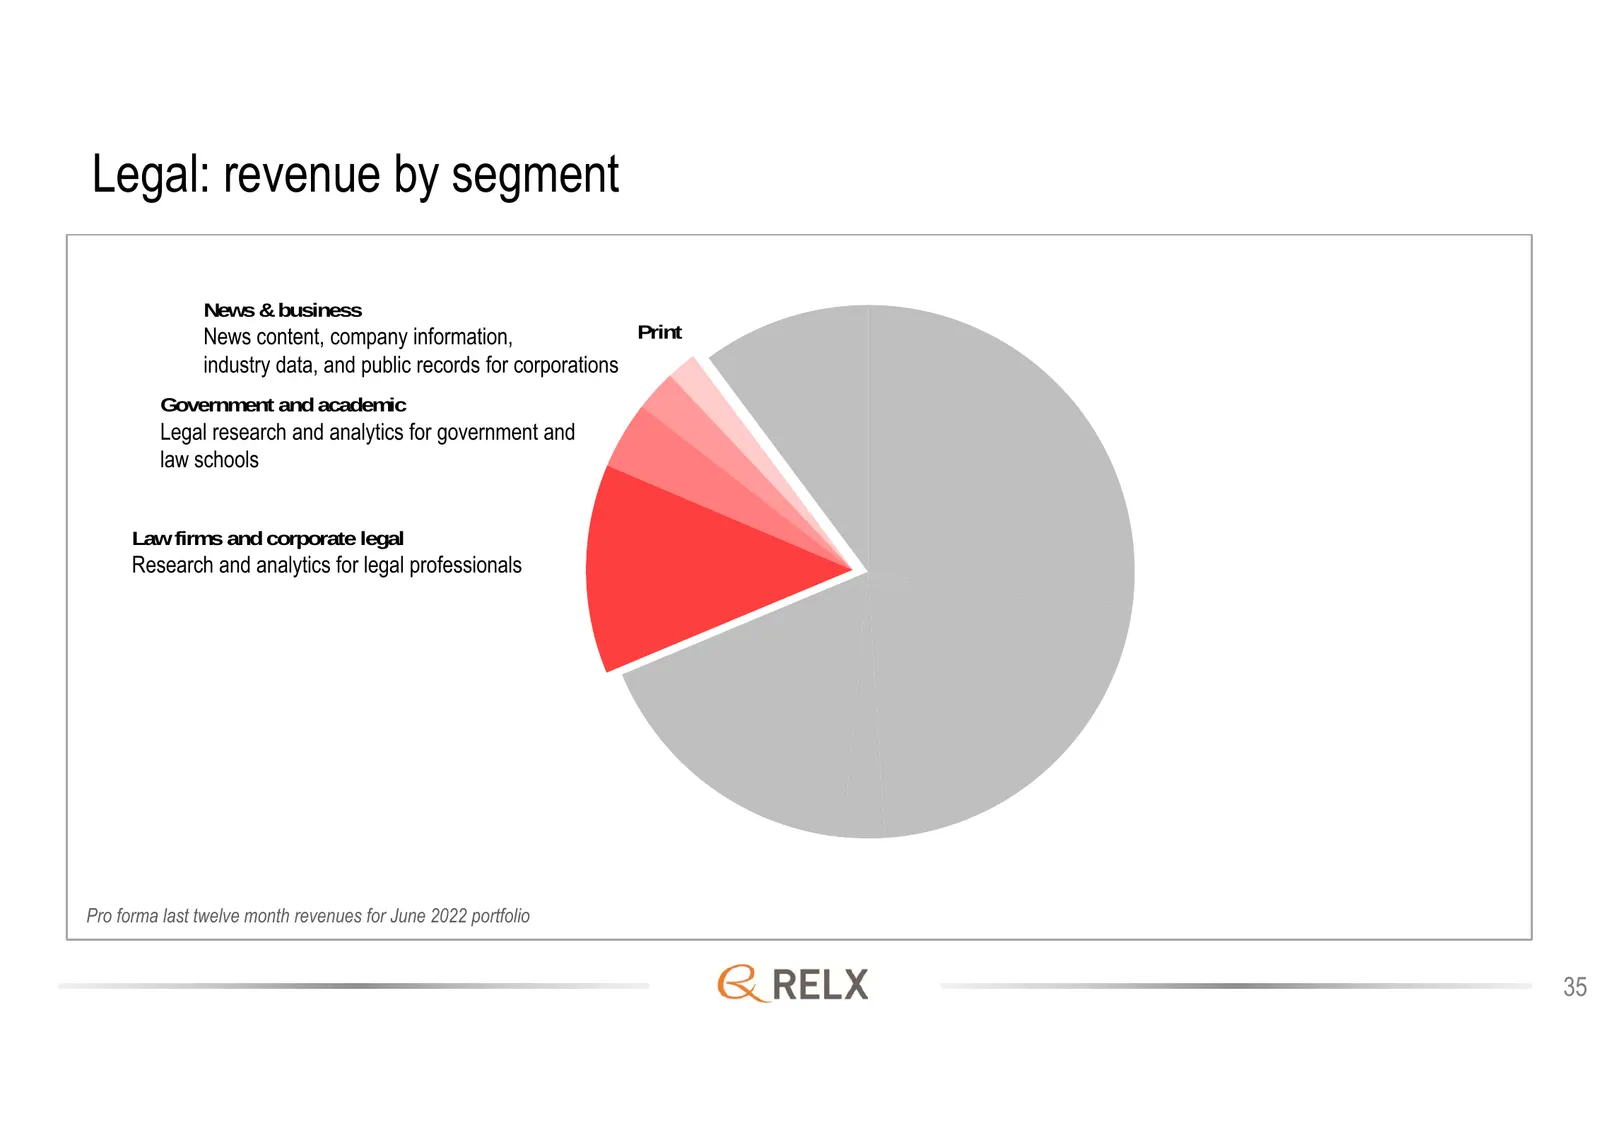
Slide 35: Legal: revenue by segment
Legal: revenue by segment News & business News content, company information, Print industry data, and public records for corporations Government and academic Legal research and analytics for government and law schools Law firms and corporate legal Research and analytics for legal professionals Pro f
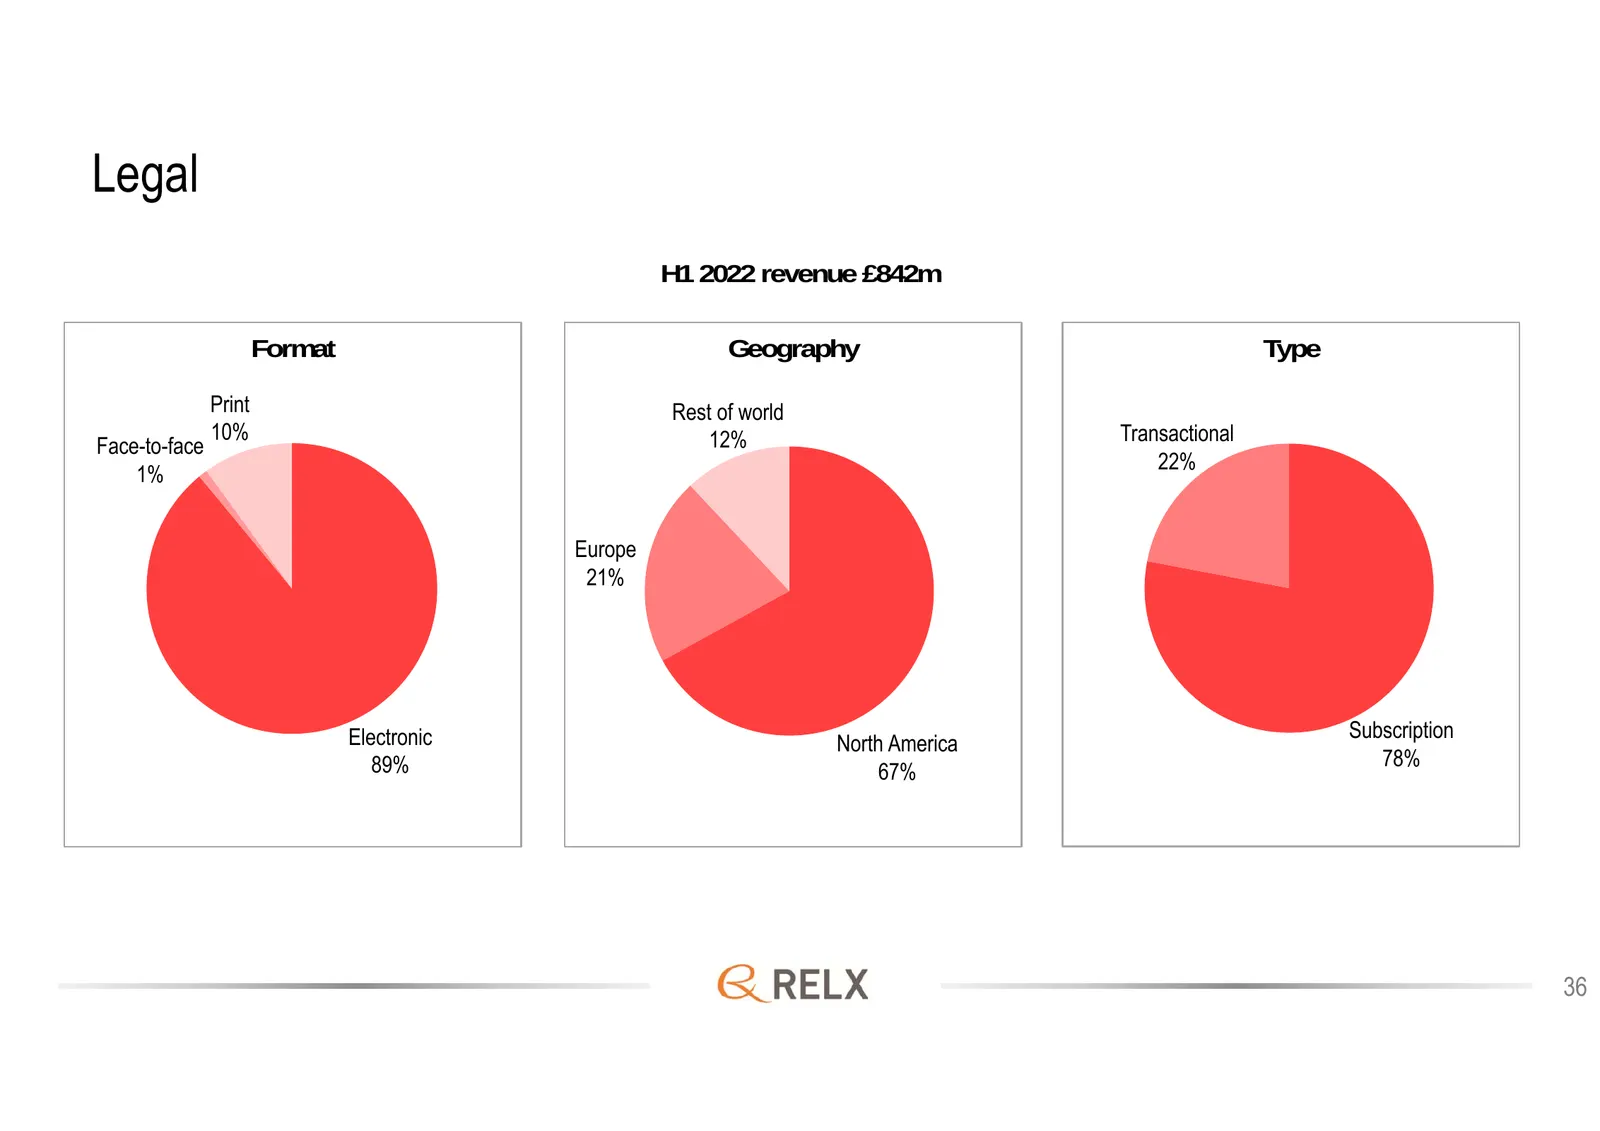
Slide 36: Legal: H1 2022 revenue
Legal H1 2022 revenue £842m Format Geography Type Print Rest of world 10% 12% Transactional Face-to-face 22% 1% Europe 21% Electronic Subscription North America 89% 78% 67% 36
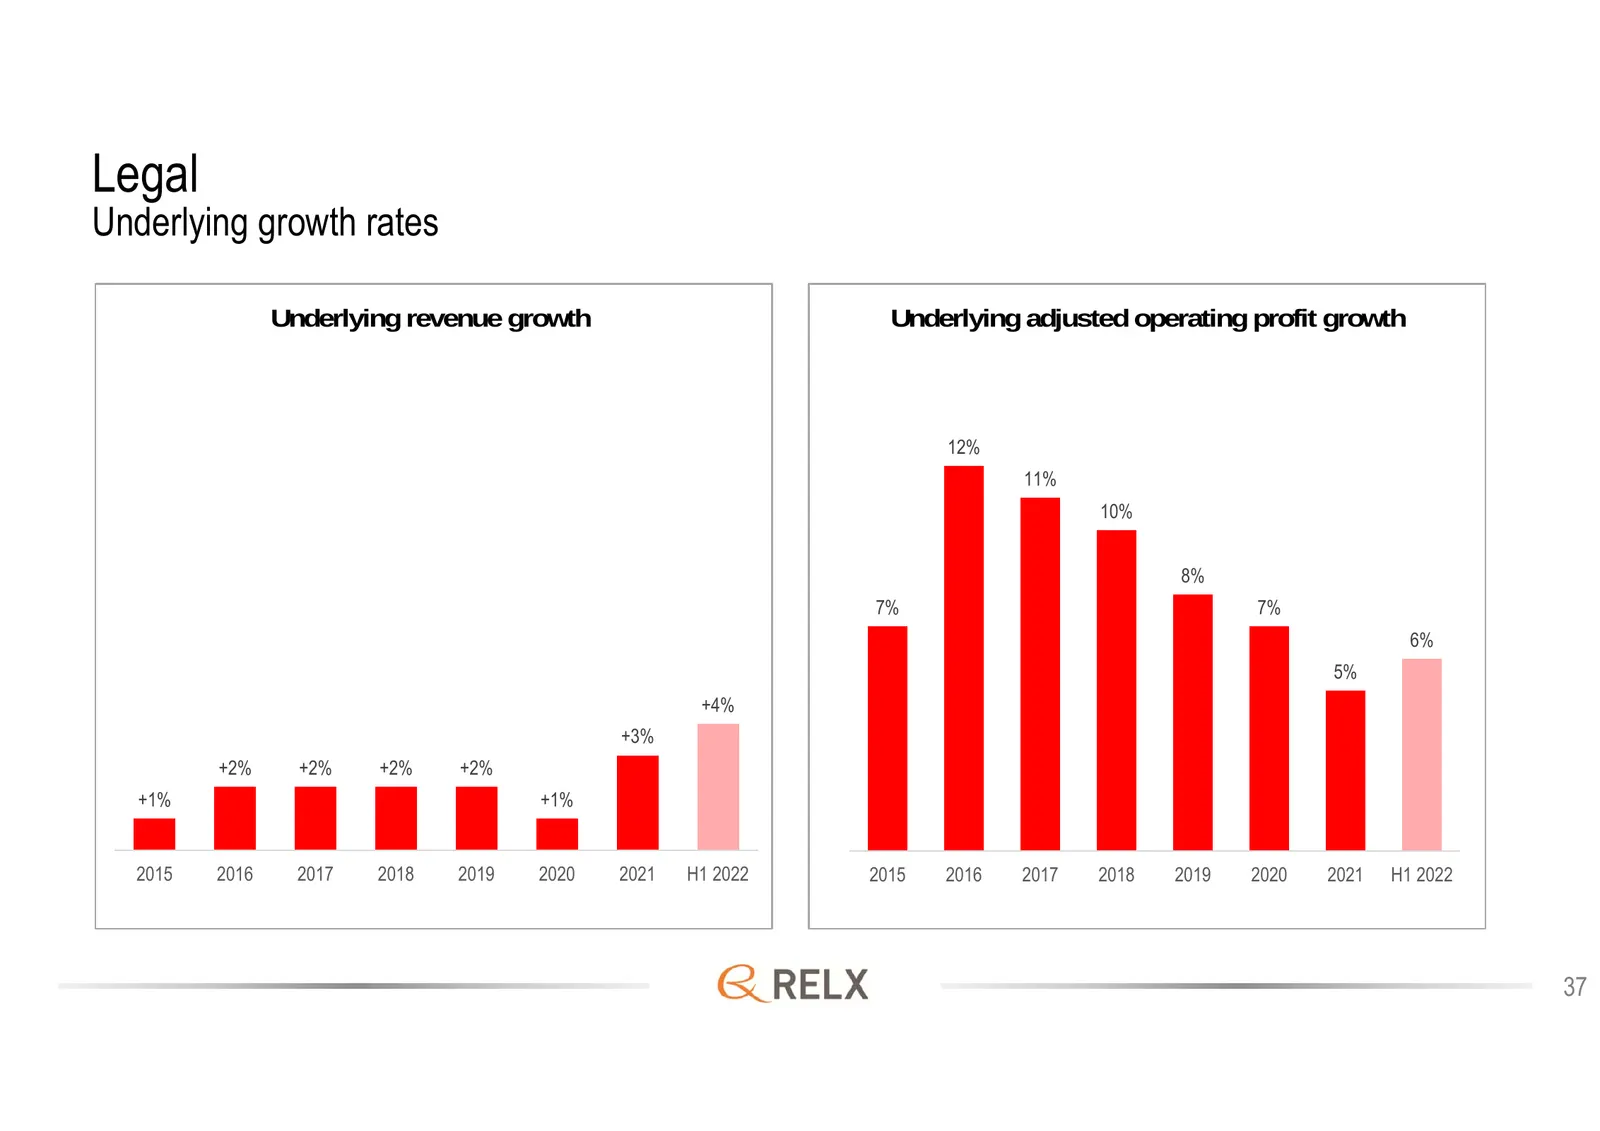
Slide 37: Legal: underlying growth rates
Legal Underlying growth rates Underlying revenue growth Underlying adjusted operating profit growth 12% 11% 10% 8% 7% 7% 6% 5% +4% +3% +2% +2% +2% +2% +1% +1% 2015 2016 2017 2018 2019 2020 2021 H1 2022 2015 2016 2017 2018 2019 2020 2021 H1 2022 37
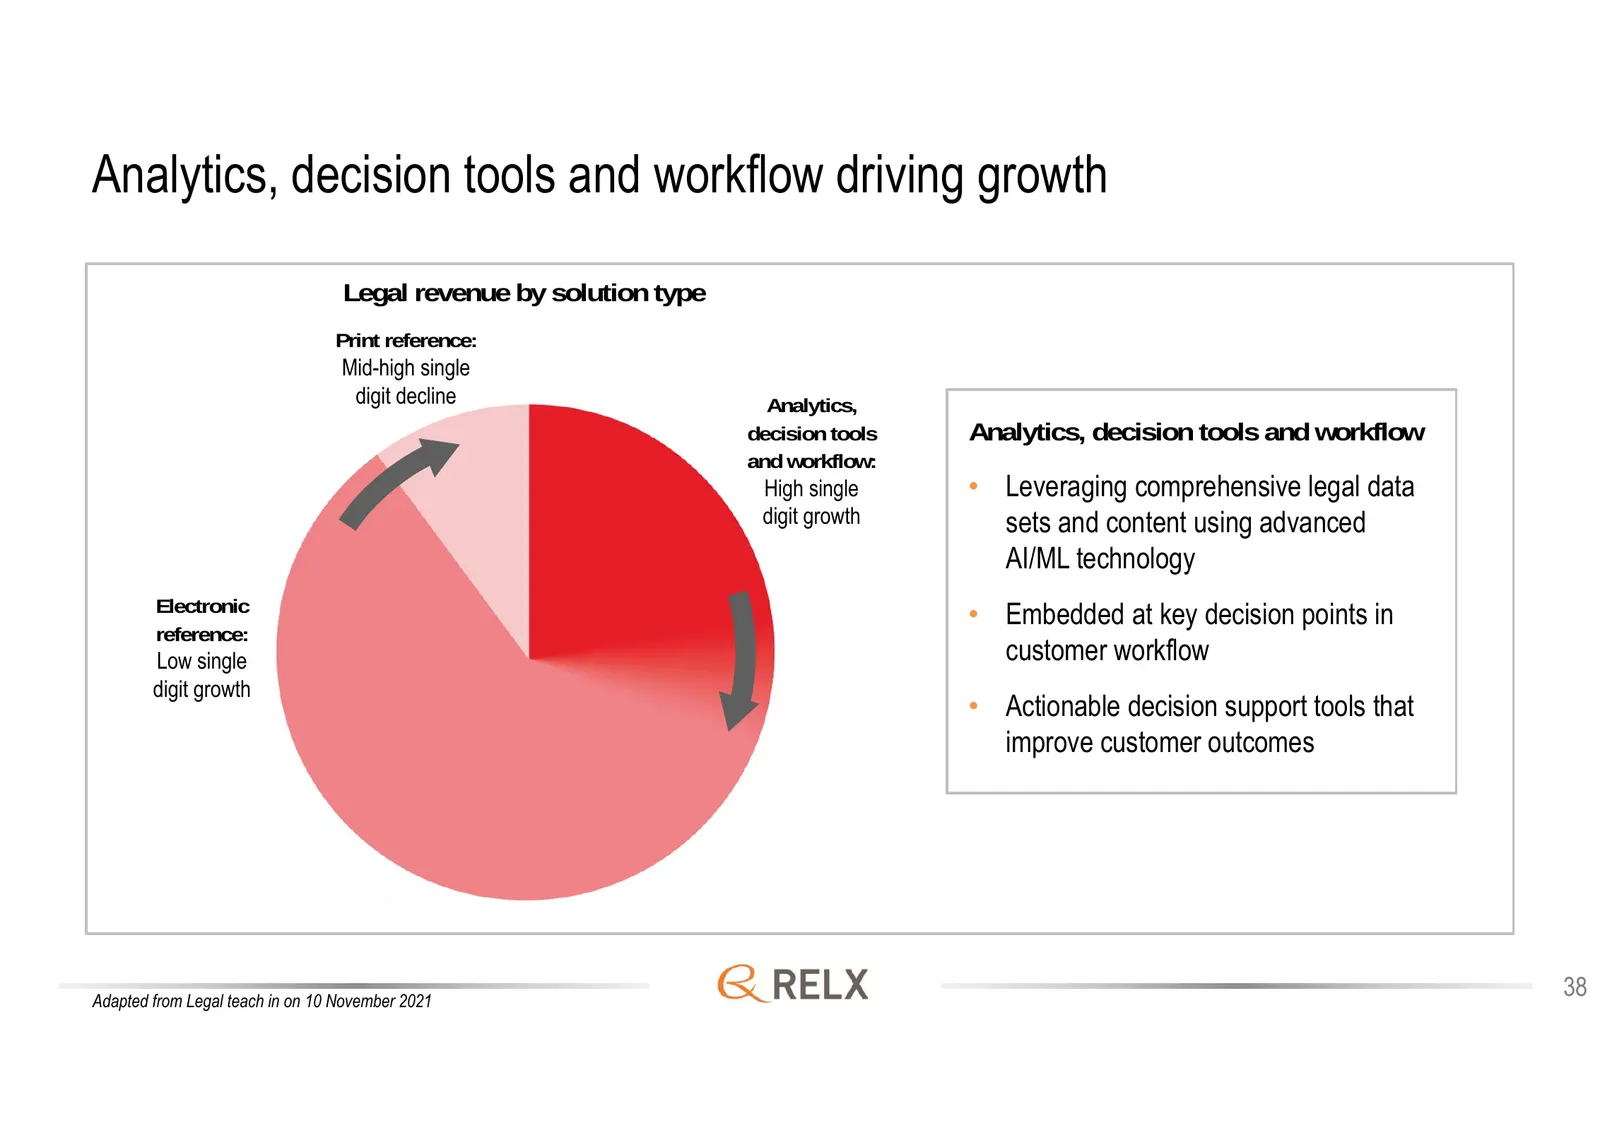
Slide 38: Analytics, decision tools and workflow driving growth
Analytics, decision tools and workflow driving growth Legal revenue by solution type Print reference: Mid-high single digit decline Analytics, decision tools Analytics, decision tools and workflow and workflow: High single • Leveraging comprehensive legal data digit growth sets and content using adv
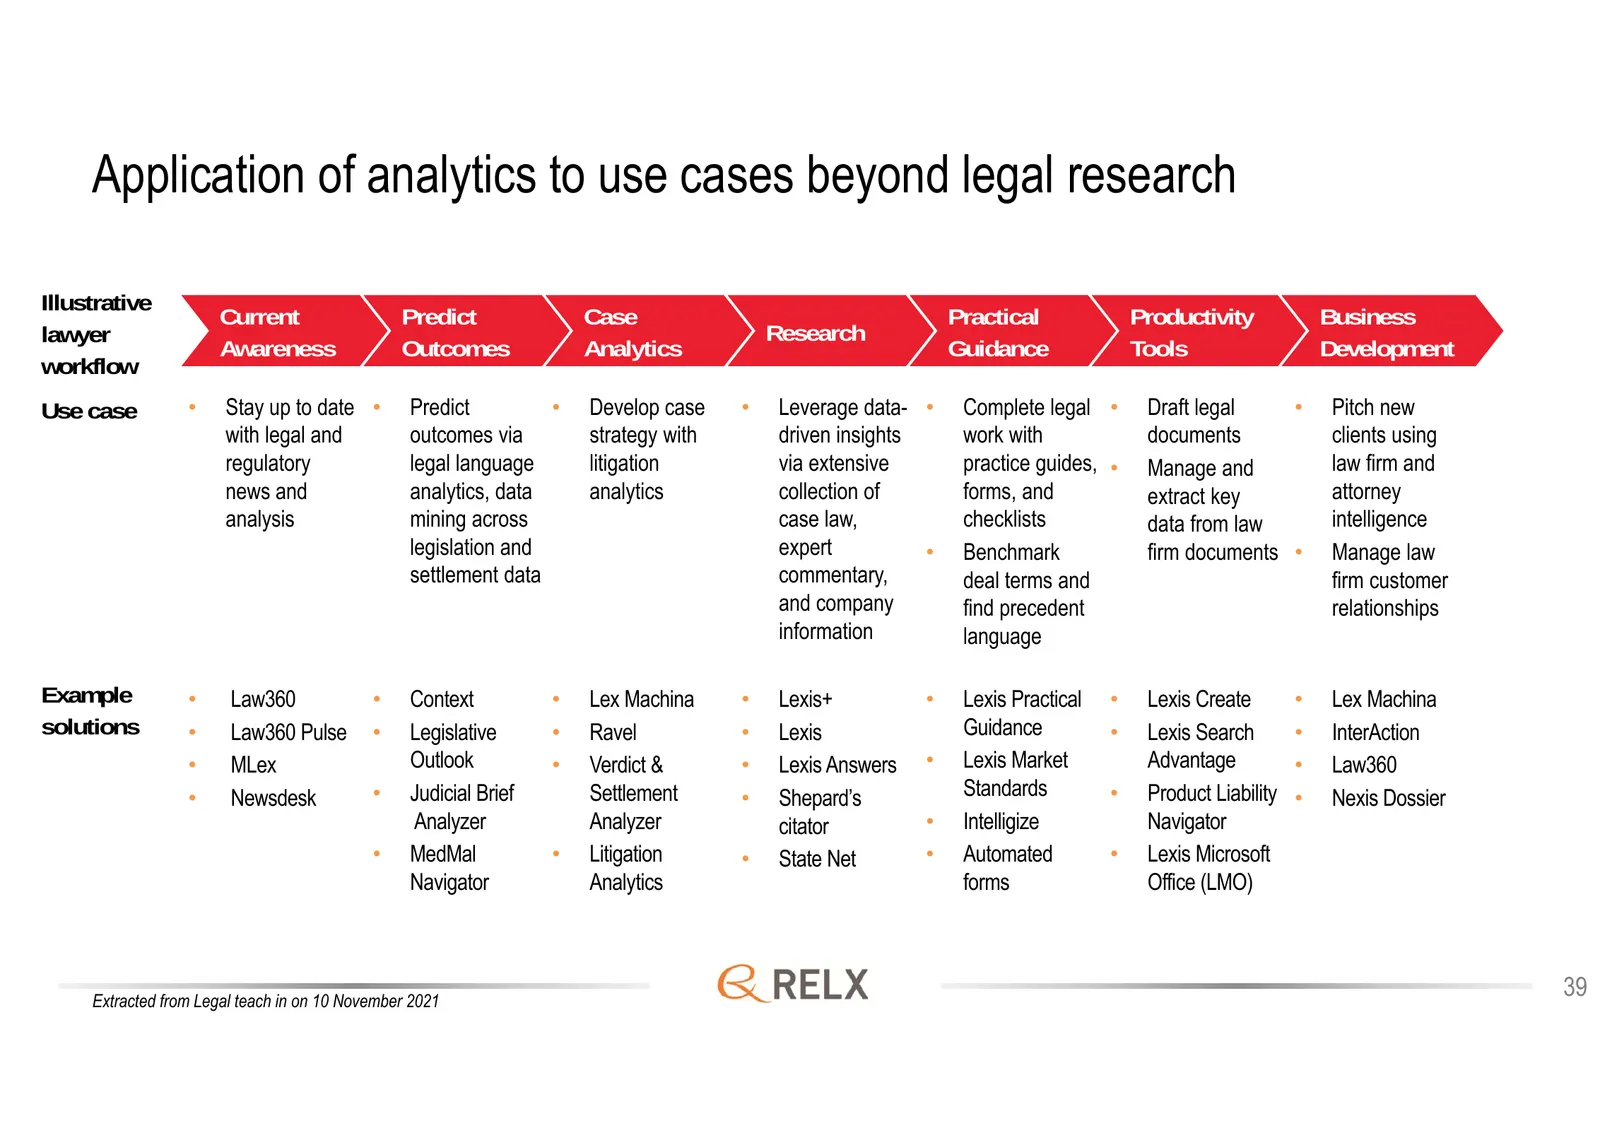
Slide 39: Application of analytics to use cases beyond legal research
Application of analytics to use cases beyond legal research Illustrative Current Predict Case Practical Productivity Business lawyer Research Awareness Outcomes Analytics Guidance Tools Development workflow Use case • Stay up to date • Predict • Develop case • Leverage data- • Complete legal • Draft
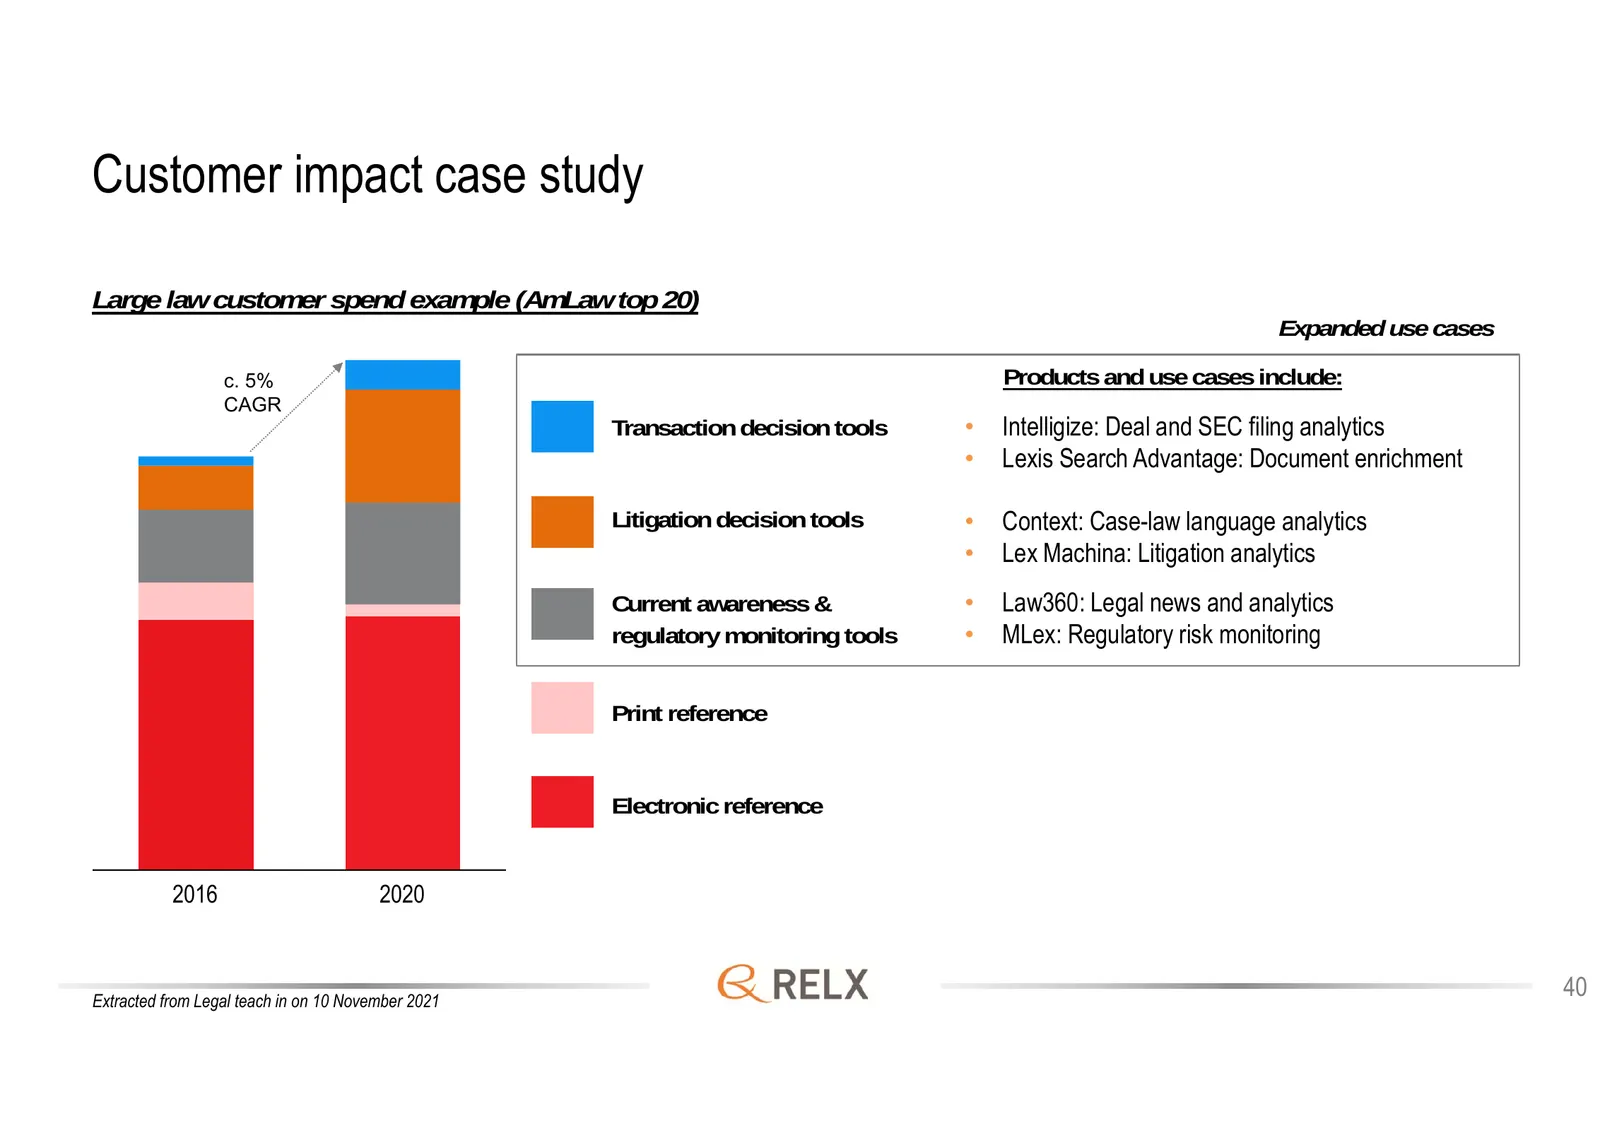
Slide 40: Customer impact case study
Customer impact case study Large law customer spend example (AmLaw top 20) Expanded use cases c. 5% Products and use cases include: CAGR Transaction decision tools • Intelligize: Deal and SEC filing analytics • Lexis Search Advantage: Document enrichment Litigation decision tools • Context: Case-law
Slide 41: Leveraging global scale and technology
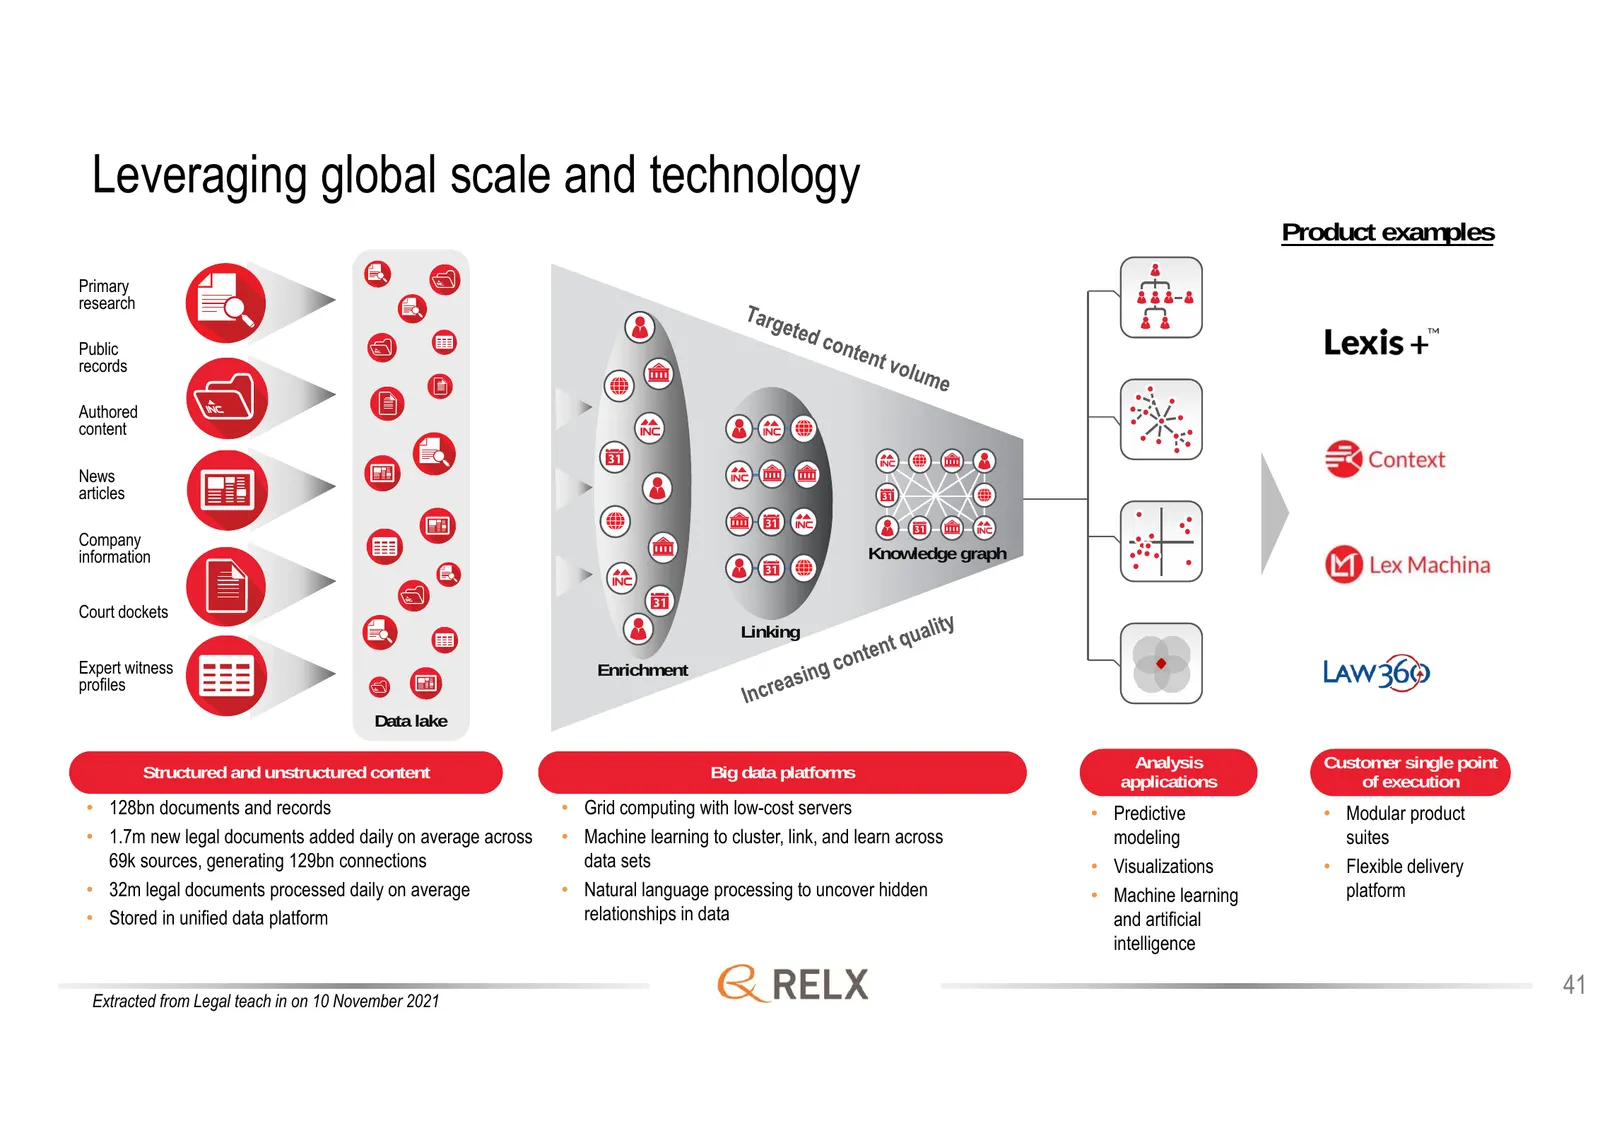
Leveraging global scale and technology Product examples Primary research Public records Authored content News articles Company information Knowledge graph Court dockets Linking Expert witness Enrichment profiles Data lake Structured and unstructured content Big data platforms Analysis Customer singl
Slide 42: Exhibitions
Exhibitions Exhibitions combines industry expertise with data and digital tools to help customers connect digitally and face-to-face, learn about markets, source products and complete transactions 42
Slide 43: Exhibitions revenue
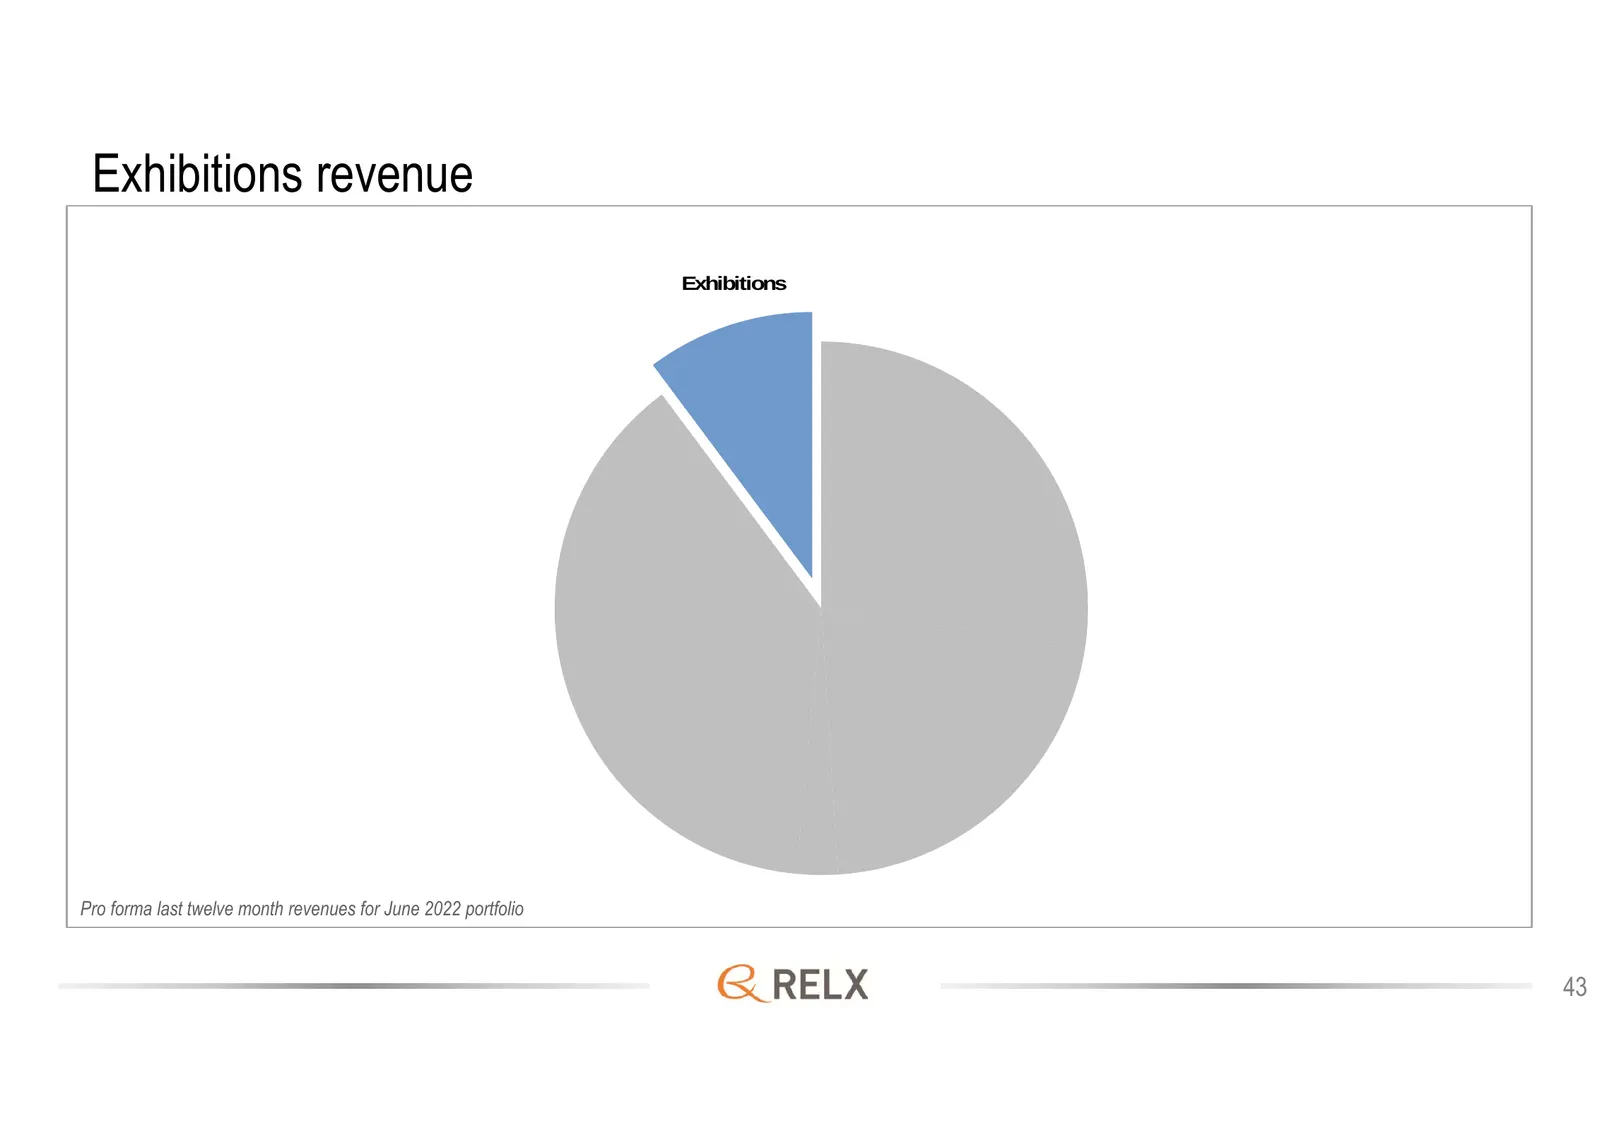
Exhibitions revenue Exhibitions Pro forma last twelve month revenues for June 2022 portfolio 43
Slide 44: Exhibitions: H1 2022 revenue
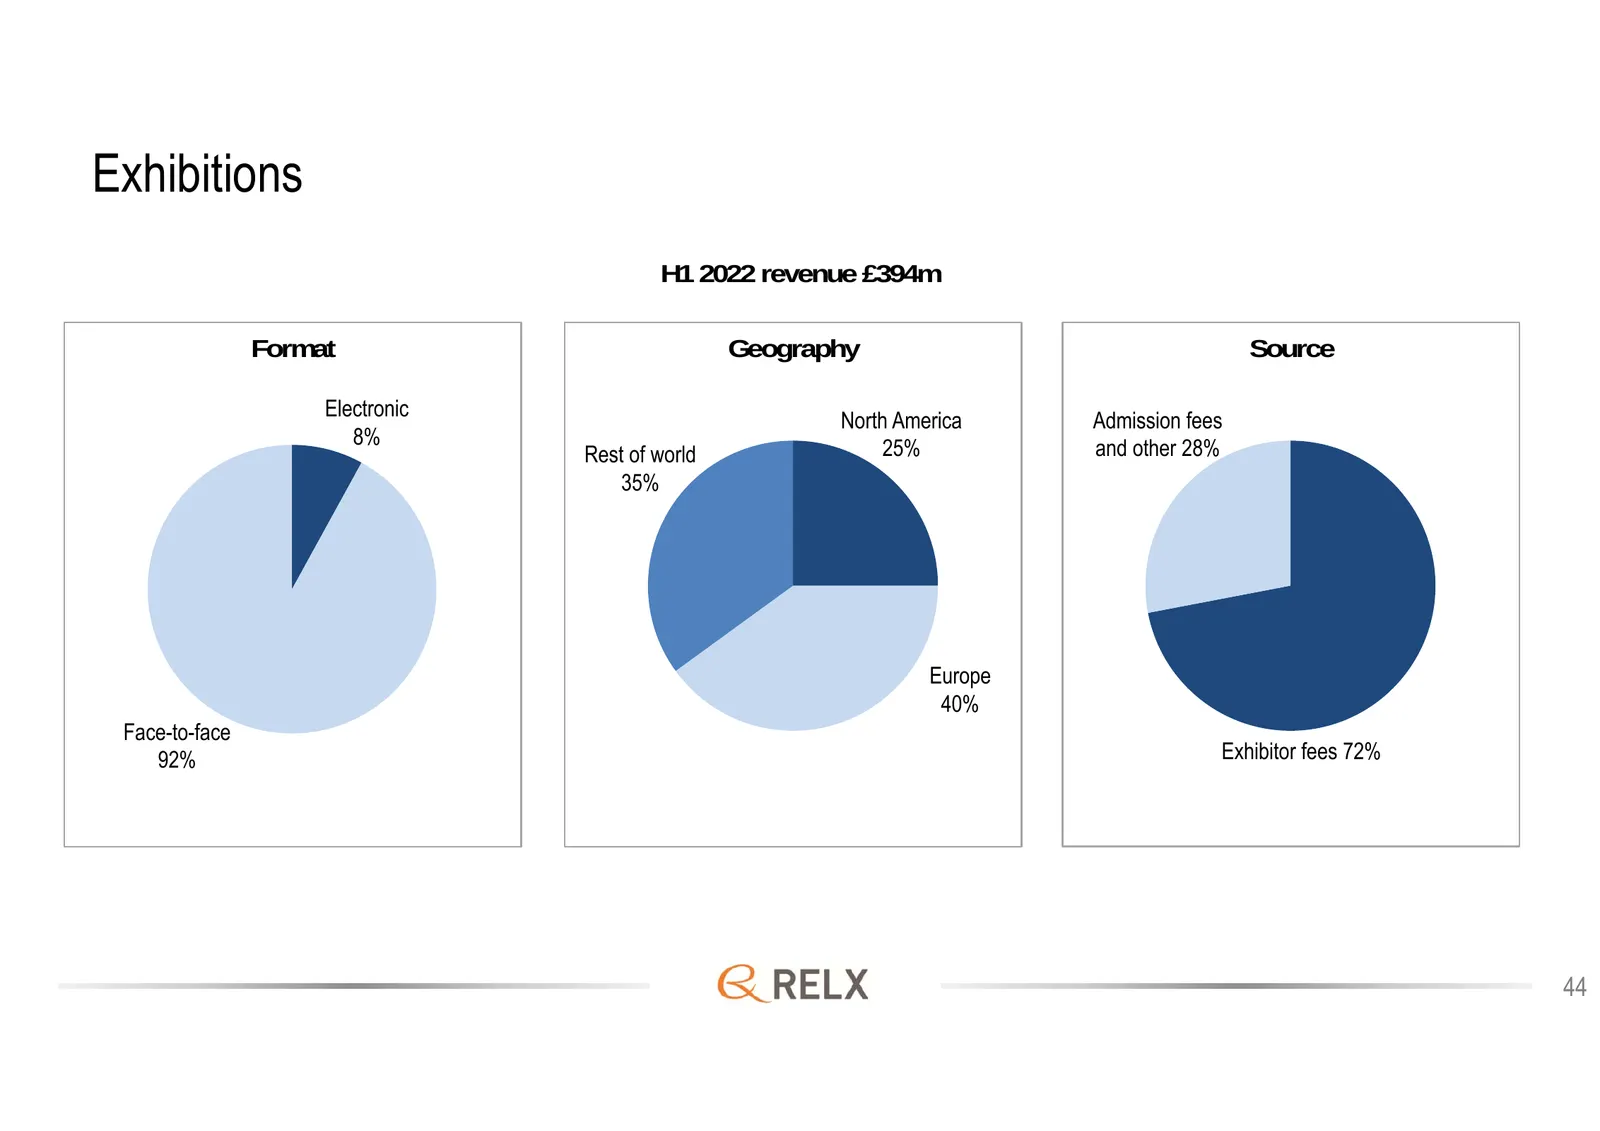
Exhibitions H1 2022 revenue £394m Format Geography Source Electronic North America Admission fees 8% Rest of world 25% and other 28% 35% Europe 40% Face-to-face 92% Exhibitor fees 72% 44
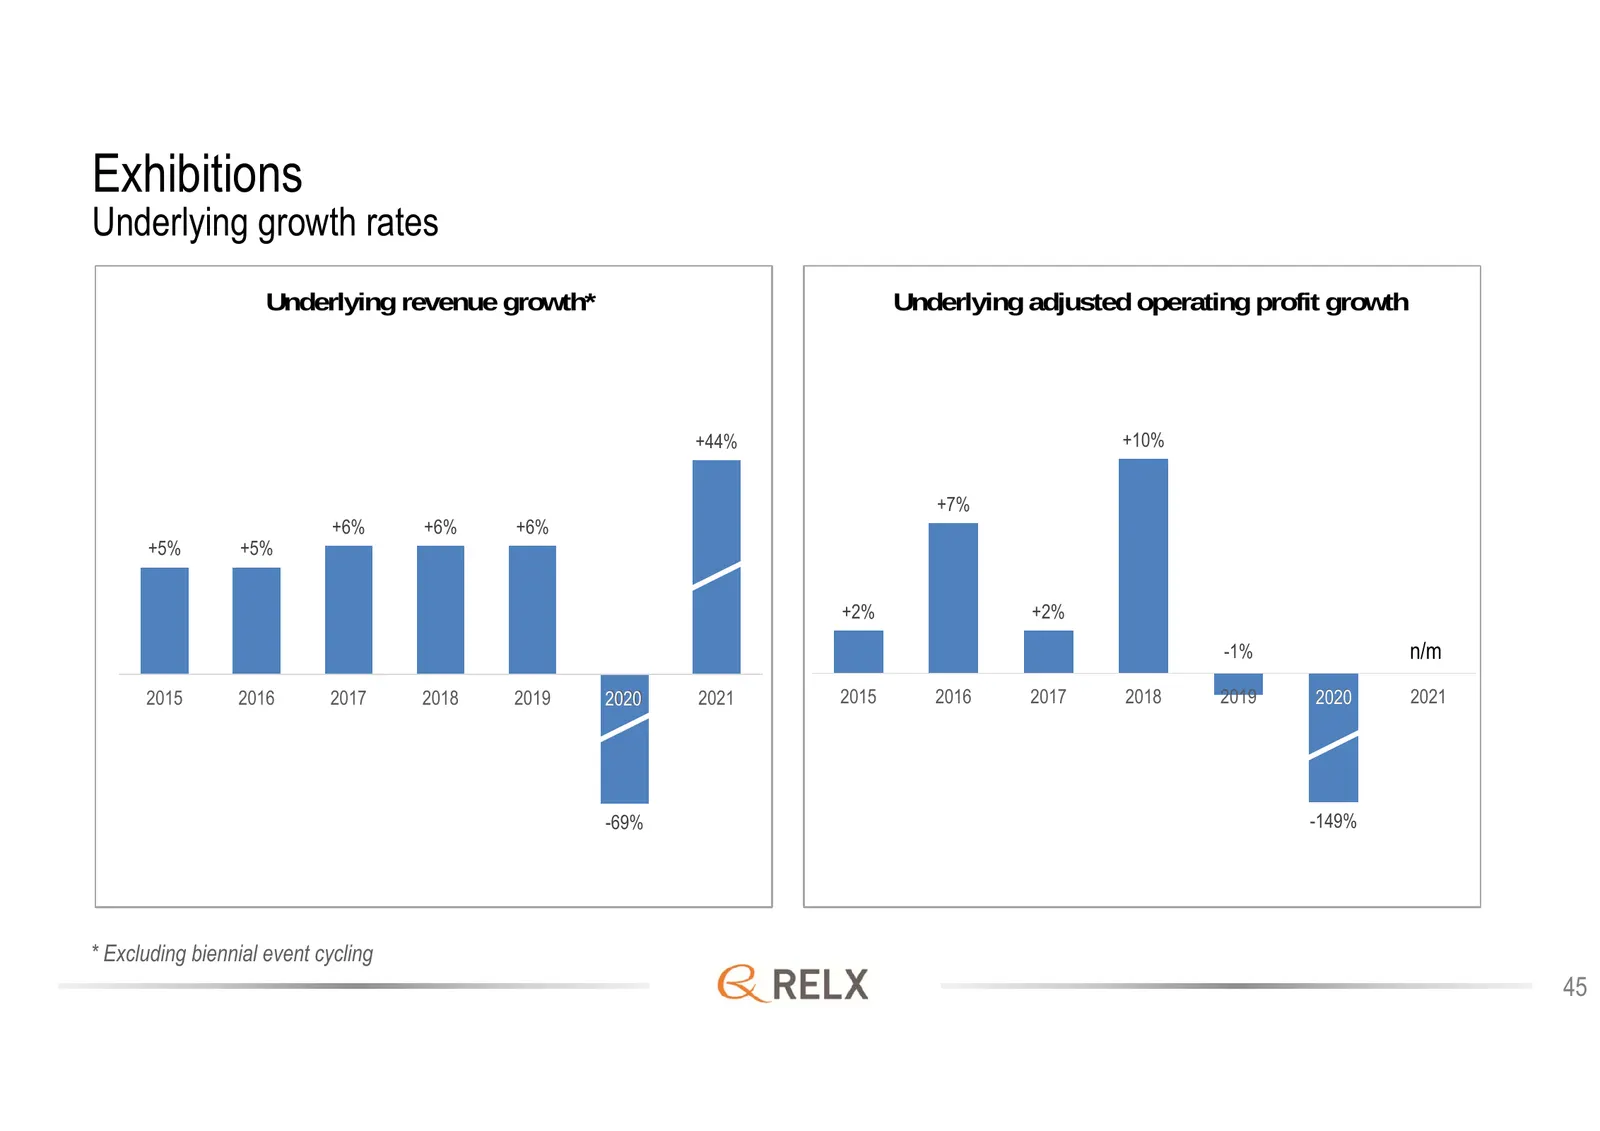
Slide 45: Exhibitions: underlying growth rates
Exhibitions Underlying growth rates Underlying revenue growth* Underlying adjusted operating profit growth +44% +10% +7% +6% +6% +6% +5% +5% +2% +2% -1% n/m 2015 2016 2017 2018 2019 2020 2021 2015 2016 2017 2018 2019 2020 2021 -69% -149% * Excluding biennial event cycling 45
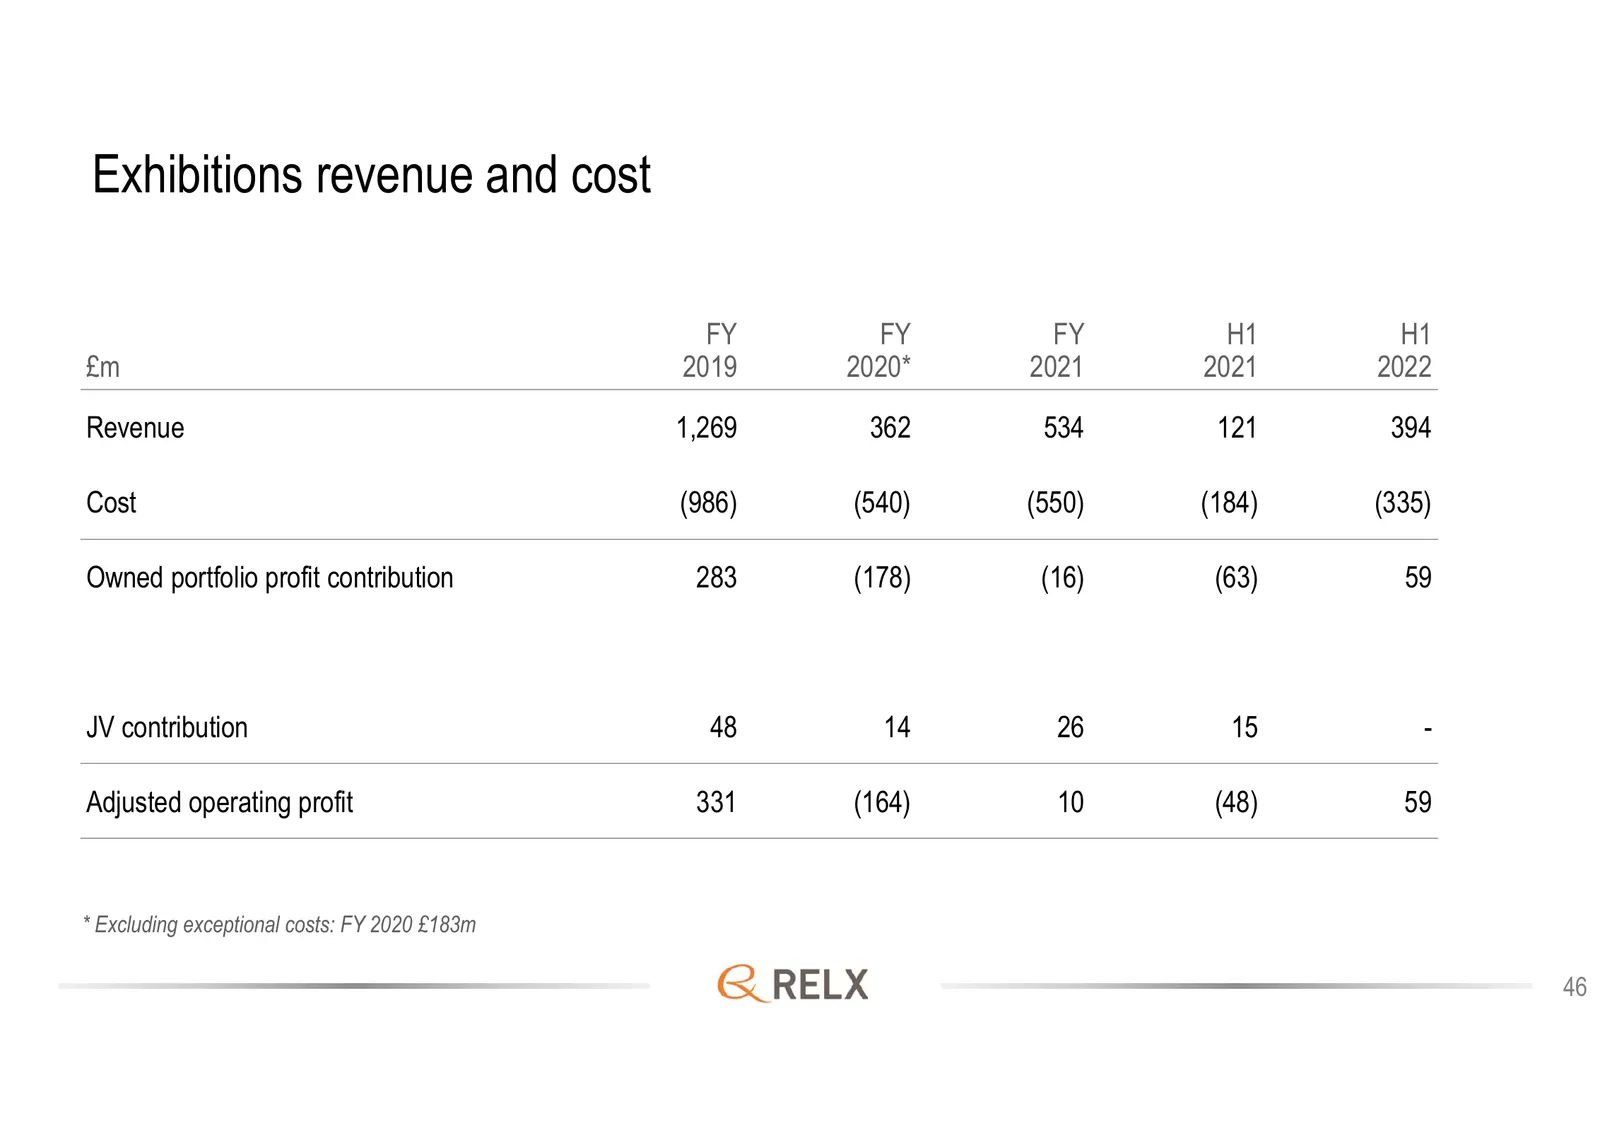
Slide 46: Exhibitions revenue and cost
Exhibitions revenue and cost FY FY FY H1 H1 £m 2019 2020* 2021 2021 2022 Revenue 1,269 362 534 121 394 Cost (986) (540) (550) (184) (335) Owned portfolio profit contribution 283 (178) (16) (63) 59 JV contribution 48 14 26 15 - Adjusted operating profit 331 (164) 10 (48) 59 * Excluding exceptional co
Slide 47: Corporate responsibility
Corporate responsibility 47
Slide 48: RELX is a provider of information-based analytics and decision tools
RELX is a provider of information-based analytics and decision tools for professional and business customers, enabling them to make better decisions, get better results and be more productive. Our purpose is to benefit society by developing products that help researchers advance scientific knowledge
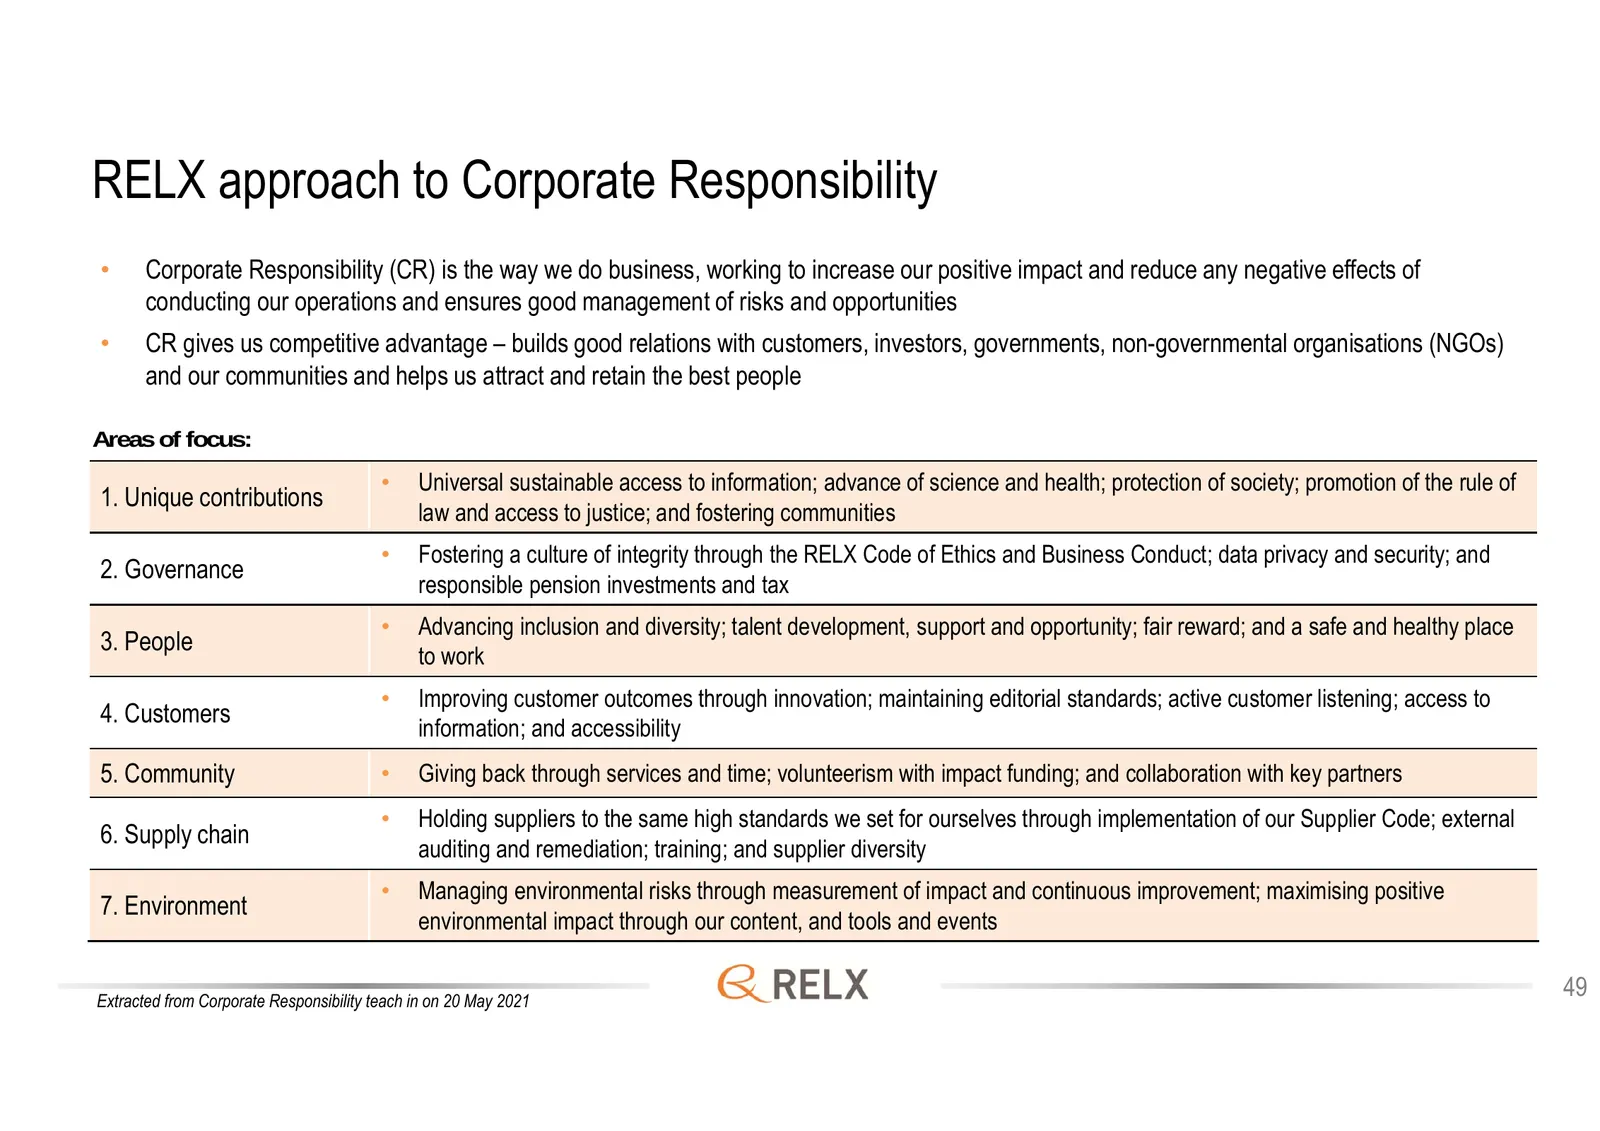
Slide 49: RELX approach to Corporate Responsibility
RELX approach to Corporate Responsibility • Corporate Responsibility (CR) is the way we do business, working to increase our positive impact and reduce any negative effects of conducting our operations and ensures good management of risks and opportunities • CR gives us competitive advantage – build
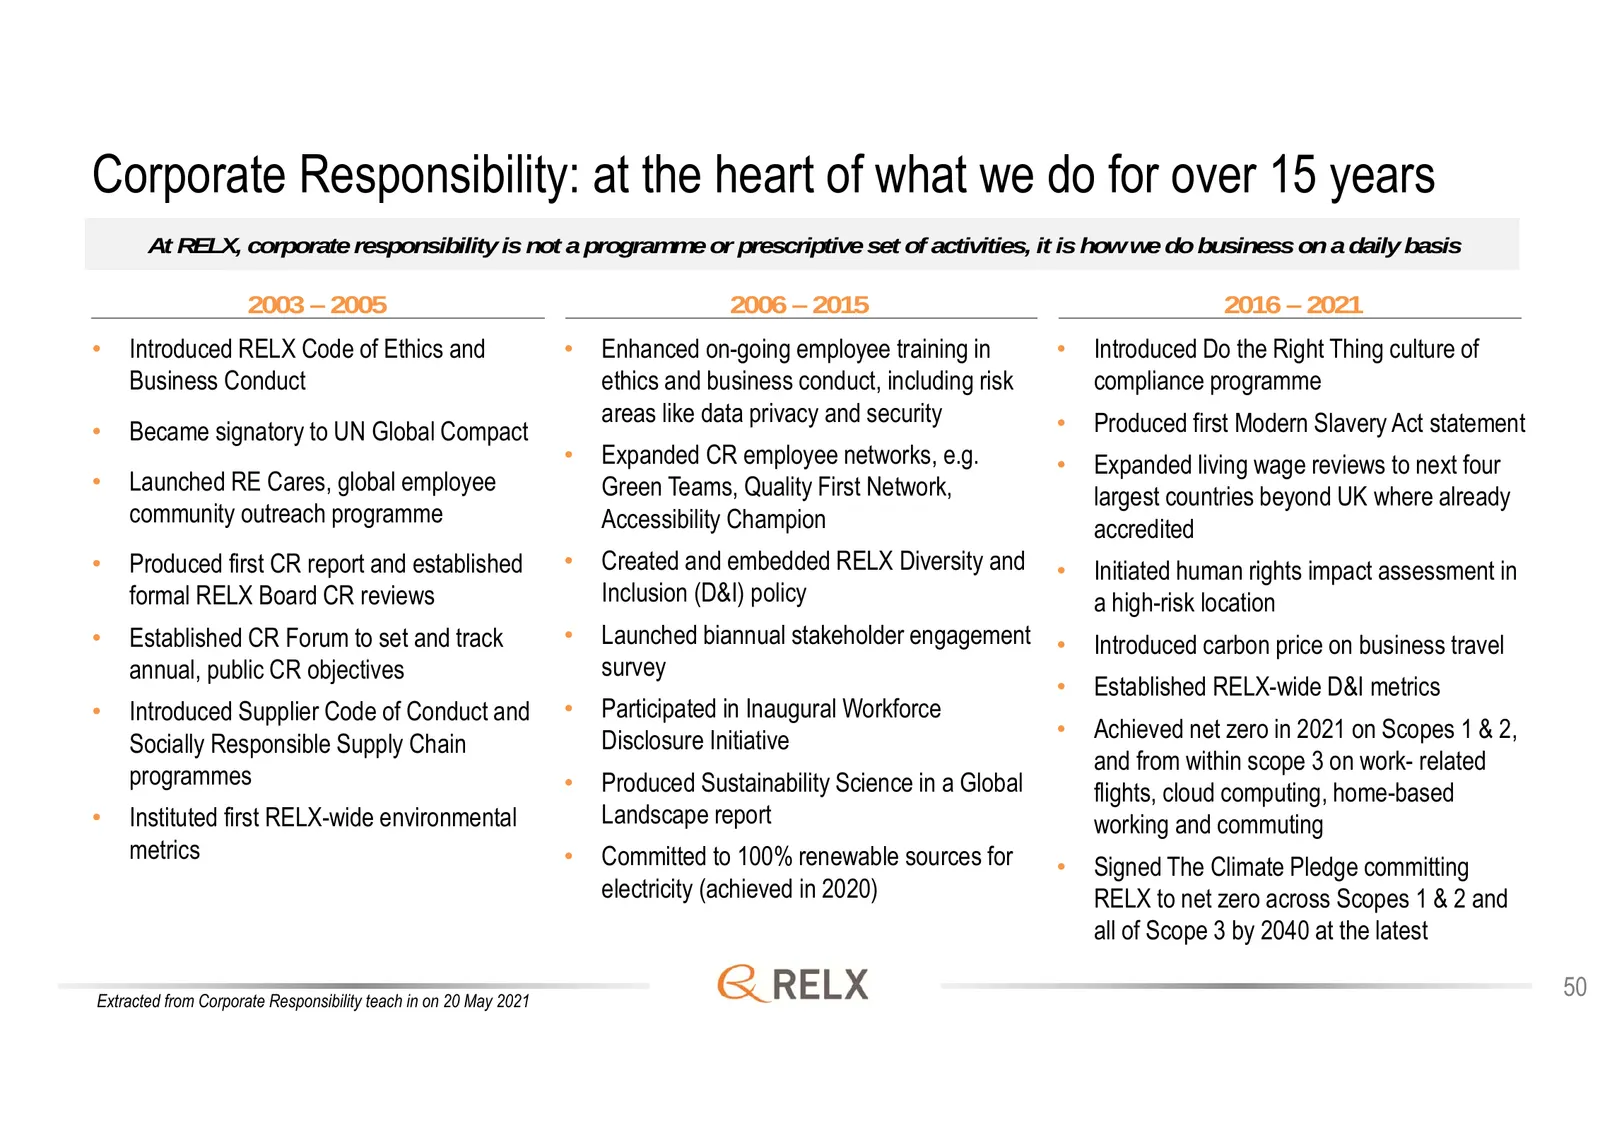
Slide 50: Corporate Responsibility: at the heart of what we do for over 15 years
Corporate Responsibility: at the heart of what we do for over 15 years At RELX, corporate responsibility is not a programme or prescriptive set of activities, it is how we do business on a daily basis 2003 – 2005 2006 – 2015 2016 – 2021 • Introduced RELX Code of Ethics and • Enhanced on-going employ
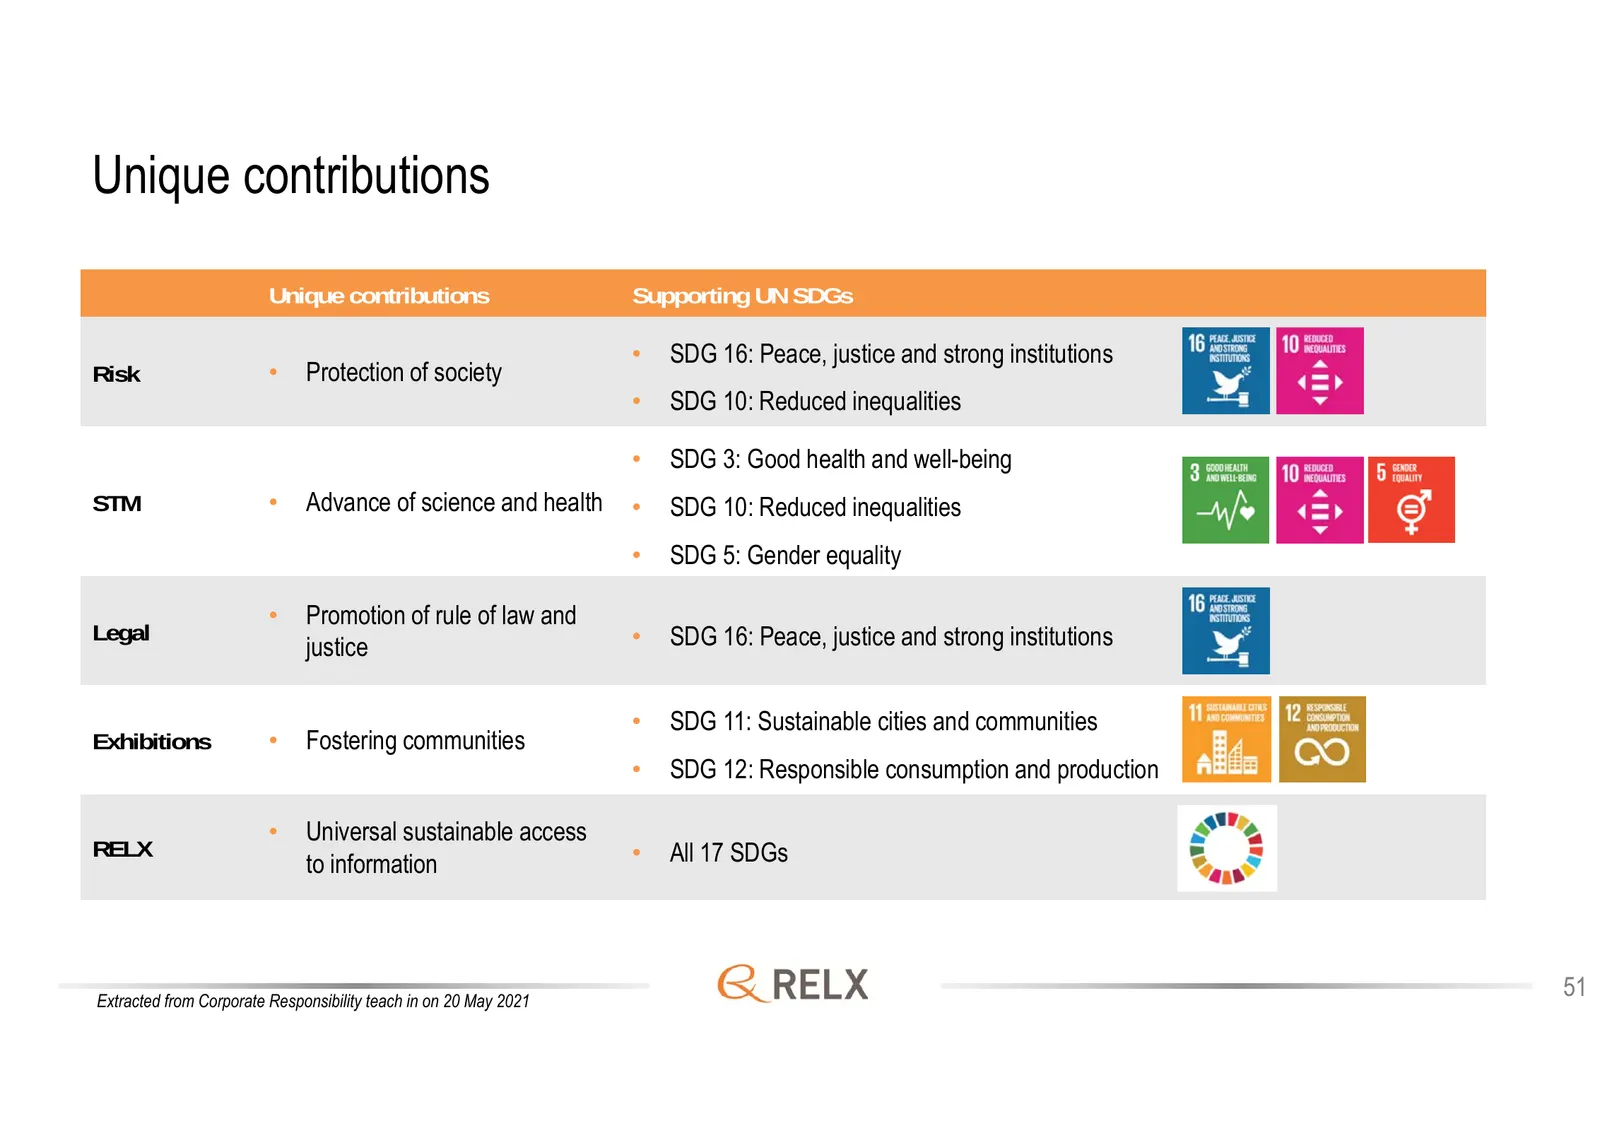
Slide 51: Unique contributions
Unique contributions Unique contributions Supporting UN SDGs • SDG 16: Peace, justice and strong institutions Risk • Protection of society • SDG 10: Reduced inequalities • SDG 3: Good health and well-being STM • Advance of science and health • SDG 10: Reduced inequalities • SDG 5: Gender equality •
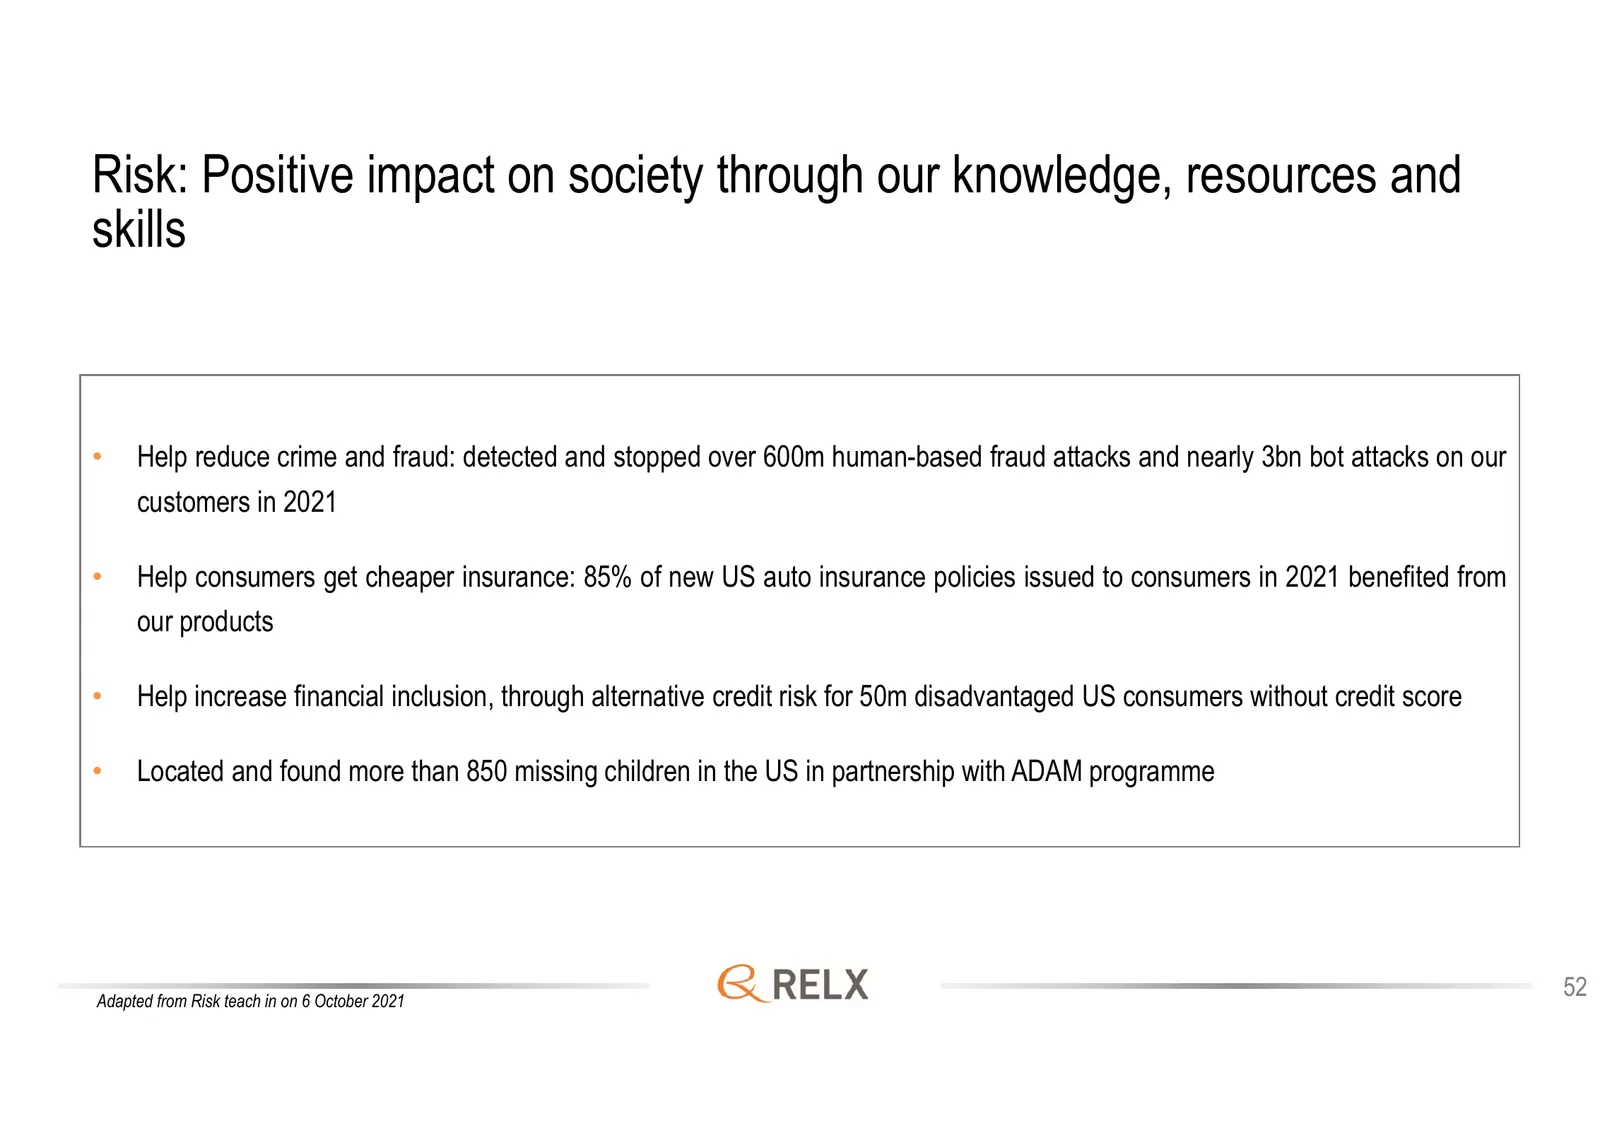
Slide 52: Risk: Positive impact on society through our knowledge, resources and skills
Risk: Positive impact on society through our knowledge, resources and skills • Help reduce crime and fraud: detected and stopped over 600m human-based fraud attacks and nearly 3bn bot attacks on our customers in 2021 • Help consumers get cheaper insurance: 85% of new US auto insurance policies issue
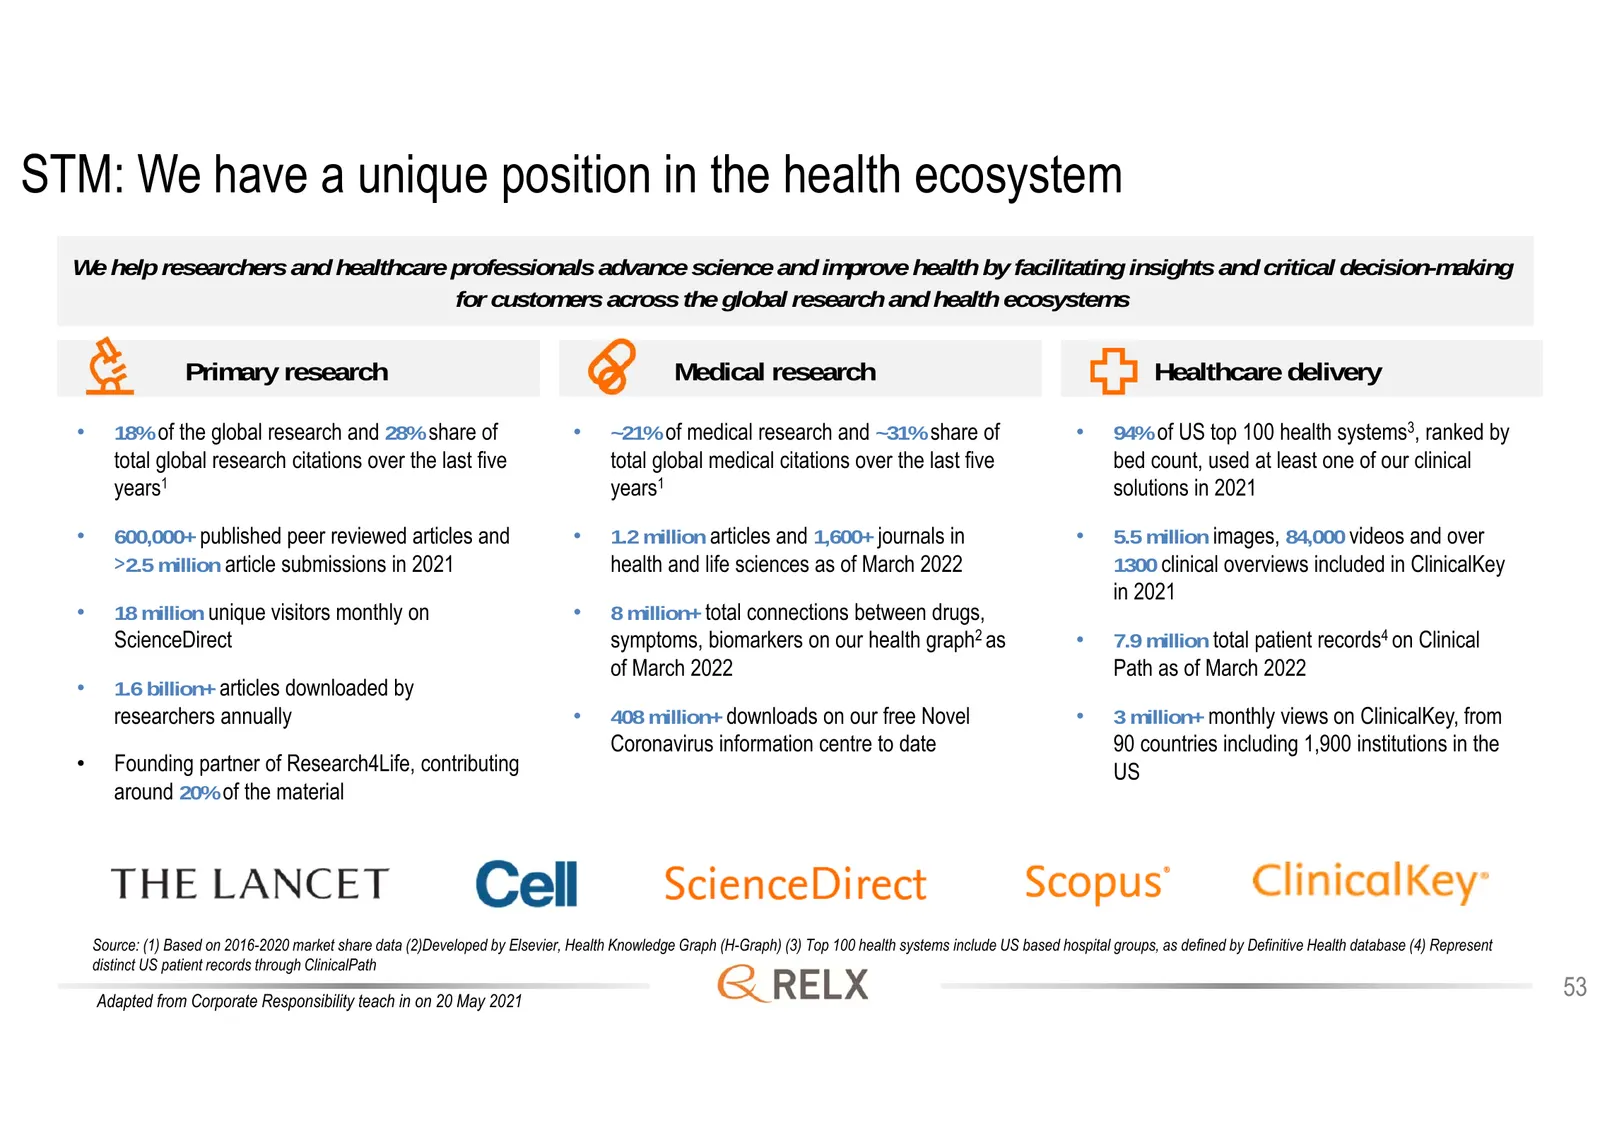
Slide 53: STM: We have a unique position in the health ecosystem
STM: We have a unique position in the health ecosystem We help researchers and healthcare professionals advance science and improve health by facilitating insights and critical decision-making for customers across the global research and health ecosystems Primary research Medical research Healthcare
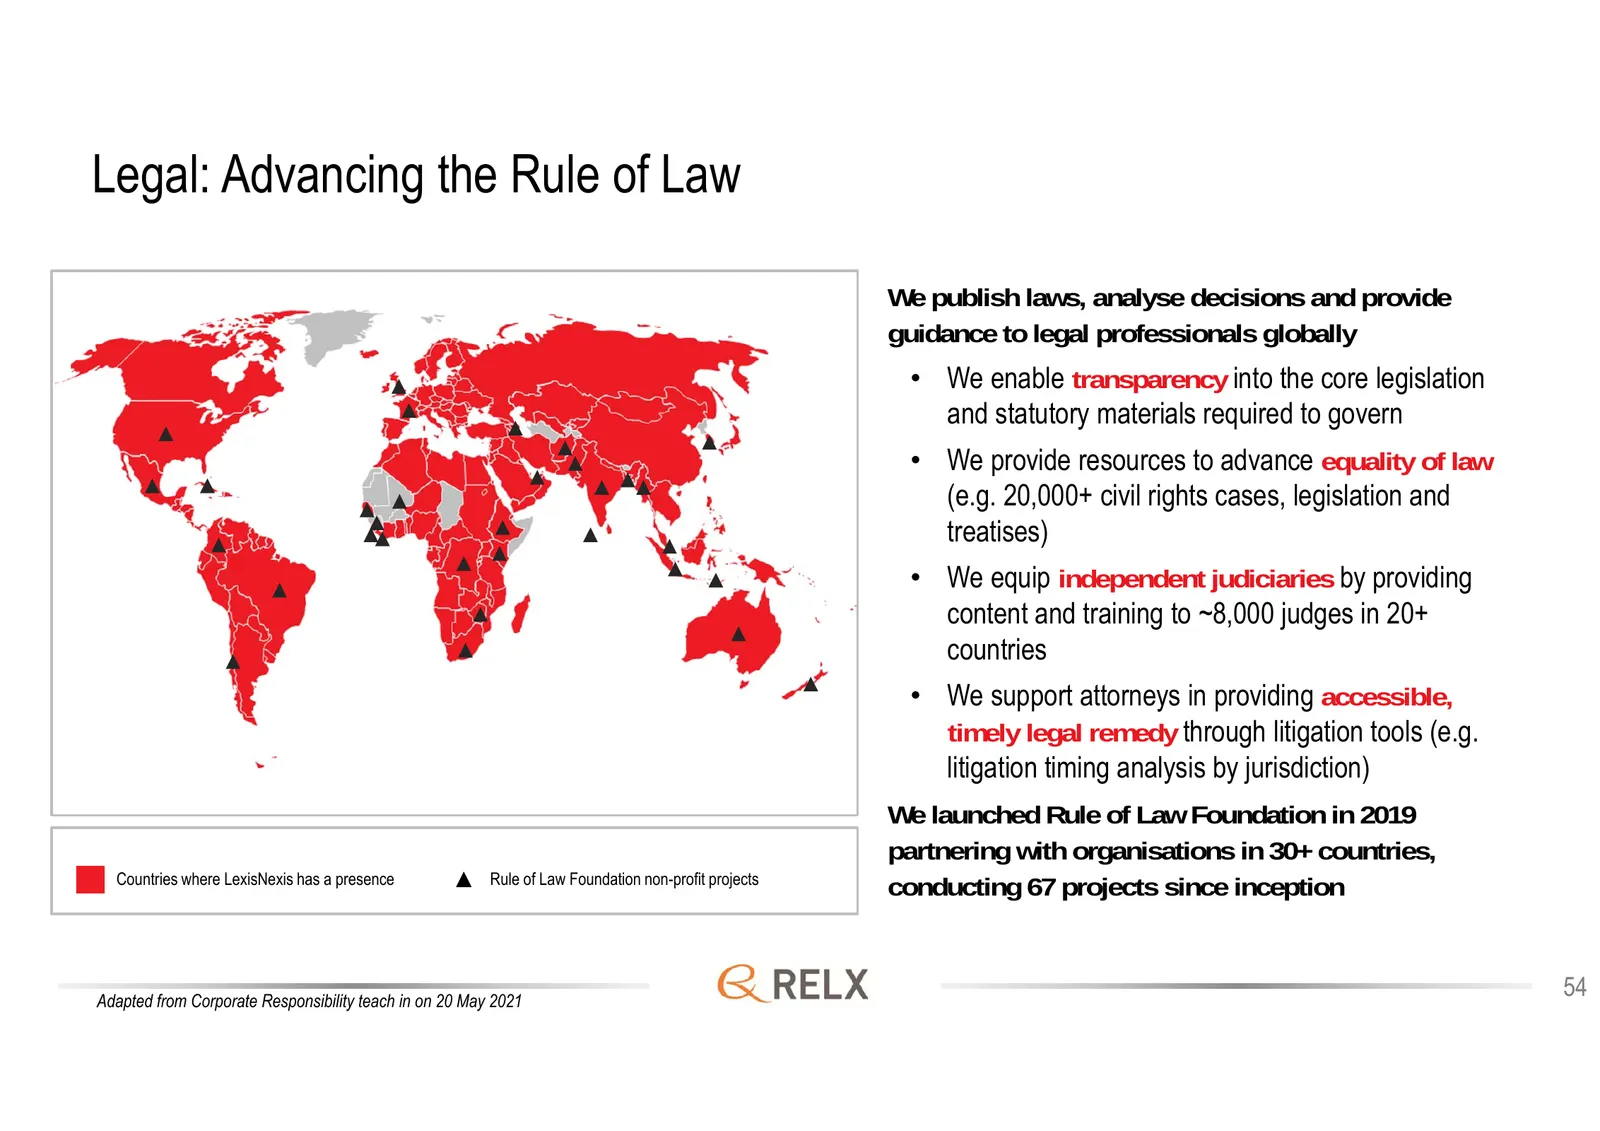
Slide 54: Legal: Advancing the Rule of Law
Legal: Advancing the Rule of Law We publish laws, analyse decisions and provide guidance to legal professionals globally • We enable transparency into the core legislation and statutory materials required to govern • We provide resources to advance equality of law (e.g. 20,000+ civil rights cases, l
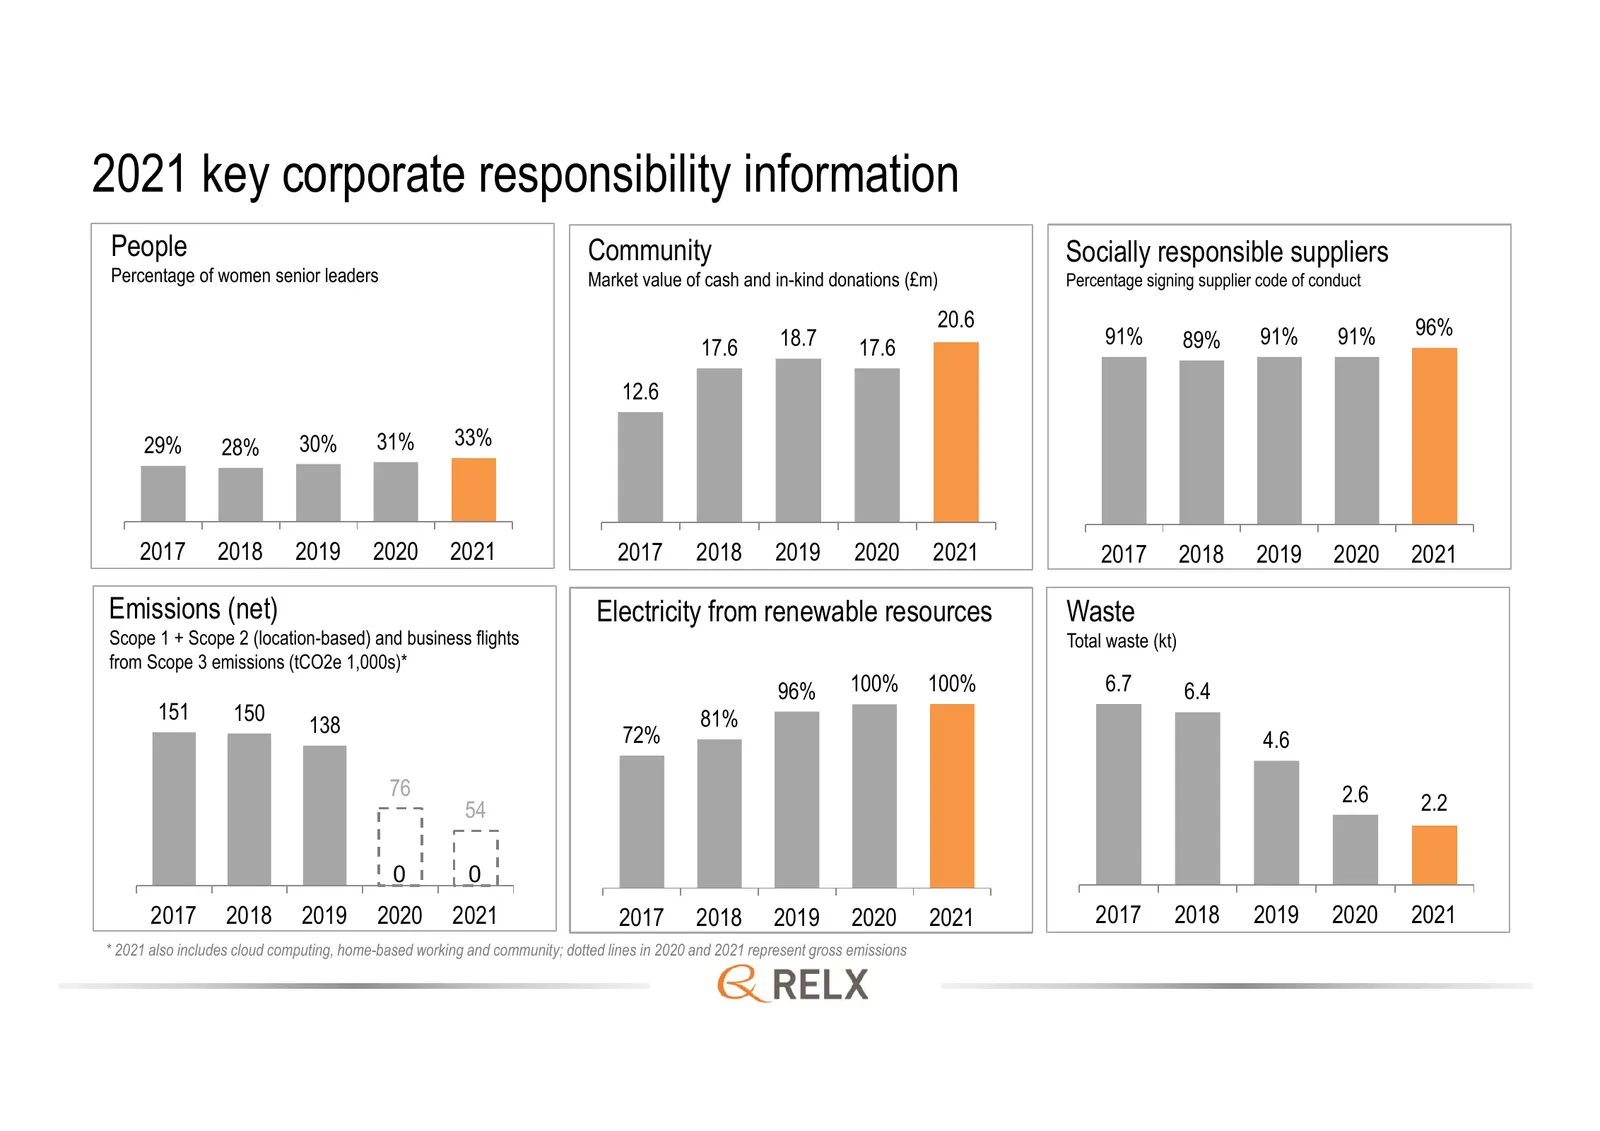
Slide 55: 2021 key corporate responsibility information
2021 key corporate responsibility information People Community Socially responsible suppliers Percentage of women senior leaders Market value of cash and in-kind donations (£m) Percentage signing supplier code of conduct 20.6 96% 17.6 18.7 17.6 91% 89% 91% 91% 12.6 29% 28% 30% 31% 33% 2017 2018 2019
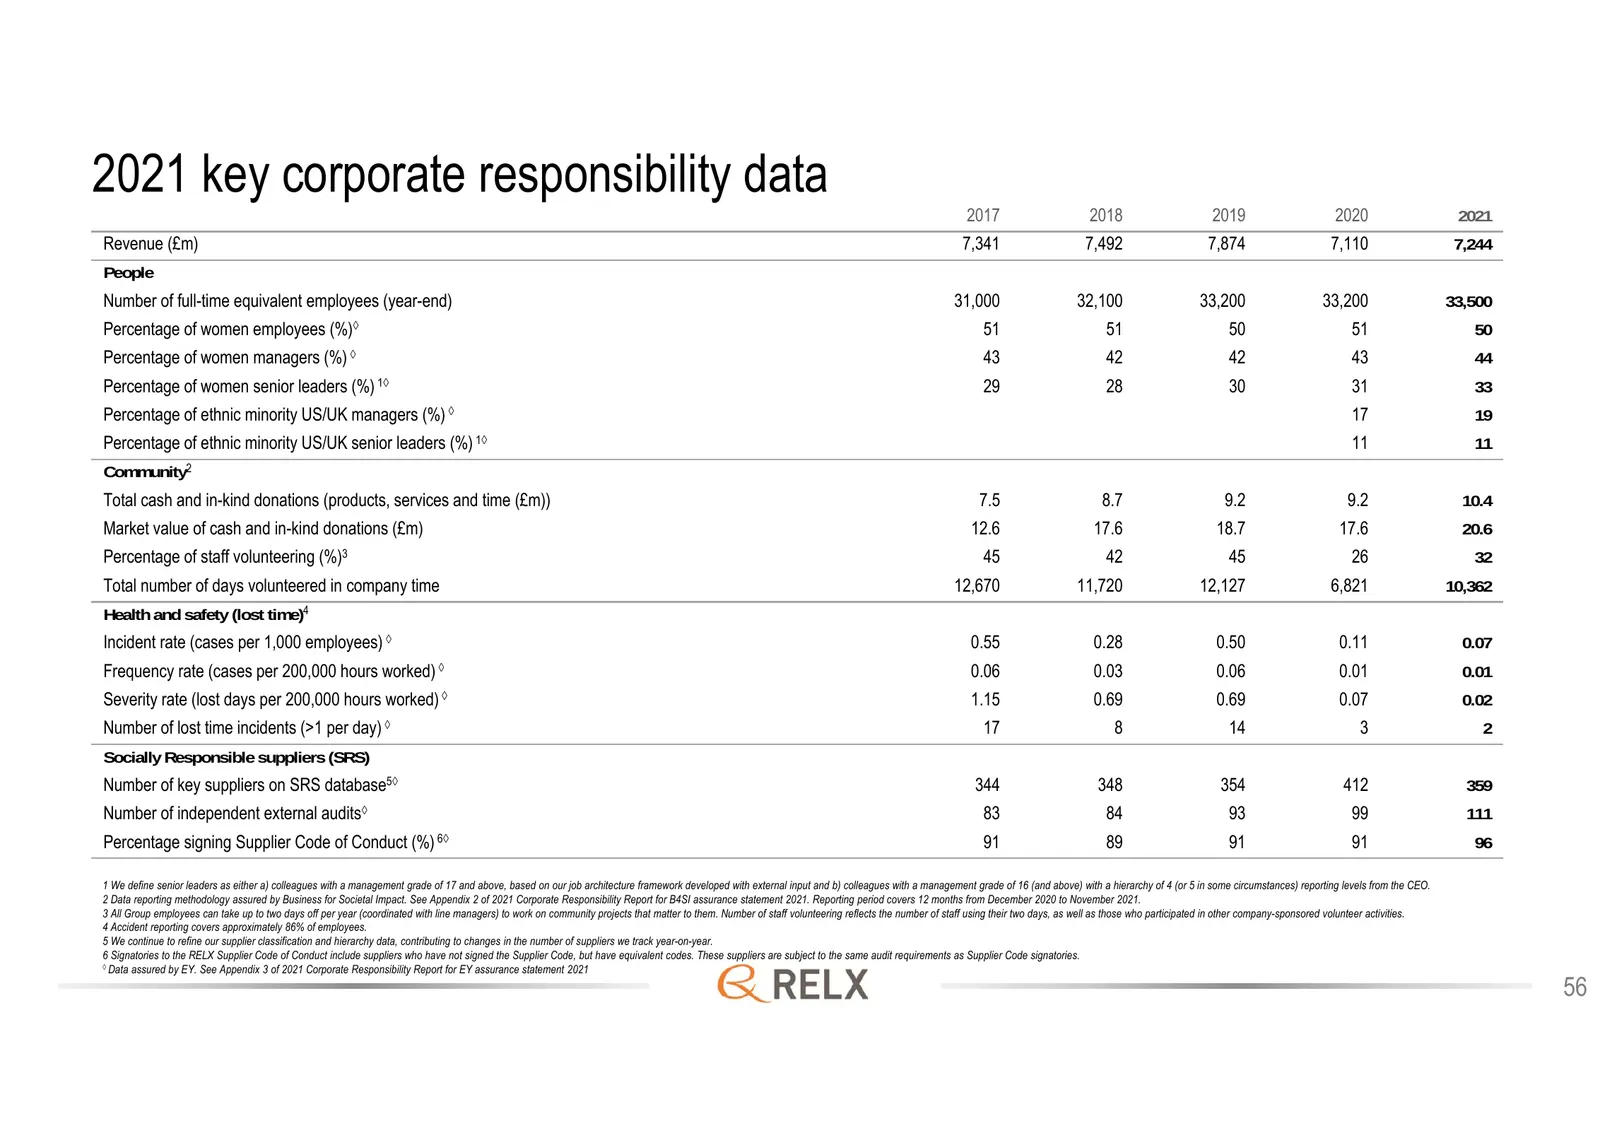
Slide 56: 2021 key corporate responsibility data
2021 key corporate responsibility data 2017 2018 2019 2020 2021 Revenue (£m) 7,341 7,492 7,874 7,110 7,244 People Number of full-time equivalent employees (year-end) 31,000 32,100 33,200 33,200 33,500 Percentage of women employees (%)◊ 51 51 50 51 50 Percentage of women managers (%) ◊ 43 42 42 43 44
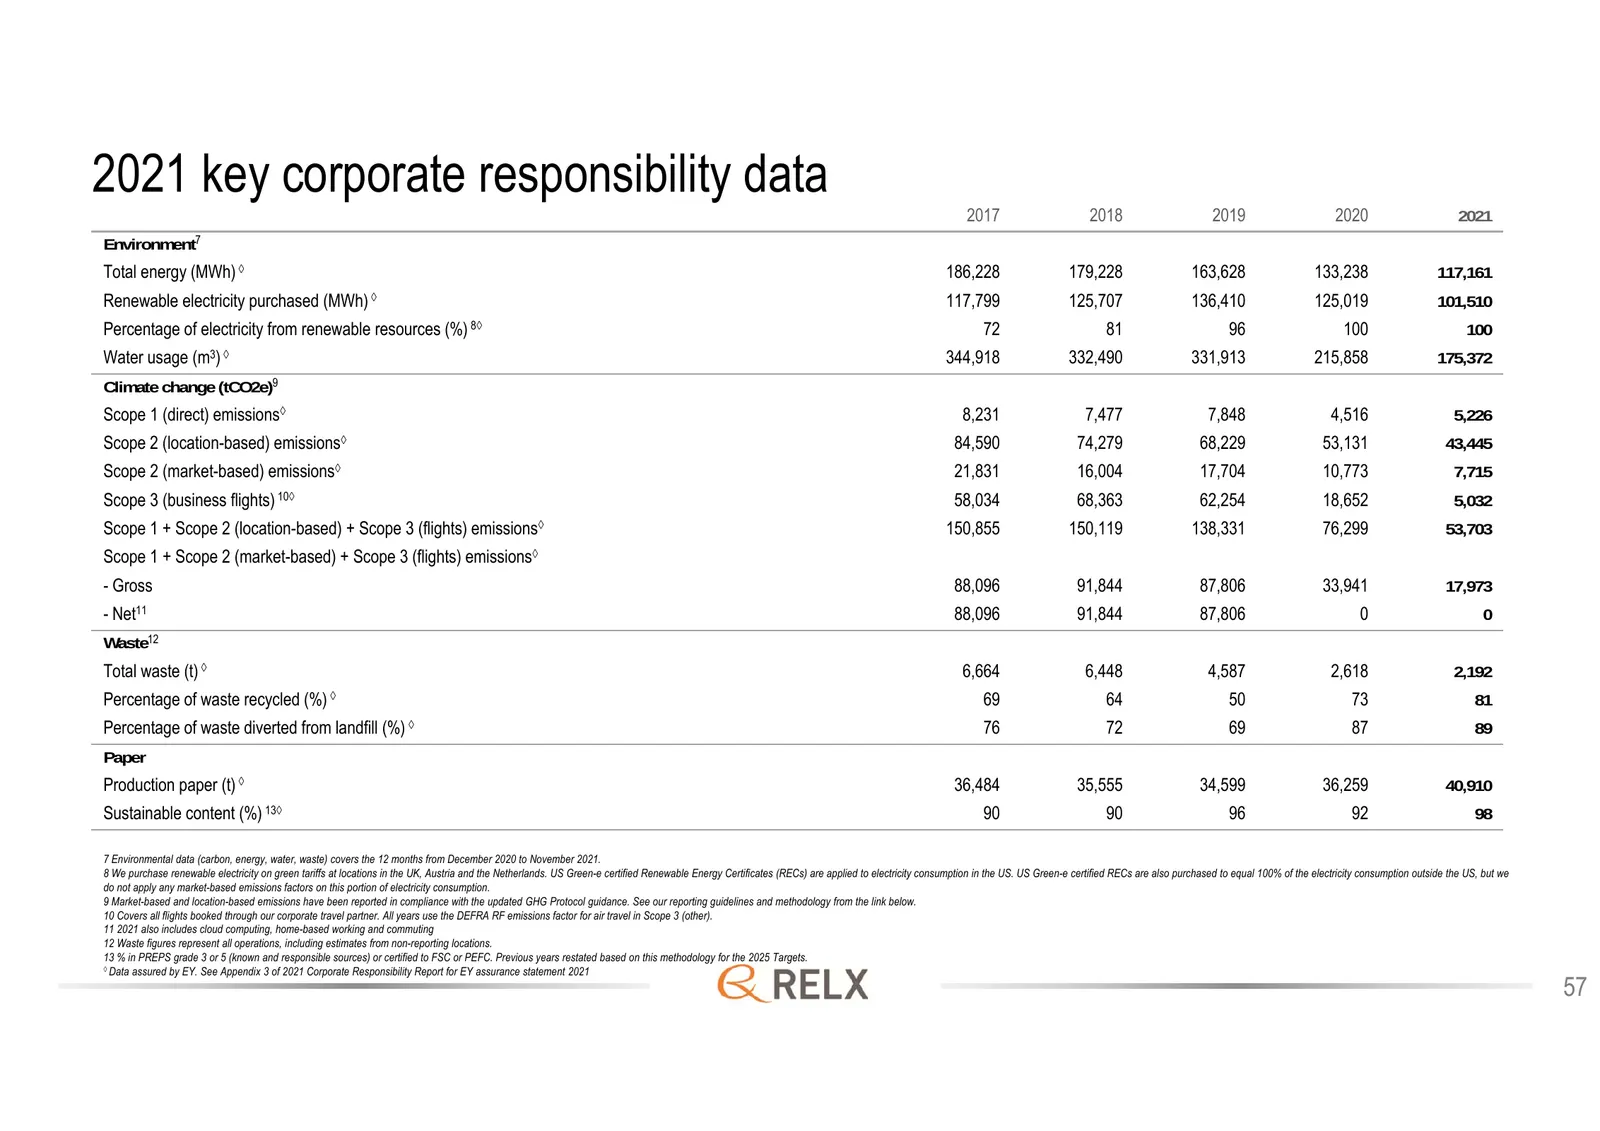
Slide 57: 2021 key corporate responsibility data
2021 key corporate responsibility data 2017 2018 2019 2020 2021 Environment7 Total energy (MWh) ◊ 186,228 179,228 163,628 133,238 117,161 Renewable electricity purchased (MWh) ◊ 117,799 125,707 136,410 125,019 101,510 Percentage of electricity from renewable resources (%) 8◊ 72 81 96 100 100 Water u
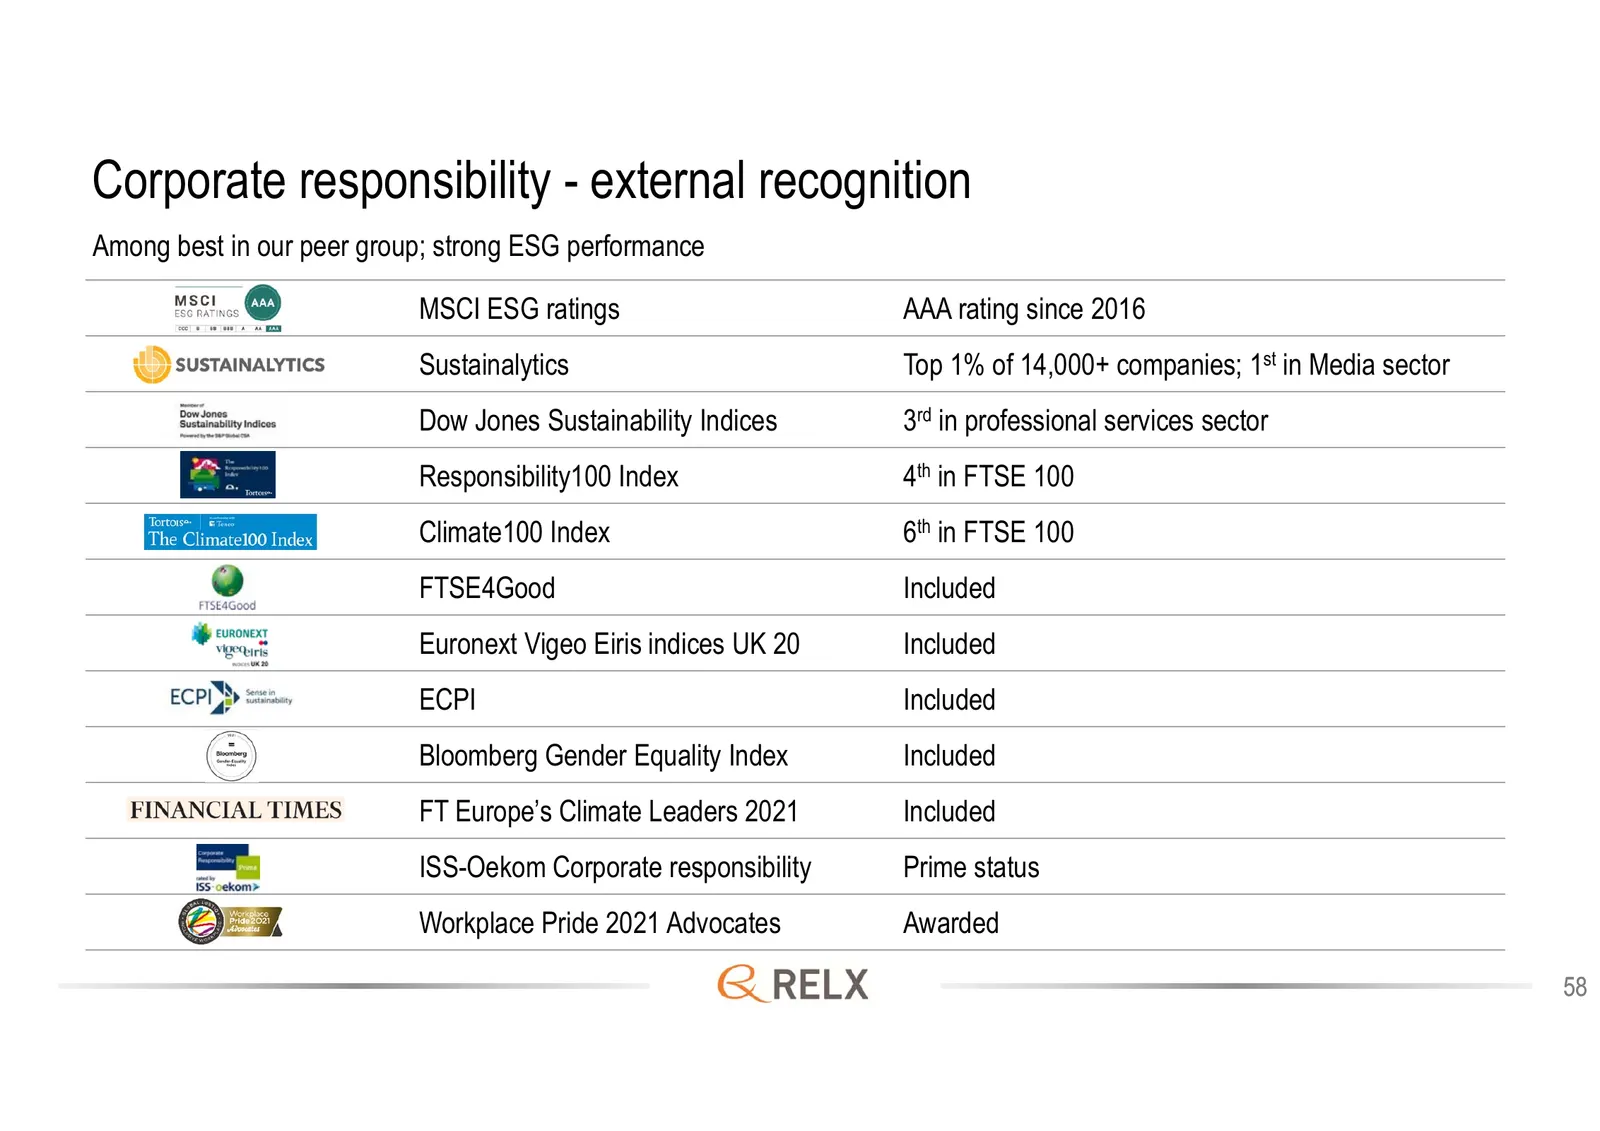
Slide 58: Corporate responsibility - external recognition
Corporate responsibility - external recognition Among best in our peer group; strong ESG performance MSCI ESG ratings AAA rating since 2016 Sustainalytics Top 1% of 14,000+ companies; 1st in Media sector Dow Jones Sustainability Indices 3rd in professional services sector Responsibility100 Index 4th

Slide 59: This slide is intentionally left blank
This slide is intentionally left blank 59
Source: Internet Archive copy of relx.com
More decks from Relx PLC
 Investor Presentation (November 2026)71 slides · November 2026
 Investor Presentation (September 2026)69 slides · September 2026
 H1 2026 Earnings Presentation30 slides · Jul 23, 2026
 FY2025 Earnings Presentation39 slides · Feb 12, 2026
 H1 2025 Earnings Presentation30 slides · Jul 24, 2025
 FY2024 Earnings Presentation20 slides · Feb 13, 2025