Relx PLC · LSE:REL
Relx — Investor Presentation (November 2026)
71 slides from Relx's investor presentation, November 2026

Slide 1: The global provider of information-based analytics and decision tools
The global provider of information-based analytics and decision tools November 2026
Slide 2: RELX Investor Relations contacts
RELX Investor Relations contacts Paul Sullivan – Head of Investor Relations James Statham – Director, Investor Relations paul.sullivan@relx.com james.statham@relx.com Natalia Gardner – Investor Relations Associate Kate Whitaker – Investor Relations natalia.gardner@relx.com kate.whitaker@relx.com 2

Slide 3: Disclaimer regarding forward-looking statements
DISCLAIMER REGARDING FORWARD-LOOKING STATEMENTS This presentation contains forward-looking statements within the meaning of Section 27A of the US Securities Act of 1933, as amended, and Section 21E of the US Securities Exchange Act of 1934, as amended. These statements are subject to risks and uncer
Slide 4: RELX is a global provider of information-based analytics and decision tools
RELX is a global provider of information-based analytics and decision tools for professional and business customers, enabling them to make better decisions, get better results and be more productive 4
Slide 5: RELX global scale and growth 2025
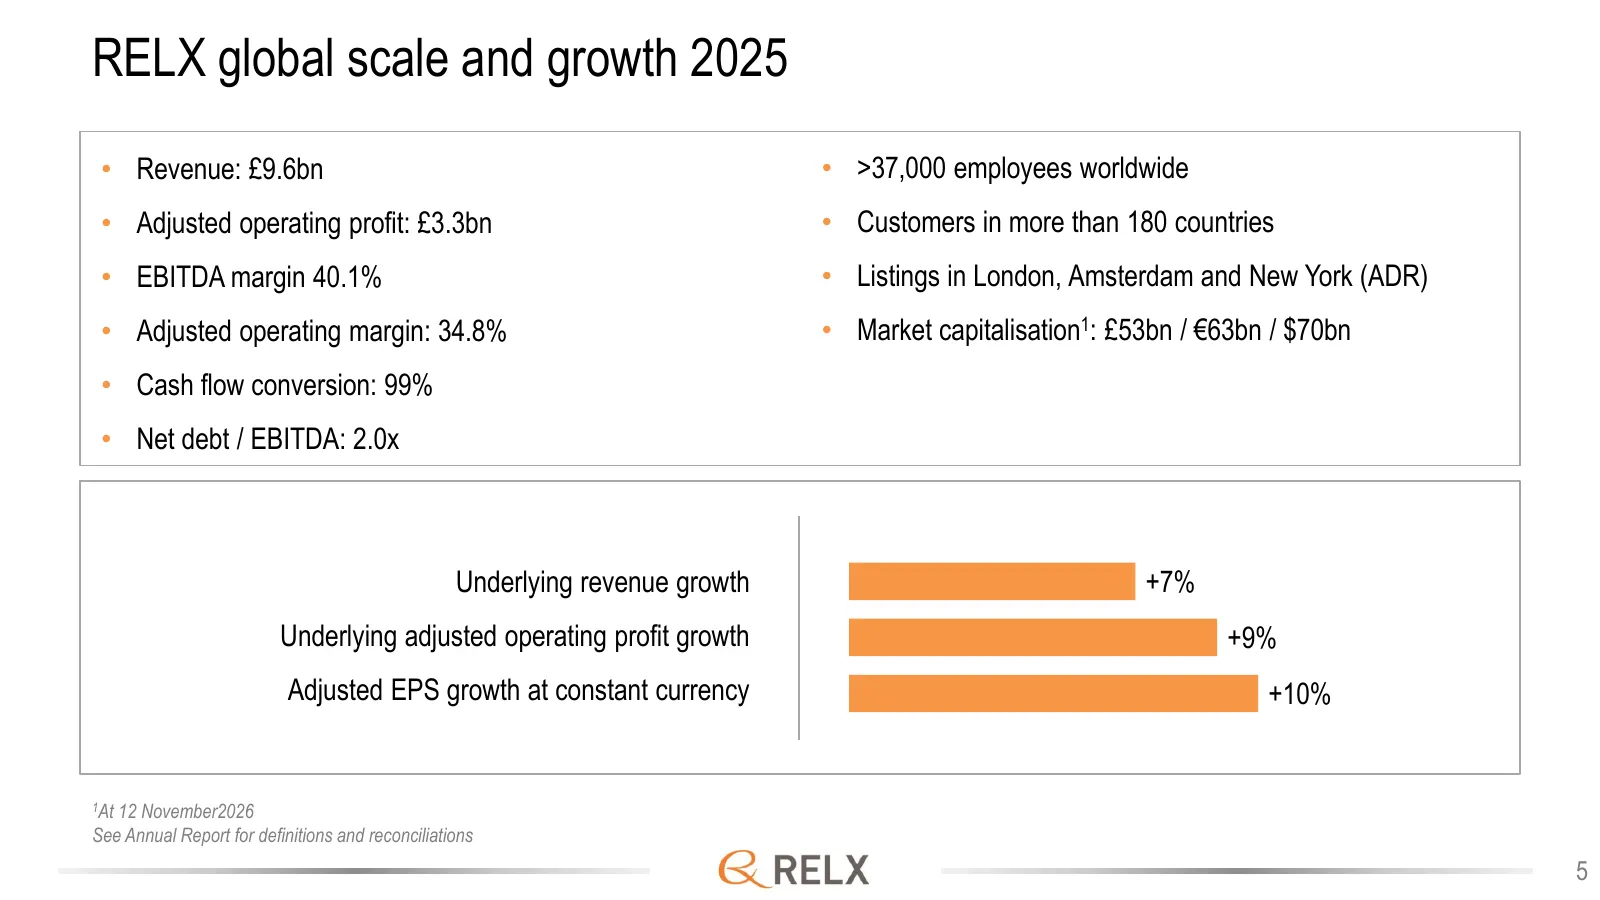
RELX global scale and growth 2025 • Revenue: £9.6bn • >37,000 employees worldwide • Adjusted operating profit: £3.3bn • Customers in more than 180 countries • EBITDA margin 40.1% • Listings in London, Amsterdam and New York (ADR) \ • Adjusted operating margin: 34.8% • Market capitalisation1: £53bn /
Slide 6: H1 2026 Progress and financial highlights
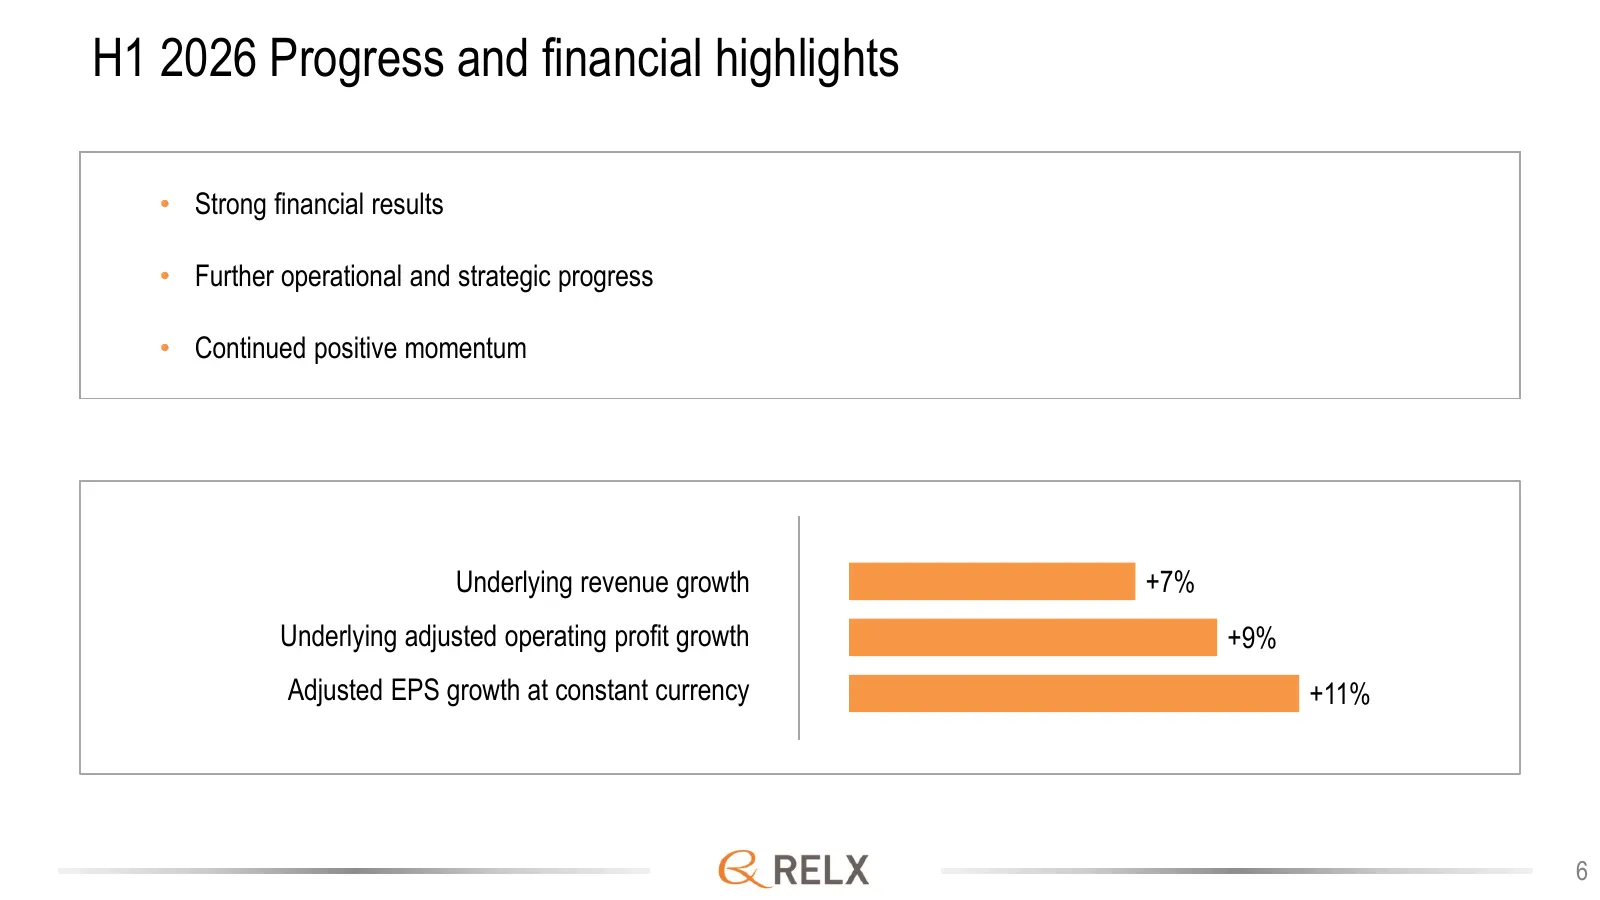
H1 2026 Progress and financial highlights • Strong financial results • Further operational and strategic progress • Continued positive momentum Underlying revenue growth +7% Underlying adjusted operating profit growth +9% Adjusted EPS growth at constant currency +11% 6
Slide 7: Progress and outlook
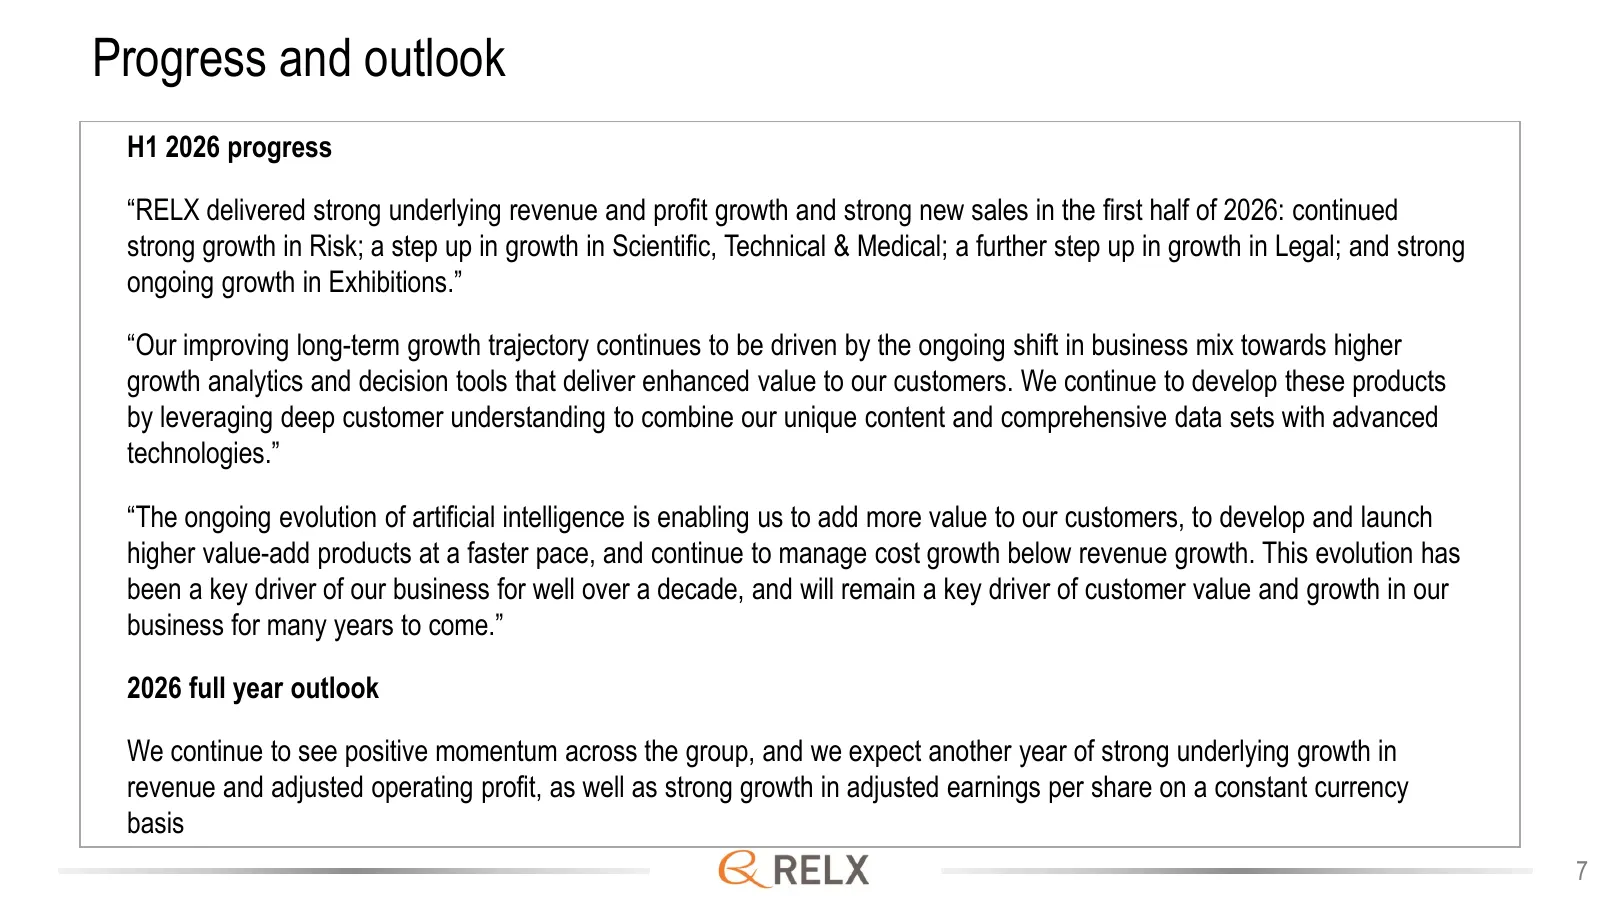
Progress and outlook H1 2026 progress “RELX delivered strong underlying revenue and profit growth and strong new sales in the first half of 2026: continued strong growth in Risk; a step up in growth in Scientific, Technical & Medical; a further step up in growth in Legal; and strong ongoing growth i
Slide 8: RELX H1 2026 revenue by category
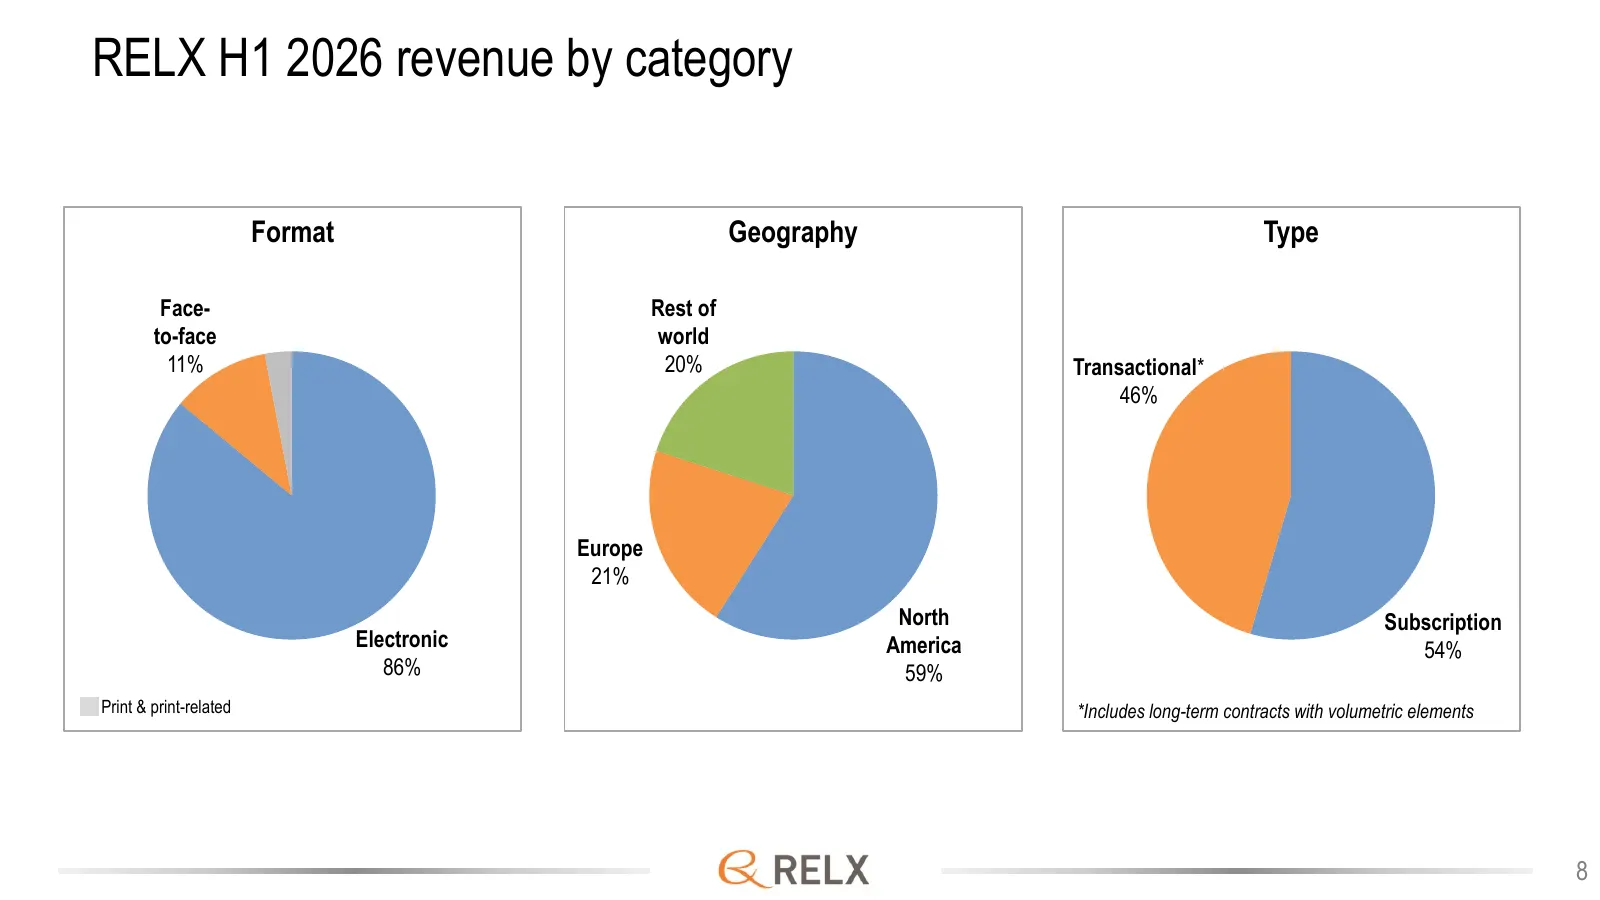
RELX H1 2026 revenue by category Format Geography Type Face- Rest of to-face world 11% 20% Transactional* 46% Europe 21% North Subscription Electronic America 54% 86% 59% Print & print-related *Includes long-term contracts with volumetric elements 8
Slide 9: RELX revenue by format
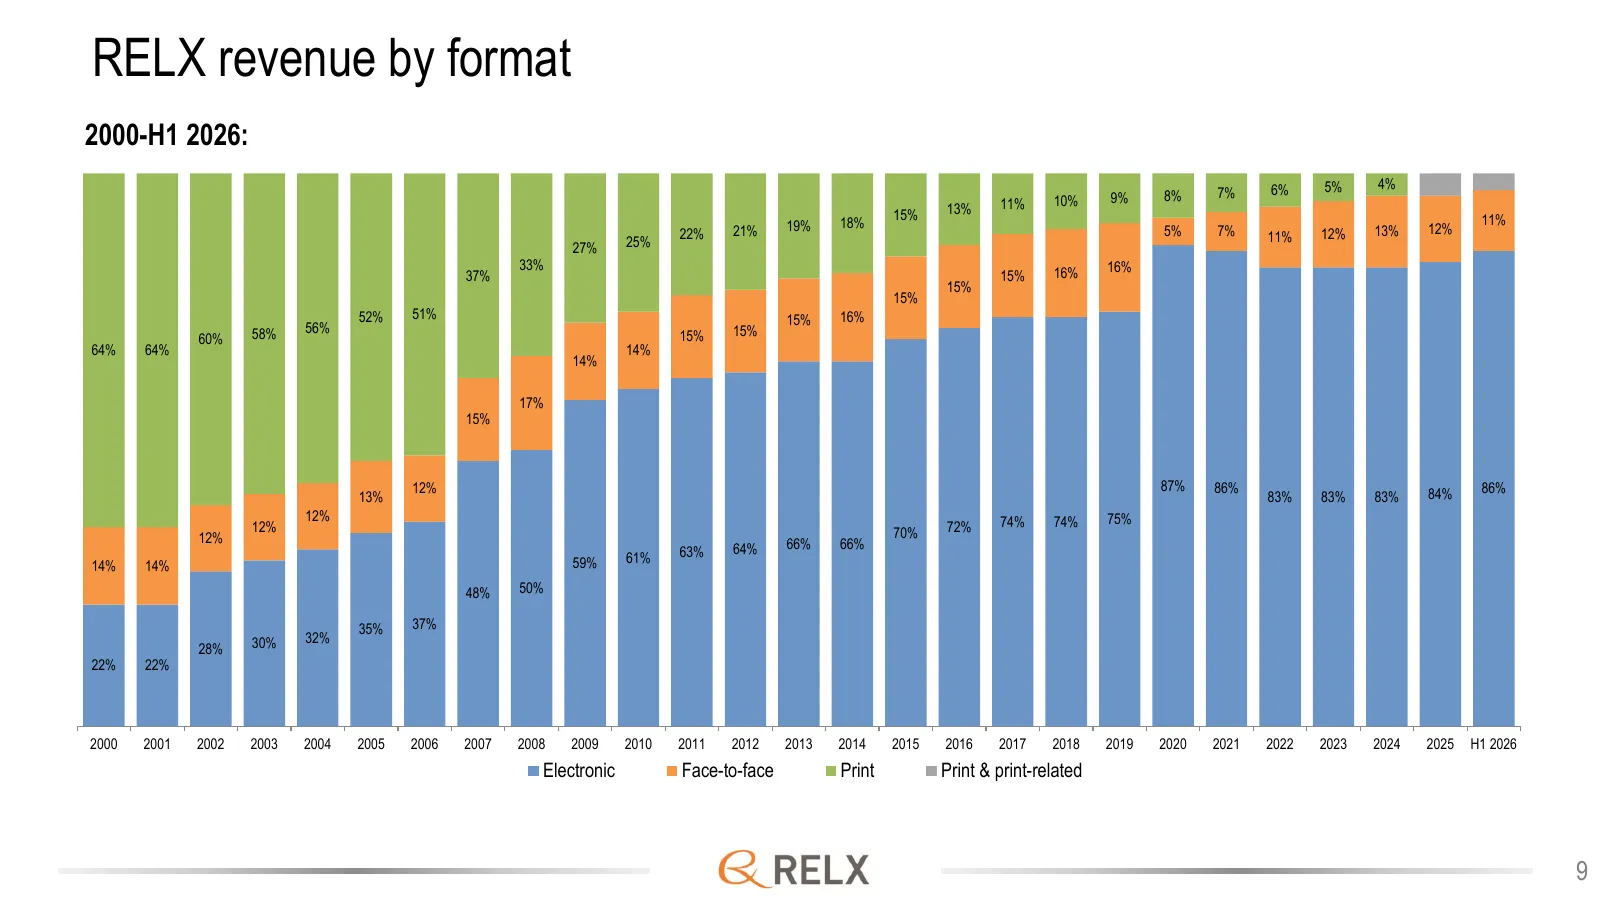
RELX revenue by format 2000-H1 2026: 6% 5% 4% 9% 8% 7% 11% 10% 15% 13% 19% 18% 11% 22% 21% 5% 7% 12% 13% 12% 25% 11% 27% 33% 16% 37% 15% 16% 15% 15% 52% 51% 15% 16% 58% 56% 15% 60% 15% 64% 64% 14% 14% 17% 15% 12% 87% 86% 86% 13% 83% 83% 83% 84% 12% 74% 74% 75% 12% 70% 72% 12% 66% 66% 63% 64% 59% 61%
Slide 10: RELX strategic direction
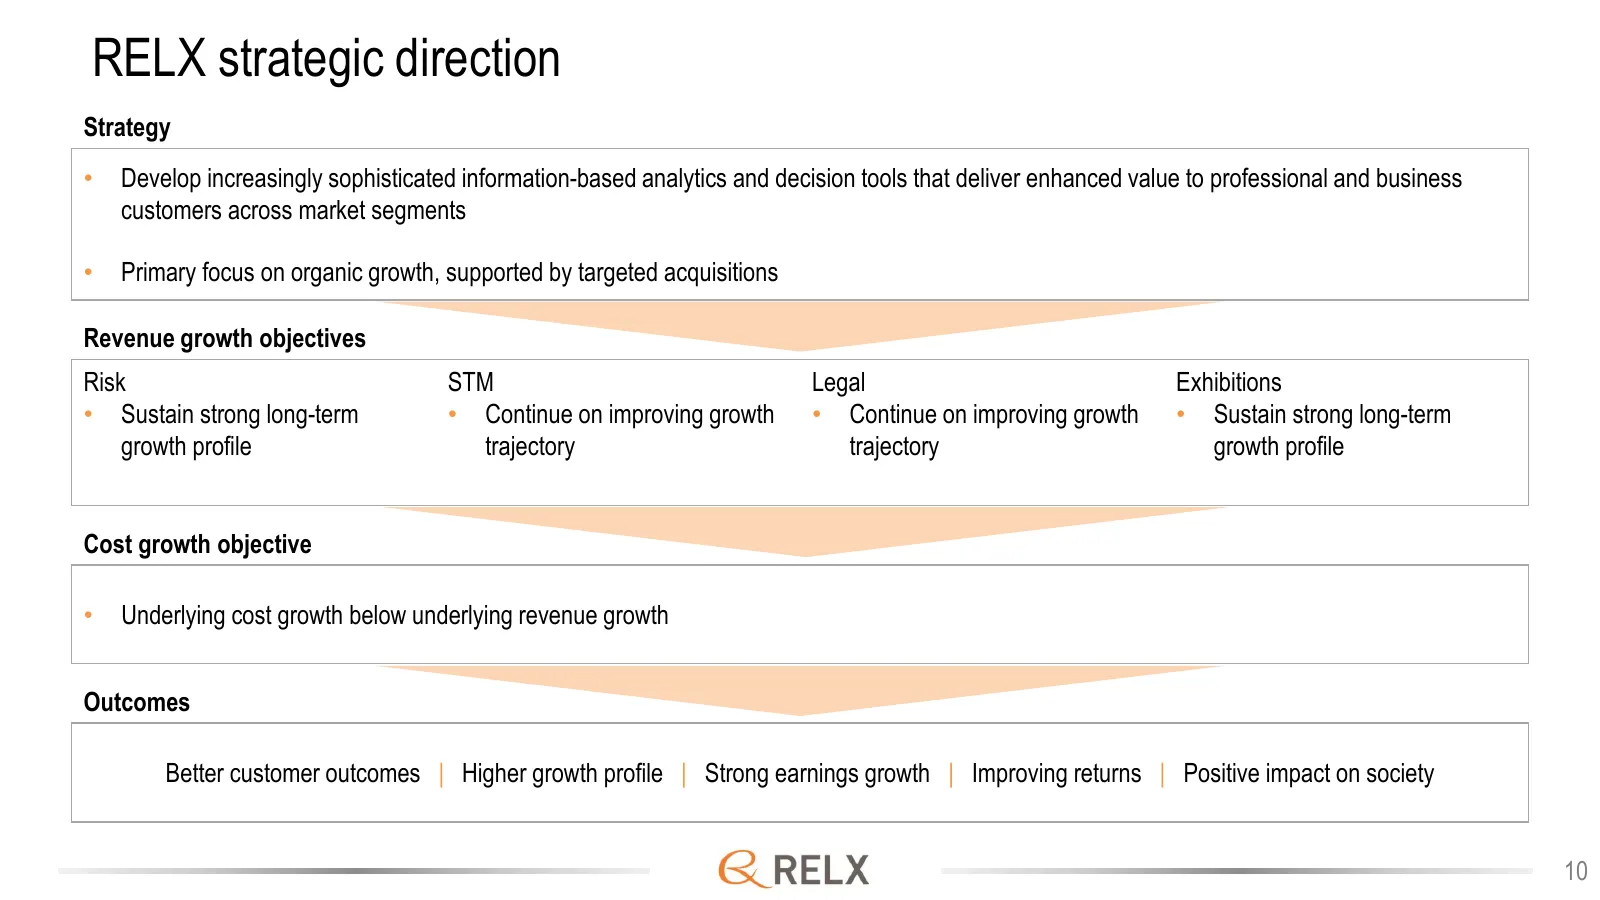
RELX strategic direction Strategy • Develop increasingly sophisticated information-based analytics and decision tools that deliver enhanced value to professional and business customers across market segments • Primary focus on organic growth, supported by targeted acquisitions Revenue growth objecti
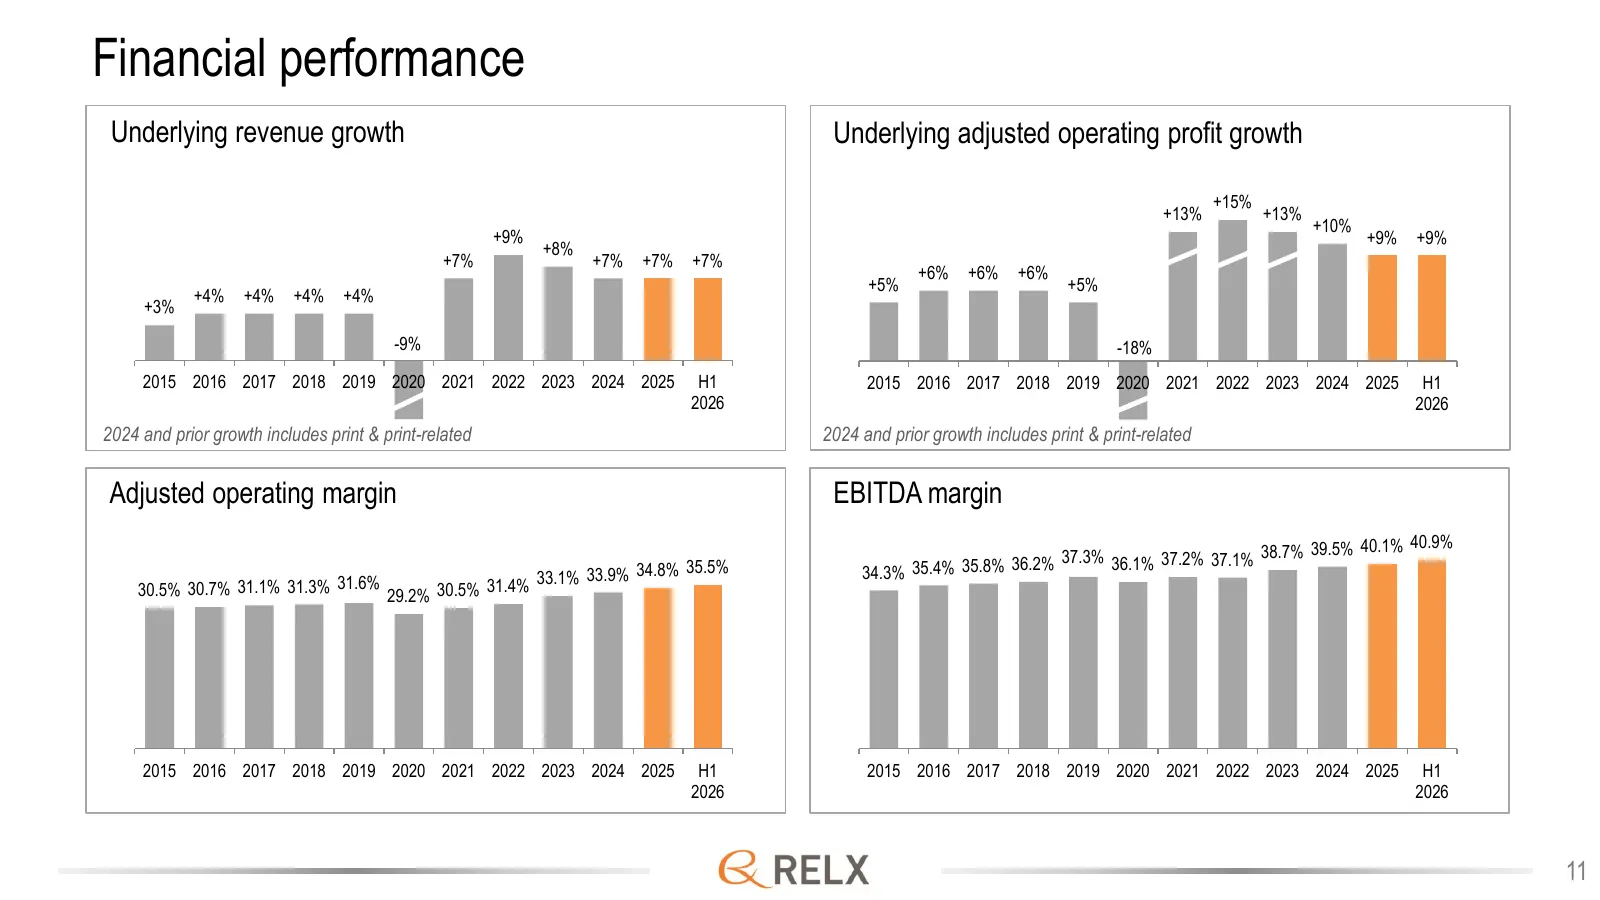
Slide 11: Financial performance
Financial performance Underlying revenue growth Underlying adjusted operating profit growth +15% +13% +13% +10% +9% +9% +9% +8% +7% +7% +7% +7% +6% +6% +6% +5% +5% +4% +4% +4% +4% +3% -9% -18% 2015 2016 2017 2018 2019 2020 2021 2022 2023 2024 2025 H1 2015 2016 2017 2018 2019 2020 2021 2022 2023 2024
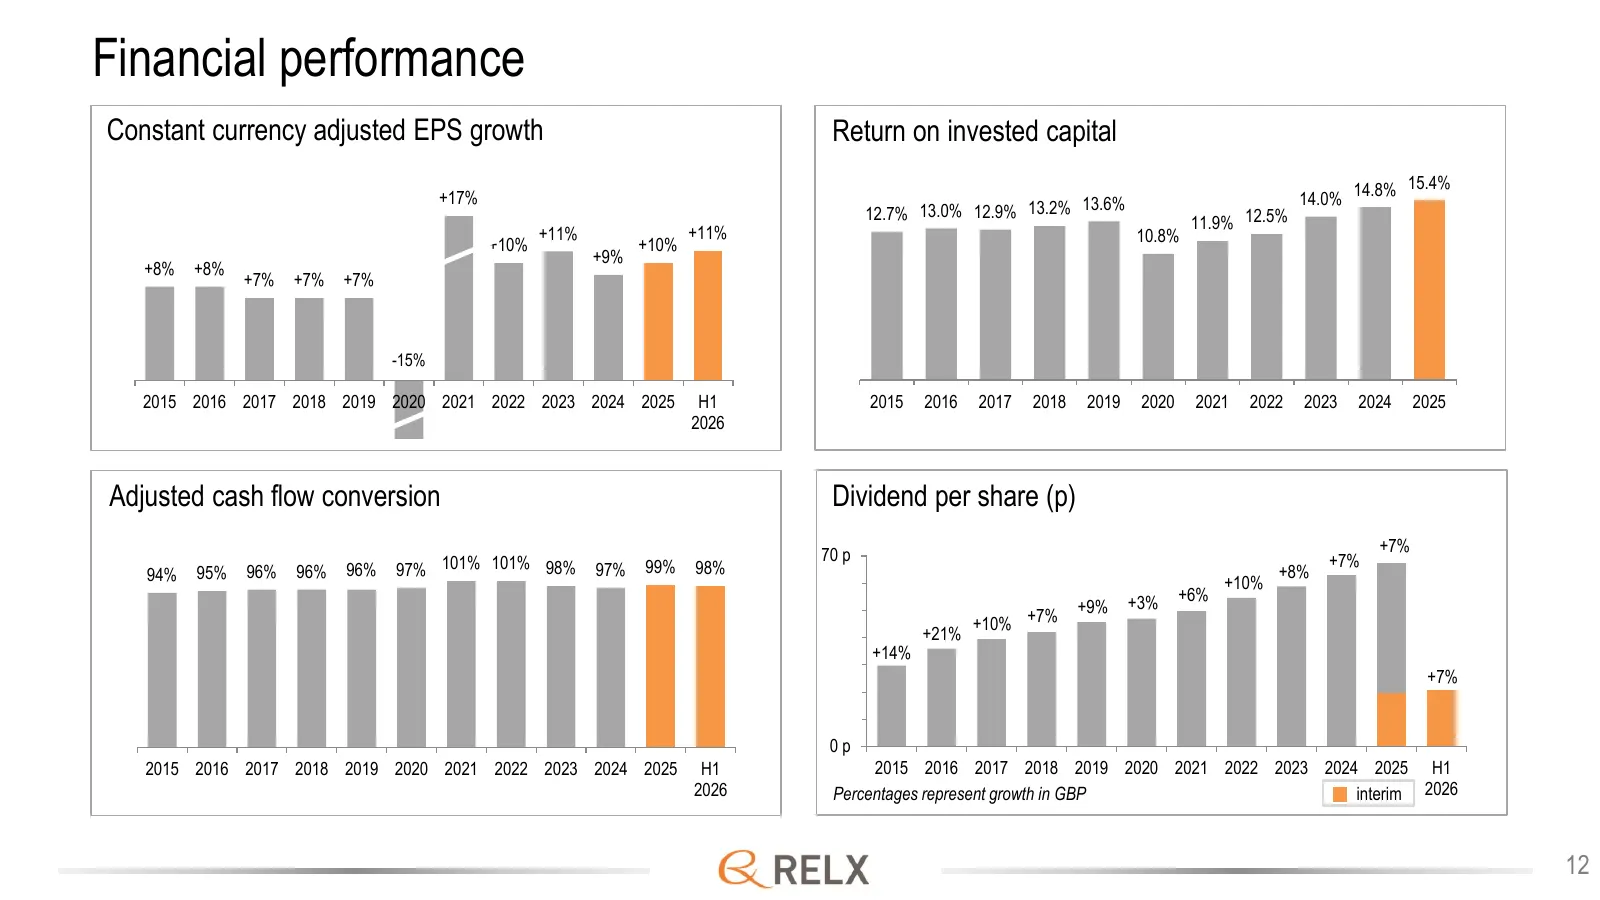
Slide 12: Financial performance
Financial performance Constant currency adjusted EPS growth Return on invested capital +17% 14.8% 15.4% 14.0% 12.7% 13.0% 12.9% 13.2% 13.6% 11.9% 12.5% +11% +11% 10.8% +10% +10% +9% +8% +8% +7% +7% +7% -15% 2015 2016 2017 2018 2019 2020 2021 2022 2023 2024 2025 H1 2015 2016 2017 2018 2019 2020 2021
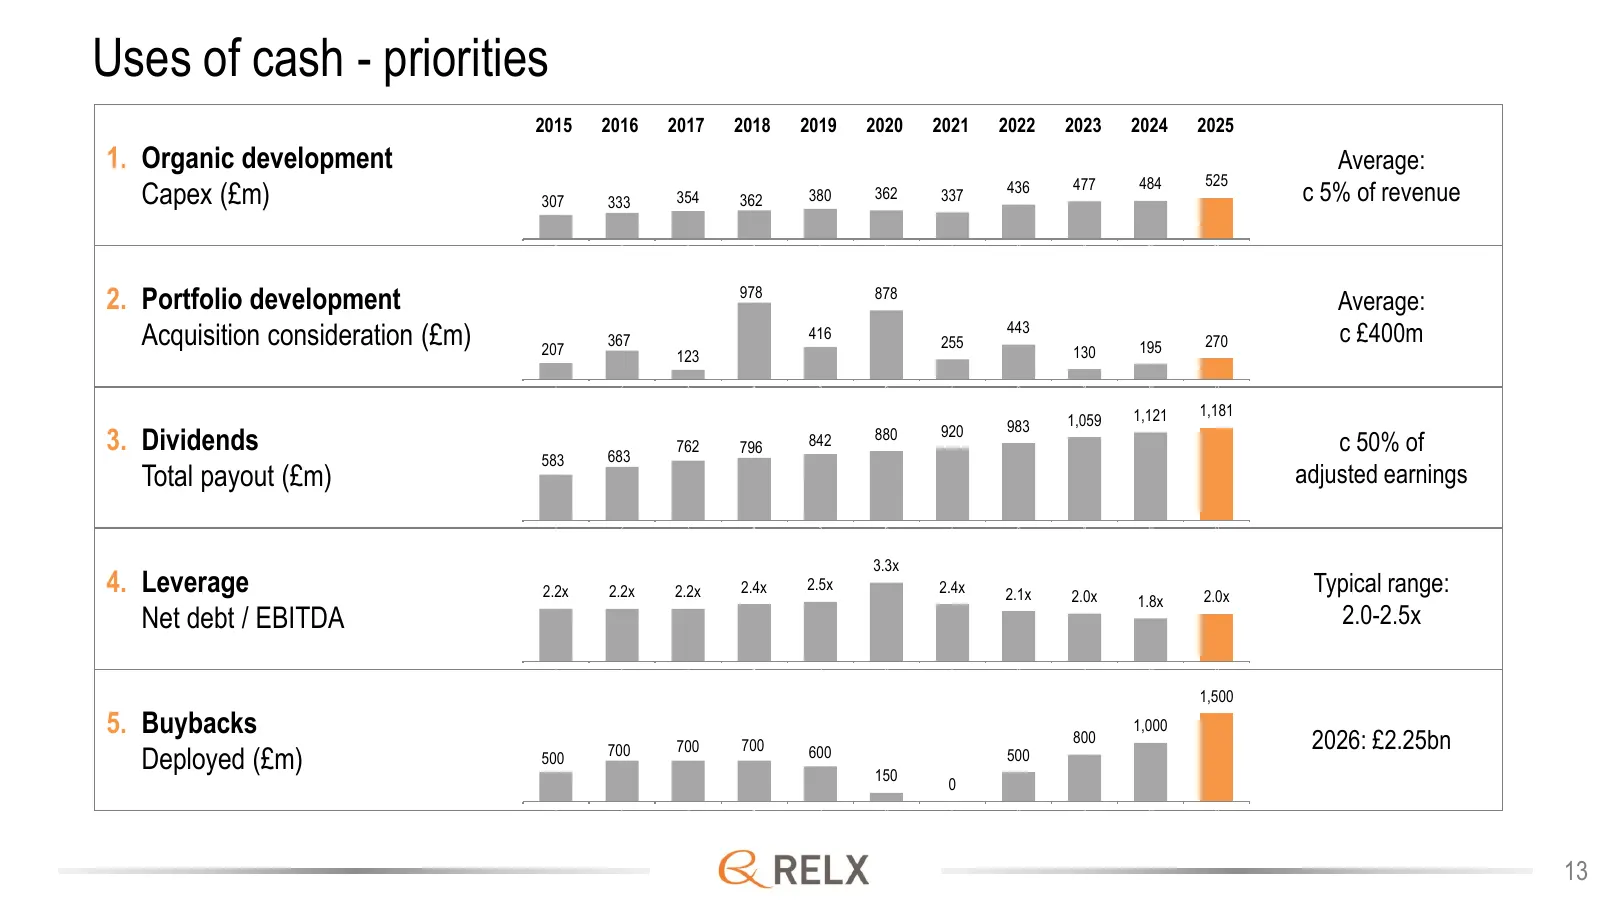
Slide 13: Uses of cash - priorities
Uses of cash - priorities 2015 2016 2017 2018 2019 2020 2021 2022 2023 2024 2025 1. Organic development Average: 484 525 Capex (£m) 307 333 354 362 380 362 337 436 477 c 5% of revenue 1 2 3 4 5 6 7 8 9 10 11 2. Portfolio development 978 878 Average: Acquisition consideration (£m) 207 367 416 255 443
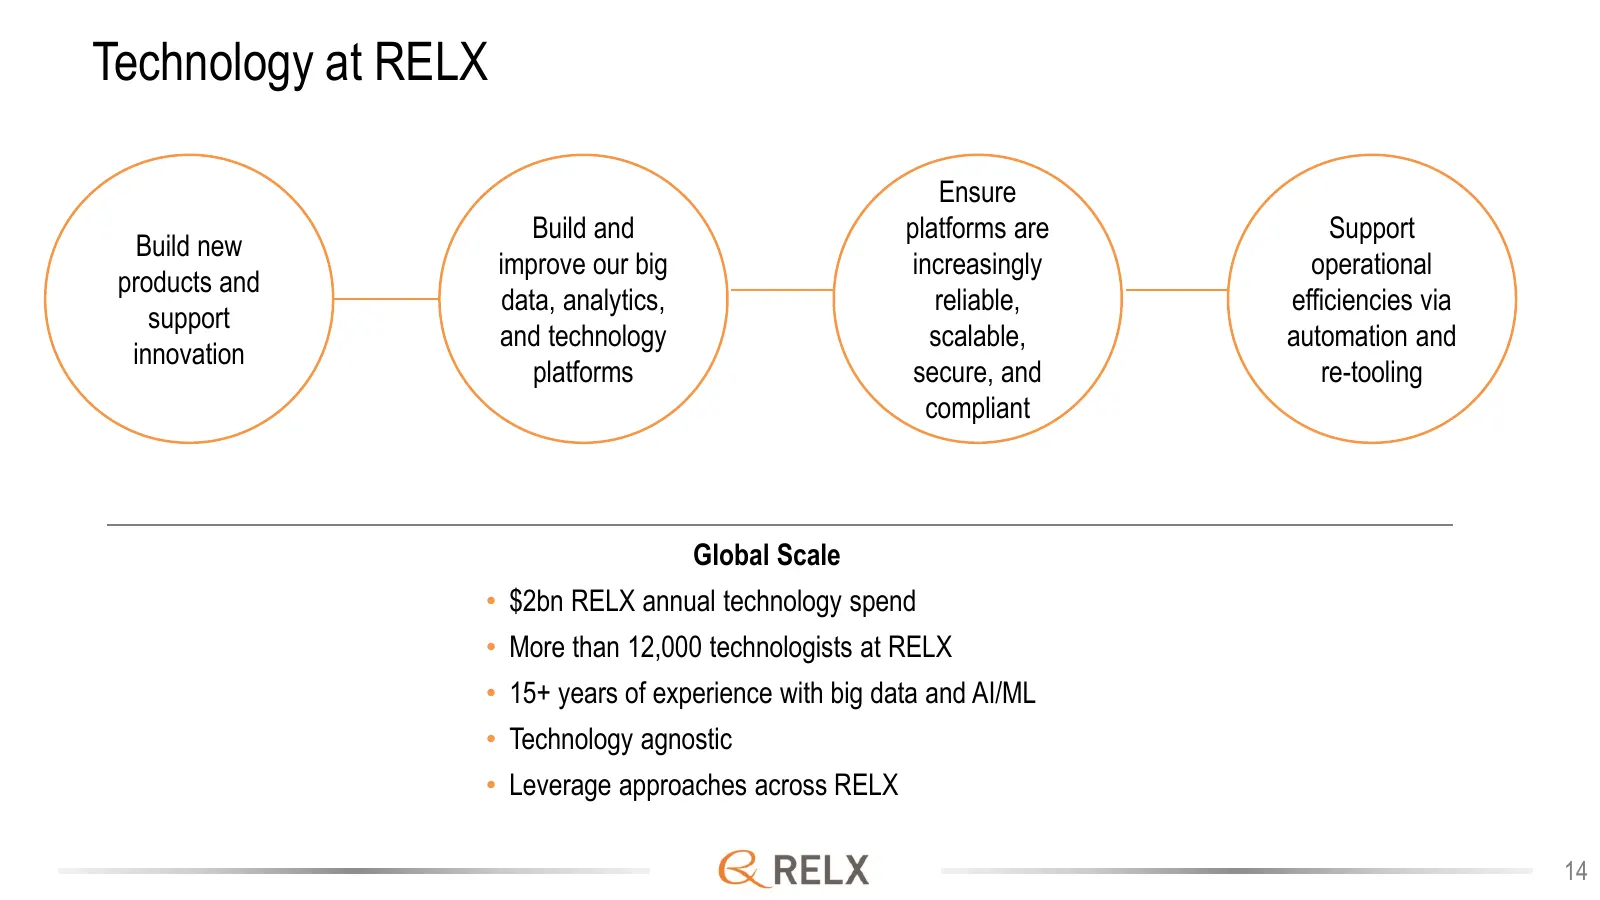
Slide 14: Technology at RELX
Technology at RELX Ensure Build and platforms are Support Build new improve our big increasingly operational products and data, analytics, reliable, efficiencies via support and technology scalable, automation and innovation platforms secure, and re-tooling compliant Global Scale • $2bn RELX annual
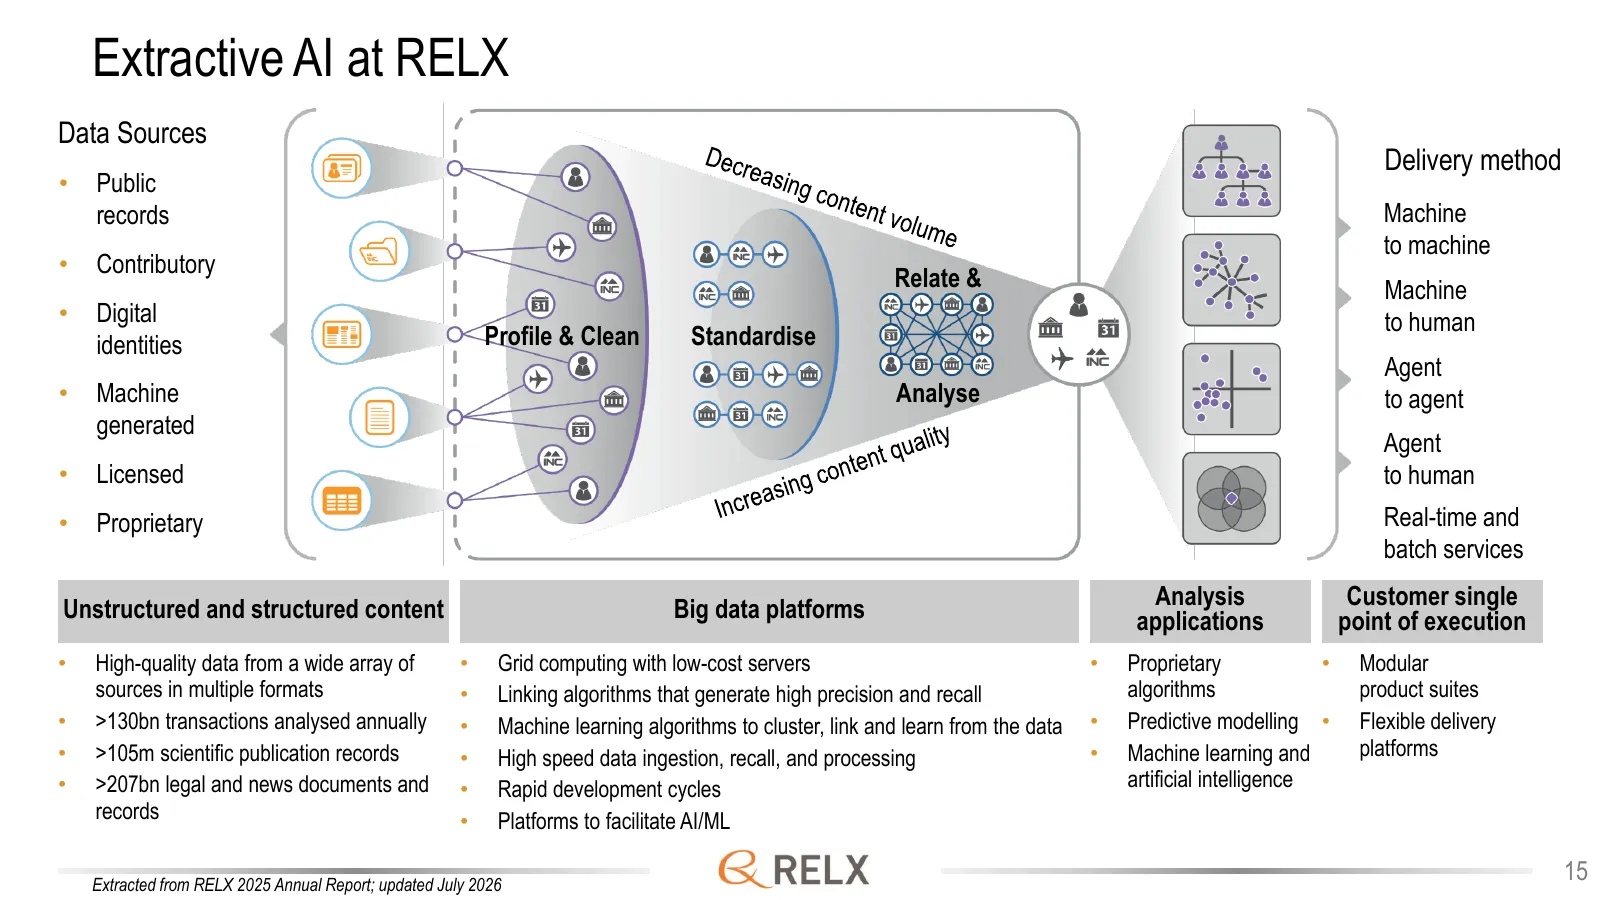
Slide 15: Extractive AI at RELX
Extractive AI at RELX Data Sources Delivery method • Public records Machine to machine • Contributory Relate & Machine • Digital to human identities Profile & Clean Standardise Agent • Machine Analyse to agent generated Agent • Licensed to human • Proprietary Real-time and batch services Unstructure
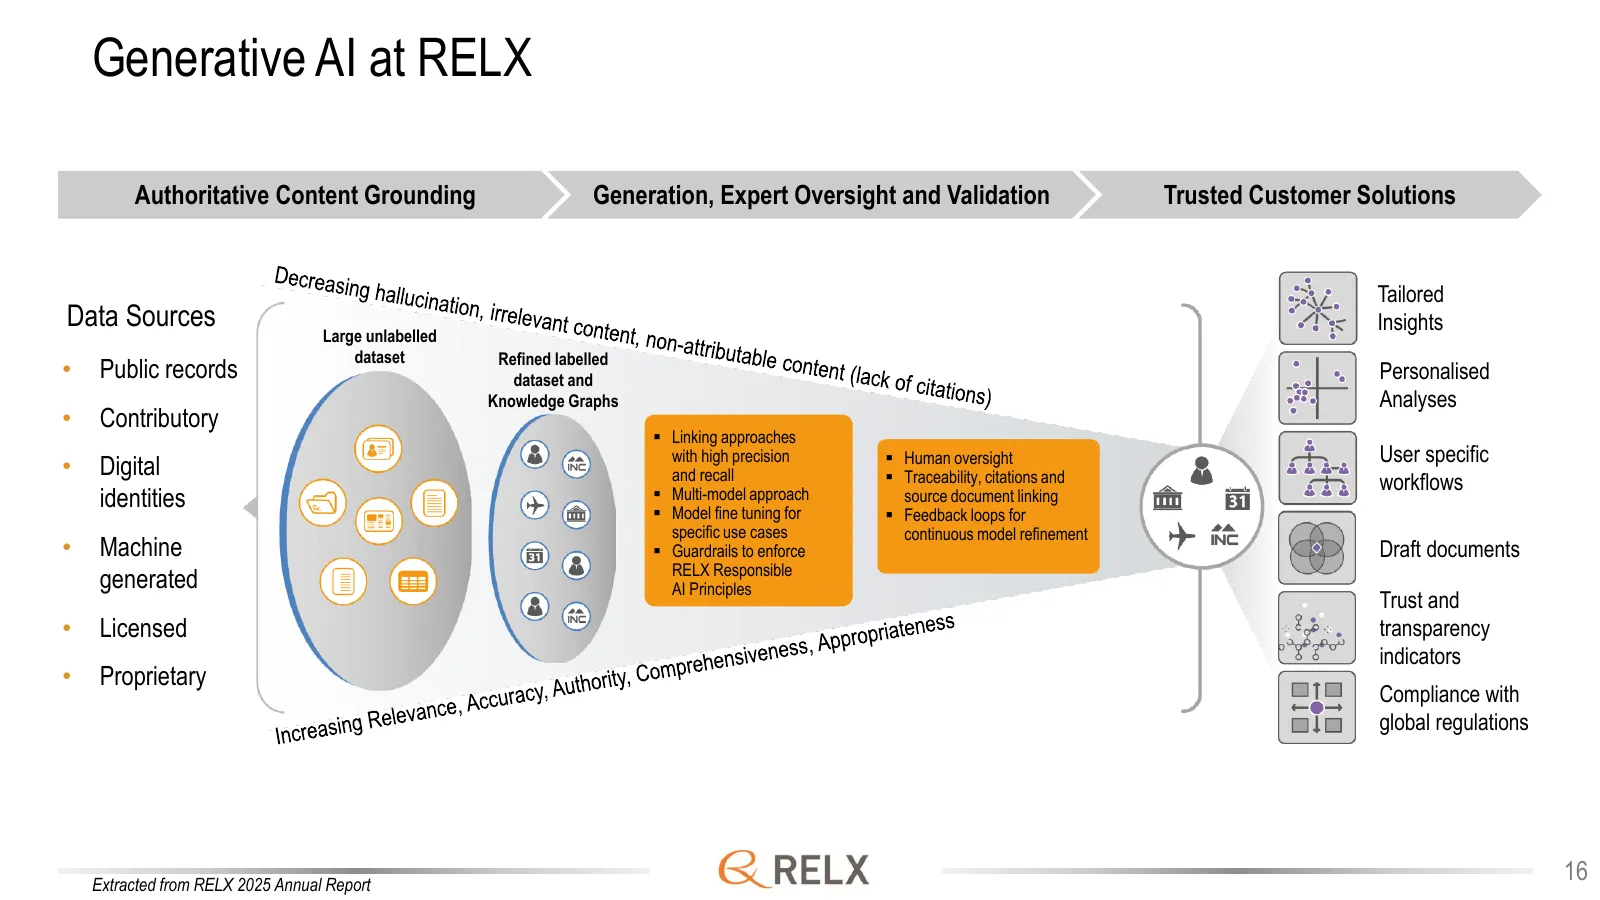
Slide 16: Generative AI at RELX
Generative AI at RELX Authoritative Content Grounding Generation, Expert Oversight and Validation Trusted Customer Solutions Tailored Data Sources Insights Large unlabelled dataset Refined labelled • Public records dataset and Personalised Knowledge Graphs Analyses • Contributory Linking approache
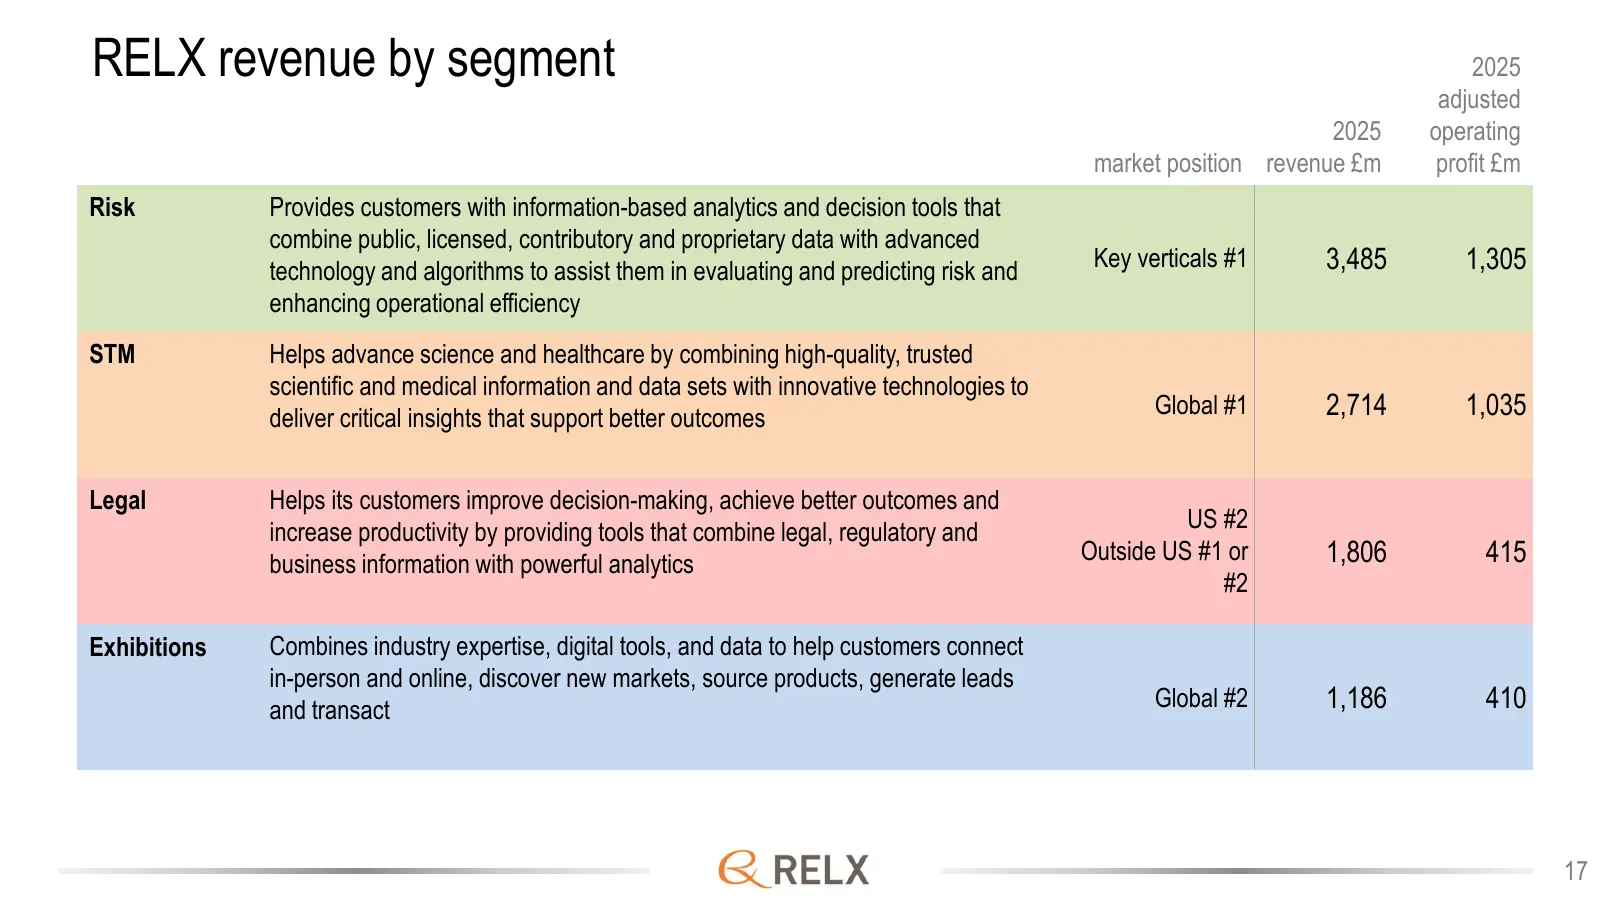
Slide 17: RELX revenue by segment
RELX revenue by segment 2025 adjusted 2025 operating market position revenue £m profit £m Risk Provides customers with information-based analytics and decision tools that combine public, licensed, contributory and proprietary data with advanced technology and algorithms to assist them in evaluating
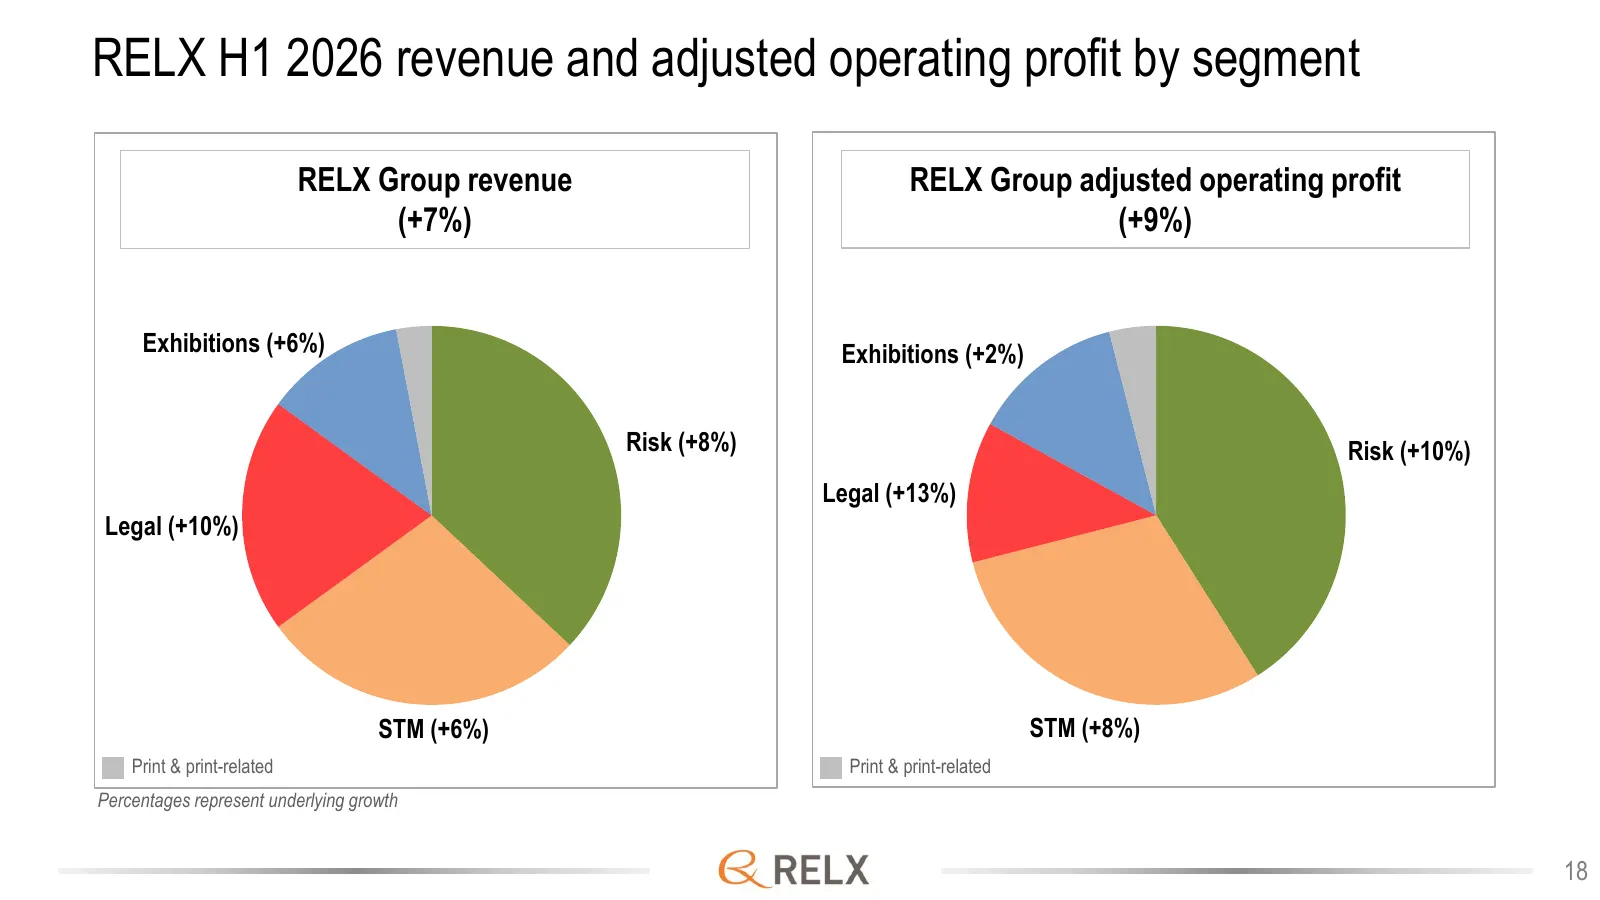
Slide 18: RELX H1 2026 revenue and adjusted operating profit by segment
RELX H1 2026 revenue and adjusted operating profit by segment RELX Group revenue RELX Group adjusted operating profit (+7%) (+9%) Exhibitions (+6%) Exhibitions (+2%) Risk (+8%) Risk (+10%) Legal (+13%) Legal (+10%) STM (+6%) STM (+8%) Print & print-related Print & print-related Percentages represent
Slide 19: RELX revenue by segment
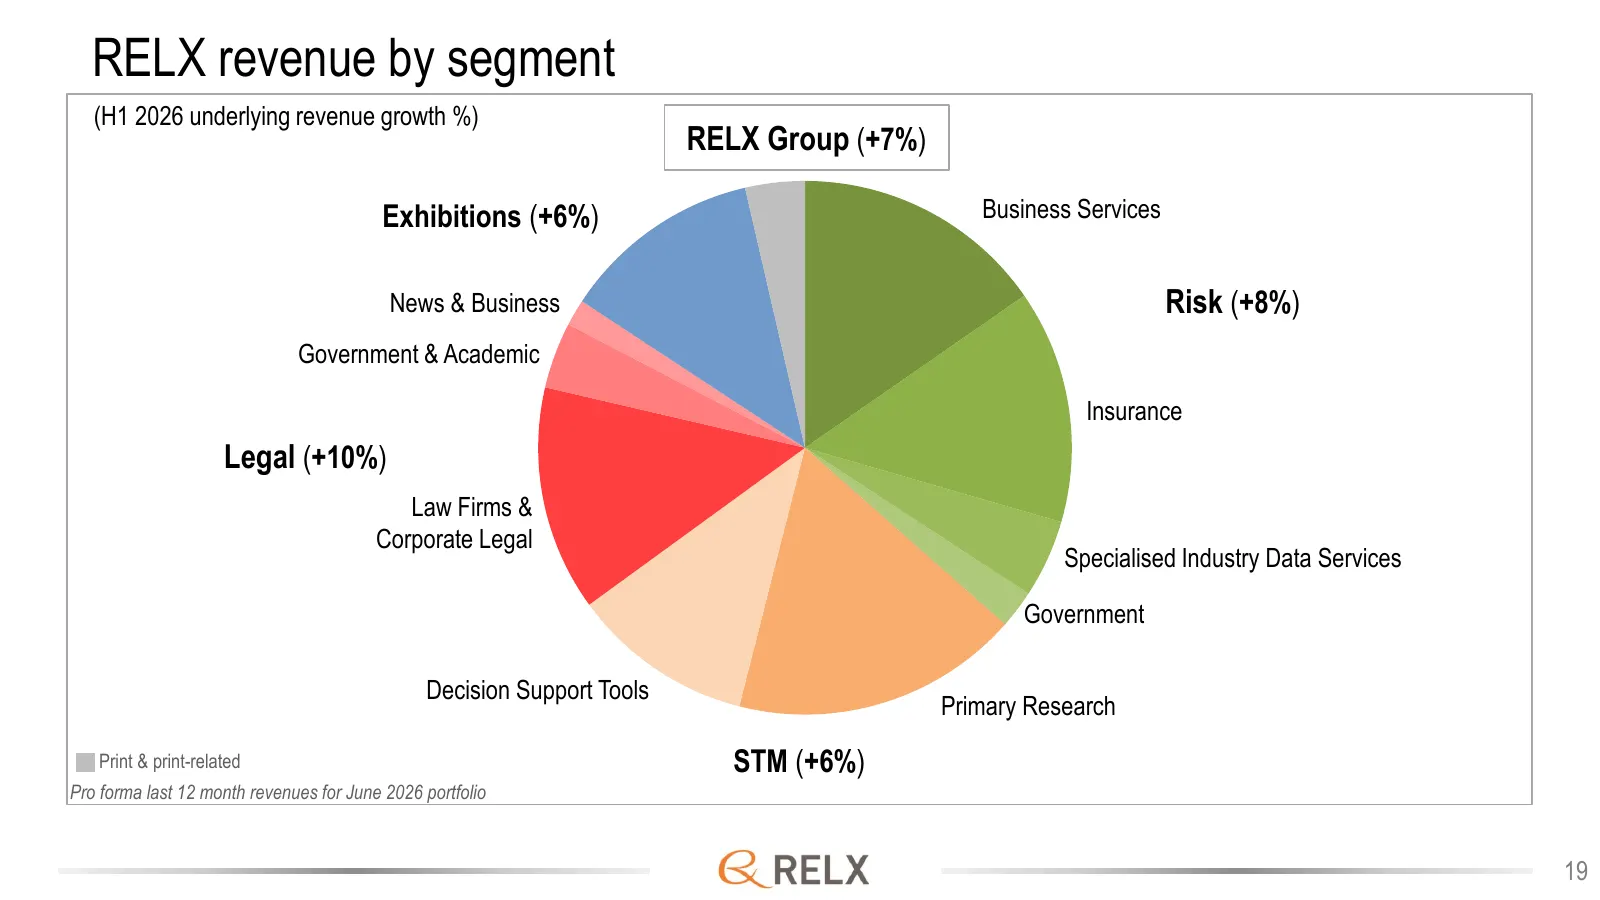
RELX revenue by segment (H1 2026 underlying revenue growth %) RELX Group (+7%) Exhibitions (+6%) Business Services News & Business Risk (+8%) Government & Academic Insurance Legal (+10%) Law Firms & Corporate Legal Specialised Industry Data Services Government Decision Support Tools Primary Research
Slide 20: RELX underlying revenue growth by segment
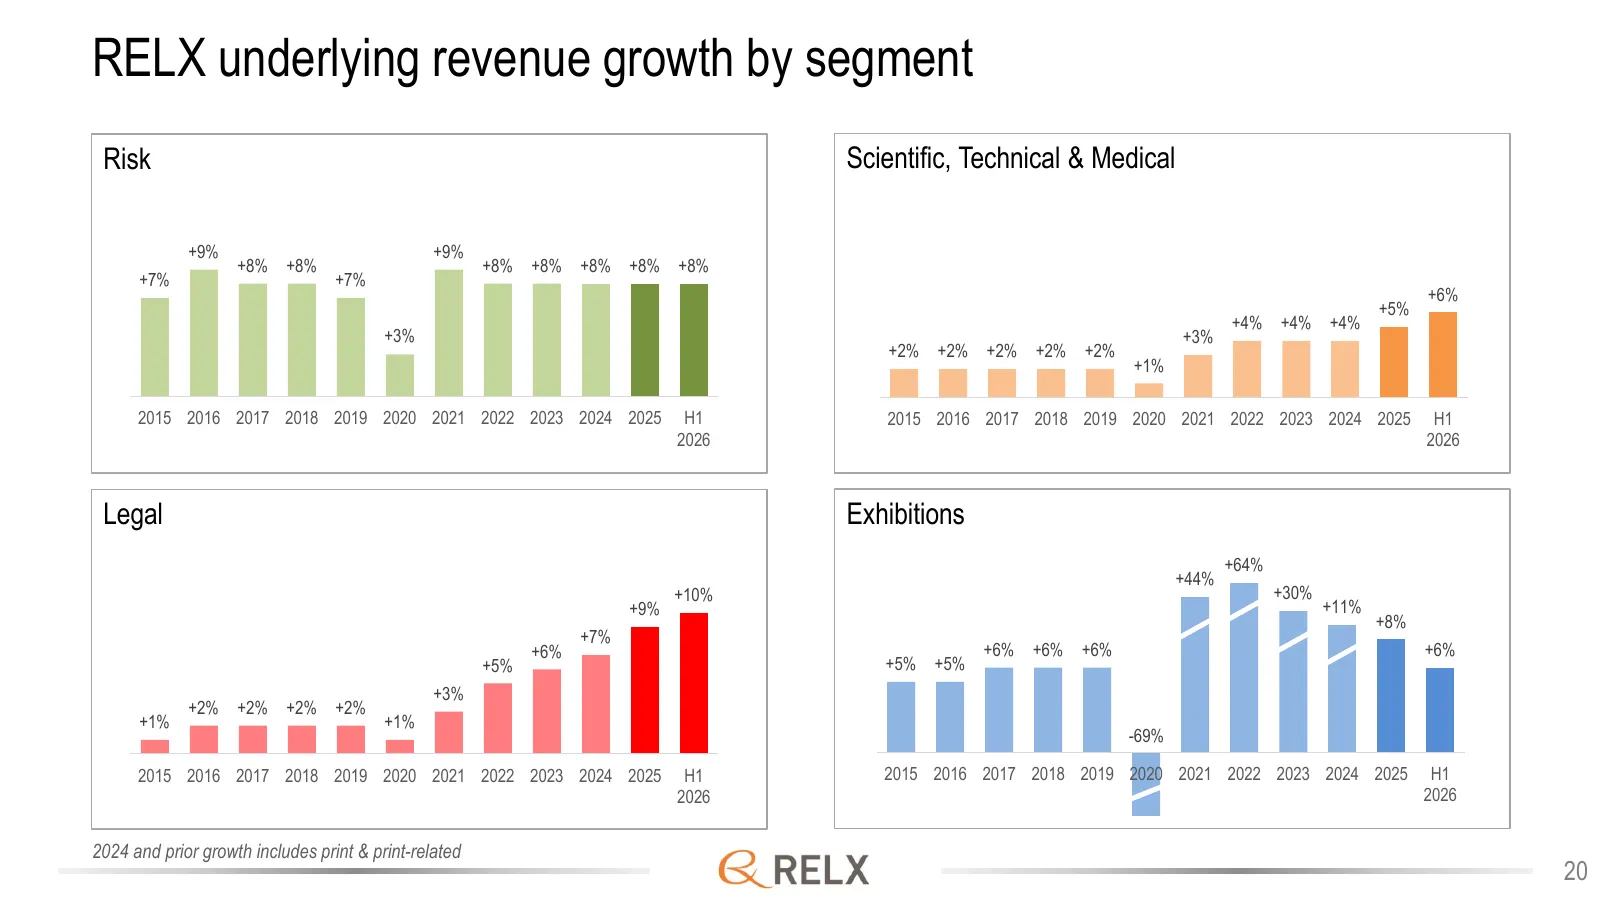
RELX underlying revenue growth by segment Risk Scientific, Technical & Medical +9% +9% +8% +8% +8% +8% +8% +8% +8% +7% +7% +6% +5% +4% +4% +4% +3% +3% +2% +2% +2% +2% +2% +1% 2015 2016 2017 2018 2019 2020 2021 2022 2023 2024 2025 H1 2015 2016 2017 2018 2019 2020 2021 2022 2023 2024 2025 H1 2026 2026

Slide 21: GRELX
GRELX 21
Slide 22: Risk
Risk Provides customers with information-based analytics and decision tools that combine public, licensed, contributory and proprietary data with advanced technology and algorithms to assist them in evaluating and predicting risk and enhancing operational efficiency 22
Slide 23: Risk: revenue by segment
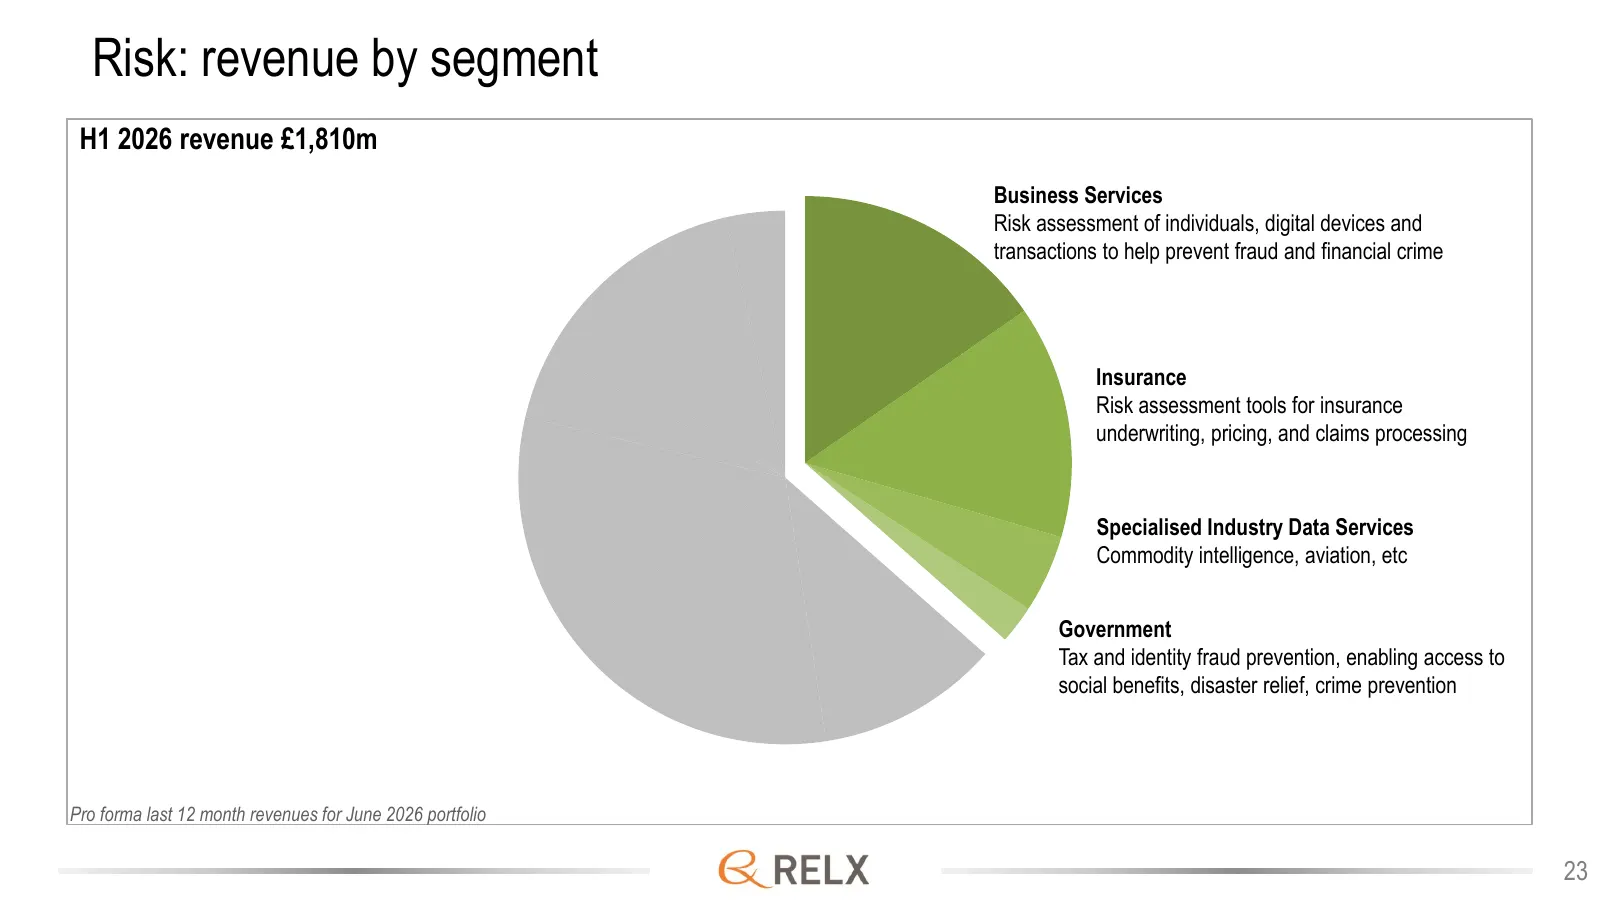
Risk: revenue by segment H1 2026 revenue £1,810m Business Services Risk assessment of individuals, digital devices and transactions to help prevent fraud and financial crime Insurance Risk assessment tools for insurance underwriting, pricing, and claims processing Specialised Industry Data Services
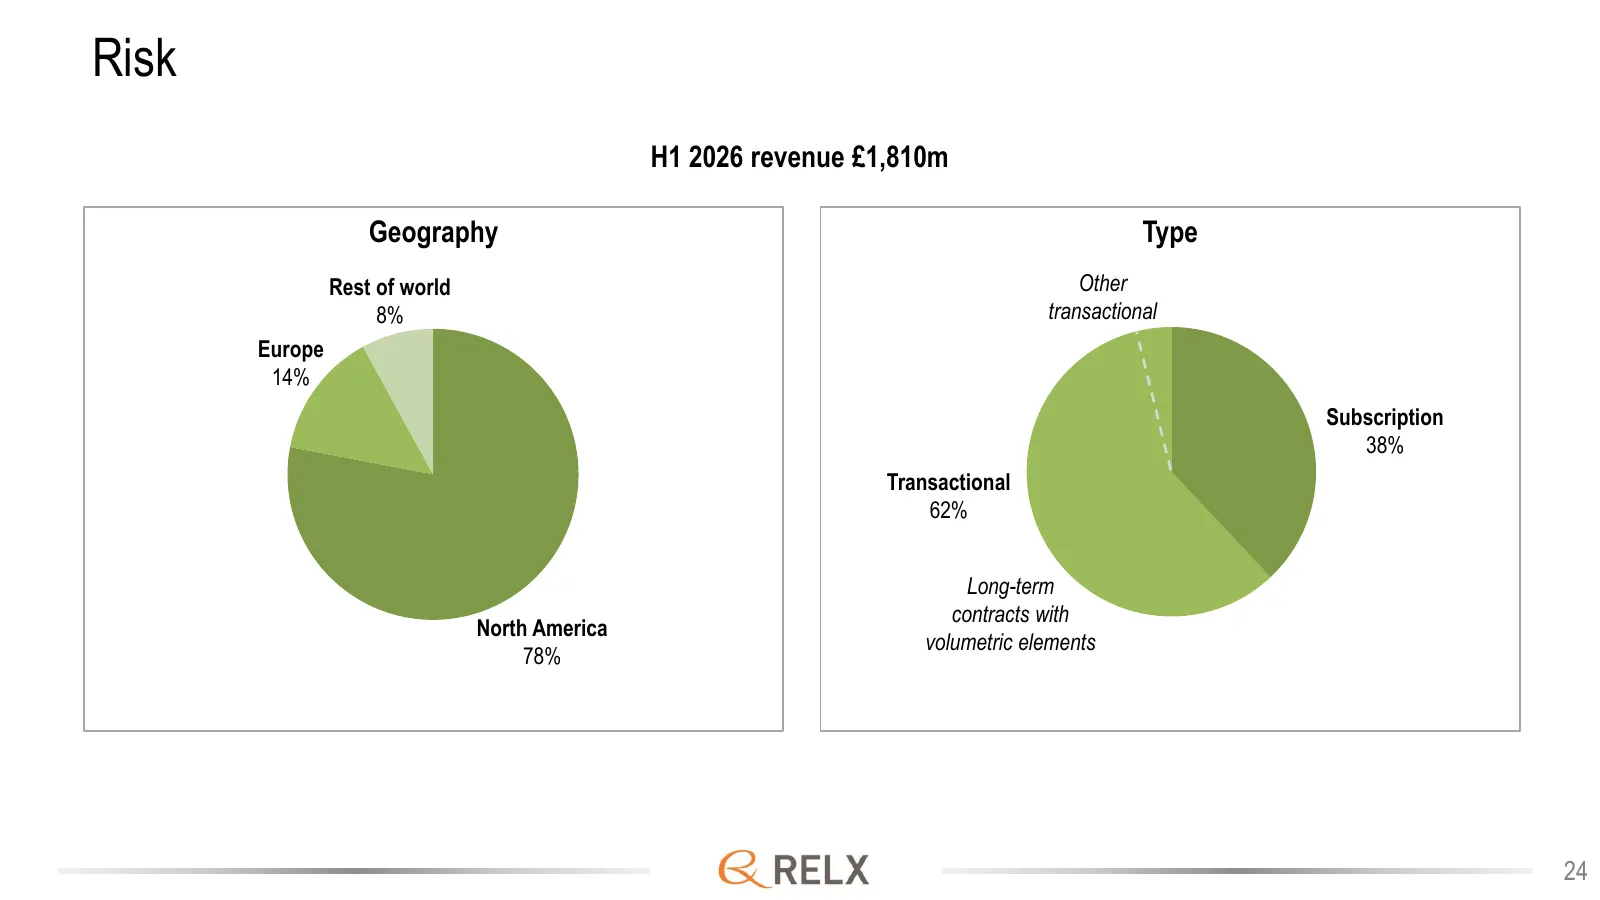
Slide 24: Risk
Risk H1 2026 revenue £1,810m Geography Type Rest of world Other 8% transactional Europe 14% Subscription 38% Transactional 62% Long-term contracts with North America volumetric elements 78% 24
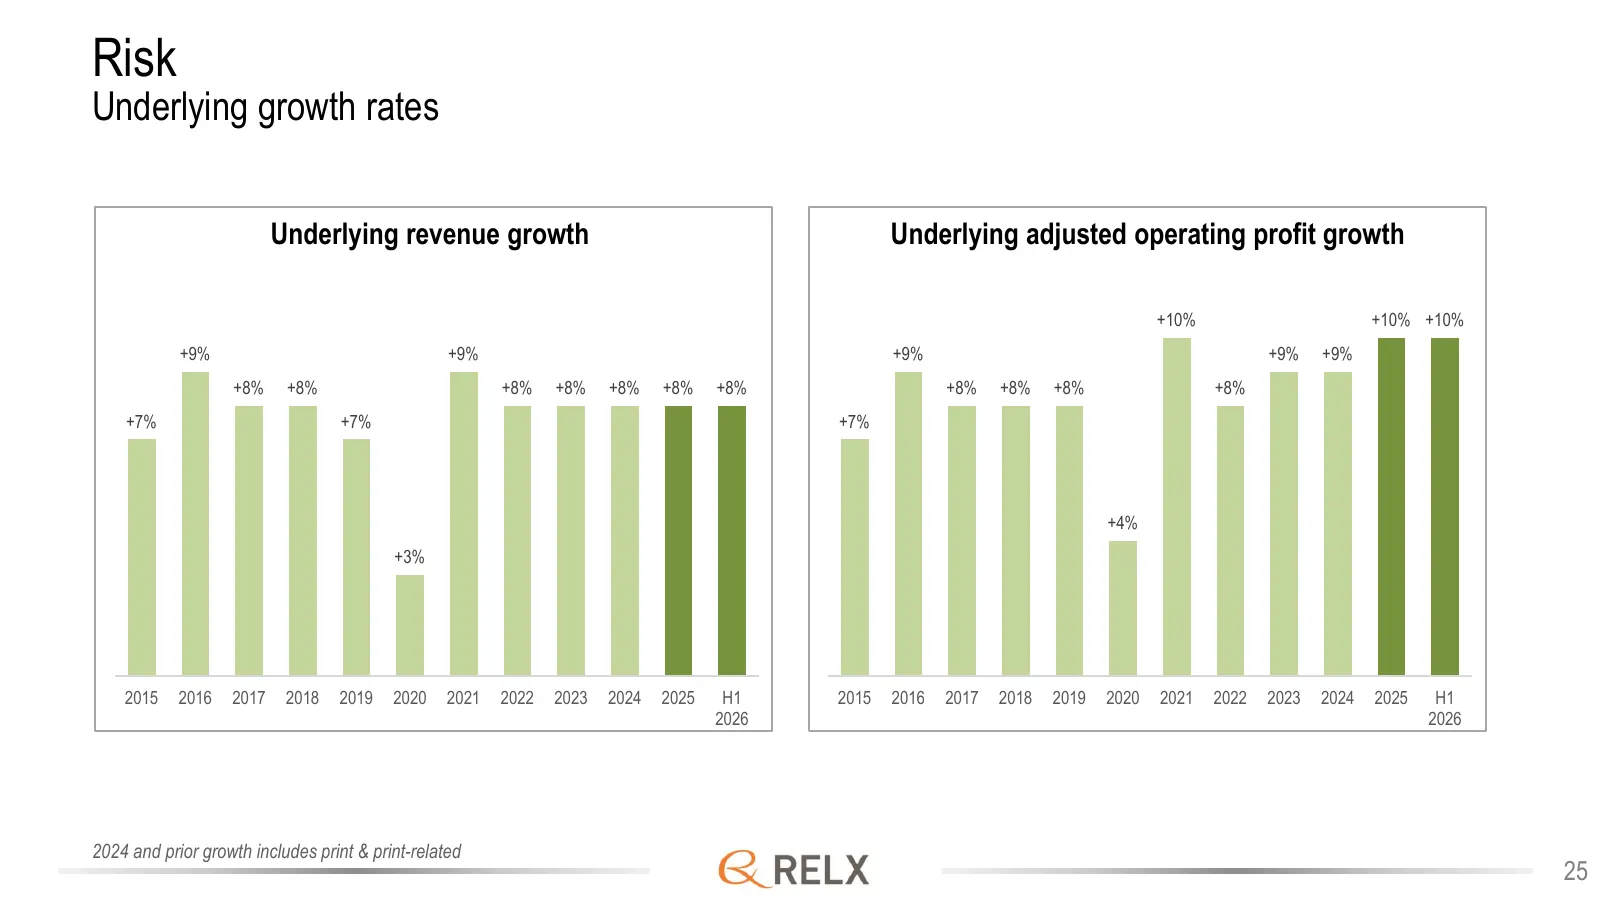
Slide 25: Risk
Risk Underlying growth rates Underlying revenue growth Underlying adjusted operating profit growth +10% +10% +10% +9% +9% +9% +9% +9% +8% +8% +8% +8% +8% +8% +8% +8% +8% +8% +8% +7% +7% +7% +4% +3% 2015 2016 2017 2018 2019 2020 2021 2022 2023 2024 2025 H1 2015 2016 2017 2018 2019 2020 2021 2022 2023
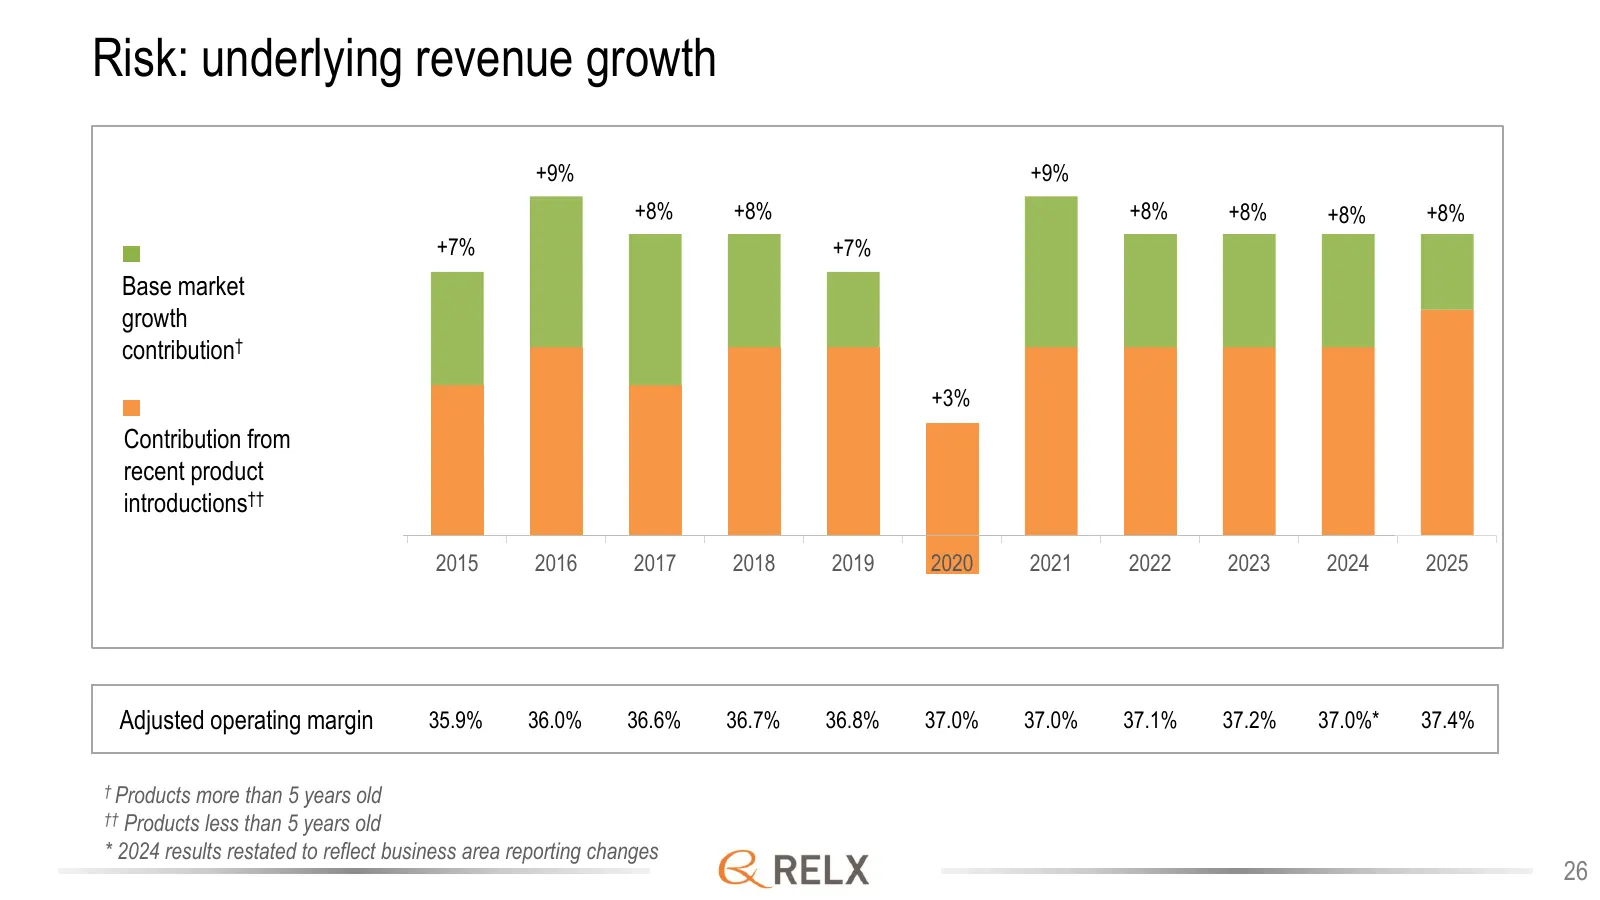
Slide 26: Risk: underlying revenue growth
Risk: underlying revenue growth +9% +9% +8% +8% +8% +8% +8% +8% +7% +7% Base market growth contribution† +3% Contribution from recent product introductions†† 2015 2016 2017 2018 2019 2020 2021 2022 2023 2024 2025 Adjusted operating margin 35.9% 36.0% 36.6% 36.7% 36.8% 37.0% 37.0% 37.1% 37.2% 37.0%*
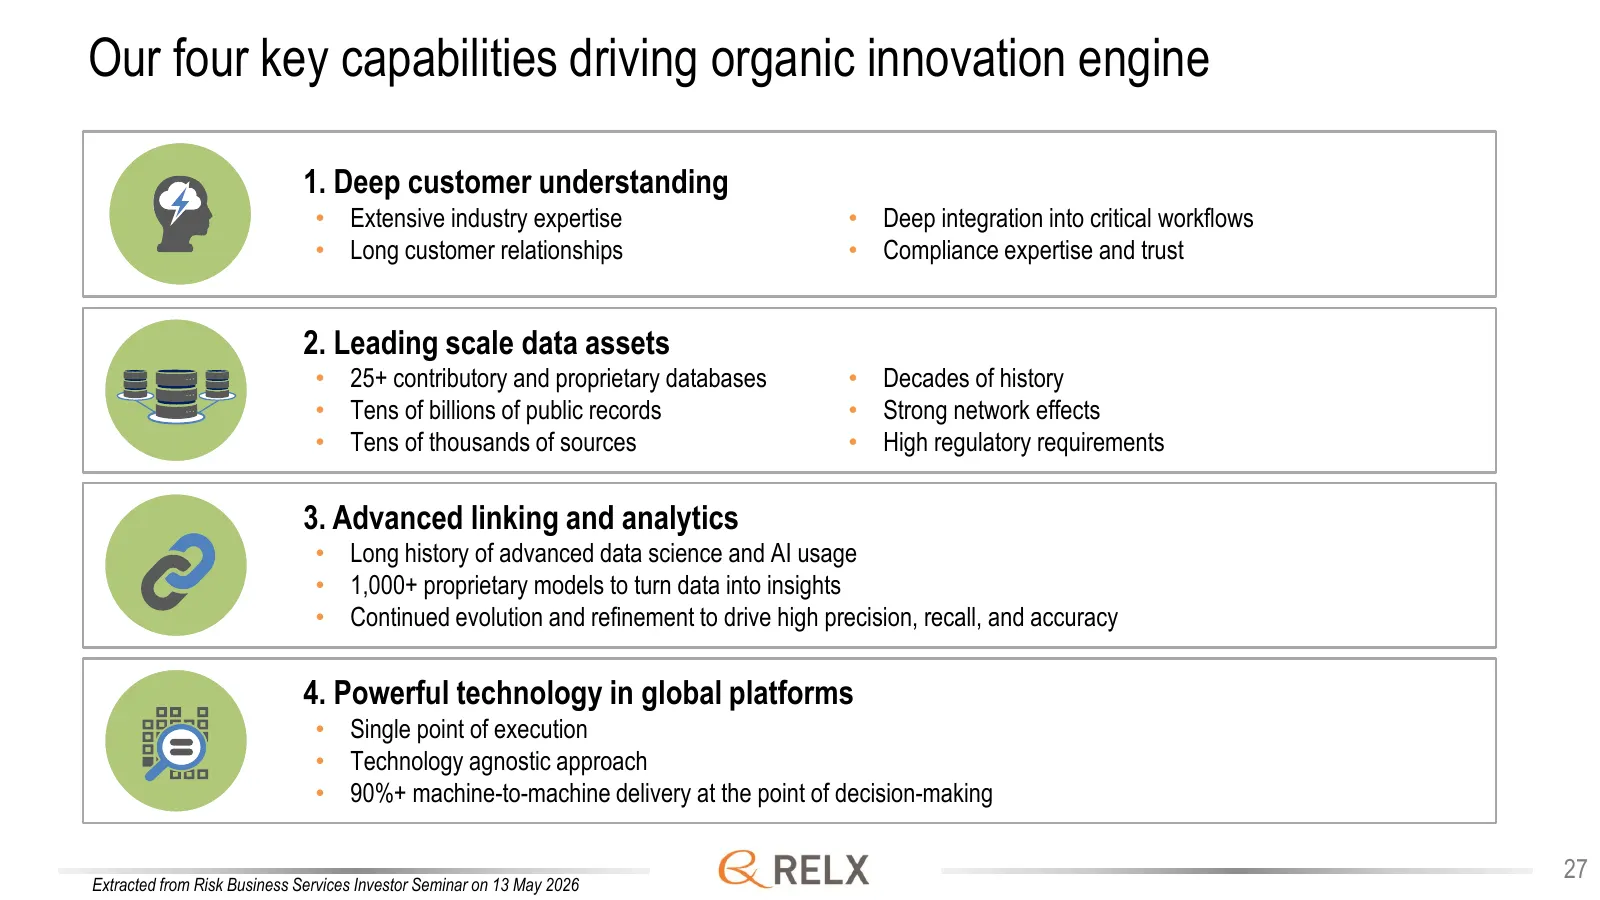
Slide 27: Our four key capabilities driving organic innovation engine
Our four key capabilities driving organic innovation engine 1. Deep customer understanding • Extensive industry expertise • Deep integration into critical workflows • Long customer relationships • Compliance expertise and trust 2. Leading scale data assets • 25+ contributory and proprietary database
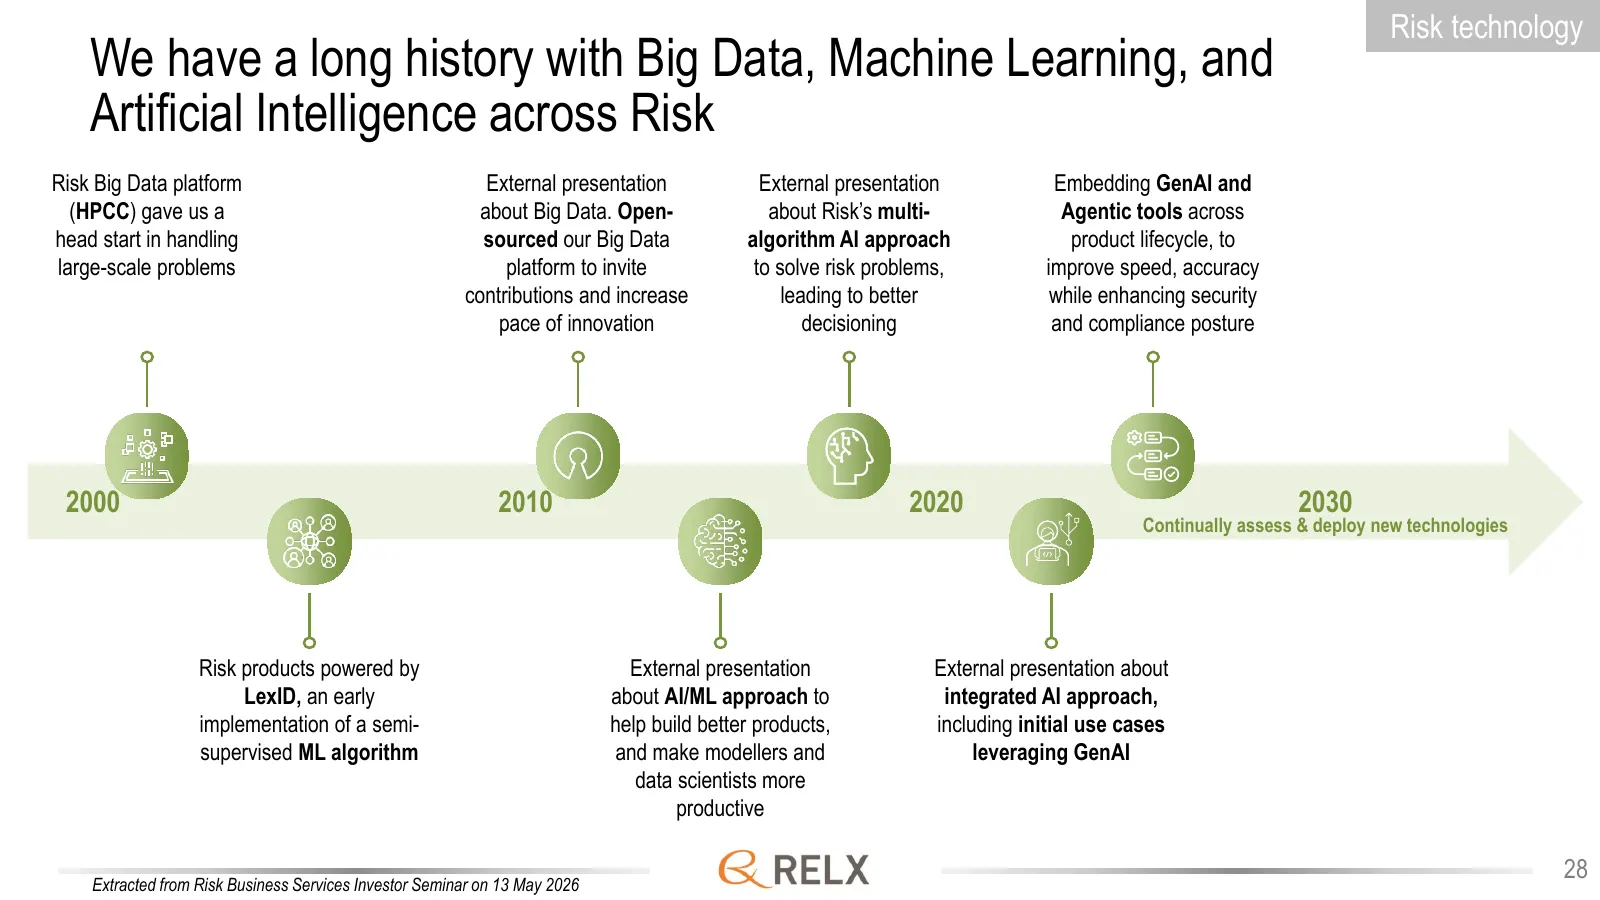
Slide 28: We have a long history with Big Data, Machine Learning, and AI across Risk
Risk technology We have a long history with Big Data, Machine Learning, and Artificial Intelligence across Risk Risk Big Data platform External presentation External presentation Embedding GenAI and (HPCC) gave us a about Big Data. Open- about Risk’s multi- Agentic tools across head start in handlin
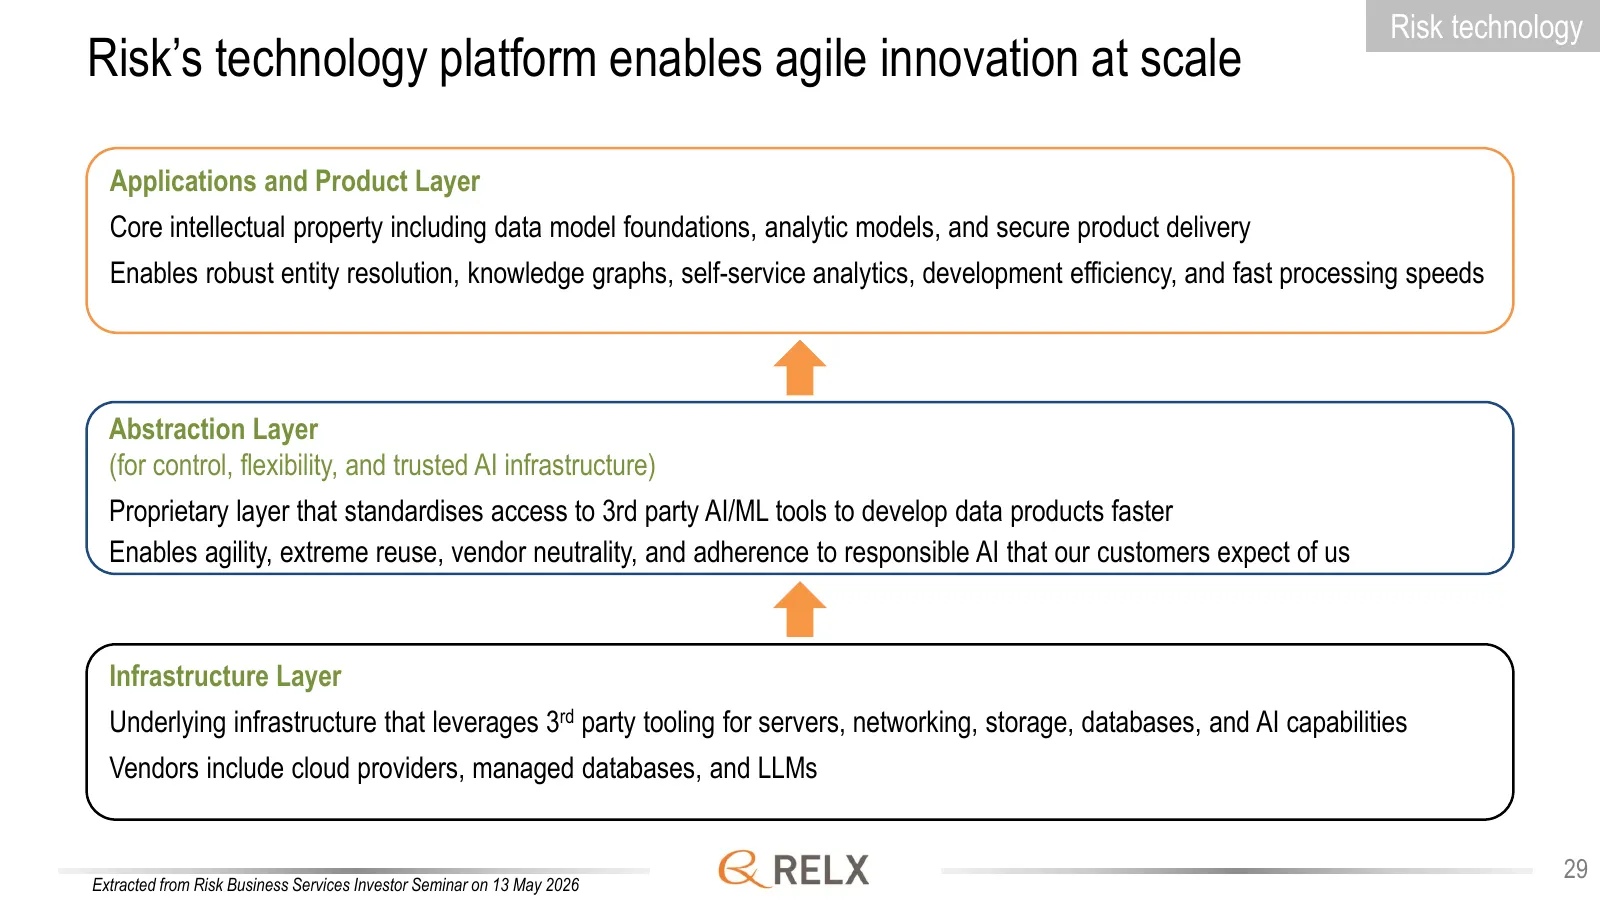
Slide 29: Risk's technology platform enables agile innovation at scale
Risk technology Risk’s technology platform enables agile innovation at scale Applications and Product Layer Core intellectual property including data model foundations, analytic models, and secure product delivery Enables robust entity resolution, knowledge graphs, self-service analytics, developmen
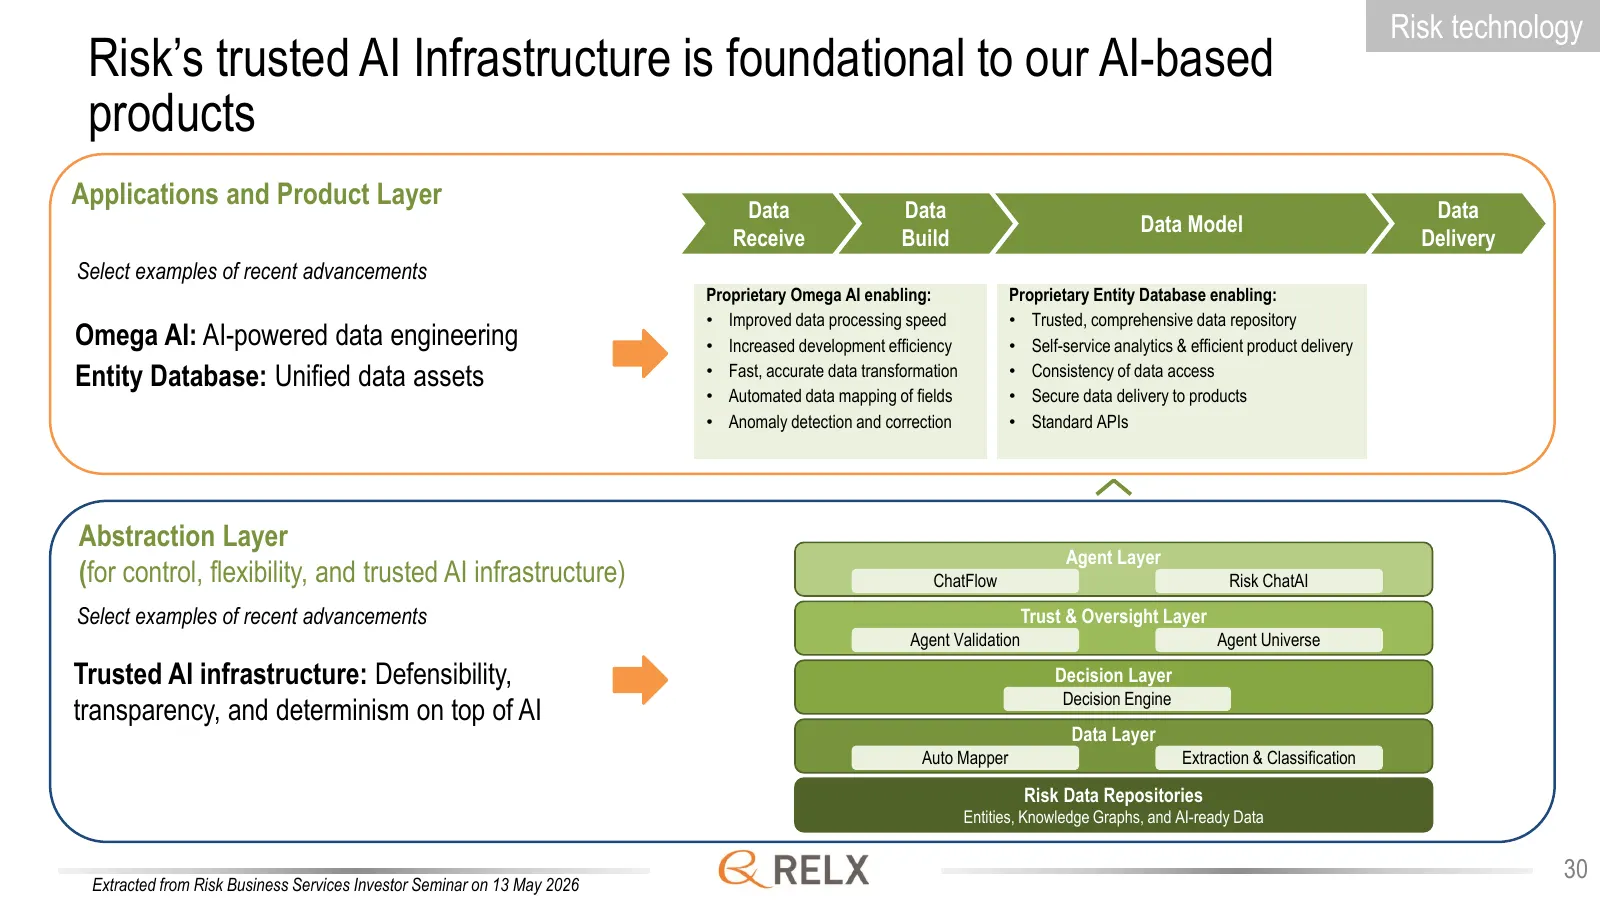
Slide 30: Risk's trusted AI Infrastructure is foundational to our AI-based products
Risk technology Risk’s trusted AI Infrastructure is foundational to our AI-based products Applications and Product Layer Data Data Data Data Model Receive Build Delivery Select examples of recent advancements Proprietary Omega AI enabling: Proprietary Entity Database enabling: • Improved data proces
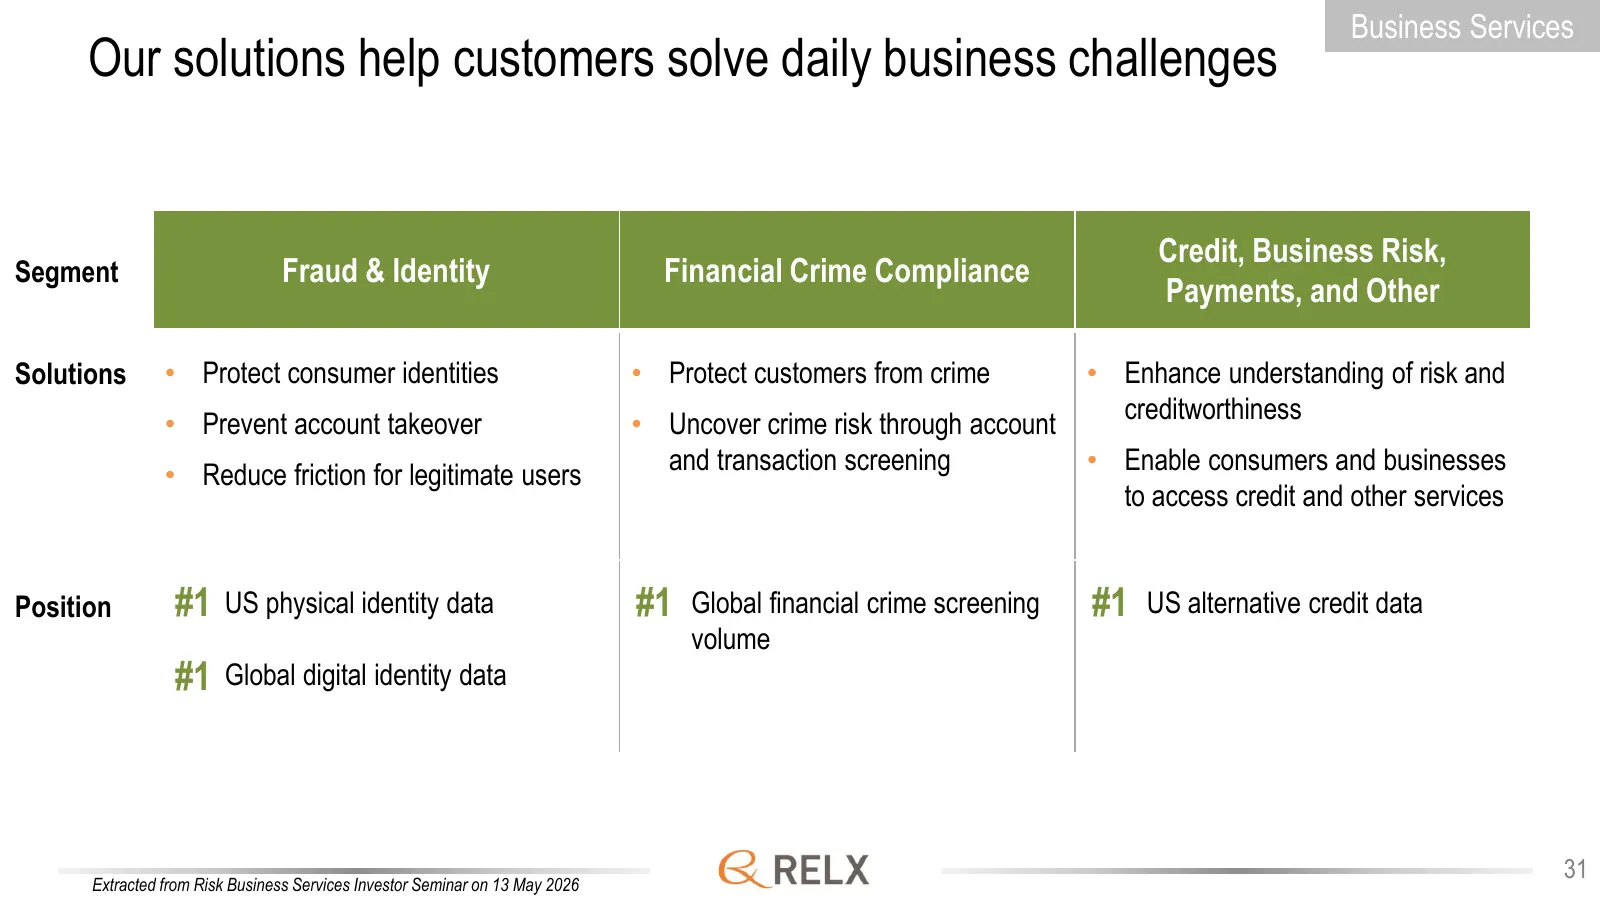
Slide 31: Our solutions help customers solve daily business challenges
Business Services Our solutions help customers solve daily business challenges Credit, Business Risk, Segment Fraud & Identity Financial Crime Compliance Payments, and Other Solutions • Protect consumer identities • Protect customers from crime • Enhance understanding of risk and creditworthiness •
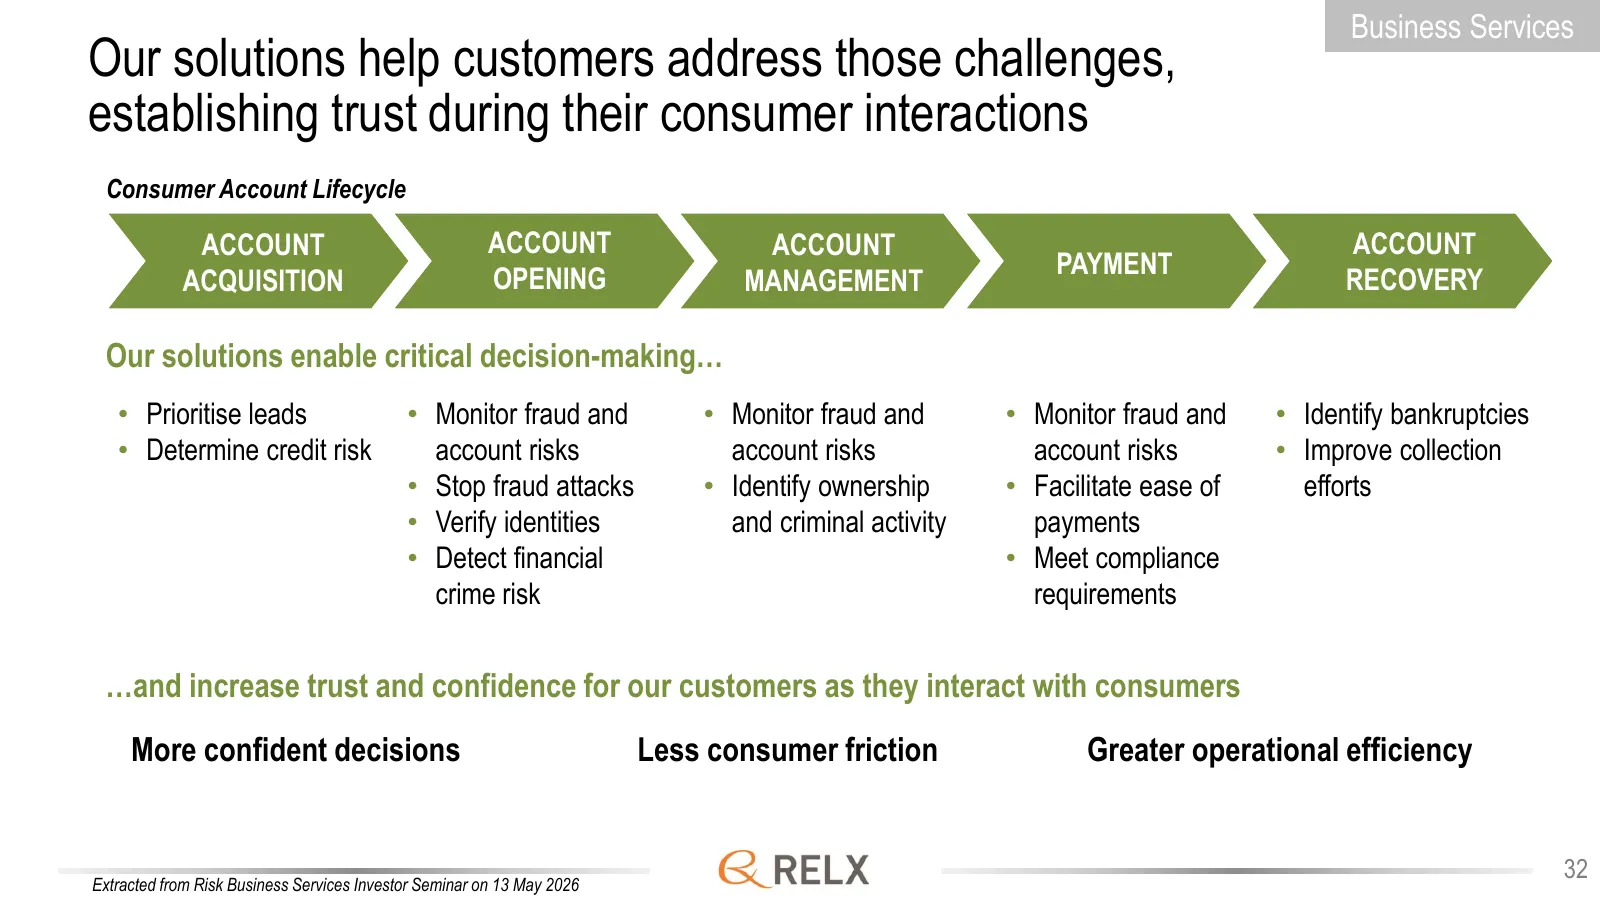
Slide 32: Our solutions help customers establish trust during consumer interactions
Business Services Our solutions help customers address those challenges, establishing trust during their consumer interactions Consumer Account Lifecycle ACCOUNT ACCOUNT ACCOUNT ACCOUNT PAYMENT ACQUISITION OPENING MANAGEMENT RECOVERY Our solutions enable critical decision-making… • Prioritise leads
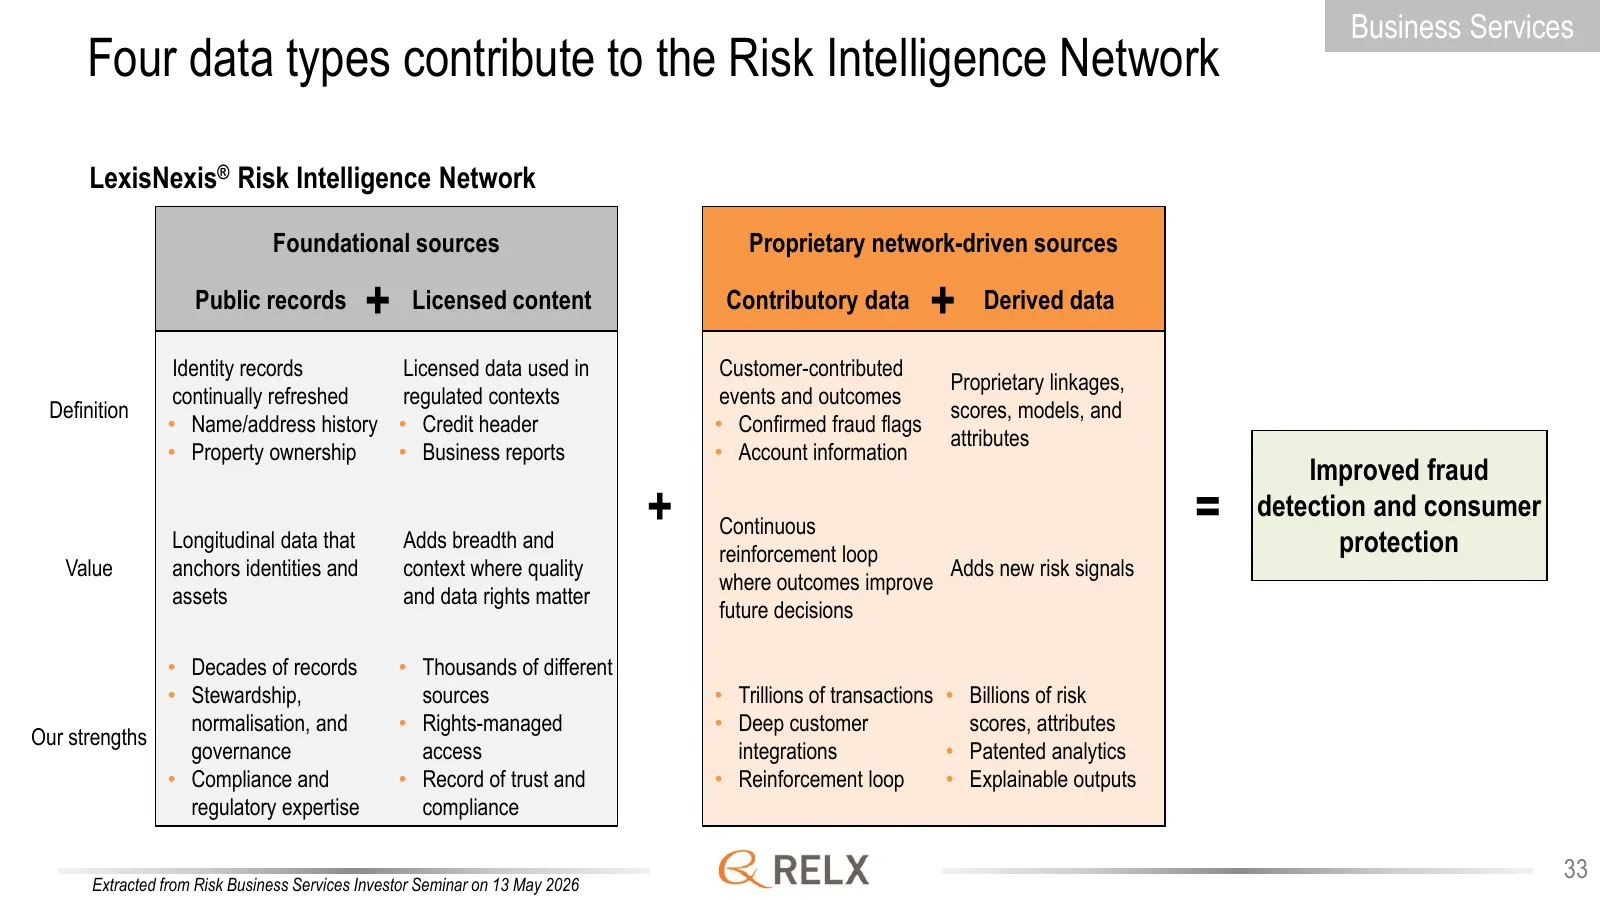
Slide 33: Four data types contribute to the Risk Intelligence Network
Business Services Four data types contribute to the Risk Intelligence Network LexisNexis® Risk Intelligence Network Foundational sources Proprietary network-driven sources Public records + Licensed content Contributory data + Derived data Identity records Licensed data used in Customer-contributed P
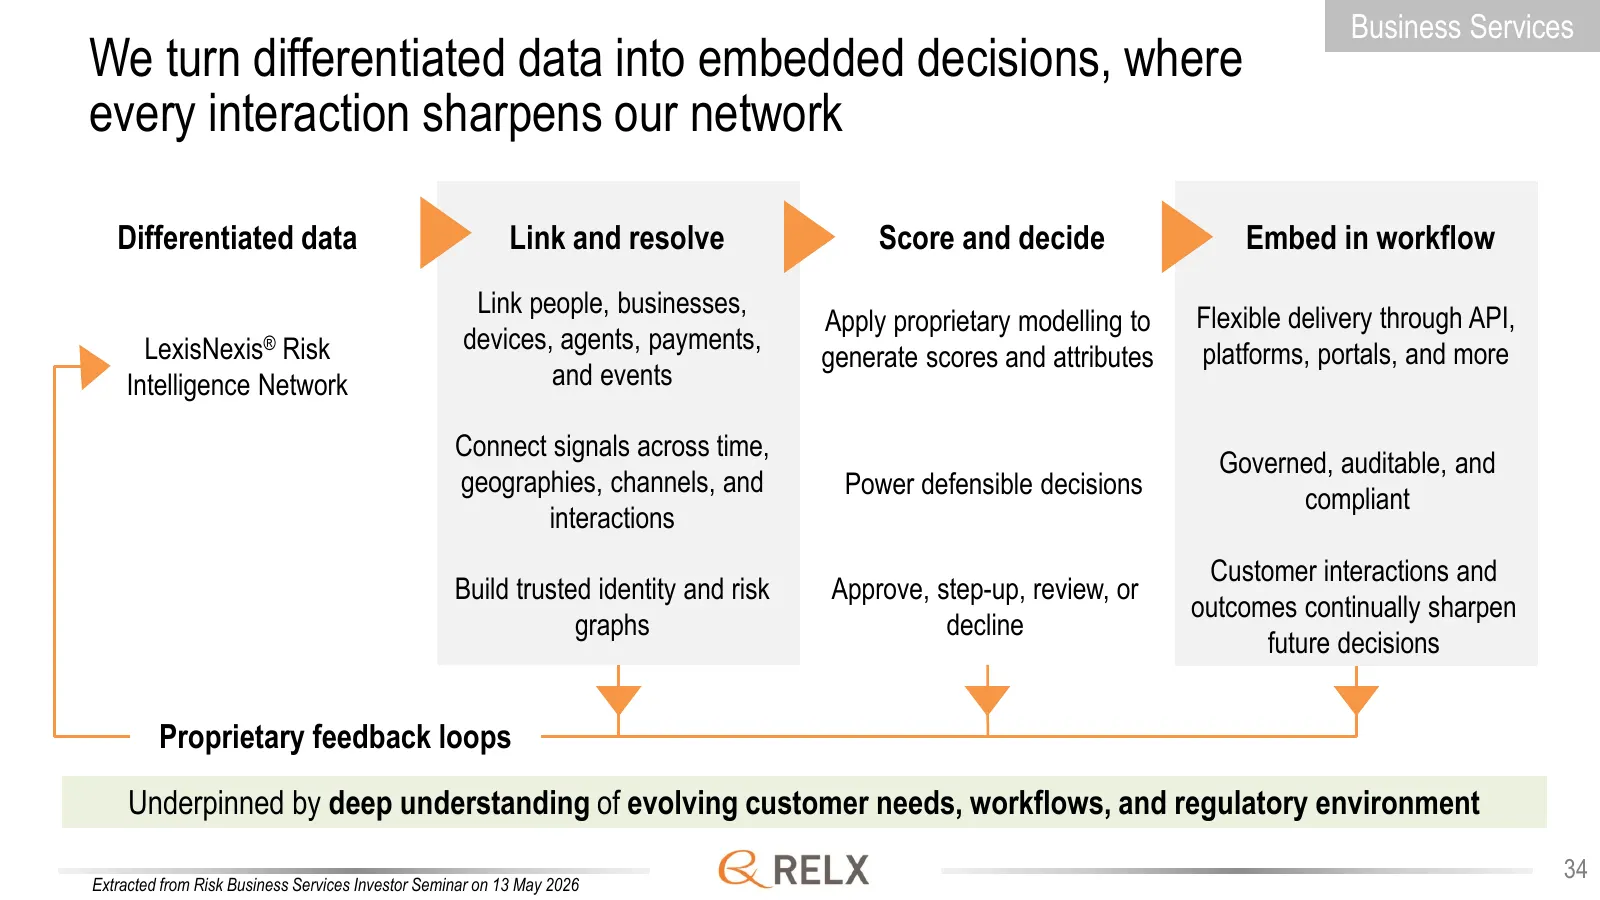
Slide 34: We turn differentiated data into embedded decisions
Business Services We turn differentiated data into embedded decisions, where every interaction sharpens our network Differentiated data Link and resolve Score and decide Embed in workflow Link people, businesses, Flexible delivery through API, Apply proprietary modelling to LexisNexis® Risk devices,
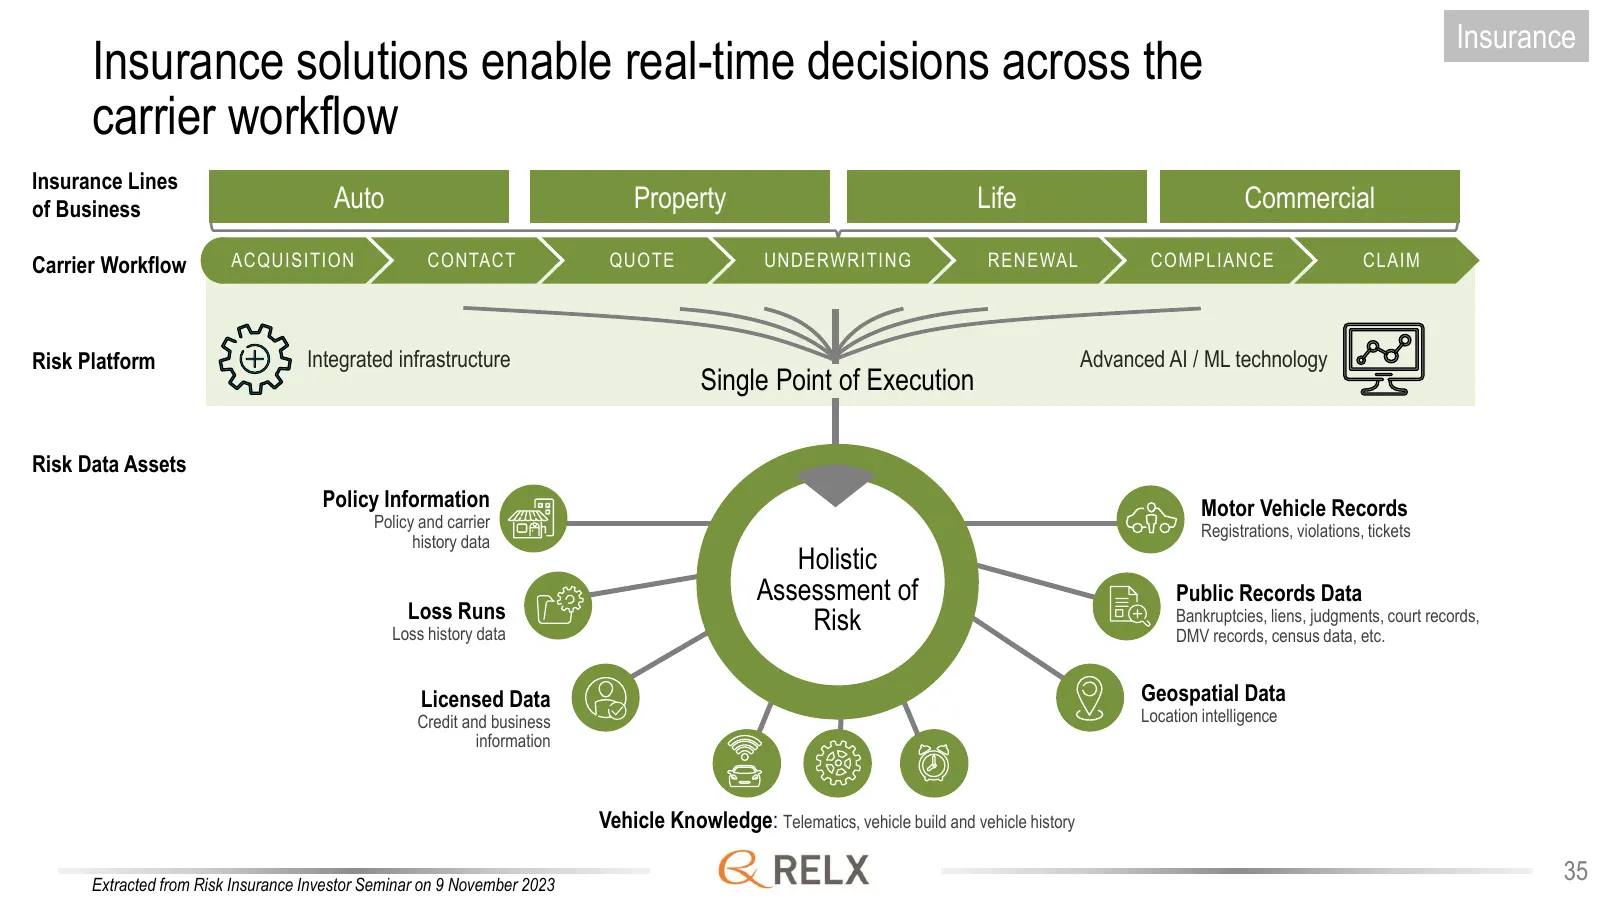
Slide 35: Insurance solutions enable real-time decisions across the carrier workflow
Insurance Insurance solutions enable real-time decisions across the carrier workflow Insurance Lines of Business Auto Property Life Commercial Carrier Workflow ACQUISITION CONTACT QUOTE UNDERWRITING RENEWAL COMPLIANCE CLAIM Risk Platform Integrated infrastructure Advanced AI / ML technology Single P
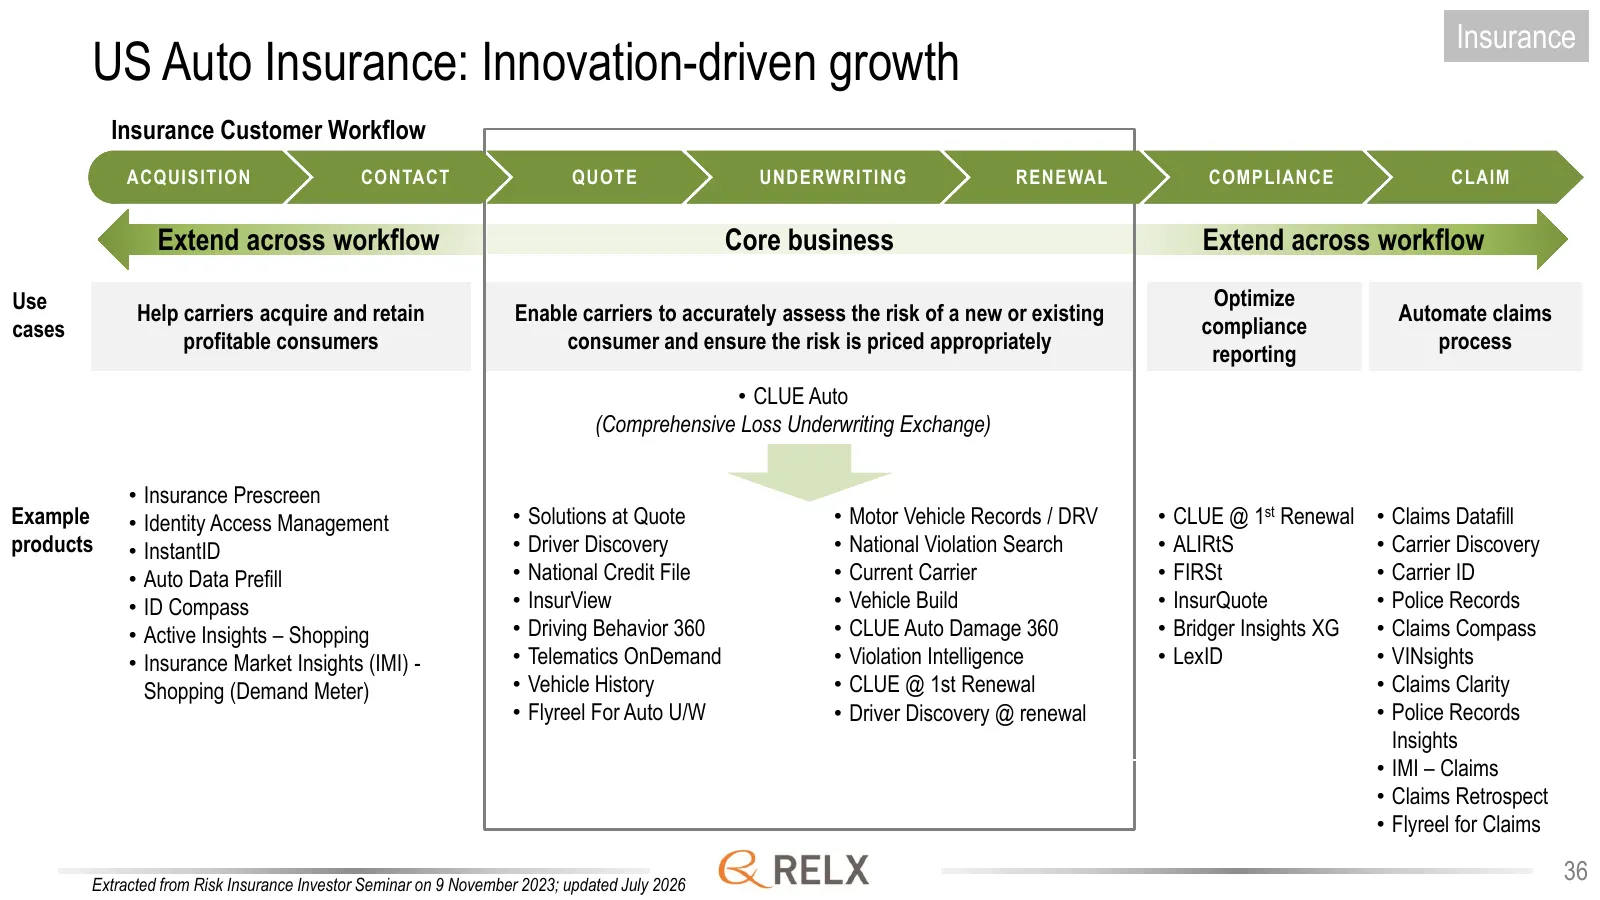
Slide 36: US Auto Insurance: Innovation-driven growth
Insurance US Auto Insurance: Innovation-driven growth Insurance Customer Workflow ACQUISITION CONTACT QUOTE UNDERWRITING RENEWAL COMPLIANCE CLAIM Extend across workflow Core business Extend across workflow Use Optimize Help carriers acquire and retain Enable carriers to accurately assess the risk of
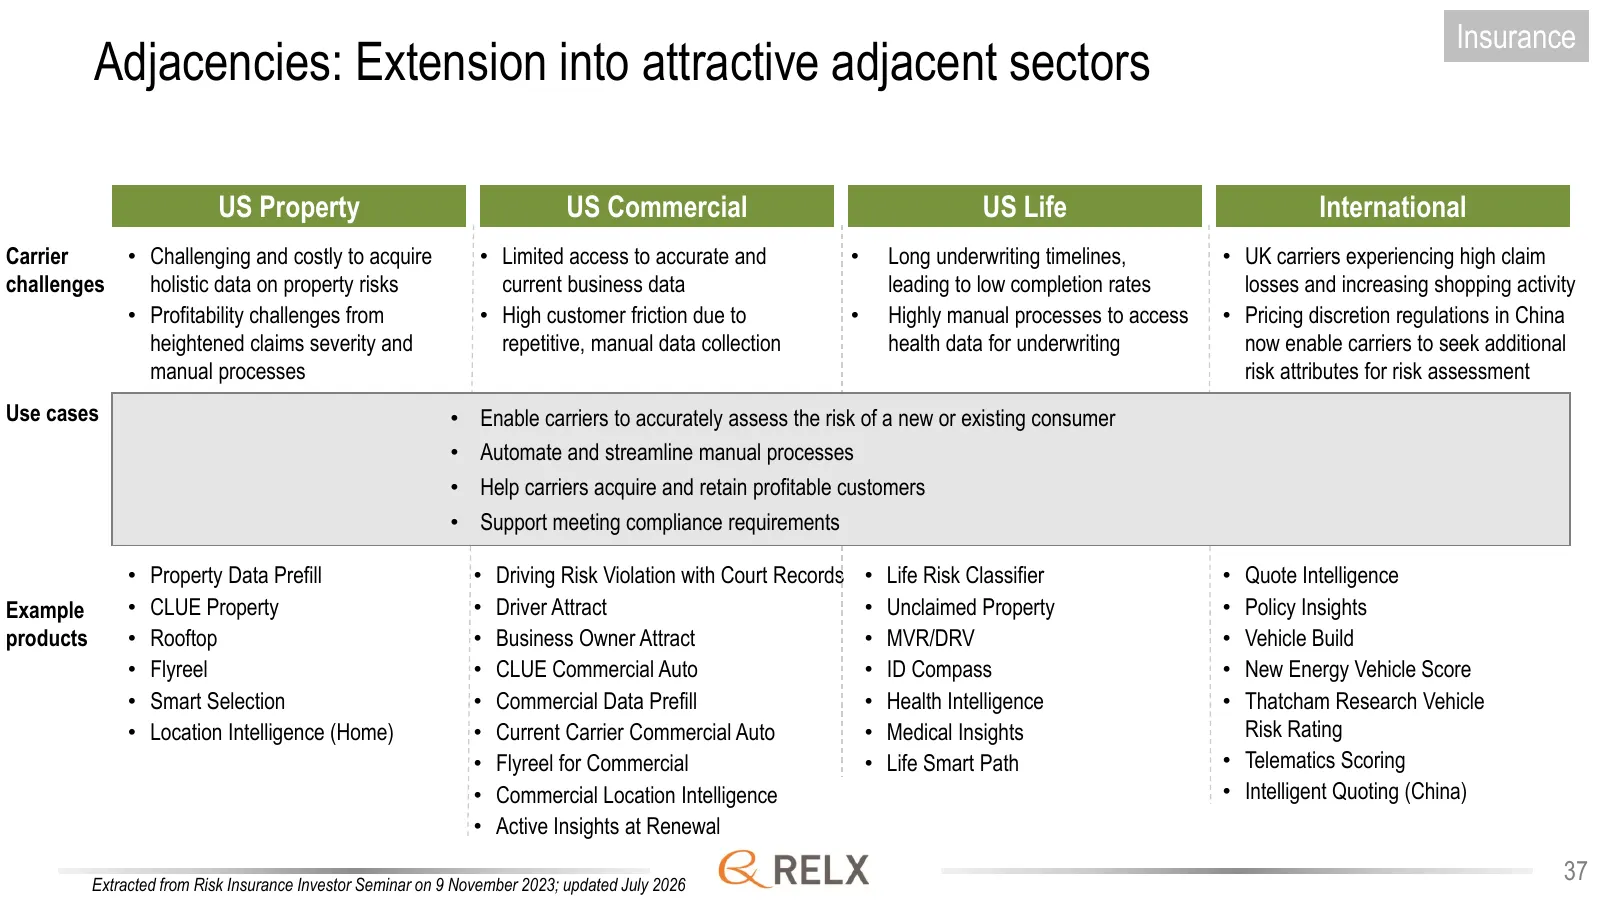
Slide 37: Adjacencies: Extension into attractive adjacent sectors
Insurance Adjacencies: Extension into attractive adjacent sectors US Property US Commercial US Life International Carrier • Challenging and costly to acquire • Limited access to accurate and • Long underwriting timelines, • UK carriers experiencing high claim challenges holistic data on property ris
Slide 38: Scientific, Technical & Medical
Scientific, Technical & Medical Helps advance science and healthcare by combining high-quality, trusted scientific and medical information and data sets with innovative technologies to deliver critical insights that support better outcomes 38
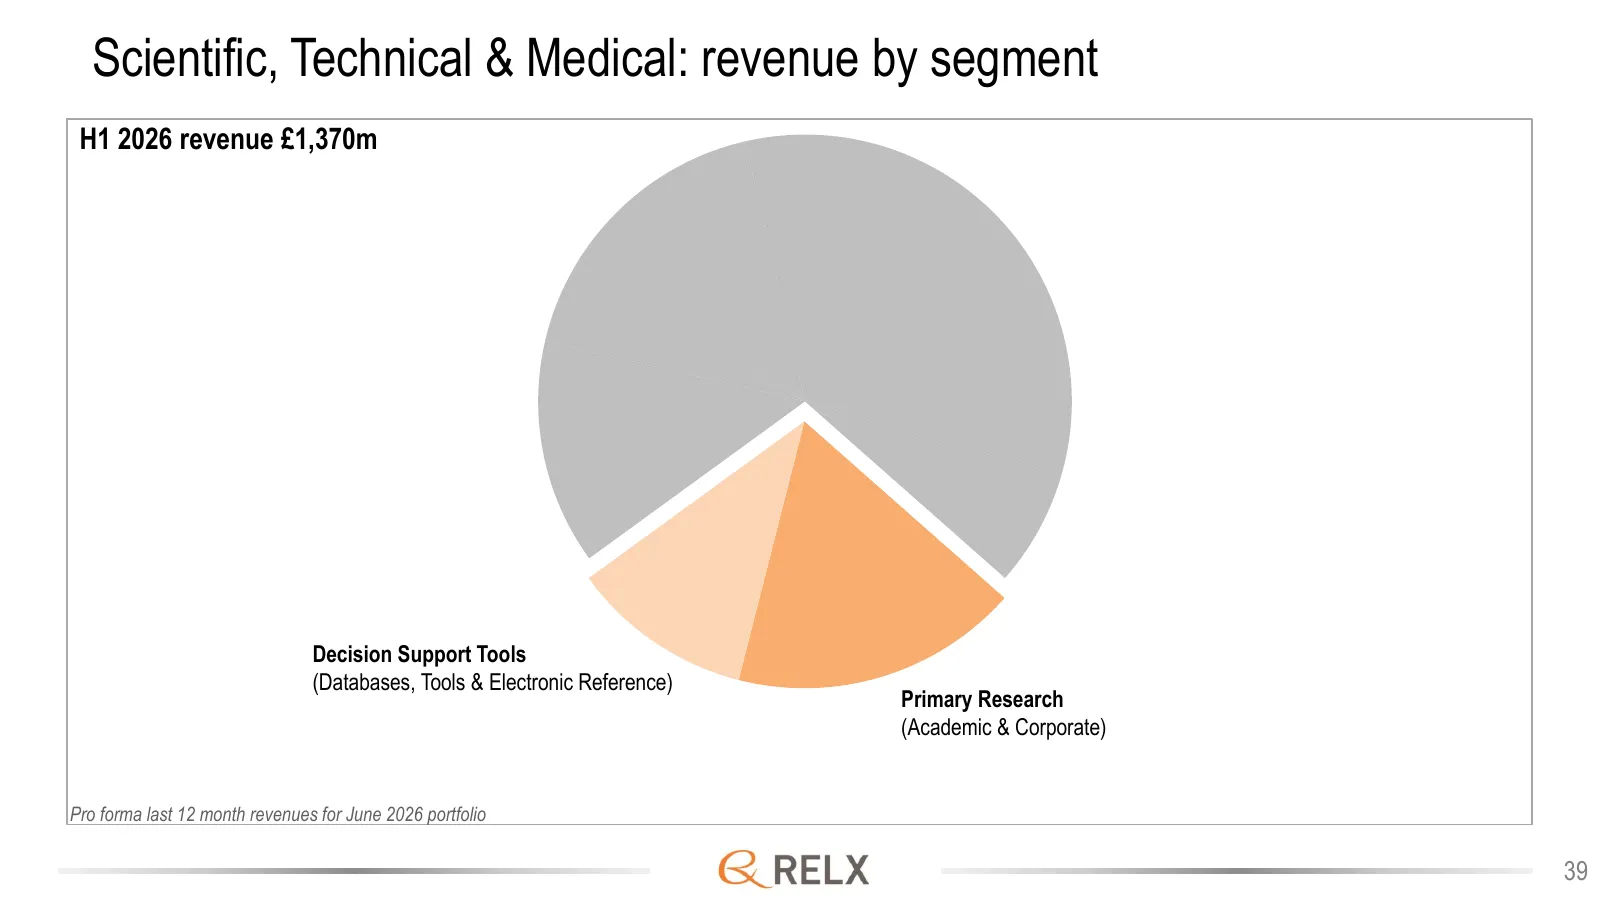
Slide 39: Scientific, Technical & Medical: revenue by segment
Scientific, Technical & Medical: revenue by segment H1 2026 revenue £1,370m Decision Support Tools (Databases, Tools & Electronic Reference) Primary Research (Academic & Corporate) Pro forma last 12 month revenues for June 2026 portfolio 39
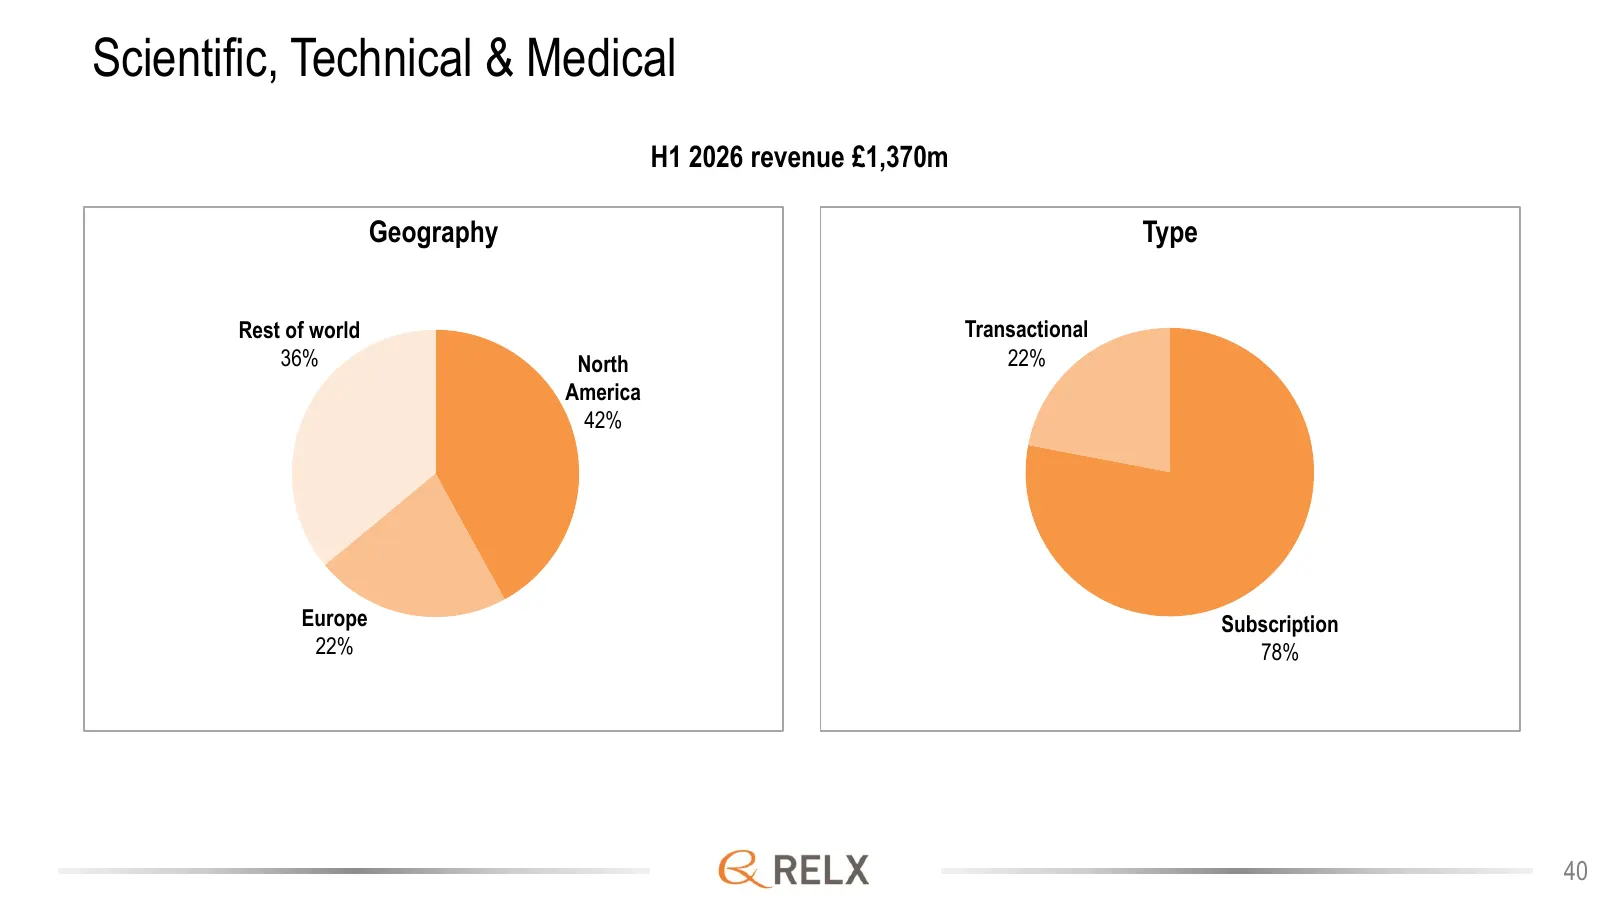
Slide 40: Scientific, Technical & Medical
Scientific, Technical & Medical H1 2026 revenue £1,370m Geography Type Rest of world Transactional 36% North 22% America 42% Europe Subscription 22% 78% 40
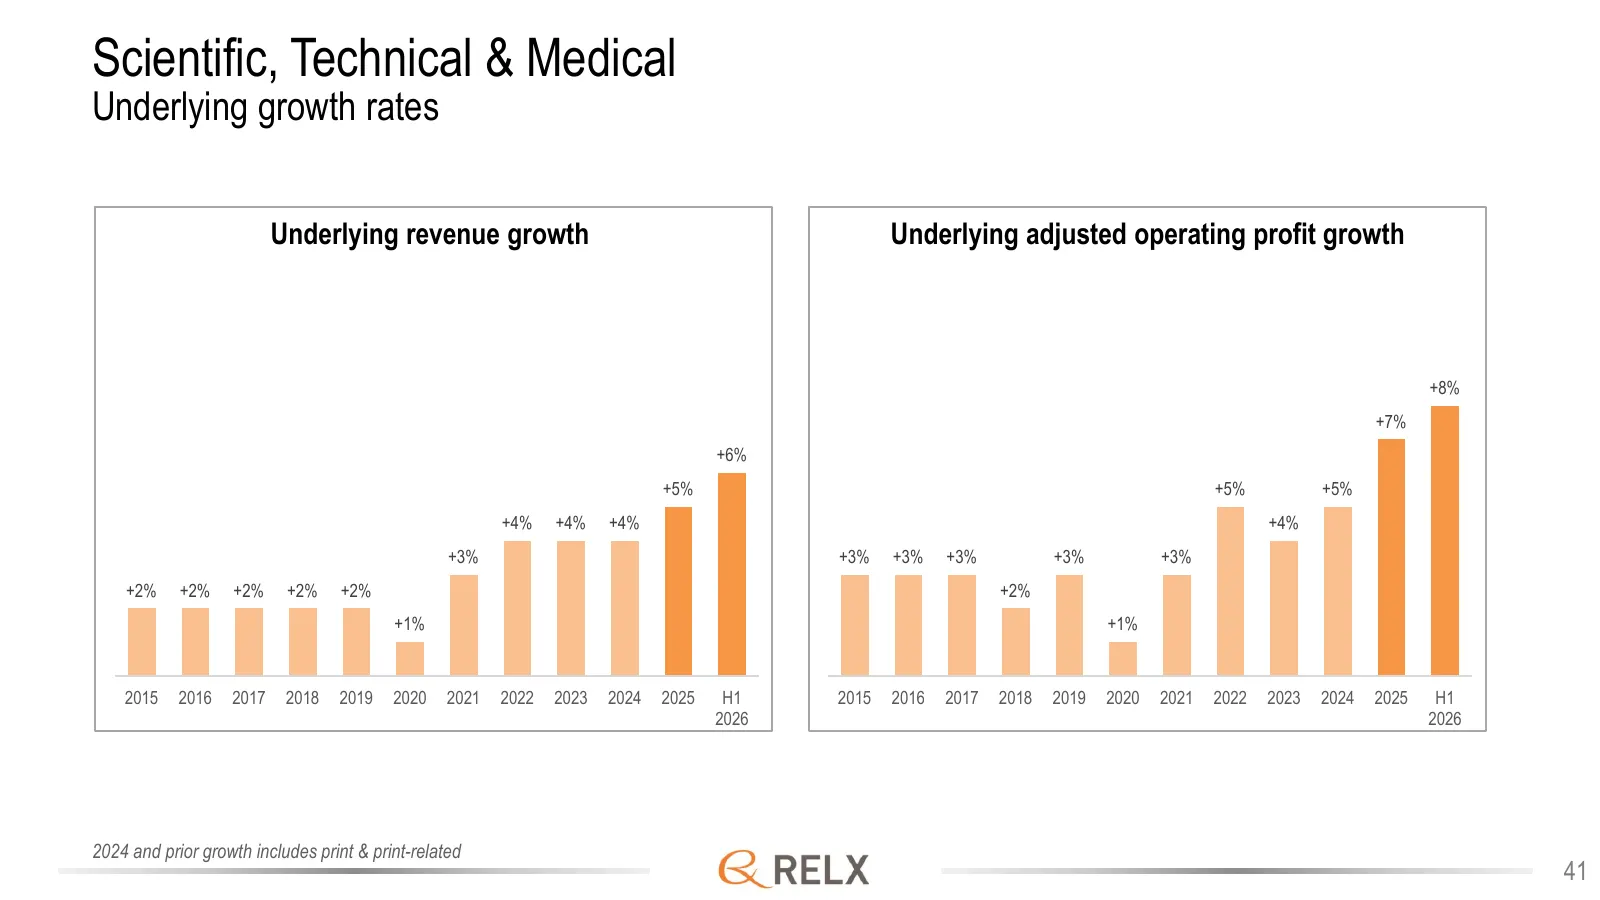
Slide 41: Scientific, Technical & Medical
Scientific, Technical & Medical Underlying growth rates Underlying revenue growth Underlying adjusted operating profit growth +8% +7% +6% +5% +5% +5% +4% +4% +4% +4% +3% +3% +3% +3% +3% +3% +2% +2% +2% +2% +2% +2% +1% +1% 2015 2016 2017 2018 2019 2020 2021 2022 2023 2024 2025 H1 2015 2016 2017 2018
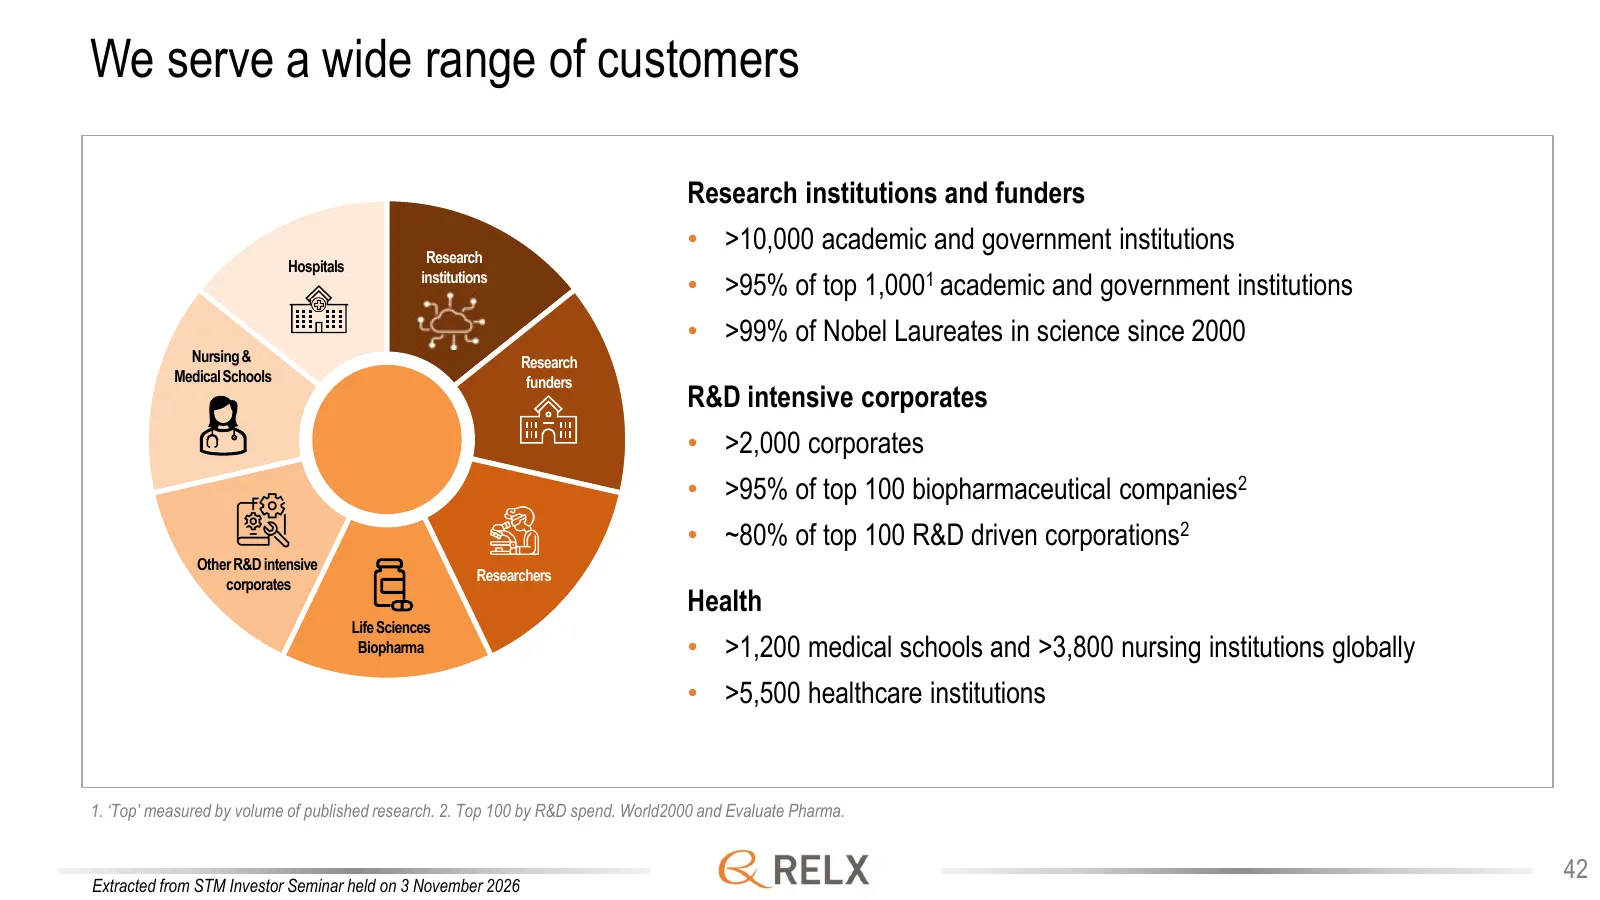
Slide 42: We serve a wide range of customers
We serve a wide range of customers Research institutions and funders Research • >10,000 academic and government institutions Hospitals institutions • >95% of top 1,0001 academic and government institutions • >99% of Nobel Laureates in science since 2000 Nursing & Research Medical Schools funders R&D
Slide 43: Strategic priorities
Strategic priorities Expand customer value in Primary Research • Continue to deliver industry-leading research quality, article volume, and user experience at a lower effective price Deliver increasing customer value with our Decision Support tools • Enhance value of existing analytics solutions and
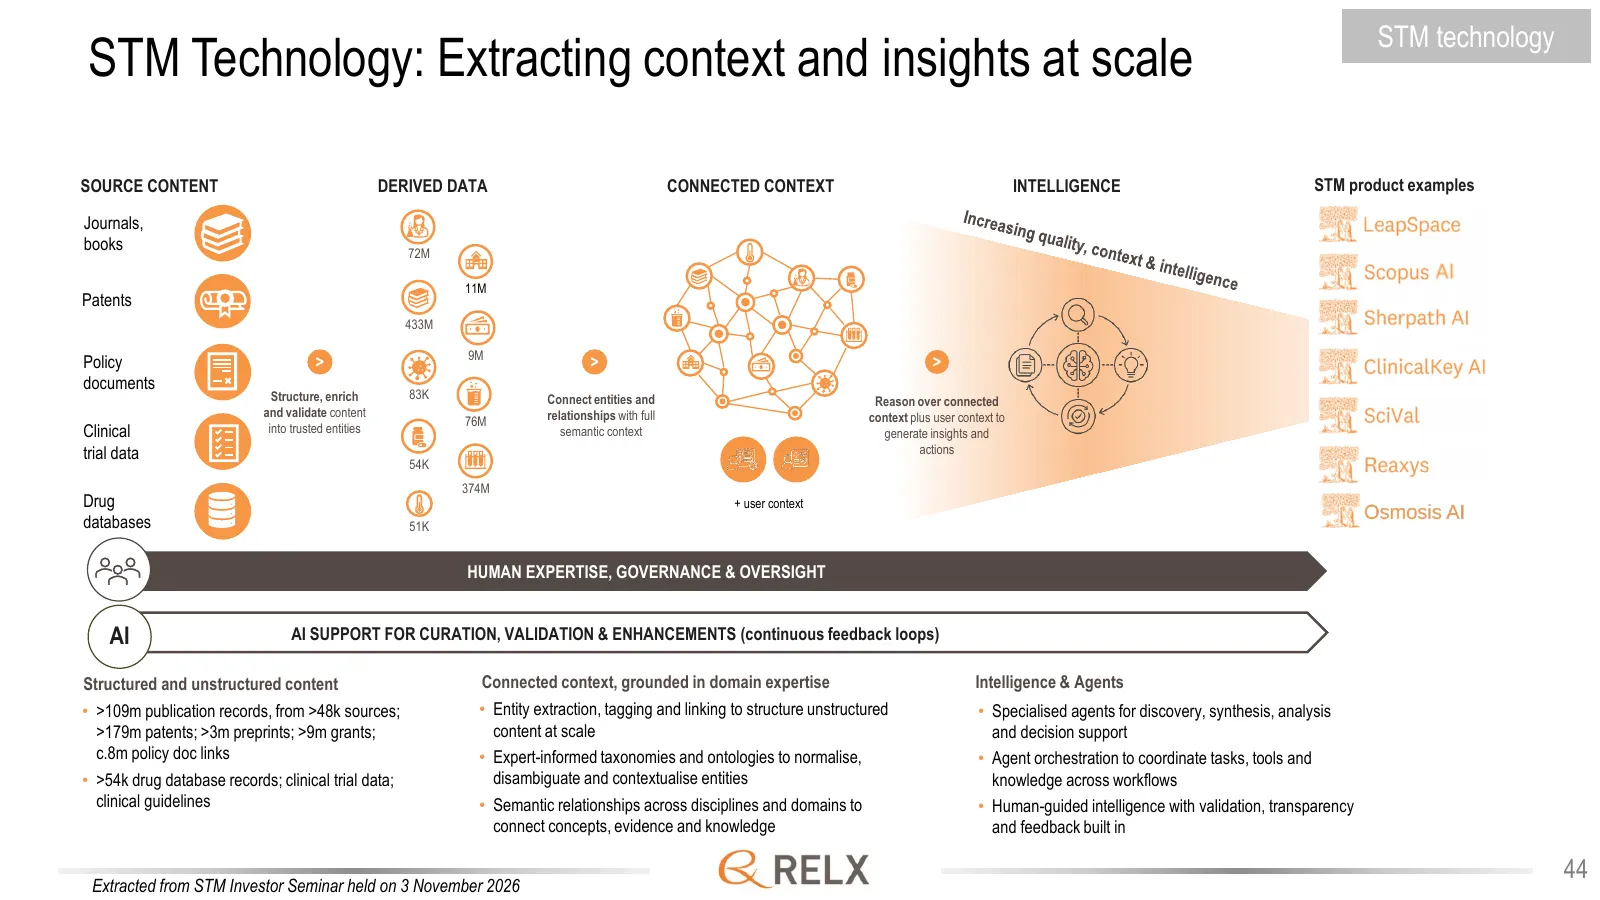
Slide 44: STM Technology: Extracting context and insights at scale
STM technology STM Technology: Extracting context and insights at scale SOURCE CONTENT DERIVED DATA CONNECTED CONTEXT INTELLIGENCE STM product examples Journals, books 72M 11M Patents 433M 9M Policy > > > documents Structure, enrich 83K Connect entities and Reason over connected and validate content
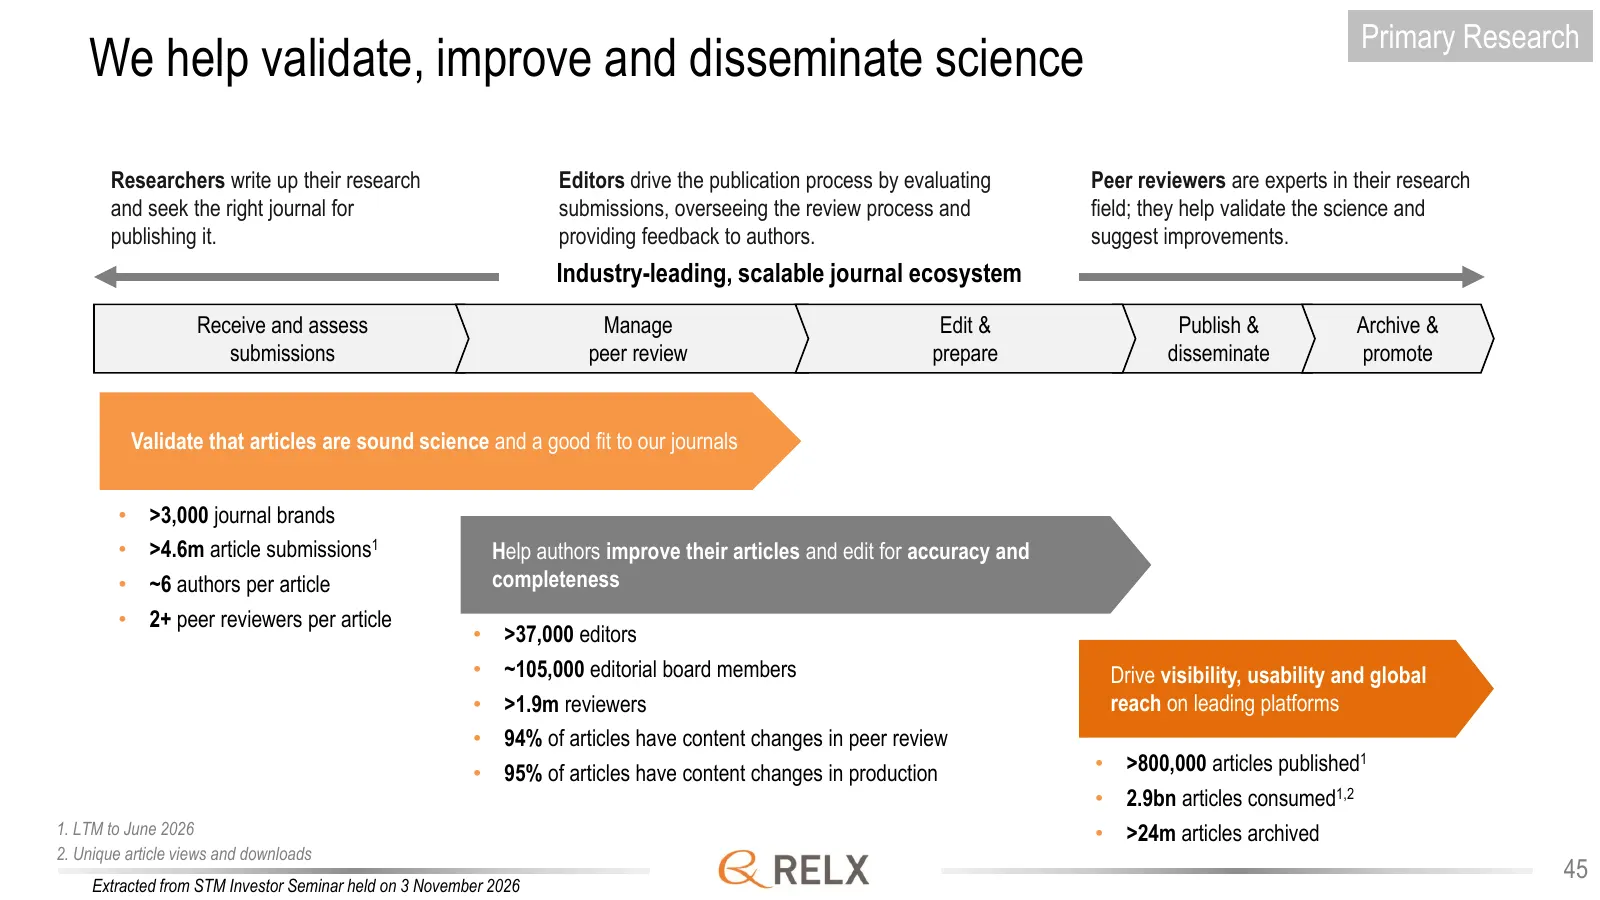
Slide 45: We help validate, improve and disseminate science
Primary Research We help validate, improve and disseminate science Researchers write up their research Editors drive the publication process by evaluating Peer reviewers are experts in their research and seek the right journal for submissions, overseeing the review process and field; they help valid
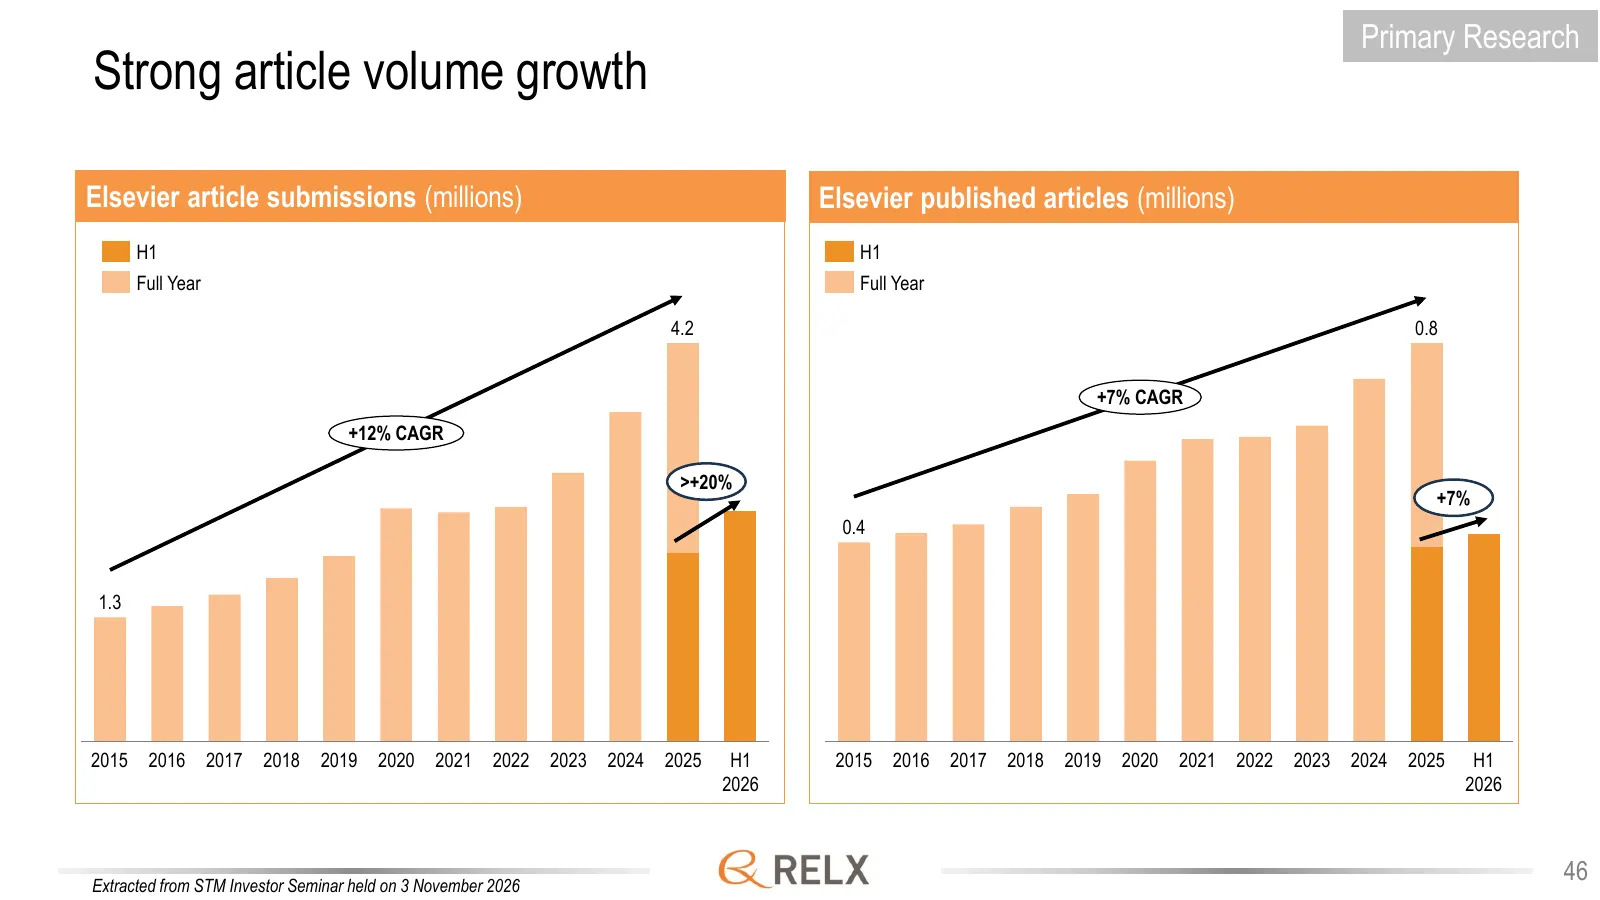
Slide 46: Strong article volume growth
Primary Research Strong article volume growth Elsevier article submissions (millions) Elsevier published articles (millions) H1 H1 Full Year Full Year 4.2 0.8 +7% CAGR +12% CAGR >+20% +7% 0.4 1.3 2015 2016 2017 2018 2019 2020 2021 2022 2023 2024 2025 H1 2015 2016 2017 2018 2019 2020 2021 2022 2023 2
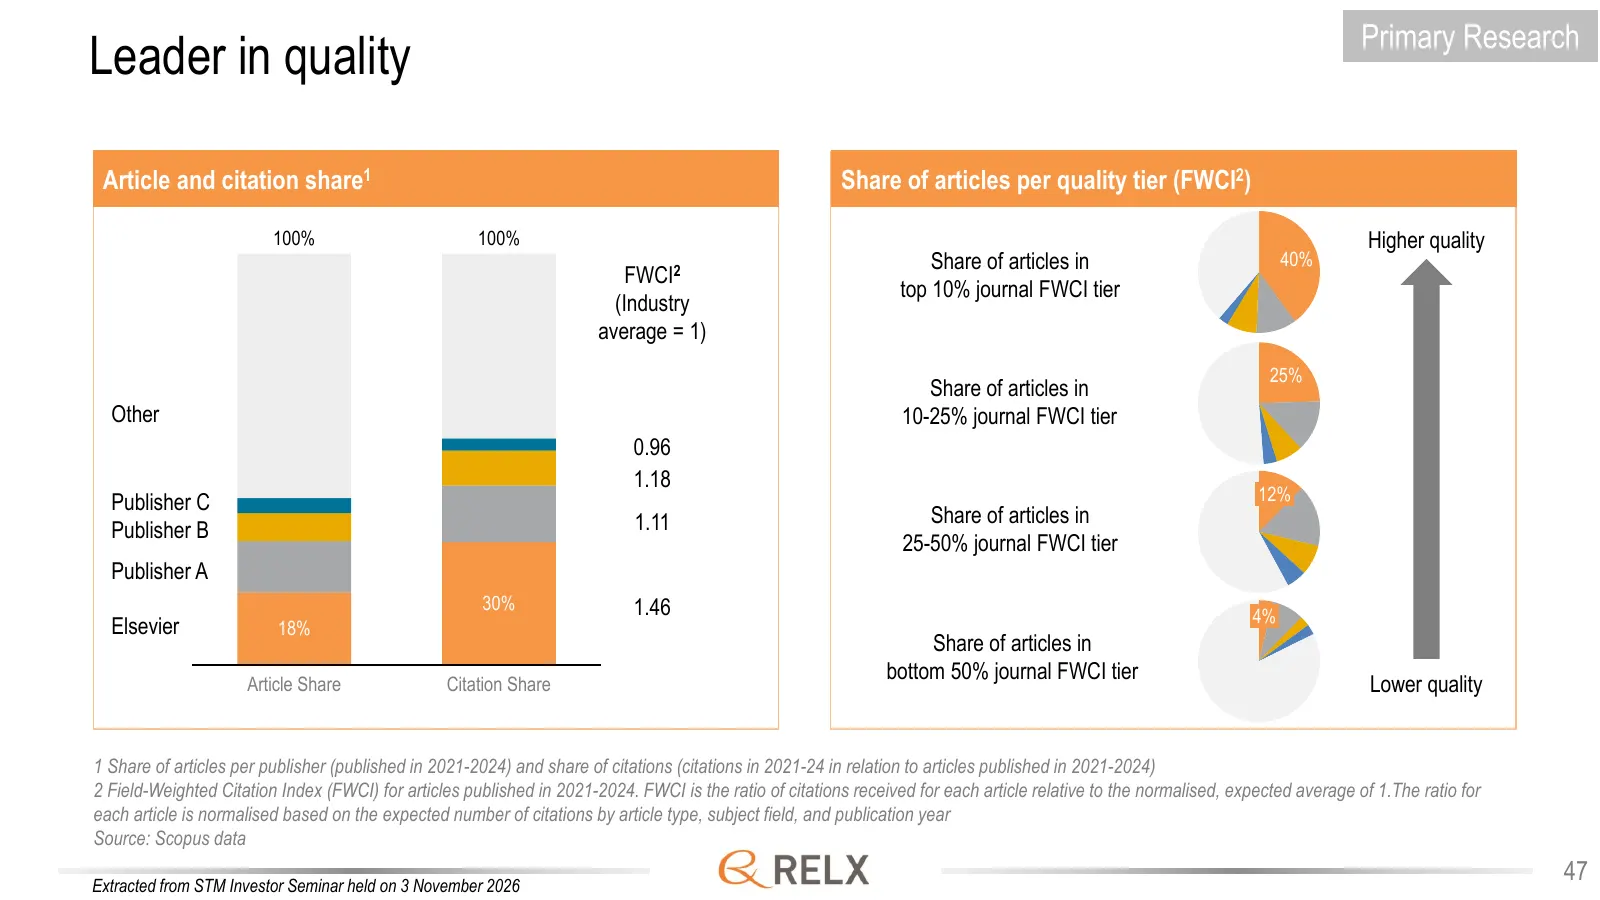
Slide 47: Leader in quality
Primary Research Leader in quality Article Article and citation share1and Citation Share Share of articles per quality tier (FWCI2) 100% 100% Higher quality Share of articles in 40% FWCI2 top 10% journal FWCI tier (Industry average = 1) 25% Share of articles in Other 10-25% journal FWCI tier 0.96 1.
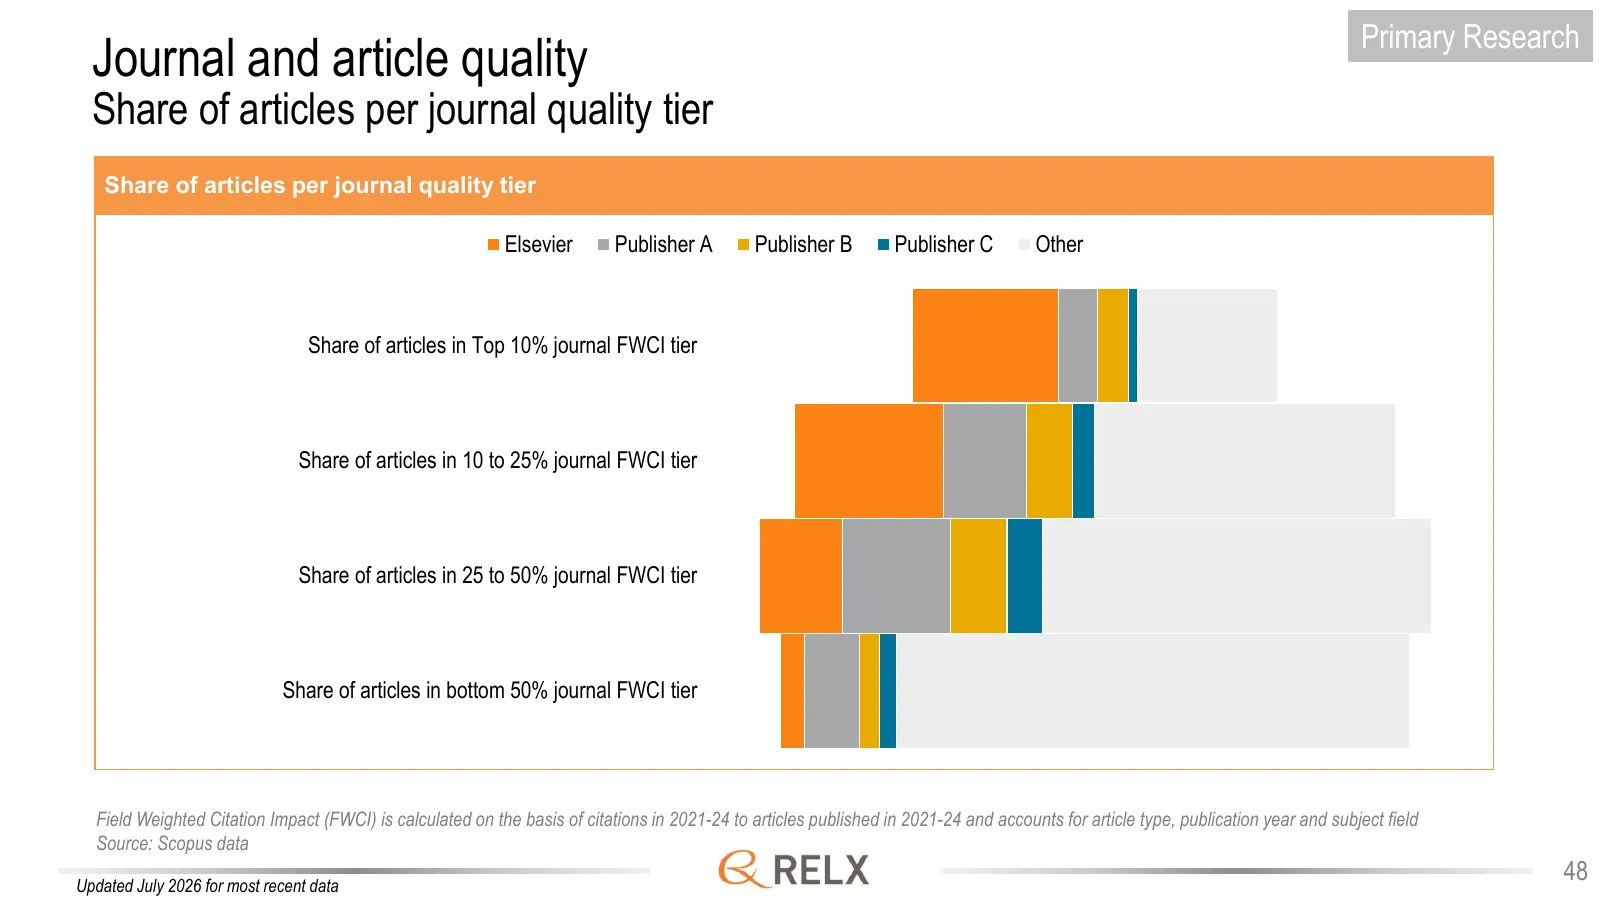
Slide 48: Journal and article quality
Primary Research Journal and article quality Share of articles per journal quality tier Share of articles per journal quality tier Elsevier Publisher A Publisher B Publisher C Other Share of articles in Top 10% journal FWCI tier Share of articles in 10 to 25% journal FWCI tier Share of articles in 2
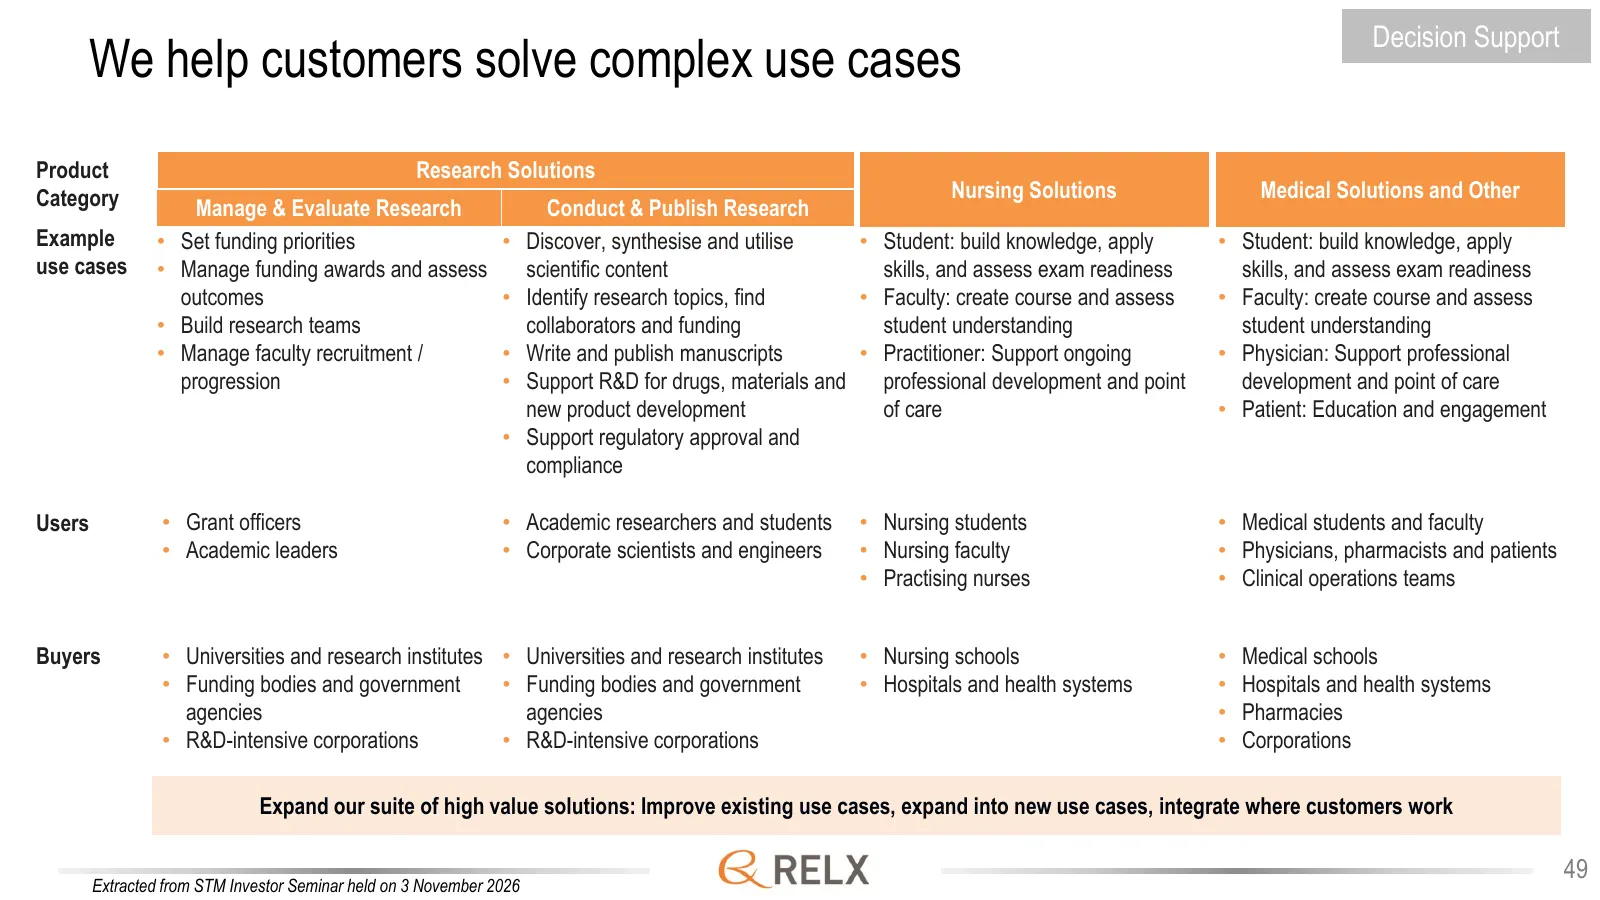
Slide 49: We help customers solve complex use cases
Decision Support We help customers solve complex use cases Product Research Solutions Category Nursing Solutions Medical Solutions and Other Manage & Evaluate Research Conduct & Publish Research Example • Set funding priorities • Discover, synthesise and utilise • Student: build knowledge, apply • S
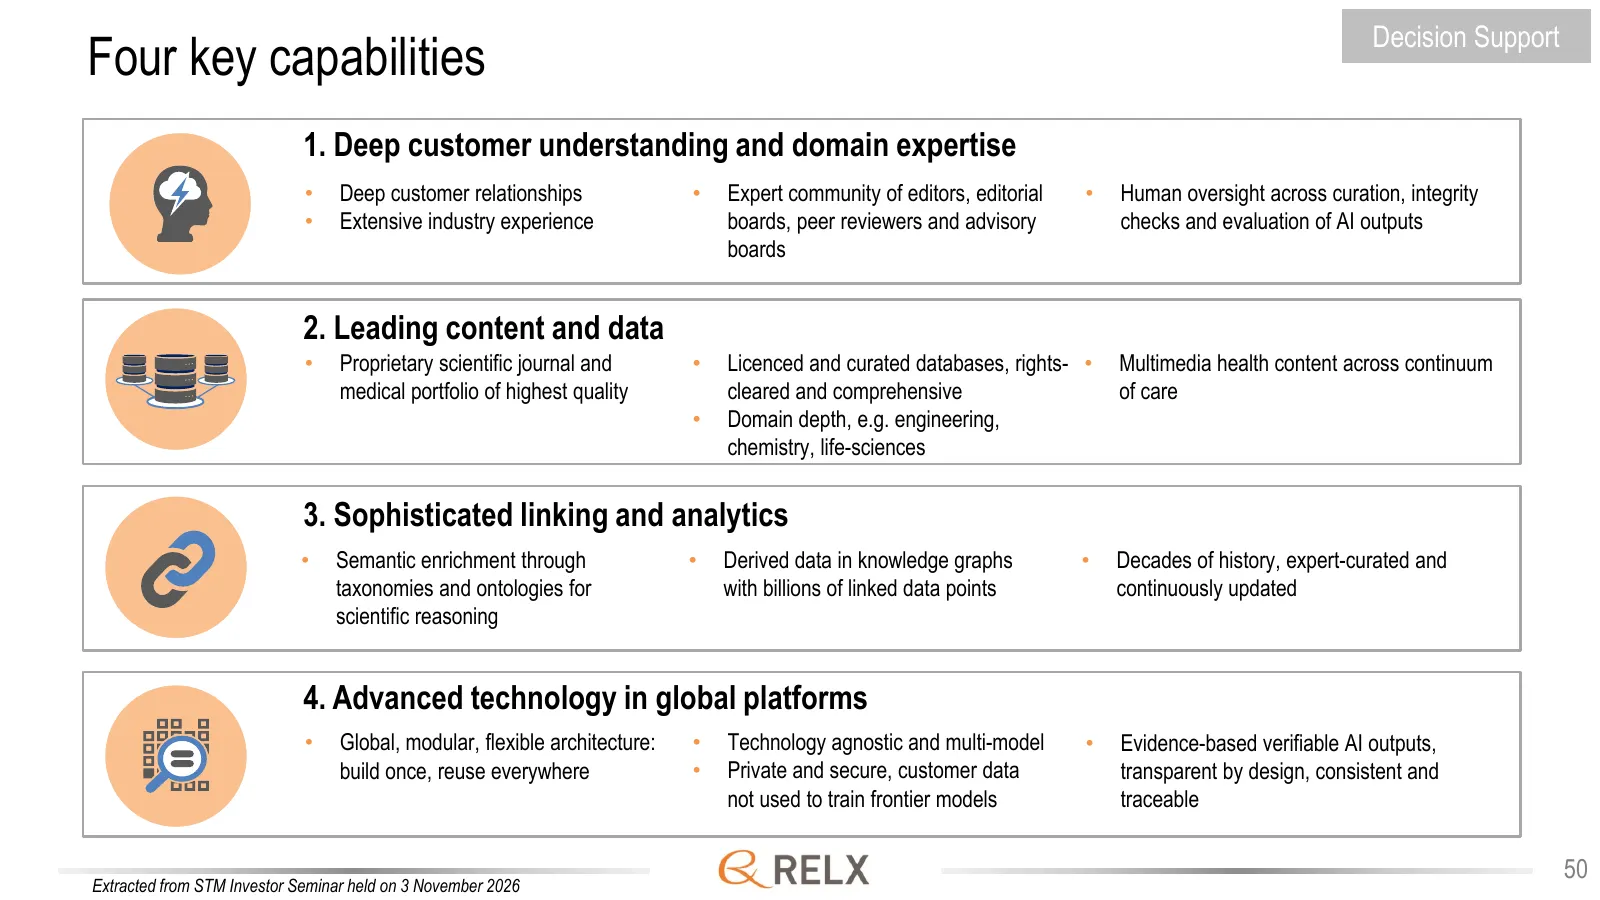
Slide 50: Four key capabilities
Decision Support Four key capabilities 1. Deep customer understanding and domain expertise • Deep customer relationships • Expert community of editors, editorial • Human oversight across curation, integrity • Extensive industry experience boards, peer reviewers and advisory checks and evaluation of

Slide 51: GRELX
GRELX 51
Slide 52: Legal
Legal Helps its customers improve decision-making, achieve better outcomes and increase productivity by providing tools that combine legal, regulatory and business information with powerful analytics 52
Slide 53: Legal: revenue by segment
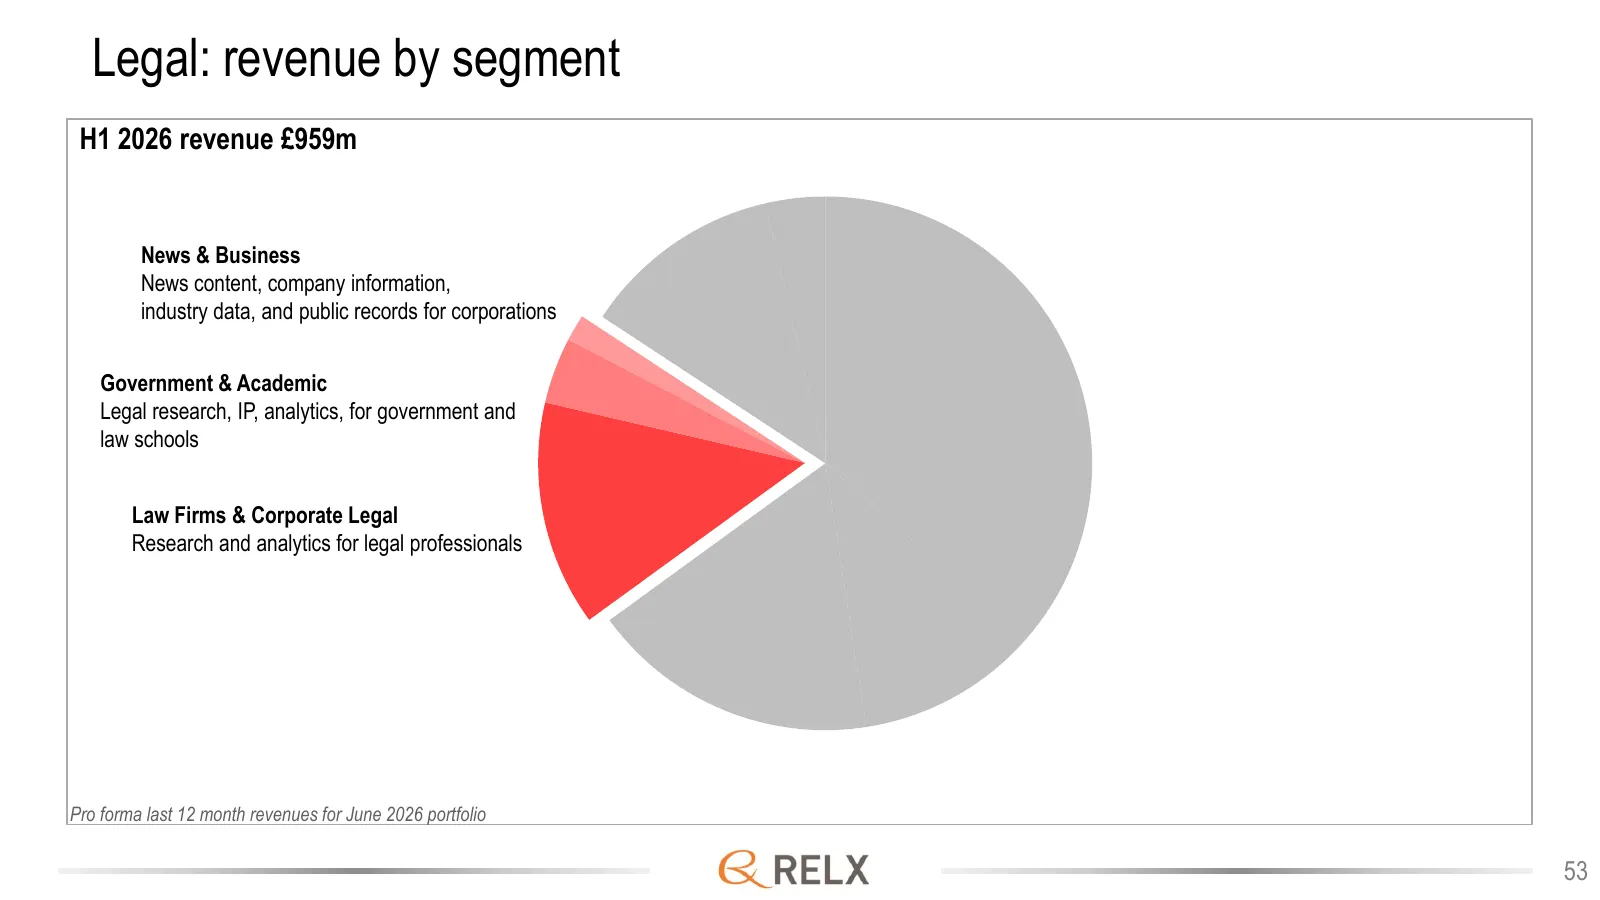
Legal: revenue by segment H1 2026 revenue £959m News & Business News content, company information, industry data, and public records for corporations Government & Academic Legal research, IP, analytics, for government and law schools Law Firms & Corporate Legal Research and analytics for legal profe
Slide 54: Legal
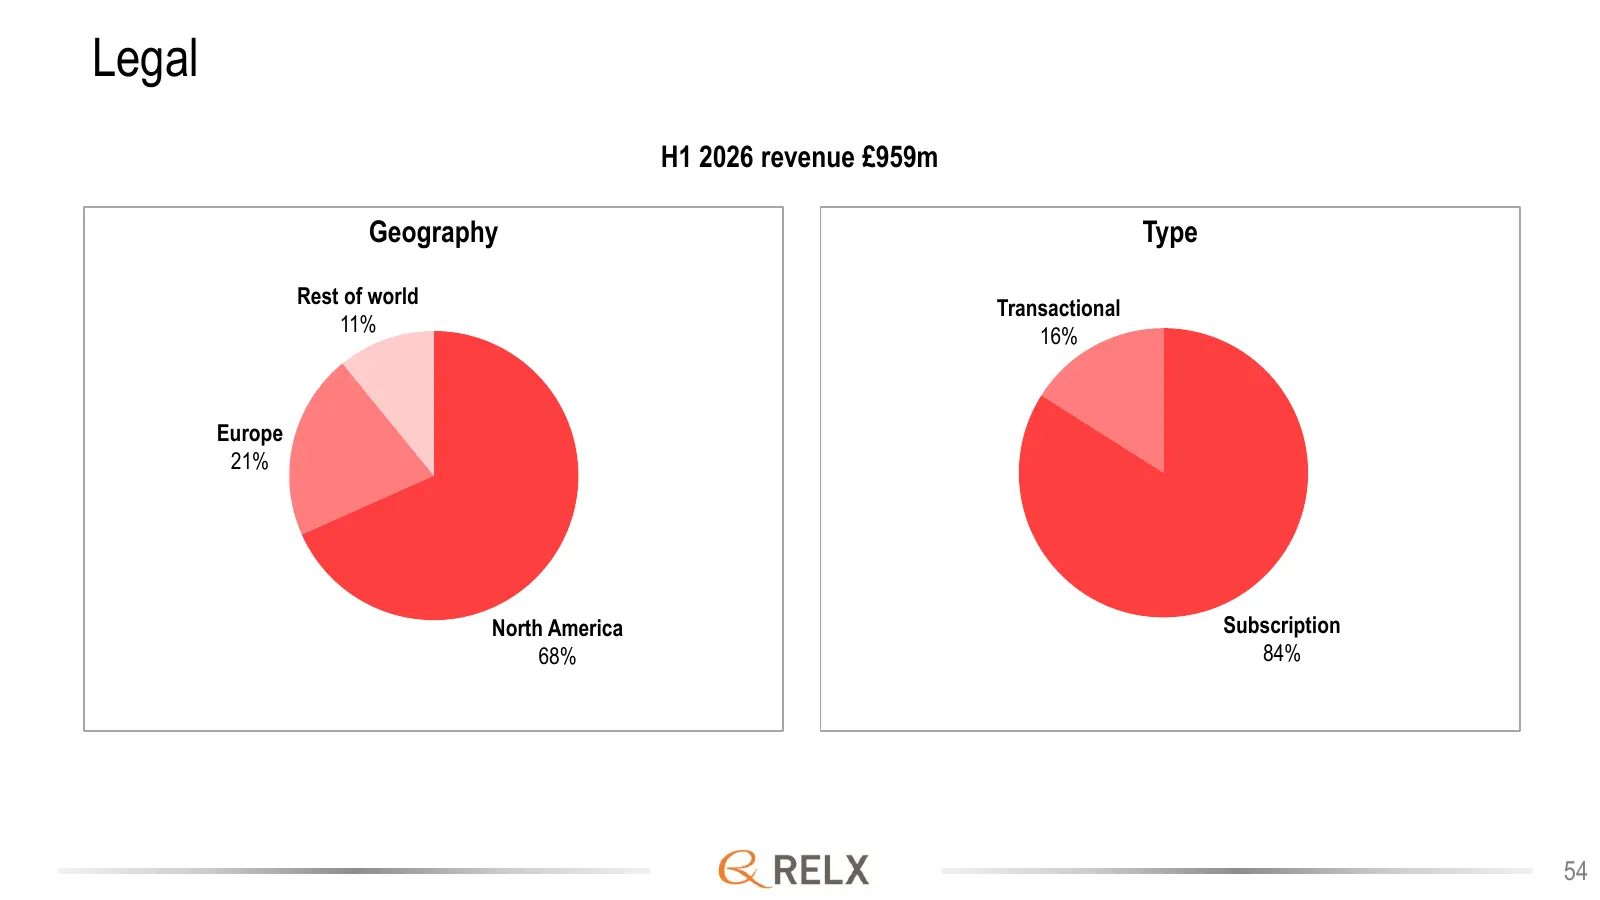
Legal H1 2026 revenue £959m Geography Type Rest of world Transactional 11% 16% Europe 21% North America Subscription 68% 84% 54
Slide 55: Legal
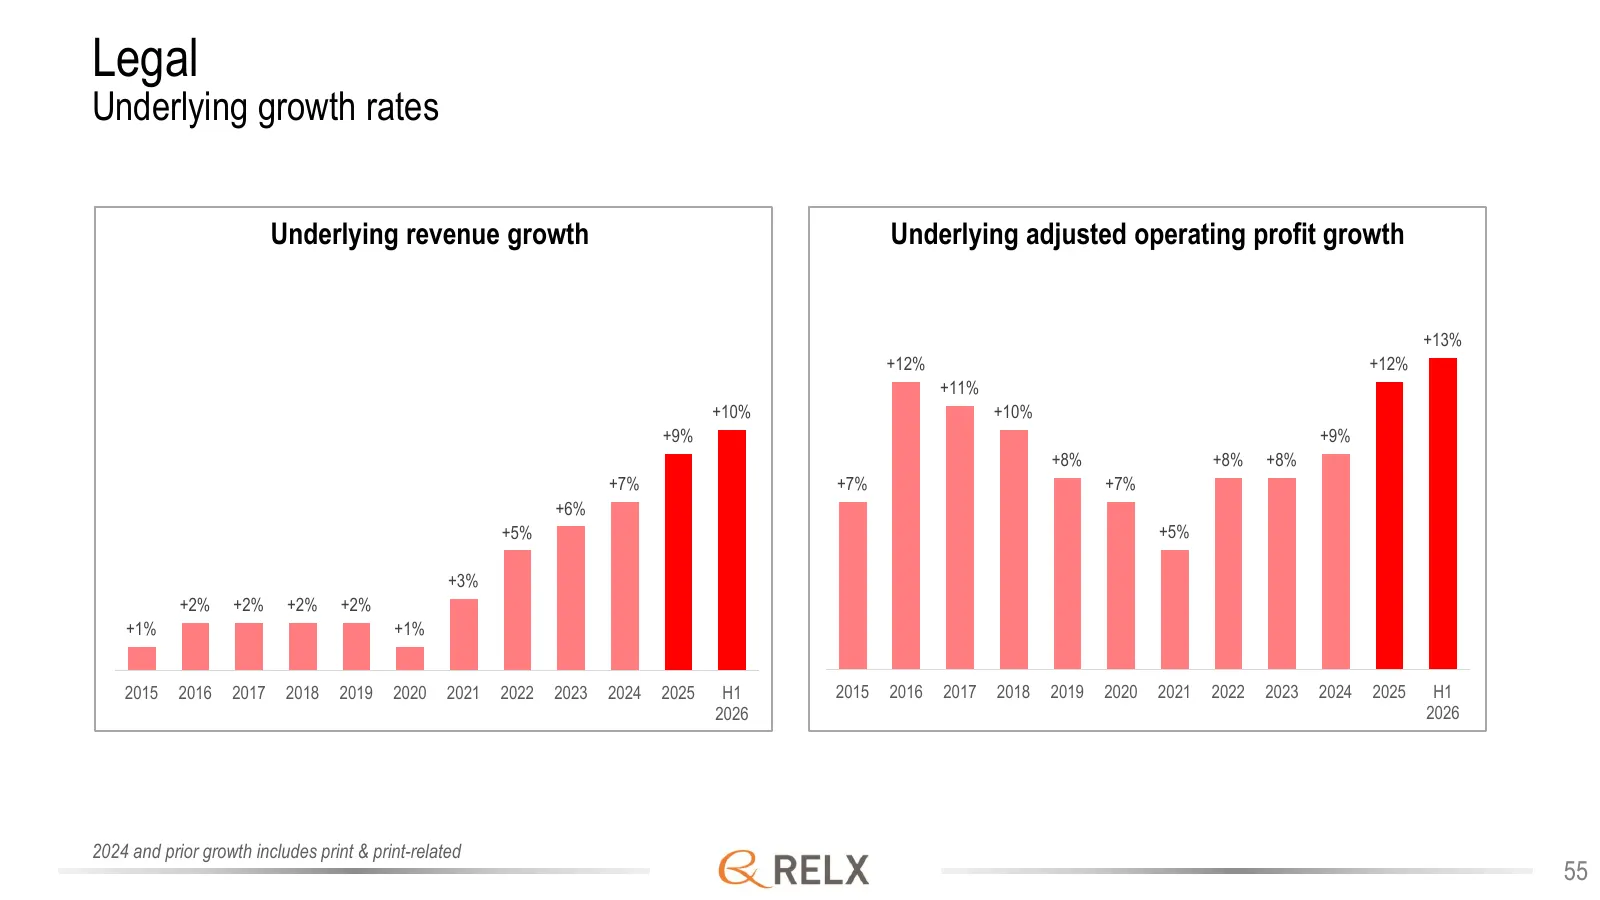
Legal Underlying growth rates Underlying revenue growth Underlying adjusted operating profit growth +13% +12% +12% +11% +10% +10% +9% +9% +8% +8% +8% +7% +7% +7% +6% +5% +5% +3% +2% +2% +2% +2% +1% +1% 2015 2016 2017 2018 2019 2020 2021 2022 2023 2024 2025 H1 2015 2016 2017 2018 2019 2020 2021 2022
Slide 56: Strategic priorities
Strategic priorities Drive improved organic revenue growth through further development of legal analytics and workflows • Expand our portfolio of information-based solutions, analytics and decision tools, and workflow tools that deliver enhanced value to our customers Pursue growth in adjacent use c
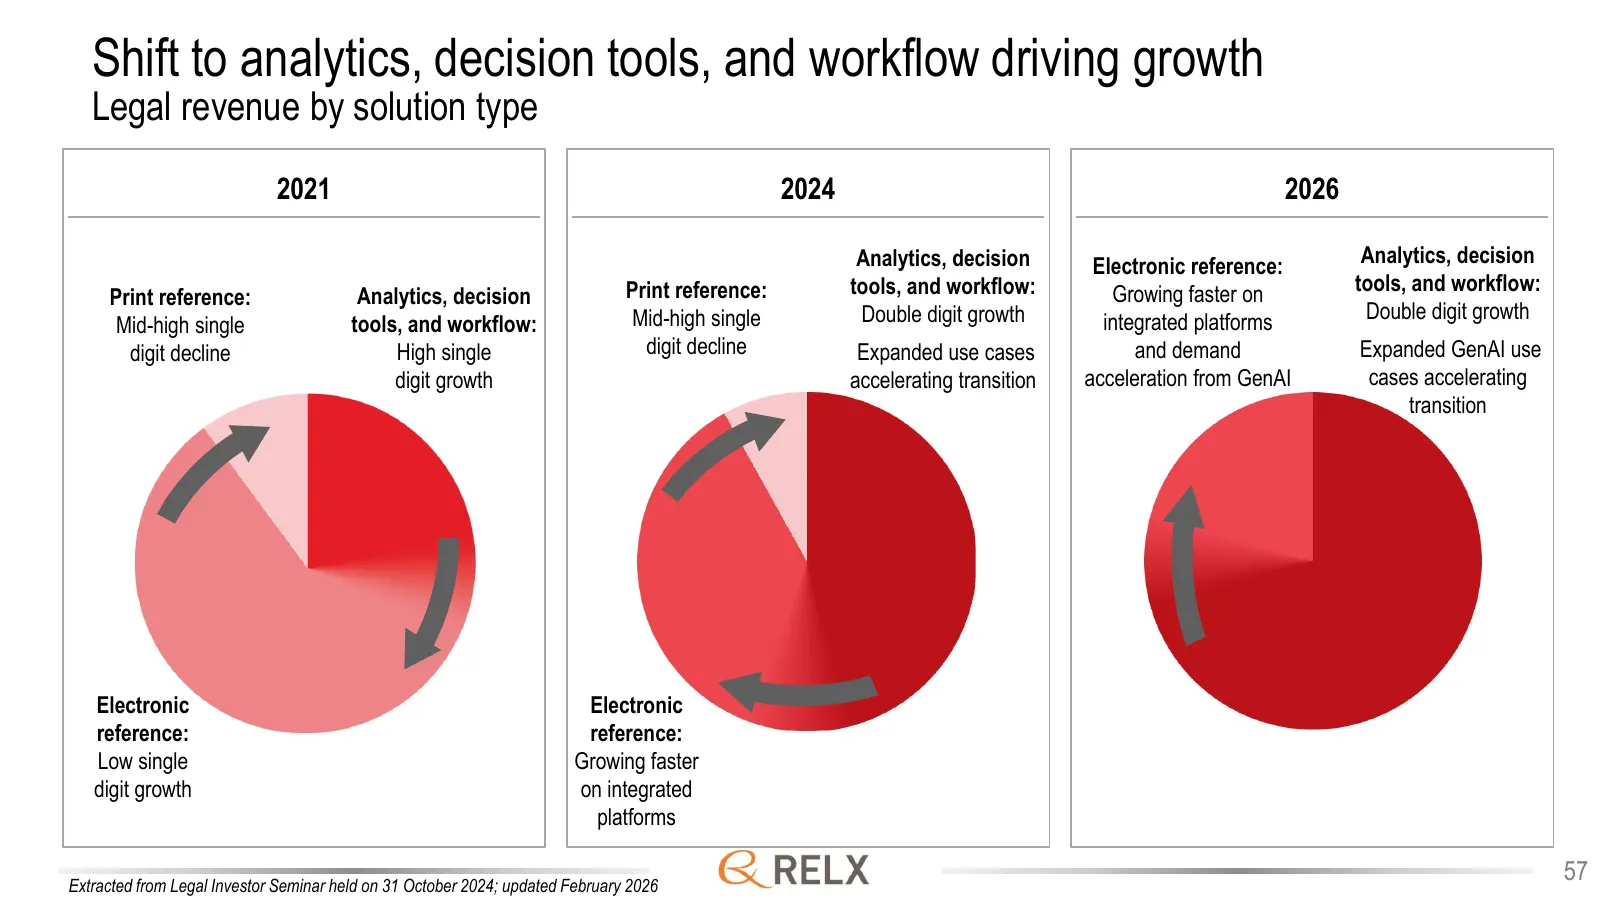
Slide 57: Shift to analytics, decision tools, and workflow driving growth
Shift to analytics, decision tools, and workflow driving growth Legal revenue by solution type 2021 2024 2026 Analytics, decision Electronic reference: Analytics, decision Print reference: tools, and workflow: Growing faster on tools, and workflow: Print reference: Analytics, decision Mid-high singl
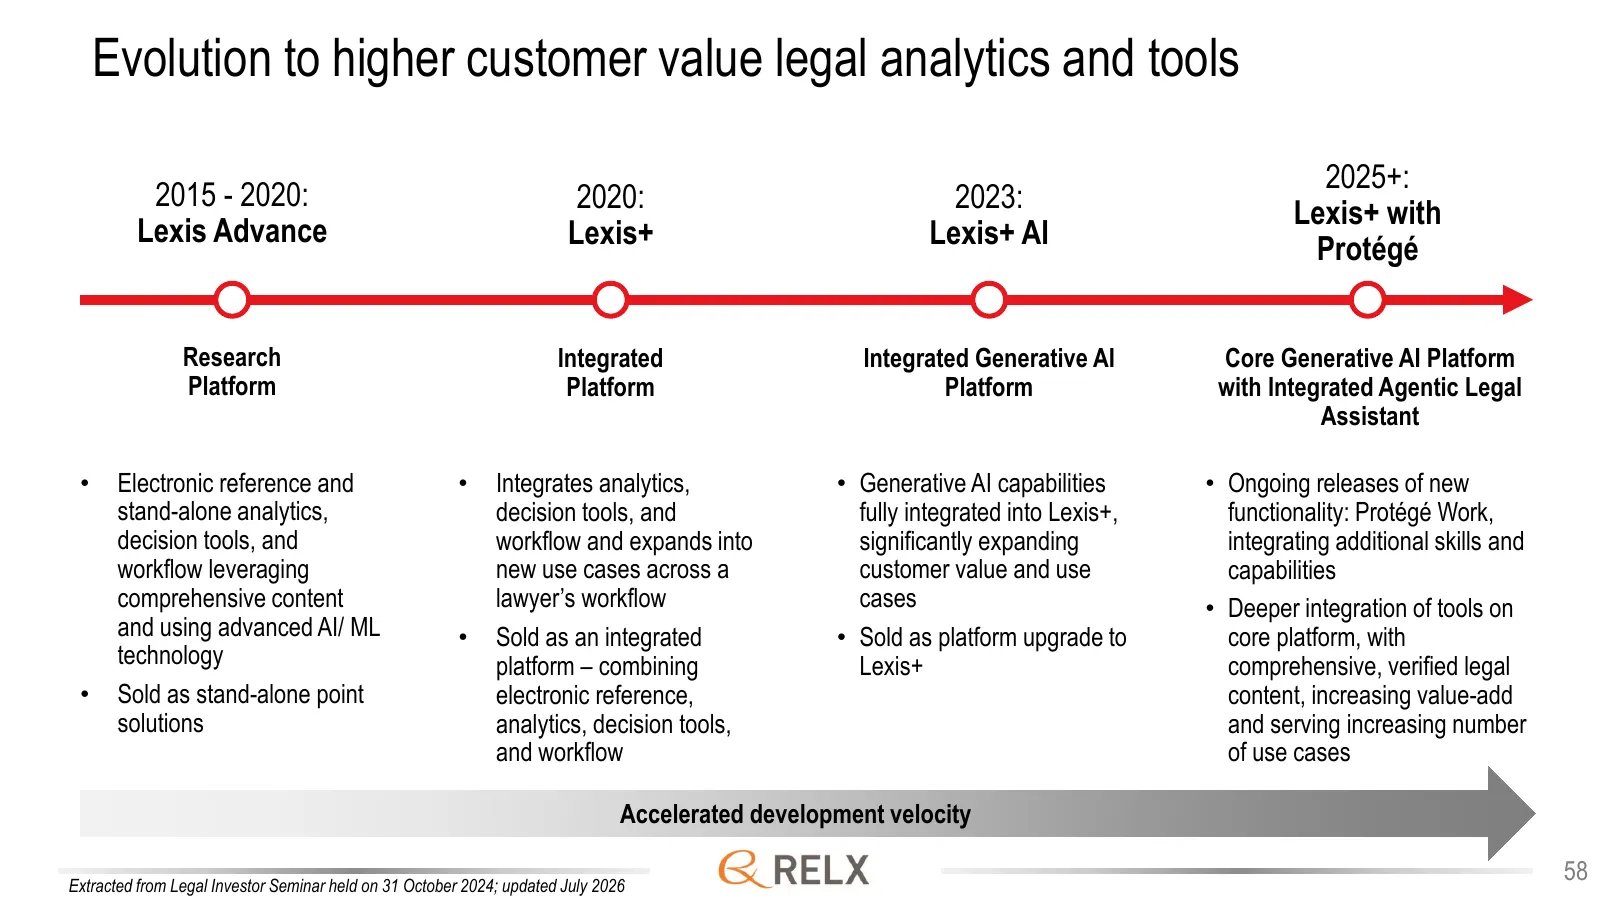
Slide 58: Evolution to higher customer value legal analytics and tools
Evolution to higher customer value legal analytics and tools 2025+: 2015 - 2020: 2020: 2023: Lexis+ with Lexis Advance Lexis+ Lexis+ AI Protégé Research Integrated Integrated Generative AI Core Generative AI Platform Platform Platform Platform with Integrated Agentic Legal Assistant • Electronic ref
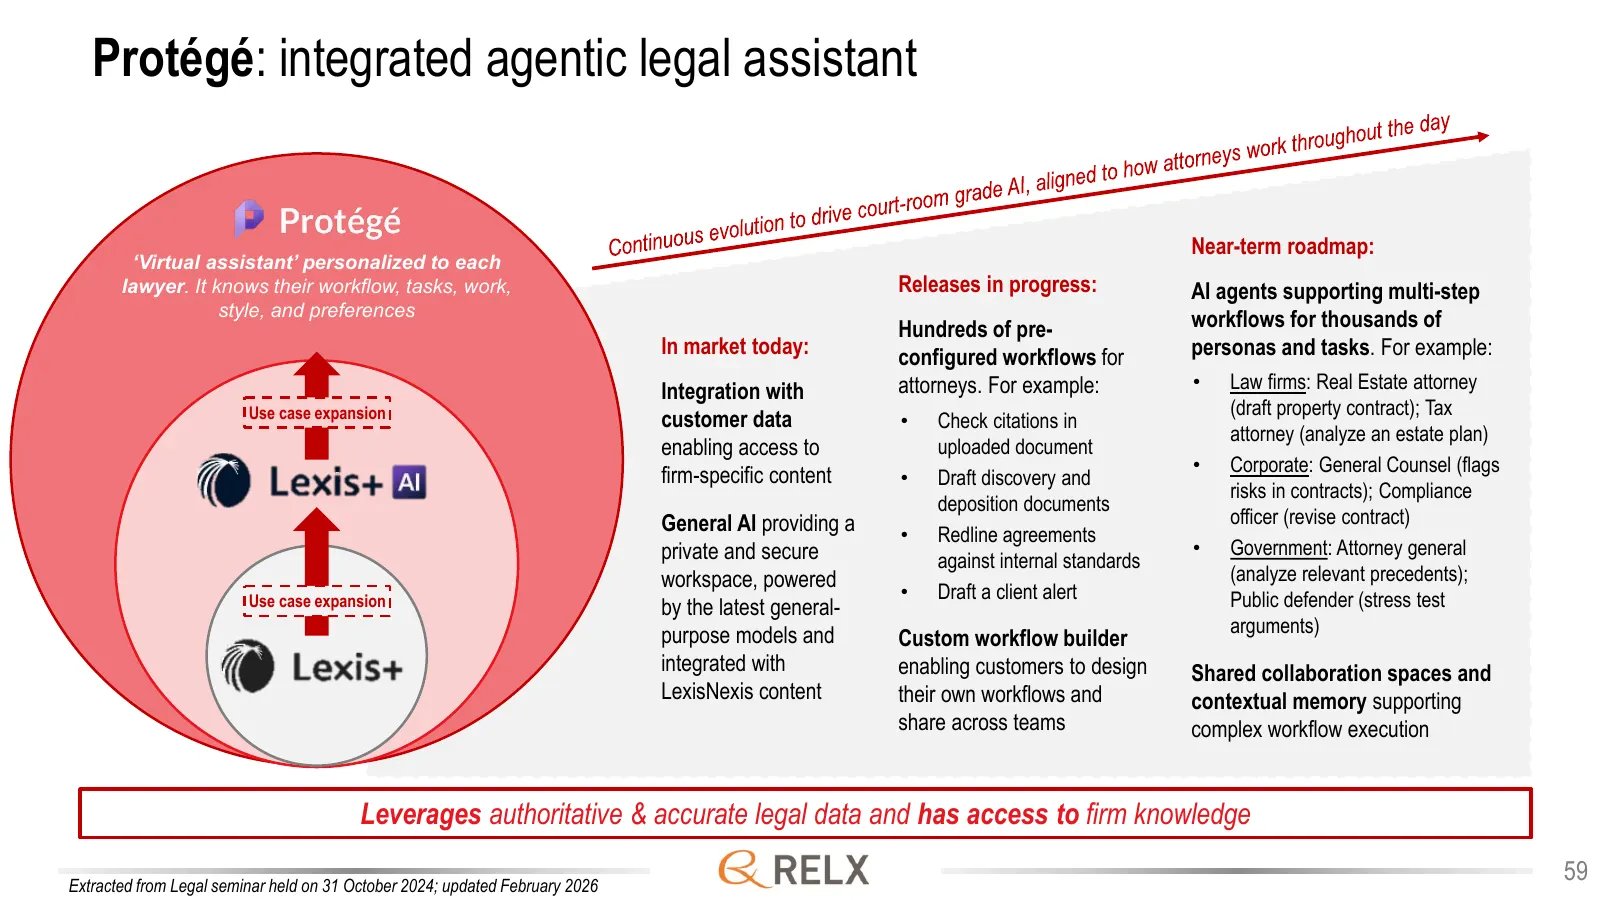
Slide 59: Protégé: integrated agentic legal assistant
Protégé: integrated agentic legal assistant Near-term roadmap: ‘Virtual assistant’ personalized to each lawyer. It knows their workflow, tasks, work, Releases in progress: AI agents supporting multi-step style, and preferences workflows for thousands of Hundreds of pre- In market today: configured w
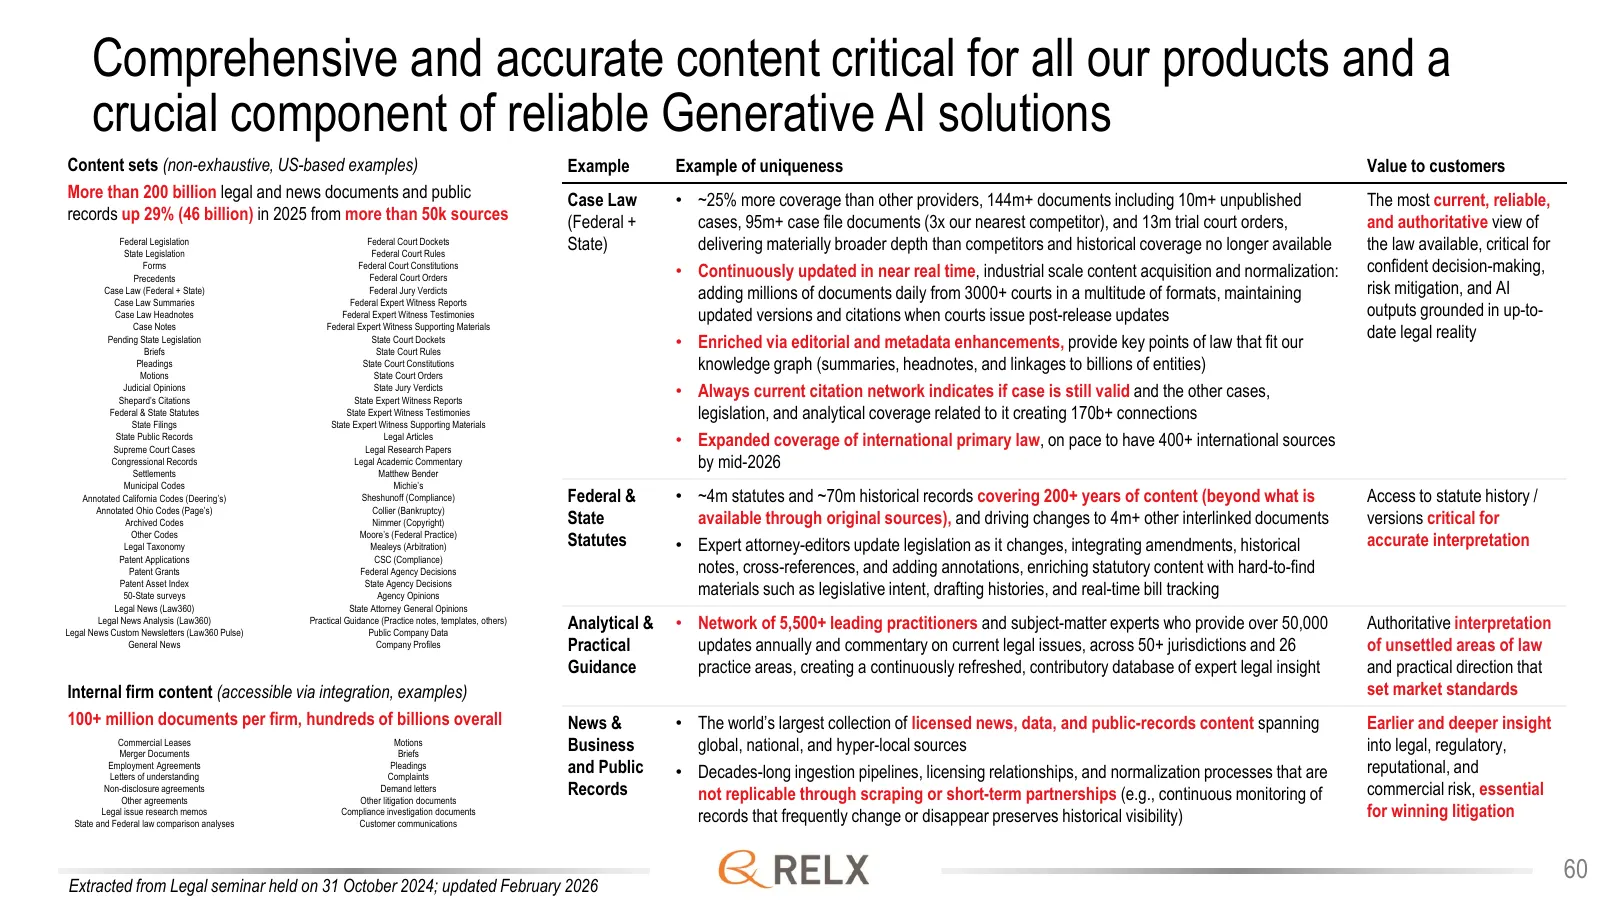
Slide 60: Comprehensive and accurate content critical for all our products
Comprehensive and accurate content critical for all our products and a crucial component of reliable Generative AI solutions Content sets (non-exhaustive, US-based examples) Example Example of uniqueness Value to customers More than 200 billion legal and news documents and public Case Law • ~25% mor
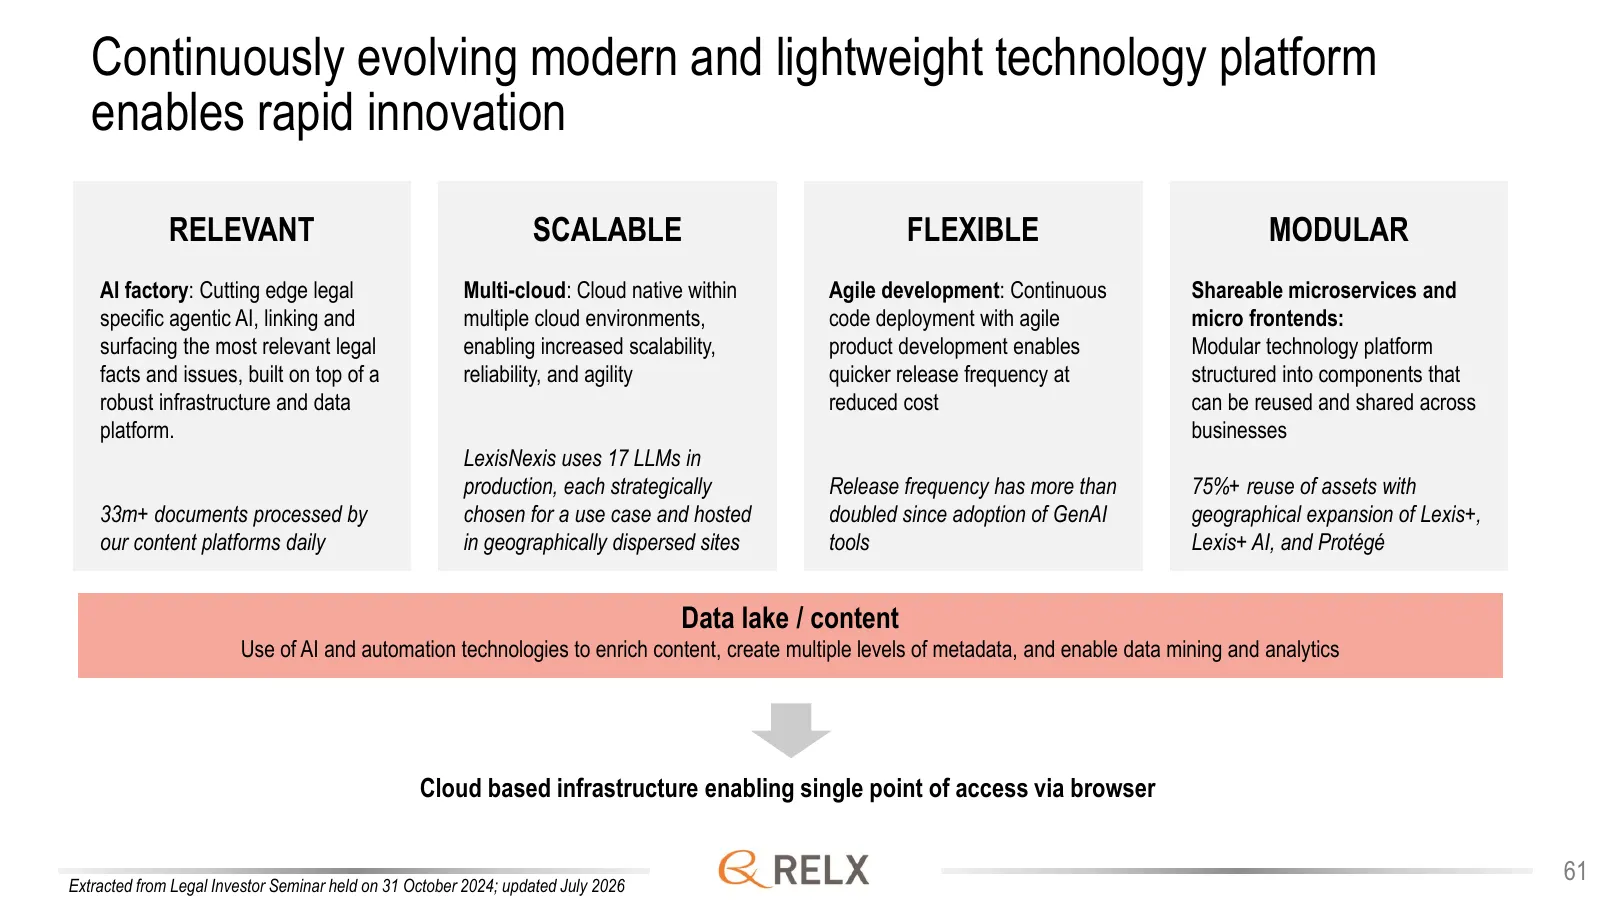
Slide 61: Continuously evolving modern and lightweight technology platform
Continuously evolving modern and lightweight technology platform enables rapid innovation RELEVANT SCALABLE FLEXIBLE MODULAR AI factory: Cutting edge legal Multi-cloud: Cloud native within Agile development: Continuous Shareable microservices and specific agentic AI, linking and multiple cloud envir
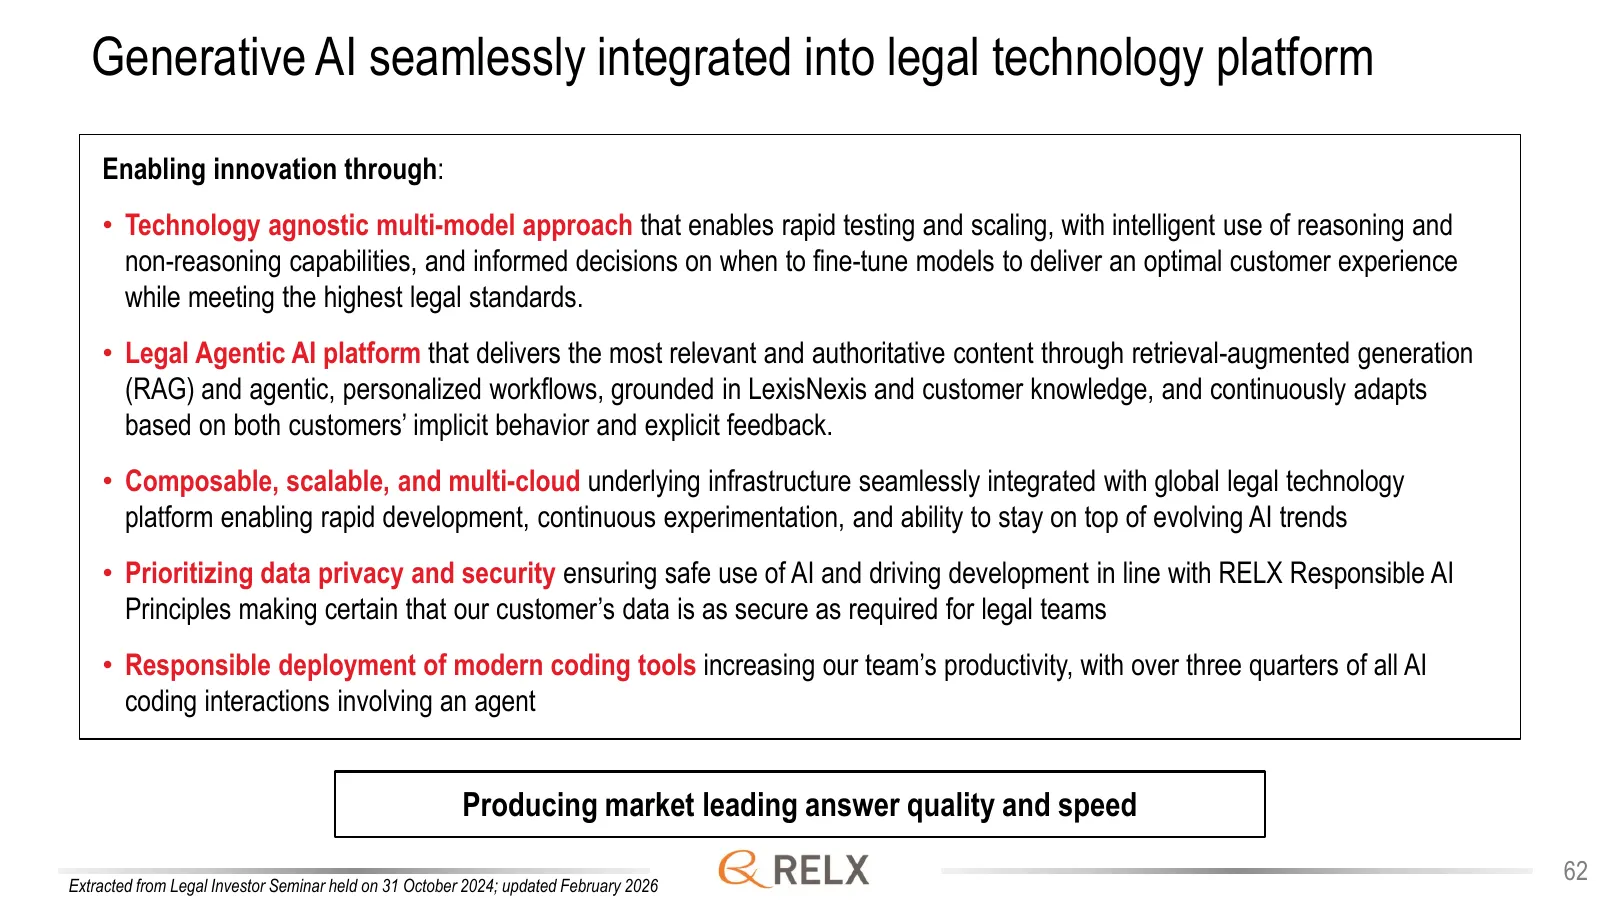
Slide 62: Generative AI seamlessly integrated into legal technology platform
Generative AI seamlessly integrated into legal technology platform Enabling innovation through: • Technology agnostic multi-model approach that enables rapid testing and scaling, with intelligent use of reasoning and non-reasoning capabilities, and informed decisions on when to fine-tune models to d
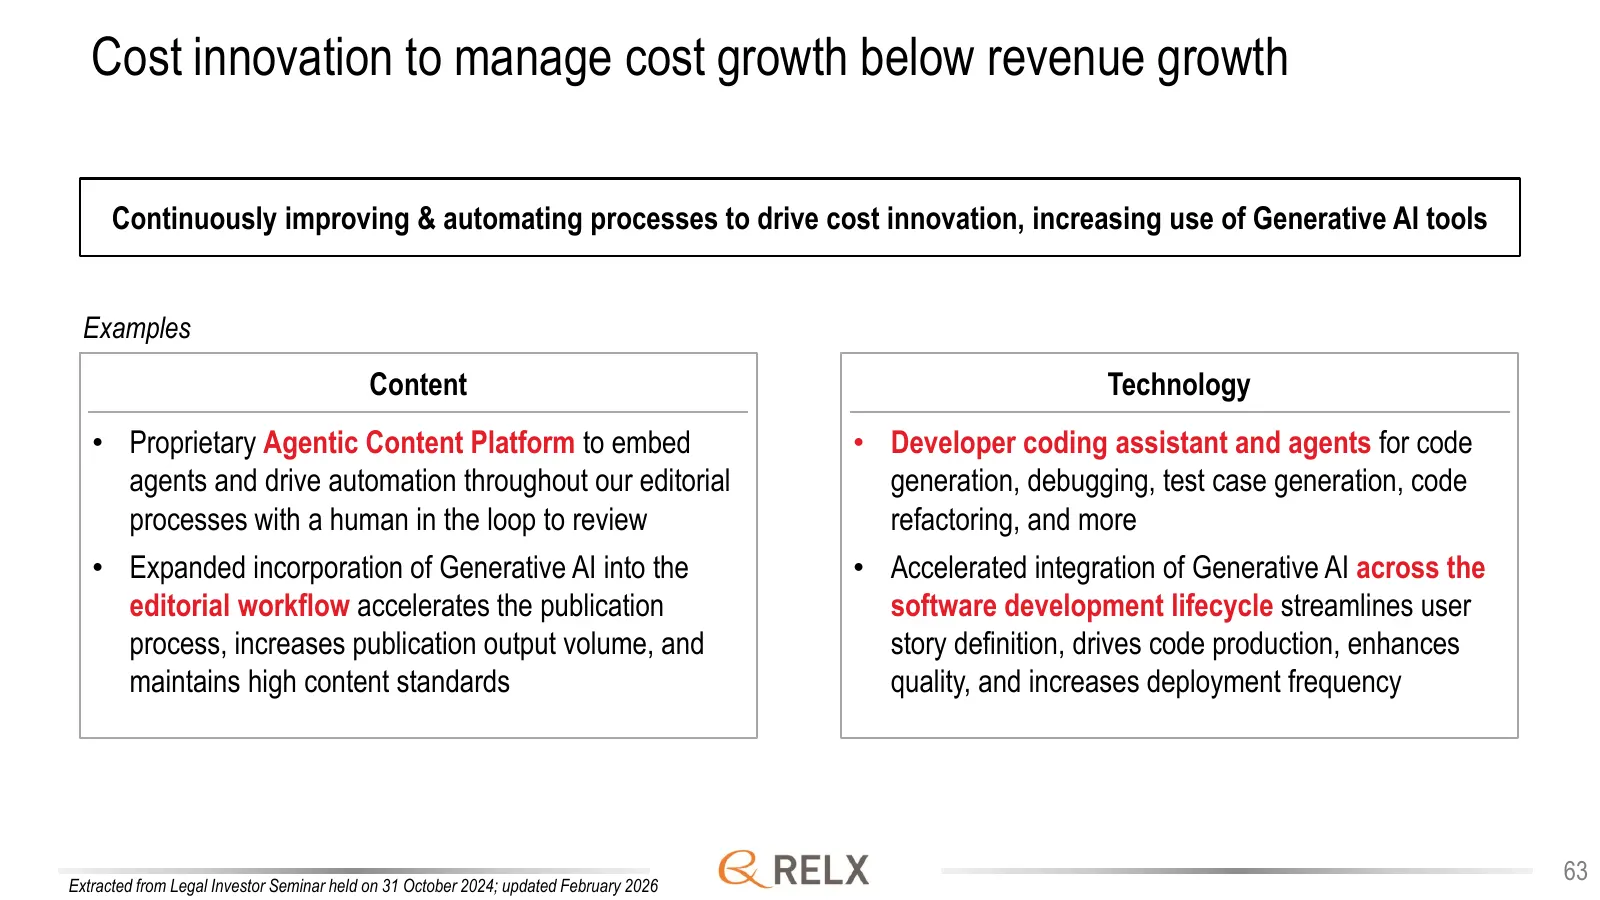
Slide 63: Cost innovation to manage cost growth below revenue growth
Cost innovation to manage cost growth below revenue growth Continuously improving & automating processes to drive cost innovation, increasing use of Generative AI tools Examples Content Technology • Proprietary Agentic Content Platform to embed • Developer coding assistant and agents for code agents
Slide 64: Exhibitions
Exhibitions Combines industry expertise, digital tools, and data to help customers connect in-person and online, discover new markets, source products and generate leads and transact 64
Slide 65: Exhibitions: revenue
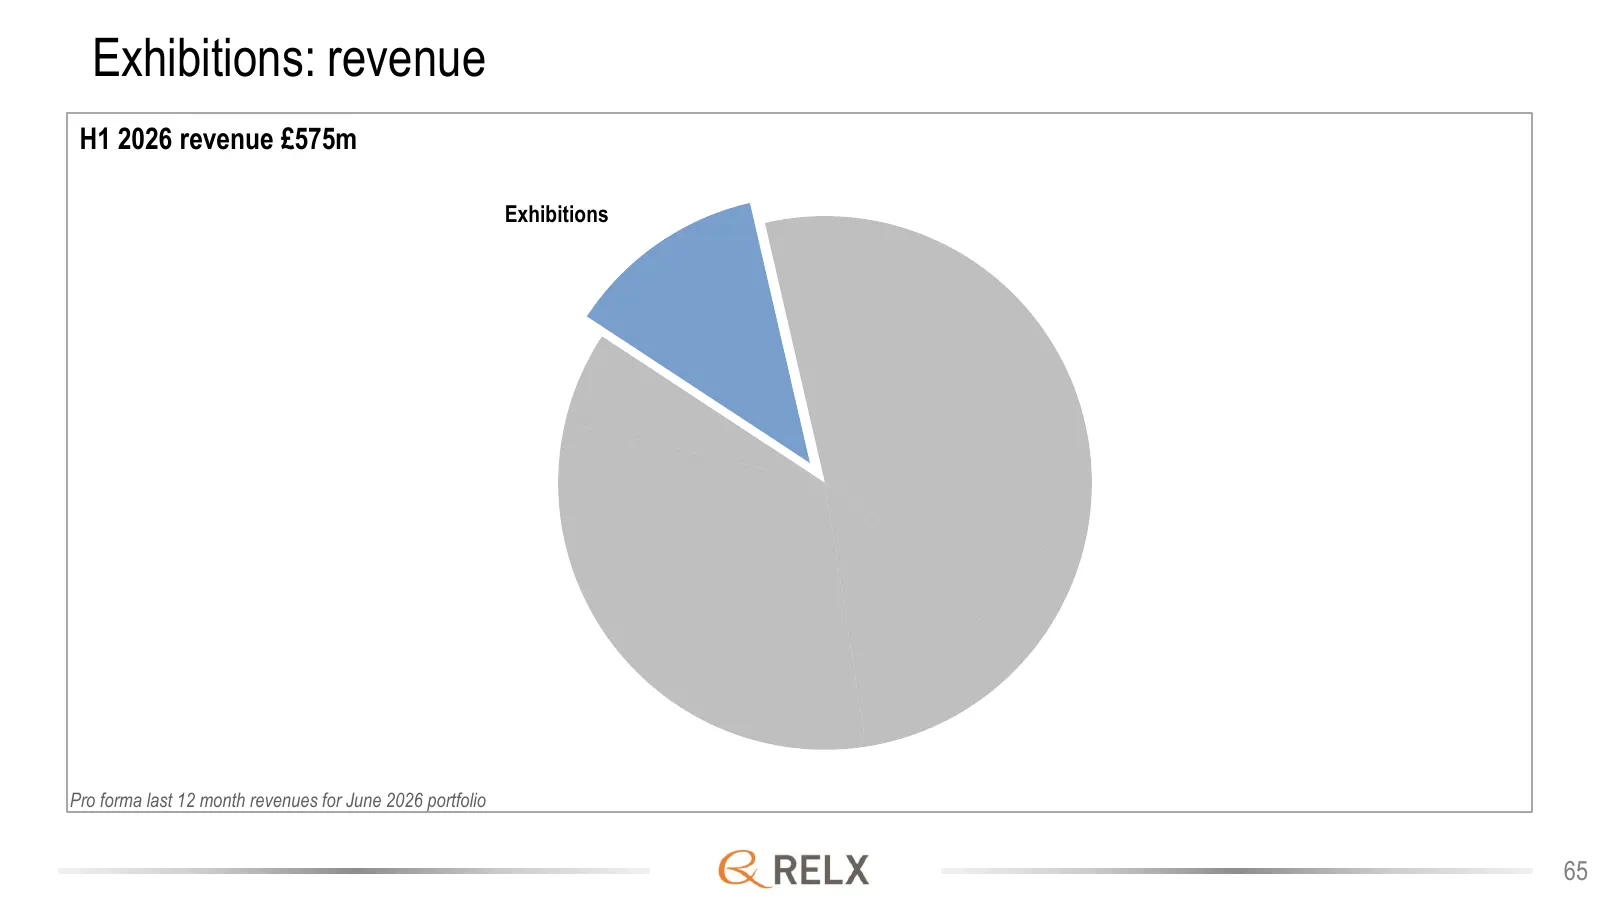
Exhibitions: revenue H1 2026 revenue £575m Exhibitions Pro forma last 12 month revenues for June 2026 portfolio 65
Slide 66: Exhibitions
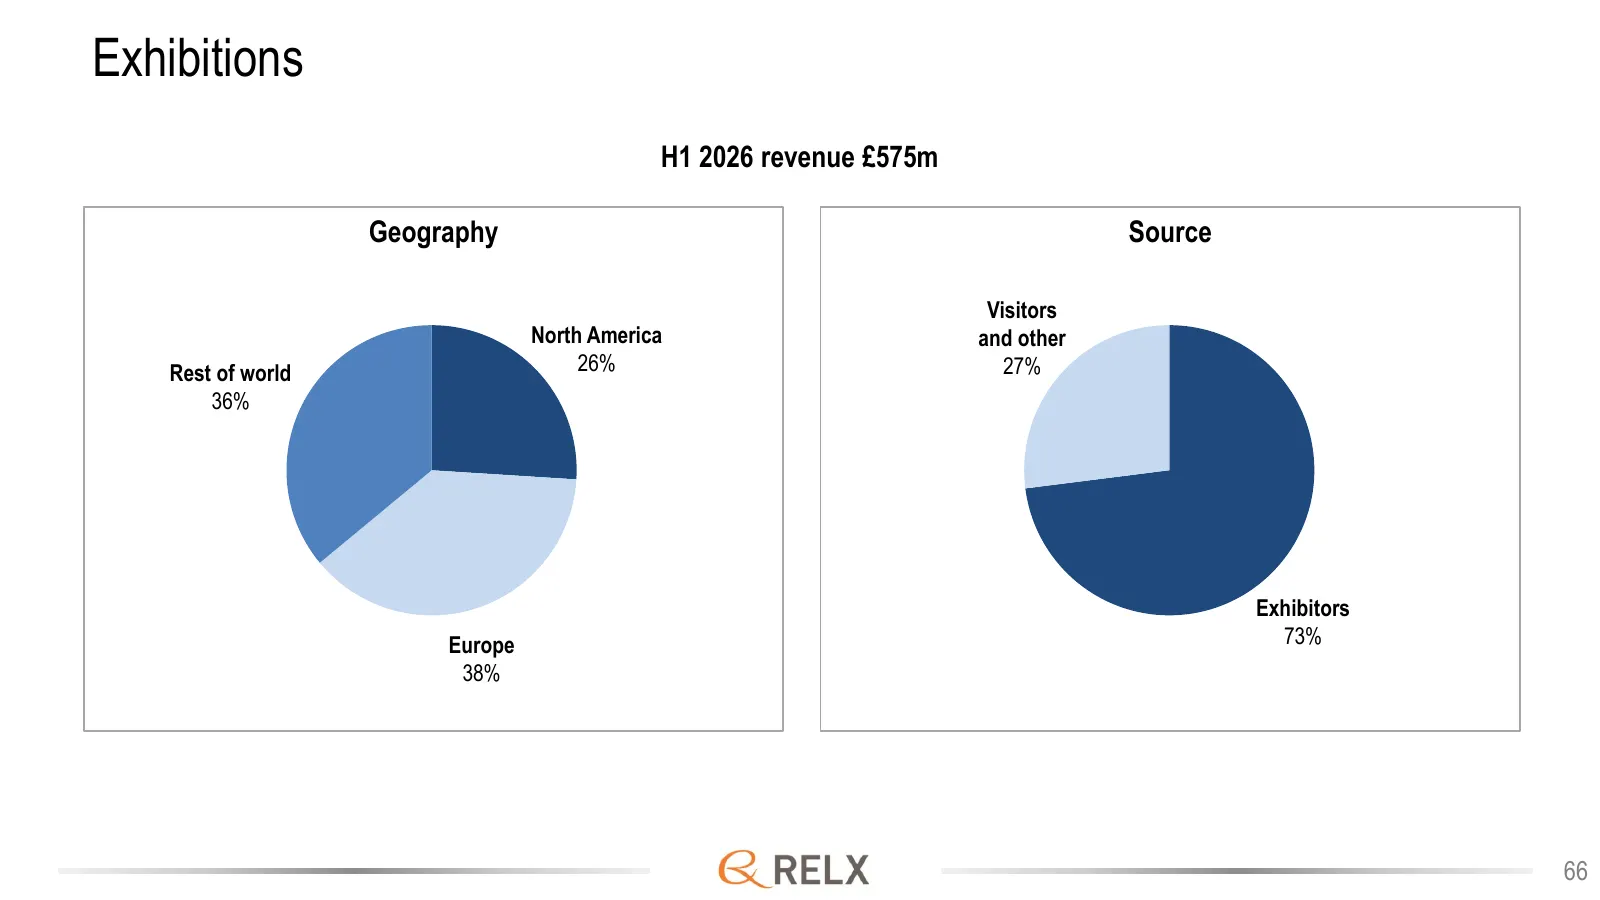
Exhibitions H1 2026 revenue £575m Geography Source Visitors North America and other Rest of world 26% 27% 36% Exhibitors Europe 73% 38% 66
Slide 67: Exhibitions
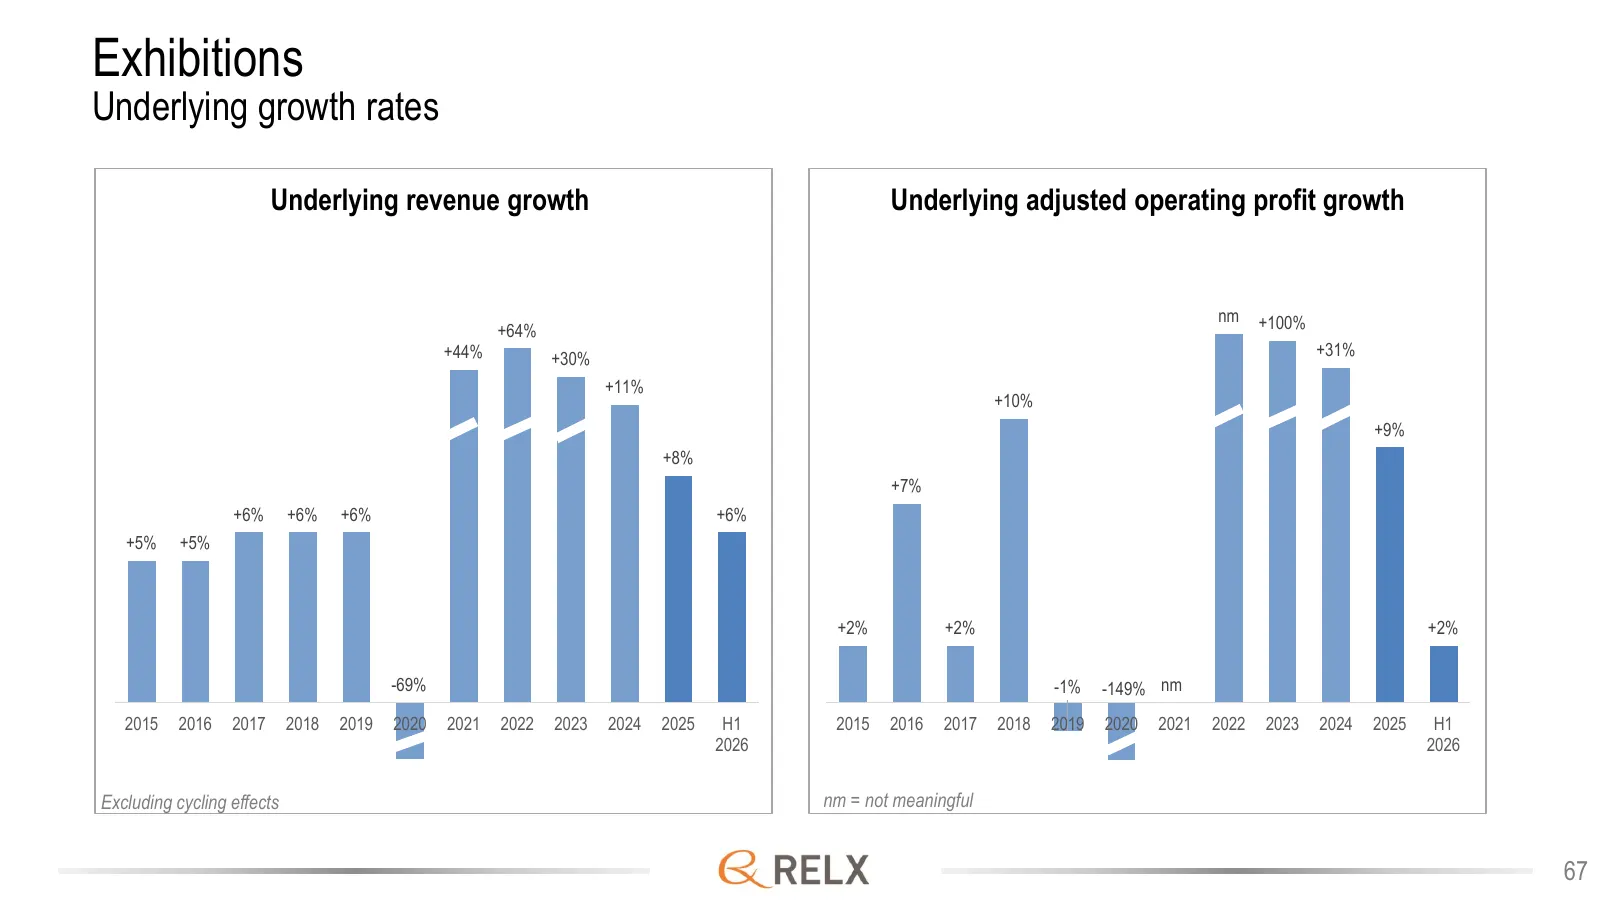
Exhibitions Underlying growth rates Underlying revenue growth Underlying adjusted operating profit growth nm +100% +64% +44% +30% +31% +11% +10% +9% +8% +7% +6% +6% +6% +6% +5% +5% +2% +2% +2% -69% -1% -149% nm 2015 2016 2017 2018 2019 2020 2021 2022 2023 2024 2025 H1 2015 2016 2017 2018 2019 2020 2

Slide 68: Corporate responsibility
Corporate responsibility 68
Slide 69: Purpose of the company
Purpose of the company • RELX is a global provider of information-based analytics and decision tools for professional and business customers, enabling them to make better decisions, get better results and be more productive. • Our purpose is to benefit society by developing products that help resear
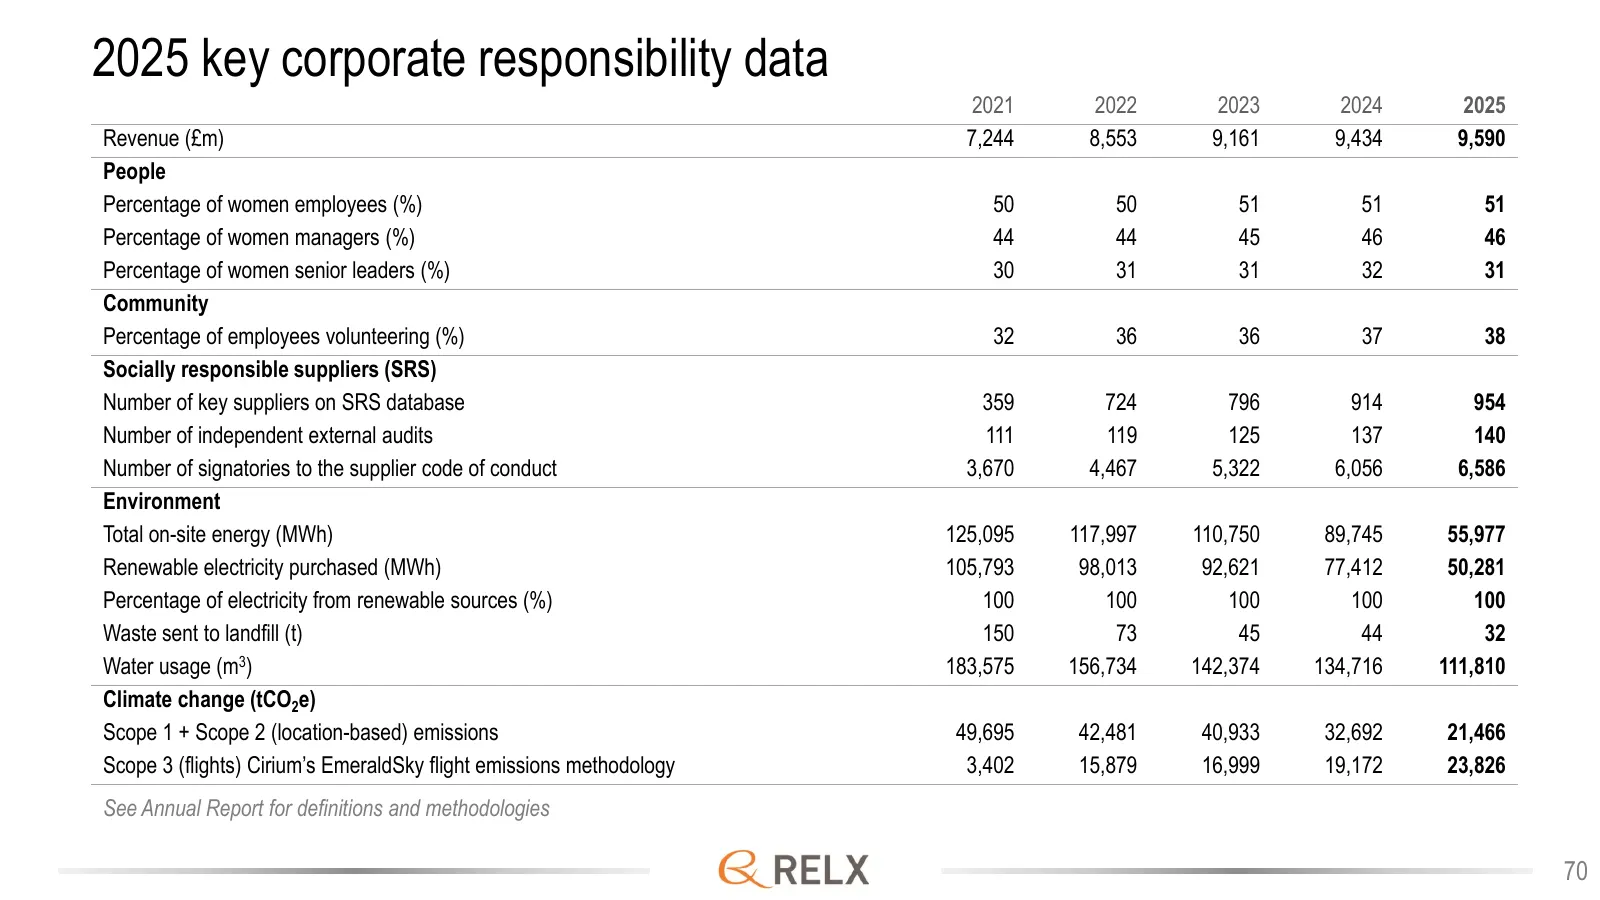
Slide 70: 2025 key corporate responsibility data
2025 key corporate responsibility data 2021 2022 2023 2024 2025 Revenue (£m) 7,244 8,553 9,161 9,434 9,590 People Percentage of women employees (%) 50 50 51 51 51 Percentage of women managers (%) 44 44 45 46 46 Percentage of women senior leaders (%) 30 31 31 32 31 Community Percentage of employees v
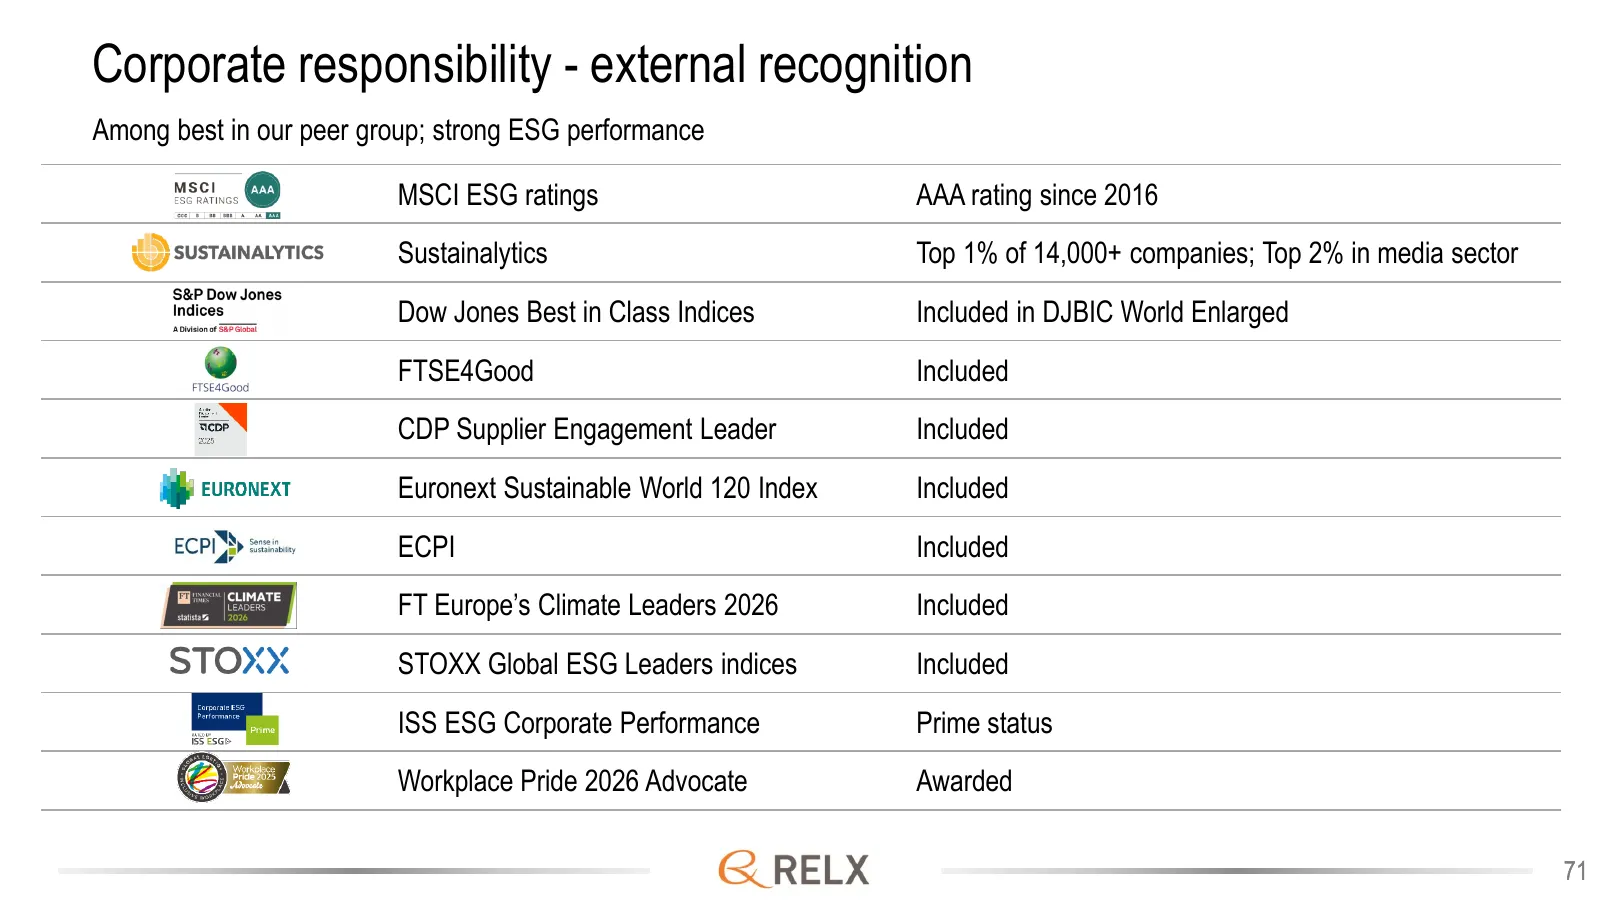
Slide 71: Corporate responsibility - external recognition
Corporate responsibility - external recognition Among best in our peer group; strong ESG performance MSCI ESG ratings AAA rating since 2016 Sustainalytics Top 1% of 14,000+ companies; Top 2% in media sector Dow Jones Best in Class Indices Included in DJBIC World Enlarged FTSE4Good Included CDP Suppl
Source: company website
More decks from Relx PLC
 Investor Presentation (September 2026)69 slides · September 2026
 H1 2026 Earnings Presentation30 slides · Jul 23, 2026
 FY2025 Earnings Presentation39 slides · Feb 12, 2026
 H1 2025 Earnings Presentation30 slides · Jul 24, 2025
 FY2024 Earnings Presentation20 slides · Feb 13, 2025
 H1 2024 Earnings Presentation32 slides · Oct 24, 2024