McBride plc · LSE:MCB
McBride — H1 2007-08 Earnings Presentation
17 slides from McBride's earnings presentation, February 2008
Slide 1: McBride plc 2007-08 interim results presentation
McBride plc 2007-08 interim results presentation February 2008
Slide 2: Summary
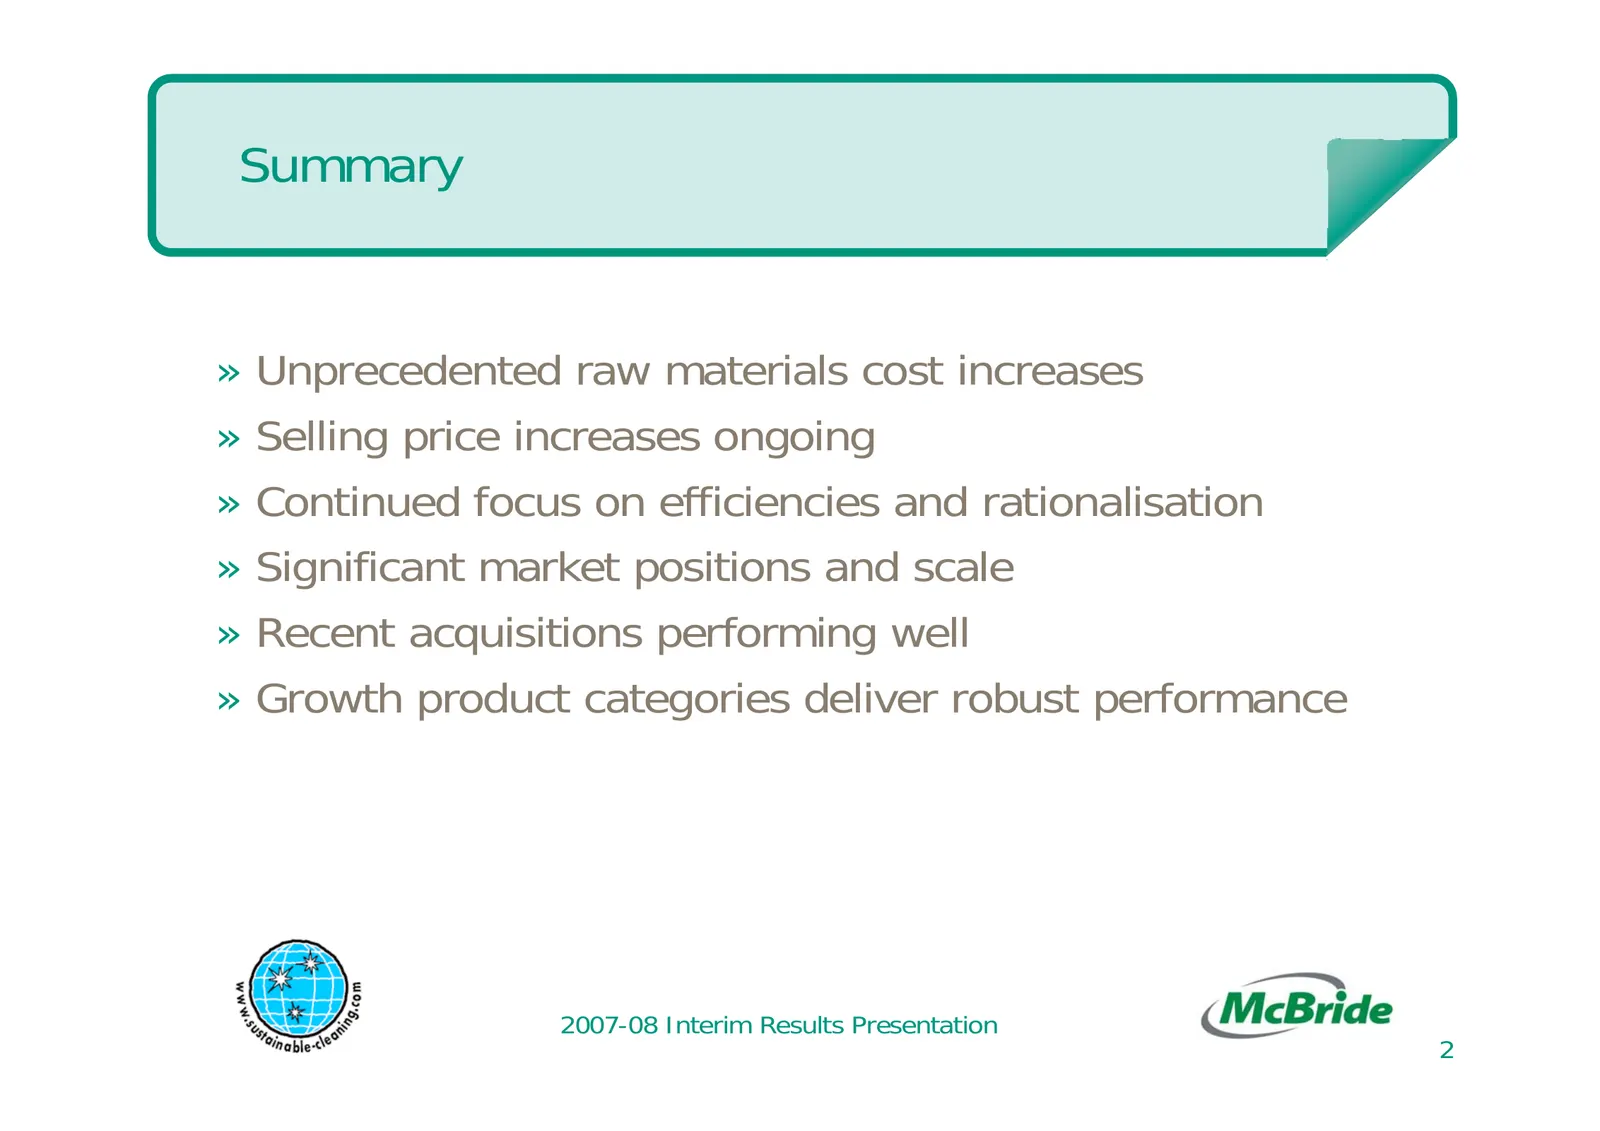
Summary » Unprecedented raw materials cost increases » Selling price increases ongoing » Continued focus on efficiencies and rationalisation » Significant market positions and scale » Recent acquisitions performing well » Growth product categories deliver robust performance 2007-08 Interim Results P

Slide 3: Financial review
Financial review
Slide 4: Financial headlines
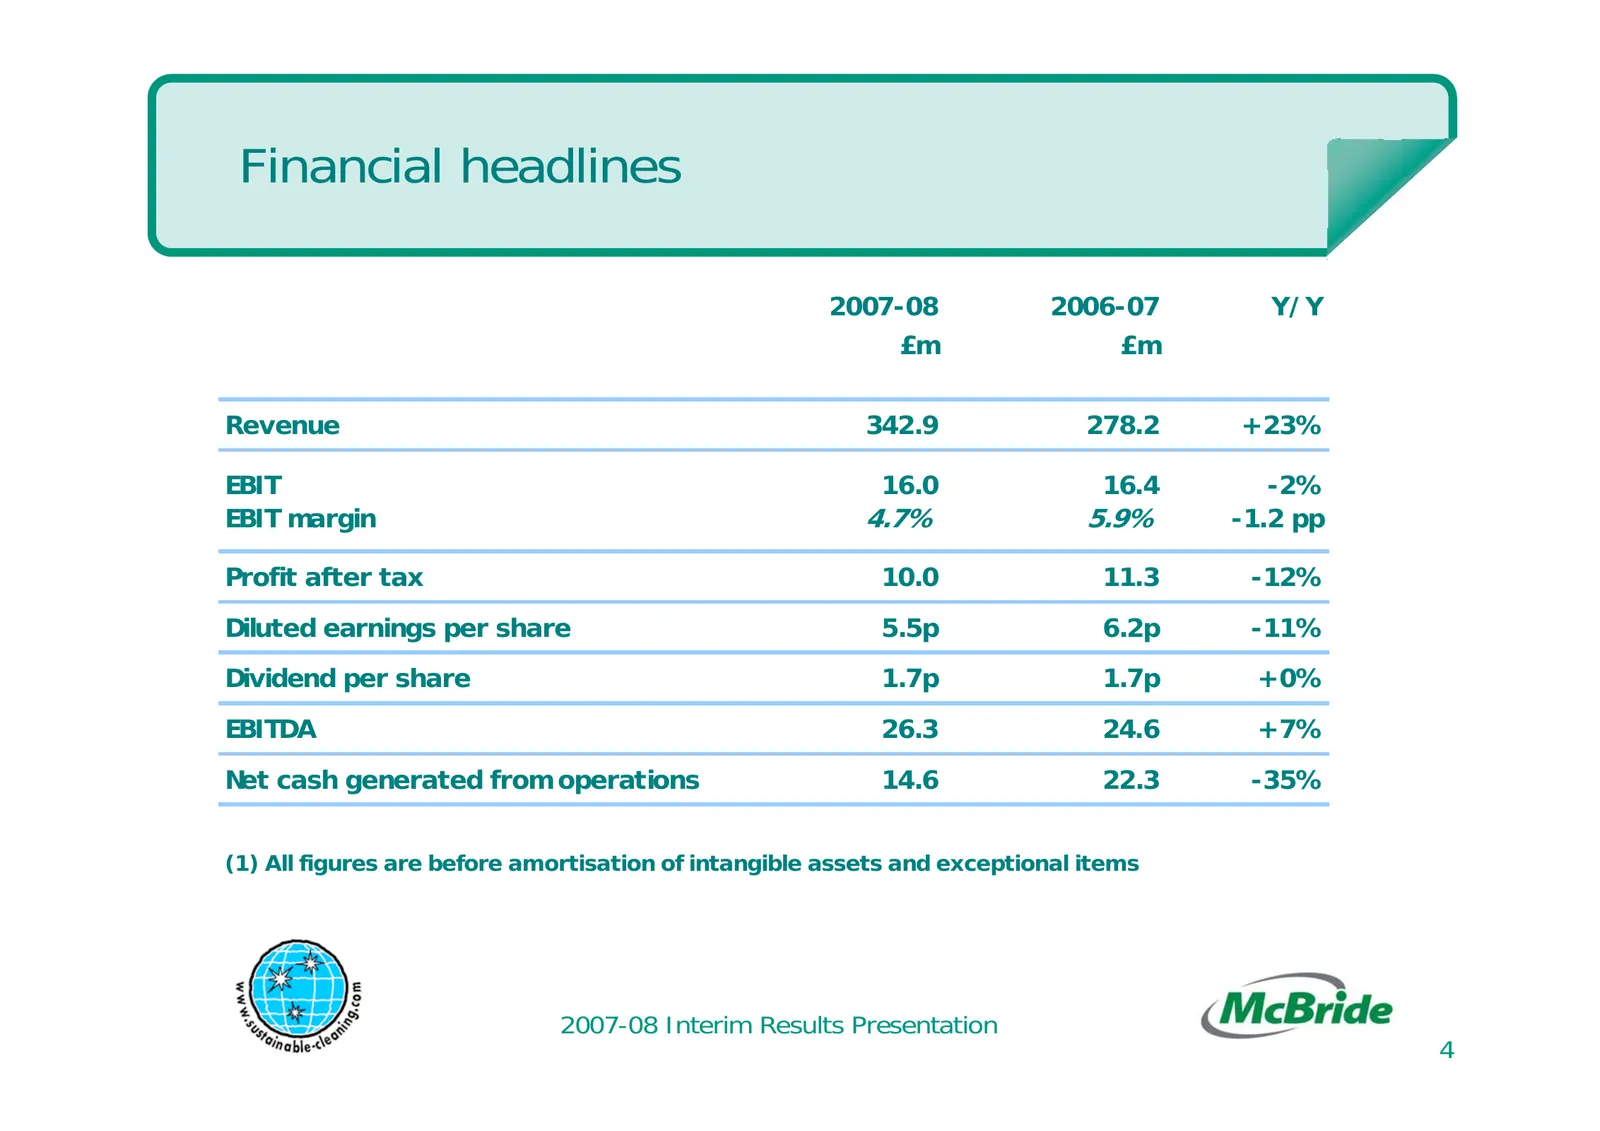
Financial headlines 2007-08 2006-07 Y/Y £m £m Revenue 342.9 278.2 +23% EBIT 16.0 16.4 -2% EBIT margin 4.7% 5.9% -1.2 pp Profit after tax 10.0 11.3 -12% Diluted earnings per share 5.5p 6.2p -11% Dividend per share 1.7p 1.7p +0% EBITDA 26.3 24.6 +7% Net cash generated from operations 14.6 22.3 -35% (1
Slide 5: Revenue bridge H1 2006-07 to H1 2007-08
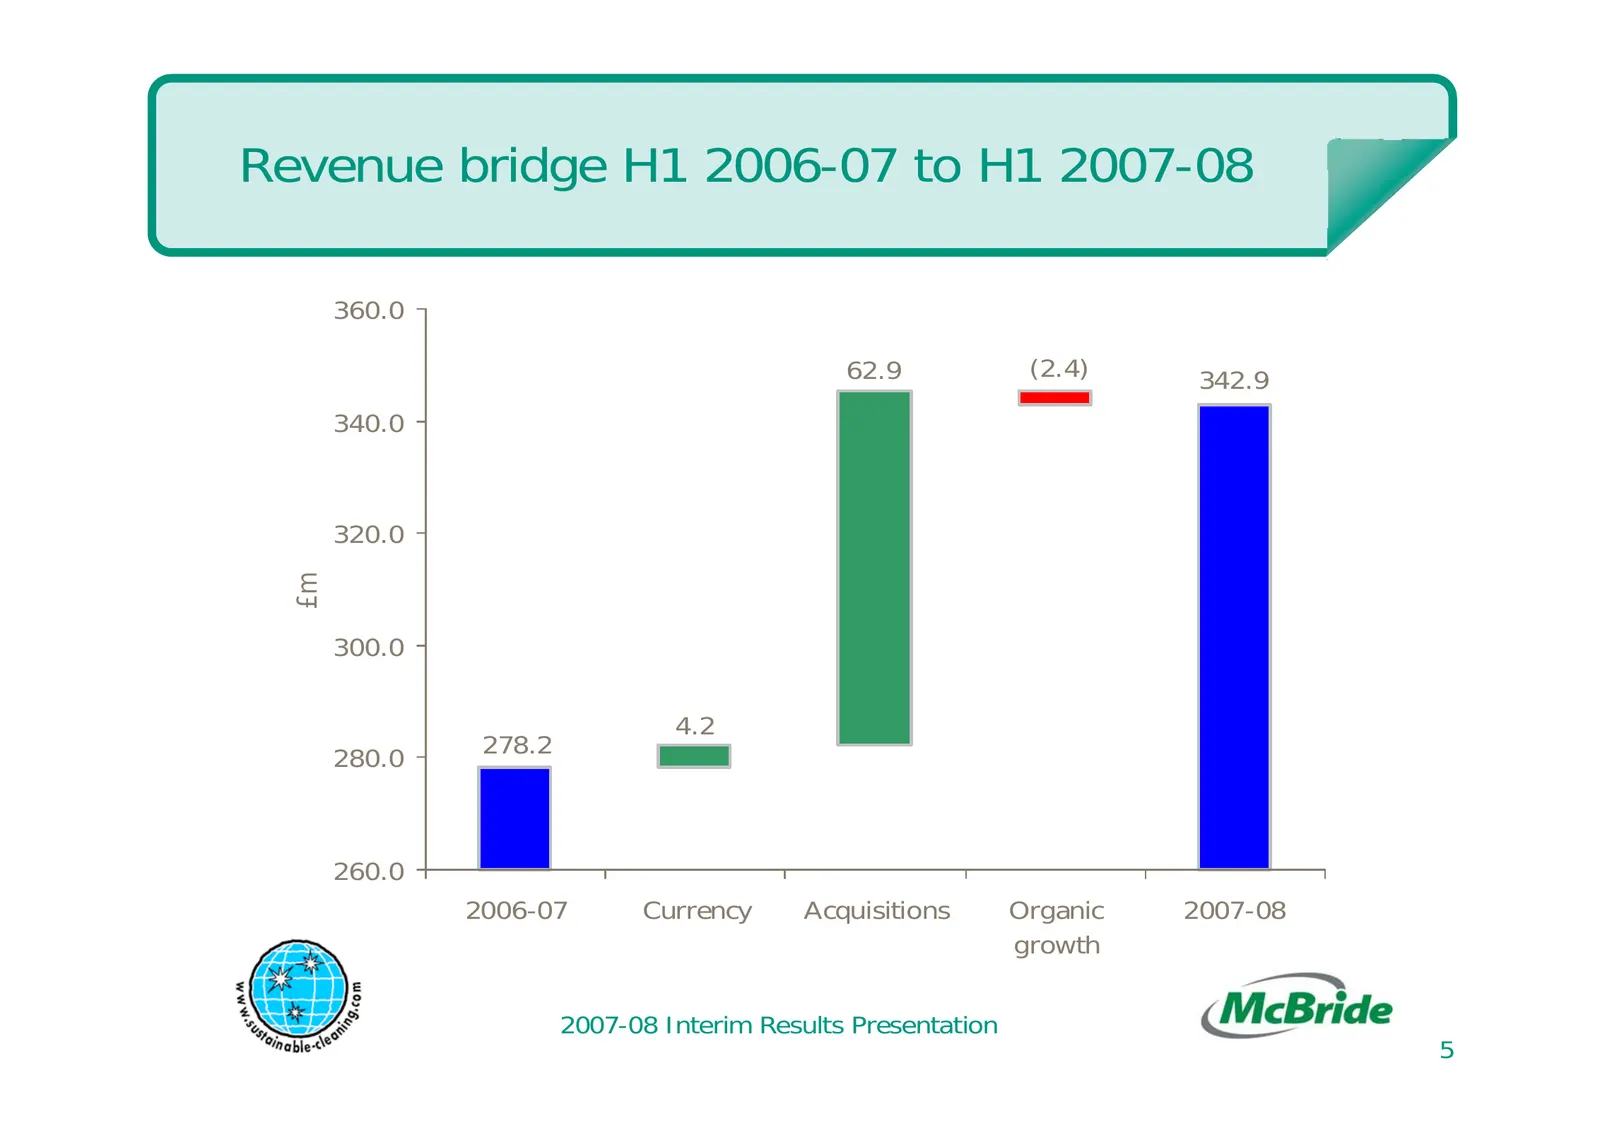
Revenue bridge H1 2006-07 to H1 2007-08 360.0 62.9 (2.4) 342.9 340.0 320.0 £m 300.0 4.2 278.2 280.0 260.0 2006-07 Currency Acquisitions Organic 2007-08 growth 2007-08 Interim Results Presentation 5
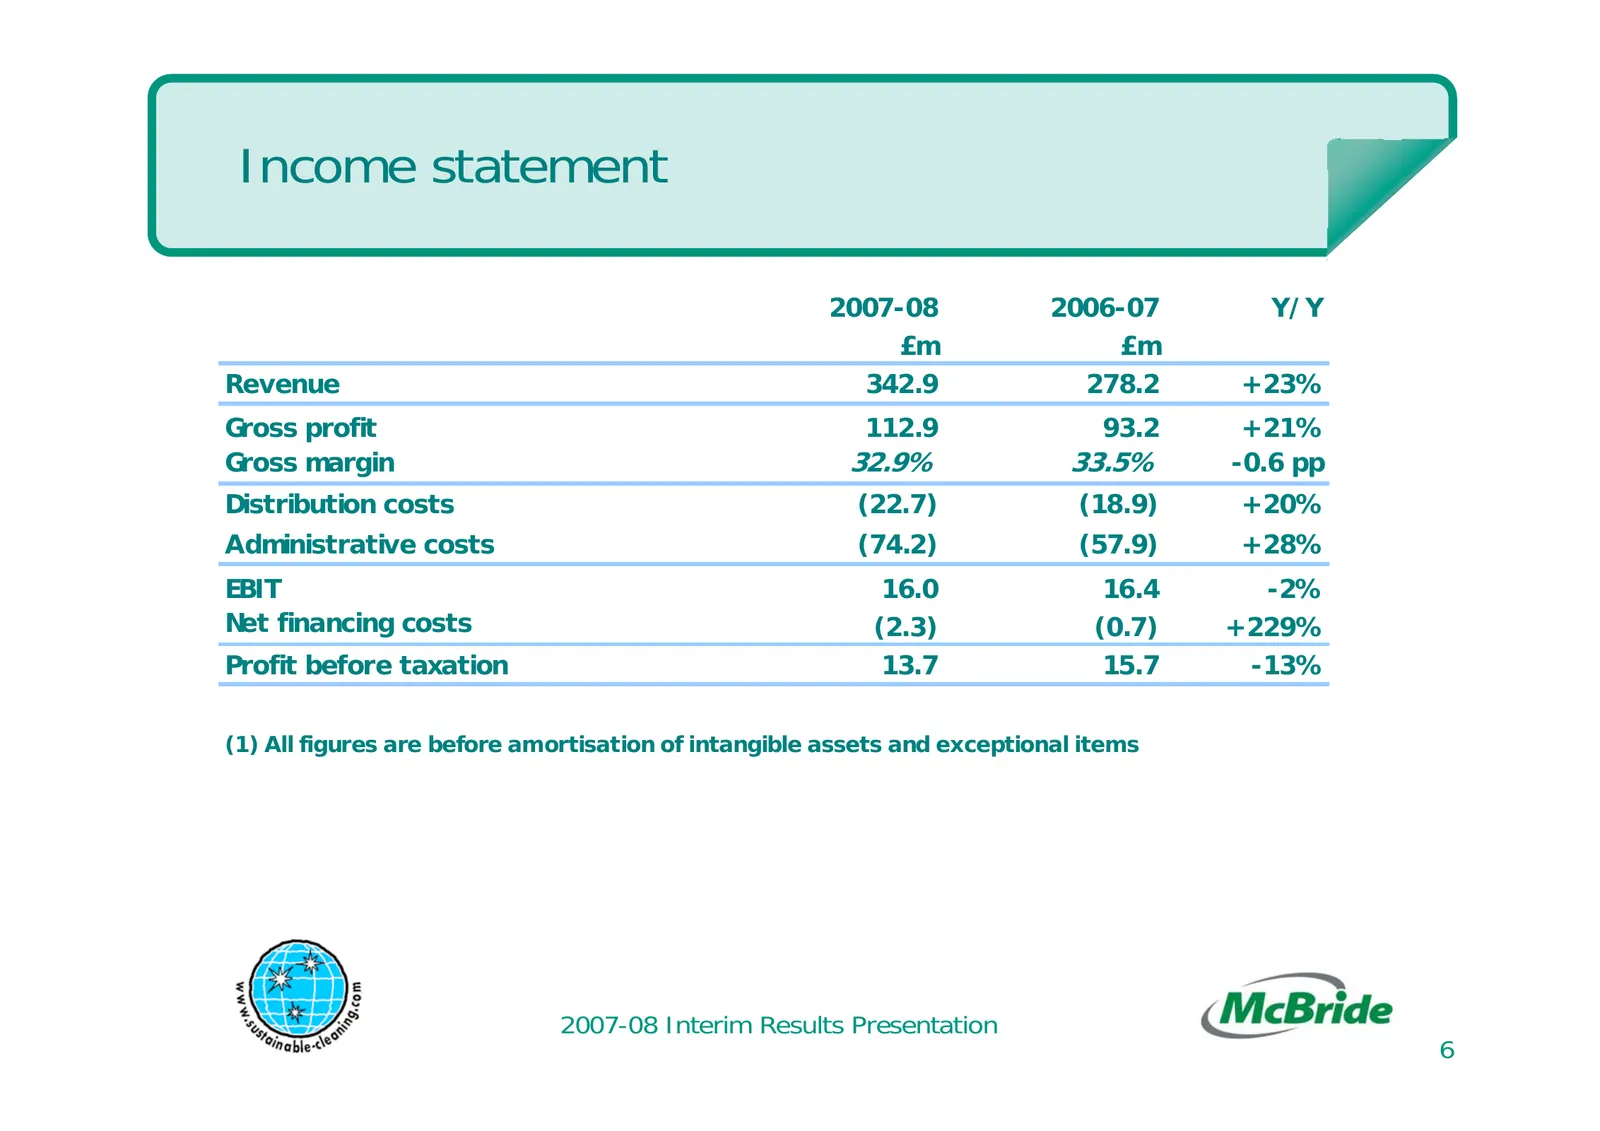
Slide 6: Income statement
Income statement 2007-08 2006-07 Y/Y £m £m Revenue 342.9 278.2 +23% Gross profit 112.9 93.2 +21% Gross margin 32.9% 33.5% -0.6 pp Distribution costs (22.7) (18.9) +20% Administrative costs (74.2) (57.9) +28% EBIT 16.0 16.4 -2% Net financing costs (2.3) (0.7) +229% Profit before taxation 13.7 15.7 -1
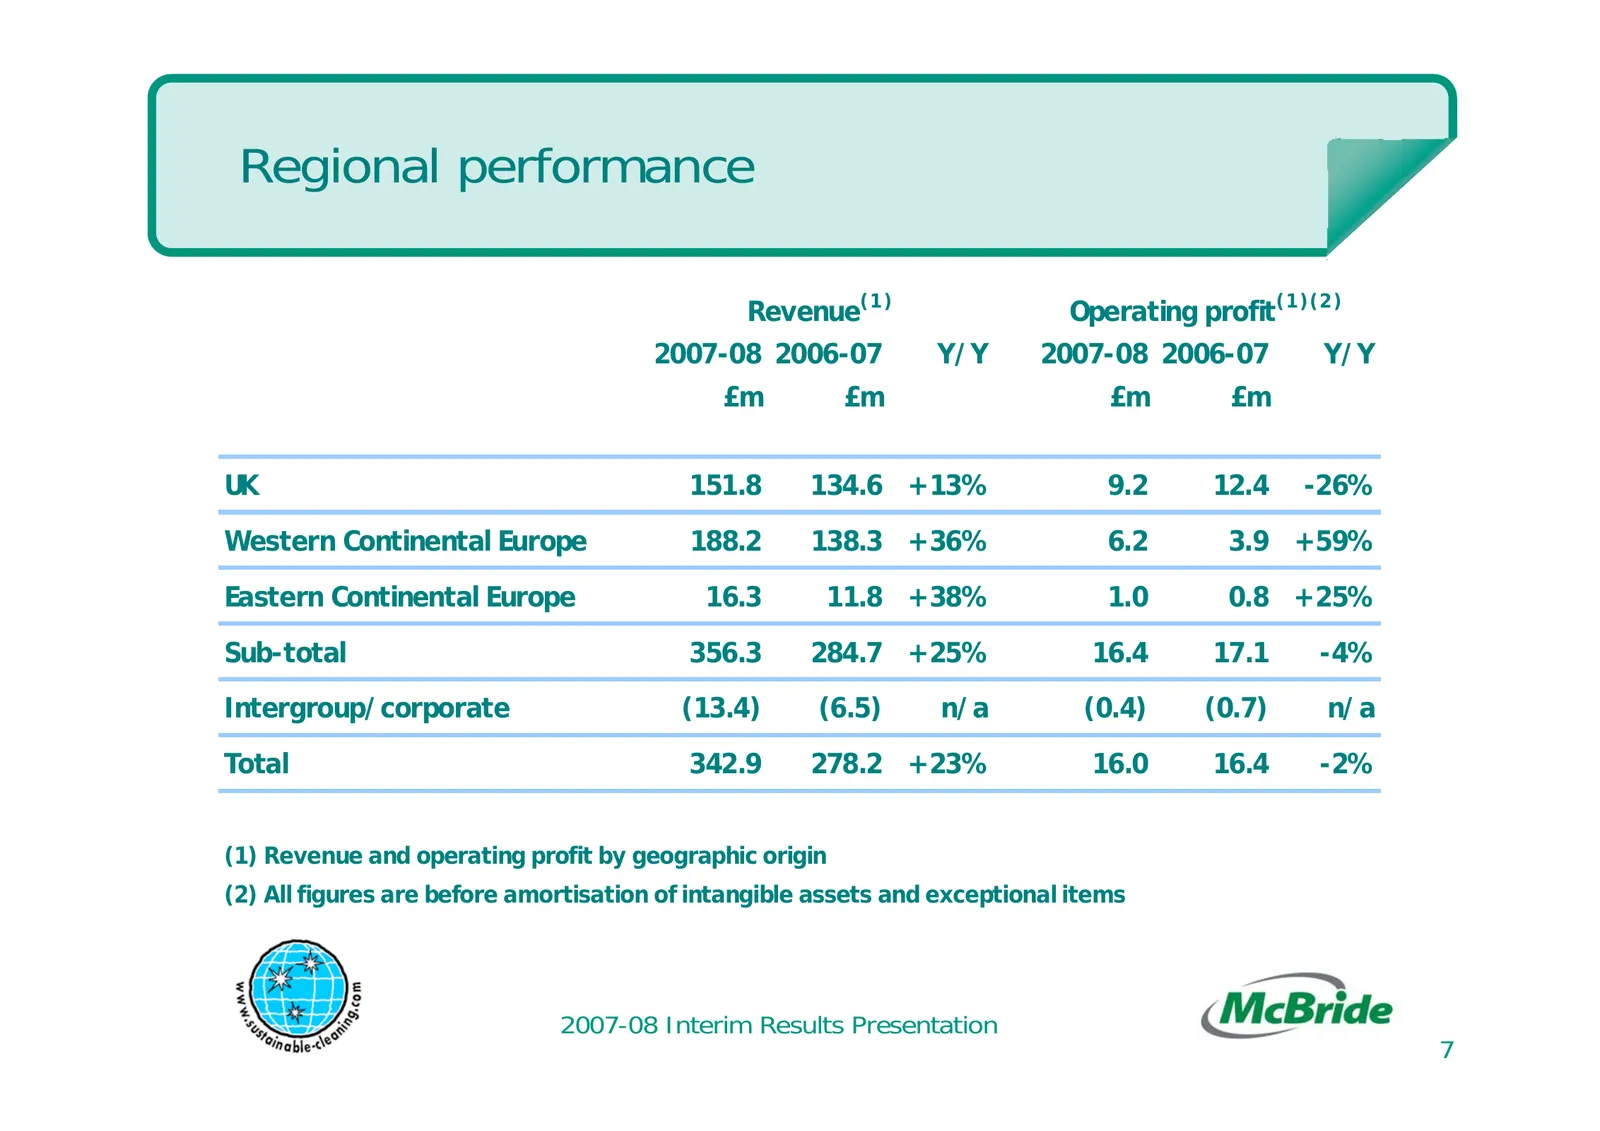
Slide 7: Regional performance
Regional performance Revenue(1 ) Operating profit (1 )(2 ) 2007-08 2006-07 Y/Y 2007-08 2006-07 Y/Y £m £m £m £m UK 151.8 134.6 +13% 9.2 12.4 -26% Western Continental Europe 188.2 138.3 +36% 6.2 3.9 +59% Eastern Continental Europe 16.3 11.8 +38% 1.0 0.8 +25% Sub-total 356.3 284.7 +25% 16.4 17.1 -4% In
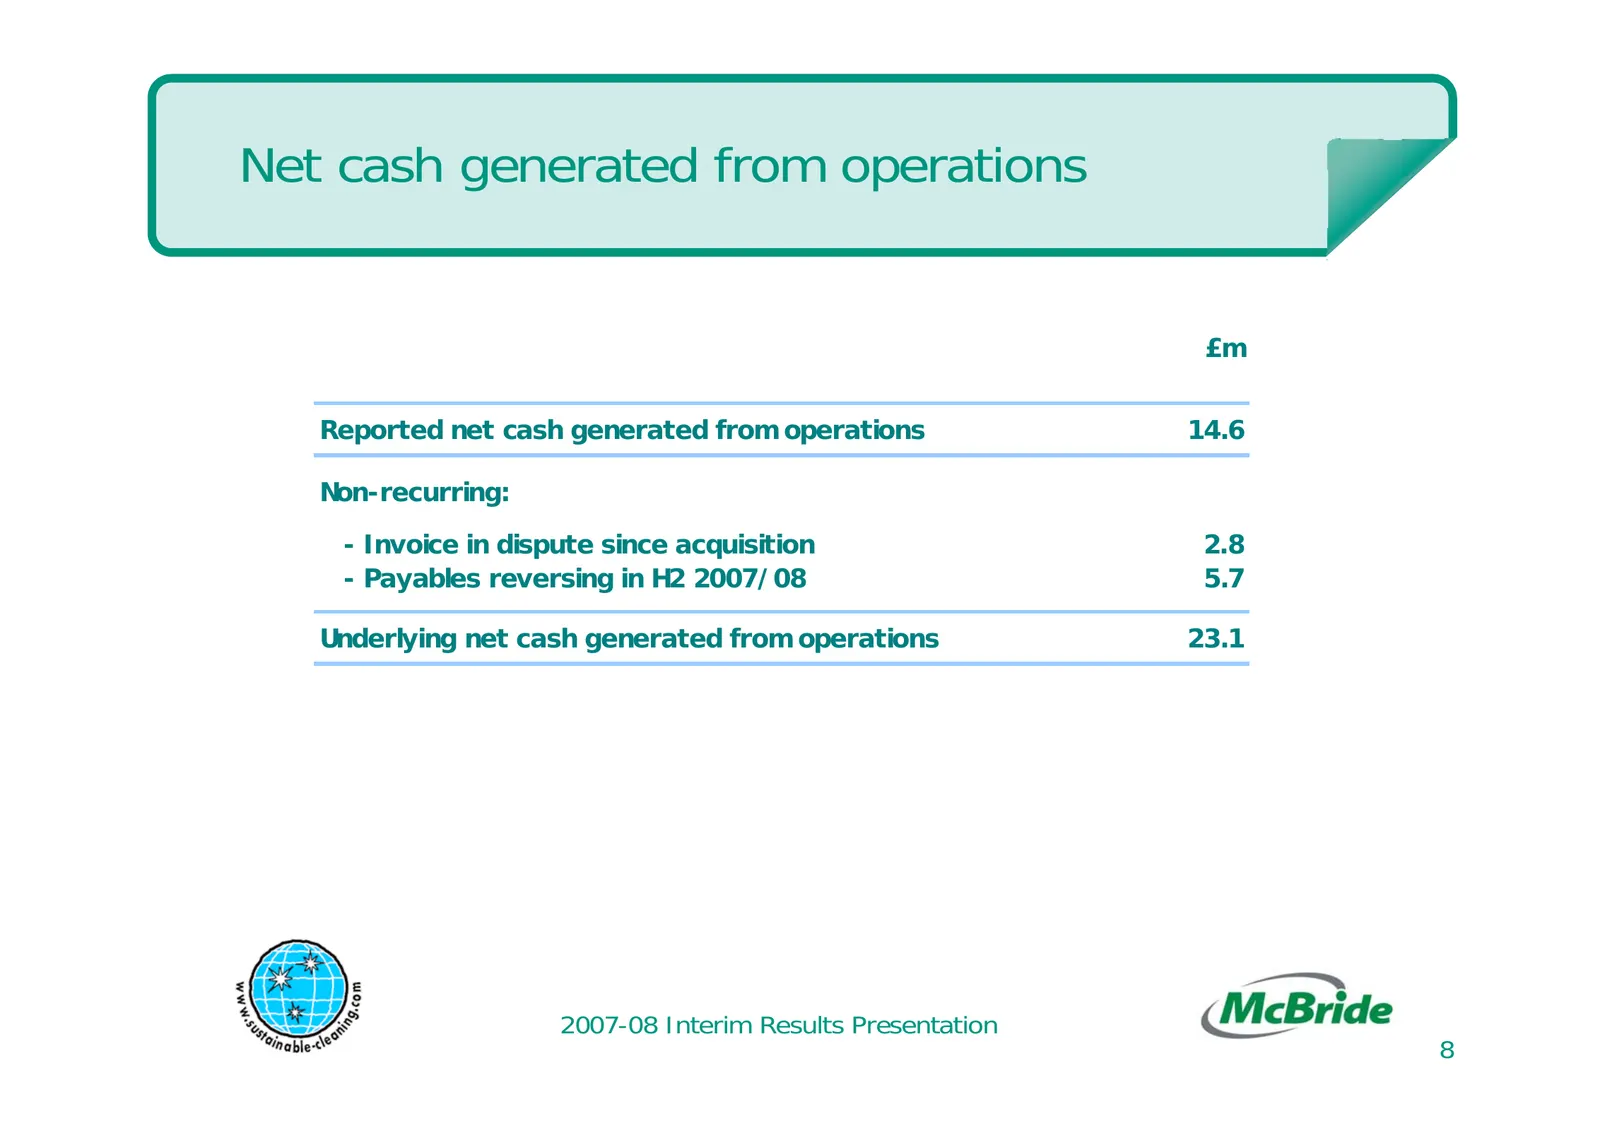
Slide 8: Net cash generated from operations
Net cash generated from operations £m Reported net cash generated from operations 14.6 Non-recurring: - Invoice in dispute since acquisition 2.8 - Payables reversing in H2 2007/08 5.7 Underlying net cash generated from operations 23.1 2007-08 Interim Results Presentation 8
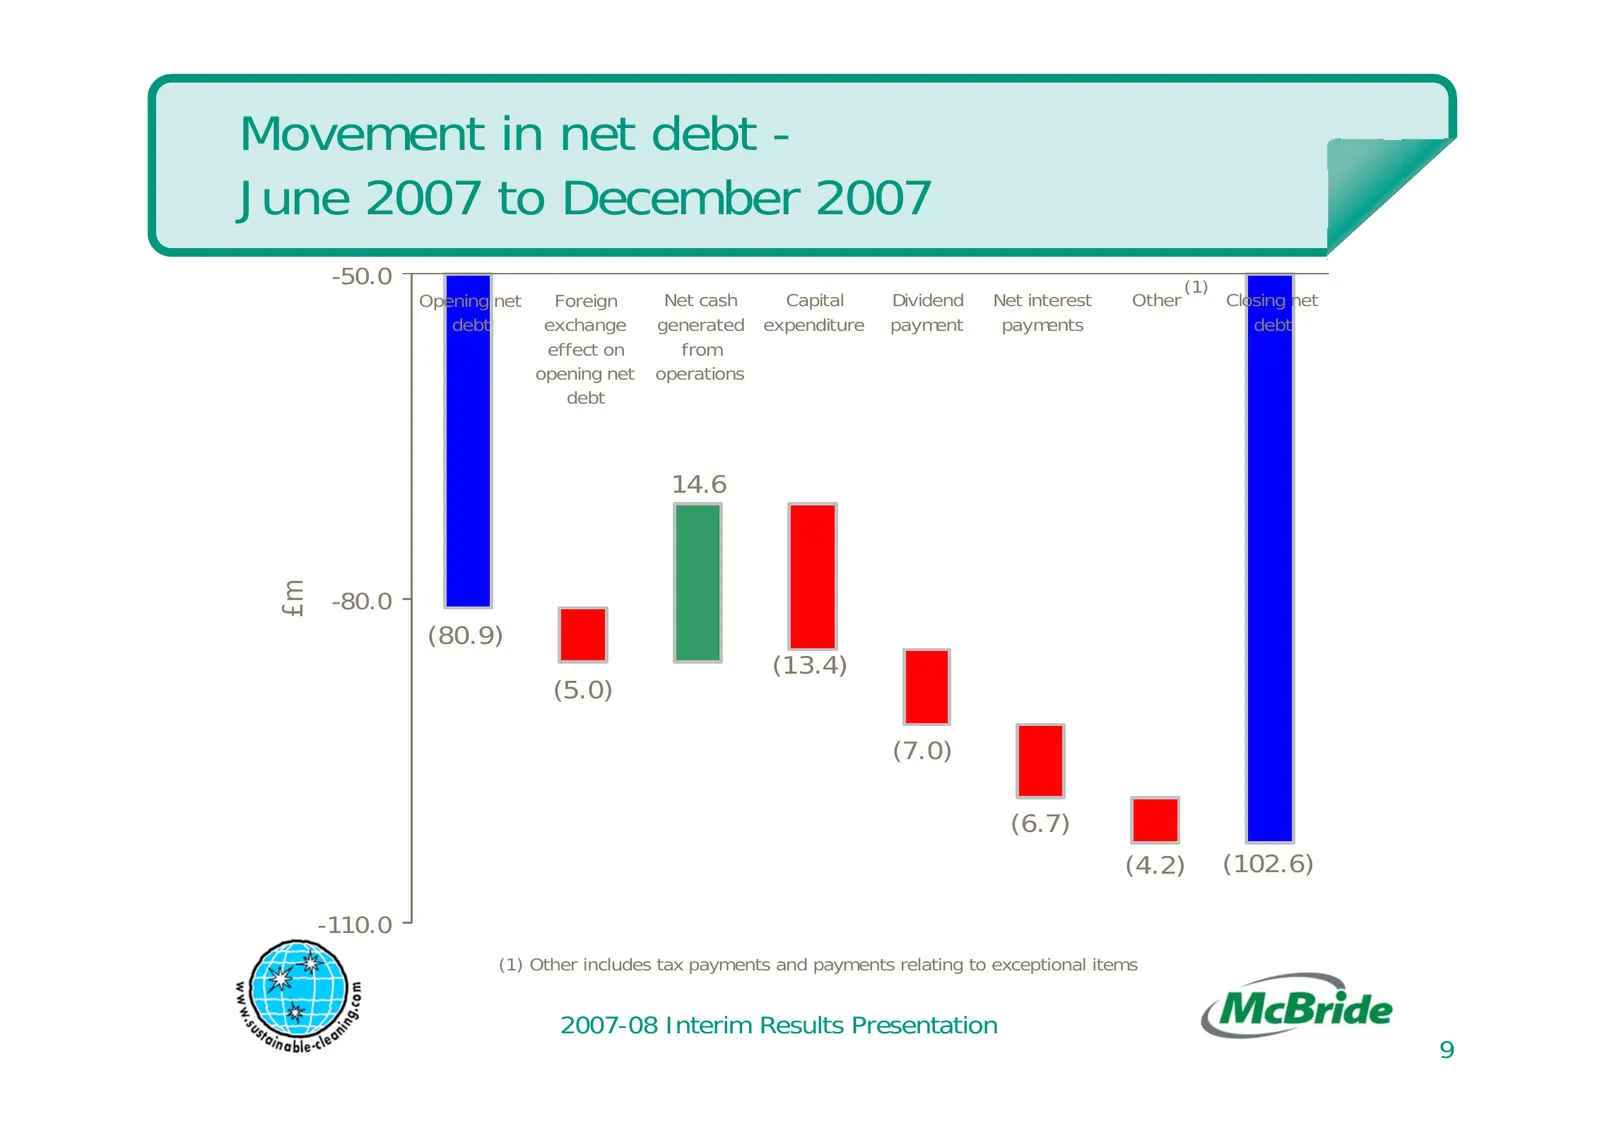
Slide 9: Movement in net debt - June 2007 to December 2007
Movement in net debt - June 2007 to December 2007 -50.0 (1) Opening net Foreign Net cash Capital Dividend Net interest Other Closing net debt exchange generated expenditure payment payments debt effect on from opening net operations debt 14.6 £m -80.0 (80.9) (13.4) (5.0) (7.0) (6.7) (4.2) (102.6) -1

Slide 10: Business review
Business review
Slide 11: Raw material cost environment
Raw material cost environment » McBride has around £400m annual raw materials spend » Unprecedented increase in raw material costs towards end of 2007 affecting whole industry » Impacted board, phosphates, fatty acids and surfactants » Upward cost pressure over previous 3 years relatively gradual an
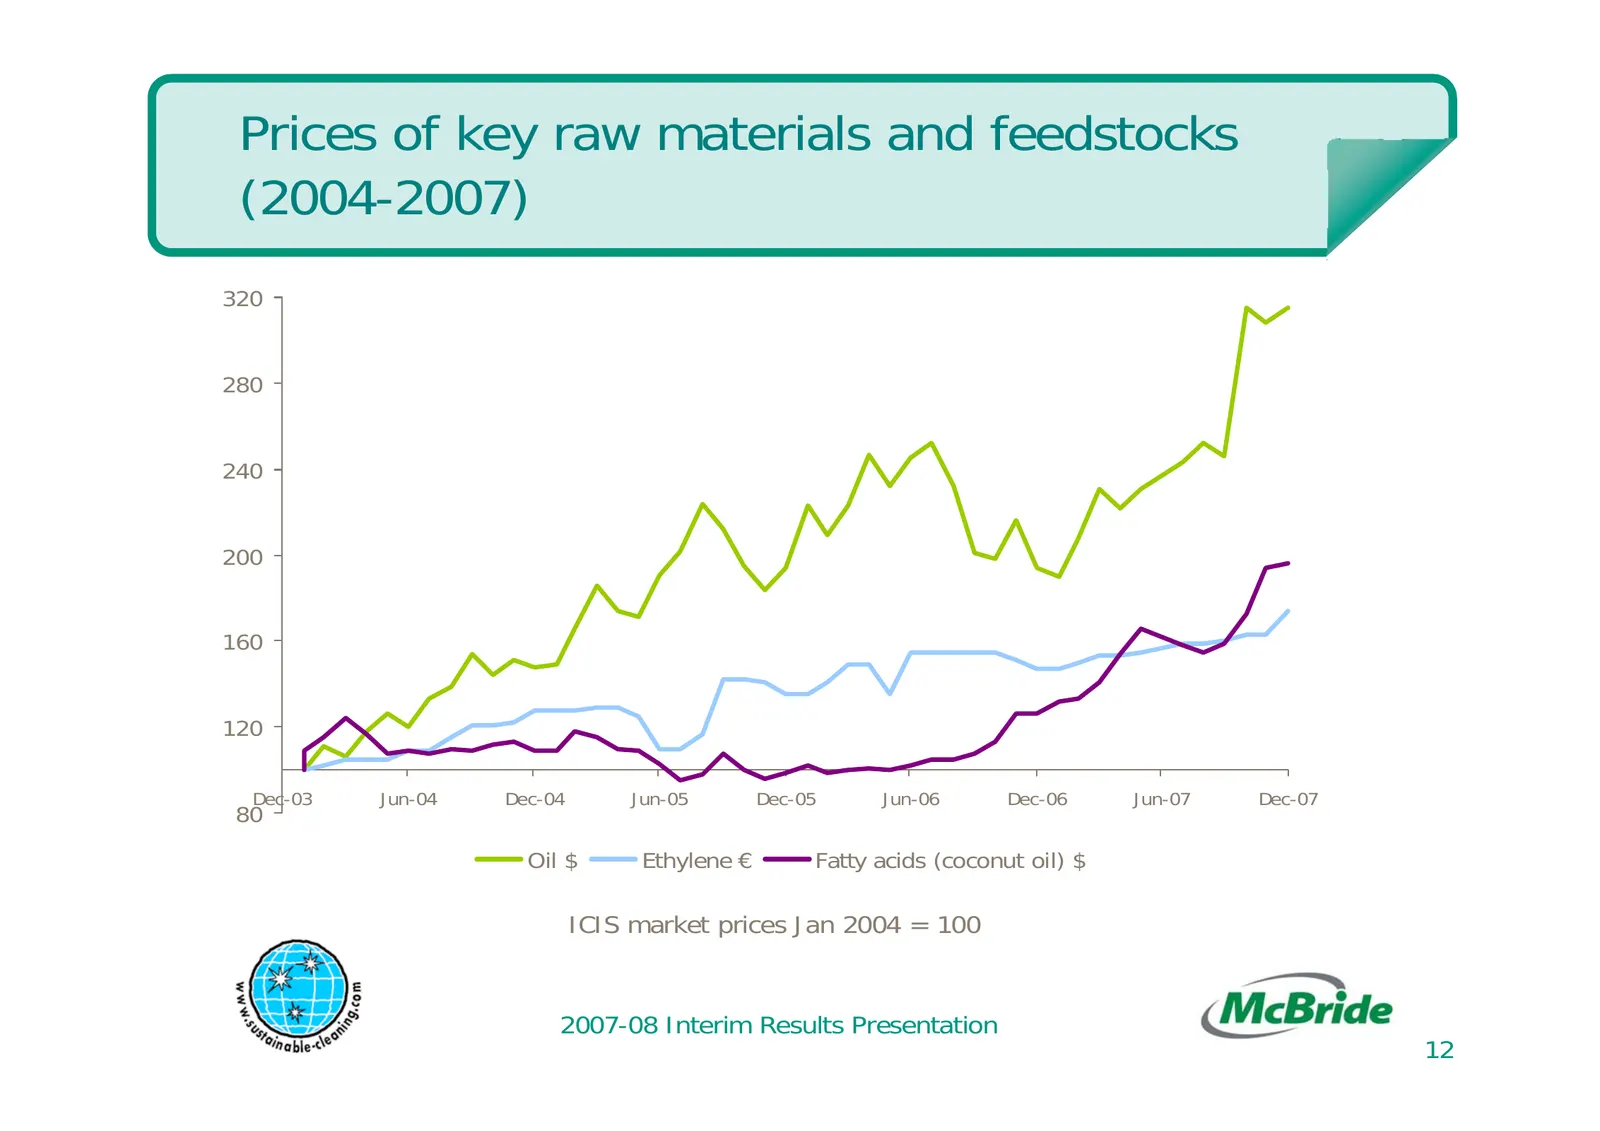
Slide 12: Prices of key raw materials and feedstocks
Prices of key raw materials and feedstocks (2004-2007) 320 280 240 200 160 120 Dec-03 Jun-04 Dec-04 Jun-05 Dec-05 Jun-06 Dec-06 Jun-07 Dec-07 80 Oil $ Ethylene € Fatty acids (coconut oil) $ ICIS market prices Jan 2004 = 100 2007-08 Interim Results Presentation 12
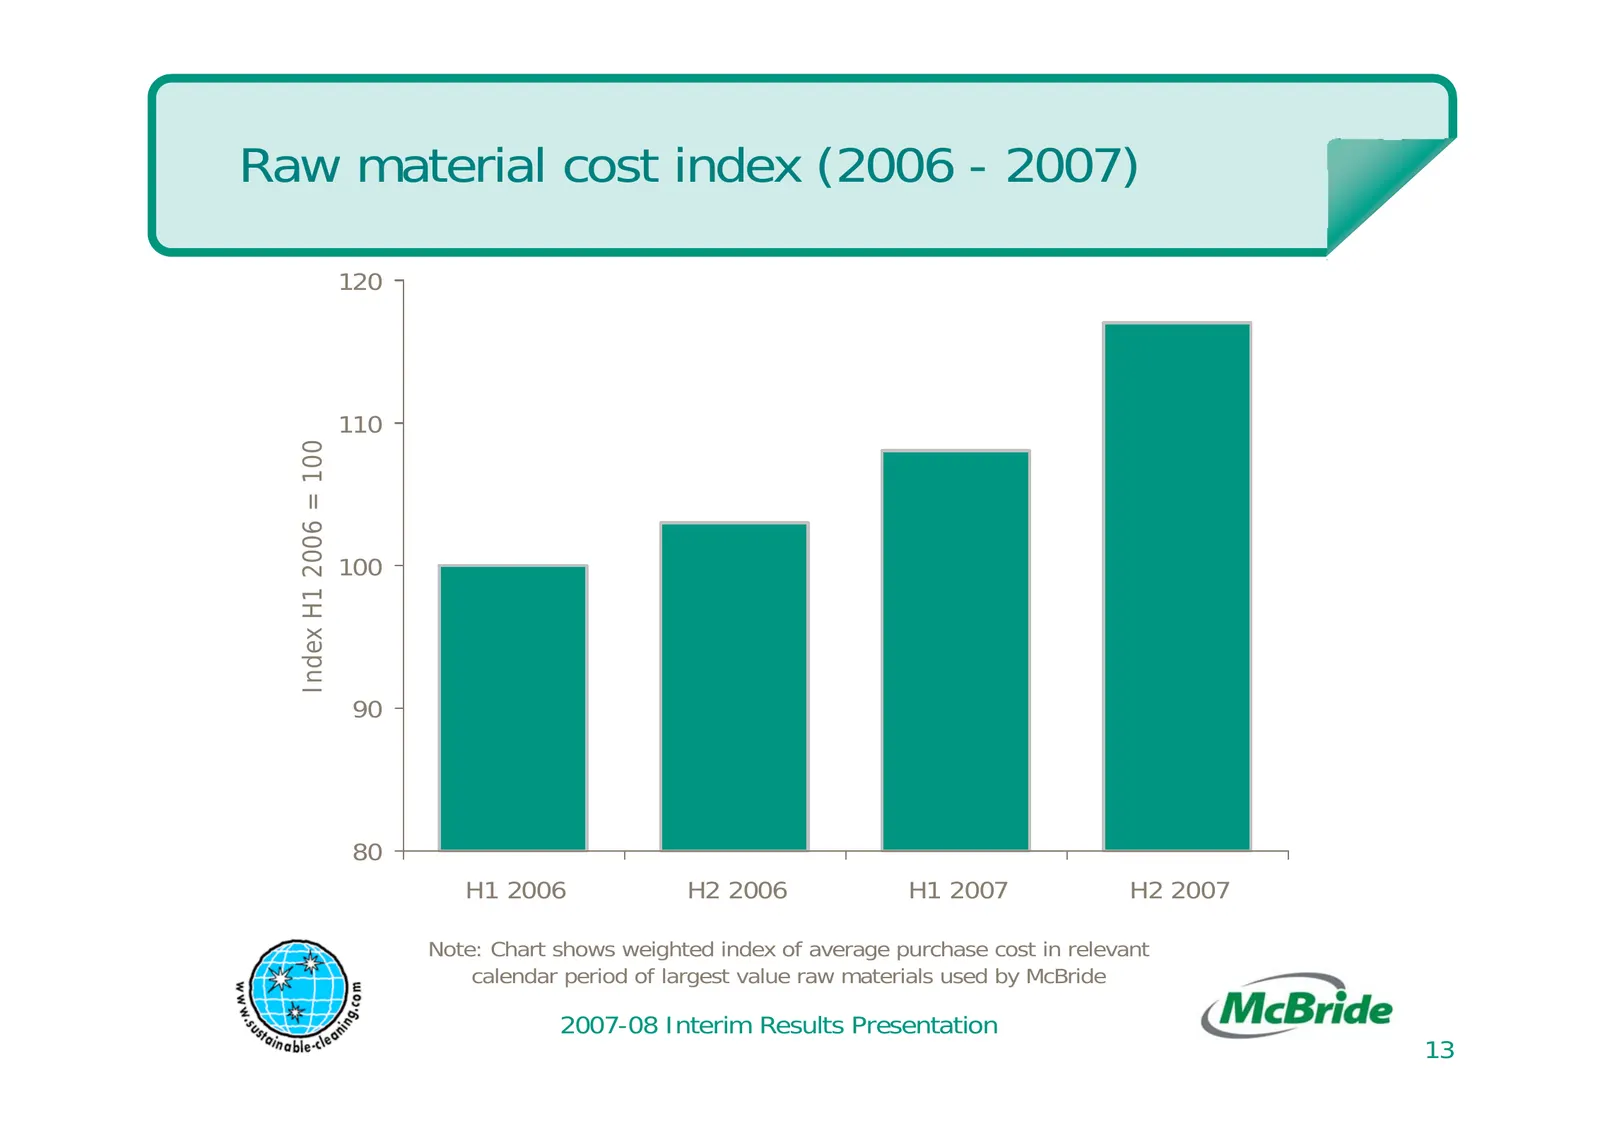
Slide 13: Raw material cost index (2006 - 2007)
Raw material cost index (2006 - 2007) 120 110 Index H1 2006 = 100 100 90 80 H1 2006 H2 2006 H1 2007 H2 2007 Note: Chart shows weighted index of average purchase cost in relevant calendar period of largest value raw materials used by McBride 2007-08 Interim Results Presentation 13
Slide 14: UK business review
UK business review » Personal care remains robust » Recent acquisitions performed well » Total revenue up 13% » Operating profit declined 26% reflecting raw materials increases and cost inflation » Focus on price increases » Improving operating efficiencies » Reinforcing product development 2007-08
Slide 15: Western Continental Europe business review
Western Continental Europe business review » Household products growing well in Italy and Spain » Personal care delivered strong organic growth » Recent acquisitions performed well » Total revenue up 36% » Operating profit up 59% with good contribution from acquisitions offsetting lower profits in c
Slide 16: Eastern Continental Europe business review
Eastern Continental Europe business review » Buoyant markets continue across region » Strong revenue growth achieved in both household and personal care » Total revenue up 38% » Operating profit up 25% » Broadening geographic footprint » More insulated from raw materials price rises due to growth an
Slide 17: Conclusion
Conclusion » Immediate business priorities: - mitigate raw materials cost increases through price increases and efficiencies - progress in both areas - ensure optimum asset base for future development » Existing strategy remains sound: - attractive growth product categories - category and new produc
Source: Internet Archive copy of mcbride.co.uk
More decks from McBride plc
 FY2026 Earnings Presentation28 slides · Sep 15, 2026
 H1 FY26 Earnings Presentation22 slides · Feb 26, 2026
 FY2025 Earnings Presentation23 slides · Sep 18, 2025
 H1 FY2025 Earnings Presentation30 slides · Feb 25, 2025
 FY2024 Earnings Presentation30 slides · Sep 17, 2024
 Investor Day (March 2024)65 slides · Mar 13, 2024