Mako Mining Corp. · TSXV:MKO
Mako Mining — Investor Presentation (February 2026)
51 slides from Mako Mining's investor presentation, February 2026
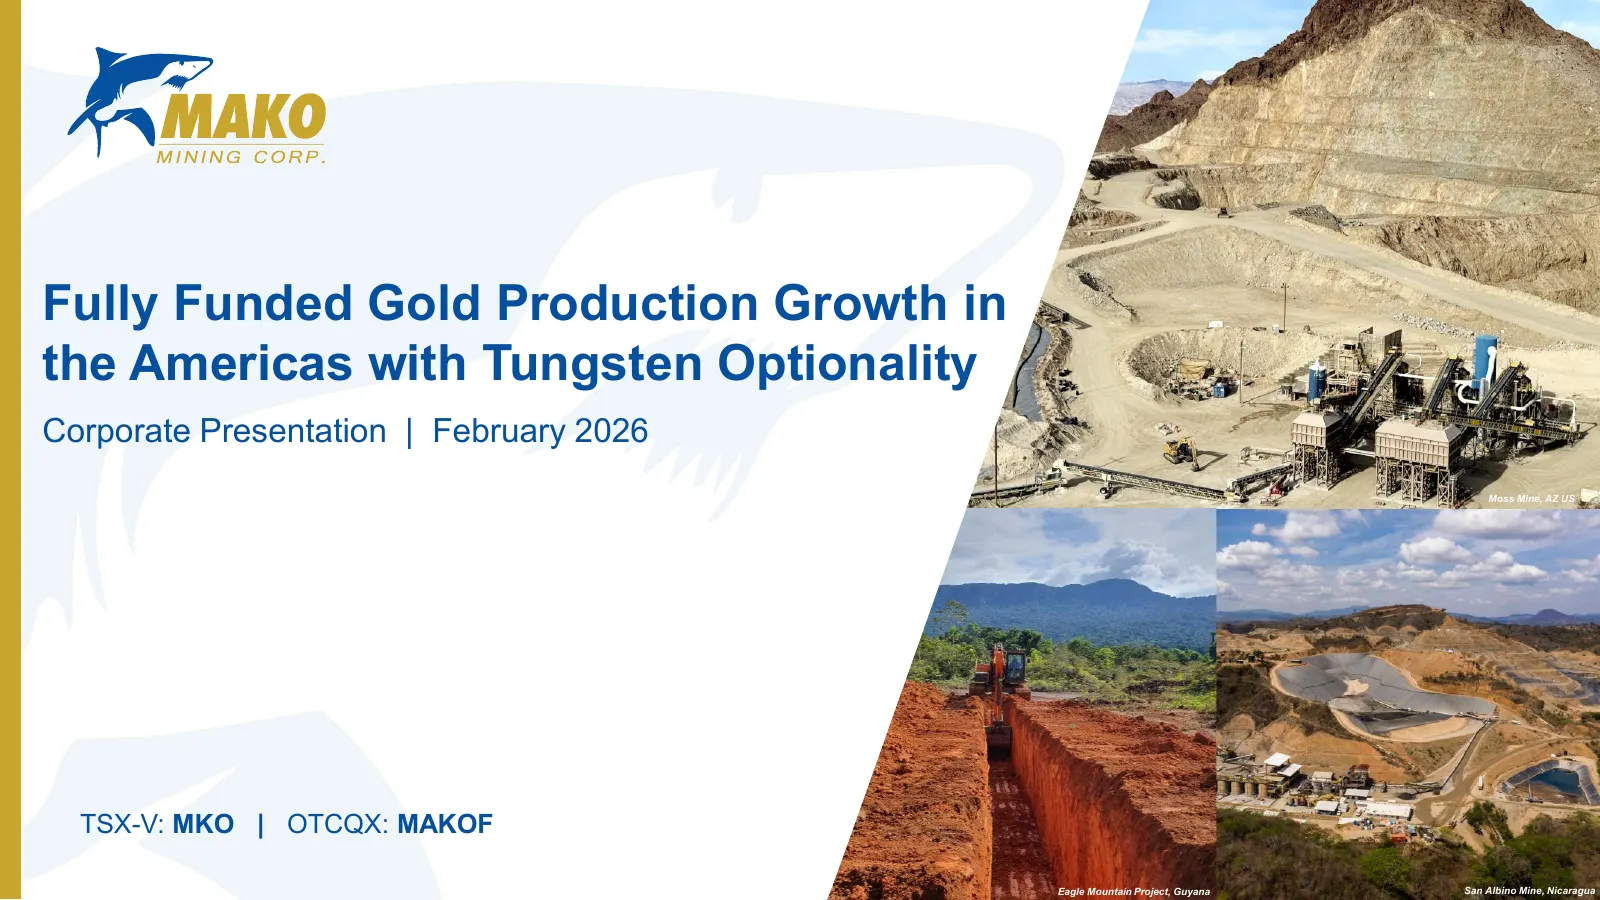
Slide 1: Fully Funded Gold Production Growth in the Americas with Tungsten Optionality
Fully Funded Gold Production Growth in the Americas with Tungsten Optionality Corporate Presentation | February 2026 Moss Mine, AZ US TSX-V: MKO | OTCQX: MAKOF Eagle Mountain Project, Guyana San Albino Mine, Nicaragua
Slide 2: Forward Looking Information
Forward Looking Information This document contains “forward-looking information” and “financial outlook” within the meaning of geologically to have the economic considerations applied to them that would enable them to be applicable Canadian securities laws. Statements containing forward-looking info
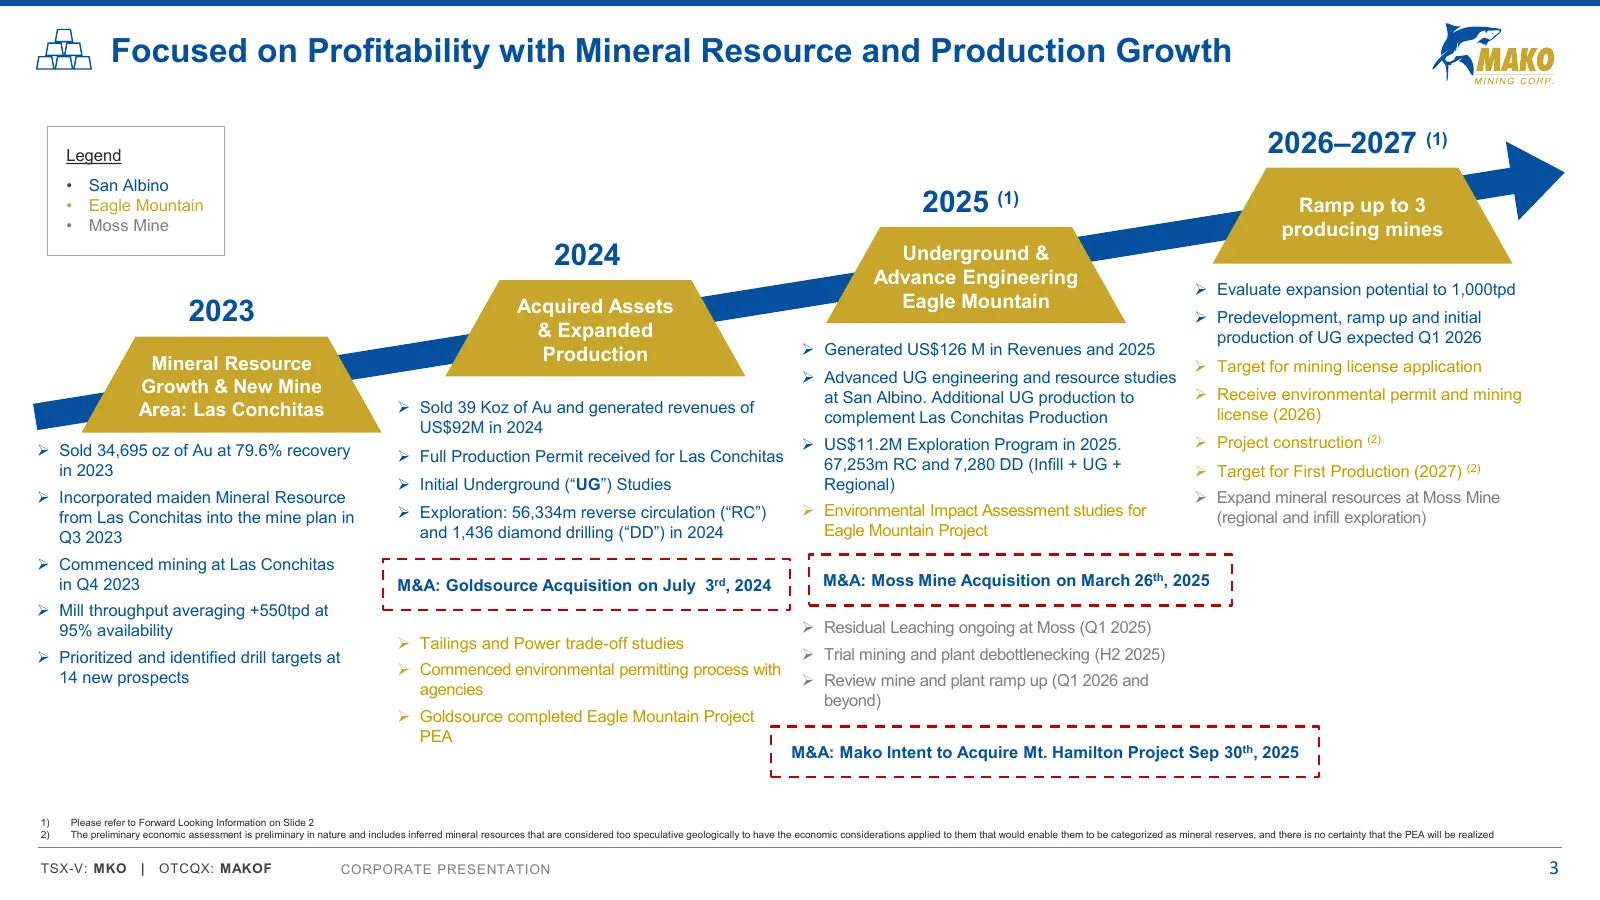
Slide 3: Focused on Profitability with Mineral Resource and Production Growth
Focused on Profitability with Mineral Resource and Production Growth Legend 2026–2027 (1) • San Albino • Eagle Mountain 2025 (1) Ramp up to 3 • Moss Mine producing mines 2024 Underground & Advance Engineering ➢ Evaluate expansion potential to 1,000tpd Eagle Mountain 2023 Acquired Assets ➢ Predevelop
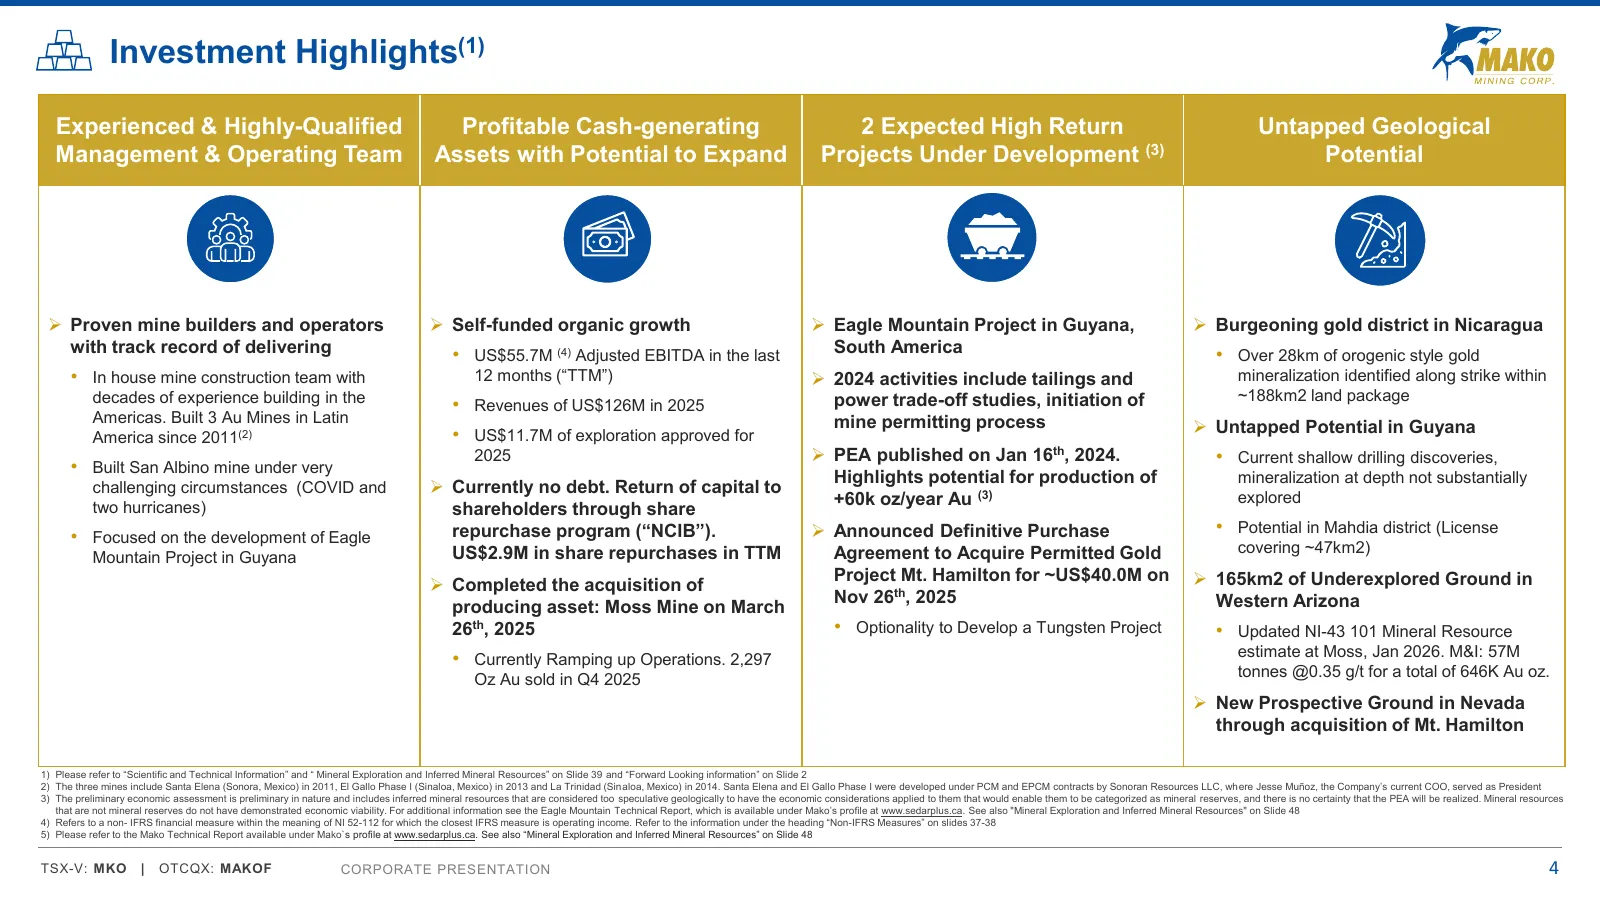
Slide 4: Investment Highlights
Investment Highlights(1) Experienced & Highly-Qualified Profitable Cash-generating 2 Expected High Return Untapped Geological Management & Operating Team Assets with Potential to Expand Projects Under Development (3) Potential ➢ Proven mine builders and operators ➢ Self-funded organic growth ➢ Eagle
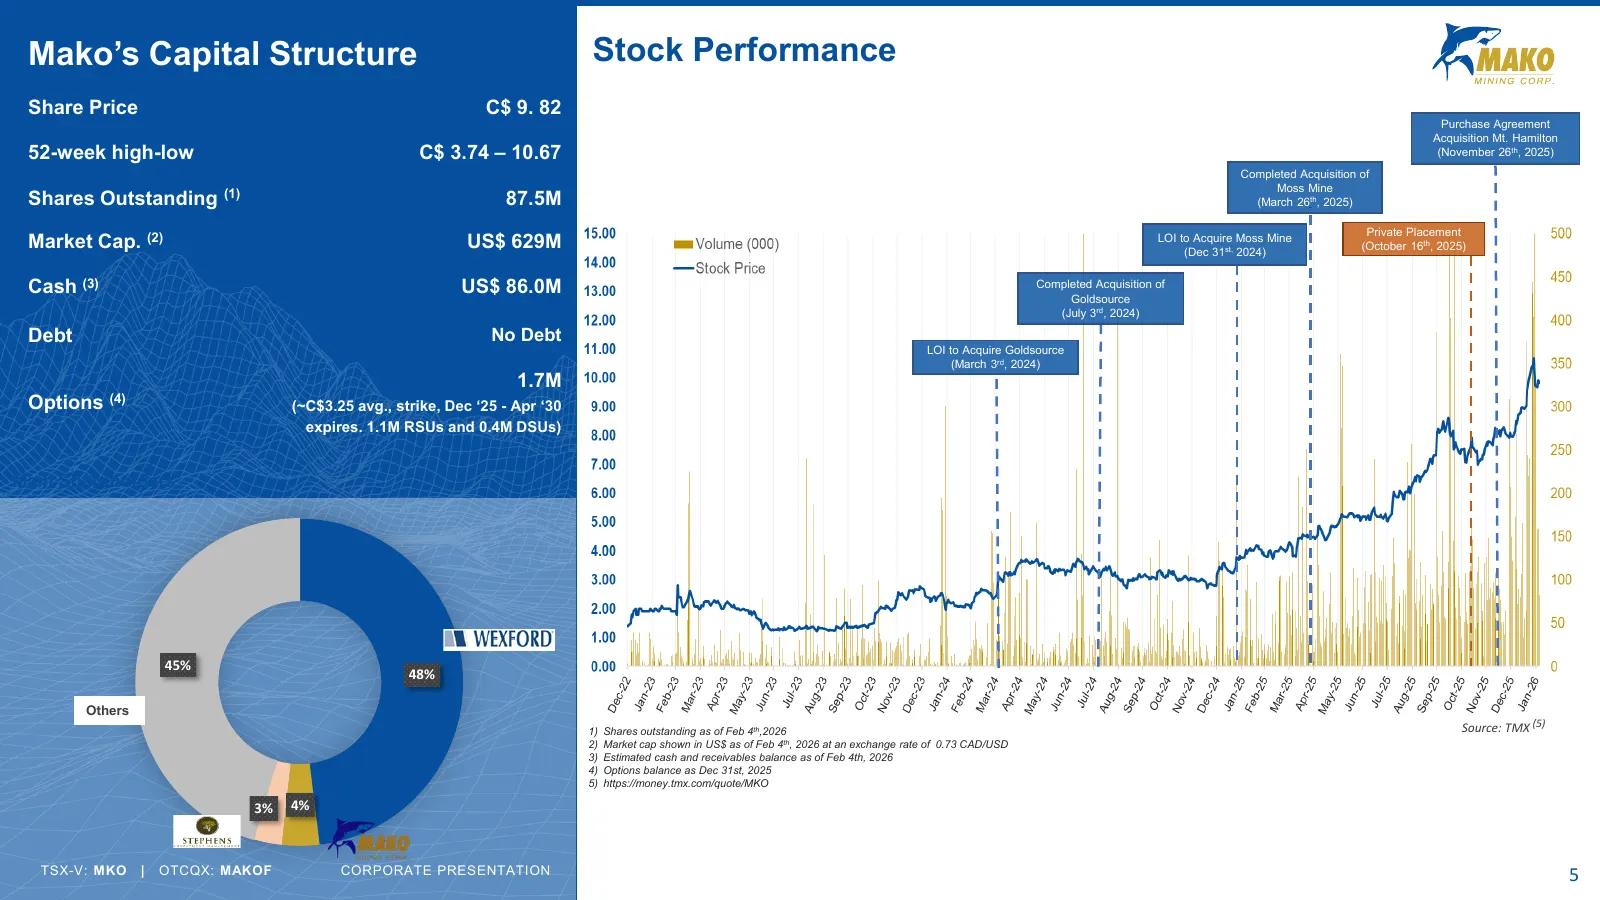
Slide 5: Stock Performance and Mako's Capital Structure
Mako’s Capital Structure Stock Performance Share Price C$ 9. 82 Purchase Agreement Acquisition Mt. Hamilton 52-week high-low C$ 3.74 – 10.67 (November 26th, 2025) Completed Acquisition of Moss Mine Shares Outstanding (1) 87.5M (March 26th, 2025) Private Placement Market Cap. (2) US$ 629M LOI to Acqu
Slide 6: Experienced and Highly-Qualified Management and Operating Team
Experienced and Highly-Qualified Management and Operating Team 6

Slide 7: Management Team
Management Team Akiba Leisman Frank Powell CEO (Director) VP of Exploration Akiba was Executive Chairman and Interim CEO of Marlin Gold Mining Ltd., Frank Powell has over 39 years of exploration experience with both major leading the company through the spinout of Sailfish Royalty Corp. and the and
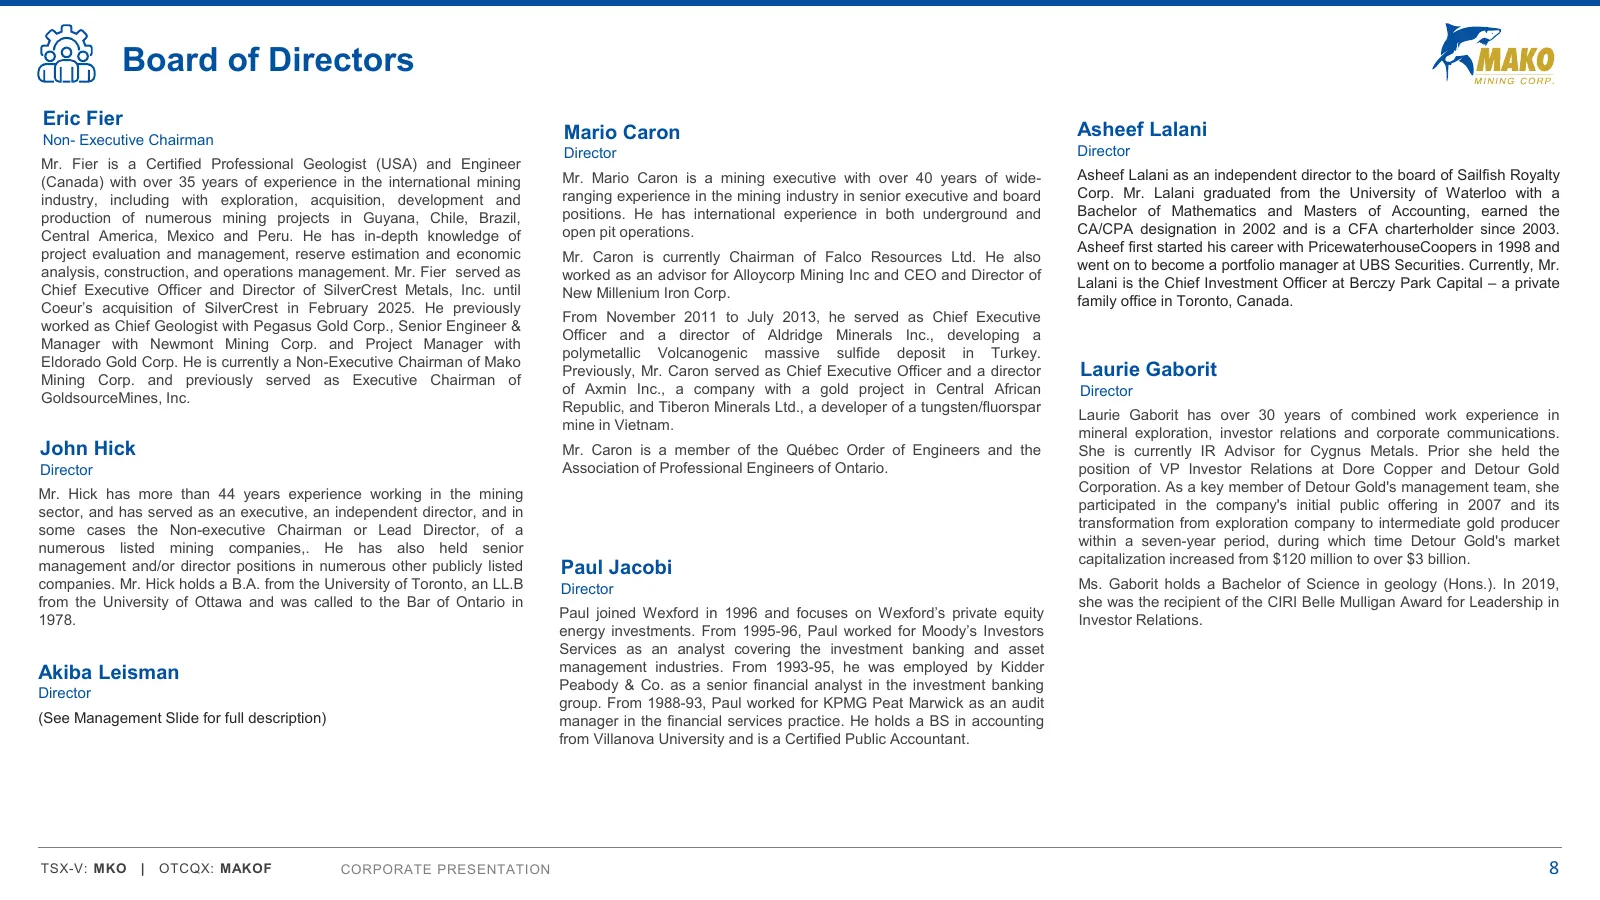
Slide 8: Board of Directors
Board of Directors Eric Fier Non- Executive Chairman Mario Caron Asheef Lalani Director Director Mr. Fier is a Certified Professional Geologist (USA) and Engineer (Canada) with over 35 years of experience in the international mining Mr. Mario Caron is a mining executive with over 40 years of wide- A
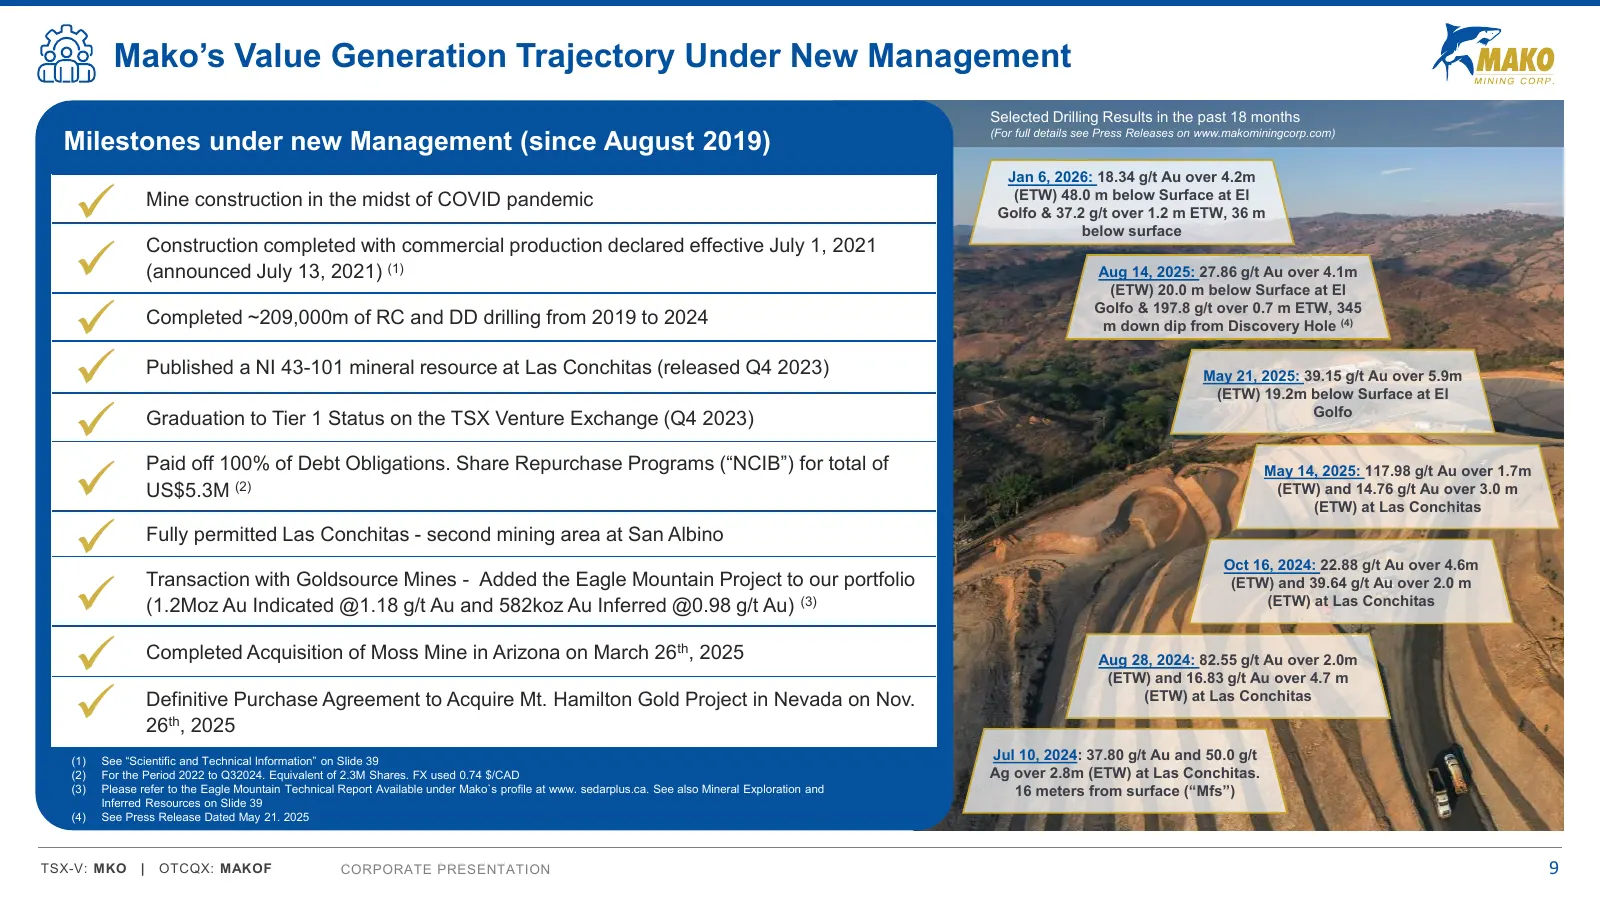
Slide 9: Mako's Value Generation Trajectory Under New Management
Mako’s Value Generation Trajectory Under New Management Selected Drilling Results in the past 18 months Milestones under new Management (since August 2019) (For full details see Press Releases on www.makominingcorp.com) Jan 6, 2026: 18.34 g/t Au over 4.2m ✓ Mine construction in the midst of COVID pa
Slide 10: San Albino Mine in Nicaragua: Cash-Generating Operation with Potential to Expand
San Albino Mine in Nicaragua: Cash-Generating Operation with Potential to Expand 10
Slide 11: Nicaragua: A Burgeoning Mining Jurisdiction
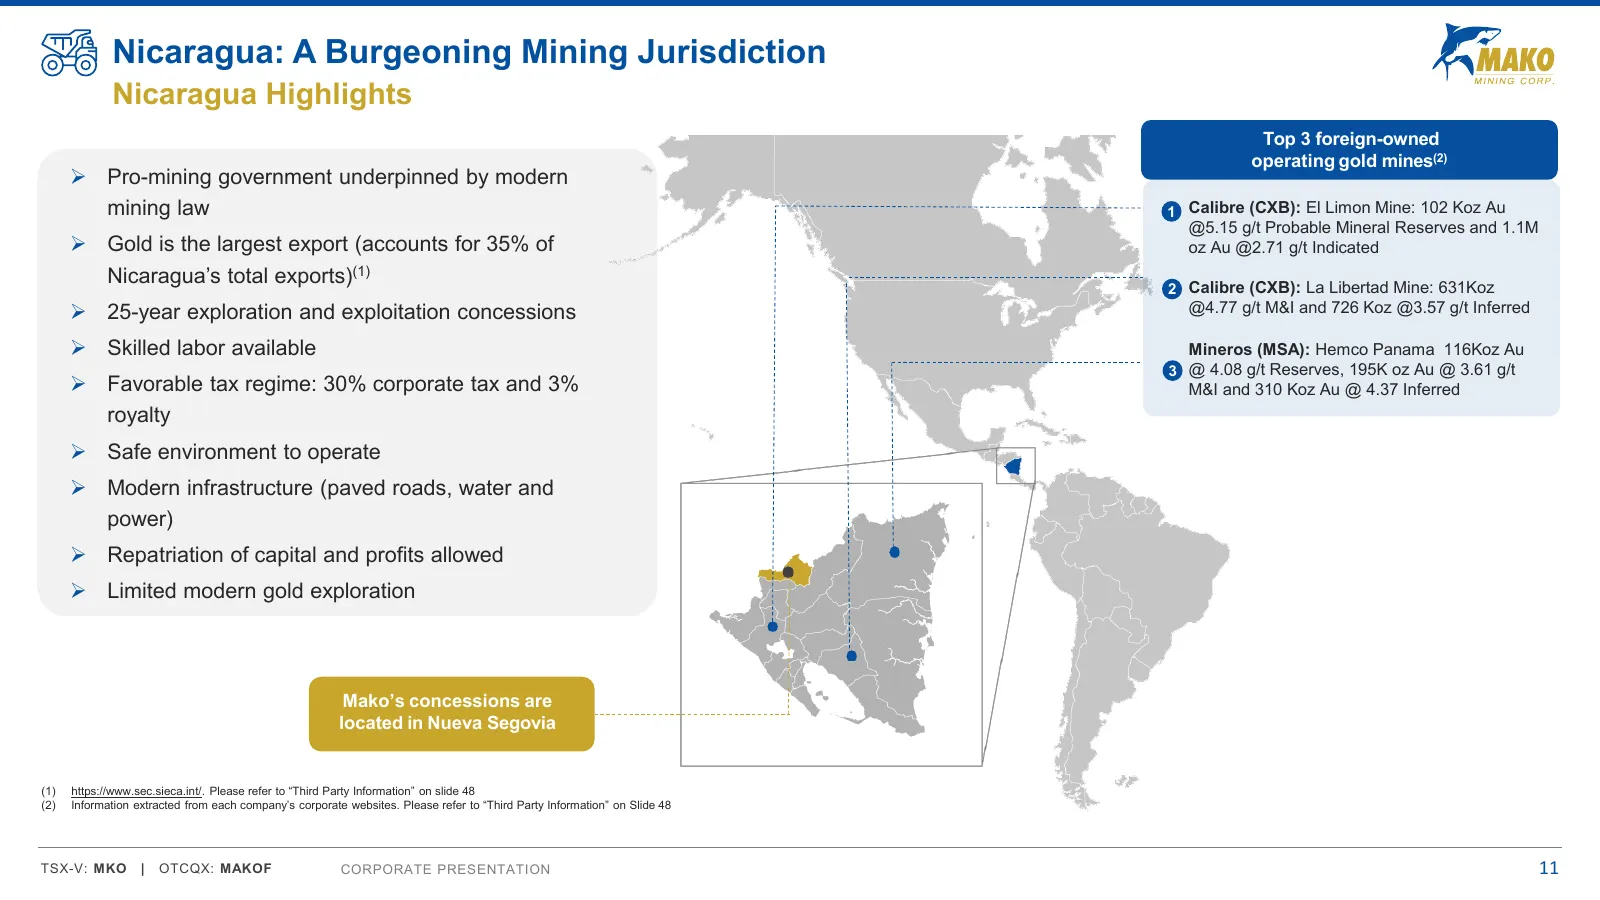
Nicaragua: A Burgeoning Mining Jurisdiction Nicaragua Highlights Top 3 foreign-owned operating gold mines(2) ➢ Pro-mining government underpinned by modern mining law 1 Calibre (CXB): El Limon Mine: 102 Koz Au @5.15 g/t Probable Mineral Reserves and 1.1M ➢ Gold is the largest export (accounts for 35%
Slide 12: San Albino Gold Mine
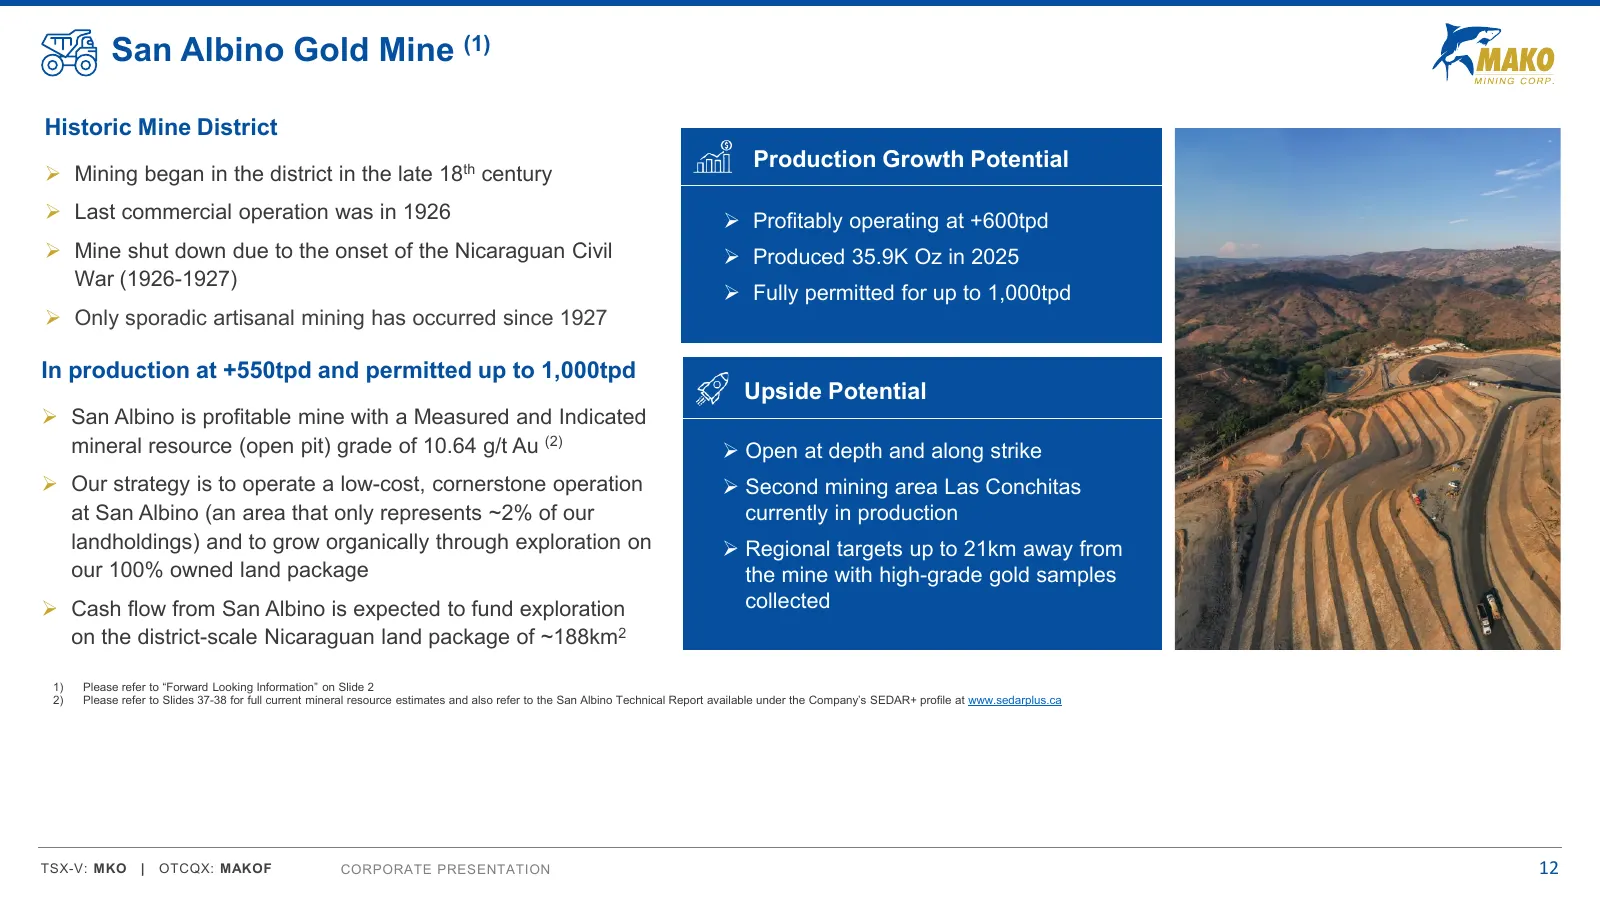
San Albino Gold Mine (1) Historic Mine District Production Growth Potential ➢ Mining began in the district in the late 18th century ➢ Last commercial operation was in 1926 ➢ Profitably operating at +600tpd ➢ Mine shut down due to the onset of the Nicaraguan Civil ➢ Produced 35.9K Oz in 2025 War (192
Slide 13: Production San Albino Mine
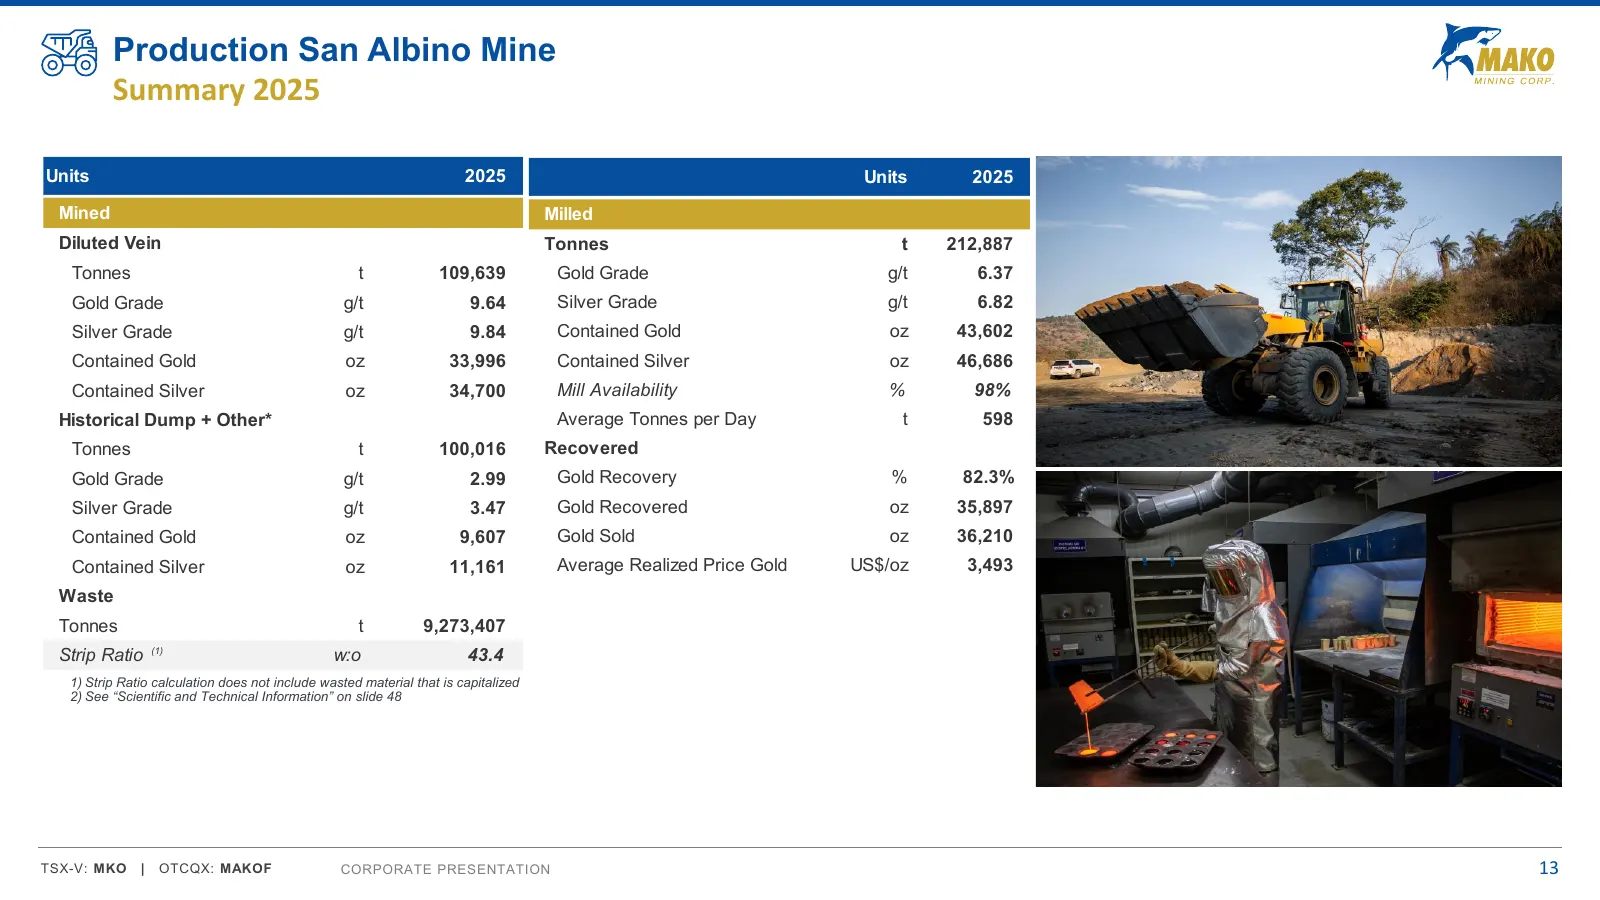
Production San Albino Mine Summary 2025 Units 2025 Units 2025 Mined Milled Diluted Vein Tonnes t 212,887 Tonnes t 109,639 Gold Grade g/t 6.37 Gold Grade g/t 9.64 Silver Grade g/t 6.82 Silver Grade g/t 9.84 Contained Gold oz 43,602 Contained Gold oz 33,996 Contained Silver oz 46,686 Contained Silver
Slide 14: Cash Generation
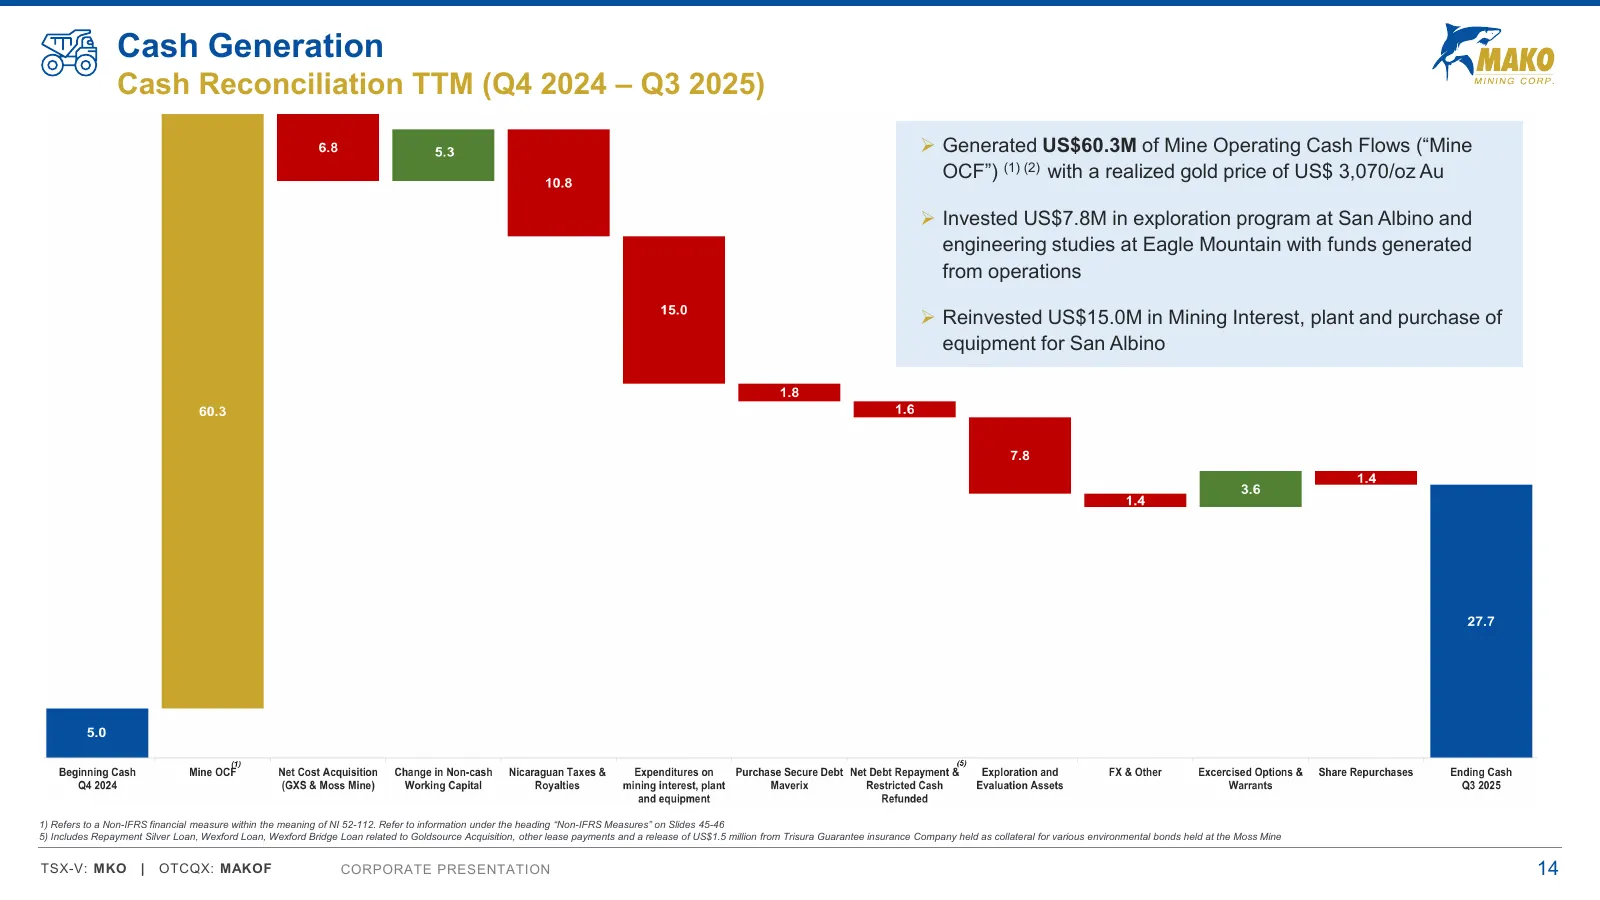
Cash Generation Cash Reconciliation TTM (Q4 2024 – Q3 2025) ➢ Generated US$60.3M of Mine Operating Cash Flows (“Mine OCF”) (1) (2) with a realized gold price of US$ 3,070/oz Au ➢ Invested US$7.8M in exploration program at San Albino and engineering studies at Eagle Mountain with funds generated from
Slide 15: Financial Summary
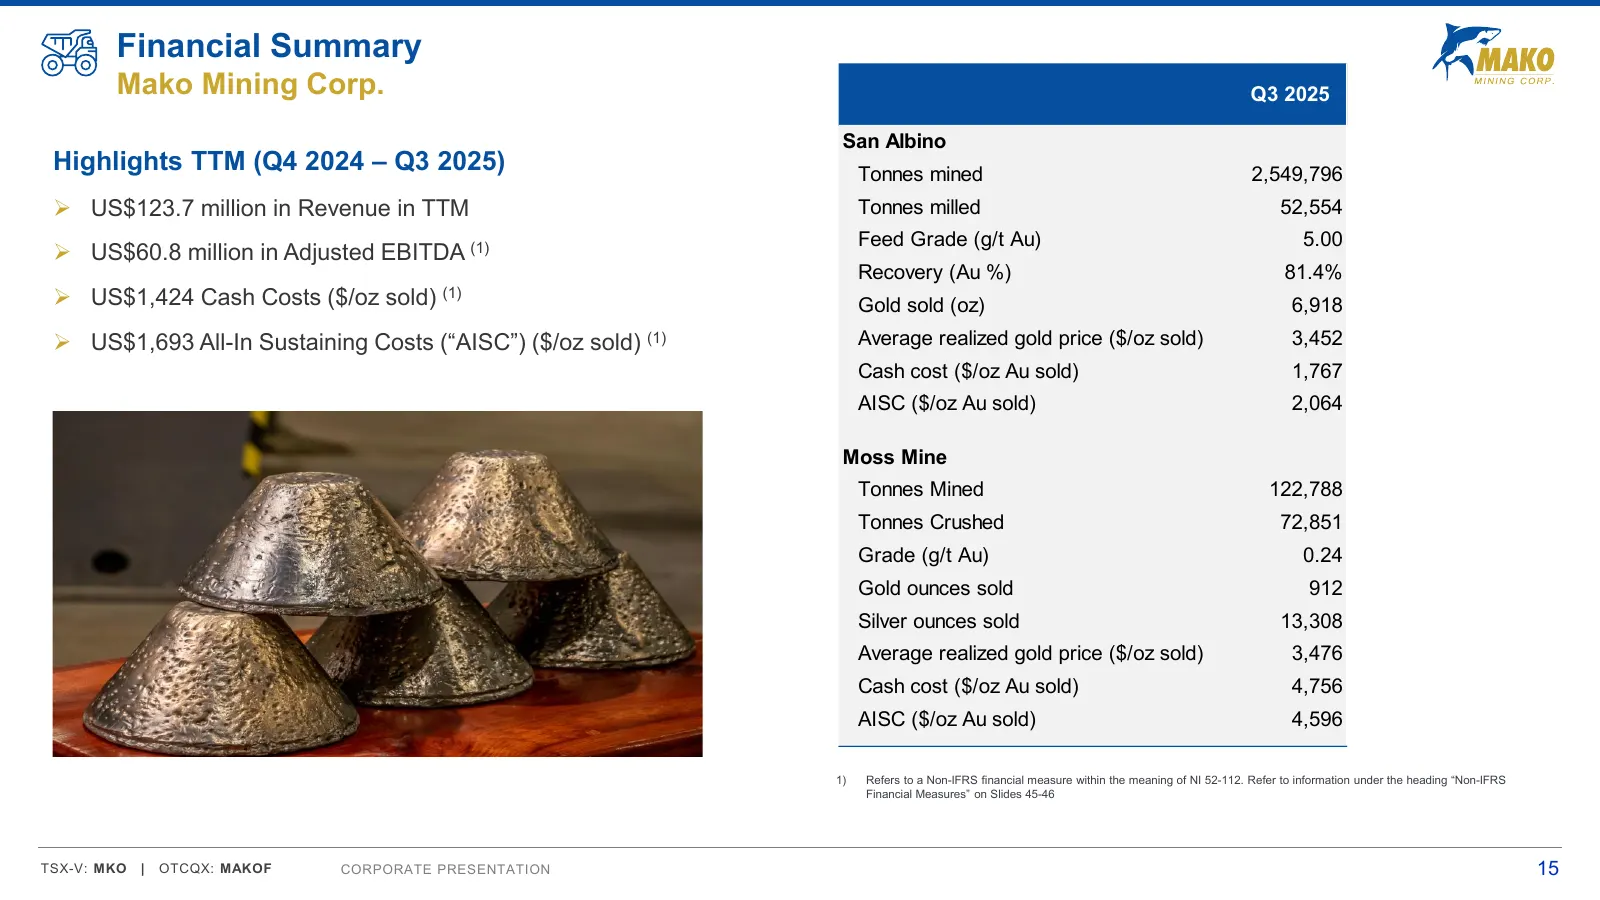
Financial Summary Mako Mining Corp. Q3 2025 San Albino Highlights TTM (Q4 2024 – Q3 2025) Tonnes mined 2,549,796 ➢ US$123.7 million in Revenue in TTM Tonnes milled 52,554 Feed Grade (g/t Au) 5.00 ➢ US$60.8 million in Adjusted EBITDA (1) Recovery (Au %) 81.4% ➢ US$1,424 Cash Costs ($/oz sold) (1) Gol
Slide 16: Eagle Mountain Gold Project: Resource Scale with Phased Development Plan
Eagle Mountain Gold Project: Resource Scale with Phased Development Plan 16
Slide 17: Guyana: The Next Great Mining Jurisdiction
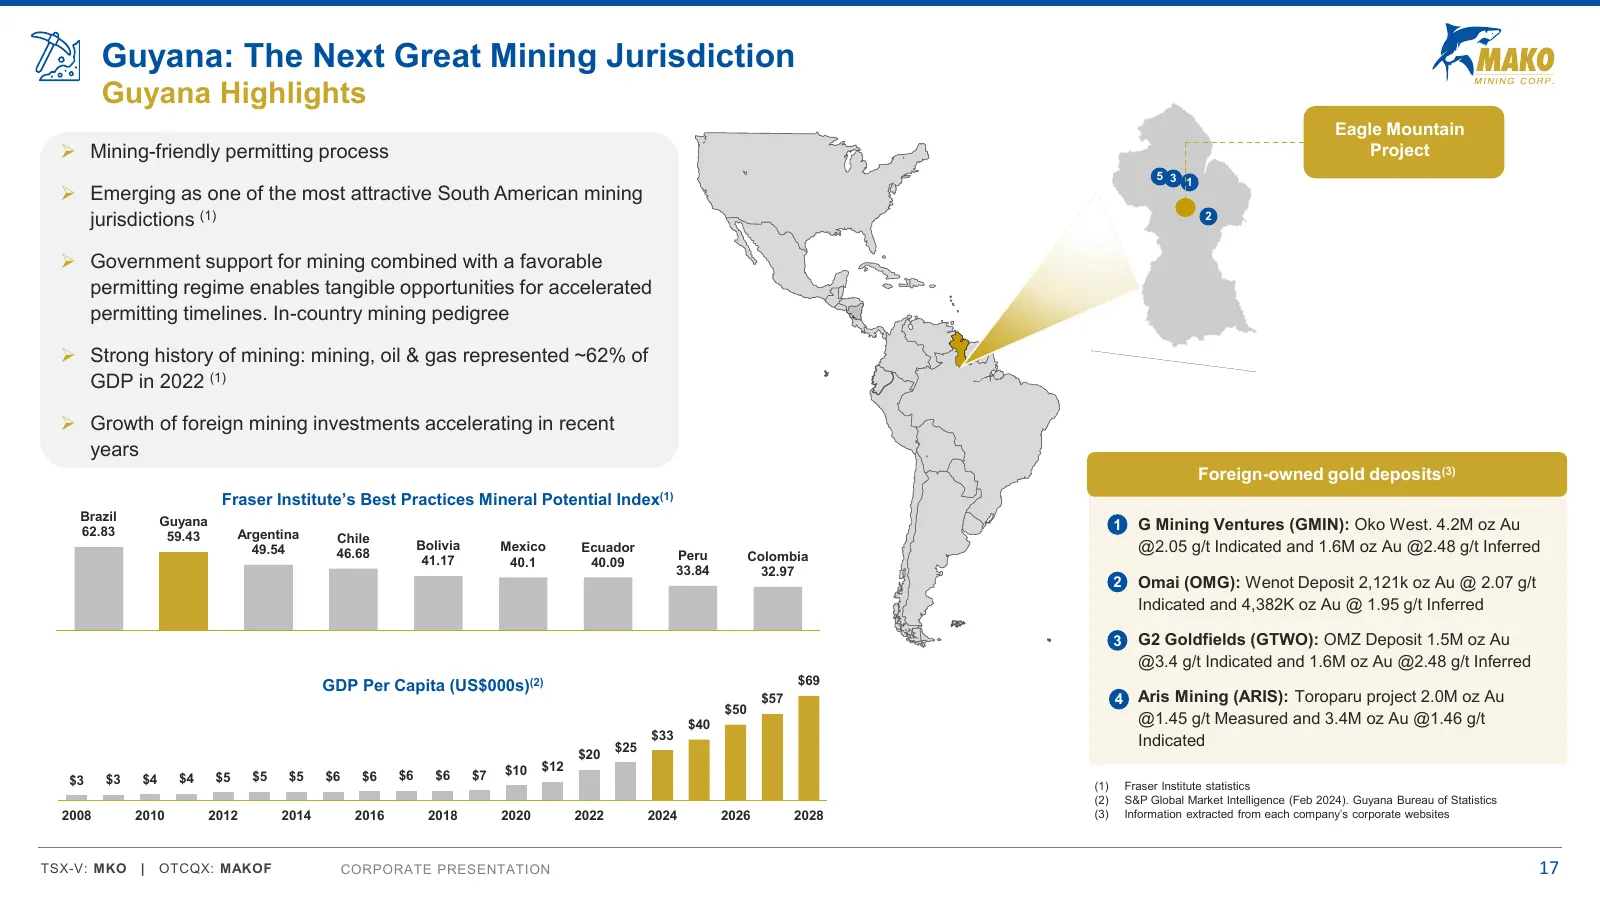
Guyana: The Next Great Mining Jurisdiction Guyana Highlights Eagle Mountain ➢ Mining-friendly permitting process Project 5 3 1 ➢ Emerging as one of the most attractive South American mining jurisdictions (1) 2 ➢ Government support for mining combined with a favorable permitting regime enables tangib
Slide 18: Eagle Mountain: PEA-Stage Development Project
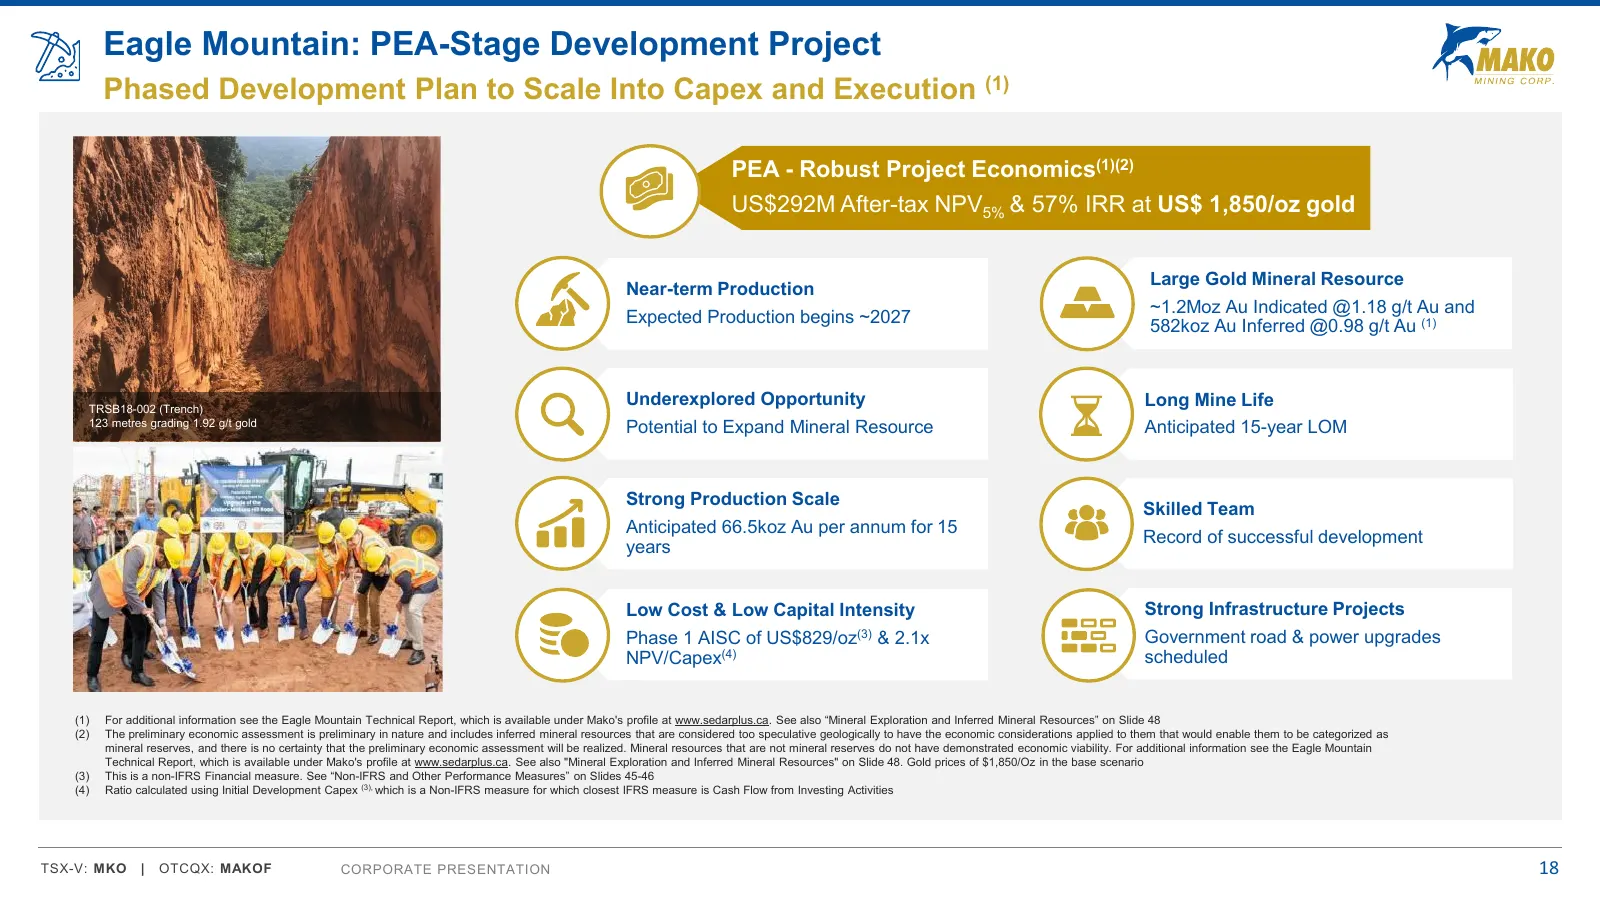
Eagle Mountain: PEA-Stage Development Project Phased Development Plan to Scale Into Capex and Execution (1) PEA - Robust Project Economics(1)(2) US$292M After-tax NPV5% & 57% IRR at US$ 1,850/oz gold Large Gold Mineral Resource Near-term Production ~1.2Moz Au Indicated @1.18 g/t Au and Expected Prod
Slide 19: Eagle Mountain Asset Overview
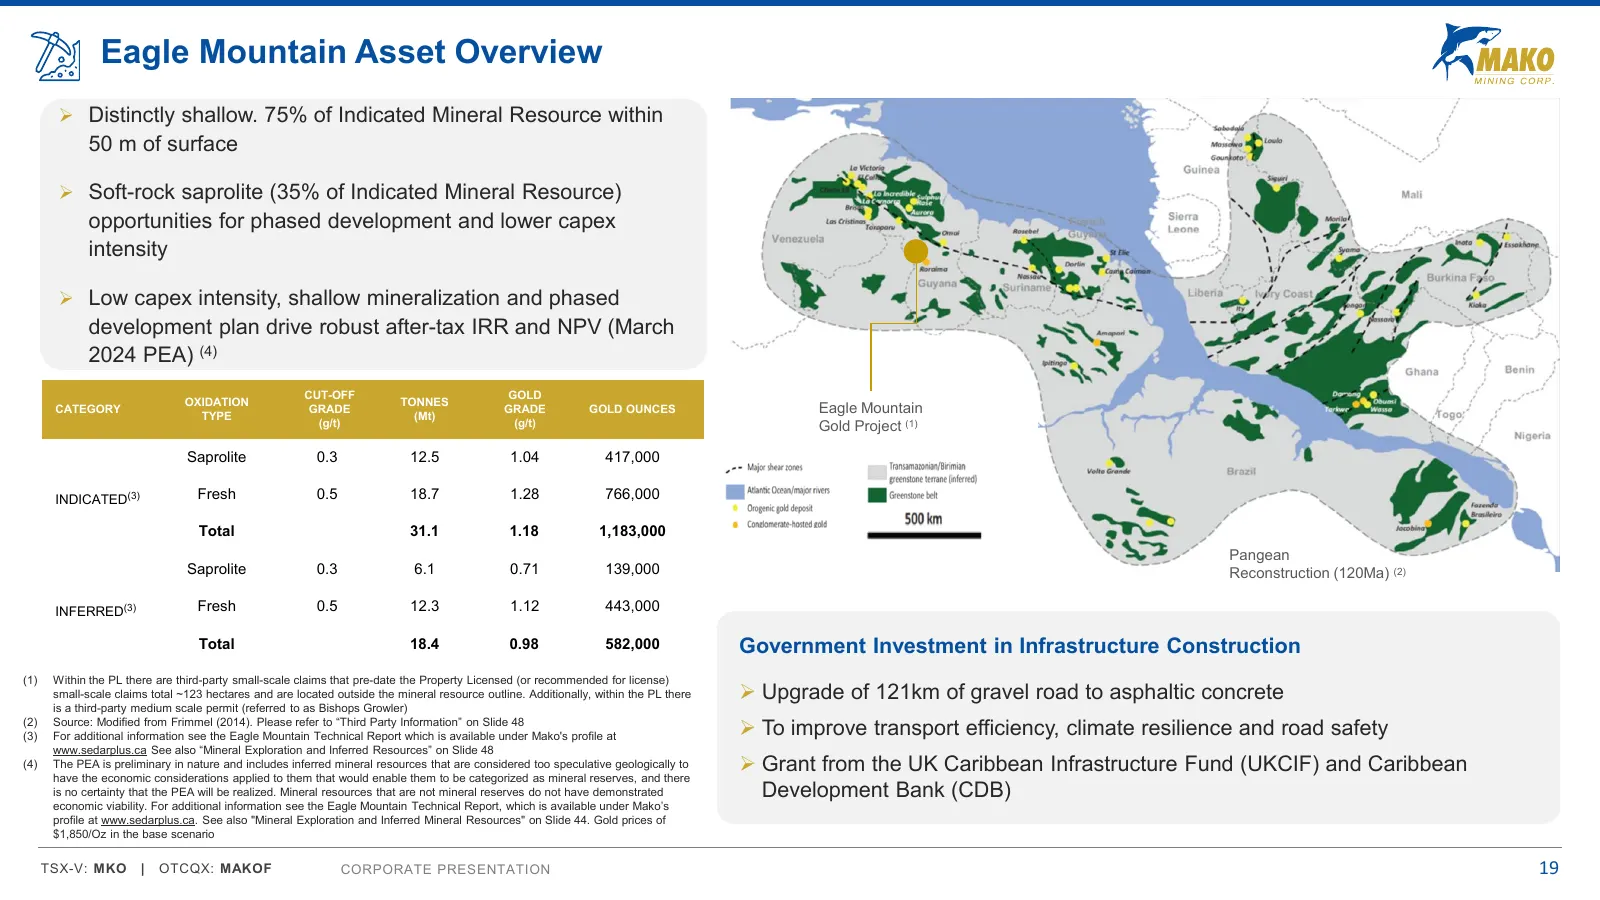
Eagle Mountain Asset Overview ➢ Distinctly shallow. 75% of Indicated Mineral Resource within 50 m of surface ➢ Soft-rock saprolite (35% of Indicated Mineral Resource) opportunities for phased development and lower capex intensity ➢ Low capex intensity, shallow mineralization and phased development p
Slide 20: PEA – Life of Mine Profile
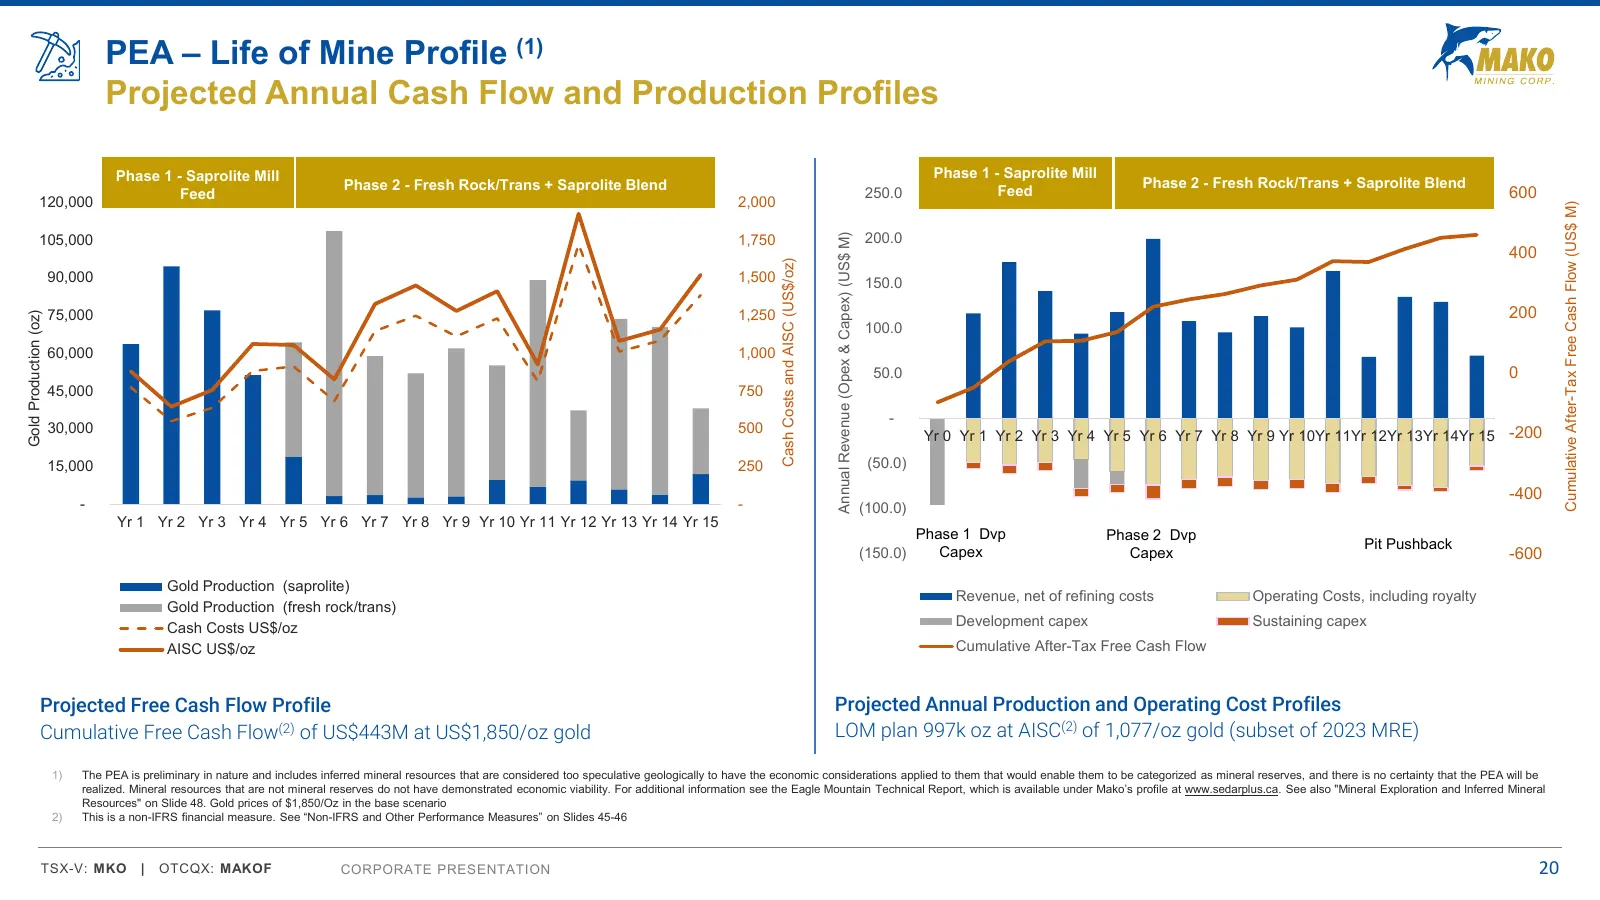
PEA – Life of Mine Profile (1) Projected Annual Cash Flow and Production Profiles Phase 1 - Saprolite Mill Phase 1 - Saprolite Mill Phase 2 - Fresh Rock/Trans + Saprolite Blend Feed Phase 2 - Fresh Rock/Trans + Saprolite Blend Feed 250.0 600 120,000 2,000 Cumulative After-Tax Free Cash Flow (US$ M)
Slide 21: Projected Timeline for Eagle Mountain Gold Project
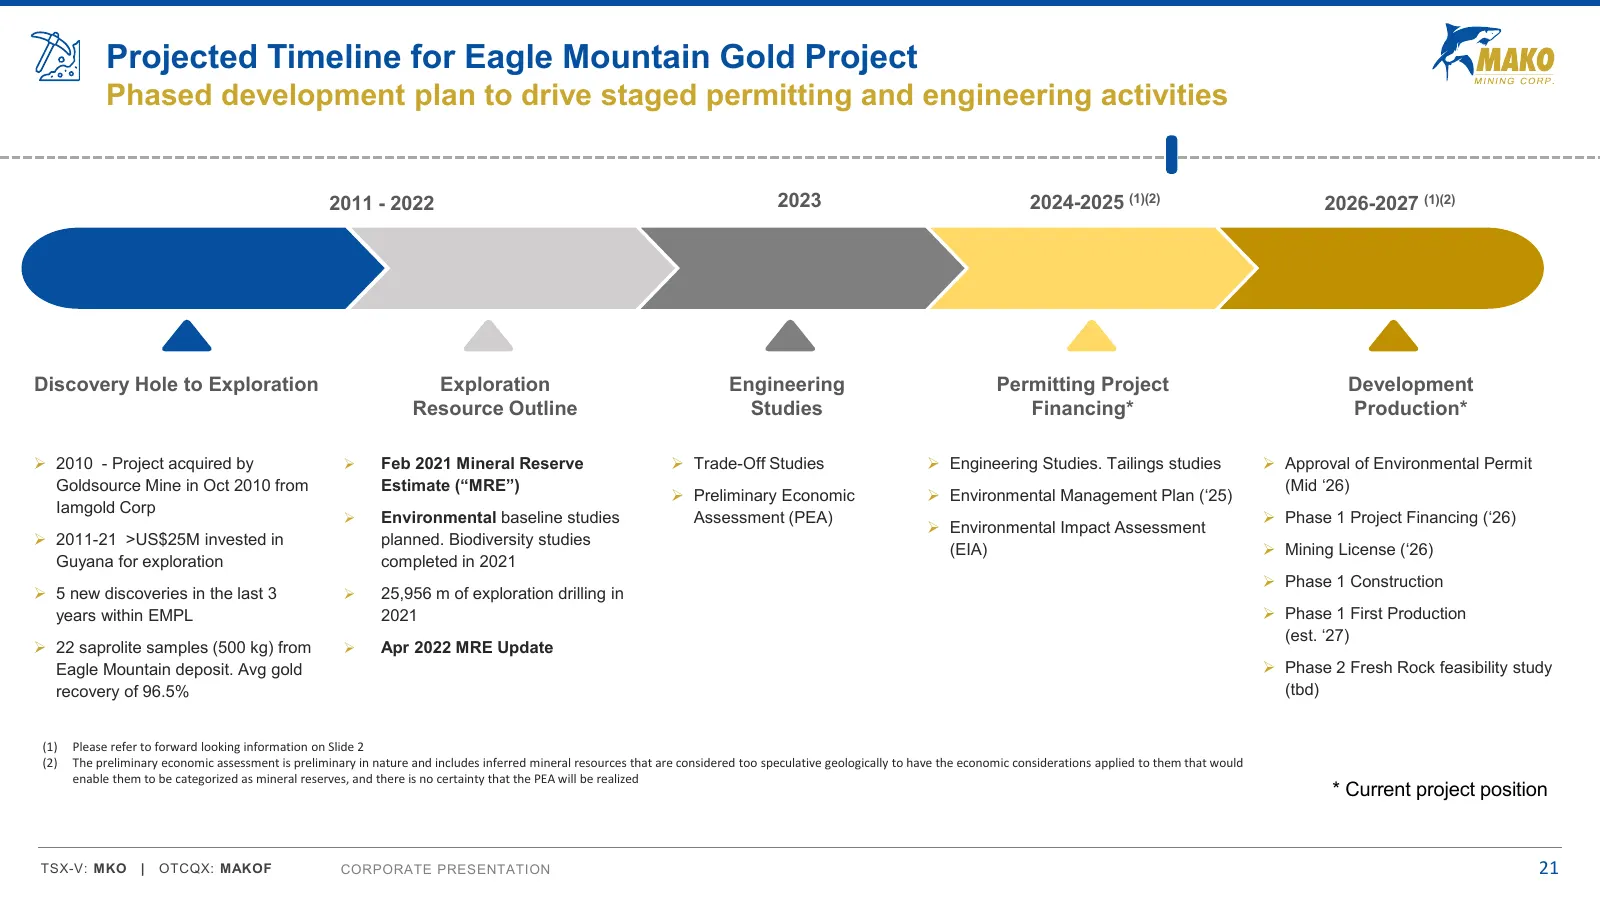
Projected Timeline for Eagle Mountain Gold Project Phased development plan to drive staged permitting and engineering activities 2011 - 2022 2023 2024-2025 (1)(2) 2026-2027 (1)(2) Discovery Hole to Exploration Exploration Engineering Permitting Project Development Resource Outline Studies Financing*
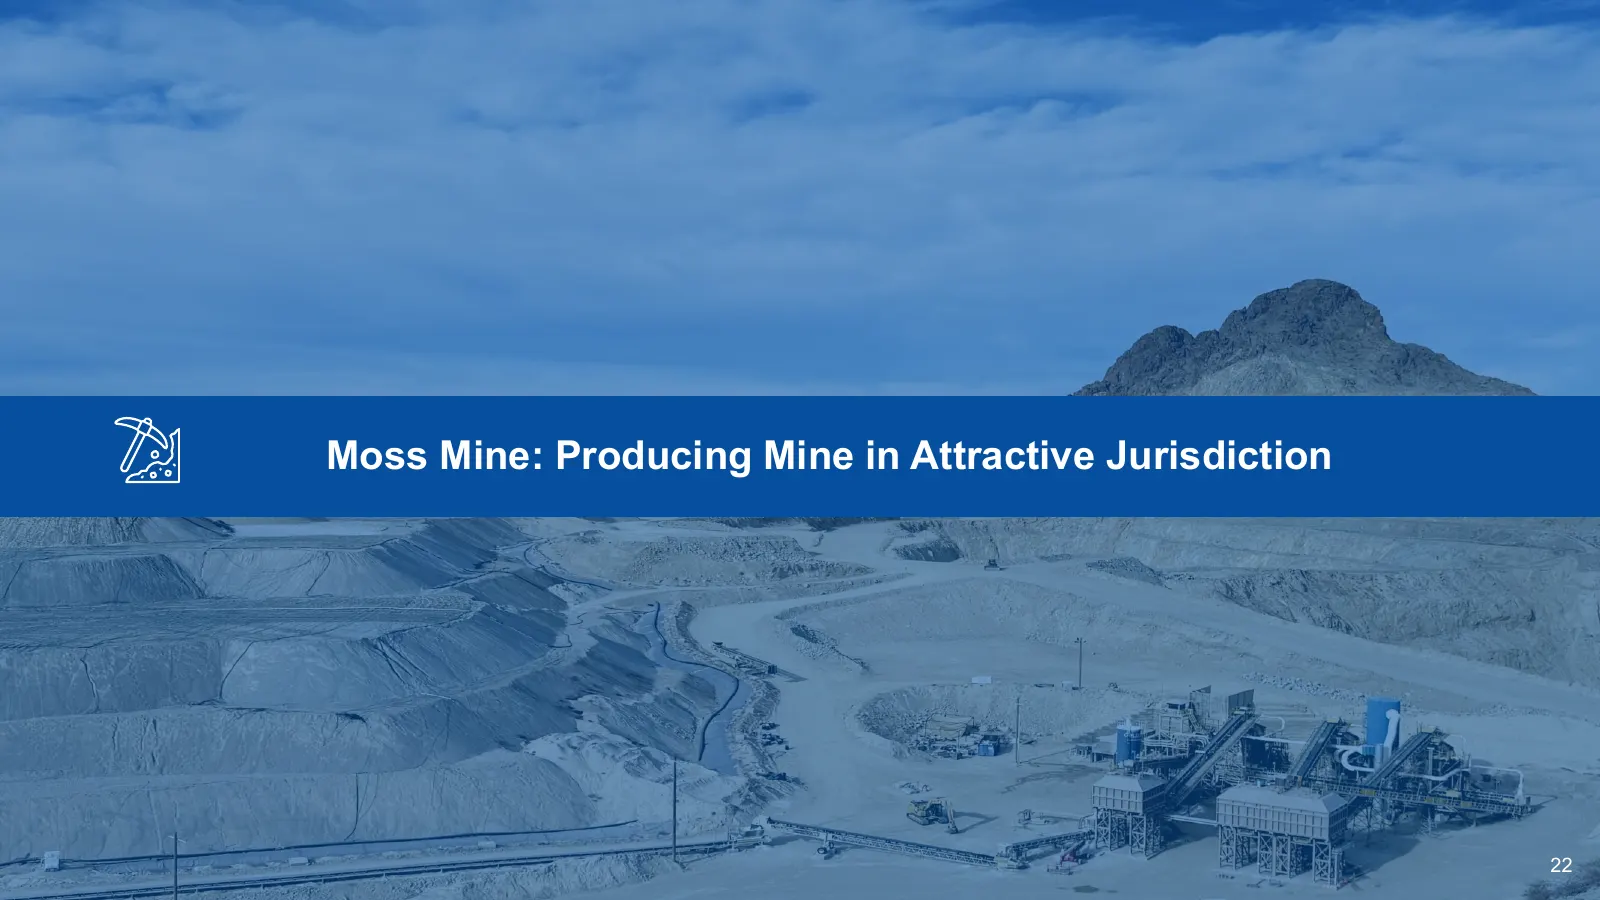
Slide 22: Moss Mine: Producing Mine in Attractive Jurisdiction
Moss Mine: Producing Mine in Attractive Jurisdiction 22
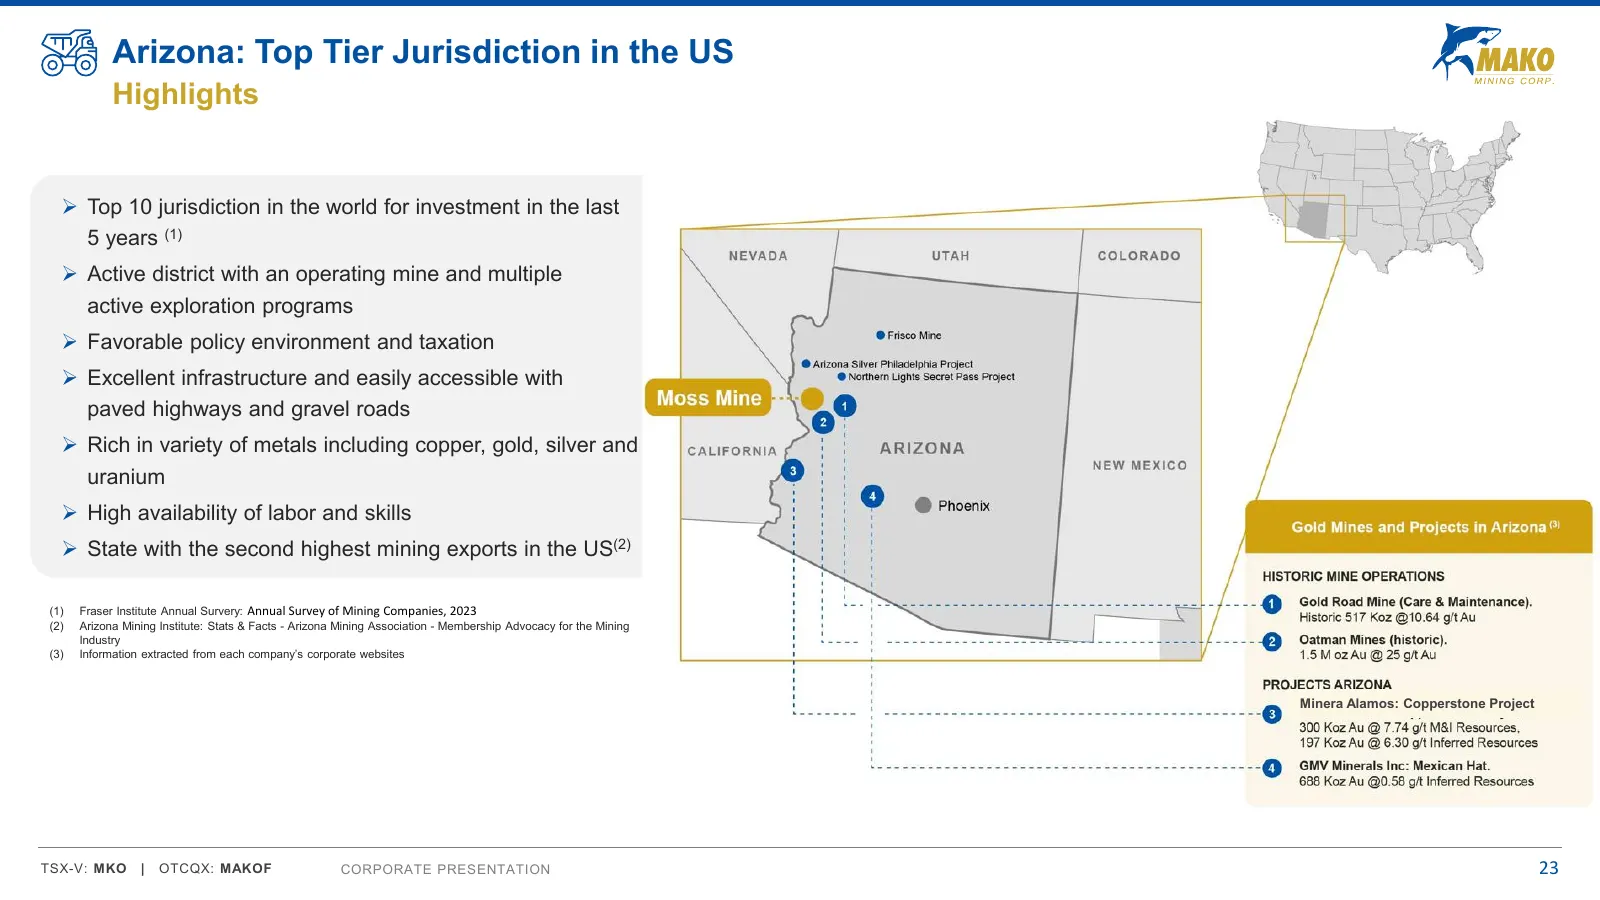
Slide 23: Arizona: Top Tier Jurisdiction in the US
Arizona: Top Tier Jurisdiction in the US Highlights ➢ Top 10 jurisdiction in the world for investment in the last 5 years (1) ➢ Active district with an operating mine and multiple active exploration programs ➢ Favorable policy environment and taxation ➢ Excellent infrastructure and easily accessible
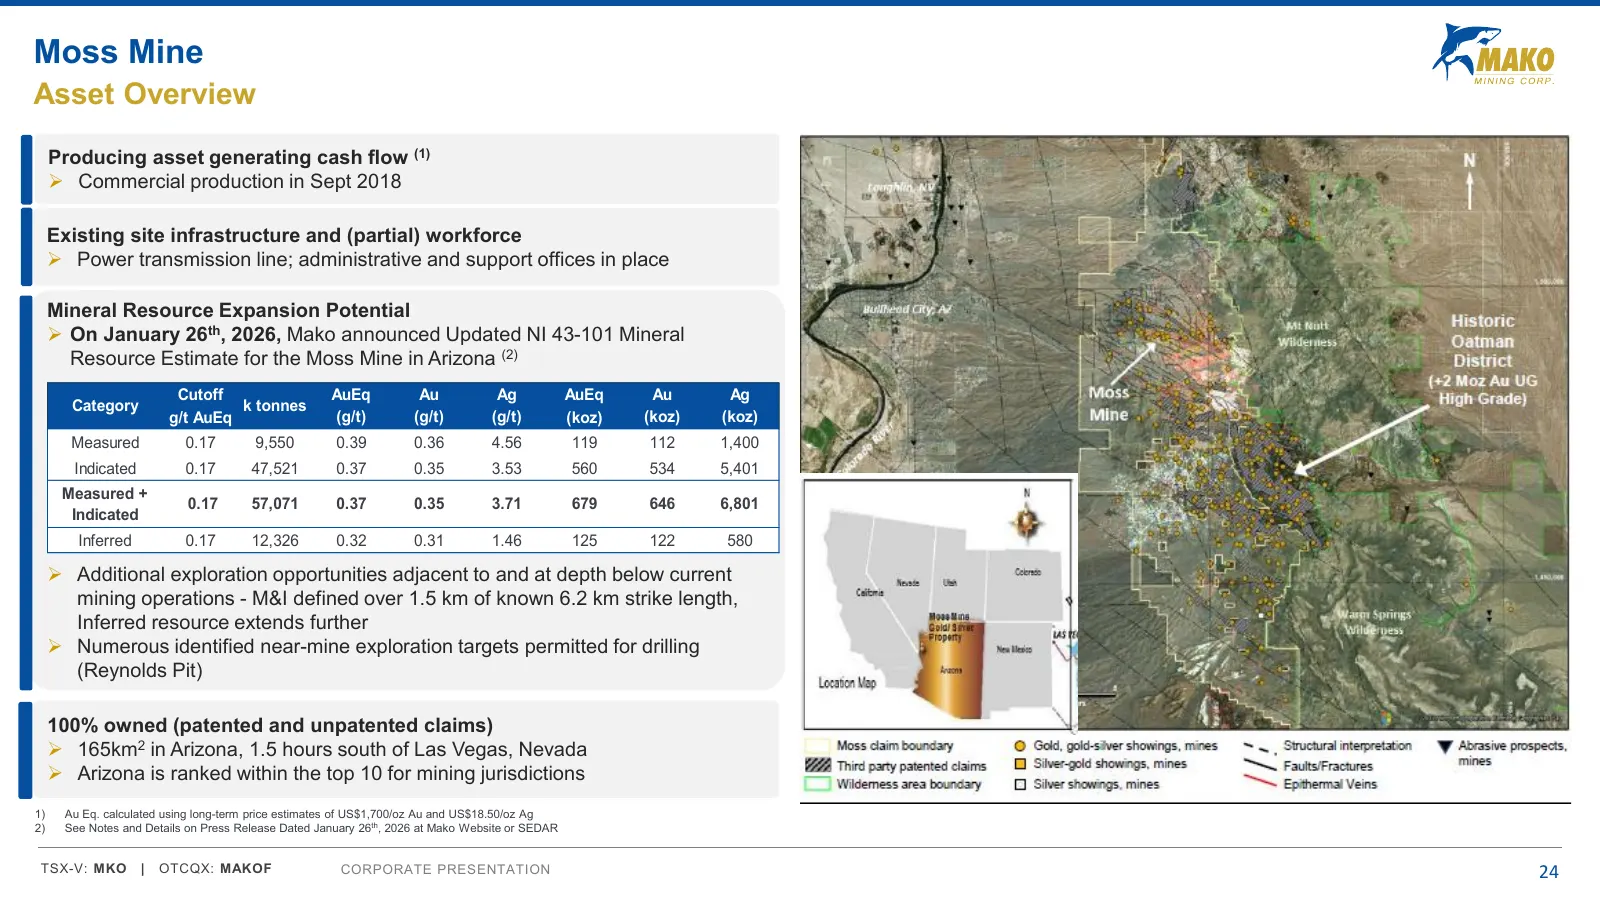
Slide 24: Moss Mine Asset Overview
Moss Mine Asset Overview Producing asset generating cash flow (1) ➢ Commercial production in Sept 2018 Existing site infrastructure and (partial) workforce ➢ Power transmission line; administrative and support offices in place Mineral Resource Expansion Potential ➢ On January 26th, 2026, Mako announ
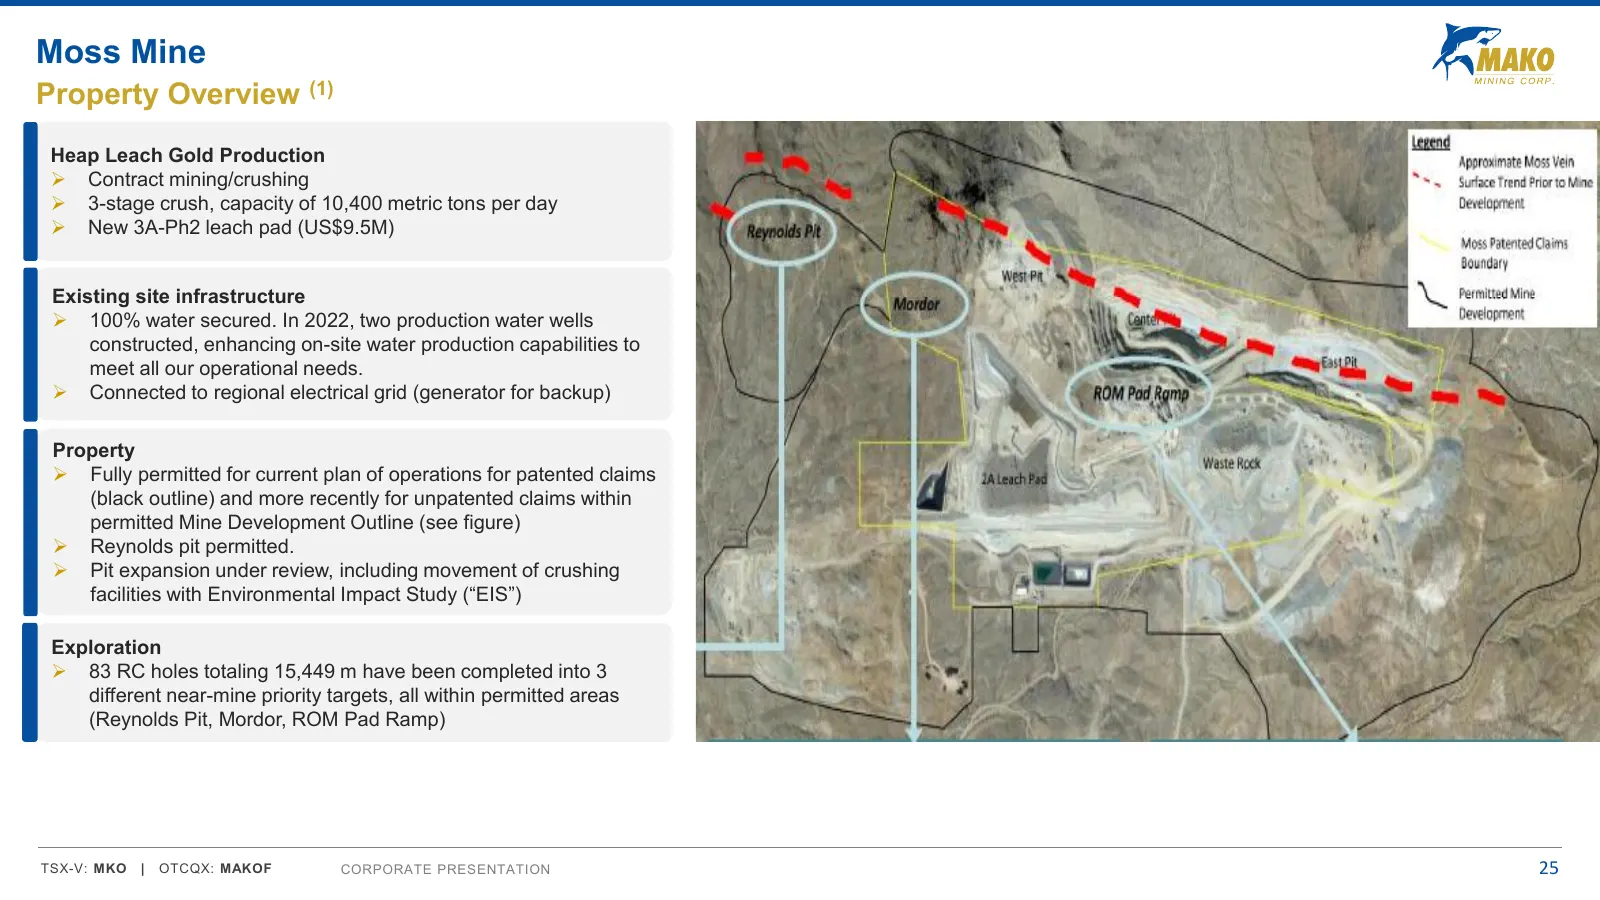
Slide 25: Moss Mine Property Overview
Moss Mine Property Overview (1) Heap Leach Gold Production ➢ Contract mining/crushing ➢ 3-stage crush, capacity of 10,400 metric tons per day ➢ New 3A-Ph2 leach pad (US$9.5M) Existing site infrastructure ➢ 100% water secured. In 2022, two production water wells constructed, enhancing on-site water p
Slide 26: Mt. Hamilton: Gold Project in Nevada with major Permits approved
Mt. Hamilton: Gold Project in Nevada with major Permits approved 26
Slide 27: Nevada: Top Ranked Mining Jurisdiction
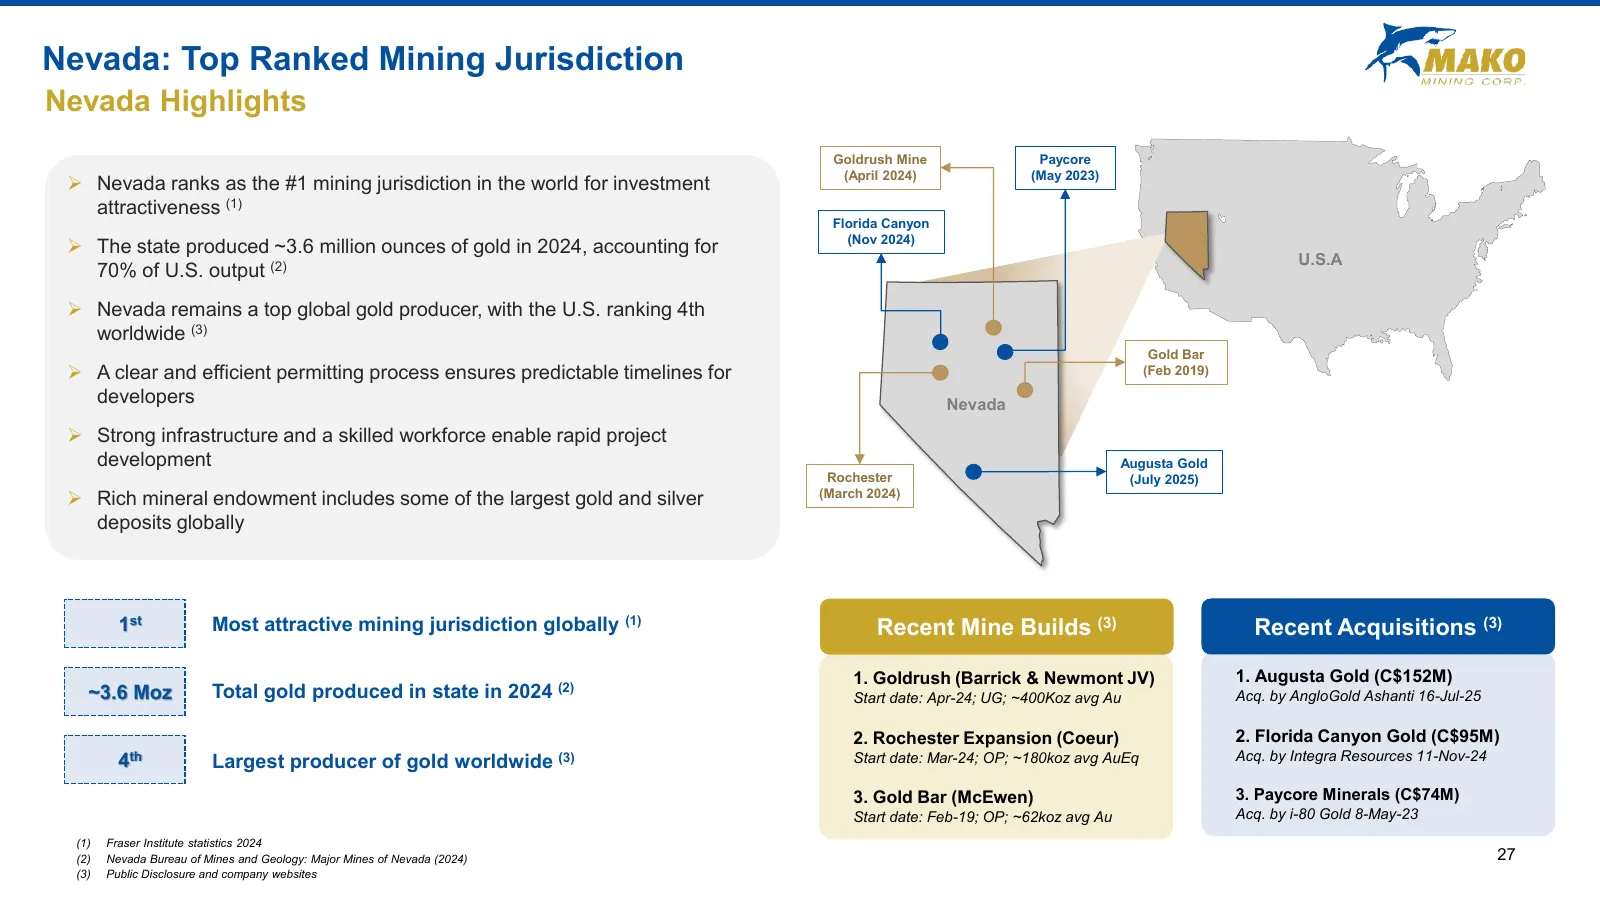
Nevada: Top Ranked Mining Jurisdiction Nevada Highlights Goldrush Mine Paycore (April 2024) (May 2023) ➢ Nevada ranks as the #1 mining jurisdiction in the world for investment attractiveness (1) Florida Canyon (Nov 2024) ➢ The state produced ~3.6 million ounces of gold in 2024, accounting for U.S.A
Slide 28: Nevada: Top Ranked Mining Jurisdiction
Nevada: Top Ranked Mining Jurisdiction Nevada Highlights Goldrush Mine Paycore (April 2024) (May 2023) ➢ Nevada ranks as the #1 mining jurisdiction in the world for investment attractiveness (1) Florida Canyon (Nov 2024) ➢ The state produced ~3.6 million ounces of gold in 2024, accounting for U.S.A
Slide 29: Mt. Hamilton Asset Overview
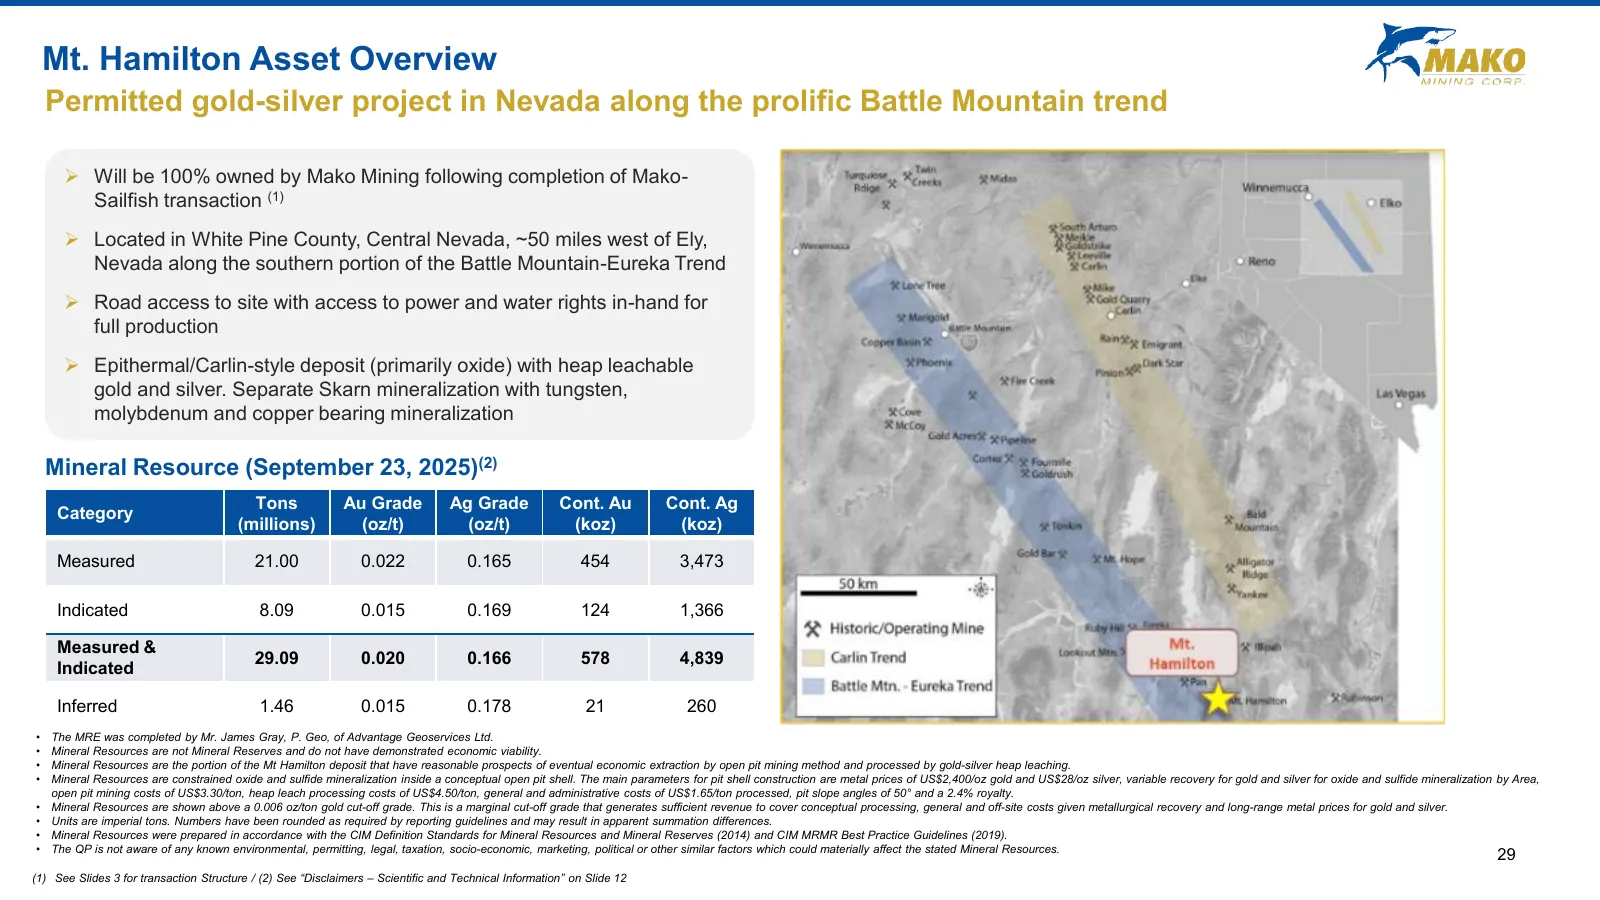
Mt. Hamilton Asset Overview Permitted gold-silver project in Nevada along the prolific Battle Mountain trend ➢ Will be 100% owned by Mako Mining following completion of Mako- Sailfish transaction (1) ➢ Located in White Pine County, Central Nevada, ~50 miles west of Ely, Nevada along the southern por
Slide 30: Untapped Geological Potential
Untapped Geological Potential 30
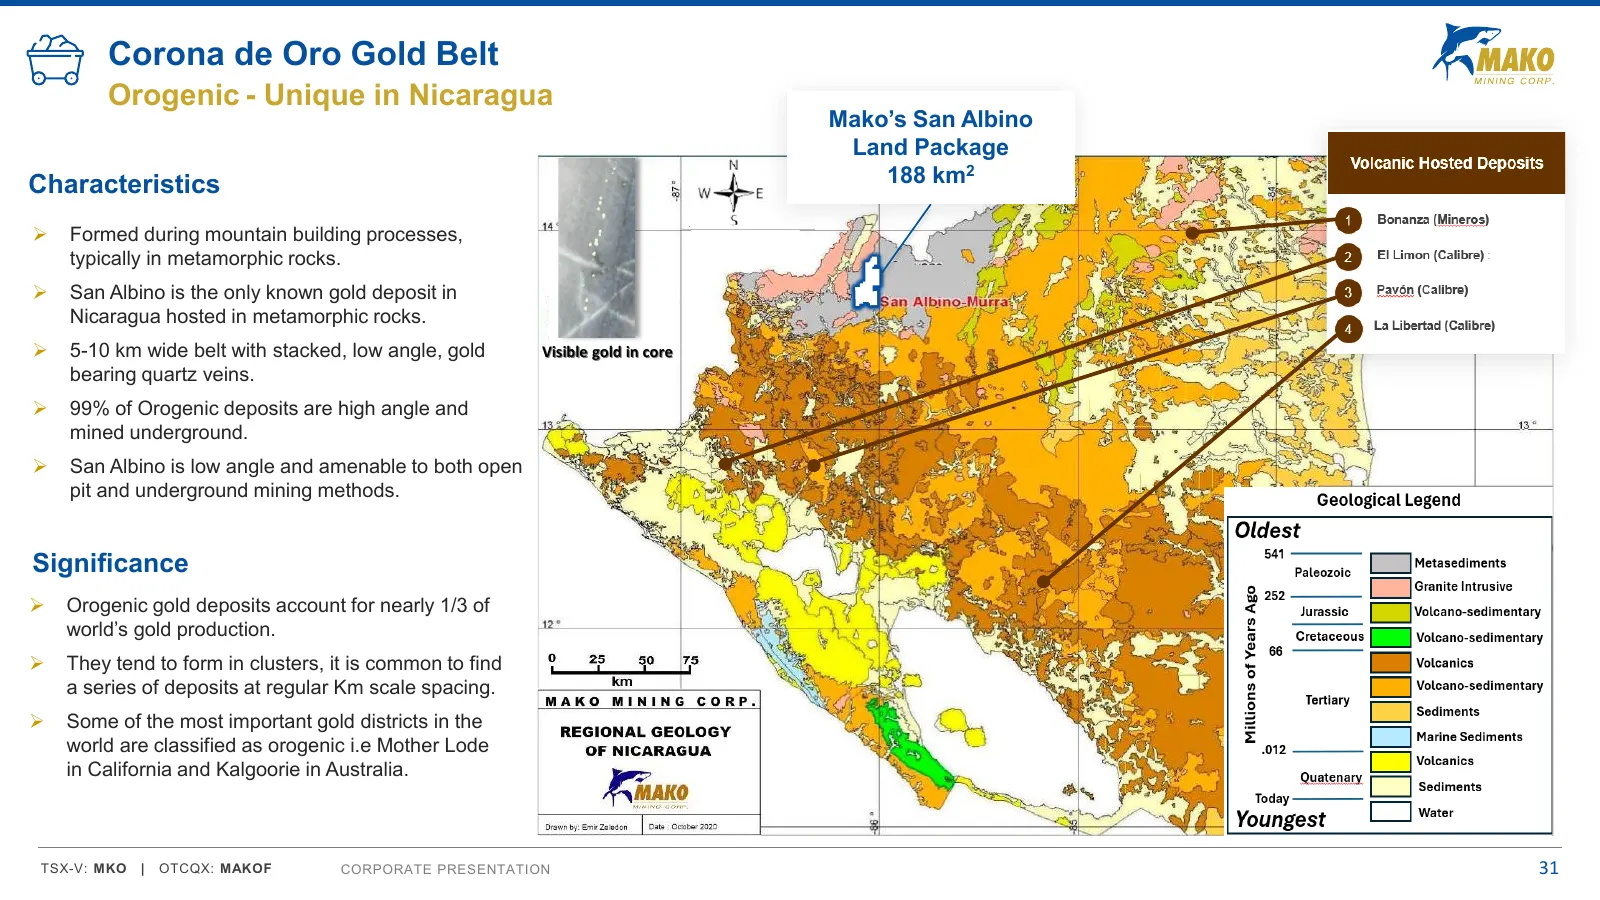
Slide 31: Corona de Oro Gold Belt
Corona de Oro Gold Belt Orogenic - Unique in Nicaragua Mako’s San Albino Land Package Characteristics 188 km2 ➢ Formed during mountain building processes, typically in metamorphic rocks. ➢ San Albino is the only known gold deposit in Nicaragua hosted in metamorphic rocks. ➢ 5-10 km wide belt with st
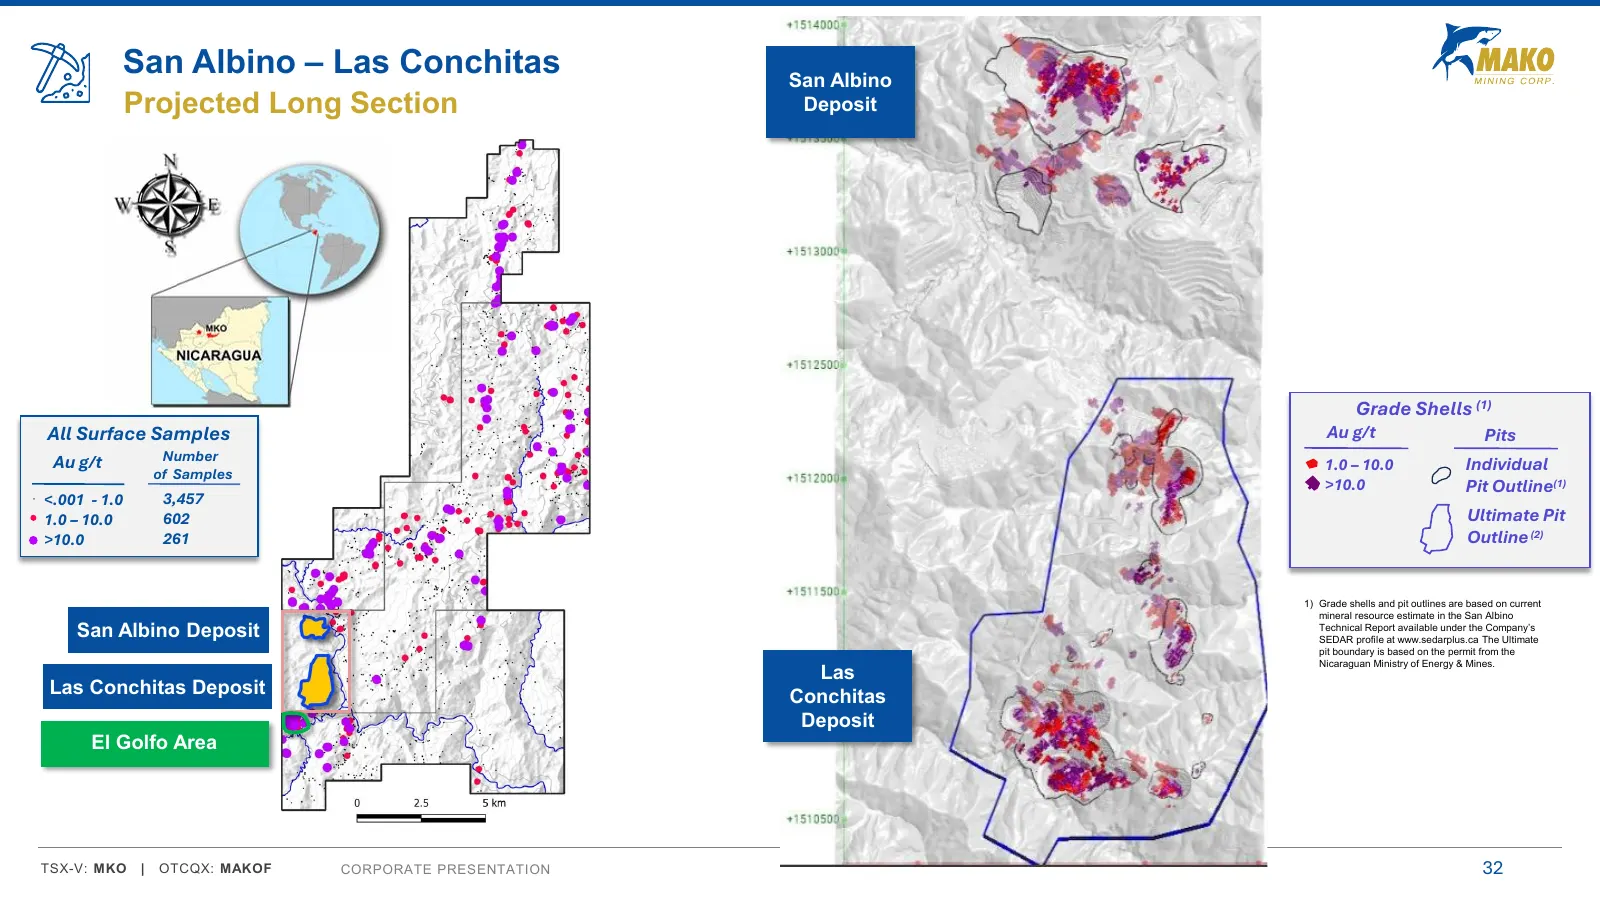
Slide 32: San Albino – Las Conchitas
San Albino – Las Conchitas San Albino Projected Long Section Deposit Grade Shells (1) All Surface Samples Au g/t Pits Au g/t Number of Samples 1.0 – 10.0 Individual >10.0 Pit Outline(1) <.001 - 1.0 3,457 1.0 – 10.0 602 Ultimate Pit >10.0 261 Outline (2) 1) Grade shells and pit outlines are based on
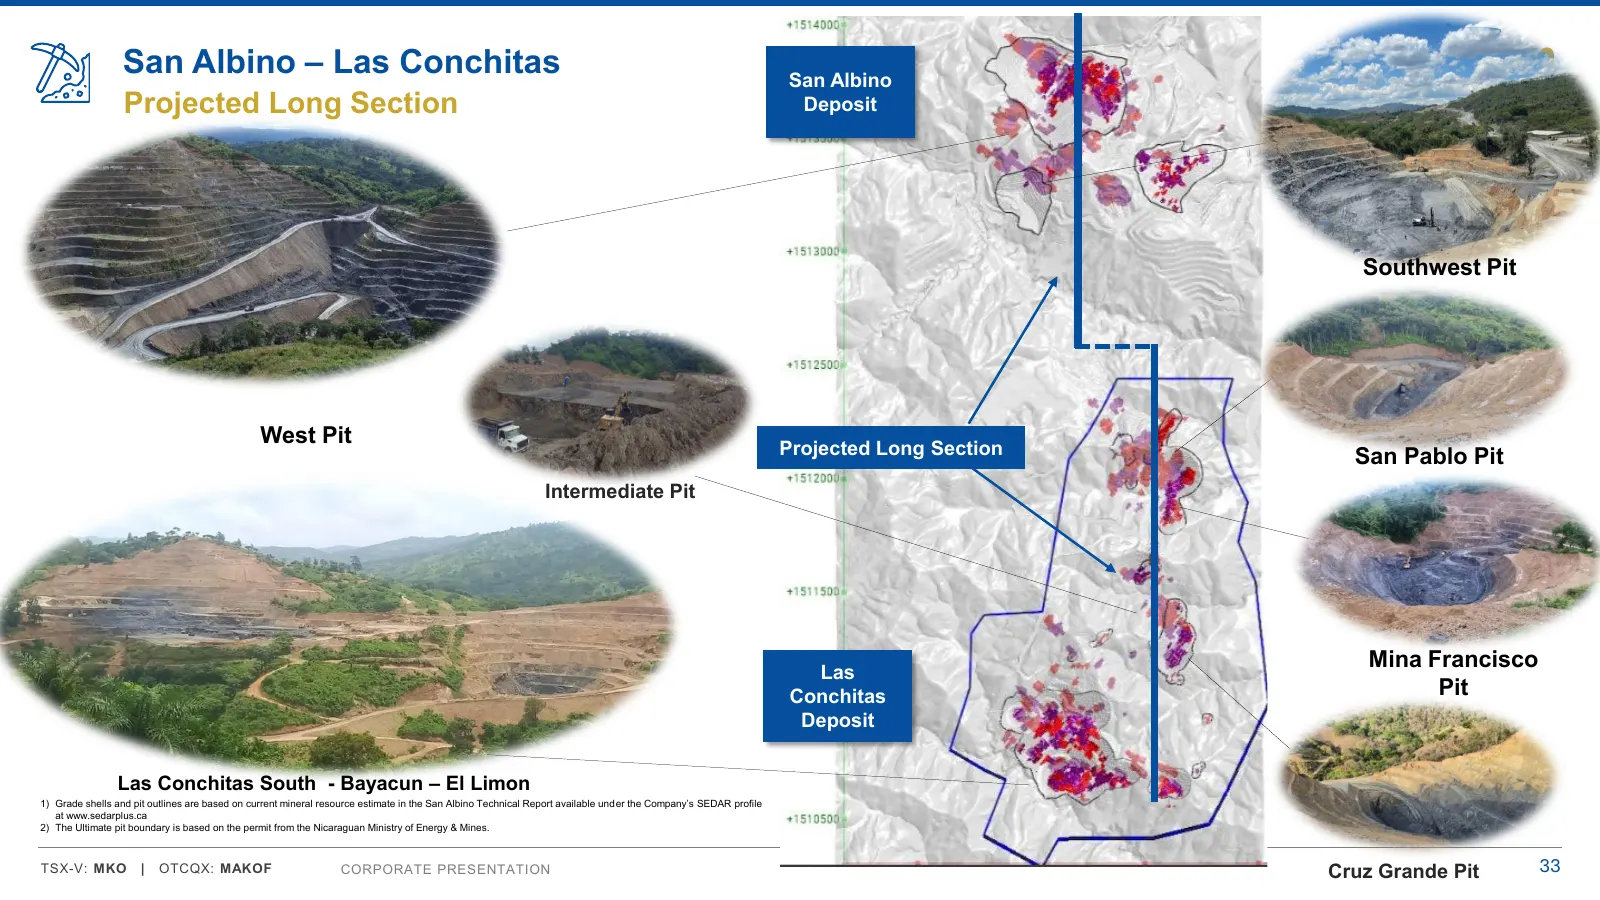
Slide 33: San Albino – Las Conchitas
San Albino – Las Conchitas San Albino Projected Long Section Deposit Southwest Pit West Pit Projected Long Section San Pablo Pit Intermediate Pit Mina Francisco Las Conchitas Pit Deposit Las Conchitas South - Bayacun – El Limon 1) Grade shells and pit outlines are based on current mineral resource e
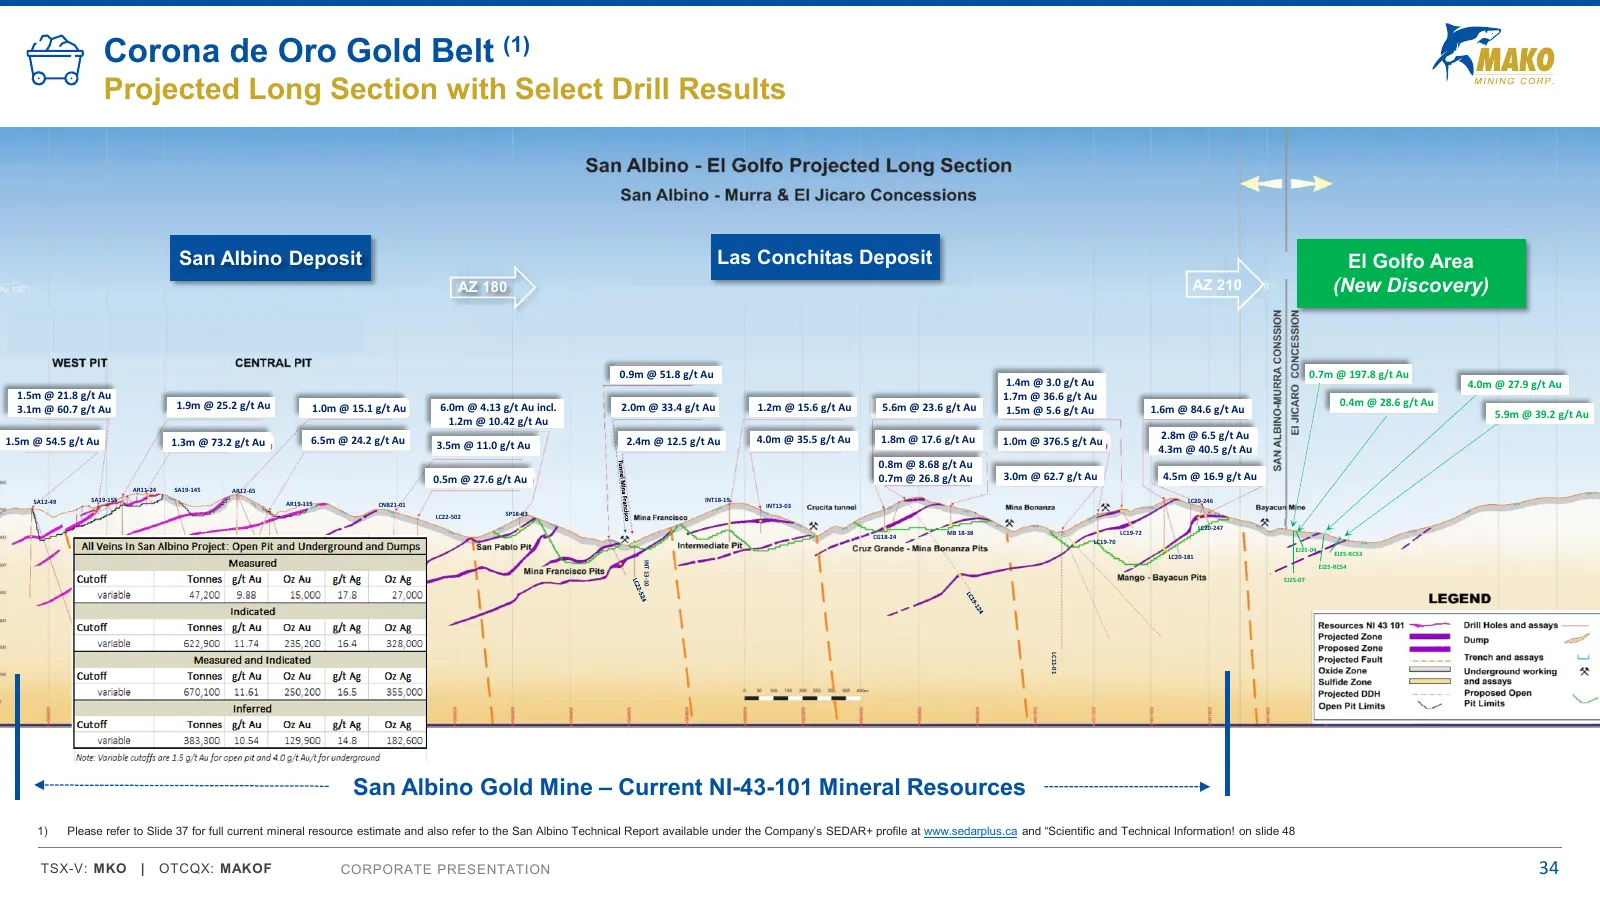
Slide 34: Corona de Oro Gold Belt: Projected Long Section with Select Drill Results
Corona de Oro Gold Belt (1) Projected Long Section with Select Drill Results San San Albino Albino Deposit Deposit Las Conchitas Las Conchitas Deposit Deposit El Golfo El Golfo Area Area AZ 180 AZ 210 (New Discovery) 0.9m @ 51.8 g/t Au 0.7m @ 197.8 g/t Au 1.4m @ 3.0 g/t Au 4.0m @ 27.9 g/t Au 1.5m @
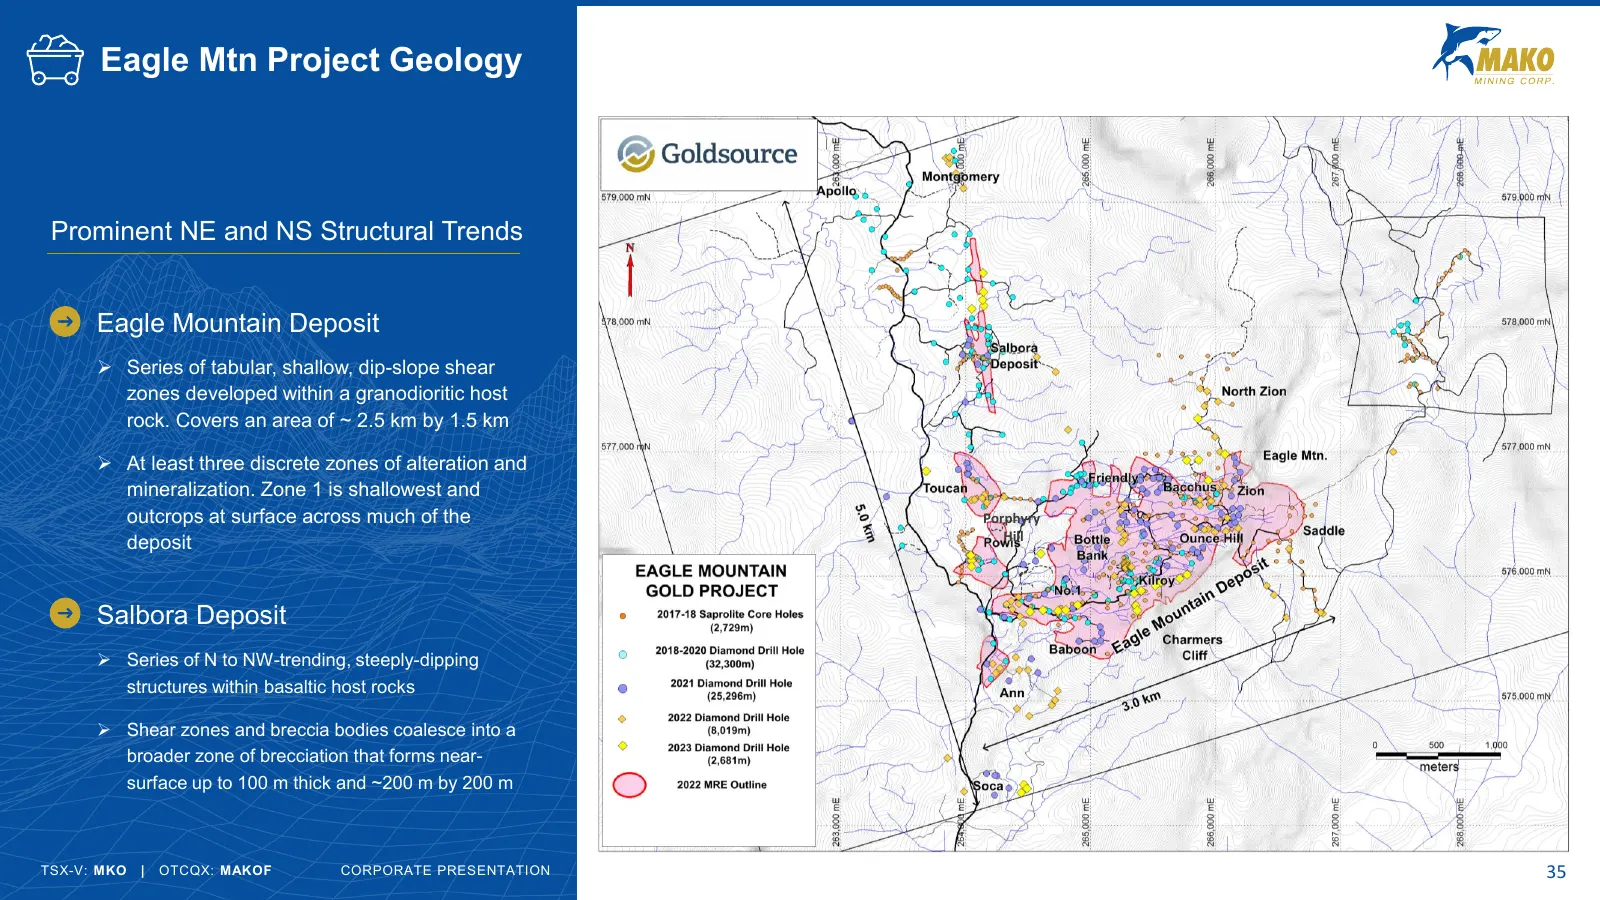
Slide 35: Eagle Mtn Project Geology
Eagle Mtn Project Geology Prominent NE and NS Structural Trends Eagle Mountain Deposit ➢ Series of tabular, shallow, dip-slope shear zones developed within a granodioritic host rock. Covers an area of ~ 2.5 km by 1.5 km ➢ At least three discrete zones of alteration and mineralization. Zone 1 is shal
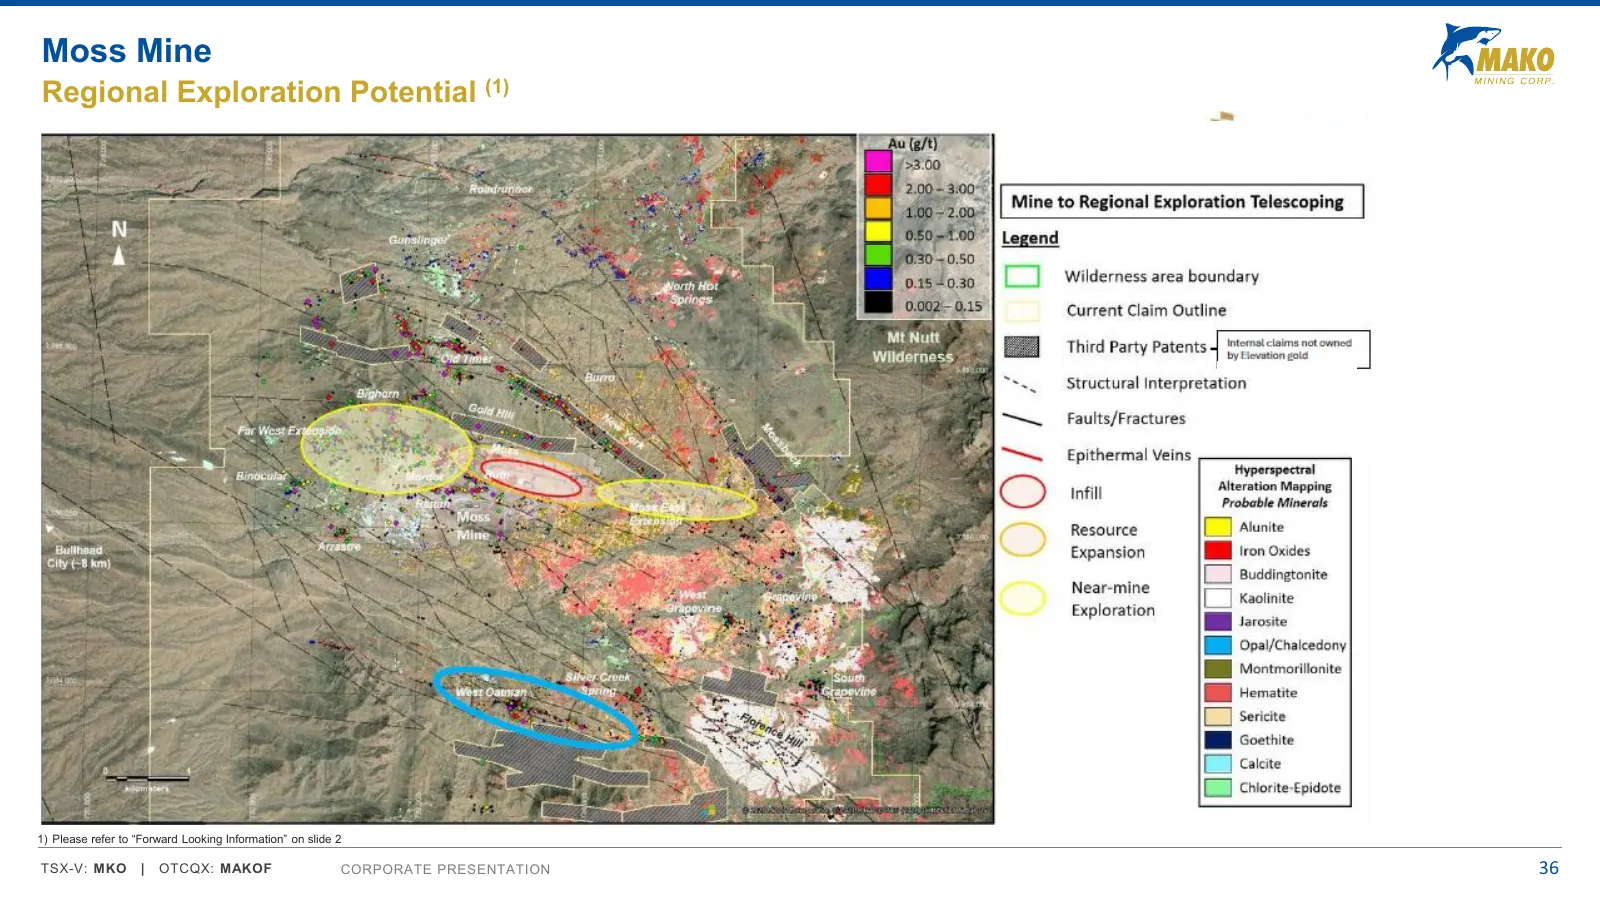
Slide 36: Moss Mine Regional Exploration Potential
Moss Mine Regional Exploration Potential (1) 1) Please refer to “Forward Looking Information” on slide 2 TSX-V: MKO | OTCQX: MAKOF CORPORATE PRESENTATION 36
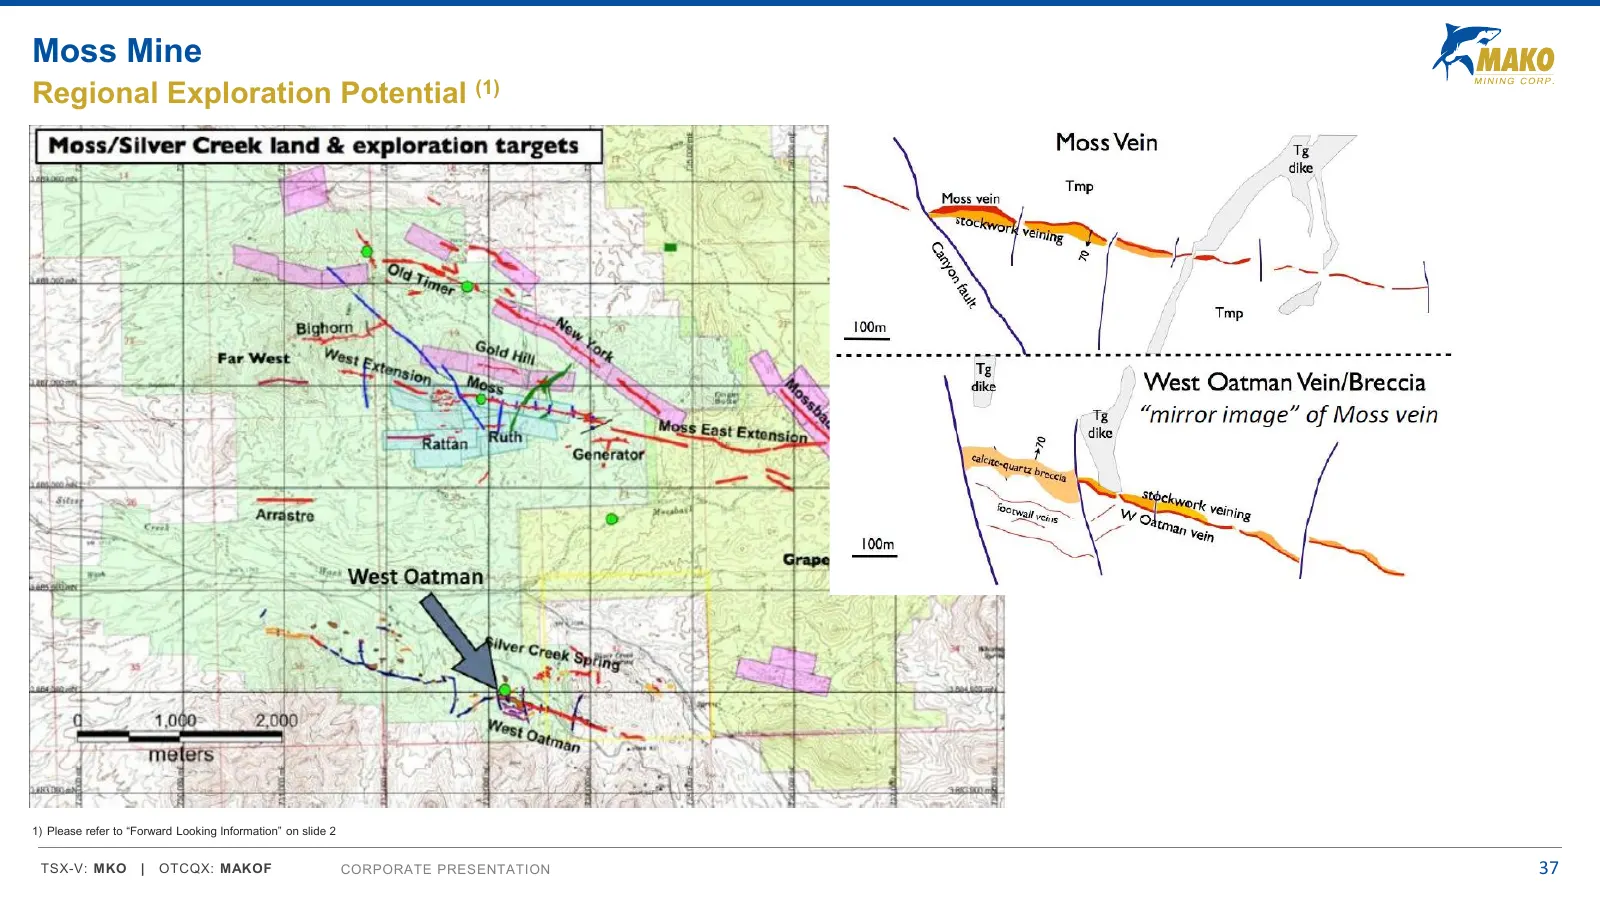
Slide 37: Moss Mine Regional Exploration Potential
Moss Mine Regional Exploration Potential (1) 1) Please refer to “Forward Looking Information” on slide 2 TSX-V: MKO | OTCQX: MAKOF CORPORATE PRESENTATION 37
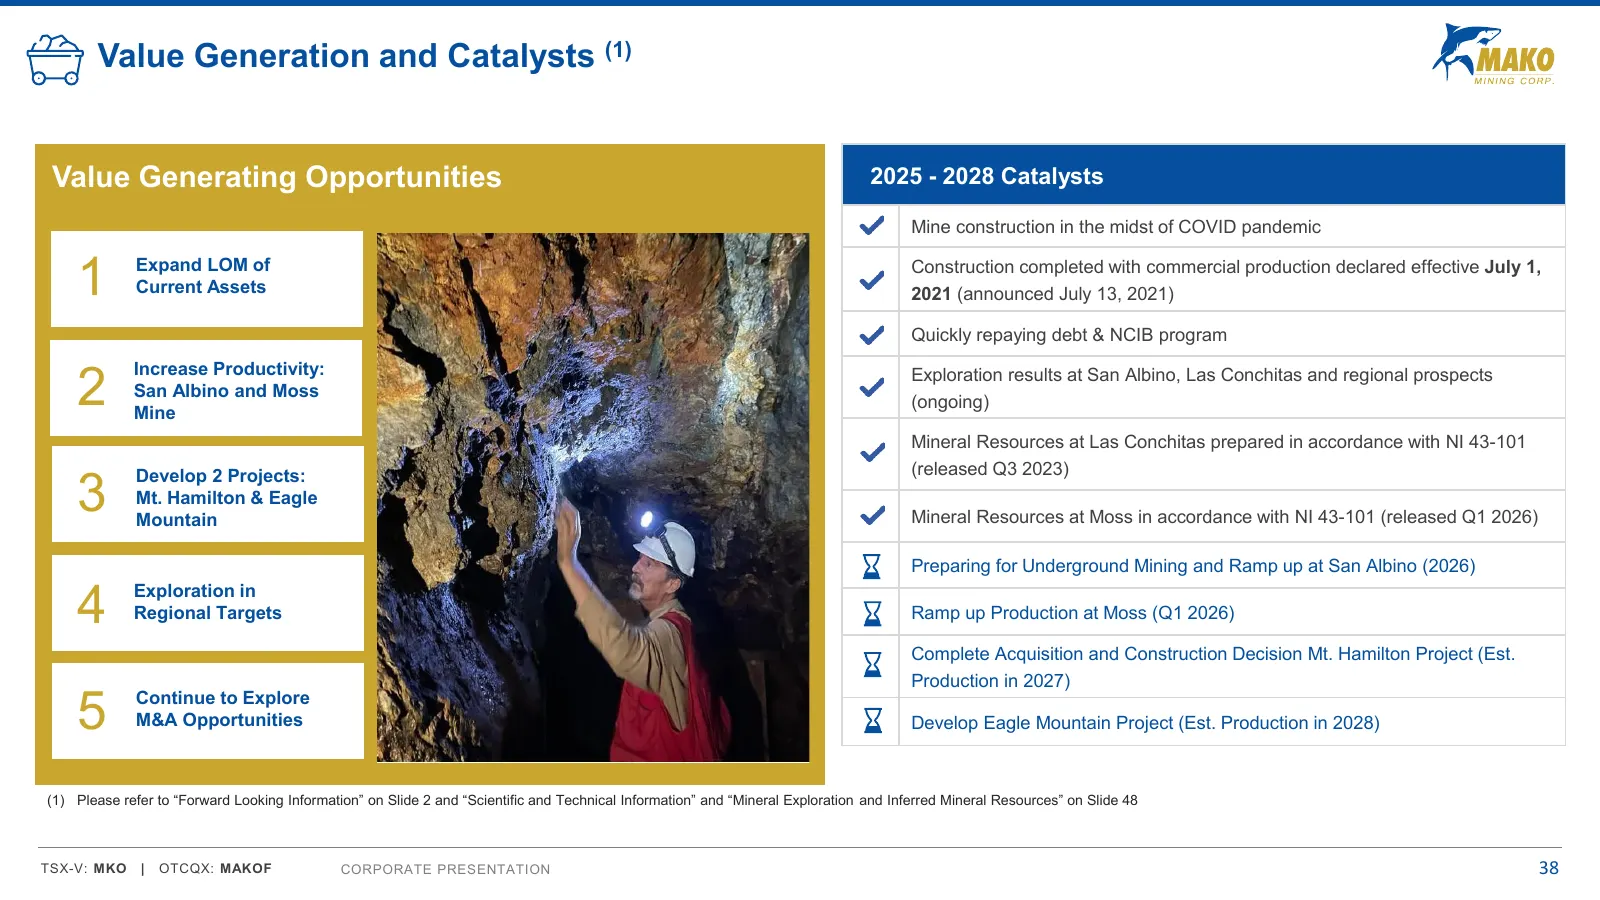
Slide 38: Value Generation and Catalysts
Value Generation and Catalysts (1) Value Generating Opportunities 2025 - 2028 Catalysts Mine construction in the midst of COVID pandemic 1 Expand LOM of Current Assets Construction completed with commercial production declared effective July 1, 2021 (announced July 13, 2021) Quickly repaying debt &
Slide 39: Appendix
Appendix 39
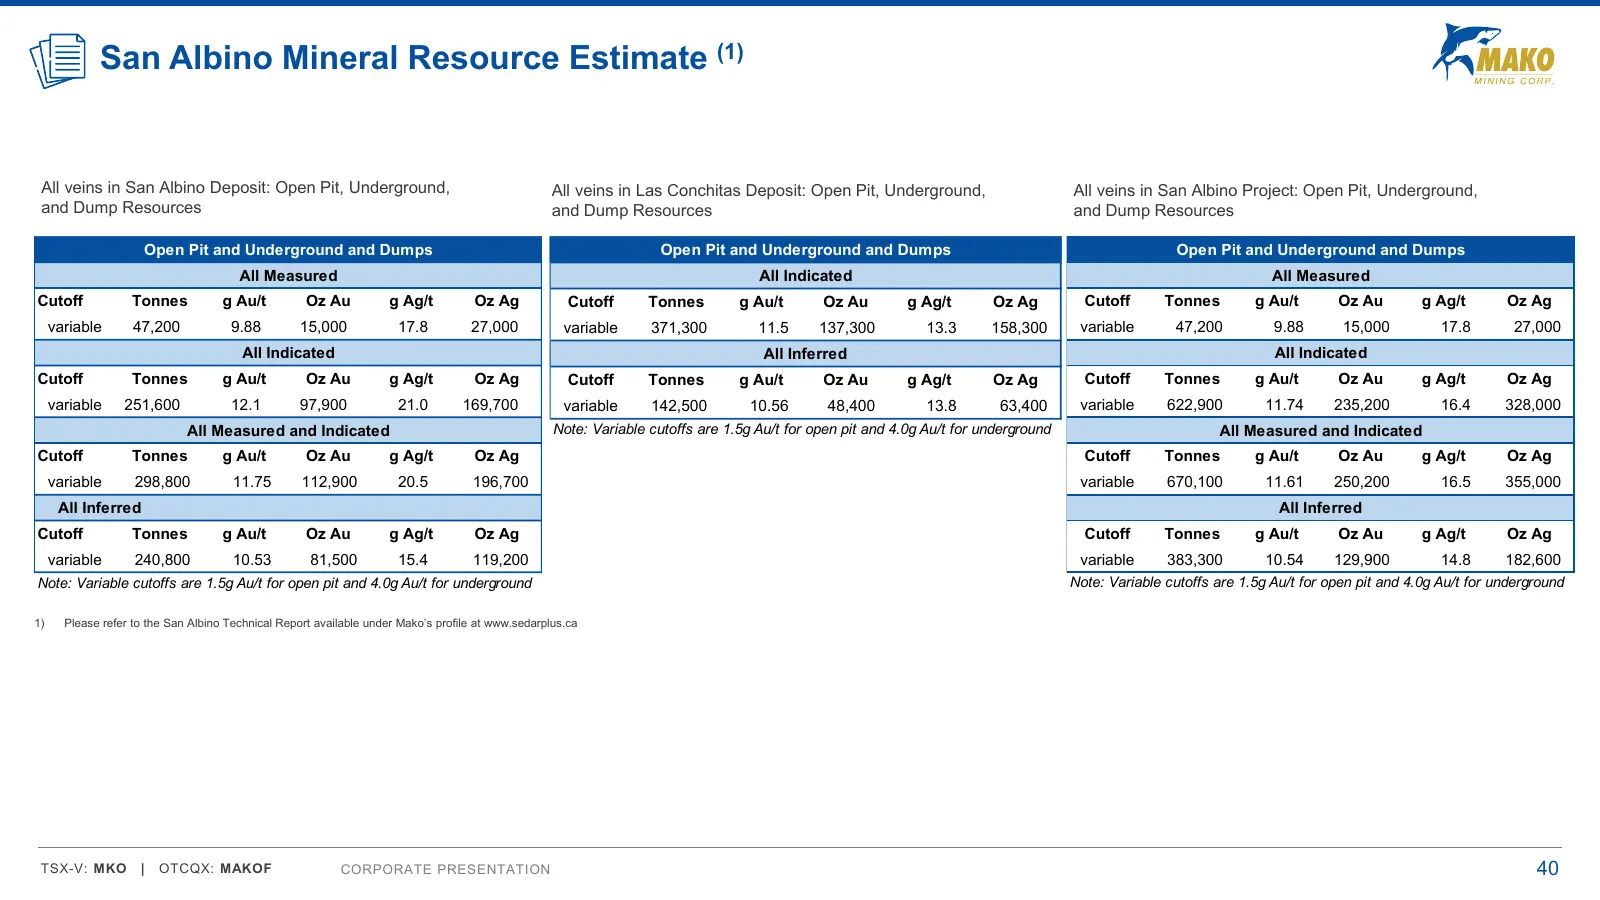
Slide 40: San Albino Mineral Resource Estimate
San Albino Mineral Resource Estimate (1) All veins in San Albino Deposit: Open Pit, Underground, All veins in Las Conchitas Deposit: Open Pit, Underground, All veins in San Albino Project: Open Pit, Underground, and Dump Resources and Dump Resources and Dump Resources Open Pit and Underground and Du
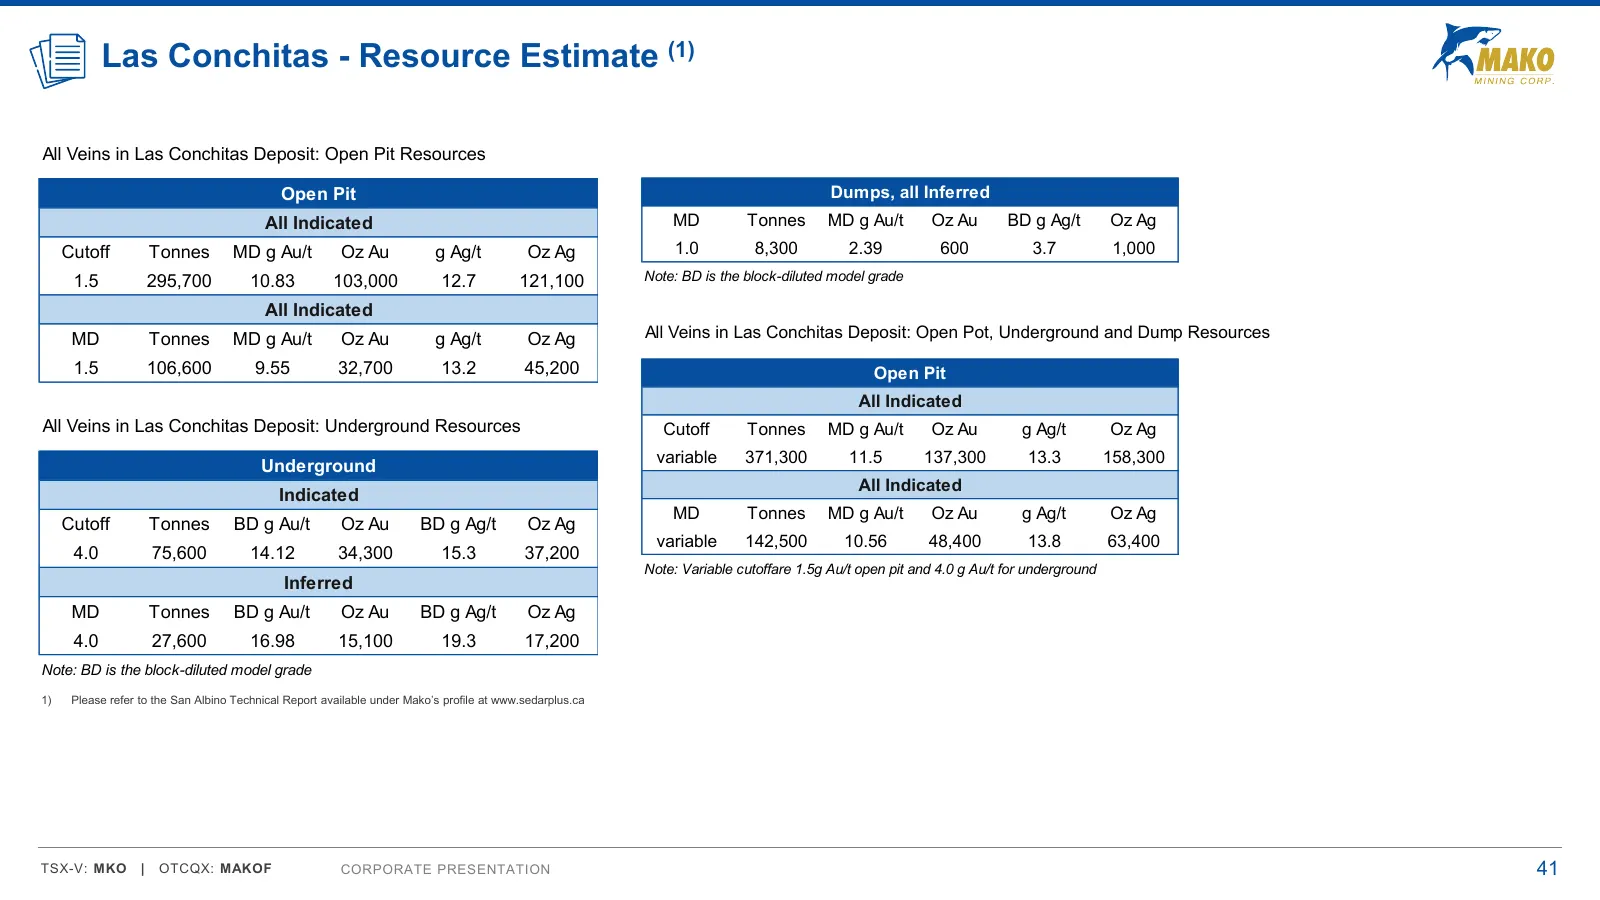
Slide 41: Las Conchitas - Resource Estimate
Las Conchitas - Resource Estimate (1) All Veins in Las Conchitas Deposit: Open Pit Resources Open Pit Dumps, all Inferred All Indicated MD Tonnes MD g Au/t Oz Au BD g Ag/t Oz Ag Cutoff Tonnes MD g Au/t Oz Au g Ag/t Oz Ag 1.0 8,300 2.39 600 3.7 1,000 1.5 295,700 10.83 103,000 12.7 121,100 Note: BD is
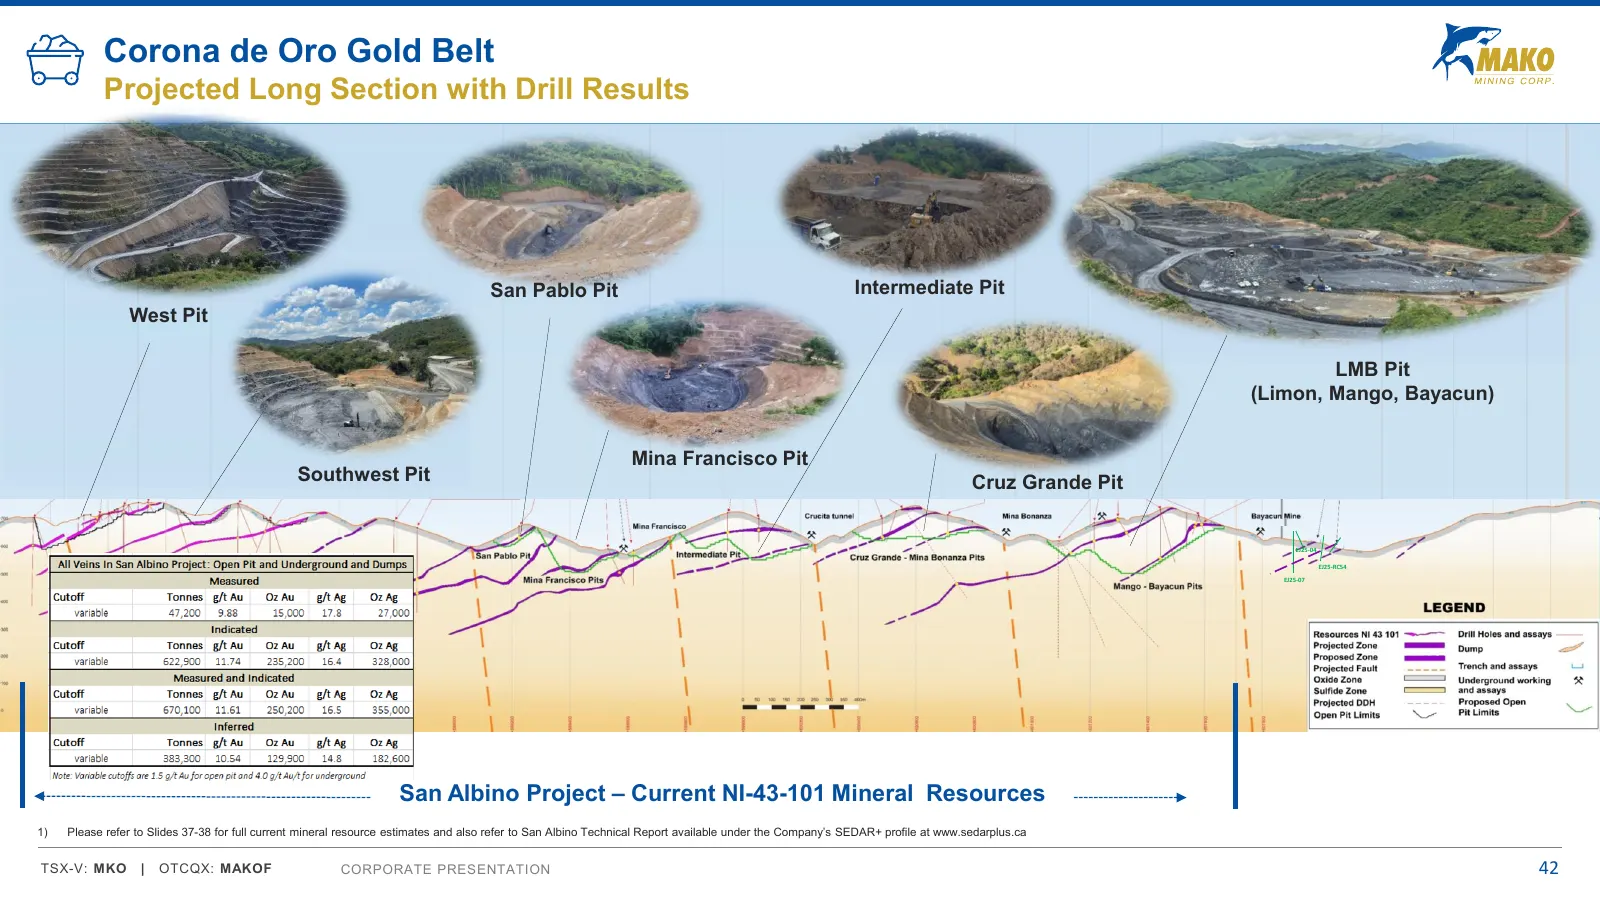
Slide 42: Corona de Oro Gold Belt: Projected Long Section with Drill Results
Corona de Oro Gold Belt Projected Long Section with Drill Results San Pablo Pit Intermediate Pit Q4 2023 West Pit LC22-524 LMB Pit (Limon, Mango, Bayacun) 0.9m @ 51.8 g/t Au LC19-72 SA19-155 1.4m @ 3.0 g/t Au AR11-24 SP18-03 Tunnel Mina Francisco INT18-19 LC20-181 EJ15-TR-03 1.5m @ 21.8 g/t Au AR12-
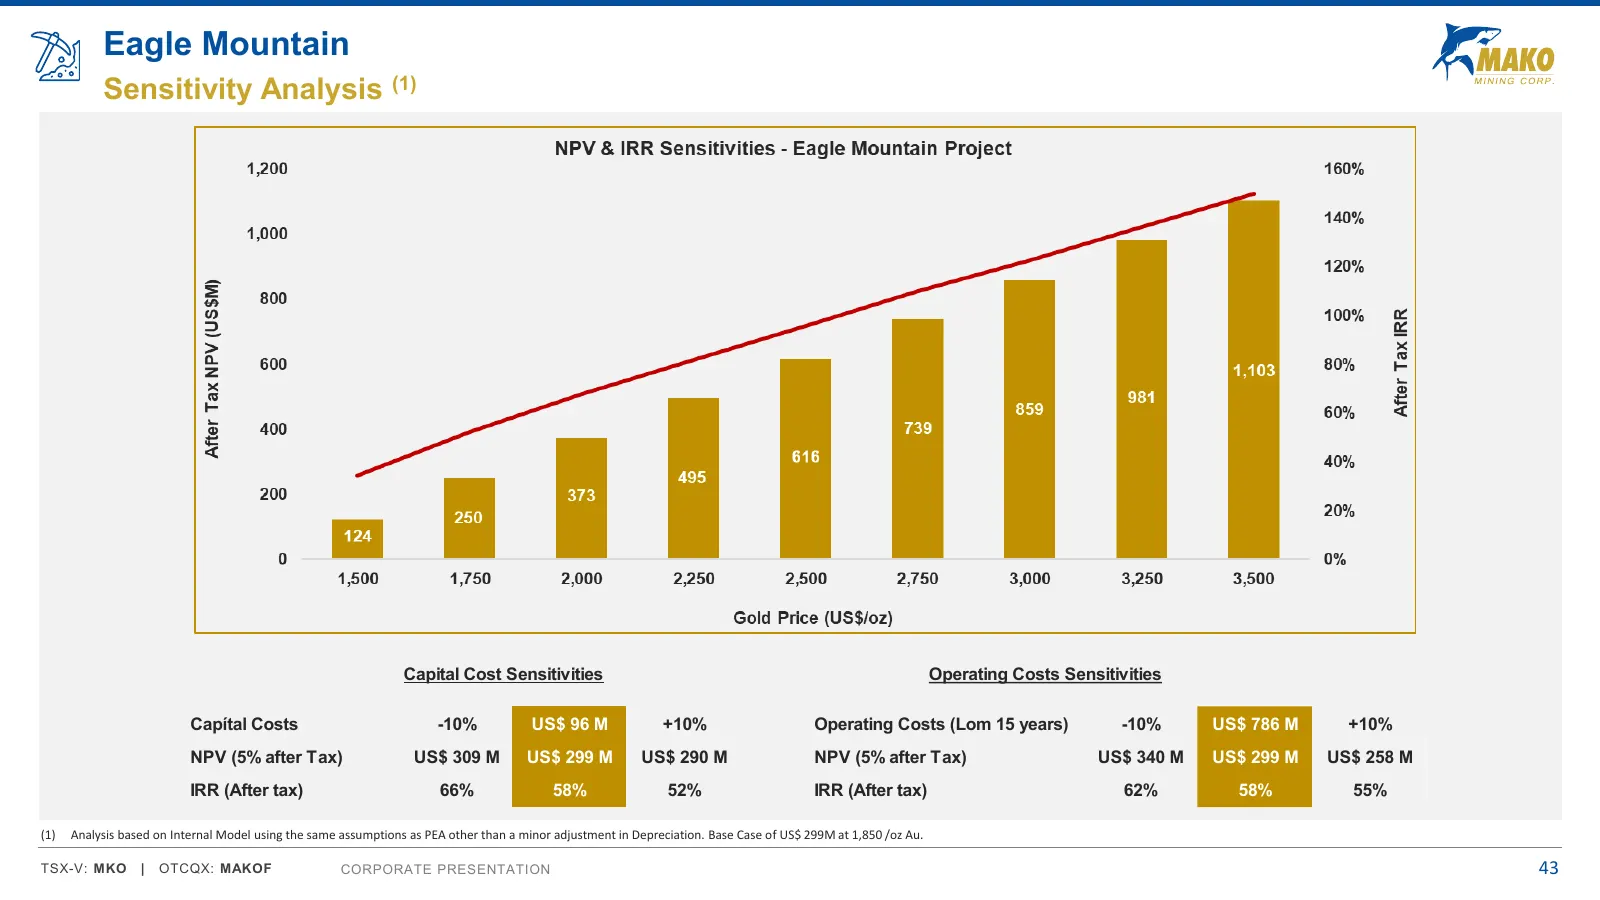
Slide 43: Eagle Mountain Sensitivity Analysis
Eagle Mountain Sensitivity Analysis (1) Capital Cost Sensitivities Operating Costs Sensitivities Capítal Costs -10% US$ 96 M +10% Operating Costs (Lom 15 years) -10% US$ 786 M +10% NPV (5% after Tax) US$ 309 M US$ 299 M US$ 290 M NPV (5% after Tax) US$ 340 M US$ 299 M US$ 258 M IRR (After tax) 66% 5
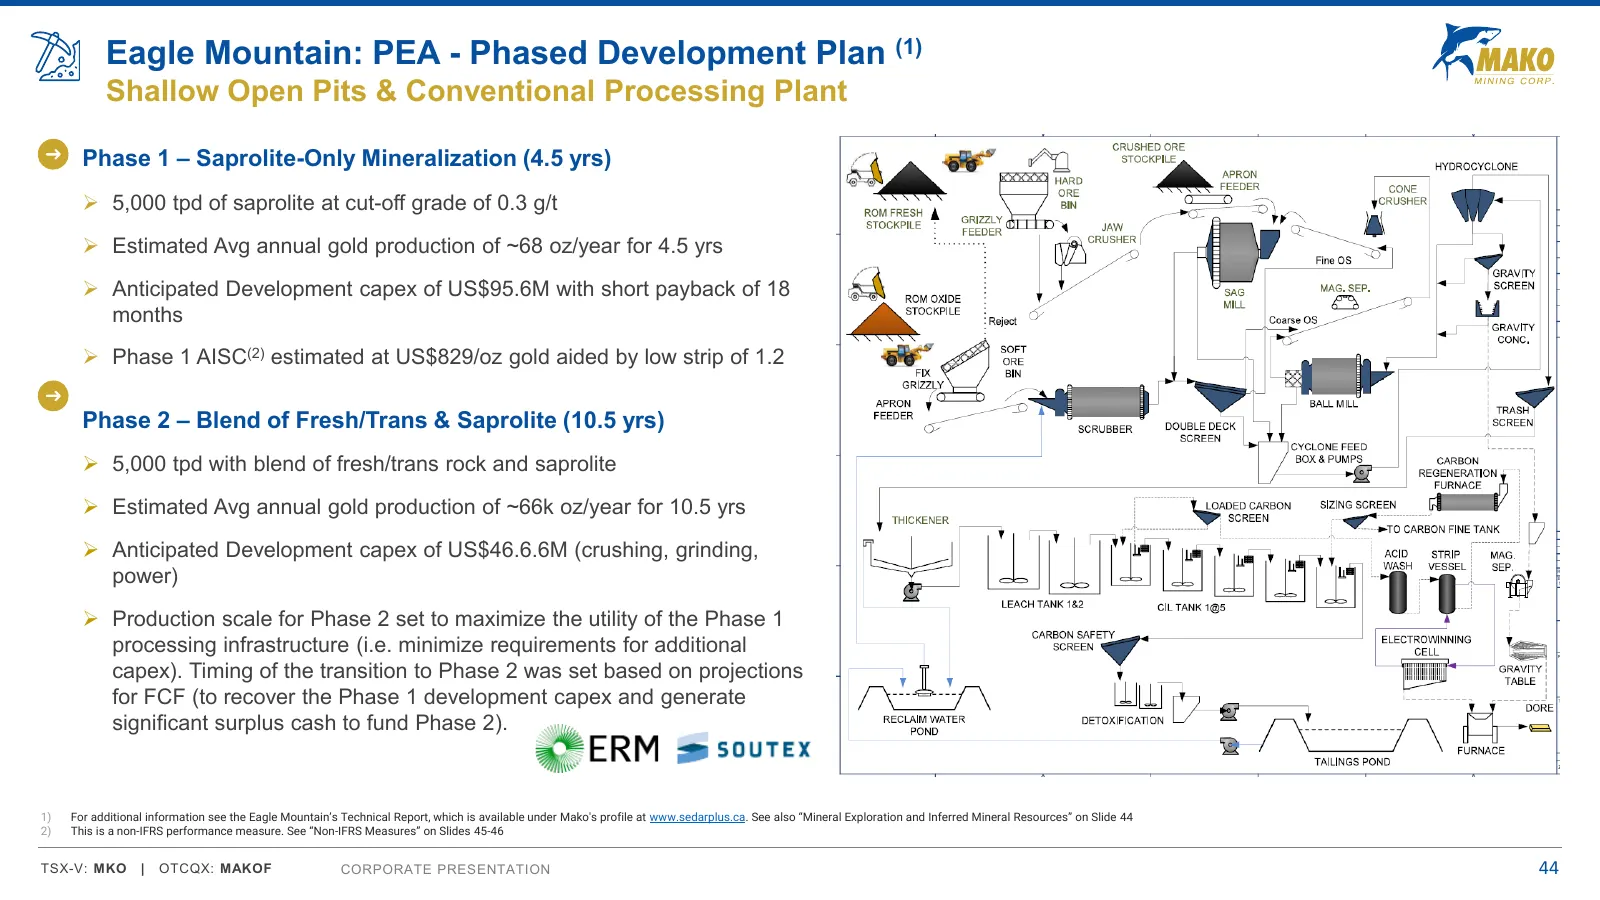
Slide 44: Eagle Mountain: PEA - Phased Development Plan
Eagle Mountain: PEA - Phased Development Plan (1) Shallow Open Pits & Conventional Processing Plant Phase 1 – Saprolite-Only Mineralization (4.5 yrs) ➢ 5,000 tpd of saprolite at cut-off grade of 0.3 g/t ➢ Estimated Avg annual gold production of ~68 oz/year for 4.5 yrs ➢ Anticipated Development capex
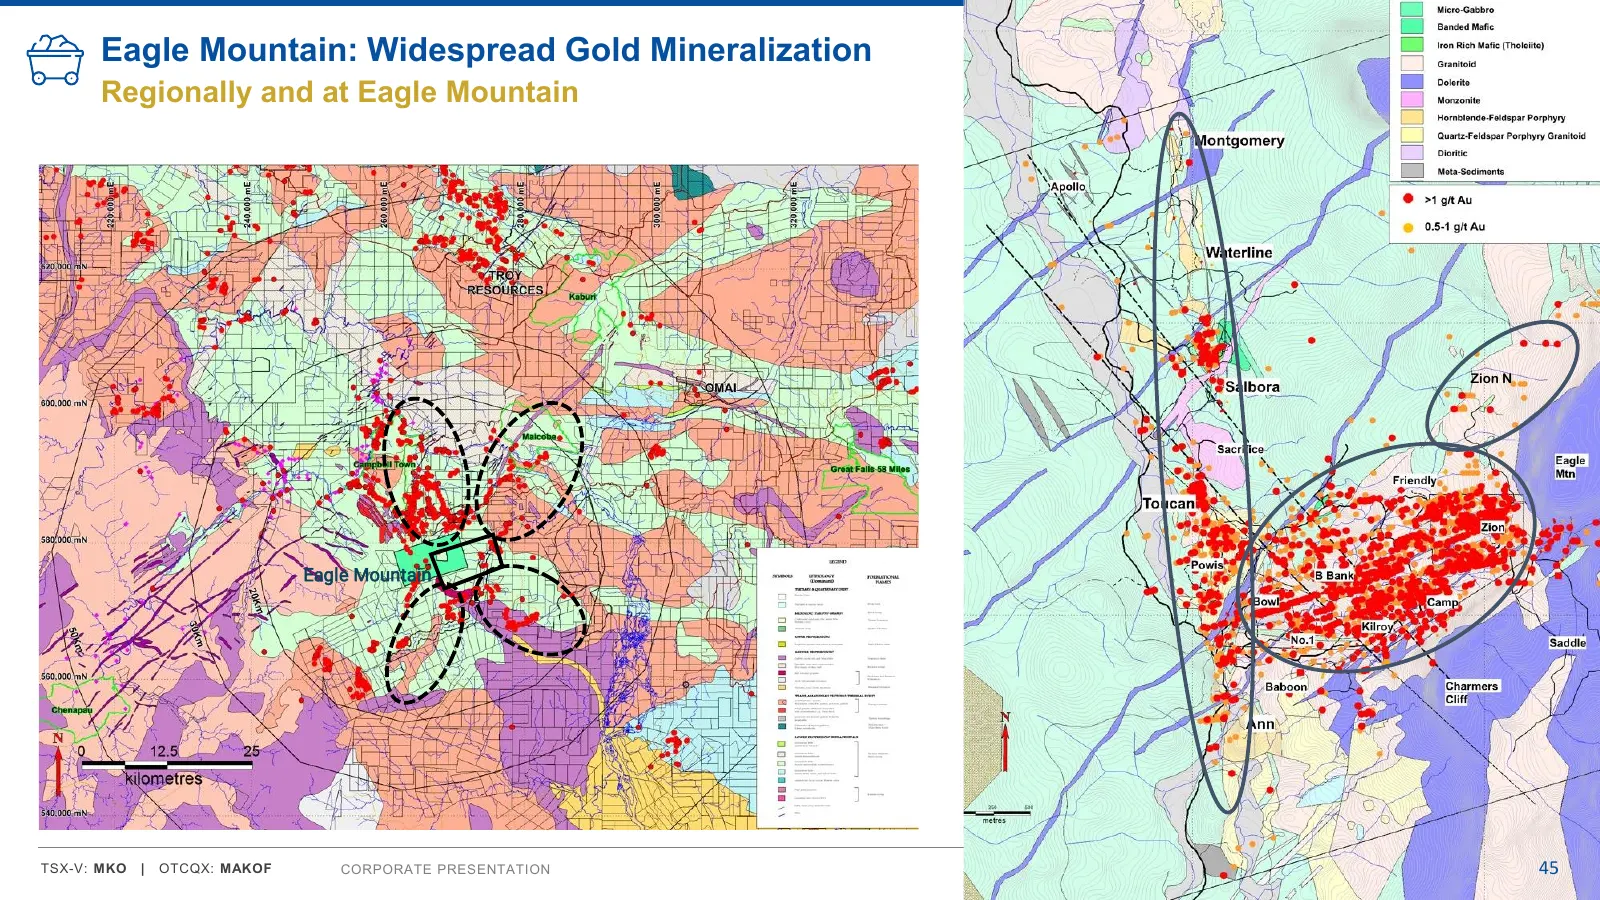
Slide 45: Eagle Mountain: Widespread Gold Mineralization
Eagle Mountain: Widespread Gold Mineralization Regionally and at Eagle Mountain Zion N Eagle Mountain TSX-V: MKO | OTCQX: MAKOF CORPORATE PRESENTATION 45
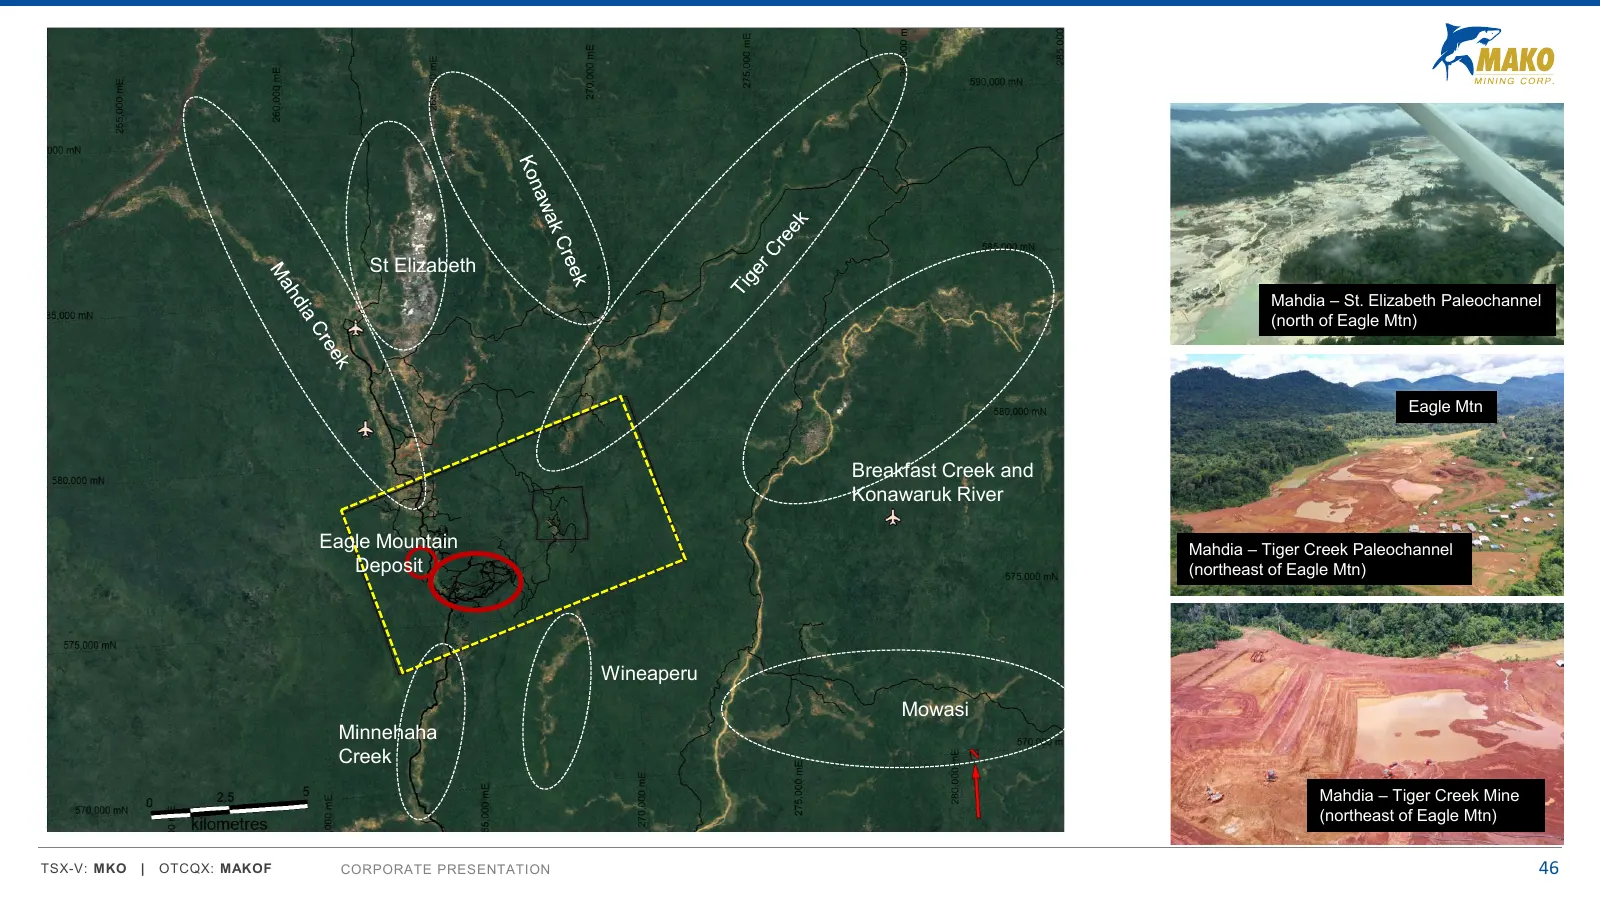
Slide 46: Eagle Mountain regional paleochannels and deposits
St Elizabeth Mahdia – St. Elizabeth Paleochannel (north of Eagle Mtn) Mahdia Valley Eagle Mtn Breakfast Creek and Konawaruk River Salbora Eagle Mountain Mahdia – Tiger Creek Paleochannel Deposit (northeast of Eagle Mtn) Minnehaha River Wineaperu Mowasi Minnehaha Creek Mahdia – Tiger Creek Mine (nort
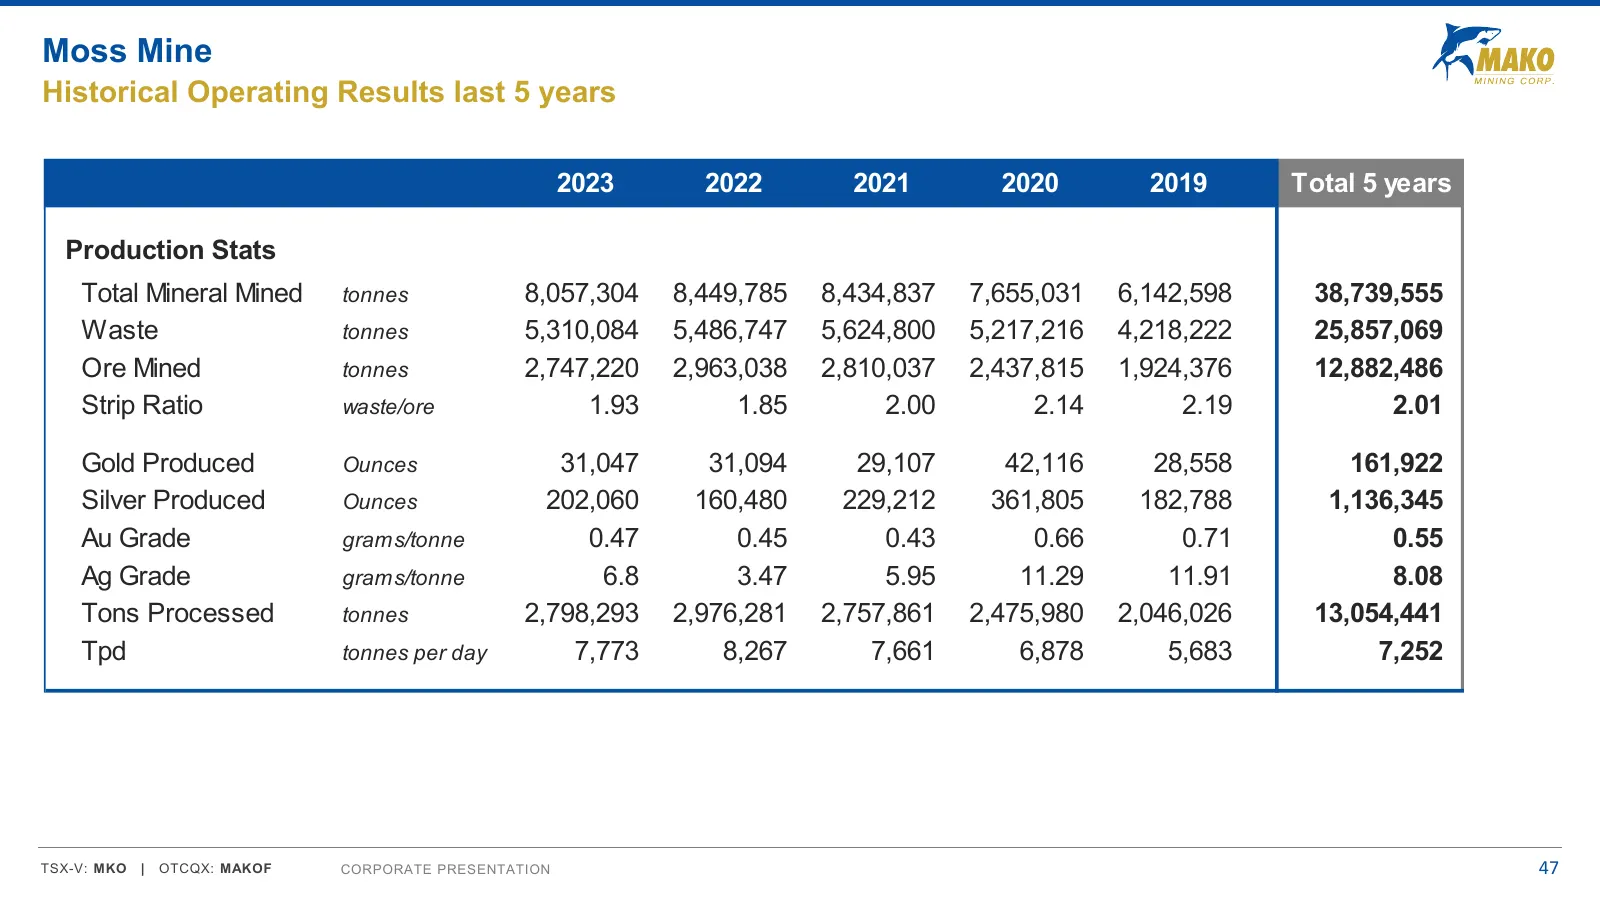
Slide 47: Moss Mine Historical Operating Results
Moss Mine Historical Operating Results last 5 years 2023 2022 2021 2020 2019 Total 5 years Production Stats Total Mineral Mined tonnes 8,057,304 8,449,785 8,434,837 7,655,031 6,142,598 38,739,555 Waste tonnes 5,310,084 5,486,747 5,624,800 5,217,216 4,218,222 25,857,069 Ore Mined tonnes 2,747,220 2,9
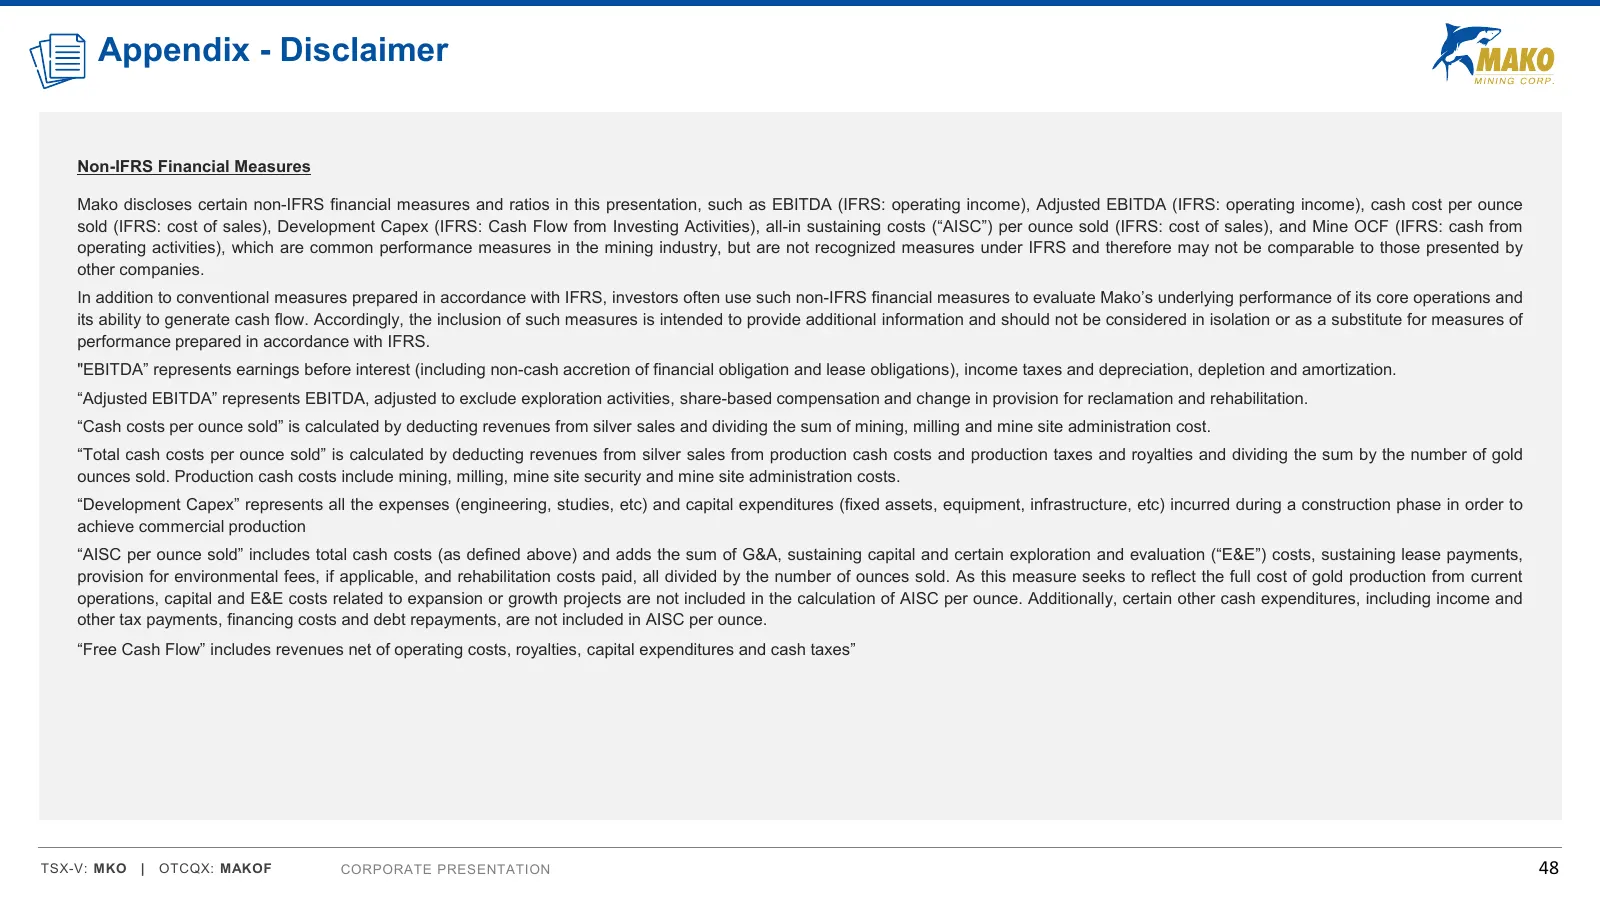
Slide 48: Appendix - Disclaimer: Non-IFRS Financial Measures
Appendix - Disclaimer Non-IFRS Financial Measures Mako discloses certain non-IFRS financial measures and ratios in this presentation, such as EBITDA (IFRS: operating income), Adjusted EBITDA (IFRS: operating income), cash cost per ounce sold (IFRS: cost of sales), Development Capex (IFRS: Cash Flow
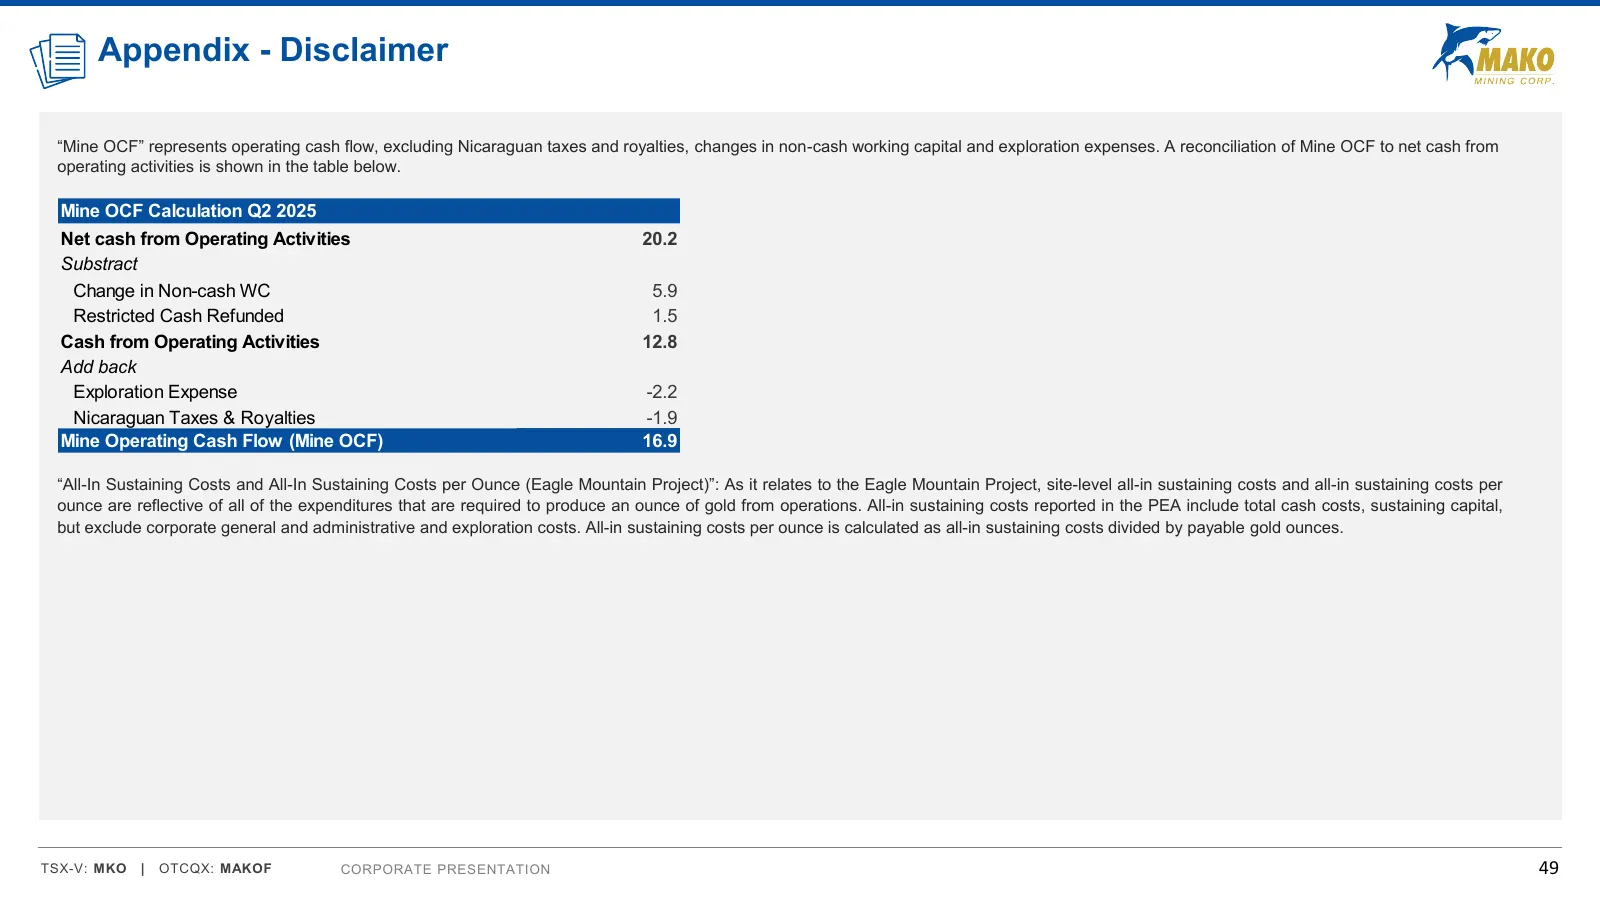
Slide 49: Appendix - Disclaimer: Mine OCF and AISC
Appendix - Disclaimer “Mine OCF” represents operating cash flow, excluding Nicaraguan taxes and royalties, changes in non-cash working capital and exploration expenses. A reconciliation of Mine OCF to net cash from operating activities is shown in the table below. Mine OCF Calculation Q2 2025 Net ca
Slide 50: Appendix - Disclaimer: Scientific and Technical Information
Appendix - Disclaimer Scientific and Technical Information All scientific and technical information relating to the San Albino Project contained in this presentation is derived from the technical report with an effective date of October 11th, 2023, as amended on June 10th, 2024 and titled “Amended T
Slide 51: Thank You
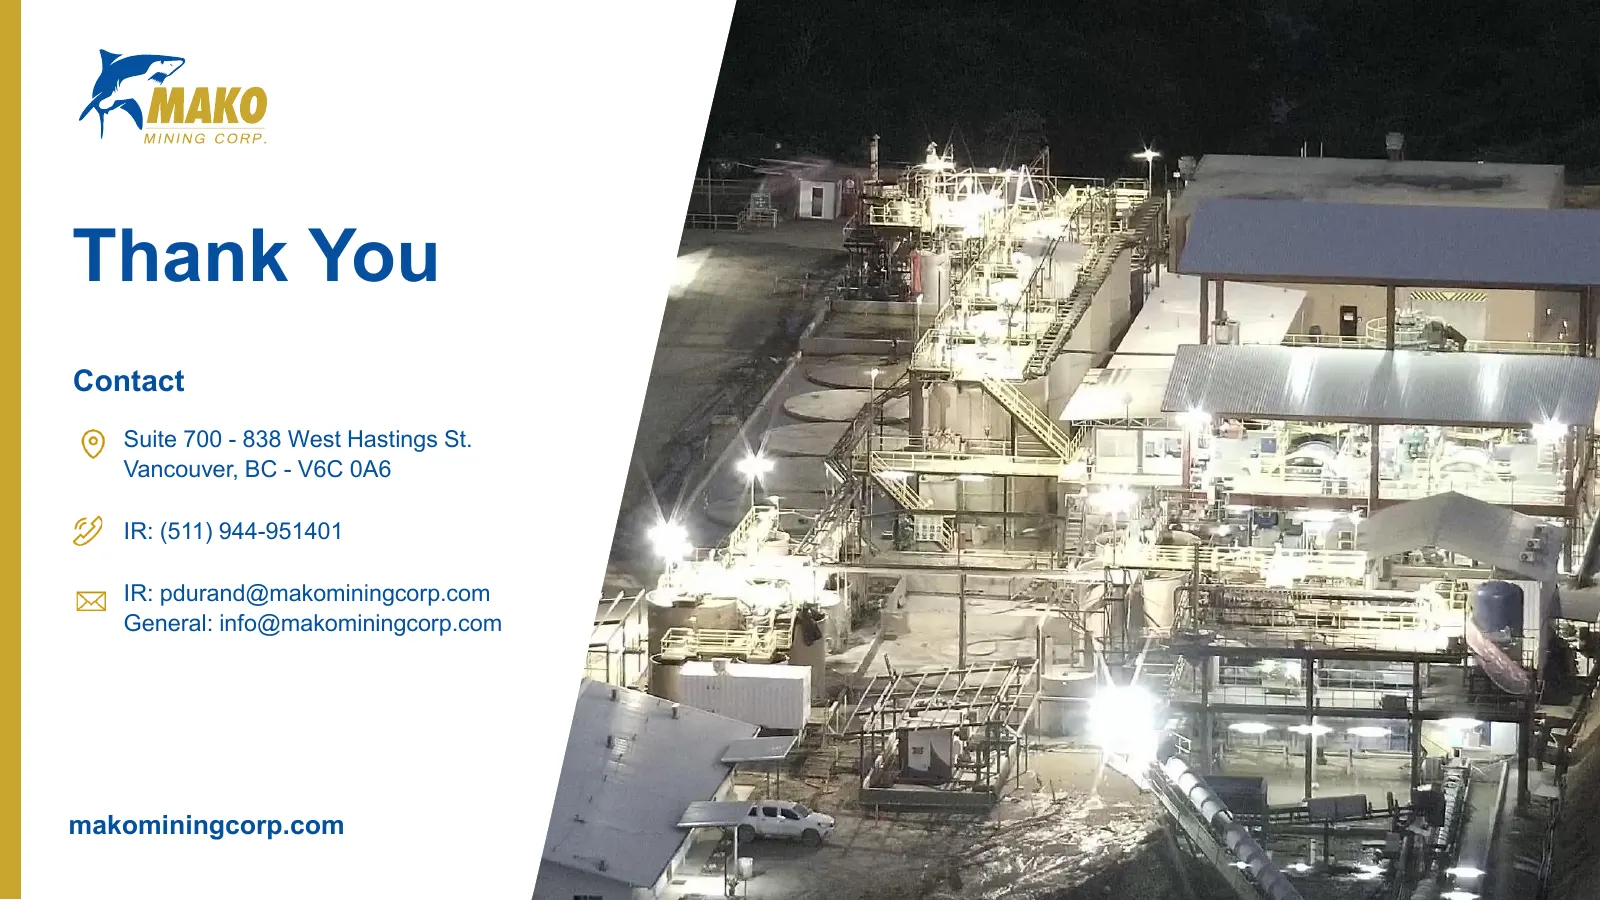
Thank You Contact Suite 700 - 838 West Hastings St. Vancouver, BC - V6C 0A6 IR: (511) 944-951401 IR: pdurand@makominingcorp.com General: info@makominingcorp.com makominingcorp.com
Source: Internet Archive copy of makominingcorp.com
More decks from Mako Mining Corp.
 Investor Presentation (November 2026)49 slides · November 2026
 Investor Presentation (September 2026)48 slides · September 2026
 Merger or Acquisition (October 2025)13 slides · October 2025
 Investor Presentation (March 2025)48 slides · March 2025
 Investor Presentation (September 2024)45 slides · September 2024
 Merger or Acquisition (June 2024)35 slides · June 2024