Crestwood Midstream Partners LP
Crestwood Midstream Partners LP — Morgan Stanley MLP and Diversified Natural Gas Corporate Access Day (March 2012)
30 slides from Crestwood Midstream Partners LP's conference presentation, Mar 8, 2012
Slide 1: Morgan Stanley MLP and Diversified Natural Gas Corporate Access Day
Exhibit 99.1 Morgan Stanley MLP and Diversified Natural Gas Corporate Access Day March 8, 2012
Slide 2: Forward Looking Statements
Forward Looking Statements This presentation contains forward-looking statements and projections, made in reliance on the safe harbor provisions of the Private Securities Litigation Reform Act of 1995, regarding future events, occurrences, circumstances, activities, performance, outcomes and results
Slide 3: Table of Contents
Table of Contents 1. Antero Marcellus Overview 2. Crestwood Update 3. Financial Overview 3
Slide 4: Antero Marcellus Overview
* * * * * * Antero Marcellus Overview 4
Slide 5: Transaction Overview
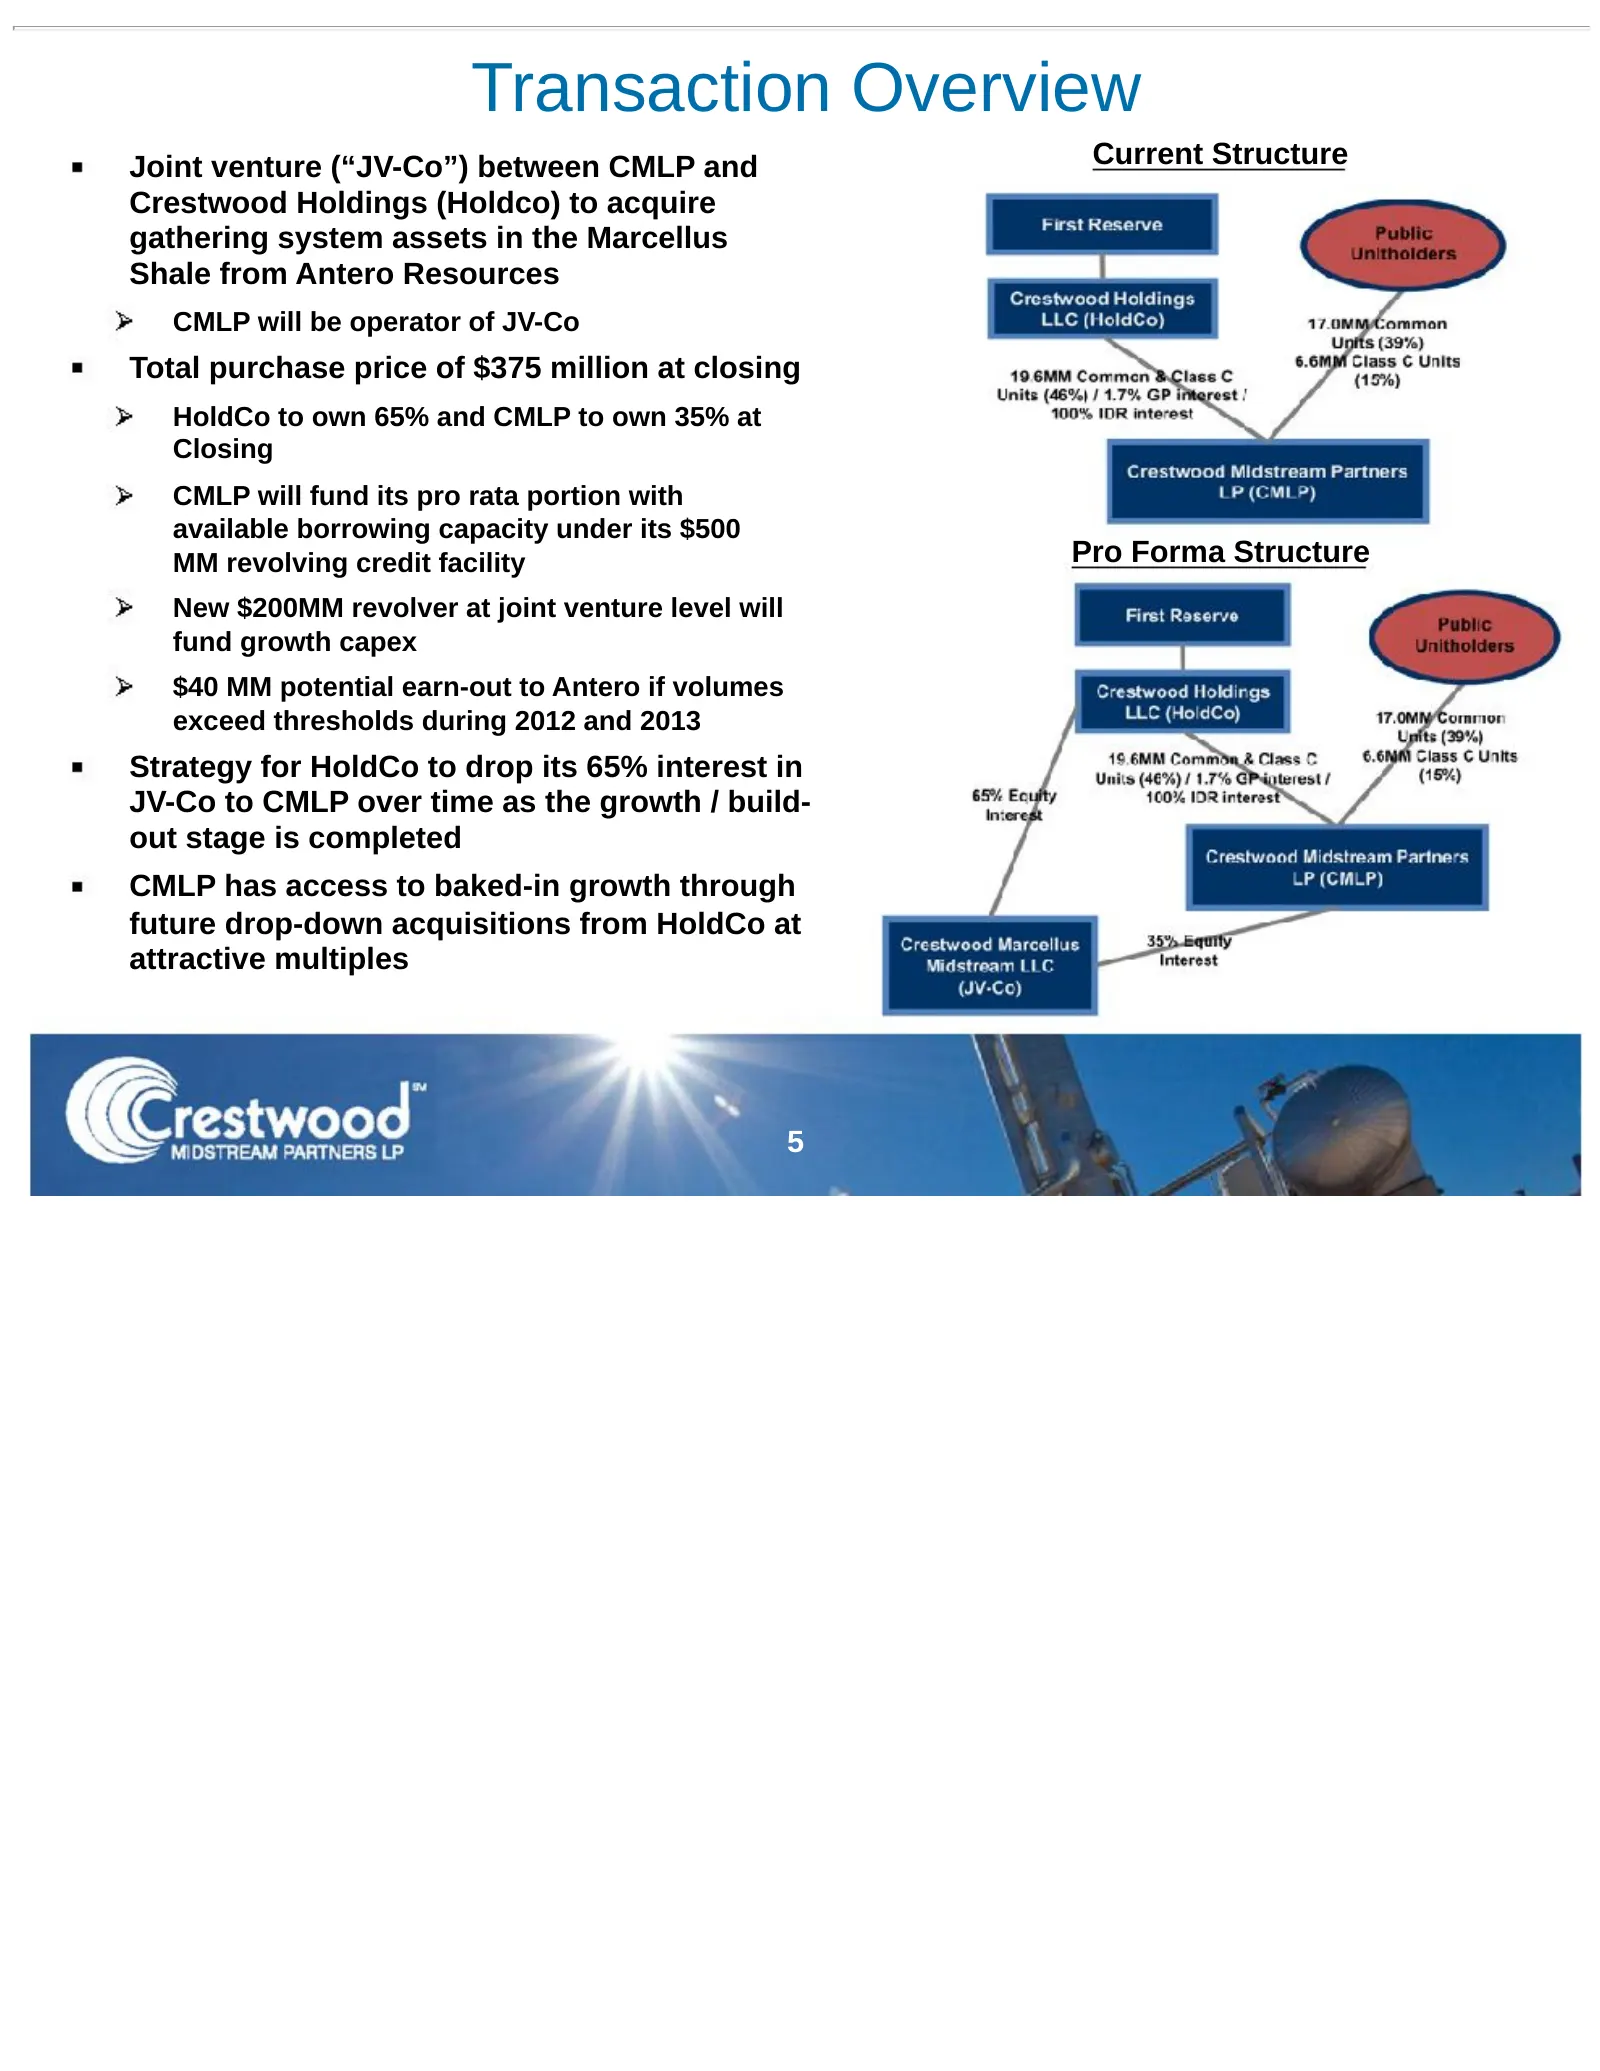
Transaction Overview Joint venture (“JV-Co”) between CMLP and Current Structure Crestwood Holdings (Holdco) to acquire gathering system assets in the Marcellus Shale from Antero Resources CMLP will be operator of JV-Co Total purchase price of $375 million at closing HoldCo to own 65% and CMLP to own
Slide 6: Strategic Rationale
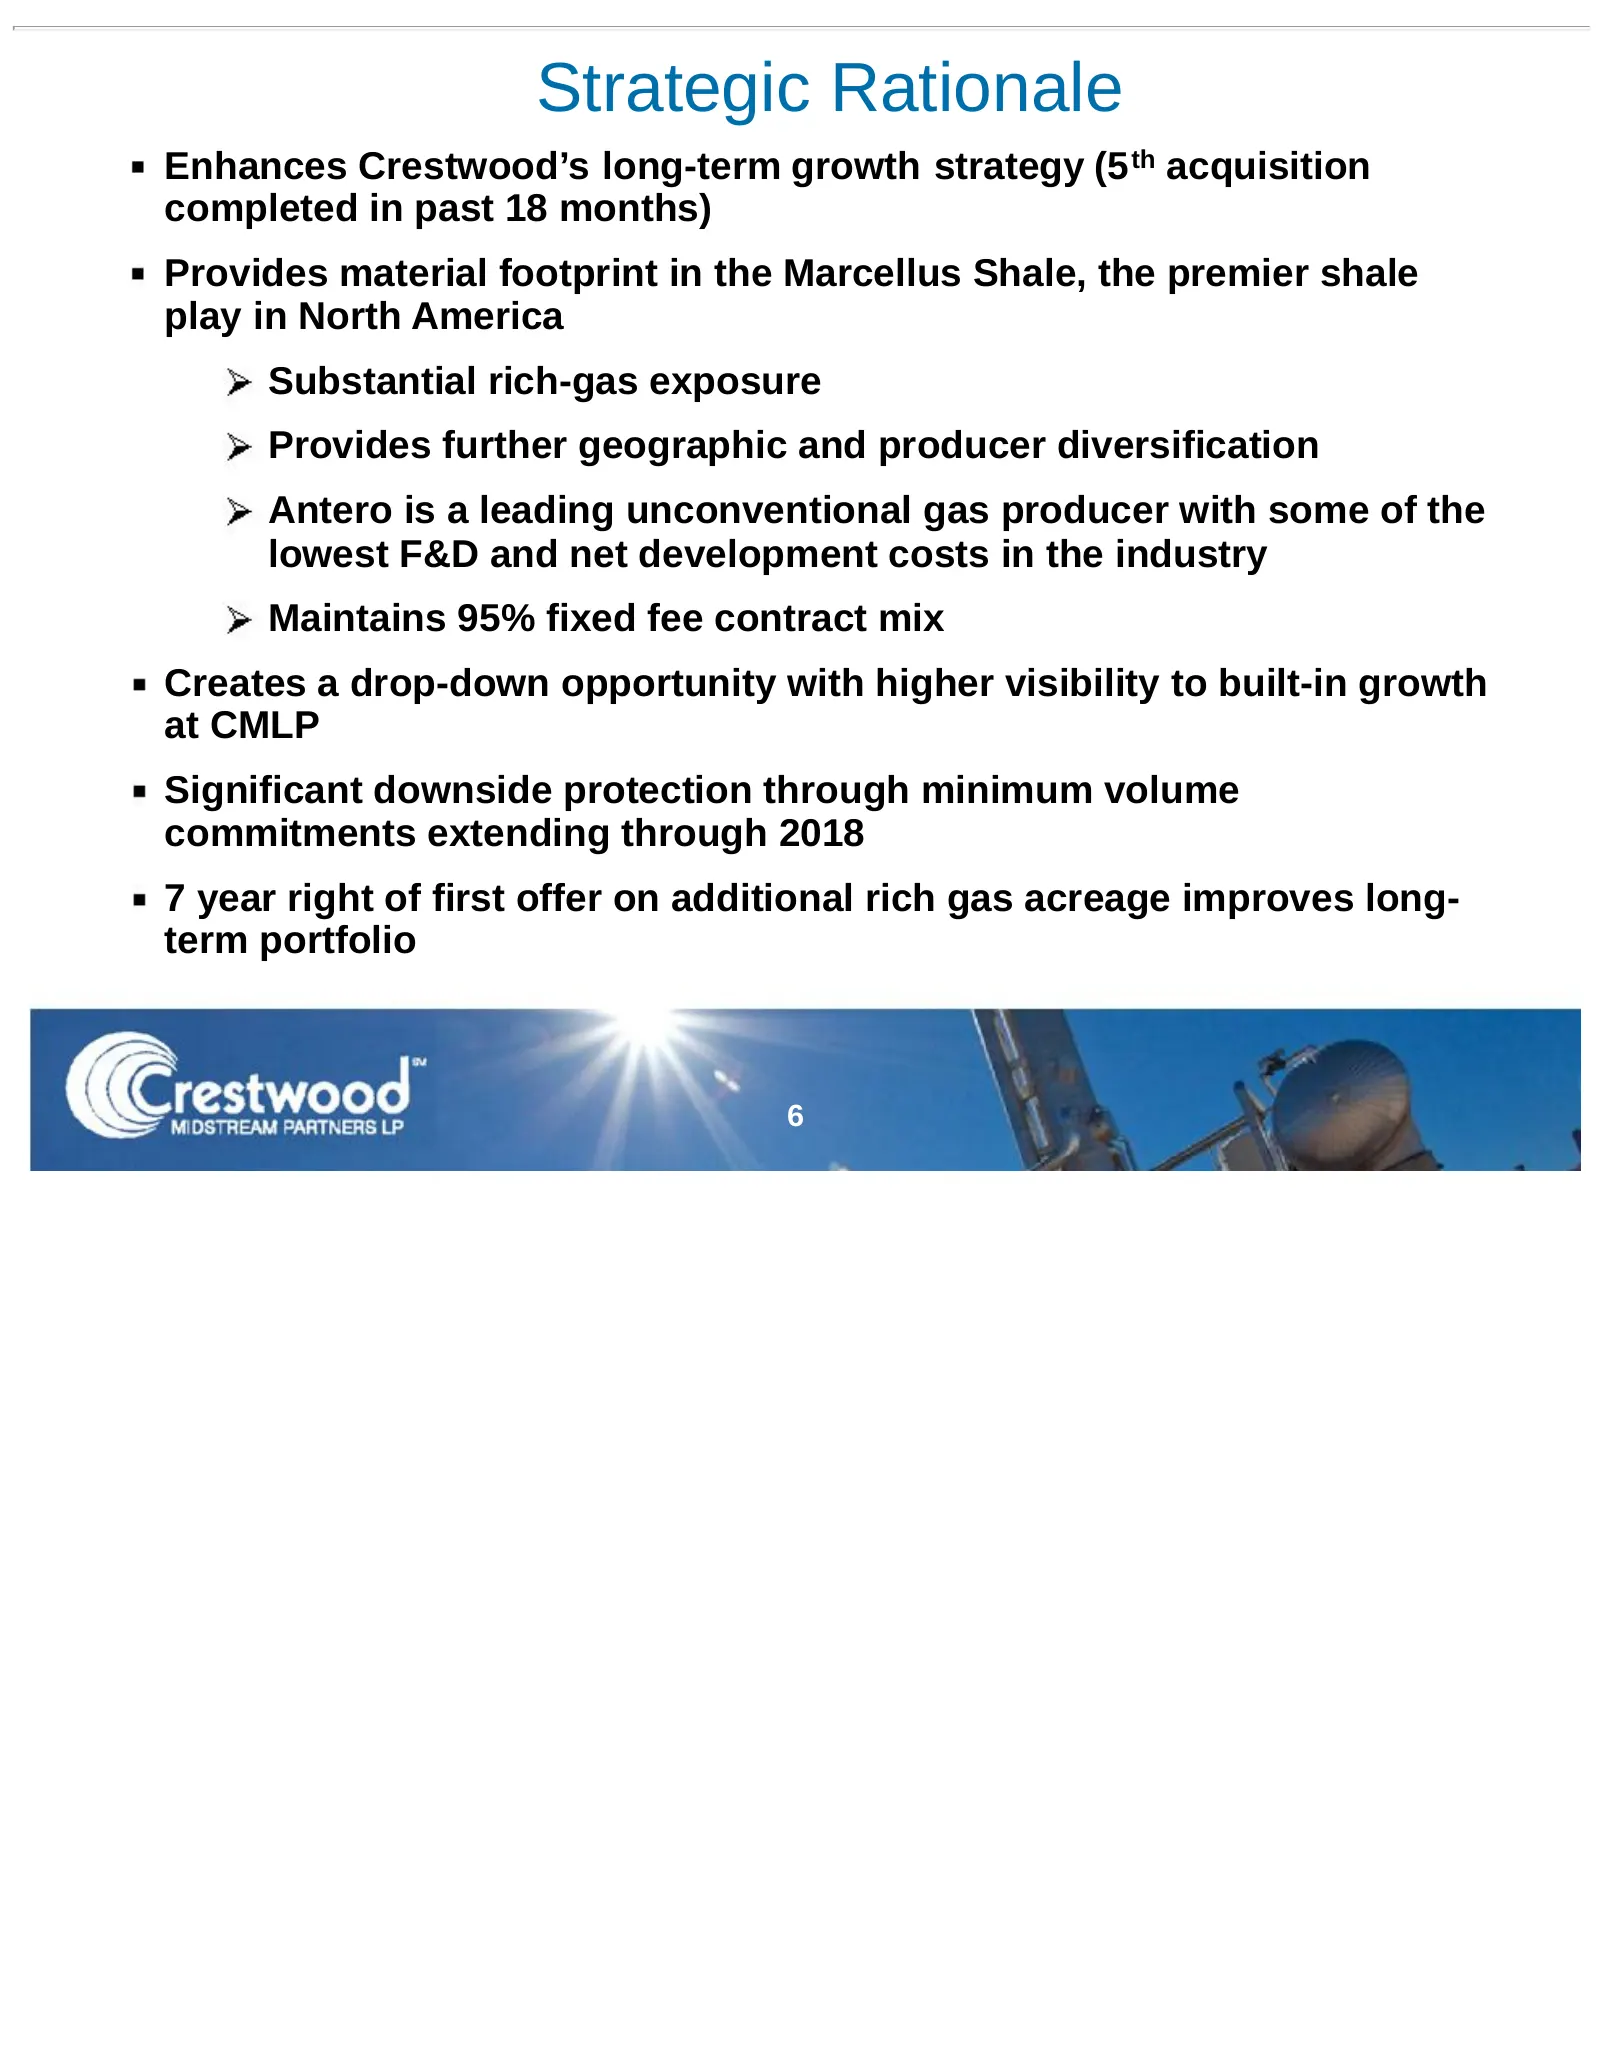
Strategic Rationale Enhances Crestwood’s long-term growth strategy (5 th acquisition completed in past 18 months) Provides material footprint in the Marcellus Shale, the premier shale play in North America Substantial rich-gas exposure Provides further geographic and producer diversification Antero
Slide 7: Transaction Merits
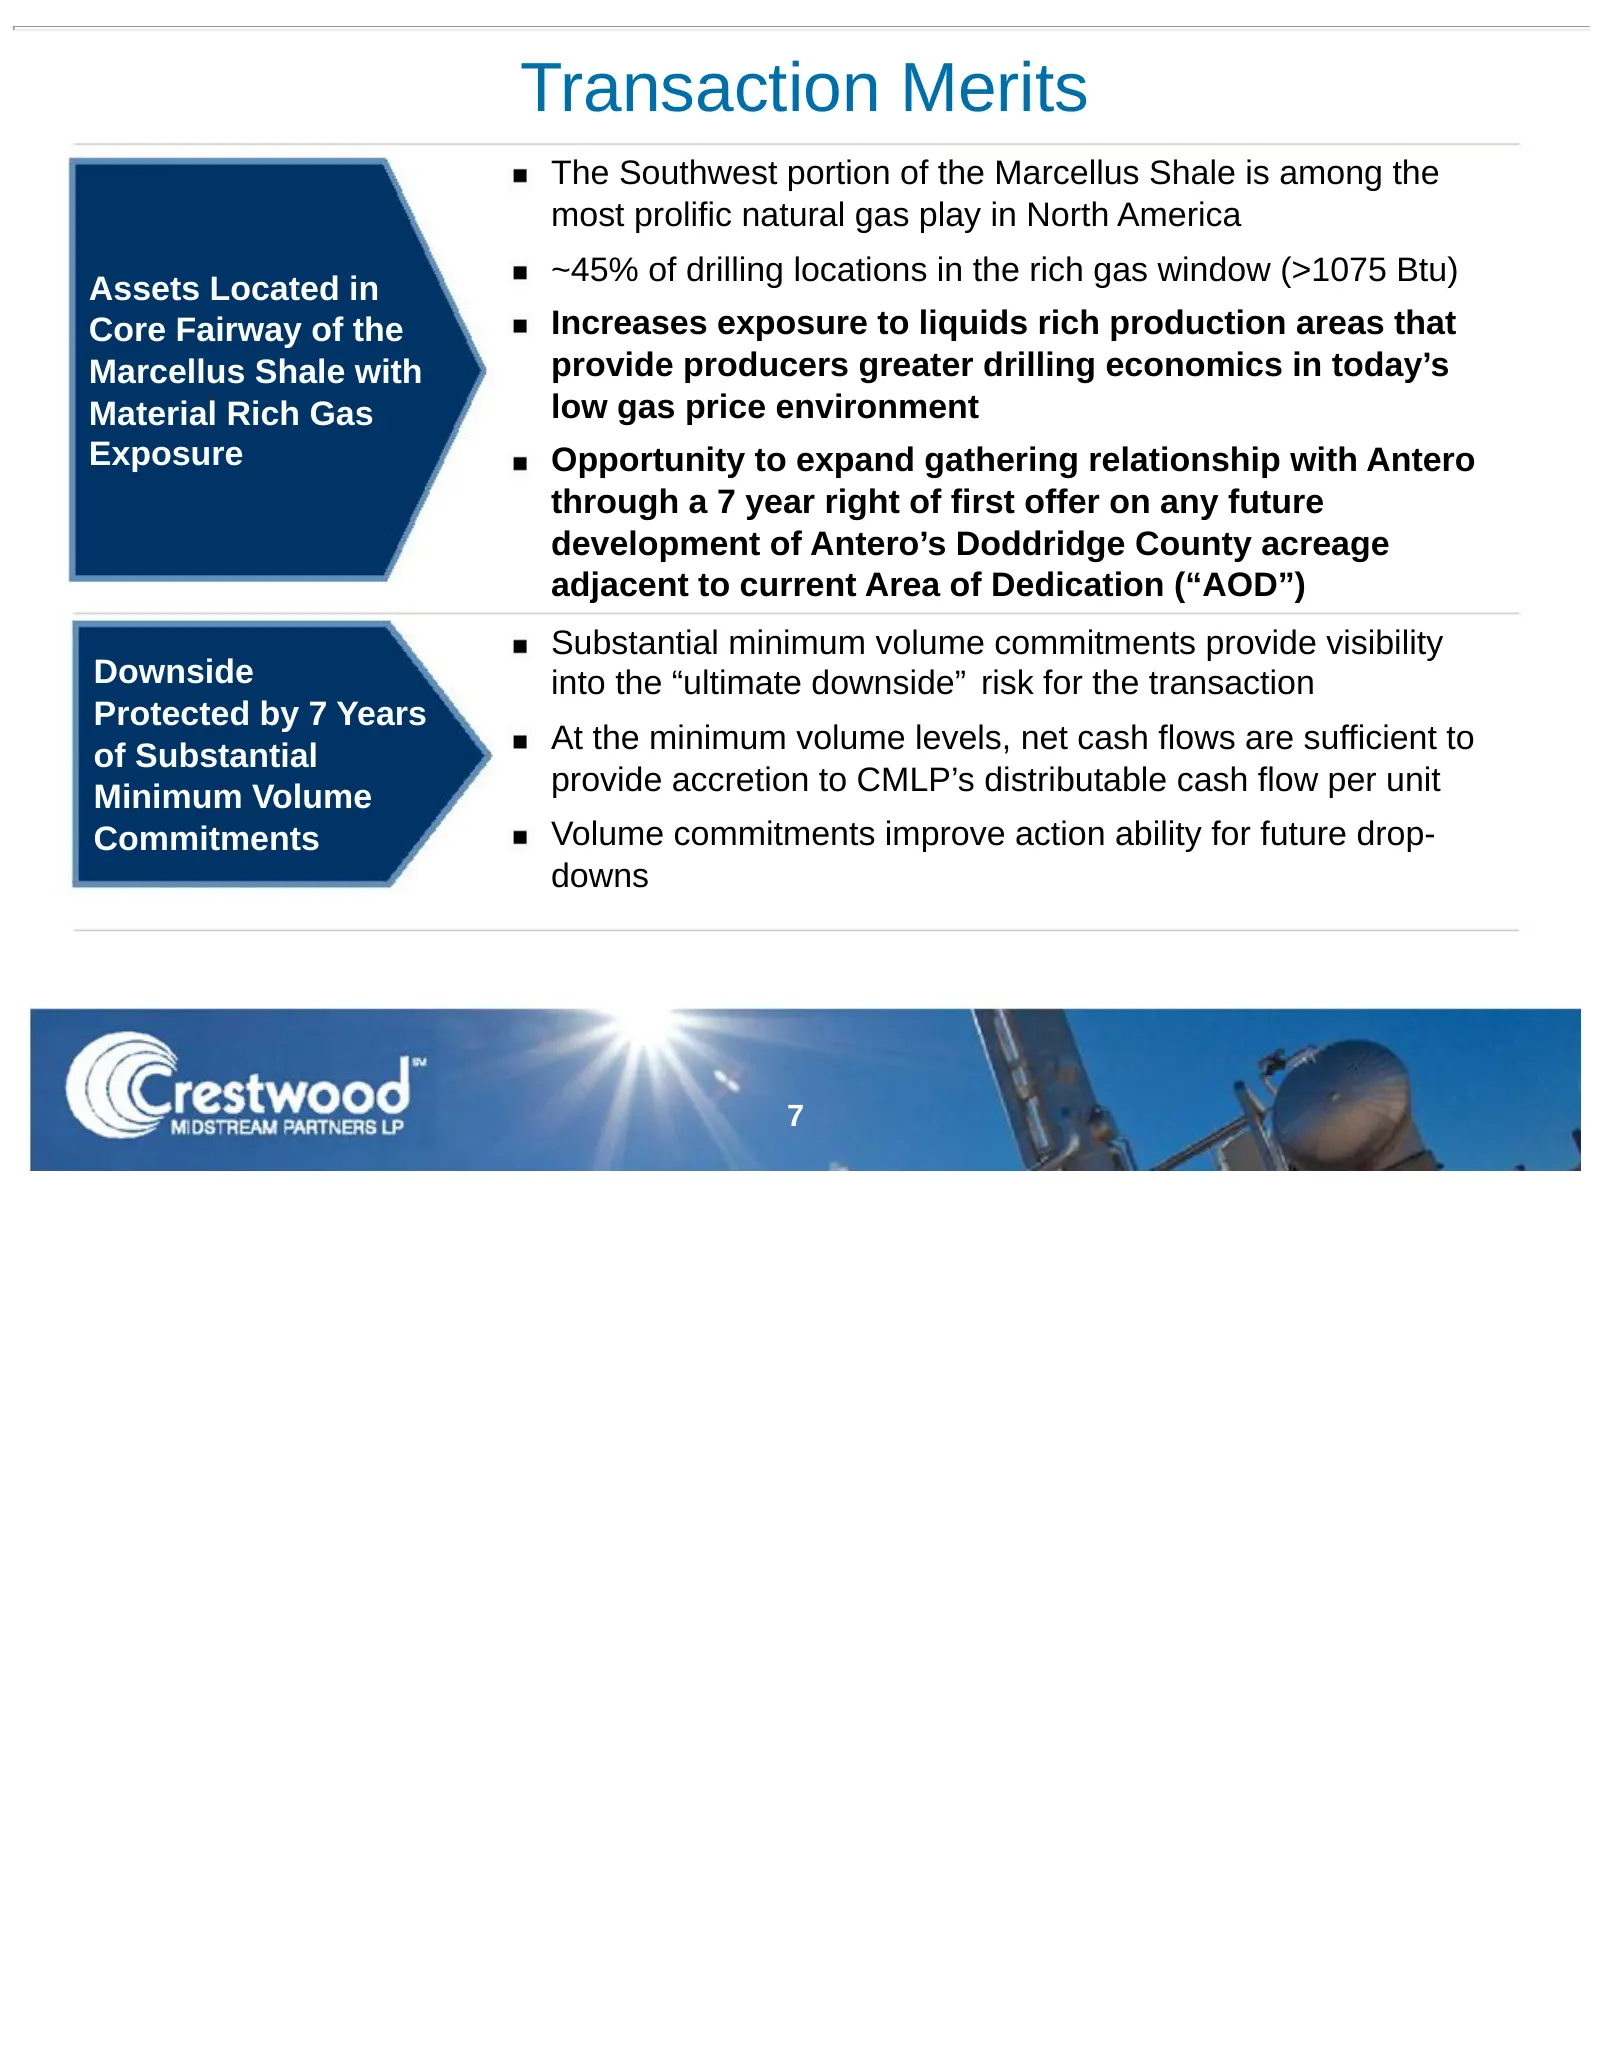
Transaction Merits The Southwest portion of the Marcellus Shale is among the most prolific natural gas play in North America ~45% of drilling locations in the rich gas window (>1075 Btu) Assets Located in Core Fairway of the Increases exposure to liquids rich production areas that Marcellus Shale wi
Slide 8: Transaction Merits (cont’d)
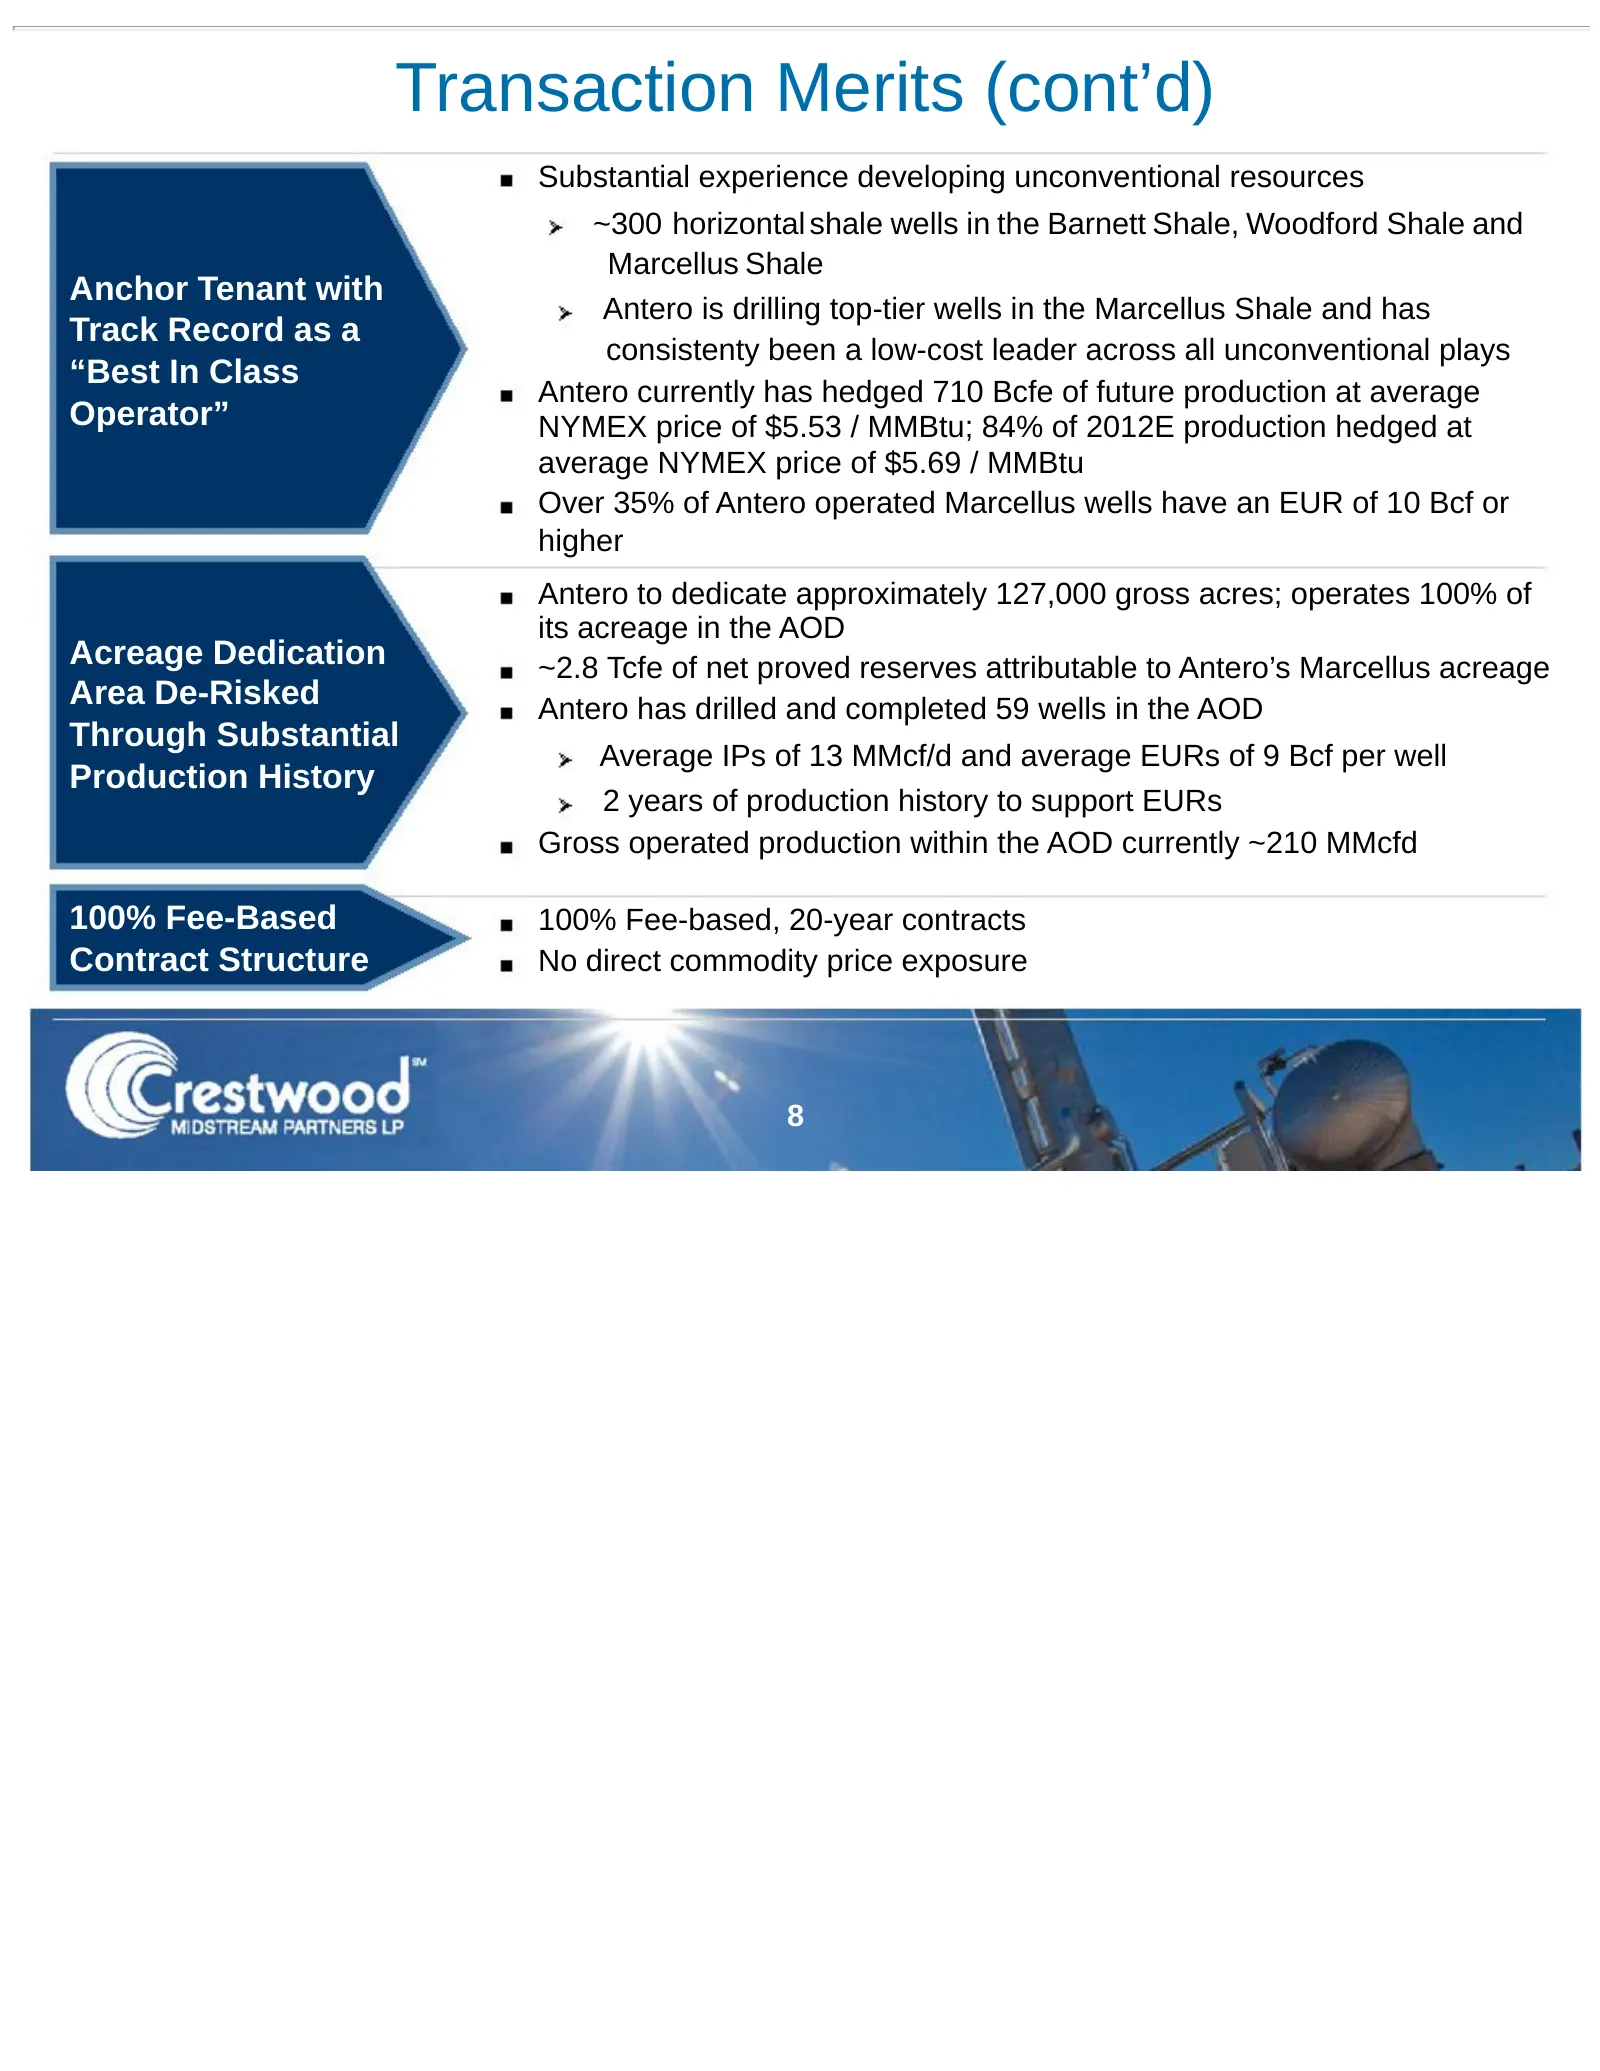
Transaction Merits (cont’d) Substantial experience developing unconventional resources ~300 horizontal shale wells in the Barnett Shale, Woodford Shale and Marcellus Shale Anchor Tenant with Antero is drilling top-tier wells in the Marcellus Shale and has Track Record as a consistenty been a low-cos
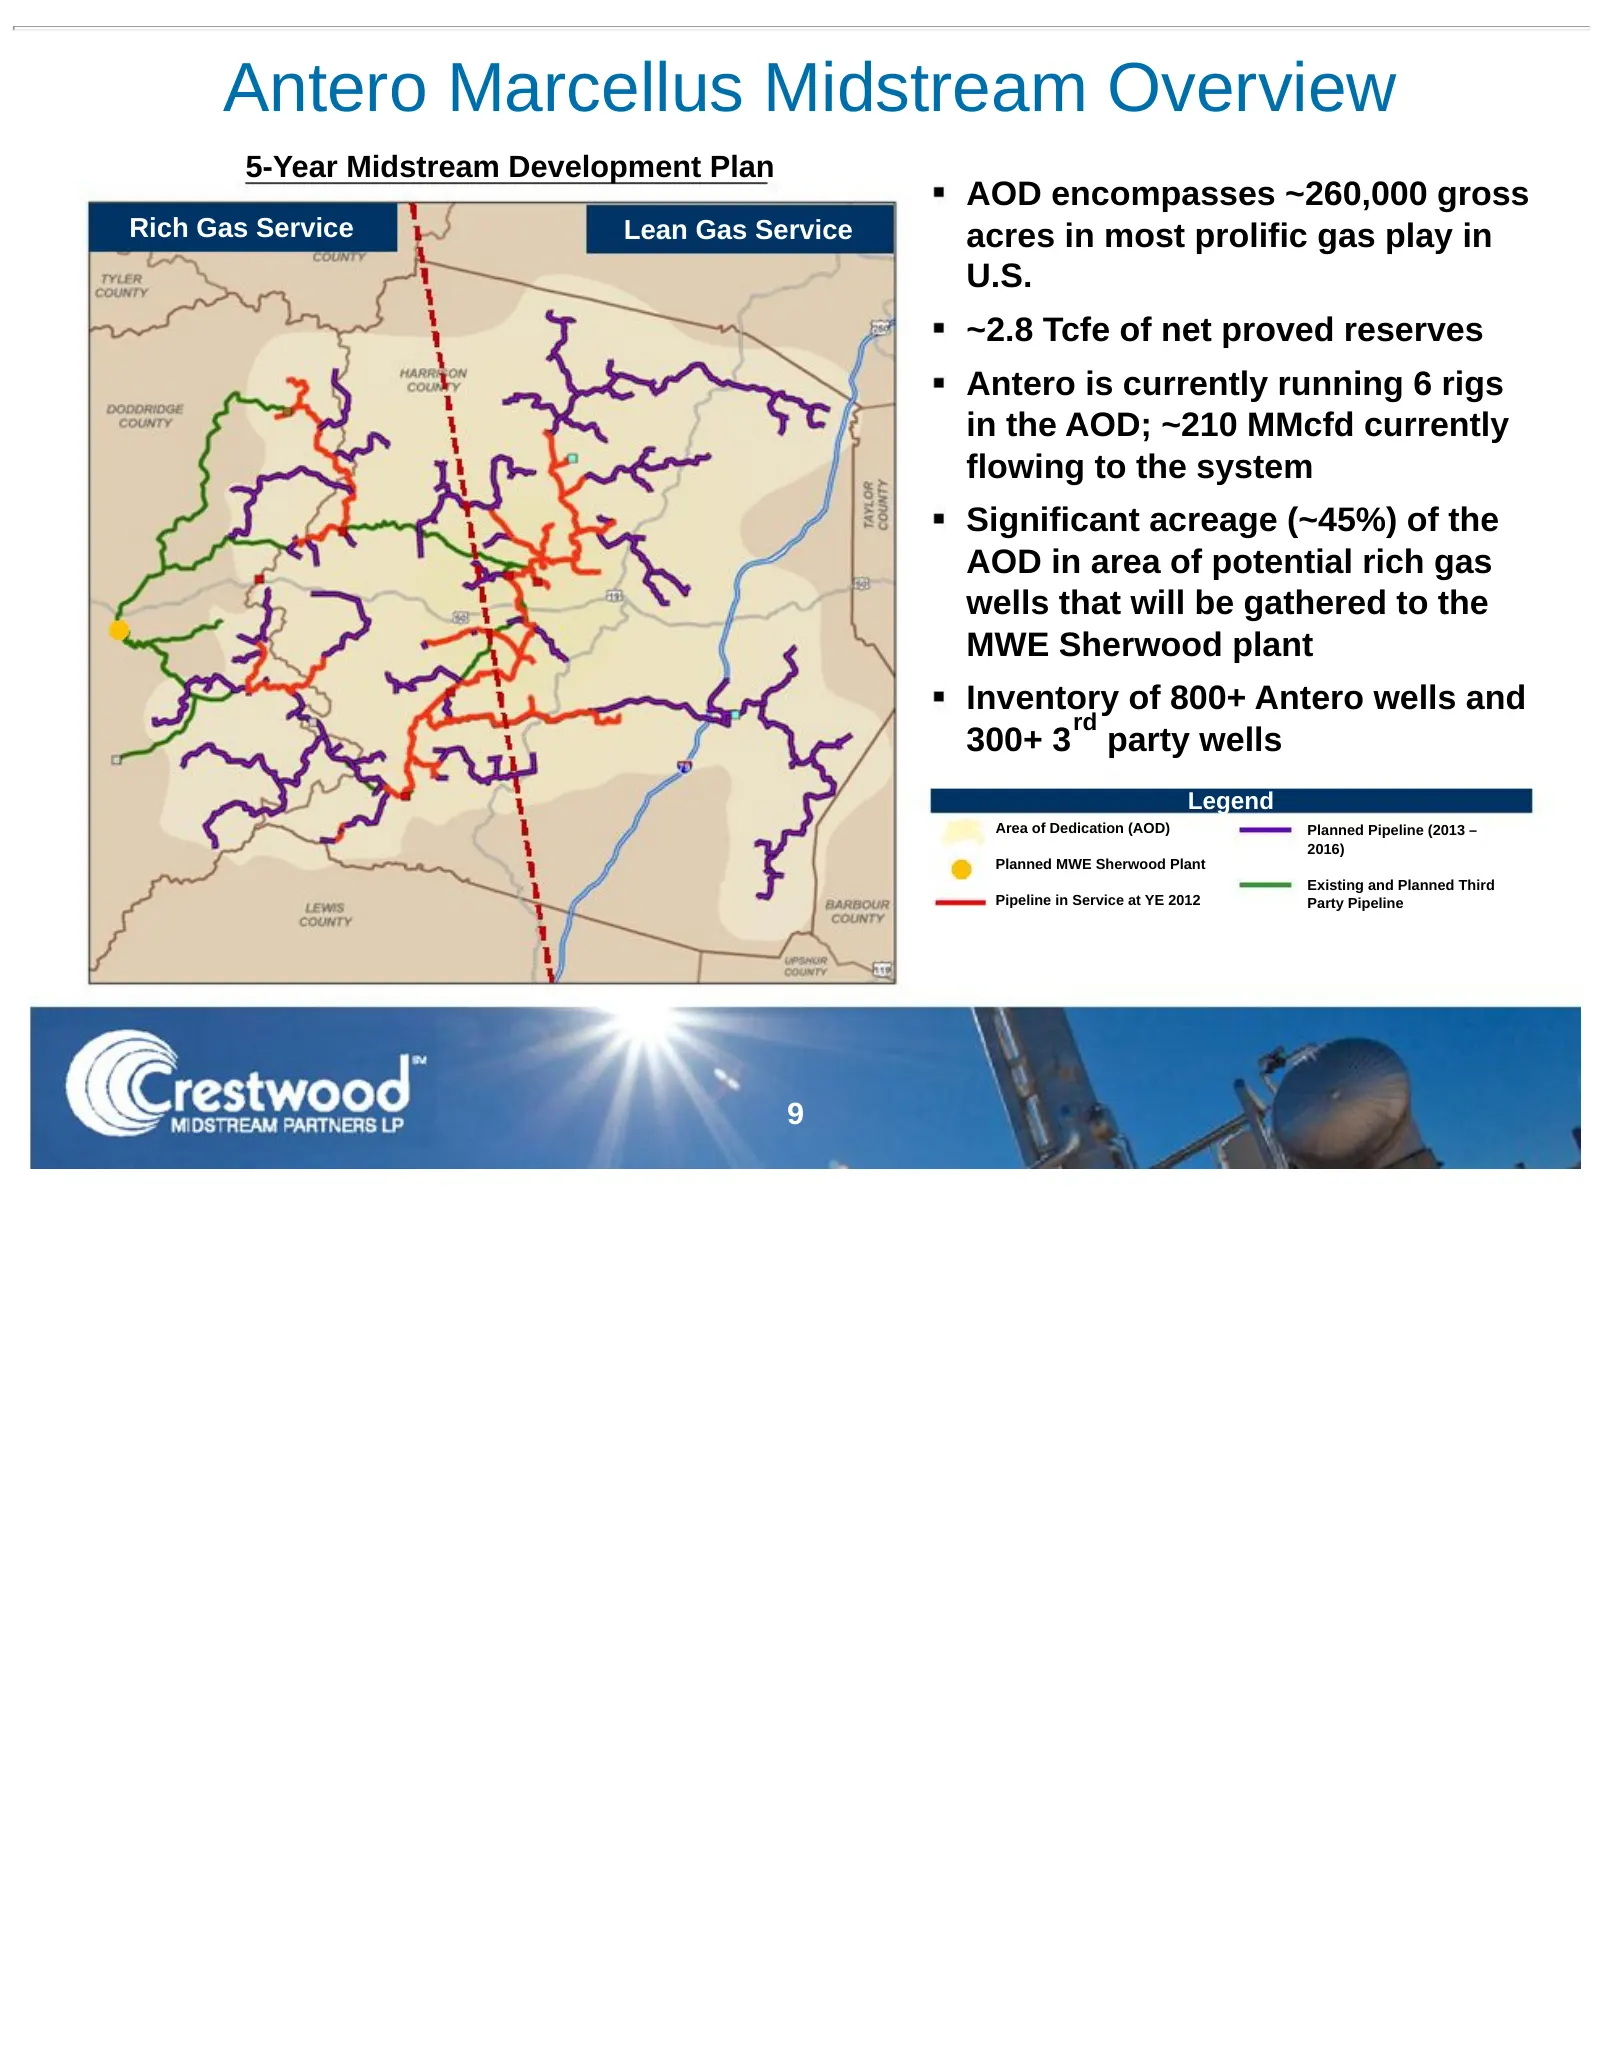
Slide 9: Antero Marcellus Midstream Overview
Antero Marcellus Midstream Overview 5-Year Midstream Development Plan AOD encompasses ~260,000 gross Rich Gas Service Lean Gas Service acres in most prolific gas play in U.S. ~2.8 Tcfe of net proved reserves Antero is currently running 6 rigs in the AOD; ~210 MMcfd currently flowing to the system Si
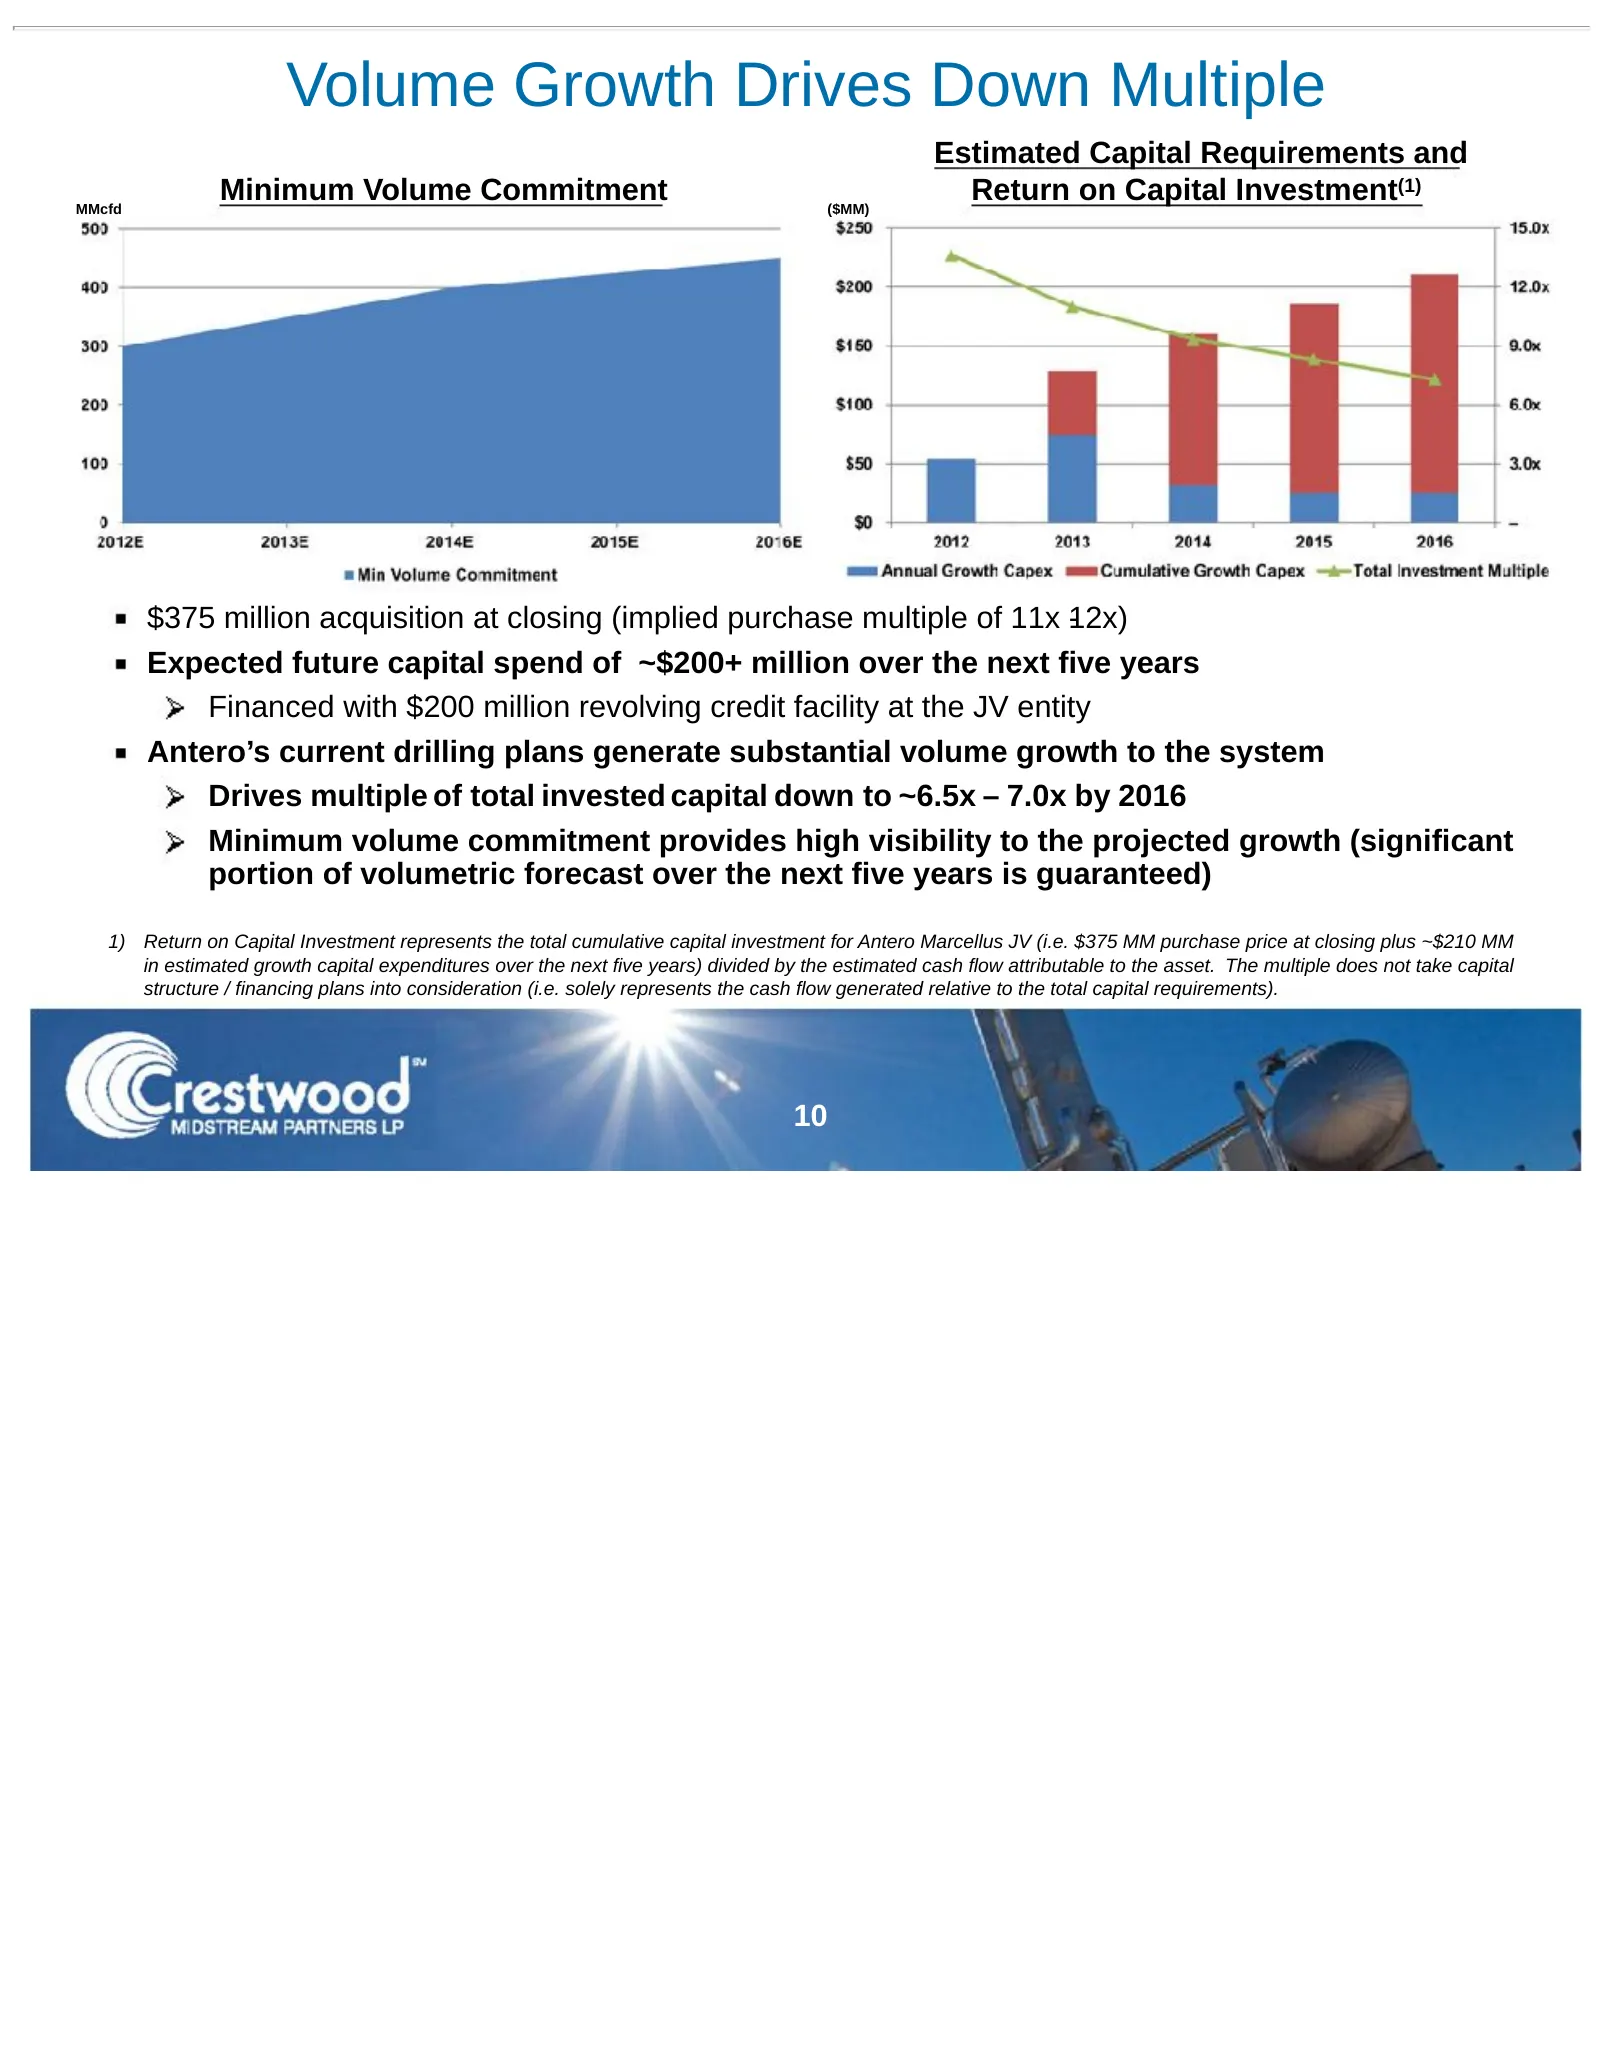
Slide 10: Volume Growth Drives Down Multiple
Volume Growth Drives Down Multiple Estimated Capital Requirements and MMcfd Minimum Volume Commitment ($MM) Return on Capital Investment(1) $375 million acquisition at closing (implied purchase multiple of 11x 1- 2x) Expected future capital spend of ~$200+ million over the next five years Financed w
Slide 11: Crestwood Update
Crestwood Update Enrestwood
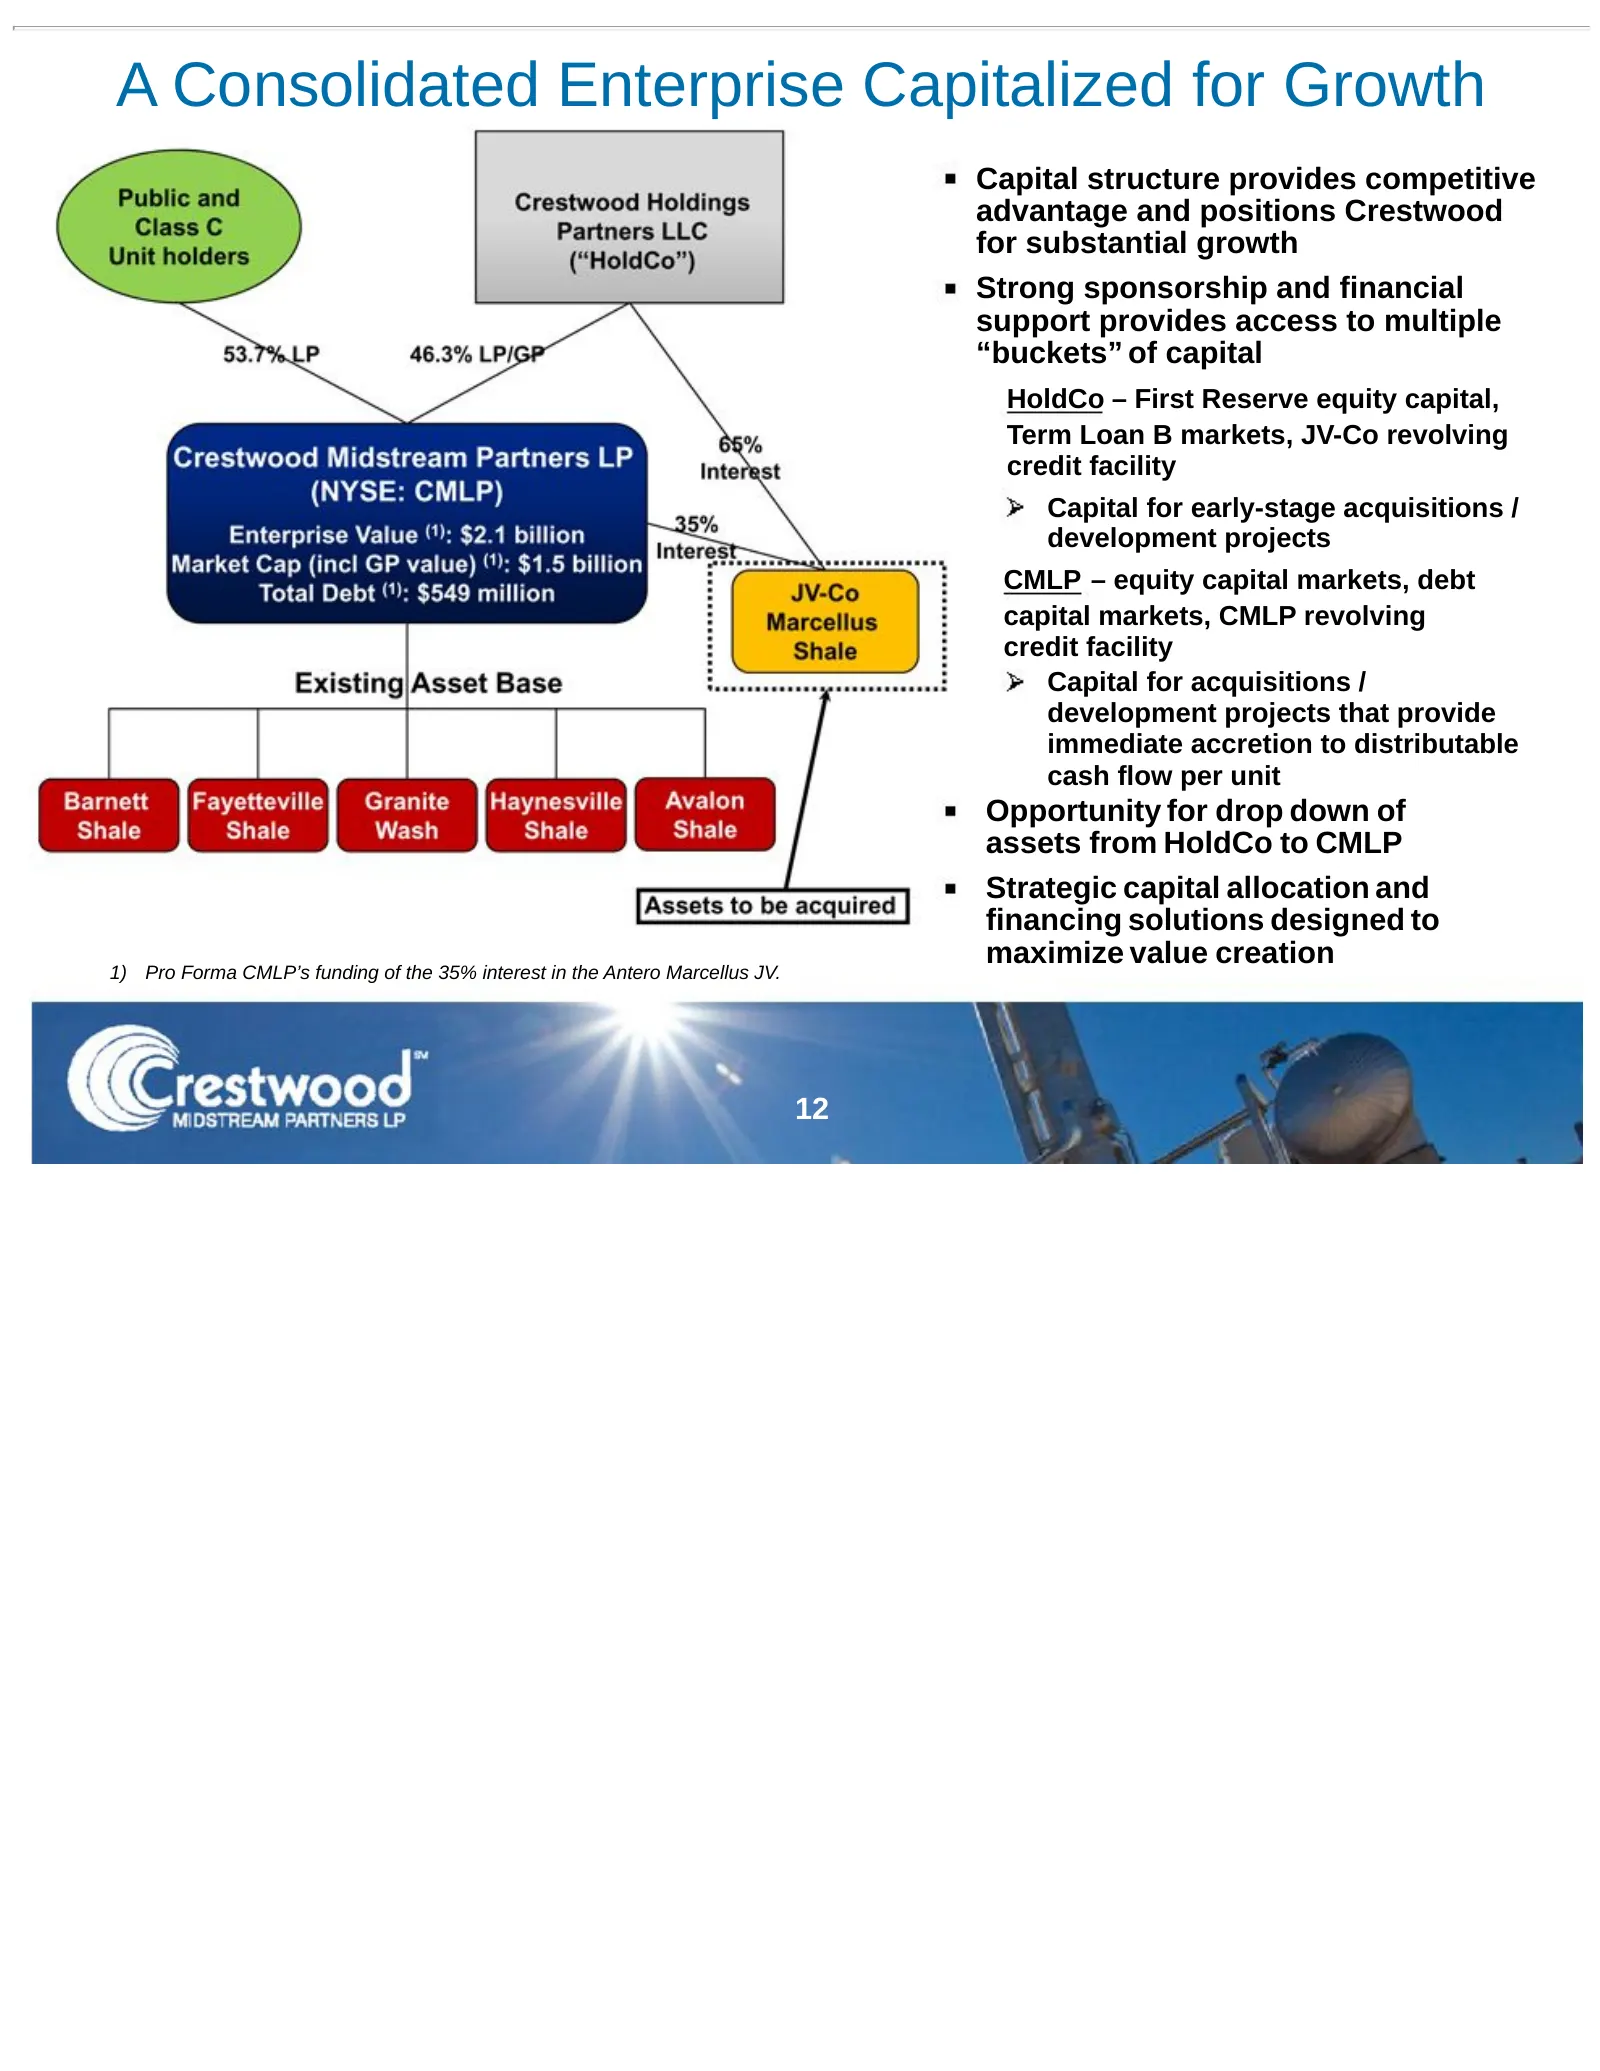
Slide 12: A Consolidated Enterprise Capitalized for Growth
A Consolidated Enterprise Capitalized for Growth Capital structure provides competitive advantage and positions Crestwood for substantial growth Strong sponsorship and financial support provides access to multiple “buckets” of capital HoldCo – First Reserve equity capital, Term Loan B markets, JV-Co
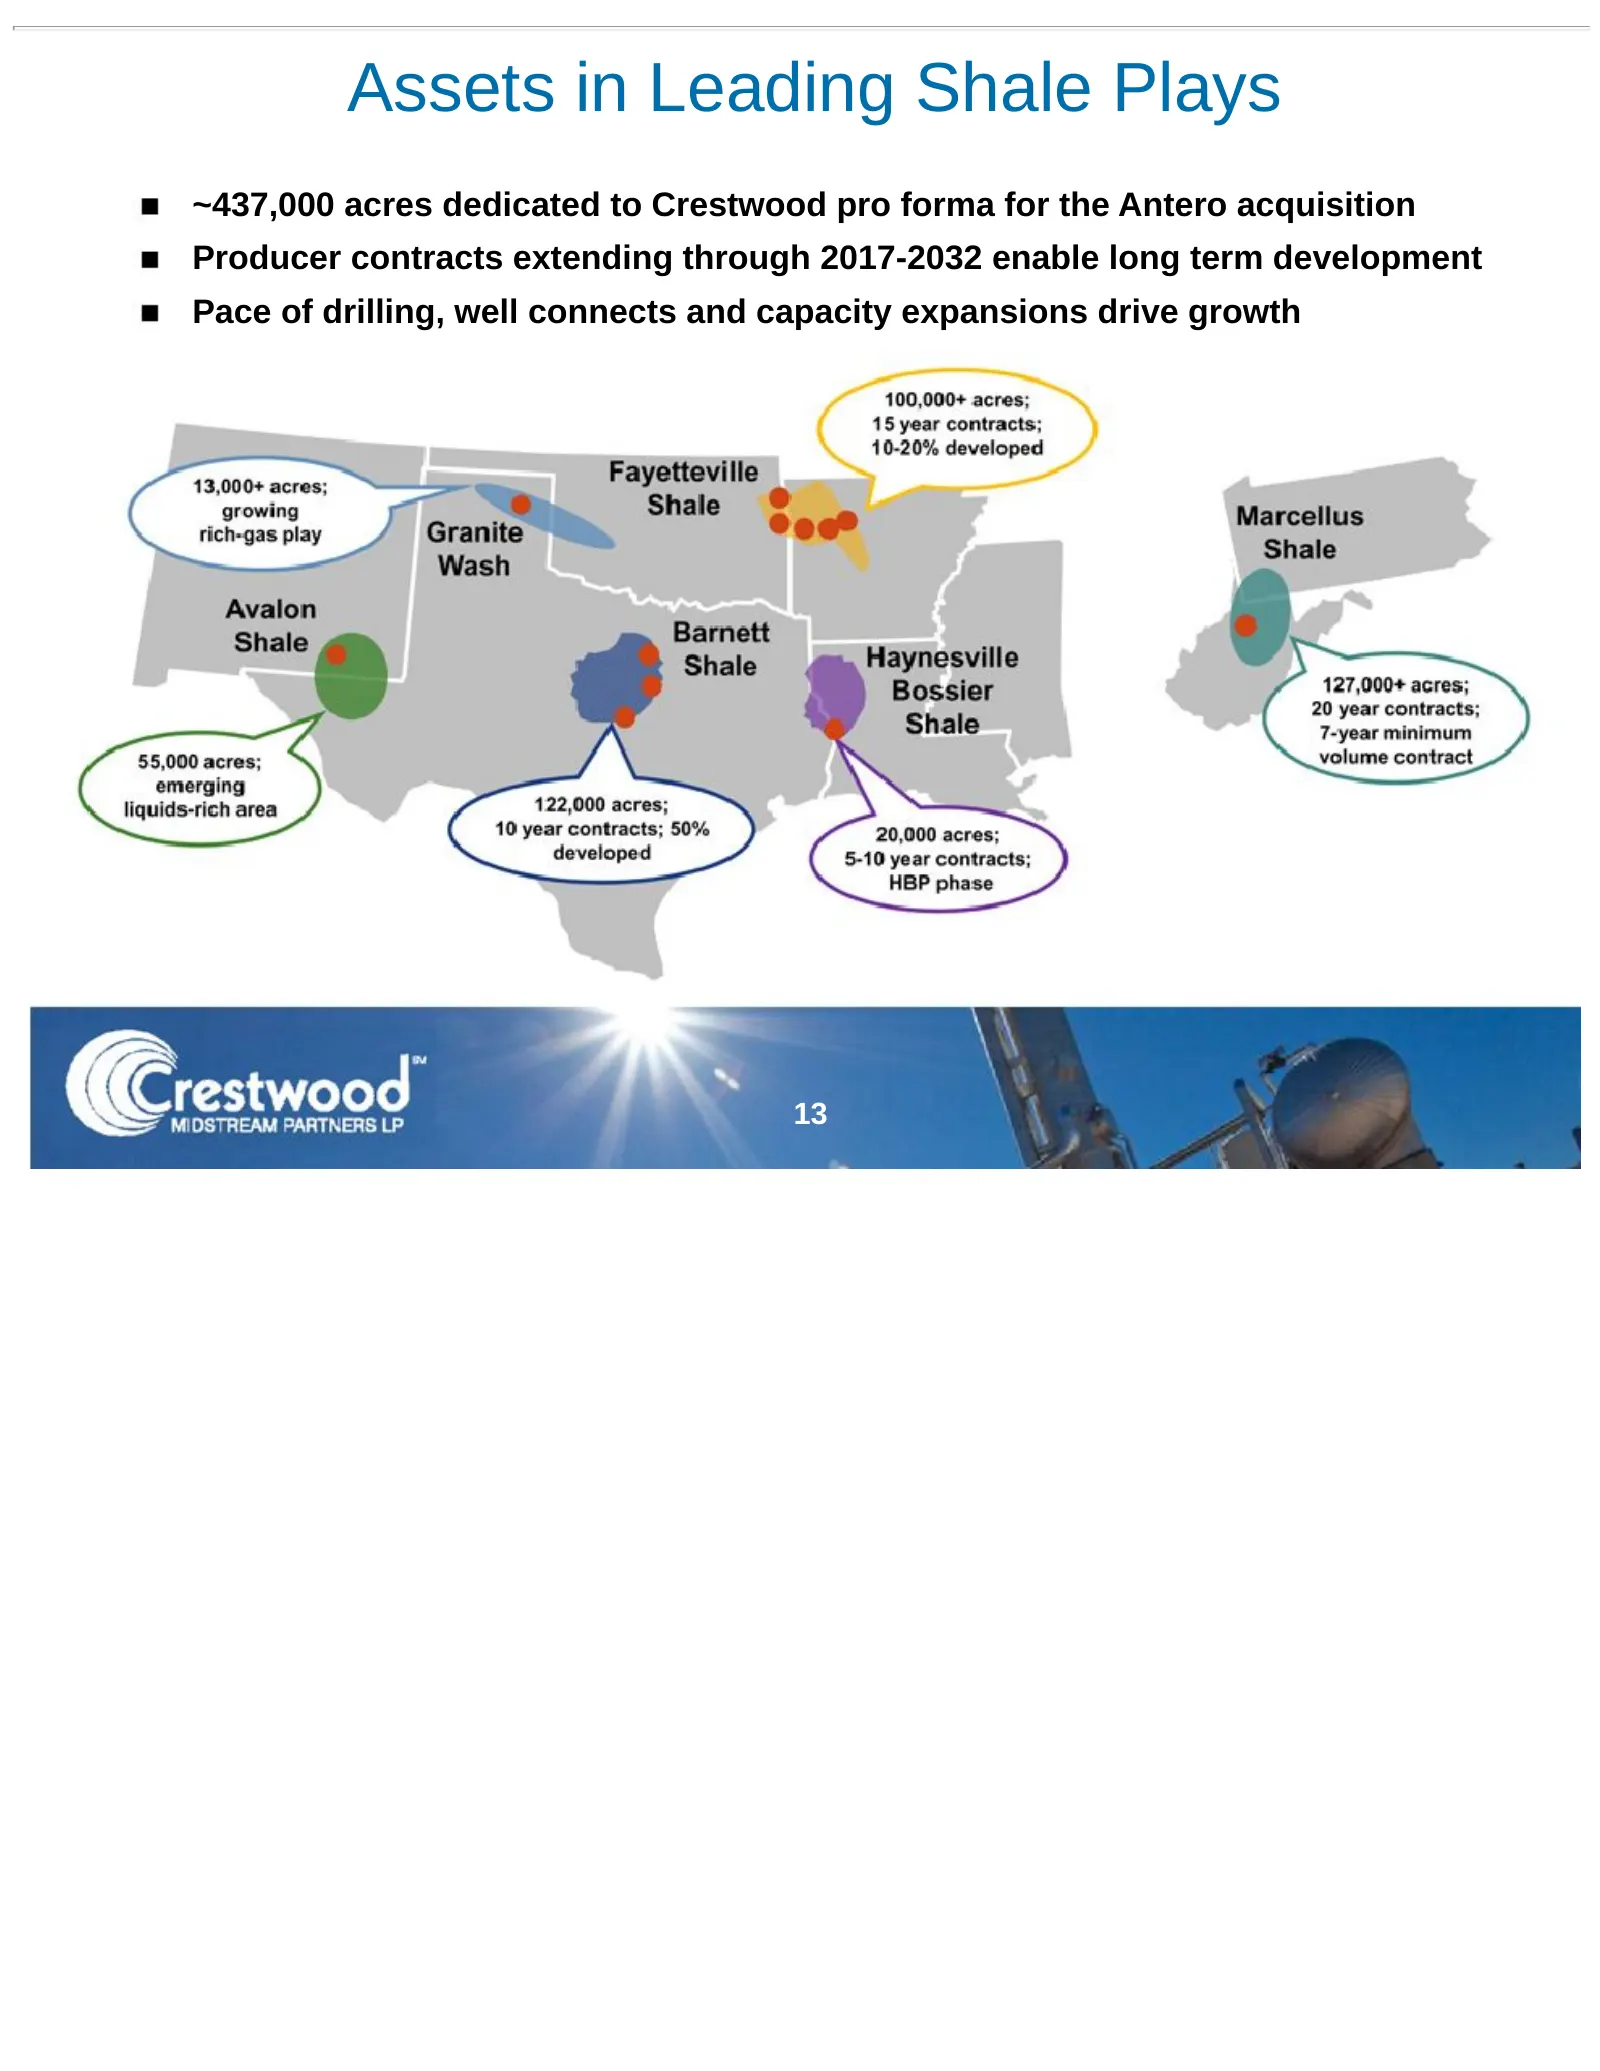
Slide 13: Assets in Leading Shale Plays
Assets in Leading Shale Plays ~437,000 acres dedicated to Crestwood pro forma for the Antero acquisition Producer contracts extending through 2017-2032 enable long term development Pace of drilling, well connects and capacity expansions drive growth 13
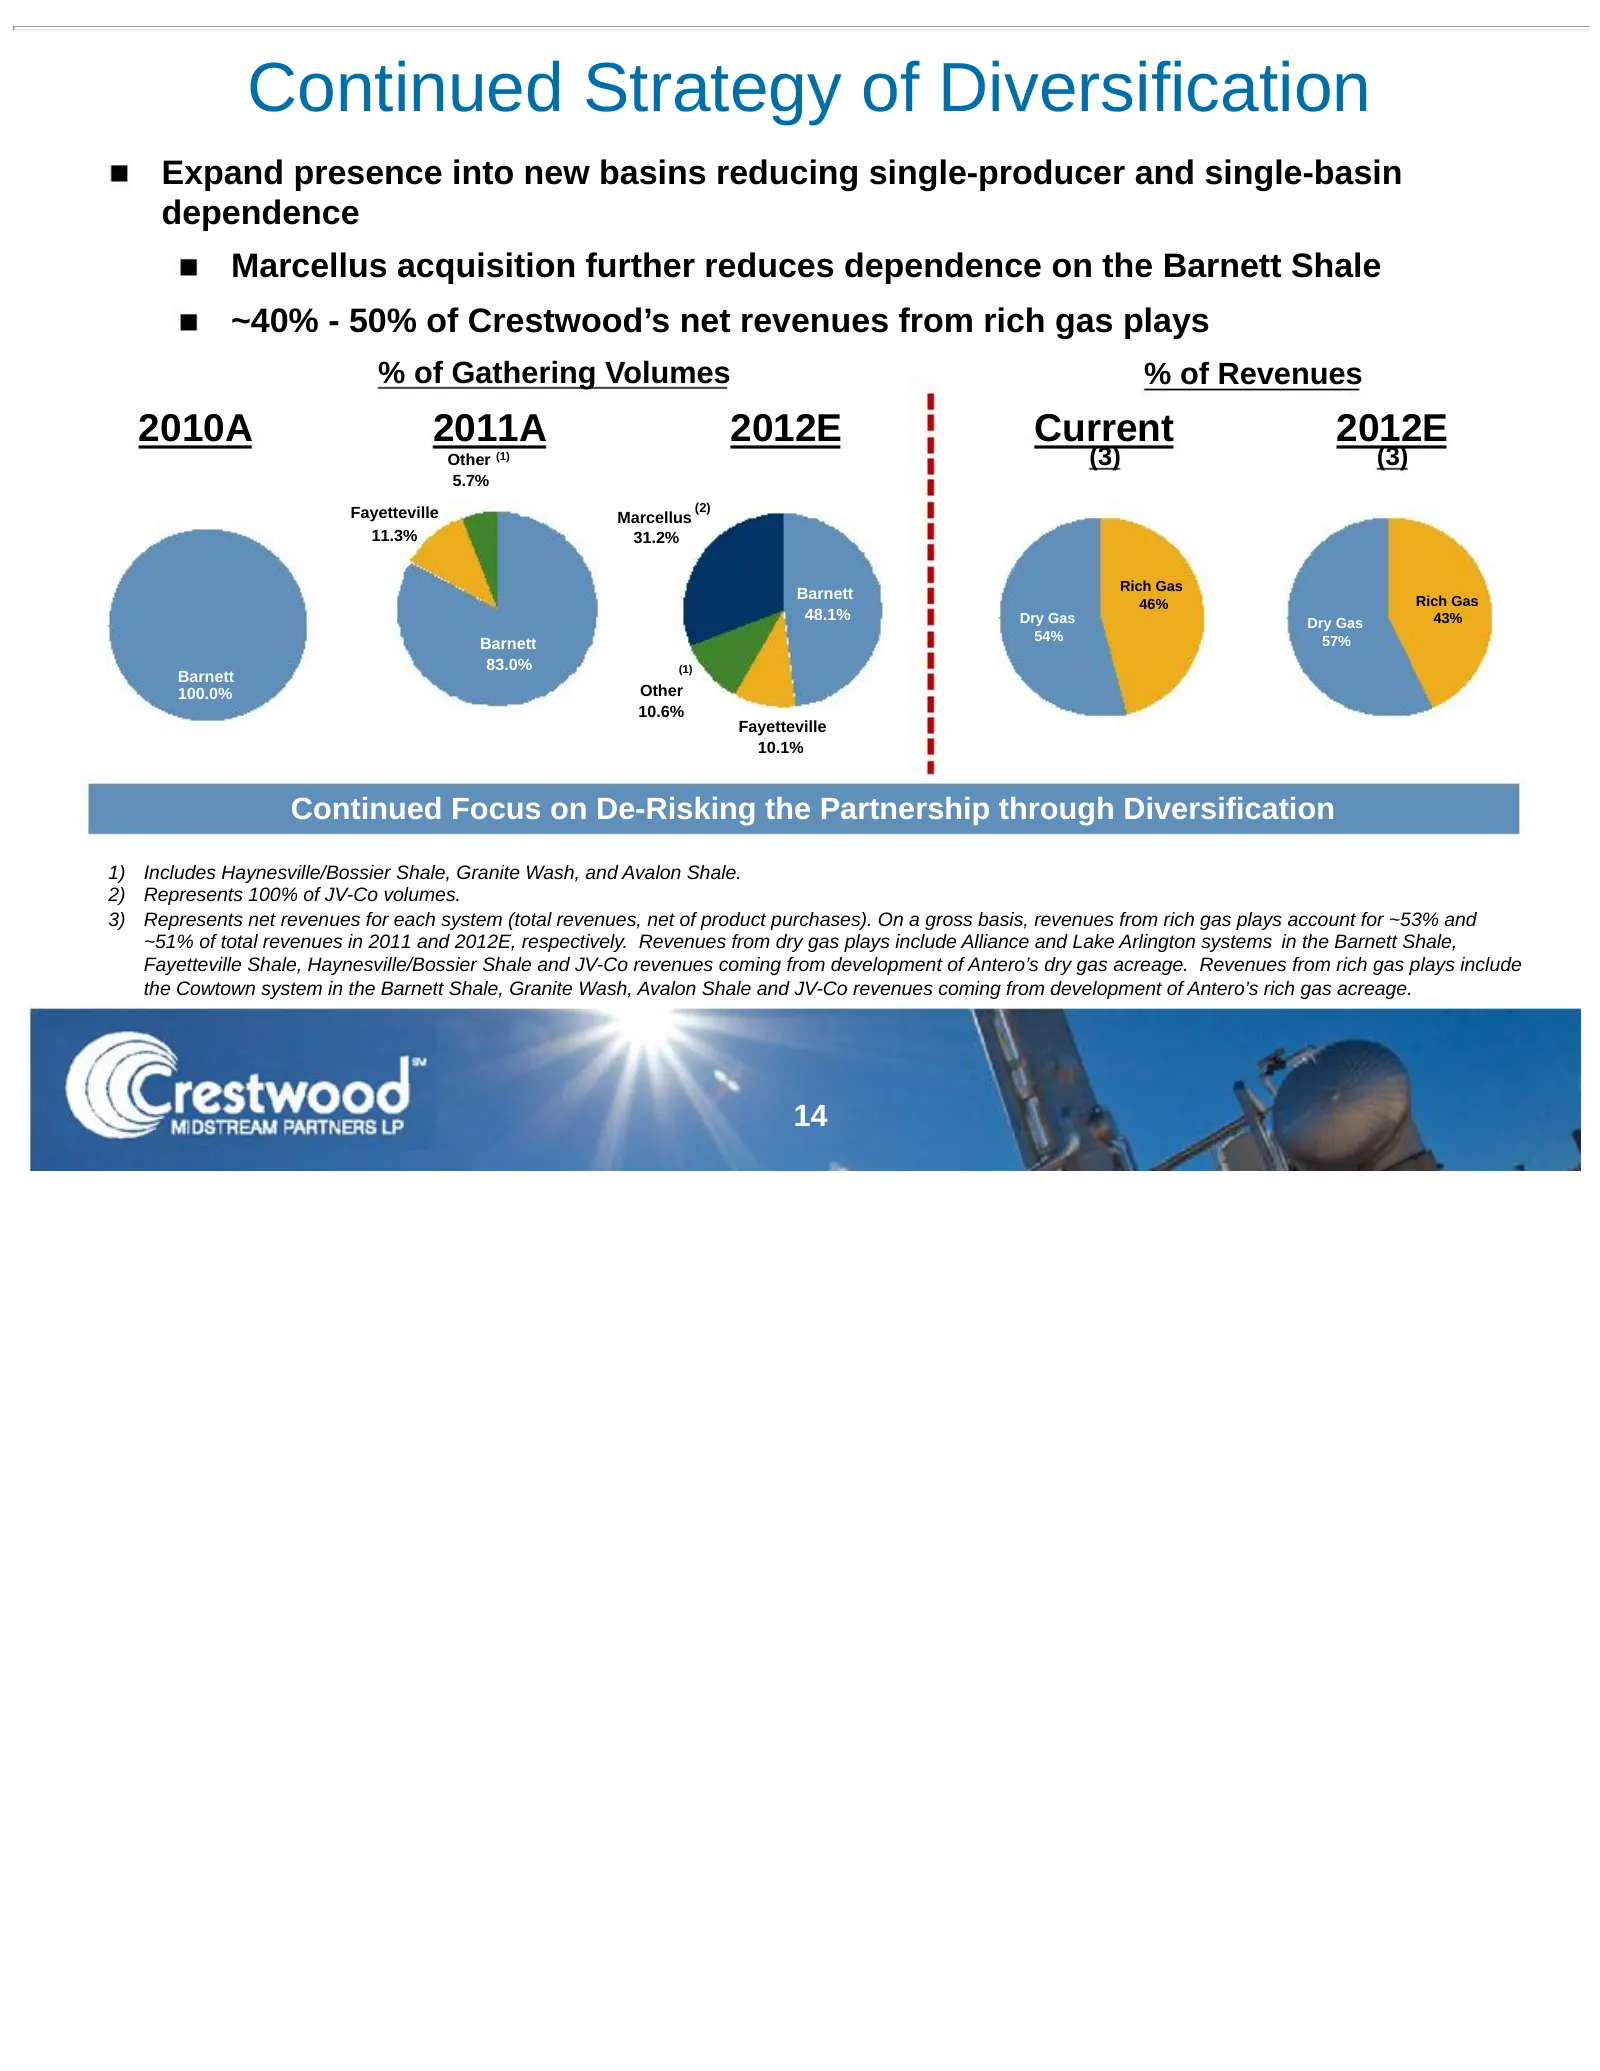
Slide 14: Continued Strategy of Diversification
Continued Strategy of Diversification Expand presence into new basins reducing single-producer and single-basin dependence Marcellus acquisition further reduces dependence on the Barnett Shale ~40% - 50% of Crestwood’s net revenues from rich gas plays % of Gathering Volumes % of Revenues 2010A 2011A
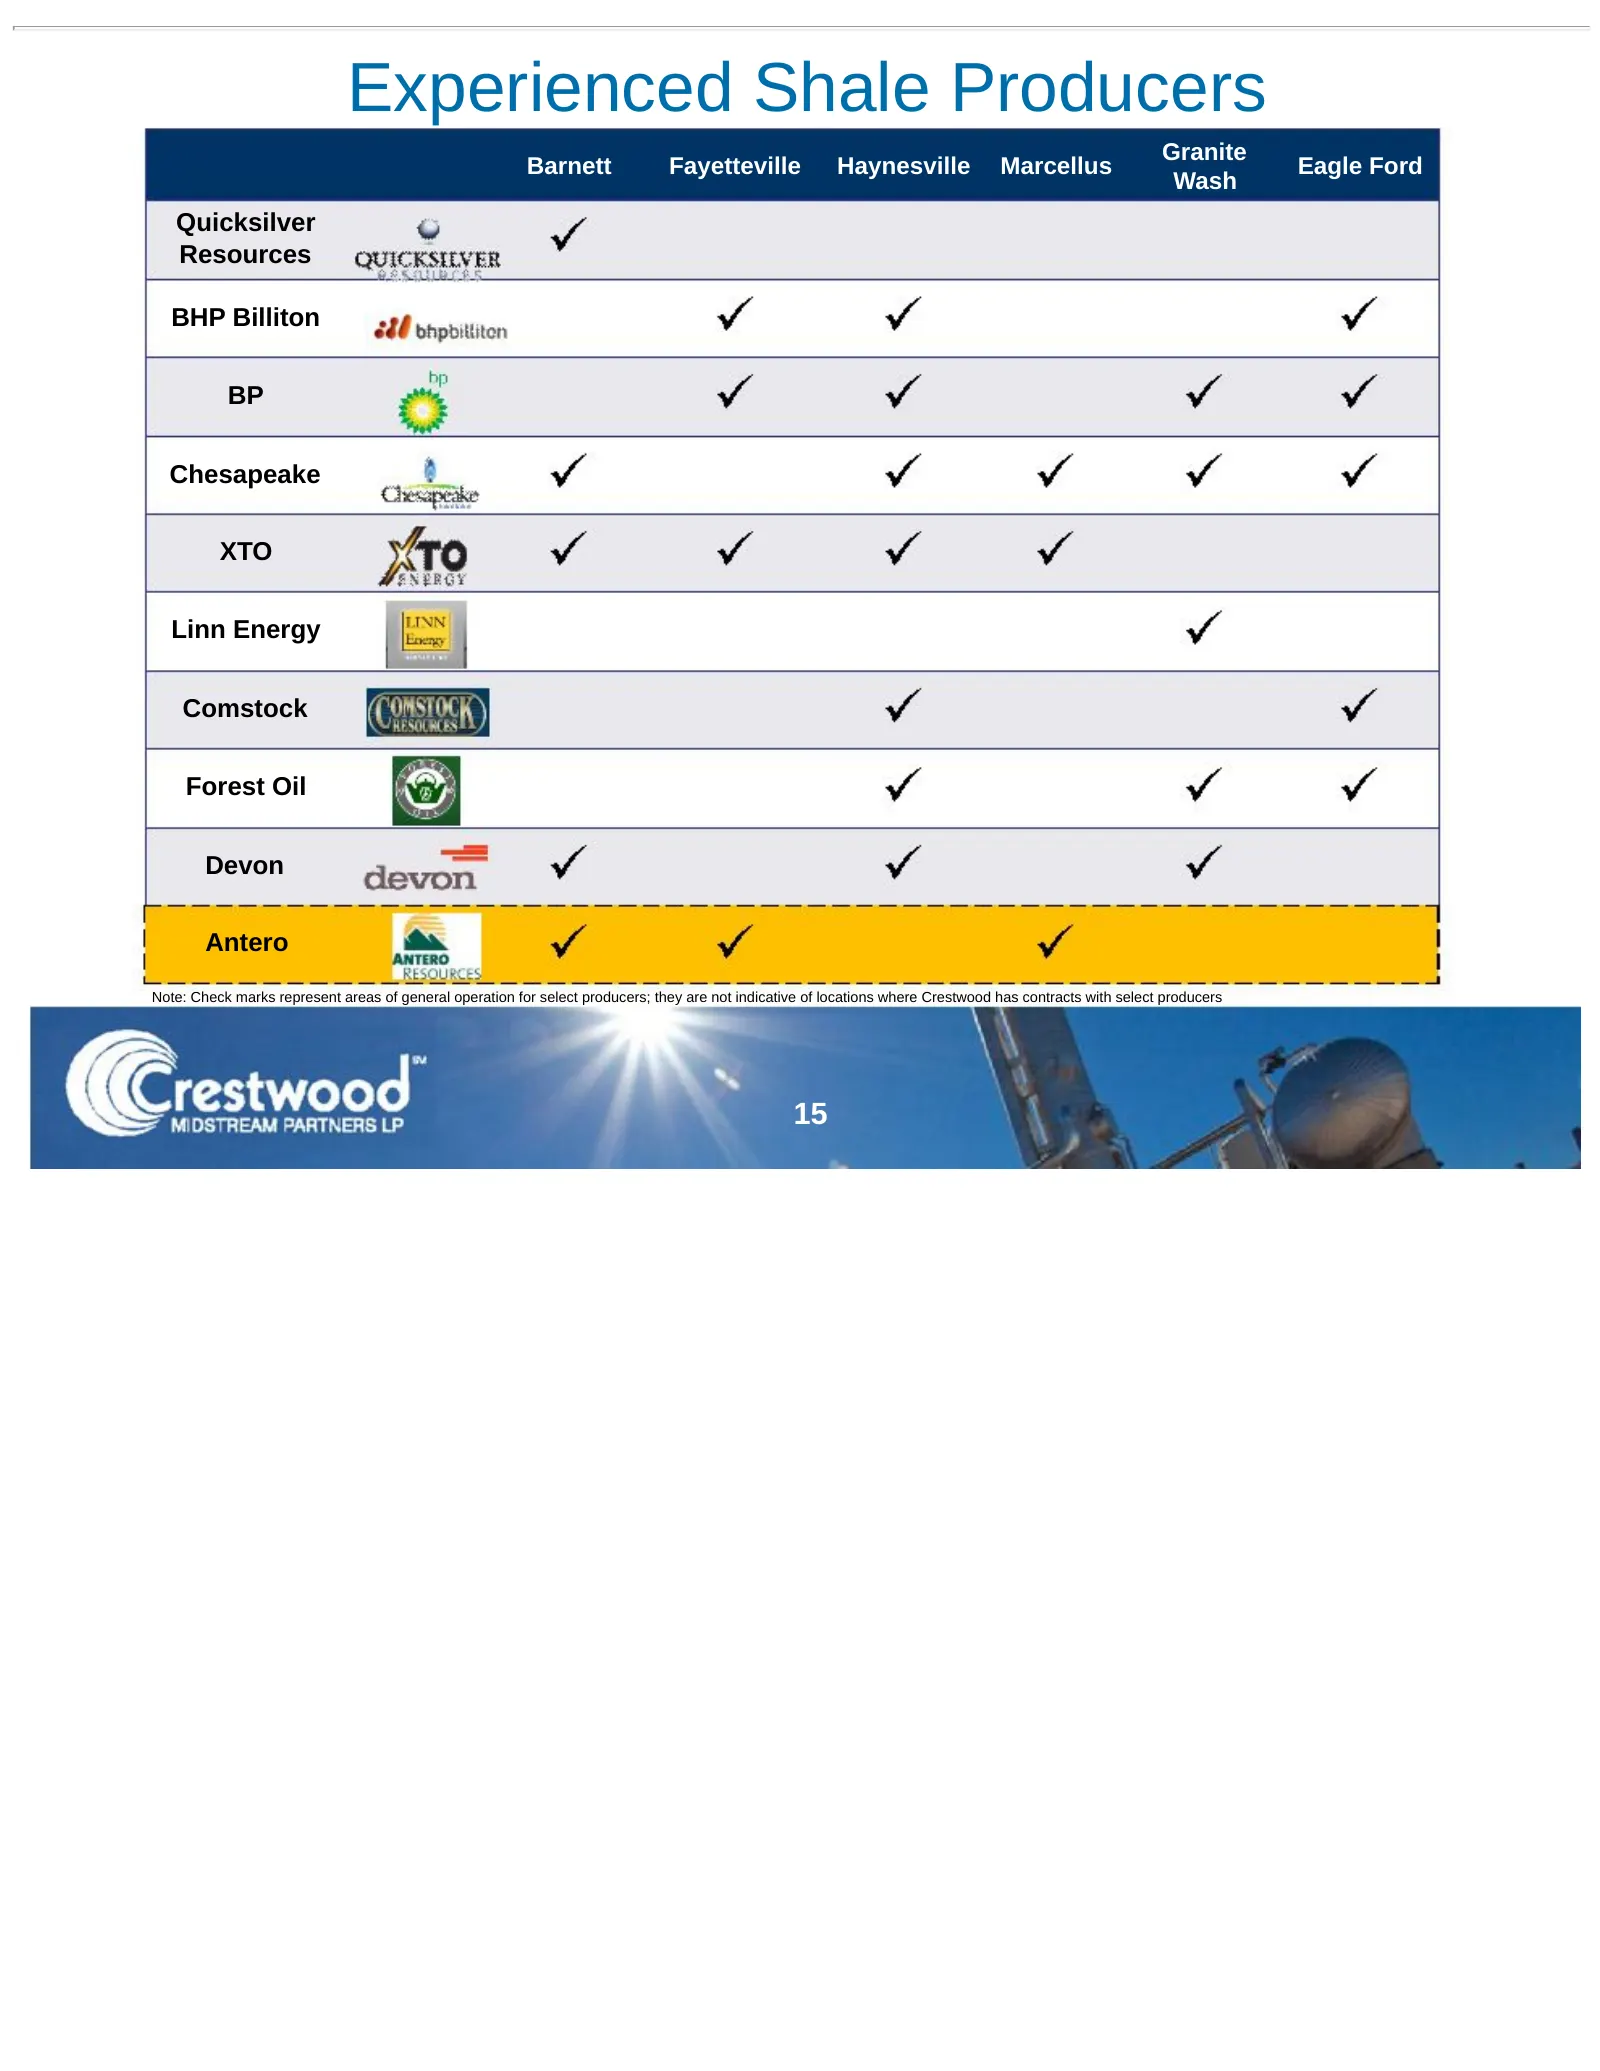
Slide 15: Experienced Shale Producers
Experienced Shale Producers Granite Barnett Fayetteville Haynesville Marcellus Eagle Ford Wash Quicksilver Resources BHP Billiton BP Chesapeake XTO Linn Energy Comstock Forest Oil Devon Antero Note: Check marks represent areas of general operation for select producers; they are not indicative of loc
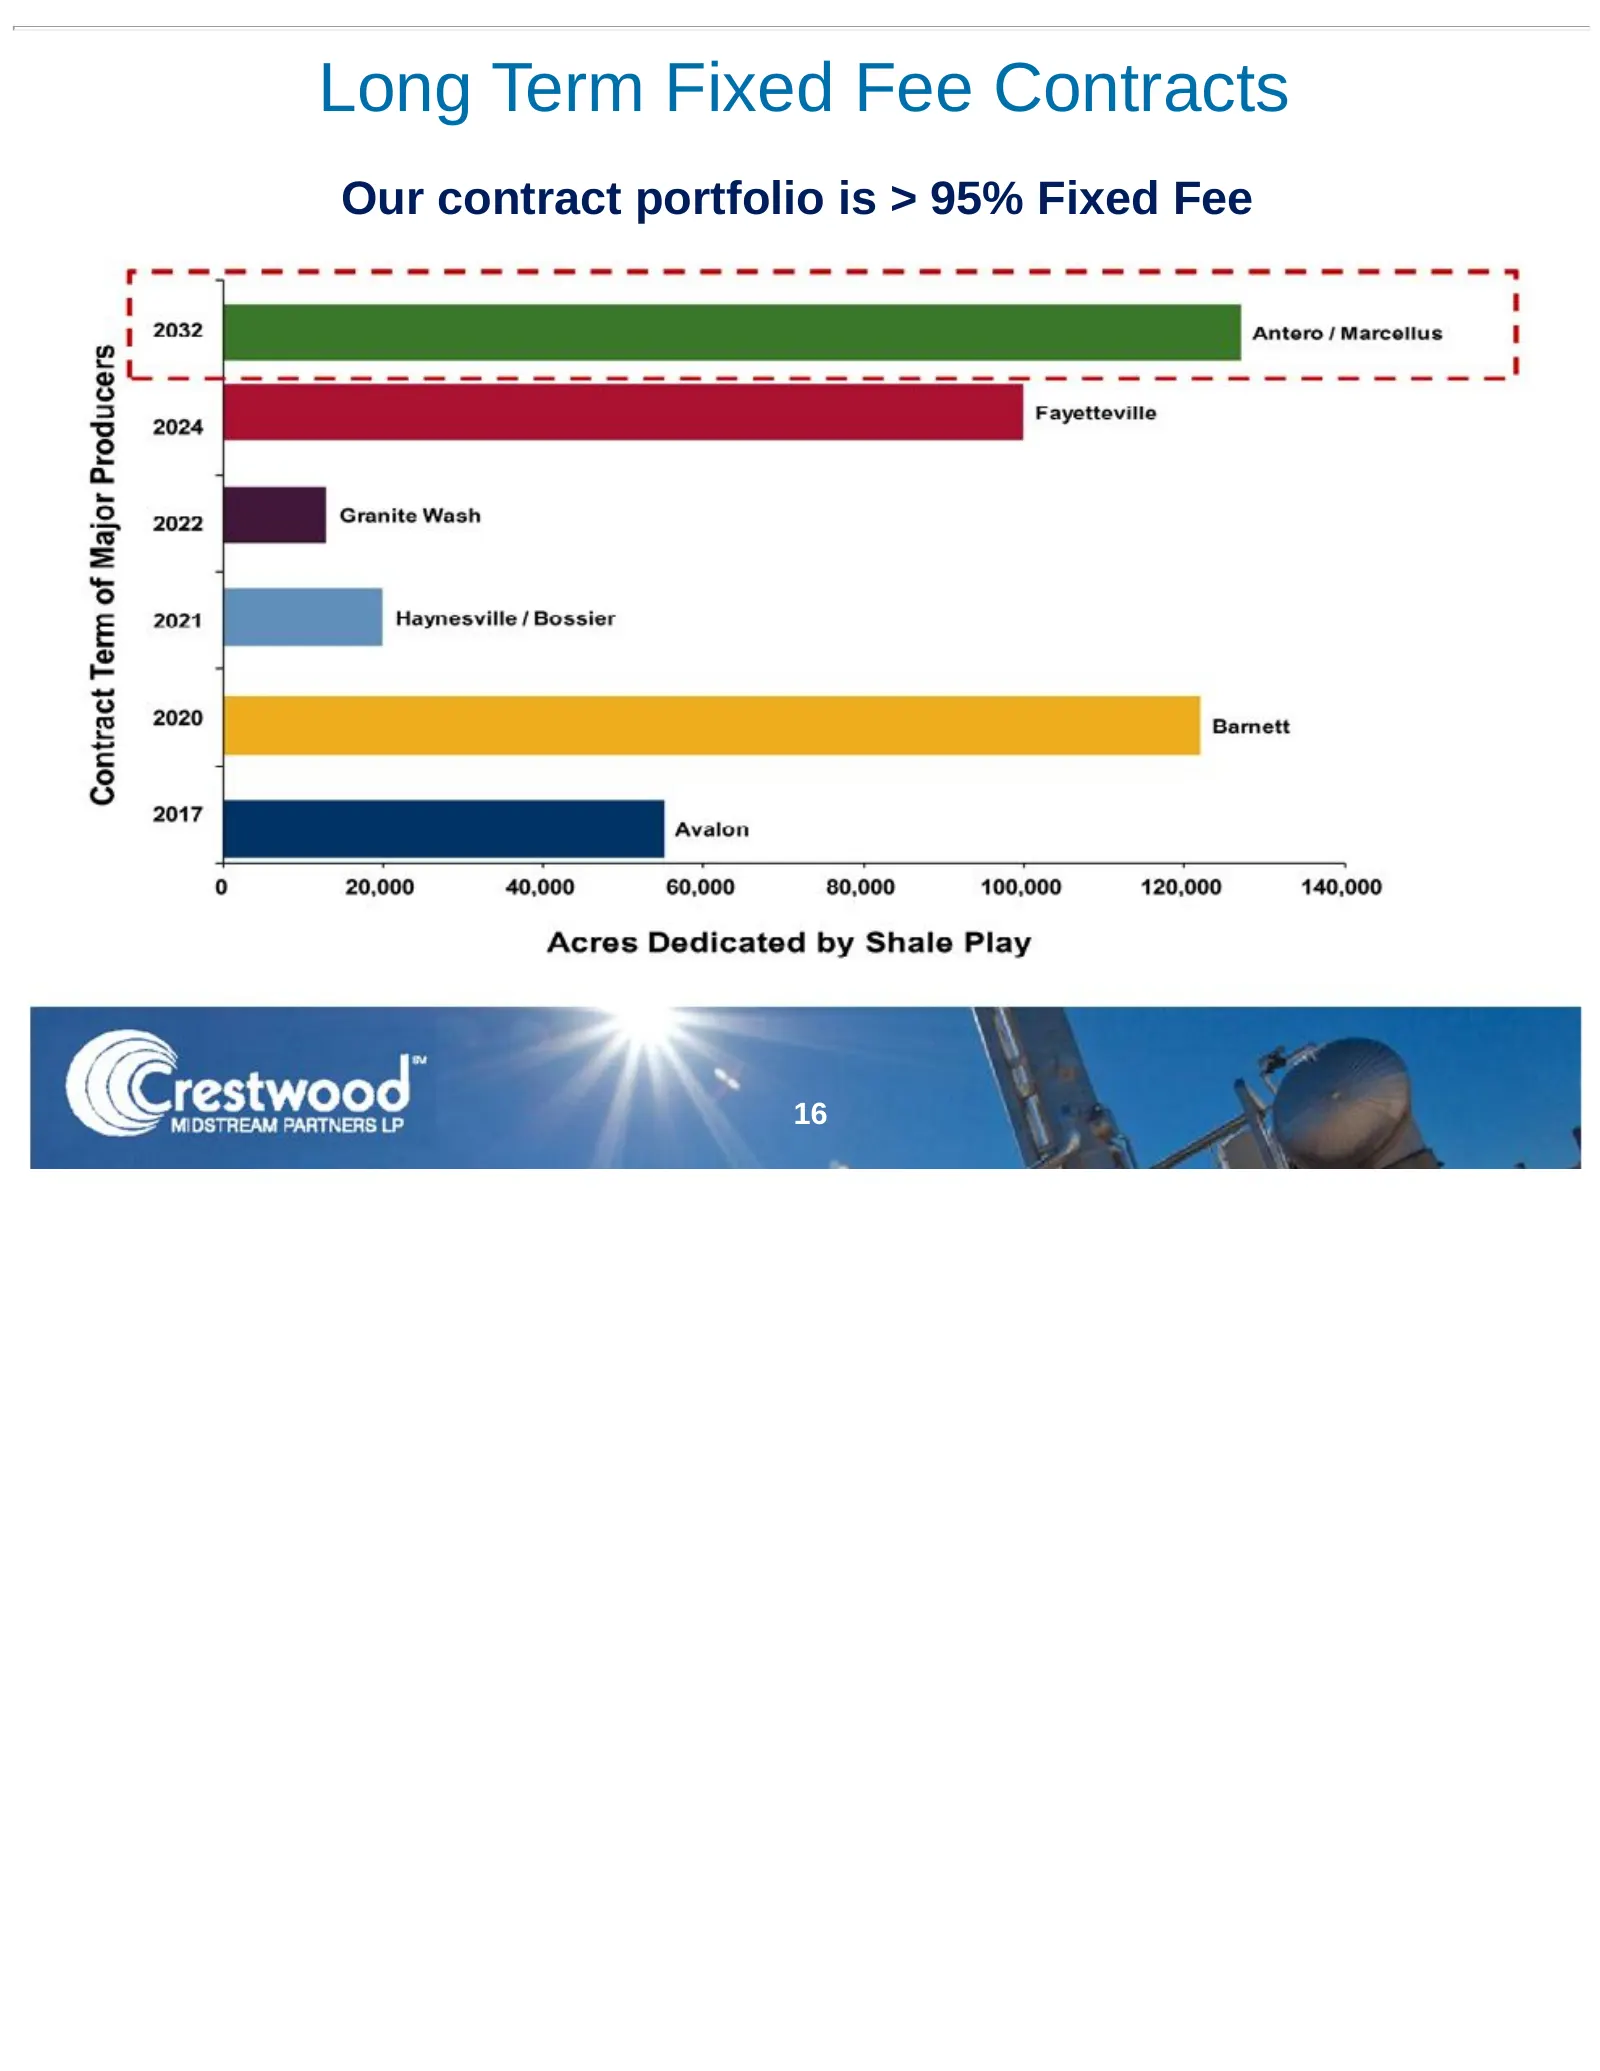
Slide 16: Long Term Fixed Fee Contracts
Long Term Fixed Fee Contracts Our contract portfolio is > 95% Fixed Fee 16
Slide 17: Barnett Shale Outlook
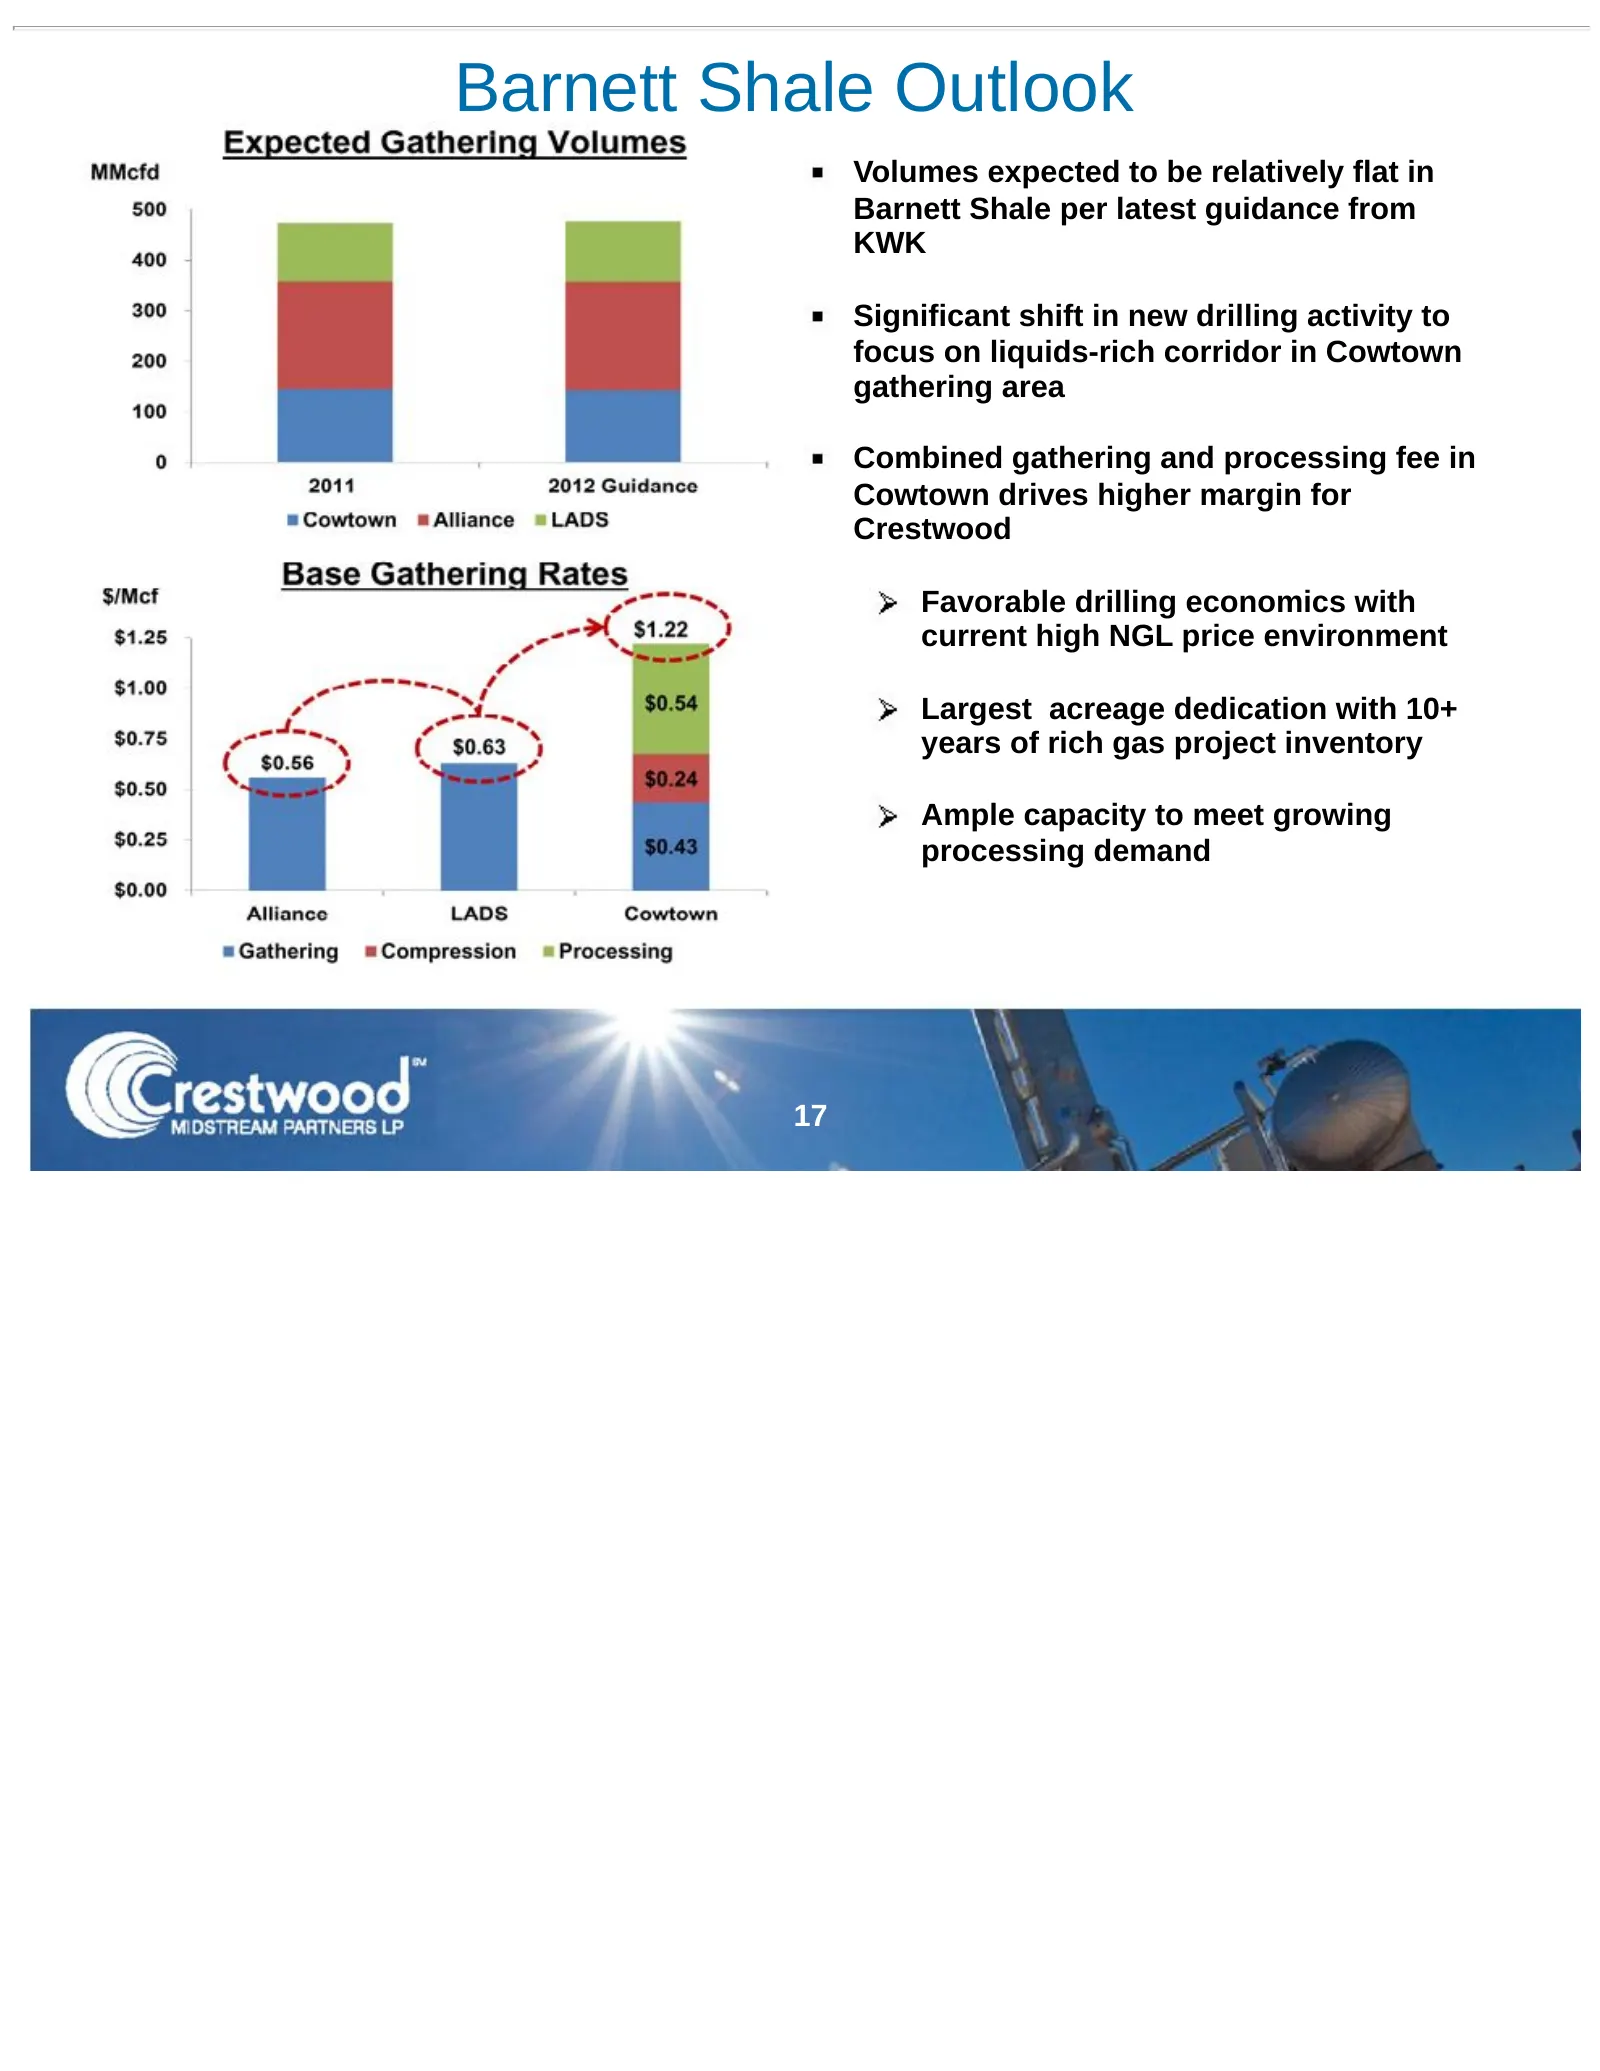
Barnett Shale Outlook Volumes expected to be relatively flat in Barnett Shale per latest guidance from KWK Significant shift in new drilling activity to focus on liquids-rich corridor in Cowtown gathering area Combined gathering and processing fee in Cowtown drives higher margin for Crestwood Favora
Slide 18: Fayetteville Shale Outlook
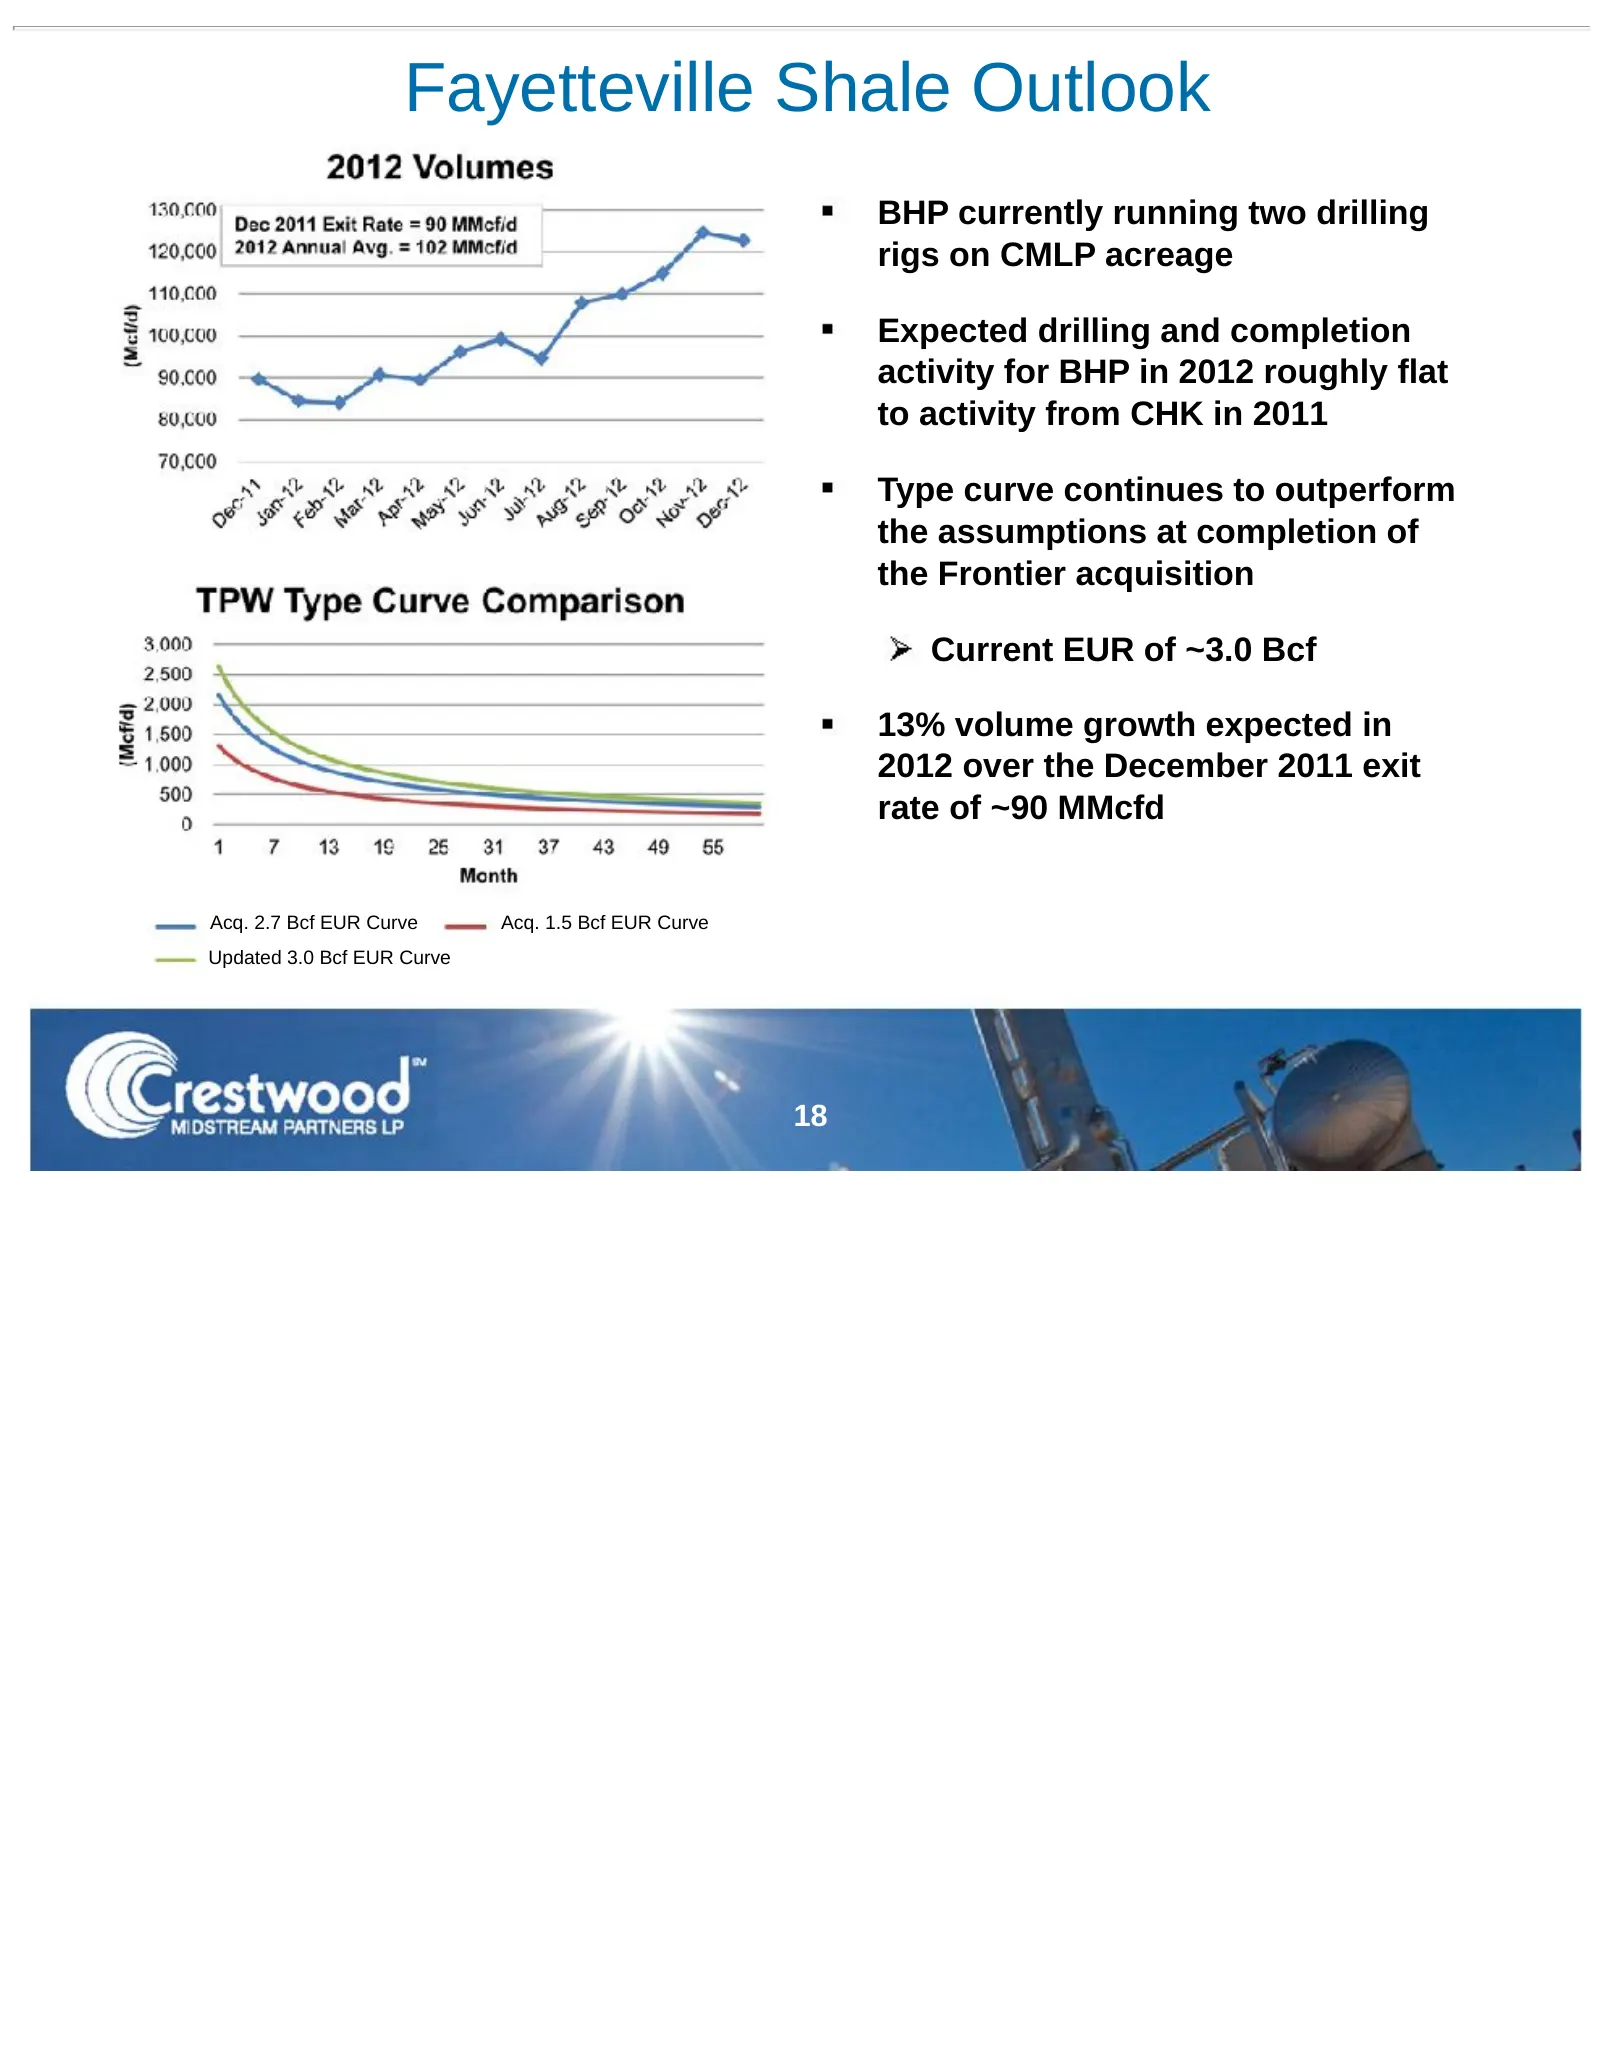
Fayetteville Shale Outlook BHP currently running two drilling rigs on CMLP acreage Expected drilling and completion activity for BHP in 2012 roughly flat to activity from CHK in 2011 Type curve continues to outperform the assumptions at completion of the Frontier acquisition Current EUR of ~3.0 Bcf
Slide 19: Fayetteville Shale Outlook (cont’d)
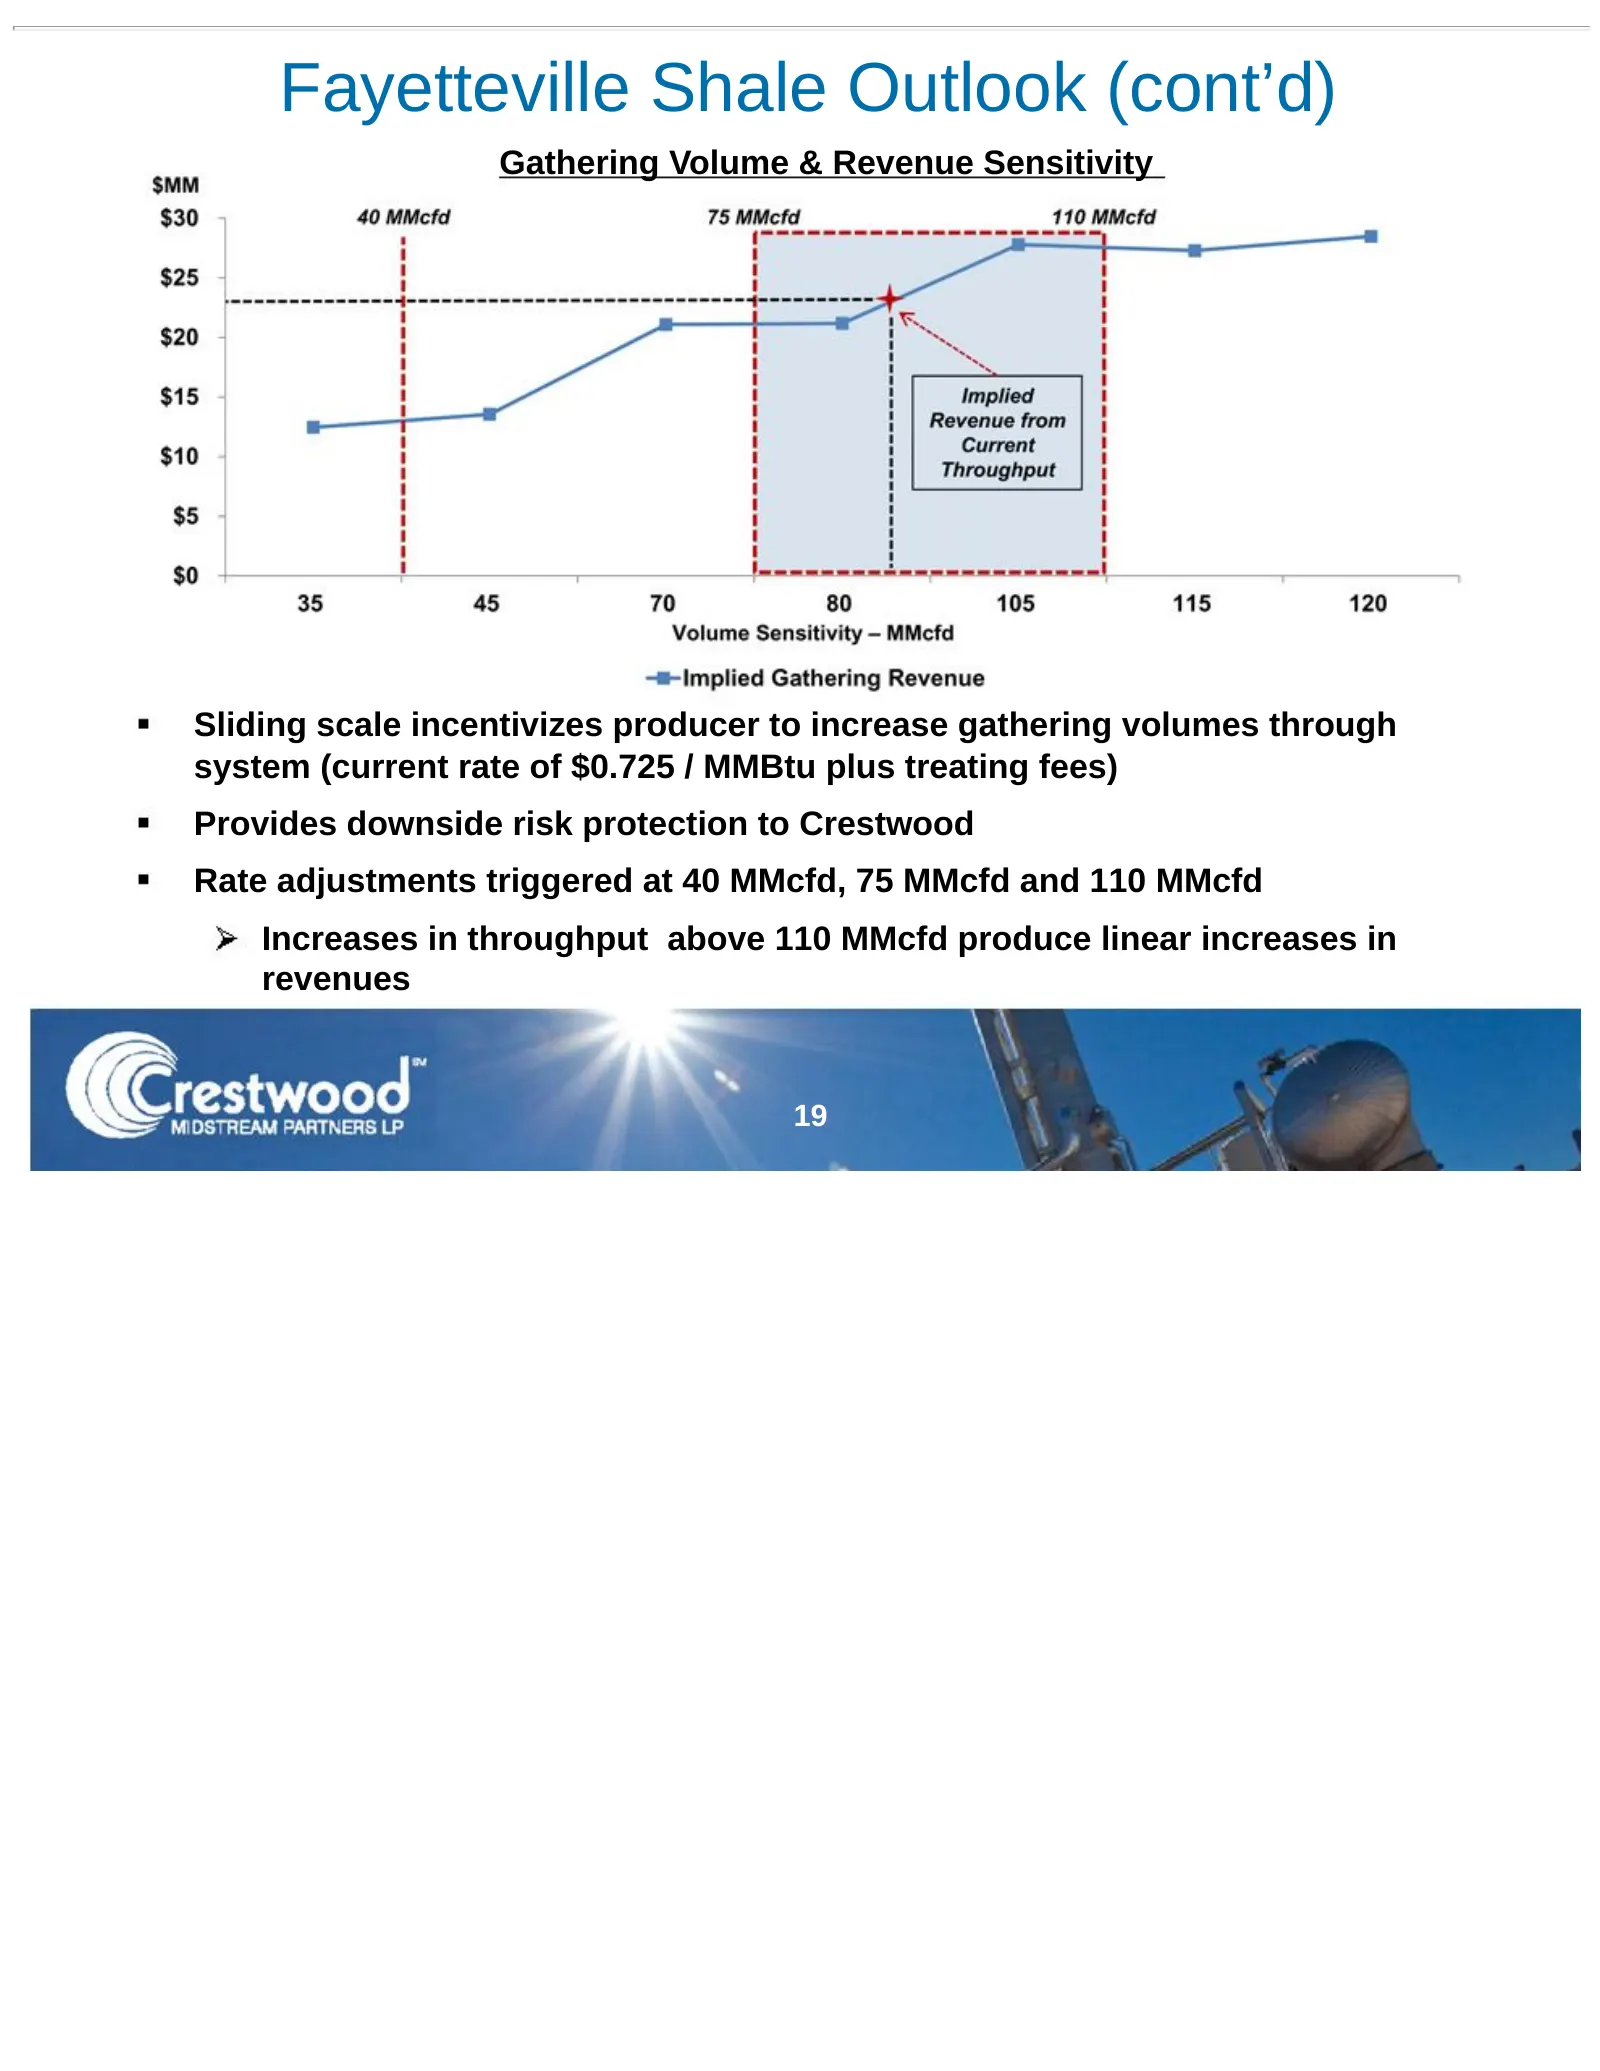
Fayetteville Shale Outlook (cont’d) Gathering Volume & Revenue Sensitivity Sliding scale incentivizes producer to increase gathering volumes through system (current rate of $0.725 / MMBtu plus treating fees) Provides downside risk protection to Crestwood Rate adjustments triggered at 40 MMcfd, 75 MM
Slide 20: Haynesville/Bossier Outlook
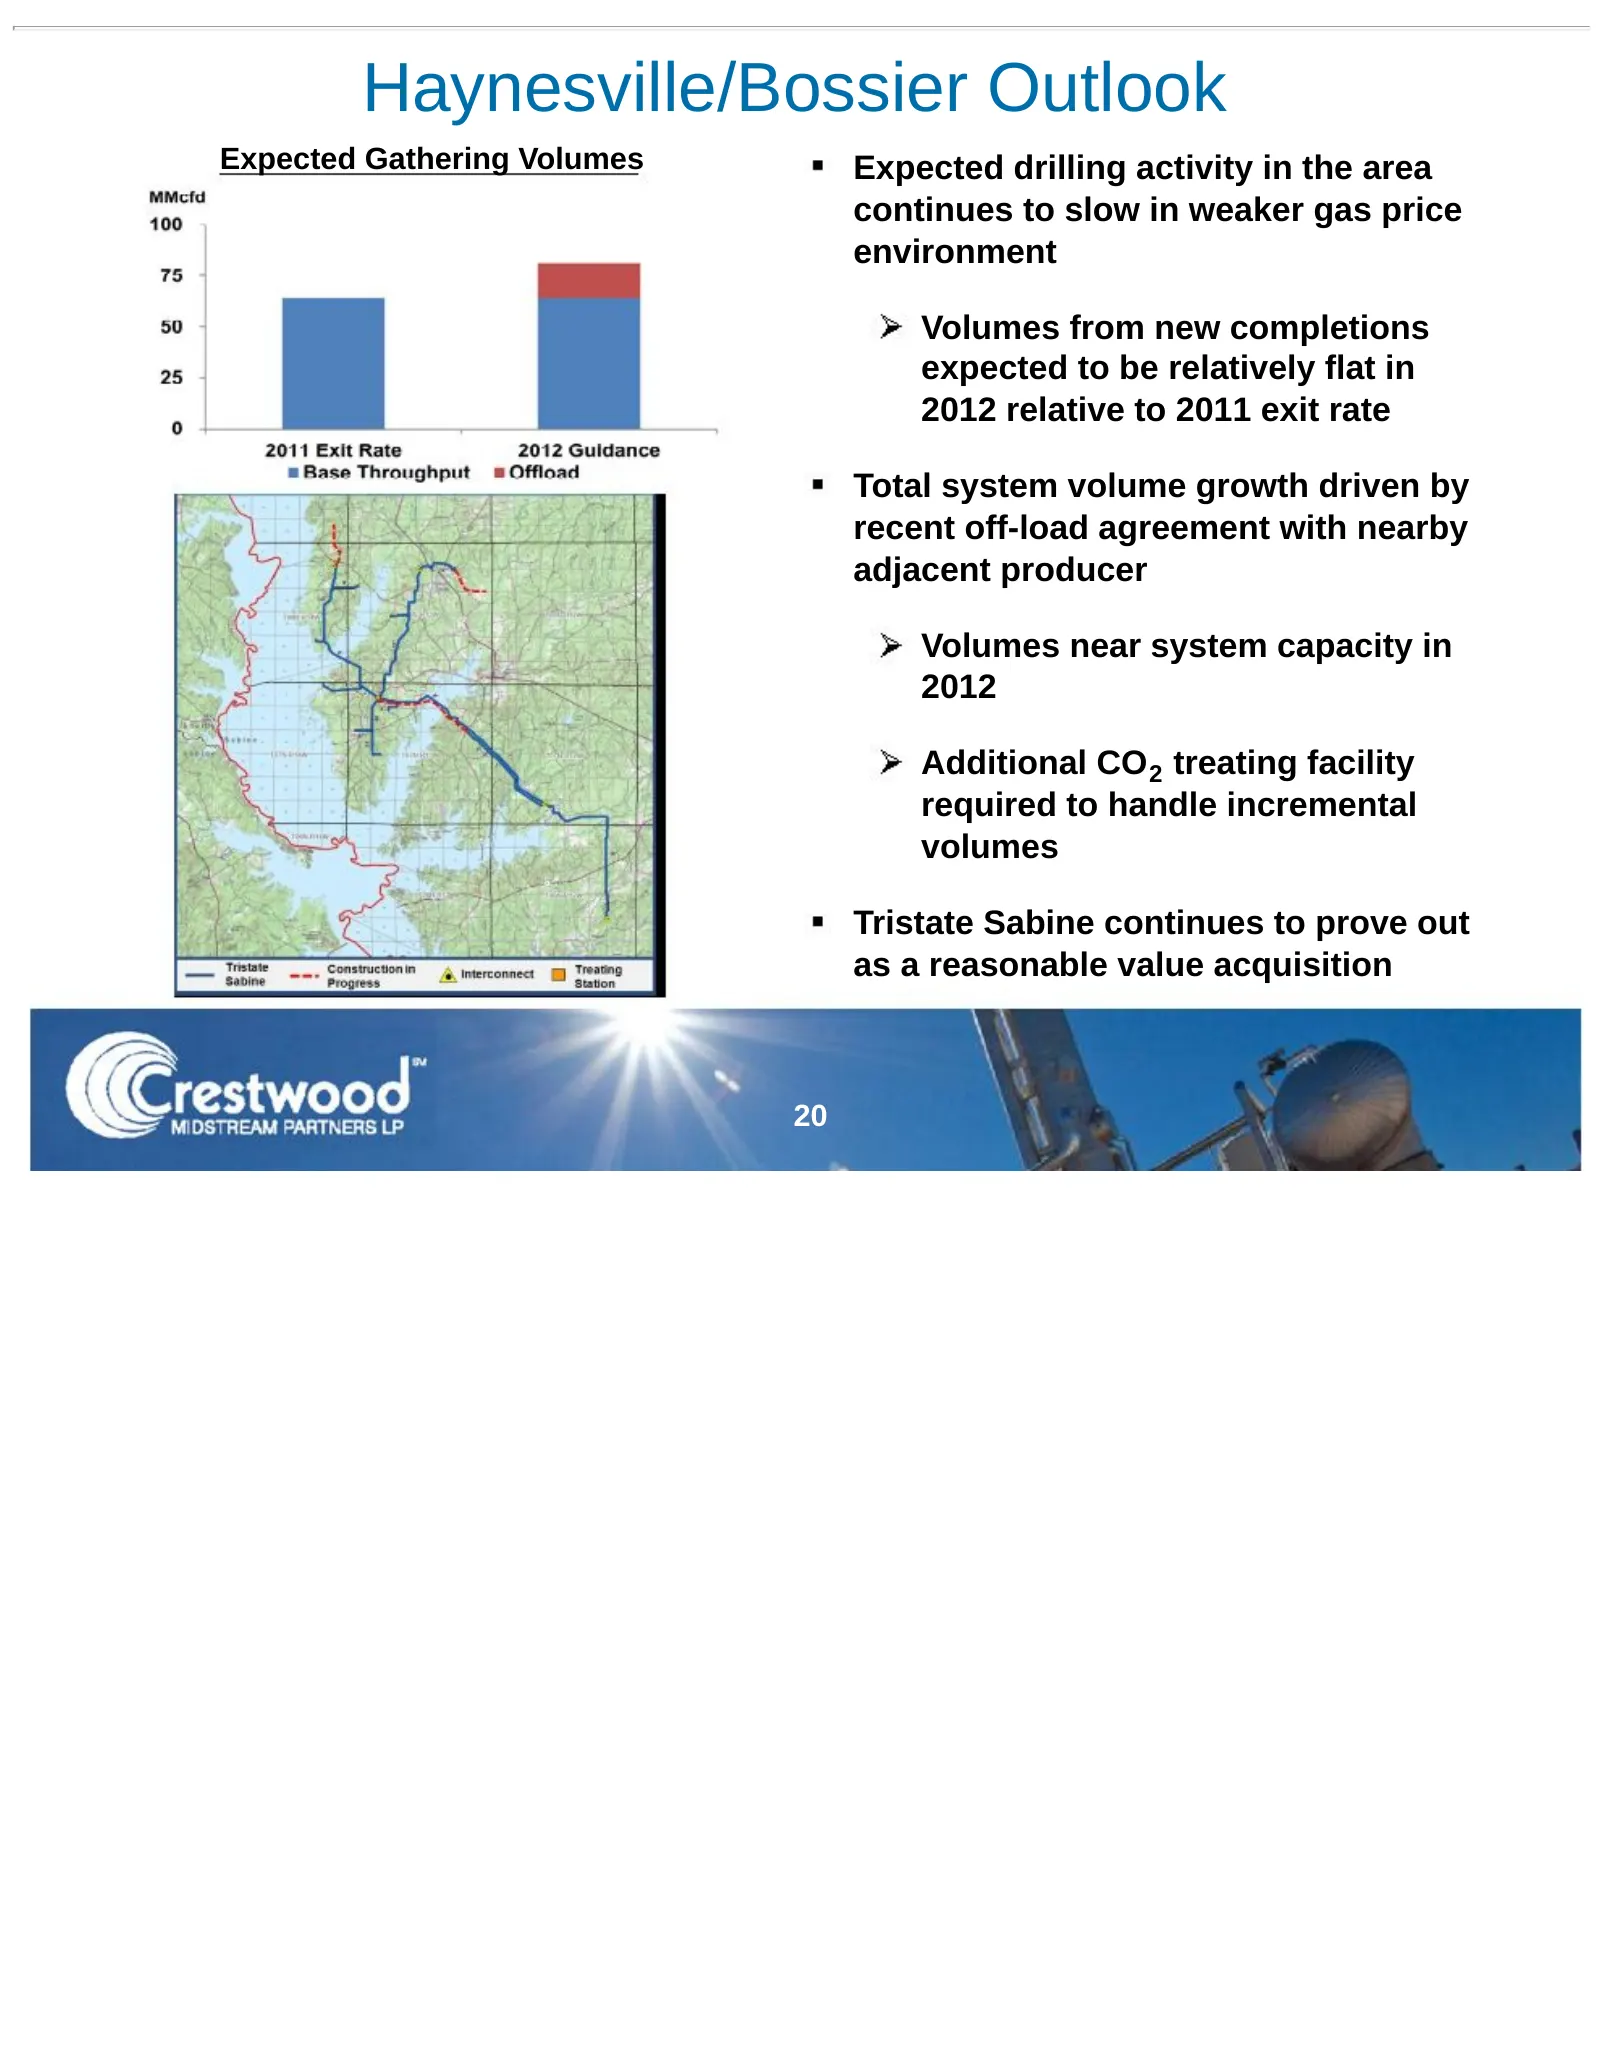
Haynesville/Bossier Outlook Expected Gathering Volumes Expected drilling activity in the area continues to slow in weaker gas price environment Volumes from new completions expected to be relatively flat in 2012 relative to 2011 exit rate Total system volume growth driven by recent off-load agreemen
Slide 21: Rich Gas Development Outlook
Rich Gas Development Outlook Continued opportunity / optionality for CMLP’s rich gas systems (Granite Wash and Avalon Shale) as producer activity continues to increase No capital projects included in current 2012 guidance Advanced discussions with existing producers continue to progress CMLP to prov
Slide 22: Financial Overview
* * * * * * * * Financial Overview 22
Slide 23: Strategically Financing Significant Growth
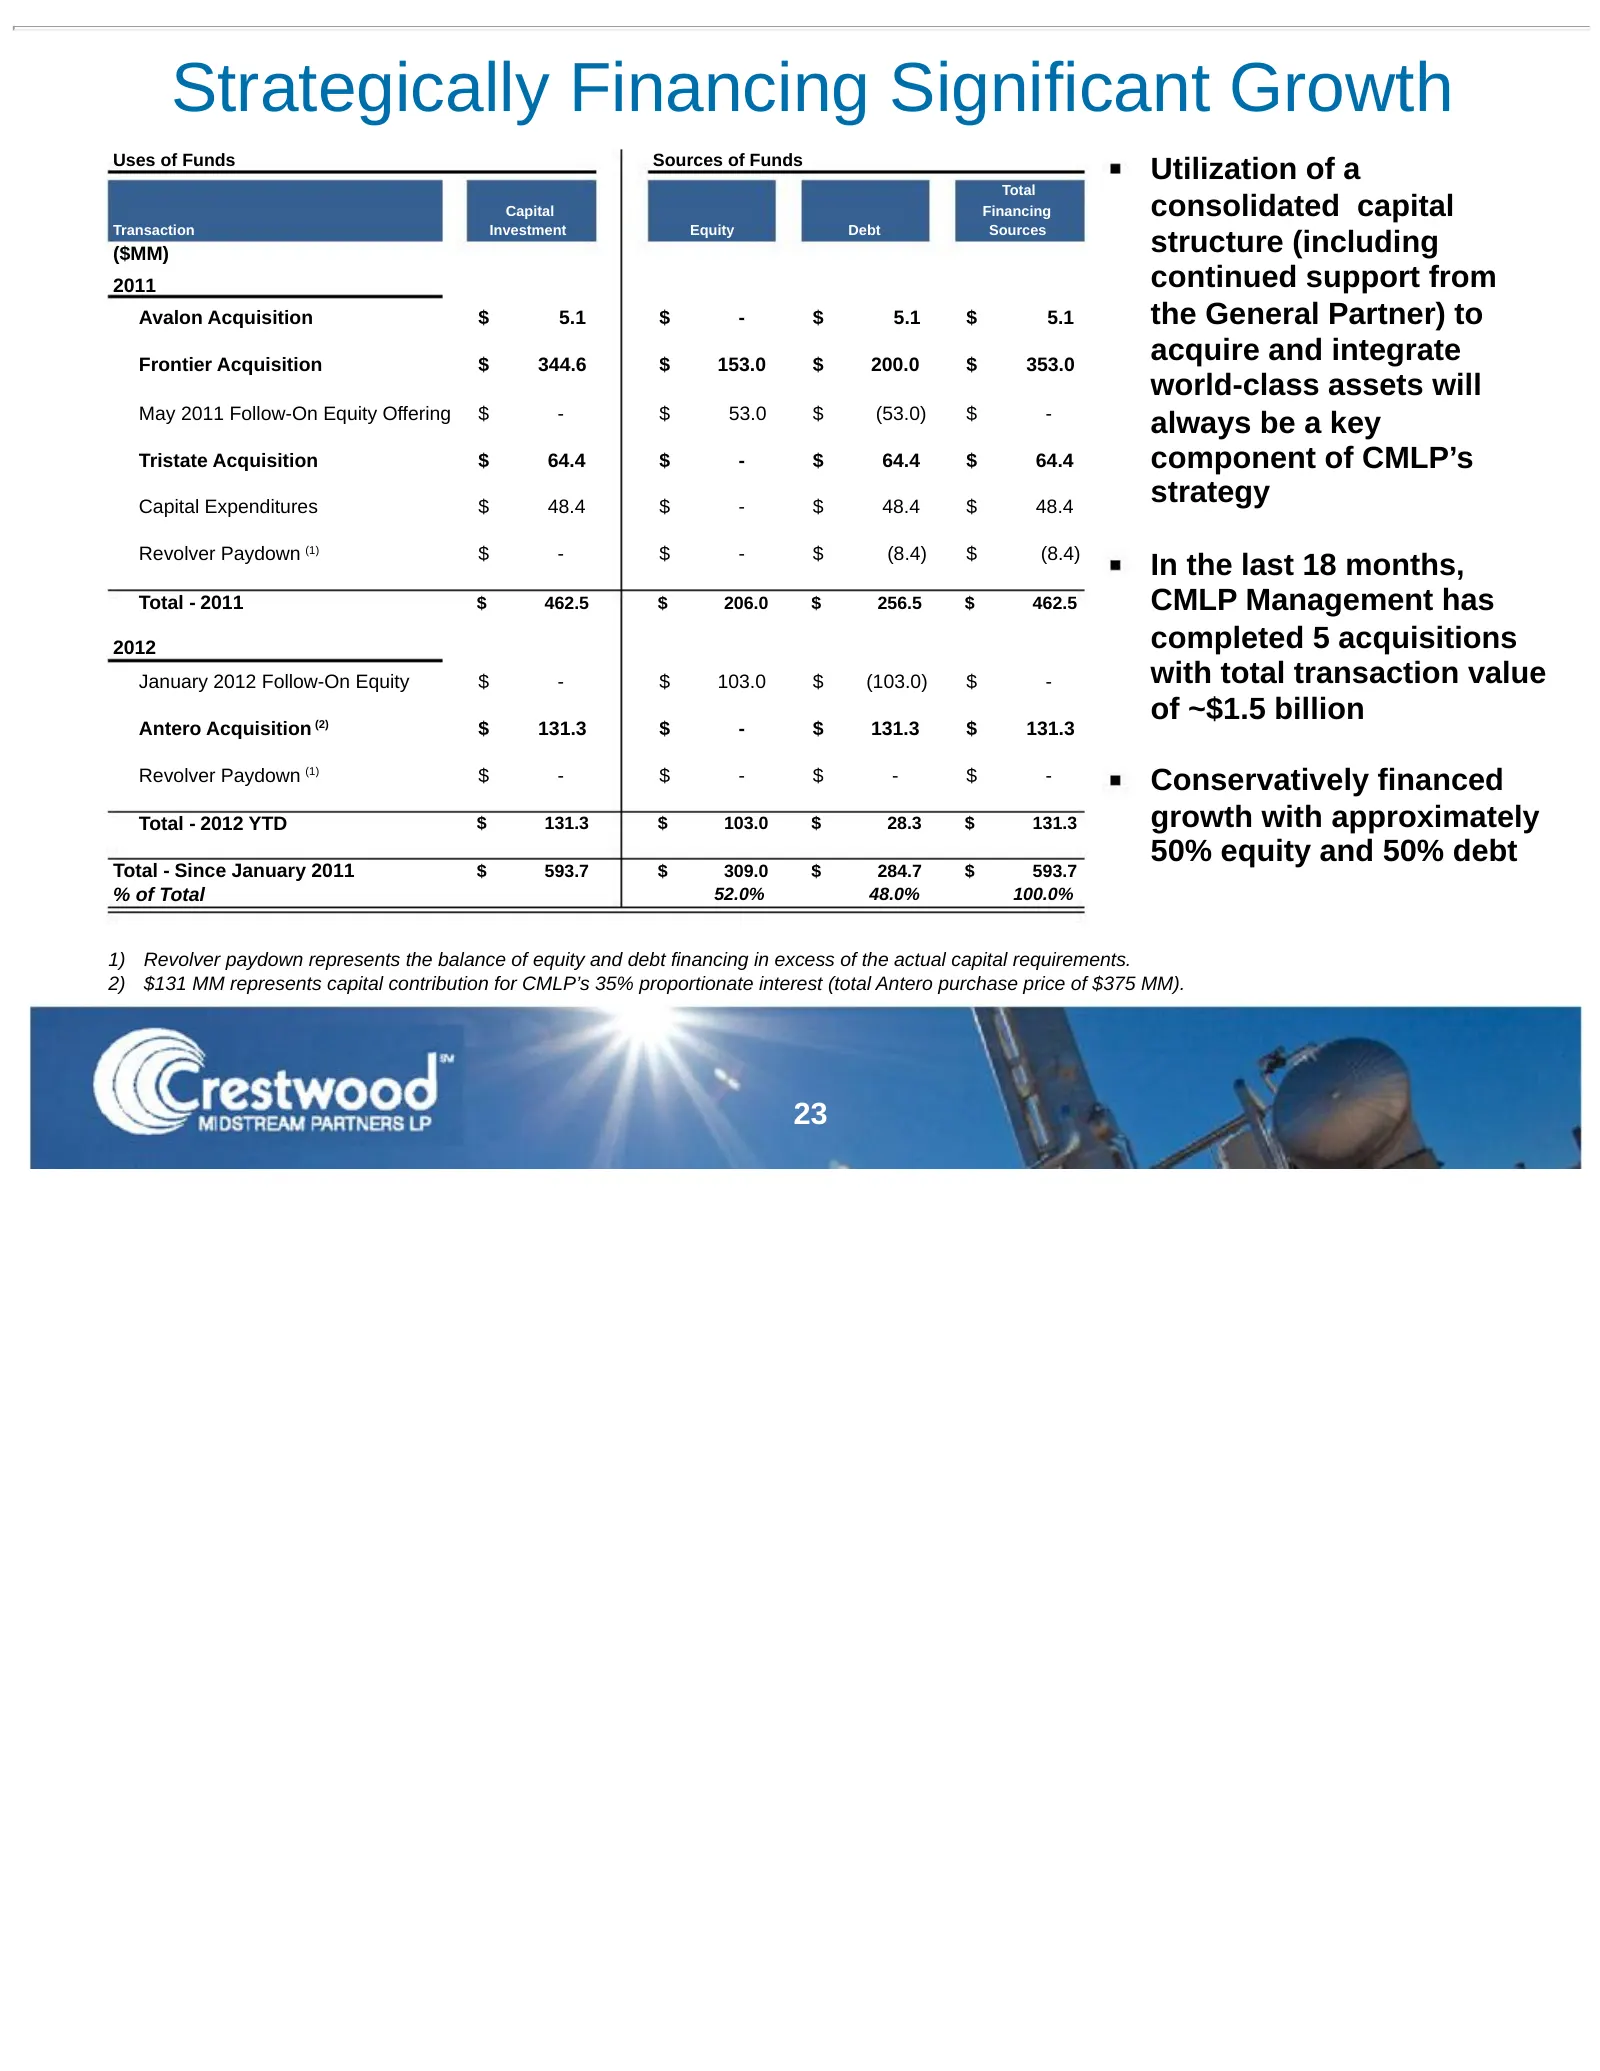
Strategically Financing Significant Growth Uses of Funds Sources of Funds Utilization of a Total Capital Financing consolidated capital Transaction Investment Equity Debt Sources ($MM) structure (including 2011 continued support from Avalon Acquisition $ 5.1 $ - $ 5.1 $ 5.1 the General Partner) to F
Slide 24: 2011 Performance
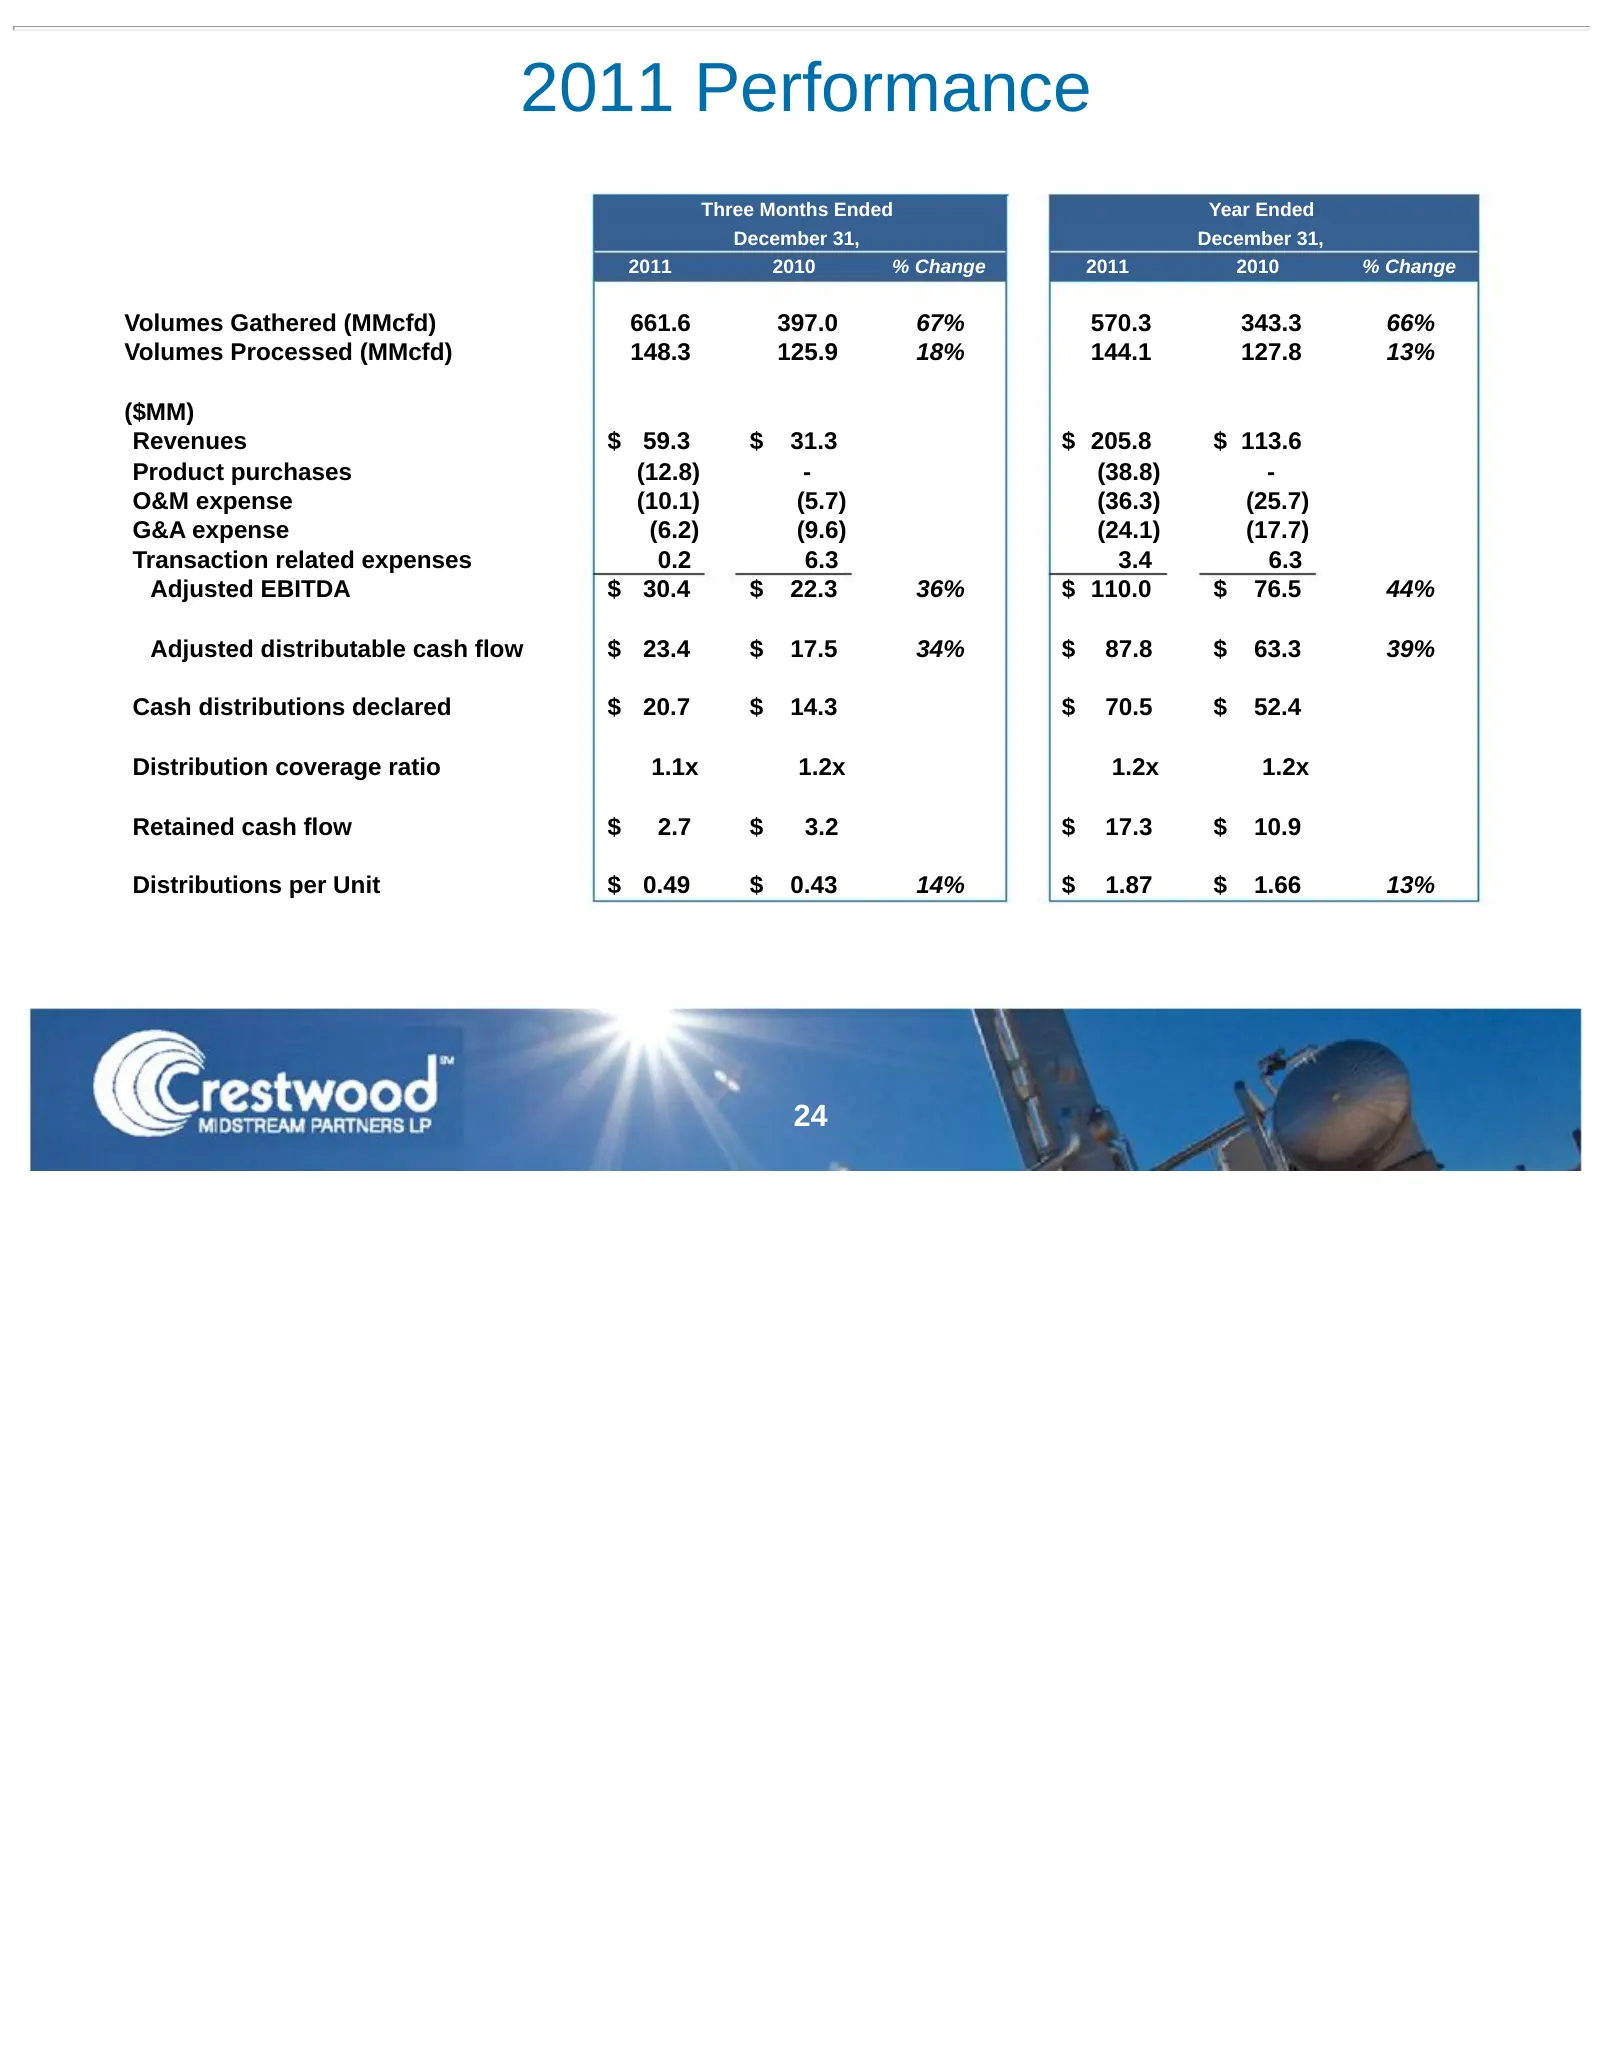
2011 Performance Three Months Ended Year Ended December 31, December 31, 2011 2010 % Change 2011 2010 % Change Volumes Gathered (MMcfd) 661.6 397.0 67% 570.3 343.3 66% Volumes Processed (MMcfd) 148.3 125.9 18% 144.1 127.8 13% ($MM) Revenues $ 59.3 $ 31.3 $ 205.8 $ 113.6 Product purchases (12.8) - (3
Slide 25: CMLP Historical Financial Summary
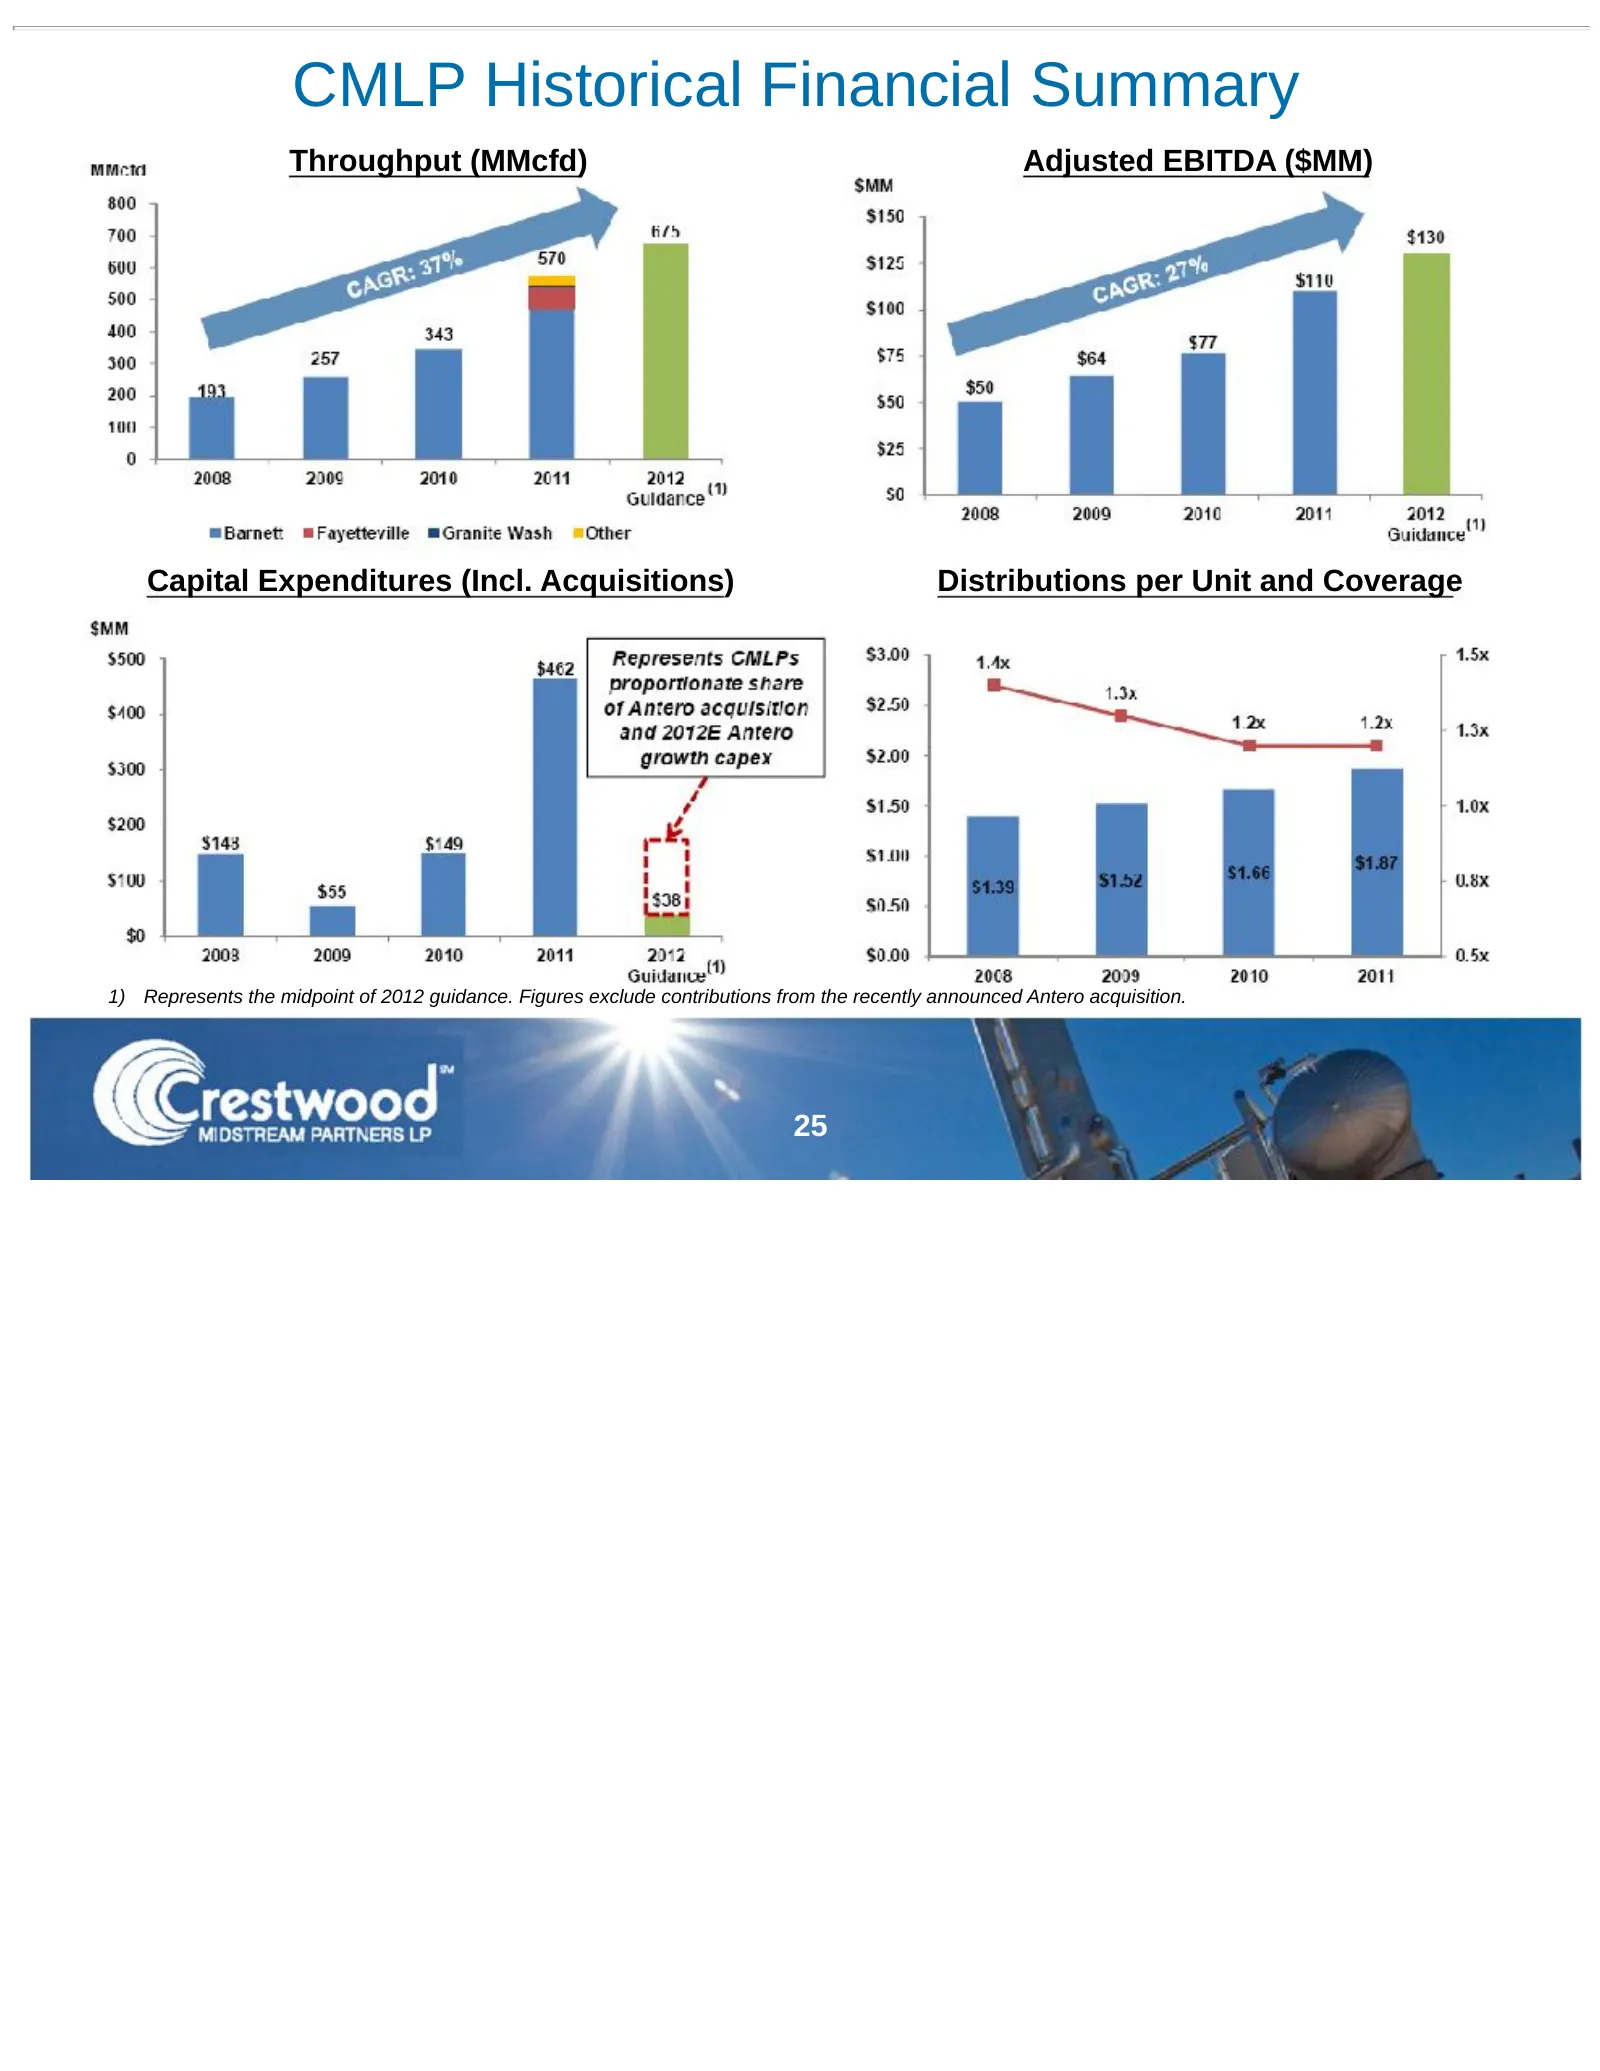
CMLP Historical Financial Summary Throughput (MMcfd) Adjusted EBITDA ($MM) Capital Expenditures (Incl. Acquisitions) Distributions per Unit and Coverage 1) Represents the midpoint of 2012 guidance. Figures exclude contributions from the recently announced Antero acquisition. 25
Slide 26: Capitalization and Leverage
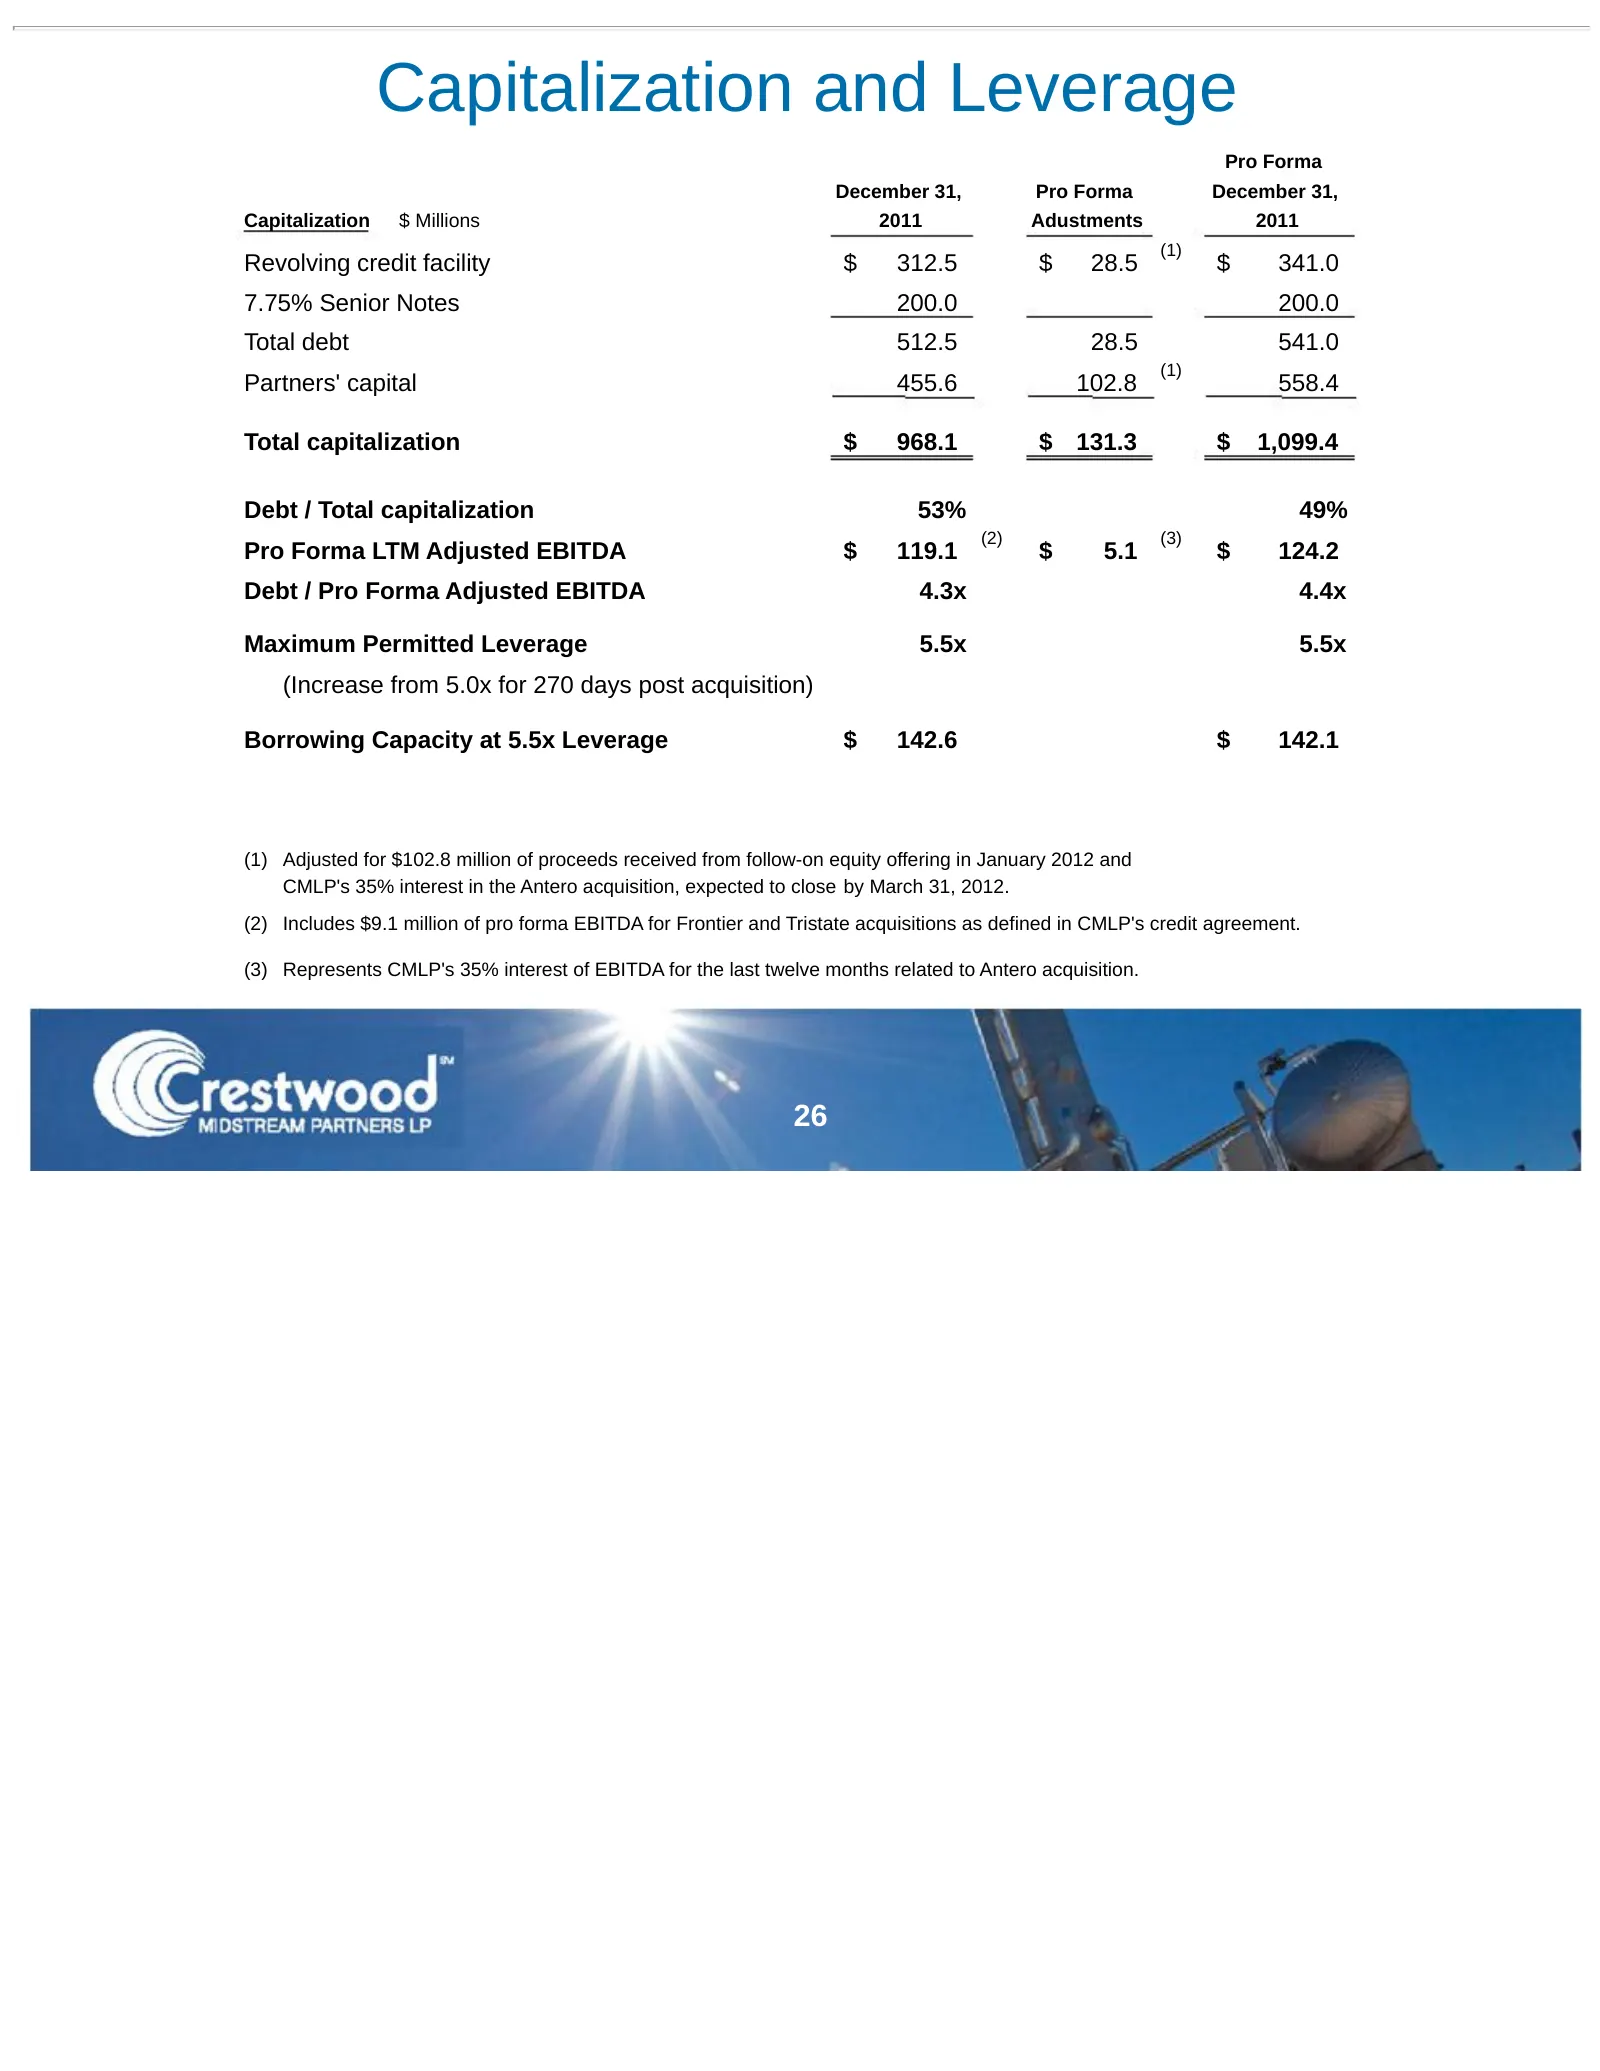
Capitalization and Leverage Pro Forma December 31, Pro Forma December 31, Capitalization $ Millions 2011 Adustments 2011 (1) Revolving credit facility $ 312.5 $ 28.5 $ 341.0 7.75% Senior Notes 200.0 200.0 Total debt 512.5 28.5 541.0 (1) Partners' capital 455.6 102.8 558.4 Total capitalization $ 968.
Slide 27: Key Investment Considerations
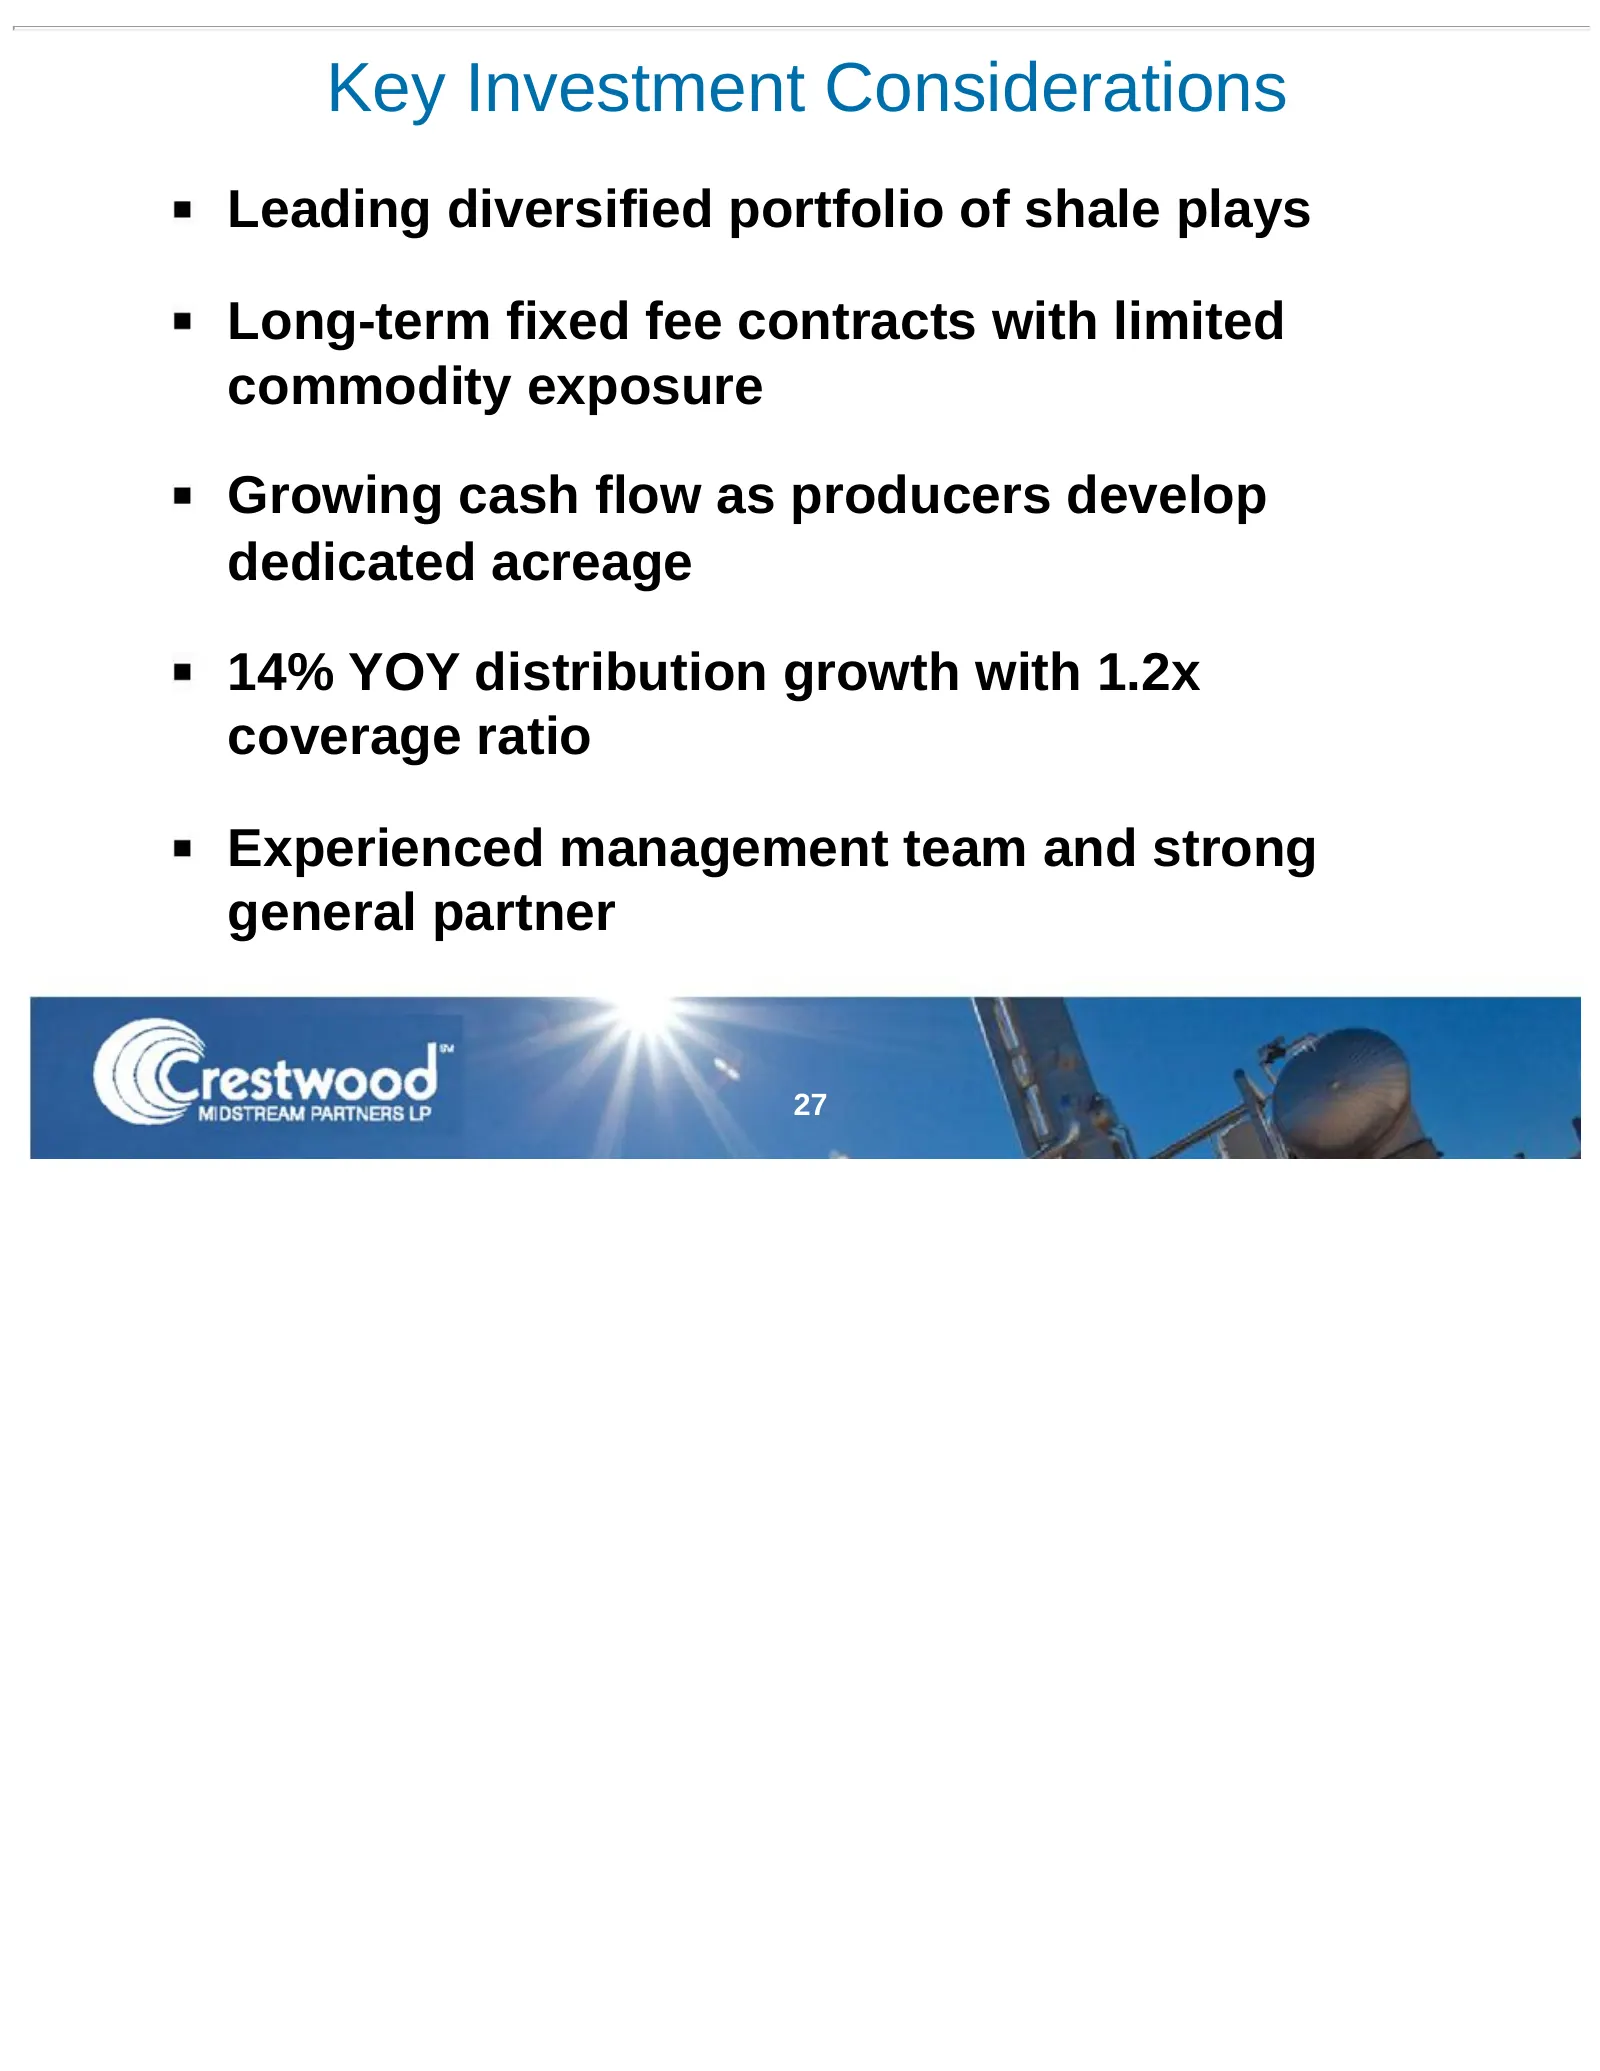
Key Investment Considerations Leading diversified portfolio of shale plays Long-term fixed fee contracts with limited commodity exposure Growing cash flow as producers develop dedicated acreage 14% YOY distribution growth with 1.2x coverage ratio Experienced management team and strong general partne
Slide 28: Non-GAAP Financial Measures
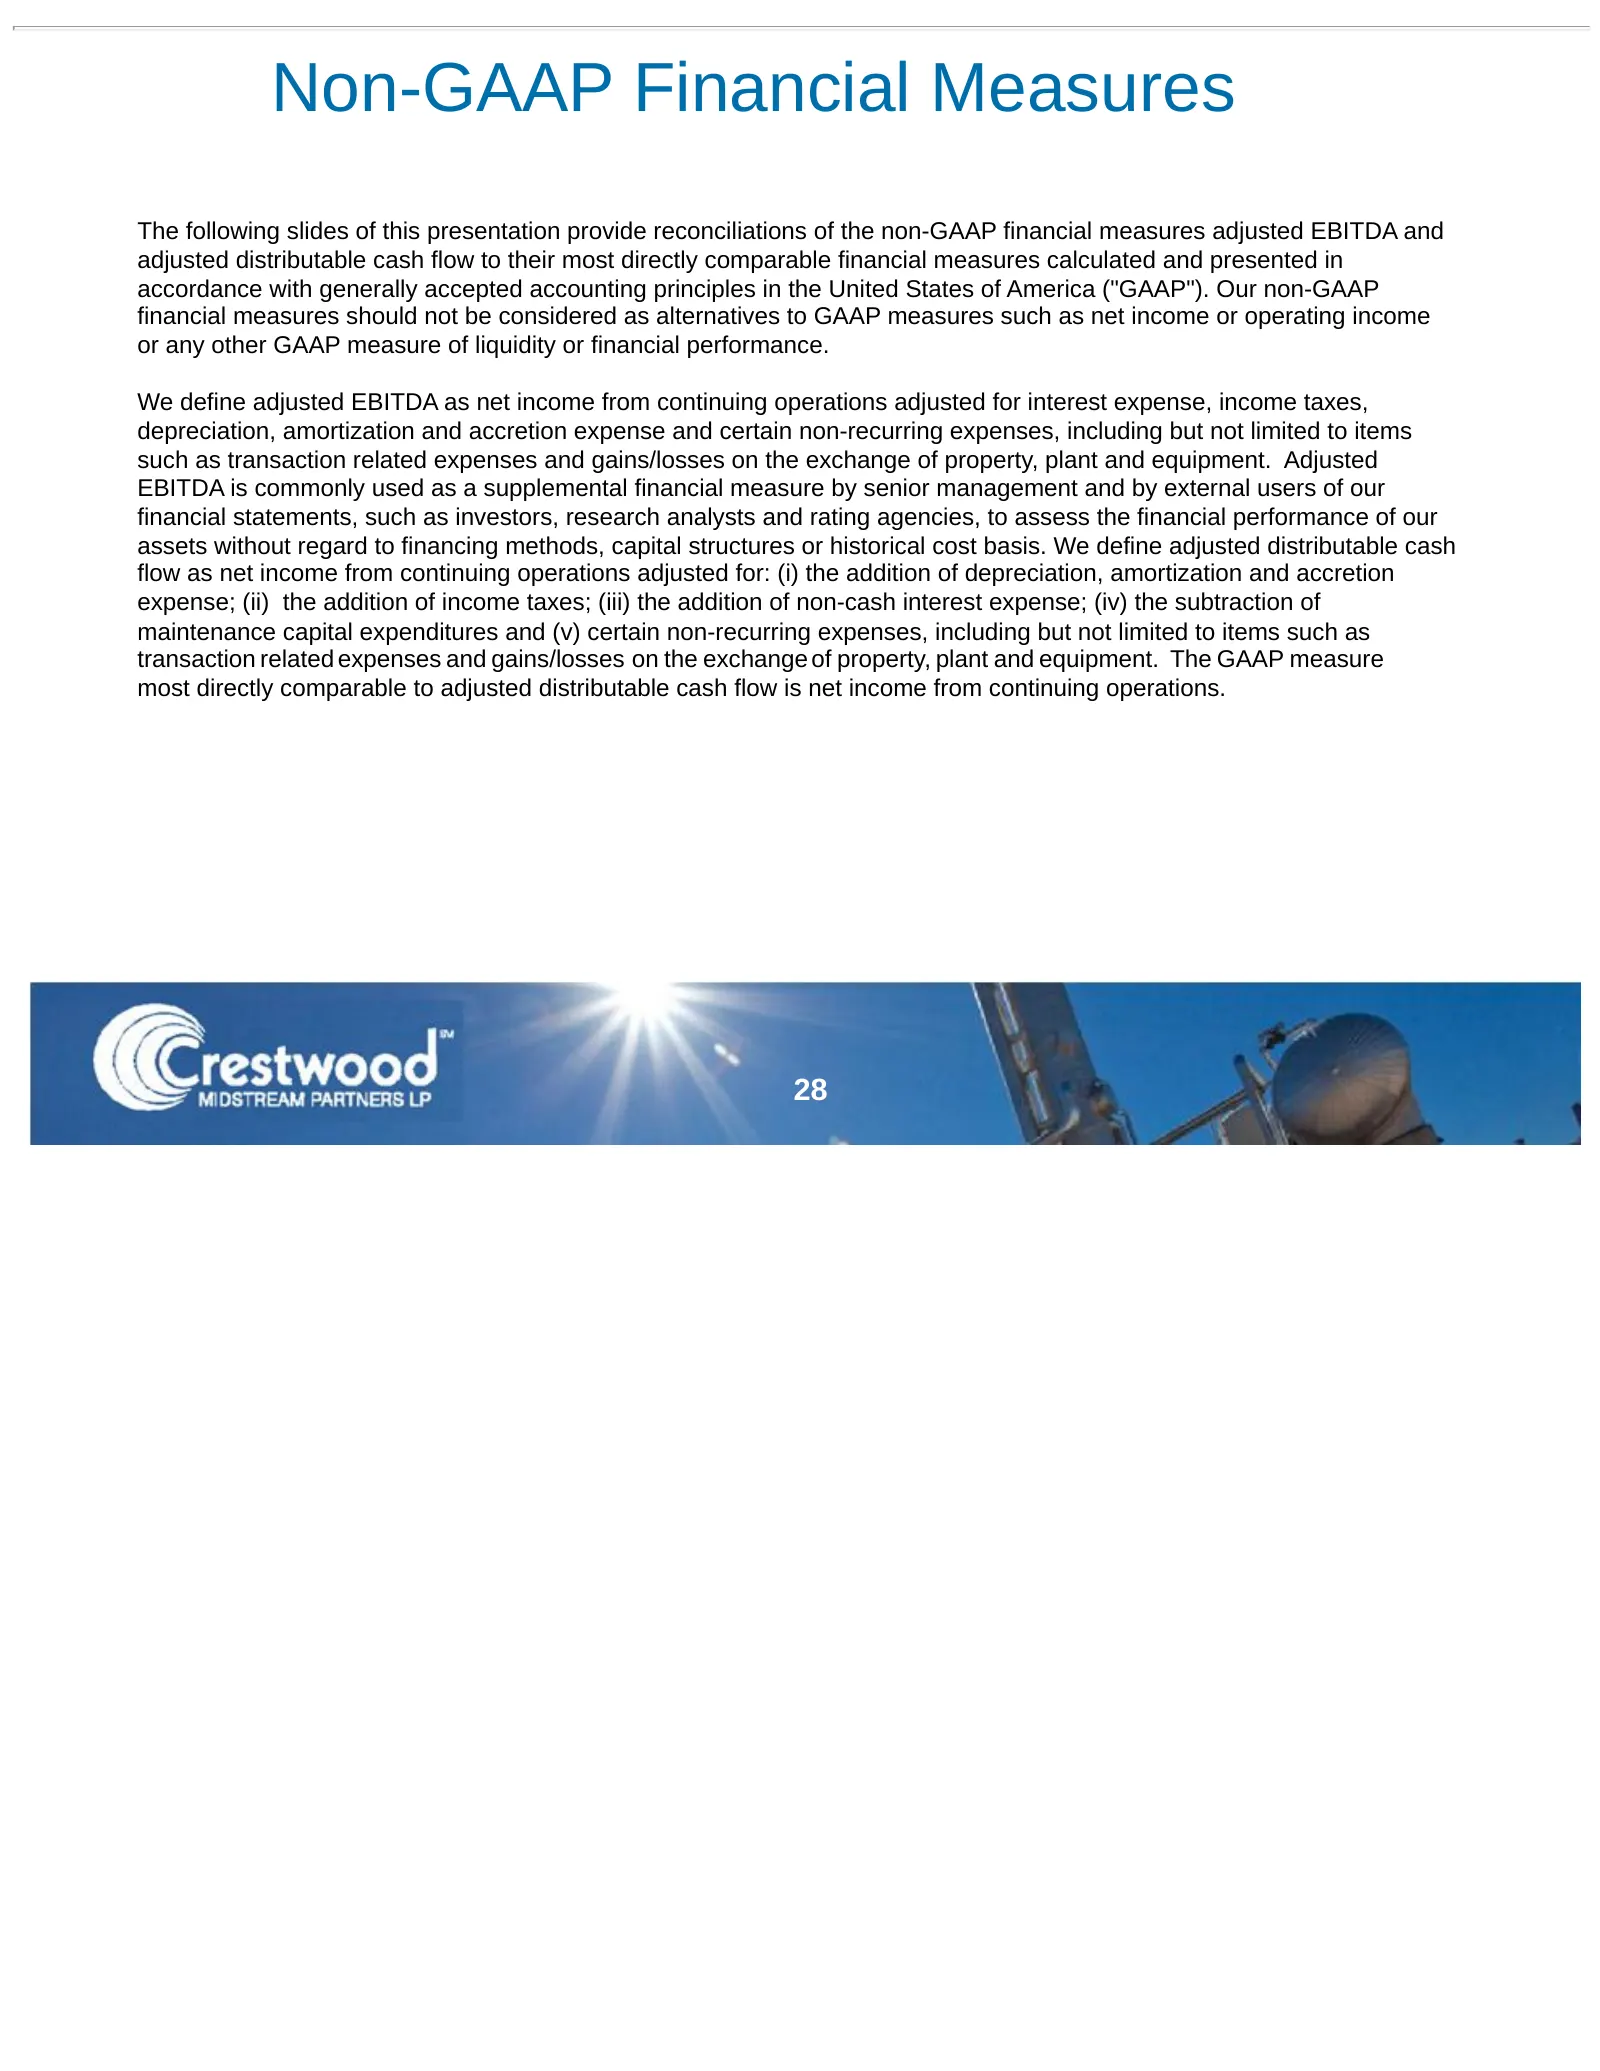
Non-GAAP Financial Measures The following slides of this presentation provide reconciliations of the non-GAAP financial measures adjusted EBITDA and adjusted distributable cash flow to their most directly comparable financial measures calculated and presented in accordance with generally accepted ac
Slide 29: Non-GAAP Reconciliations
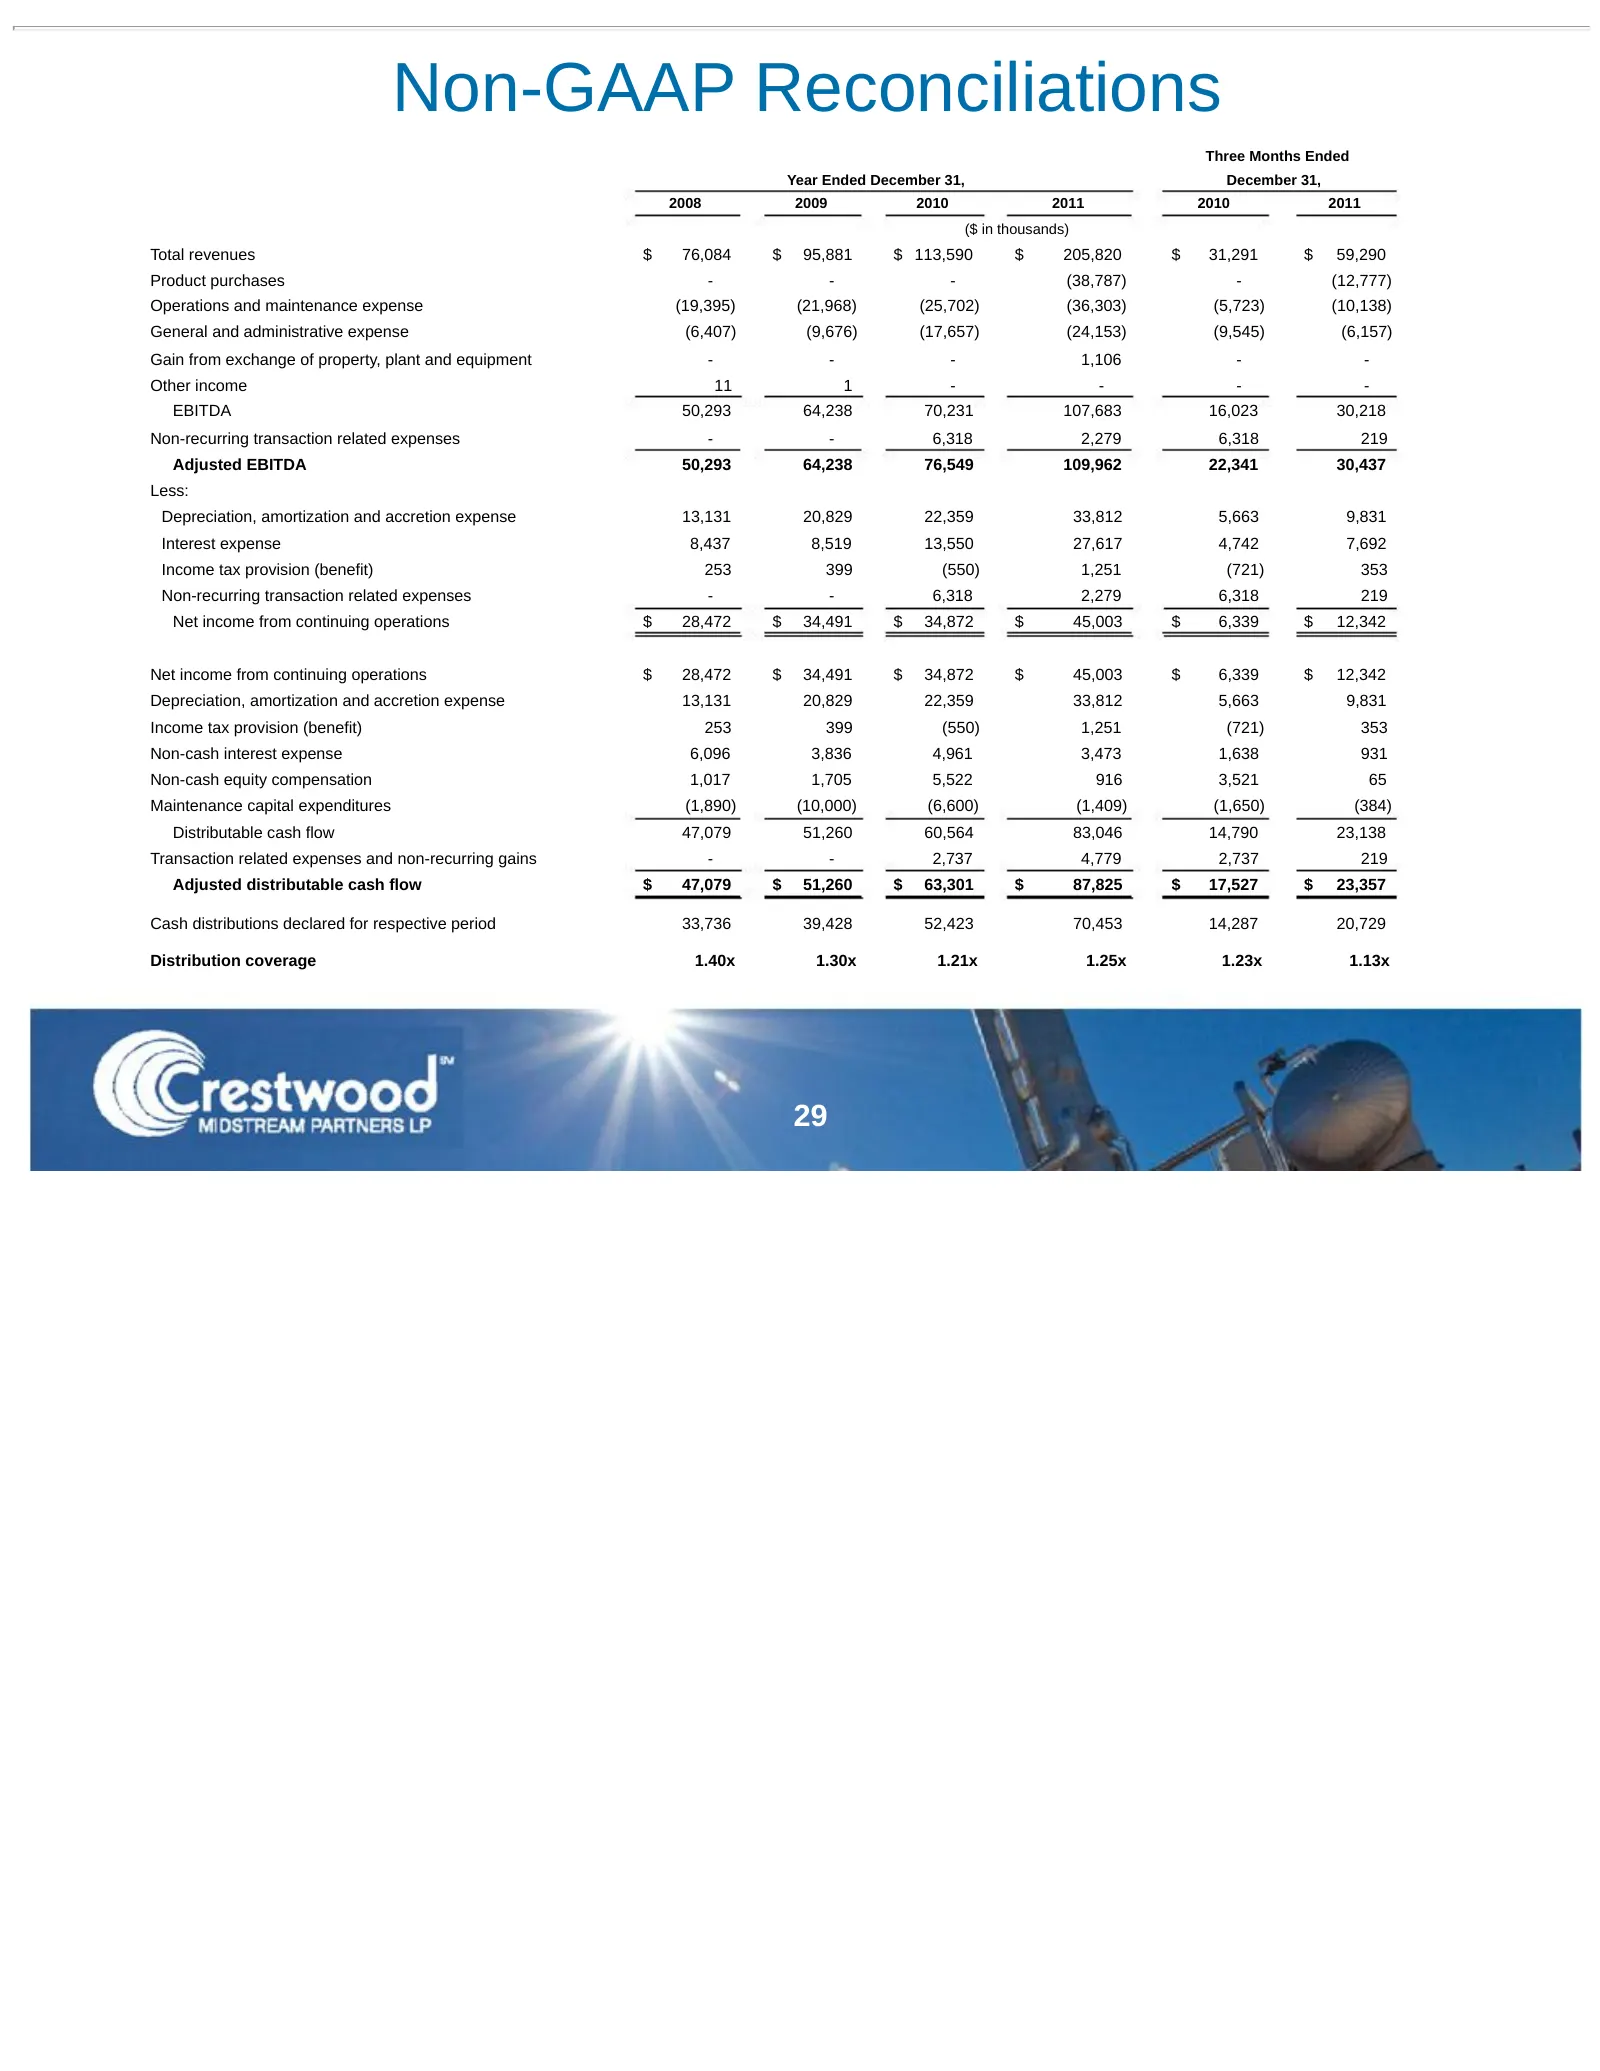
Non-GAAP Reconciliations Three Months Ended Year Ended December 31, December 31, 2008 2009 2010 2011 2010 2011 ($ in thousands) Total revenues $ 76,084 $ 95,881 $ 113,590 $ 205,820 $ 31,291 $ 59,290 Product purchases - - - (38,787) - (12,777) Operations and maintenance expense (19,395) (21,968) (25,
Slide 30: Non-GAAP Reconciliation: 2012 Forecast
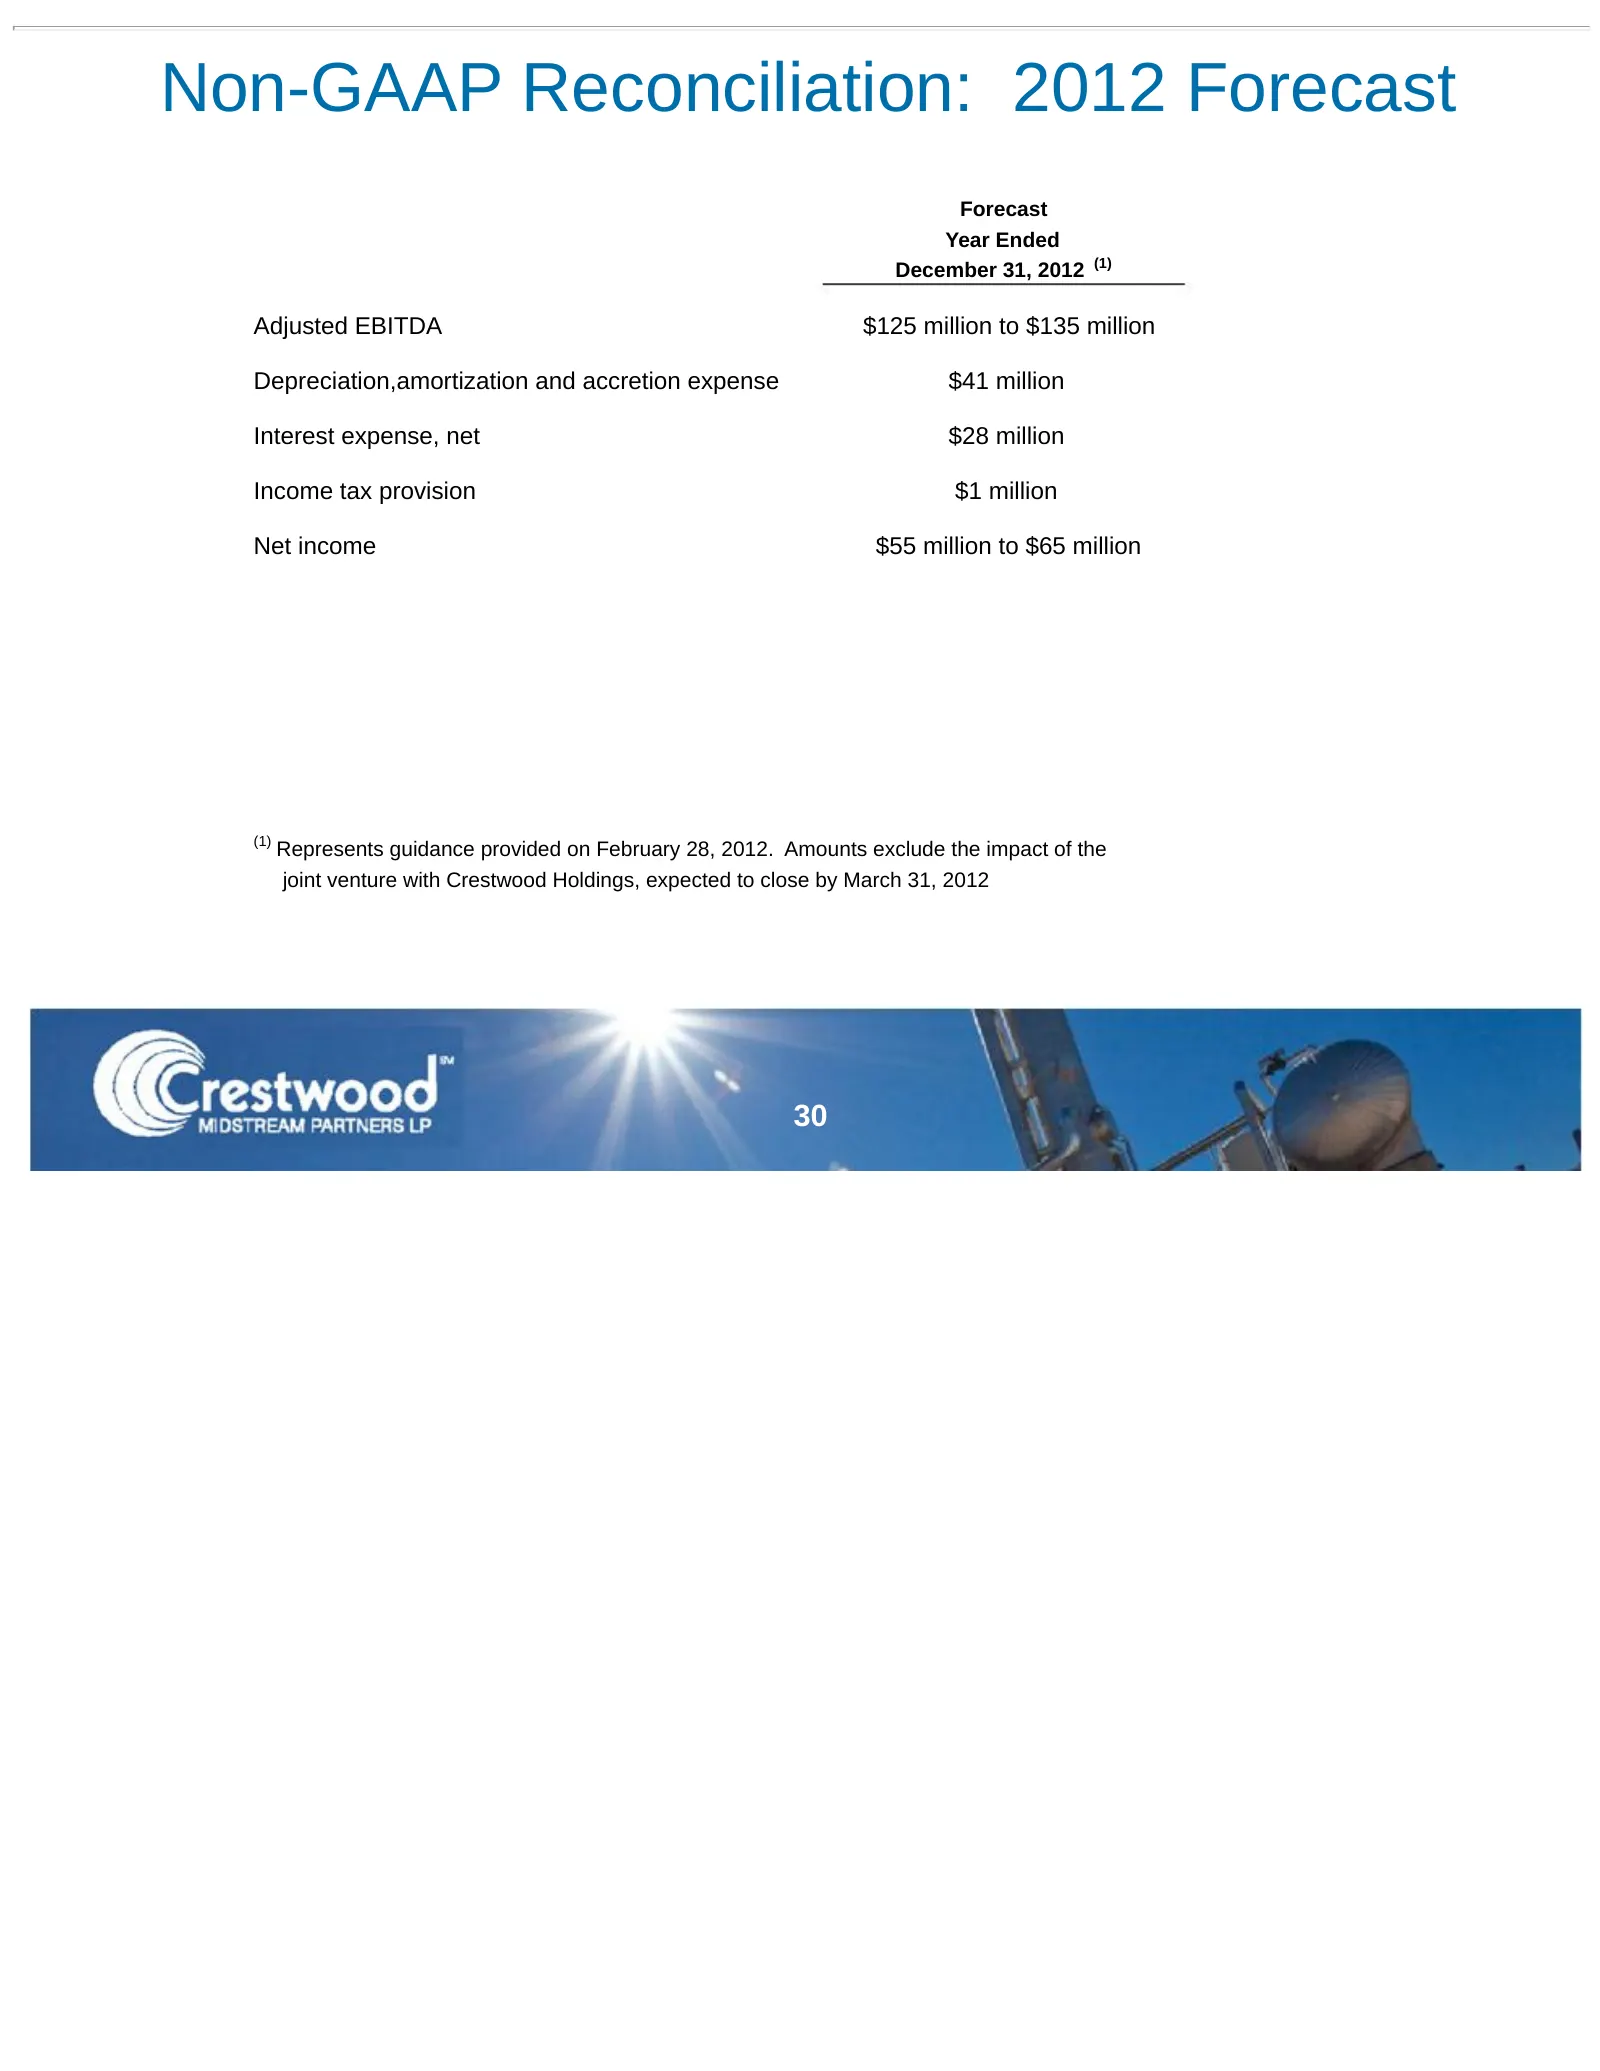
Non-GAAP Reconciliation: 2012 Forecast Forecast Year Ended December 31, 2012 (1) Adjusted EBITDA $125 million to $135 million Depreciation,amortization and accretion expense $41 million Interest expense, net $28 million Income tax provision $1 million Net income $55 million to $65 million (1) Repres
Source: SEC EDGAR · 8-K filed Mar 8, 2012
More decks from Crestwood Midstream Partners LP
 Merger or Acquisition (August 2013)28 slides · Aug 21, 2013
 NAPTP 2013 MLP Investor Conference30 slides · May 22, 2013
 Merger or Acquisition (May 2013)10 slides · May 6, 2013
 Merger or Acquisition (May 2013)21 slides · May 6, 2013
 Merger or Acquisition (November 2011)9 slides · Nov 1, 2011
 BNP Paribas Loan Syndication Annual Investor Conference (May 2011)21 slides · May 13, 2011