Southern States Bancshares Inc
Southern States Bancshares — Q3 2021 Earnings Presentation
13 slides from Southern States Bancshares's earnings presentation, Oct 26, 2021
Slide 1: Q3 2021 Investor Presentation
Q3 2021 Investor Presentation October 26, 2021
Slide 2: Important Notices and Disclaimers
2 Important Notices and Disclaimers Forward-Looking Statements This presentation contains forward-looking statements within the meaning of the federal securities laws, which reflect our current expectations and beliefs with respect to, among other things, future events and our financial performance.
Slide 3: Q3 2021 Results Highlights
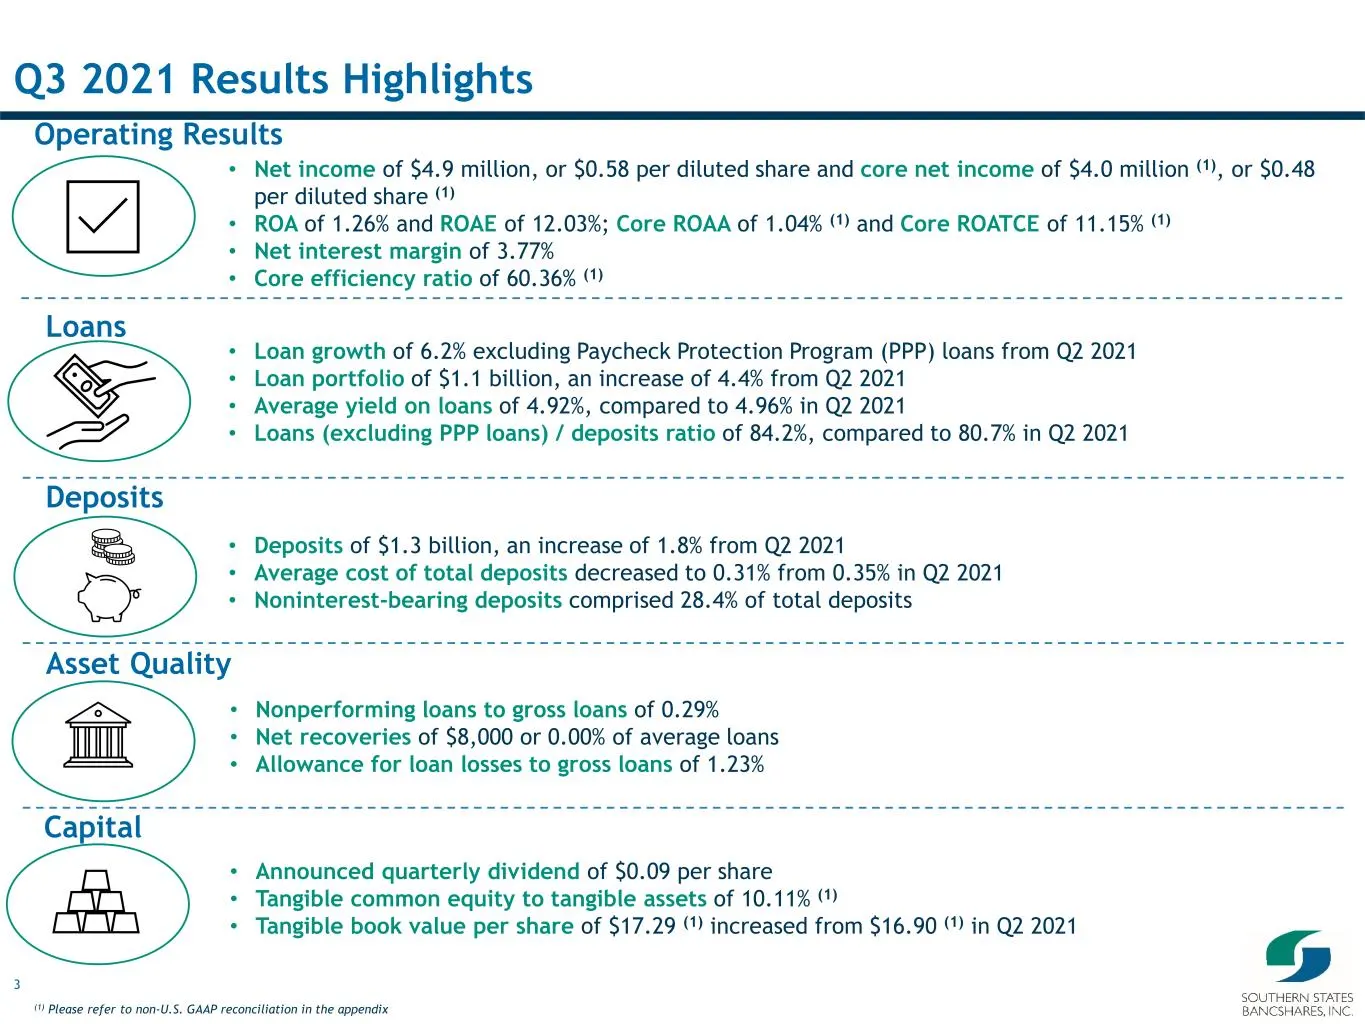
3 Q3 2021 Results Highlights (1) Please refer to non-U.S. GAAP reconciliation in the appendix Operating Results Loans Deposits Capital Asset Quality • Net income of $4.9 million, or $0.58 per diluted share and core net income of $4.0 million (1), or $0.48 per diluted share (1) • ROA of 1.26% and ROA
Slide 4: Overview of Southern States Bancshares, Inc.
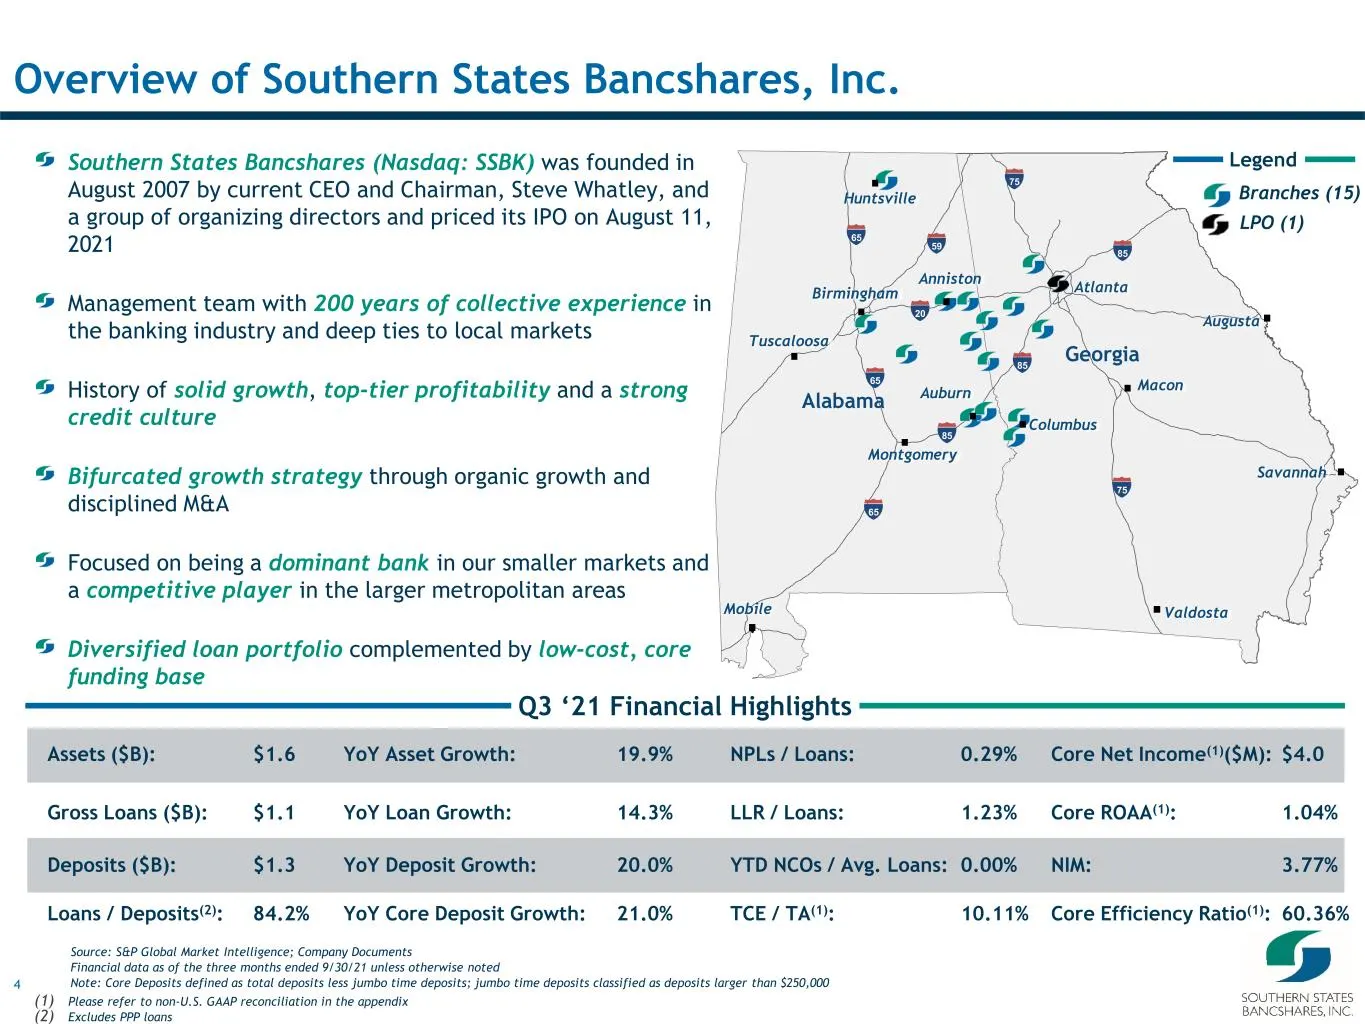
4 Branches (15) Legend Huntsville Birmingham Montgomery Columbus Atlanta Alabama Georgia 65 85 75 Anniston Auburn 20 85 75 85 65 65 59 Tuscaloosa LPO (1) YoY Core Deposit Growth: 21.0%Loans / Deposits(2): 84.2% Overview of Southern States Bancshares, Inc. Q3 ‘21 Financial Highlights YoY Asset Growth
Slide 5: Our History and Growth
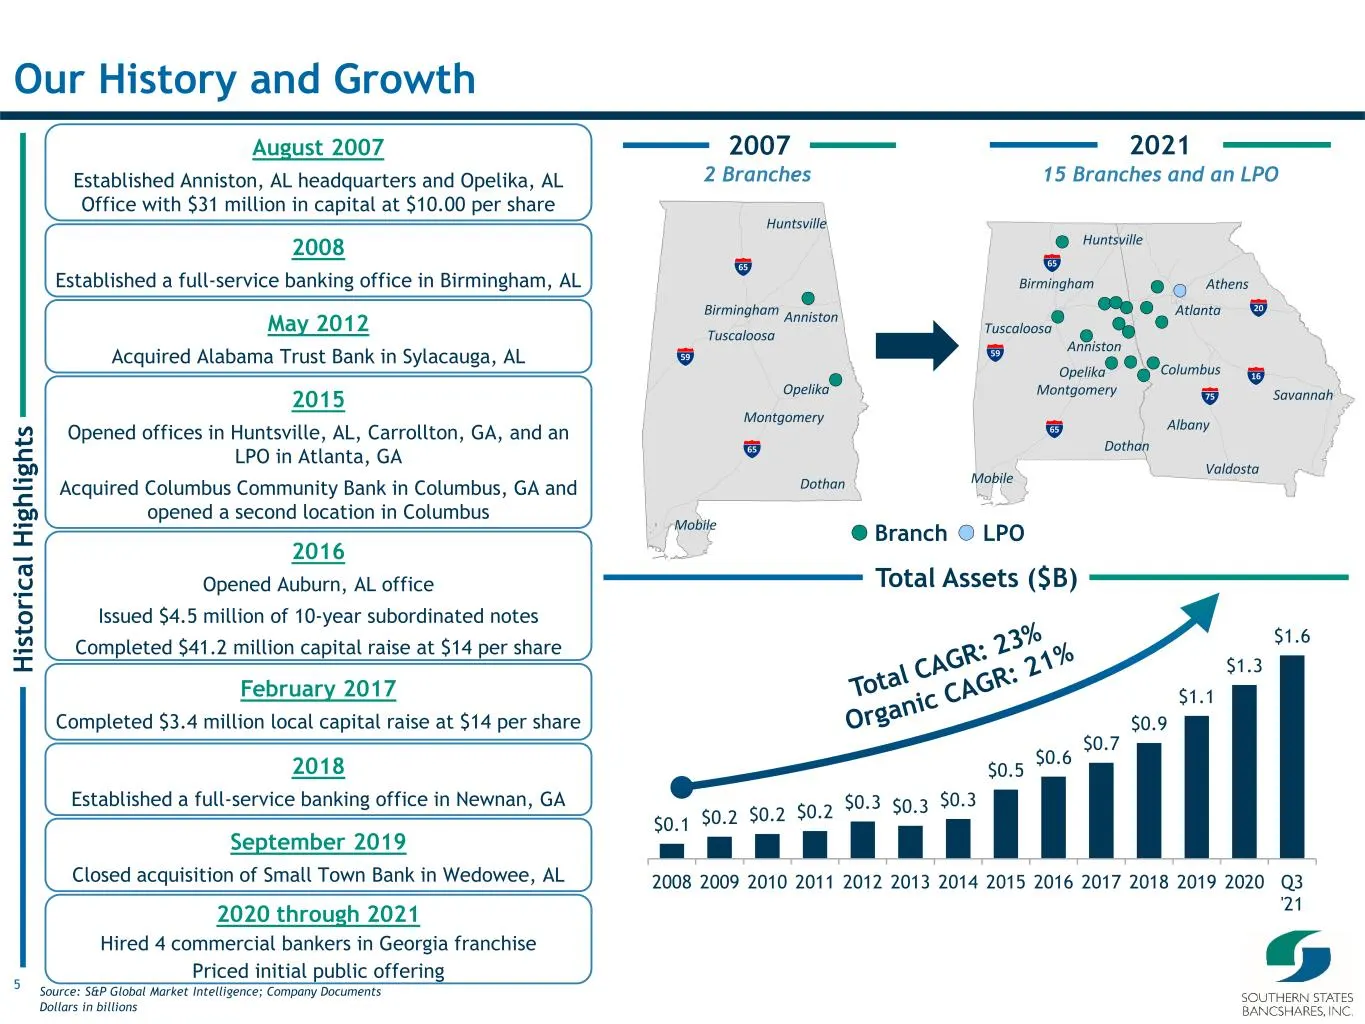
5 2007 Our History and Growth Source: S&P Global Market Intelligence; Company Documents Dollars in billions H is to ri ca l H ig hl ig ht s August 2007 Established Anniston, AL headquarters and Opelika, AL Office with $31 million in capital at $10.00 per share May 2012 Acquired Alabama Trust Bank in
Slide 6: Robust Market Dynamics Creates Growth Opportunities
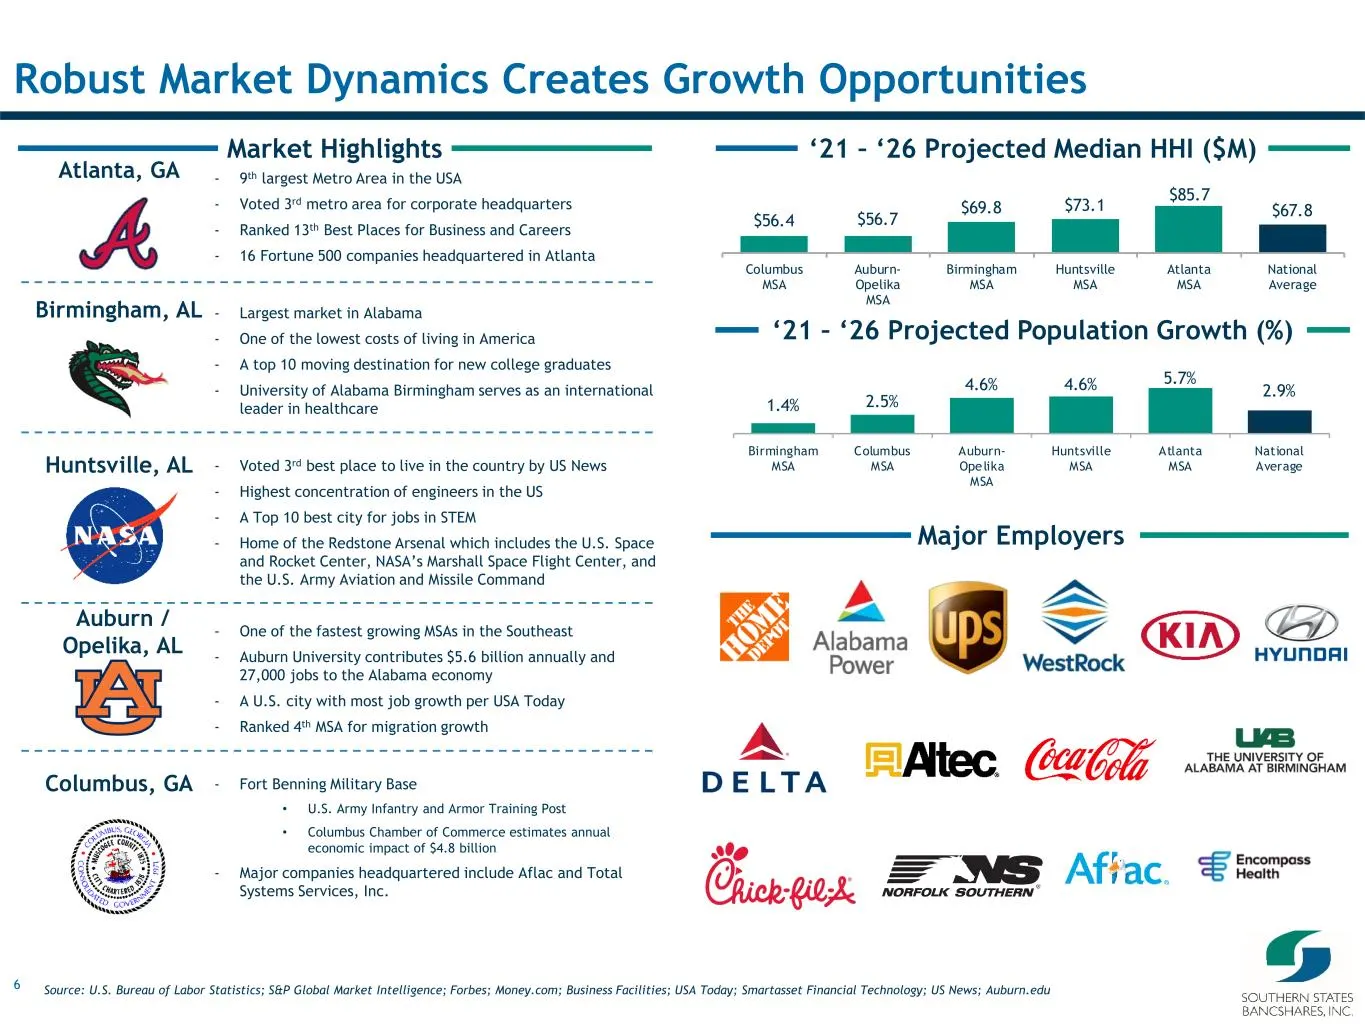
6 Columbus, GA $56.4 $56.7 $69.8 $73.1 $85.7 $67.8 Columbus MSA Auburn- Opelika MSA Birmingham MSA Huntsville MSA Atlanta MSA National Average 1.4% 2.5% 4.6% 4.6% 5.7% 2.9% Birmingham MSA Columbus MSA Auburn- Opelika MSA Huntsville MSA Atlanta MSA National Average Major Employers Market Highlights R
Slide 7: Balance Sheet Growth
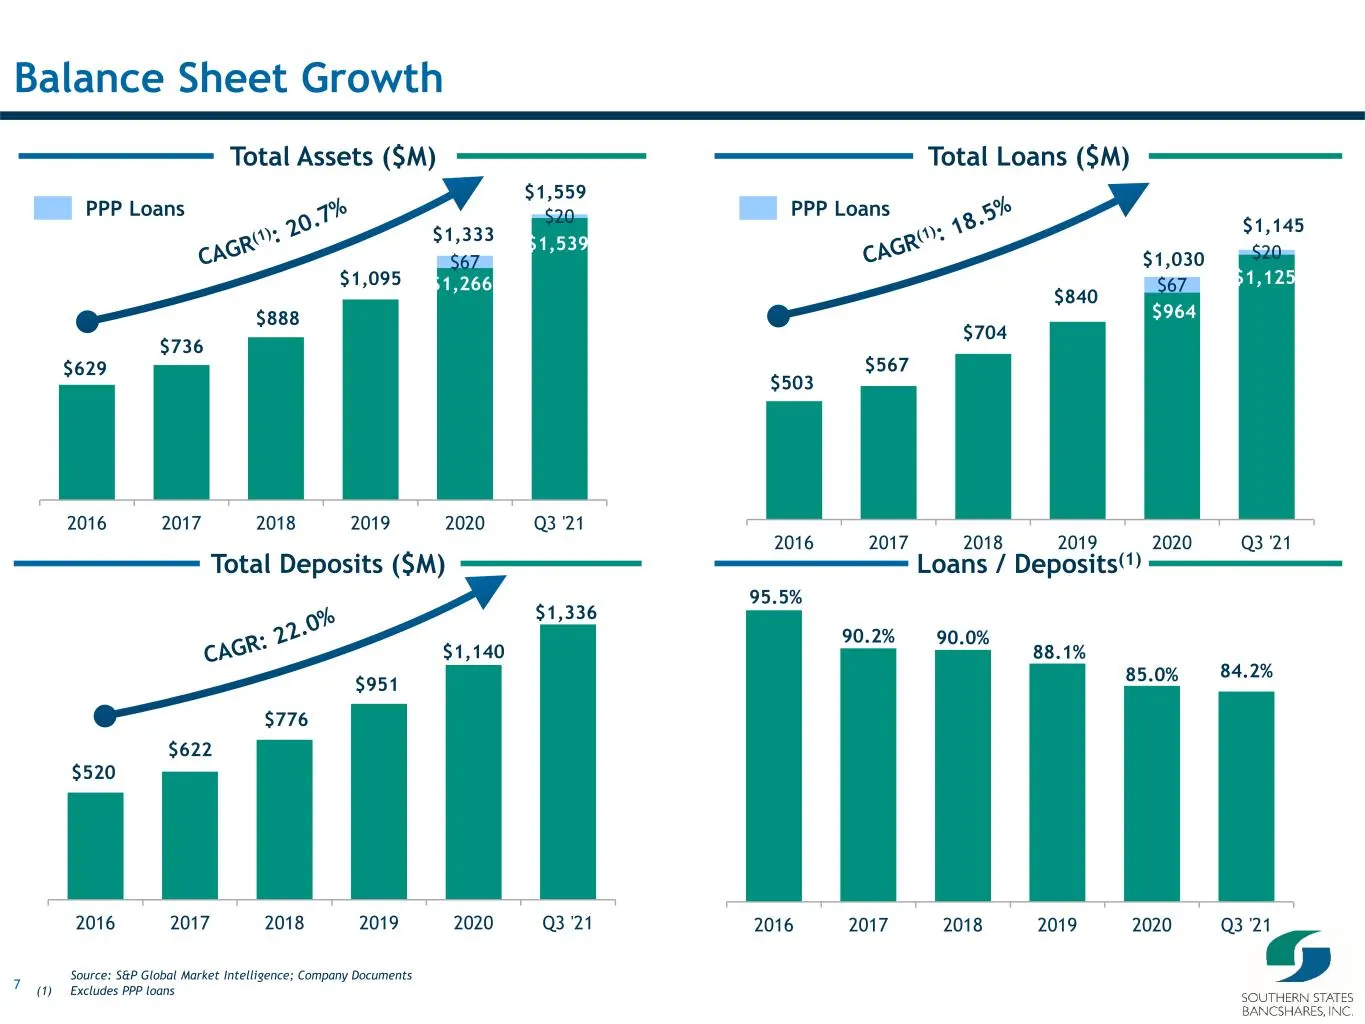
7 Loans / Deposits(1)Total Deposits ($M) Total Loans ($M)Total Assets ($M) Balance Sheet Growth Source: S&P Global Market Intelligence; Company Documents (1) Excludes PPP loans PPP Loans PPP Loans $629 $736 $888 $1,095 $1,266 $1,539 $67 $20 2016 2017 2018 2019 2020 Q3 '21 $1,559 $1,333 $520 $622 $77
Slide 8: Asset Quality
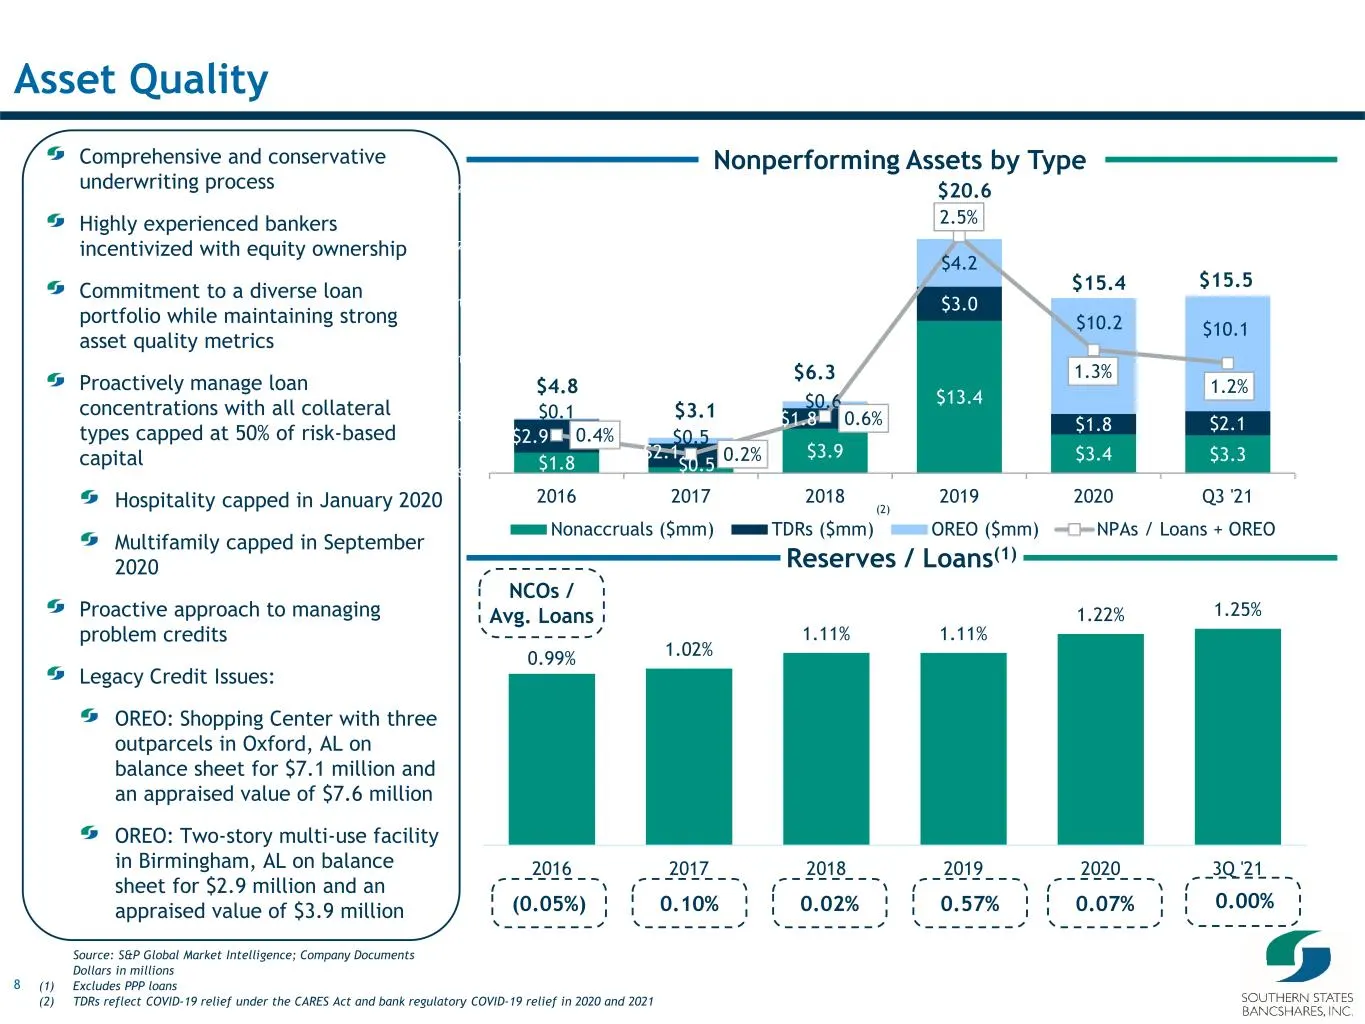
8 Nonperforming Assets by Type Asset Quality Source: S&P Global Market Intelligence; Company Documents Dollars in millions (1) Excludes PPP loans (2) TDRs reflect COVID-19 relief under the CARES Act and bank regulatory COVID-19 relief in 2020 and 2021 Reserves / Loans(1) NCOs / Avg. Loans $4.8 $3.1
Slide 9: Building Shareholder Value: Our Strategic Focus
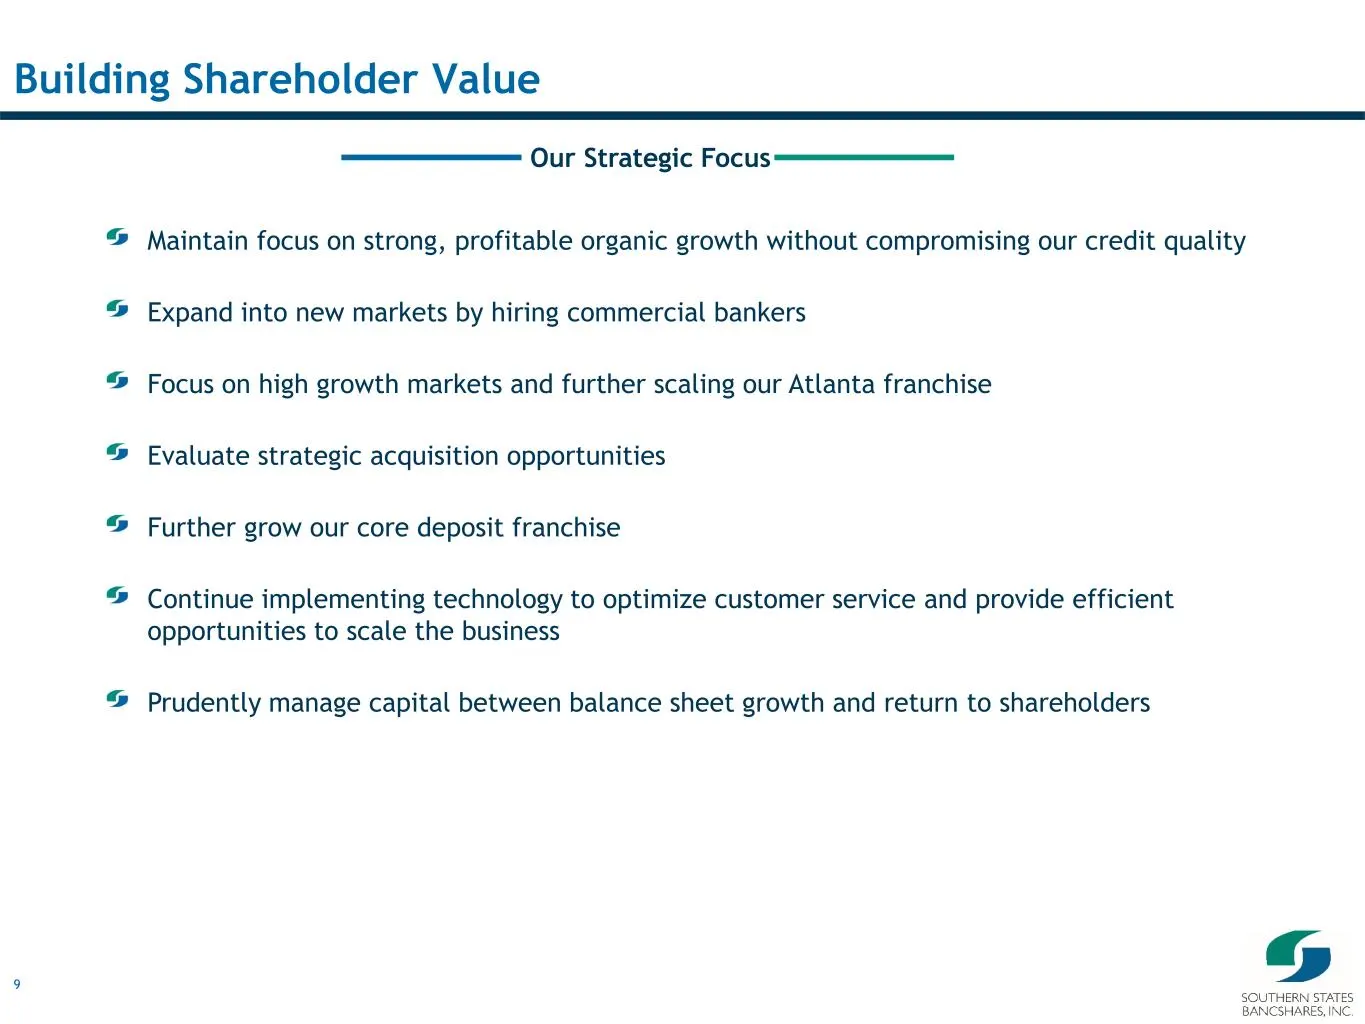
9 Building Shareholder Value Our Strategic Focus Maintain focus on strong, profitable organic growth without compromising our credit quality Expand into new markets by hiring commercial bankers Focus on high growth markets and further scaling our Atlanta franchise Evaluate strategic acquisition oppo
Slide 10: Near-Term Outlook
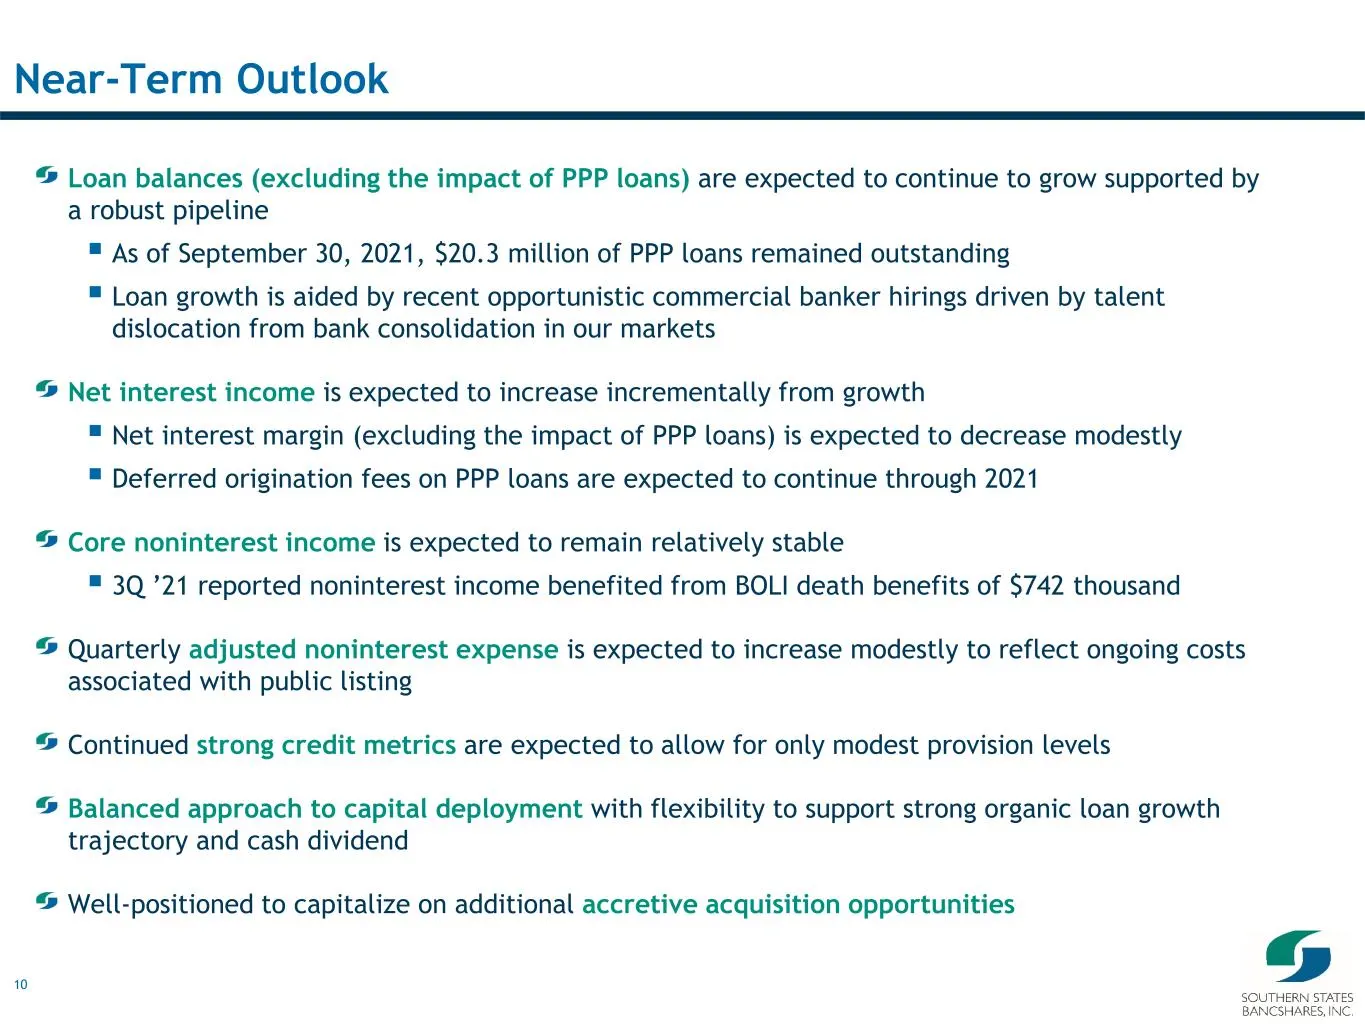
10 Near-Term Outlook Loan balances (excluding the impact of PPP loans) are expected to continue to grow supported by a robust pipeline As of September 30, 2021, $20.3 million of PPP loans remained outstanding Loan growth is aided by recent opportunistic commercial banker hirings driven by talent
Slide 11: Appendix
Appendix ty SOUTHERN STATES BANCSHARES, INC.
Slide 12: Non-GAAP Financial Measures Reconciliations
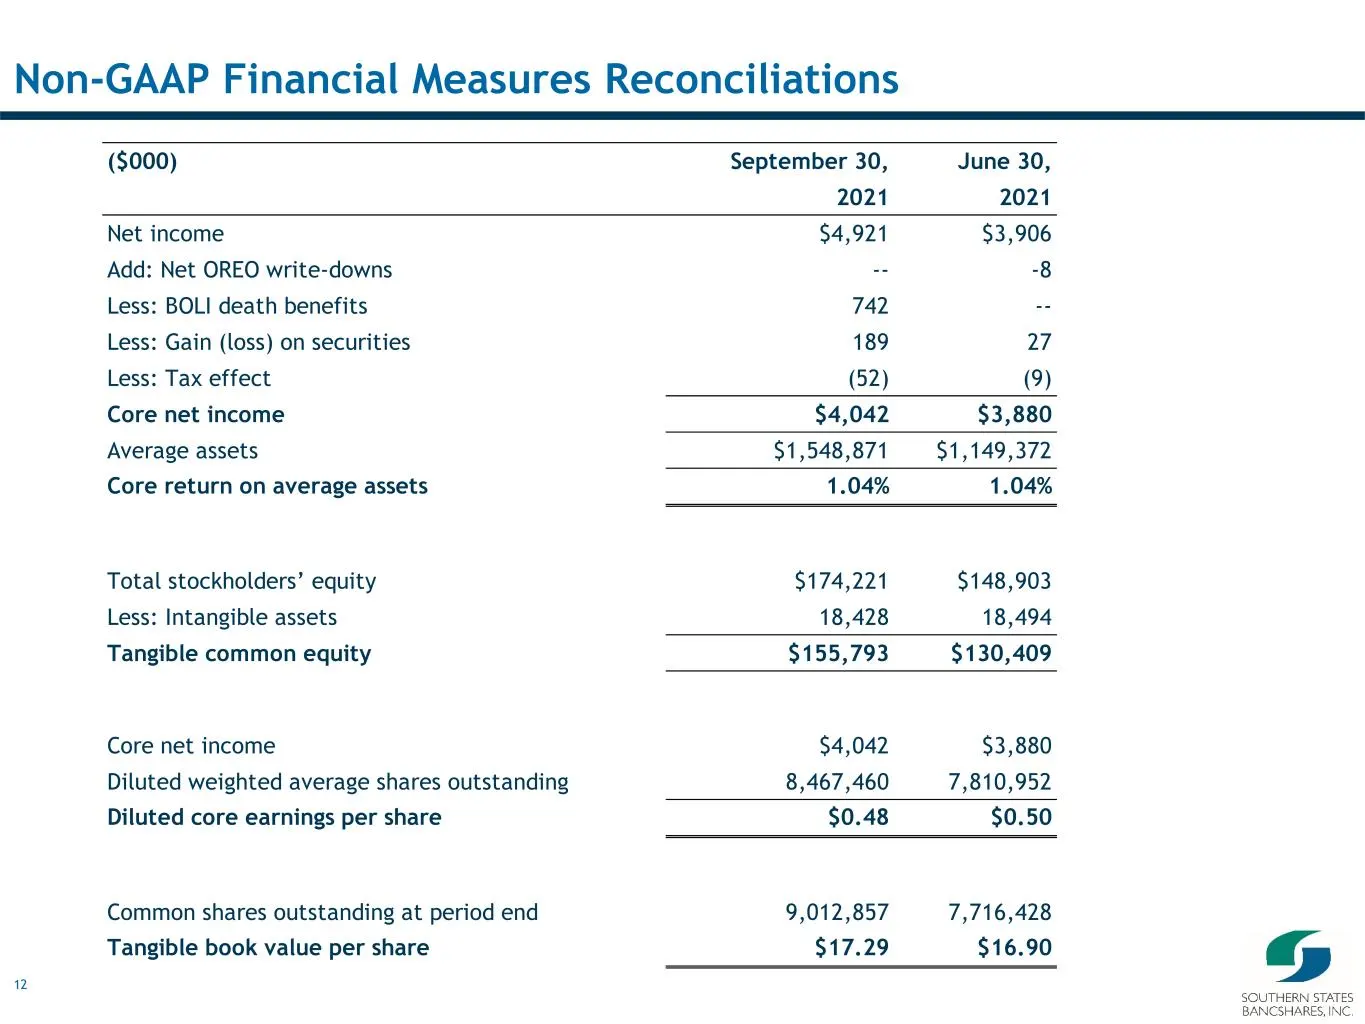
12 Non-GAAP Financial Measures Reconciliations ($000) September 30, June 30, 2021 2021 Net income $4,921 $3,906 Add: Net OREO write-downs -- -8 Less: BOLI death benefits 742 -- Less: Gain (loss) on securities 189 27 Less: Tax effect (52) (9) Core net income $4,042 $3,880 Average assets $1,548,871 $1
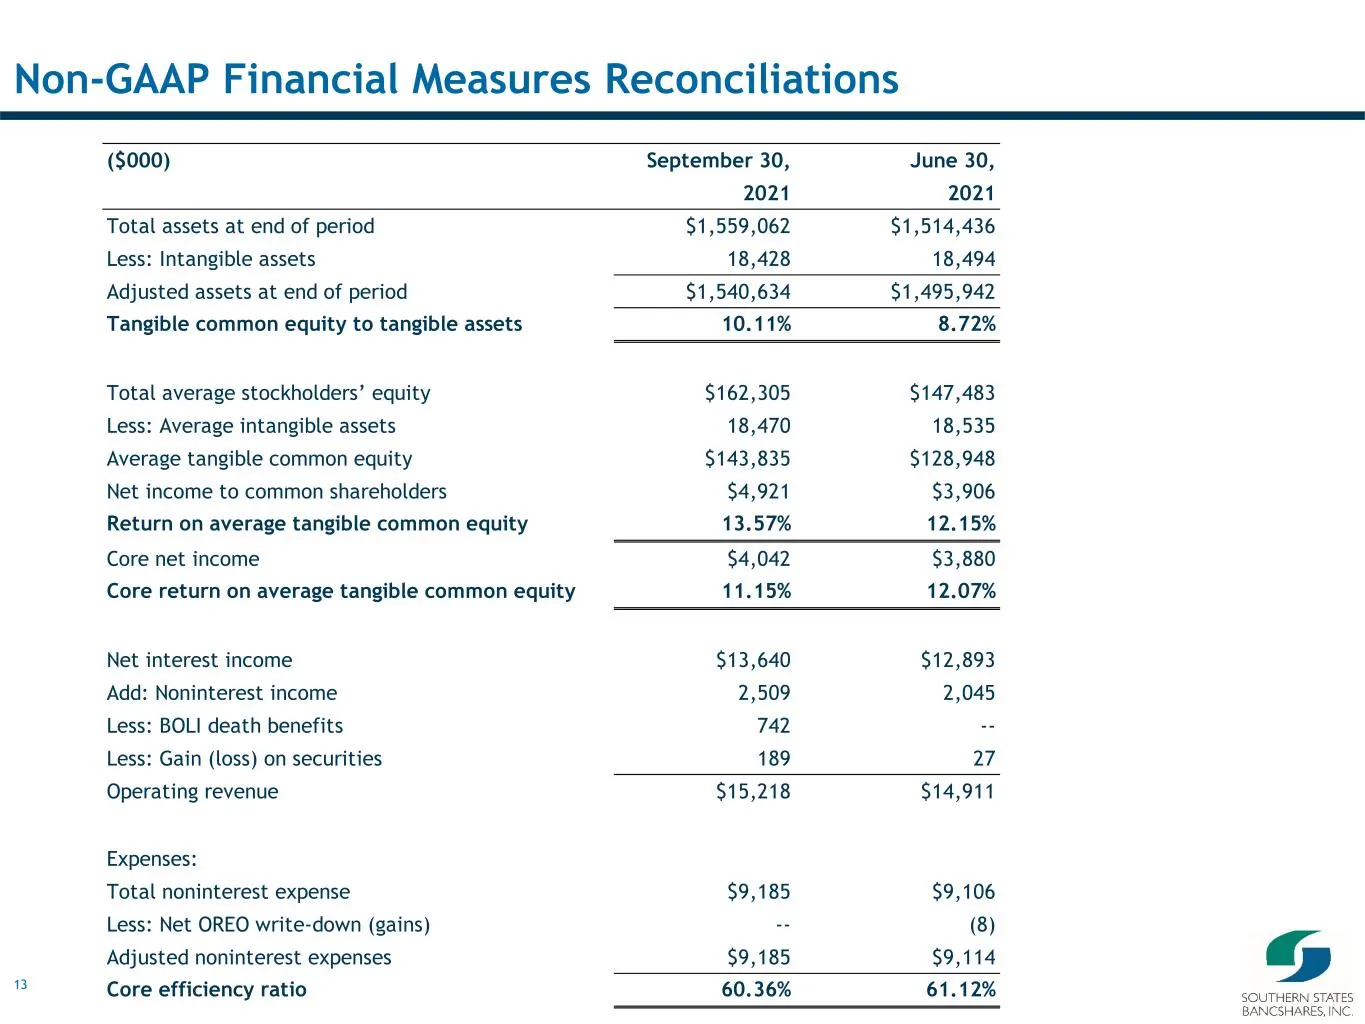
Slide 13: Non-GAAP Financial Measures Reconciliations
13 Non-GAAP Financial Measures Reconciliations ($000) September 30, June 30, 2021 2021 Total assets at end of period $1,559,062 $1,514,436 Less: Intangible assets 18,428 18,494 Adjusted assets at end of period $1,540,634 $1,495,942 Tangible common equity to tangible assets 10.11% 8.72% Total average
Source: SEC EDGAR · 8-K filed Oct 26, 2021
More decks from Southern States Bancshares Inc
 Stephens Investor Conference 202537 slides · Jun 3, 2025
 Q1 2025 Earnings Presentation22 slides · Apr 22, 2025
 Merger or Acquisition (March 2025)20 slides · Mar 31, 2025
 Q4 2024 Earnings Presentation22 slides · Jan 22, 2025
 Q3 2024 Earnings Presentation19 slides · Oct 22, 2024
 Q2 2024 Earnings Presentation17 slides · Jul 23, 2024