Plains Exploration & Production Company
Plains Exploration & Production — Raymond James 26th Annual Institutional Investors Conference (March 2005)
30 slides from Plains Exploration & Production's conference presentation, Mar 7, 2005
Slide 1: PXP – Raymond James 26th Annual Institutional Investors Conference
PXP Raymond James 26th Annual Institutional Investors Conference March 7, 2005 N Y S E : P X P w w w . p l a i n s x p . c o m
Slide 2: Forward Looking Statements
Forward Looking Statements Except for the historical information contained herein, the matters discussed in this presentation are forward-looking statements that involve certain assumptions and known and unknown risks, uncertainties and other factors that could cause our actual results to differ mat
Slide 3: Company History
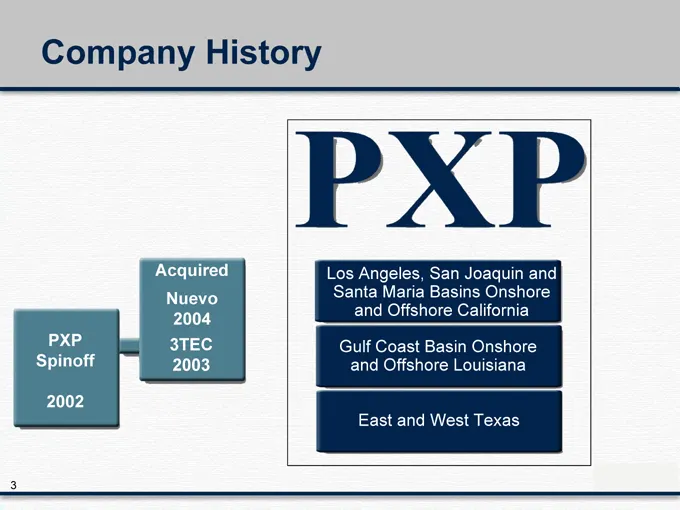
Company History PXP Spinoff Acquired Nuevo 2004 3TEC Los Angeles, San Joaquin and Santa Maria Basins Onshore and Offshore California Gulf Coast Basin Onshore and Offshore Louisiana East and West Texas PXP
Slide 4: 2004 Reserves and Production
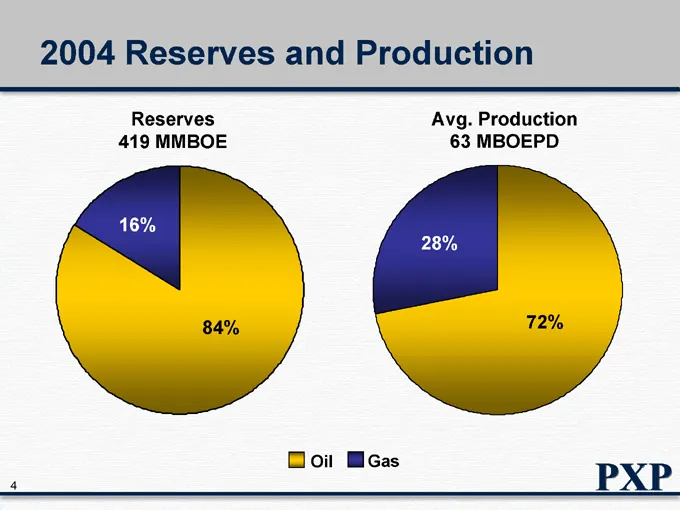
2004 Reserves and Production Reserves 419 MMBOE Avg. Production 63 MBOEPD 16% 84% 28% 72% Oil Gas
Slide 5: PXP: Uniquely Positioned to Create Value
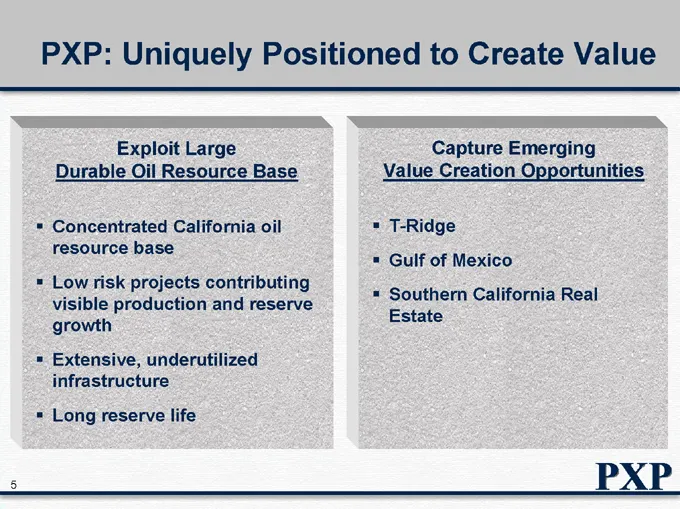
PXP: Uniquely Positioned to Create Value Exploit Large Durable Oil Resource Base Concentrated California oil resource base Low risk projects contributing visible production and reserve growth Extensive, underutilized infrastructure Long reserve life Capture Emerging Value Creation Opportunities T-Ri
Slide 6: Large Durable Oil Resource Base
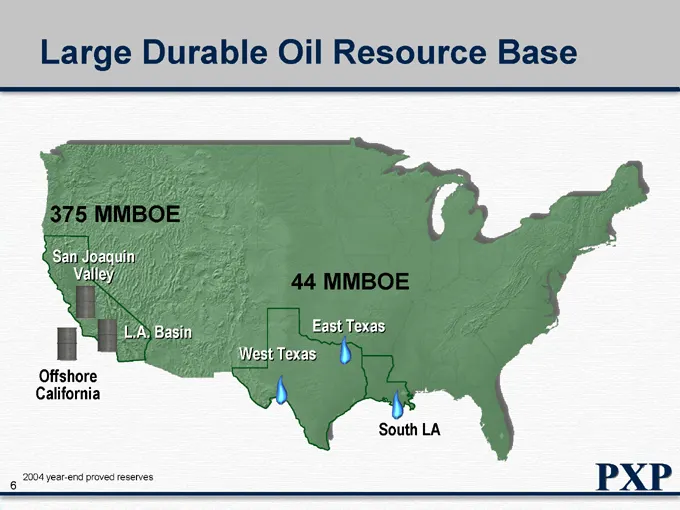
Large Durable Oil Resource Base 375 MMBOE San Joaquin Valley L.A. Basin Offshore California 44 MMBOE West Texas East Texas South LA 2004 year-end proved reserves
Slide 7: California's Historical Oil Production
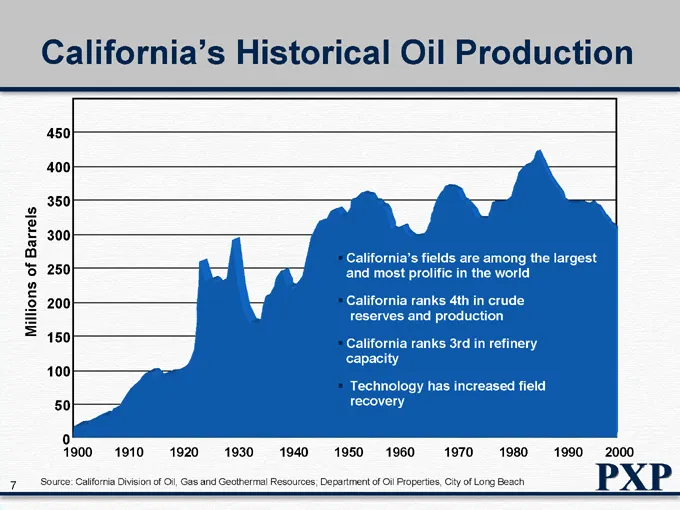
California’s Historical Oil Production Millions of Barrels 450 400 350 300 250 200 150 100 50 0 1900 1910 1920 1930 1940 1950 1960 1970 1980 1990 2000 California’s fields are among the largest and most prolific in the world California ranks 4th in crude reserves and production California ranks 3rd i
Slide 8: PXP—Western Development Unit
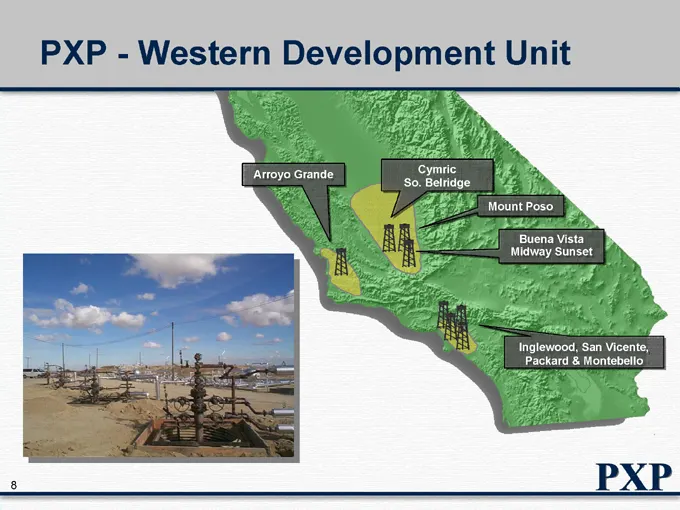
PXP—Western Development Unit Arroyo Grande Cymric So. Belridge Mount Poso Buena Vista Midway Sunset Inglewood, San Vicente, Packard & Montebello
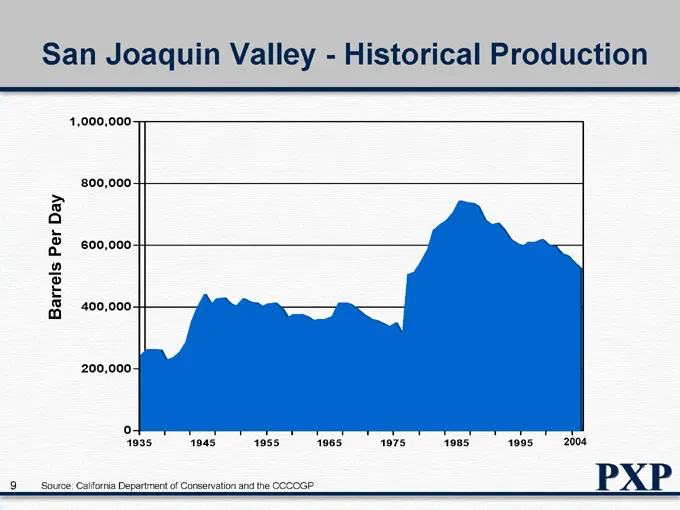
Slide 9: San Joaquin Valley—Historical Production
San Joaquin Valley—Historical Production Barrels Per Day 1,000,000 800,000 600,000 400,000 200,000 1935 1945 1955 1965 1975 1985 1995 2004 Source: California Department of Conservation and the CCCOGP
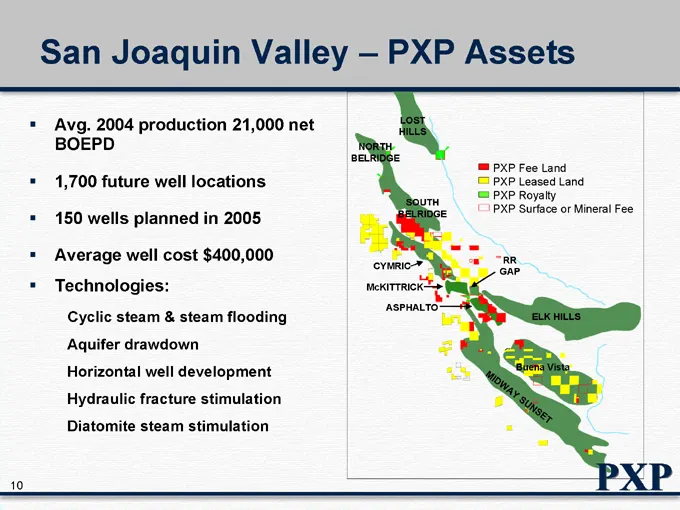
Slide 10: San Joaquin Valley – PXP Assets
San Joaquin Valley – PXP Assets Avg. 2004 production 21,000 net BOEPD 1,700 future well locations 150 wells planned in 2005 Average well cost $400,000 Technologies: Cyclic steam & steam flooding Aquifer drawdown Horizontal well development Hydraulic fracture stimulation Diatomite steam stimulation N
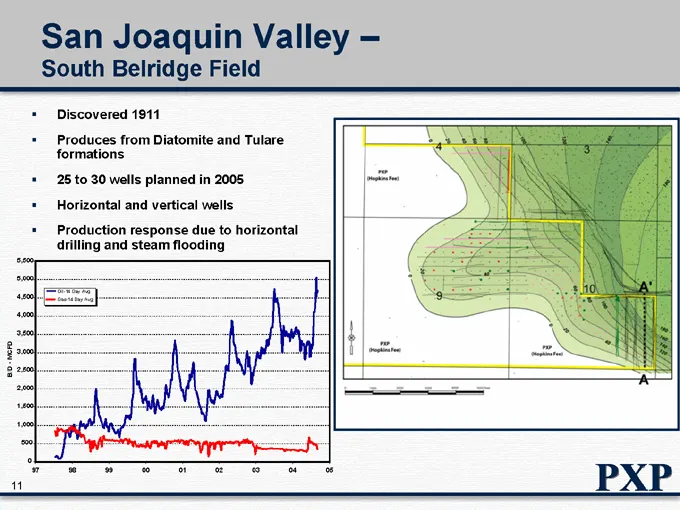
Slide 11: San Joaquin Valley – South Belridge Field
San Joaquin Valley – South Belridge Field Discovered 1911 Produces from Diatomite and Tulare formations 25 to 30 wells planned in 2005 Horizontal and vertical wells Production response due to horizontal drilling and steam flooding B/D—MCFD 5,500 5,000 4,500 4,000 3,500 3,000 2,500 2,000 1,500 1,000
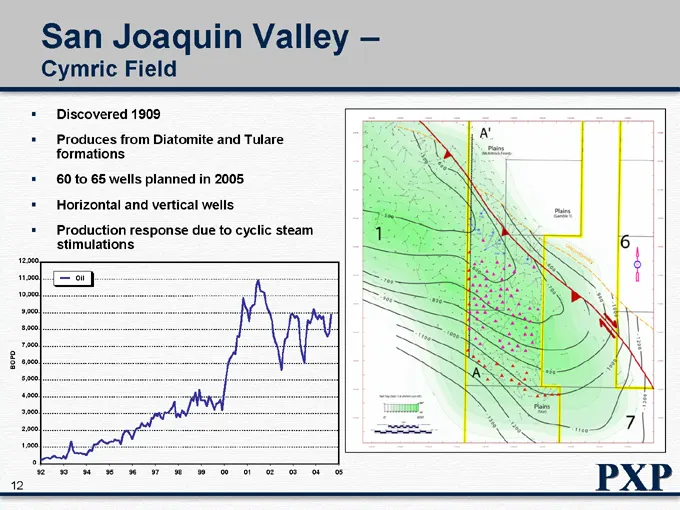
Slide 12: San Joaquin Valley – Cymric Field
San Joaquin Valley – Cymric Field Discovered 1909 Produces from Diatomite and Tulare formations 60 to 65 wells planned in 2005 Horizontal and vertical wells Production response due to cyclic steam stimulations BOPD 12,000 11,000 10,000 9,000 8,000 7,000 6,000 5,000 4,000 3,000 2,000 1,000 0 93 94 95
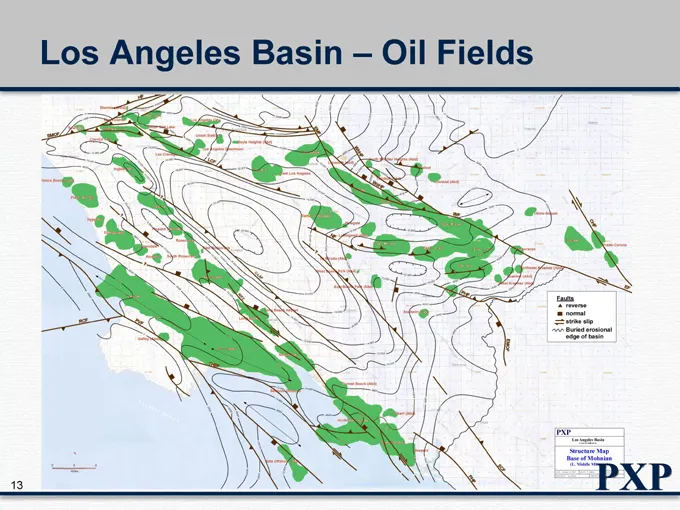
Slide 13: Los Angeles Basin – Oil Fields
Los Angeles Basin – Oil Fields Faults reverse normal strike slip Buried erosional edge of basin PXP Los Angeles Basin CALIFORNIA Structure Map Base of Mohnian L. Middle
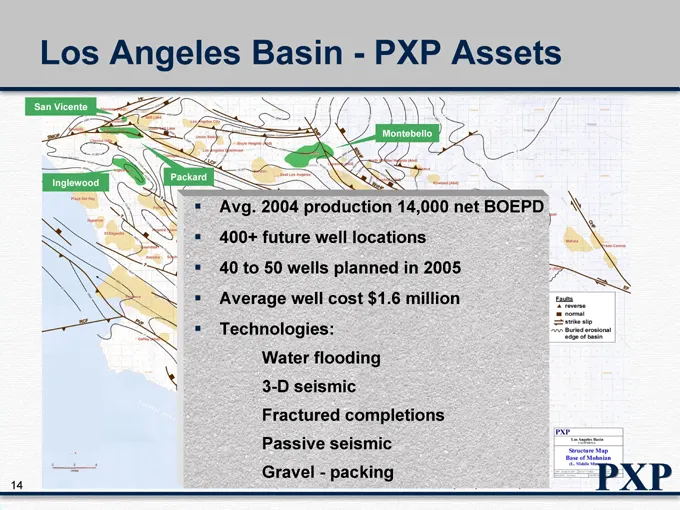
Slide 14: Los Angeles Basin—PXP Assets
Los Angeles Basin—PXP Assets San Vicente Inglewood Packard Montebello Avg. 2004 production 14,000 net BOEPD 400+ future well locations 40 to 50 wells planned in 2005 Average well cost $1.6 million Technologies: Water flooding 3-D seismic Fractured completions Passive seismic Gravel—packing Faults re
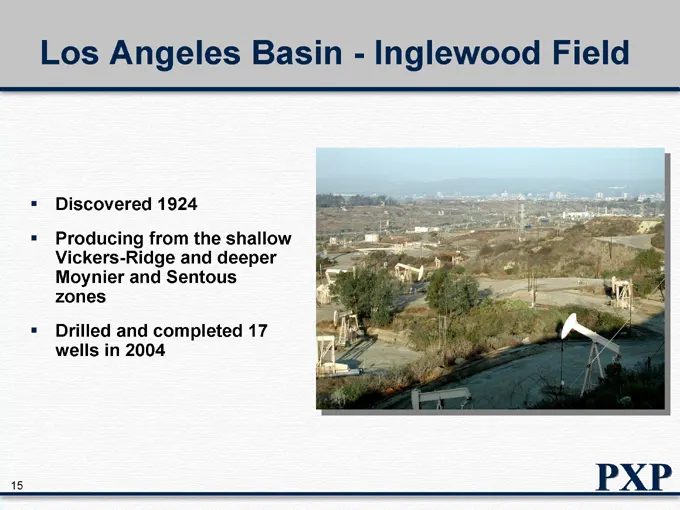
Slide 15: Los Angeles Basin—Inglewood Field
Los Angeles Basin—Inglewood Field Discovered 1924 Producing from the shallow Vickers-Ridge and deeper Moynier and Sentous zones Drilled and completed 17 wells in 2004
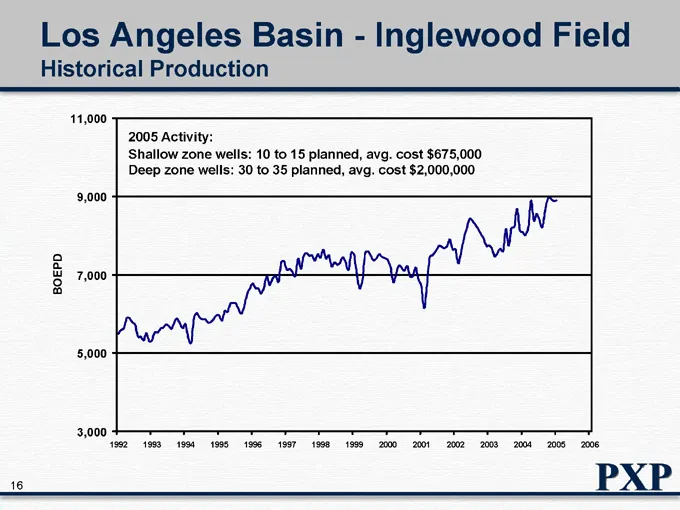
Slide 16: Los Angeles Basin—Inglewood Field Historical Production
Los Angeles Basin—Inglewood Field Historical Production BOEPD 11,000 9,000 7,000 5,000 3,000 1993 1994 1995 1996 1997 1998 1999 2000 2001 2002 2003 2004 2005 2006 Activity: Shallow zone wells: 10 to 15 planned, avg. cost $675,000 Deep zone wells: 30 to 35 planned, avg. cost $2,000,000
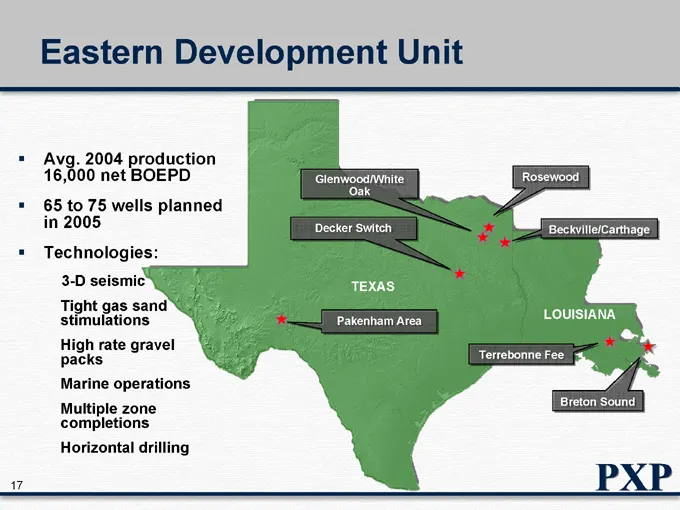
Slide 17: Eastern Development Unit
Eastern Development Unit Avg. 2004 production 16,000 net BOEPD 65 to 75 wells planned in 2005 Technologies: 3-D seismic Tight gas sand stimulations High rate gravel packs Marine operations Multiple zone completions Horizontal drilling Glenwood/White Oak Decker Switch TEXAS Pakenham Area Rosewood Bec
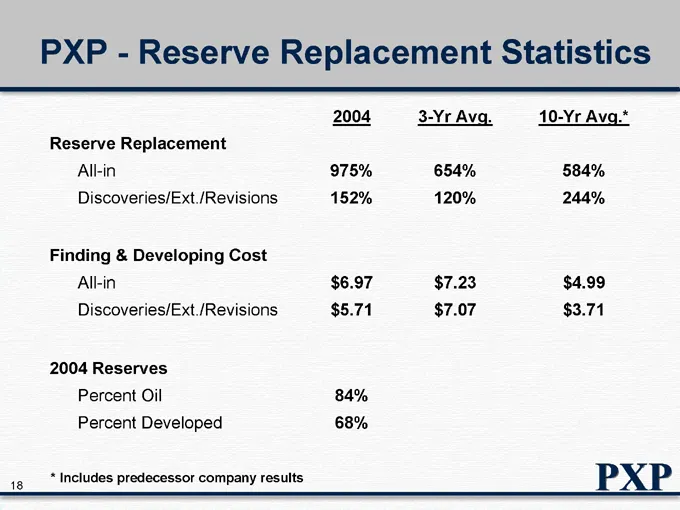
Slide 18: PXP—Reserve Replacement Statistics
PXP—Reserve Replacement Statistics 2004 3-Yr Avg. 10-Yr Avg.* Reserve Replacement All-in 975% 654% 584% Discoveries/Ext./Revisions 152% 120% 244% Finding & Developing Cost All-in $6.97 $7.23 $4.99 Discoveries/Ext./Revisions $5.71 $7.07 $3.71 2004 Reserves Percent Oil 84% Percent Developed 68% * Incl
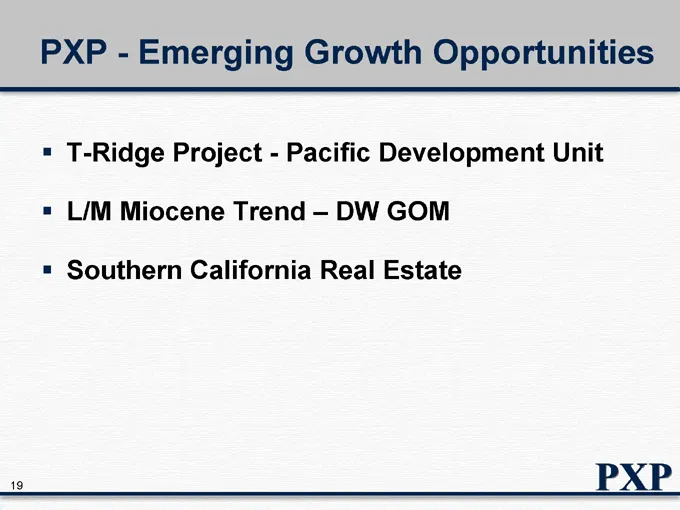
Slide 19: PXP—Emerging Growth Opportunities
PXP—Emerging Growth Opportunities T-Ridge Project—Pacific Development Unit L/M Miocene Trend – DW GOM Southern California Real Estate
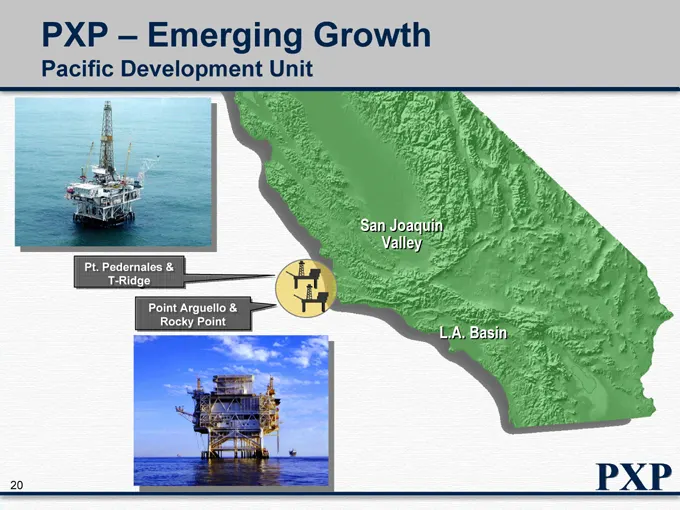
Slide 20: PXP – Emerging Growth: Pacific Development Unit
PXP – Emerging Growth Pacific Development Unit Pt. Pedernales & T-Ridge Point Arguello & Rocky Point San Joaquin Valley L.A. Basin
Slide 21: Emerging Growth: Pacific Development Unit
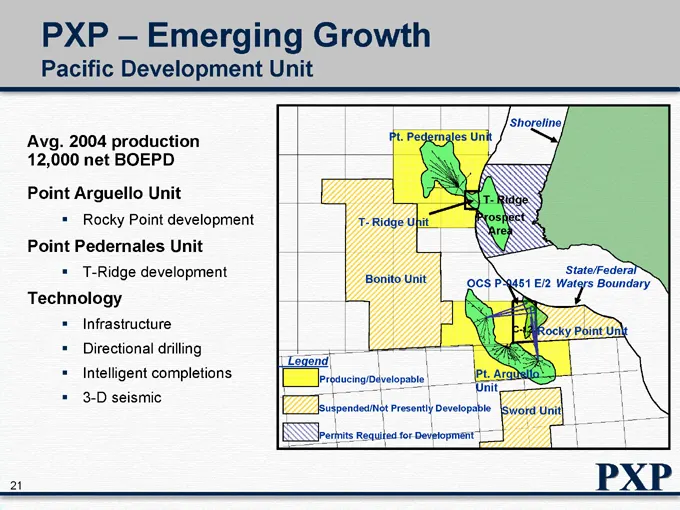
PXP – Emerging Growth Pacific Development Unit Avg. 2004 production 12,000 net BOEPD Point Arguello Unit Rocky Point development Point Pedernales Unit T-Ridge development Technology Infrastructure Directional drilling Intelligent completions 3-D seismic Pt. Pedernales Unit Shoreline T- Ridge Prospec
Slide 22: Pacific Development Unit: T-Ridge Project
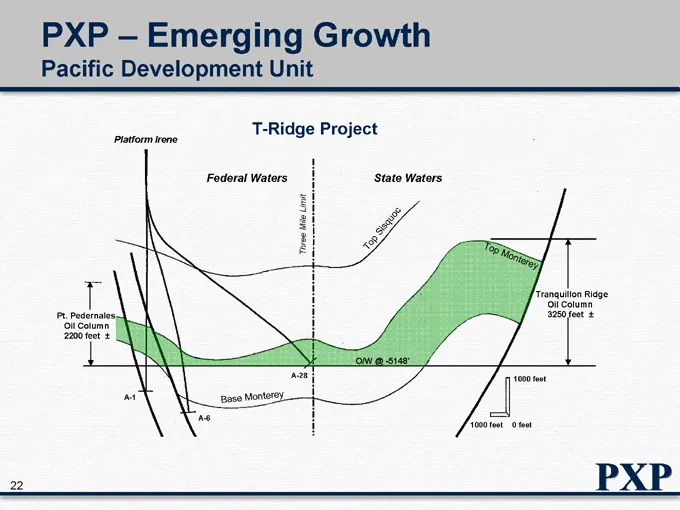
PXP – Emerging Growth Pacific Development Unit T-Ridge Project Platform Irene Federal Waters Pt. Pedernales Oil Column 2200 feet ± State Waters A-1 A-6 Base Monterey A-28 O/W @ -5148’ Three Mile Limit Top Sisquoc Top Monterey Tranquillon Ridge Oil Column 3250 feet ± 1000 feet 1000 feet feet
Slide 23: Emerging Growth: Exploration Unit
PXP – Emerging Growth Exploration Unit Focus on North America resource trends L/M Miocene Trend – DW GOM
Slide 24: L/M Miocene Trend – DW GOM
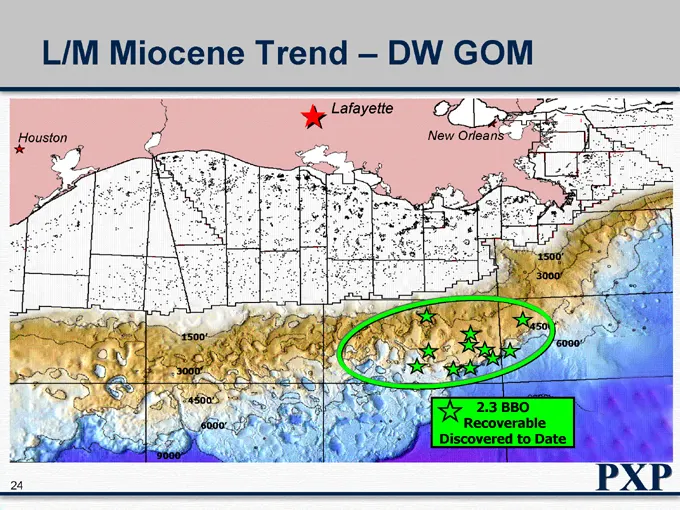
L/M Miocene Trend – DW GOM Houston Lafayette New Orleans 1500’ 3000’ 4500’ 6000’ 1500’ 3000’ 4500’ 6000’ 9000’ 2.3 BBO Recoverable Discovered to Date
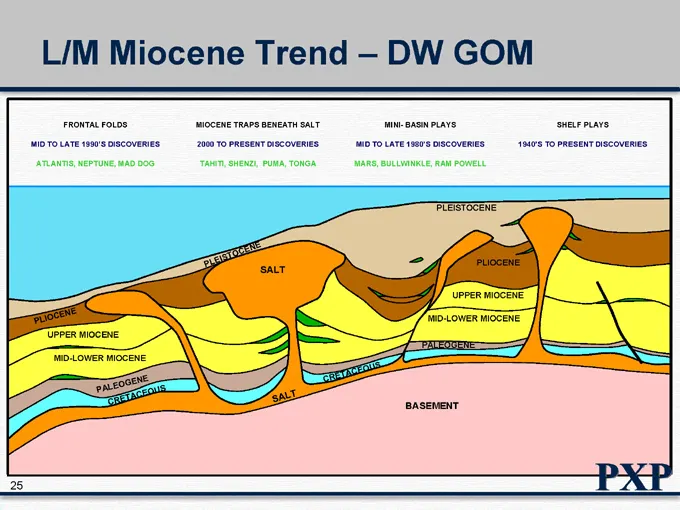
Slide 25: L/M Miocene Trend – DW GOM
L/M Miocene Trend – DW GOM FRONTAL FOLDS MIOCENE TRAPS BENEATH SALT MINI- BASIN PLAYS SHELF PLAYS MID TO LATE 1990’S DISCOVERIES 2000 TO PRESENT DISCOVERIES MID TO LATE 1980’S DISCOVERIES 1940’S TO PRESENT DISCOVERIES ATLANTIS, NEPTUNE, MAD DOG TAHITI, SHENZI, PUMA, TONGA MARS, BULLWINKLE, RAM POWEL
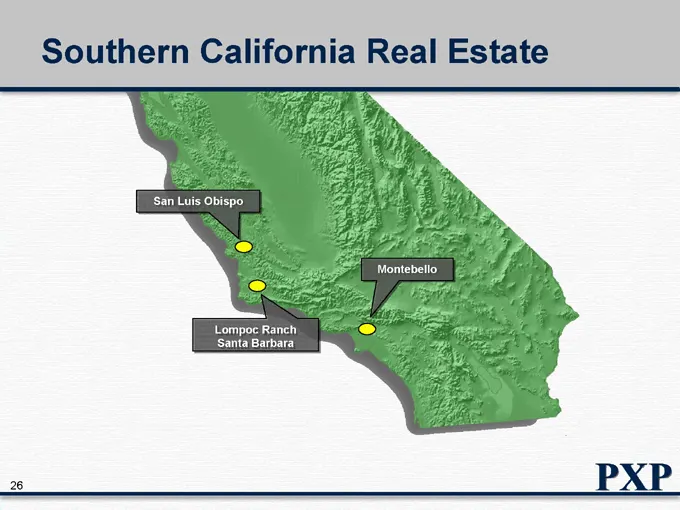
Slide 26: Southern California Real Estate
Southern California Real Estate San Luis Obispo Lompoc Ranch Santa Barbara Montebello
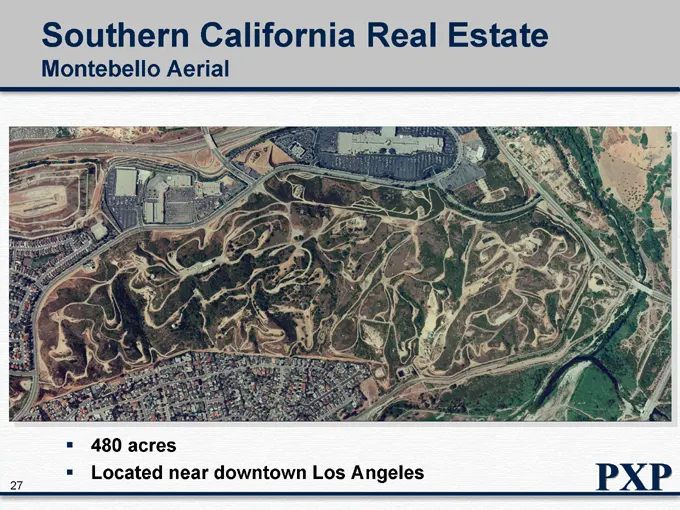
Slide 27: Southern California Real Estate – Montebello
Southern California Real Estate Montebello Aerial 480 acres Located near downtown Los Angeles
Slide 28: Operational Drivers
Operational Drivers Exploiting Large Resource Base Los Angeles Basin San Joaquin Valley Pacific Development Unit Eastern Development Unit Emerging Growth Opportunities T-Ridge Project—Pacific Development Unit L/M Miocene Trend – DW GOM Southern California Real Estate
Slide 29: Positioned for the Future
Positioned for the Future Large, durable, resource base with long reserve life and extensive, underutilized infrastructure Visible production and reserve growth from low risk projects Emerging opportunities for longer-term growth and value creation Improving corporate profile Unit costs lower 2005+
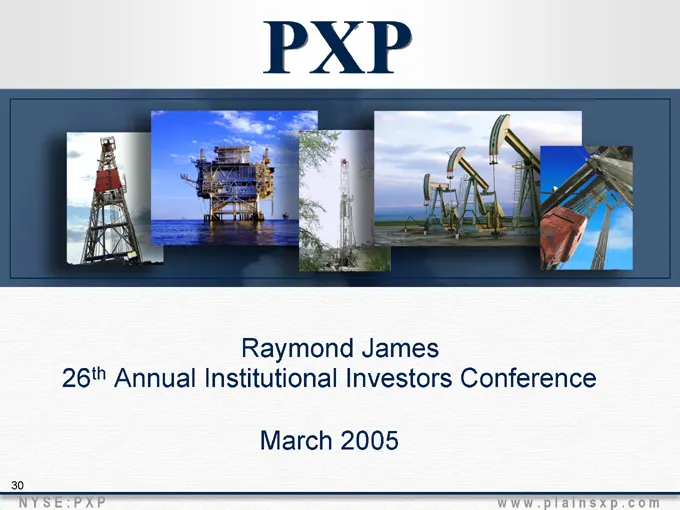
Slide 30: Raymond James 26th Annual Institutional Investors Conference
Raymond James 26th Annual Institutional Investors Conference March 2005
Source: SEC EDGAR · 8-K filed Mar 7, 2005
More decks from Plains Exploration & Production Company
 Global Metals, Mining & Steel Conference 201333 slides · May 14, 2013
 Q1 2013 Earnings Presentation46 slides · Apr 19, 2013
 Merger or Acquisition (February 2013)35 slides · Feb 25, 2013
 2013 Credit Suisse Energy Summit10 slides · Feb 5, 2013
 Merger or Acquisition (January 2013)30 slides · Jan 17, 2013
 Credit Suisse 2012 Energy Summit32 slides · Feb 7, 2012