Community Banks — PennRock Financial Services — Merger or Acquisition (November 2004)
15 slides from Community Banks's merger presentation, Nov 16, 2004
Slide 1: Announcement of Strategic Merger, November 16, 2004
Exhibit 99.2 Exhibit 99.216, A ANNOUNCE November AND 2004 STRATEGIC MERGER
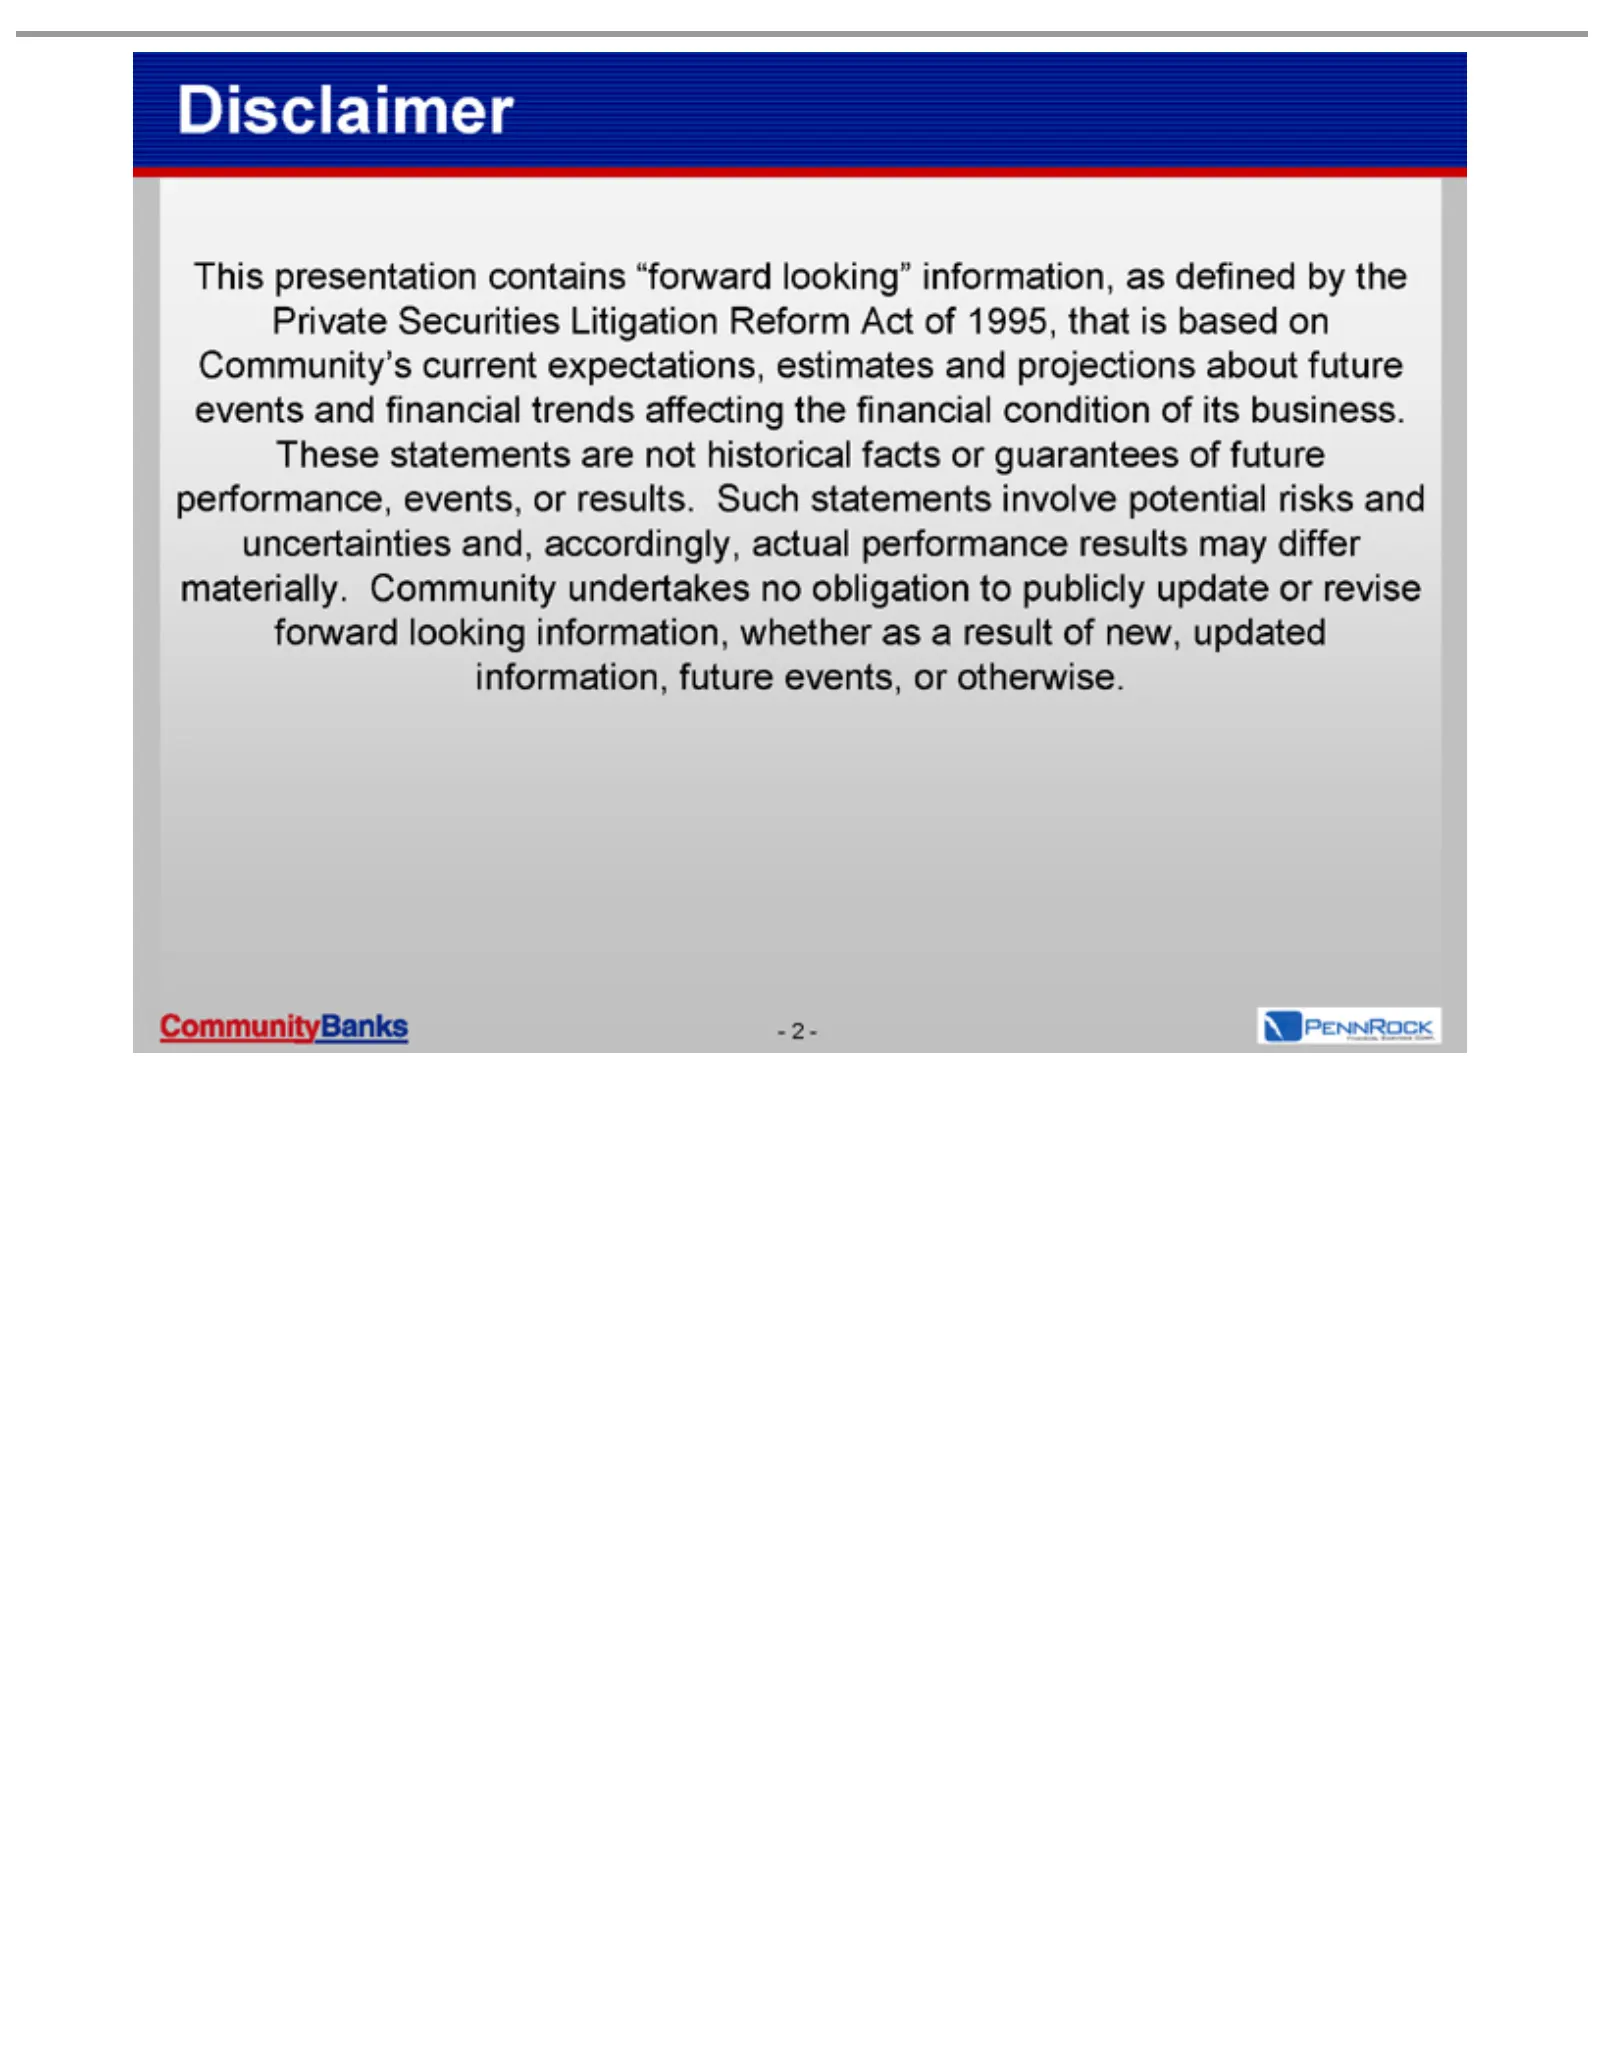
Slide 2: Disclaimer
This Disclaimer projections Such -looking 2 - presentation statements information, aboutinvolve future contains whether events potential “forward asand a risks result financial looking” and of new, uncertainties trends information, updated affecting information, and, as the defined accordingly, fina
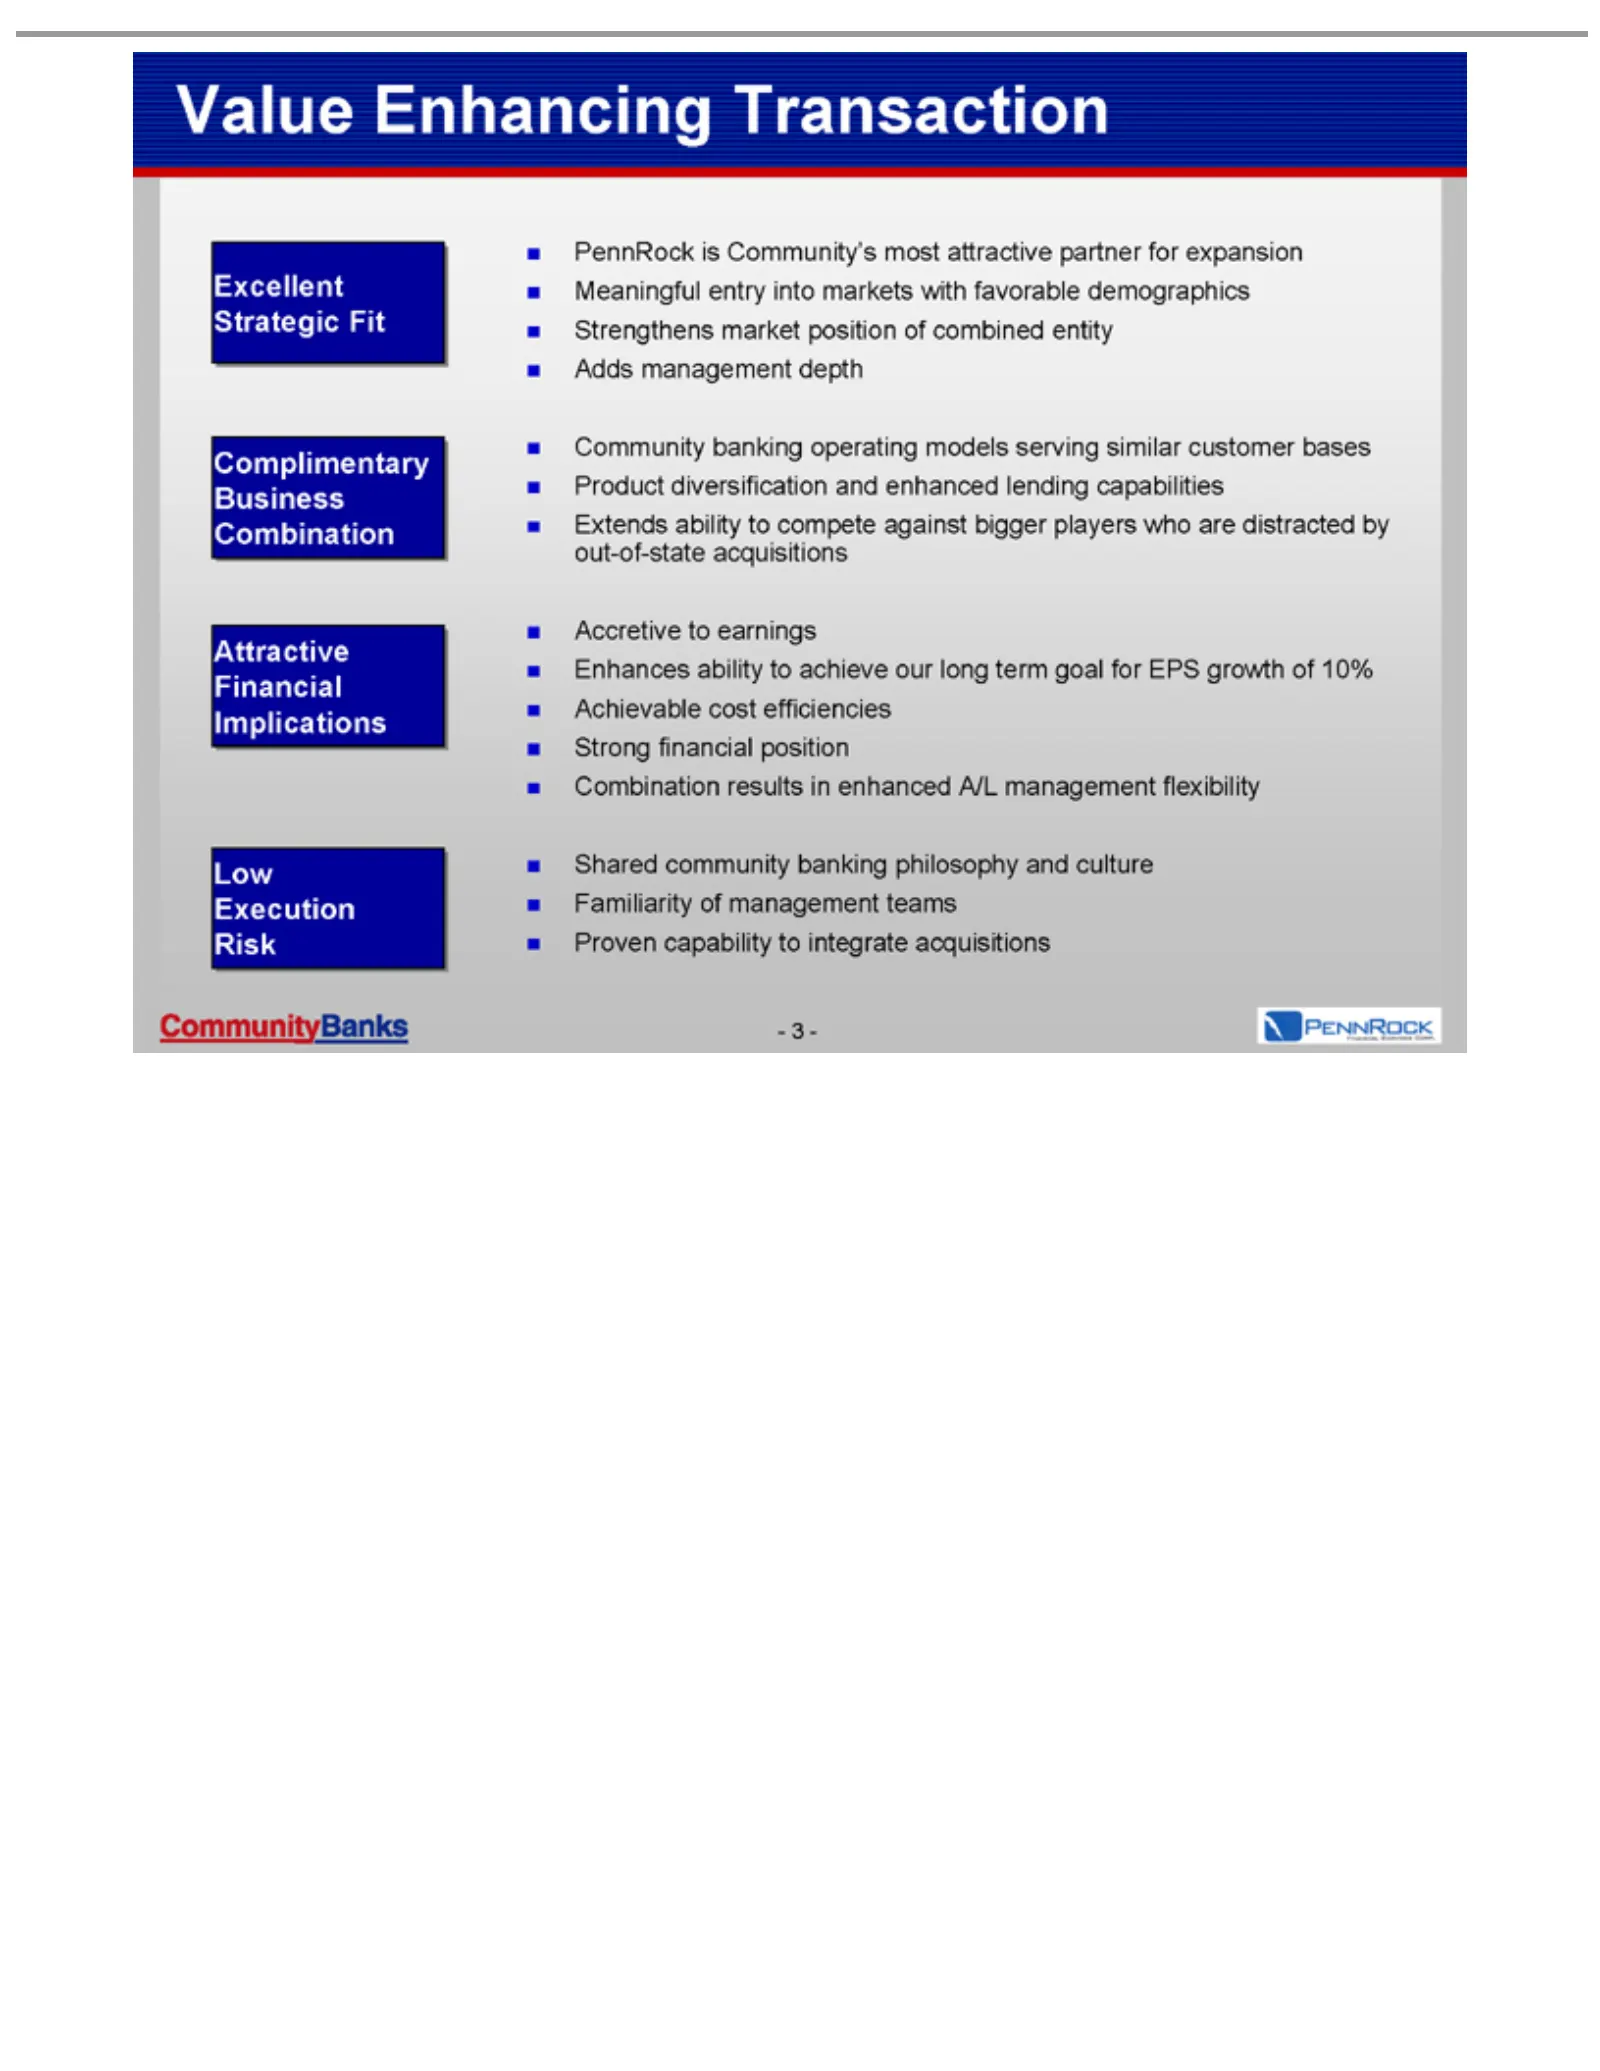
Slide 3: Strategic and financial rationale of the combination
PennRock Meaningful Strengthens Adds Community Product Extends Accretive Enhances Achievable Strong Combination Shared Familiarity Proven Excellent Complimentary Attractive Low -Value 3 - Execution management Enhancing financial community capability diversification ability Strategic ability to Finan
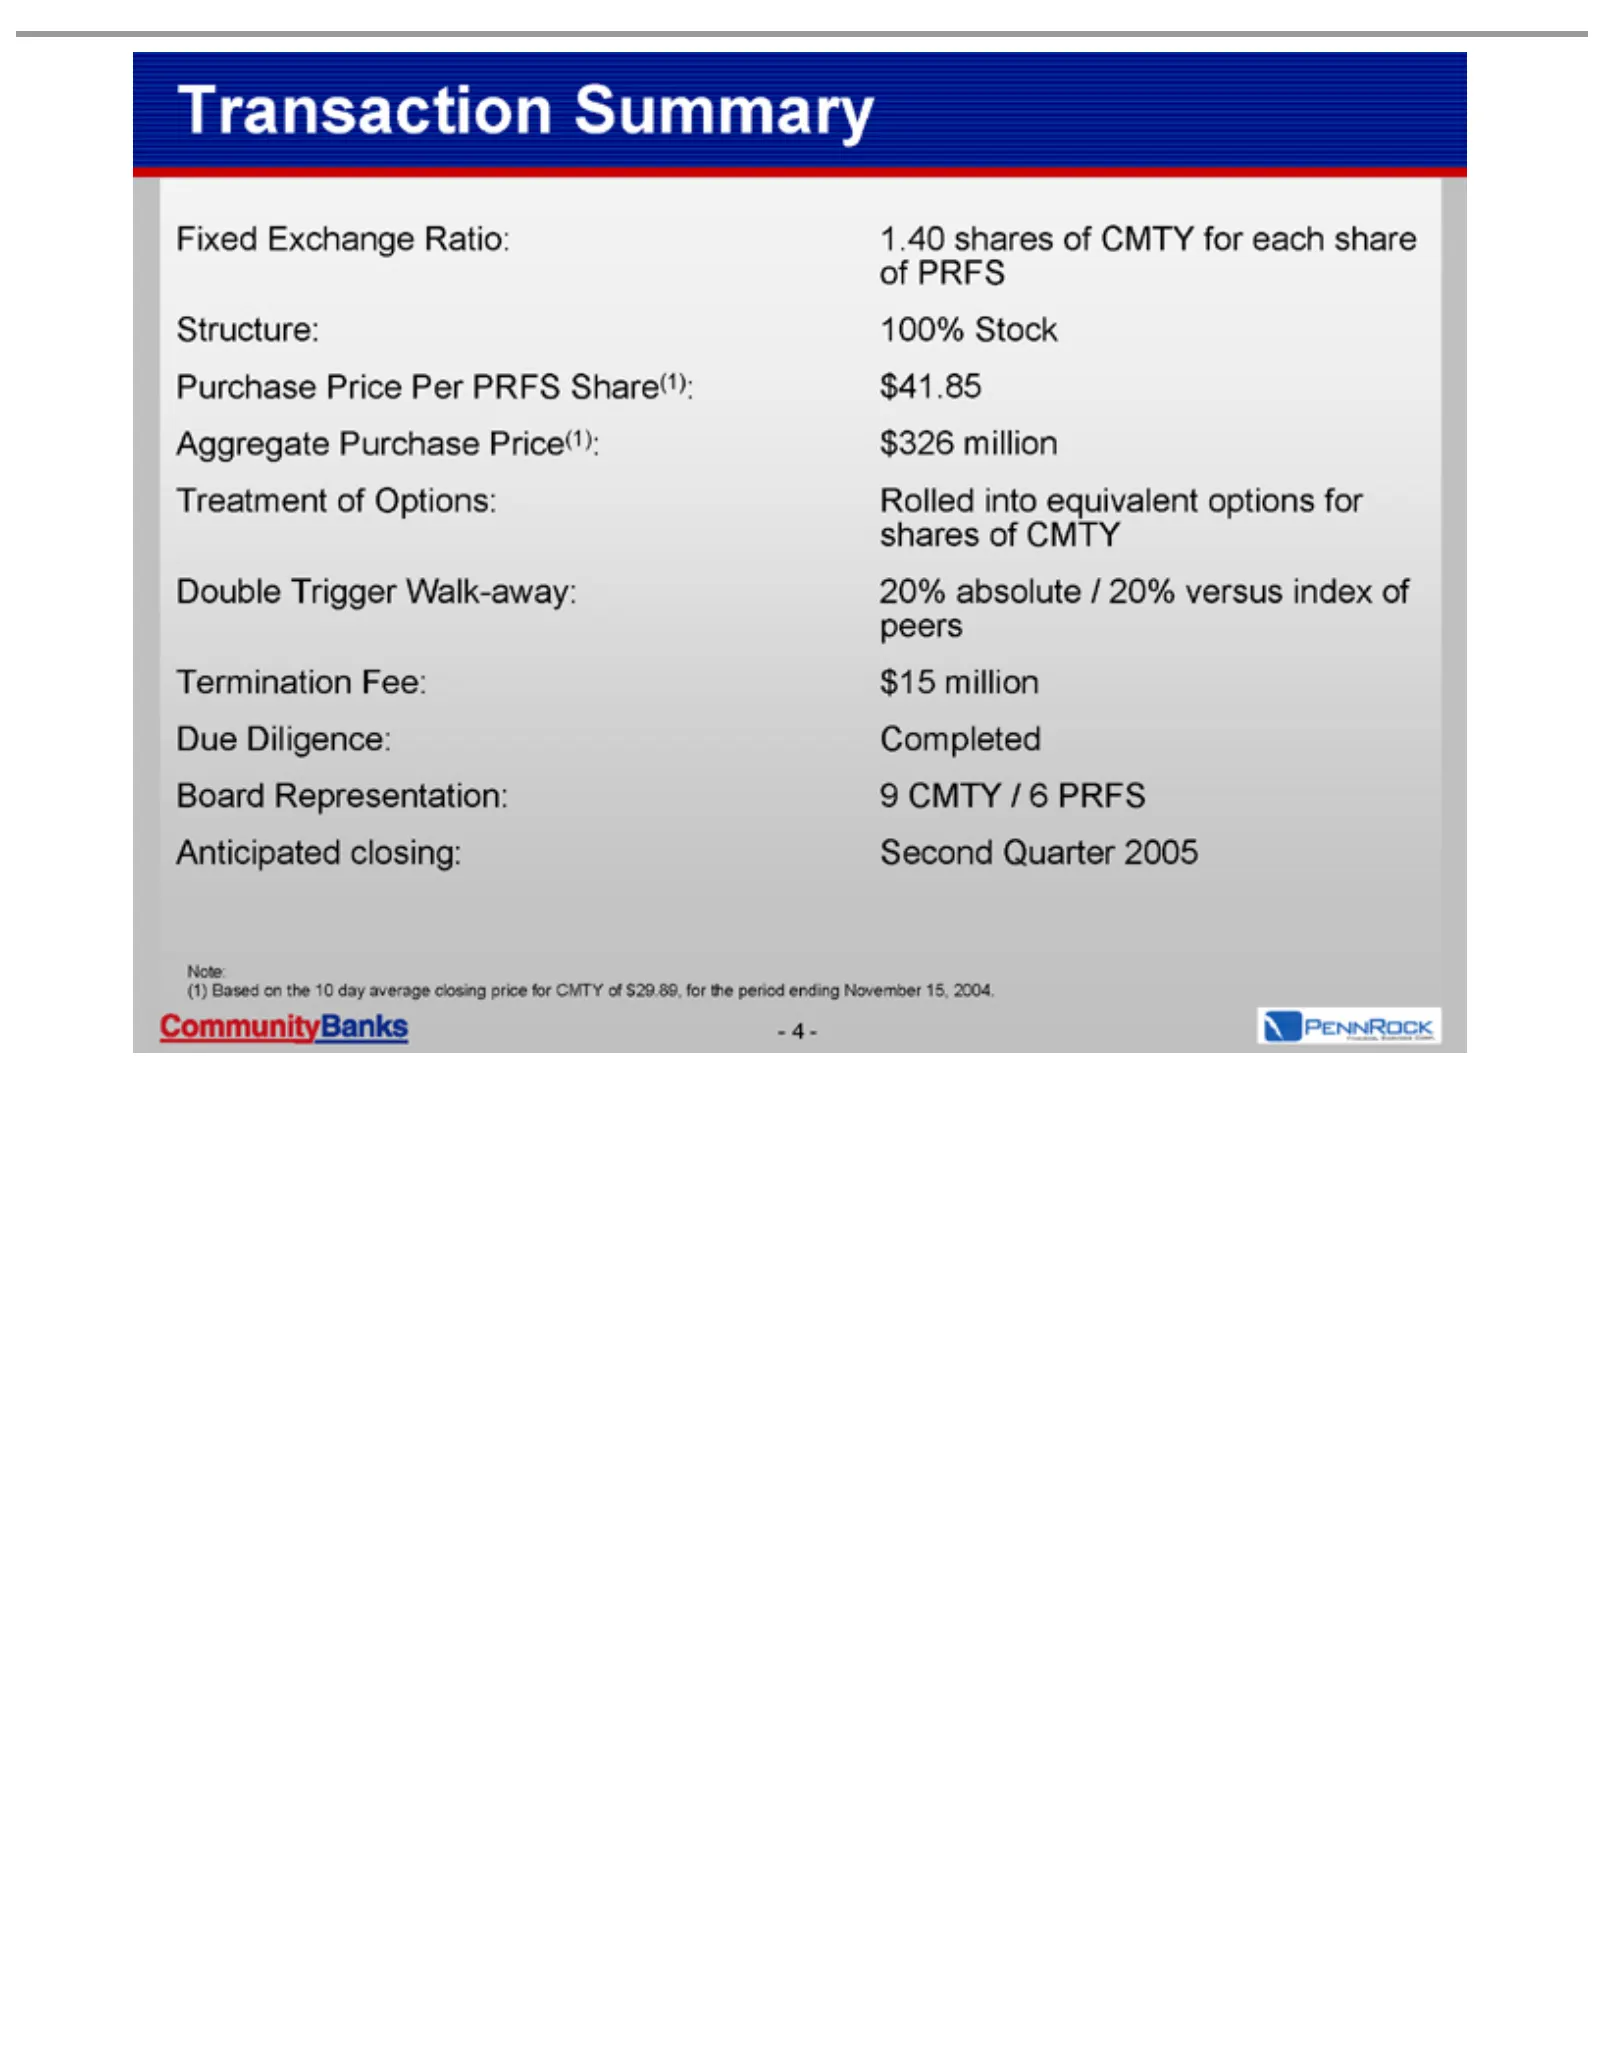
Slide 4: Transaction Summary
Fixed Purchase Structure: Aggregate Treatment Double Termination Due Board Anticipated 1.40 100% $326 $41.85 Rolled 20% $15 9 Completed Second (1) Note: -Transaction 4— CMTY Based million Diligence: shares absolute million Exchange Stock Representation: into Trigger Quarter /Price on of 6Purchase eq
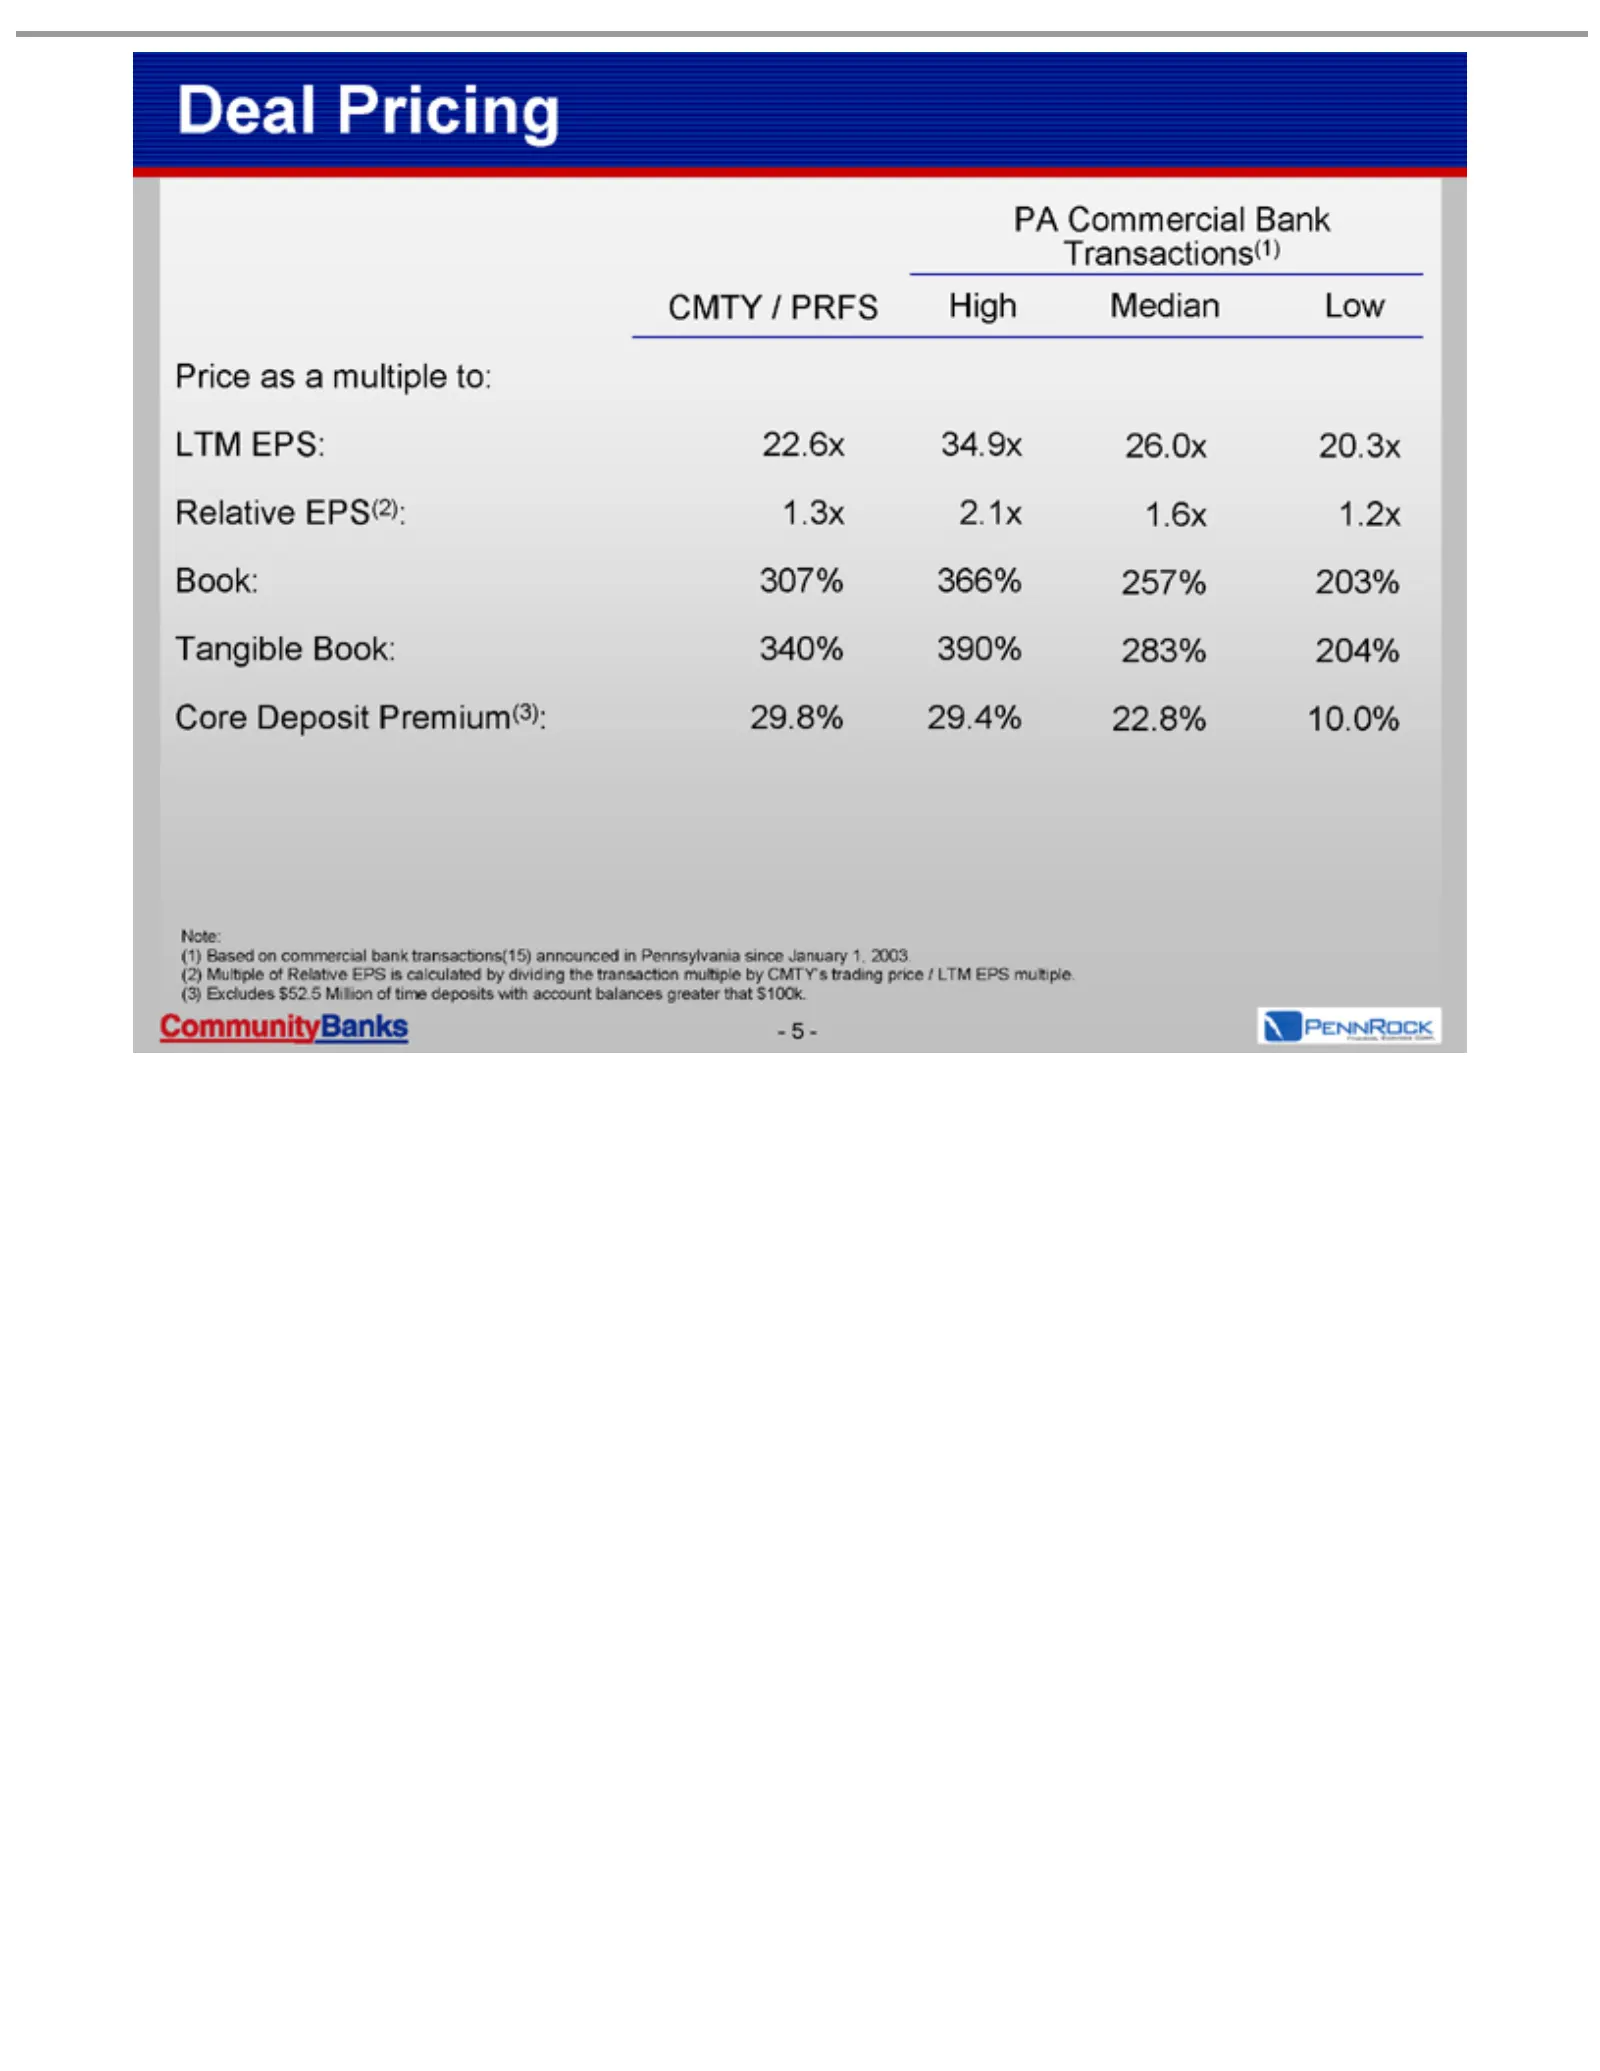
Slide 5: Pricing Relative to Commercial Bank Transactions
Price LTM Relative Tangible Book: Core CMTY PA Low Median High Deal 10.0% 204% 203% 1.2x 20.3x 22.8% 283% 257% 1.6x 26.0x 29.4% 390% 366% 2.1x 34.9x 29.8% 340% 307% 1.3x 22.6x (1) Note: (2) -(3) 5 -Commercial Based Multiple Excludes Pricing Deposit EPS: as/aEPS(2): PRFS Book: multiple onof $52.5 com
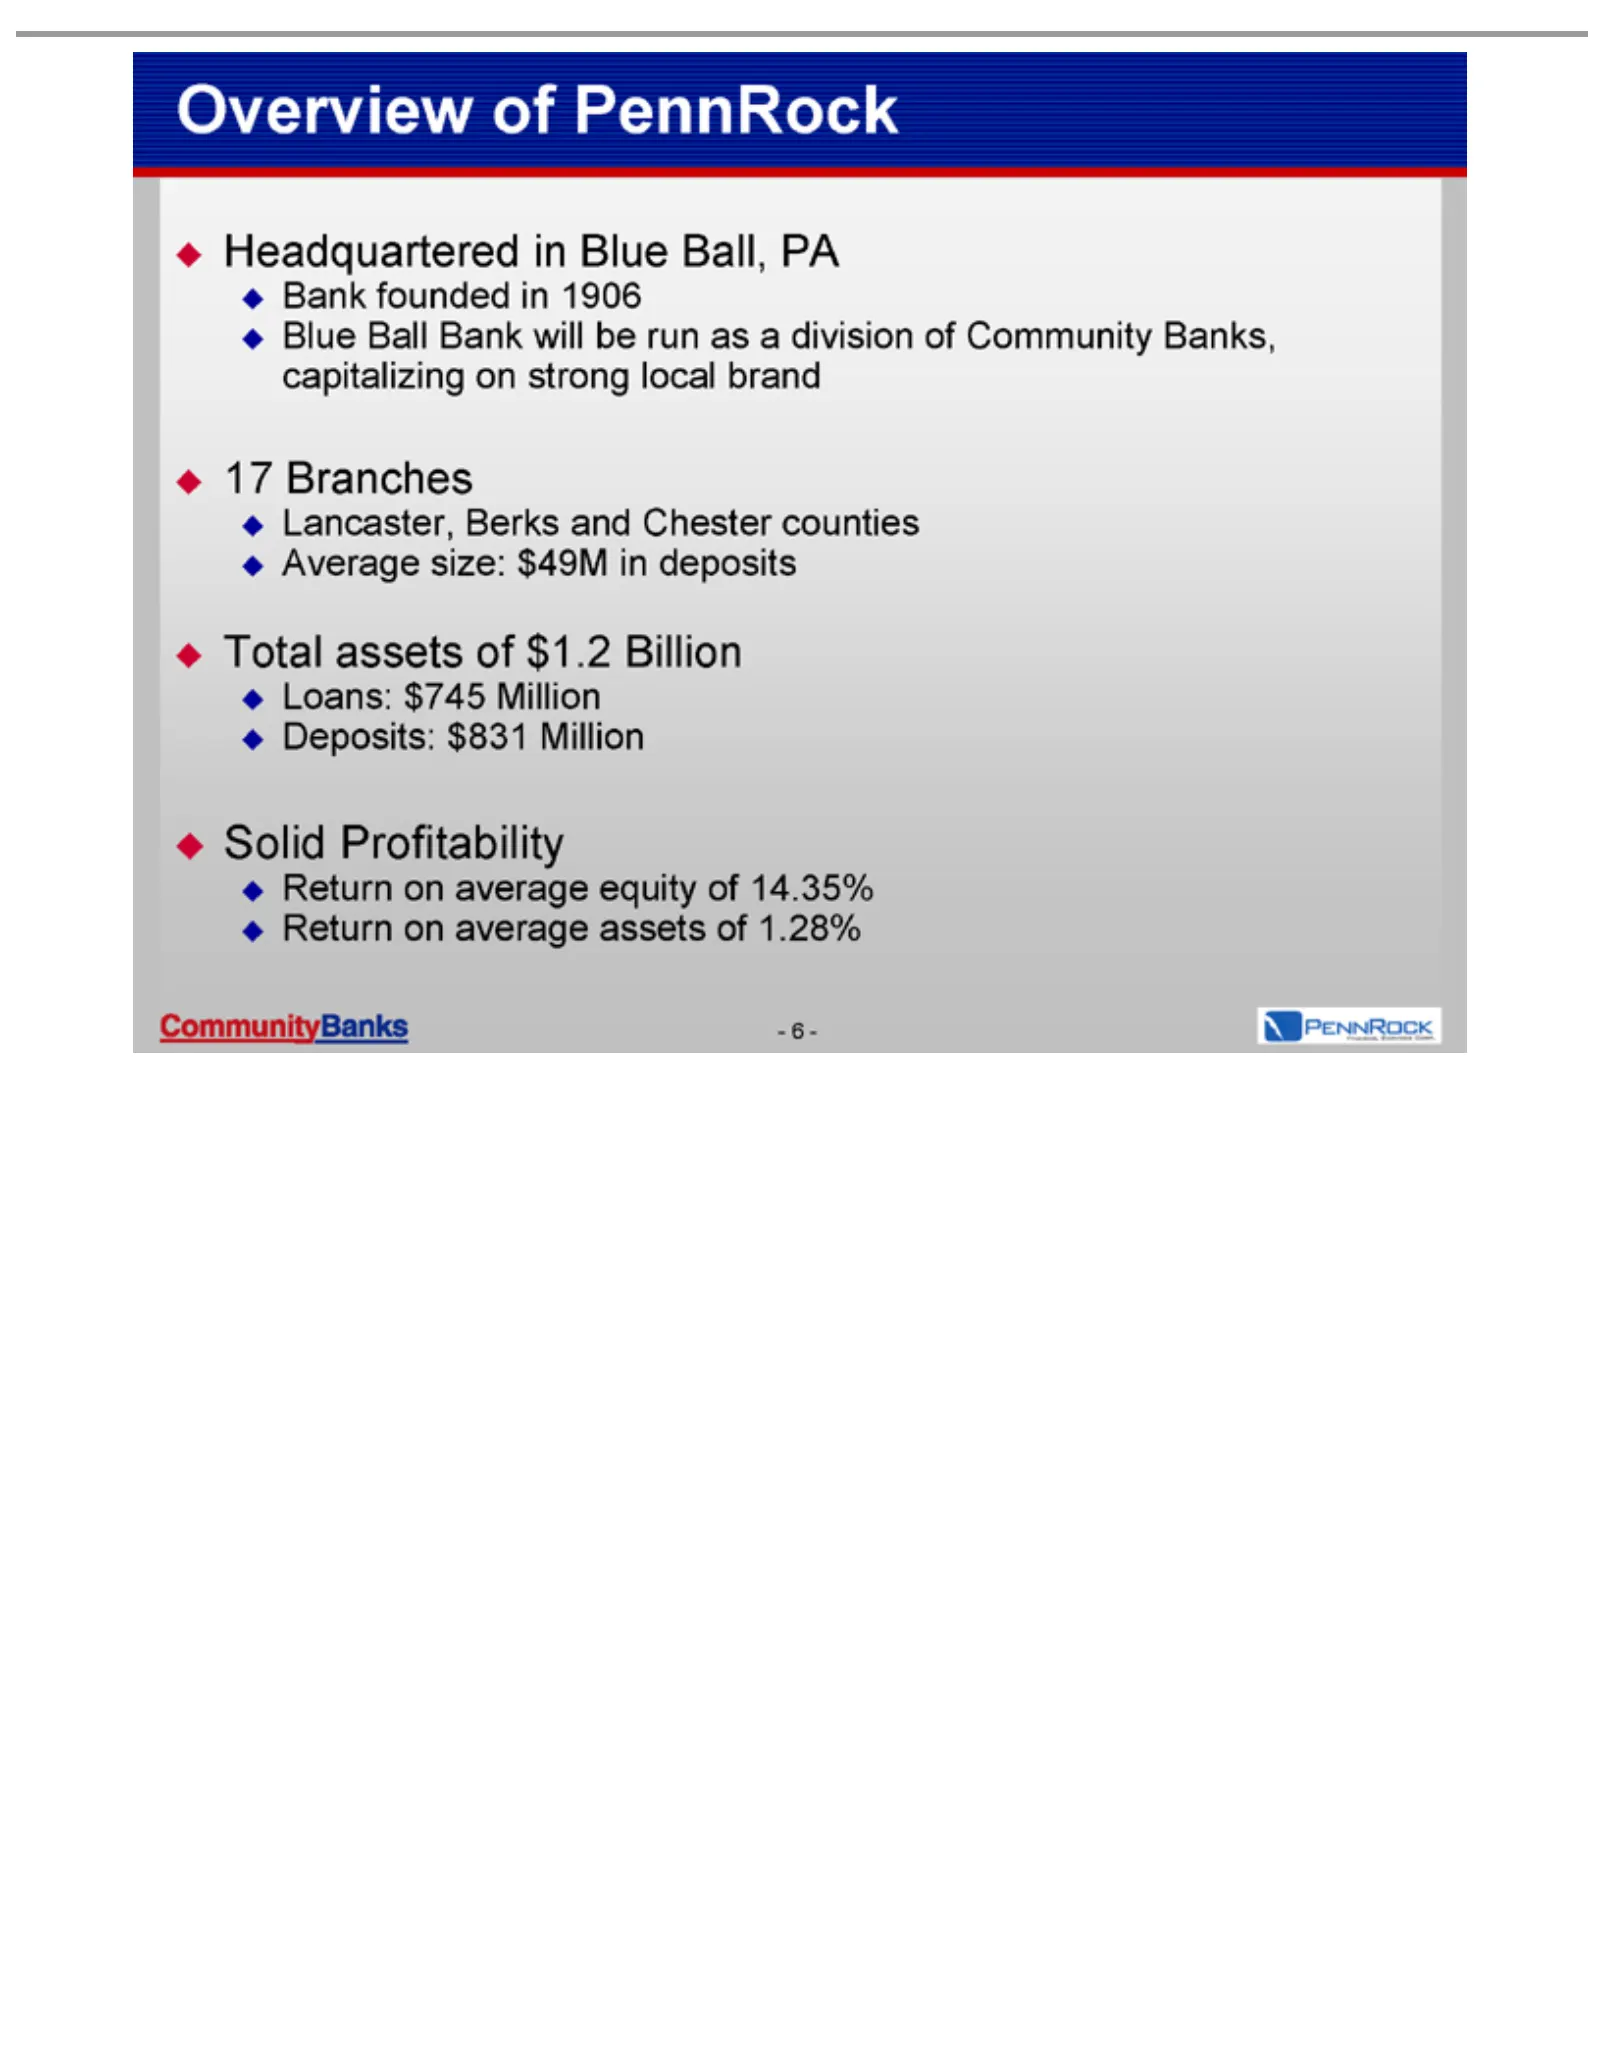
Slide 6: PennRock Overview
Headquartered Bank Blue 17 Lancaster, Average Total Loans: Deposits: Solid Return -Overview 6 Branches - Ball assets founded Profitability $745 onsize: $831 Bank of average Berks ofMillion PennRock $49M in $1.2 in Million will 1906 and Blue equity assets Billion be inChester Ball, deposits run of of
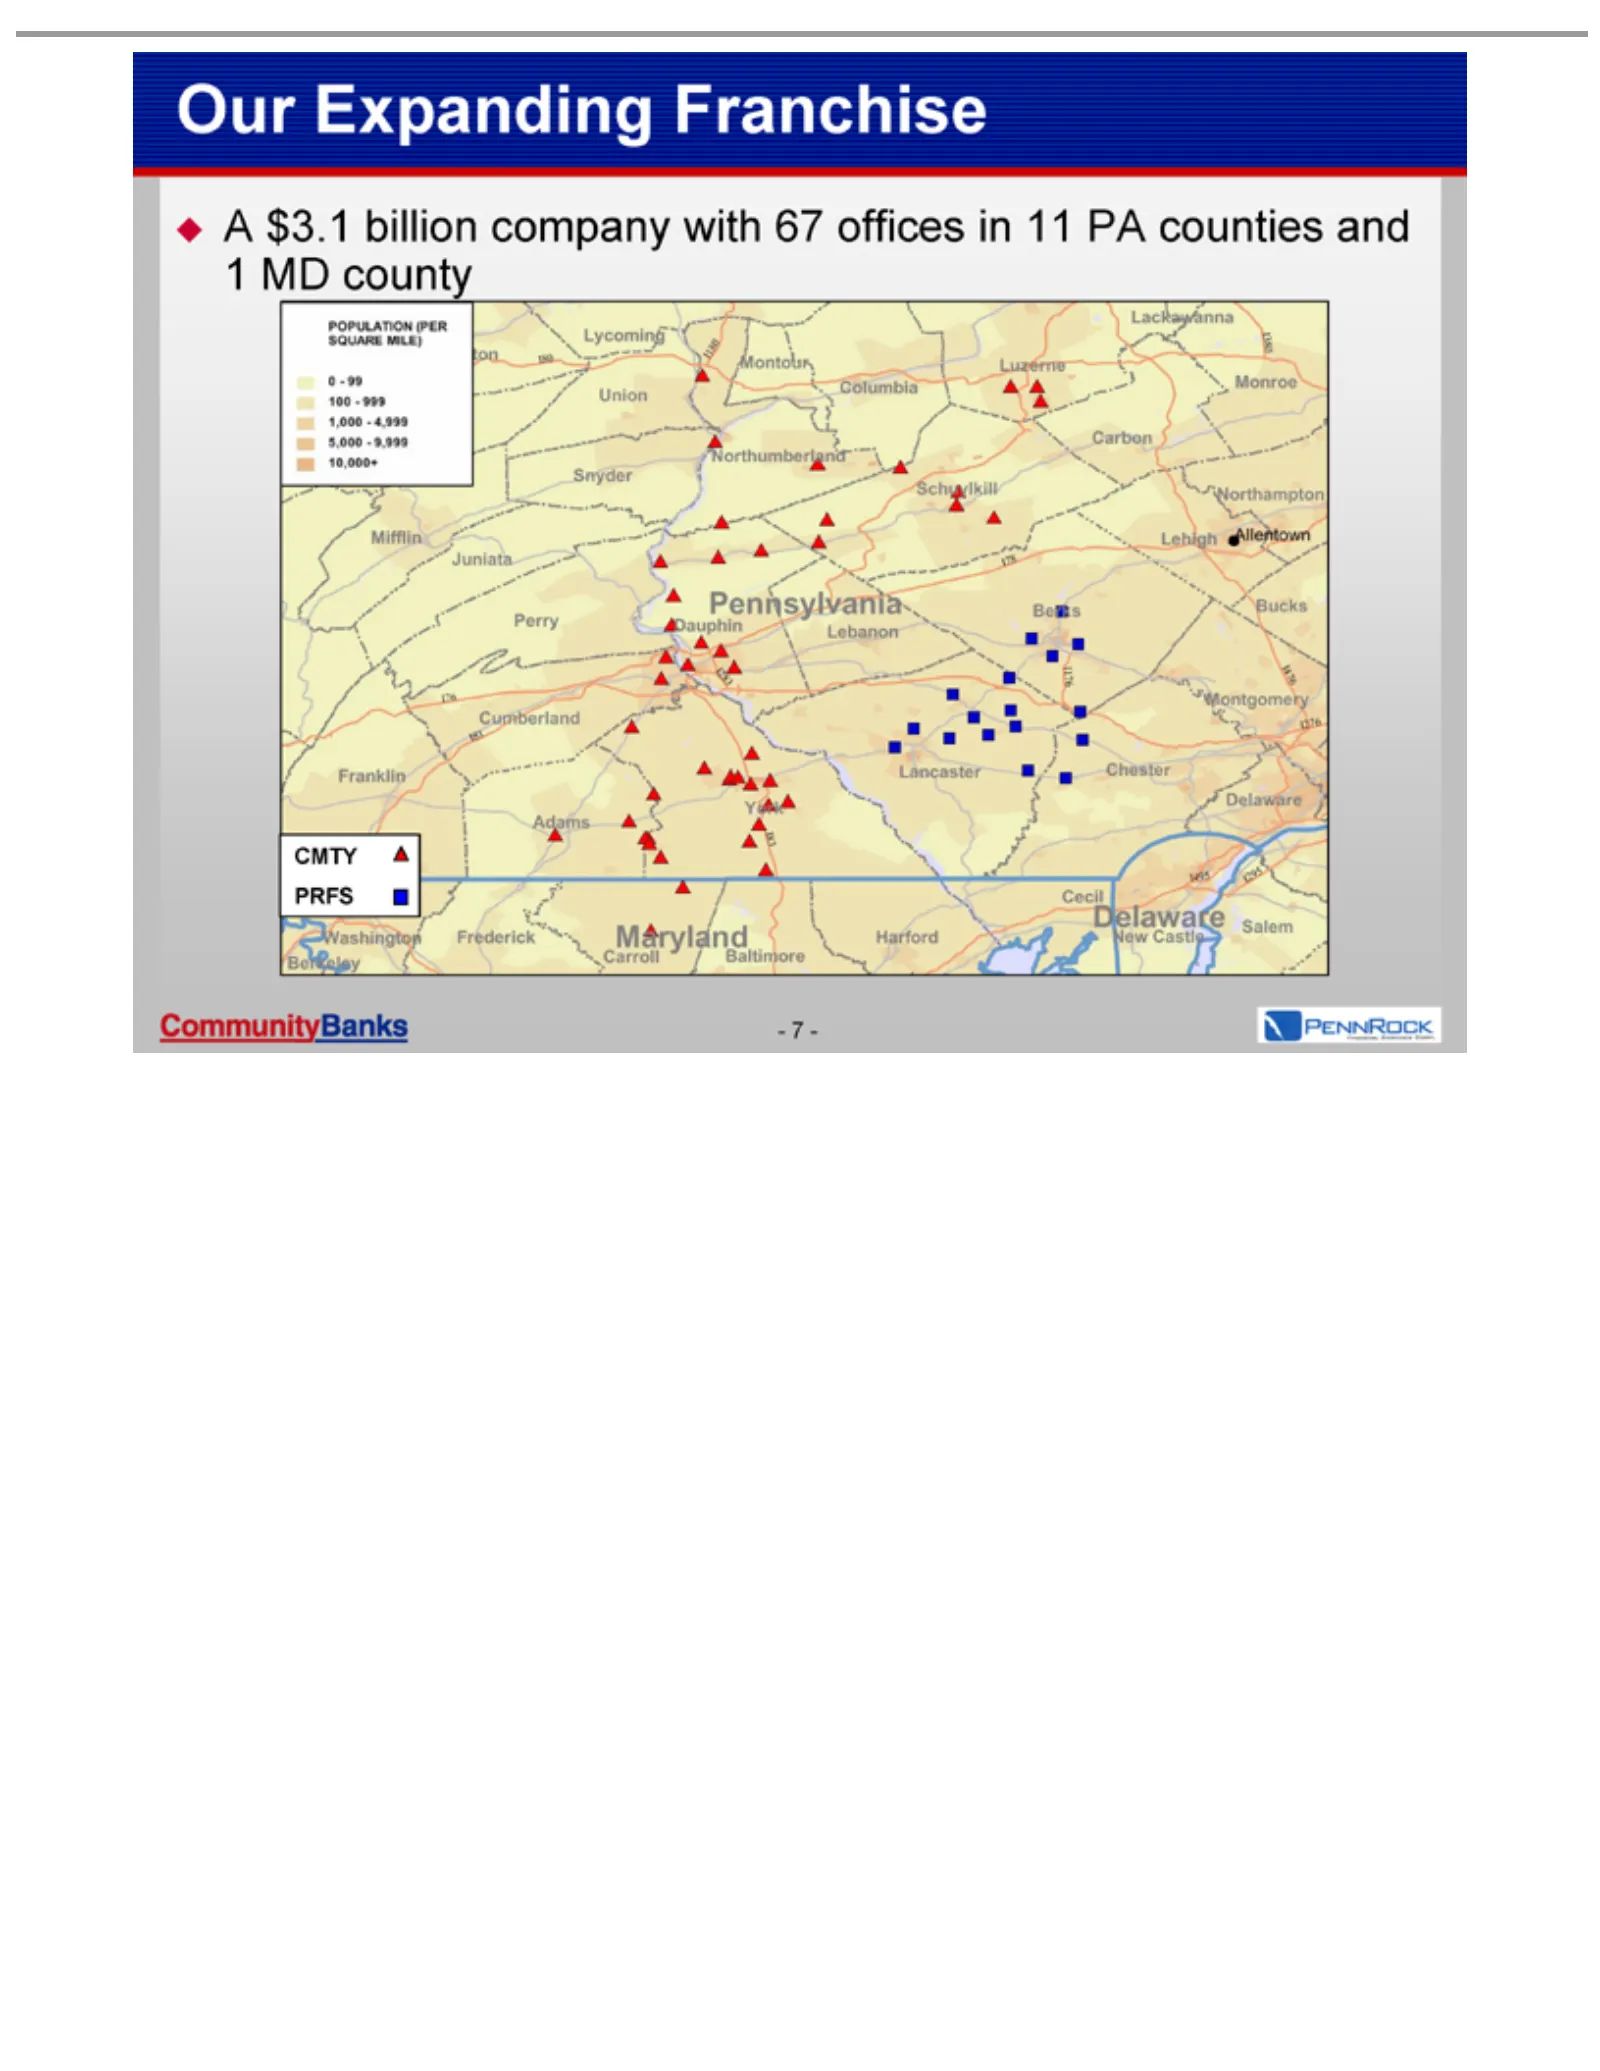
Slide 7: Expanding franchise with 67 offices
Our A PRFS CMTY POPULATION 0 100 1,000 -5,000 10,000+ 7-$3.1 -99 -Expanding - 999 - billion 4,999 company 9,999 Franchise (PER SQUARE with 67 offices MILE) in 11 PA counties and 1 MD county
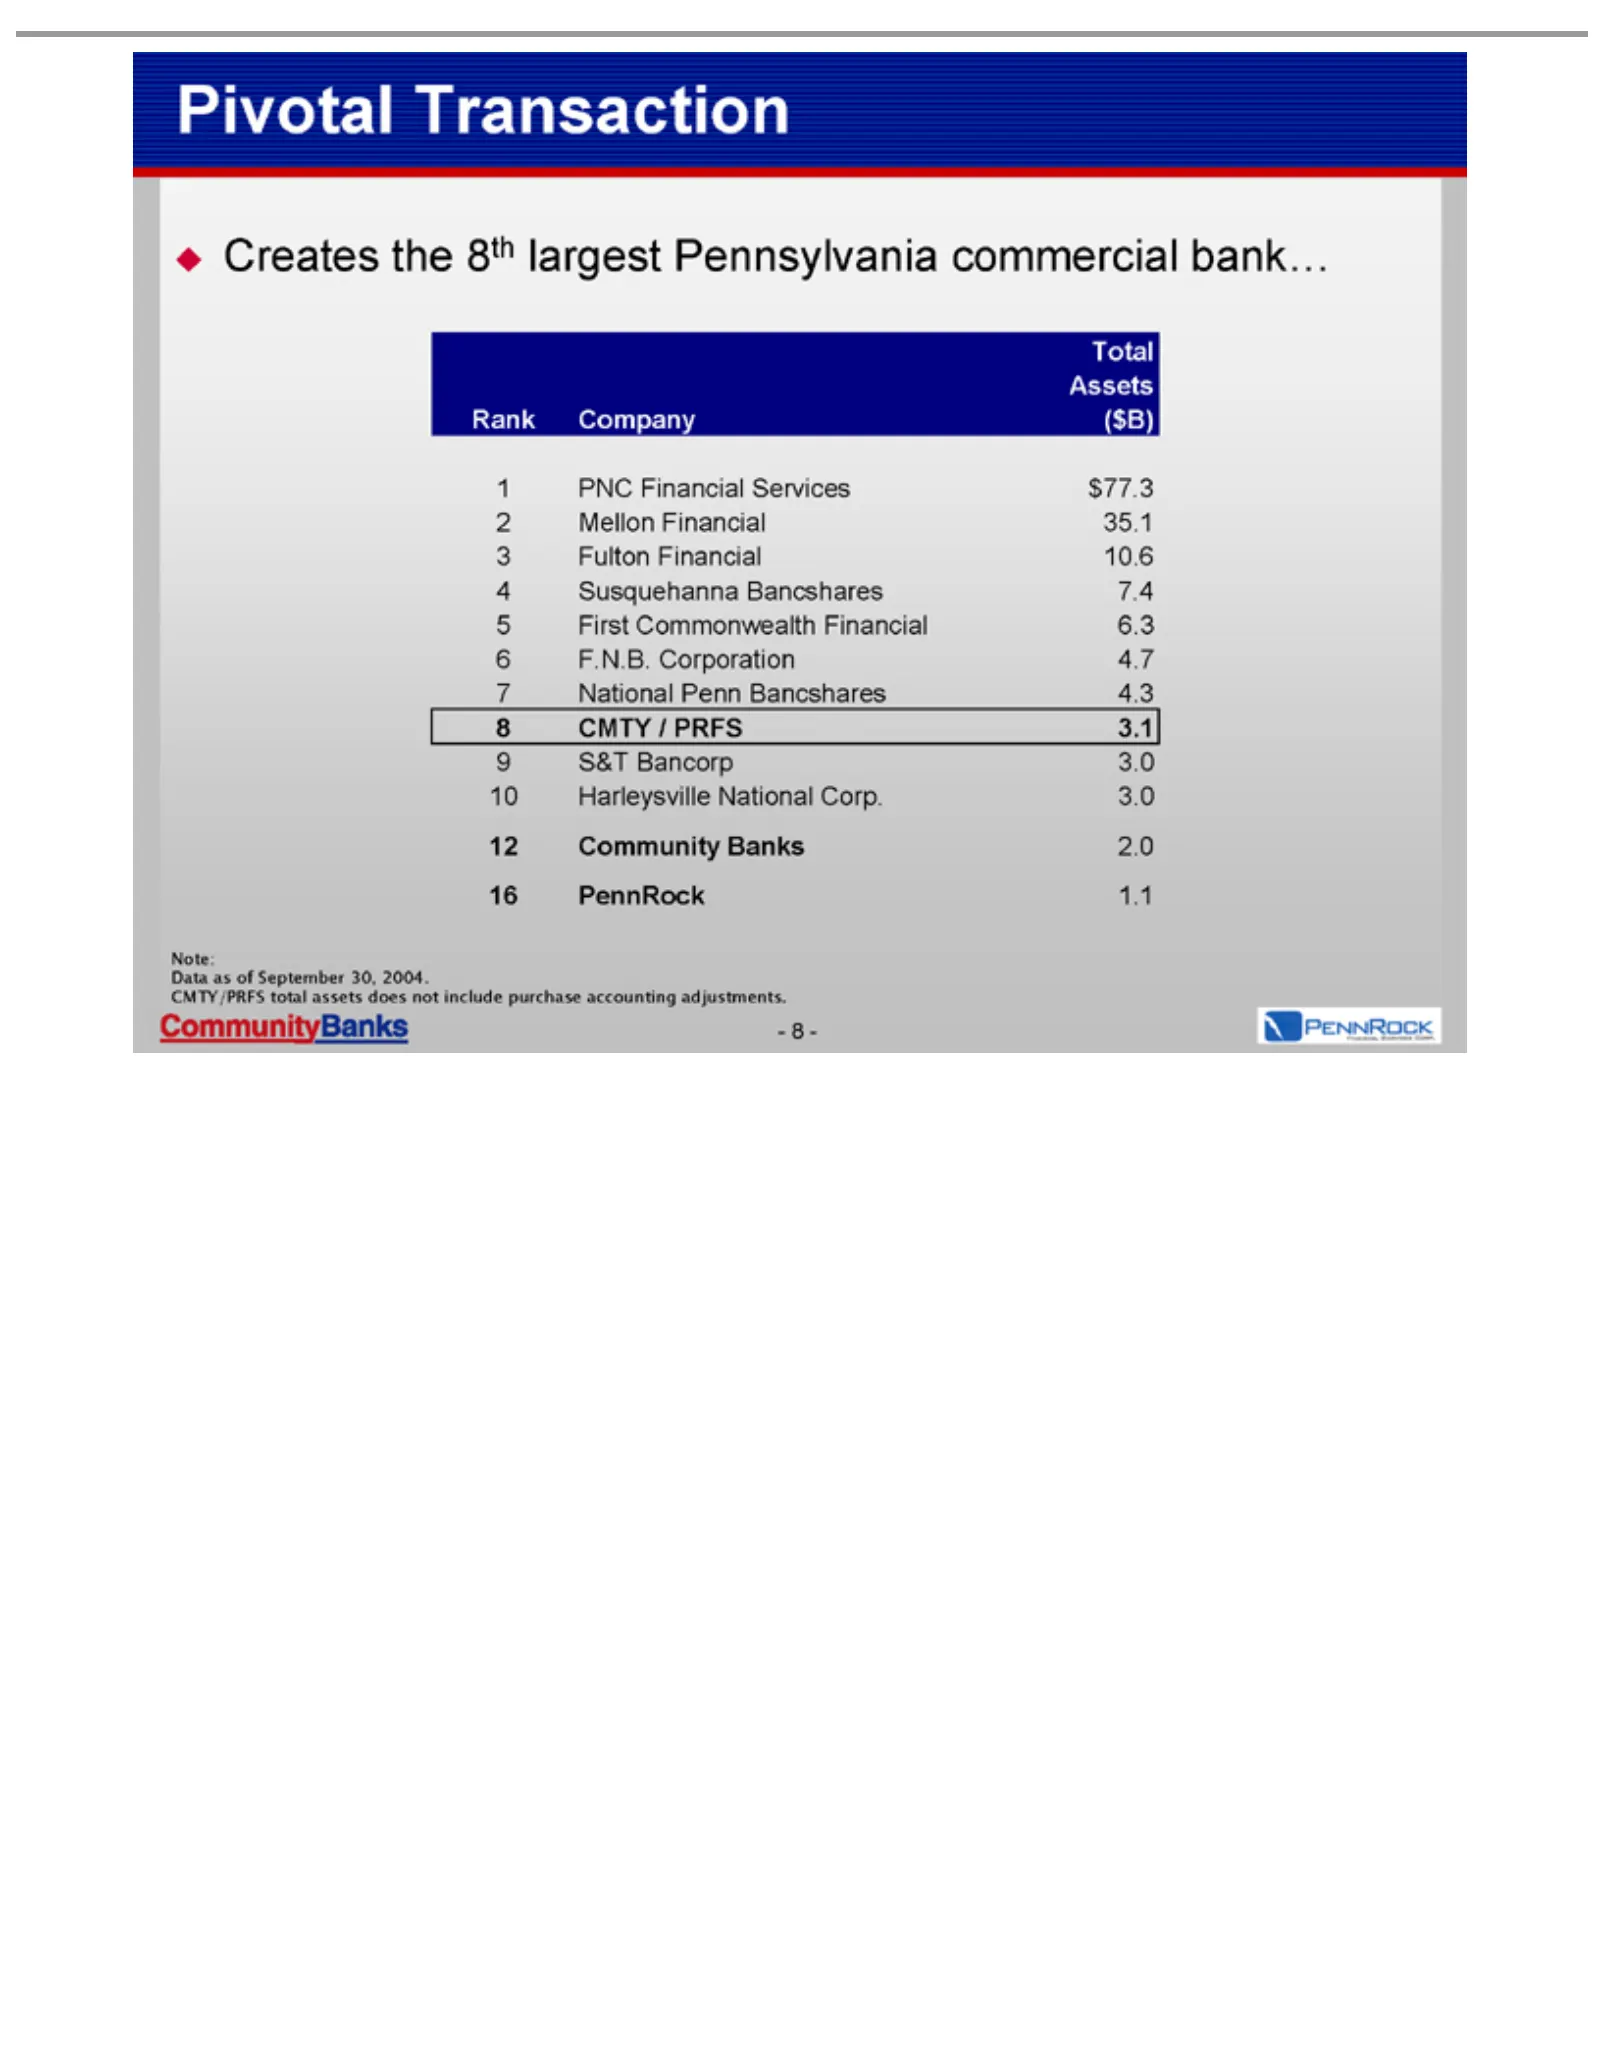
Slide 8: Creates 8th largest Pennsylvania commercial bank
Pivotal Creates Data Note: CMTY/PRFS P 1 ($B) Company Rank Assets Total M 2 $77.3 3 35.1 4 10.6 5 7.4 F 6 6.3 N 7 4.7 C 8 4.3 S 9 3.1 Harleysville 10 Community 12 -3.0 1.1 PennRock 16 2.0 .N.B. NC ulton usquehanna irst &T 8MTY ational ellon - Commonwealth as Bancorp Financial Financial Corporation T
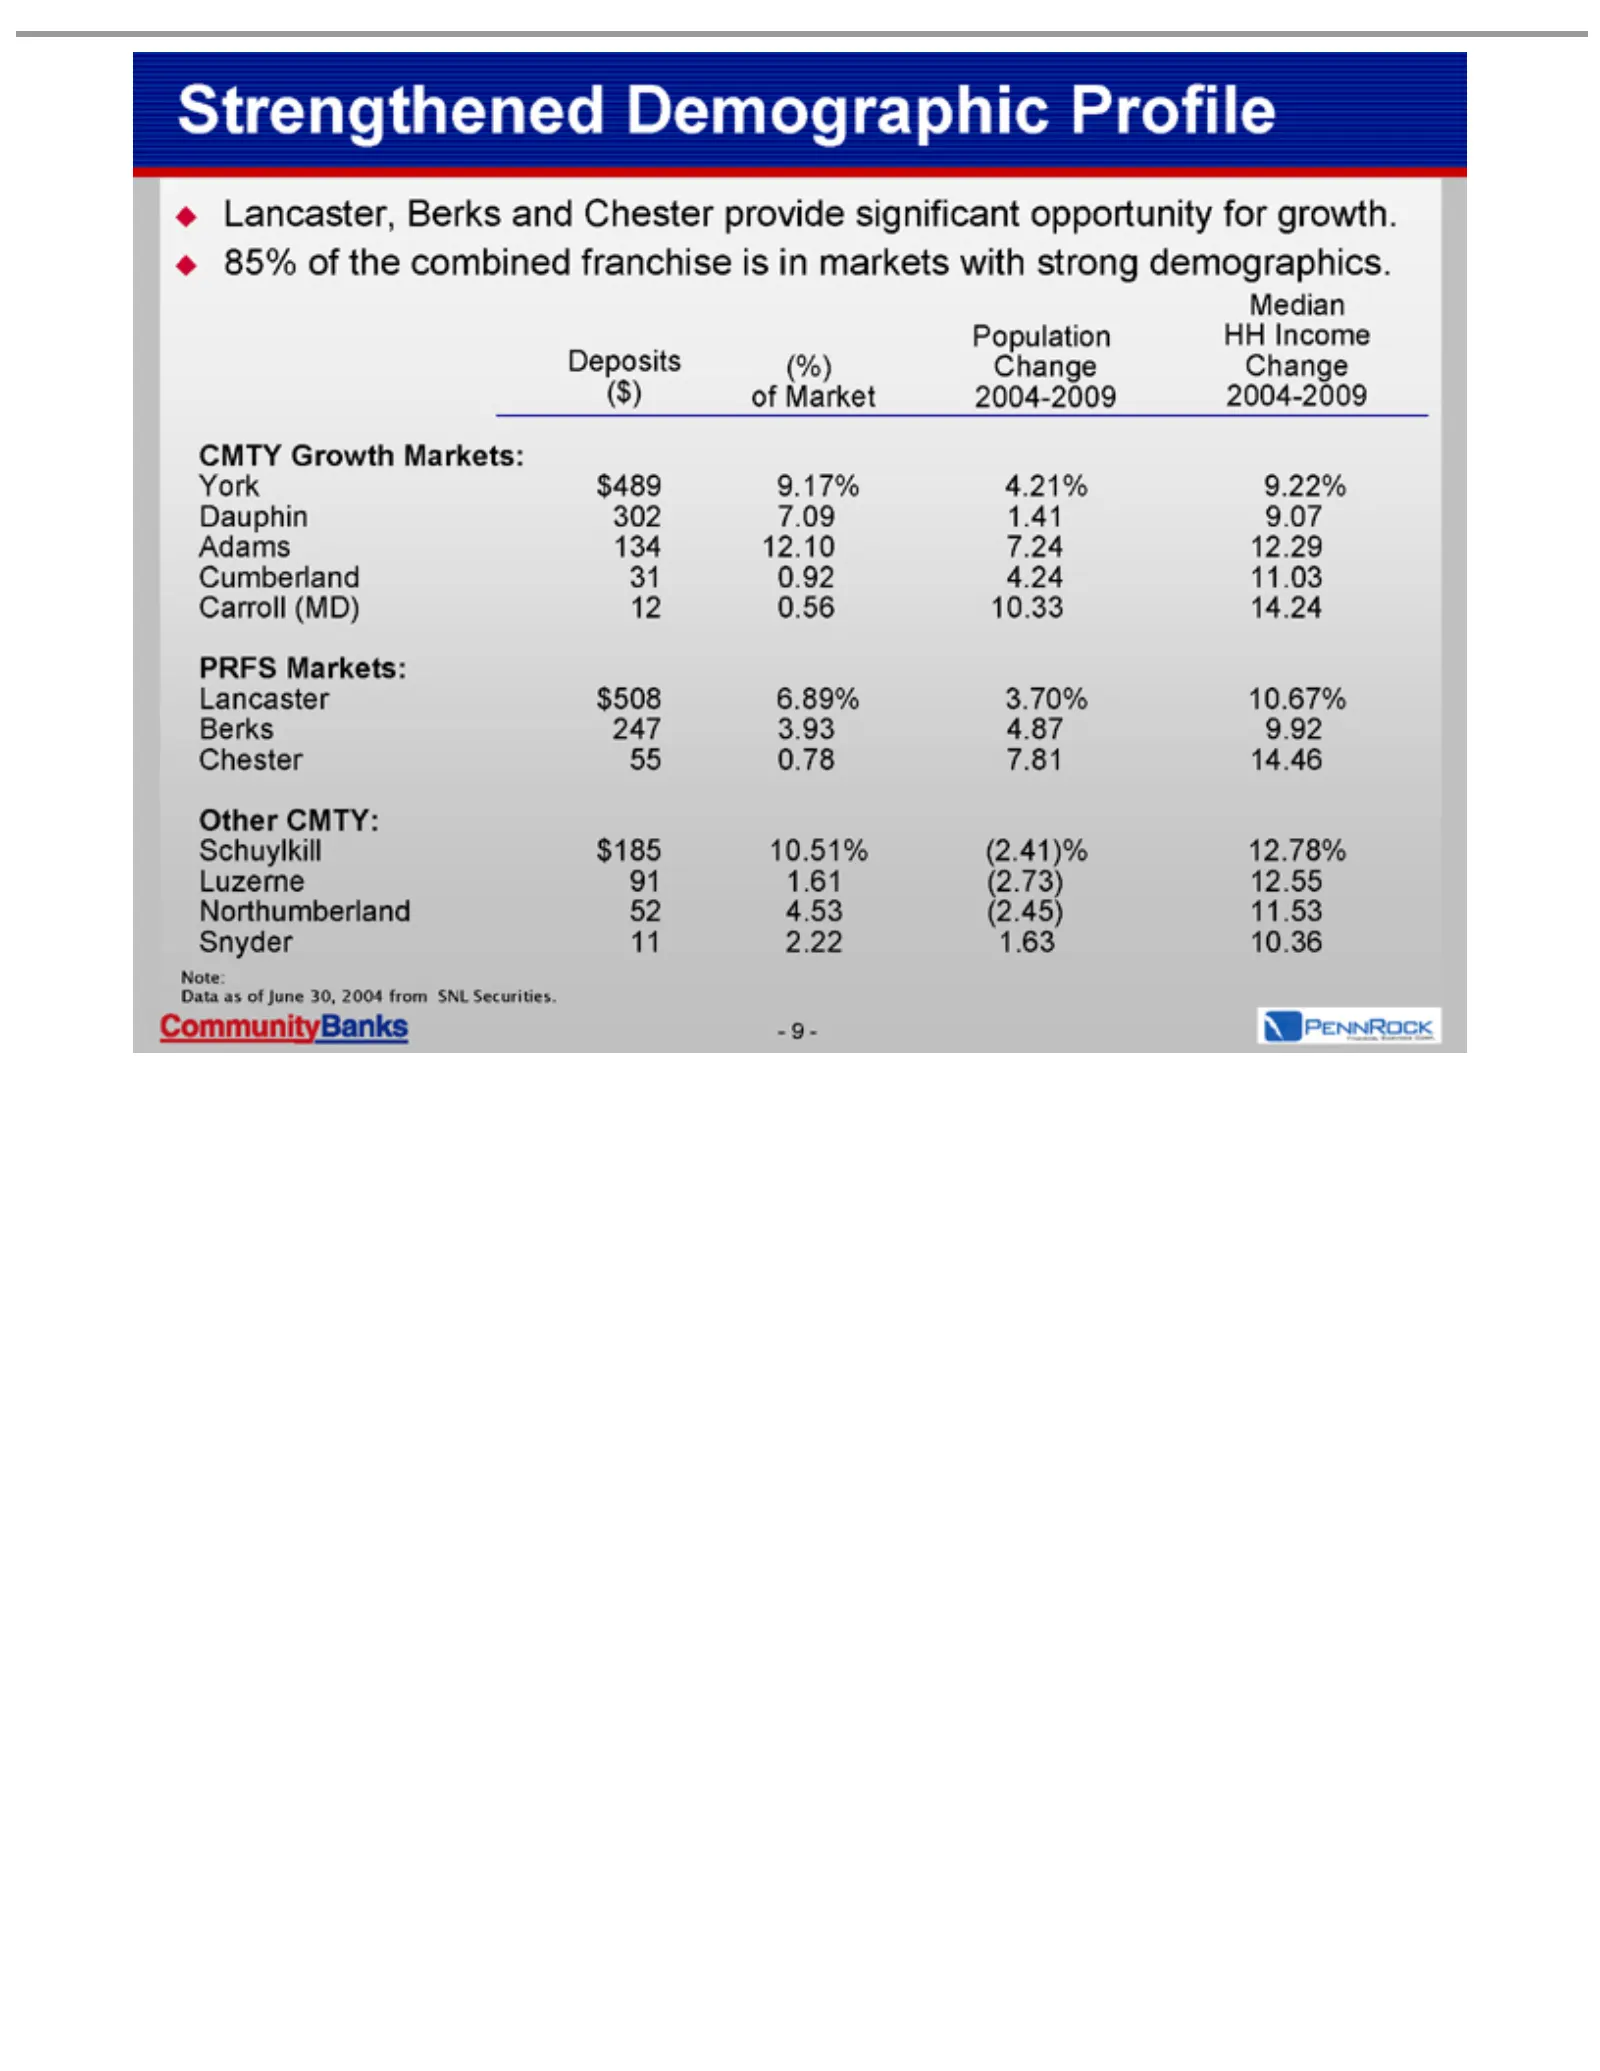
Slide 9: Strengthened CMTY market demographics
Strengthened CMTY Carroll Cumberland Adams Dauphin York PRFS Other Chester Berks Lancaster HH Median Population Snyder Northumberland Luzerne Schuylkill Data Note: 2004-2009 Change Lancaster, 10.36 11.53 12.55 12.78% 14.46 9.92 10.67% 14.24 11.03 12.29 9.07 9.22% 1.63 (2.45) (2.73) (2.41)% 7.81 4.87
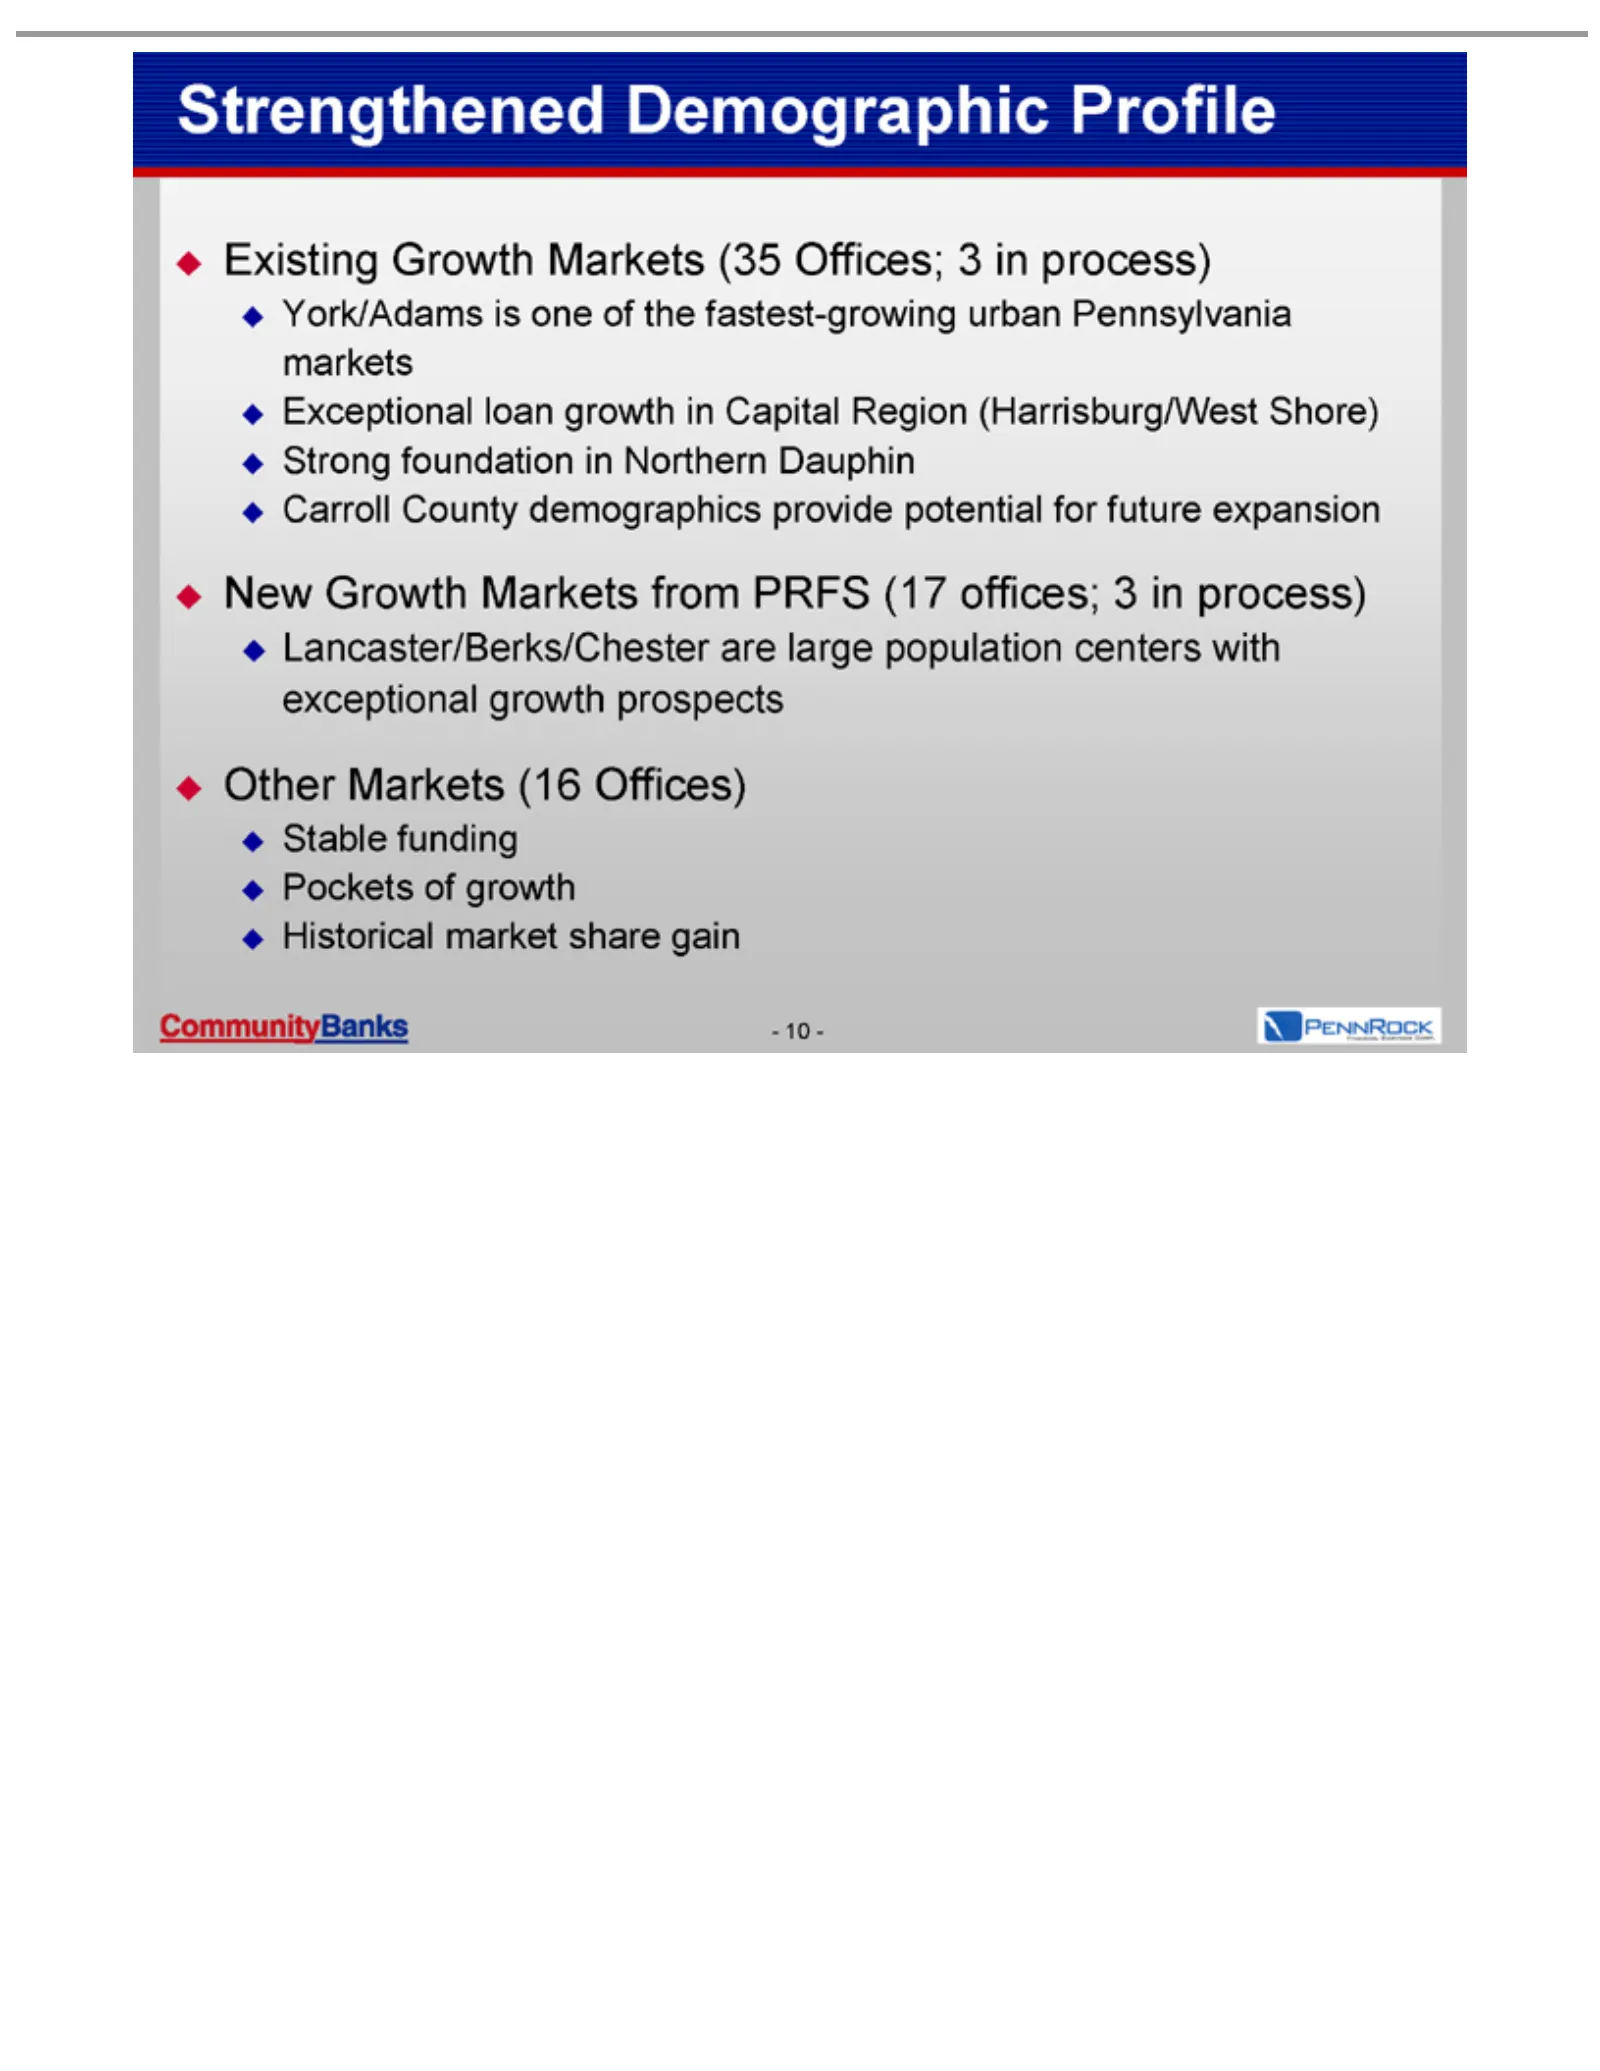
Slide 10: Strengthened markets and growth opportunities
Strengthened Existing York/Adams Exceptional Strong Carroll New Lancaster/Berks/Chester Other Stable Pockets -Historical 10 -Growth Markets funding foundation County of Growth market growth loan is Markets Demographic (16 one demographics Markets growth share in Offices) ofNorthern from the gain are
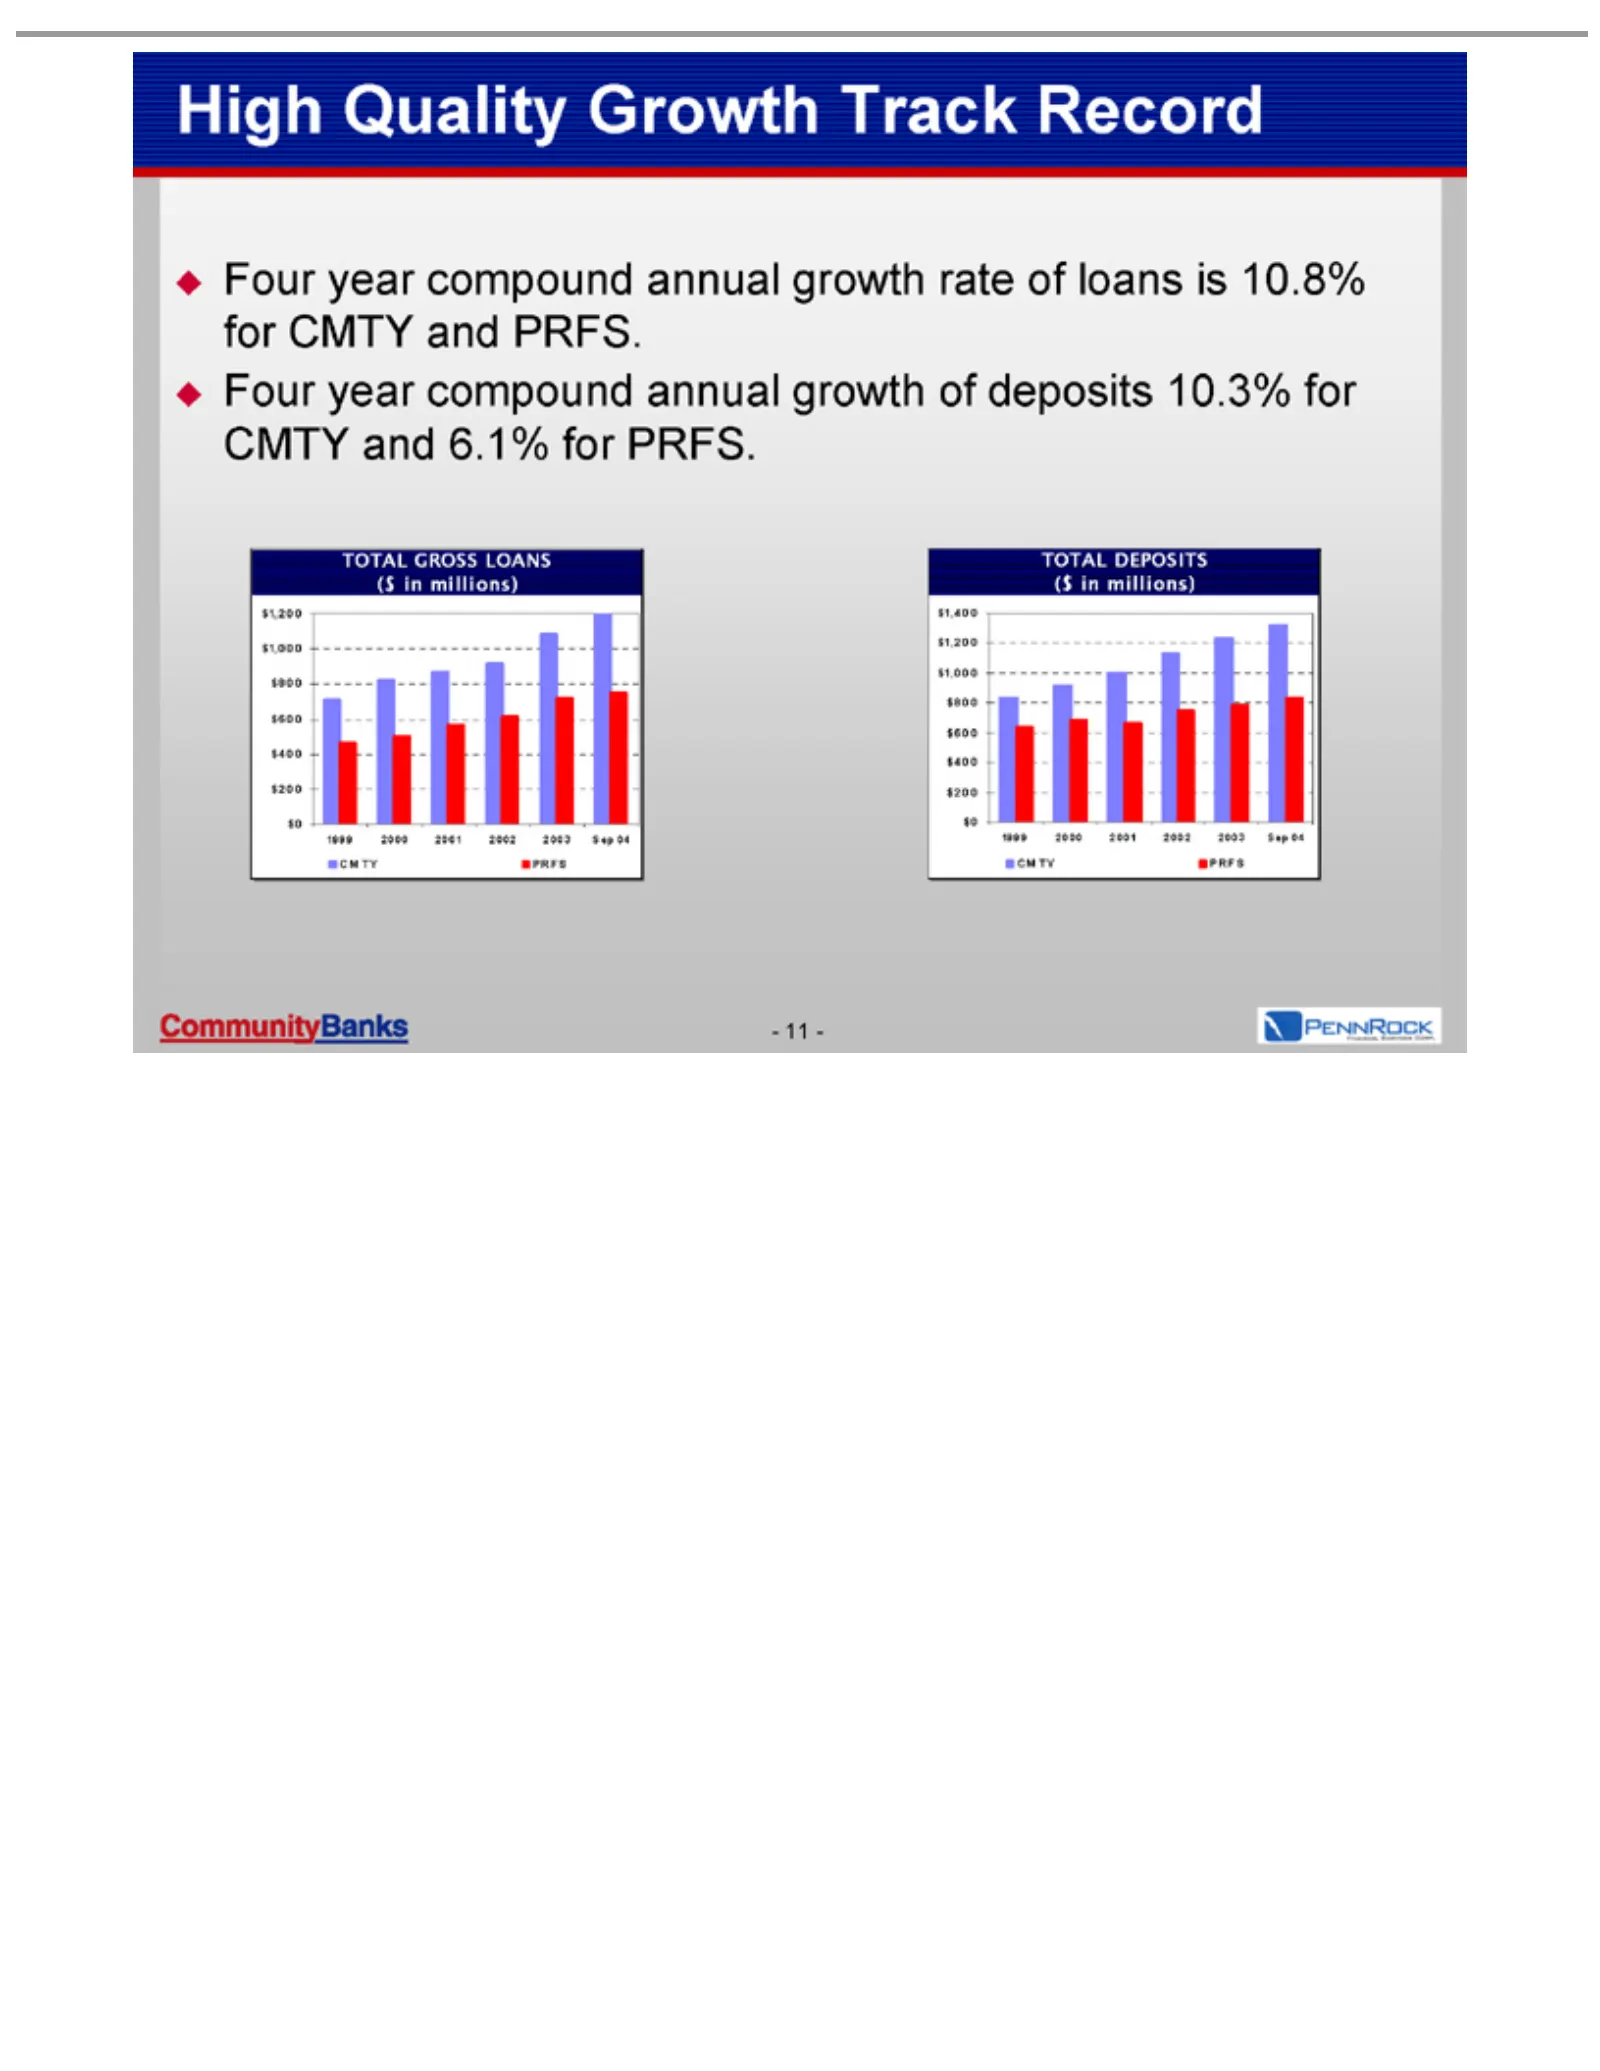
Slide 11: High Quality Growth Track Record
High Four Sep TOTAL PRFS CMTY -($ 2004 2003 2002 2001 2000 1999 $0 $200 $400 $600 $800 $1,000 $1,200 $1,400 11in04 -millions) year Quality GROSS DEPOSITS compound Growth LOANS annual Track Record growth of ratedeposits of loans10.3% is 10.8% for CMTY for CMTY and and 6.1%PRFS. for PRFS.
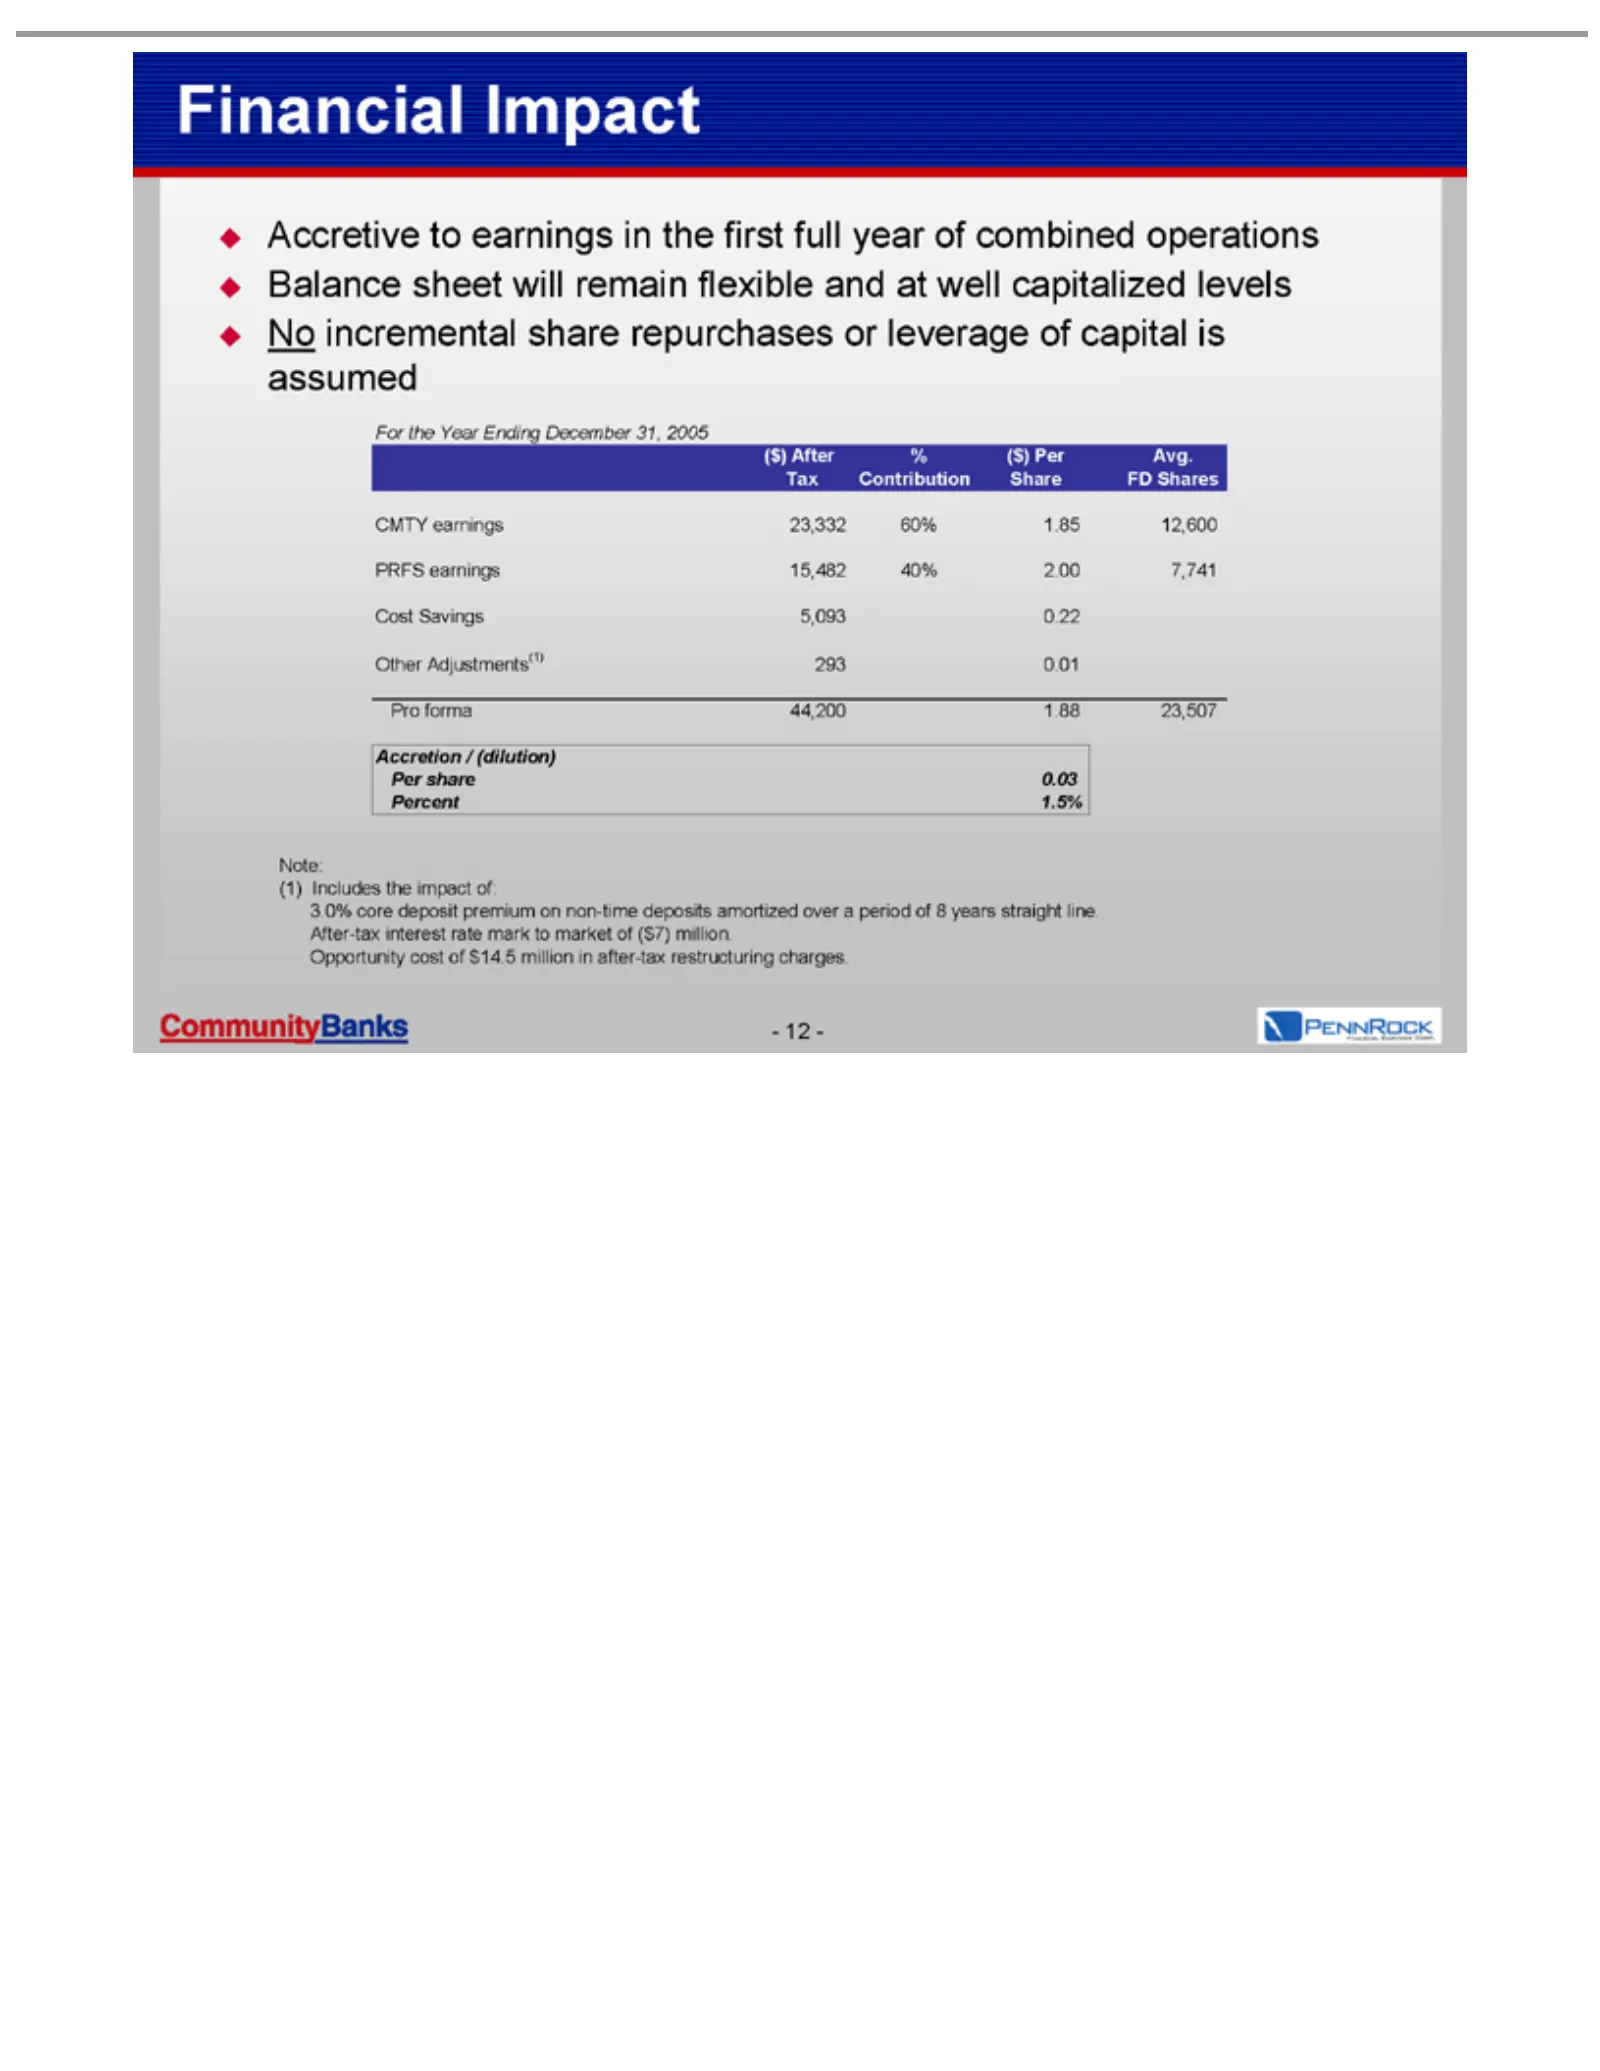
Slide 12: Financially Accretive Transaction
Financial Accretive Balance No For (($) % FD Share Contribution Tax Avg. CMTY PRFS 12,600 1.85 60% 23,332 Cost 7,741 2.00 40% 15,482 Other 0.22 5,093 Pro 0.01 293 (1) Accretion 23,507 1.88 44,200 Per Includes Note: 1.5% Percent 0.03 3.0% After-tax -Opportunity $) 12After Per incremental Shares share
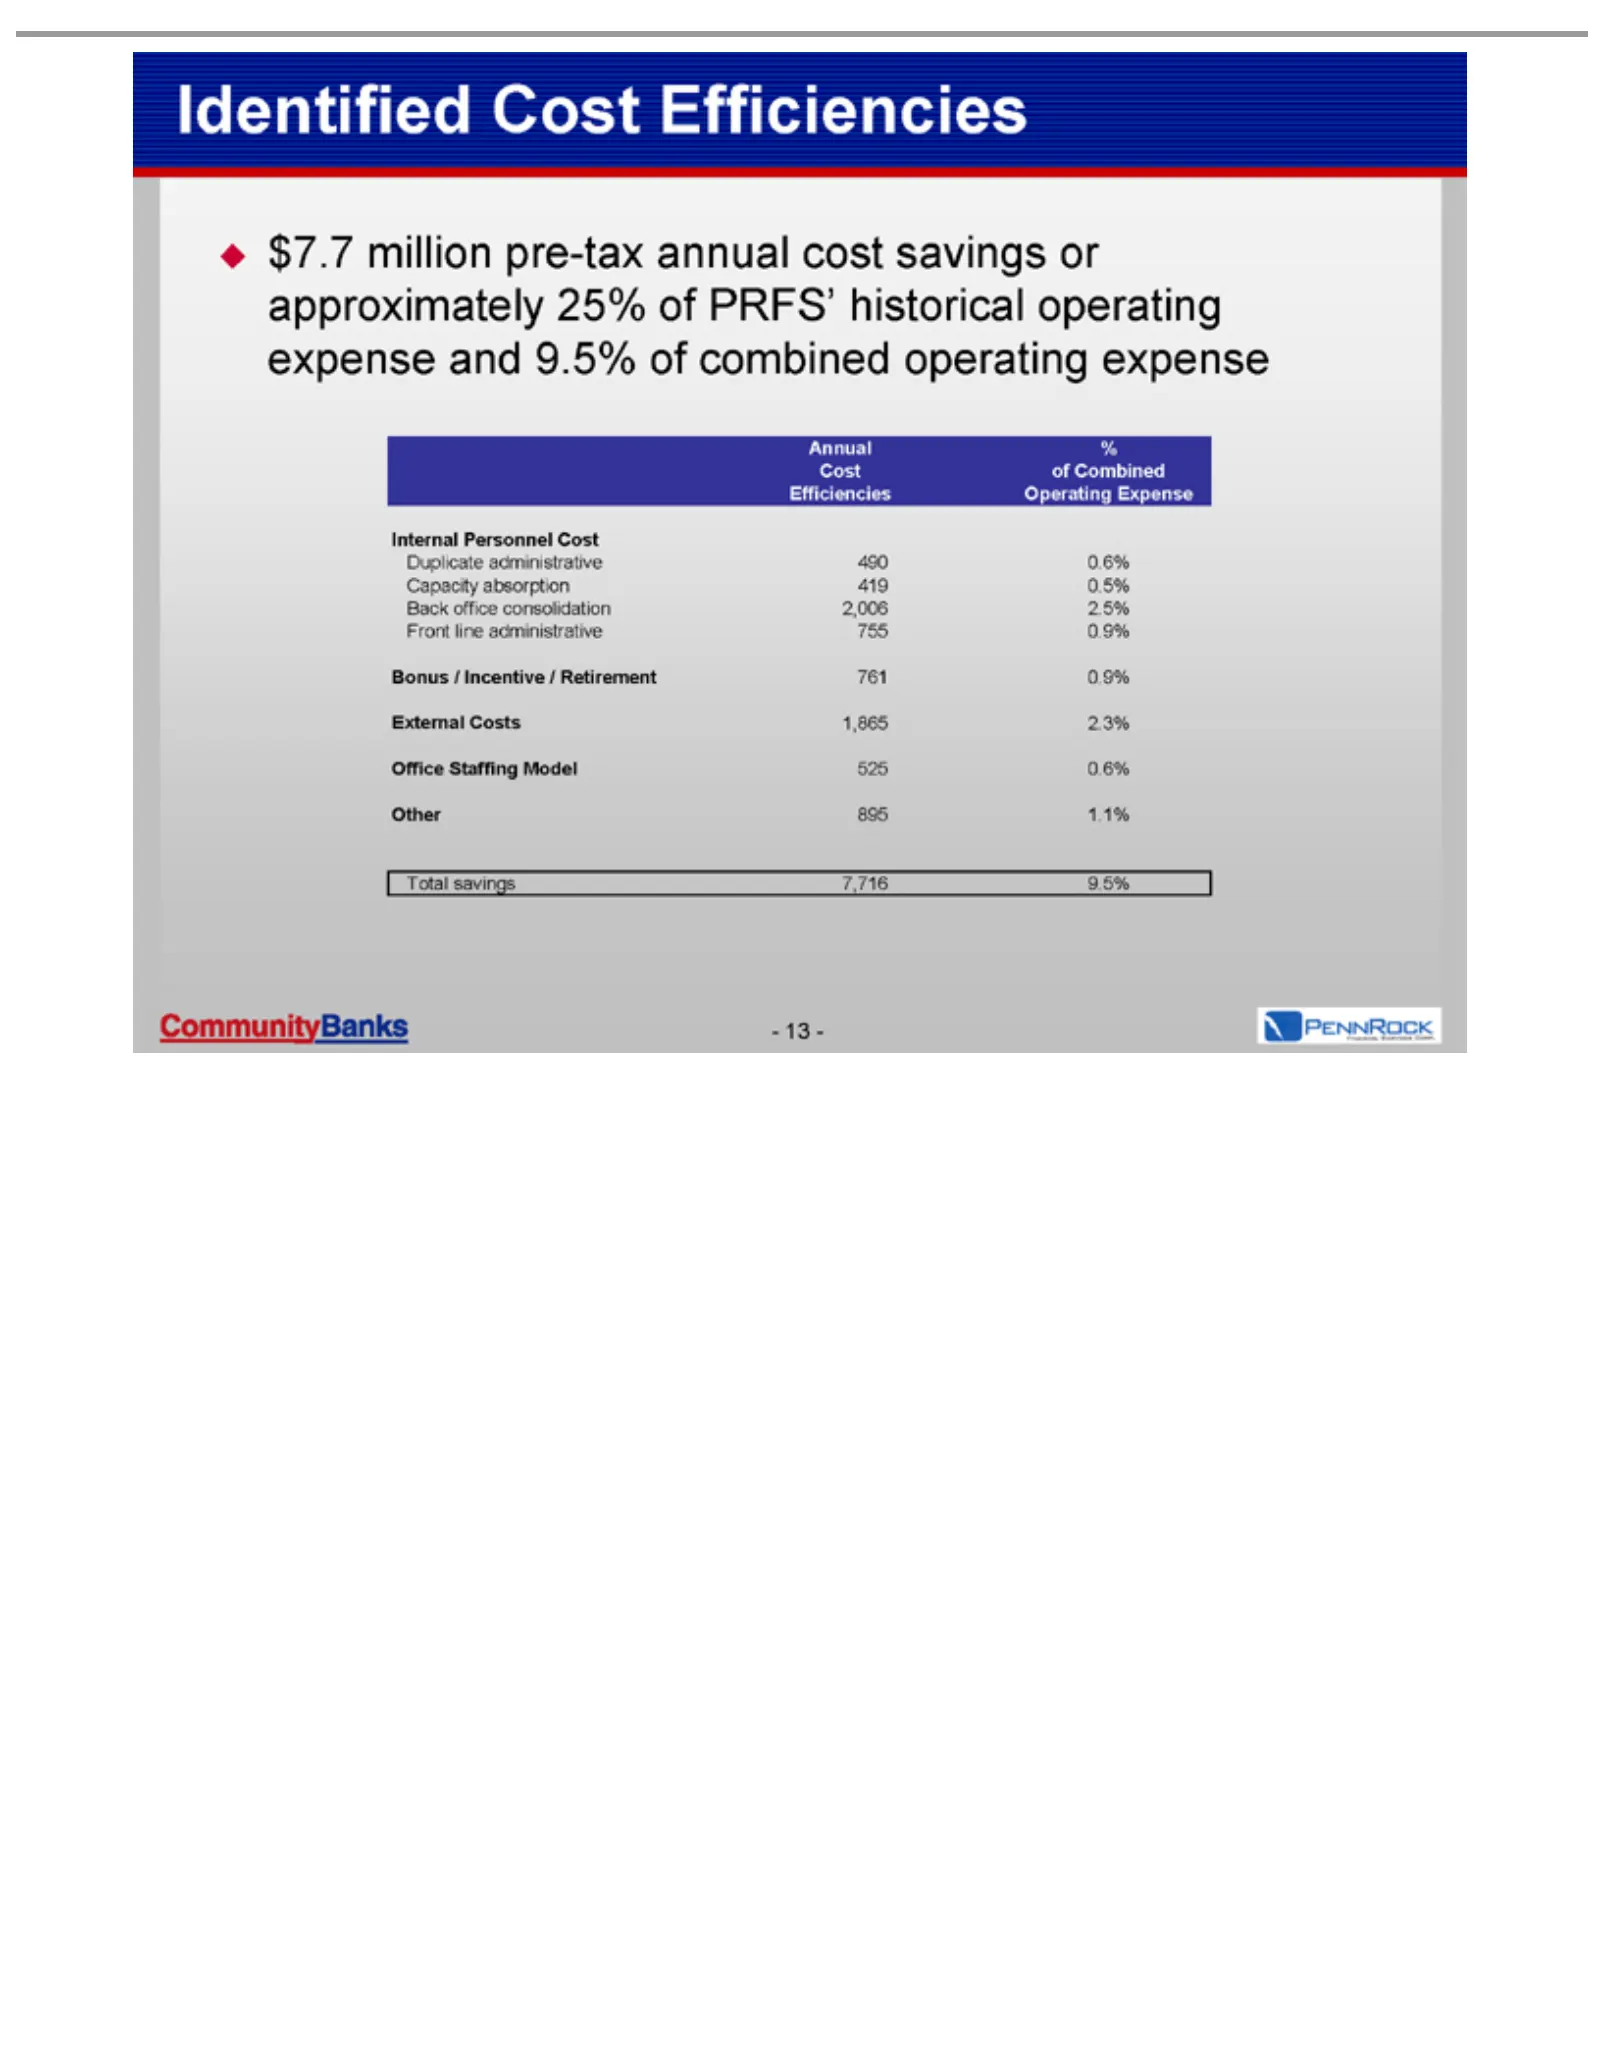
Slide 13: Identified Annual Operating Efficiencies
Identified $7.7 C % Annual of Operating Efficiencies Internal Duplicate Capacity 490 Back 0.5% 419 Front 2.5% 2,006 Bonus 755 External 0.9% 761 Office 2.3% 1,865 Total 1.1% 895 Other 0.6% -525 9.5% 7,716 13 ost Combined -million savings office line Staffing / Incentive Personnel Costs absorption Cos
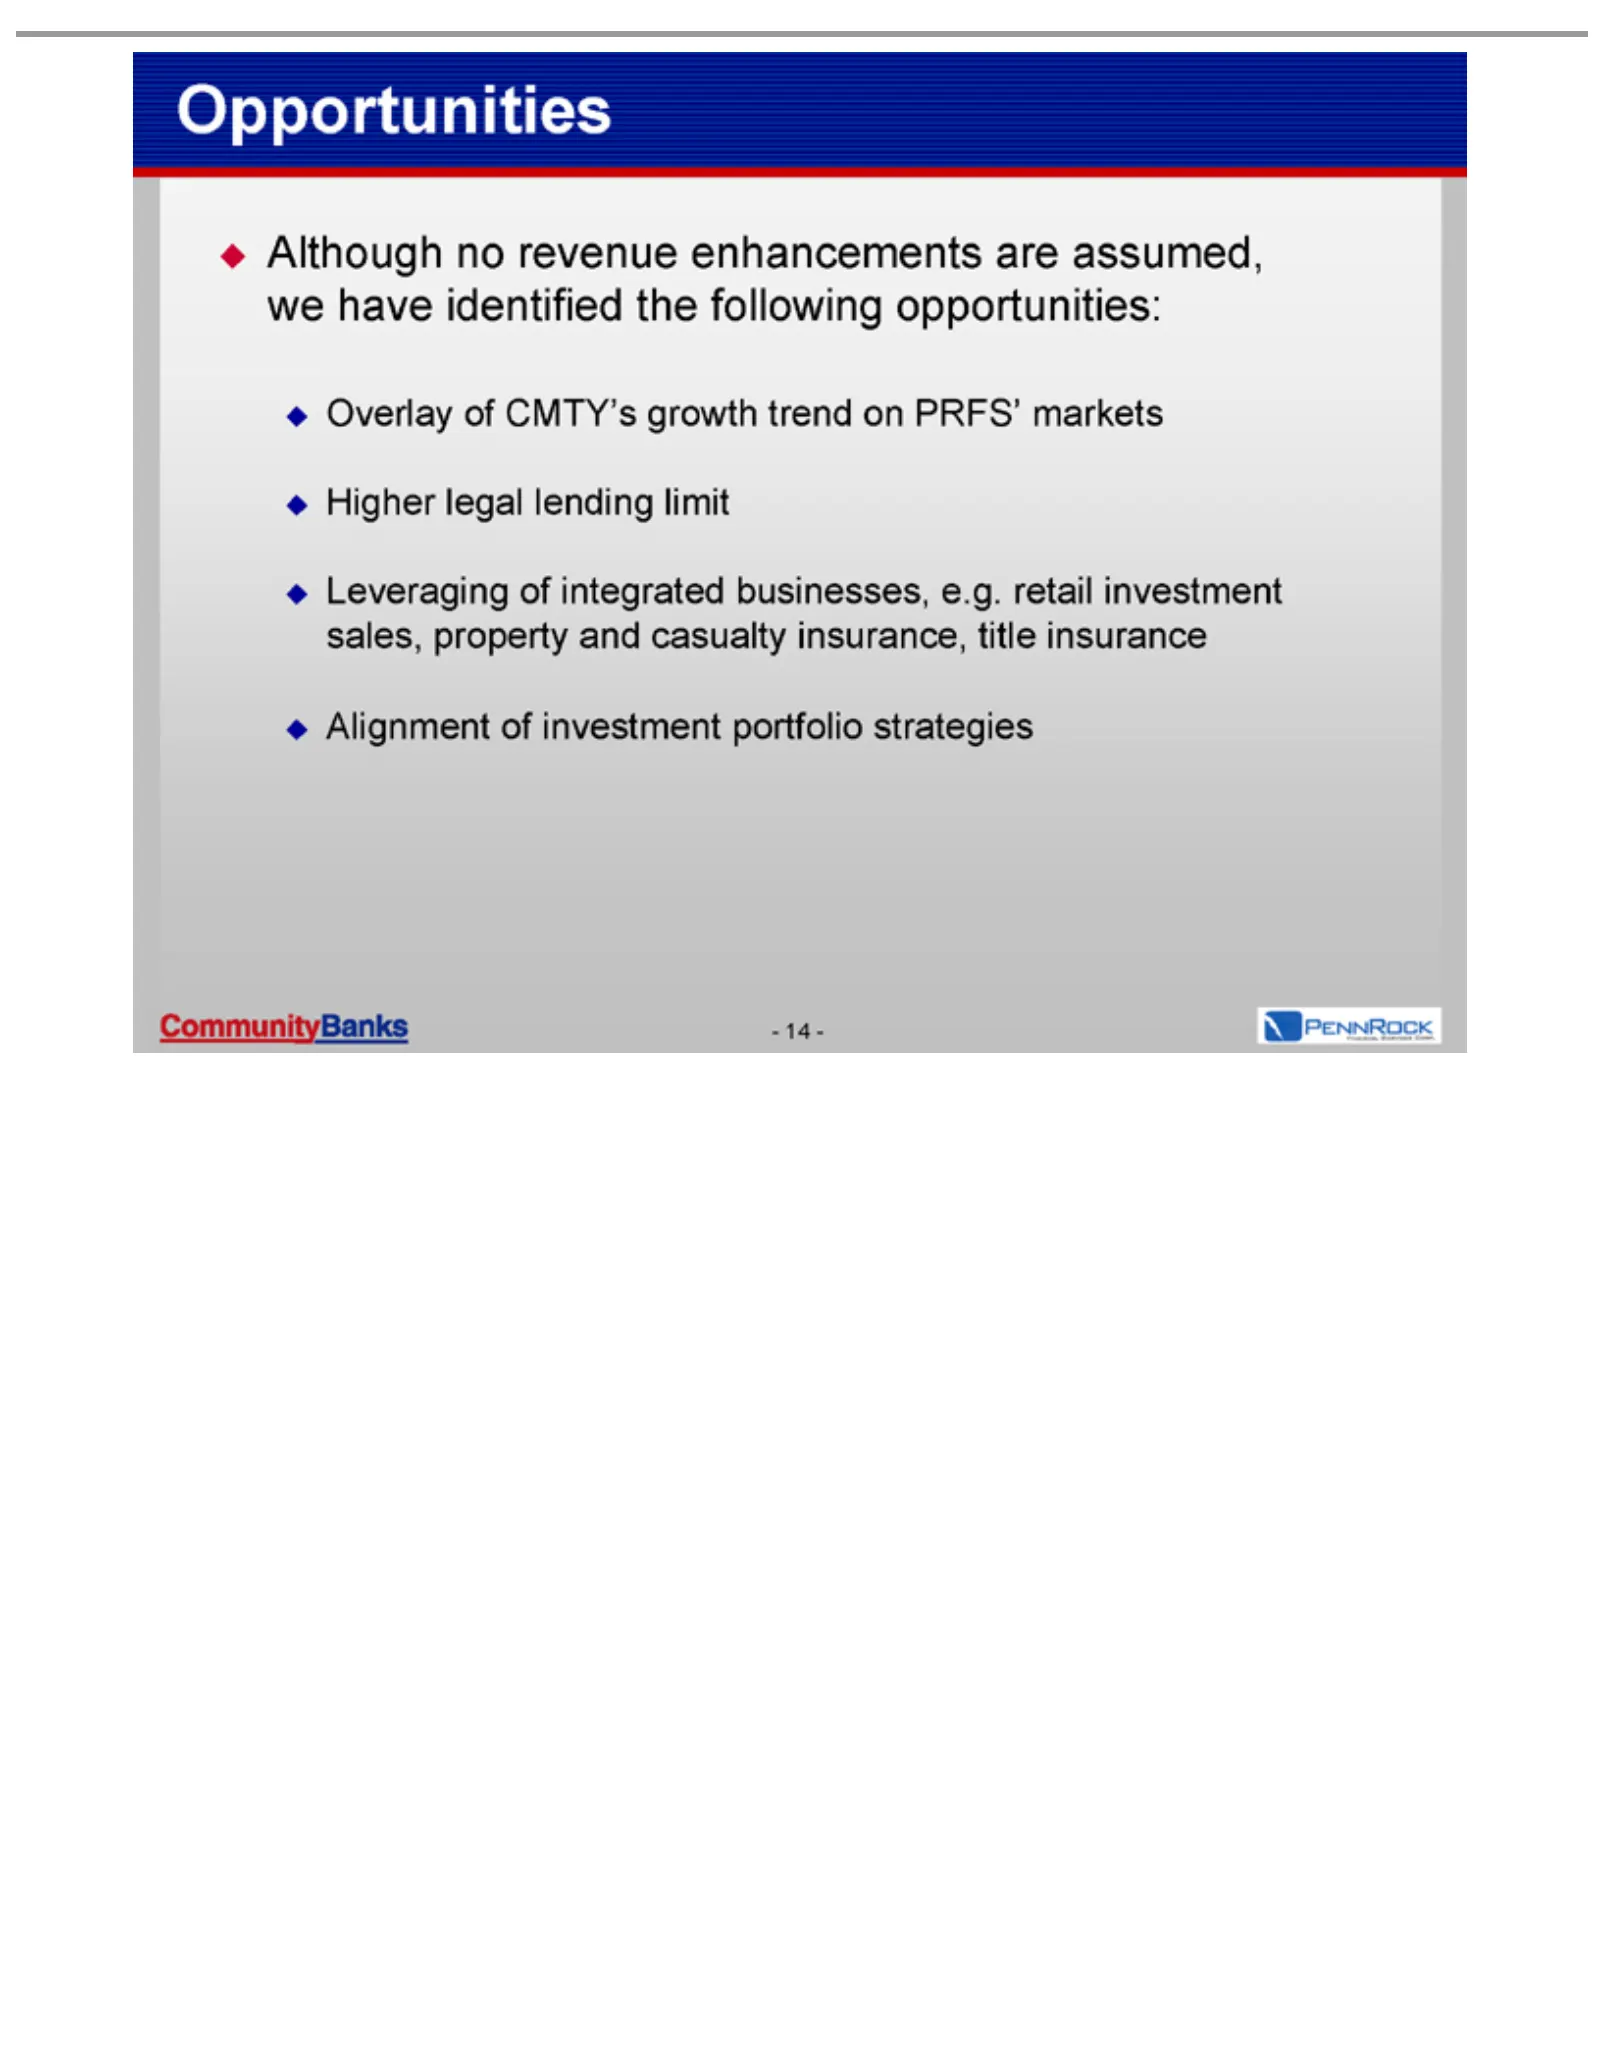
Slide 14: Revenue enhancement opportunities overlay
Although Opportunities Overlay Higher Leveraging -Alignment 14 - legal ofno of CMTY’s oflending revenue investment integrated growth limit enhancements businesses, portfolio trend on strategies are e.g. PRFS’ assumed, retail markets investment we have sales, identified property the following and cas
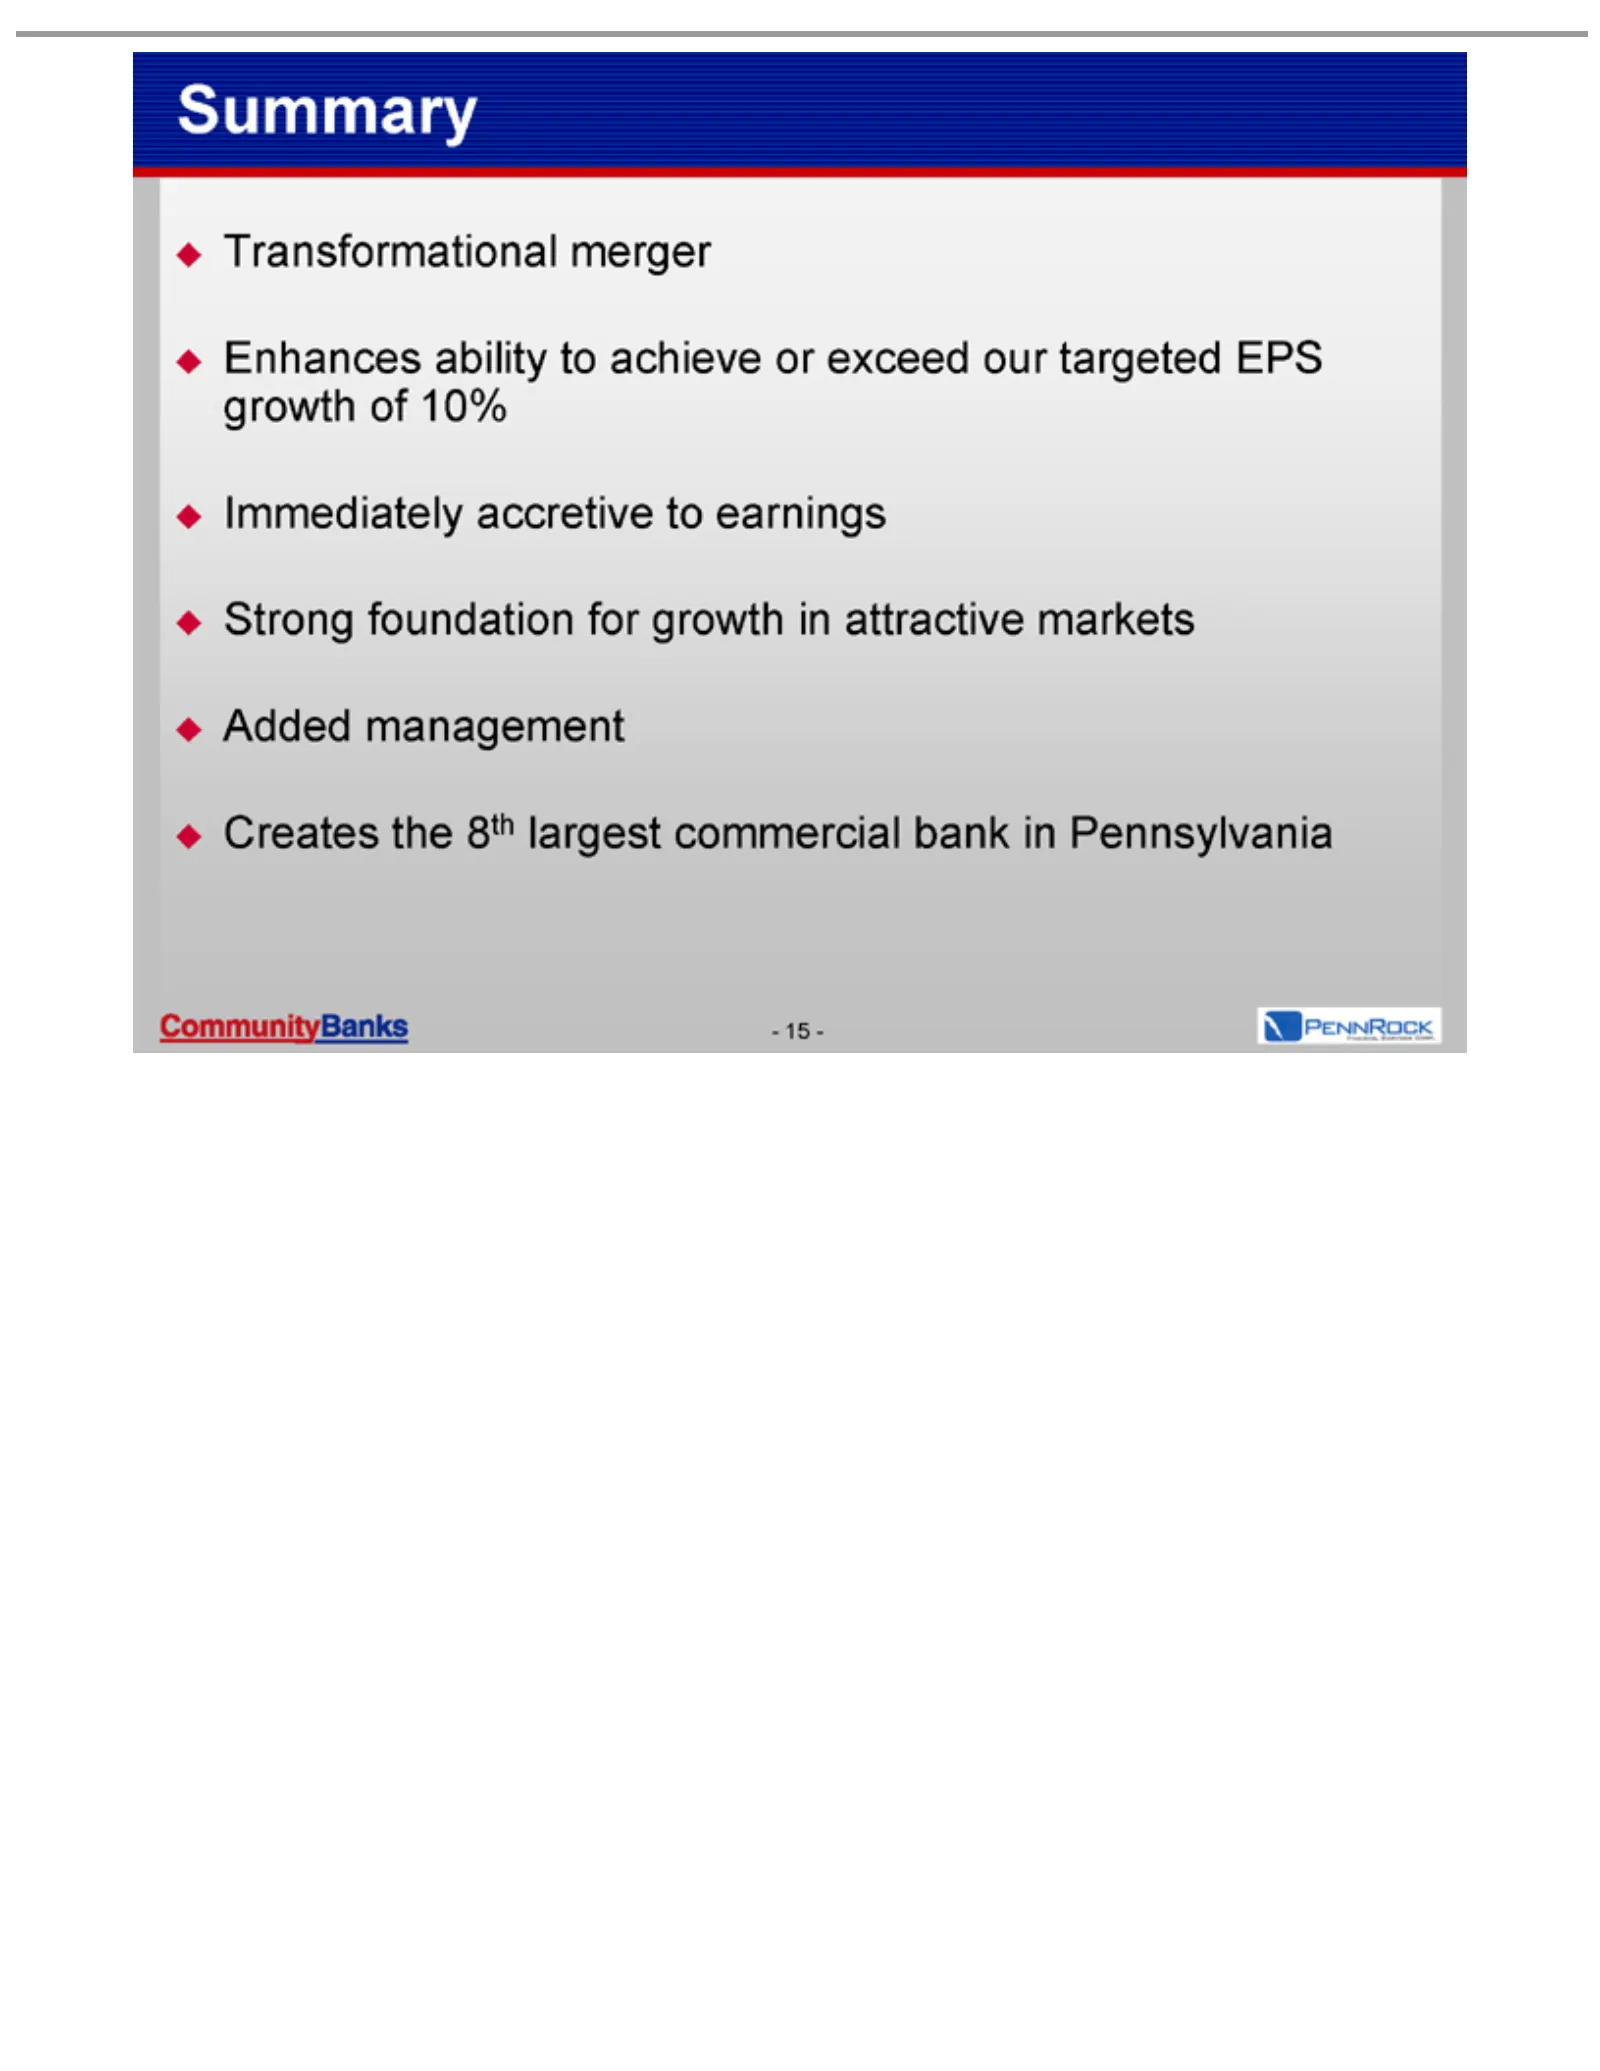
Slide 15: Transformational merger summary
Transformational Summary Enhances Immediately Strong Added -Creates 15 - management foundation theability 8th accretive largest to merger for achieve growth commercial to earnings orinexceed attractive bank ourintargeted markets Pennsylvania EPS growth of 10%
Source: SEC EDGAR · DEFA14A filed Nov 16, 2004
More decks from Community Banks Inc
 Community Banks — Merger or Acquisition (June 2007)23 slides · Jun 20, 2007
 Community Banks — Merger or Acquisition (May 2007)31 slides · May 1, 2007
 Ferris, Baker Watts Mid-Atlantic Bank Conference 200620 slides · Jul 27, 2006
 Shareholder Meeting (May 2006)45 slides · May 9, 2006
 Emerald Groundhog Day Investment Forum (February 2006)40 slides · Feb 2, 2006
 Mid-Atlantic SuperCommunity Bank Conference 200528 slides · Nov 8, 2005