Community Banks — Shareholder Meeting (May 2006)
45 slides from Community Banks's shareholder meeting presentation, May 9, 2006
Slide 1: President's Report: Fulfilling Our Commitments
President’s Report May 9, 2006 Fulfilling Our Commitments 1
Slide 2: Disclaimer
Disclaimer This presentation contains “forward looking” information, as defined by the Private Securities Litigation Reform Act of 1995, that is based on Community’s current expectations, estimates and projections about future events and financial trends affecting the financial condition of its busi
Slide 3: President's Report Agenda
President’s Report z Agenda “Fulfilling Our Commitments” The Blue Ball Merger: A Final Retrospective 2005 Performance: The Financial Story Q1-2006: An Update Stock Performance Setting the Stage for 2006 3
Slide 4: Fulfilling Our Commitments: Constituencies
Fulfilling Our Commitments z Constituencies Customers Employees The communities we serve Former PennRock shareholders Loyal, established CMTY shareholders The investment community-prospective investors 4
Slide 5: Commitments to Customers
Commitments to Customers z Avoid Alienating Customers Minimize disruption No Office Closings Preserve Customer Contact Personnel Maintain Product Integrity z Enhance Product Offerings – Best of both product lines z Remain Firmly Committed to our banking philosophy of 5
Slide 6: Commitments to Employees
Commitments to Employees z Merger-Related Minimize staff displacement Add staffing thru branch expansion z Prospective – “Employer of Choice” Establish recruiting department Additional training staff & new training facility Medical benefits for part-time staff Incentive compensation 6
Slide 7: Commitments to Our Communities
Commitments to Our Communities z Maintain a strong local presence in the communities we serve Over $500,000 in community-based contributions $225,000 to local educational institutions thru PA Tax Credit Programs z Established CommunityBanks Foundation for future giving z Community involvement of
Slide 8: Financial Commitments
Financial Commitments Promises Made, Promises Kept z Merger accretive to earnings in the first full year of operations z Position the balance sheet for flexibility in dealing with interest rate changes z Maintain “well-capitalized” status in post-merger timeframe z Achieve efficiencies thru $7.7 mil
Slide 9: Operational Commitments
Operational Commitments z Core operating system conversion to Jack Henry- Silverlake (Old CMTY) z Merger of core operating systems to one platform (New CMTY / Old PRFS) z Transfer of core processing & deposit processing to Blue Ball location. Loans operations and Call Center to Hanover. z Integratio
Slide 10: President's Report Agenda
President’s Report z Agenda “Fulfilling Our Commitments” The Blue Ball Merger: A Final Retrospective 2005 Performance: The Financial Story Q1-2006: An Update Stock Performance Setting the Stage for 2006 10
Slide 11: Blue Ball Retrospective Chronology
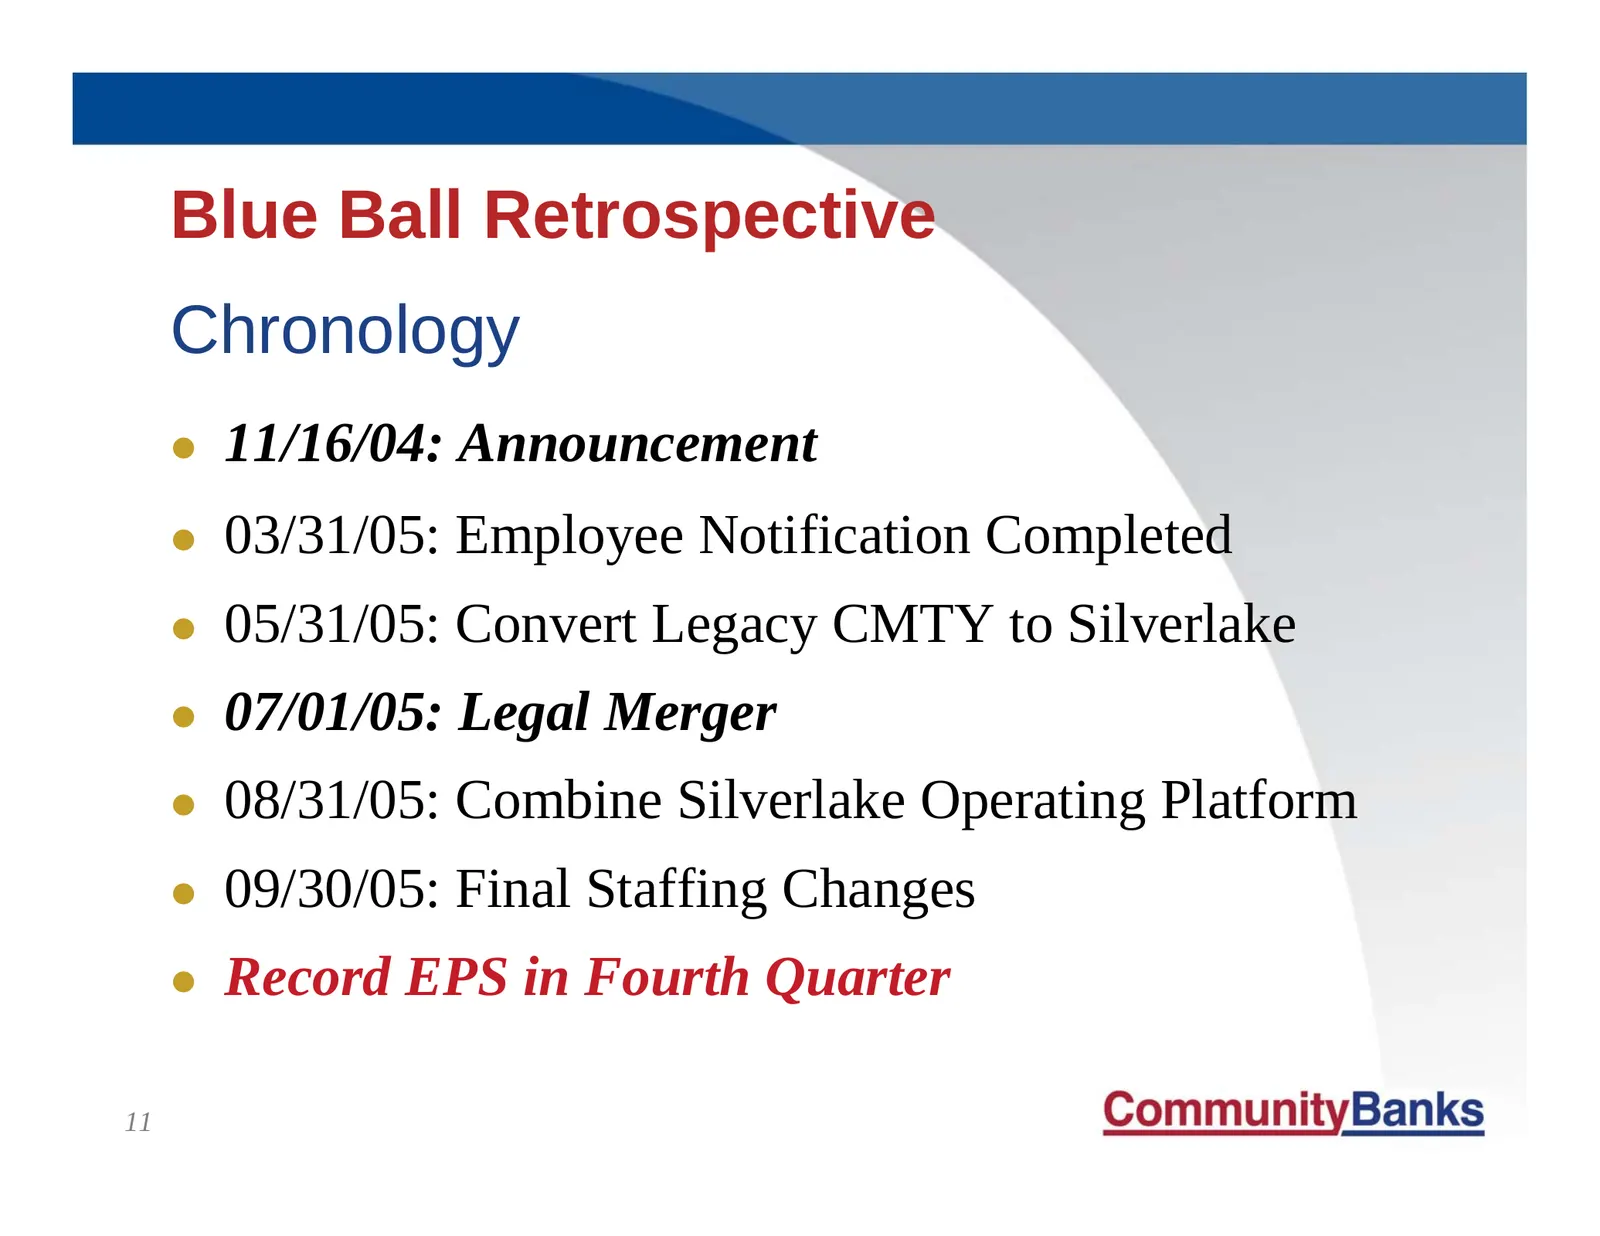
Blue Ball Retrospective Chronology z 11/16/04: Announcement z 03/31/05: Employee Notification Completed z 05/31/05: Convert Legacy CMTY to Silverlake z 07/01/05: Legal Merger z 08/31/05: Combine Silverlake Operating Platform z 09/30/05: Final Staffing Changes z Record EPS in Fourth Quarter 11
Slide 12: Blue Ball Retrospective: Merger & Conversion Expenses
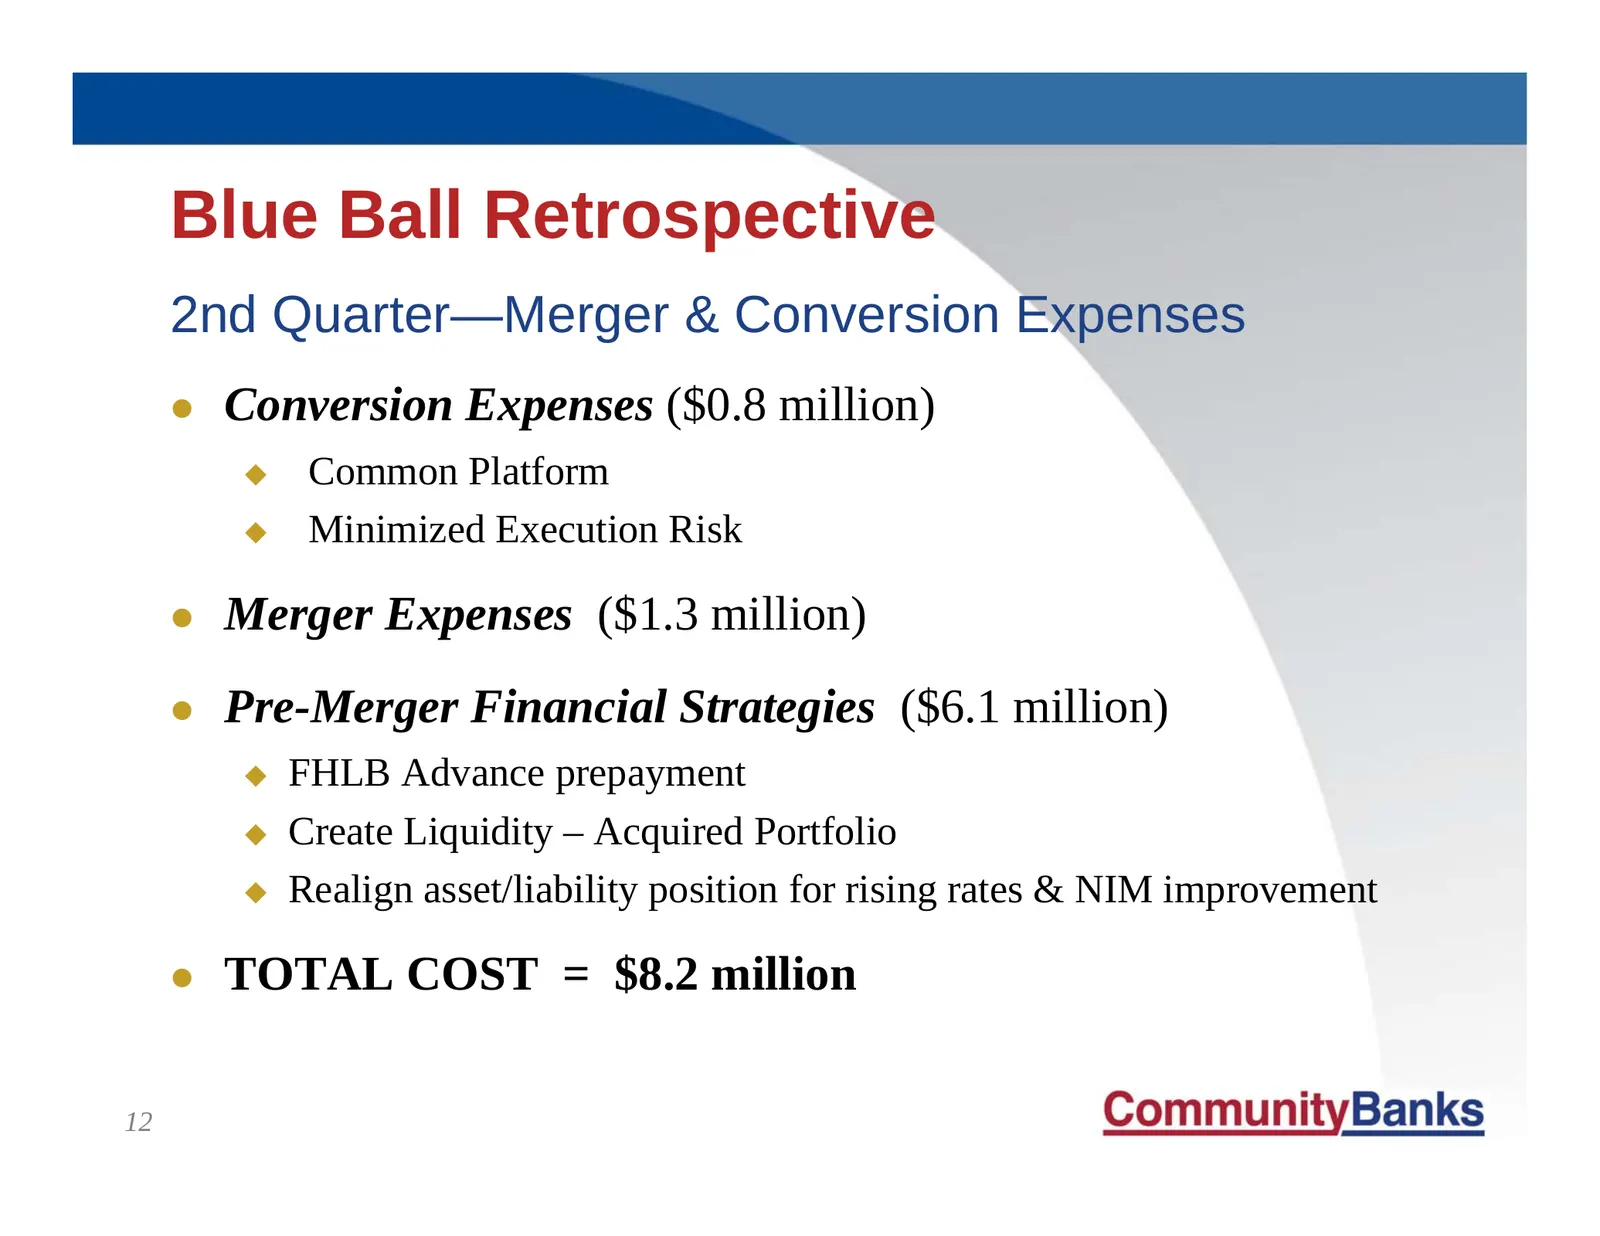
Blue Ball Retrospective 2nd Quarter—Merger & Conversion Expenses z Conversion Expenses ($0.8 million) Common Platform Minimized Execution Risk z Merger Expenses ($1.3 million) z Pre-Merger Financial Strategies ($6.1 million) FHLB Advance prepayment Create Liquidity – Acquired Portfolio Rea
Slide 13: Blue Ball Retrospective: Summary of Accomplishments
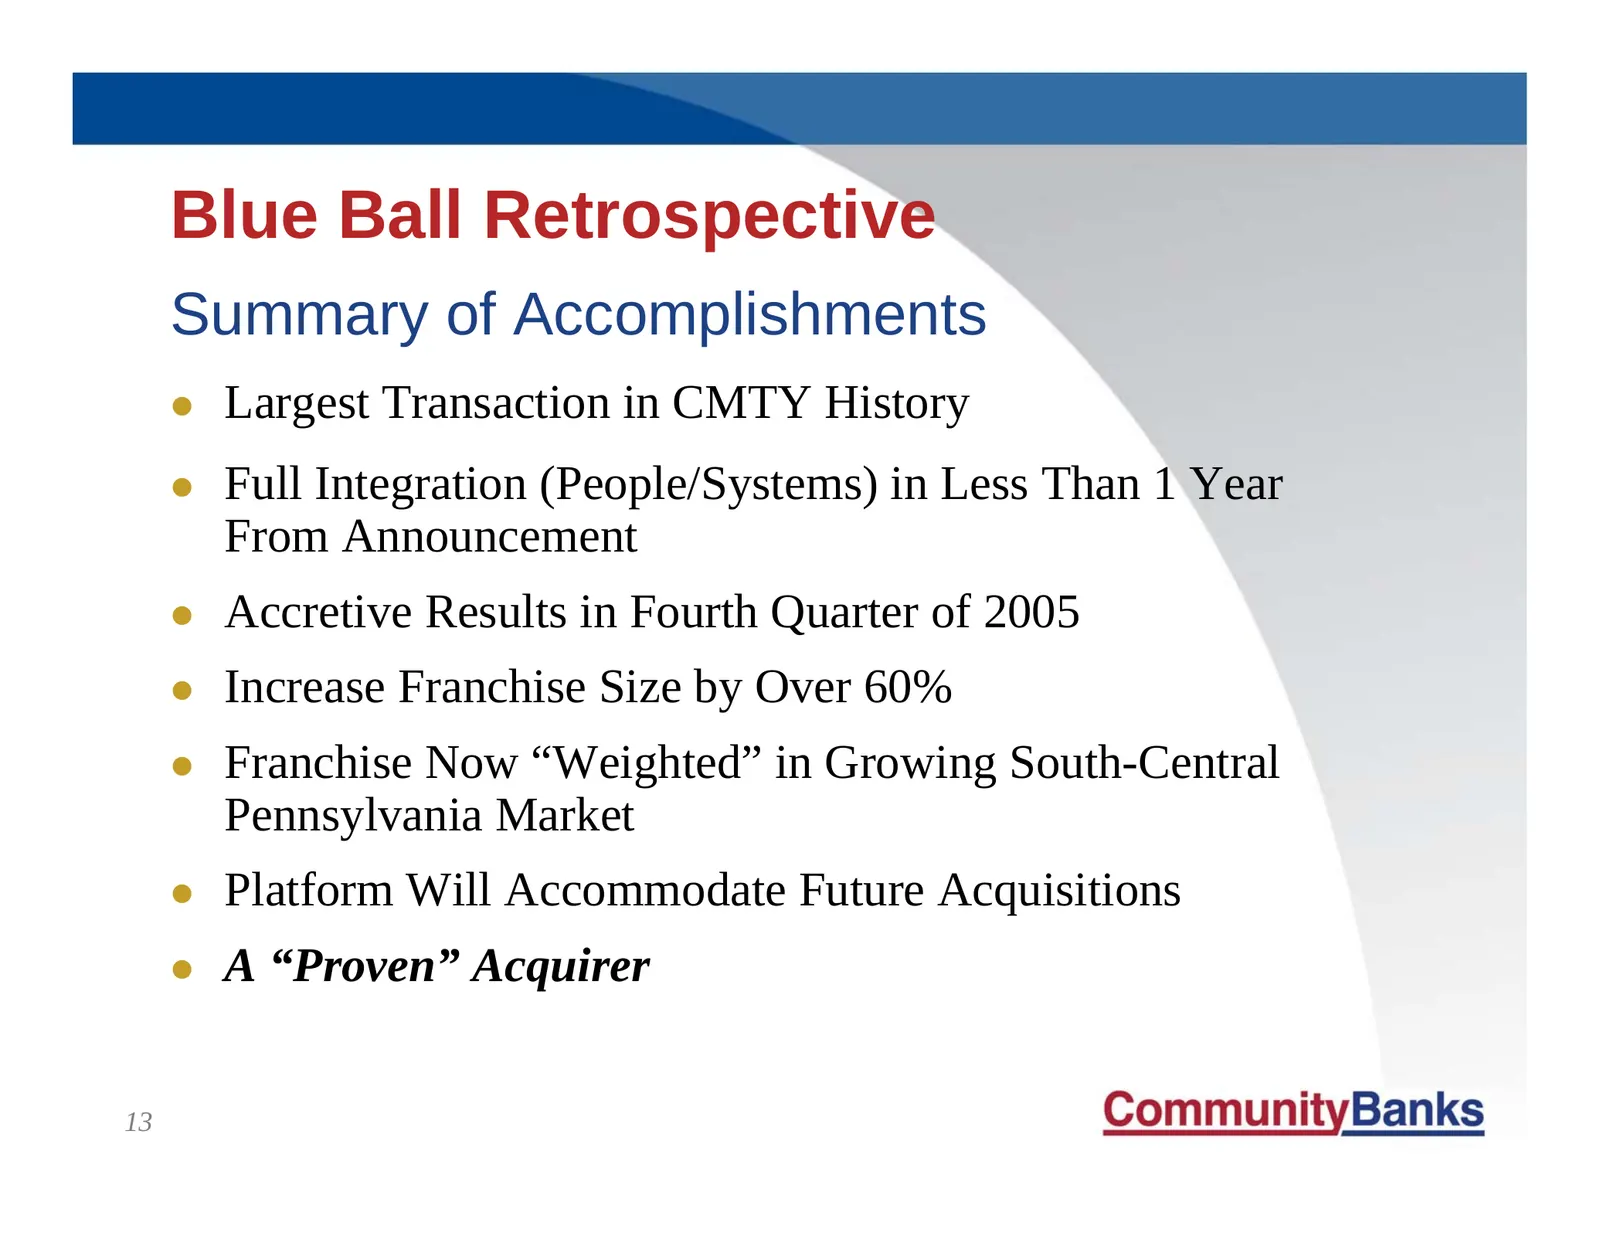
Blue Ball Retrospective Summary of Accomplishments z Largest Transaction in CMTY History z Full Integration (People/Systems) in Less Than 1 Year From Announcement z Accretive Results in Fourth Quarter of 2005 z Increase Franchise Size by Over 60% z Franchise Now “Weighted” in Growing South-Central P
Slide 14: President's Report Agenda
President’s Report z Agenda “Fulfilling Our Commitments” The Blue Ball Merger: A Final Retrospective 2005 Performance: The Financial Story Q1-2006: An Update Stock Performance Setting the Stage for 2006 14
Slide 15: Performance Goals
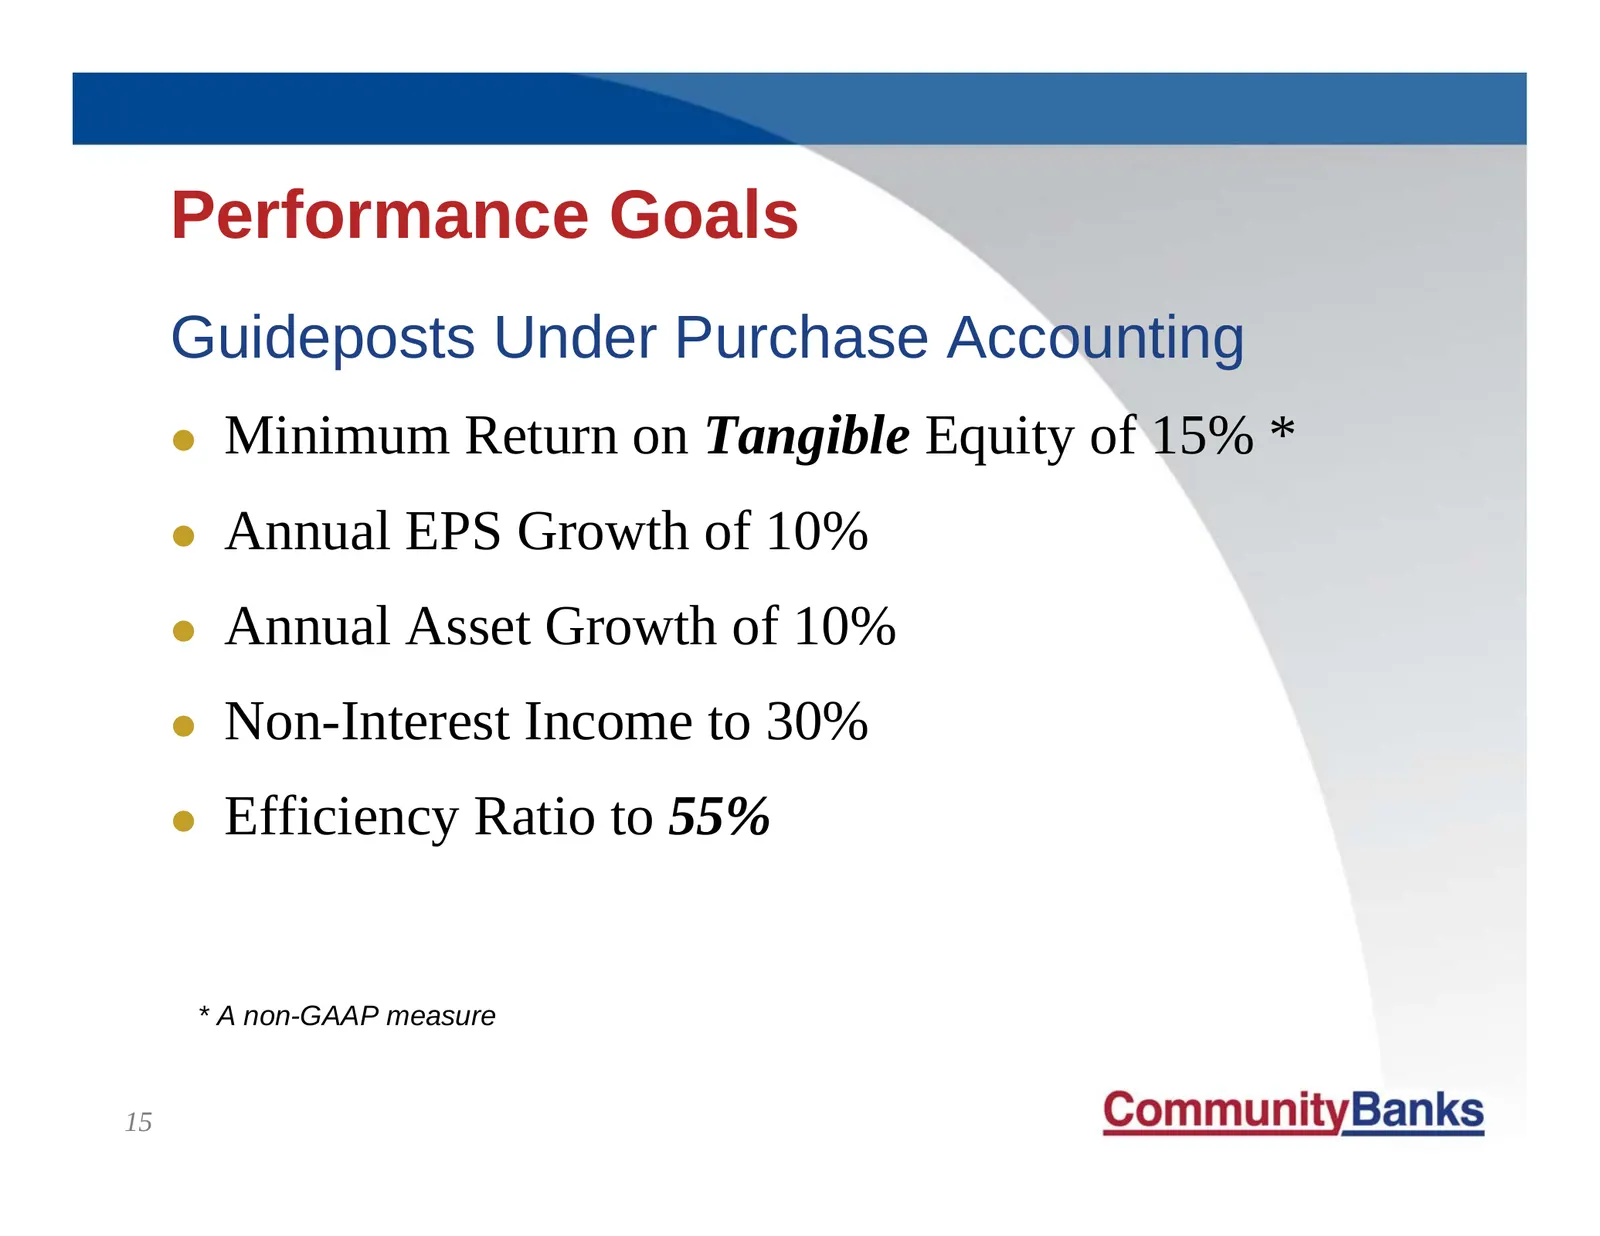
Performance Goals Guideposts Under Purchase Accounting z Minimum Return on Tangible Equity of 15% * z Annual EPS Growth of 10% z Annual Asset Growth of 10% z Non-Interest Income to 30% z Efficiency Ratio to 55% * A non-GAAP measure 15
Slide 16: 2005 vs. 2004 Performance
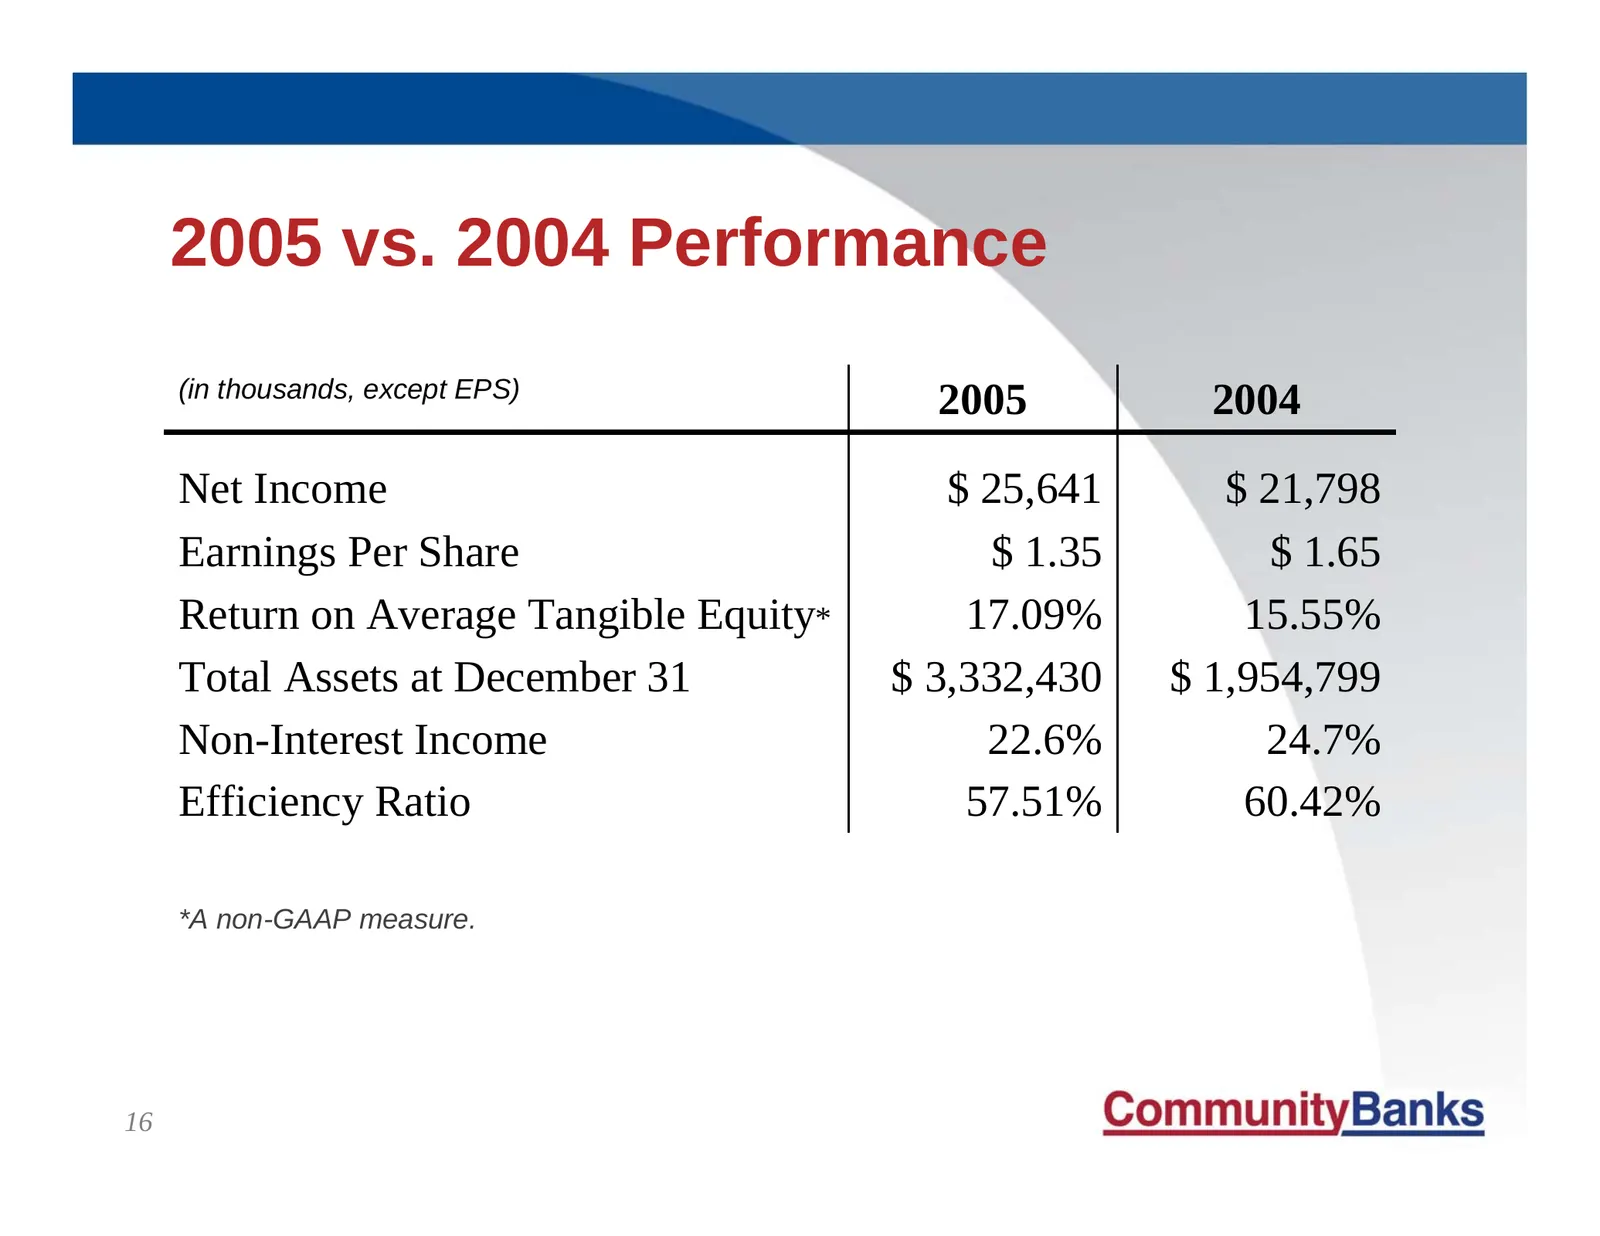
2005 vs. 2004 Performance (in thousands, except EPS) 2005 2004 Net Income $ 25,641 $ 21,798 Earnings Per Share $ 1.35 $ 1.65 Return on Average Tangible Equity* 17.09% 15.55% Total Assets at December 31 $ 3,332,430 $ 1,954,799 Non-Interest Income 22.6% 24.7% Efficiency Ratio 57.51% 60.42% *A non-GAAP
Slide 17: Mid-Year Transaction
Mid-Year Transaction Purchase Accounting Complexities z Pre-Merger Results (Q1,Q2)—Excludes Blue Ball operations z Post-Merger Results (Q3, Q4)—Reflects combined operations and provides “barometer” of success z Full Year Results are a hybrid z Historical Results (pre-7/1/05) are not restated 17
Slide 18: Pre-Merger CMTY
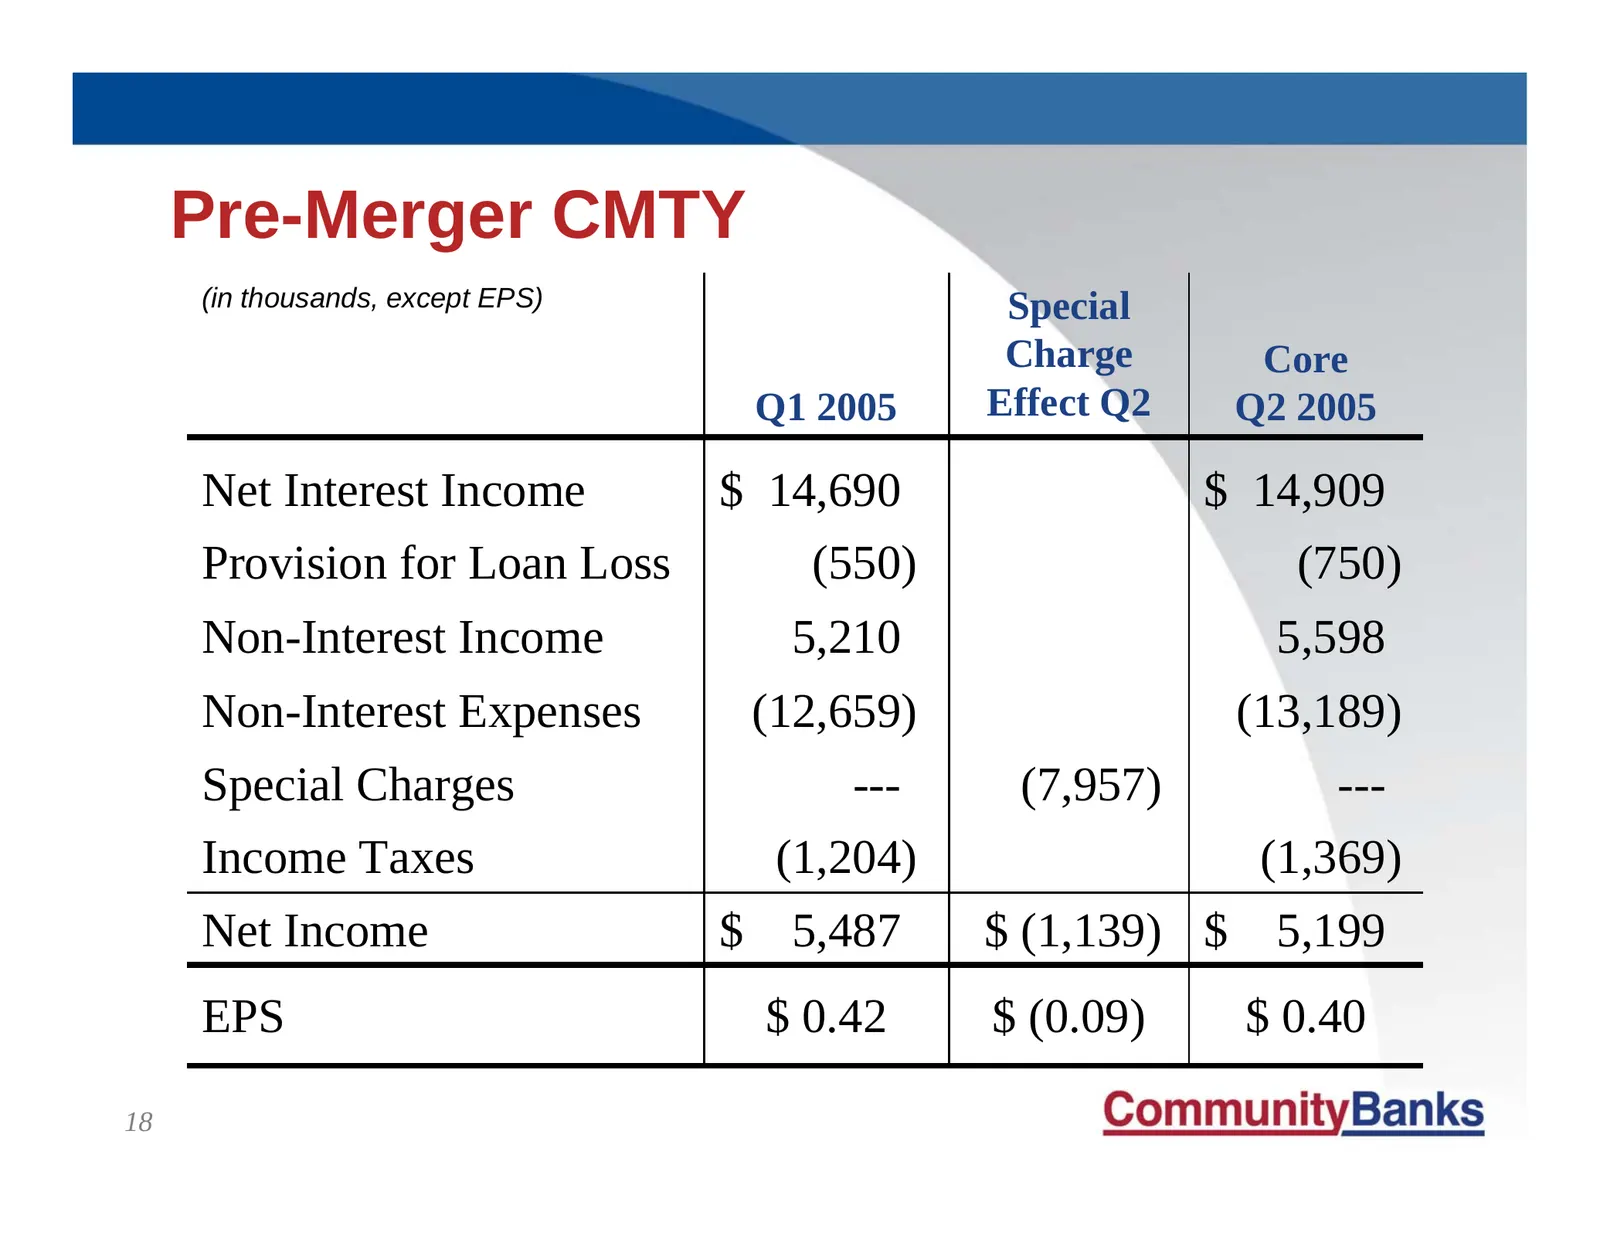
Pre-Merger CMTY (in thousands, except EPS) Special Charge Core Q1 2005 Effect Q2 Q2 2005 Net Interest Income $ 14,690 $ 14,909 Provision for Loan Loss (550) (750) Non-Interest Income 5,210 5,598 Non-Interest Expenses (12,659) (13,189) Special Charges --- (7,957) --- Income Taxes (1,204) (1,369) Net
Slide 19: Post Merger CMTY
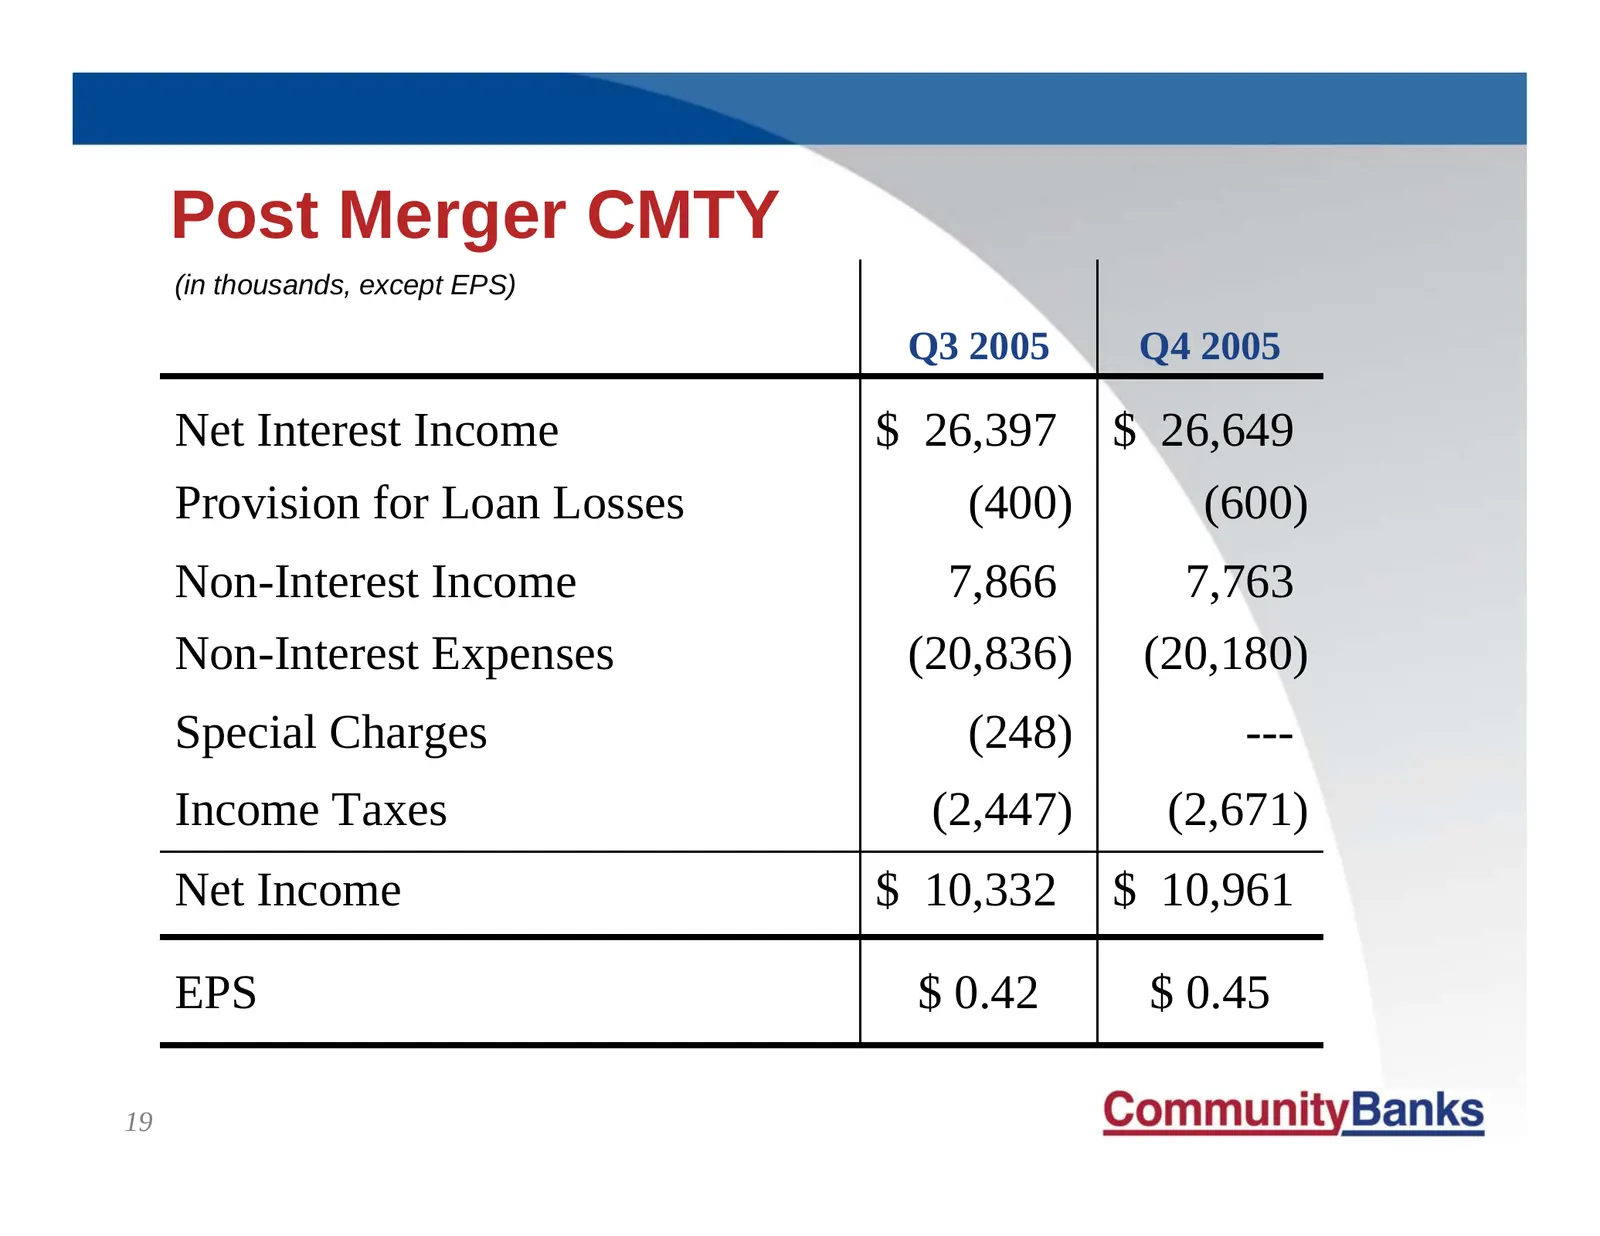
Post Merger CMTY (in thousands, except EPS) Q3 2005 Q4 2005 Net Interest Income $ 26,397 $ 26,649 Provision for Loan Losses (400) (600) Non-Interest Income 7,866 7,763 Non-Interest Expenses (20,836) (20,180) Special Charges (248) --- Income Taxes (2,447) (2,671) Net Income $ 10,332 $ 10,961 EPS $ 0.
Slide 20: Four Components of Performance
Four Components of Performance z Net Interest Income z Provision for Loan Losses z Non-Interest Income z Non-Interest Expenses 20
Slide 21: Net Interest Margin
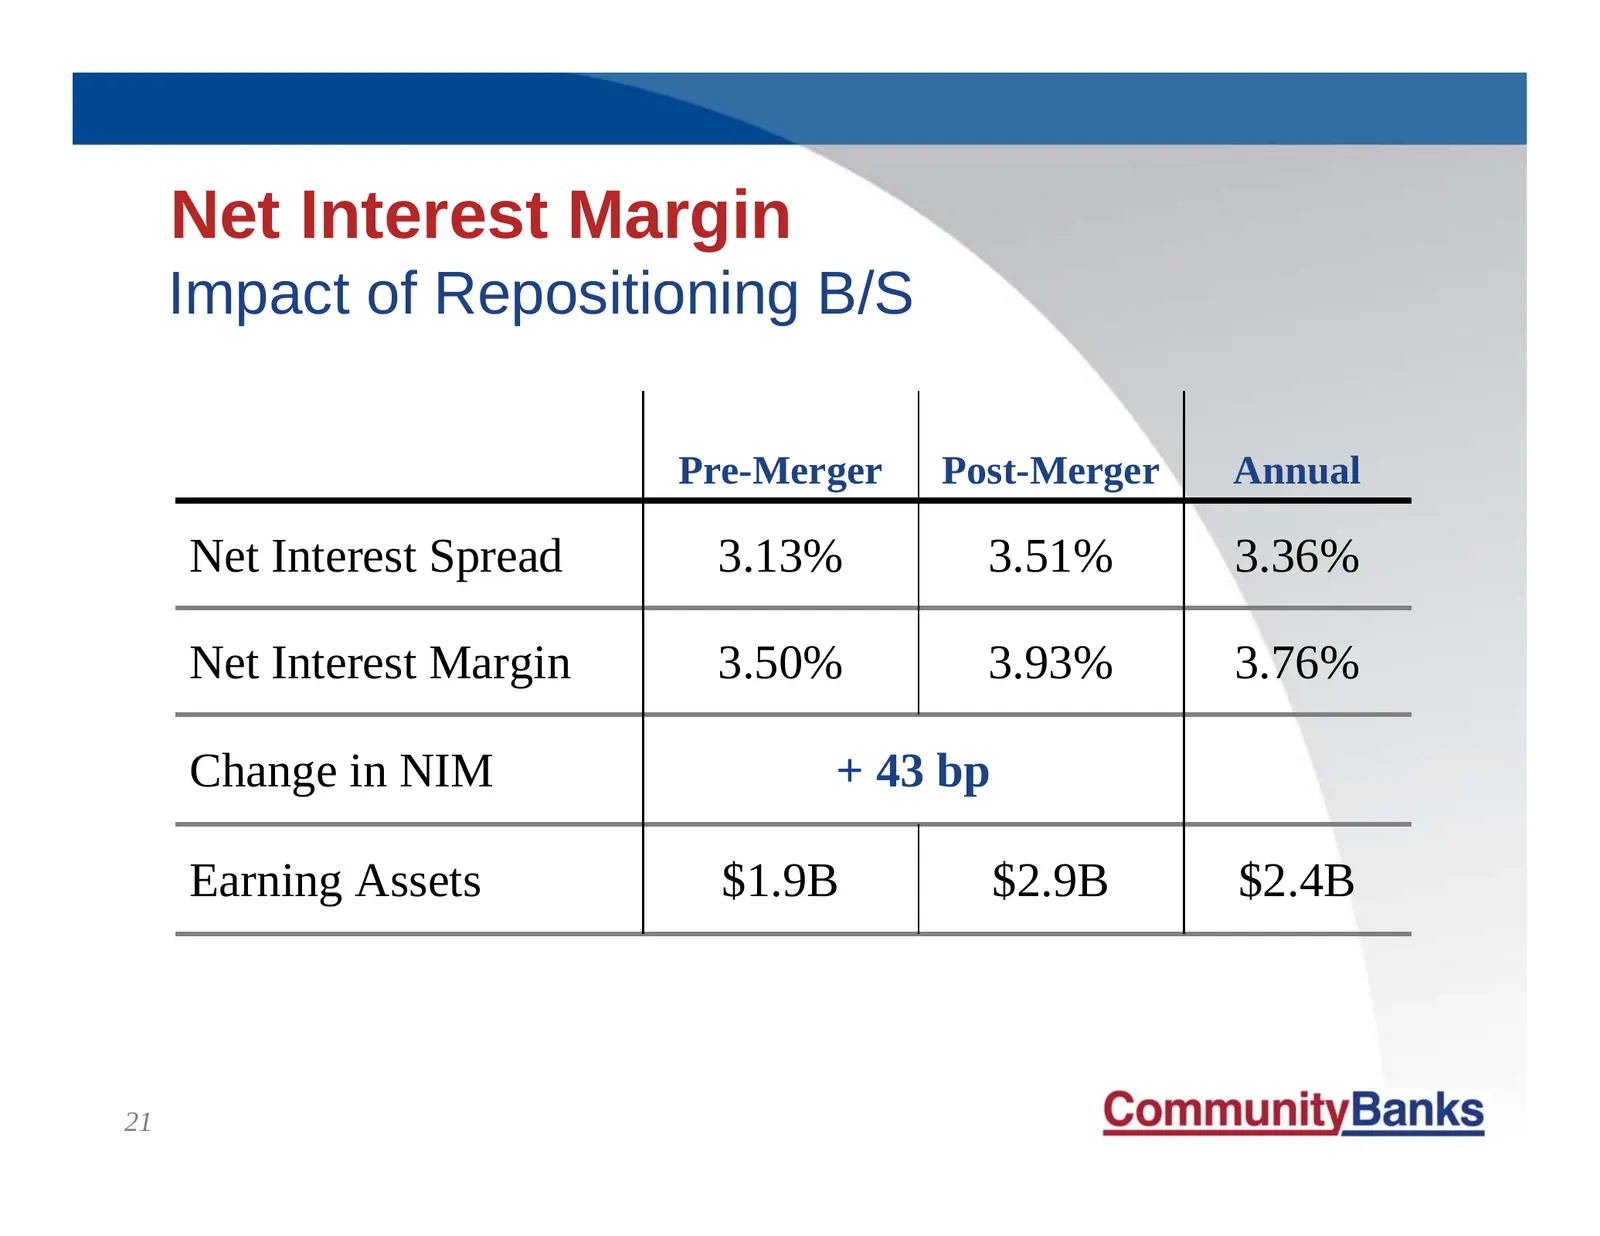
Net Interest Margin Impact of Repositioning B/S Pre-Merger Post-Merger Annual Net Interest Spread 3.13% 3.51% 3.36% Net Interest Margin 3.50% 3.93% 3.76% Change in NIM + 43 bp Earning Assets $1.9B $2.9B $2.4B 21
Slide 22: Credit Quality
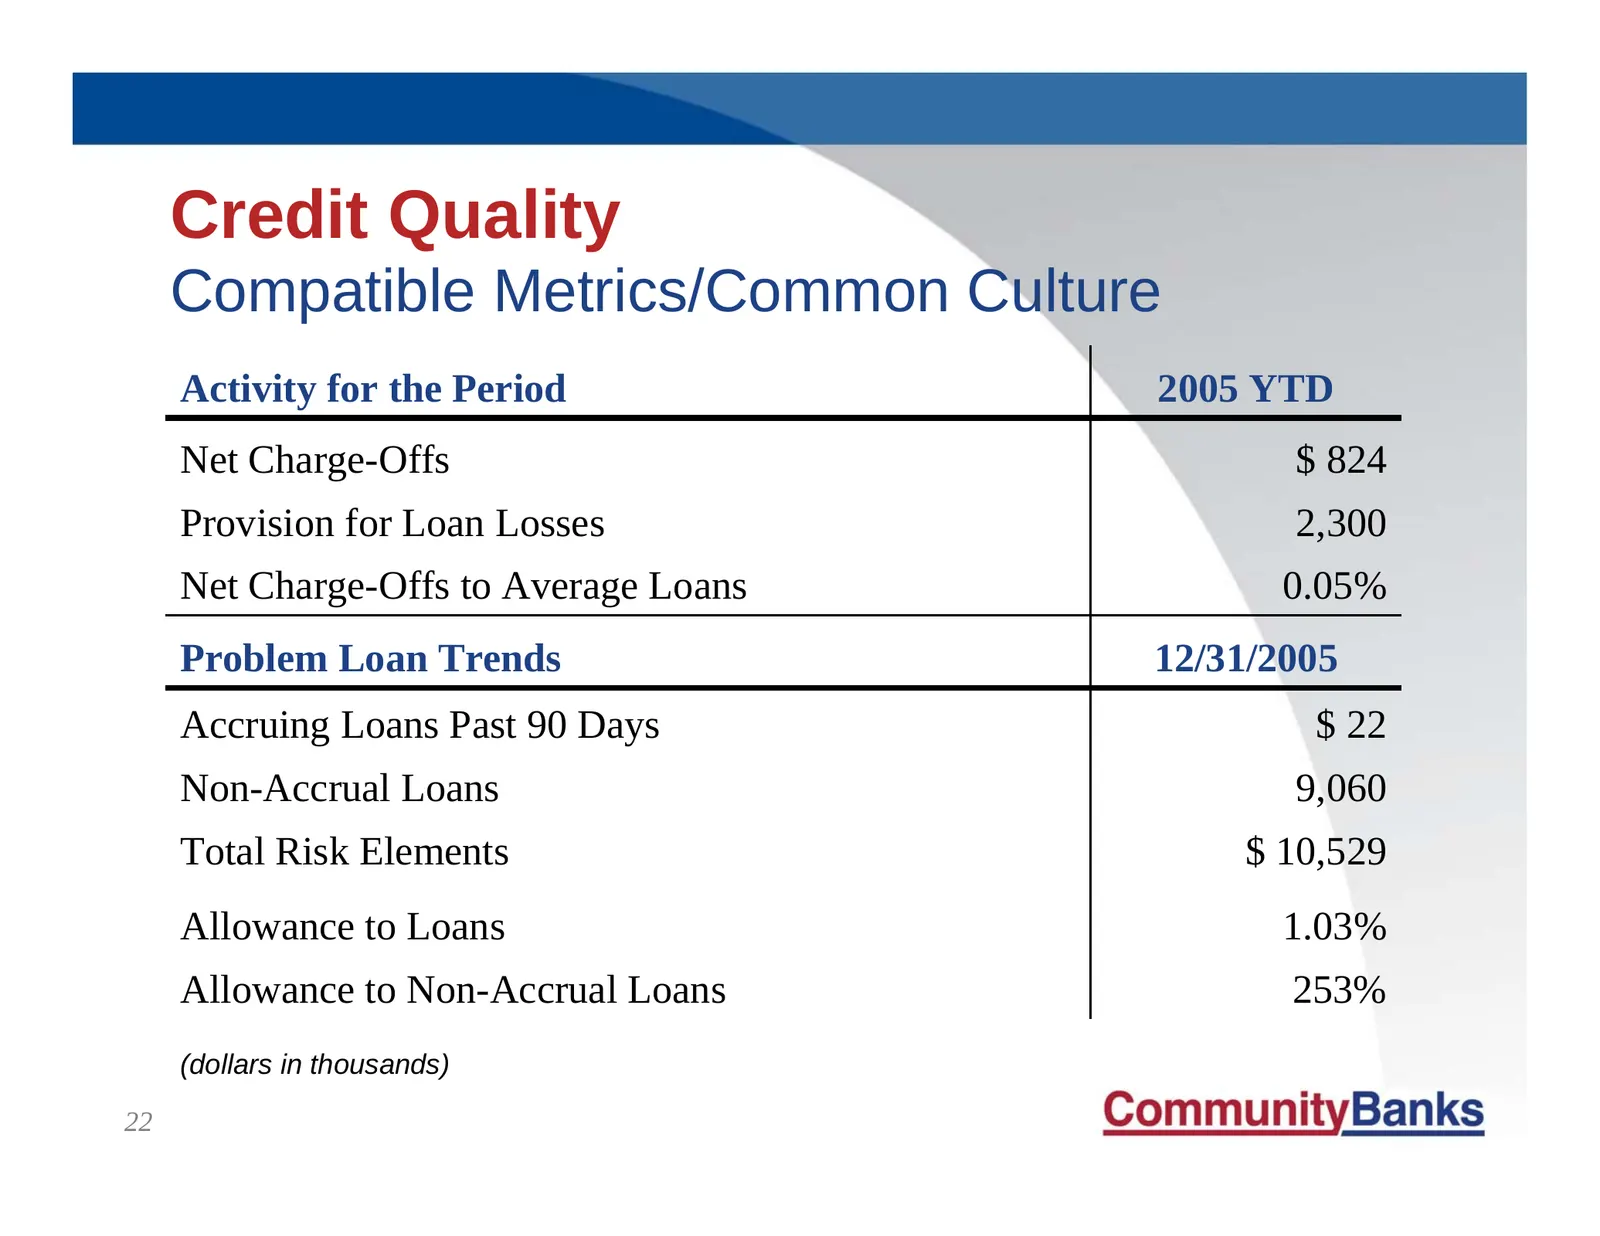
Credit Quality Compatible Metrics/Common Culture Activity for the Period 2005 YTD Net Charge-Offs $ 824 Provision for Loan Losses 2,300 Net Charge-Offs to Average Loans 0.05% Problem Loan Trends 12/31/2005 Accruing Loans Past 90 Days $ 22 Non-Accrual Loans 9,060 Total Risk Elements $ 10,529 Allowanc
Slide 23: Charge-Off History
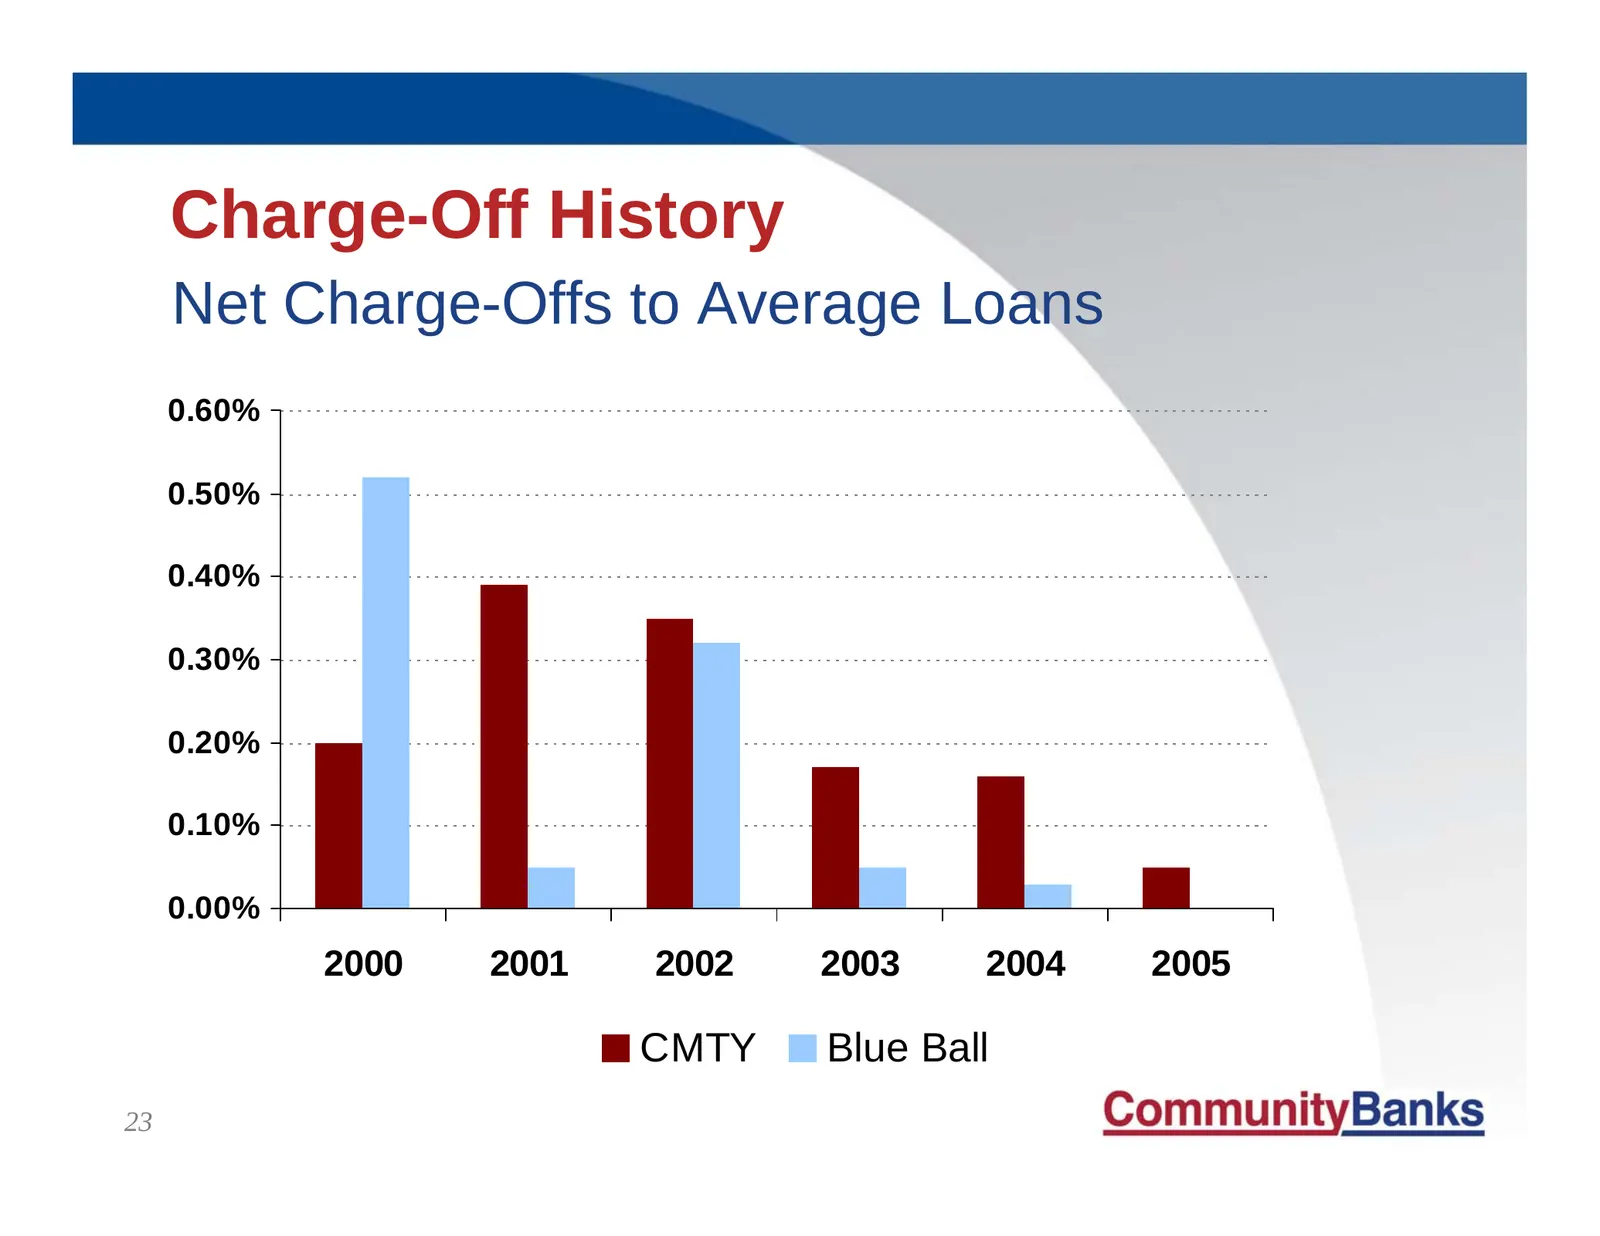
Charge-Off History Net Charge-Offs to Average Loans 0.60% 0.50% 0.40% 0.30% 0.20% 0.10% 0.00% 2000 2001 2002 2003 2004 2005 CMTY Blue Ball 23
Slide 24: Non-Interest Income
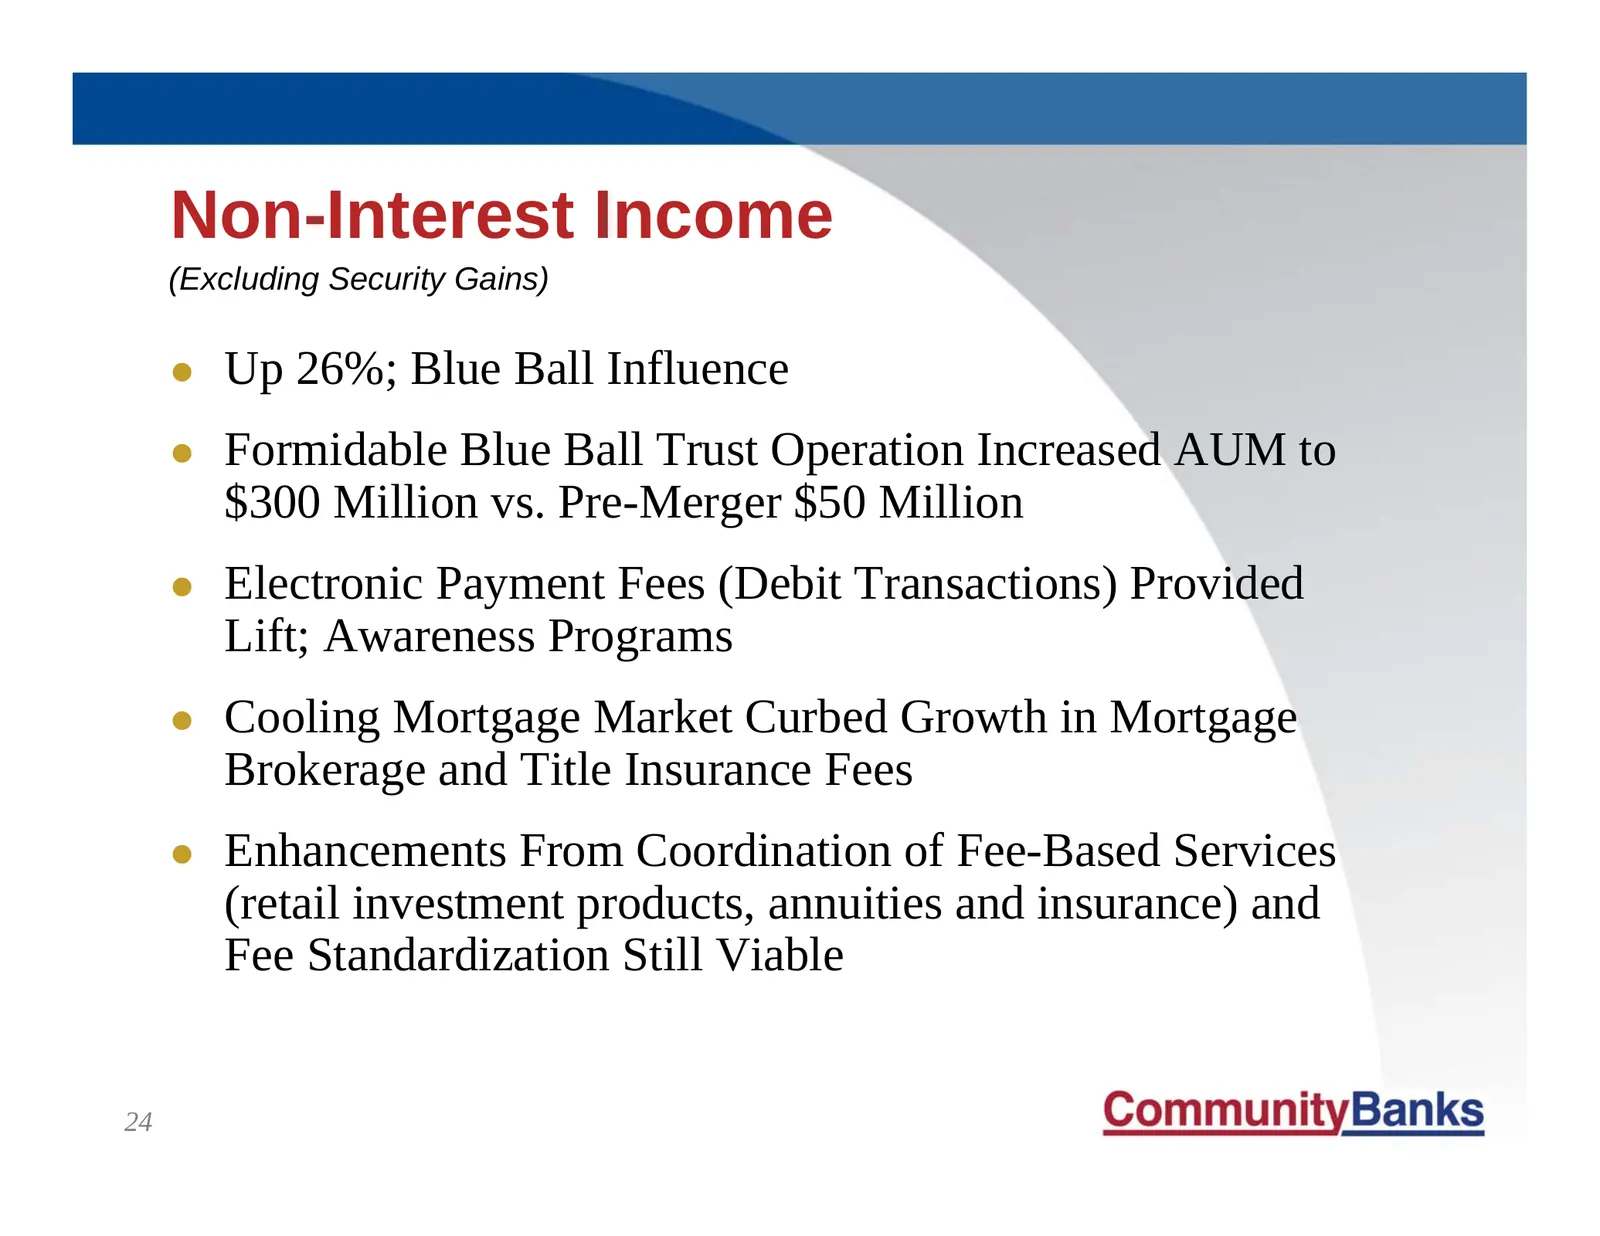
Non-Interest Income (Excluding Security Gains) z Up 26%; Blue Ball Influence z Formidable Blue Ball Trust Operation Increased AUM to $300 Million vs. Pre-Merger $50 Million z Electronic Payment Fees (Debit Transactions) Provided Lift; Awareness Programs z Cooling Mortgage Market Curbed Growth in Mor
Slide 25: 2005: Improved Efficiency from Merger
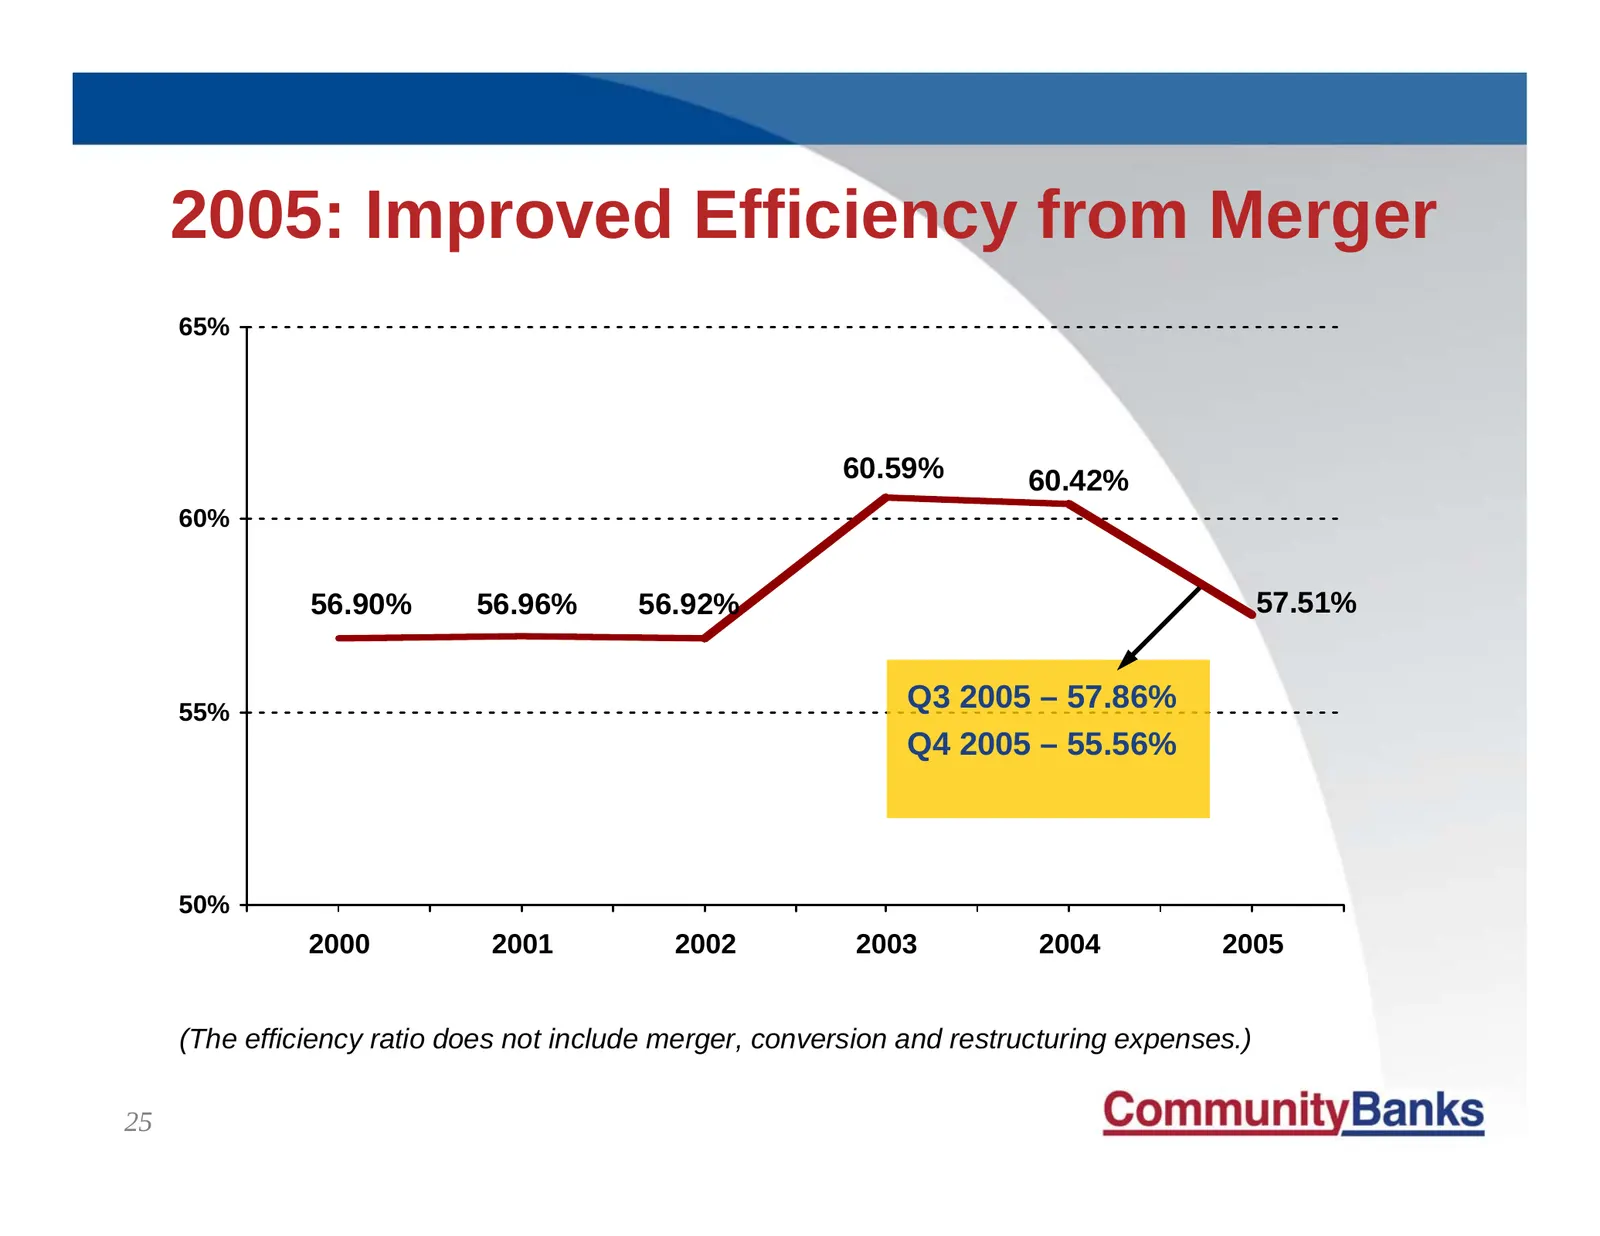
2005: Improved Efficiency from Merger 65% 60.59% 60.42% 60% 56.90% 56.96% 56.92% 57.51% 55% Q3 2005 – 57.86% Q4 2005 – 55.56% 50% 2000 2001 2002 2003 2004 2005 (The efficiency ratio does not include merger, conversion and restructuring expenses.) 25
Slide 26: Goodwill and Other Intangibles
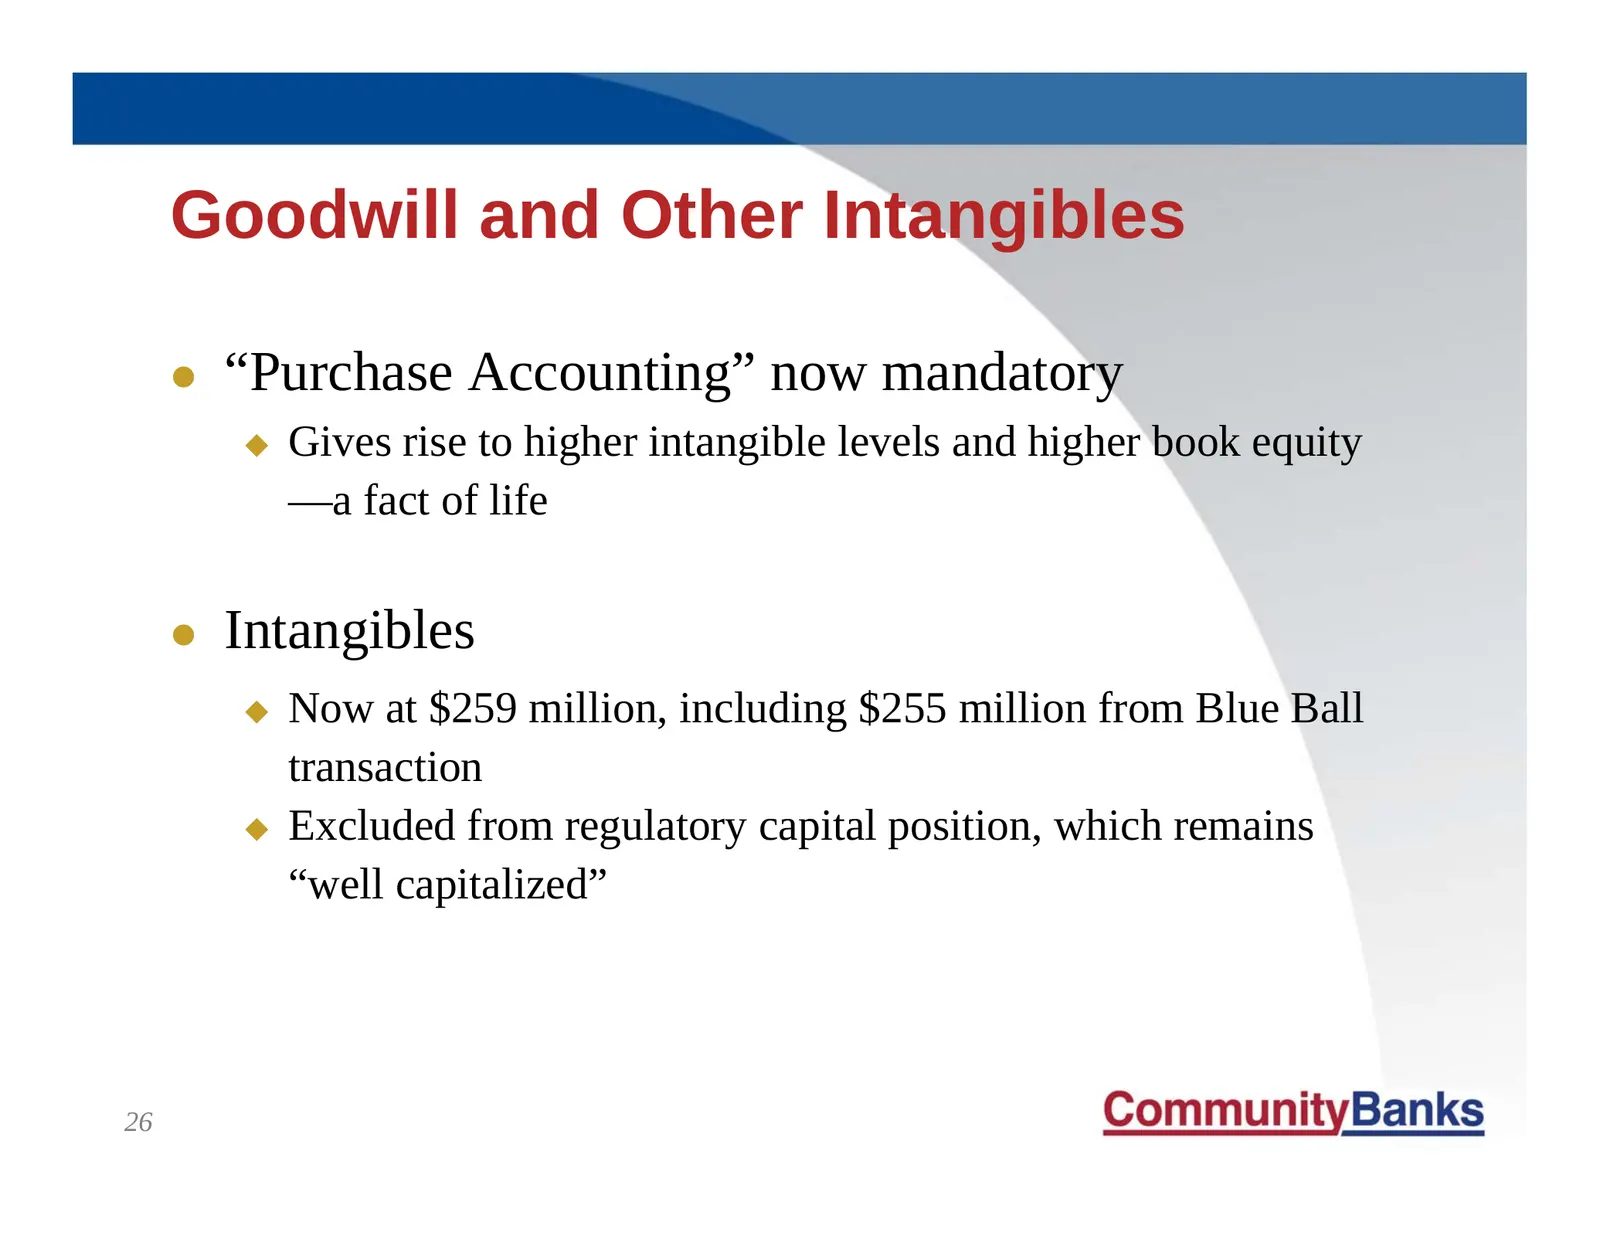
Goodwill and Other Intangibles z “Purchase Accounting” now mandatory Gives rise to higher intangible levels and higher book equity —a fact of life z Intangibles Now at $259 million, including $255 million from Blue Ball transaction Excluded from regulatory capital position, which remains “well
Slide 27: Capital Levels
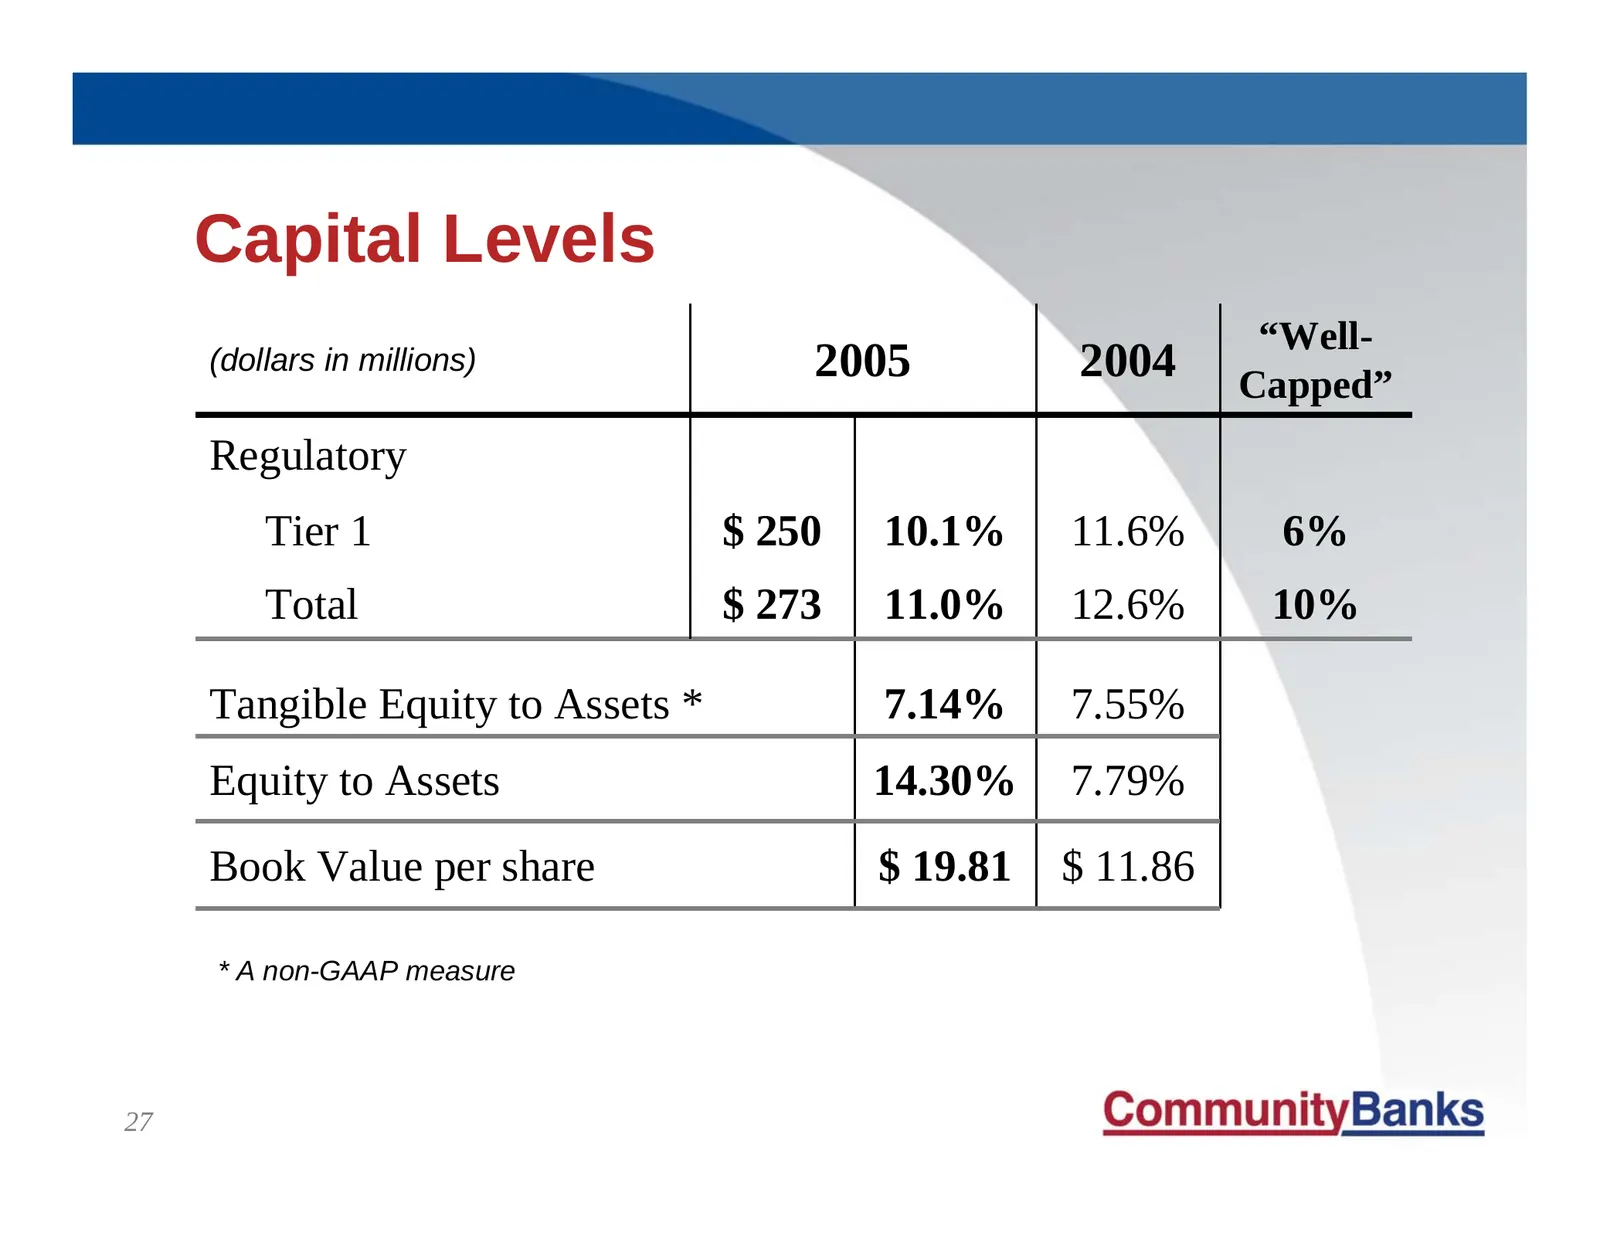
Capital Levels “Well- (dollars in millions) 2005 2004 Capped” Regulatory Tier 1 $ 250 10.1% 11.6% 6% Total $ 273 11.0% 12.6% 10% Tangible Equity to Assets * 7.14% 7.55% Equity to Assets 14.30% 7.79% Book Value per share $ 19.81 $ 11.86 * A non-GAAP measure 27
Slide 28: President's Report Agenda
President’s Report z Agenda “Fulfilling Our Commitments” The Blue Ball Merger: A Final Retrospective 2005 Performance: The Financial Story Q1-2006: An Update Stock Performance Setting the Stage for 2006 28
Slide 29: Performance Goals: Q1 2006
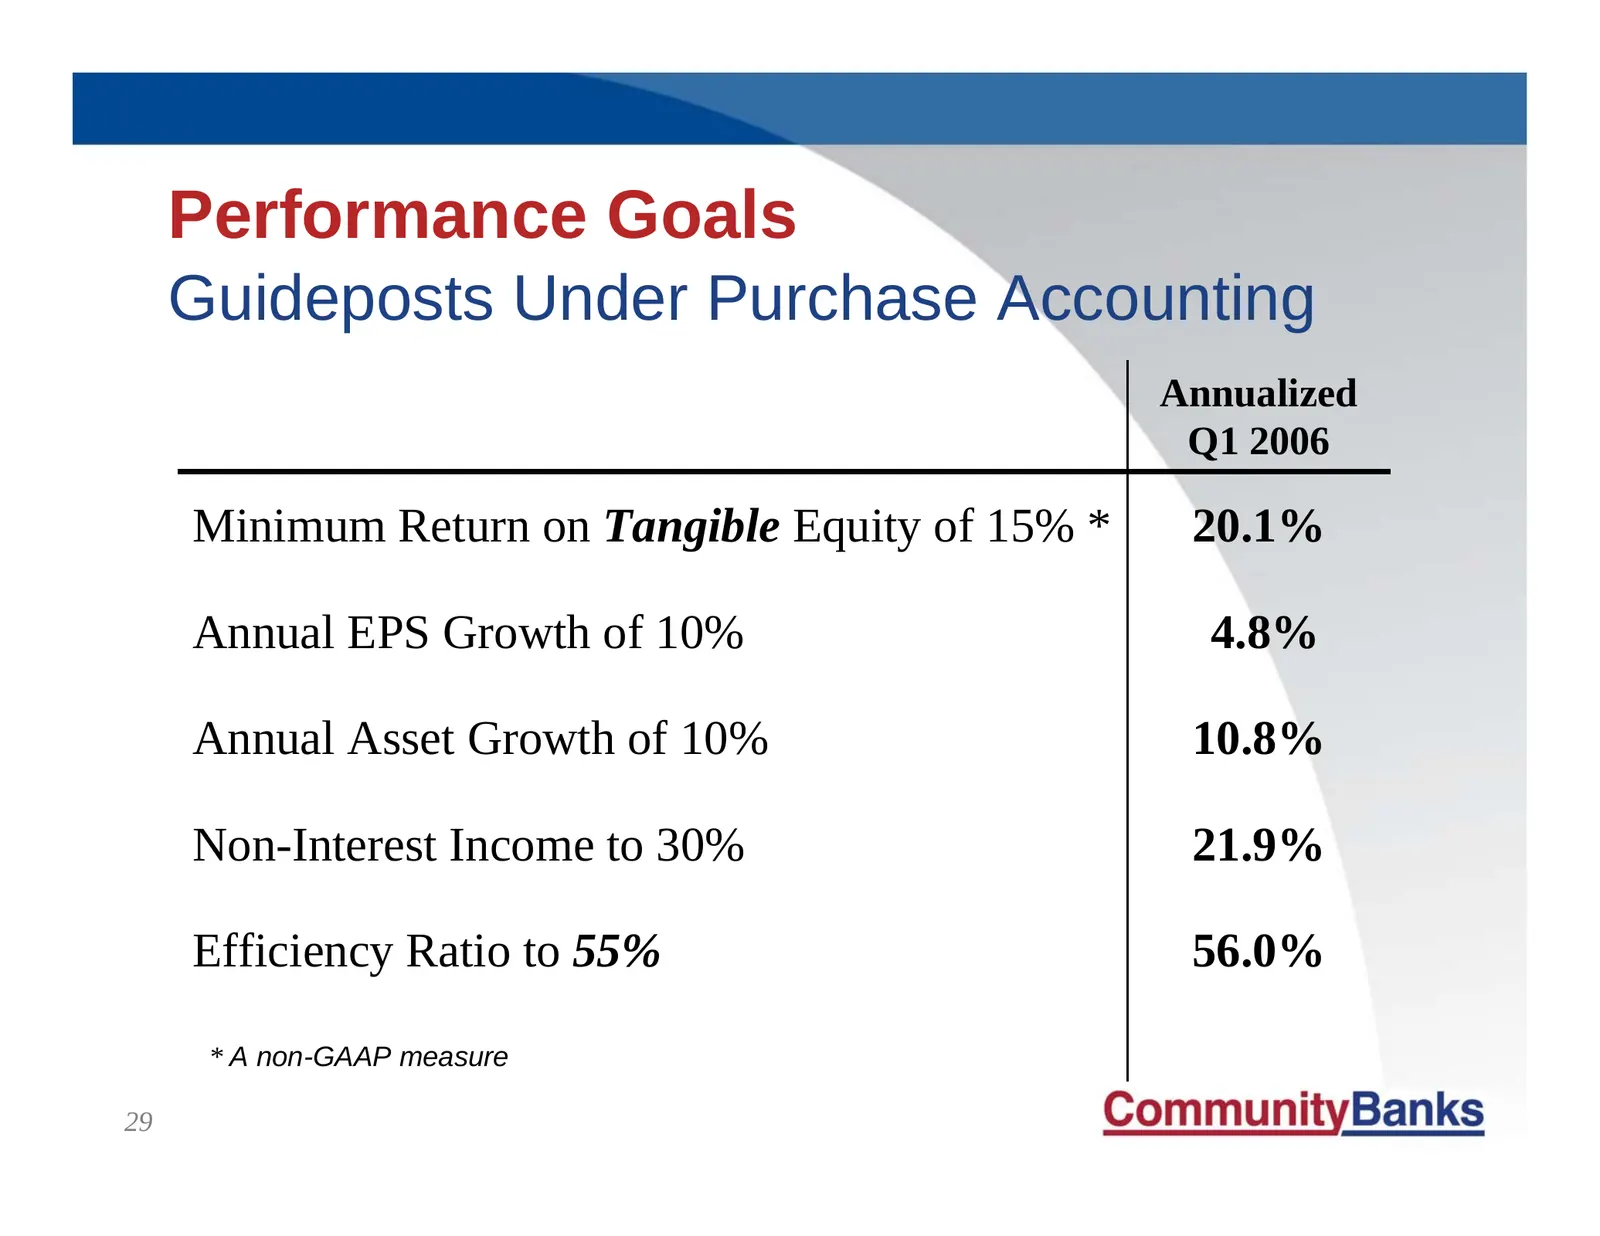
Performance Goals Guideposts Under Purchase Accounting Annualized Q1 2006 Minimum Return on Tangible Equity of 15% * 20.1% Annual EPS Growth of 10% 4.8% Annual Asset Growth of 10% 10.8% Non-Interest Income to 30% 21.9% Efficiency Ratio to 55% 56.0% * A non-GAAP measure 29
Slide 30: First Quarter Highlights: Profitability Performance
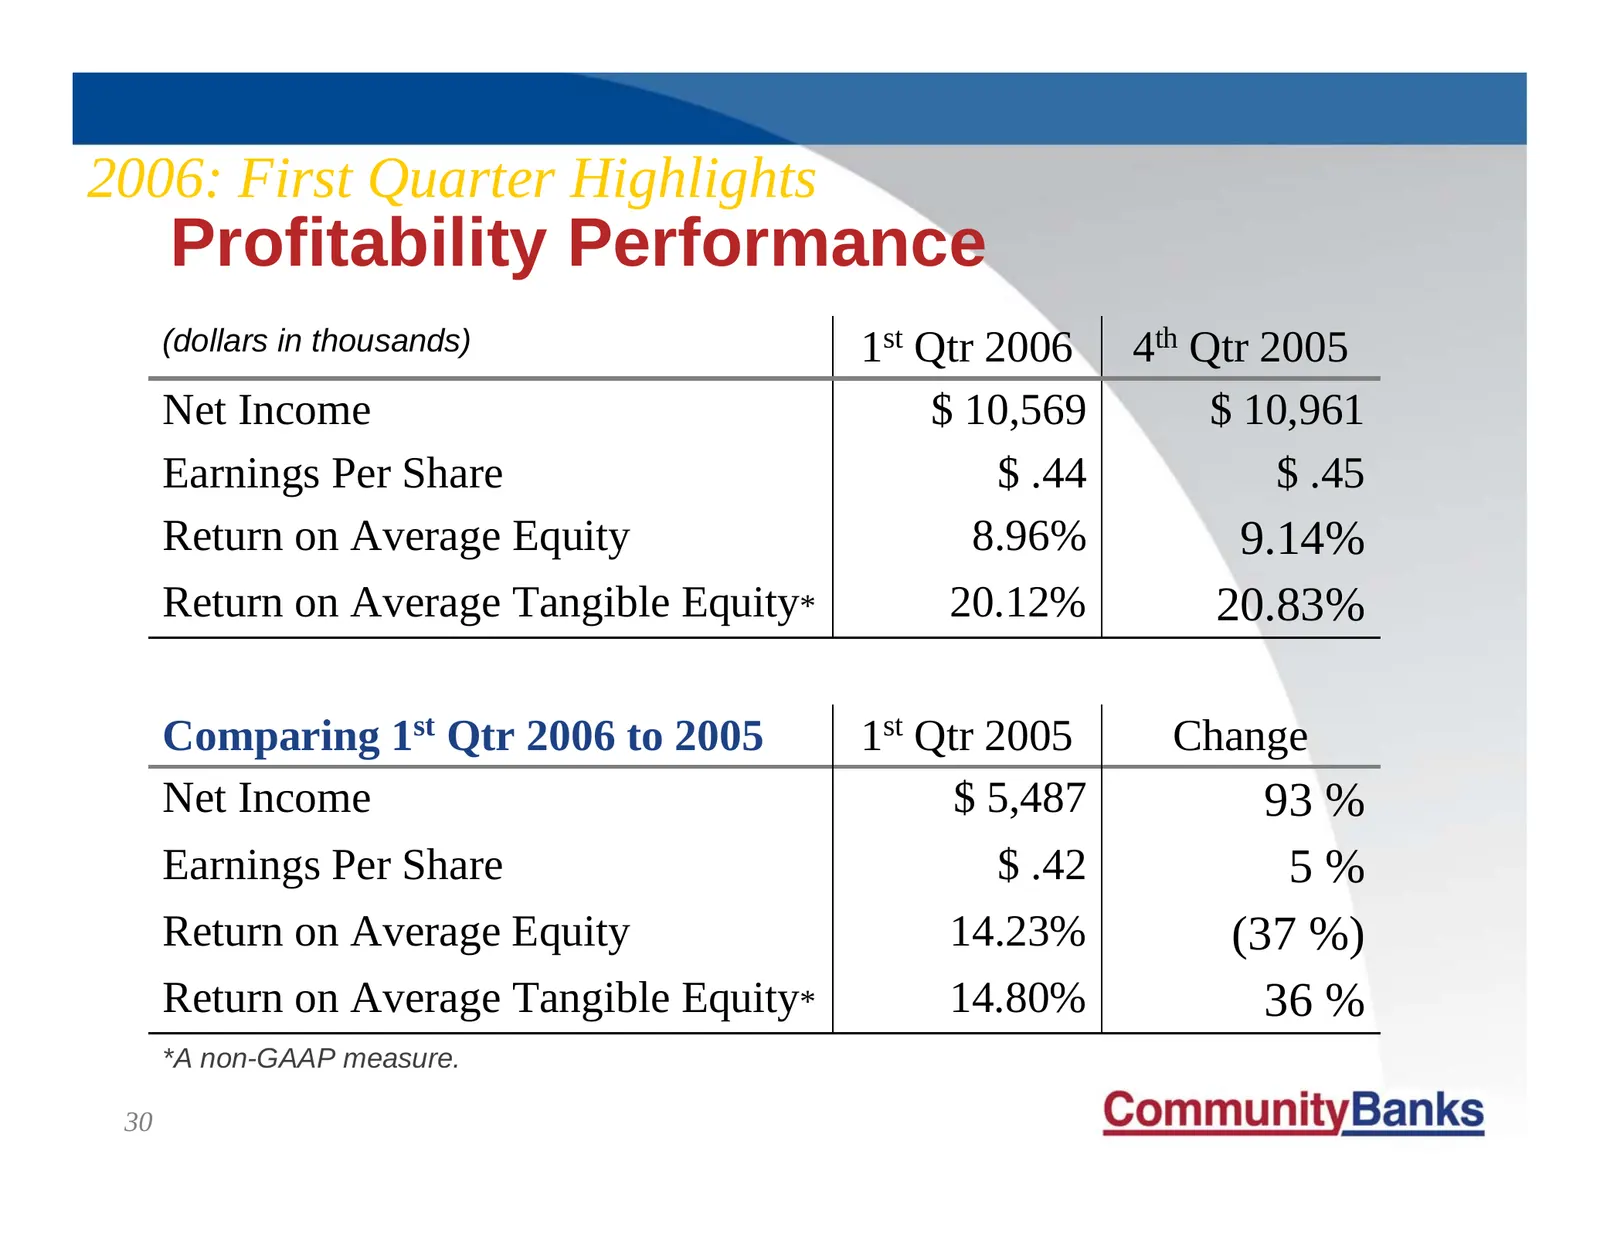
2006: First Quarter Highlights Profitability Performance (dollars in thousands) 1st Qtr 2006 4th Qtr 2005 Net Income $ 10,569 $ 10,961 Earnings Per Share $ .44 $ .45 Return on Average Equity 8.96% 9.14% Return on Average Tangible Equity* 20.12% 20.83% Comparing 1st Qtr 2006 to 2005 1st Qtr 2005 Chan
Slide 31: First Quarter Highlights: Performance
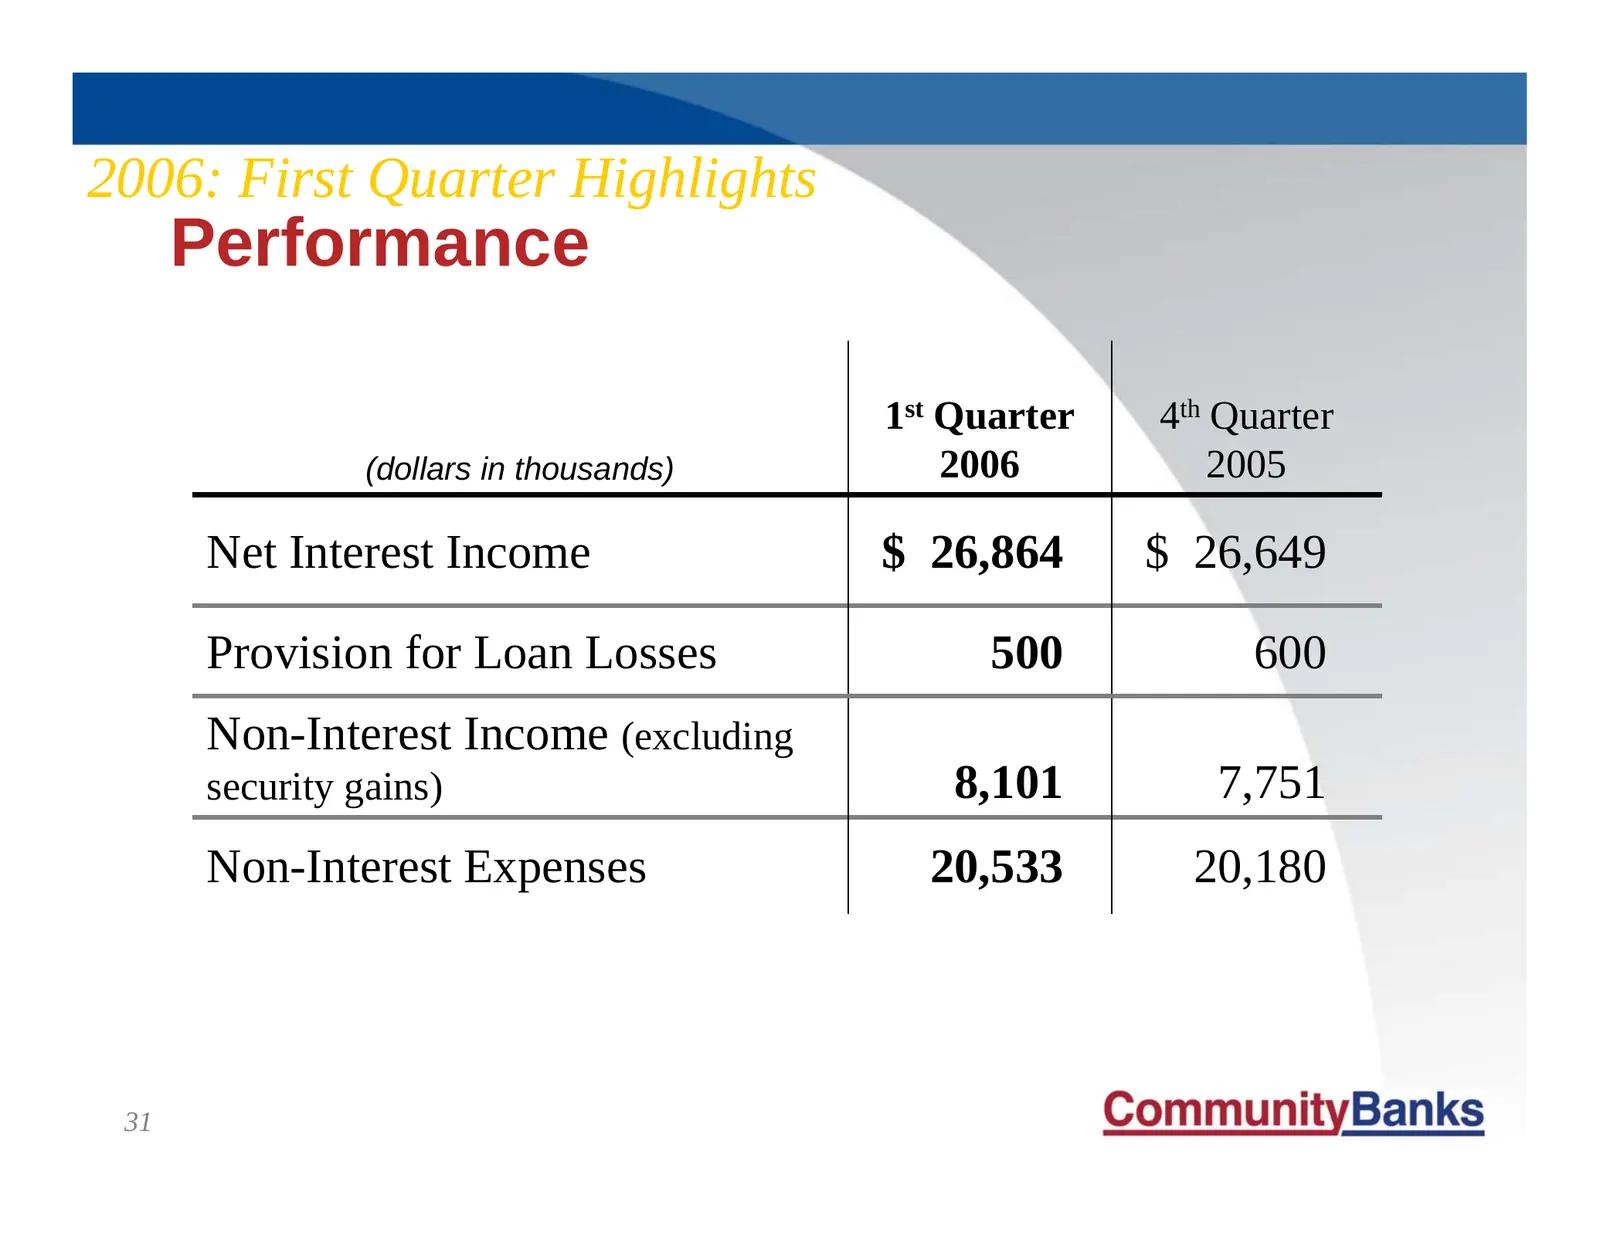
2006: First Quarter Highlights Performance 1st Quarter 4th Quarter (dollars in thousands) 2006 2005 Net Interest Income $ 26,864 $ 26,649 Provision for Loan Losses 500 600 Non-Interest Income (excluding security gains) 8,101 7,751 Non-Interest Expenses 20,533 20,180 31
Slide 32: First Quarter Highlights: Loans
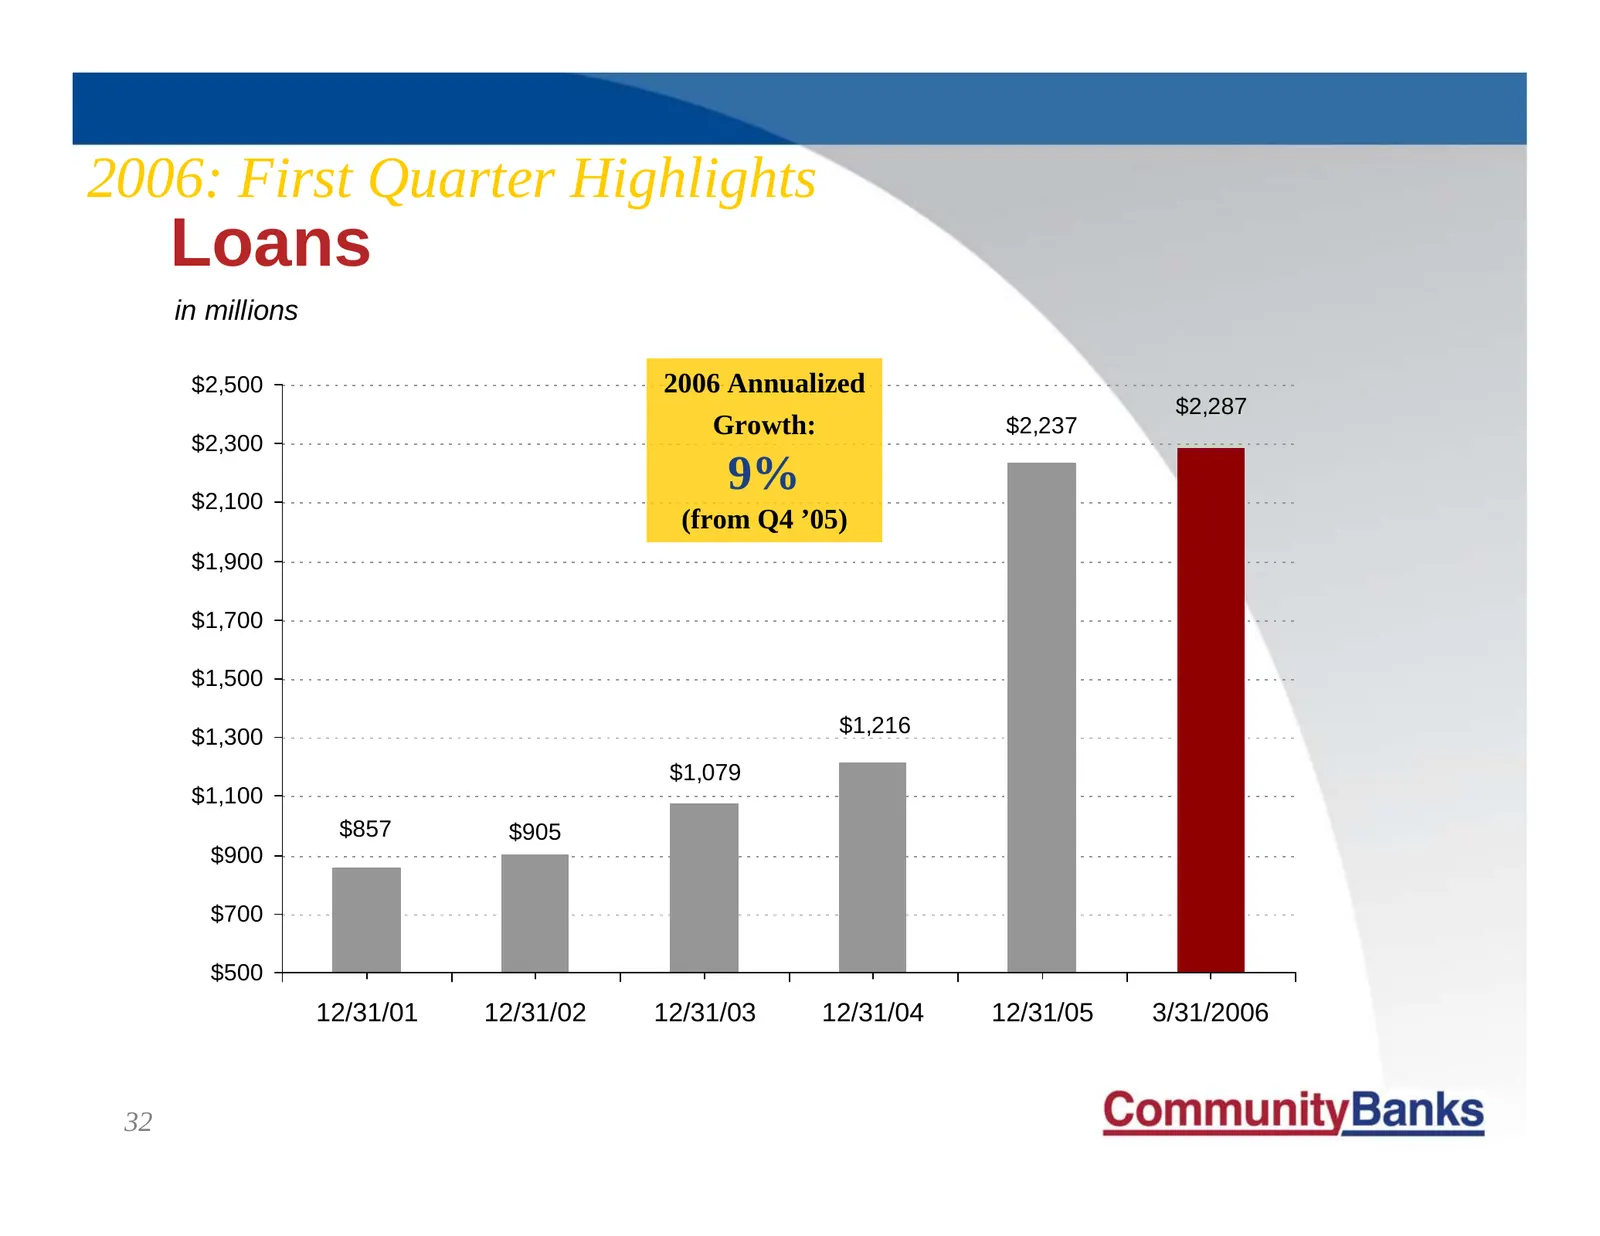
2006: First Quarter Highlights Loans in millions $2,500 2006 Annualized $2,287 Growth: $2,237 $2,300 $2,100 9% (from Q4 ’05) $1,900 $1,700 $1,500 $1,216 $1,300 $1,079 $1,100 $857 $905 $900 $700 $500 12/31/01 12/31/02 12/31/03 12/31/04 12/31/05 3/31/2006 32
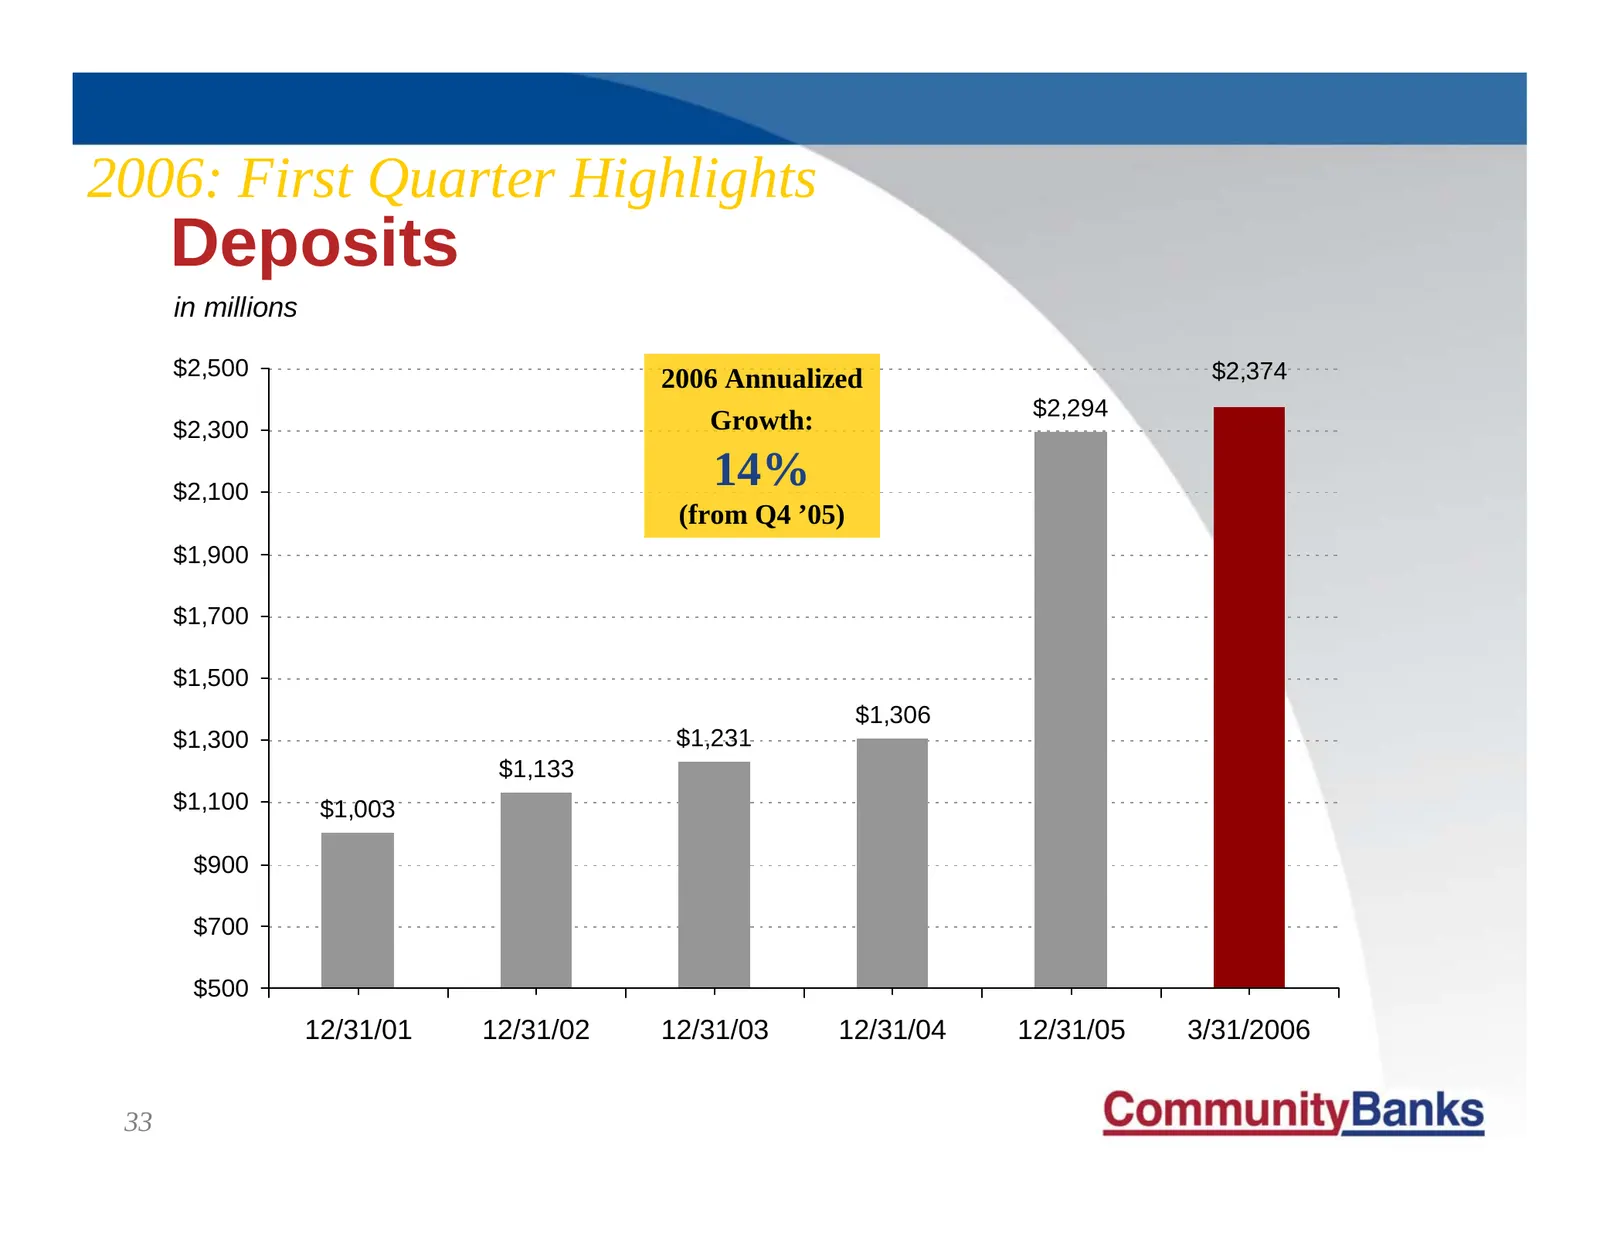
Slide 33: First Quarter Highlights: Deposits
2006: First Quarter Highlights Deposits in millions $2,500 2006 Annualized $2,374 $2,294 $2,300 Growth: $2,100 14% (from Q4 ’05) $1,900 $1,700 $1,500 $1,306 $1,300 $1,231 $1,133 $1,100 $1,003 $900 $700 $500 12/31/01 12/31/02 12/31/03 12/31/04 12/31/05 3/31/2006 33
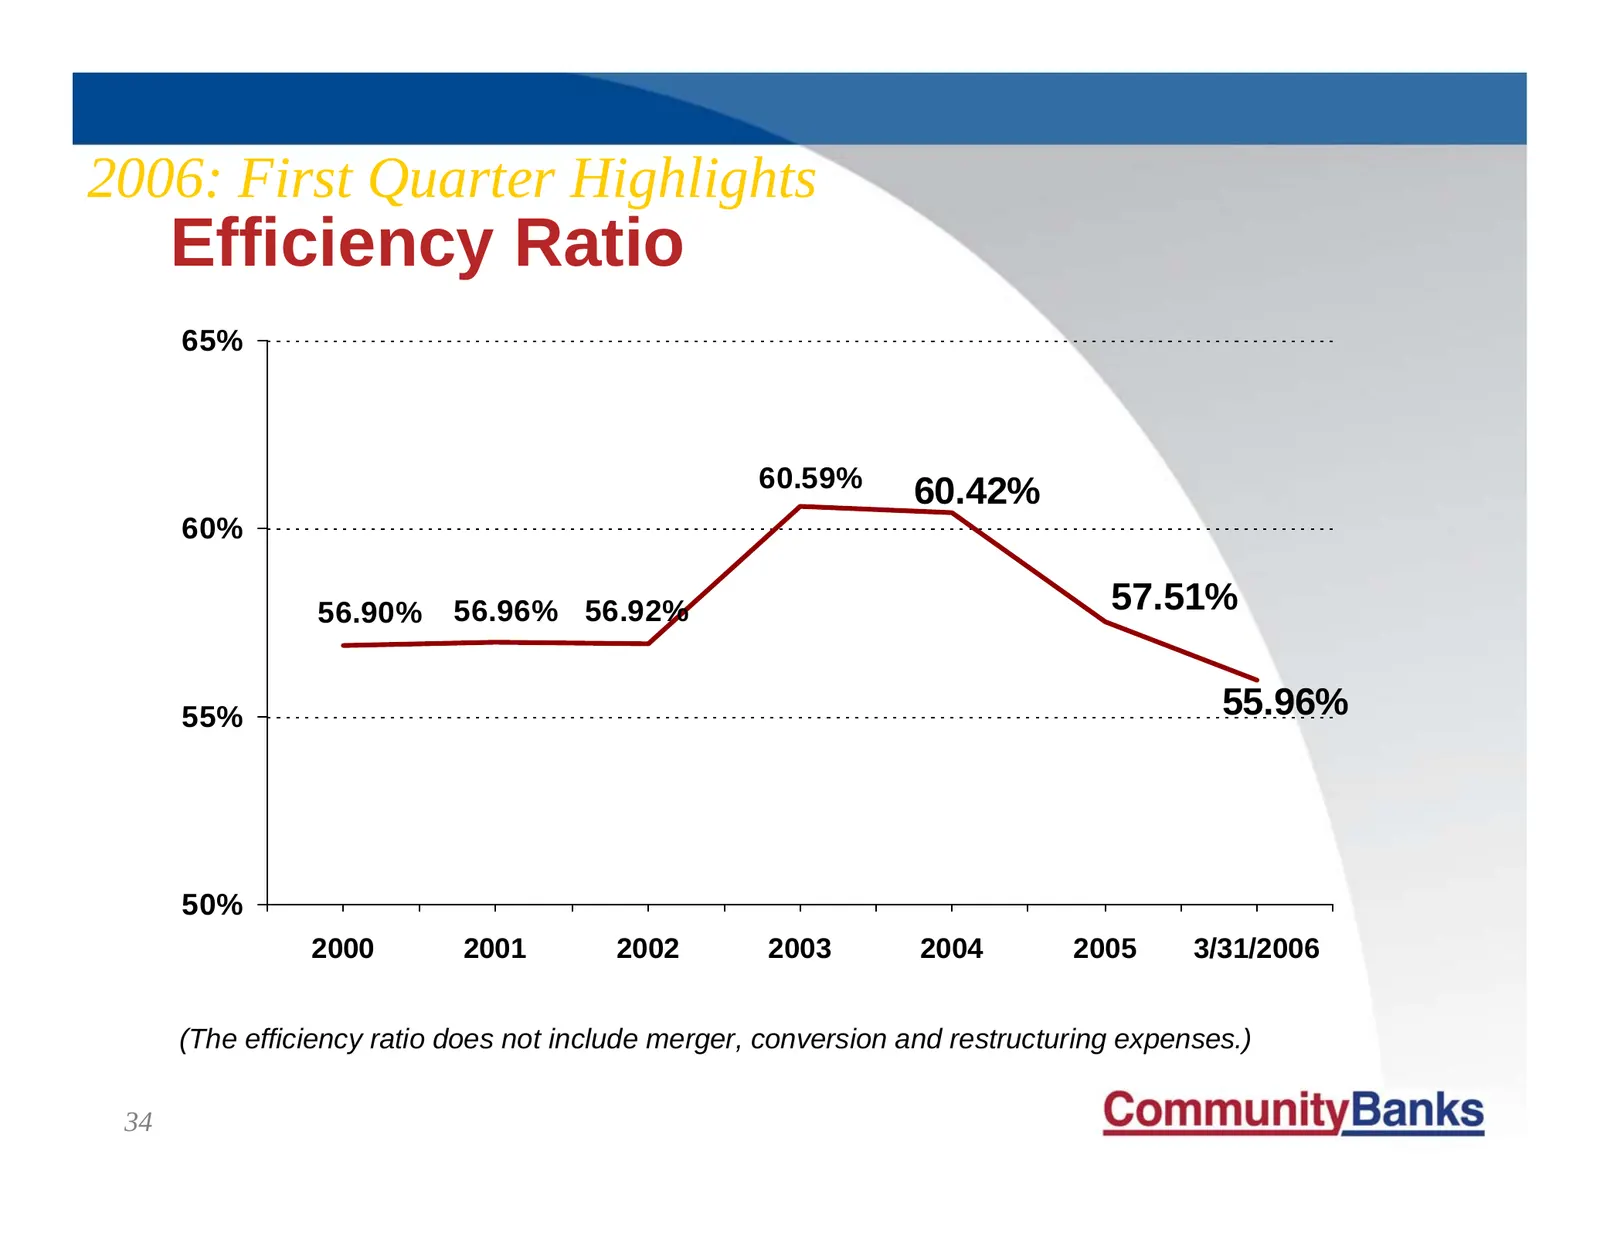
Slide 34: First Quarter Highlights: Efficiency Ratio
2006: First Quarter Highlights Efficiency Ratio 65% 60.59% 60.42% 60% 56.90% 56.96% 56.92% 57.51% 55% 55.96% 50% 2000 2001 2002 2003 2004 2005 3/31/2006 (The efficiency ratio does not include merger, conversion and restructuring expenses.) 34
Slide 35: President's Report Agenda
President’s Report z Agenda “Fulfilling Our Commitments” The Blue Ball Merger: A Final Retrospective 2005 Performance: The Financial Story Q1-2006: An Update Stock Performance Setting the Stage for 2006 35
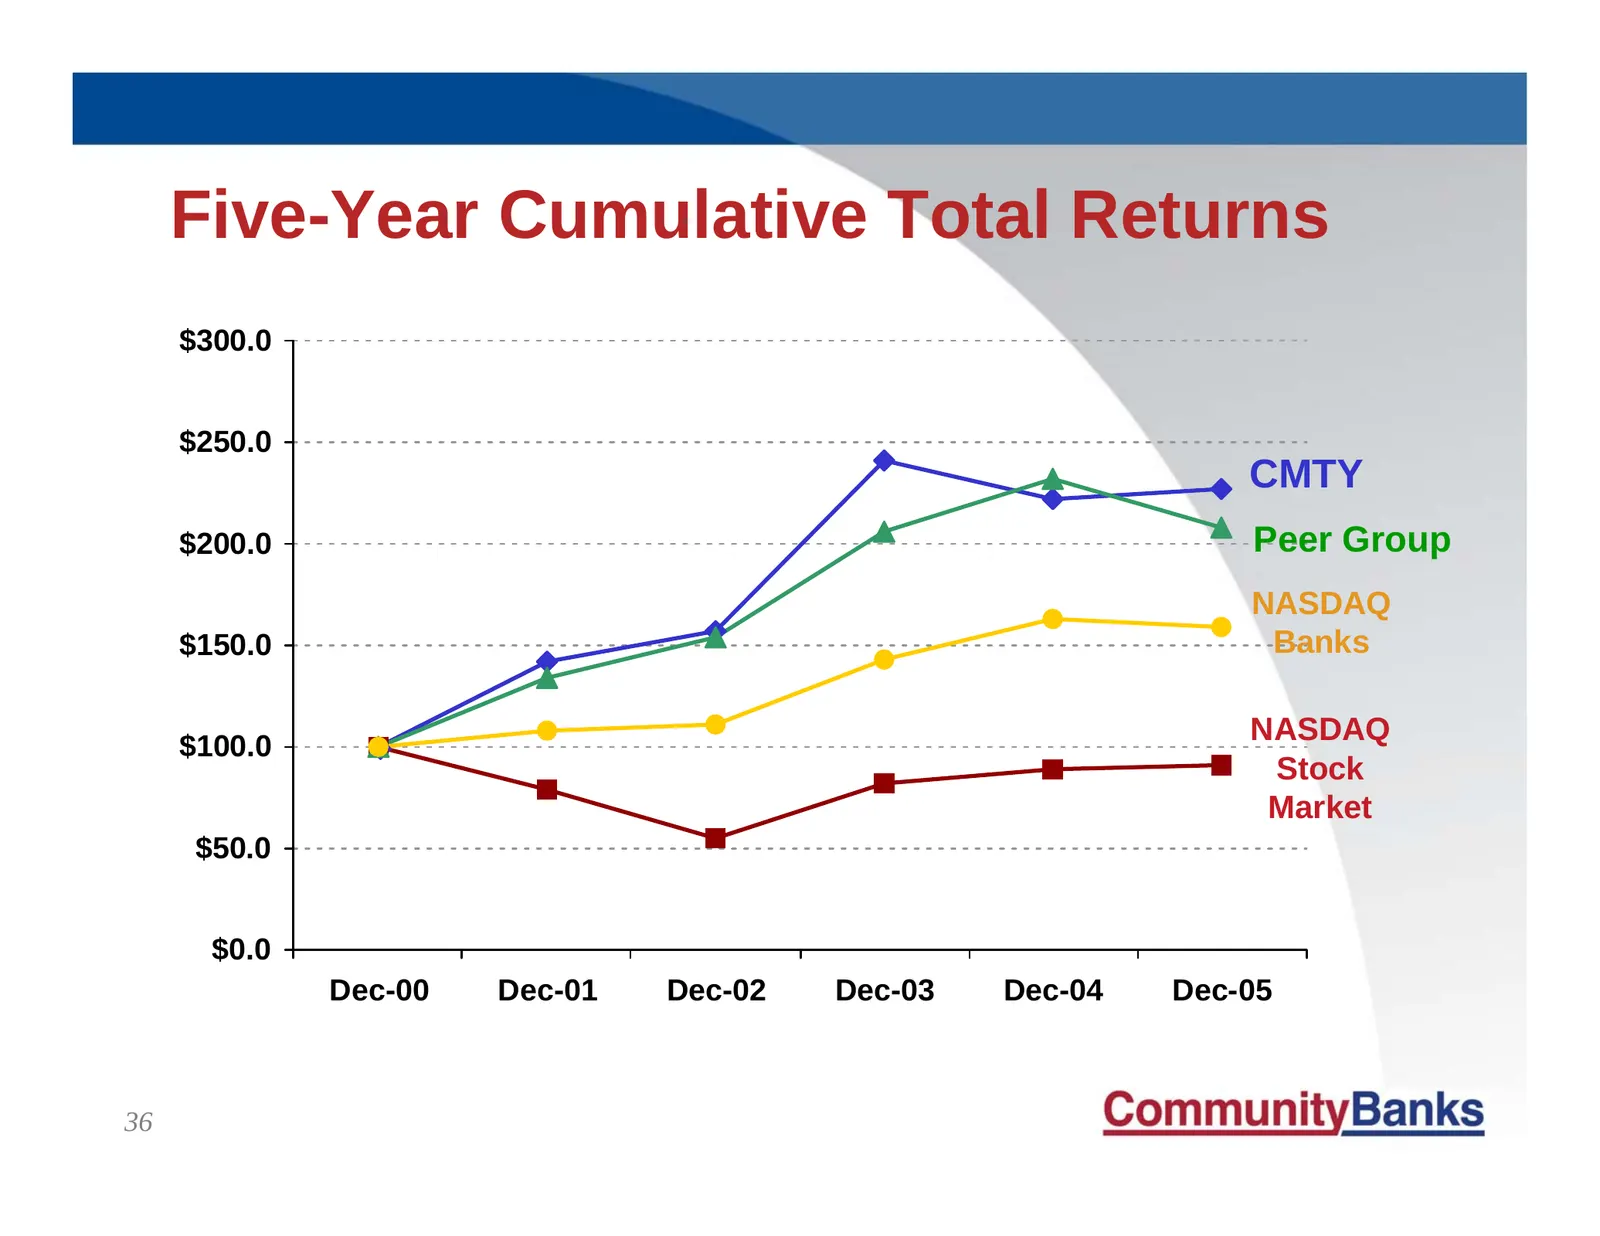
Slide 36: Five-Year Cumulative Total Returns
Five-Year Cumulative Total Returns $300.0 $250.0 CMTY $200.0 Peer Group NASDAQ $150.0 Banks NASDAQ $100.0 Stock Market $50.0 $0.0 Dec-00 Dec-01 Dec-02 Dec-03 Dec-04 Dec-05 36
Slide 37: One Year Ago: Price Post-Announcement
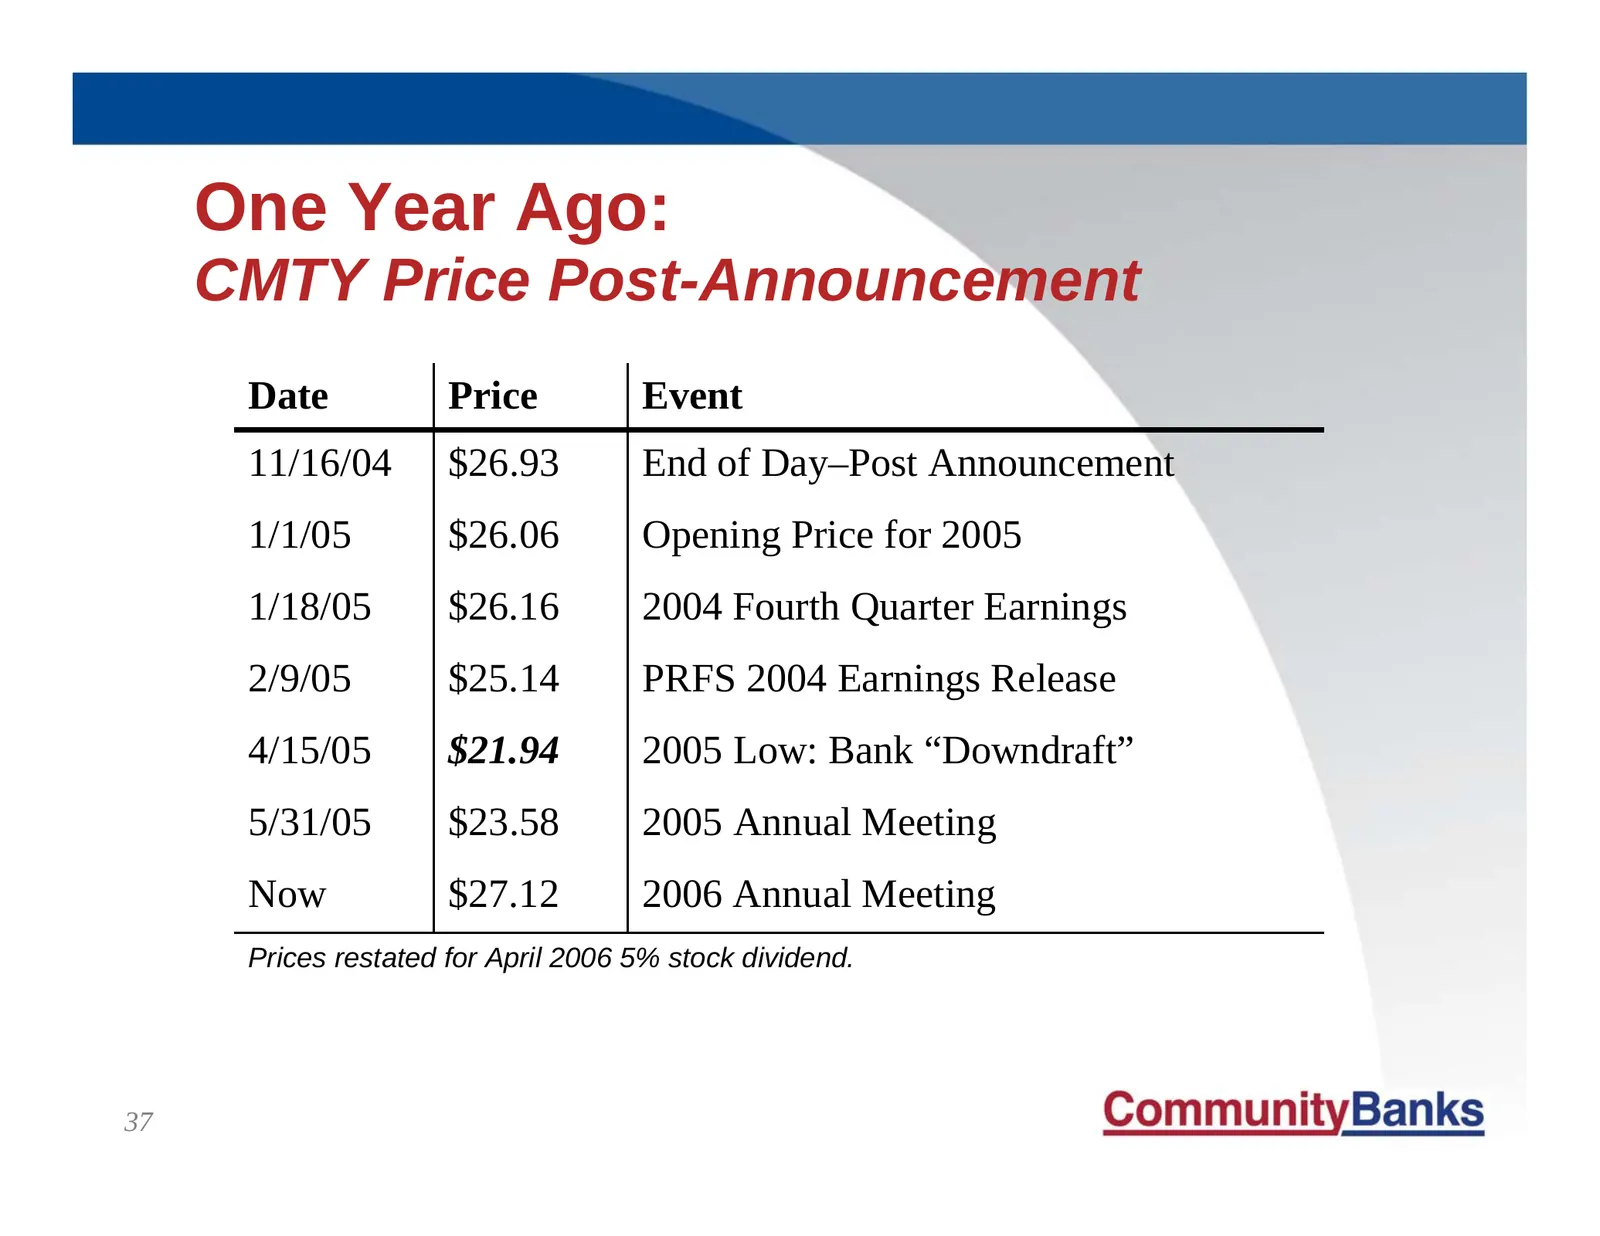
One Year Ago: CMTY Price Post-Announcement Date Price Event 11/16/04 $26.93 End of Day–Post Announcement 1/1/05 $26.06 Opening Price for 2005 1/18/05 $26.16 2004 Fourth Quarter Earnings 2/9/05 $25.14 PRFS 2004 Earnings Release 4/15/05 $21.94 2005 Low: Bank “Downdraft” 5/31/05 $23.58 2005 Annual Meet
Slide 38: Quarterly Dividend
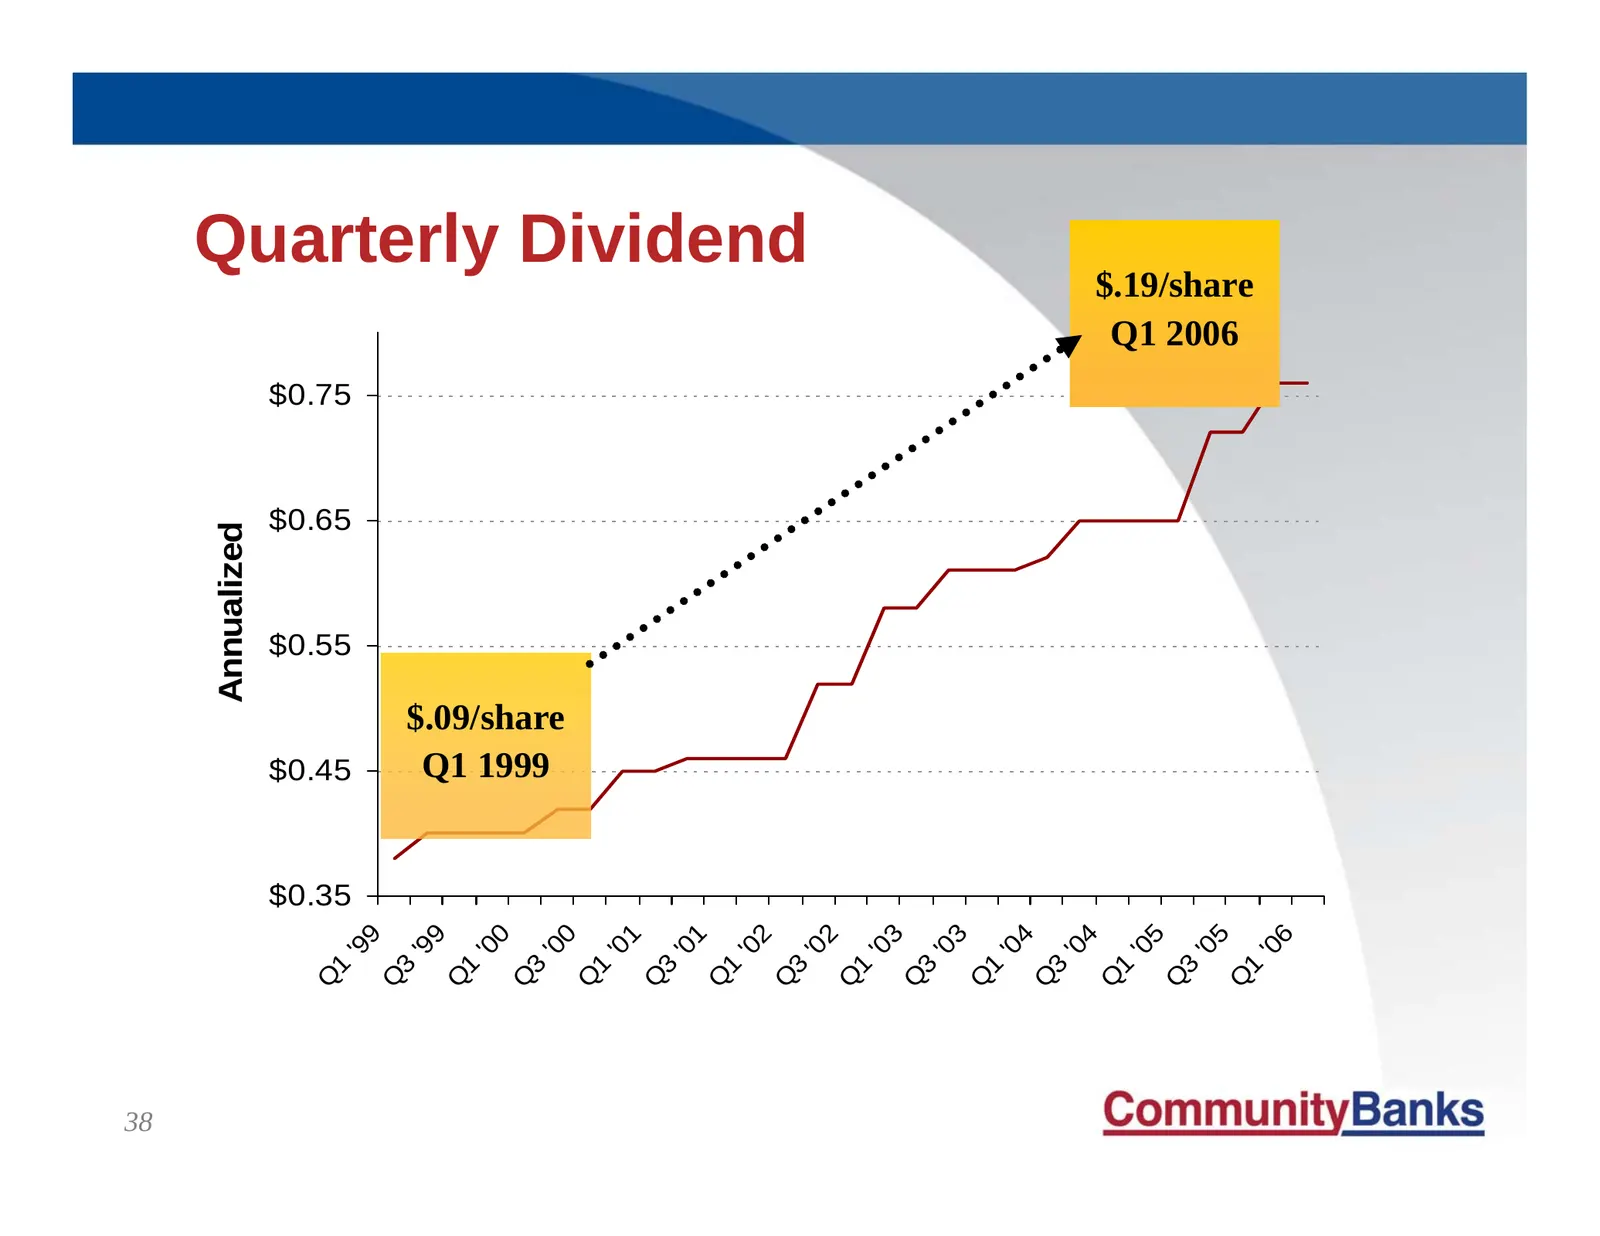
38 Annualized Q 1 $0.35 $0.45 $0.55 $0.65 $0.75 '9 9 Q 3 '9 9 Q 1 '0 0 Q 3 Q1 1999 '0 $.09/share 0 Q 1 '0 1 Q 3 '0 1 Q 1 '0 2 Q 3 Quarterly Dividend '0 2 Q 1 '0 3 Q 3 '0 3 Q 1 '0 4 Q 3 '0 4 Q 1 '0 5 Q 3 '0 5 Q1 2006 Q $.19/share 1 '0 6
Slide 39: Share Repurchase
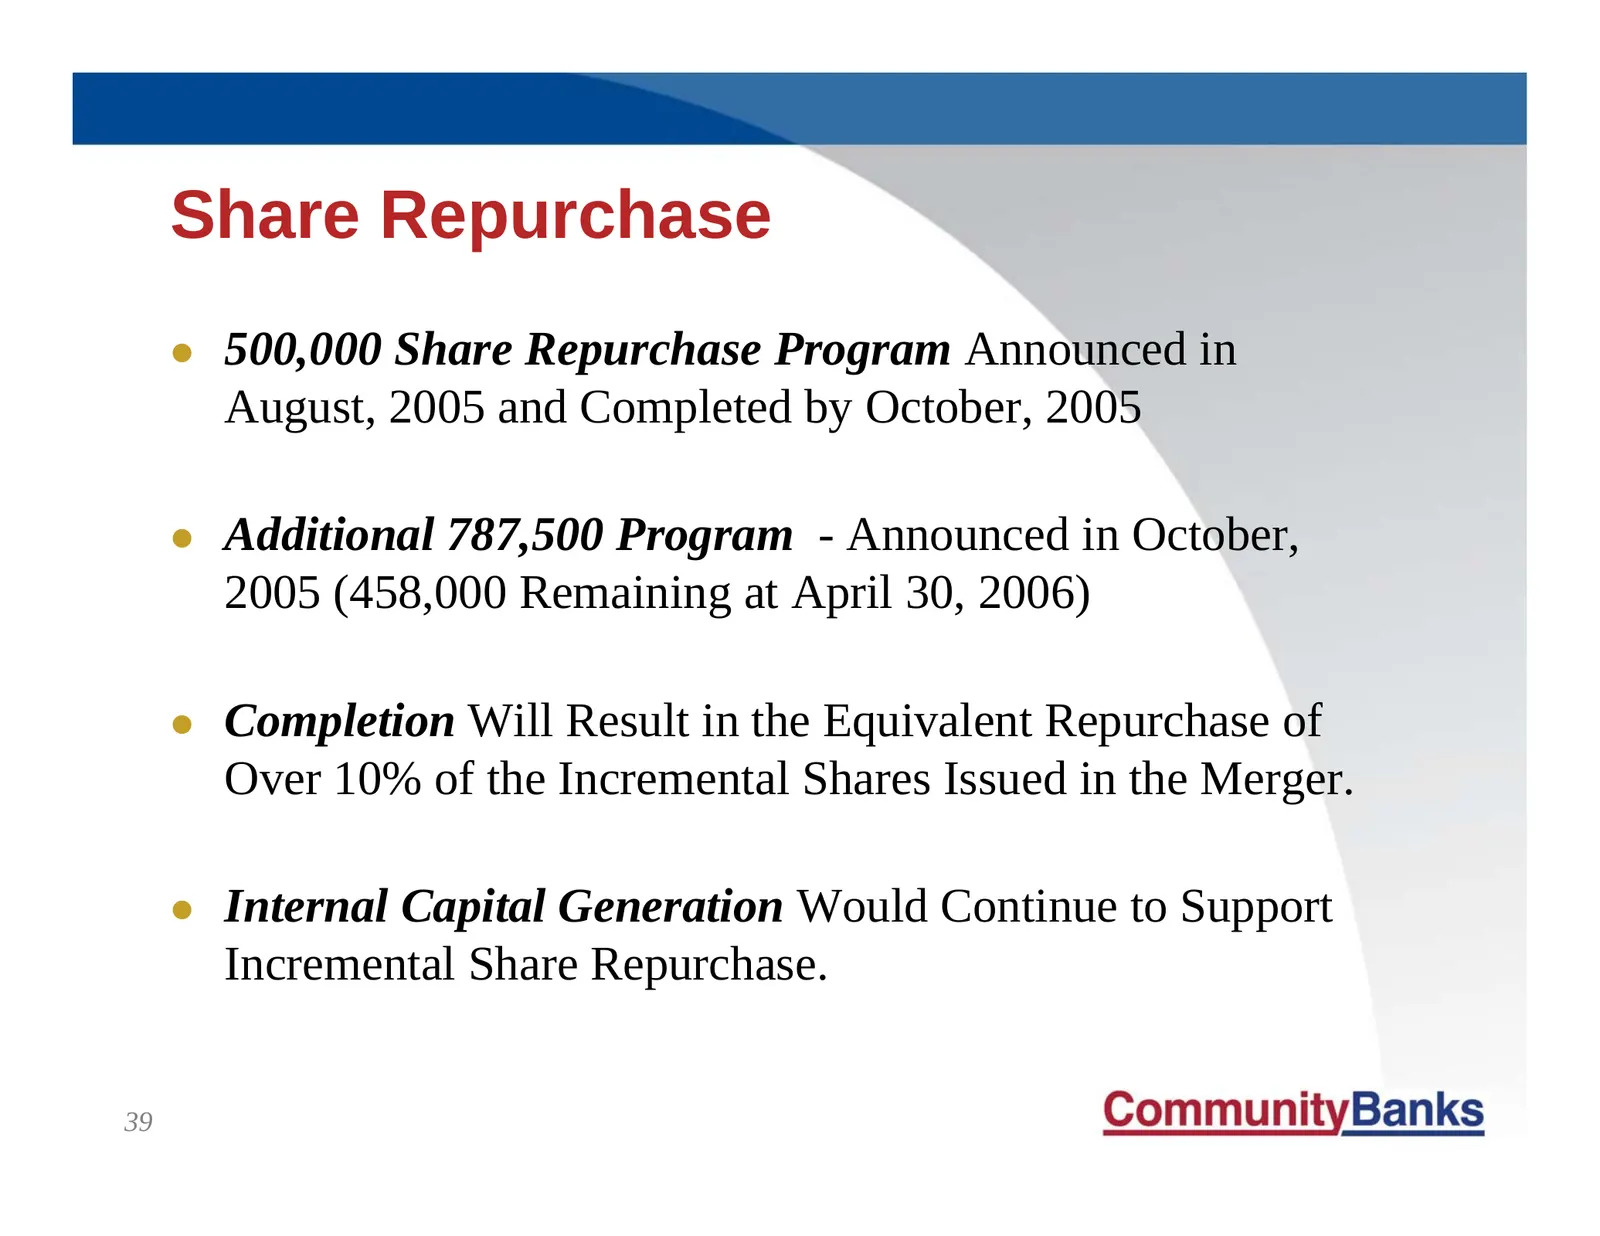
Share Repurchase z 500,000 Share Repurchase Program Announced in August, 2005 and Completed by October, 2005 z Additional 787,500 Program - Announced in October, 2005 (458,000 Remaining at April 30, 2006) z Completion Will Result in the Equivalent Repurchase of Over 10% of the Incremental Shares Iss
Slide 40: President's Report Agenda
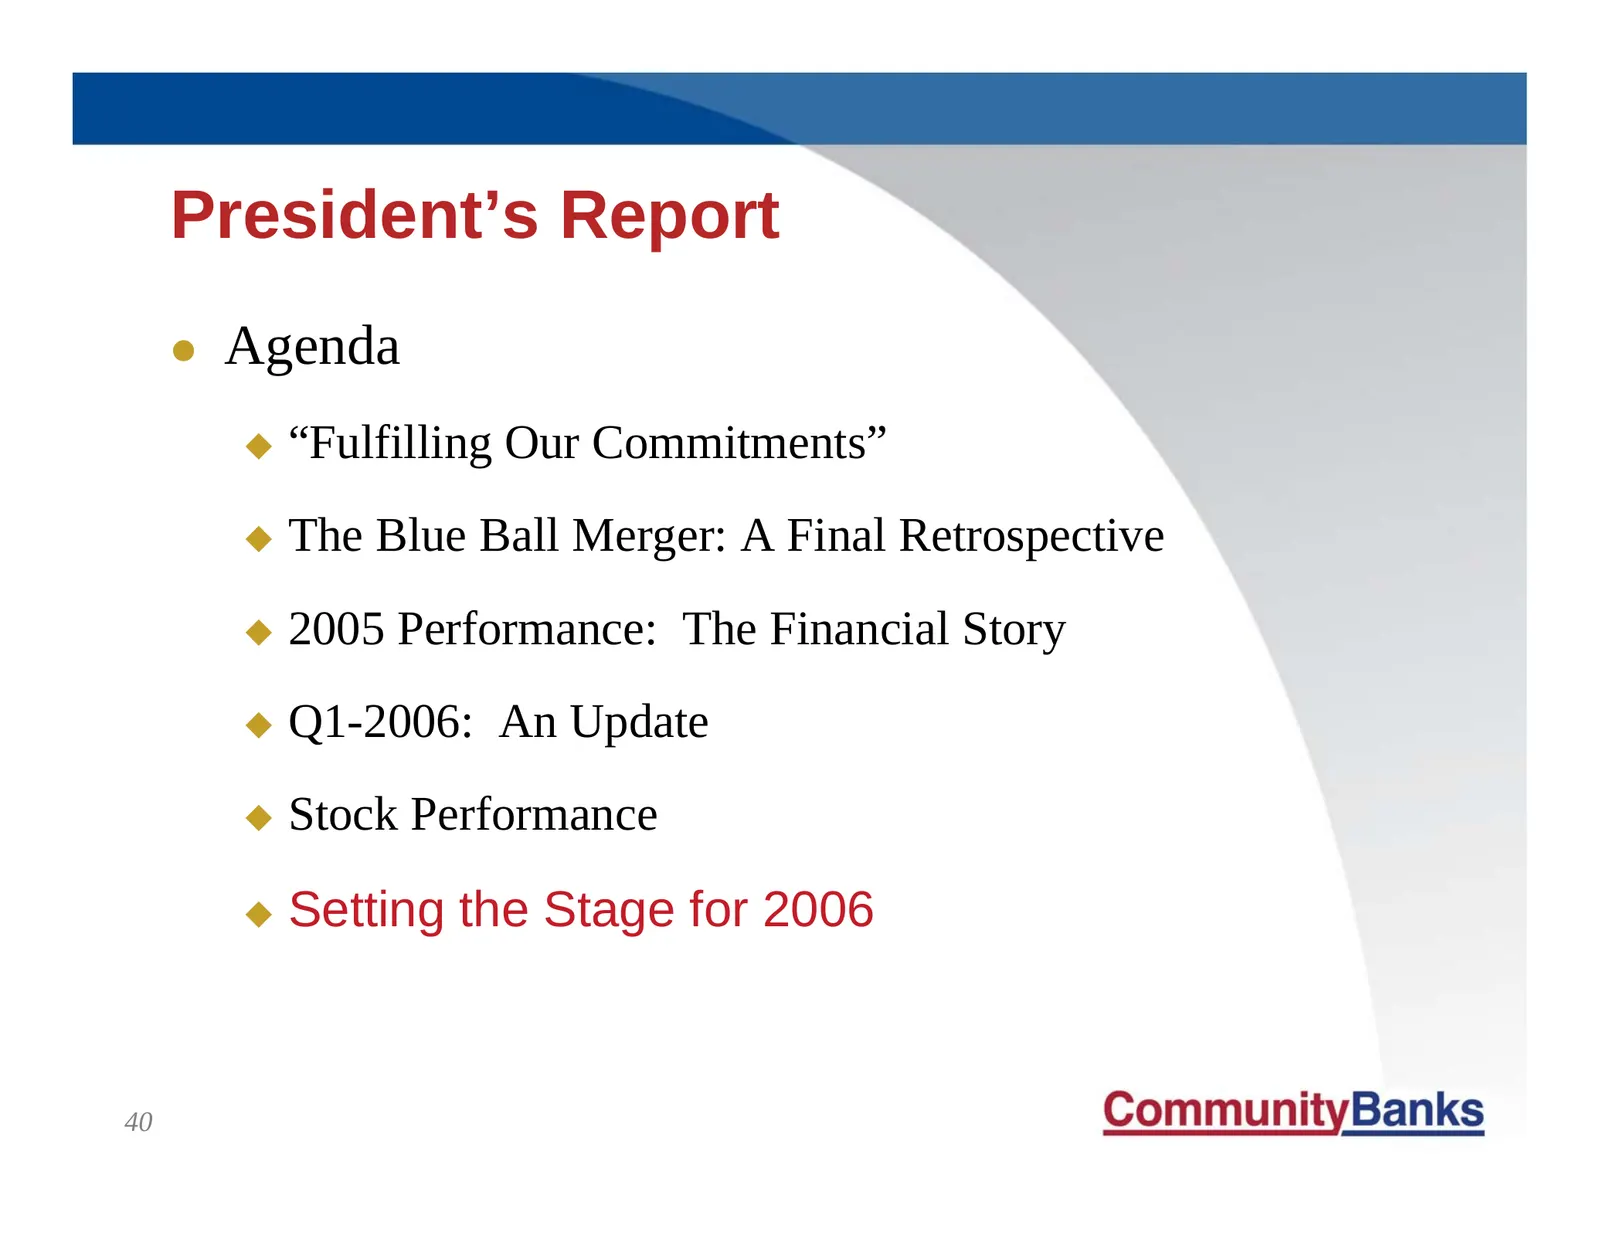
President’s Report z Agenda “Fulfilling Our Commitments” The Blue Ball Merger: A Final Retrospective 2005 Performance: The Financial Story Q1-2006: An Update Stock Performance Setting the Stage for 2006 40
Slide 41: Strategic Vision
Strategic Vision z Our Mission Financial services provider of choice Employer of choice in the communities where we operate Acquisition partner of choice for banks and financial services providers in markets we desire z Industry Consolidation Nearly 80 Financial Institutions with Under $1 Bi
Slide 42: 2005/2006 Branch Expansion
2005/2006 Branch Expansion z 2005 February—Willow Street (Lancaster County) March — Spring Grove (York) July — Lemoyne (Cumberland/Dauphin) September — Carlisle (Cumberland) November — Museum Road (Berks) z 2006 Late Spring—Hershey (Dauphin) — OPEN Delco Plaza (York) Mount Joy (Lanca
Slide 43: Setting the Stage for 2006: The Experts' Perspective
Setting the Stage for 2006: The “Experts” Perspective z The “flat” yield curve will continue to put pressure on net interest margins z Rising rates impact loan metrics z Bank stock valuations remain at historically high levels relative to the S&P Index 43
Slide 44: EPS Drives Stock Performance
EPS Drives Stock Performance z Successful EXECUTION Follow through on Cultural Integration/ Leveraging Platform z CREDIT QUALITY Keeping our “Eye on the Ball” A Critical Cultural “Fit” z Interest Rate Environment Managing With a “Flat” Yield Curve Fortified Balance Sheet Position z Competi
Slide 45: Questions
45 Questions 229 CommunityBanks
Source: SEC EDGAR · 8-K filed May 9, 2006
More decks from Community Banks Inc
 Community Banks — Merger or Acquisition (June 2007)23 slides · Jun 20, 2007
 Community Banks — Merger or Acquisition (May 2007)31 slides · May 1, 2007
 Ferris, Baker Watts Mid-Atlantic Bank Conference 200620 slides · Jul 27, 2006
 Emerald Groundhog Day Investment Forum (February 2006)40 slides · Feb 2, 2006
 Mid-Atlantic SuperCommunity Bank Conference 200528 slides · Nov 8, 2005
 Shareholder Meeting (June 2005)51 slides · Jun 1, 2005